effects of low concentration of selected analgesics and
TRANSCRIPT

Title: Effects of Low Concentration of Selected Analgesics and Successive Bioaugmentation of the Activated Sludge on Its Activity and Metabolic Diversity
Author: Joanna Żur, Justyna Michalska, Artur Piński, Agnieszka Mrozik, Agnieszka Nowak
Citation style: Żur Joanna, Michalska Justyna, Piński Artur, Mrozik Agnieszka, Nowak Agnieszka. (2020). Effects of Low Concentration of Selected Analgesics and Successive Bioaugmentation of the Activated Sludge on Its Activity and Metabolic Diversity. “Water” (Vol. 12, Iss. 4 (2020), Art. No. 1133), doi 10.3390/W12041133
water
Article
Effects of Low Concentration of Selected Analgesicsand Successive Bioaugmentation of the ActivatedSludge on Its Activity and Metabolic Diversity
Joanna Zur * , Justyna Michalska, Artur Pinski , Agnieszka Mrozik andAgnieszka Nowak *
Institute of Biology, Biotechnology and Environmental Protection, Faculty of Natural Sciences, University ofSilesia in Katowice, Jagiellonska 28, 40-032 Katowice, Poland; [email protected] (J.M.);[email protected] (A.P.); [email protected] (A.M.)* Correspondence: [email protected] (J.Z.); [email protected] (A.N.);
Tel.: +48-32-2009-462 (J.Z.); +48-32-2009-576 (A.N.)
Received: 17 March 2020; Accepted: 13 April 2020; Published: 16 April 2020�����������������
Abstract: In this study, we evaluated the impact of the successive bioaugmentation of the activatedsludge (AS) with the defined bacterial consortium on the activity and functional capacity of theAS microorganisms. In parallel, the removal of low concentrations of the selected non-steroidalanti-inflammatory drugs (ibuprofen, naproxen, diclofenac) and analgesic paracetamol was studied.We found that the addition of the bacterial consortium consisting of three pharmaceuticals-degradingstrains Bacillus thuringiensis B1 (2015b), Stenotrophomonas maltophilia KB2, and Pseudomonas mooreiKB4 into the AS did not cause any significant changes in the biomass abundance and metabolicactivity of the AS microorganisms. Although, the successive bioaugmentation of the AS caused aslight increase in the metabolic diversity, the intensity of carbohydrates usage, and metabolic richness.Microorganisms in the bioaugmented and non-bioaugmented AS were able to degrade the mixture ofthe analyzed drugs with similar efficiency, however, diclofenac was removed more effectively in thebioaugmented AS. Several metabolites were identified and efficiently utilized, with the exception of4-OH diclofenac. Two new diclofenac-degrading strains assigned as Serratia proteamaculans AS4 andRahnella bruchi AS7 were isolated from the diclofenac-treated AS.
Keywords: activated sludge; bacterial consortium; bioaugmentation; biodegradation; functionalcapacity; non-steroidal anti-inflammatory drugs (NSAIDs); paracetamol; phylogenetic resolution
1. Introduction
A wide range of contaminants of emerging concerns (CEC), including pharmaceuticals andpersonal care products are continuously introduced into various environmental matrices. Organicpollutants are usually characterized by highly diversified structure, low water solubility, poorbiodegradability, and environmental persistence [1,2]. Noteworthy, for most drugs, including thenon-steroidal anti-inflammatory drugs (NSAIDs) and paracetamol, there are no strict monitoringrecommendations or discharges guidelines. Pharmaceuticals used within this study, ibuprofen (IBU),naproxen (NPX), diclofenac (DCF), and paracetamol (APAP) have been detected in several naturalmatrices, e.g., surface water [3,4], wastewater [5], soil and sludge [6–8] at a concentration rangefrom ng L−1 to µg L−1. Drugs remain active even at low concentrations, therefore, their presencemay lead to successive deterioration of water quality and have an adverse impact on the ecosystemand human health [9]. The main sources of pharmaceuticals in the environment include domesticand industrial wastewater from pharmaceuticals production, hospital effluents, landfill leachate,
Water 2020, 12, 1133; doi:10.3390/w12041133 www.mdpi.com/journal/water

Water 2020, 12, 1133 2 of 22
artificial recharge using reclaimed water, and infiltration of contaminated water from agricultural land.To date, the conventional methods i.e., chlorination as well as the advanced treatment techniques e.g.,the membrane bioreactors, nanofiltration, reverse osmosis, and carbon nanocomposites with magneticproperties are not fully adapted for pharmaceuticals removal [2,9,10]. Moreover, some authors pointedout that the biological treatment is a bottleneck for micro-pollutant removal [11].
The efficiency of analgesics biodegradation by conventional activated sludge (AS) and membranebioreactors was summarized by Tiwari et al. [9], who found almost 90%–100% removal efficiency of IBUbut only 55%–85% and 5%–45% removal efficiencies of NPX and DCF, respectively. The effectivenessof the AS treatment can be further improved by bioaugmentation, however, the successful treatmentdepends primarily on the behavior of the strains introduced to the environment, which are characterizedby the potential to alter the interplay within the native communities resulting in strong shifts in theirstructure, with neutral, beneficial, or detrimental impacts. The behavior of the exogenous strainsintroduced into the AS depends on their ability to survive and grow within the new habitat, competewith autochthonous microorganisms for the acquisition of nutrients, and resilience to the changingenvironmental conditions such as pH, temperature, and water availability [12]. The successivebioaugmentation, which partly mitigates those problems, is based on the repetitive introductionof highly competent and carefully selected bacteria, whose growth rate exceeds washout andpredation [13–16].
Some authors pointed out that microorganisms of one species may be replaced by others withthe same metabolic properties [17]. Indeed, most basic functions i.e., respiration, nutrient uptake, ordenitrification are rather constant and unrelated to microbial diversity. Contrary, processes carriedout by more specialized strains i.e., xenobiotics removal or detoxification, are vulnerable to microbialdiversity decrease. Environments subjected to the continuous influence of xenobiotics constitute avaluable source of new isolates with increased metabolic properties [17]. Up to now, the numberof microorganisms capable of degrading the NSAIDs is limited, thus, there is an urgent need toisolate new bacterial strains, especially those capable of utilizing polycyclic drugs characterizedby poor biodegradability, i.e., DCF and NPX [10,18]. In recent years, many authors highlightedthat biodegradation of xenobiotics by pure bacterial cultures fails to reflect the adequate behavior ofenvironmental microorganisms during xenobiotics degradation, mainly due to the synergistic metabolicactivities exhibited by microorganisms in communities. Thus, bioaugmentation based on microbialconsortia, where degradation processes are frequently dependent on the combined actions of variousspecies, is more often applied for the degradation of xenobiotic compounds with low susceptibility tobiodegradation. A combination of strains may be used to mimic naturally occurring communities,enhance or imitate a degradation pathway, or degrade several target pollutants within the samewastewater [19,20]. Zhang et al. [21] noticed that the microbial consortium used for APAP degradationachieved higher removal rates and significantly better tolerance to APAP with a shorter adaptation time.One of the crucial issues related to the degradation processes carried out by microorganisms concernsthe environmental concentrations, which are frequently much lower than doses used in lab-scaledegradation experiments. It must be taken into consideration that there are threshold concentrations ofxenobiotics necessary to induce catabolic enzymes, below which degradation is unperceived. Moreover,the differences in the kinetics of the same biodegradation processes, but with different concentrationsof substrate and competition from other carbon sources at low levels are frequently observed [22,23].
Thus, the aim of this study included the following goals: (i) analyzing the impact of lowanalgesics concentrations of 0.5 mg L−1 for NPX and DCF and 1 mg L−1 for IBU and APAP on the ASmicroorganisms, (ii) establishing the influence of introduced microorganisms on the autochthonousmicroflora, (iii) estimating the effectiveness of analgesics removal assisted by the consortium ofbacterial strains, (iv) studying the degradation processes and formation of secondary metabolites, and(v) isolating new bacterial strains able to degrade DCF.

Water 2020, 12, 1133 3 of 22
2. Materials and Methods
2.1. Characteristics of the Activated Sludge
The AS was derived from the aerobic chamber of the wastewater treatment plant (WWTP)Klimzowiec located in Chorzów, Poland. The AS characterization included determinations of pH,sludge volume index (SVI), and mixed liquor suspended solids (MLSS) [24]. The microbial activity inthe AS was assayed via the quantification of the dehydrogenases (DHA) [25], nonspecific esterases(NSEA) [26], and specific oxygen uptake rate (SOUR) [27]. The number of total heterotrophic bacteria(THB) in the AS was determined after their extraction from the sludge [16] and enumerated accordingto EN ISO 8199:2010 [28] (Table 1). The part of the AS was sterilized (three times at 3 day intervals,121 ◦C, 40 min) for further analysis. Our preliminary studies indicated that autoclaving in suchconditions allowed to obtain sterile sludge, which was also confirmed by serial dilution plating.
Table 1. Characteristics of the activated sludge (AS) obtained from the Klimzowiec sewage plant.
Parameter Value
pH 7.713 ± 0.071SVI, g cm−3 114.182 ± 1.665MLSS, g L−1 3.667 ± 0.180
SOUR, mg O2 g−1 MLSS h−1 8.424 ± 0.621DHA, mg TPF g−1 MLSS h−1 16.096 ± 0.952
NSEA, µg fluorescein g−1 MLSS h−1 23.012 ± 0.697Number of the THB, log CFU g−1 MLSS−1 8.226 ± 0.992
2.2. Composition of Bacterial Consortium
The microbial consortium used for bioaugmentation of the AS included three environmentalbacterial strains: Bacillus thuringiensis B1 (2015b), Stenotrophomonas maltophilia KB2, and Pseudomonasmoorei KB4 derived from the Microbial Culture Collection in the Institute of Biology, Biotechnologyand Environmental Protection (Faculty of Natural Sciences, University of Silesia in Katowice, Poland).All of the strains can degrade the selected NSAIDs: IBU, NPX, DCF, and analgesic drug, APAP (Table 2).In preliminary studies, the most effective bacterial consortium with the appropriate proportions ofthe particular bacterial strains was established. According to the obtained results, the initial opticaldensity of particular bacteria in the inoculum at a wavelength of 600 nm (OD600) was leveled-off to 0.1,which corresponded with 2.7 × 10⁵, 1.6 × 10⁷, and 1.7 × 10⁶ CFU mL−1 for B1 strain, KB2 strain, andKB4 strain, respectively.
Table 2. Composition of the bacterial consortium for bioaugmentation of the AS.
Bacterial Strain Site of Isolation Degradation of Aromatics Reference
Bacillus thuringiensisB1(2015b)
Contaminated soilJaworzno, Poland Ibuprofen, naproxen [29]
Stenotrophomonasmaltophilia KB2
Activated sludgeMiechowice, Poland
Naproxen, phenol,mononithrophenols,
methylphenols[30]
Pseudomonas moorei KB4 Activated sludgeChorzów, Poland
Paracetamol, diclofenac, phenol,4-hydroxybenzoic acid [31]
2.3. Experimental Set-Up and Isolating Diclofenac-Degrading Strains
Before the experiment, the AS was diluted with the synthetic wastewater (SW) medium withthe following composition, g L−1: 0.285 C6H12O6; 0.69 CH3COONa; 0.145 NH4Cl; 0.06 KH2PO4;0.04 K2HPO4; 0.069 NaCl; 0.026 CaCl2 and 0.145 KCl [16] to obtain the initial concentration of thesludge biomass of 3.0 ± 0.5 g L−1, which reflected the average concentration of microorganisms

Water 2020, 12, 1133 4 of 22
desirable for the wastewater treatment process. The composition of the SW reflected the ratio of carbon,nitrogen, and phosphorus in the effluents of the WWTP Klimzowiec.
Herein, six experimental conditions of the AS (assays) were designed (Figure 1A). The abioticcontrol of the analgesics physicochemical decomposition was analyzed in the control SWc assay,which was filled with the SW supplemented with the same doses of examined pharmaceuticals asthe other systems. The AS1 assay contained the AS supplemented with the NSAIDs, APAP, andbacterial consortium. The assay AS2 was non-bioaugmented but fed with the NSAIDs and APAP.The AS3 contained sterilized AS with NSAIDs, APAP, and bacterial consortium. The assay assignedas AS4 served as the bioaugmented biotic control and contained the AS with bacterial consortium,while the AS5 served as the non-bioaugmented biotic control. The experiment was conducted for30 days at 23 ◦C with mixing. Every 7 days, the volume of the supernatant liquid was measuredand replaced with fresh SW which reflected the natural cycles occurring in the WWTP. The bacterialconsortium was introduced repeatedly every 7 days after the exchange of supernatant liquid to avoidinoculated bacteria being washed out from the AS system. The AS was amended with the mixture ofIBU (1 mg L−1), APAP (1 mg L−1), NPX (0.5 mg L−1), and DCF (0.5 mg L−1). Every 7 days after themedium exchange, the new doses of drugs were spiked to the appropriate initial concentrations. Wemeasured the concentration of the pharmaceuticals residue before the medium exchange to correctlyspike drugs to the assays and after the addition to verify that the proper concentration of the drugswas introduced. The pharmaceutical removal was monitored in the 7-day time regime mimicking theoperation of the WWTPs.Water 2020, 12, x FOR PEER REVIEW 5 of 25
Figure 1. Scheme of the experimental set-up. (A) Different non- or bioaugmented assays AS1–AS4 fed with NSAIDs and APAP and control assay AS5, (B) scheme of the isolation of new DCF-degrading strains from the DCF-treated AS by classical enrichment technique. NSAIDs—non-steroidal anti-inflammatory drugs (IBU, NPX, and DCF); IBU—ibuprofen, NPX—naproxen, DCF—diclofenac, APAP—paracetamol.
2.4. Evaluating the Activated Sludge Quality and Impact of Bioaugmentation
To estimate the metabolic response and functional capacity of microorganisms from the repeatedly bioaugmented AS as well as the condition of the non-bioaugmented AS, several different parameters were measured.
2.4.1. Measuring the Dehydrogenases Activity
The activity of the AS microorganisms was assayed by quantifying the activity of dehydrogenases based on the reduction of 2,3,5-triphenyltetrazolium chloride (TTC) (Avantor, Gliwice, Poland) into red, insoluble 1,2,3-triphenyltetrazolium chloride (TPF) according to Miksch [33].
2.4.2. Analyzing the Chemical Oxygen Demand
In order to evaluate the concentration of organic substances in the wastewater, chemical oxygen demand (COD) was measured every 7 days before medium exchange according to the APHA [24].
2.4.3. Enumerating the Total Heterotrophic Bacteria
The THB were extracted from the AS flocs by homogenization (10 s at 11,000 × g) and enumerated on the lysogeny broth (LB, BTL, Poland) plates solidified with agar (BTL, Poland) and incubated for 24–72 h at 23 °C. THB was expressed as CFU mL−1.
2.4.4. Metabolic Activity of the AS Measuring by BIOLOG
The functional capacity of the AS microorganisms from different assays during the experimental period was examined using the Biolog system with 96-well EcoPlatesTM and Biolog microstation (BIOLOG Inc., Hayward, CA, USA). At the beginning of the experiment (t0) and after 30 days of
Figure 1. Scheme of the experimental set-up. (A) Different non- or bioaugmented assays AS1–AS4 fedwith NSAIDs and APAP and control assay AS5, (B) scheme of the isolation of new DCF-degrading strainsfrom the DCF-treated AS by classical enrichment technique. NSAIDs—non-steroidal anti-inflammatorydrugs (IBU, NPX, and DCF); IBU—ibuprofen, NPX—naproxen, DCF—diclofenac, APAP—paracetamol.
Parallelly, new bacterial strains able to degrade DCF were isolated from the AS not subjected tobioaugmentation using the classical enrichment technique [29]. Briefly, 10 mL of the AS was introducedinto 90 mL of 0.9% NaCl and supplemented with DCF at a concentration of 10 mg L−1 as a sole carbonand energy source. The culture was incubated at 23 ◦C with shaking (130 rpm) for 5 weeks. If thecomplete degradation of DCF was achieved, a higher dose of the drug was introduced. After theadaptation of the AS microorganisms to 25 mg L−1 of DFC, 1 mL of sample was serially diluted from

Water 2020, 12, 1133 5 of 22
10−1 to 10−3 with the NaCl and spread onto the agar plates containing mineral salts medium (MSM)with the following composition, g L−1: 3.78 Na2HPO4 × 12 H2O; 0.5 KH2PO4; 5.0 NH4Cl; 0.2 MgSO4 ×
7 H2O; 0.01 yeast extract [32] supplemented with 25 mg L−1 of DCF to obtain pure bacterial cultures.The agar plates were incubated at 23 ◦C for 24 h, and single colonies were further proliferated on thenutrient agar for the purity tests (Figure 1B).
2.4. Evaluating the Activated Sludge Quality and Impact of Bioaugmentation
To estimate the metabolic response and functional capacity of microorganisms from the repeatedlybioaugmented AS as well as the condition of the non-bioaugmented AS, several different parameterswere measured.
2.4.1. Measuring the Dehydrogenases Activity
The activity of the AS microorganisms was assayed by quantifying the activity of dehydrogenasesbased on the reduction of 2,3,5-triphenyltetrazolium chloride (TTC) (Avantor, Gliwice, Poland) intored, insoluble 1,2,3-triphenyltetrazolium chloride (TPF) according to Miksch [33].
2.4.2. Analyzing the Chemical Oxygen Demand
In order to evaluate the concentration of organic substances in the wastewater, chemical oxygendemand (COD) was measured every 7 days before medium exchange according to the APHA [24].
2.4.3. Enumerating the Total Heterotrophic Bacteria
The THB were extracted from the AS flocs by homogenization (10 s at 11,000 × g) and enumeratedon the lysogeny broth (LB, BTL, Poland) plates solidified with agar (BTL, Poland) and incubated for24–72 h at 23 ◦C. THB was expressed as CFU mL−1.
2.4.4. Metabolic Activity of the AS Measuring by BIOLOG
The functional capacity of the AS microorganisms from different assays during the experimentalperiod was examined using the Biolog system with 96-well EcoPlatesTM and Biolog microstation(BIOLOG Inc., Hayward, CA, USA). At the beginning of the experiment (t0) and after 30 days oftreatment (t30), 10 mL samples from the bioaugmented assays and respective controls were mixed with90 mL of the sterile saline solution and shaken for 1 h at 130 rpm. Afterward, 120 µL of the preparedsuspensions were used to inoculate each well of the plates and incubated at 22 ± 1 ◦C in the dark for5 days. The measurements of the absorbance in each well was performed at 590 nm at the beginning ofthe experiment and every 12 h. The final results were obtained when the value curve plateau of theaverage well color development (AWCD) or inflection point was reached (Microlog 4.01 software).The non-linear model described by the Verhulst equation with the four-parameter logistic function wasused to calculate the specific rate of the increase in the microbial activity A(t) [16]:
A(t) =Amax(
1 + b· exp(−k·t50)) (1)
where Amax indicates the maximum microbial activity; t50 indicates the time at which the microbialactivity has reached half of its maximum, k relates to the steepness slope of A(t)—a function of time forthe utilization of each carbon source in the EcoPlateTM at t = t50; and b—the relative microbial activityincrease in an arbitrary constant.
The Avt50 parameter which indicated that the total microbial activity increased at the fastest ratewas calculated from the equation:
Avt50 =
∑ni=1(ln b/k)
N(2)

Water 2020, 12, 1133 6 of 22
The calculated parameter was used to compare the control and bioaugmented assays by estimatingthe functional capacity indices, i.e., average well color development (AWCD), metabolic richnessindex (S), Gini coefficient (G), Shannon–Weaver diversity index (H’ECO), and evenness (E). The carbonsources utilized in the EcoPlatesTM were divided into seven groups: polymers, surfactants, phenolicacids, carboxylic acids, amines, amino acids, and carbohydrates [34].
2.5. Measuring the Protein Concentration
In order to estimate indirectly the biomass abundance in the AS, the protein concentration wasestimated by the Bradford method [32] with bovine serum albumin as a control.
2.6. Multi-Locus Sequence Typing and Phylogenetic Analysis of the Newly Isolated Strains
Bacterial DNA was isolated from the pure cultures using the DNA commercial kit (GeneMatrixBacterial and Yeast Genomic DNA, Eurx, Gdansk, Poland). The initial molecular identification ofanalyzed strains was performed by phylogenetic analysis based on the partial sequence of 16S rRNAaccording to the protocol described by Marchlewicz et al. [29]. The nearest taxonomic group wasidentified by the online tool BLASTN using DDBJ/EMBL/GenBank nucleotide sequence databases.The 16S rRNA gene sequences have been stored in the GenBank database (NCBI) under the followingaccession numbers: MT180428 and MT180429, for AS4 and AS7 strains, respectively. To providemore detailed phylogenetic characteristics, sequencing of the partial sequences of two housekeepinggenes, rpoB and pyrG was performed [35]. The sequences of the examined genes were extractedfrom fully sequenced representative genomes from the genera indicated in the 16S rRNA analysis(Klebsiella, Serratia, and Enterobacter) in the PATRIC database [36]. The nucleotide sequences ofboth genes were aligned separately in Geneious Prime® 2019.2.3 with global alignment on defaultsettings. The specific primers for both genes were designed from identical sites. For amplification ofthe partial sequence of the rpoB gene primers: rpoB_F: 5’ ATGGTTTACTCCTATACCGAGAA 3’,rpoB_R: 5’ GCATCATGCGGTAGATTTCTAC 3’ and for pyrG gene: pyrG_F: 5’ GTCGTATCCTCTCTGGGTAAAG 3’, pyrG_R: 5’ TTAAGCTGAATCGTTTACAAATATAATC 3’ were used.Amplification of both genes was carried out with a program consisting of initial denaturationat 94 ◦C for 2 min, 30 cycles of denaturation at 94 ◦C for 15 s, annealing at 58 ◦C for 30 s, extension at72 ◦C for 90 s, and a final elongation step at 72 ◦C for 7 min with Pfu DNA Polymerase (Eurx, Gdansk,Poland). The partial nucleotide sequences of rpoB gene have been deposited in the GenBank databaseof NCBI under the accession number MT181967 and MT181969, and pyrG gene under the accessionnumber MT181968 and MT181970 for AS4 and AS7 strains, respectively. Sequences for strains wereretrieved from the GenBank database and aligned separately for each gene in Geneious Prime and thenfor each strain pyrG, rpoB, and 16S rRNA sequences were concatenated. The final alignment was usedto build a maximum likelihood (ML) phylogenetic tree in MEGA X version 10.1.5. The ML analysis wasperformed with Tamura–Nei model with 1000 bootstrap phylogeny tests. The isolated strains will bedeposited in the publicly available German Collection of Microorganisms and Cell Cultures (DSMZ).
2.7. Measuring the Analgesics Concentrations
The concentration of tested drugs in the bioaugmented and non-bioaugmented assays and theirrespective controls were determined using Merck Hitachi reversed-phase High-Performance LiquidChromatography (HPLC) with a column Ascentis Express® C18 (100× 4.6 mm), operated in an isocraticmode, pre-column Opti-Solv® EXP, and UV/Vis diode array detector. The mobile phase for theparticular drugs detection was consisted as follows: acetonitrile: 1% acetic acid (50:50, v/v) for IBU andNPX, methanol: 1% acetic acid (95:5, v/v) for APAP and acetonitrile: 1% acetic acid:methanol (50:30:20,v/v/v) for DCF. The flow rate of the mobile phase was 1 mL min−1. The NSAIDs and APAP in thesupernatant were identified and quantified by comparing their HPLC retention times and UV-visiblespectra with respective parameters of external standards. The detection wavelength was 230, 240, 260,and 276 nm for IBU, APAP, NPX, and DCF, respectively.

Water 2020, 12, 1133 7 of 22
2.8. Identifying the Intermediates Formed During Degradation
Every 7 days, the analyses of the secondary metabolites in the bioaugmented assays with theNSAIDs and APAP were performed using liquid chromatography coupled with a mass detector(UHPLC/MS/MS) Shimadzu LC/MS-8040 in reverse phase system, using a Luna Omega C18 1.6 µmcolumn, 100 × 2.1 mm (Phenomenex) and mobile phases: A-5 mM aqueous solution of ammoniumacetate pH 5.8, B-acetonitrile. The mobile phase flow was 0.4 mL min−1 and the oven temperaturewas 30 ◦C. The following elution program was used: 0–2 min—10% isocratic B, 2–9 min from 10% to70% B, 9–10 min—isocratic 70% B, 10–10.5 min—from 70% to 5% B, 10.5–14 min—isocratic 5% B. Massspectrometer parameters were as follows: nebulizing gas flow 3 L min−1, drying gas flow 8 L min−1,temperature 250 ◦C desolvation line, 400 ◦C heating block temperature. The analyses were performedin multiple reaction monitoring (MRM) mode.
2.9. Statistical Analyses
All of the data were expressed as the mean value and standard deviation of three biologicalreplicates. Data were analyzed using Microsoft Office Excel 2010 and Statistica® 13.3 PL (TIBCOSoftware Inc., Palo Alto, CA, USA). In order to determine whether the pharmaceuticals orbioaugmentation influenced the activity or metabolic properties of microorganisms in the AS, theresults were evaluated using ANOVA test. The statistical significance (p < 0.05) of any differenceswere analyzed using one-way ANOVA for considering the effect of drugs or bioaugmentation on thefunctional diversity indices and the usage of carbon substrates and evaluated by a post-hoc test of themeans using the lowest significant differences (LSD) test for normally distributed data or multiplecomparisons test (MCT) for results, which did not present normal distribution. For the cluster andSpearman’s rank correlation analysis, data were first subjected to min–max normalization according tothe equation:
ND =RDi −RDmax
RDmax −RDmin(3)
where, ND—normalized data (all of the variables were scaled to the range between 0 and 1); RDi—theinitial raw data; RDmin—the minimal value of each parameter in a data set; and RDmax—the maximalvalue of each parameter in a data set. All of the factors that might have an influence on the changesobserved between non- and bioaugmented assays were evaluated by PCA analysis based on thecorrelation matrix.
3. Results
3.1. The Impact of Pharmaceuticals and Bioaugmentation on the AS Quality
The results of the TPF concentration measurement indicated that the bioaugmented AS1 assaywas characterized by a higher overall metabolic activity compared to the non-bioaugmented assay AS2(Figure 2). In turn, the bioaugmented biotic control AS4 was characterized by the lowest metabolicactivity within the tested systems. Considering the weak metabolic activity observed in the AS4,the increase of this parameter for the AS1 resulted probably from the drugs degradation. It wasindicated that the high activity of the bacterial consortium in the control AS3 assay was inhibited by theautochthonous microorganisms which was reflected in the lowest microbial activity in the assay AS4.Moreover, the relatively high bacterial activity observed in the control AS3 was probably connectedwith the high accessibility of nutrients released from the AS flocs.
In the AS1, THB (CFU mL−1) during the entire experiment was rather constant. Small differenceswere also observed for the assay AS2. On the other hand, the greatest differentiation was revealedfor the AS3 and AS4 treatments, which were simultaneously characterized by the highest THB. It isnoteworthy that in the AS5 assay, to which neither consortia nor pharmaceuticals were added, therewas no sharp decrease in the number of microorganisms.

Water 2020, 12, 1133 8 of 22
COD (mg L−1 O2) measurements allowed to estimate system’s organic load. The lowest valueswere calculated for the AS1 and AS4 assays, which indicated that the constructed bacterial consortiumwas characterized by high efficiency in organic substances removal (Figure 3). For the AS1, the mostsevere decline in the COD values was observed after 7 days of treatment (t7) and at the end of theexperiment (t30). For the assay AS2 containing the AS and pharmaceuticals, the COD values wererather constant, with a slight drop on day 21 of the experiment (t21). However, for the AS2 the level ofthe observed loading was significantly lower (maximum value reached 1672 mg L−1 O2) than thoseobserved for the AS5, where the COD values ranged from 4004 at t0 to 6160 mg L−1 O2 at t30, withoutsignificant reduction at any sampling time.
Water 2020, 12, x FOR PEER REVIEW 8 of 25
changes observed between non- and bioaugmented assays were evaluated by PCA analysis based on the correlation matrix.
3. Results
3.1. The Impact of Pharmaceuticals and Bioaugmentation on the AS Quality
The results of the TPF concentration measurement indicated that the bioaugmented AS1 assay was characterized by a higher overall metabolic activity compared to the non-bioaugmented assay AS2 (Figure 2). In turn, the bioaugmented biotic control AS4 was characterized by the lowest metabolic activity within the tested systems. Considering the weak metabolic activity observed in the AS4, the increase of this parameter for the AS1 resulted probably from the drugs degradation. It was indicated that the high activity of the bacterial consortium in the control AS3 assay was inhibited by the autochthonous microorganisms which was reflected in the lowest microbial activity in the assay AS4. Moreover, the relatively high bacterial activity observed in the control AS3 was probably connected with the high accessibility of nutrients released from the AS flocs.
Figure 2. Bacteria consortium evolution weekly assessed by dehydrogenases activity (TPF, µg g−1 h−1) —bars, and THB enumeration (log CFU mL−1)—points, on the experimental conditions (assays AS1–AS5), during the experimental period (30 days). The data are presented as the mean values of three biological replicates ± standard deviation. Columns marked with red asterisks are significantly different (p < 0.05, multiple comparisons (MCT) test) considering different experimental conditions at the same sampling time, and marked with black asterisks—within each assay considering the sampling day. TPF—triphenyltetrazolium chloride, THB—Total Heterotrophic Bacteria.
In the AS1, THB (CFU mL−1) during the entire experiment was rather constant. Small differences were also observed for the assay AS2. On the other hand, the greatest differentiation was revealed for the AS3 and AS4 treatments, which were simultaneously characterized by the highest THB. It is noteworthy that in the AS5 assay, to which neither consortia nor pharmaceuticals were added, there was no sharp decrease in the number of microorganisms.
COD (mg L−1 O2) measurements allowed to estimate system’s organic load. The lowest values were calculated for the AS1 and AS4 assays, which indicated that the constructed bacterial consortium was characterized by high efficiency in organic substances removal (Figure 3). For the AS1, the most severe decline in the COD values was observed after 7 days of treatment (t7) and at the end of the experiment (t30). For the assay AS2 containing the AS and pharmaceuticals, the COD values
Figure 2. Bacteria consortium evolution weekly assessed by dehydrogenases activity (TPF,µg g−1 h−1)—bars, and THB enumeration (log CFU mL−1)—points, on the experimental conditions(assays AS1–AS5), during the experimental period (30 days). The data are presented as the mean valuesof three biological replicates ± standard deviation. Columns marked with red asterisks are significantlydifferent (p < 0.05, multiple comparisons (MCT) test) considering different experimental conditions atthe same sampling time, and marked with black asterisks—within each assay considering the samplingday. TPF—triphenyltetrazolium chloride, THB—Total Heterotrophic Bacteria.
In order to evaluate indirectly the biomass in each experimental condition, the concentrationof proteins released from the flocs was measured (Figure 4). The obtained results showed that thehighest overall concentration of proteins was measured in the biotic non-bioaugmented control AS5.Considering the periodic feeding of the AS with fresh SW without the addition of bacterial consortiumand/or NSAIDs, good quality of the AS in this assay was expected. Indeed, there were no severedisturbances between the AS4 and AS5 assays that indicated no negative influence of inoculatedbacterial consortium on the AS condition. The general trends in protein concentrations were similarfor all tested systems. Similarly, the successive bioaugmentation was not significantly reflected in theoverall protein concentrations, because most of the differences were not statistically significant.

Water 2020, 12, 1133 9 of 22
Water 2020, 12, x FOR PEER REVIEW 9 of 25
were rather constant, with a slight drop on day 21 of the experiment (t21). However, for the AS2 the level of the observed loading was significantly lower (maximum value reached 1672 mg L−1 O2) than those observed for the AS5, where the COD values ranged from 4004 at t0 to 6160 mg L−1 O2 at t30, without significant reduction at any sampling time.
Figure 3. Weekly activated sludge COD (mg L−1 O2) content on the five AS assays during the experimental period: (A) the AS1, AS2, and AS4 are the bioaugmented assays and/or assays with pharmaceuticals; (B) the AS5 assay is the control. COD—carbon oxygen demand.
In order to evaluate indirectly the biomass in each experimental condition, the concentration of proteins released from the flocs was measured (Figure 4). The obtained results showed that the highest overall concentration of proteins was measured in the biotic non-bioaugmented control AS5. Considering the periodic feeding of the AS with fresh SW without the addition of bacterial consortium and/or NSAIDs, good quality of the AS in this assay was expected. Indeed, there were no severe disturbances between the AS4 and AS5 assays that indicated no negative influence of inoculated bacterial consortium on the AS condition. The general trends in protein concentrations were similar for all tested systems. Similarly, the successive bioaugmentation was not significantly reflected in the overall protein concentrations, because most of the differences were not statistically significant.
Figure 3. Weekly activated sludge COD (mg L−1 O2) content on the five AS assays during theexperimental period: (A) the AS1, AS2, and AS4 are the bioaugmented assays and/or assays withpharmaceuticals; (B) the AS5 assay is the control. COD—carbon oxygen demand.
Water 2020, 12, x FOR PEER REVIEW 10 of 25
Figure 4. Protein concentrations (mg mL−1) in the five assays (AS1–AS5) during 30 days of treatment. The data are presented as the mean values of three biological replicates ± standard deviation. The values of protein concentration with different lower-case letters (a, b, c, d, e) are significantly different (p < 0.05, post hoc lowest significant differences (LSD) test) considering different experimental conditions at the same sampling time. The values of protein concentration with different upper-case letters (A, B, C, D, E) are significantly different (p < 0.05, post hoc LSD test) within each assay considering the sampling day.
3.2. Microbial Activity in the Activated Sludge
To compare the metabolic activity and functional capacity of microorganisms in the tested systems, the EcoPlateTM indices were estimated. It was indicated that the bioaugmentation of the AS caused a slight increase in the microbial diversity at t0 what was observed as a significant difference in H’Eco values between AS1/t0 and AS2/t0 (Table 3). The highest value of this parameter was calculated for AS5 at t30. Although the average and maximum microbial activity were the lowest in the non-bioaugmented and not fed AS5 assay, the microbial communities achieved half of their overall maximal activity in the shortest time (Avt50) (Table 4). The presence of the pharmaceuticals in the assay AS2 significantly influenced the microorganisms abundance, which was reflected in the higher G coefficient value compared to its value calculated for the control AS5 assay. Neither the bioaugmentation nor the NSAIDs and APAP influenced the S index. Microorganisms in all assays were able to utilize 83%–89% of the carbon sources available on the EcoPlate, which was correlated with the S values in the range from 26 to 28.
Figure 4. Protein concentrations (mg mL−1) in the five assays (AS1–AS5) during 30 days of treatment.The data are presented as the mean values of three biological replicates± standard deviation. The valuesof protein concentration with different lower-case letters (a, b, c, d, e) are significantly different (p < 0.05,post hoc lowest significant differences (LSD) test) considering different experimental conditions at thesame sampling time. The values of protein concentration with different upper-case letters (A, B, C, D, E)are significantly different (p < 0.05, post hoc LSD test) within each assay considering the sampling day.
3.2. Microbial Activity in the Activated Sludge
To compare the metabolic activity and functional capacity of microorganisms in the tested systems,the EcoPlateTM indices were estimated. It was indicated that the bioaugmentation of the AS caused aslight increase in the microbial diversity at t0 what was observed as a significant difference in H’Ecovalues between AS1/t0 and AS2/t0 (Table 3). The highest value of this parameter was calculated for AS5at t30. Although the average and maximum microbial activity were the lowest in the non-bioaugmentedand not fed AS5 assay, the microbial communities achieved half of their overall maximal activity inthe shortest time (Avt50) (Table 4). The presence of the pharmaceuticals in the assay AS2 significantlyinfluenced the microorganisms abundance, which was reflected in the higher G coefficient valuecompared to its value calculated for the control AS5 assay. Neither the bioaugmentation nor the
Water 2020, 12, 1133 10 of 22
NSAIDs and APAP influenced the S index. Microorganisms in all assays were able to utilize 83%–89%of the carbon sources available on the EcoPlate, which was correlated with the S values in the rangefrom 26 to 28.
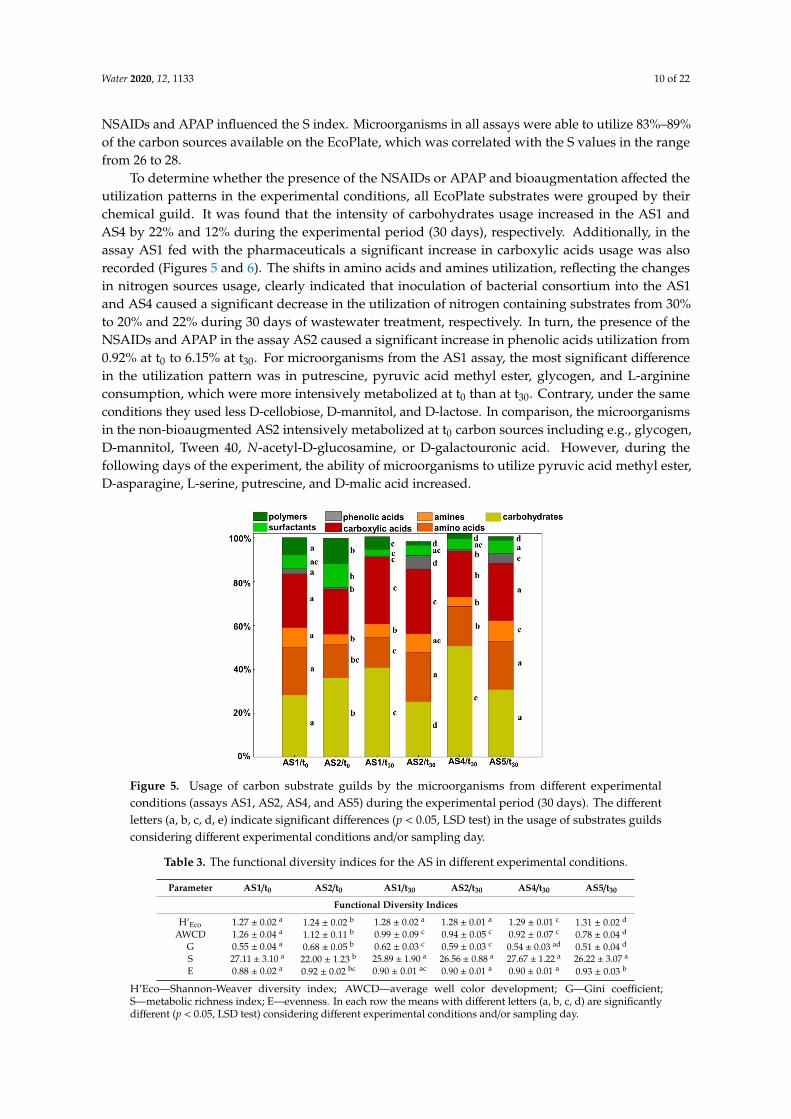
To determine whether the presence of the NSAIDs or APAP and bioaugmentation affected theutilization patterns in the experimental conditions, all EcoPlate substrates were grouped by theirchemical guild. It was found that the intensity of carbohydrates usage increased in the AS1 andAS4 by 22% and 12% during the experimental period (30 days), respectively. Additionally, in theassay AS1 fed with the pharmaceuticals a significant increase in carboxylic acids usage was alsorecorded (Figures 5 and 6). The shifts in amino acids and amines utilization, reflecting the changesin nitrogen sources usage, clearly indicated that inoculation of bacterial consortium into the AS1and AS4 caused a significant decrease in the utilization of nitrogen containing substrates from 30%to 20% and 22% during 30 days of wastewater treatment, respectively. In turn, the presence of theNSAIDs and APAP in the assay AS2 caused a significant increase in phenolic acids utilization from0.92% at t0 to 6.15% at t30. For microorganisms from the AS1 assay, the most significant differencein the utilization pattern was in putrescine, pyruvic acid methyl ester, glycogen, and L-arginineconsumption, which were more intensively metabolized at t0 than at t30. Contrary, under the sameconditions they used less D-cellobiose, D-mannitol, and D-lactose. In comparison, the microorganismsin the non-bioaugmented AS2 intensively metabolized at t0 carbon sources including e.g., glycogen,D-mannitol, Tween 40, N-acetyl-D-glucosamine, or D-galactouronic acid. However, during thefollowing days of the experiment, the ability of microorganisms to utilize pyruvic acid methyl ester,D-asparagine, L-serine, putrescine, and D-malic acid increased.Water 2020, 12, x FOR PEER REVIEW 12 of 25
Figure 5. Usage of carbon substrate guilds by the microorganisms from different experimental conditions (assays AS1, AS2, AS4, and AS5) during the experimental period (30 days). The different letters (a, b, c, d, e) indicate significant differences (p < 0.05, LSD test) in the usage of substrates guilds considering different experimental conditions and/or sampling day.
Figure 5. Usage of carbon substrate guilds by the microorganisms from different experimentalconditions (assays AS1, AS2, AS4, and AS5) during the experimental period (30 days). The differentletters (a, b, c, d, e) indicate significant differences (p < 0.05, LSD test) in the usage of substrates guildsconsidering different experimental conditions and/or sampling day.
Table 3. The functional diversity indices for the AS in different experimental conditions.
Parameter AS1/t0 AS2/t0 AS1/t30 AS2/t30 AS4/t30 AS5/t30
Functional Diversity Indices
H’Eco 1.27 ± 0.02 a 1.24 ± 0.02 b 1.28 ± 0.02 a 1.28 ± 0.01 a 1.29 ± 0.01 c 1.31 ± 0.02 d
AWCD 1.26 ± 0.04 a 1.12 ± 0.11 b 0.99 ± 0.09 c 0.94 ± 0.05 c 0.92 ± 0.07 c 0.78 ± 0.04 d
G 0.55 ± 0.04 a 0.68 ± 0.05 b 0.62 ± 0.03 c 0.59 ± 0.03 c 0.54 ± 0.03 ad 0.51 ± 0.04 d
S 27.11 ± 3.10 a 22.00 ± 1.23 b 25.89 ± 1.90 a 26.56 ± 0.88 a 27.67 ± 1.22 a 26.22 ± 3.07 a
E 0.88 ± 0.02 a 0.92 ± 0.02 bc 0.90 ± 0.01 ac 0.90 ± 0.01 a 0.90 ± 0.01 a 0.93 ± 0.03 b
H’Eco—Shannon-Weaver diversity index; AWCD—average well color development; G—Gini coefficient;S—metabolic richness index; E—evenness. In each row the means with different letters (a, b, c, d) are significantlydifferent (p < 0.05, LSD test) considering different experimental conditions and/or sampling day.

Water 2020, 12, 1133 11 of 22
Table 4. The kinetic parameters for the AS in different experimental conditions.
Parameter AS1/t0 AS2/t0 AS1/t30 AS2/t30 AS4/t30 AS5/t30
Kinetic Parameters
Amax 1.29 ± 0.04 ac 1.04 ± 0.13 b 1.32 ± 0.09 a 1.19 ± 0.05 ab 1.25 ± 0.10 ac 1.10 ± 0.06 bc
b 50.07 ± 5.63 a 129.88 ± 19.04 b 221.59 ± 34.59 cd 180.78 ± 19.50 bc 227.67 ± 30.22 d 674.21 ± 60.82 e
k 0.069 ± 0.004 a 0.082 ± 0.006 b 0.098 ± 0.003 c 0.100 ± 0.004 c 0.090 ± 0.002 d 0.148 ± 0.005 e
Avt50 57.15 ± 2.91 ac 58.054 ± 1.70 ad 54.78 ± 1.18 bc 52.65 ± 1.17 b 60.46 ± 1.46 d 44.62 ± 1.19 e
Amax—maximum microbial activity; b—the relative microbial activity increase in an arbitrary constant; k—thespecific rate of activity increase; Avt50—time at which the total microbial activity increased at the fastest rate. In eachrow the means with different letters (a, b, c, d, e) are significantly different (p < 0.05, LSD test) considering differentexperimental conditions and/or sampling day.Water 2020, 12, x FOR PEER REVIEW 13 of 25
Figure 6. Cluster analysis based on the Spearman’s rank correlation coefficients estimated for the Biolog® EcoPlatesTM carbon sources utilization patterns for the different experimental conditions (assays AS1, AS2, AS4, and AS5) during the experimental period (30 days). All data were normalized and presented as a color scale ranging from green (MIN, means 0) to red (MAX, means 1).
3.3. Removal of Pharmaceuticals
As the obtained results showed, the degraded doses of APAP, IBU, and NPX were quite similar in the bioaugmented AS1 and the non-bioaugmented AS2 assays (Table 5).
Figure 6. Cluster analysis based on the Spearman’s rank correlation coefficients estimated for theBiolog® EcoPlatesTM carbon sources utilization patterns for the different experimental conditions(assays AS1, AS2, AS4, and AS5) during the experimental period (30 days). All data were normalizedand presented as a color scale ranging from green (MIN, means 0) to red (MAX, means 1).
3.3. Removal of Pharmaceuticals
As the obtained results showed, the degraded doses of APAP, IBU, and NPX were quite similar inthe bioaugmented AS1 and the non-bioaugmented AS2 assays (Table 5).

Water 2020, 12, 1133 12 of 22
Table 5. Degraded doses of analyzed pharmaceuticals in the AS1, AS2, and AS3 assays during 30 daysof treatment.
Pharmaceutical Time of Analysis Assay Degraded Dose (mg L−1)
APAP
t7
AS1 1.0AS2 1.0AS3 1.0
t14
AS1 1.0AS2 1.0AS3 1.0
t21
AS1 1.0AS2 1.0AS3 1.0
t30
AS1 1.0AS2 1.0AS3 1.0
IBU
t7
AS1 1.0AS2 1.0AS3 1.0
t14
AS1 1.0AS2 1.0AS3 1.0
t21
AS1 1.0AS2 1.0AS3 1.0
t30
AS1 1.0AS2 1.0AS3 0.94 ± 0.02
NPX
t7
AS1 0.5AS2 0.5AS3 0.5
t14
AS1 0.5AS2 0.5AS3 0.5
t21
AS1 0.5AS2 0.5AS3 0.5
t30
AS1 0.34 ± 0.00AS2 0.32 ± 0.05AS3 0.44 ± 0.01
DCF
t7
AS1 0.14 ± 0.08AS2 0.12 ± 0.04AS3 0.33 ± 0.04
t14
AS1 0.5 ± 0.00AS2 0.34 ± 0.04AS3 0.39 ± 0.02
t21
AS1 0.46 ± 0.01AS2 0.31 ± 0.02AS3 0.5
t30
AS1 0.49 ± 0.00AS2 0.43 ± 0.05AS3 0.48 ± 0.01
The data are presented as the mean values of three biological replicates ± standard deviation. The last period islonger than the previous due to the measurements in the last day of the experiment (30 day).

Water 2020, 12, 1133 13 of 22
Over the experiment, the AS microorganisms in the AS1, AS2, and AS3 assays completelyutilized four doses of APAP and IBU. Degradation of NPX proceeded similarly in the AS1 and AS2treatment with NPX residue at 0.16 ± 0.00−0.18 ± 0.05 mg L−1. More visible changes were observedin DCF degradation, which was the most ineffective in the AS2 assays with the autochthonousmicroorganisms. The residue of DCF in the AS2 at t7 was 0.38 ± 0.04 mg L−1, at t14—0.16 ± 0.04 mg L−1,at t21—0.19 ± 0.02 mg L−1 and at t30—0.07 ± 0.05 mg L−1. The presence of the bacterial consortium inthe AS1 significantly enhanced DCF degradation compared to its removal by microorganisms in theAS2, with DCF residue at t7—0.36 ± 0.08 mg L−1, at t14—0.00 ± 0.00 mg L−1, at t21—0.04 ± 0.01 mg L−1,and at t30—0.01 ± 0.00 mg L−1. Simultaneously, the incomplete degradation of pharmaceuticals in theAS3 assay with the sterilized AS and bacterial consortium indicated that the degradation of drugs inthe AS1 treatment was partly enhanced by the indigenous microorganisms. The final concentrationof IBU in the AS3 was 0.05 ± 0.02 mg L−1, NPX—0.06 ± 0.01 mg L−1, and DCF—0.02 ± 0.01 mg L−1,whereas, APAP was not detected.
3.4. Secondary Metabolites Formation
In order to identify the most important secondary metabolites formed during the degradation ofthe analyzed drugs, the AS from the assay AS1 was subjected to analysis using the UHPLC MS/MS.The transition of m/z of the precursors to the m/z of the products is given in Table S1. By-productsidentified after every 7 days of treatment are summarized in Table 6. Among the identified metabolites,2-OH-IBU and 4-OH-DCF were characterized by the highest concentration.
Table 6. Secondary metabolites identified in the AS1 assay during 30 days of treatment.
Pharmaceutical Metabolite Time of Analysis RT UHPLC MS/MS (ng mL−1)
APAP
4-aminophenol t7 1.93 <40.0t14 <40.0t21 <40.0t30 <40.0
Hydroquinone t7 nd ndt14 ndt21 ndt30 nd
NPX O-desmethyl-NPX
t7
4.89
<20.0t14 <20.0t21 <20.0t30 <20.0
IBU
1-OH-IBU t7 5.25 <5.0t14 <5.0t21 <5.0t30 <5.0
2-OH-IBU t7 4.81 <5.0t14 <5.0t21 8.6 ± 0.1t30 <5.0
DCF
DCF lactam t7 8.98 <20.0t14 <20.0t21 <20.0t30 <20.0
4-OH-DCF t7 6.11 48.9 ± 0.7t14 72.1 ± 2.2t21 45.9 ± 3.4t30 <20.0
The data are presented as the mean values of three biological replicates ± standard deviation. The last period islonger than the previous due to the measurements in the last day of the experiment (30 day). RT—retention time(min); nd—not detected.

Water 2020, 12, 1133 14 of 22
3.5. New Diclofenac-Degrading Strains
To impose a strong selection pressure, the higher concentrations of DCF than those detected in theWWTPs effluents were used to isolate two new DCF-degrading bacterial strains. The phylogeneticanalysis of the isolates was performed based on the partial sequences of 16S rRNA, and twohousekeeping genes, pyrG and rpoB according to literature data [35]. Newly isolated strains wereassigned as Serratia proteamaculans AS4 and Rahnella bruchi AS7 (Figure 7). It is worth emphasizing thatthis is the first report about Serratia and Rahnella able to degrade DCF. Both strains are rod-shapedGram-negative bacteria with creamy, smooth, and glossy colonies. The abilities of both strains todegrade DCF were studied under the co-metabolic conditions with glucose, because none of them werecapable of utilizing DCF as a sole carbon and energy source. It was found that under such conditionsS. proteamaculans AS4 and R. bruchi AS7 were able to degrade DCF at the concentrations of 0.479 and0.540 mg L−1 within 14 days, respectively (Figure 8).Water 2020, 12, x FOR PEER REVIEW 17 of 25
Figure 7. Phylogenetic tree of the newly isolated strains Serratia proteamaculans AS4 and Rahnella bruchi AS7 based on the partial sequences of 16S rDNA, and two housekeeping genes: CTP synthase (pyrG) and subunit beta of RNA polymerase (rpoB). Branching percentage values were determined with the use of 1000 bootstraps phylogeny test. The accession number for genomes are shown in brackets. The tree was constructed using the maximum likelihood method. The scale bar represents 1% nucleotide sequence divergence.
Figure 8. Changes in the optical density (OD600) and degradation of DCF by S. proteamaculans AS4 and R. bruchi AS7 under co-metabolic conditions with glucose (1 g L−1). The data are presented as the mean values of three biological replicates ± standard deviation.
Figure 7. Phylogenetic tree of the newly isolated strains Serratia proteamaculans AS4 and Rahnellabruchi AS7 based on the partial sequences of 16S rDNA, and two housekeeping genes: CTP synthase(pyrG) and subunit beta of RNA polymerase (rpoB). Branching percentage values were determinedwith the use of 1000 bootstraps phylogeny test. The accession number for genomes are shown inbrackets. The tree was constructed using the maximum likelihood method. The scale bar represents 1%nucleotide sequence divergence.

Water 2020, 12, 1133 15 of 22
Water 2020, 12, x FOR PEER REVIEW 17 of 25
Figure 7. Phylogenetic tree of the newly isolated strains Serratia proteamaculans AS4 and Rahnella bruchi AS7 based on the partial sequences of 16S rDNA, and two housekeeping genes: CTP synthase (pyrG) and subunit beta of RNA polymerase (rpoB). Branching percentage values were determined with the use of 1000 bootstraps phylogeny test. The accession number for genomes are shown in brackets. The tree was constructed using the maximum likelihood method. The scale bar represents 1% nucleotide sequence divergence.
Figure 8. Changes in the optical density (OD600) and degradation of DCF by S. proteamaculans AS4 and R. bruchi AS7 under co-metabolic conditions with glucose (1 g L−1). The data are presented as the mean values of three biological replicates ± standard deviation.
Figure 8. Changes in the optical density (OD600) and degradation of DCF by S. proteamaculans AS4 andR. bruchi AS7 under co-metabolic conditions with glucose (1 g L−1). The data are presented as the meanvalues of three biological replicates ± standard deviation.
4. Discussion
4.1. The Impact of Bioaugmentation and Pharmaceuticals on the AS Quality and Metabolic Diversity
Due to the incomplete removal and poor biodegradability, the NSAIDs and other analgesics areamong the most frequently detected organic contaminants in different natural matrices. Moreover, thelack of sustainable approaches for the removal of the NSAIDs contributes to their continuous releaseto the environment in the parent forms or as active or more stable metabolites [37]. This can leadto their accumulation in trophic chains and cause long-term adverse effects in living organisms [38].For pharmaceuticals removal, the AS technology frequently followed by additional physicochemicalmethods is widely used in various European Union countries [39]. It is worth emphasizing thatbiodegradation is the dominant mechanism for the removal of acidic drugs, i.e., IBU, NPX, and DCF,while sorption and volatilization appear to be of secondary importance [40,41]. This is especiallyimportant for DCF, the most toxic NSAID among those chosen for analysis, due to its weak adsorptionon suspended solids, which results from the occurrence of DCF molecule in the form of an ion atneutral pH [42]. However, it is worth noting that in the literature, some contradictory results about thesorption of the NSAIDs to the AS flocs were published—some authors reported that sorption is relevantfor hydrophobic compounds e.g., the poly-cyclic NSAIDs [41]. Despite that, in most published papersrelated to sorption of the NSAIDs, the authors highlighted that these mechanisms are negligible [42].
Although bioaugmentation has proven to be a valuable strategy to improve the operationalparameters of the biological wastewater treatment systems and enhance the removal of variouspollutants, there is scarce information about its application for the treatment of wastewater containingthe prevalent pharmaceuticals [43]. In this study, we focused mainly on the metabolic response andbiochemical diversity alterations in the AS during feeding with low concentrations of the drugs.As Almeida et al. [44] reported, biodegradation is rarely studied in terms of the mixture of NSAIDsand analgesics, where synergistic effects of the presence of one drug on another are widely observed. Itis well known that a combination of different compounds can affect biodegradation due to its inhibitionor by competition and toxicity [44,45].
In the present study, the multidirectional effects of the mixture of four popular analgesics presentin wastewater at low concentrations as well as the successive bioaugmentation of the AS withpharmaceuticals-degrading strains on the AS quality were studied. The bioaugmentation of the ASwith the designed microbial consortium was intended to enhance the removal efficiency of selected
Water 2020, 12, 1133 16 of 22
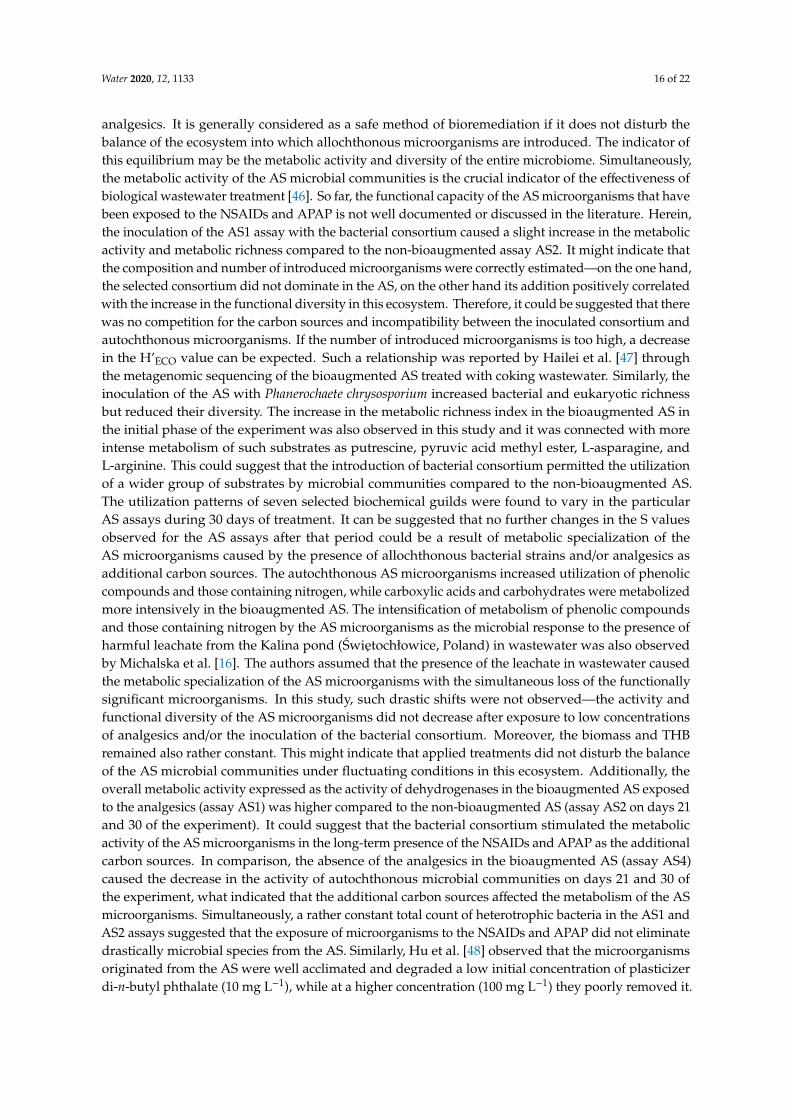
analgesics. It is generally considered as a safe method of bioremediation if it does not disturb thebalance of the ecosystem into which allochthonous microorganisms are introduced. The indicator ofthis equilibrium may be the metabolic activity and diversity of the entire microbiome. Simultaneously,the metabolic activity of the AS microbial communities is the crucial indicator of the effectiveness ofbiological wastewater treatment [46]. So far, the functional capacity of the AS microorganisms that havebeen exposed to the NSAIDs and APAP is not well documented or discussed in the literature. Herein,the inoculation of the AS1 assay with the bacterial consortium caused a slight increase in the metabolicactivity and metabolic richness compared to the non-bioaugmented assay AS2. It might indicate thatthe composition and number of introduced microorganisms were correctly estimated—on the one hand,the selected consortium did not dominate in the AS, on the other hand its addition positively correlatedwith the increase in the functional diversity in this ecosystem. Therefore, it could be suggested that therewas no competition for the carbon sources and incompatibility between the inoculated consortium andautochthonous microorganisms. If the number of introduced microorganisms is too high, a decreasein the H’ECO value can be expected. Such a relationship was reported by Hailei et al. [47] throughthe metagenomic sequencing of the bioaugmented AS treated with coking wastewater. Similarly, theinoculation of the AS with Phanerochaete chrysosporium increased bacterial and eukaryotic richnessbut reduced their diversity. The increase in the metabolic richness index in the bioaugmented AS inthe initial phase of the experiment was also observed in this study and it was connected with moreintense metabolism of such substrates as putrescine, pyruvic acid methyl ester, L-asparagine, andL-arginine. This could suggest that the introduction of bacterial consortium permitted the utilizationof a wider group of substrates by microbial communities compared to the non-bioaugmented AS.The utilization patterns of seven selected biochemical guilds were found to vary in the particularAS assays during 30 days of treatment. It can be suggested that no further changes in the S valuesobserved for the AS assays after that period could be a result of metabolic specialization of theAS microorganisms caused by the presence of allochthonous bacterial strains and/or analgesics asadditional carbon sources. The autochthonous AS microorganisms increased utilization of phenoliccompounds and those containing nitrogen, while carboxylic acids and carbohydrates were metabolizedmore intensively in the bioaugmented AS. The intensification of metabolism of phenolic compoundsand those containing nitrogen by the AS microorganisms as the microbial response to the presence ofharmful leachate from the Kalina pond (Swietochłowice, Poland) in wastewater was also observedby Michalska et al. [16]. The authors assumed that the presence of the leachate in wastewater causedthe metabolic specialization of the AS microorganisms with the simultaneous loss of the functionallysignificant microorganisms. In this study, such drastic shifts were not observed—the activity andfunctional diversity of the AS microorganisms did not decrease after exposure to low concentrationsof analgesics and/or the inoculation of the bacterial consortium. Moreover, the biomass and THBremained also rather constant. This might indicate that applied treatments did not disturb the balanceof the AS microbial communities under fluctuating conditions in this ecosystem. Additionally, theoverall metabolic activity expressed as the activity of dehydrogenases in the bioaugmented AS exposedto the analgesics (assay AS1) was higher compared to the non-bioaugmented AS (assay AS2 on days 21and 30 of the experiment). It could suggest that the bacterial consortium stimulated the metabolicactivity of the AS microorganisms in the long-term presence of the NSAIDs and APAP as the additionalcarbon sources. In comparison, the absence of the analgesics in the bioaugmented AS (assay AS4)caused the decrease in the activity of autochthonous microbial communities on days 21 and 30 ofthe experiment, what indicated that the additional carbon sources affected the metabolism of the ASmicroorganisms. Simultaneously, a rather constant total count of heterotrophic bacteria in the AS1 andAS2 assays suggested that the exposure of microorganisms to the NSAIDs and APAP did not eliminatedrastically microbial species from the AS. Similarly, Hu et al. [48] observed that the microorganismsoriginated from the AS were well acclimated and degraded a low initial concentration of plasticizerdi-n-butyl phthalate (10 mg L−1), while at a higher concentration (100 mg L−1) they poorly removed it.

Water 2020, 12, 1133 17 of 22
The solution was the bioaugmentation of the AS with Micrococcus sp. which enhanced the removalefficiency of higher concentration of the target compound.
4.2. Pharmaceuticals Removal and Secondary Metabolites Formation
In this study, we focused on the visualization and proving that low concentrations of the analgesics,which are detected in the influents are efficiently removed from the sewage, since the large body of theliterature is concerned about the concentrations far exceeding those detected in the environment [10].The abiotic control SWc established within this study confirmed that the removal of the analyzed drugsresulted from the biological activity of the AS microflora. Considering the NSAIDs adsorption, thesorbed pharmaceuticals onto the bacterial surface are frequently released into the medium during thelong-period analysis and we did not observe such a phenomenon. The biodegradation hypothesis isalso further supported by secondary metabolites formation detected by UHPLC MS/MS. A similarconclusion was made by Almeida et al. [44] who investigated the degradation of the NSAIDs mixture bythe AS from three different WWTPs. Generally, the biodegradation kinetics in the bioaugmented assayAS1 and the non-bioaugmented AS2 followed a similar trend, especially for APAP, which was utilizedwith equal efficiency in both systems. Efficient biodegradation of APAP, the monocyclic analgesic withrelatively simple chemical structure was expected in both the bioaugmented and non-bioaugmentedsystems. Similar observations were made by De Gusseme et al. [49] who demonstrated that after 16 daysof operation at a hydraulic retention time of 5 days in a membrane bioreactor, upward of 99.9% removalof the administered dose of APAP (100 µg L−1) was obtained. The established microbial consortiumwas also able to degrade APAP at an environmentally relevant concentration of 8.3 µg L−1. Moreover,under the batch incubation conditions with heat-killed microorganisms the biological removal of APAPhas been confirmed since its sorption to the biomass was negligible. In comparison, IBU with a highbranch structure and the presence of substitutions at the para position of the aromatic ring is foundas more resistant to biodegradation than APAP [50,51]. In this study, any significant changes in theremoval of tested pharmaceuticals between microorganisms in the AS1 and AS2 assays were observed.Physicochemical properties of IBU molecule may determine its relatively high mobility in watersbut, in comparison with other pharmaceuticals, its persistence may be lower [52]. Considering ourresults, this hypothesis is more probable. For IBU, the AS autochthonous microflora was equally ableto metabolize IBU at the chosen concentration. Similar results were obtained by Almeida et al. [44]who investigated the degradation of IBU at the concentration of 0.5–1.0 mg L−1 by the AS derivedfrom three different municipal WWTPs. For DCF, to date, only a few reports about degradationhave been published, e.g., by attached growth biomass from a carrier-filled compartment of a hybridbioreactor at the WWTP, microbial removal investigated in a MBR, or DCF removal by microorganismsfrom agricultural soils [53–55], however, microorganisms responsible for its biodegradation havenot been identified. As a consequence, limited information regarding microorganisms responsiblefor DCF utilization and microbial processes underlying the degradation of its residues are available.The sensitivity of microorganisms to this compound could be partly responsible for the harmful effectsof DCF and/or DCF-containing mixtures on the microbial biodiversity in the AS. Jewell et al. [56]revealed 88% removal of the initial concentration of DCF (1.6 µg L−1) in the influent of the full-scaleWWTP during 10-day monitoring experiment and confirmed the formation of several by-products. Inthis study, significant differences in DCF removal were found between the bioaugmented assay AS1 andnon-bioaugmented AS2. It was probably caused by the inoculation of the AS with P. moorei KB4 strain,which can metabolize relatively high concentrations of DCF. For NPX, the second analyzed polycyclicNSAIDs, the dynamics rates were quite similar for the AS1 and AS2 assays. Considering its highresistance to the biological treatment, extremely limited knowledge about degradation pathways andmicroorganisms capable of degrading this NSAID, the bioaugmentation strategy may be a promisingtool for the successful removal of NPX in wastewater [57]. Despite the relatively large release of theanalyzed pharmaceuticals into the environment, the knowledge about the metabolic pathways of theirdegradation remains still not fully understood. The partial metabolic pathways and key metabolites

Water 2020, 12, 1133 18 of 22
formed during the degradation of tested pharmaceuticals by bacterial strains used in the consortiumwere established in the previous studies [31,51,58]. For APAP, the two most frequently detectedmicrobial metabolites include hydroquinone and 4-aminophenol [21,31,59,60]. In this study, in theassay AS1 both metabolites were identified and efficiently removed by the AS communities. For IBU,the hydroxy- and carboxyibuprofen derivatives are described as the most commonly detected in theWWTPs effluents [61]. The formation of both 1-OH-IBU and 2-OH-IBU metabolites were observed inthe AS1 assay, although, the analysis performed with the use of UHPLC MS/MS revealed that bothmetabolites were efficiently degraded. Over 30 days of treatment, the accumulation of 2-OH-IBU inthe AS1 was observed at t21, however, its presence was not further revealed (t30). The accumulationof O-desmethylnaproxen, a key by-product of NPX degradation, identified e.g., for B. thuringiensisB1(2015b) [58], was excluded by the UHPLC MS/MS analysis. For DCF, 4-OH-DCF and lactam DCFare known as one of the most important initially formed secondary metabolites during microbialdegradation [56]. The constant presence of 4-OH-DCF was confirmed in the AS1 assay using theUHPLC MS/MS with the highest value at t21. Noteworthy, after every 7 days of the AS1 assay operation,none of the tested drugs were found. Moreover, further analysis confirmed that key by-productswere metabolized by the same microorganisms, which clearly indicated that examined drugs at lowconcentrations as well as their key metabolites were not accumulated. Considering that most of theorganic pollutants and their by-products are characterized by high toxicity and chemical stability,from the environmental point of view biodegradation of the mature compound and its metabolites isextremely beneficial.
4.3. Isolation of New DCF-Degrading Strains
The novelty of this work relates also to the isolation of two new bacterial strainsSerratia proteamaculans AS4 and Rahnella bruchi AS7 able to DCF degrade. Although the 16S rRNAsequence is widely used to establish the taxonomy of the newly isolated strains due to its highconservation, failing to provide proper phylogenetic resolution to assigned analyzed strains to the levelof species [62,63]. Thus, MLST analysis performed in this study based on the two additional genesprovided better discrimination of the phylogenetic analysis. To date, only a few DCF-metabolizingbacterial strains have been isolated, e.g., Enterobacter hormachei D15 [42], Raoultella sp. DD4 [64],Brevibacterium sp. D4 [65], Raoultella sp. KDF8 [66], Labrys portucalensis F11 [67], and Klebsiella sp.KSC [68]. The ability of new isolates to degrade DCF were studied under the co-metabolic conditionswith glucose, because none of them were able to metabolize DCF as a sole carbon and energy source.Supplementation with the additional carbon source frequently ensures the increase in the bacterialbiomass and, simultaneously, better degradation of the drug [29]. Similarly, glucose as an external carbonsource applied by Aissaoui et al. [42] under co-metabolic degradation of DCF by Enterobacter hormaecheiD15 strain significantly intensified biodegradation efficiency. In turn, Moreira et al. [67] intensifiedbiodegradation of DCF by Labrys portucalensis F11 strain by periodic feeding with sodium acetate,which allowed to obtain higher bacterial density. In this study, S. proteamaculans AS4 and R. bruchi AS7were able to degrade almost 0.5 mg L−1 of DCF which definitely exceeds the detected environmentalconcentrations of this drug.
5. Conclusions
The AS technology is an effective method for treating the wastewater containing selected mono-and polycyclic NSAIDs and/or analgesics. The bioaugmentation of the AS with bacterial strains withnaturally increased degradative capabilities seems to be a promising solution for the removal of poorlybiodegradable pharmaceuticals e.g., DCF and NPX. In this study, the addition of the designed microbialconsortium consisting of three pharmaceuticals-degrading strains did not cause any severe changes inthe biomass and metabolic activity of the AS microorganisms. Moreover, in the metabolic properties ofthe autochthonous microflora any significant changes were not found. Nevertheless, the introducedstrains intensified the metabolism of different groups of substrates compared to the non-bioaugmented

Water 2020, 12, 1133 19 of 22
AS. Throughout the experiment, we identified a few key secondary metabolites including hydroxylatedderivatives of IBU and DCF. Additionally, two new DCF-degrading isolates were obtained from thenon-bioaugmented AS, namely Serratia proteamaculans AS4 and Rahnella bruchi AS7.
Supplementary Materials: The following are available online at http://www.mdpi.com/2073-4441/12/4/1133/s1,Table S1: The electrospray mode of the analyzed compounds and transition of m/z of precursors to m/z of products.
Author Contributions: Conceptualization, J.Z., A.N.; methodology, J.Z., A.N., J.M., A.P.; software, J.Z., A.N., J.M.,A.P.; validation, J.Z., A.N., formal analysis, A.M.; investigation, J.Z., A.N., A.P.; data curation, J.Z., A.N., J.M., A.P.;writing—original draft preparation, J.Z., A.N., J.M.; writing—review and editing, A.M.; visualization, J.Z., A.N.,J.M., A.P., supervision, J.Z., A.N., A.M.; project administration, J.Z., A.N.; funding acquisition, J.Z. All authorshave read and agreed to the published version of the manuscript.
Funding: This research was funded by the Ministry of Science and Higher Education and realized under theIntelligent Development Operational Program (2014–2020), grant number 8/NAB3/II+/2017.
Conflicts of Interest: The authors declare no conflict of interest.
References
1. Benotti, M.J.; Brownawell, B.J. Microbial degradation of pharmaceuticals in estuarine and coastal seawater.Environ. Pollut. 2009, 157, 994–1002. [CrossRef] [PubMed]
2. Kim, S.; Chu, K.H.; Al-Hamadani, Y.A.J.; Park, C.M.; Jang, M.; Kim, D.-H.; Yu, M.; Heo, J.; Yoon, Y. Removalof contaminants of emerging concern by membranes in water and wastewater: A review. Chem. Eng. J. 2018,335, 896–914. [CrossRef]
3. Roberts, P.H.; Thomas, K.V. The occurrence of selected pharmaceuticals in wastewater effluent and surfacewaters of the lower Tyne catchment. Sci. Pollut. Res. 2006, 356, 143–153. [CrossRef] [PubMed]
4. Esterhuizen-Londt, M.; Schwartz, K.; Pflugmacher, S. Using aquatic fungi for pharmaceutical bioremediation:Uptake of acetaminophen by Mucor hiemalis does not result in an enzymatic oxidative stress response.Fungal Biol. 2016, 120, 1249–1257. [CrossRef] [PubMed]
5. Guerra, P.; Kim, M.; Shah, A.; Alaee, M.; Smyth, S.A. Occurrence and fate of antibiotic,analgesic/anti-inflammatory, and antifungal compounds in five wastewater treatment processes. Sci. TotalEnviron. 2014, 473, 235–243. [CrossRef]
6. Luo, Y.; Guo, W.; Ngo, H.H.; Nghiem, L.D.; Hai, F.I.; Zhang, J.; Liang, J.; Wang, X. A review on the occurrenceof micropollutants in the aquatic environment and their fate and removal during wastewater treatment.Sci. Total Environ. 2014, 473–474, 619–641. [CrossRef]
7. Matongo, S.; Birungi, G.; Moodley, B.; Ndungu, P. Pharmaceutical residues in water and sediment ofMsunduzi River, Kwa Zulu-Natal, South Africa. Chemosphere 2015, 134, 133–140. [CrossRef]
8. Ashfaq, M.; Noor, N.; Saif-Ur-Rehman, M.; Sun, Q.; Mustafa, G.; Nazar, M.F.; Yu, C.-P. Determinationof commonly used pharmaceuticals in hospital waste of Pakistan and evaluation of their ecological riskassessment. Clean Water Air Soil 2017, 45, 1500392. [CrossRef]
9. Tiwari, B.; Sellamuthu, B.; Ouarda, Y.; Drogui, P.; Tyagi, R.D.; Buelna, G. Review on fate and mechanism ofremoval of pharmaceutical pollutants from wastewater using biological approach. Bioresour. Technol. 2017,224, 1–12. [CrossRef]
10. Zur, J.; Pinski, A.; Marchlewicz, M.; Hupert-Kocurek, K.; Wojcieszynska, D.; Guzik, U. Organic micropollutantsparacetamol and ibuprofen—Toxicity, biodegradation, and genetic background of their utilization by bacteria.Environ. Sci. Pollut. Res. 2018, 25, 21498–21524. [CrossRef]
11. Falås, P.; Baillon-Dhumez, A.; Andersen, H.R.; Ledin, A.; la Cour Jansen, J. Suspended biofilm carrier andactivated sludge removal of acidic pharmaceuticals. Water Res. 2012, 46, 1167–1175. [CrossRef] [PubMed]
12. Festa, S.; Coppotelli, B.M.; Morelli, I.S. Comparative bioaugmentation with a consortium and a single strainin a phenanthrene-contaminated soil: Impact on the bacterial community and biodegradation. Appl. SoilEcol. 2016, 98, 8–19. [CrossRef]
13. Loperana, L.; Saravia, V.; Murro, D.; Ferrari, M.D.; Lareo, C. Kinetic properties of a commercial and a nativeinoculum for aerobic milk fat degradation. Bioresour. Technol. 2006, 97, 2160–2165. [CrossRef] [PubMed]

Water 2020, 12, 1133 20 of 22
14. Loperana, L.; Ferrari, M.D.; Saravia, V.; Murro, D.; Lima, C.; Ferrando, L.; Fernández, A.; Lareo, C.Performance of a commercial inoculum for the aerobic biodegradation of a high fat content dairy wastewater.Bioresour. Technol. 2007, 98, 1045–1051. [CrossRef] [PubMed]
15. Singer, A.C.; van der Gast, C.J.; Thompson, I.P. Perspectives and vision for strain selection in bioaugmentation.Trends Biotechnol. 2005, 23, 74–77. [CrossRef] [PubMed]
16. Michalska, J.; Gren, I.; Zur, J.; Wasilkowski, D.; Mrozik, A. Impact of the biological cotreatment of the KalinaPond leachate on laboratory sequencing batch reactor operation and activated sludge quality. Water 2019, 11,1539. [CrossRef]
17. Hernandez-Raquet, G.; Durand, E.; Braun, F.; Cravo-Laureau, C.; Godon, J.-J. Impact of microbial diversitydepletion on xenobiotic degradation by sewage-activated sludge. Environ. Microbiol. Rep. 2013, 4, 588–594.[CrossRef]
18. Domaradzka, D.; Guzik, U.; Wojcieszynska, D. Biodegradation and biotransformation of polycyclicnon-steroidal anti-inflammatory drugs. Rev. Environ. Sci. Biotechnol. 2015, 14, 229–239. [CrossRef]
19. Thompson, I.P.; Van Der Gast, C.J.; Ciric, L.; Singer, A. Bioaugmentation for bioremediation: The challengeof strain selection. Environ. Microbiol. 2005, 7, 909–915. [CrossRef]
20. Nzila, A.; Razzak, S.A.; Zhu, J. Bioaugmentation: An emerging strategy of industrial wastewater treatmentfor reuse and discharge. Int. J. Environ. Res. Public Health 2016, 13, 846. [CrossRef]
21. Zhang, L.; Hu, J.; Zhu, R.; Zhou, Q.; Chen, J. Degradation of paracetamol by pure bacterial cultures and theirmicrobial consortium. Appl. Microbiol. Biotechnol. 2013, 97, 3687–3698. [CrossRef] [PubMed]
22. Kolvenbach, B.A.; Helbling, D.E.; Kohler, H.-P.E.; Corvini, P.F.-X. Emerging chemicals and the evolutionof biodegradation capacities and pathways in bacteria. Curr. Opin. Biotechnol. 2014, 27, 8–14. [CrossRef][PubMed]
23. Li, Z.; McLachlan, M.S. Biodegradation of chemicals in unspiked surface waters downstream of wastewatertreatment plants. Environ. Sci. Technol. 2019, 53, 1884–1892. [CrossRef]
24. APHA. Standard Methods for the Examination of Water and Wastewater; American Public Health Association,American Water Works Association, Water Environment Federation: Washington, DC, USA, 1999.
25. Miksch, K. Application of dehydrogenase activity determinations in biodegradation of refinery sewage.Gas Water Civ. Technol. 1977, 51, 234–235.
26. Schumacher, T.E.; Eynard, A.; Chintala, R. Rapid cost-effective analysis of microbial activity in soils usingmodified fluorescein diacetate method. Environ. Sci. Pollut. Res. 2015, 22, 4759–4762. [CrossRef] [PubMed]
27. Lim, J.W.; Yan, J.Z.; Seng, C.E. Performance of phenol-acclimated activated sludge in the presence of variousphenolic compound. Appl. Water Sci. 2013, 3, 515–525. [CrossRef]
28. EN ISO 8199:2010. Water Quality—General Requirements and Guidance for Microbiological Examinations byCulture; International Organization for Standardization: Geneva, Switzerland, 2010.
29. Marchlewicz, A.; Domaradzka, D.; Guzik, U.; Wojcieszynska, D. Bacillus thuringiensis B1(2015b) is aGram-positive bacteria able to degrade naproxen and ibuprofen. Water Air Soil Pollut. 2016, 227, 197.[CrossRef]
30. Guzik, U.; Gren, I.; Wojcieszynska, D.; Łabuzek, S. Isolation and characterization of a novel strain ofStenotrophomonas maltophilia possessing various dioxygenases for monocyclic hydrocarbon degradation.Braz. J. Microbiol. 2009, 40. [CrossRef]
31. Zur, J.; Wojcieszynska, D.; Hupert-Kocurek, K.; Marchlewicz, A.; Guzik, U. Paracetamol—Toxicity andmicrobial utilization. Pseudomonas moorei KB4 strain as a case study for exploring degradation pathway.Chemosphere 2018, 206, 192–202. [CrossRef]
32. Wojcieszynska, D.; Guzik, U.; Gren, I.; Perkosz, M.; Hupert-Kocurek, K. Induction of aromatic ring: Cleavagedioxygenases in Stenotrophomonas maltophilia strain KB2 in cometabolic systems. World J. Microbiol. Biotechnol.2011, 27, 805–811. [CrossRef]
33. Miksch, K. The influence of the concentration of dissolved oxygen on the determination of the dehydrogenaseactivity of activated sludge using method of TTC test. Clean Soil Air Water. 1983, 11, 17–21. [CrossRef]
34. Nowak, A.; Mrozik, A. Degradation of 4-chlorophenol and microbial diversity in soil inoculated withsingle Pseudomonas sp. CF600 and Stenotrophomonas maltophilia KB2. J. Environ. Manag. 2018, 215, 216–229.[CrossRef] [PubMed]
35. Wu, M.; Eisen, J. A simple, fast, and accurate method of phylogenomic inference. Genome Biol. 2008, 9, R151.[CrossRef] [PubMed]

Water 2020, 12, 1133 21 of 22
36. Wattam, A.R.; Davis, J.J.; Assaf, R.; Boisvert, S.; Brettin, T.; Bun, C.; Conrad, N.; Dietrich, E.M.; Disz, T.;Gabbard, J.L.; et al. Improvements to PATRIC, the all-bacterial bioinformatics database and analysis resourcecenter. Nucl. Acid Res. 2017, 45, 535–542. [CrossRef] [PubMed]
37. Rozas, O.; Vidal, C.; Baeza, C.; Jardim, W.F.; Rossner, A.; Mansilla, H.D. Organic micropollutants (OMPs) innatural waters: Oxidation by UV/H2O2 treatment and toxicity assessment. Water Res. 2016, 98, 109–118.[CrossRef] [PubMed]
38. Grujíc, S.; Vasiljevic, T.; Lauševic, M. Determination of multiple pharmaceutical classes in surface andground waters by liquid chromatography-ion-trap-tandem-mass spectrometry. J. Chromatogr. A 2009, 1216,4989–5000. [CrossRef]
39. Paxéus, N. Removal of selected non-steroidal anti-inflammatory drugs (NSAIDs), gemfibrozil, carbamazepine,β-blockers, trimethoprim and triclosan in conventional wastewater treatment plants in five EU countriesand their discharge to the aquatic environment. Water Sci. Technol. 2004, 50, 253–260. [CrossRef]
40. Quintana, J.B.; Weiss, S.; Reemtsma, T. Pathways and metabolites of microbial degradation of selected acidicpharmaceutical and their occurrence in municipal wastewater treated by membrane bioreactor. Water Res.2005, 39, 2654–2664. [CrossRef]
41. Salgado, R.; Marques, R.; Noronha, J.P.; Carvalho, G.; Oehmen, A.; Reis, M.A. Assessing the removal ofpharmaceuticals and personal care products in a full-scale activated sludge plant. Environ. Sci. Pollut.Res. Int. 2012, 19, 1818–1827. [CrossRef]
42. Aissaoui, S.; Ouled-Haddar, H.; Sifour, M.; Harrouche, K.; Sghaier, H. Metabolic and co-metabolictransformation of diclofenac by Enterobacter hormachei D15 isolated from activated sludge. Curr. Microbiol.2016, 74, 381–388. [CrossRef]
43. Jiménez-Silva, V.A.; Santoyo-Tepole, F.; Ruiz-Ordaz, N.; Galíndez-Mayer, J. Study of the ibuprofen impacton wastewater treatment mini-plants with bioaugmented sludge. Process Saf. Environ. 2019, 123, 140–149.[CrossRef]
44. Almeida, B.; Oehmen, A.; Marques, R.; Brito, D.; Carvalho, G.; Barreto Crespo, M.T. Modelling thebiodegradation of non-steroidal anti-inflammatory drugs (NSAIDs) by activated sludge and a pure culture.Bioresour. Technol. 2013, 133, 31–37. [CrossRef] [PubMed]
45. Reardon, K.F.; Mosteller, D.C.; Rogers, J.B.; Du Teau, N.M.; Kim, K.H. Biodegradation kinetics of aromatichydrocarbon mixtures by pure and mixed bacterial cultures. Environ. Health Perspect. 2002, 6, 1005–1011.[CrossRef] [PubMed]
46. Xia, Y.; Wen, X.; Zhang, B.; Yang, Z. Diversity and assembly patterns of activated sludge microbialcommunities: A review. Biotechnol. Adv. 2018, 36, 1038–1047. [CrossRef]
47. Hailei, W.; Ping, L.; Ying, W.; Lei, L.; Jianming, Y. Metagenomic insight into the bioaugmentation mechanismof Phanerochaete chrysosporium in an activated sludge system treating coking wastewater. J. Hazard. Mater.2017, 321, 820–829. [CrossRef]
48. Hu, J.; Yang, Q.; Wang, J.L. Biodegradation of di-n-butyl phthalate in sequencing batch reactor bioaugmentedwith Micrococcus sp. and the bacterial community analysis. Int. J. Environ. Sci. Technol. 2015, 12, 2819–2828.[CrossRef]
49. De Gusseme, B.; Vanhaecke, L.; Verstraete, W.; Boona, N. Degradation of acetaminophen by Delftia tsuruhatensisand Pseudomonas aeruginosa in a membrane bioreactor. Water Res. 2011, 45, 1829–1837. [CrossRef]
50. Musson, S.E.; Campo, P.; Tolaymat, T.; Suidan, M.; Townsend, T.G. Assessment of the anaerobic degradationof six active pharmaceutical ingredients. Sci. Total. Environ. 2010, 408, 2068–2074. [CrossRef]
51. Marchlewicz, A.; Guzik, U.; Smułek, W.; Wojcieszynska, D. Exploring the degradation of ibuprofen byBacillus thuringiensis B1(2015b): The new pathway and factors affecting degradation. Molecules 2017, 22, 1676.[CrossRef]
52. Parolini, M.; Binelli, A.; Provini, A. Chronic effects induced by ibuprofen on the freshwater bivalveDreissena polymorpha. Ecotoxicol. Environ. Saf. 2011, 74, 1586–1594. [CrossRef]
53. Kosjek, T.; Heath, E.; Perez, S.; Petrovic, M.; Barcelo, D. Metabolism studies of diclofenac and clofibricacid in activated sludge bioreactors using liquid chromatography with quadrupole and time-of-flight massspectrometry. J. Hydrol. 2009, 372, 109–117. [CrossRef]
54. Al-Rajab, A.J.; Sabourin, L.; Lapen, D.R.; Topp, E. The non-steroidal anti-inflammatory drug diclofenac isreadily biodegradable in agricultural soils. Sci. Total Environ. 2010, 409, 78–82. [CrossRef] [PubMed]

Water 2020, 12, 1133 22 of 22
55. Langenhoff, A.; Inderfurth, N.; Veuskens, T.; Schraa, G.; Blokland, M.; Kujawa-Roeleveld, K.; Rijnaarts, H.Microbial removal of the pharmaceuticals compounds ibuprofen and diclofenac from wastewater. BioMedRes. Int. 2013, 2013, 325806. [CrossRef]
56. Jewell, K.S.; Falås, P.; Wick, A.; Joss, A.; Ternes, T.A. Transformation of diclofenac in hybrid biofilm activatedsludge processes. Water Res. 2016, 105, 559–567. [CrossRef] [PubMed]
57. Matamoros, V.; Arias, C.; Brix, H.; Bayona, J.M. Preliminary screening of small-scale domestic wastewatertreatment systems for removal of pharmaceutical and personal care products. Water Res. 2009, 43, 55–62.[CrossRef] [PubMed]
58. Górny, D.; Guzik, U.; Hupert-Kocurek, K.; Wojcieszynska, D. A new pathway for naproxen utilisation byBacillus thuringiensis B1(2015b) and its decomposition in the presence of organic and inorganic contaminants.J. Environ. Manag. 2019, 239, 1–7. [CrossRef]
59. Wu, S.; Zhang, L.; Chen, J. Paracetamol in the environment and its degradation by microorganisms.Appl. Microbiol. Biotechnol. 2012, 96, 875–884. [CrossRef]
60. Zur, J.; Pinski, A.; Michalska, J.; Hupert-Kocurek, K.; Nowak, A.; Wojcieszynska, D.; Guzik, U. A whole-cellimmobilization system on bacterial cellulose for the paracetamol-degrading Pseudomonas moorei KB4 strain.Int. Biodeterior. Biodegrad. 2020, 149, 104919. [CrossRef]
61. Murdoch, R.W.; Hay, A.G. The biotransformation of ibuprofen to trihydroxyibuprofen in activated sludge byVariovorax Ibu-1. Biodegradation 2015, 26, 105–113. [CrossRef]
62. Patiño, L.H.; Camargo, M.; Muñoz, M.; Ríos-Chaparro, D.I.; Patarroyo, M.A.; Ramírez, J.D. Unveilingthe Multilocus Sequence Typing (MLST) schemes and core genome phylogenies for genotypingChlamydia trachomatis. Front. Microbiol. 2018, 9, 1854. [CrossRef]
63. Hu, Y.; Wei, L.; Feng, Y.; Xie, Y.; Zong, Z. Klebsiella huaxiensis sp. nov., recovered from human urine. Int. J.Syst. Evol. Microbiol. 2019, 69, 333–336. [CrossRef] [PubMed]
64. Domaradzka, D.; Guzik, U.; Hupert-Kocurek, K.; Wojcieszynska, D. Toxicity of diclofenac and itsbiotransformation by Raoultella sp. DD4. Pol. J. Environ. Stud. 2016, 25, 2211–2216. [CrossRef]
65. Bessa, V.S.; Moreira, I.S.; Tiritan, M.E.; Castro, P.M.L. Enrichment of bacterial strains for the biodegradationof diclofenac and carbamazepine from activated sludge. Int. Biodeterior. Biodegrad. 2017, 120, 135–142.[CrossRef]
66. Palyzová, A.; Zahradník, J.; Marešová, H.; Sokolová, L.; Kyslíková, E.; Grulich, M.; Štepánek, V.; Rezanka, T.;Kyslík, P. Potential of the strain Raoultella sp. KDF8 for removal of analgesics. Folia Microbiol. (Praha) 2018,63, 273–282. [CrossRef]
67. Moreira, I.S.; Bessa, V.S.; Murgolo, S.; Piccirillo, C.; Mascolo, G.; Castro, P.M.L. Biodegradation of diclofenacby the bacterial strain Labrys portucalensis F11. Ecotoxicol. Environ. Saf. 2018, 152, 104–113. [CrossRef]
68. Stylianou, K.; Hapeshi, E.; Vasquez, M.; Fatta-Kassinos, D.; Vyrides, I. Diclofenac biodegradation by newlyisolated Klebsiella sp. KSC: Microbial intermediates and ecotoxicological assessment. J. Environ. Chem. Eng.2018, 6, 3242–3248. [CrossRef]
© 2020 by the authors. Licensee MDPI, Basel, Switzerland. This article is an open accessarticle distributed under the terms and conditions of the Creative Commons Attribution(CC BY) license (http://creativecommons.org/licenses/by/4.0/).