effects of nutrition therapy on hba1c and cardiovascular
TRANSCRIPT

RESEARCH Open Access
Effects of nutrition therapy on HbA1c andcardiovascular disease risk factors inoverweight and obese patients with type 2diabetesAdham Mottalib1* , Veronica Salsberg1, Barakatun-Nisak Mohd-Yusof1,2, Wael Mohamed1, Padraig Carolan1,David M. Pober1, Joanna Mitri1 and Osama Hamdy1
Abstract
Background: Nutrition Therapy (NT) is essential in type 2 diabetes (T2D) management. Standards of carerecommend that each patient engages with a nutritionist (RDN) to develop an individualized eating plan. However,it is unclear if it is the most efficient method of NT. This study evaluates the effects of three differentmethods of NT on HbA1c and cardiovascular disease risk factors in overweight and obese patients with T2D.
Methods: We randomized 108 overweight and obese patients with T2D (46 M/62F; age 60 ± 10 years; HbA1c8.07 ± 1.05%; weight 101.4 ± 21.1 kg and BMI 35.2 ± 7.7 kg/m2) into three groups. Group A met with RDN todevelop an individualized eating plan. Group B met with RDN and followed a structured meal plan. Group Cdid similar to group B and received weekly phone support by RDN.
Results: After 16 weeks, all three groups had a significant reduction of their energy intake compared tobaseline. HbA1c did not change from baseline in group A, but decreased significantly in groups B (− 0.66%,95% CI -1.03 to − 0.30) and C (− 0.61%, 95% CI -1.0 to − 0.23) (p value for difference among groups overtime < 0.001). Groups B and C also had significant reductions in body weight, body fat percentage and waistcircumference.
Conclusion: Structured NT alone improves glycemia in comparison to individualized eating plans inoverweight and obese patients with T2D. It also reduces other important cardiovascular disease risk factorslike body fat percentage and waist circumference.
Trial registration: The trial was retrospectively registered at clinicaltrials.gov( NCT02520050).
Keywords: Clinical nutrition, Nutrition therapy, Lifestyle intervention, Diabetes management, Weightmanagement
BackgroundObesity and type 2 diabetes (T2D) are chronic diseasesthat reached pandemic proportions [1, 2]. Cardiovasculardisease risk in patients with both T2D and obesity issignificantly high and leads to increased morbidity andmortality [3, 4]. Physicians and professional societies agreethat lifestyle changes that include nutrition therapy (NT)
are the first-line therapy for patients with T2D [5–7]. Theeffectiveness of NT in reducing glycosylated hemoglobin(HbA1c) and cardiovascular disease risk factors in patientswith diabetes was previously demonstrated in manystudies and meta-analyses [8, 9]. Standards of care in dia-betes recommend that each patient engages with a regis-tered dietitian nutritionist (RDN) to develop anindividualized eating plan [5, 6, 10]. In practice, patientsand their healthcare providers became fully responsible inreaching an agreement on the best dietary caloric leveland macronutrient distribution that fit patients’ needs [5,
* Correspondence: [email protected] Diabetes Center, Harvard Medical School, One Joslin Place, Boston,MA 02215, USAFull list of author information is available at the end of the article
© The Author(s). 2018 Open Access This article is distributed under the terms of the Creative Commons Attribution 4.0International License (http://creativecommons.org/licenses/by/4.0/), which permits unrestricted use, distribution, andreproduction in any medium, provided you give appropriate credit to the original author(s) and the source, provide a link tothe Creative Commons license, and indicate if changes were made. The Creative Commons Public Domain Dedication waiver(http://creativecommons.org/publicdomain/zero/1.0/) applies to the data made available in this article, unless otherwise stated.
Mottalib et al. Nutrition Journal (2018) 17:42 https://doi.org/10.1186/s12937-018-0351-0

6, 10]. This left many patients and their healthcare pro-viders uncertain on how to best implement NT.The aim of this study is to identify the optimal model
of NT by evaluating the effects of three differentmethods of NT on HbA1c and other cardiovascular dis-ease risk factors in overweight and obese patients withT2D.
MethodsStudy populationWe included female and male patients between 18–80 yearsof age who were diagnosed with T2D and were not treatedwith insulin but managed by stable doses of other diabetesmedications for ≥3 months prior to enrollment, with HbA1c≥7% and body mass index (BMI) ≥25 kg/m2. Patients onantihypertensive and/or cholesterol lowering medicationswere also managed by stable doses of these medications for≥3 months prior to enrollment. We excluded pregnantwomen and patients with history of bariatric surgery,gastroparesis or patients who were actively enrolled inweight management programs. Study participants wererecruited through advertisement in local media and clinicreferrals. After screening, eligible participants signed thestudy consent form, which was approved by the InstitutionalReview Board.
Study designThis is a prospective, randomized, three-arm study of16 weeks duration. The study was conducted betweenApril 2015 and June 2016. Eligible participants were ran-domized to three different methods of NT. Participantsin group A followed the current standard of care recom-mendations [5, 6, 10] where they met with the studyRDN to develop an individualized eating plan with ob-jectives of lowering HbA1c and reducing weight throughreduction of energy intake. Participants in this groupreceived educational materials demonstrating the “PlateMethod” and healthy eating [11]. This method teachesindividuals to plan their meals such that one-third toone-half of their plate is filled with non-starchy vegeta-bles, and the remainder of the plate is divided evenlybetween lean protein and starchy foods with an em-phasis on healthy carbohydrate foods such as wholegrains and starchy vegetables. Participants also receivededucational materials to guide them on making healthierchoices within each food group. While there were nopre-specified targets for daily energy or macronutrientintake, dietary counseling for this group aimed at devel-oping 2–5 individualized nutrition goals in order toimprove HbA1c and reduce body weight. These goalswere set while considering each participant’s motivationlevel, food preferences, current eating patterns, andability to follow recommended dietary modifications.The study RDN provided support and follow-up on
participants’ progress towards goals throughout theintervention at the scheduled study visits and follow-upphone calls.Participants in groups B and C followed a well-defined,
structured dietary plan according to the Joslin NutritionGuidelines for overweight and obese patients with type 2diabetes [12]. Participants were instructed to follow ahypocaloric dietary plan (1500 kcal/day for women,1800 kcal/day for men) that included use of a commer-cially available diabetes specific nutrition formula (DSNF)1–3 times per day within their caloric limit. The DSNF had220 kcal/serving and contained 32.7% calories from fat,40% calories from carbohydrate, and 27.3% calories fromprotein. The meal replacement was provided to par-ticipants free of charge. The meal plans provided ap-proximately 40–45% calories from low-glycemic indexcarbohydrate, 1–1.5 g/kg of body weight from protein,and the rest of daily calories from fat with < 10% saturatedfat. Sodium was limited to < 2300 mg sodium and fiber in-take was adjusted to provide 14 g/1000 calories. All partic-ipants in groups B and C were provided with a dinnermenu book containing 17 different recipes according theabove macronutrients composition with detailed ingredi-ents, nutrition facts and cooking instructions. Snack listswere also provided for one additional 150–200 caloriesnack per day.To investigate whether increased frequency of patient-
RDN interaction affects study outcomes, group Creceived once weekly phone coaching and support pro-vided by an RDN. The purpose of these calls was to mo-tivate them to adhere to the nutritional intervention,provide guidance on implementing the structured diet-ary plan, and answer questions that may arise duringintervention.Study participants were asked to maintain their base-
line activity level without any change throughout thestudy period and were not given any specific exercise orbehavioral recommendations and were not asked to keepan exercise log in order to narrow the study interventionvariables to that related to NT alone. All participantscame to the clinical research center for three study visits(baseline, 8 weeks and 16 weeks) during which theyspent one hour with the study RDN. All participants re-ceived two 15-min follow-up phone calls (at weeks 4and 12) from the study RDN to provide dietary advice,promote adherence and address any questions or con-cerns. Before the first baseline visit, all participants wereasked to complete a 3-day food log; recording all foodsand beverages consumed on any 2 random week-daysand 1 weekend day during the week prior to the visit.Participants in group A were asked to complete a 3-dayfood log during the week prior to their second and finalstudy visits. Participants in groups B and C were askedto record their daily food and frequency of DSNF intake
Mottalib et al. Nutrition Journal (2018) 17:42 Page 2 of 10

in their dietary log books throughout the 16 weeks ofintervention.Participants were instructed to record amounts of
foods consumed using household measurements (meas-uring cups, measuring spoons, etc.) and to recordweights or volumes of food or beverages for packaged,individual-serving foods. If participants consumed foodsoutside the home, they were instructed to estimate por-tion. The food logs had specified sections in which torecord a description of the food or beverage consumed,how the food was prepared, and if there was any oils/fats, salt, sugar, or other condiments or sauces added tothe food or beverage either during preparation or justprior to consumption. Participants were prompted by in-structions on the food log to record the time and occa-sion of each meal, snack, or beverage. The researchdietitian reviewed all food records with each participantto clarify portion sizes and preparation method, andprobe for additional food and beverages consumed atand between each recorded eating occasion, and other-wise clarify errors, unclear descriptions, and question-able entries [13].
Study proceduresAnthropometric measurements and blood samples weretaken at each visit after an overnight fast. Blood pressurewas measured in the seated position. Body weight wasmeasured using a calibrated scale (Tanita BWB–800,Japan). Measurement of body composition was doneusing professional version of bioelectrical impedanceanalyzer (Tanita TBF–215, Japan). Visceral fat was mea-sured using a validated bioelectrical impedance device(Tanita, Viscan AB–140, Japan) and was expressed in ar-bitrary units ranging from 1 to 59. Height was measuredwithout shoes. Waist circumference was measured justabove the hip bone and hip circumference was measuredaround the maximum circumference of the buttocks.Dietary macronutrients composition was assessed byanalyzing food logs from the three study visits using theFood Processor Diet & Nutrition Analysis Software (ver-sion 10.15.41, 2015, ESHA Research, Salem, OR, USA).These analyses include total energy intake, averagemacronutrient values and percent energy intake fromcarbohydrate, total fat, saturated fat, protein and totaldietary fiber per day. Insulin sensitivity was calculatedusing the homeostatic model assessment (HOMA-IR)equation from fasting plasma glucose and serum insulinat baseline and after 16 weeks [14].
Outcome measuresThe primary outcome for this study was the effect ofNT on HbA1c after 16 weeks of intervention. Secondaryoutcomes include the change in body weight, body com-position, visceral fat, waist and hip circumference, blood
pressure, lipid profile, fasting glucose, insulin, c-peptide,insulin sensitivity (HOMA-IR), urinary microalbumin/creatinine ratio, high-sensitivity C-reactive protein (hs-CRP) and dietary macronutrients values.
Randomization and maskingRandomization was conducted using a computer gener-ated sequence with block design to ensure even distribu-tion of study participants among intervention groups.Study investigators, RDN, participants and staff conduct-ing assessments were not masked to treatment assign-ment. However, the study statistician was masked totreatment assignment to minimize bias during dataanalysis.
Statistical analysisAll statistical analyses were conducted using SAS version9.4 for Windows (SAS Institute, Cary, NC, USA 2012).Statistical significance was set a priori at p < 0.05.Primary analysis was of the as-randomized/intention-to-treat population. Demographic and baseline subjectcharacteristics were assessed by general linear model(analysis of variance (ANOVA); PROC GLM). Change inoutcomes over time was assessed by linear mixed effectsmodel (analogous to repeated-measures ANOVA; PROCMIXED) which provides a flexible, likelihood-based ap-proach to treating missing data and within-subject cor-relation in longitudinal studies.In secondary analyses, we evaluated the effects of pos-
sible covariates (e.g. BMI) on study outcomes and foundno significant effects of any candidate covariate nor anyinteraction with the main effects of interest. Addition ofcovariates to the model did not change the p-values ofthe regression coefficients for the main effect and didnot reverse their sign, so we present the results of un-adjusted analyses. The study was powered for a drop-outrate of 20%, which is common for nutrition interventionstudies.
ResultsParticipant flow and baseline characteristicsBetween May 2015 and January 2016, 167 individuals werescreened for eligibility. Of which, 108 participants wererandomized to the three study groups (Fig. 1). The studyincluded 46 males and 62 females with mean (±SD) age of60 ± 10 years. At baseline, study participants had meanHbA1c of 8.07 ± 1.05% and had mean diabetes duration of11 ± 7 years; mean initial body weight of 101.4 ± 21.1 kg,mean BMI of 35.2 ± 7.7 kg/m2, and 24 (22.2%) subjectshad a BMI of < 30 kg/m2. At baseline, there were nosignificant differences in any of these parameters amongthe three groups. Detailed baseline characters are shownin Table 1. Eighty-four participants completed the16 weeks of follow-up (22% attrition rate); however, data
Mottalib et al. Nutrition Journal (2018) 17:42 Page 3 of 10
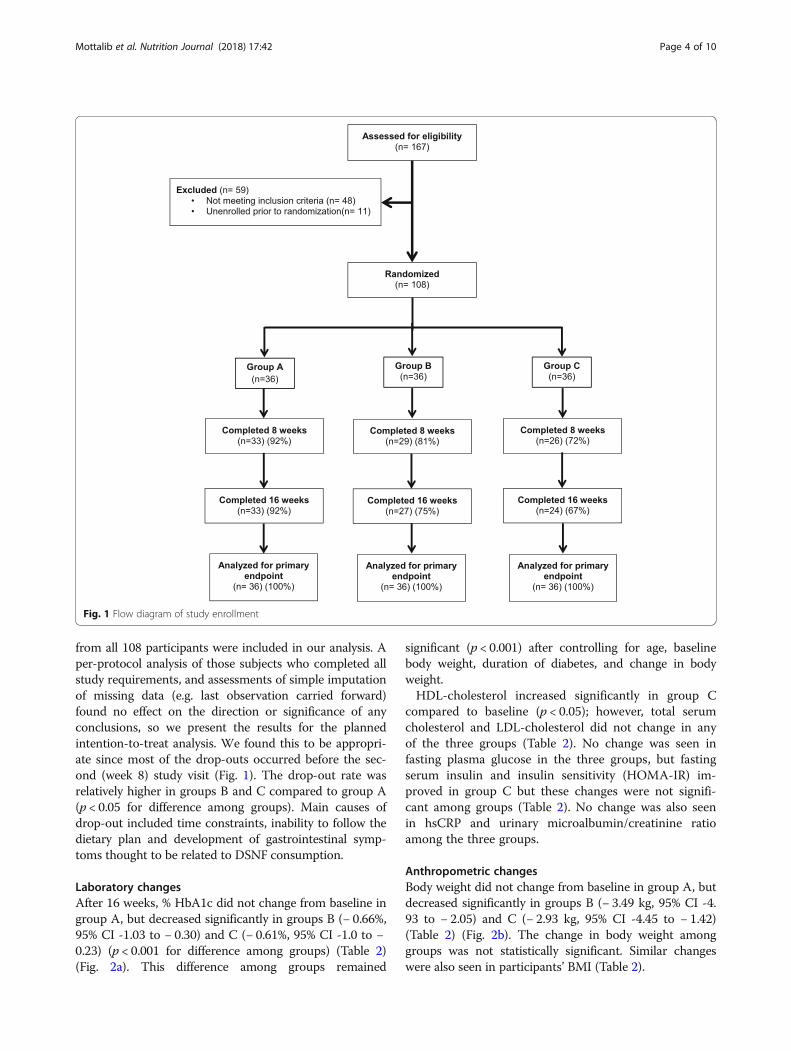
from all 108 participants were included in our analysis. Aper-protocol analysis of those subjects who completed allstudy requirements, and assessments of simple imputationof missing data (e.g. last observation carried forward)found no effect on the direction or significance of anyconclusions, so we present the results for the plannedintention-to-treat analysis. We found this to be appropri-ate since most of the drop-outs occurred before the sec-ond (week 8) study visit (Fig. 1). The drop-out rate wasrelatively higher in groups B and C compared to group A(p < 0.05 for difference among groups). Main causes ofdrop-out included time constraints, inability to follow thedietary plan and development of gastrointestinal symp-toms thought to be related to DSNF consumption.
Laboratory changesAfter 16 weeks, % HbA1c did not change from baseline ingroup A, but decreased significantly in groups B (− 0.66%,95% CI -1.03 to − 0.30) and C (− 0.61%, 95% CI -1.0 to −0.23) (p < 0.001 for difference among groups) (Table 2)(Fig. 2a). This difference among groups remained
significant (p < 0.001) after controlling for age, baselinebody weight, duration of diabetes, and change in bodyweight.HDL-cholesterol increased significantly in group C
compared to baseline (p < 0.05); however, total serumcholesterol and LDL-cholesterol did not change in anyof the three groups (Table 2). No change was seen infasting plasma glucose in the three groups, but fastingserum insulin and insulin sensitivity (HOMA-IR) im-proved in group C but these changes were not signifi-cant among groups (Table 2). No change was also seenin hsCRP and urinary microalbumin/creatinine ratioamong the three groups.
Anthropometric changesBody weight did not change from baseline in group A, butdecreased significantly in groups B (− 3.49 kg, 95% CI -4.93 to − 2.05) and C (− 2.93 kg, 95% CI -4.45 to − 1.42)(Table 2) (Fig. 2b). The change in body weight amonggroups was not statistically significant. Similar changeswere also seen in participants’ BMI (Table 2).
Fig. 1 Flow diagram of study enrollment
Mottalib et al. Nutrition Journal (2018) 17:42 Page 4 of 10

Percentage body fat did not change from baseline in groupA, but decreased significantly in groups B (− 1.6%, 95% CI-2.4 to − 0.8) and C (− 1.2%, 95% CI -2.0 to − 0.3) (p < 0.05for difference among groups). Waist circumference did notchange from baseline in group A, but decreased significantlyin groups B (− 5.0 cm, 95% CI -7.0 to − 2.9) and C (− 2.9 cm,95% CI -5.0 to − 0.8.) Change in waist circumference amonggroups was significant (p < 0.01). Hip circumference
decreased significantly in the three groups; however, changeamong groups was not significant (Table 2). Visceral fatlevels decreased significantly in group B only (p < 0.05); how-ever change among groups was not significant (Table 2).There was a small, yet significant, increase in systolic
blood pressure in group B but it did not change ingroups A and C (Table 2). Diastolic pressure did notchange in any of the three groups.
Table 1 Demographics and baseline characteristics of the study participants
Group A (n = 36) Group B (n = 36) Group C (n = 36) P value
Age (years) 57 (10) 61 (10) 61 (9) 0.14
Sex (male) 36% 44% 47% 0.62
Diabetes duration (years) 11 (10) 11 (6) 11 (6) 0.98
Number of diabetes medications 1.6 (0.8) 1.9 (0.9) 2.0 (1.1) 0.16
Race
Asian 0% 3% 6% 0.77
Black 47% 19% 19% < 0.05
Hispanic 6% 3% 8% 0.87
Non-Hispanic white 47% 69% 58% 0.18
Other/Unreported 0% 6% 8% 0.37
HbA1c (%) 8.15 (1.02) 8.17 (1.21) 7.99 (0.91) 0.44
Fasting plasma glucose (mmol/L) 10.1 (3.9) 9.8 (3.2) 8.7 (1.9) 0.14
Fasting insulin (pmol/L) 133 (88) 151 (108) 150 (110) 0.69
HOMA-IR 9.5 (10.1) 9.4 (7.2) 8.9 (8.6) 0.95
Total cholesterol (mmol/L) 5.09 (1.10) 4.45 (1.27) 4.08 (1.21) 0.38
LDL cholesterol (mmol/L) 2.43 (0.95) 2.47 (1.06) 1.95 (0.67) < 0.05
HDL cholesterol (mmol/L) 1.18 (0.28) 1.13 (0.23) 1.20 (0.33) 0.51
Triglycerides (mmol/L) 1.72 (0.76) 1.89 (1.10) 1.79 (1.00) 0.77
Albumin/creatinine ratio (mg/mmol) 2.89 (3.54) 2.66 (3.87) 3.97 (10.58) 0.69
hsCRP (nmol/L) 53.8 (91.9) 41.0 (63.3) 37.2 (34.7) 0.55
Body weight (kg) 101.2 (20.7) 105.4 (25.3) 97.5 (16.3) 0.29
BMI (kg/m2) 35.4 (7.1) 36.4 (9.4) 33.9 (6.1) 0.36
Body fat (%) 41.2 (10.0) 42.5 (8.5) 39.9 (9.3) 0.52
Visceral fat (arbitrary units) 16.2 (5.8) 18.2 (7.1) 16.9 (5.0) 0.44
Waist circumference (cm) 117.1 (13.2) 121.9 (17.3) 117.1 (12.3) 0.11
Hip circumference (cm) 120.7 (15.9) 124.8 (20.3) 118.2 (11.2) 0.18
Wait/hip ratio 0.97 (0.07) 0.98 (0.07) 0.99 (0.08) 0.82
Systolic blood pressure (mmHg) 134 (15) 131 (18) 132 (14) 0.65
Diastolic blood pressure (mmHg) 72 (10) 72 (8) 71 (9) 0.8
Daily caloric intake (kcal) 1944 (699) 1943 (623) 1993 (813) 0.95
Carbohydrate intake (g) 216.9 (94.7) 206.6 (81.7) 223.3 (89.0) 0.73
Total fat intake (g) 85.1 (37.8) 88.2 (32.9) 82.8 (39.8) 0.83
Saturated fat intake (g) 27.7 (12.3) 28.0 (14.6) 27.4 (16.0) 0.98
Protein intake (g) 82.6 (22.4) 84.3 (24.9) 90.9 (32.5) 0.4
Fiber intake (g) 16.4 (5.4) 19.6 (6.0) 19.0 (6.6) 0.07
Data are mean (SD) or percentage. p values from Fisher’s Exact Test among groups at baseline. Group A: individualized nutrition therapy, Group B: Structurednutrition therapy, Group C: Structured nutrition therapy + weekly phone support
Mottalib et al. Nutrition Journal (2018) 17:42 Page 5 of 10
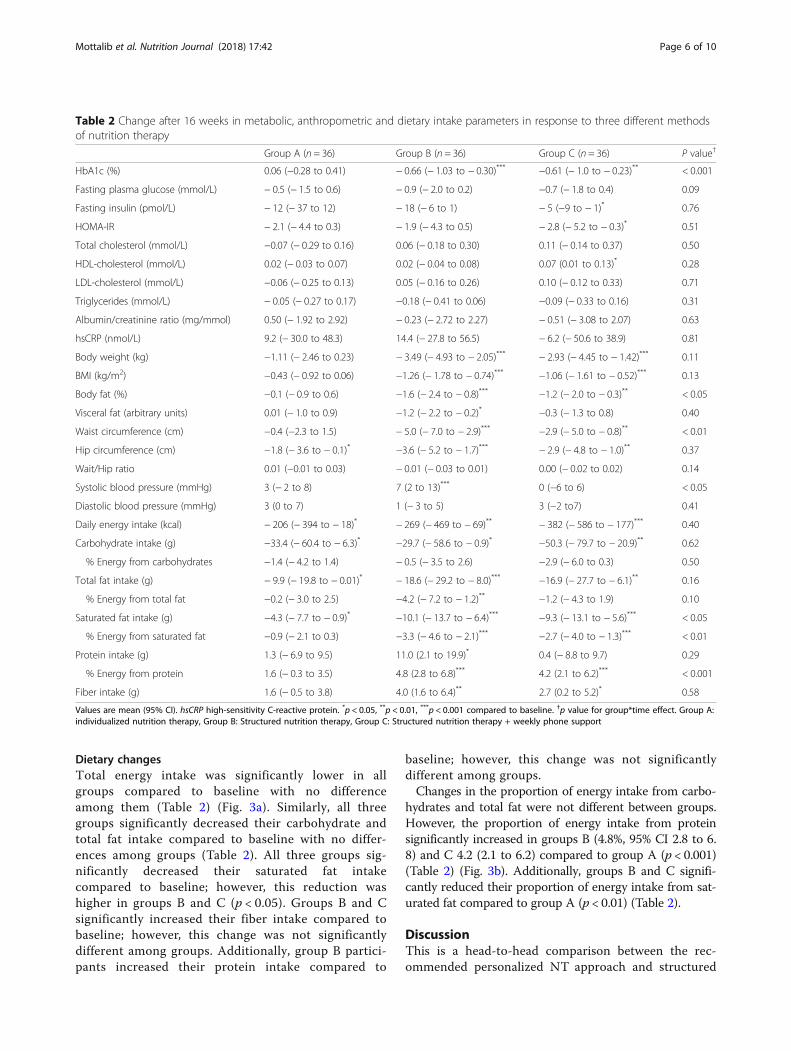
Dietary changesTotal energy intake was significantly lower in allgroups compared to baseline with no differenceamong them (Table 2) (Fig. 3a). Similarly, all threegroups significantly decreased their carbohydrate andtotal fat intake compared to baseline with no differ-ences among groups (Table 2). All three groups sig-nificantly decreased their saturated fat intakecompared to baseline; however, this reduction washigher in groups B and C (p < 0.05). Groups B and Csignificantly increased their fiber intake compared tobaseline; however, this change was not significantlydifferent among groups. Additionally, group B partici-pants increased their protein intake compared to
baseline; however, this change was not significantlydifferent among groups.Changes in the proportion of energy intake from carbo-
hydrates and total fat were not different between groups.However, the proportion of energy intake from proteinsignificantly increased in groups B (4.8%, 95% CI 2.8 to 6.8) and C 4.2 (2.1 to 6.2) compared to group A (p < 0.001)(Table 2) (Fig. 3b). Additionally, groups B and C signifi-cantly reduced their proportion of energy intake from sat-urated fat compared to group A (p < 0.01) (Table 2).
DiscussionThis is a head-to-head comparison between the rec-ommended personalized NT approach and structured
Table 2 Change after 16 weeks in metabolic, anthropometric and dietary intake parameters in response to three different methodsof nutrition therapy
Group A (n = 36) Group B (n = 36) Group C (n = 36) P value†
HbA1c (%) 0.06 (−0.28 to 0.41) − 0.66 (− 1.03 to − 0.30)*** −0.61 (− 1.0 to − 0.23)** < 0.001
Fasting plasma glucose (mmol/L) − 0.5 (− 1.5 to 0.6) − 0.9 (− 2.0 to 0.2) −0.7 (− 1.8 to 0.4) 0.09
Fasting insulin (pmol/L) − 12 (− 37 to 12) − 18 (− 6 to 1) − 5 (−9 to − 1)* 0.76
HOMA-IR − 2.1 (− 4.4 to 0.3) − 1.9 (− 4.3 to 0.5) − 2.8 (− 5.2 to − 0.3)* 0.51
Total cholesterol (mmol/L) −0.07 (− 0.29 to 0.16) 0.06 (− 0.18 to 0.30) 0.11 (− 0.14 to 0.37) 0.50
HDL-cholesterol (mmol/L) 0.02 (− 0.03 to 0.07) 0.02 (− 0.04 to 0.08) 0.07 (0.01 to 0.13)* 0.28
LDL-cholesterol (mmol/L) −0.06 (− 0.25 to 0.13) 0.05 (− 0.16 to 0.26) 0.10 (− 0.12 to 0.33) 0.71
Triglycerides (mmol/L) − 0.05 (− 0.27 to 0.17) −0.18 (− 0.41 to 0.06) −0.09 (− 0.33 to 0.16) 0.31
Albumin/creatinine ratio (mg/mmol) 0.50 (− 1.92 to 2.92) − 0.23 (− 2.72 to 2.27) − 0.51 (− 3.08 to 2.07) 0.63
hsCRP (nmol/L) 9.2 (− 30.0 to 48.3) 14.4 (− 27.8 to 56.5) − 6.2 (− 50.6 to 38.9) 0.81
Body weight (kg) −1.11 (− 2.46 to 0.23) − 3.49 (− 4.93 to − 2.05)*** − 2.93 (− 4.45 to − 1.42)*** 0.11
BMI (kg/m2) −0.43 (− 0.92 to 0.06) −1.26 (− 1.78 to − 0.74)*** −1.06 (− 1.61 to − 0.52)*** 0.13
Body fat (%) −0.1 (− 0.9 to 0.6) −1.6 (− 2.4 to − 0.8)*** −1.2 (− 2.0 to − 0.3)** < 0.05
Visceral fat (arbitrary units) 0.01 (− 1.0 to 0.9) −1.2 (− 2.2 to − 0.2)* −0.3 (− 1.3 to 0.8) 0.40
Waist circumference (cm) −0.4 (−2.3 to 1.5) − 5.0 (− 7.0 to − 2.9)*** −2.9 (− 5.0 to − 0.8)** < 0.01
Hip circumference (cm) −1.8 (− 3.6 to − 0.1)* −3.6 (− 5.2 to − 1.7)*** − 2.9 (− 4.8 to − 1.0)** 0.37
Wait/Hip ratio 0.01 (−0.01 to 0.03) − 0.01 (− 0.03 to 0.01) 0.00 (− 0.02 to 0.02) 0.14
Systolic blood pressure (mmHg) 3 (− 2 to 8) 7 (2 to 13)*** 0 (−6 to 6) < 0.05
Diastolic blood pressure (mmHg) 3 (0 to 7) 1 (− 3 to 5) 3 (−2 to7) 0.41
Daily energy intake (kcal) − 206 (− 394 to − 18)* − 269 (− 469 to − 69)** − 382 (− 586 to − 177)*** 0.40
Carbohydrate intake (g) −33.4 (− 60.4 to − 6.3)* −29.7 (− 58.6 to − 0.9)* −50.3 (− 79.7 to − 20.9)** 0.62
% Energy from carbohydrates −1.4 (− 4.2 to 1.4) − 0.5 (− 3.5 to 2.6) −2.9 (− 6.0 to 0.3) 0.50
Total fat intake (g) − 9.9 (− 19.8 to − 0.01)* − 18.6 (− 29.2 to − 8.0)*** −16.9 (− 27.7 to − 6.1)** 0.16
% Energy from total fat −0.2 (− 3.0 to 2.5) −4.2 (− 7.2 to − 1.2)** −1.2 (− 4.3 to 1.9) 0.10
Saturated fat intake (g) −4.3 (− 7.7 to − 0.9)* −10.1 (− 13.7 to − 6.4)*** −9.3 (− 13.1 to − 5.6)*** < 0.05
% Energy from saturated fat −0.9 (− 2.1 to 0.3) −3.3 (− 4.6 to − 2.1)*** −2.7 (− 4.0 to − 1.3)*** < 0.01
Protein intake (g) 1.3 (− 6.9 to 9.5) 11.0 (2.1 to 19.9)* 0.4 (− 8.8 to 9.7) 0.29
% Energy from protein 1.6 (− 0.3 to 3.5) 4.8 (2.8 to 6.8)*** 4.2 (2.1 to 6.2)*** < 0.001
Fiber intake (g) 1.6 (− 0.5 to 3.8) 4.0 (1.6 to 6.4)** 2.7 (0.2 to 5.2)* 0.58
Values are mean (95% CI). hsCRP high-sensitivity C-reactive protein. *p < 0.05, **p < 0.01, ***p < 0.001 compared to baseline. †p value for group*time effect. Group A:individualized nutrition therapy, Group B: Structured nutrition therapy, Group C: Structured nutrition therapy + weekly phone support
Mottalib et al. Nutrition Journal (2018) 17:42 Page 6 of 10

NT in patients with T2D. This study demonstratedthat all three methods of NT effectively improved dietquality in overweight and obese patients with dia-betes. All three interventions reduced daily energy in-take, total fat, saturated fat and total carbohydratescompared to baseline. However, the structured dietaryintervention was superior in helping participants sig-nificantly improve their glycemic control. An HbA1creduction of 0.61–0.66%, as seen in the structuredNT groups of this study, is similar to what wasobserved after few of the commonly used diabetesmedications [15]. This reflects the prominent value ofthis NT method in managing T2D among this popu-lation. It is impressive to see these results in patientswho had T2D for a long duration of an average(±SD) 11 ± 7 years and with baseline HbA1c of anaverage (±SD) 8.07 ± 1.05%. Moreover, structured NTsignificantly reduced body weight by 2.9–3.5 kg. It
also reduced waist circumference and percentage body fateven at a similar daily energy intake level of individualizedNT; without any modification in physical activity ormedication change. It has been long perceived that life-style improves glycemic control and body weight [16, 17].However, this notion was challenged by a recentmeta-analysis of lifestyle intervention studies that showedcollectively an average weight reduction of < 5%, whichthe authors considered a small magnitude that is notenough to improve metabolic parameters [18]. In contrast,this study demonstrates that it may be possible to signifi-cantly lower HbA1c and achieve modest weight reductionof around 3% through structured NT alone. Consideringthat diabetes medications were stable during the entirestudy and that participants were advised not to changetheir routine physical activity, it is more likely thatobserved metabolic improvements were attributed tostructured NT.
a
b
Fig. 2 Change in HbA1c (a) and body weight (b) from baseline in response to different methods of nutrition therapy. Values are mean ± SEM.Group A: individualized nutrition therapy, Group B: Structured nutrition therapy, Group C: Structured nutrition therapy + weekly phone support.n = 36 in each group. * p < 0.01 and ** p < 0.001 compared to baseline
Mottalib et al. Nutrition Journal (2018) 17:42 Page 7 of 10
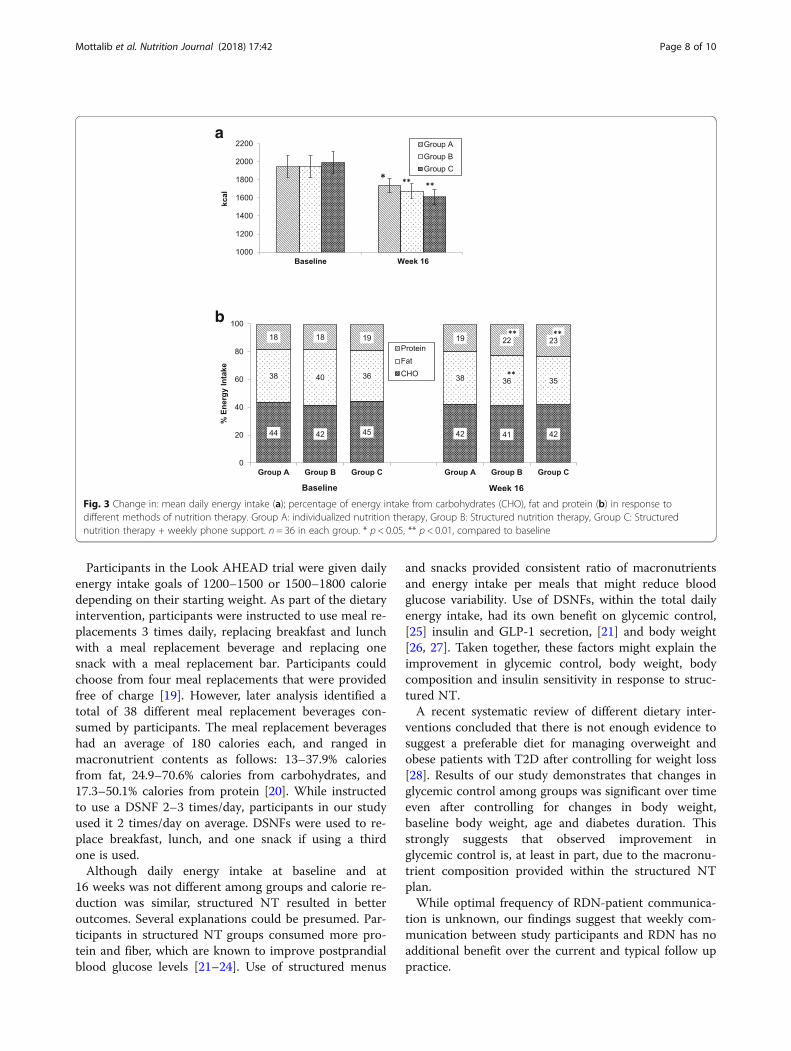
Participants in the Look AHEAD trial were given dailyenergy intake goals of 1200–1500 or 1500–1800 caloriedepending on their starting weight. As part of the dietaryintervention, participants were instructed to use meal re-placements 3 times daily, replacing breakfast and lunchwith a meal replacement beverage and replacing onesnack with a meal replacement bar. Participants couldchoose from four meal replacements that were providedfree of charge [19]. However, later analysis identified atotal of 38 different meal replacement beverages con-sumed by participants. The meal replacement beverageshad an average of 180 calories each, and ranged inmacronutrient contents as follows: 13–37.9% caloriesfrom fat, 24.9–70.6% calories from carbohydrates, and17.3–50.1% calories from protein [20]. While instructedto use a DSNF 2–3 times/day, participants in our studyused it 2 times/day on average. DSNFs were used to re-place breakfast, lunch, and one snack if using a thirdone is used.Although daily energy intake at baseline and at
16 weeks was not different among groups and calorie re-duction was similar, structured NT resulted in betteroutcomes. Several explanations could be presumed. Par-ticipants in structured NT groups consumed more pro-tein and fiber, which are known to improve postprandialblood glucose levels [21–24]. Use of structured menus
and snacks provided consistent ratio of macronutrientsand energy intake per meals that might reduce bloodglucose variability. Use of DSNFs, within the total dailyenergy intake, had its own benefit on glycemic control,[25] insulin and GLP-1 secretion, [21] and body weight[26, 27]. Taken together, these factors might explain theimprovement in glycemic control, body weight, bodycomposition and insulin sensitivity in response to struc-tured NT.A recent systematic review of different dietary inter-
ventions concluded that there is not enough evidence tosuggest a preferable diet for managing overweight andobese patients with T2D after controlling for weight loss[28]. Results of our study demonstrates that changes inglycemic control among groups was significant over timeeven after controlling for changes in body weight,baseline body weight, age and diabetes duration. Thisstrongly suggests that observed improvement inglycemic control is, at least in part, due to the macronu-trient composition provided within the structured NTplan.While optimal frequency of RDN-patient communica-
tion is unknown, our findings suggest that weekly com-munication between study participants and RDN has noadditional benefit over the current and typical follow uppractice.
a
b
Fig. 3 Change in: mean daily energy intake (a); percentage of energy intake from carbohydrates (CHO), fat and protein (b) in response todifferent methods of nutrition therapy. Group A: individualized nutrition therapy, Group B: Structured nutrition therapy, Group C: Structurednutrition therapy + weekly phone support. n = 36 in each group. * p < 0.05, ** p < 0.01, compared to baseline
Mottalib et al. Nutrition Journal (2018) 17:42 Page 8 of 10

This study had some limitations. It was limited tooverweight and obese patients, so it is unknown if simi-lar results can be reproduced in lean patients with type2 diabetes. It also did not include patients treated withinsulin. However, frequent titration of insulin in any nu-trition study may impact glycemic outcomes and adds astrong variable that may affect study results. Group Ahad 92% of its participants complete all 16 weeks offollow up, while groups B and C had a significantlylower completion rate. The higher attrition rate ob-served in groups B and C may be attributed to the highlystructured nature of the intervention, including the useof DSNFs, which was not sustainable for some partici-pants. Although utilization of 3-day food records wasvalidated in multiple studies, this method has its limita-tions with regards to characterizing subjects’ usual dietdue to within-person variations of day-to-day foodintake. Based on this we suggest that patients first startwith a structured NT plan when initiating NT. However,a more personalized eating plan might be more suitablefor those who are not able to adhere to structured NT.The study was conducted at single diabetes center in anurban location, so it is unknown if different populationor other location may have an impact on the studyresults. The follow up period was limited to 16 weeks, soit is unknown if these improvements will persist forlonger duration which warrants a study with long-termfollow up.
ConclusionIn conclusion, an RDN-provided structured nutritiontherapy which includes a macronutrient compositionthat is higher in protein and lower in saturated fat withina pre-specified level of energy intake, in addition to theuse of menus, snacks lists, a diabetes-specific nutritionalformula and keeping a daily food record results in thelowering of important cardiovascular disease risk factors,namely HbA1c, body fat percentage and waist circumfer-ence, compared to individualized meal plans offered tooverweight and obese patients with type 2 diabetes. Thisstudy adds additional evidence to support the importantrole of RDNs in conducting NT using a structured plan.Additionally, weekly RDN phone support does not haveadditional benefit in patients following structured NT.Further studies are warranted to investigate the long-term effects of structured nutrition therapy in patientswith type 2 diabetes.
AcknowledgmentsThe authors would like to thank the education department at Joslin DiabetesCenter and the staff of the Joslin Clinical Research Center.
FundingThis is an investigator initiated study funded by a research grant fromMetagenics Inc. The funding source had no role in the study design,conduct, analysis or presentation of the study results.
Availability of data and materialsThe datasets used and/or analyzed during the current study available fromthe corresponding author on reasonable request.
Prior presentationData from this study were presented at the 76th Scientific Sessions of theAmerican Diabetes Association, New Orleans, LA, 10–14 June 2016.
Authors’ contributionsAM and OH designed the study, contributed to data analysis and wrote themanuscript. VS was the study nutritionist and contributed to drafting themethods section. B-NM-Y collected clinical data, reviewed and edited themanuscript. WM collected and entered clinical data in addition to reviewingand editing the manuscript. PC coordinated this trial in addition to reviewingand editing the manuscript. DP analyzed data and wrote the statistical analysissection. JM reviewed and edited the manuscript. OH designed the study,supervised this work, edited and reviewed the manuscript. AM and OH werethe guarantors of this work and, as such, had full access to all of the data in thestudy and took responsibility for the integrity of the data and the accuracy ofthe data analysis. All authors read and approved the final manuscript.
Ethics approval and consent to participateThe Committee on Human Subjects at Joslin Diabetes Center approved thestudy design (Protocol CHS# 2014–40). The trail was registered atclinicaltrials.gov (NCT02520050). All subjects have signed a consent form toparticipate of the study.
Competing interestsOH is on advisory board of Astra Zeneca, Inc. and is consultant to Merck Inc.He is shareholder of Healthimation, LLC. He receives research grants fromNovo-Nordisk, Inc., Intracia, Inc., Abbott, Inc. and the National Dairy Council.JM receives research grants the National Dairy Council. AM, VS, B-NM-Y, WM,PC and DP report no conflicts of interest related to this work.
Publisher’s NoteSpringer Nature remains neutral with regard to jurisdictional claims inpublished maps and institutional affiliations.
Author details1Joslin Diabetes Center, Harvard Medical School, One Joslin Place, Boston,MA 02215, USA. 2Department of Nutrition and Dietetics, Faculty of Medicineand Health Sciences, Universiti Putra Malaysia, Selangor, Malaysia.
Received: 5 February 2018 Accepted: 3 April 2018
References1. Herman WH, Zimmet P. Type 2 diabetes: an epidemic requiring global
attention and urgent action. Diabetes Care. 2012;35:943–4.2. Caballero B. The global epidemic of obesity: an overview. Epidemiol Rev.
2007;29:1–5.3. Eckel RH, Kahn SE, Ferrannini E, Goldfine AB, Nathan DM, Schwartz MW,
Smith RJ, Smith SR. Obesity and type 2 diabetes: what can be unified andwhat needs to be individualized? J Clin Endocrinol Metab. 2011;96:1654–63.
4. Bhupathiraju SN, Hu FB. Epidemiology of obesity and diabetes and theircardiovascular complications. Circ Res. 2016;118:1723–35.
5. Evert AB, Boucher JL, Cypress M, Dunbar SA, Franz MJ, Mayer-Davis EJ,Neumiller JJ, Nwankwo R, Verdi CL, Urbanski P, Yancy WS Jr. Nutritiontherapy recommendations for the management of adults with diabetes.Diabetes Care. 2014;37(Suppl 1):S120–43.
6. ADA. Lifestyle Management. Sec. 4. In: Standards of medical Care inDiabetes—2017. Diabetes care, vol. 40; 2017. p. S33–43.
7. Garber AJ, Abrahamson MJ, Barzilay JI, Blonde L, Bloomgarden ZT,Bush MA, Dagogo-Jack S, DeFronzo RA, Einhorn D, Fonseca VA.Consensus statement by the American Association of ClinicalEndocrinologists and American College of endocrinology on thecomprehensive type 2 diabetes management algorithm–2016executive summary. Endocr Pract. 2016;22:84–113.
8. Pastors JG, Warshaw H, Daly A, Franz M, Kulkarni K. The evidence for theeffectiveness of medical nutrition therapy in diabetes management.Diabetes Care. 2002;25:608–13.
Mottalib et al. Nutrition Journal (2018) 17:42 Page 9 of 10

9. Inzucchi SE, Bergenstal RM, Buse JB, Diamant M, Ferrannini E, Nauck M, Peters AL,Tsapas A, Wender R, Matthews DR. Management of hyperglycemia in type 2diabetes, 2015: a patient-centered approach: update to a position statement ofthe American Diabetes Association and the European Association for the Studyof diabetes. Diabetes Care. 2015;38:140–9.
10. ADA. Foundations of care and comprehensive medical evaluation. Sec.3. In: Standards of medical Care in Diabetes—2016. Diabetes care, vol.39; 2016. p. S23–35.
11. Camelon KM, Hadell K, Jamsen PT, Ketonen KJ, Kohtamaki HM, Makimatilla S,Tormala ML, Valve RH. The plate model: a visual method of teaching mealplanning. DAIS project group. Diabetes atherosclerosis intervention study. JAm Diet Assoc. 1998;98:1155–8.
12. Giusti J, Rizzotto JA. Interpreting the Joslin Diabetes Center and Joslin clinicclinical nutrition guideline for overweight and obese adults with type 2diabetes. Curr Diab Rep. 2006;6:405–8.
13. Yang YJ, Kim MK, Hwang SH, Ahn Y, Shim JE, Kim DH. Relative validities of3-day food records and the food frequency questionnaire. Nutr Res Pract.2010;4:142–8.
14. Monzillo LU, Hamdy O. Evaluation of insulin sensitivity in clinical practiceand in research settings. Nutr Rev. 2003;61:397–412.
15. Karagiannis T, Paschos P, Paletas K, Matthews DR, Tsapas A. Dipeptidylpeptidase-4 inhibitors for treatment of type 2 diabetes mellitus in theclinical setting: systematic review and meta-analysis. BMJ. 2012;344:e1369.
16. Group LAR. Cardiovascular effects of intensive lifestyle intervention in type 2diabetes. N Engl J Med. 2013;2013:145–54.
17. Pronk NP, Remington PL, on behalf of the Community Preventive ServicesTask F. Combined diet and physical activity promotion programs forprevention of diabetes: community preventive services task forcerecommendation statement. Ann Intern Med. 2015;163:465–8.
18. Franz MJ, Boucher JL, Rutten-Ramos S, VanWormer JJ. Lifestyle weight-lossintervention outcomes in overweight and obese adults with type 2diabetes: a systematic review and meta-analysis of randomized clinical trials.J Acad Nutr Diet. 2015;115:1447–63.
19. Wadden TA, West DS, Delahanty L, Jakicic J, Rejeski J, Williamson D,Berkowitz RI, Kelley DE, Tomchee C, Hill JO, Kumanyika S. The look AHEADstudy: a description of the lifestyle intervention and the evidencesupporting it. Obesity (Silver Spring). 2006;14:737–52.
20. Raynor HA, Anderson AM, Miller GD, Reeves R, Delahanty LM, Vitolins MZ,Harper P, Mobley C, Konersman K, Mayer-Davis E. Partial meal replacementplan and quality of the diet at 1 year: action for health in diabetes (lookAHEAD) trial. J Acad Nutr Diet. 2015;115:731–42.
21. Mottalib A, Mohd-Yusof B-N, Shehabeldin M, Pober D, Mitri J, Hamdy O.Impact of diabetes-specific nutritional formulas versus oatmeal on postprandialglucose, insulin, GLP-1 and postprandial Lipidemia. Nutrients. 2016;8:443.
22. Van Loon LJ, Kruijshoop M, Menheere PP, Wagenmakers AJ, Saris WH, KeizerHA. Amino acid ingestion strongly enhances insulin secretion in patientswith long-term type 2 diabetes. Diabetes Care. 2003;26:625–30.
23. Nuttall FQ, Mooradian AD, Gannon MC, Billington C, Krezowski P. Effect ofprotein ingestion on the glucose and insulin response to a standardizedoral glucose load. Diabetes Care. 1984;7:465–70.
24. Chandalia M, Garg A, Lutjohann D, von Bergmann K, Grundy SM, Brinkley LJ.Beneficial effects of high dietary fiber intake in patients with type 2 diabetesmellitus. N Engl J Med. 2000;342:1392–8.
25. Hamdy O, Zwiefelhofer D. Weight management using a meal replacementstrategy in type 2 diabetes. Curr Diab Rep. 2010;10:159–64.
26. Wadden TA, West DS, Neiberg RH, Wing RR, Ryan DH, Johnson KC, ForeytJP, Hill JO, Trence DL, Vitolins MZ, Look ARG. One-year weight losses in thelook AHEAD study: factors associated with success. Obesity (Silver Spring).2009;17:713–22.
27. Wadden TA, Neiberg RH, Wing RR, Clark JM, Delahanty LM, Hill JO, Krakoff J,Otto A, Ryan DH, Vitolins MZ, Look ARG. Four-year weight losses in the lookAHEAD study: factors associated with long-term success. Obesity (SilverSpring). 2011;19:1987–98.
28. Emadian A, Andrews RC, England CY, Wallace V, Thompson JL. The effect ofmacronutrients on glycaemic control: a systematic review of dietaryrandomised controlled trials in overweight and obese adults with type 2diabetes in which there was no difference in weight loss betweentreatment groups. Br J Nutr. 2015;114:1656–66.
Mottalib et al. Nutrition Journal (2018) 17:42 Page 10 of 10