effects of olive mill wastewater on soil properties and ... · pdf filevegetation waters are...
TRANSCRIPT
425
Middle East Journal of Agriculture Research, 3(3): 425-447, 2014
ISSN 2077-4605
Corresponding Author: George Haddad, Lebanese Agricultural Research Institute (LARI) - Station El Fanar- Jdeidet El
Metn -BP90-1965-Lebanon.
E-mail: [email protected]
Effects of Olive Mill Wastewater on Soil Properties and Seed Germination 1George Haddad,
1Layal Karam,
2Ola El Korhani,
3Randa Chehab- Khoury,
1Fatima El-Ali and
3Abdul Halim Mouneimne
1Lebanese Agricultural Research Institute (LARI) - Station El Fanar- Jdeidet El Metn -BP90-1965-Lebanon
2Lebanese University- Doctoral School of Technology and Sciences- Fanar- BP90-239- Lebanon
3Lebanese University-Faculty of Agriculture- El Dekwaneh- El Metn-Lebanon
ABSTRACT
This study attempts to address the environmental problems posed by olive mill wastewater (OMW).
However, the spreading of OMW seems to be an efficient and economical technique to enhance bio-agro-
industrial wastes. This work aims to evaluate the effects of the spreading of OMW on some physico-chemical
properties of soil and the development of two cultures that are considered as susceptible as barley (Hordeum
vulgare) and tomato (Lycopersicum esculentum). The experimentation was conducted in a greenhouse under
controlled conditions on a sandy loam soil. The doses used of OMW are respectively 0 (as control), 1, 5, 10 and
15 L.m-2
. The evolution of physicochemical parameters of the soil was monitored after 1, 15, 30, 50 and 90 days
of application. Plantings are made after 1, 15, 50, and 90 days of the application of OMW. The effects of olive
mill wastewater on the development of the plants were determined. Phytotoxicity of OMW was determined by
the germination test. The results of experimental tests have found no negative indications in terms of
application. They found enrichment in potassium, phosphorus and organic matter on soil treated with high doses
of OMW. The nitrogen content of soil generally does not change. Slight changes in salinity and acidity are
observed, but not proved harmful to crops. For the plants, barley presented a higher sensitivity than the tomato.
The inhibitory effects on survival, on height growth, and on dry matter disappeared after 50 and 90 days of
application. The germination index is nil for barley. For tomato, this index is above 50% after 9 days.
Key words: Environmental problems, olive mill wastewater (OMW), Seed Germination.
Introduction
In Lebanon, a total of 492 olive mills have been identified including about 87 % use the traditional oil
extraction method, while 10 % use three-phase decanters and 3 % use two-phase decanters. The majority of the
olive mills (45.73 %) are located in North Lebanon, followed by Mount Lebanon (17.48 %), South Lebanon
(16.67 %), Nabatieh (15.45 %) and the Bekaa Valley (4.67 %) (MOE, 2007).This high number of mills is due,
perhaps, to increased olive grove surface and consequently the production of olives.
The manufacturing process of olive oil yields three phases; an oily phase, and two by-products a solid
residue (olive pomace) and an aqueous phase. The latter, when combined with the washing water process forms
an olive mill wastewater (OMW). The amount of this waste depends on the process used for oil extraction.
Vegetation waters are the brown watery liquid residue which has been separated from the oil by centrifugation
or sedimentation after pressing (Fedeli and Camurati, 1981). The pomace contains the skins, pulp and pit
fragments. This separation is most commonly achieved via a horizontal decanter centrifuge or an olive oil press.
It is necessary to differentiate the OMW resulted from traditional system and continuous systems. The
traditional system is a discontinuous system consisting of pressing the paste by means of hydraulic presses. The
continuous three-phase system uses horizontal centrifugation (decanter) to separate the oil from the mass. The
three-phase centrifugation system produces the three components; oil, vegetable water, and olive pomace. The
discontinuous traditional system uses a decanter that separates the oil and mixes the olive pomace with the olive
mill wastewater in one phase called humid olive kernel or watery pomace. The improper disposal of these
wastes causes serious environmental impacts to soil, water and air and related to its high organic content made
up largely of simple phenolic compounds (Zenjari et al., 1999). However, the random and uncontrolled disposal
of OMW poses an environmental problem especially in the case of the continuous three- phase system (Le
Verge, 2004).
Many researchers have applied OMW directly on soil and have tested its effect as an organic fertilizer thus
revealing positive and negative effects. Beneficial effects are related to its high nutrients concentration,
especially K, and its potential for mobilizing soil ions, whereas, negative effects are associated with its high
mineral salt content, low pH and the presence of phytotoxic compounds, especially of polyphenols (Paredes et
al., 1999) which are also known to possess antibacterial properties (Pérez et al., 1992). Some researchers have
426 Middle East J. Agric. Res., 3(3): 425-447, 2014
founded the rapid decomposition of phenolic compounds in the soil, and no accumulation trend was observed
after subsequent applications (Chartzoulakis et al., 2010).
Furthermore, OMW can substitute in part for a conventional fertilizer and used as organic fertilizer (Fiestas
Ros de Ursinos 1981a; Morisot and Tournier, 1986; Bricolli-Bati and Lombardo, 1990; Fiestas Ros de Ursinos
and Borja Padilla, 1992; Levi Menzi et al., 1992; Garcia-Ortiz et al., 1999), due to their high concentration of
potassium and to a lesser extent of nitrogen (Albi Romero and Fiestas Ros de Ursinos, 1960 ; Catalano et al.,
1985; Catalano et al., 1986 ; Cegarra et al., 1996; Ammar and Ben Rouina, 1999) and of organic matter
(Catalano et al., 1985). But, other authors have reported the richness of this effluent in organic matter hardly
biodegradable (Catalano et al., 1986), and its inhibitory effect on plant growth due to the presence of phenolic
compounds (Pérez et al. 1986; Pérez et al., 1992; Rozzi and Malpei, 1996; Cabrera et al., 1997; Zenjari et al.,
1999).
In order to reduce the effect of pollution of OMW and solve the environmental problem of runoff, several
processes techniques have been proposed, among other things, the purification of OMW in wastewater treatment
plants (Tomati et al., 1987), their use for the production of animal feed (Nefzaoui, 1999) ; as substrates for
microorganisms and for the production of yeast (Fiestas Ros de Ursinos, 1966; Galli et al., 1988); their use in
irrigation of soil after dilution (Fiestas Ros de Ursinos, 1981b), the production of biogas and products of special
interest generated by the extraction of antioxidants, pectinolytic enzymes and proteins (Hamdi, 1991 ; Hamdi et
al., 1991; Sayadi et Ellouz, 1993 - 1995); or as physico-chemical and biological treatments (Ranalli, 1991,
Paredes et al., 1999). But these solutions are expensive, technically and economically, for small and medium-
sized mills. Although OMW can be a significant source of pollution if dispose of in streams and lakes. Their
controlled direct application to agricultural soils has been proposed as a rational, economical and inexpensive
alternative method of disposal and recovery of their mineral and organic components and at the same time to
enrich poor soils in organic matter (Ranalli, 1991; Cegarra et al., 1996; Paredes et al., 1999; Tamburino et al.,
1999; Zenjari and Nejmeddine, 2001; Di Giovacchino et al., 2002; Ben Rouina et al., 2006b). This spreading
allows nutrients, required for the microflora of soils and plants, to return into the soil. Some studies have
showed that the spreading of OMW on the cultivated soil did not induce phytotoxic effects on the cultivations
(Marsilio et al., 1990; Levi-Minzi et al., 1992; Bonari et al., 1993; Di Giovacchino et al., 2001). This solution is
considered the best option for the oil mills located in rural areas. We note that in Lebanon, the mills are mostly
distributed in rural areas near the land where olive trees are cultivated.
This research aims to evaluate, under greenhouse, at intervals of time of application and at different doses,
the effects of the produced olive mill wastewater, by two different extraction systems: discontinuous traditional
press system and continuous three-phase system, on the physical and chemical properties of soil, on the
germination and growth of two plants, that are barley "Hordeum vulgare" (monocotyledon) and tomato
"Lycopersicum esculentum" (dicotyledon).This was performed with an adequate time between OMW
application and planting.
Materials and Methods
Physico-chemical analysis of olive mill wastewater (OMW):
Both types of OMW derived from two olive oil mills located in the region of Zghorta El-Zawiyeh in North
Lebanon. The first type is that of a discontinuous traditional press system (DTP) and the second is that of a
continuous 3-phase system (C3Ph). These OMW have been with no previous treatment and were stored at 4°C
to determine some physicochemical characteristics. Analyses were made with respect to the fresh matter. The
following parameters were determined: pH, electrical conductivity (EC), density (simple weighing of a certain
volume of the crude solution), dissolved total matter, mineral and organic fractions, total nitrogen (Kjeldahl
method) (Rodier, 1996), organic matter (calcination at 500°C for 24 hours) (Pauwels et al., 1992; Navarro et al,
1993), total phosphorus and total potassium (sulfo-nitro-perchloric digestion) (Beley, 1948, Hamzé et al., 1984),
the total phosphorus was measured by UV-absorption spectrophotometry and the total potassium by flame
emission spectrophotometry. Polyphenolic compounds were extracted with ethyl acetate (Balice and Cera,
1984) and were assayed by spectrophotometry at 765 nm wavelength using Folin-Ciocalteau reagent (Vazquez
Roncero et al., 1974; Maestro Duran et al., 1991; Montedoro et al., 1992; Paredes et al., 1999; Zenjari et al.,
2001), total polyphenols are expressed as tyrosol.
Effects of different OMW on soil and physico-chemical analysis of soil:
The experiment was conducted in greenhouse under controlled conditions of temperature (20-22°C) and
equivalent moisture (70-80%).
The soil was distributed into pots of 113 cm2
surfaces and capacity of approximately 0.8 kg soil pot-1
. The
doses of OMW applied at the beginning of the experiment are respectively 0 L.m-2
(control), two doses
427 Middle East J. Agric. Res., 3(3): 425-447, 2014
considered as normal in the range of 1 and 5 L.m-2
and two doses considered as excessive in the range of 10 et
15 L.m-2
.
To determine the effects of OMW on soil, we followed the evolution of certain physicochemical properties
of soil by sampling in each pot after 1; 15; 30; 50 and 90 days of OMW application. A total of 135 pots were
used for soil analysis. The soil samples were air-dried, mixed and sieved through 2 mm diameter sieve. Sub
samples were dried in a 105°C oven to determine the dry soil matter. At the end of each period, some
physicochemical parameters of soil were determined. pH of the aqueous suspension extract soil/water (w:v ;
1:2.5) was measured (Rowell, 1995). Electrical conductivity (EC) was determined on an aqueous extraction
solution with a ratio mass:volume; 1:5 (AFNOR, 1987; Rowell, 1995). Total nitrogen was determined by the
Kjeldahl method (Rowell, 1995; Pansu and Gautheyrou, 2003). Available phosphorus was determined by Olsen
method with sodium bicarbonate extraction and ratio mass:volume; 1:20 (Olsen and Dean, 1965; Tandon, 1998;
Pansu and Gautheyrou, 2003). Exchangeable potassium was determined using the Schollenberger and Simon
method (Schollenberger and Simon, 1945) by acetate ammonium extraction with a ratio mass:volume; 1:20.
Total organic carbon was determined by wet digestion after chromic acid oxidation (Walkely and Black, 1934),
organic matter was obtained from the carbon content (Navarro et al., 1993; Tandon, 1998; Rowell, 1995; Ryan
et al., 1996; Pansu and Gautheyrou, 2003). Total porosity was calculated by determining the bulk and particles
densities (Rowell, 1995).
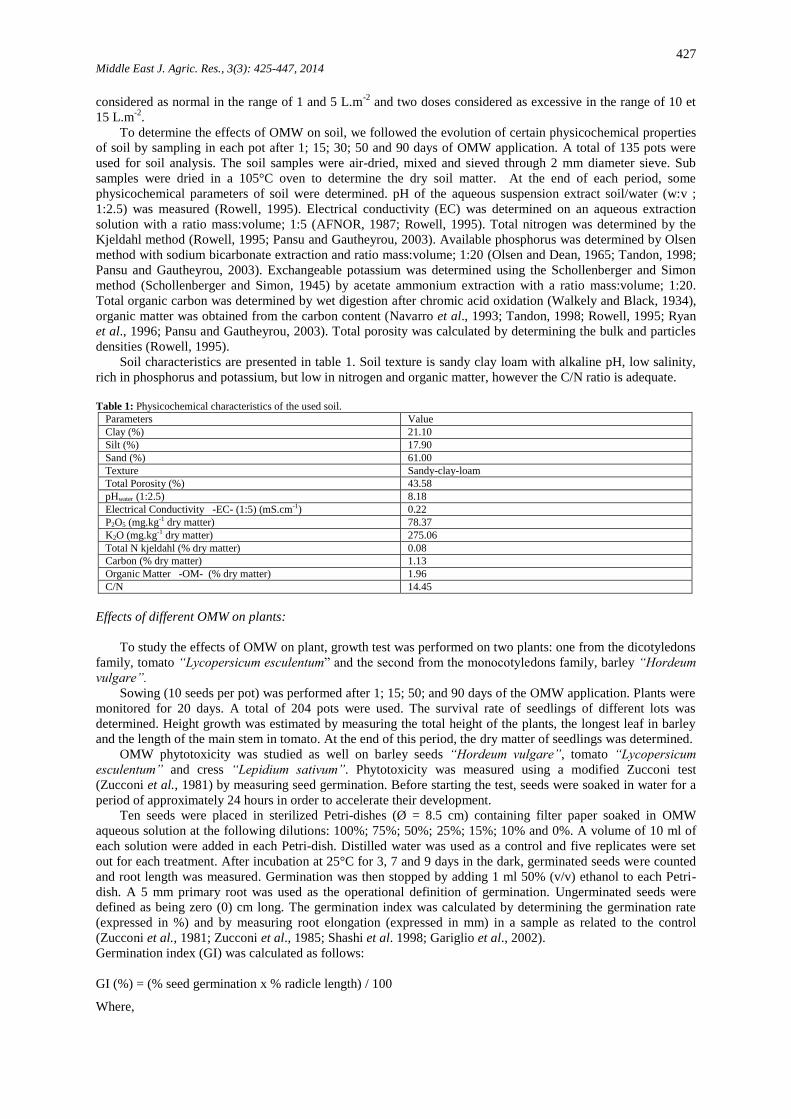
Soil characteristics are presented in table 1. Soil texture is sandy clay loam with alkaline pH, low salinity,
rich in phosphorus and potassium, but low in nitrogen and organic matter, however the C/N ratio is adequate.
Table 1: Physicochemical characteristics of the used soil.
Parameters Value
Clay (%) 21.10
Silt (%) 17.90
Sand (%) 61.00
Texture Sandy-clay-loam
Total Porosity (%) 43.58
pHwater (1:2.5) 8.18
Electrical Conductivity -EC- (1:5) (mS.cm-1) 0.22
P2O5 (mg.kg-1 dry matter) 78.37
K2O (mg.kg-1 dry matter) 275.06
Total N kjeldahl (% dry matter) 0.08
Carbon (% dry matter) 1.13
Organic Matter -OM- (% dry matter) 1.96
C/N 14.45
Effects of different OMW on plants:
To study the effects of OMW on plant, growth test was performed on two plants: one from the dicotyledons
family, tomato “Lycopersicum esculentum” and the second from the monocotyledons family, barley “Hordeum
vulgare”.
Sowing (10 seeds per pot) was performed after 1; 15; 50; and 90 days of the OMW application. Plants were
monitored for 20 days. A total of 204 pots were used. The survival rate of seedlings of different lots was
determined. Height growth was estimated by measuring the total height of the plants, the longest leaf in barley
and the length of the main stem in tomato. At the end of this period, the dry matter of seedlings was determined.
OMW phytotoxicity was studied as well on barley seeds “Hordeum vulgare”, tomato “Lycopersicum
esculentum” and cress “Lepidium sativum”. Phytotoxicity was measured using a modified Zucconi test
(Zucconi et al., 1981) by measuring seed germination. Before starting the test, seeds were soaked in water for a
period of approximately 24 hours in order to accelerate their development.
Ten seeds were placed in sterilized Petri-dishes (Ø = 8.5 cm) containing filter paper soaked in OMW
aqueous solution at the following dilutions: 100%; 75%; 50%; 25%; 15%; 10% and 0%. A volume of 10 ml of
each solution were added in each Petri-dish. Distilled water was used as a control and five replicates were set
out for each treatment. After incubation at 25°C for 3, 7 and 9 days in the dark, germinated seeds were counted
and root length was measured. Germination was then stopped by adding 1 ml 50% (v/v) ethanol to each Petri-
dish. A 5 mm primary root was used as the operational definition of germination. Ungerminated seeds were
defined as being zero (0) cm long. The germination index was calculated by determining the germination rate
(expressed in %) and by measuring root elongation (expressed in mm) in a sample as related to the control
(Zucconi et al., 1981; Zucconi et al., 1985; Shashi et al. 1998; Gariglio et al., 2002).
Germination index (GI) was calculated as follows:
GI (%) = (% seed germination x % radicle length) / 100
Where,
428 Middle East J. Agric. Res., 3(3): 425-447, 2014
% Germination = Mean germination in OMW solution / Mean germination in distilled water x 100
and
% Radicle Length = Mean radicle length in OMW solution / Mean radicle length in water x 100
Statistical analysis:
The treatment distribution was performed according to the statistical scheme of the Randomized Complete
Design (RCD) with 3 replications. The statistical interpretation was performed by the variance analysis with one
studied factor (ANOVA) following the procedure of the general linear model (GLM) of the statistical program
SAS (Statistical Analysis System, 2004). Comparison of the average of treatments is established by calculating
the least significant difference (LSD) at 5%.
Results and Discussion
Physicochemical characteristics of the used Olive Mill Wastewater (OMW):
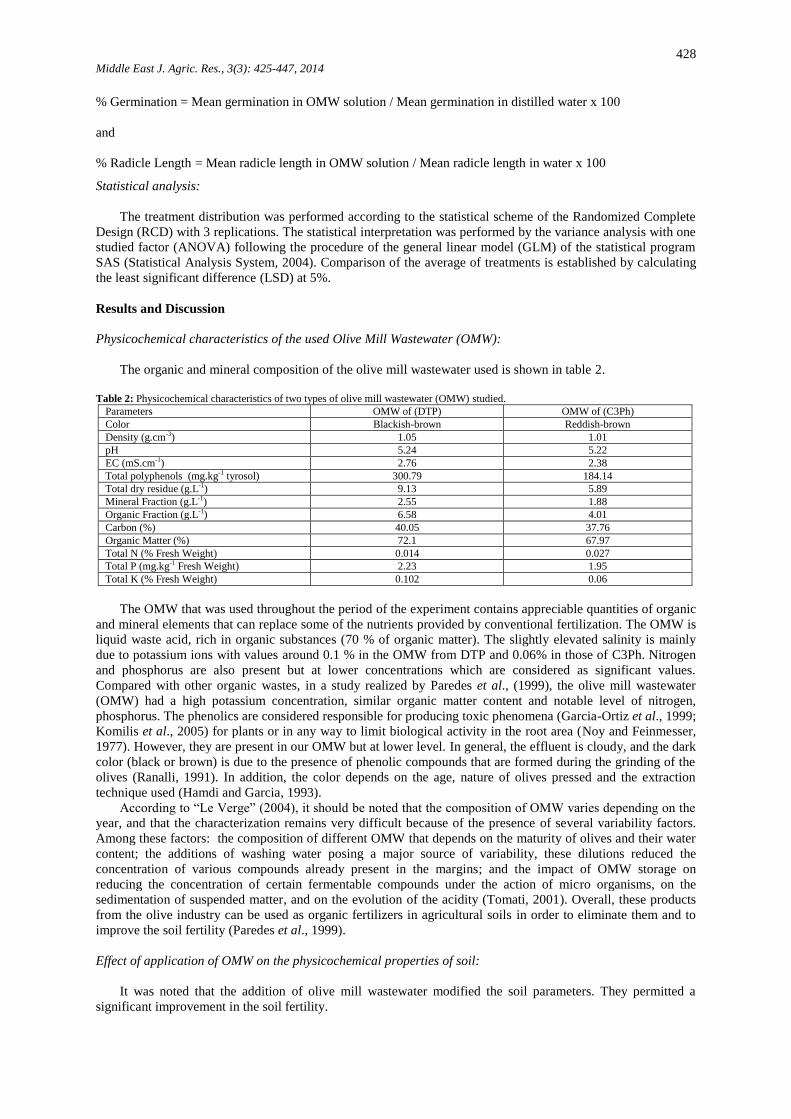
The organic and mineral composition of the olive mill wastewater used is shown in table 2.
Table 2: Physicochemical characteristics of two types of olive mill wastewater (OMW) studied.
Parameters OMW of (DTP) OMW of (C3Ph)
Color Blackish-brown Reddish-brown
Density (g.cm-3) 1.05 1.01
pH 5.24 5.22
EC (mS.cm-1) 2.76 2.38
Total polyphenols (mg.kg-1 tyrosol) 300.79 184.14
Total dry residue (g.L-1) 9.13 5.89
Mineral Fraction (g.L-1) 2.55 1.88
Organic Fraction (g.L-1) 6.58 4.01
Carbon (%) 40.05 37.76
Organic Matter (%) 72.1 67.97
Total N (% Fresh Weight) 0.014 0.027
Total P (mg.kg-1 Fresh Weight) 2.23 1.95
Total K (% Fresh Weight) 0.102 0.06
The OMW that was used throughout the period of the experiment contains appreciable quantities of organic
and mineral elements that can replace some of the nutrients provided by conventional fertilization. The OMW is
liquid waste acid, rich in organic substances (70 % of organic matter). The slightly elevated salinity is mainly
due to potassium ions with values around 0.1 % in the OMW from DTP and 0.06% in those of C3Ph. Nitrogen
and phosphorus are also present but at lower concentrations which are considered as significant values.
Compared with other organic wastes, in a study realized by Paredes et al., (1999), the olive mill wastewater
(OMW) had a high potassium concentration, similar organic matter content and notable level of nitrogen,
phosphorus. The phenolics are considered responsible for producing toxic phenomena (Garcia-Ortiz et al., 1999;
Komilis et al., 2005) for plants or in any way to limit biological activity in the root area (Noy and Feinmesser,
1977). However, they are present in our OMW but at lower level. In general, the effluent is cloudy, and the dark
color (black or brown) is due to the presence of phenolic compounds that are formed during the grinding of the
olives (Ranalli, 1991). In addition, the color depends on the age, nature of olives pressed and the extraction
technique used (Hamdi and Garcia, 1993).
According to “Le Verge” (2004), it should be noted that the composition of OMW varies depending on the
year, and that the characterization remains very difficult because of the presence of several variability factors.
Among these factors: the composition of different OMW that depends on the maturity of olives and their water
content; the additions of washing water posing a major source of variability, these dilutions reduced the
concentration of various compounds already present in the margins; and the impact of OMW storage on
reducing the concentration of certain fermentable compounds under the action of micro organisms, on the
sedimentation of suspended matter, and on the evolution of the acidity (Tomati, 2001). Overall, these products
from the olive industry can be used as organic fertilizers in agricultural soils in order to eliminate them and to
improve the soil fertility (Paredes et al., 1999).
Effect of application of OMW on the physicochemical properties of soil:
It was noted that the addition of olive mill wastewater modified the soil parameters. They permitted a
significant improvement in the soil fertility.
429 Middle East J. Agric. Res., 3(3): 425-447, 2014
Effect on the rate of organic matter of soil:
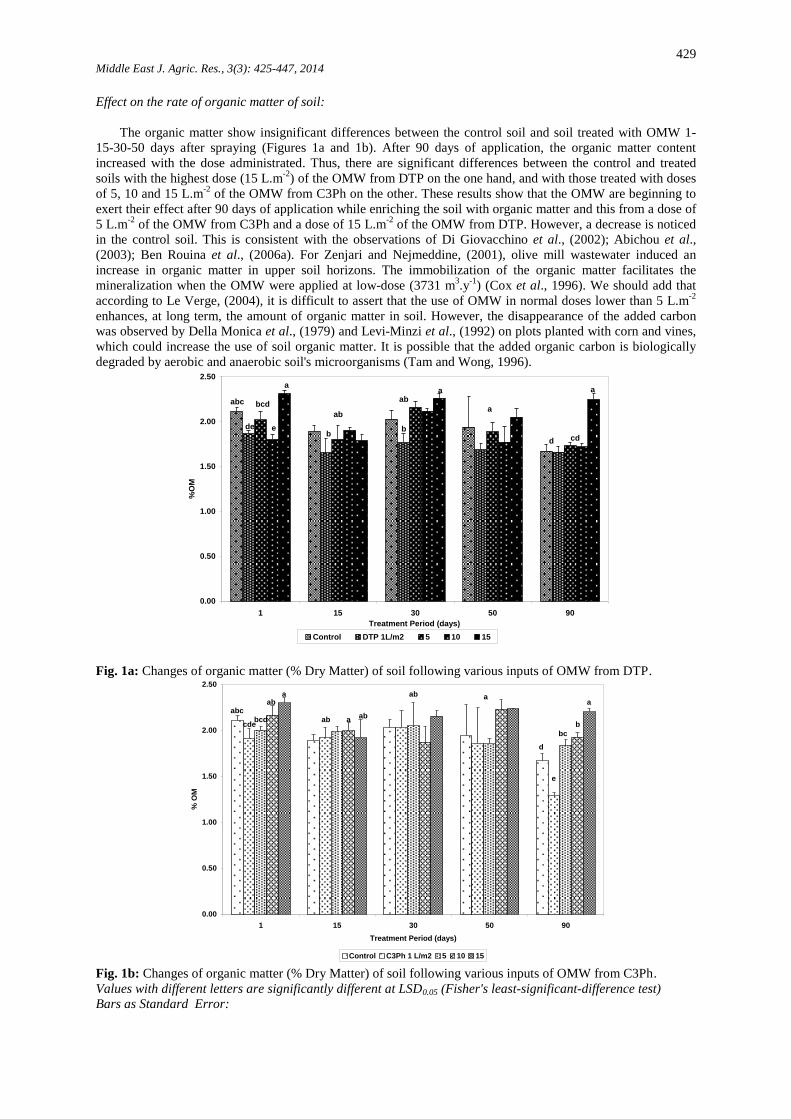
The organic matter show insignificant differences between the control soil and soil treated with OMW 1-
15-30-50 days after spraying (Figures 1a and 1b). After 90 days of application, the organic matter content
increased with the dose administrated. Thus, there are significant differences between the control and treated
soils with the highest dose (15 L.m-2
) of the OMW from DTP on the one hand, and with those treated with doses
of 5, 10 and 15 L.m-2
of the OMW from C3Ph on the other. These results show that the OMW are beginning to
exert their effect after 90 days of application while enriching the soil with organic matter and this from a dose of
5 L.m-2
of the OMW from C3Ph and a dose of 15 L.m-2
of the OMW from DTP. However, a decrease is noticed
in the control soil. This is consistent with the observations of Di Giovacchino et al., (2002); Abichou et al.,
(2003); Ben Rouina et al., (2006a). For Zenjari and Nejmeddine, (2001), olive mill wastewater induced an
increase in organic matter in upper soil horizons. The immobilization of the organic matter facilitates the
mineralization when the OMW were applied at low-dose (3731 m3.y
-1) (Cox et al., 1996). We should add that
according to Le Verge, (2004), it is difficult to assert that the use of OMW in normal doses lower than 5 L.m-2
enhances, at long term, the amount of organic matter in soil. However, the disappearance of the added carbon
was observed by Della Monica et al., (1979) and Levi-Minzi et al., (1992) on plots planted with corn and vines,
which could increase the use of soil organic matter. It is possible that the added organic carbon is biologically
degraded by aerobic and anaerobic soil's microorganisms (Tam and Wong, 1996).
0.00
0.50
1.00
1.50
2.00
2.50
1 15 30 50 90
Treatment Period (days)
%O
M
Control DTP 1L/m2 5 10 15
de
abc
a
cdd
a
aba
b
ab
b
a
e
bcd
Fig. 1a: Changes of organic matter (% Dry Matter) of soil following various inputs of OMW from DTP.
0.00
0.50
1.00
1.50
2.00
2.50
1 15 30 50 90
Treatment Period (days)
% O
M
Control C3Ph 1 L/m2 5 10 15
b
bc
e
d
aab
abab a
aab
bcd
ecde
abca
Fig. 1b: Changes of organic matter (% Dry Matter) of soil following various inputs of OMW from C3Ph.
Values with different letters are significantly different at LSD0.05 (Fisher's least-significant-difference test)
Bars as Standard Error:
430 Middle East J. Agric. Res., 3(3): 425-447, 2014
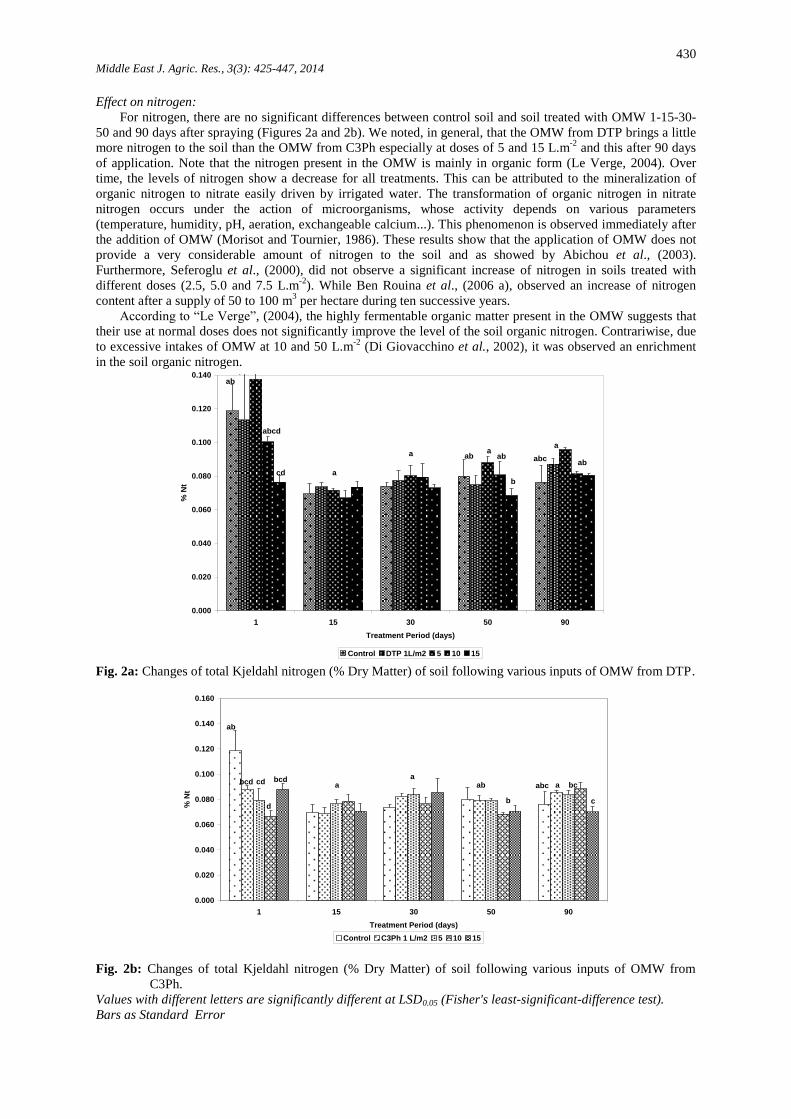
Effect on nitrogen:
For nitrogen, there are no significant differences between control soil and soil treated with OMW 1-15-30-
50 and 90 days after spraying (Figures 2a and 2b). We noted, in general, that the OMW from DTP brings a little
more nitrogen to the soil than the OMW from C3Ph especially at doses of 5 and 15 L.m-2
and this after 90 days
of application. Note that the nitrogen present in the OMW is mainly in organic form (Le Verge, 2004). Over
time, the levels of nitrogen show a decrease for all treatments. This can be attributed to the mineralization of
organic nitrogen to nitrate easily driven by irrigated water. The transformation of organic nitrogen in nitrate
nitrogen occurs under the action of microorganisms, whose activity depends on various parameters
(temperature, humidity, pH, aeration, exchangeable calcium...). This phenomenon is observed immediately after
the addition of OMW (Morisot and Tournier, 1986). These results show that the application of OMW does not
provide a very considerable amount of nitrogen to the soil and as showed by Abichou et al., (2003).
Furthermore, Seferoglu et al., (2000), did not observe a significant increase of nitrogen in soils treated with
different doses (2.5, 5.0 and 7.5 L.m-2
). While Ben Rouina et al., (2006 a), observed an increase of nitrogen
content after a supply of 50 to 100 m3 per hectare during ten successive years.
According to “Le Verge”, (2004), the highly fermentable organic matter present in the OMW suggests that
their use at normal doses does not significantly improve the level of the soil organic nitrogen. Contrariwise, due
to excessive intakes of OMW at 10 and 50 L.m-2
(Di Giovacchino et al., 2002), it was observed an enrichment
in the soil organic nitrogen.
0.000
0.020
0.040
0.060
0.080
0.100
0.120
0.140
1 15 30 50 90
Treatment Period (days)
% N
t
Control DTP 1L/m2 5 10 15
ab
a
abc
b
aba
aba
acd
abcd
aabcab
Fig. 2a: Changes of total Kjeldahl nitrogen (% Dry Matter) of soil following various inputs of OMW from DTP.
0.000
0.020
0.040
0.060
0.080
0.100
0.120
0.140
0.160
1 15 30 50 90
Treatment Period (days)
% N
t
Control C3Ph 1 L/m2 5 10 15
c
bcaabc
b
aba
abcd
d
cdbcd
ab
Fig. 2b: Changes of total Kjeldahl nitrogen (% Dry Matter) of soil following various inputs of OMW from
C3Ph.
Values with different letters are significantly different at LSD0.05 (Fisher's least-significant-difference test).
Bars as Standard Error
431 Middle East J. Agric. Res., 3(3): 425-447, 2014
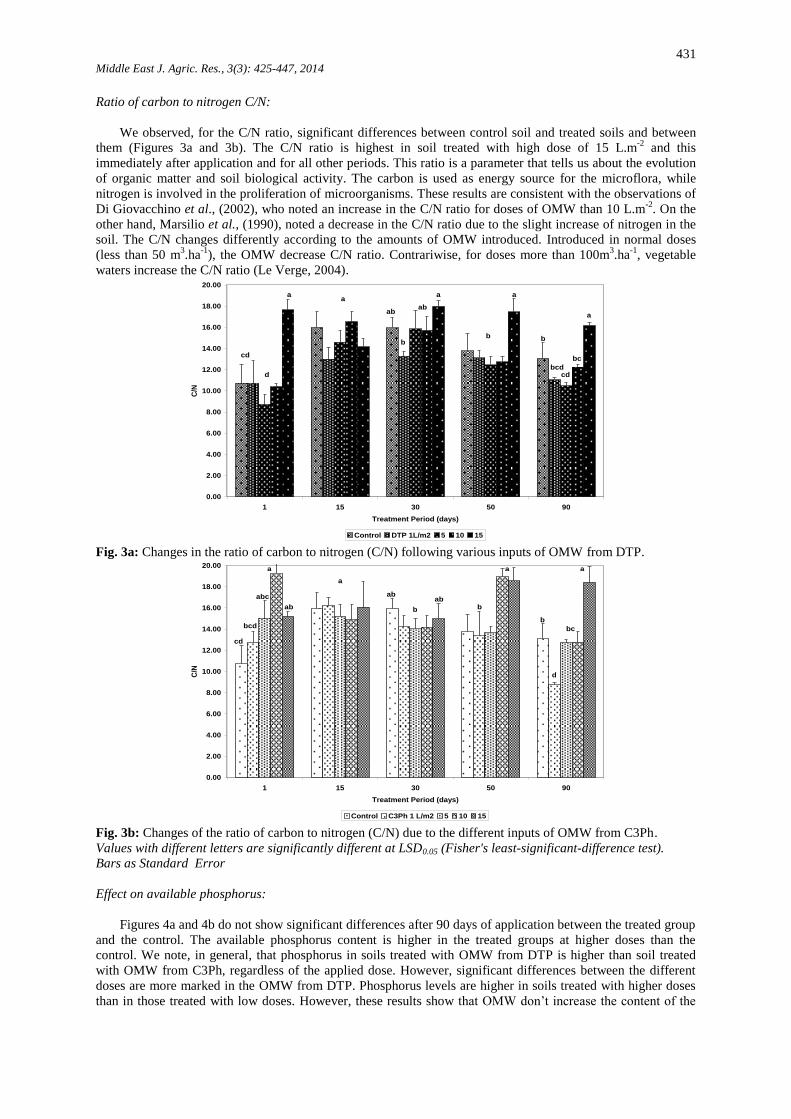
Ratio of carbon to nitrogen C/N:
We observed, for the C/N ratio, significant differences between control soil and treated soils and between
them (Figures 3a and 3b). The C/N ratio is highest in soil treated with high dose of 15 L.m-2
and this
immediately after application and for all other periods. This ratio is a parameter that tells us about the evolution
of organic matter and soil biological activity. The carbon is used as energy source for the microflora, while
nitrogen is involved in the proliferation of microorganisms. These results are consistent with the observations of
Di Giovacchino et al., (2002), who noted an increase in the C/N ratio for doses of OMW than 10 L.m-2
. On the
other hand, Marsilio et al., (1990), noted a decrease in the C/N ratio due to the slight increase of nitrogen in the
soil. The C/N changes differently according to the amounts of OMW introduced. Introduced in normal doses
(less than 50 m3.ha
-1), the OMW decrease C/N ratio. Contrariwise, for doses more than 100m
3.ha
-1, vegetable
waters increase the C/N ratio (Le Verge, 2004).
0.00
2.00
4.00
6.00
8.00
10.00
12.00
14.00
16.00
18.00
20.00
1 15 30 50 90
Treatment Period (days)
C/N
Control DTP 1L/m2 5 10 15
a
bc
cdbcd
b
a
b
a
b
abab
aa
d
cd
Fig. 3a: Changes in the ratio of carbon to nitrogen (C/N) following various inputs of OMW from DTP.
0.00
2.00
4.00
6.00
8.00
10.00
12.00
14.00
16.00
18.00
20.00
1 15 30 50 90
Treatment Period (days)
C/N
Control C3Ph 1 L/m2 5 10 15
a
bc
d
b
a
bab
b
ab
a
ab
a
abc
bcd
cd
Fig. 3b: Changes of the ratio of carbon to nitrogen (C/N) due to the different inputs of OMW from C3Ph.
Values with different letters are significantly different at LSD0.05 (Fisher's least-significant-difference test).
Bars as Standard Error
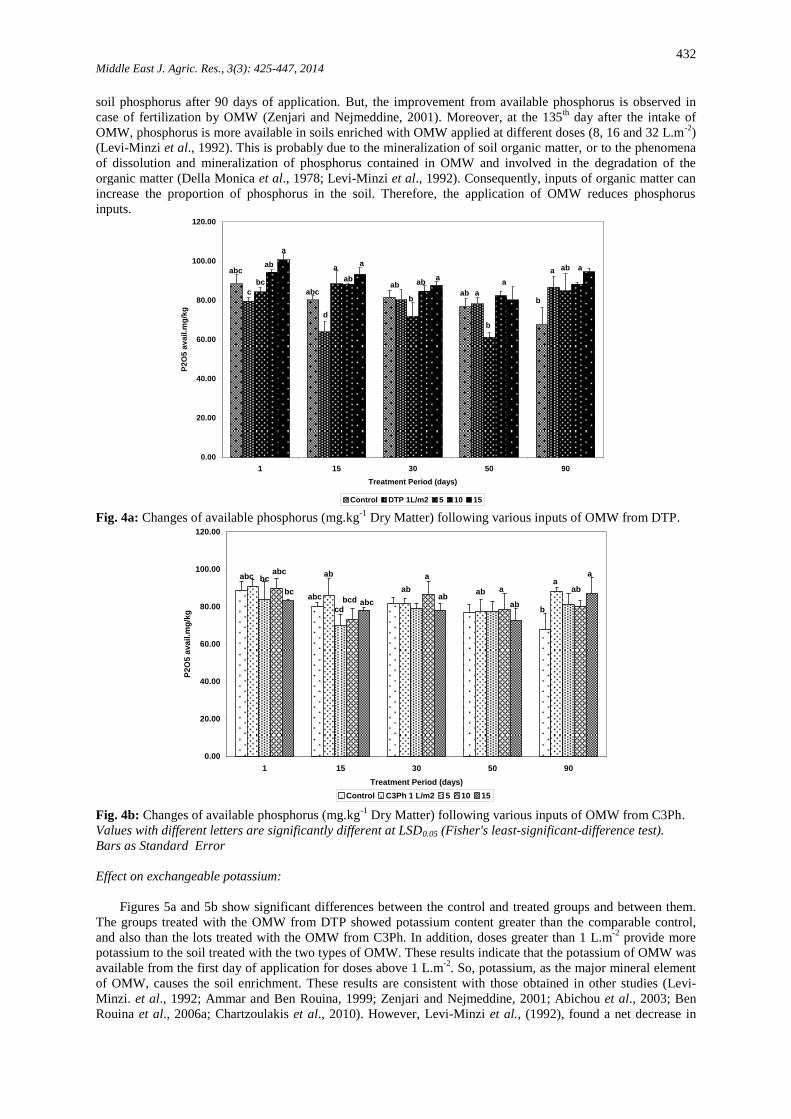
Effect on available phosphorus:
Figures 4a and 4b do not show significant differences after 90 days of application between the treated group
and the control. The available phosphorus content is higher in the treated groups at higher doses than the
control. We note, in general, that phosphorus in soils treated with OMW from DTP is higher than soil treated
with OMW from C3Ph, regardless of the applied dose. However, significant differences between the different
doses are more marked in the OMW from DTP. Phosphorus levels are higher in soils treated with higher doses
than in those treated with low doses. However, these results show that OMW don’t increase the content of the
432 Middle East J. Agric. Res., 3(3): 425-447, 2014
soil phosphorus after 90 days of application. But, the improvement from available phosphorus is observed in
case of fertilization by OMW (Zenjari and Nejmeddine, 2001). Moreover, at the 135th
day after the intake of
OMW, phosphorus is more available in soils enriched with OMW applied at different doses (8, 16 and 32 L.m-2
)
(Levi-Minzi et al., 1992). This is probably due to the mineralization of soil organic matter, or to the phenomena
of dissolution and mineralization of phosphorus contained in OMW and involved in the degradation of the
organic matter (Della Monica et al., 1978; Levi-Minzi et al., 1992). Consequently, inputs of organic matter can
increase the proportion of phosphorus in the soil. Therefore, the application of OMW reduces phosphorus
inputs.
0.00
20.00
40.00
60.00
80.00
100.00
120.00
1 15 30 50 90
Treatment Period (days)
P2
O5
av
ail
.mg
/kg
Control DTP 1L/m2 5 10 15
a
b
a
b
aab
aab
b
ab
a
ab
a
d
abc
a
ab
bc
c
abc ab a
Fig. 4a: Changes of available phosphorus (mg.kg-1
Dry Matter) following various inputs of OMW from DTP.
0.00
20.00
40.00
60.00
80.00
100.00
120.00
1 15 30 50 90
Treatment Period (days)
P2
O5
av
ail
.mg
/kg
Control C3Ph 1 L/m2 5 10 15
a
aba
bab
aabab
a
ab
abc
d
bcd
cd
ab
abcbc
abcbcabc
Fig. 4b: Changes of available phosphorus (mg.kg-1
Dry Matter) following various inputs of OMW from C3Ph.
Values with different letters are significantly different at LSD0.05 (Fisher's least-significant-difference test).
Bars as Standard Error
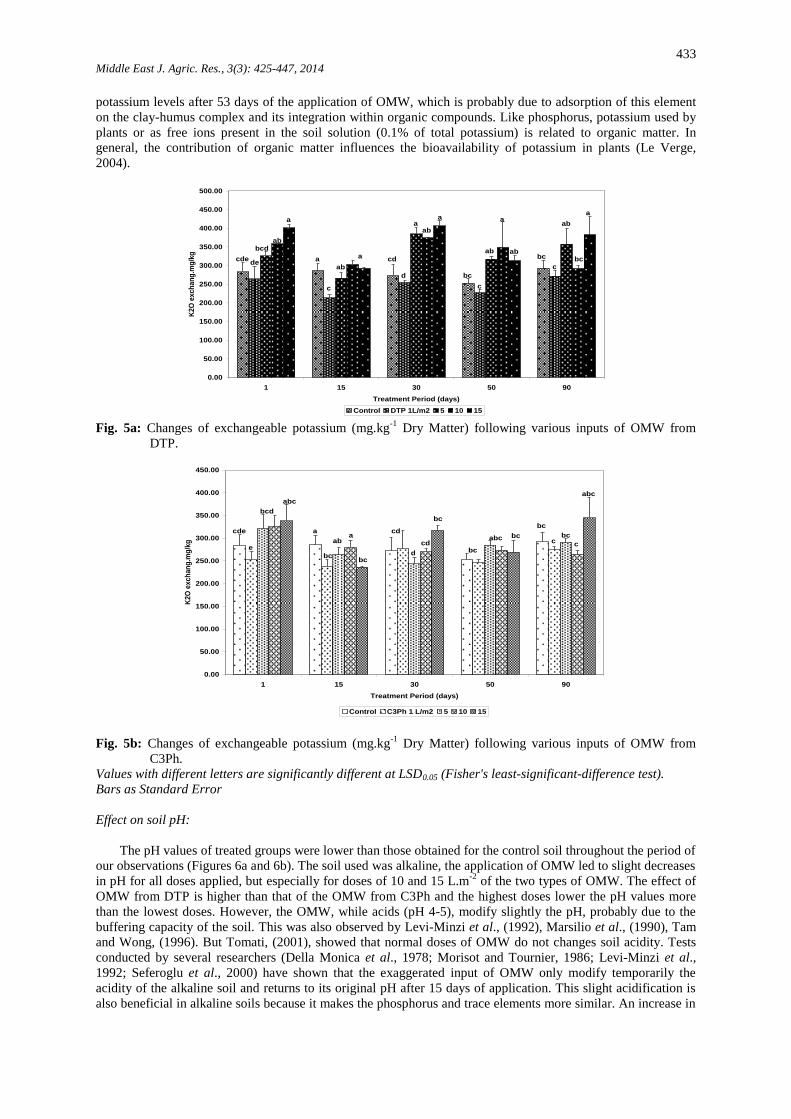
Effect on exchangeable potassium:
Figures 5a and 5b show significant differences between the control and treated groups and between them.
The groups treated with the OMW from DTP showed potassium content greater than the comparable control,
and also than the lots treated with the OMW from C3Ph. In addition, doses greater than 1 L.m-2
provide more
potassium to the soil treated with the two types of OMW. These results indicate that the potassium of OMW was
available from the first day of application for doses above 1 L.m-2
. So, potassium, as the major mineral element
of OMW, causes the soil enrichment. These results are consistent with those obtained in other studies (Levi-
Minzi. et al., 1992; Ammar and Ben Rouina, 1999; Zenjari and Nejmeddine, 2001; Abichou et al., 2003; Ben
Rouina et al., 2006a; Chartzoulakis et al., 2010). However, Levi-Minzi et al., (1992), found a net decrease in
433 Middle East J. Agric. Res., 3(3): 425-447, 2014
potassium levels after 53 days of the application of OMW, which is probably due to adsorption of this element
on the clay-humus complex and its integration within organic compounds. Like phosphorus, potassium used by
plants or as free ions present in the soil solution (0.1% of total potassium) is related to organic matter. In
general, the contribution of organic matter influences the bioavailability of potassium in plants (Le Verge,
2004).
0.00
50.00
100.00
150.00
200.00
250.00
300.00
350.00
400.00
450.00
500.00
1 15 30 50 90
Treatment Period (days)
K2O
ex
ch
an
g.m
g/k
g
Control DTP 1L/m2 5 10 15
bc
ab
c
bcab
a
ab
c
bc
a
aba
d
cda
ab
c
a
a
abbcd
decde
a
Fig. 5a: Changes of exchangeable potassium (mg.kg-1
Dry Matter) following various inputs of OMW from
DTP.
0.00
50.00
100.00
150.00
200.00
250.00
300.00
350.00
400.00
450.00
1 15 30 50 90
Treatment Period (days)
K2O
ex
ch
an
g.m
g/k
g
Control C3Ph 1 L/m2 5 10 15
abc
c
bcc
bc
bcabc
bc
bc
cd
d
cd
bc
aab
bc
a
abc
bcd
e
e
cde
Fig. 5b: Changes of exchangeable potassium (mg.kg-1
Dry Matter) following various inputs of OMW from
C3Ph.
Values with different letters are significantly different at LSD0.05 (Fisher's least-significant-difference test).
Bars as Standard Error
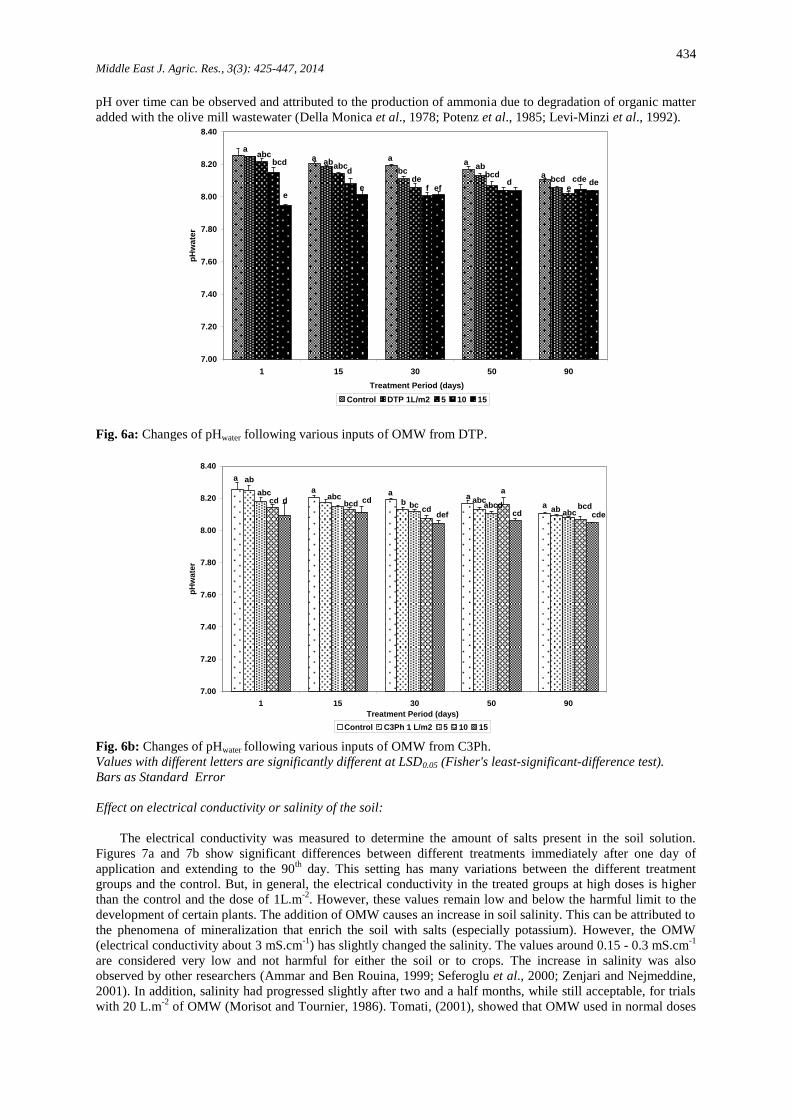
Effect on soil pH:
The pH values of treated groups were lower than those obtained for the control soil throughout the period of
our observations (Figures 6a and 6b). The soil used was alkaline, the application of OMW led to slight decreases
in pH for all doses applied, but especially for doses of 10 and 15 L.m-2
of the two types of OMW. The effect of
OMW from DTP is higher than that of the OMW from C3Ph and the highest doses lower the pH values more
than the lowest doses. However, the OMW, while acids (pH 4-5), modify slightly the pH, probably due to the
buffering capacity of the soil. This was also observed by Levi-Minzi et al., (1992), Marsilio et al., (1990), Tam
and Wong, (1996). But Tomati, (2001), showed that normal doses of OMW do not changes soil acidity. Tests
conducted by several researchers (Della Monica et al., 1978; Morisot and Tournier, 1986; Levi-Minzi et al.,
1992; Seferoglu et al., 2000) have shown that the exaggerated input of OMW only modify temporarily the
acidity of the alkaline soil and returns to its original pH after 15 days of application. This slight acidification is
also beneficial in alkaline soils because it makes the phosphorus and trace elements more similar. An increase in
434 Middle East J. Agric. Res., 3(3): 425-447, 2014
pH over time can be observed and attributed to the production of ammonia due to degradation of organic matter
added with the olive mill wastewater (Della Monica et al., 1978; Potenz et al., 1985; Levi-Minzi et al., 1992).
7.00
7.20
7.40
7.60
7.80
8.00
8.20
8.40
1 15 30 50 90
Treatment Period (days)
pH
wa
ter
Control DTP 1L/m2 5 10 15
decdee
bcd
e
ad
bcdab
a
effde
bc
a
e
dabc
aba
e
bcdabc
a
Fig. 6a: Changes of pHwater following various inputs of OMW from DTP.
7.00
7.20
7.40
7.60
7.80
8.00
8.20
8.40
1 15 30 50 90
Treatment Period (days)
pH
wa
ter
Control C3Ph 1 L/m2 5 10 15
a
defcd
bcb
acdbcd
abca
dcdabc
d
aba
cdebcd
abcaba
cd
a
abcdabc
Fig. 6b: Changes of pHwater following various inputs of OMW from C3Ph.
Values with different letters are significantly different at LSD0.05 (Fisher's least-significant-difference test).
Bars as Standard Error
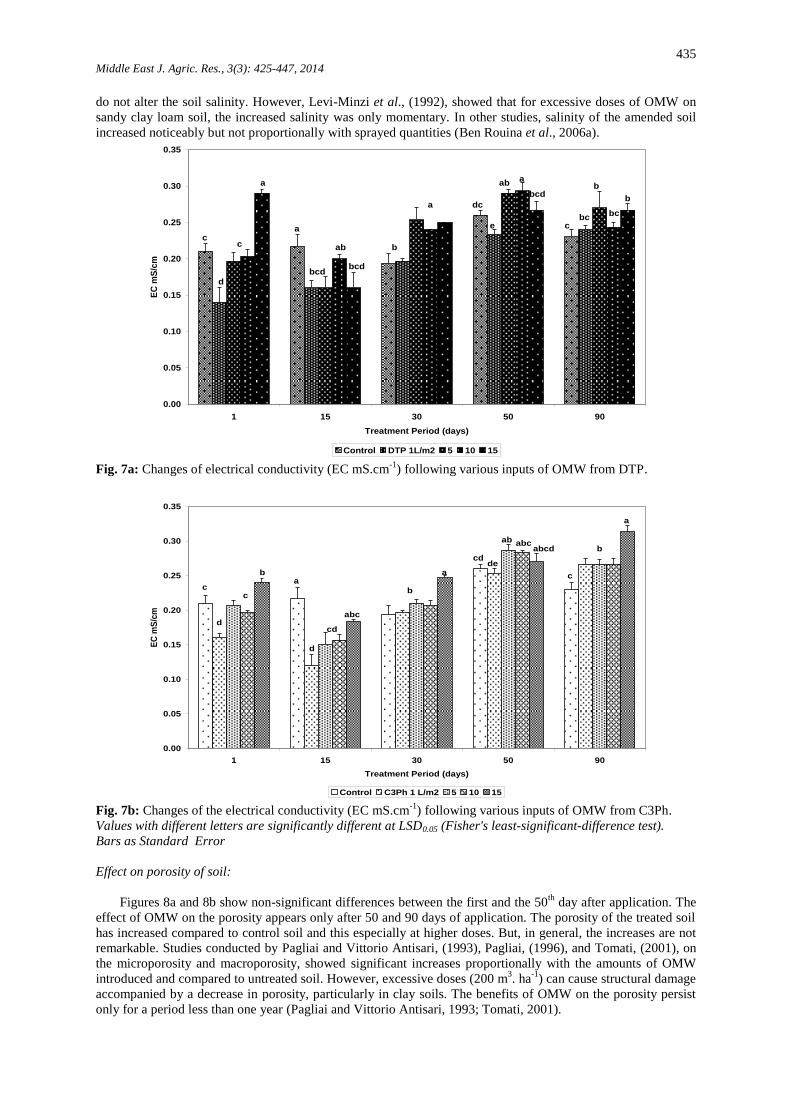
Effect on electrical conductivity or salinity of the soil:
The electrical conductivity was measured to determine the amount of salts present in the soil solution.
Figures 7a and 7b show significant differences between different treatments immediately after one day of
application and extending to the 90th
day. This setting has many variations between the different treatment
groups and the control. But, in general, the electrical conductivity in the treated groups at high doses is higher
than the control and the dose of 1L.m-2
. However, these values remain low and below the harmful limit to the
development of certain plants. The addition of OMW causes an increase in soil salinity. This can be attributed to
the phenomena of mineralization that enrich the soil with salts (especially potassium). However, the OMW
(electrical conductivity about 3 mS.cm-1
) has slightly changed the salinity. The values around 0.15 - 0.3 mS.cm-1
are considered very low and not harmful for either the soil or to crops. The increase in salinity was also
observed by other researchers (Ammar and Ben Rouina, 1999; Seferoglu et al., 2000; Zenjari and Nejmeddine,
2001). In addition, salinity had progressed slightly after two and a half months, while still acceptable, for trials
with 20 L.m-2
of OMW (Morisot and Tournier, 1986). Tomati, (2001), showed that OMW used in normal doses
435 Middle East J. Agric. Res., 3(3): 425-447, 2014
do not alter the soil salinity. However, Levi-Minzi et al., (1992), showed that for excessive doses of OMW on
sandy clay loam soil, the increased salinity was only momentary. In other studies, salinity of the amended soil
increased noticeably but not proportionally with sprayed quantities (Ben Rouina et al., 2006a).
0.00
0.05
0.10
0.15
0.20
0.25
0.30
0.35
1 15 30 50 90
Treatment Period (days)
EC
mS
/cm
Control DTP 1L/m2 5 10 15
c
ab
e
dca
b
bcd
ab
bcd
a
a
c
d
bc
b
bcc
bcd
a
b
Fig. 7a: Changes of electrical conductivity (EC mS.cm-1
) following various inputs of OMW from DTP.
0.00
0.05
0.10
0.15
0.20
0.25
0.30
0.35
1 15 30 50 90
Treatment Period (days)
EC
mS
/cm
Control C3Ph 1 L/m2 5 10 15
c
a
b
c
abcdabcab
decd
a
b
abc
cd
d
ab
c
d
Fig. 7b: Changes of the electrical conductivity (EC mS.cm-1
) following various inputs of OMW from C3Ph.
Values with different letters are significantly different at LSD0.05 (Fisher's least-significant-difference test).
Bars as Standard Error
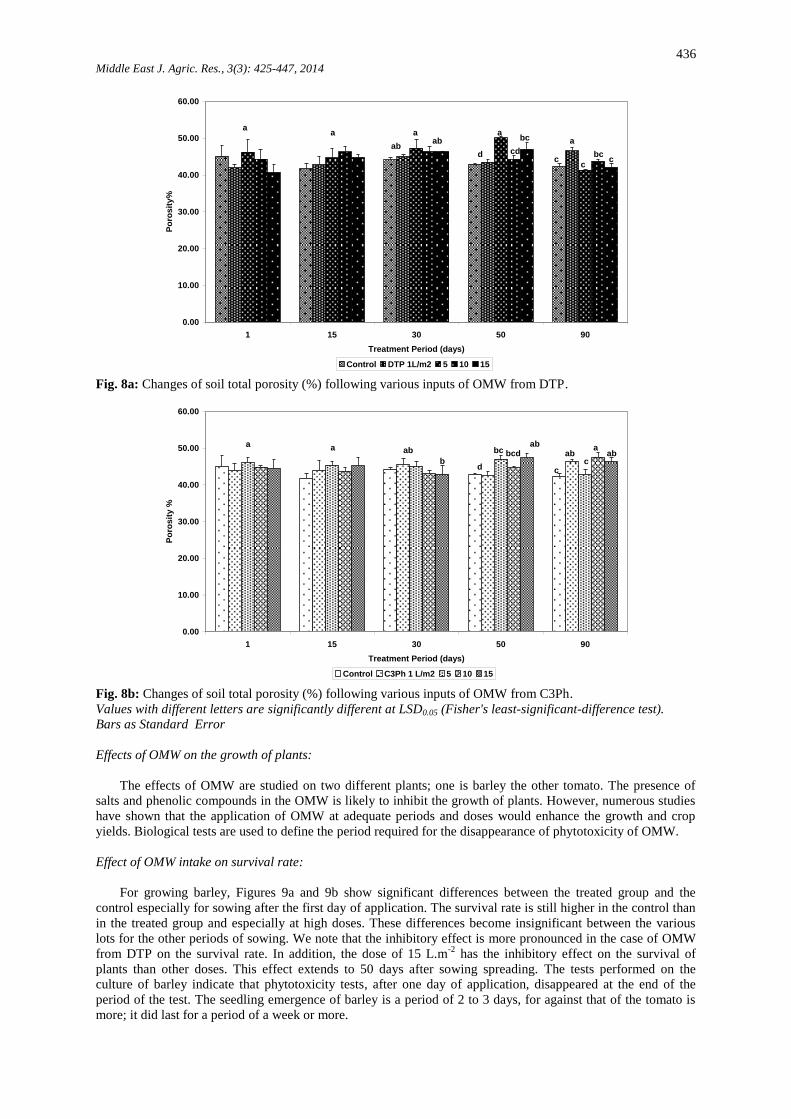
Effect on porosity of soil:
Figures 8a and 8b show non-significant differences between the first and the 50th
day after application. The
effect of OMW on the porosity appears only after 50 and 90 days of application. The porosity of the treated soil
has increased compared to control soil and this especially at higher doses. But, in general, the increases are not
remarkable. Studies conducted by Pagliai and Vittorio Antisari, (1993), Pagliai, (1996), and Tomati, (2001), on
the microporosity and macroporosity, showed significant increases proportionally with the amounts of OMW
introduced and compared to untreated soil. However, excessive doses (200 m3. ha
-1) can cause structural damage
accompanied by a decrease in porosity, particularly in clay soils. The benefits of OMW on the porosity persist
only for a period less than one year (Pagliai and Vittorio Antisari, 1993; Tomati, 2001).
436 Middle East J. Agric. Res., 3(3): 425-447, 2014
0.00
10.00
20.00
30.00
40.00
50.00
60.00
1 15 30 50 90
Treatment Period (days)
Po
ros
ity
%
Control DTP 1L/m2 5 10 15
bc
cd
a
d
aba
ab
aa
cbc
c
a
c
Fig. 8a: Changes of soil total porosity (%) following various inputs of OMW from DTP.
0.00
10.00
20.00
30.00
40.00
50.00
60.00
1 15 30 50 90
Treatment Period (days)
Po
ros
ity %
Control C3Ph 1 L/m2 5 10 15
aab
a
cab
c
abbcdbc
db
aba
Fig. 8b: Changes of soil total porosity (%) following various inputs of OMW from C3Ph.
Values with different letters are significantly different at LSD0.05 (Fisher's least-significant-difference test).
Bars as Standard Error
Effects of OMW on the growth of plants:
The effects of OMW are studied on two different plants; one is barley the other tomato. The presence of
salts and phenolic compounds in the OMW is likely to inhibit the growth of plants. However, numerous studies
have shown that the application of OMW at adequate periods and doses would enhance the growth and crop
yields. Biological tests are used to define the period required for the disappearance of phytotoxicity of OMW.
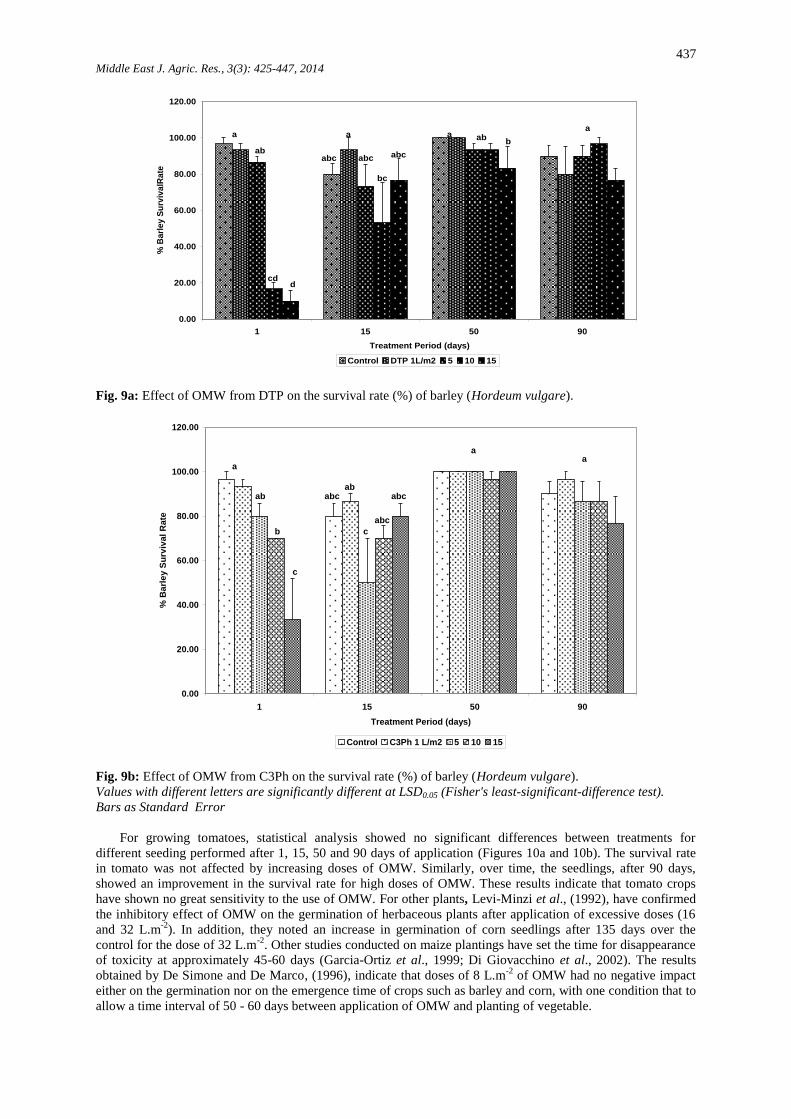
Effect of OMW intake on survival rate:
For growing barley, Figures 9a and 9b show significant differences between the treated group and the
control especially for sowing after the first day of application. The survival rate is still higher in the control than
in the treated group and especially at high doses. These differences become insignificant between the various
lots for the other periods of sowing. We note that the inhibitory effect is more pronounced in the case of OMW
from DTP on the survival rate. In addition, the dose of 15 L.m-2
has the inhibitory effect on the survival of
plants than other doses. This effect extends to 50 days after sowing spreading. The tests performed on the
culture of barley indicate that phytotoxicity tests, after one day of application, disappeared at the end of the
period of the test. The seedling emergence of barley is a period of 2 to 3 days, for against that of the tomato is
more; it did last for a period of a week or more.
437 Middle East J. Agric. Res., 3(3): 425-447, 2014
0.00
20.00
40.00
60.00
80.00
100.00
120.00
1 15 50 90
Treatment Period (days)
% B
arl
ey
Su
rviv
alR
ate
Control DTP 1L/m2 5 10 15
a
baba
abc
bc
abc
a
abc
dcd
ab
a
Fig. 9a: Effect of OMW from DTP on the survival rate (%) of barley (Hordeum vulgare).
0.00
20.00
40.00
60.00
80.00
100.00
120.00
1 15 50 90
Treatment Period (days)
% B
arl
ey
Su
rviv
al
Ra
te
Control C3Ph 1 L/m2 5 10 15
aa
abc
abc
c
ababc
c
b
ab
a
Fig. 9b: Effect of OMW from C3Ph on the survival rate (%) of barley (Hordeum vulgare).
Values with different letters are significantly different at LSD0.05 (Fisher's least-significant-difference test).
Bars as Standard Error
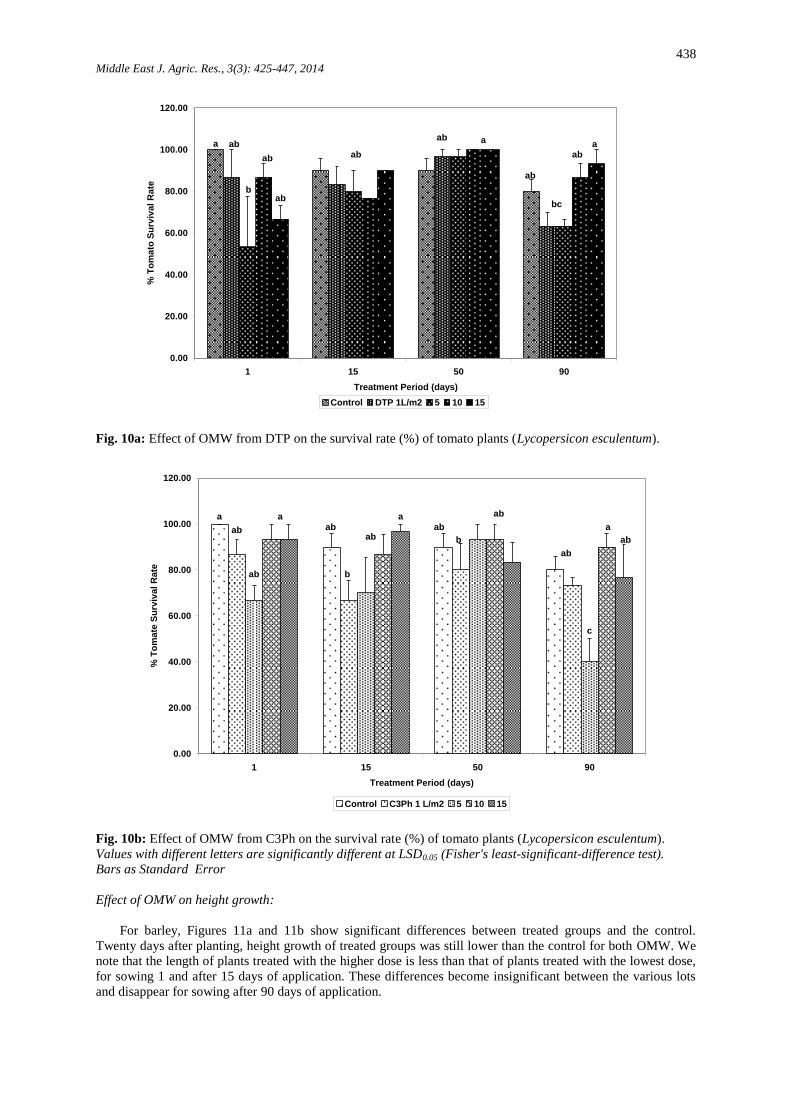
For growing tomatoes, statistical analysis showed no significant differences between treatments for
different seeding performed after 1, 15, 50 and 90 days of application (Figures 10a and 10b). The survival rate
in tomato was not affected by increasing doses of OMW. Similarly, over time, the seedlings, after 90 days,
showed an improvement in the survival rate for high doses of OMW. These results indicate that tomato crops
have shown no great sensitivity to the use of OMW. For other plants, Levi-Minzi et al., (1992), have confirmed
the inhibitory effect of OMW on the germination of herbaceous plants after application of excessive doses (16
and 32 L.m-2
). In addition, they noted an increase in germination of corn seedlings after 135 days over the
control for the dose of 32 L.m-2
. Other studies conducted on maize plantings have set the time for disappearance
of toxicity at approximately 45-60 days (Garcia-Ortiz et al., 1999; Di Giovacchino et al., 2002). The results
obtained by De Simone and De Marco, (1996), indicate that doses of 8 L.m-2
of OMW had no negative impact
either on the germination nor on the emergence time of crops such as barley and corn, with one condition that to
allow a time interval of 50 - 60 days between application of OMW and planting of vegetable.
438 Middle East J. Agric. Res., 3(3): 425-447, 2014
0.00
20.00
40.00
60.00
80.00
100.00
120.00
1 15 50 90
Treatment Period (days)
% T
om
ato
Su
rviv
al
Rate
Control DTP 1L/m2 5 10 15
aab
bc
ab
aab
abab
b
aba
ab
Fig. 10a: Effect of OMW from DTP on the survival rate (%) of tomato plants (Lycopersicon esculentum).
0.00
20.00
40.00
60.00
80.00
100.00
120.00
1 15 50 90
Treatment Period (days)
% T
om
ate
Su
rviv
al
Ra
te
Control C3Ph 1 L/m2 5 10 15
a
c
ab
ab
b
aba
ab
b
aba
ab
ab
a
ab
Fig. 10b: Effect of OMW from C3Ph on the survival rate (%) of tomato plants (Lycopersicon esculentum).
Values with different letters are significantly different at LSD0.05 (Fisher's least-significant-difference test).
Bars as Standard Error
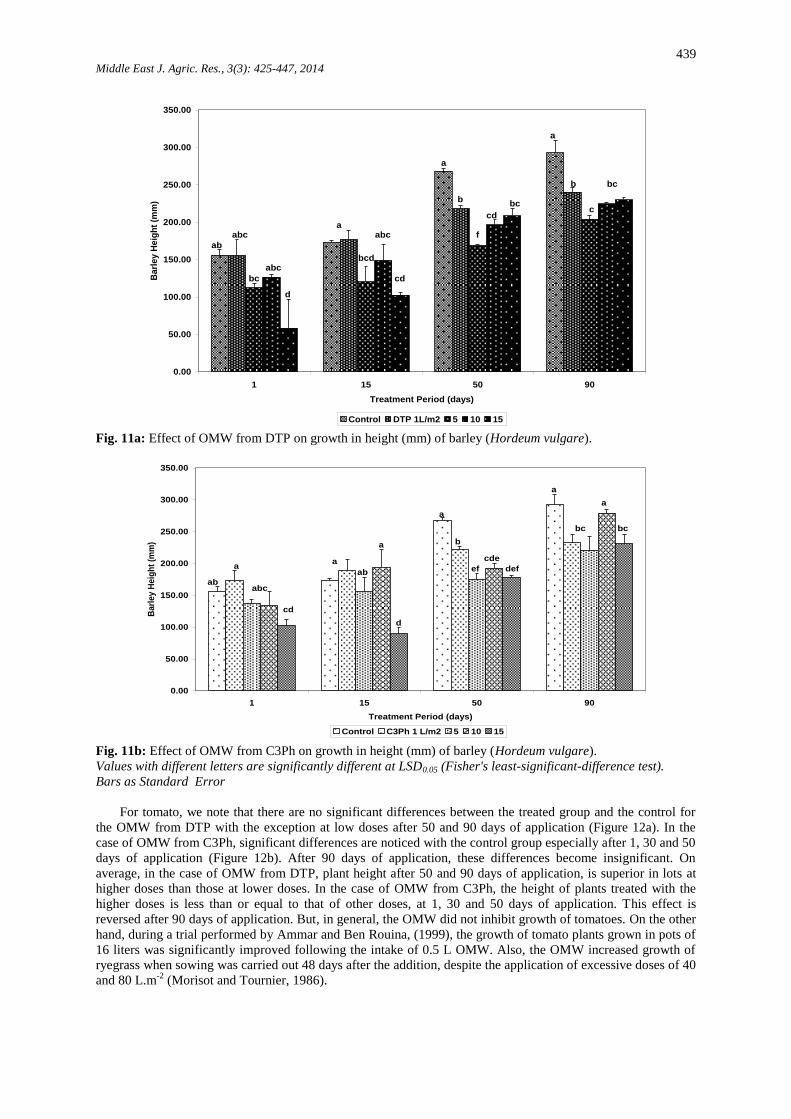
Effect of OMW on height growth:
For barley, Figures 11a and 11b show significant differences between treated groups and the control.
Twenty days after planting, height growth of treated groups was still lower than the control for both OMW. We
note that the length of plants treated with the higher dose is less than that of plants treated with the lowest dose,
for sowing 1 and after 15 days of application. These differences become insignificant between the various lots
and disappear for sowing after 90 days of application.
439 Middle East J. Agric. Res., 3(3): 425-447, 2014
0.00
50.00
100.00
150.00
200.00
250.00
300.00
350.00
1 15 50 90
Treatment Period (days)
Ba
rle
y H
eig
ht
(mm
)
Control DTP 1L/m2 5 10 15
c
bcb
a
bc
cd
f
b
a
cd
abc
bcd
a
d
abc
bc
abc
ab
Fig. 11a: Effect of OMW from DTP on growth in height (mm) of barley (Hordeum vulgare).
0.00
50.00
100.00
150.00
200.00
250.00
300.00
350.00
1 15 50 90
Treatment Period (days)
Barl
ey
He
igh
t (m
m)
Control C3Ph 1 L/m2 5 10 15
bc
a
bc
a
def
cde
ef
b
a
d
a
ab
a
cd
abc
a
ab
Fig. 11b: Effect of OMW from C3Ph on growth in height (mm) of barley (Hordeum vulgare).
Values with different letters are significantly different at LSD0.05 (Fisher's least-significant-difference test).
Bars as Standard Error
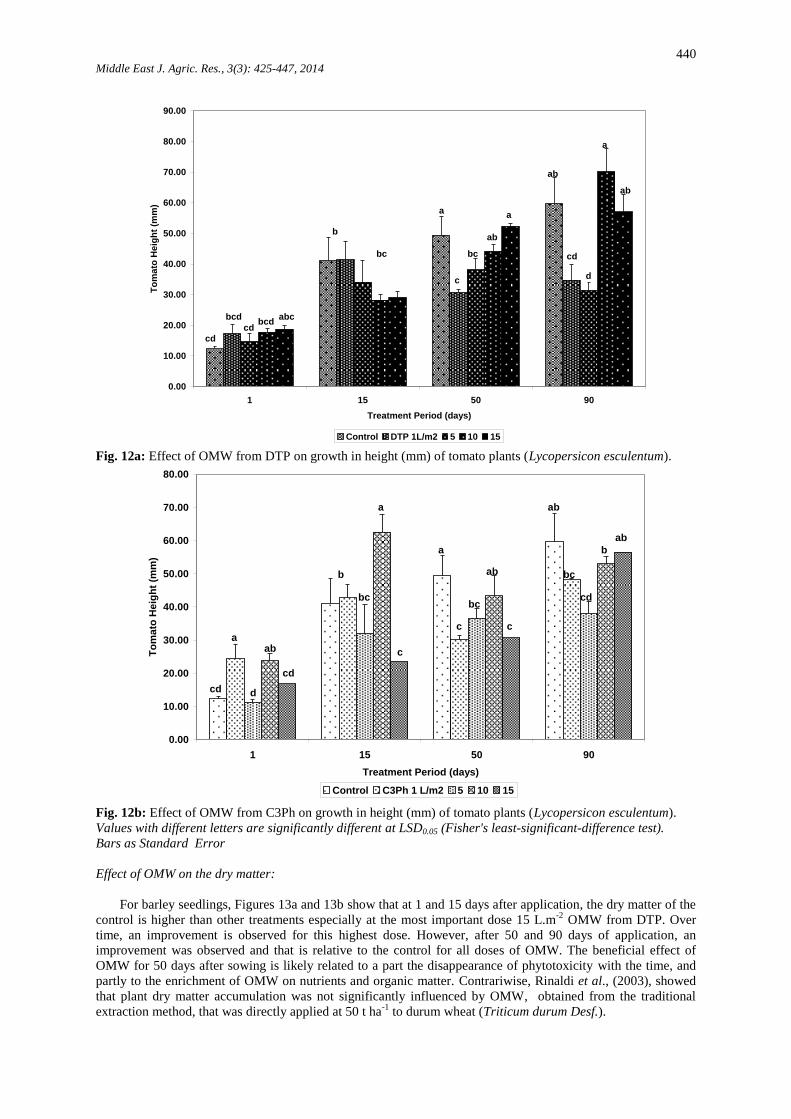
For tomato, we note that there are no significant differences between the treated group and the control for
the OMW from DTP with the exception at low doses after 50 and 90 days of application (Figure 12a). In the
case of OMW from C3Ph, significant differences are noticed with the control group especially after 1, 30 and 50
days of application (Figure 12b). After 90 days of application, these differences become insignificant. On
average, in the case of OMW from DTP, plant height after 50 and 90 days of application, is superior in lots at
higher doses than those at lower doses. In the case of OMW from C3Ph, the height of plants treated with the
higher doses is less than or equal to that of other doses, at 1, 30 and 50 days of application. This effect is
reversed after 90 days of application. But, in general, the OMW did not inhibit growth of tomatoes. On the other
hand, during a trial performed by Ammar and Ben Rouina, (1999), the growth of tomato plants grown in pots of
16 liters was significantly improved following the intake of 0.5 L OMW. Also, the OMW increased growth of
ryegrass when sowing was carried out 48 days after the addition, despite the application of excessive doses of 40
and 80 L.m-2
(Morisot and Tournier, 1986).
440 Middle East J. Agric. Res., 3(3): 425-447, 2014
0.00
10.00
20.00
30.00
40.00
50.00
60.00
70.00
80.00
90.00
1 15 50 90
Treatment Period (days)
To
ma
to H
eig
ht
(mm
)
Control DTP 1L/m2 5 10 15
ab
a
d
cd
ab
a
ab
bc
c
a
bc
b
abcbcd
cd
bcd
cd
Fig. 12a: Effect of OMW from DTP on growth in height (mm) of tomato plants (Lycopersicon esculentum).
0.00
10.00
20.00
30.00
40.00
50.00
60.00
70.00
80.00
1 15 50 90
Treatment Period (days)
To
ma
to H
eig
ht
(mm
)
Control C3Ph 1 L/m2 5 10 15
ab
b
cd
bc
ab
c
ab
bc
c
a
c
a
bc
b
cd
ab
d
a
cd
Fig. 12b: Effect of OMW from C3Ph on growth in height (mm) of tomato plants (Lycopersicon esculentum).
Values with different letters are significantly different at LSD0.05 (Fisher's least-significant-difference test).
Bars as Standard Error
Effect of OMW on the dry matter:
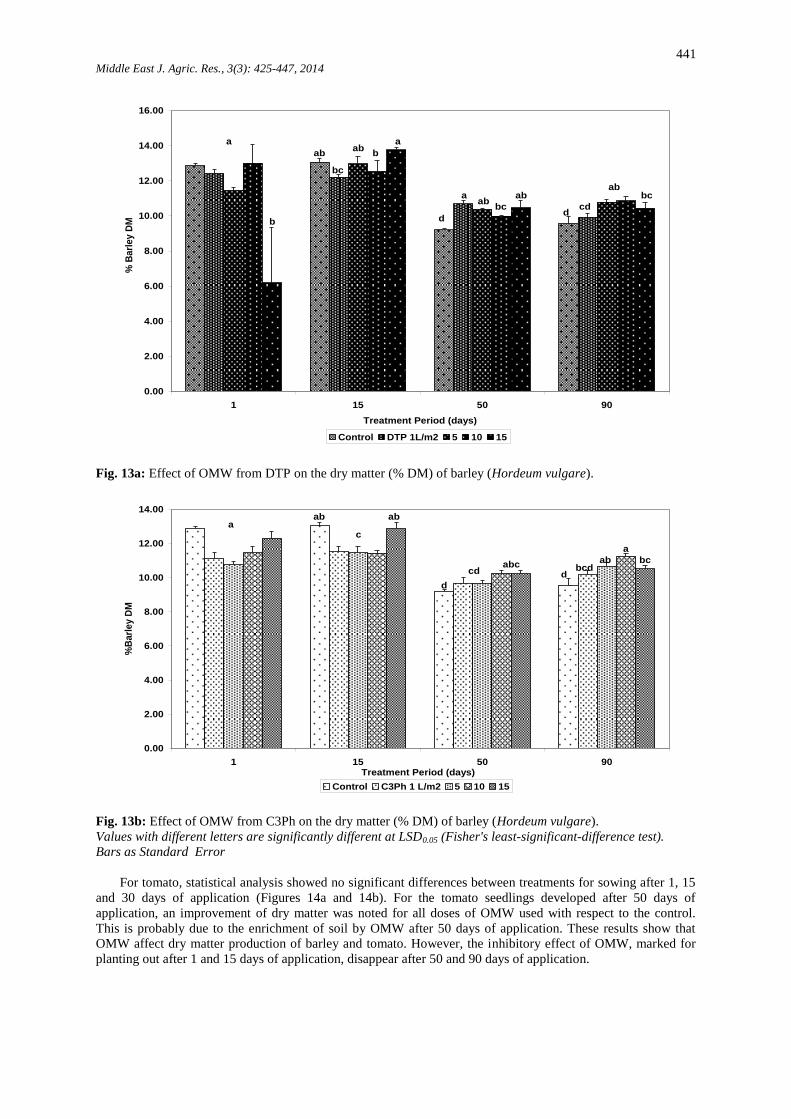
For barley seedlings, Figures 13a and 13b show that at 1 and 15 days after application, the dry matter of the
control is higher than other treatments especially at the most important dose 15 L.m-2
OMW from DTP. Over
time, an improvement is observed for this highest dose. However, after 50 and 90 days of application, an
improvement was observed and that is relative to the control for all doses of OMW. The beneficial effect of
OMW for 50 days after sowing is likely related to a part the disappearance of phytotoxicity with the time, and
partly to the enrichment of OMW on nutrients and organic matter. Contrariwise, Rinaldi et al., (2003), showed
that plant dry matter accumulation was not significantly influenced by OMW, obtained from the traditional
extraction method, that was directly applied at 50 t ha-1
to durum wheat (Triticum durum Desf.).
441 Middle East J. Agric. Res., 3(3): 425-447, 2014
0.00
2.00
4.00
6.00
8.00
10.00
12.00
14.00
16.00
1 15 50 90
Treatment Period (days)
% B
arl
ey
DM
Control DTP 1L/m2 5 10 15
bcab
cdd
ab
bcab
a
d
a
bab
bc
ab
b
a
Fig. 13a: Effect of OMW from DTP on the dry matter (% DM) of barley (Hordeum vulgare).
0.00
2.00
4.00
6.00
8.00
10.00
12.00
14.00
1 15 50 90Treatment Period (days)
%B
arl
ey
DM
Control C3Ph 1 L/m2 5 10 15
bc
a
abbcd
dabc
cd
d
ab
c
aba
Fig. 13b: Effect of OMW from C3Ph on the dry matter (% DM) of barley (Hordeum vulgare).
Values with different letters are significantly different at LSD0.05 (Fisher's least-significant-difference test).
Bars as Standard Error
For tomato, statistical analysis showed no significant differences between treatments for sowing after 1, 15
and 30 days of application (Figures 14a and 14b). For the tomato seedlings developed after 50 days of
application, an improvement of dry matter was noted for all doses of OMW used with respect to the control.
This is probably due to the enrichment of soil by OMW after 50 days of application. These results show that
OMW affect dry matter production of barley and tomato. However, the inhibitory effect of OMW, marked for
planting out after 1 and 15 days of application, disappear after 50 and 90 days of application.

442 Middle East J. Agric. Res., 3(3): 425-447, 2014
0.00
2.00
4.00
6.00
8.00
10.00
12.00
14.00
1 15 50 90
Treatment Period (days)
%T
om
ato
DM
Control DTP 1L/m2 5 10 15
ab
cd
a
bcdabc
d
ab
a
ab
c
a
aba
abc
ab
b
ab
Fig. 14a: Effect of OMW from DTP on the dry matter (% DM) of tomato plants (Lycopersicon esculentum).
0.00
2.00
4.00
6.00
8.00
10.00
12.00
14.00
1 15 50 90
Treatment Period (days)
%T
om
ato
DM
Control C3Ph 1 L/m2 5 10 15
bcd
ab
d
abcabc
dab
a
bc
c
a
abcbc
c
abc
a
ab
Fig. 14b: Effect of OMW from C3Ph on the dry matter (% DM) of tomato plants (Lycopersicon esculentum).
Values with different letters are significantly different at LSD0.05 (Fisher's least-significant-difference test).
Bars as Standard Error
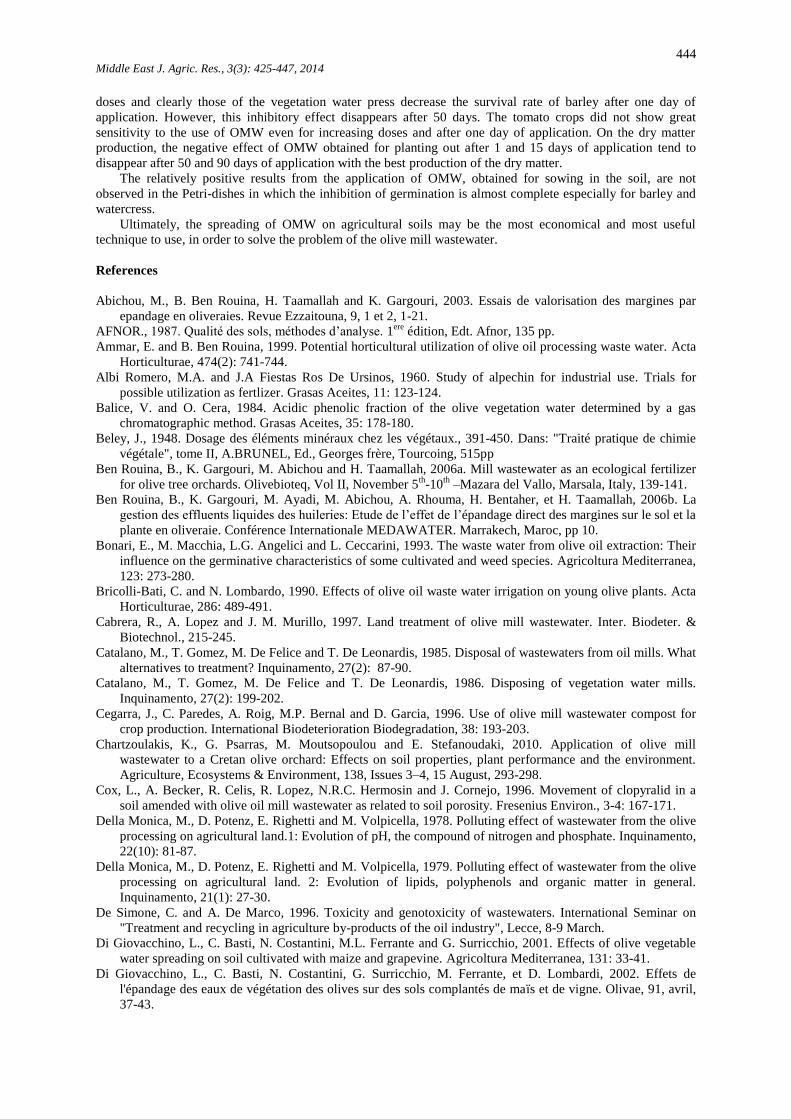
Effect of OMW on the germination index:
The magnitude of phytotoxicity can be determined indirectly by reducing the phytotoxicity germination
when the index rises. For barley and watercress (Figure 15a), the index of germination is nil for all dilutions.
The seeds of these plants have not germinated in solutions of vegetation water. The inhibition of germination is
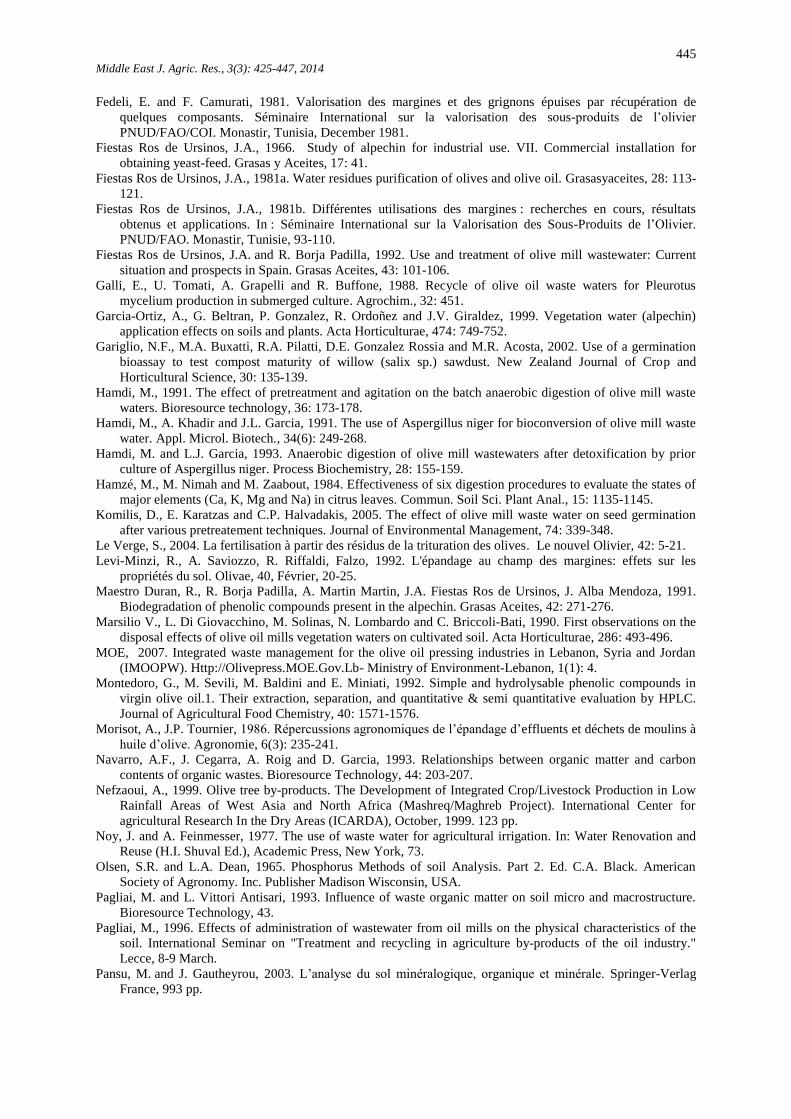
complete. Both types of plants are considered sensitive and detect direct phytotoxicity of OMW. For tomato
(Figure 15b), after seven days, the germination index is below the value of 50 % which is the limit that
indicating the absence of phytotoxicity. The inhibitory effect is noticeable for all solutions. After 9 days, the
inhibitory effect is diminished especially for the OMW from C3Ph and for dilutions ranging from 10 to 25%. As
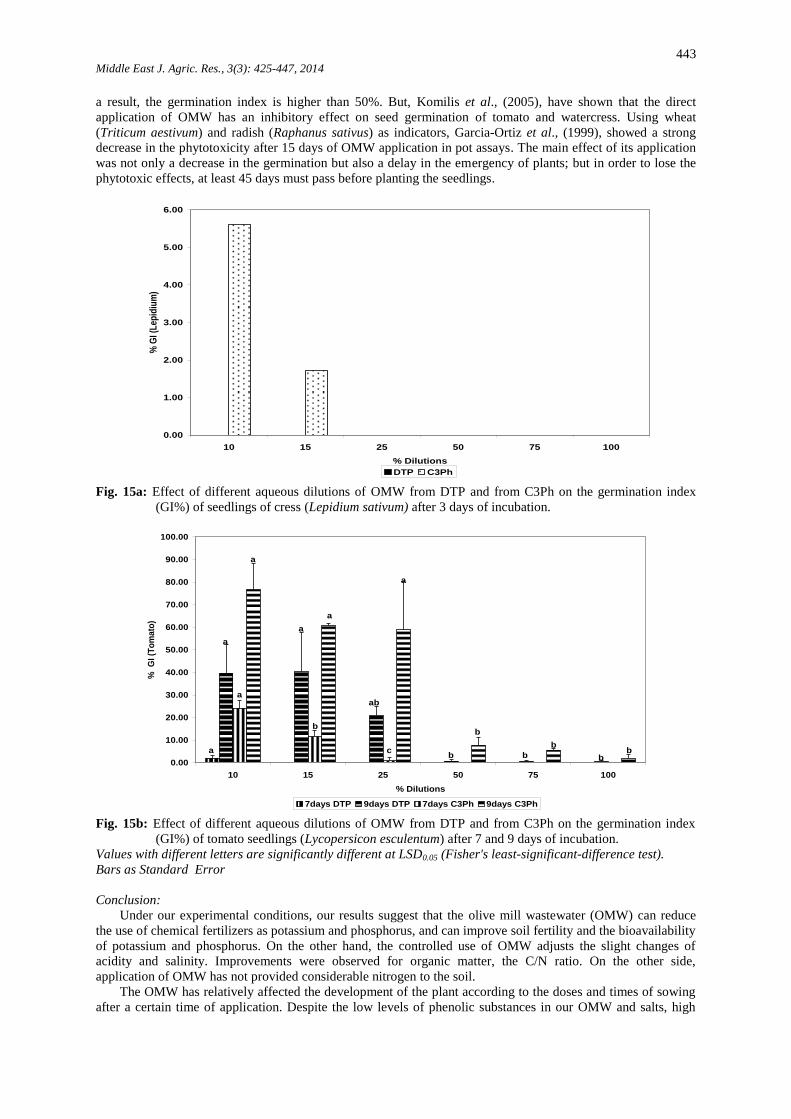
443 Middle East J. Agric. Res., 3(3): 425-447, 2014
a result, the germination index is higher than 50%. But, Komilis et al., (2005), have shown that the direct
application of OMW has an inhibitory effect on seed germination of tomato and watercress. Using wheat
(Triticum aestivum) and radish (Raphanus sativus) as indicators, Garcia-Ortiz et al., (1999), showed a strong
decrease in the phytotoxicity after 15 days of OMW application in pot assays. The main effect of its application
was not only a decrease in the germination but also a delay in the emergency of plants; but in order to lose the
phytotoxic effects, at least 45 days must pass before planting the seedlings.
0.00
1.00
2.00
3.00
4.00
5.00
6.00
10 15 25 50 75 100
% Dilutions
% G
I (L
epid
ium
)
DTP C3Ph
Fig. 15a: Effect of different aqueous dilutions of OMW from DTP and from C3Ph on the germination index
(GI%) of seedlings of cress (Lepidium sativum) after 3 days of incubation.
0.00
10.00
20.00
30.00
40.00
50.00
60.00
70.00
80.00
90.00
100.00
10 15 25 50 75 100
% Dilutions
%
GI
(To
ma
to)
7days DTP 9days DTP 7days C3Ph 9days C3Ph
a
b
a
a
b b b
ab
a
a
a bb
b
a
c
Fig. 15b: Effect of different aqueous dilutions of OMW from DTP and from C3Ph on the germination index
(GI%) of tomato seedlings (Lycopersicon esculentum) after 7 and 9 days of incubation.
Values with different letters are significantly different at LSD0.05 (Fisher's least-significant-difference test).
Bars as Standard Error
Conclusion:
Under our experimental conditions, our results suggest that the olive mill wastewater (OMW) can reduce
the use of chemical fertilizers as potassium and phosphorus, and can improve soil fertility and the bioavailability
of potassium and phosphorus. On the other hand, the controlled use of OMW adjusts the slight changes of
acidity and salinity. Improvements were observed for organic matter, the C/N ratio. On the other side,
application of OMW has not provided considerable nitrogen to the soil.
The OMW has relatively affected the development of the plant according to the doses and times of sowing
after a certain time of application. Despite the low levels of phenolic substances in our OMW and salts, high
444 Middle East J. Agric. Res., 3(3): 425-447, 2014
doses and clearly those of the vegetation water press decrease the survival rate of barley after one day of
application. However, this inhibitory effect disappears after 50 days. The tomato crops did not show great
sensitivity to the use of OMW even for increasing doses and after one day of application. On the dry matter
production, the negative effect of OMW obtained for planting out after 1 and 15 days of application tend to
disappear after 50 and 90 days of application with the best production of the dry matter.
The relatively positive results from the application of OMW, obtained for sowing in the soil, are not
observed in the Petri-dishes in which the inhibition of germination is almost complete especially for barley and
watercress.
Ultimately, the spreading of OMW on agricultural soils may be the most economical and most useful
technique to use, in order to solve the problem of the olive mill wastewater.
References
Abichou, M., B. Ben Rouina, H. Taamallah and K. Gargouri, 2003. Essais de valorisation des margines par
epandage en oliveraies. Revue Ezzaitouna, 9, 1 et 2, 1-21.
AFNOR., 1987. Qualité des sols, méthodes d’analyse. 1ere
édition, Edt. Afnor, 135 pp.
Ammar, E. and B. Ben Rouina, 1999. Potential horticultural utilization of olive oil processing waste water. Acta
Horticulturae, 474(2): 741-744.
Albi Romero, M.A. and J.A Fiestas Ros De Ursinos, 1960. Study of alpechin for industrial use. Trials for
possible utilization as fertlizer. Grasas Aceites, 11: 123-124.
Balice, V. and O. Cera, 1984. Acidic phenolic fraction of the olive vegetation water determined by a gas
chromatographic method. Grasas Aceites, 35: 178-180.
Beley, J., 1948. Dosage des éléments minéraux chez les végétaux., 391-450. Dans: "Traité pratique de chimie
végétale", tome II, A.BRUNEL, Ed., Georges frère, Tourcoing, 515pp
Ben Rouina, B., K. Gargouri, M. Abichou and H. Taamallah, 2006a. Mill wastewater as an ecological fertilizer
for olive tree orchards. Olivebioteq, Vol II, November 5th
-10th
–Mazara del Vallo, Marsala, Italy, 139-141.
Ben Rouina, B., K. Gargouri, M. Ayadi, M. Abichou, A. Rhouma, H. Bentaher, et H. Taamallah, 2006b. La
gestion des effluents liquides des huileries: Etude de l’effet de l’épandage direct des margines sur le sol et la
plante en oliveraie. Conférence Internationale MEDAWATER. Marrakech, Maroc, pp 10.
Bonari, E., M. Macchia, L.G. Angelici and L. Ceccarini, 1993. The waste water from olive oil extraction: Their
influence on the germinative characteristics of some cultivated and weed species. Agricoltura Mediterranea,
123: 273-280.
Bricolli-Bati, C. and N. Lombardo, 1990. Effects of olive oil waste water irrigation on young olive plants. Acta
Horticulturae, 286: 489-491.
Cabrera, R., A. Lopez and J. M. Murillo, 1997. Land treatment of olive mill wastewater. Inter. Biodeter. &
Biotechnol., 215-245.
Catalano, M., T. Gomez, M. De Felice and T. De Leonardis, 1985. Disposal of wastewaters from oil mills. What
alternatives to treatment? Inquinamento, 27(2): 87-90.
Catalano, M., T. Gomez, M. De Felice and T. De Leonardis, 1986. Disposing of vegetation water mills.
Inquinamento, 27(2): 199-202.
Cegarra, J., C. Paredes, A. Roig, M.P. Bernal and D. Garcia, 1996. Use of olive mill wastewater compost for
crop production. International Biodeterioration Biodegradation, 38: 193-203.
Chartzoulakis, K., G. Psarras, M. Moutsopoulou and E. Stefanoudaki, 2010. Application of olive mill
wastewater to a Cretan olive orchard: Effects on soil properties, plant performance and the environment.
Agriculture, Ecosystems & Environment, 138, Issues 3–4, 15 August, 293-298.
Cox, L., A. Becker, R. Celis, R. Lopez, N.R.C. Hermosin and J. Cornejo, 1996. Movement of clopyralid in a
soil amended with olive oil mill wastewater as related to soil porosity. Fresenius Environ., 3-4: 167-171.
Della Monica, M., D. Potenz, E. Righetti and M. Volpicella, 1978. Polluting effect of wastewater from the olive
processing on agricultural land.1: Evolution of pH, the compound of nitrogen and phosphate. Inquinamento,
22(10): 81-87.
Della Monica, M., D. Potenz, E. Righetti and M. Volpicella, 1979. Polluting effect of wastewater from the olive
processing on agricultural land. 2: Evolution of lipids, polyphenols and organic matter in general.
Inquinamento, 21(1): 27-30.
De Simone, C. and A. De Marco, 1996. Toxicity and genotoxicity of wastewaters. International Seminar on
"Treatment and recycling in agriculture by-products of the oil industry", Lecce, 8-9 March.
Di Giovacchino, L., C. Basti, N. Costantini, M.L. Ferrante and G. Surricchio, 2001. Effects of olive vegetable
water spreading on soil cultivated with maize and grapevine. Agricoltura Mediterranea, 131: 33-41.
Di Giovacchino, L., C. Basti, N. Costantini, G. Surricchio, M. Ferrante, et D. Lombardi, 2002. Effets de
l'épandage des eaux de végétation des olives sur des sols complantés de maїs et de vigne. Olivae, 91, avril,
37-43.
445 Middle East J. Agric. Res., 3(3): 425-447, 2014
Fedeli, E. and F. Camurati, 1981. Valorisation des margines et des grignons épuises par récupération de
quelques composants. Séminaire International sur la valorisation des sous-produits de l’olivier
PNUD/FAO/COI. Monastir, Tunisia, December 1981.
Fiestas Ros de Ursinos, J.A., 1966. Study of alpechin for industrial use. VII. Commercial installation for
obtaining yeast-feed. Grasas y Aceites, 17: 41.
Fiestas Ros de Ursinos, J.A., 1981a. Water residues purification of olives and olive oil. Grasasyaceites, 28: 113-
121.
Fiestas Ros de Ursinos, J.A., 1981b. Différentes utilisations des margines : recherches en cours, résultats
obtenus et applications. In : Séminaire International sur la Valorisation des Sous-Produits de l’Olivier.
PNUD/FAO. Monastir, Tunisie, 93-110.
Fiestas Ros de Ursinos, J.A. and R. Borja Padilla, 1992. Use and treatment of olive mill wastewater: Current
situation and prospects in Spain. Grasas Aceites, 43: 101-106.
Galli, E., U. Tomati, A. Grapelli and R. Buffone, 1988. Recycle of olive oil waste waters for Pleurotus
mycelium production in submerged culture. Agrochim., 32: 451.
Garcia-Ortiz, A., G. Beltran, P. Gonzalez, R. Ordoñez and J.V. Giraldez, 1999. Vegetation water (alpechin)
application effects on soils and plants. Acta Horticulturae, 474: 749-752.
Gariglio, N.F., M.A. Buxatti, R.A. Pilatti, D.E. Gonzalez Rossia and M.R. Acosta, 2002. Use of a germination
bioassay to test compost maturity of willow (salix sp.) sawdust. New Zealand Journal of Crop and
Horticultural Science, 30: 135-139.
Hamdi, M., 1991. The effect of pretreatment and agitation on the batch anaerobic digestion of olive mill waste
waters. Bioresource technology, 36: 173-178.
Hamdi, M., A. Khadir and J.L. Garcia, 1991. The use of Aspergillus niger for bioconversion of olive mill waste
water. Appl. Microl. Biotech., 34(6): 249-268.
Hamdi, M. and L.J. Garcia, 1993. Anaerobic digestion of olive mill wastewaters after detoxification by prior
culture of Aspergillus niger. Process Biochemistry, 28: 155-159.
Hamzé, M., M. Nimah and M. Zaabout, 1984. Effectiveness of six digestion procedures to evaluate the states of
major elements (Ca, K, Mg and Na) in citrus leaves. Commun. Soil Sci. Plant Anal., 15: 1135-1145.
Komilis, D., E. Karatzas and C.P. Halvadakis, 2005. The effect of olive mill waste water on seed germination
after various pretreatement techniques. Journal of Environmental Management, 74: 339-348.
Le Verge, S., 2004. La fertilisation à partir des résidus de la trituration des olives. Le nouvel Olivier, 42: 5-21.
Levi-Minzi, R., A. Saviozzo, R. Riffaldi, Falzo, 1992. L'épandage au champ des margines: effets sur les
propriétés du sol. Olivae, 40, Février, 20-25.
Maestro Duran, R., R. Borja Padilla, A. Martin Martin, J.A. Fiestas Ros de Ursinos, J. Alba Mendoza, 1991.
Biodegradation of phenolic compounds present in the alpechin. Grasas Aceites, 42: 271-276.
Marsilio V., L. Di Giovacchino, M. Solinas, N. Lombardo and C. Briccoli-Bati, 1990. First observations on the
disposal effects of olive oil mills vegetation waters on cultivated soil. Acta Horticulturae, 286: 493-496.
MOE, 2007. Integrated waste management for the olive oil pressing industries in Lebanon, Syria and Jordan
(IMOOPW). Http://Olivepress.MOE.Gov.Lb- Ministry of Environment-Lebanon, 1(1): 4.
Montedoro, G., M. Sevili, M. Baldini and E. Miniati, 1992. Simple and hydrolysable phenolic compounds in
virgin olive oil.1. Their extraction, separation, and quantitative & semi quantitative evaluation by HPLC.
Journal of Agricultural Food Chemistry, 40: 1571-1576.
Morisot, A., J.P. Tournier, 1986. Répercussions agronomiques de l’épandage d’effluents et déchets de moulins à
huile d’olive. Agronomie, 6(3): 235-241.
Navarro, A.F., J. Cegarra, A. Roig and D. Garcia, 1993. Relationships between organic matter and carbon
contents of organic wastes. Bioresource Technology, 44: 203-207.
Nefzaoui, A., 1999. Olive tree by-products. The Development of Integrated Crop/Livestock Production in Low
Rainfall Areas of West Asia and North Africa (Mashreq/Maghreb Project). International Center for
agricultural Research In the Dry Areas (ICARDA), October, 1999. 123 pp.
Noy, J. and A. Feinmesser, 1977. The use of waste water for agricultural irrigation. In: Water Renovation and
Reuse (H.I. Shuval Ed.), Academic Press, New York, 73.
Olsen, S.R. and L.A. Dean, 1965. Phosphorus Methods of soil Analysis. Part 2. Ed. C.A. Black. American
Society of Agronomy. Inc. Publisher Madison Wisconsin, USA.
Pagliai, M. and L. Vittori Antisari, 1993. Influence of waste organic matter on soil micro and macrostructure.
Bioresource Technology, 43.
Pagliai, M., 1996. Effects of administration of wastewater from oil mills on the physical characteristics of the
soil. International Seminar on "Treatment and recycling in agriculture by-products of the oil industry."
Lecce, 8-9 March.
Pansu, M. and J. Gautheyrou, 2003. L’analyse du sol minéralogique, organique et minérale. Springer-Verlag
France, 993 pp.
446 Middle East J. Agric. Res., 3(3): 425-447, 2014
Paredes, C., J. Cegarra, J. Roig, M.A. Sanchez-Monedero and M.P. Bernal, 1999. Characterization of olive mill
wastewater (alpechin) and its sludge for agricultural purposes. Bioresource Technology, 67: 111-115.
Pauwels, J.M., E. Van Rust, M. Verloo and Z.E. Mvoudo, 1992. Manuel de laboratoire de pédologie : Méthodes
d’analyses des sols et des plantes. Publications Agricoles, 28: 265.
Pérez, J.D., E. Esteban, M. Gomez and F. Gallardo-Lara, 1986. Effects of waste water from olive processing on
seed germination and early plant growth of different vegetable species. J. Environ. Sci. Health, Part B, 21:
349-357.
Pérez, J., T. de la Rubia, J. Moreno and J. Martinez, 1992. Phenolic content and antibacterial activity of olive oil
waste waters. Environ. Toxicol. Chem., 11: 489-495.
Potenz, D., E. Righetti, A. Bellettieri, F. Girardi, P. Antonacci, L.A. Calianno and G. Pergolese, 1985. Evolution
of phytotoxicity in a soil treated with sewage mills. 2. Application of the test "Germination of Lepidium
sativum" and comparative study of some chemical and physico-chemical parameters. Inquin., 29: 49.
Ranalli, A., 1991. L'effluent des huileries d'olive: Propositions en vue de son utilisation et de son épuration.
Références aux normes italiennes en la matière. Iere
partie, Olivae, 37: 30-39.
Rinaldi, M., G. Rana and M. Introna, 2003. Olive-mill wastewater spreading in southern Italy, effects on a
durum wheat crop. Field Crop Res., 84: 319-326.
Rodier, J., 1996. L’analyse de l’eau, eaux naturelles, eaux résiduaires, eau de mer. 8ème
édition, DUNOD, 1384
pp.
Rowell, D.L., 1995. Soil Science: methods and applications. Longman Scientific & Technical. 329 pp.
Rozzi, A. and F. Malpei, 1996. Treatment and disposal of olive mill effluents. International Biodeterioration
Biodegradation, 38: 135-144.
Ryan, J., S. Garabet, K. Harmsen and A. Rashid, 1996- A Soil and Plant Analysis Manual Adapted for the West
Asia and North Africa Region. International Center for Agricultural Research in the Dry Areas (ICARDA),
Aleppo, Syria, 140pp.
Sayadi, S. and R. Ellouz, 1993. Screening of white rot fungi for the treatment of olive mill wastewaters. J.
Chem. Tech. Biotechnol., 57: 141-146.
Sayadi, S. and R. Ellouz, 1995. Roles of lignin peroxidase and manganese peroxidase from Phanerochaete
chrysosporium in the decoloration of olive mill wastewaters. Appl. Environ. Microbiol., 60: 1098-1103.
Schollenberger, C.J. and R.H. Simon, 1945. Determination of exchange capacity and exchangeable bases in soil-
ammonium acetate method. Soil Sci., 59: 13-24.
Seferoglu, S., G. Aydin and M. Aydin, 2000. Effects of vegetation water of oil mills on some physical and
chemical characteristics of soils. In “Proceedings of International Symposium on desertification” Konya,
Turkey, 13-17 June 2000, 247-251.
Shashi, S.R., E. Hidekazu, S. Kazunori and I. Kazuyuki, 1998. Stabilization of chemical and biochemical
characteristics of grass straw and leaf mix during in-vessel composting with and without seeding material.
Soil Sci. Plant Nutr., 44(4): 485-495.
Statistical Analysis System, 2004. Stat Software, SAS Institute Inc., Cary, North Carolina, USA.
Tam, M.N.F.Y. and Y.S. Wong, 1996. Retention of wastewater-borne nitrogen and phosphorus in mangrove
soils. Environ. Technol., 117: 851-859.
Tamburino, V., S.M. Zimbone and P. Quattrone, 1999. Storage and land application of olive-oil wastewater.
(Accumulation et écoulement des margines par épandage sur le sol agricole.) Olivae, 76: 36-45.
Tandon, HLS., 1998. Methods of Analysis of Soils, Plants, Waters and Fertilizers. Tandon HLS (Ed.). Fertiliser
Development and Consultation Organisation, New Delhi, India, 144pp.
Tomati, U., E. Gaslli and A. Grappelli, 1987. Prospects for the purification of waste water from oil mills. L’Inf.
Agr., 48: 73.
Tomati, U., 2001. Programma Nazionale di Ricerca sui Reflui del Sistema Agricolo-Industriale, Sottoprogretto
Reflui Oleari. Stato dell’arte sul problema dell’utilizzanione dei reflui oleari. (National Research Program
on Agricultural and Industrial Wastewater System, Wastewater from oil mills. State of the art on the
problem of utilization of oil mill wastes.) Http://users. Unimi.it/~fsangio/cnr/olio1.htm.
Vazquez Roncero, A., E. Graciani Constante and R. Maestro Duran, 1974. Components olive phenolics. I-pulp
Polyphenols. Grasas y Aceite, 25: 269-279.
Walkley, A.J. and C.A. Black, 1934. Estimation of soil organic carbon by the chromic acid titration method.
Soil Sci., 37: 29-38.
Zenjari, B., M. Hafidi, I. El Hadrami, J.R. Bailly and A. Nejmeddine, 1999. Traitement aérobie des effluents
d’huileries par les micro-organismes du sol. Agrochimica, XLIII: 276-285.
Zenjari, B. and A. Nejmeddine, 2001. Impact of spreading olive mill wastewater on soil characteristics:
laboratory experiments. Agronomie, 21: 749-755.
Zucconi, F., M. Pera, M. Forte and M. De Bertoldi, 1981. Evaluating toxicity of immature compost. Biocycle,
22: 54-57.

447 Middle East J. Agric. Res., 3(3): 425-447, 2014
Zucconi, F., A. Monaco, M. Forte and M. De Bertoldi, 1985. Phytotoxins during the stabilization of organic
matter. In : Grasser, J.K.R. ed. Composting of agricultural and other wastes. Elsevier Applied Science
Publishers, London, 73-86.