effects of orthographic, phonologic, and semantic information...
TRANSCRIPT

Effects of Orthographic, Phonologic, and Semantic Information Sources on Visual and Auditory
Lexical Decision
by
Stephanie Michelle Nixon
BA University of North Texas, 1997
MS, Arizona State University, 1999
Submitted to the Graduate Faculty of
School of Health and Rehabilitation Sciences in partial fulfillment
of the requirements for the degree of
Doctor of Philosophy
University of Pittsburgh
2006

UNIVERSITY OF PITTSBURGH
HEALTH AND REHABILITATION SCIENCES
This dissertation was presented
by
Stephanie Michelle Nixon
It was defended on
April 24, 2006
and approved by
Malcolm McNeil, PhD, Chairman and Professor
Sheila Pratt, PhD, Assistant Professor
Thomas F. Campbell, PhD, Professor
Connie A. Tompkins, PhD, Professor
David Plaut, PhD, Professor, Departments of Psychology and Computer Science Carnegie Mellon University
Christine A. Dollaghan, PhD, Professor
Dissertation Director
ii

EFFECTS OF ORTHOGRAPHIC, PHONOLOGIC, AND SEMANTIC INFORMATION SOURCES ON VISUAL AND AUDITORY LEXICAL DECISION
Stephanie Michelle Nixon, PhD
University of Pittsburgh, 2006
The present study was designed to compare lexical decision latencies in visual and auditory
modalities to three word types: (a) words that are inconsistent with two information sources,
orthography and semantics (i.e., heterographic homophones such as bite/byte), (b) words that are
inconsistent with one information source, semantics (i.e., homographic homophones such as bat),
and (c) control words that are not inconsistent with any information source. Participants (N =
76) were randomly assigned to either the visual or auditory condition in which they judged the
lexical status (word or nonword) of 180 words (60 heterographic homophones, 60 homographic
homophones, and 60 control words) and 180 pronounceable nonsense word foils. Results
differed significantly in the visual and auditory modalities. In visual lexical decision,
homographic homophones were responded to faster than heterographic homophones or control
words, which did not differ significantly. In auditory lexical decision, both homographic
homophones and heterographic homophones were responded to faster than control words.
Results are used to propose potential modifications to the Cooperative Division of Labor Model
of Word Recognition (Harm & Seidenberg, 2004) to enable it to encompass both the visual and
auditory modalities and account for the present results.
iii

TABLE OF CONTENTS PREFACE...................................................................................................................................... ix 1. Introduction............................................................................................................................. 1
1.1. Characteristics of Models of Word Recognition ............................................................ 2 1.2. Interactive Models of Word Recognition ....................................................................... 4
1.2.1. Influences on the Speed of Coherence.................................................................... 8 1.3. Single-Source Inconsistencies ...................................................................................... 11
1.3.1. Phonology and Orthography................................................................................. 11 1.3.2. Phonology and Semantics ..................................................................................... 12 1.3.3. Analyses of Stimuli in Previous Lexical Decision Studies................................... 16
1.4. Comparing Visual and Auditory Processing................................................................. 20 2. Purpose.................................................................................................................................. 21 3. Methods................................................................................................................................. 22
3.1. Participants.................................................................................................................... 22 3.2. Stimuli........................................................................................................................... 23
3.2.1. Internet Frequency Estimates of Semantic Representations................................. 25 3.2.2. Internet Estimates of Semantic Dominance for Heterographic Homophones and Homographic Homophones .................................................................................................. 26 3.2.3. Final Stimulus Word Lists .................................................................................... 27
3.2.3.1. Creating the Auditory Stimuli....................................................................... 27 3.2.3.2. Descriptive Characteristics of the Stimulus Words ...................................... 28
3.3. Procedures..................................................................................................................... 29 4. Statistical Analyses ............................................................................................................... 32 5. Results................................................................................................................................... 33
5.1. Exclusions ..................................................................................................................... 33 5.2. Primary Analyses .......................................................................................................... 35 5.3. Covariate Analyses ....................................................................................................... 37 5.4. Additional Analyses...................................................................................................... 40
6. Discussion............................................................................................................................. 42 6.1. Orthographic, Phonologic, and Semantic Influences on Visual and Auditory Lexical Decision .................................................................................................................................... 43 6.2. Modifying the Cooperative Division of Labor Model of Word Recognition............... 44 6.3. Limitations .................................................................................................................... 49 6.4. Directions for Future Research ..................................................................................... 52
APPENDIX A............................................................................................................................... 55 Models of Word Recognition.................................................................................................... 55
APPENDIX B ............................................................................................................................... 81 Word Recognition Models and Influences on Word Recognition............................................ 81
APPENDIX C ............................................................................................................................... 85 Background History Form ........................................................................................................ 85
iv

APPENDIX D............................................................................................................................... 87 Directions for Selecting Words to Obtain Semantic Representation Frequency Estimates ..... 87
APPENDIX E ............................................................................................................................... 91 Word Stimuli............................................................................................................................. 91
APPENDIX F.............................................................................................................................. 120 Reliability and Validity of Semantic Representation Frequency Estimates ........................... 120
APPENDIX G............................................................................................................................. 126 Nonword Stimuli..................................................................................................................... 126
APPENDIX H............................................................................................................................. 132 Directions to Participants........................................................................................................ 132
APPENDIX I .............................................................................................................................. 134 Covariate Data ........................................................................................................................ 134
APPENDIX J .............................................................................................................................. 137 Item Accuracy Outliers Removed........................................................................................... 137
APPENDIX K............................................................................................................................. 141 Exploratory Analyses: Morphologically Different Heterographic homophones Removed ... 141
BIBLIOGRAPHY....................................................................................................................... 144
v

LIST OF TABLES
Table 1. Summary of Lexical Decision Studies Manipulating Phonology-to-orthography
Inconsistency by Modality.................................................................................................... 13 Table 2. Summary of Lexical Decision Studies Manipulating Phonology-to-semantics
Inconsistency by Modality.................................................................................................... 15 Table 3. Percentage of Control Words with Alternate Classifications from Several
Heterographic Homophone Visual Lexical Decision Studies .............................................. 16 Table 4. Percentage of Heterographic Homophones with Alternate Classifications from Several
Heterographic HomophoneVisual Lexical Decision Studies ............................................... 17 Table 5. Percentage of Control Words with Alternate Classification from Several Homographic
Homophone/Polysemous Word Lexical Decision Studies ................................................... 17 Table 6. Percentage of Homographic Homophones/Polysemous Words with Alternate
Classifications from Several Homographic Homophone/Polysemous word Lexical Decision Studies................................................................................................................................... 18
Table 7. Group Differences for Age and Level of Completed Education ................................... 23 Table 8. Characteristics of Heterographic homophone, Homographic homophone, and Control
Word Stimuli......................................................................................................................... 29 Table 9. Number of participants excluded by criteria.................................................................. 33 Table 10. Total Number of Lexical Decision Latency Outliers across Participants and
Descriptive Statistics............................................................................................................. 34 Table 11. Total Number of Inaccurate Lexical Decisions across Participants and Descriptive
Statistics ................................................................................................................................ 34 Table 12. Lexical Decision Latencies by Participants and Items as a Function of Word Type and
Modality................................................................................................................................ 35 Table 13. Analysis of Variance Results for Lexical Decision Latencies by Participants and Items
............................................................................................................................................... 35 Table 14. Analysis of Variance Results for Visual Lexical Decision Latencies by Participants
and Items............................................................................................................................... 36 Table 15. Analysis of Variance results for Auditory Lexical Decision Latencies by Participants
and Items............................................................................................................................... 36 Table 16. Visual Lexical Decision Latencies as a Function of Word Type ................................ 36 Table 17. Auditory Lexical Decision Latencies as a Function of Word Type ............................ 37 Table 18. Correlations (rs) between Item Characteristics and Lexical Decision Latencies......... 38 Table 19. Correlations (rs) between Item Characteristics and Visual Lexical Decision Latencies
............................................................................................................................................... 38 Table 20. Correlations (rs) between Item Characteristics and Auditory Lexical Decision
Latencies ............................................................................................................................... 38 Table 21. Item Accuracy Outliers by Modality and Word Type with Accuracy and SDs below
Mean ..................................................................................................................................... 40 Table 22. Correlations between Semantic Representation Frequency Estimates and Objective
Frequency Measures ........................................................................................................... 123 Table 23. Lexical Decision Latencies Adjusted on the Covariates Acoustic Duration and
Semantic Representation Frequency Estimate.................................................................... 135
vi

Table 24. ANCOVA Results Adjusted for the Covariates Acoustic Duration and Semantic Representation Frequency Estimate.................................................................................... 135
Table 25. Visual Lexical Decision Latencies Adjusted on the Covariates Acoustic Duration and Semantic Representation Frequency Estimates .................................................................. 136
Table 26. Auditory Lexical Decision Latencies Adjusted on the Covariates Acoustic Duration and Semantic Representation Frequency Estimates ........................................................... 136
Table 27. One-Way ANCOVAs on Visual Lexical Decision Latencies Adjusted for the Covariates Acoustic Duration and Semantic Representation Frequency Estimate (n = 180)............................................................................................................................................. 136
Table 28. One-Way ANCOVAs on Auditory Lexical Decision Latencies Adjusted for the Covariates Acoustic Duration and Semantic Representation Frequency Estimate (n = 180)............................................................................................................................................. 136
Table 29. Descriptive Statistics by Participants and Items as a Function of Word Type and Modality.............................................................................................................................. 139
Table 30. Visual Lexical Decision Latencies as a Function of Word Type with Item Accuracy Outliers Excluded................................................................................................................ 140
Table 31. Auditory Lexical Decision Latencies as a Function of Word Type with Item Accuracy Outliers Excluded................................................................................................................ 140
Table 32. Lexical Decision Latencies with Morphologically Heterographic Homophones Excluded ............................................................................................................................. 142
Table 33. Visual Lexical Decision Latencies with Morphologically Different Heterographic Homophones Excluded ....................................................................................................... 143
Table 34. Auditory Lexical Decision Latencies with Morphologically Different Heterographic Homophones Excluded ....................................................................................................... 143
vii

LIST OF FIGURES
Figure 1. Interactive framework applied to visual word recognition............................................. 5 Figure 2. Interactive framework applied to spoken word recognition........................................... 6 Figure 3. Mean visual lexical decision latencies by word type, with and without covariates (AD
= Acoustic Duration; SemFrq = Semantic Representation Frequency Estimate)................. 39 Figure 4. Mean auditory lexical decision latencies by word type, with and without covariates
(AD = Acoustic Duration; SemFrq = Semantic Representation Frequency Estimate)......... 39 Figure 5. Figure of model from Harm and Seidenberg (2004). The authors eventually added
feedback from semantics to orthography to allow "spelling verification". .......................... 47 Figure 6. Connection strengths for visual word recognition in the extended Cooperative Division
of Labor Model. .................................................................................................................... 48 Figure 7. Connection strengths for spoken word recognition in the extended Cooperative
Division of Labor Model. ..................................................................................................... 48
viii

PREFACE
This dissertation is dedicated to Raymond G. Daniloff, PhD and to James Case, PhD. Daniloff, without your inspiration and support, I never would have considered doctoral studies. You inspired me and stuck by me. I know that you have been with me in spirit, pushing me forward, and providing emotional support, just as you did in life. Jim, you are the epitome of The Giving Tree. Your emails about life and my degree provided inspiration and peace. Thank you both for always believing in me. I miss you both and hope you can read this from the heavens.
I have been fortunate to be surrounded by incredible people who provided me with tools to overcome obstacles. Without their support, I would not have gone beyond my high school degree. I must thank my mother, Deborah Sarah Satterfield Nixon, my father, John Daniel Nixon, my sister Christen Leigh Nixon, and my step-mother, Arlene F. Nixon for their love and support throughout this educational process. Thank you for being there. My maternal grandparents were always there to encourage me: Ruth Lasater Satterfield (deceased, Thanksgiving Day 1996) and Robert Beeler Satterfield, PhD (deceased, December 2005) as well as my paternal grandparents, Eunice Rosella Nixon (deceased, September 5, 2005) and John Daniel Nixon (deceased, 1/1995). Aunt Rachael (Chapman; Knoxville, TN) as soon as I finish, I really am coming to visit – and not for a drive through! Thanks for the ear and room during my drives to and from Texas.
My friends have been essential throughout my educational career: They have been understanding when I could not go out secondary to writing and even taken the time to listen to my incessant babblings about the papers and projects I have written. There were also those at Pittsburgh who were with me throughout the dissertation, Heather’s voice, Stacey’s ear, Jill’s “google”, my co-workers at the Institute of Education Sciences (IES), and the many students who participated in my studies.
Leonard L. LaPointe, PhD (aka, L3 and Chick), thank you for your mentorship during my master’s at Arizona State University and for continuing to advise me after I went to Pitt for the doctorate. I hope to impact others the way you have me. Other faculty members from Arizona State University have continued encouraging me: M. Jeanne Wilcox, PhD and Jean Brown, PhD.
At the University of Pittsburgh many faculty members and post-doctoral fellows provided me with the resources to complete this study and degree: Thomas F. Campbell, PhD, Malcolm R. McNeil, PhD, David Plaut, PhD, Sheila Pratt, PhD, Connie A. Tompkins, PhD, Michael Harm, PhD, Charles Perfetti, PhD, David Klahr, PhD, Erik Reichle, PhD and more. I appreciated the opportunities to study with each of you and with the faculty from Carnegie Mellon.
Thank you Barbara (Barbara R. Foorman, PhD; University of Texas Health Sciences Center – Houston) and employees of the Executive Branch on the Education and Workforce Development Subcommittee. Thank you also to all the employees (particularly Peggy McCardle and Dan Berch) of the Child Development and Behavior Branch of NICHD (NIH) for the new position!
Last but definitely not least, I thank Christine A. Dollaghan, PhD for advising me through the many projects I have undertaken including this dissertation. Thank you for affording me the means to pursue my dreams and shaping me into a more objective researcher. With your guidance, I have developed a program of research that provides a framework for my career.
ix
1. Introduction
The orthographic, phonologic, and semantic characteristics of words are among the
information sources that can influence word recognition. For many words in English, the
relationship among these information sources is consistent. That is, a word’s orthographic
pattern maps to a single phonologic pattern which in turn maps to a single semantic pattern.
However, for some words the relationships among orthography, phonology, and semantics are
inconsistent. Inconsistency exists when a single pattern in one information source (e.g., the
orthographic body –ow) maps to more than one pattern in another information source (e.g., the
phonologic rimes /o[/ and /e[/).
The influence of inconsistency among orthographic, phonologic, and semantic
information sources on word recognition has been investigated by manipulating inconsistency in
various modalities (i.e., auditory or visual) and conditions (e.g., semantic decision, lexical
decision, etc.). However, past research has focused on inconsistencies arising from a single
information source, even if multiple inconsistencies may have existed with other information
sources. For example, Holden (2002) and Pexman and Lupker (1999) studied the influence of
phonology-to-orthography inconsistency on visual lexical decision latencies. Although both
studies manipulated stimuli that were also phonology-to-semantics inconsistent (i.e.,
homophones), this characteristic of the stimuli was not considered a contributing influence. The
present study was designed to contrast the effects of single and multiple sources of orthographic,
phonologic, and semantic inconsistency on word recognition latencies in visual and auditory
lexical decision tasks. We begin with an overview of certain key assumptions of word
recognition models, focusing on models of word recognition described in an interactive
framework, hereafter referred to generally as interactive models (e.g., Harm & Seidenberg, 2004;
1

McClelland & Elman, 1986a, 1986b; Plaut, McClelland, Seidenberg, & Patterson, 1996; Stone &
Van Orden, 1994; Van Orden, Bosman, Goldinger, & Farrar, 1997; Van Orden & Goldinger,
1994; Van Orden, Pennington, & Stone, 1990). We then review the evidence concerning the
influence of single sources of inconsistency on word recognition latencies as well as the
similarities and differences between visual and spoken word recognition, prior to presenting the
plan of the current study.
1.1. Characteristics of Models of Word Recognition
Models of word recognition (e.g., Coltheart, Rastle, Perry, Langdon, & Ziegler, 2001;
Gaskell & Marslen-Wilson, 1997, 2002; Grossberg, 2000; Harm & Seidenberg, 2004; Luce,
Goldinger, Auer, & Vitevitch, 2000; Luce & Pisoni, 1998; Norris, McQueen, & Cutler, 2000a,
2000b; Plaut et al., 1996; Ratcliff, Gomez, & McKoon, 2004; Rodd, Gaskell, & Marslen-Wilson,
2004; Stone & Van Orden, 1994; Zorzi, 2000) vary in their stated and unstated assumptions
about processing directionality (i.e., feedforward and feedback) among orthographic, phonologic,
and semantic information sources, the relevance of each information source to processing, and
the extent to which processing influences are specific to the visual and auditory modalities.1 For
example, some models of word recognition assume a feedforward processing architecture in
which information is processed from stimulus to response in a unidirectional fashion (Rueckl,
2002); indeed, some models overtly reject the possibility of feedback processing (Norris et al.,
2000a, 2000b). Conversely, interactive models, allow both feedforward and feedback processing
connections (e.g., Harm & Seidenberg, 2004; Van Orden, Bosman et al., 1997). In such models,
information is processed interactively between stimulus and response such that information from
subsequent processing operations can feed activation back to the original stimulus information
1 See Appendix A for examples of several models of word recognition. Hyperlinks lead to the section describing each model in this Appendix.
2

and to the intermediate processing stages to influence word recognition (Rueckl, 2002; Stone,
Vanhoy, & Van Orden, 1997). Although the existence of feedback processing influences on
visual or spoken word recognition continues to be debated (for a review, see Montant, 2000;
Norris et al., 2000a, 2000b; Rueckl, 2002; Samuel, 2001; Stone et al., 1997; Tanenhaus,
Magnuson, McMurray, & Aslin, 2000), a number of recent word recognition models assume a
feedback processing architecture (e.g., Grossberg, 2000; Harm & Seidenberg, 2004; Plaut et al.,
1996; Rueckl, 2002; Stone & Van Orden, 1994; Van Orden, Bosman et al., 1997; Van Orden et
al., 1990).
Assumptions about the influence of orthographic, phonologic, and semantic information
sources on word recognition are usually constrained by a model’s focus on either the auditory
modality or the visual modality. Understandably, most spoken word recognition models
emphasize the importance of phonologic and semantic information but rarely address the
potential impact of orthographic information on processing (e.g., Gaskell & Marslen-Wilson,
1997; Grossberg, 2000; Luce et al., 2000). Although activated orthographic information
associated with a spoken word could also feed activation back to phonologic and semantic
information to influence word recognition, few spoken word recognition models have addressed
this possibility and one model, Merge (Norris et al., 2000a, 2000b), explicitly disavows any
influence of orthographic information on spoken word recognition. On the other hand, visual
word recognition models emphasize the importance of orthographic and phonologic information
and although some acknowledge the potential impact of semantic information on processing of
written words (e.g., Coltheart et al., 2001; Kawamoto, Farrar, & Kello, 1994; Plaut et al., 1996;
3

Rodd et al., 2004),2 few studies have examined the concurrent effects of all three information
sources during visual word recognition.
1.2. Interactive Models of Word Recognition
Interactive models of word recognition can easily encompass both visual and spoken
word recognition, particularly those that are fully interactive. Although not overtly addressed in
all interactive models, most interactive models assume that orthographic, phonologic, and
semantic information interact to influence visual and/or spoken word recognition (e.g., Gibbs &
Van Orden, 1998; Gottlob, Goldinger, Stone, & Van Orden, 1999; Harm & Seidenberg, 2004;
Plaut et al., 1996; Stone & Van Orden, 1994; Van Orden, Bosman, et al., 1997; Van Orden et al.,
1990; Van Orden & Goldinger, 1994; Van Orden, Jansen op de Haar, & Bosman, 1997).3
Interactions occur via feedforward and feedback processing among the information sources,
which are represented by nodes or sets of units in the model’s architecture (Appendix A). An
input pattern (written or spoken, word or nonword) initiates parallel feedforward and feedback
activation of the input’s associated orthographic, phonologic, and semantic nodes. The
information source containing nodes with representations most similar to the perceptual
information in the input pattern receives the strongest initial activation and this strong activation
helps focus activation across information sources by providing some boundaries. Activation
oscillates among nodes within information sources and among information sources and is
typically strongest for nodes that activate representations similar to the input pattern. Thus, in
visual word recognition, presenting a letter pattern most strongly activates the orthographic
nodes, and the activated orthographic nodes focus activation of the stimulus’s associated 2 Rodd and colleagues (2004) used only interactivity between orthography and semantics in their model, but this does not preclude interactivity among orthography, phonology, and semantics. 3 Interactive models of word recognition do not always state overtly that they may account for visual and spoken word recognition. However, it is inherent in the assumption of complete interactivity that such models should be able to account for processing in both modalities.
4

phonologic and semantic nodes (Figure 1). Likewise, in spoken word recognition, presenting a
phonologic (i.e., spoken) pattern most strongly activates the phonologic nodes, and the activated
phonologic nodes focus activation of the stimulus’s associated orthographic and semantic nodes
(Figure 2).
Orthographic Nodes
INPUT
Phonologic Nodes
Semantic Nodes
Orthographic Nodes
Orthographic Nodes
INPUT
Phonologic Nodes
Semantic Nodes
INPUTINPUT
Phonologic Nodes
Semantic Nodes
Phonologic Nodes
Semantic Nodes
Phonologic Nodes
Semantic Nodes
Figure 1. Interactive framework applied to visual word recognition.
Line thickness indicates the strength of connections between nodes. Loops back to each information source indicate interactivity among nodes within an information source. Figure adapted from Van Orden, Bosman, and colleagues (1997) and from Van Orden, Jansen op de Haar, and Bosman (1997).
Some interactive models assume that the local relationships or connections between two
information sources (i.e., orthography and phonology, phonology and semantics, and
orthography and semantics) vary in strength. For example, the local relationship between
orthographic and phonologic information is generally assumed to be the strong because it entails
statistical mappings between graphemes and phonemes in which one typically predicts the other
5

with a high degree of accuracy (e.g., the grapheme b overwhelmingly maps to the phoneme /b/;
Gottlob et al., 1999; Van Orden, Bosman et al., 1997). However, factors other than statistical
relationships affect the strengths assumed for local relationships in interactive models. In
general, semantic information is assumed to be activated more strongly by phonologic
information than by orthographic information because spoken language is learned earlier and
used more often than written language (Frost, 1998). Accordingly, the relationship between
orthography and semantics is often assumed to be the weakest of the three local relationships
(e.g., Frost, 1998; Gottlob et al., 1999; Harm & Seidenberg, 2004; Stone & Van Orden, 1994;
Van Orden, Bosman et al., 1997; Van Orden et al., 1990; Van Orden, Jansen op de Haar, &
Bosman, 1997).
Phonologic Nodes
Orthographic Nodes
Semantic Nodes
INPUT
Phonologic Nodes
Orthographic Nodes
Semantic Nodes
Phonologic Nodes
Phonologic Nodes
Orthographic Nodes
Semantic Nodes
Orthographic Nodes
Semantic Nodes
Orthographic Nodes
Semantic Nodes
Orthographic Nodes
Semantic Nodes
Orthographic Nodes
Semantic Nodes
Semantic Nodes
Semantic Nodes
INPUTINPUT
Figure 2. Interactive framework applied to spoken word recognition.
Same general descriptive information applies to this figure as to . Note the different inputs for compared with Figure 2. Figure adopted from Van Orden, Bosman, and colleagues (1997) and from Van Orden, Jansen op de Haar, and Bosman (1997).
Figure 1 Figure 1
In a fully interactive model, the strengths of each local relationship may be interpreted as
modality of input independent (i.e., the same across modalities). For example, in some
6

descriptions of the Resonance Model, the strengths of the local relationships are overtly proposed
to be modality of input independent (e.g., Van Orden, Bosman et al., 1997; Van Orden, Jansen
op de Haar, & Bosman, 1997). That is, the local relationship between orthography and
phonology is proposed to be stronger than the local relationship between phonology and
semantics and the local relationship between orthography and semantics is proposed to be the
weakest of all local relationships for both visual word recognition and spoken word recognition.
This might seem strange for spoken word recognition because accessing orthographic knowledge
is unnecessary when recognizing spoken words; however, the importance of written language
and the extent with which it is used may elevate the importance of the local relationship between
orthography and phonology (e.g., Van Orden et al., 1990; Van Orden, Bosman et al., 1997; Van
Orden, Jansen op de Haar, & Bosman, 1997). An alternate hypothesis is for an interactive model
to allow variable strengths for the local relationships, which are determined by task demands and
modality of input demands. The latter approach would account for processing differences
between modalities without necessitating separate models for each modality. For example, the
local relationship between orthography and phonology may have a stronger role in visual word
recognition than in spoken word recognition because written input should most strongly activate
orthographic information. Likewise, the local relationship between phonology and semantics
may have a stronger role in spoken word recognition than in visual word recognition because
spoken input most strongly activates phonologic information.
Throughout visual and auditory processing, orthographic, phonologic, and semantic
nodes are hypothesized to continuously feed activation forward and backward to each other,
gradually converging on local information matches between activated patterns of nodes (e.g.,
Harm & Seidenberg, 2004; Stone & Van Orden, 1994; Van Orden, Bosman et al., 1997; Van
7

Orden & Goldinger, 1994; Van Orden, Jansen op de Haar, & Bosman, 1997). Local information
matches are mutually reinforced by cycles of feedforward and feedback activation as they
gradually cohere into local resonances between orthographic and phonologic information,
phonologic and semantic information, and orthographic and semantic information. For example,
resonance occurs when only small mismatches, if any, remain between the orthographic nodes
activated by a written stimulus input and the orthographic nodes activated by feedback from
phonologic information. This activation feeds back and forth, oscillating, until achieving
minimal cross-talk (i.e., mismatch), at which point resonance occurs for the local relationship
between orthography and phonology. While local resonances are cohering, the activated patterns
of nodes across all three information sources feed activation forward and backward to each other
until they converge on strong and stable global information matches. In turn, global information
matches are mutually reinforced by cycles of feedforward and feedback activation as they
gradually cohere into global resonance among orthographic, phonologic, and semantic
information that can support responding (Harm & Seidenberg, 2004; Stone & Van Orden, 1994;
Van Orden, Bosman et al., 1997; Van Orden & Goldinger, 1994; Van Orden, Jansen op de Haar,
& Bosman, 1997).
1.2.1. Influences on the Speed of Coherence
Although activation of orthographic, phonologic, and semantic information associated
with an input pattern is assumed to begin in parallel and occur continuously, information
matches can cohere into local resonances at different times. General stimulus characteristics
such as word frequency and neighborhood density, might modulate the speed with which local
and global resonances cohere during word recognition. For example, low frequency words
generally are responded to more slowly than are high frequency words (Balota, Cortese, Sergent-
8

Marshall, Spieler, & Yap, 2004; Brown & Watson, 1987; Dobbs, Friedman, & Lloyd, 1985;
Fiez, Balota, Raichle, & Petersen, 1999; Luce & Pisoni, 1998). A number of other
characteristics of stimulus words have been reported to modulate response latencies in language
processing tasks including age of acquisition (e.g., Brown & Watson, 1987), familiarity (e.g.,
Balota et al., 2004; Lewellen, Goldinger, Pisoni, & Greene, 1993), neighborhood size (e.g., Luce
& Pisoni, 1998; Peereman & Content, 1997; Sears, Hino, & Lupker, 1995; Vitevitch, 2002),
uniqueness point (e.g., Radeau, Morais, Mousty, Saerens, & Bertelson, 1992; Radeau, Mousty, &
Bertelson, 1989), imageability (e.g., Balota et al., 2004; Pecher, 2001), concreteness (e.g., Balota
et al., 2004), acoustic duration (e.g., Luce & Pisoni, 1998), and orthographic length (e.g., Balota
et al., 2004; Whaley, 1978). Some of these phenomena are described in context of the models of
word recognition in Appendix B.
In addition to these general influences, coherence is hypothesized to take longer when
there is inconsistent feedforward and/or inconsistent feedback activation (Gottlob et al., 1999;
Stone & Van Orden, 1994; Van Orden & Goldinger, 1994). Inconsistent activation is created
when one activated pattern in an information source activates more than one pattern in another
information source (Stone et al., 1997). For example, in spoken word recognition, hearing a
word with the phonologic rime pattern /-o[l/ feeds activation to six orthographic body patterns, -
oal, -ol, -ole, -oll, -oul, and –owl. The availability of six orthographic body patterns matching a
single phonologic rime pattern is predicted to delay the match between the phonologic pattern
and a single orthographic pattern, which in turn should slow coherence of the local resonance
between phonology and orthography (Ziegler & Ferrand, 1998). In a fully interactive model,
such local inconsistencies could result in additional inconsistencies as feedforward and feedback
cycles progress (e.g., Van Orden, Bosman et al., 1997; Ventura, Morais, Pattamadilok, &
9

Kolinsky, 2004; Ziegler & Ferrand, 1998; Ziegler, Ferrand, & Montant, 2004). Thus, for
example, in visual word recognition, when a word is presented with the orthographic body
pattern –oal, activation of the matching phonologic rime pattern /-o[l/ should feed activation
back not only to the target but also to the other five possible orthographic bodies, further slowing
coherence of the local resonance between phonology and orthography (Stone et al., 1997).
The effects of inconsistency on visual and spoken word recognition have been primarily
considered with respect to individual information sources (e.g., a single phonologic
representation mapping to more than one orthographic representation). However, an input
pattern could also receive inconsistency from more than one information source, which could
conceivably result in even slower coherence of the global resonance. For example, a
homographic homophone, such as bat, has a single phonologic representation that maps to a
single orthographic representation, but its phonologic and orthographic representations each map
to more than one unrelated semantic representation (e.g., “a flying mammal”, “to wink”, or “to
hit a baseball”; Kellas, Ferraro, & Simpson, 1988; Klein & Murphy, 2001; Klepousniotou, 2002;
Rodd, Gaskell, & Marslen-Wilson, 2002). Therefore, semantics is the only source with
inconsistency for a homographic homophone. By contrast, for heterographic homophones a
single phonologic representation (e.g., /be]t/) maps to more than one orthographic
representation (e.g., bite/byte) as well as to more than one unrelated semantic representation
(Pexman, Lupker, & Reggin, 2002).
Although homographic homophones and heterographic homophones provide an
opportunity to determine whether word recognition latencies are affected by the cumulative
number of inconsistent information sources, no previous word recognition study has contrasted
such stimuli in visual or auditory lexical decision. Instead, previous research, primarily in visual
10

word recognition, has focused on the impact of single-source inconsistencies, such as phonology-
to-semantics inconsistency and phonology-to-orthography inconsistency. We turn now to an
overview of the literature concerning the effects of single-source inconsistencies on word
recognition latencies, focusing on results from lexical decision studies involving homographic
homophones or heterographic homophones.
1.3. Single-Source Inconsistencies
1.3.1. Phonology and Orthography
A number of studies have manipulated phonology-to-orthography inconsistency in visual
and auditory lexical decision. In this literature, the presence of phonology-to-orthography
inconsistency at most grain-sizes4 in lexical stimuli has been shown to slow lexical decision
latencies (e.g., Holden, 2002; Ziegler & Ferrand, 1998). As of yet, heterographic homophones,
which are phonology-to-orthography inconsistent at the whole-word grain-size, have only been
manipulated in visual word recognition tasks including visual lexical decision. Investigators
have reported longer visual lexical decision latencies to heterographic homophones than to
nonheterographic homophonic control words, a finding that is known as the heterographic
homophone disadvantage (Table 1; e.g., Holden, 2002; Pexman, Lupker, & Jared, 2001).
Likewise, there were longer visual lexical decision latencies to words with phonology-to-
orthography inconsistent rime-body correspondences than to their consistent control words
(Table 1; e.g., Holden, 2002; Stone et al., 1997). The similar patterns of visual lexical decision
results for lexical (i.e., heterographic homophones) and sublexical grain-sizes (e.g., rime-body
correspondences) of phonology-to-orthography inconsistent words have been hypothesized to
4 Grain-sizes are measures of word units including sublexical units as small as letters and phonemes and lexical units as large as whole words.
11

12
reflect the same disruptive influence arising from inconsistency between phonology and
orthography (Holden, 2002; Stone et al., 1997).
In the auditory modality, the influence of phonology-to-orthography inconsistency at
whole-word grain-sizes (i.e., heterographic homophones) has yet to be investigated, but a few
studies have addressed phonology-to-orthography inconsistency at sublexical grain-sizes (Table
1; Frost et al., 2003; Ventura et al., 2004; Ziegler & Ferrand, 1998; Ziegler et al., 2004). Parallel
to the visual lexical decision latency results, auditory lexical decision latencies were longer to
words with phonology-to-orthography inconsistent rime-body correspondences than to consistent
control words in French (Ziegler et al., 2004; Ziegler & Ferrand, 1998), in Portuguese (Ventura
et al., 2004), and in American English (Frost et al.,2003). This phonology-to-orthography
inconsistency disadvantage for auditory lexical decision latencies has been hypothesized to arise
from the same source as the phonology-to-orthography inconsistency disadvantage for visual
lexical decision latencies (Frost et al., 2003; Stone et al., 1997; Ventura et al., 2004; Ziegler et
al., 1997, 2004; Ziegler & Ferrand, 1998). Therefore, phonology-to-orthography inconsistency
at sublexical grain-sizes slowed both visual and auditory lexical decision latencies in the above
studies.
1.3.2. Phonology and Semantics
By contrast with the rather consistent findings concerning the impact of phonology-to-
orthography inconsistency on word recognition, the evidence on phonology-to-semantics
inconsistency is more variable. A particular concern in this literature is the lack of attention to
the features of the words selected to be semantically ambiguous. For example, a number of
studies have shown shorter visual lexical decision latencies to semantically ambiguous words
(i.e., words having more than one semantic representation) than to non-ambiguous control words

Manipulation Example Modality Finding Citation(s) Longer decision latencies than nonhomophonic control words
Holden, 2002, exp. 4 Pexman et al., 2001 Pexman & Lupker, 1999 Pexman, Lupker, & Reggin, 2002 however see, Davelaar, Coltheart, Besner, & Jonasson, 1978
Phonology-to-orthography inconsistency vs. consistency of whole-word correspondences (Heterographic homophones)
bite/byte → /be]t/ VWR
More errors than nonhomophoninc control words
Pexman et al., 2001 Pexman & Lupker, 1999 Pexman, Lupker, & Reggin, 2002 However see, Davelaar et al., 1978
VWR Longer decision latencies and more errors than for consistent monosyllabic English and French words
Holden, 2002 Stone et al., 1997 Ziegler, Montant, & Jacobs, 1997 however see, Peereman, Content, & Bonin, 1998; Balota et al., 2004
Phonology-to-orthography inconsistency vs. consistency of rime-body correspondences
/-o[l/ → -oal, -ol, -ole, -oll, -oul, -owl
SWR Longer decision latencies and more errors than for consistent monosyllabic English, French, & Portuguese words
Frost, Fowler, & Rueckl, 2003, exp. 2a Ventura et al., 2004, exps. 1 & 2 Ziegler & Ferrand, 1998 Ziegler et al., 2004, Exp. 1
Table 1. Summary of Lexical Decision Studies Manipulating Phonology-to-orthography Inconsistency by Modality
Note. VWR = Visual word recognition; SWR = Spoken word recognition; RT = Reaction time
13

14
(Table 2; e.g., Azuma & Van Orden, 1997; Hino et al., 2002, exp. 1a; Pexman, Lupker, & Hino,
2002), a finding that has been hypothesized to reflect an increased speed of coherence of local
and global resonances resulting from the cumulative activation of multiple semantic
representations (e.g., Pexman, Hino, & Lupker, 2004; Pexman & Lupker, 1999; Rodd et al.,
2002; Smith & Besner, 2001). Findings from one study (Rodd et al., 2002) of British-English
speakers suggest, however, that it may be important to differentiate between related and
unrelated meanings of semantically ambiguous words. Rodd and colleagues (2002) found that
visual and auditory lexical decision latencies were slower to homographic homophones than to
control words as would be expected if inconsistency slows coherence of resonances, which in
turn slows response latencies, but that visual and auditory lexical decision latencies were faster
to polysemous words (with more than one related meaning) than to control words. These
findings suggest that the existence of more than one unrelated semantic representation for a
homographic homophone may decrease the strength of semantic activation yielding slower
lexical decision latencies, whereas more than one related semantic representation for a
polysemous word may increase the strength of semantic activation yielding faster lexical
decision latencies. Although a subsequent study employing Japanese Katakana (Pexman et al.,
2004) failed to replicate the effects reported by Rodd and colleagues (2002), differences between
the shallow orthography of such stimuli as compared to English stimuli make it difficult to
compare the findings of these two studies. At a minimum, the findings of Rodd and colleagues
(2002) suggest that it may be important to distinguish semantically ambiguous stimuli according
to whether their multiple meanings are related or unrelated, a conclusion that is supported by the
analysis of stimuli described in the next section.

Manipulation Example Modality Finding Citation(s) Shorter RTs and fewer errors than control words (Japanese Katakana)
Hino et al., 2002, exp. 1a Pexman et al., 2004 (exp. 4)
Shorter RTs than control words (English)
Azuma & Van Orden, 1997 Kellas et al., 1988 Pexman et al., 2004 (exp. 1) Pexman & Lupker, 1999 Pexman, Hino, & Lupker, 2002 exps., 1a & 1b
Semantically ambiguous words (homographic homophones & polysemous words) vs. non-semantically ambiguous words
See below VWR
Fewer errors than control words (English)
Pexman et al., 2004 (exp. 1) Pexman, Hino, & Lupker , 2002, exps. 1a & 1b
Longer RTs than control words (English)
Rodd et al., 2002, exps. 1 & 2
Shorter RTs than control words (Japanese Katakana)
Pexman et al., 2004 (exp. 4)
VWR
Fewer errors than control words (Japanese Katakana)
Pexman et al., 2004 (exp. 4)
Homographic homophones vs. words with no unrelated and with few related semantic representations
bat → /bqt/ → “flying mammal”, “used to hit a baseball”, “flutter eyelids”
SWR Longer RTs than control words (English)
Rodd et al., 2002, exp. 3
VWR Shorter RTs than control words (English)
Rodd et al., 2002, exps. 1 & 2 Polysemous words vs. words with few related and no unrelated semantic representations
lease → /lis/ → “rental”, “term of contract”, “to rent”, etc.
SWR Shorter RTs than control words (English)
Rodd et al., 2002, exp. 3
Table 2. Summary of Lexical Decision Studies Manipulating Phonology-to-semantics Inconsistency by Modality
Note. VWR = visual word recognition; SWR = spoken word recognition; RT = reaction time
15

1.3.3. Analyses of Stimuli in Previous Lexical Decision Studies
A careful look at the stimulus words employed in several of the influential studies
described above shows that the words used as heterographic homophones, homographic
homophones, and polysemous may not have been defined and/or controlled adequately. For
example, semantically ambiguous words have included homographic homophones/homonyms
and polysemous words and have more than one unrelated or related semantic representation for
one orthographic and one phonologic representation (Azuma & Van Orden, 1997; Hino, Lupker,
& Pexman, 2002; Klein & Murphy, 2001; Klepousniotou, 2002; Rodd et al., 2002).
To examine this possibility, stimulus words from five studies, Edwards, Pexman, and
Hudson (2004), Pexman and colleagues (2001), Pexman & Lupker (1999), Pexman, Lupker, and
Reggin (2002), and Rodd and colleagues (2002), were analyzed to determine how often words
selected to represent one type could also represent another word type.
Control words intended not to be heterographic homophones or homographic
homophones, but having multiple unrelated semantic representations are of primary concern
because the heterographic homophone disadvantage might be stronger in comparison to a control
word that is actually a homographic homophone. As shown in Table 3, a substantial percentage
(34-50%) of control words intended not to be heterographic homophones could be classified as
semantically ambiguous; between 26 and 34% of these were also homographic homophones.
Table 3. Percentage of Control Words with Alternate Classifications from Several Heterographic Homophone Visual Lexical Decision Studies
Study Experiment(s) Heterographic homophone
Homographic homophone
Homographic Heterophone
Acronym
Edwards et al. (2004) 1 & 2 10.11% 25.84% 0.00% 1.12% Pexman et al. (2001) 1 – 5 15.15% 33.33% 0.00% 0.00% Pexman et al. (2001) 6 7.55% 33.96% 0.00% 0.00% Pexman, Lupker, & Reggin (2002)
1 & 2 16.67% 33.33% 0.00% 0.00%
Pexman & Lupker (1999)
1 & 2 9.68% 32.26% 0.00% 0.00%
16

Similar findings are seen in the heterographic homophones employed in these studies,
more than one-fourth of which (27-32%) could also be classified as homographic homophones
(Table 4).
Table 4. Percentage of Heterographic Homophones with Alternate Classifications from Several Heterographic HomophoneVisual Lexical Decision Studies
Study Experiment(s) Spelling Variant Homographic homophone
Homographic Heterophone
Edwards et al. (2004) 1 & 2 1.12% 30.34% 4.49% Pexman et al. (2001) 1-5 2.86% 22.86% 2.86% Pexman et al. (2001) 6 0.00% 32.08% 1.89% Pexman, Lupker, & Reggin (2002)
1 & 2 0.00% 29.41% 5.88%
Pexman & Lupker (1999) 1 & 2 0.00% 26.67% 3.33%
Nonhomographic homophone control words were less affected by such cross-
classification; the percentage of such words representing more than one word class ranged from
10 to 20 (Table 5). However, up to 32% of nonhomographic homophone control words were
actually homographic homophones and between 10 and 20% of nonhomographic homophone
control words were heterographic homophones. In short, these analyses further cloud the
interpretation of the contradictory findings concerning the impact of homophones on lexical
decision latencies.
Table 5. Percentage of Control Words with Alternate Classification from Several Homographic Homophone/Polysemous Word Lexical Decision Studies
Study Experiment(s) Heterographic homophones
Homographic homophones
Rodd, Gaskell, & Marslen-Wilson (2002) 2 (Vis) 19.64% 0.00% Rodd, Gaskell, & Marslen-Wilson (2002) 3 (Aud) 18.63% 0.00% Pexman & Lupker (1999) 1 & 2 (Vis) 9.68% 32.26% Note. Vis = Visual lexical decision; Aud = Auditory lexical decision
Studies of semantic ambiguity (i.e., homographic homophony/polysemy) also included
cross-classified stimuli (e.g., Pexman & Lupker, 1999; Rodd et al., 2002). Pexman and Lupker
(1999) manipulated both polysemy and homophony in a visual lexical decision task to determine
whether the polysemous word advantage and heterographic homophone disadvantage would co-
17

occur. Although Pexman and Lupker (1999) did not set out to manipulate homographic
homophones distinct from polysemous words, 68% of their polysemous stimulus words were
homographic homophones (Table 6) and of the control words 32% were homographic
homophones and 10% were heterographic homophones (Table 5). Even in the study by Rodd
and colleagues (2002) who attempted to contrast related and unrelated semantic representations
of semantically ambiguous words, more than 15% of the words used as homographic
homophones were also heterographic homophones (Table 6).
Table 6. Percentage of Homographic Homophones/Polysemous Words with Alternate Classifications from Several Homographic Homophone/Polysemous word Lexical Decision Studies
Study Experiment Heterographic homophones
Polysemous Words
Rodd, Gaskell, & Marslen-Wilson (2002) 2 (Vis) 18.18% 0.00% Rodd, Gaskell, & Marslen-Wilson (2002) 3 (Aud) 17.82% 0.00% Pexman & Lupker (1999)5 1 & 2 (Vis) 25.00% 32.14% Note. Vis = Visual lexical decision; Aud = Auditory lexical decision
In addition to the possible cross-classification revealed by these analyses, recent evidence
suggests that a number of additional characteristics of word stimuli may have been controlled
insufficiently. Balota and colleagues (2004) analyzed visual lexical decision latencies for 2,428
monosyllabic words; by contrast with most previous work, these investigators reported that
phonology-to-orthography inconsistency did not have negative effects. However, Balota and
colleagues (2004) noted that words with greater “semantic connectivity (i.e., words that are
imageable and words with more semantic representations) yielded faster lexical decision
latencies.
5 Pexman and Lupker (1999) used “polysemous words” which included mostly homographic homophones. Accordingly, that classification is used for this table. The debate about the difference between homographic homophones (homonyms) and polysemous words is summarized by Klein and Murphy (2001). This debate has led to inconsistent use of terminology, which makes this literature difficult to navigate.
18

Another concern with respect to the stimuli used in the existing literature is the frequent
use of identical word and nonword stimuli across experiments, sometimes without comment.
For example, Pexman, Lupker, and Reggin (2002) created their stimulus lists by forming subsets
of lists used in past studies. Such an approach might be justifiable on theoretical grounds, but
the generalizability of findings to the broader set of potential stimulus words is unknown.
Finally, in addition to problems with stimulus definition and selection, previous work on
visual and spoken word recognition has generally focused on the effects of individual sources of
inconsistency even when stimuli enable other sources of inconsistency to operate simultaneously.
Results from studies contrasting heterographic homophones and control words have been
interpreted as arising from single-source inconsistency (phonology-to-orthography; e.g., Holden,
2002; Pexman & Lupker, 1999; Rodd et al., 2002), despite the fact that heterographic
homophones actually have two sources of inconsistency (orthography and semantics). Previous
research indicates that inconsistency from more than one unrelated semantic representation for
homographic homophones as well as from more than one unrelated semantic representation and
more than one orthographic representation for heterographic homophones may slow visual
lexical decision latencies (e.g., Holden, 2002; Pexman et al., 2001; Pexman & Lupker, 1999;
Rodd et al., 2002). Moreover, inconsistency from two information sources may slow lexical
decision latencies to a greater degree than inconsistency from just one information source.
However, until lexical decision latencies to carefully controlled heterographic homophones,
homographic homophones, and control words are contrasted in a single study, strong conclusions
about the effects of inconsistency on lexical decision latencies cannot be drawn. One purpose of
the present study was to provide such evidence.
19

1.4. Comparing Visual and Auditory Processing
Empirical evidence is also scant concerning the extent to which word recognition
processes are similar or different in the visual and auditory modalities. A comparison of the
visual (Exp. 2) and the auditory (Exp. 3) lexical decision latencies reported by Rodd and
colleagues (2002) for similar stimuli revealed an overall mean visual lexical decision latency
(595.40 ms) that was almost 400 ms shorter than the mean auditory lexical decision latency
(963.00 ms). This is consistent with the contrast between spoken input which arrives over time,
and visual input in which the entire stimulus is available immediately. However, apart from the
additional time required for stimulus presentation, it appears that most models would predict
similar processing stages in the two modalities and several investigators have suggested that
ambiguity may have comparable effects in the two modalities. For example, Rodd and
colleagues (2002) reported that polysemous words and homographic homophones resulted in
similar ambiguity effects in both modalities, although they did not conduct statistical
comparisons of the visual and auditory modalities. Likewise, longer lexical decision latencies
have been reported for words with phonology-to-orthography inconsistent rime-body
correspondences than to words with phonology-to-orthography consistent rime-body
correspondences in both the visual and auditory modality (e.g., Frost et al., 2003; Holden, 2002;
Ziegler et al., 2004). However, such results provide only indirect evidence concerning the
effects of inconsistency in the visual and auditory modality. Thus, a second purpose of the
present study was to directly compare visual and auditory lexical decision latencies to
heterographic homophones, homographic homophones, and control words.
20

2. Purpose
The present study was designed to compare lexical decision latencies in the visual and
auditory modalities to three word types: (a) word stimuli that are inconsistent with two
information sources, orthography and semantics (i.e., heterographic homophones), (b) word
stimuli that are inconsistent with one information source, semantics (i.e., homographic
homophones), and (c) and word stimuli that are not inconsistent with any information source
(i.e., control words). There were two hypotheses:
(1) Lexical decision latencies will differ significantly by word type within each
modality.
(2) There will not be an interaction between modality and word type. (i.e., The
effects of inconsistency will be similar in the visual and auditory modalities.)
21

3. Methods
The same general participant selection criteria, stimuli, and experimental procedures were
used for both visual lexical decision and auditory lexical decision. In what follows, the
procedures common to both conditions are presented first, followed by the procedures specific to
each condition.
3.1. Participants
Of the 84 students recruited initially, 83 native English-speaking undergraduate students
from the University of Pittsburgh’s Psychology Subject Pool met the criteria below and were
enrolled in the study. Based on a questionnaire (Appendix C), individuals were excluded if they
reported any of the following: (a) a native language other than English; (b) physical limitations
that could affect responding (e.g., paralyzed or weak response hand); (c) history of learning
disabilities (e.g., language learning disabilities, dyslexia, reading difficulties, etc.) or
neurological impairments (e.g., Attention Deficit Hyperactivity Disorder, stroke, traumatic brain
injury, seizures, etc.); (d) participation in a college course dedicated to phonetic transcription.
One individual failed the hearing screening and was excluded from participation. Two
participants mentioned academic placement in “special reading classes” while enrolled in
primary school but did not report persistent reading difficulties and were included in the
protocol. Participants passed an audiological screening at 25 dB HL for 1,000, 2,000, and 4,000
Hz and reported normal or corrected-to-normal vision.
The participants ranged in age from 18 to 27 (M = 18.61, SD = 1.29), 52% were females
and 17% were members of racial/ethnic minorities. Eligible participants were assigned to the
22

visual or auditory condition using a random numbers table. As shown in Table 7 there were no
significant differences between the participant groups for age or level of completed education.6
Table 7. Group Differences for Age and Level of Completed Education
Visual (n = 40) Auditory (n = 43) Measure M SD M SD t (74)
Age 18.52 1.01 18.70 1.51 0.61 Completed education 1.25 0.78 1.35 0.61 0.65
3.2. Stimuli
To select the stimulus words for this study, a database of monosyllabic words was
compiled from three sources: (a) previous studies (Azuma, 1996; Azuma & Van Orden, 1997;
Borowsky & Masson, 1996; Folk, 1999; Folk & Morris, 1995; Holden, 2002; Jared, Levy, &
Rayner, 1999; Klein & Murphy, 2001; Klepousniotou, 2002; Pexman & Lupker, 1999; Pexman,
Lupker, & Reggin, 2002); (b) a dictionary of heterographic homophones and homographs
(Hobbs, 1999); and, (c) a large set of orthography-to-phonology and phonology-to-orthography
consistent and inconsistent monosyllabic words identified in Nixon (2002). Each of the resulting
6,355 monosyllabic words was first analyzed to determine whether it qualified as a homographic
homophone, a heterographic homophone, or a control word according to the following criteria.
Homographic homophones were defined as words with a single orthographic representation and
a single phonologic representation, but more than one unrelated semantic representation as
evidenced by having more than one dictionary entry in the Wordsmyth Internet dictionary.7
Heterographic homophones were defined as words with a single phonologic representation but at
least two orthographic representations, each denoting an unrelated semantic representation.
Control words were defined as words that were not heterographic homophones, homographic
6 Level of completed education was recorded as follows: high school (1), freshman year of college (2), sophomore year of college (3), junior year of college (4), senior year of college (5). 7 The Wordsmyth Dictionary-Thesaurus (www.wordsmyth.net) contains a word list with definitions for nearly 50,000 headwords and linkages among these to exact synonyms and near synonyms.
23

homophones, or homographic heterophones. These criteria were used to identify 650 sets of
heterographic homophones with 1,546 orthographic representations, 1,130 homographic
homophones with 2,544 unrelated semantic representations, and 3,679 control words were
identified.
The resulting pool of potential stimuli was then examined to exclude words that met any
of the following criteria: (a) words without entries in Wordsmyth; (b) function words (e.g.,
prepositions, articles, copulas, etc.); (c) contractions (e.g., we’ve); (d) proper nouns; (e)
acronyms (e.g., AIDS); (f) homographs, i.e., words with a single orthographic representation but
more than one phonologic representation (e.g., bow → /be[/ and /bo[/); (g) words meeting the
criteria for both heterographic homophones and homographic homophones (e.g., ball and bawl
are heterographic homophones, but ball also has two unrelated semantic representations, “a
spherical or nearly spherical body” and “a large social function at which there is formal
dancing”; and, (h) spelling variants of the same word (e.g., blond and blonde). After these
exclusions, the resulting pool contained 233 heterographic homophone sets (35.85% of the sets
identified initially) with 524 orthographic representations (33.89% of those identified initially),
790 homographic homophones (69.91%) with 1,759 semantic representations (69.14%), and
3,389 control words (92.12%).
To estimate frequency of occurrence for stimuli and to control for differences in semantic
representation dominance for heterographic homophones and homographic homophones, an
Internet frequency estimate was obtained for each word in the pool by entering it into an Internet
search engine and recording the number of hits returned (Blair, Urland, & Ma, 2002).
Significant and large correlations have been found (Blair et al., 2002) between such Internet
frequency estimates and the Kučera and Francis (1967) written word frequencies (r = .89) and
24

CELEX word frequencies (r = .78). Because such Internet frequency estimates are compiled
from formal, informal, and conversational texts they are likely to include new, informal, and
slang words not represented in other word frequency databases. In addition, Internet frequency
estimates can be refined to estimate the frequency and semantic dominance of each semantic
representation for a word by searching for co-occurrences of words in web pages (Blair et al.,
2002), which was an important consideration for the present study as described below.
3.2.1. Internet Frequency Estimates of Semantic Representations
To estimate the frequency of related and unrelated semantic representations, which was
particularly important for selecting homographic homophones in the present study, Internet
frequency estimates were obtained for semantic representations of each potential stimulus word
by modifying the search method used by Blair and colleagues (2002) to search for co-
occurrences of words in web pages. These co-occurrences were defined by an orthographic
representation’s semantic use, which included its related semantic representation(s) in
Wordsmyth (i.e., the definitions included in a single dictionary entry). The orthographic
representation of a potential stimulus word was entered into Google® and limited by its defining
characteristics, synonyms, near synonyms, and related words (see Appendix D). For example,
the control word beep has three related semantic representations in Wordsmyth: “a short, usually
high-pitched warning signal”; “to emit a short warning signal”; “to cause to emit a short warning
signal”. Therefore, the overall Internet frequency estimate for the related semantic
representations of beep would be obtained by entering beep (warning OR signal OR horn OR
short OR warn). This method was also used to obtain Internet frequency estimates for unrelated
semantic representations of homographic homophones, by limiting the search for each
orthographic representation to the defining characteristics of each unrelated semantic
25

representation. Henceforth, this estimate is referred to as the semantic representation frequency
estimate. For example, tag has two unrelated semantic representations according to Wordsmyth:
1a piece of cardboard, thin metal, plastic or other material that identifies, labels, or shows the
price of that to which it is attached;8 and, 2a children’s game in which one player chases the
others until he or she touches one of them, who then becomes the pursuer. Therefore, the
semantic representation frequency estimate for each unrelated semantic representation of tag
could be obtained for 1tag by entering tag (label OR price OR cardboard OR name OR sale OR
sell) and 2tag by entering tag (game OR player OR chase OR touch).
3.2.2. Internet Estimates of Semantic Dominance for Heterographic Homophones and
Homographic Homophones
A semantic dominance score was calculated for the unrelated semantic representations of
heterographic homophones and homographic homophones by obtaining the percentage of total
Internet frequency estimates accounted for by each unrelated semantic representation. This was
done by dividing the semantic representation frequency estimate by the sum of all semantic
representation frequency estimates sharing one phonologic representation and multiplying this
number by one hundred (for scores see Appendix E). The semantic representation with the
largest semantic dominance score was considered dominant. If semantic dominance estimates
differed by < 5% the heterographic homophone or homographic homophone was considered to
have balanced semantic dominance. Heterographic homophones and homographic homophones
with one highly dominant semantic representation (i.e., a semantic dominance score that was >
50% from that of the second most frequent semantic representation) were excluded. Fifty
percent was chosen as a cut-off because it excluded homographic homophones and heterographic
8 There are nine related semantic representations for this one unrelated semantic representation of tag. Only one of these nine related semantic representations is listed above, but the defining characteristics were selected from all nine related semantic representations.
26

homophones that had been labeled biased in previous studies without eliminating those labeled
balanced in previous studies (e.g., Folk, 1999; Folk & Morris, 1995). Eliminating heterographic
homophones and homographic homophones with one very dominant semantic representation was
intended to limit the impact of semantic representation dominance variability and maximize
semantic conflict for visual and auditory lexical decisions (e.g., Daneman, Reingold, &
Davidson, 1995; Folk, 1999; Folk & Morris, 1995; Pexman et al., 2001; Starr & Fleming, 2001).
Several analyses were conducted to evaluate the validity and reliability of the Internet-
based semantic representation frequency estimates. Appendix F provides details on these
studies.
3.2.3. Final Stimulus Word Lists
Sixty-seven heterographic homophone sets (148 orthographic representations) met the
criteria above. From these, seven heterographic homophone sets were randomly eliminated as
they shared a root word with another heterographic homophone, leaving 60 homophone sets with
134 different orthographic representations. Accordingly, 60 homographic homophones (146
unrelated semantic representations) were randomly selected from the 513 eligible homographic
homophones (1,206 unrelated semantic representations) and 60 control words were randomly
selected from the 3,389 eligible control words.
3.2.3.1. Creating the Auditory Stimuli For recording, the phonetically transcribed stimuli were read in lists by a native English-
speaking female from the Pittsburgh, PA area who was an expert in phonetic transcription. From
among the available recorded tokens of each stimulus, a clear and intelligible exemplar that did
not occur at the end of a list was selected by the investigator for presentation. Stimuli were
evaluated for clarity by a group of doctoral students in communication science and disorders.
27

The auditory stimuli were digitally recorded via a single channel at a sampling rate of 44,100 Hz
with 16 bits per sample using Cool Edit Pro® using a head-mounted microphone (Radio Shack
33-3003) set approximately 6-inches from the speaker’s mouth. Each stimulus was spliced from
the entire stimulus set and saved as a separate digital *.*wav file. After editing, stimulus files
were equated for overall root mean square (RMS) amplitude using Cool Edit Pro® to ensure that
the stimuli were similar in average intensity. The acoustic duration of the individual word and
nonword files were measured using Multispeech®, Model 3700 software (Kay Elemetrics).
3.2.3.2. Descriptive Characteristics of the Stimulus Words The heterographic homophone, homographic homophone, and control word stimuli are
listed along with their descriptive characteristics in Appendix E. The three stimulus word sets
did not differ significantly with respect to semantic representation frequency estimates (F(2, 335)
< 0.01, p = 1.00), number of graphemes (F(2, 177) = 1.17, p = 0.31), or acoustic duration as
measured with Multispeech®, Model 3700 software (Kay Elemetrics) (F(2, 177) = 2.11, p = 0.13;
see Table 8 for descriptive statistics). In addition, the heterographic homophone and
homographic homophone stimulus word groups did not differ significantly with respect to
semantic dominance scores (t(254.77) = -1.51, p = 0.13).
For each heterographic homophone, the orthographic representations to be visually
presented were selected randomly after the stimulus words were identified. This procedure does
not place assumptions about the orthographic representation(s) recognized by participants in
auditory lexical decision or about the unrelated semantic representation(s) of homographic
homophones recognized by participants in visual or auditory lexical decision. (The visually
presented orthographic representation for each heterographic homophone set is indicated in
Appendix E.)
28

An additional 180 monosyllabic nonwords were created using the body-rime
correspondences from the 180 stimulus words (Appendix G). To create a nonword, onsets (null,
consonant, or consonant blend) were pseudo-randomly assigned to each body-rime
correspondence. This increased the odds that the nonwords were not only word-like but also
orthographically and phonologically similar to the stimulus words; two characteristics that
increase the probability of semantic processing (e.g., Azuma & Van Orden, 1997; Borowsky &
Masson, 1996; Pexman et al., 2001). No nonword appeared in Wordsmyth as a word, a prefix,
or a suffix, and no nonword was a pseudohomophone (e.g., phan).
Table 8. Characteristics of Heterographic homophone, Homographic homophone, and Control Word Stimuli
Homographic homophones
Heterographic homophones
Control Words Total Statistic
Semantic Representation Frequency Estimate df (2, 355) M 2,752,174.20 2,716,071.40 2,700,764.80 2,728,735.40 SD 3,680,737.49 3,802,749.57 4,176,433.77 3,809,211.32
F < 0.01 ns
Number of Letters df (2, 177) M 4.73 4.55 4.80 4.69 SD 0.97 0.89 0.92 0.93
F = 1.17 ns
Acoustic Duration (ms) df (2, 177) M 528.45 562.40 547.71 546.19 SD 91.74 79.22 100.32 91.40
F = 2.11 ns
Semantic Dominance df (254.77) M 41.67% 44.78% -- -- SD 15.16 18.93 -- --
t = -1.51 ns
3.3. Procedures
Screening and experimental procedures occurred in a single session in a sound-isolated
room at the Department of Communication Science and Disorders at the University of
Pittsburgh. First, the screening and experimental procedures were described to participants and
the informed consent was discussed and signed. Second, each participant filled out a brief
background history questionnaire (Appendix C). Third, hearing was screened binaurally using
pure-tone signals at 25 dB HL for 1,000 Hz, 2,000 Hz, and 4,000 Hz (American Speech-
29

Language-Hearing Association Audiologic Assessment Panel 1996, 1997). After the screening
procedures, a random numbers table (www.randomizer.org) was used to randomly assign
qualifying participants to either the visual condition, in which participants read items, or the
auditory condition, in which participants listened to items.
In response to each item, participants were directed to indicate whether they thought it
was a word or a nonsense word by a button press as described below (see directions in Appendix
H). They were instructed to use the hand they found most comfortable and were not allowed to
change hands during the experiment. The experimenter then demonstrated how to use the
keyboard and participants were given an opportunity to ask questions before beginning 30
practice trials. They received feedback about their speed and accuracy on the computer screen.
Following the practice trials, participants again could ask questions before continuing the
experimental task. During the experimental task, participants were required to respond to each
stimulus item and did not receive feedback about speed and accuracy.
Stimuli were presented randomly without replacement using E-Prime® (version 1.1;
Schneider, Eschmann, & Zuccolotto, 2002) on a Toshiba Satellite Intel Pentium III processor and
lexical decision latencies were collected using button presses. Each trial began with a symbol
(+) displayed in the center of the screen for 500 ms followed by a blank screen for 100 ms. A
stimulus (word or nonword) was presented on the screen or via headphones as appropriate. On
each trial, the stimulus (word or nonword) was presented until the participant responded by
pressing either the letter g button on the left, labeled WORD, or the letter j button on the right,
labeled NONWORD. After a response, the screen cleared and there was an intertrial interval of
1,000 ms.
30

A one-to-one ratio of words to nonwords was used in order to limit response biases
(Galanter, 1962). Thus, each participant responded to 360 items, which required approximately
40 minutes. For visual lexical decision, the stimuli were presented in the center of a color
monitor set approximately 40 cm from each participant in black Arial letters about 0.50 cm high
(18-point) on a white background. For auditory lexical decision, a calibration noise band,
created with Cool Edit Pro®, was played via E-prime® (Schneider et al., 2002) at the beginning
of each session to ensure that the amplitude settings within the computer and experimental
program were the same across sessions. The calibration sound file was created to match the
mean RMS of the sound files. On each trial a stimulus was presented binaurally at 65 dB SPL,
which is analogous to normal conversation at three feet (Martin, 1994), via Kenwood personal
monitor headphones (Model KPM-510).
31

4. Statistical Analyses
Participant mean lexical decision latencies were analyzed using a mixed 2 (Visual and
Auditory) by 3 (heterographic homophones, homographic homophones, control words) Analysis
of Variance (ANOVA) with repeated measures on the second factor. Post-hoc pairwise
Bonferroni t-test comparisons were conducted as appropriate within each modality. A sample
size of 48 participants (24 in the visual modality and 24 in the auditory) was calculated with
power at 0.80, Cohen’s d at 0.50, and alpha at 0.05.
In addition to the analyses by participants, item analyses were conducted. Item mean
lexical decision latencies were analyzed using a 2 (Visual and Auditory) x 3 (heterographic
homophones, homographic homophones, and control words) ANOVA. Item analyses were
included in an effort to address the generalizability of findings across a similar population of
randomly selected items (e.g., Cleland, Gaskell, Quinlan, & Tamminen, 2006; De Moor,
Verguts, & Brysbaert, 2005; Huck & Cormier, 1996; McLennan & Luce, 2005). A sample size
of 53 stimulus words for each word type was calculated with power at 0.80, Cohen’s d at 0.50,
and alpha at 0.05.
Even though word types were carefully controlled, there were several variables that could
pose threats to validity. Accordingly, supplemental Analyses of Covariance (ANCOVA) were
planned with the covariates semantic representation frequency estimate, acoustic duration, and
number of letters. Predictor variables were first correlated with the lexical decision latencies;
those with correlations exceeding +0.20 were included as covariates (Huck & Cormier, 1996).
32
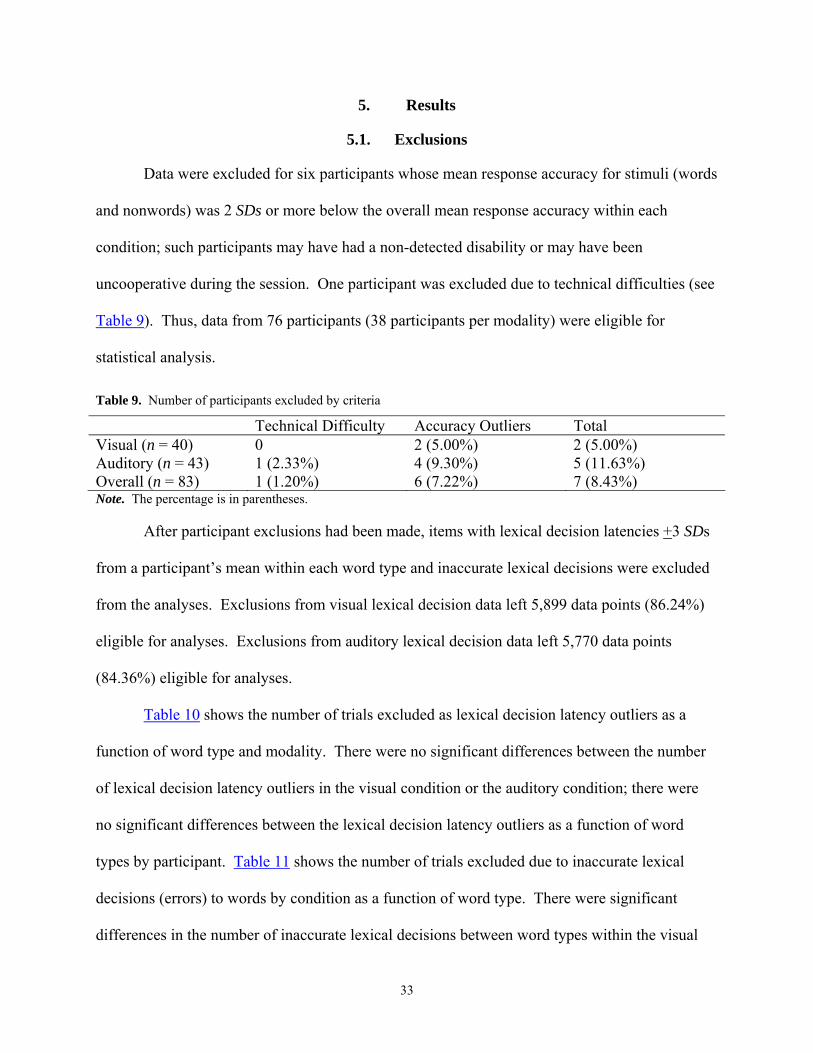
5. Results
5.1. Exclusions
Data were excluded for six participants whose mean response accuracy for stimuli (words
and nonwords) was 2 SDs or more below the overall mean response accuracy within each
condition; such participants may have had a non-detected disability or may have been
uncooperative during the session. One participant was excluded due to technical difficulties (see
Table 9). Thus, data from 76 participants (38 participants per modality) were eligible for
statistical analysis.
Table 9. Number of participants excluded by criteria
Technical Difficulty Accuracy Outliers Total Visual (n = 40) 0 2 (5.00%) 2 (5.00%) Auditory (n = 43) 1 (2.33%) 4 (9.30%) 5 (11.63%) Overall (n = 83) 1 (1.20%) 6 (7.22%) 7 (8.43%) Note. The percentage is in parentheses.
After participant exclusions had been made, items with lexical decision latencies +3 SDs
from a participant’s mean within each word type and inaccurate lexical decisions were excluded
from the analyses. Exclusions from visual lexical decision data left 5,899 data points (86.24%)
eligible for analyses. Exclusions from auditory lexical decision data left 5,770 data points
(84.36%) eligible for analyses.
Table 10 shows the number of trials excluded as lexical decision latency outliers as a
function of word type and modality. There were no significant differences between the number
of lexical decision latency outliers in the visual condition or the auditory condition; there were
no significant differences between the lexical decision latency outliers as a function of word
types by participant. Table 11 shows the number of trials excluded due to inaccurate lexical
decisions (errors) to words by condition as a function of word type. There were significant
differences in the number of inaccurate lexical decisions between word types within the visual
33
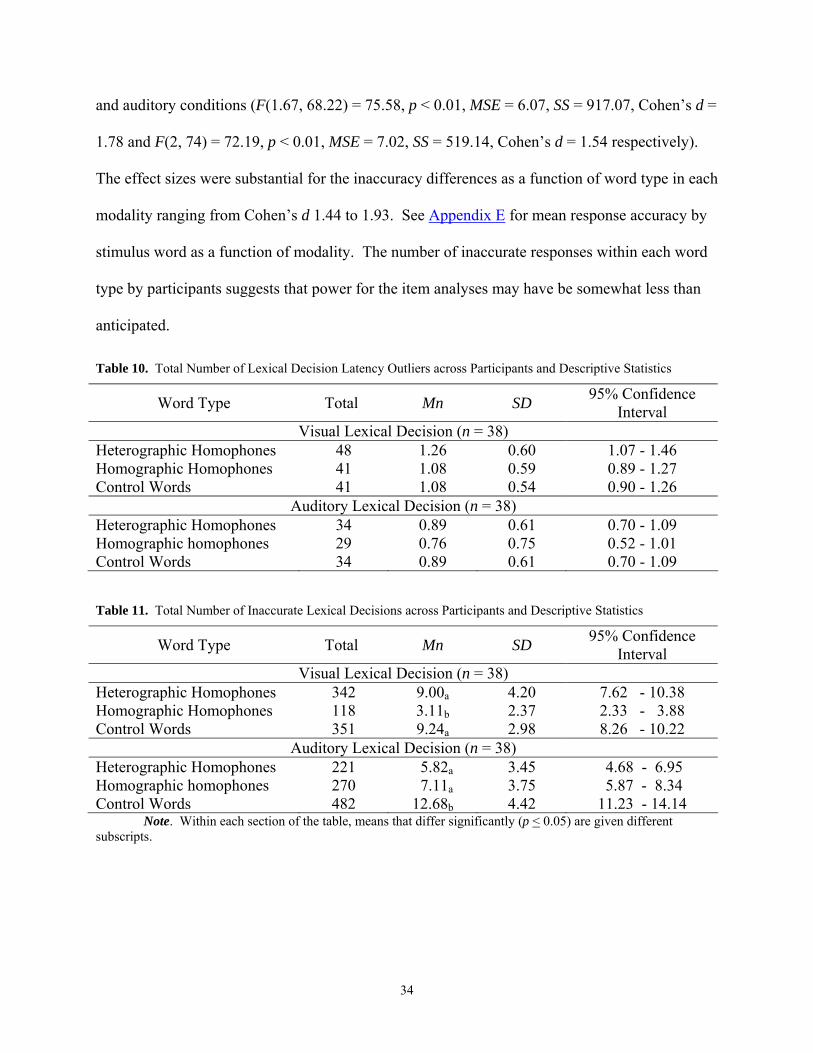
and auditory conditions (F(1.67, 68.22) = 75.58, p < 0.01, MSE = 6.07, SS = 917.07, Cohen’s d =
1.78 and F(2, 74) = 72.19, p < 0.01, MSE = 7.02, SS = 519.14, Cohen’s d = 1.54 respectively).
The effect sizes were substantial for the inaccuracy differences as a function of word type in each
modality ranging from Cohen’s d 1.44 to 1.93. See Appendix E for mean response accuracy by
stimulus word as a function of modality. The number of inaccurate responses within each word
type by participants suggests that power for the item analyses may have be somewhat less than
anticipated.
Table 10. Total Number of Lexical Decision Latency Outliers across Participants and Descriptive Statistics
Word Type Total Mn SD 95% Confidence Interval
Visual Lexical Decision (n = 38) Heterographic Homophones 48 1.26 0.60 1.07 - 1.46 Homographic Homophones 41 1.08 0.59 0.89 - 1.27 Control Words 41 1.08 0.54 0.90 - 1.26
Auditory Lexical Decision (n = 38) Heterographic Homophones 34 0.89 0.61 0.70 - 1.09 Homographic homophones 29 0.76 0.75 0.52 - 1.01 Control Words 34 0.89 0.61 0.70 - 1.09
Table 11. Total Number of Inaccurate Lexical Decisions across Participants and Descriptive Statistics
Word Type Total Mn SD 95% Confidence Interval
Visual Lexical Decision (n = 38) Heterographic Homophones 342 9.00a 4.20 7.62 - 10.38 Homographic Homophones 118 3.11b 2.37 2.33 - 3.88 Control Words 351 9.24a 2.98 8.26 - 10.22
Auditory Lexical Decision (n = 38) Heterographic Homophones 221 5.82a 3.45 4.68 - 6.95 Homographic homophones 270 7.11a 3.75 5.87 - 8.34 Control Words 482 12.68b 4.42 11.23 - 14.14
Note. Within each section of the table, means that differ significantly (p < 0.05) are given different subscripts.
34

5.2. Primary Analyses
Table 12 shows descriptive statistics by Word Type and Modality. The 2 (Visual vs.
Auditory) x 3 (heterographic homophone, homographic homophone, and control word)
ANOVAs yielded a significant main effect of word type and an interaction between modality and
word type by participants but not by items (Table 13). This interaction shows that patterns of
lexical decision latencies differed within each modality as a function of word type.
Table 12. Lexical Decision Latencies by Participants and Items as a Function of Word Type and Modality
Word Type Mn SD 95% Confidence Interval Participants (N = 76)
Heterographic Homophones 897.42 194.36 864.96 - 929.89 Homographic Homophones 886.79 206.28 853.59 - 919.99 Control Words 915.67 220.31 877.80 - 953.55 Visual 758.40 208.59 710.49 - 806.39 Auditory 1,041.53 209.53 993.62 - 1089.43
Items (N = 360) Heterographic Homophones 910.80 166.66 890.04 - 931.55 Homographic Homophones 892.97 172.94 872.22 - 913.73 Control Words 943.40 199.49 922.65 - 964.16 Visual 777.86 126.90 759.43 - 796.28 Auditory 1,053.59 106.54 1033.14 – 1069.04
Table 13. Analysis of Variance Results for Lexical Decision Latencies by Participants and Items
Variable df SS MS F d Power Participants (N = 76)
Main effect of word type 2 32,435.35 16,217.67 11.37** 0.16 0.99 Main effect of modality 1 1,523,082.74 1,523,082.74 69.35** 2.34 1.00 Modality x Word Type 2 8,799.29 4,399.63 3.09* 0.08 0.59 Within-cells error 148 211,047.64 1,426.00 Between-cells error 74 41,625,333.87 21,963.97
Items (N = 360) Main effect of word type 2 156,944.52 78,472.26 5.87** 0.23 0.87 Main effect of modality 1 6,842,472.20 6,842,472.20 511.99** 1.87 1.00 Modality x Word Type 2 26,318.28 26,318.28 0.99 0.34 0.23 Within-cells error 354 4,731,048.32 13,364.54 Note. *p < 0.05, **p < 0.01
The follow-up one-way ANOVAs illustrated significant main effects of word type for
both visual lexical decision (Table 14) and auditory lexical decision (Table 15). Table 16 shows
35

descriptive statistics for visual lexical decision latencies by participants and items. Both
heterographic homophones and control words had significantly longer lexical decision latencies
than homographic homophones by participants (Cohen’s d = 0.08 and Cohen’s d = 0.10
respectively). These results suggest a small advantage for homographic homophones relative to
both heterographic homophones and control words. By contrast, the item analyses indicated a
significant homographic homophone advantage only compared with control words (Cohen’s d =
0.46).
Table 14. Analysis of Variance Results for Visual Lexical Decision Latencies by Participants and Items
Variable df SS MS F d Power Participants (n = 38)
Main effect of word type 2 19,159.86 9,579.93 7.58** 0.08 0.94 Within-cells error 74 93,537.48 1,264.02
Items (n = 180) Main effect of word type 2 104,988.13 52,494.07 3.35* 0.38 0.63 Within-cells error 177 2,777,415.89 15,691.62 Note. *p < 0.05 **p <0.01
Table 15. Analysis of Variance results for Auditory Lexical Decision Latencies by Participants and Items
Variable df SS MS F d Power Participants (n = 38)
Main effect of word type 2 22,074.75 11,037.38 6.95** 0.20 0.92 Within-cells error 74 117,510.16 1,587.98
Items (n = 180) Main effect of word type 2 78,274.66 39,137.33 3.55* 0.39 0.65 Within-cells error 177 1,953,632.43 11,037.47 Note. *p < 0.05 **p <0.01
Table 16. Visual Lexical Decision Latencies as a Function of Word Type
Variable Mn SD 95% Confidence Intervals Participants (n = 38)
Heterographic homophones 764.63a 160.01 712.03 - 817.22 Homographic homophones 740.35b 147.11 692.00 - 788.70 Control Words 770.22a 174.12 712.98 - 827.45
Items (n = 180) Heterographic homophones 784.17ab 128.43 752.26 - 816.09 Homographic homophones 745.63a 83.05 713.72 - 777.55 Control Words 803.77ab 153.90 771.86 - 835.68 Note. Within each section of the table, means that differ significantly (p < 0.05) are given different subscripts.
36

Table 17 shows descriptive statistics for auditory lexical decision latencies by
participants and items. In the participant analyses, both heterographic homophones and
homographic homophones had significantly faster auditory lexical decision latencies than control
words (Cohen’s d = 0.22 and Cohen’s d = 0.20 respectively). These results suggest an advantage
for heterographic and homographic homophones relative to control words. By contrast, the item
analyses did not indicate any significant differences between word types.
Table 17. Auditory Lexical Decision Latencies as a Function of Word Type
Word Type Mn SD 95% Confidence Interval Participants (n = 38)
Heterographic homophones 1,030.22a 121.44 990.30 - 1,070.14 Homographic homophones 1,033.23a 143.40 986.10 - 1,080.37 Control Words 1,061.13b 156.88 1,009.56 - 1,112.70
Items (n = 180) Heterographic homophones 1,037.42a 83.16 1,010.65 - 1,064.19 Homographic homophones 1,040.32a 96.28 1,013.55 - 1,067.08 Control Words 1,083.03a 130.10 1,056.27 - 1,109.00 Note. Within each section of the table, means that differ significantly (p < 0.05) are given different subscripts.
5.3. Covariate Analyses
Because acoustic duration and semantic representation frequency estimates met the
specified criteria, they were used in the ANCOVA on the item means (Tables 18, 19, & 20).
Including these covariates yielded only one difference: significantly faster auditory lexical
decision latencies for heterographic homophones over control words. Thus, with the covariates,
the auditory lexical decision findings by items more closely paralleled those by participants.
Appendix I illustrates details of the ANCOVA analyses. Figures 3 and 4 illustrate the
similarities between item lexical decision latencies with and without covariate adjustments.
37

Table 18. Correlations (rs) between Item Characteristics and Lexical Decision Latencies
Measure 1 2 3 4 1. Lexical decision latencies -- 2. Acoustic duration 0.14** -- 3. Semantic representation frequency estimate -0.30** -0.13* -- 4. Number of letters 0.09 0.27** -0.29** -- Note. Spearman’s rho correlations were used because lexical decision latencies did not meet the hypothesis of normality (W(360) = 0.97, p < 0.01). ** p < 0.01, * p < 0.05
Table 19. Correlations (rs) between Item Characteristics and Visual Lexical Decision Latencies
Measure 1 2 3 4 1. Lexical decision latencies -- 2. Acoustic duration 0.07 -- 3. Semantic representation frequency estimate -0.69** -0.13 -- 4. Number of letters 0.15* 0.27** -0.27** -- Note. Spearman’s rho correlations were used. **p < 0.01, * p < 0.05
Table 20. Correlations (rs) between Item Characteristics and Auditory Lexical Decision Latencies
Measure 1 2 3 4 1. Lexical decision latencies -- 2. Acoustic duration 0.46** -- 3. Semantic representation frequency estimate -0.35** -0.13 -- 4. Number of letters 0.16* 0.28** -0.30** -- Note. Spearman’s rho correlations were used. **p < 0.01, * p < 0.05
38
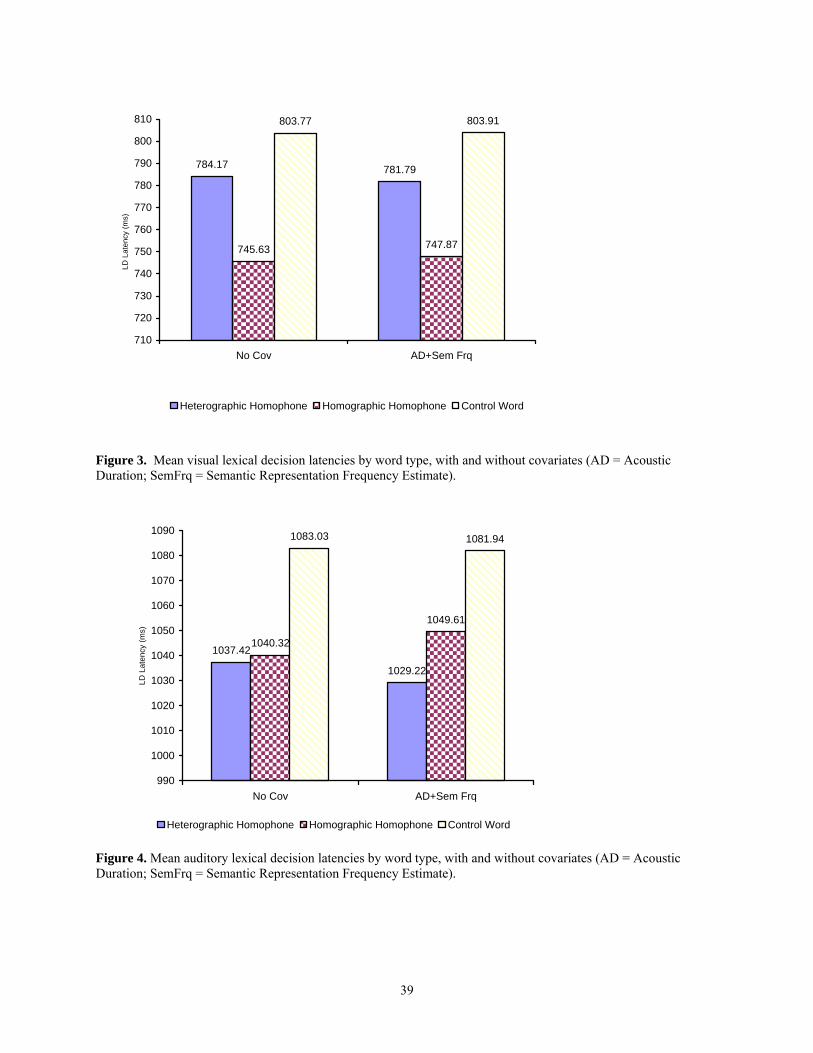
784.17 781.79
745.63 747.87
803.77 803.91
710
720
730
740
750
760
770
780
790
800
810
No Cov AD+Sem Frq
LD L
aten
cy (m
s)
Heterographic Homophone Homographic Homophone Control Word
Figure 3. Mean visual lexical decision latencies by word type, with and without covariates (AD = Acoustic Duration; SemFrq = Semantic Representation Frequency Estimate).
1037.42
1029.22
1040.32
1049.61
1083.03 1081.94
990
1000
1010
1020
1030
1040
1050
1060
1070
1080
1090
No Cov AD+Sem Frq
LD L
aten
cy (m
s)
Heterographic Homophone Homographic Homophone Control Word
Figure 4. Mean auditory lexical decision latencies by word type, with and without covariates (AD = Acoustic Duration; SemFrq = Semantic Representation Frequency Estimate).
39

5.4. Additional Analyses
Because of the unanticipated interaction between modality and word type, two other
factors were examined for their potential impact on the results. First, data were analyzed with
item accuracy outliers excluded. Item accuracy outliers were defined as those with accuracy 2
SDs below the mean accuracy for words by condition. In the visual condition, 13 stimulus words
(7.22%) were classified as item accuracy outliers and in the auditory condition, 11 stimulus
words (6.11%) were classified as item accuracy outliers. See Table 21 for the item accuracy
outliers disaggregated by word type and modality. Excluding item accuracy outliers did not
change the results (see Appendix J).
Table 21. Item Accuracy Outliers by Modality and Word Type with Accuracy and SDs below Mean
Visual Lexical Decision Auditory Lexical Decision Stimulus Accuracy SDs Below Mn Stimulus Accuracy SDs Below Mn
Heterographic homophones Yon 11% -4.00 Flue 26% -3.22 Firs 34% -2.81 Mote 39% -2.55 Lute 47% -2.12
Homographic homophones Bisque 45% -2.38 Lore 47% -2.26
Control Words Doffed 18% -3.64 Doffed 5% -4.72 Swum 24% -3.33 Hone 21% -3.78 Domed 26% -3.22 Swum 24% -3.61 Flub 32% -2.91 Flub 32% -3.14 Skeet 32% -2.91 Fames 34% -3.02 Chafe 34% -2.80 Slots 37% -2.85 Bouts 37% -2.65 Dens 42% -2.56 Hone 47% -2.13 Skeet 47% -2.26 Bouts 50% -2.09 Note. Shaded items are item accuracy outliers in both modalities.
Second, results were examined with morphologically different heterographic
homophones excluded (i.e., bard/barred, bruise/brews, gaze/gays, hoard/horde/whored,
clod/clawed, nose/knows/noes, ode/owed, prince/prints, tide/tied, and wade/weighed). Excluding
40

morphologically different homophones did not change the results. See Appendix K for a
complete summary of these results.
41

6. Discussion
In this study lexical decision latencies were compared for heterographic homophones,
homographic homophones, and control words in the visual and auditory modalities. As
hypothesized, lexical decision latencies differed significantly as a function of word type, but the
pattern of differences was not the same in the two modalities. In the visual modality, there was a
significant advantage for homographic homophones over both heterographic homophones and
control words, which did not differ. In the auditory modality, by contrast, there was a significant
advantage for both heterographic homophones and homographic homophones over control
words.
As noted in the Introduction, most research in the visual modality has shown that
inconsistency between phonology-to-orthography inconsistency slows response latencies (i.e.,
there is a heterographic homophone disadvantage). Contrary to the past findings indicating a
heterographic homophone disadvantage relative to control words (e.g., Holden, 2002; Pexman &
Lupker, 1999), the present results showed no evidence of a disadvantage for heterographic
homophones relative to control words. With respect to homographic homophones, past findings
are more difficult to interpret due to poor definition of word stimuli in this category. The present
study showed an advantage for homographic homophones which is consistent with findings from
Pexman and colleagues (2004), but not with findings from Rodd and colleagues (2002).
In the auditory modality, evidence at the whole-word grain-size is available only for
homographic homophones, which Rodd and colleagues (2002) showed were processed more
slowly than control words. Results of the present study contradicted Rodd and colleagues (2002)
as homographic homophones showed a significant advantage relative to control words. No
previous study has examined heterographic homophones in the auditory modality; this study
showed a heterographic homophone advantage relative to control words. In short, effects of
42

inconsistency were neither additive nor identical across the two modalities, contrary to what
might have been predicted based on the existing literature.
6.1. Orthographic, Phonologic, and Semantic Influences on Visual and Auditory Lexical Decision
Based on the present visual lexical decision latency results, global resonance among
orthographic, phonologic, and semantic information coheres faster for homographic homophones
than for heterographic homophones or control words. This suggests that the local resonance
between orthographic and semantic information is a strong facilitator of the speed with which the
global resonance will cohere. Both homographic homophones and heterographic homophones
had more than one unrelated semantic representation feeding activation back to phonology and
orthography; however, only homographic homophones had significantly faster lexical decision
latencies compared with control words and heterographic homophones. For heterographic
homophones, more than one unrelated semantic representation may have been activated by
phonologic information; however, because there was no advantage for heterographic
homophones over control words it appears that only one semantic representation cohered with
the presented orthographic representation. Thus, more than one unrelated semantic
representation that feeds activation back to a single orthographic representation appears to cohere
a strong local resonance between orthographic and semantic information that can speed global
resonance allowing a rapid response.
The auditory lexical decision latency results, on the other hand, suggest that global
resonance among orthographic, phonologic, and semantic information coheres faster for both
heterographic homophones and homographic homophones than for control words. Both
heterographic homophones and homographic homophones had more than one unrelated semantic
representation feeding information back to one phonologic representation and both had faster
43
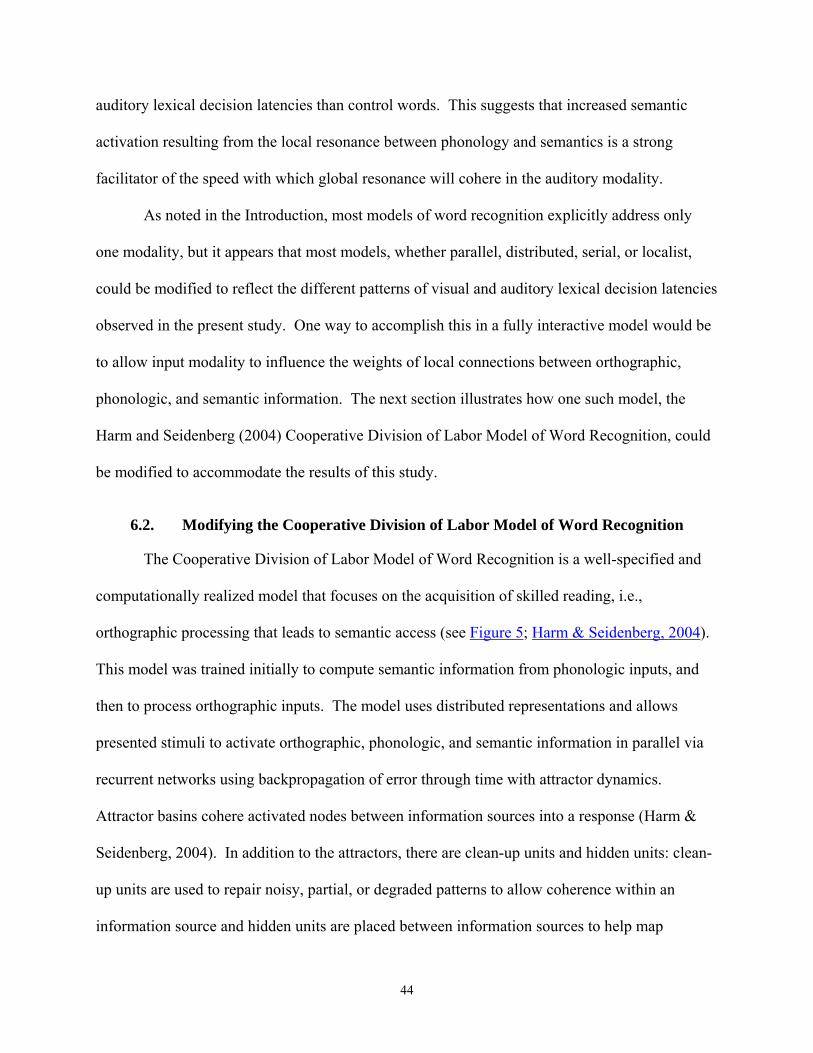
auditory lexical decision latencies than control words. This suggests that increased semantic
activation resulting from the local resonance between phonology and semantics is a strong
facilitator of the speed with which global resonance will cohere in the auditory modality.
As noted in the Introduction, most models of word recognition explicitly address only
one modality, but it appears that most models, whether parallel, distributed, serial, or localist,
could be modified to reflect the different patterns of visual and auditory lexical decision latencies
observed in the present study. One way to accomplish this in a fully interactive model would be
to allow input modality to influence the weights of local connections between orthographic,
phonologic, and semantic information. The next section illustrates how one such model, the
Harm and Seidenberg (2004) Cooperative Division of Labor Model of Word Recognition, could
be modified to accommodate the results of this study.
6.2. Modifying the Cooperative Division of Labor Model of Word Recognition
The Cooperative Division of Labor Model of Word Recognition is a well-specified and
computationally realized model that focuses on the acquisition of skilled reading, i.e.,
orthographic processing that leads to semantic access (see Figure 5; Harm & Seidenberg, 2004).
This model was trained initially to compute semantic information from phonologic inputs, and
then to process orthographic inputs. The model uses distributed representations and allows
presented stimuli to activate orthographic, phonologic, and semantic information in parallel via
recurrent networks using backpropagation of error through time with attractor dynamics.
Attractor basins cohere activated nodes between information sources into a response (Harm &
Seidenberg, 2004). In addition to the attractors, there are clean-up units and hidden units: clean-
up units are used to repair noisy, partial, or degraded patterns to allow coherence within an
information source and hidden units are placed between information sources to help map
44
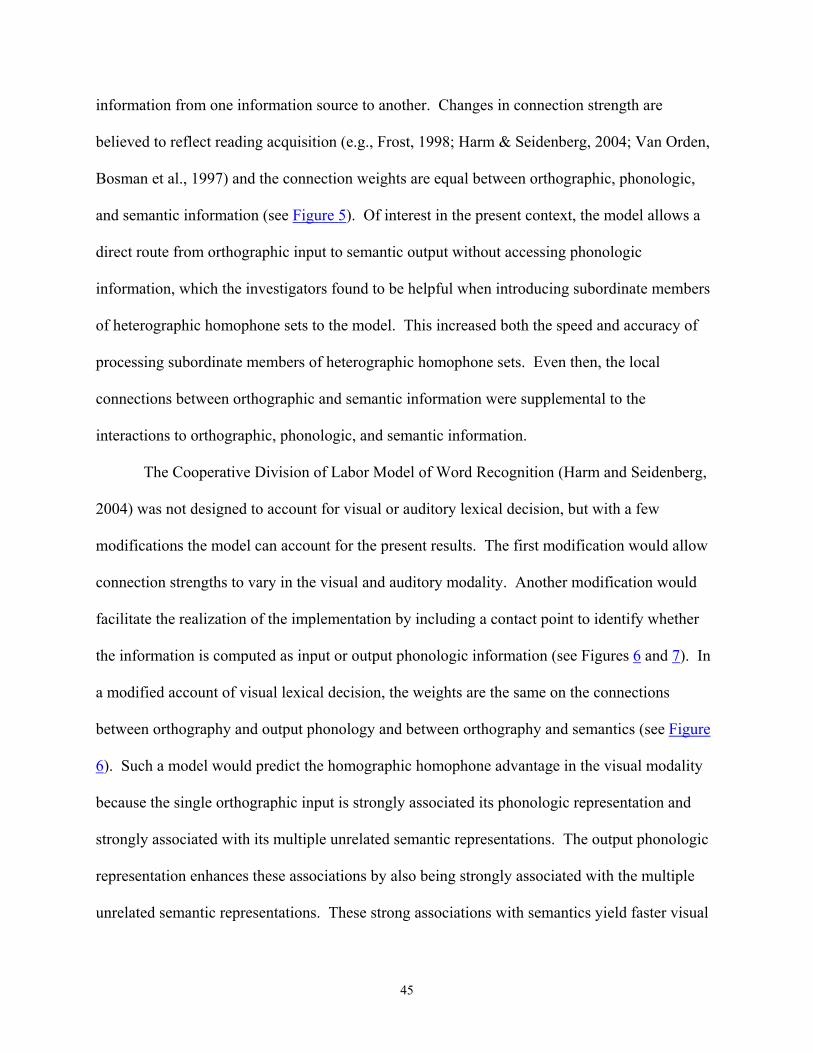
information from one information source to another. Changes in connection strength are
believed to reflect reading acquisition (e.g., Frost, 1998; Harm & Seidenberg, 2004; Van Orden,
Bosman et al., 1997) and the connection weights are equal between orthographic, phonologic,
and semantic information (see Figure 5). Of interest in the present context, the model allows a
direct route from orthographic input to semantic output without accessing phonologic
information, which the investigators found to be helpful when introducing subordinate members
of heterographic homophone sets to the model. This increased both the speed and accuracy of
processing subordinate members of heterographic homophone sets. Even then, the local
connections between orthographic and semantic information were supplemental to the
interactions to orthographic, phonologic, and semantic information.
The Cooperative Division of Labor Model of Word Recognition (Harm and Seidenberg,
2004) was not designed to account for visual or auditory lexical decision, but with a few
modifications the model can account for the present results. The first modification would allow
connection strengths to vary in the visual and auditory modality. Another modification would
facilitate the realization of the implementation by including a contact point to identify whether
the information is computed as input or output phonologic information (see Figures 6 and 7). In
a modified account of visual lexical decision, the weights are the same on the connections
between orthography and output phonology and between orthography and semantics (see Figure
6). Such a model would predict the homographic homophone advantage in the visual modality
because the single orthographic input is strongly associated its phonologic representation and
strongly associated with its multiple unrelated semantic representations. The output phonologic
representation enhances these associations by also being strongly associated with the multiple
unrelated semantic representations. These strong associations with semantics yield faster visual
45

lexical decision latencies to homographic homophones than to control words or heterographic
homophones. A heterographic homophone does not receive the same benefit from the strong
association between its single phonologic representation and multiple semantic representations,
as suggested by the lack of a heterographic homophone advantage compared with control words.
The difference arises from the number of semantic representations associated with the
orthographic input, i.e., heterographic homophones have just one semantic representation for
each orthographic representation and homographic homophones have multiple unrelated
semantic representations for each orthographic representations. For a heterographic homophone,
multiple unrelated semantic representations associated with the phonologic representation of a
heterographic homophone do not remain activated because the orthographic input only activates
one of these semantic representations, which depletes any activation for the other semantic
representations. Accordingly, when orthographic input is used to focus activation, as in visual
lexical decision, heterographic homophones are processed similarly to control words.
In a modified account of auditory lexical decision, by contrast, the strongest weights are
on the connections between input phonology and semantics followed by the connections between
input phonology and orthography, and finally by the connections between orthography and
semantics (see Figure 7). When one phonologic input activates multiple unrelated semantic
representations and the task is lexical decision, there is rapid coherence between the phonologic
input and semantic nodes. This reinforces the other local relationships and focuses them to
cohere into global resonance. This model would predict that heterographic homophones and
homographic homophones would have faster auditory lexical decision latencies than control
words. Thus, in both modalities, if the input representation, orthographic or phonologic, is
associated with multiple semantic representations, then global resonance among orthographic,
46

phonologic, and semantic representations will cohere quickly promoting faster lexical decision
latencies.
Semantics Phonology
Orthography
H
H
HH
C C
Semantics Phonology
Orthography
H
H
HH
C C
Figure 5. Figure of model from Harm and Seidenberg (2004). The authors eventually added feedback from semantics to orthography to allow "spelling verification".
C = Clean-up Units; H = Hidden Units
47

Orthography
Input Phonology
C
Semantics
Output Phonology
C
C
H
H
H
H
H
H
Orthography
Input Phonology
C
Semantics
Output Phonology
C
C
H
H
H
H
H
H
Figure 6. Connection strengths for visual word recognition in the extended Cooperative Division of Labor Model.
Connection strength is illustrated by line thickness and color. Information sources and lines connected with input phonology are in gray because this information does not interact unless there is a spoken presentation. C = Clean-up units; H = Hidden Units. Adapted from Harm and Seidenberg (2004).
Orthography
Input Phonology
C
Semantics
Output Phonology
C
C
H
H
H
H
H
H
Orthography
Input Phonology
C
Semantics
Output Phonology
C
C
H
H
H
H
H
H
Figure 7. Connection strengths for spoken word recognition in the extended Cooperative Division of Labor Model.
Connection Strength is illustrated by line thickness and color. Output phonology and its connections are in gray because unless generation of phonologic information is necessary, output phonology is not in use. C = Clean-up units; H = Hidden Units. Adapted from Harm and Seidenberg (2004).
48

These modifications to the Cooperative Division of Labor Model (Harm & Seidenberg,
2004) should allow it to account for the present results in both the visual and auditory modalities.
Of course, a computational instantiation of the model would be necessary to evaluate its
adequacy in predicting behavioral results (Harm & Seidenberg, 2004).
6.3. Limitations
Limitations of the present study include undetected variation in participants and stimuli.
With respect to participants, reading skill and vocabulary were not measured directly, although
past research has shown different patterns of responses for participants at different reading and
vocabulary levels (e.g., Bell & Perfetti, 1994; Folk, 1999; Folk & Morris, 1995; Unsworth &
Pexman, 2003; Starr & Fleming, 2001). The absence of a heterographic homophone
disadvantage relative to control words during visual lexical decision might suggest that the
participants in the present study were more skilled with reading than participants in other studies
(e.g., Bell & Perfetti, 1994; Unsworth & Pexman, 2003). For example, Unsworth and Pexman
(2003) found that high-skilled and low-skilled readers exhibited a heterographic homophone
disadvantage for visual lexical decision latencies, but high-skilled readers did not exhibit the
same disadvantage for response accuracy unlike the low-skilled readers. By contrast, the present
study did not find evidence of a heterographic homophone disadvantage for visual lexical
decision latencies or for response accuracy compared with control words. An overt measure of
reading skill was not used in the present study because reading skill was not a variable of
interest. In fact, many lexical decision studies indirectly measure reading skill in the manner of
the present study by excluding participants according to some response accuracy level.
Differences in reading skill could contribute to the different findings across studies: Studies
focusing on the visual modality that use highly skilled readers may not find effects that arise
49
from inconsistent orthographic information because their experience with computing meaning
from orthographic information might diminish the need for phonologic information to guide
meaning access. Conversely, readers less skilled with orthographic information might rely more
heavily on phonologic than orthographic information to guide meaning access.
Similarly, without a direct measure of the participants’ vocabulary knowledge, it is
impossible to know whether their vocabularies included at least two unrelated semantic
representations for the homographic homophones and at least two orthographic representations
with unrelated semantic representations for the heterographic homophones. The main control
placed on participant knowledge was the exclusion of inaccurate responses. An indirect control
comes from the validity study for the semantic representation frequency estimates using the
homographic homophones (see Appendix F). In this study, 22 native English-speaking
participants from the University of Pittsburgh rated the frequency of occurrence for at least two
semantic representations of homographic homophones and their ratings of perceived semantic
representation frequency were within 2 SDs of the Internet-based semantic representation
frequency estimates. Direct evidence that the participants in the visual and auditory condition
were similar with respect to reading skill and vocabulary knowledge would further strengthen the
results of this study.
Additional possible limitations center on the stimulus items, the use of Internet-based
semantic representation frequency estimates and list context effects. With respect to stimulus
items, it is possible that uncontrolled systematic differences among word types could have
contributed to the results. For example, orthographic and phonologic neighborhood density have
been argued to influence word recognition latencies, although recent investigations have shown
that orthographic neighborhood size accounts for negligible amounts of variability in visual and
50
auditory lexical decision (e.g., Balota et al., 2004; Ziegler, Muneaux, & Grainger, 2003). These
factors could not be controlled while maintaining the other necessary stimulus features for this
investigation, but their potential influence cannot be discounted.
Internet-based estimates were used in an effort to equate the word types for semantic
representation frequency because there were problems with the use of word association norms to
measure semantic representation frequency for homographic homophones (de Groot, 1989;
Gilhooly & Logie, 1980; Griffin, 1999). In past studies, researchers (e.g., Pexman & Lupker,
1999; Rodd et al., 2002) used objective frequency counts to match frequencies between
homographic homophones and control words without accounting for the potential difference
between the semantic representation frequency estimates for homographic homophones and
control words.
Because semantic dominance was based on the semantic representation frequency
estimates, there may have been a difference between participant perceived dominance and actual
dominance, which could have led to a reduced chance of finding the homographic homophone
and heterographic homophone disadvantages. The correlation between Internet-based semantic
dominance scores and participant-based semantic dominance estimates was r = 0.71 (p < 0.01)
for homographic homophones, which is significant and strong but only accounts for 49.70% of
the variance. Although the mean semantic dominance scores did not differ significantly for
heterographic homophones and homographic homophones, 20% (12) of the heterographic
homophones have semantic dominance scores within 10% of each other versus 36.67% (22) of
the homographic homophones. A greater number of homographic homophones that are closely
balanced should have enhanced the chance of finding either a homographic homophone
advantage or disadvantage for visual and auditory lexical decision latencies by allowing each
51
semantic representation equal opportunity to influence responses (Folk & Morris, 1995). A brief
analysis of the stimulus words by semantic dominance subtype within each modality did not
reveal significant differences (Fs < 1). However, power was between 0.38 and 0.35 for this
variable in the visual and auditory modalities for homographic homophones. Although it would
be ideal to control this factor in the future, doing so would be impossible while maintaining the
other controls.
Stimulus words can yield list context effects, which are likely associated with loading the
lists with items that have extreme values along the targeted dimensions, which becomes
implicitly or explicitly apparent to the participants yielding strategic responses (Balota et al.,
2004). For example, visual lexical decision latencies to words presented with
pseudohomophonic nonwords are longer than those to words presented with pronounceable
nonwords (e.g., Pexman et al., 2001). This effect is argued to suggest that pseudohomophonic
nonwords attune participants to the orthographic information of the stimulus. In the present
study several participants mentioned that there was something different about the orthographic
representations of the stimulus words. Participants could have been influenced by the
preponderance of semantically ambiguous words because two-thirds of the words were
heterographic homophones and homographic homophones. This would provide a fast and
accurate way to classify these word types, thus yielding faster responses to homophones than
control words in both visual and auditory lexical decision. However, this possibility is mitigated
by the different responses to homographic and heterographic homophones.
6.4. Directions for Future Research
The present study has several important implications for future research. Researchers
need to be careful when selecting and classifying all stimulus words. Removing the cross-
52

classification of words within each word type presented a different picture for the present study:
there was not a heterographic homophone disadvantage relative to control words and there was a
homographic homophone advantage. In fact, there was an advantage for heterographic
homophones over control words in the auditory modality. The modality difference is important
to note because researchers often conduct experiments on language-based effects in the visual
modality, assuming that results will generalize to the auditory modality (Frost, 1998). The
present study suggests the need for caution in such generalization.
The present results also suggest that reading skill and vocabulary knowledge should be
measured directly, perhaps by a recognition-based vocabulary quiz for the representations of
heterographic and homographic homophones. In addition, differences in frequency of word
occurrence in visual as compared with spoken language may be an important variable. For
example, homographic homophones bisque and lore were item accuracy outliers in the auditory
condition but not in the visual condition. This suggests participants may have read these two
words more frequently than they heard them. Conversely, five heterographic homophones were
item accuracy outliers in the visual condition, yon, flue, firs, mote, and lute, but none of these
were item accuracy outliers in auditory lexical decision. For such words, their frequency within
each modality may influence their speed of coherence.
Furthermore, it would be very interesting to extend stimulus word sets to include
homographic heterophones (e.g., bow → bo[ and be[) to better understand the role of
phonologic inconsistency and clarify whether activation is excitatory or inhibitory among the
phonologic information nodes and the role of the connection between orthographic information
and semantic information. Finally, it is unknown whether these results would generalize to other
language processing tasks. For example, patterns of performance have been reported to differ in
53

visual lexical decision vs single-word oral reading as well as in auditory lexical decision vs oral
shadowing tasks (e.g., Balota et al., 2004; Ziegler et al., 2003). Information about the influence
of orthographic, phonologic, and semantic information sources across all language-based tasks is
a prerequisite to fully specified models of language processing.
54

APPENDIX A
Models of Word Recognition
55

Models of Word Recognition
Several models of word recognition are presented in this appendix and described using
the following characteristics. The label is first, followed by the description of the information in
each row:
1. Primary concern(s): What is/are the primary effects that the model was designed to explain?
2. Modality: Which modality was the model designed to account for? 3. Basic Format: Connectionist vs. Dynamical vs. Dual-Route. A model can take more than
one approach. 4. Computational: Has the model been implemented computationally? 5. Information Processing: Does the model assume information processing occurs in serial,
in parallel, or in both ways? 6. Information Sources: Orthography, phonology, and semantics. Which information
source(s) are implemented and/or hypothesized to operate in the model? 7. Type of Representations: What type(s) of representations does the model use? i.e.,
Distributed representations include a set of units and each unit participates in the representation of many words. Localist representations use individual units to represent the orthography, phonology, and semantics of a word or the word’s lexical entry.
8. Routes: How many are there? Describe. 9. Interactivity: Does the model assume interactivity? 10. Homogeneous or Heterogeneous: Homogeneous means all computations involve the
same kinds of structures. Heterogeneous means computations involve different structures. 11. Hidden Units: Does the model use hidden units? Describe. 12. Connection weights: Describe any connection weights. 13. Connection Strength(s) and Mapping Ease: Do the connection strengths and/or ease of
mapping(s) between information sources vary? Describe. 14. Attractors/Attractor basins: Does the model use attractors or attractor basins? 15. Learning: Description of learning if it exists.
56

16. Developmental Explanation: Describe the account for the development trajectory of
learning. 17. Design Constraints: Are there any constraints on the system? How do these occur? 18. Model Limitations: What limits the model from changing? 19. Related Model(s): List a few related models if any exist.
57

Connectionist Networks: General Principles (Rueckl, 2002)
Design Characteristics Primary concern(s): Overview of dynamical systems approach to visual
word recognitionModality: Discussed in terms of VWR, but theoretically could
account for SWR Basic Format: Connectionist and Dynamical Computational: Some Information Processing: Parallel Information Sources: Orthography, phonology, & semantics Type(s) of Representations: Distributed but can be localist at smallest grain-size of
theoretical importance Routes: N/A Interactivity: Most exhibit some amount of interactivity Homogeneous or Heterogeneous: Primarily homogeneous Hidden Units: Model dependent Connection Weights: • Coupling parameters control the interactions
among nodes • These are determined by learning process tuning
the network to environment and task demands • Weights contain the internal constraints and act to
ensure that the states of a network’s components are mutually consistent
Connection Strength and Mapping Ease:
Network dependent
Attractors/Attractor Basins: • Self-organizing attractor dynamics • Over time a model’s pattern of activation moves
toward a stable state • Upon reaching attractor state the network remains
there until input changes (i.e., perturbation) • State space includes fixed points of attractors and
repellers • Positions of attractors in state space are organized
to reflect similarities in orthography, phonology, and semantics
• When properly trained, each word has a unique attractor
Learning Occurs: Learning algorithm is used to adjust connection strengths such that activation flow is tailored to structure and task demands of environment
Developmental Explanation Model dependent Design Constraints: • State of a dynamical system characterized by one
or more state parameters varying across model • Self-causal: Changes in system state are a
58

Design Characteristics consequence of state dependent processes
• Control parameters (e.g., weights & external input) determine the structure of the flow field
• External constraints on the dynamics of word identification reflect optical push that seeing orthography exerts on lexical system
• Self-organizing on 2 time scales: faster time scale is equal to reading rate and slower time scale is the connectivity pattern which adjusts weights to tune network to structure of environment and task demands
• Parametric control includes potentially many options to accommodate strategy effects
Model Limitations: N/A Related Models: • Harm and Seidenberg (2004)
• Plaut et al. (1996) • Resonance model by Van Orden and colleagues • Connectionist Dual-Process Model (e.g., Zorzi,
2000)
59

Computing Meanings of Words in Reading: Cooperative Division of Labor between
Visual and Phonological Processes (Harm & Seidenberg, 2004)
Design Characteristics Primary concern(s): • Model of meaning computation based on principles
explored in previous work and allowing both pathways to activate semantics (Primary)
• Feasibility of orthography to semantics pathway • Developmental trajectory from language acquisition to
skilled reading • Heterographic homophone and pseudohomophone
processing • Effect(s) of masking on lexical processing
Modality: Designed to account for VWR, but theoretically could account for SWR
Basic Format: Connectionist and Dynamical Computational: Yes – Modified backpropagation Information Processing: Parallel Information Sources: Orthography, phonology, & semantics Type(s) of Representations: Distributed Routes: N/A Interactivity: • Interactive
• Feedback is overtly represented between phonology and semantics
• Feedback is overtly represented between orthography and semantics in the last adaptation of the model
Homogeneous or Heterogeneous:
Homogeneous
Hidden Units: • Yes • Mediate computations • Assist with encoding complex relations between codes • Individual hidden units are not dedicated to individual
words Connection Weights: • Weights on connections between units are used to
process all words • Cooperative division of labor: contribution of one set of
weights to output depends on contribution of other set of weights
• Adjusted by backpropagation of error through the network and moving each weight in a direction that minimizes the error
• Regularities are encoded in the weights Connection Strength and Mapping Ease:
• Orthography → Phonology & Orthography → Semantics connections differ in degree vs. kind
60

Design Characteristics • System learns the regularities from the training corpus
and encodes as weights • Orthography → phonology are correlated with each
other • Phonology → Semantics is known • Orthography → Semantics is difficult to learn but faster
to compute Attractors/Attractor Basins: • Add a time-varying component to processing
• Network can change state in response to own state & external input
Learning Occurs: • Variant of backpropagation for training attractor networks to settle into patterns over time
• A letter pattern is presented to the model and it computes semantic output which is compared to correct target
• Discrepancy used to make small adjustments to weights • Across experiences, weights gradually assume values
yielding accurate performance Developmental Explanation • Learning to read is central to the model
• Approximates some aspects of children’s knowledge • Models learning phonology → semantics before adding
orthography • Does not account for explicit learning which occurs in
classrooms Design Constraints: • Minimal assumptions about nature of orthographic,
phonologic, and semantic codes, but incorporates strong assumptions about the relationships among these
• Phonology develops as an underlying representation mediating between production and comprehension of spoken language
• Pretrained component on relationships between phonologic and semantic patterns for words was in place when orthographic patterns were introduced
• Semantic representations were composed of meanings with elements recurring in many words and meanings with different representations
• Capacity to encode letter strings • Assumes that the readers should compute meanings
quickly and accurately which demands maximum activation from all available resources; network was penalized for incorrect or slow responses and error was injected early to encourage quick ramp up of activity
• Orthography → phonology → semantics peaks and increased accuracy of intact model is due to additional
61

Design Characteristics learning in orthography → semantics
• System responds to task assigned and division of labor shifts as skill acquired with orthography → semantics becoming more efficient
Model Limitations: • Phonological representations do not capture all aspects of phonological knowledge
• Has not attempted to simulate course of phonological acquisition
• Does not account for visual or auditory lexical decision Related Models: • Plaut et al. (1996)
• Resonance model by Van Orden and colleagues
62
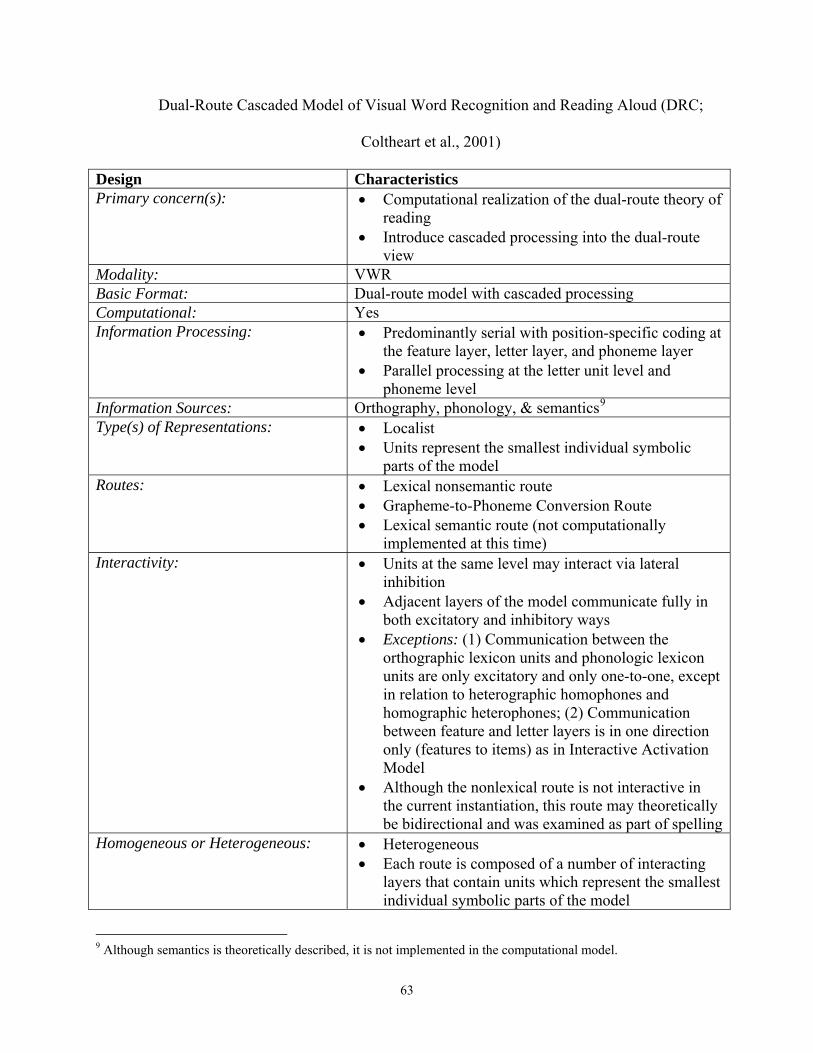
Dual-Route Cascaded Model of Visual Word Recognition and Reading Aloud (DRC;
Coltheart et al., 2001)
Design Characteristics Primary concern(s): • Computational realization of the dual-route theory of
reading • Introduce cascaded processing into the dual-route
view Modality: VWR Basic Format: Dual-route model with cascaded processing Computational: Yes Information Processing: • Predominantly serial with position-specific coding at
the feature layer, letter layer, and phoneme layer • Parallel processing at the letter unit level and
phoneme level Information Sources: Orthography, phonology, & semantics9
Type(s) of Representations: • Localist • Units represent the smallest individual symbolic
parts of the model Routes: • Lexical nonsemantic route
• Grapheme-to-Phoneme Conversion Route • Lexical semantic route (not computationally
implemented at this time) Interactivity: • Units at the same level may interact via lateral
inhibition • Adjacent layers of the model communicate fully in
both excitatory and inhibitory ways • Exceptions: (1) Communication between the
orthographic lexicon units and phonologic lexicon units are only excitatory and only one-to-one, except in relation to heterographic homophones and homographic heterophones; (2) Communication between feature and letter layers is in one direction only (features to items) as in Interactive Activation Model
• Although the nonlexical route is not interactive in the current instantiation, this route may theoretically be bidirectional and was examined as part of spelling
Homogeneous or Heterogeneous: • Heterogeneous • Each route is composed of a number of interacting
layers that contain units which represent the smallest individual symbolic parts of the model
9 Although semantics is theoretically described, it is not implemented in the computational model.
63

Design Characteristics Hidden Units: None mentioned Connection Weights: • Constant weights associated with the
communications between two units • Remain same for all connected units for any two
communications between units in two adjacent layers
Connection Strength and Mapping Ease:
• Hardwired to be sensitive to computationally generated GPC rules
• Hardwired to be frequency-sensitive • Hardwired with phonotactic rules and
morphophonemic rules Attractors/Attractor Basins: N/A Learning Occurs: Hardwired by the authors using past research Developmental Explanation Does not overtly account for reading acquisition, but
claims that learning to read can be understood in the context of the model via rule learning.
Design Constraints: • Operates with words up to 9 letters long • Added a blank-letter detector to each set of 26 letter
detectors that is activated when there is no letter in that particular position in the letter string
• Feature, letter, and phoneme layers have position-specific coding and different subsets of units for each position in the input or output string
• Heterographic homophones have separate units in the orthographic lexicon but a common unit in the phonologic lexicon
• Homographic heterophones have a single unit in the orthographic lexicon but separate units in the phonologic lexicon for each pronunciation
• Lexical Nonsemantic Route: Generates pronunciation of a word via sequential processes; units in the orthographic lexicon are frequency sensitive
• GPC Route: Uses GPC rules selected on statistical grounds and context sensitive grounds to convert a letter string into a phoneme string; serial processing from left-to-right using rules
• Lexical Semantic Route: to be implemented later • Weak phonology theory for all tasks • Claims to account for spelling-to-dictation of words
because of feedback from the phoneme level to the letter level in the lexical route, but admits must adapt to allow the model to spell regular words, irregular words, and nonwords
64

Design Characteristics • Extensions made for spelling-to-dictation are argued
to allow the model to account for auditory lexical decision results
• Pathway that readers use to recognize words may change to accommodate task demands
• Reliance on assembled phonology may be reduced or eliminated when the stimulus set includes pseudohomophone foils because readers shift processing away from nonlexical assembled phonology and rely on lexical processing because these distinguish them from words
• Predicts a null or reduced regularity effect when pseudohomophone foils are included in lexical decision
Model Limitations: • Predicts a frequency by regularity interaction, not found by Jared (2002)
• Restricted to monosyllabic words and acknowledges need for rules for assigning stress and vowel reduction
• Does not accurately account for masking research because masking indicates a role for early phonologic influences on processing
• Does not consider orthographic body a level of representation and if shown to be then DRC will be refuted
• Crude lexical decision process, but the model was not designed to account for lexical decision
• Not developed to explain consistency effects, but claims these are part of neighborhood consistency
• Accounting for strange words (e.g., weird) because does not allow a priori subcategories of exception words
• No limits because researchers can always propose extra components and pathways to accommodate unexpected main effects (Gibbs & Van Orden, 1998)
• Questionable utility for understanding the flexibility of human performance (Gibbs & Van Orden, 1998)
Related Models: • Interactive-Activation and Competition Model: McClelland & Rumelhart (1981) and Rumelhart & McClelland (1982)
65

Connectionist Models of Word Reading: PMSP96
(Plaut, McClelland, Seidenberg, & Patterson, 1996)
Design Characteristics Primary concern(s): • Connectionist account of knowledge representation
and cognitive processing in quasi-regular domains • Specific context of normal and impaired word
reading Modality: VWR; theoretically, it could account for SWR Basic Format: Connectionist Computational: Yes Information Processing: Yes Information Sources: Orthography, phonology, & semantics10
Type(s) of Representations: • Distributed • Graphotactic and Phonotactic specifications
Routes: N/A Interactivity: • Interactive
• Componential attractors • Uses an abstraction of a recurrent implementation
Homogeneous or Heterogeneous: • Homogeneous Hidden Units: • Yes
• Networks containing hidden units ca overcome the limitations of having only input and output units
• Sensitivity to higher order combinations of input units
• Tend to make similar responses to similar inputs and can respond to input pattern with nonstandard phonologic representation, yielding an inconsistency disadvantage
Connection Weights: Weight changes were modified using the training procedure for frequencies of occurrence of words
Connection Strength and Mapping Ease:
• Mapping between semantics and phonology develops before reading acquisition
• Orthography → semantics can be acquired when learning to read, like orthography → phonology
• Orthography → phonology is more structured and degree of learning within semantics is likely sensitive to frequency with which words are encountered
• Strength of semantic contribution to phonology in reading increases gradually over time and is stronger
10 Semantics is always in the theoretical model, but is not implemented in the computational model until Simulation 3.
66

Design Characteristics for high-frequency words
Attractors/Attractor Basins: • Componential attractors are developed in learning to map orthography to phonology
• Substructure that reflects common sublexical correspondences between orthography and phonology
• Applies to most words and nonwords, providing correct pronunciations
• Attractors for exception words are less componential Learning Occurs: • Backpropagation over time adapted for continuous
units • Continuous propagation of error backwards • If targets remain constant over time, output units
will attempt to reach their targets quickly and remain there
Developmental Explanation • Demonstration of development is beyond scope of work
• Makes assumptions about the system’s inputs and outputs even thought these are learned internal representations
• Attempted to make these broadly consistent with relevant developmental and behavioral data
Design Constraints: • Based on a number of principles of information processing (e.g., GRAIN)
• 2 simulations are feedforward which do not account for interactivity and randomness
• Phonologic and semantic pathways must work together to support normal skilled reading
Model Limitations: • Not designed to account for development • Different results from human data in Jared (2002)
for Simulations 1 and 4 Related Models: • Seidenberg & McClelland (1989)
• Fully interactive models (e.g., Resonance model by Van Orden and colleagues and Recurrent feedback models)
67

The TRACE I & II Model of Speech Perception (McClelland, 1991; McClelland &
Elman, 1986a, 1986b)
Design Characteristics Primary concern(s): Apply ideas embodied in interactive activation model of
word perception to speech perceptionModality: SWR Basic Format: Connectionist Computational: Interactive Activation Information Processing: Activates successive units in time, but this spreads activation
throughout system Information Sources: Phonology (feature level, phoneme level, & word level) Type(s) of Representations: • Localist
• One independent processing unit devoted to each representational unit in each level
• Units are repeated in each time slice Routes: N/A Interactivity: • Interactive
• Perceptual processing of older portions of the input continues even as newer portions being processed
• Excitatory activation between levels • Inhibitory activation among nodes within a level • Model can anticipate the word with each time slice of
phonetic information Homogeneous or Heterogeneous: • Homogeneous whenever possible
• Heterogeneous in that units are repeated in each time slice
Hidden Units: N/A Connection Weights: • Not in original versions
• Weight modulation by adjacent time slices Connection Strength and Mapping Ease:
Hard-wired by the authors
Attractors/Attractor Basins: Network can change state in response to own state & external input
Learning Occurs: Hard-wired by creators Developmental Explanation Not an objective and not accounted for Design Constraints: • At the feature level there are banks of feature detectors,
one for each of several dimensions of speech sounds • At the phoneme level there are phoneme detectors • At the word level there are detectors for every word • Entire network of units referred to as the trace because
the pattern of activation remaining from a spoken input is a trace of the analysis of the input at each of the three processing levels
68
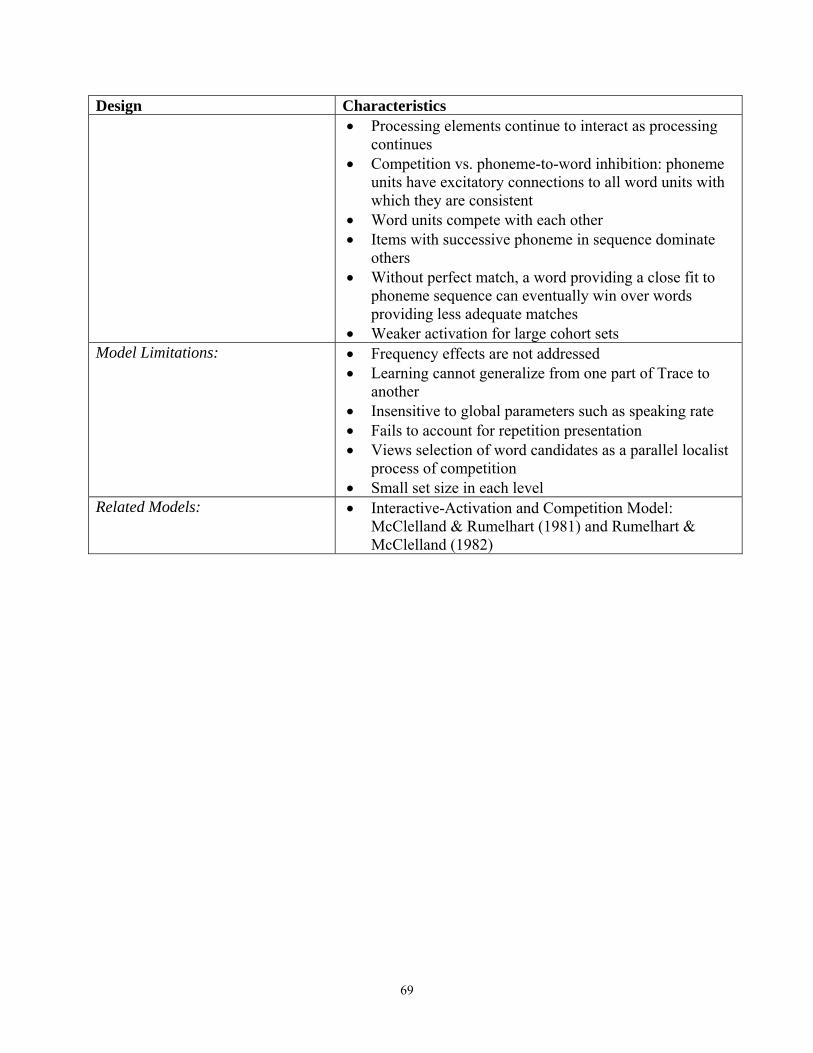
Design Characteristics • Processing elements continue to interact as processing
continues • Competition vs. phoneme-to-word inhibition: phoneme
units have excitatory connections to all word units with which they are consistent
• Word units compete with each other • Items with successive phoneme in sequence dominate
others • Without perfect match, a word providing a close fit to
phoneme sequence can eventually win over words providing less adequate matches
• Weaker activation for large cohort sets Model Limitations: • Frequency effects are not addressed
• Learning cannot generalize from one part of Trace to another
• Insensitive to global parameters such as speaking rate • Fails to account for repetition presentation • Views selection of word candidates as a parallel localist
process of competition • Small set size in each level
Related Models: • Interactive-Activation and Competition Model: McClelland & Rumelhart (1981) and Rumelhart & McClelland (1982)
69

Resonance Model/Recurrent Feedback Model
(Stone & Van Orden, 1994; Stone et al., 1997; Van Orden, 2002; Van Orden &
Goldinger, 1994; Van Orden, Bosman et al., 1997; Van Orden, Jansen op de Haar, &
Bosman, 1997)
Design Characteristics Primary concern(s): Phonology is fundamental to reading and spelling Modality: VWR & some SWR Basic Format: Connectionist & Dynamical Computational: No Information Processing: Parallel Information Sources: Orthography, phonology, & semantics Type(s) of Representations: • Distributed, subsymbolic
• Finest grain-size of orthographic-phonologic-semantic correspondences that correlate with performance
Routes: N/A Interactivity: • Interactive
• Recurrent feedback/Resonance • Governed by sigmoid (nonlinear) signal function • Cooperative interactions included • Feedback from phonologic information rapidly organizes
perception, mediating local competitions to organize the visual stimulus
Homogeneous or Heterogeneous: • Homogeneous Hidden Units: N/A Connection Weights: • Depends on consistency and inconsistency of mappings
• Frequency of mappings and words Connection Strength and Mapping Ease:
• Phonologic coherence hypothesis: orthographic-phonologic resonances cohere before orthographic-semantic resonances
• Primacy of orthographic-phonologic is guaranteed because statistical and strengthened by frequency
• For high frequency or regular words, resonance between letters and phonemes may occur so rapidly that perception appears direct yielding ceiling effects
• Phonologic-semantic relationship is stronger than orthographic-semantic relationship because we speak before we read; asymmetry self-perpetuates because reading strengthens phonologic-semantic representations because phonology functions
Attractors/Attractor Basins: • Well-learned patterns for meaningful words • Develop as a consequence of learning
70

Design Characteristics • Within the attractor basin, dynamics move encodings
toward respective attractor point • Distance traveled in attractor basin between initial
encoding and attractor point is positively correlated with response time
Learning Occurs: • Covariant learning principle • System behavior should reflect the cumulative statistical
relationships between inputs and outputs • Model uses vectors to limit cross-talk • High frequency words are less influenced by cross talk • The closer the actual output is to the correct output, the
faster the model generates a response • Implicit process cleans up cross talk and more cross talk
leads to more clean-up time • Inconsistent cross talk increases competition for resonance
which increases response latencies Developmental Explanation Uses covariant learning principle Design Constraints: • Units begin mutual activation simultaneously, but cannot
support response until achieve resonance • Every node in the orthography, phonology, and semantic
group of nodes is bidirectionally connected every node in the other two groups
• Interactivity assumption leads to prediction that visual and spoken word recognition should be influenced by orthography-to-phonology inconsistency and phonology-to-orthography inconsistency
• Nodes are fully interdependent • After initial spread of activation, cooperating-competitive
dynamics begin among all subsymbol groups and coherent structures emerge as relatively stable feedback loops
• Flexible change in patterns of activation and adaptation to task and context
• A naming response is specified when orthographic and phonologic subsymbols cohere in resonance; first, the strongest pronunciation may be activated and if incorrect it will be unstable and weaker pronunciation is activated because more stable
• A lexical decision response occurs when the system state for word stimuli can be distinguished from that for nonword stimuli; if no semantic context, orthographic-phoneme connections should cohere first because graphemes and phonemes tightly covary; because nonwords also activate semantic nodes, initial activation is not enough to distinguish words from nonwords; words
71

Design Characteristics are distinguished as their stable feedback loops build on initial activation and inhibit spurious activation
• Mismatch index is an estimate of overall coherence which is the difference between feedforward activation on orthographic nodes and feedback patterns. Illegal & legal nonwords entail more mismatch than pseudohomophones because they generate less semantic activity
• In context, orthographic-phonologic covariation still exerts role in perception, but in highly predictive context, semantic resonance may cohere quickly optimizing reading
• Involves parametric control to accommodate strategy effects
Model Limitations: • Hidden units will be necessary for this model to operate quickly and allow combination of information
• Assumption of recurrent feedback does not naturally accommodate the assumption of pathway selection
Related Models: • Interactive-Activation and Competition Model: McClelland & Rumelhart (1981) and Rumelhart & McClelland (1982)
• Plaut et al (1996) • Harm and Seidenberg (2004)
72

Connectionist Dual-Process Model
(Zorzi, 2000; Zorzi, Houghton, & Butterworth, 1998)
Design Characteristics Primary concern(s): • Model of reading that maintains the uniform
computational PDP style without rigid commitment to single route
• Separating different knowledge into different systems yields successful modeling of surface dyslexia
Modality: VWR Basic Format: Connectionist Computational: Yes – standard backpropagation learning algorithm Information Processing: Parallel Information Sources: Orthography & Phonology Type(s) of Representations: • Distributed
• Direct pathway: extracts sublexical spelling-sound relationships
• Mediated pathway: forming word-specific representations that are distributed via backpropagation training
Routes: Two: mediated and direct Interactivity: • Interactive
• Task demands interact with initial network architecture Homogeneous or Heterogeneous: Homogeneous Hidden Units: • Form intermediate representations in mapping from
orthography to phonology • In mediated pathway act to inhibit the wrong phoneme
candidates activated by the direct connections and reinforce correct phoneme units
Connection Weights: Error signals used to change weights on direct and mediated pathways in parallel
Connection Strength and Mapping Ease:
• Self-organization of the system emerges from the interaction of task demands with an initial pattern of connectivity permitting direct and mediated interactions
• Consistency yields greater strength/ease of mapping Attractors/Attractor Basins: N/A Learning Occurs: • Sublexical route learns typical spelling-to-sound
correspondences via a 2-layer network • Lexical route converts print to speech via direct
activation of the word’s phonologic representation learned in a 3-layer network containing orthographic input, hidden units, and phonologic output
Developmental Explanation N/A Design Constraints: • Does not implement an orthographic lexicon: print
73

Design Characteristics directly activates the word’s phonologic representation
• Two sources of information feeding output • Backpropagation is used in the mediated pathway but
not in the direct pathway Model Limitations: • Lacks semantic information
• GPC rules in spite of body-rime primacy for English Related Models: • Plaut et al (1996)
• DRC Coltheart et al. (2001)
74

Independent Activation Meaning Model (Dixon & Twilley, 1999a, 1999b; Twilley & Dixon, 2000)
Design Characteristics Primary concern(s): • Lexical ambiguity resolution
• Provide a framework for much existing data on ambiguity resolution and incorporate several common approaches to ambiguity resolution as special cases
• Influence of context on comprehension in many domains
Modality: VWR, but theoretically could account for SWR Basic Format: Connectionist formulation with some nonlinearity Computational: Yes Information Processing: Parallel Information Sources: • Semantics
• Input/perceptual piece which may be orthography or phonology
Type(s) of Representations: • Distributed • Large sets of microfeatures used for word meanings • One meaning can be written as a vector of activations
Routes: N/A Interactivity: • Independent
• Information flows unidirectionally from one process to another
• Presumes feedback is slow but access and integration inputs combine to determine activation level for word meanings
• Weak influence of implicit feedback loop between the level of word meanings and integration input
• Weak potential for interactive feedback among word meanings
Homogeneous or Heterogeneous: Homogeneous Hidden Units: N/A Connection Weights: Simple incremental learning algorithms are used to learn
connection weights associating a word in context with one meaning
Connection Strength and Mapping Ease:
Appear modulated by meaning frequency
Attractors/Attractor Basins: N/A Learning Occurs: Hard-wired Developmental Explanation N/A Design Constraints: • Feedback is slow and any influences processing
weakly • Input from access processes is determined by
perceptual encoding and varies over time
75
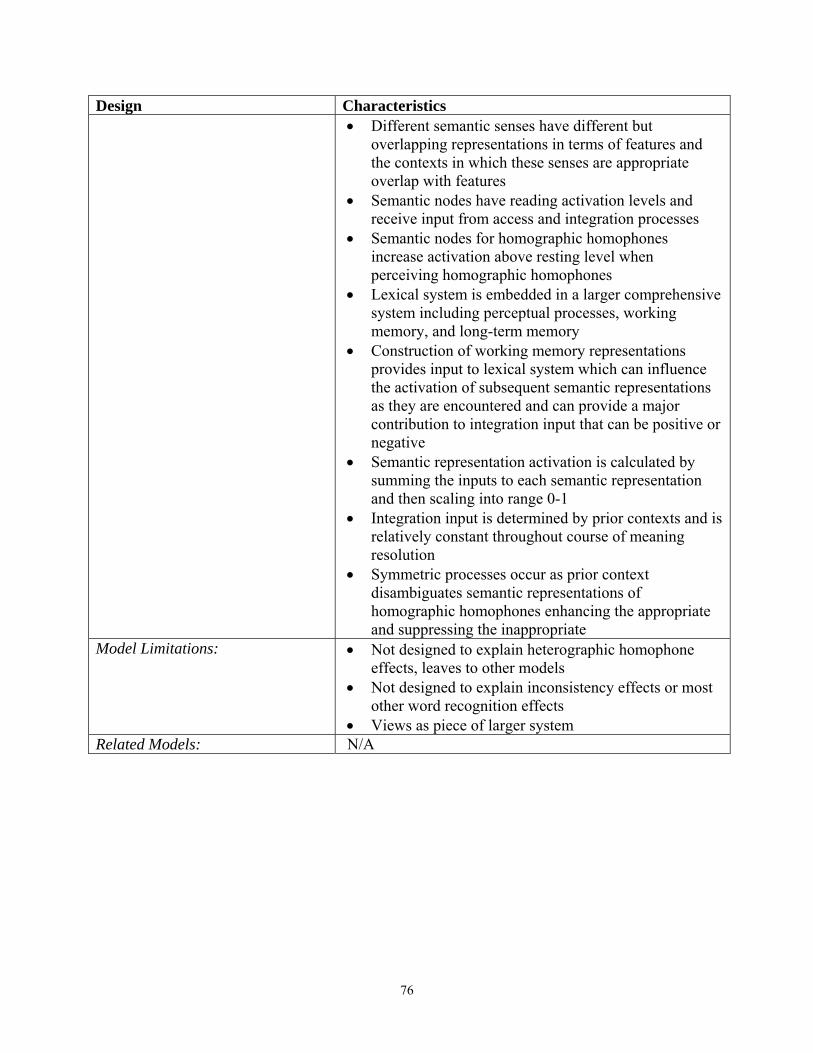
Design Characteristics • Different semantic senses have different but
overlapping representations in terms of features and the contexts in which these senses are appropriate overlap with features
• Semantic nodes have reading activation levels and receive input from access and integration processes
• Semantic nodes for homographic homophones increase activation above resting level when perceiving homographic homophones
• Lexical system is embedded in a larger comprehensive system including perceptual processes, working memory, and long-term memory
• Construction of working memory representations provides input to lexical system which can influence the activation of subsequent semantic representations as they are encountered and can provide a major contribution to integration input that can be positive or negative
• Semantic representation activation is calculated by summing the inputs to each semantic representation and then scaling into range 0-1
• Integration input is determined by prior contexts and is relatively constant throughout course of meaning resolution
• Symmetric processes occur as prior context disambiguates semantic representations of homographic homophones enhancing the appropriate and suppressing the inappropriate
Model Limitations: • Not designed to explain heterographic homophone effects, leaves to other models
• Not designed to explain inconsistency effects or most other word recognition effects
• Views as piece of larger system Related Models: N/A
76
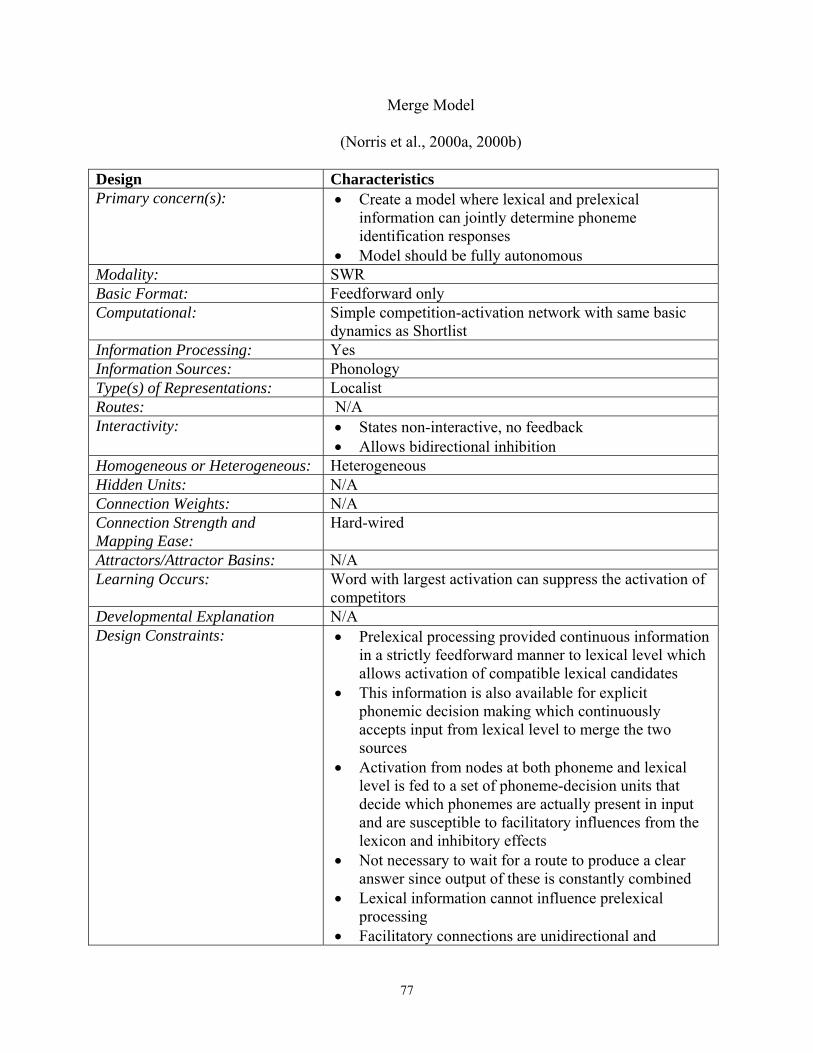
Merge Model
(Norris et al., 2000a, 2000b)
Design Characteristics Primary concern(s): • Create a model where lexical and prelexical
information can jointly determine phoneme identification responses
• Model should be fully autonomous Modality: SWR Basic Format: Feedforward only Computational: Simple competition-activation network with same basic
dynamics as Shortlist Information Processing: Yes Information Sources: Phonology Type(s) of Representations: Localist Routes: N/A Interactivity: • States non-interactive, no feedback
• Allows bidirectional inhibition Homogeneous or Heterogeneous: Heterogeneous Hidden Units: N/A Connection Weights: N/A Connection Strength and Mapping Ease:
Hard-wired
Attractors/Attractor Basins: N/A Learning Occurs: Word with largest activation can suppress the activation of
competitors Developmental Explanation N/A Design Constraints: • Prelexical processing provided continuous information
in a strictly feedforward manner to lexical level which allows activation of compatible lexical candidates
• This information is also available for explicit phonemic decision making which continuously accepts input from lexical level to merge the two sources
• Activation from nodes at both phoneme and lexical level is fed to a set of phoneme-decision units that decide which phonemes are actually present in input and are susceptible to facilitatory influences from the lexicon and inhibitory effects
• Not necessary to wait for a route to produce a clear answer since output of these is constantly combined
• Lexical information cannot influence prelexical processing
• Facilitatory connections are unidirectional and
77

Design Characteristics inhibitory connections are unidirectional
• Lexical network is created dynamically: word nodes are not permanently connected to decision nodes
Model Limitations: • Claim phonology-to-orthography inconsistency disadvantage is an effect of type frequency
• Prelexical phoneme level duplicated at the phoneme decision stage
• Feedforward models accumulate ad hoc explanations each time they confront a new feedback phenomenon
• Fails with respect to parsimony • Cannot account for context-sensitive speech data • Unnatural explanation for decisions
Related Models: Shortlist (Norris, 1994)
78

Modeling the Effects of Semantic Ambiguity in Word Recognition
(Rodd et al., 2002, 2004)
Design Characteristics Primary concern(s): • Implications of semantic ambiguity for connectionist
word recognition models • Illustrate the related semantic representation advantage
and the unrelated semantic representation disadvantage
Modality: VWR Basic Format: Connectionist Computational: Yes Information Processing: Yes Information Sources: Orthography & Semantics Type(s) of Representations: Distributed semantic representations Routes: N/A Interactivity: • Feedforward from orthography to semantics
• Recurrent connections between semantic representations
Homogeneous or Heterogeneous: Homogeneous Hidden Units: N/A Connection Weights: Weights are set by the connection strength between the
units Connection Strength and Mapping Ease:
Connection strengths were learned via an error-correcting learning algorithm
Attractors/Attractor Basins: • Unrelated semantic representations of homographic homophones correspond to separate attractor basins in different regions of semantic space and process of moving away from blend state makes these words more difficult to recognize
• Related semantic representations of polysemous words correspond to the overlapping regions in semantic space which broadens the attractor basin
• Related semantic representation benefit should be restricted to lexical decision
Learning Occurs: • Connection strengths were initially set to 0 • Network presented with a single training pattern • Error-correcting learning algorithm changed
connection strengths for feedforward connections from orthographic to semantic units and recurrent connections between semantic units
Developmental Explanation N/A Design Constraints: • No feedback from semantics to orthography
• Attractor space
79

Design Characteristics Model Limitations: • No role for phonologic information
• Not designed to account for all types of semantic ambiguity effects (e.g., Heterographic homophones)
• Restricted to lexical decision Related Models: N/A
80

81
APPENDIX B
Word Recognition Models and Influences on Word Recognition

Word Recognition Models and Influences on Word Recognition
VWR Naming Model Frequency: HF
words < LF words latencies
Orthographic length: Long > Short latencies
OP Inconsistency disadvantage for
latencies
Pseudohomophone advantage for
latencies
Heterographic homophone disadvantage
latencies
Homographic homophone advantage latencies
Division of Labor (H&S2004)
+ + + + + c + c
DRC (Coltheart et al., 2001) + + + (neighborhood
consistency) + - +
PMSP96 + + + + +c + TRACE II -a - a - a - a - a - a
Resonance Model + + + + + c +
Connectionist Dual-Process Model
+ + + + - + c
Independent Activation Meaning Model
+ - b - b - b - b +
Merge - a - a - a - a - a - a
Rodd et al., 2004
- b - b - b - b
- (cannot because separate orthographic
representation for each unrelated semantic
representation would yield different result)
- (claims should be disadvantage)
Note. OP = orthography-to-phonology; PO = phonology-to-orthography; + = accounts for; - = cannot account for; p-g = phoneme-to-grapheme; r-b = rime-body; b-r = body-rime anot designed to account for this modality; bmodel is supplemental to other word recognition models for this effect; cDid not mention this result, but theoretically could account for
82

VWR Lexical Decision
Model
Frequency: HF words < LF words latencies
OP Regularity disadvantage:
Irregular > Regular latencies
PO Inconsistency disadvantage
at p-g for latencies
PO Inconsistency
disadvantage at r-b for latencies
Heterographic homophone disadvantage
latencies
Homographic homophone advantage latencies
Homographic homophone disadvantage
latencies
Division of Labor (H&S2004)
+ + c + c + c + c + c + c
DRC (Coltheart et al., 2001)
+ -, Predicts null or
reduced when pseudohomophones
included - - - + -
PMSP96 + + c + c + c +c + + c
TRACE II -a - a - a - a - a - a - a
Resonance Model + + + + + c + +
Connectionist Dual-Process Model
+ - - - + + -
Independent Activation Meaning Model
+ - b - b - b - b + -
Merge - a - a - a - a - a - a - a
Rodd et al., 2004 - b - b - b - b
- (separate ortho rep per unrelated
semantic rep would yield different result)
- +
Note. OP = orthography-to-phonology; PO = phonology-to-orthography; + = accounts for; - = cannot account for; p-g = phoneme-to-grapheme; r-b = rime-body; b-r = body-rime, anot designed to account for this modality; bmodel is supplemental to other word recognition models for this effect; cDid not mention this result, but theoretically could account for
83
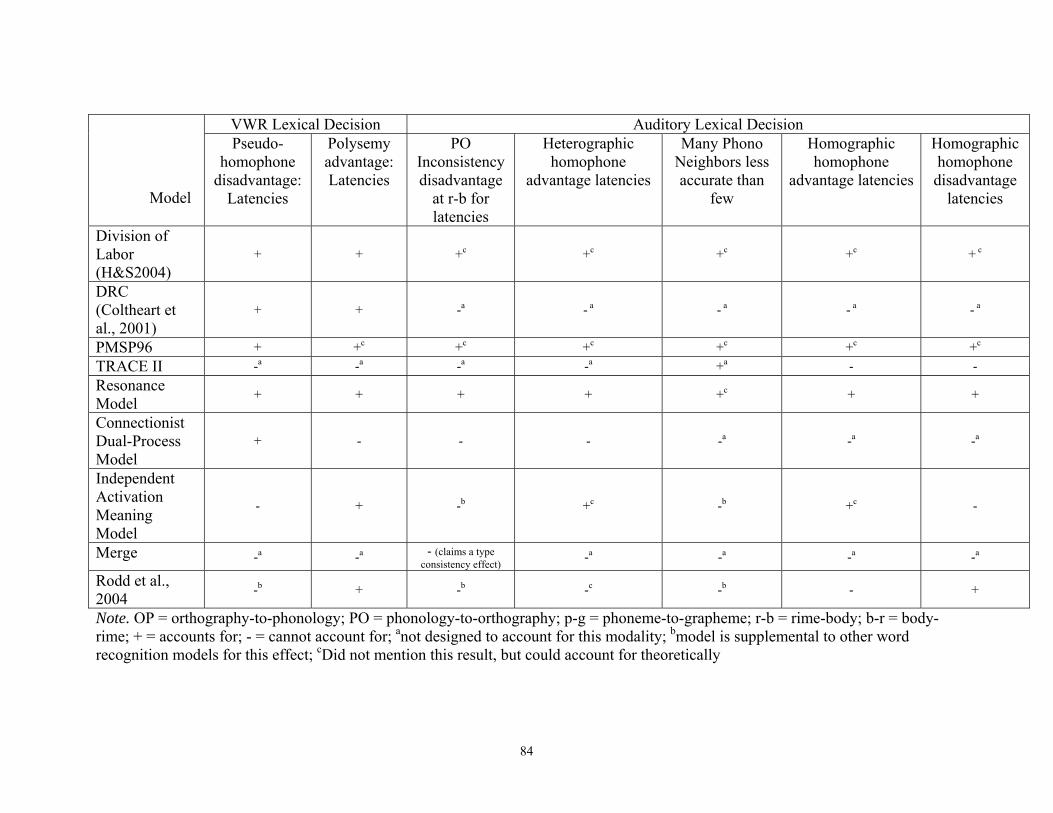
84
VWR Lexical Decision Auditory Lexical Decision
Model
Pseudo-homophone
disadvantage: Latencies
Polysemy advantage: Latencies
PO Inconsistency disadvantage
at r-b for latencies
Heterographic homophone
advantage latencies
Many Phono Neighbors less accurate than
few
Homographic homophone
advantage latencies
Homographic homophone disadvantage
latencies
Division of Labor (H&S2004)
+ + +c +c +c +c + c
DRC (Coltheart et al., 2001)
+ + -a - a - a - a - a
PMSP96 + +c +c +c +c +c +c
TRACE II -a -a -a -a +a - - Resonance Model + + + + +c + +
Connectionist Dual-Process Model
+ - - - -a -a -a
Independent Activation Meaning Model
- + -b +c -b +c -
Merge -a -a - (claims a type consistency effect) -a -a -a -a
Rodd et al., 2004 -b + -b -c -b - +
Note. OP = orthography-to-phonology; PO = phonology-to-orthography; p-g = phoneme-to-grapheme; r-b = rime-body; b-r = body-rime; + = accounts for; - = cannot account for; anot designed to account for this modality; bmodel is supplemental to other word recognition models for this effect; cDid not mention this result, but could account for theoretically

APPENDIX C
Background History Form
85

Participant #
BACKGROUND QUESTIONNAIRE
Age Major Circle 1 for each of the following Highest grade completed: high school diploma/GED College year completed: freshman sophomore junior senior graduate school Gender: male female Race: African-American Hispanic Caucasian Asian American Indian Other: Is your native language English? YES NO Do you have any physical limitations that may affect your ability to push buttons with either of your hands (e.g., paralyzed or weak hand)? YES NO Do you have normal or corrected-to-normal vision with or without corrective lenses (20/25)? YES NO Have you ever taken a course in phonetic transcription or do you know how to phonetically transcribe? YES NO Have you ever been diagnosed with a learning disability (e.g., dyslexia, reading disability, language learning disability, central auditory processing disorder, etc.) or a neurological impairment (e.g., seizures, epilepsy, ADHD/ADD, traumatic brain injury, etc.)? YES NO Did you ever receive special education or resource services, tutoring for reading or language difficulties, or speech-language therapy? YES NO
86

APPENDIX D
Directions for Selecting Words to Obtain Semantic Representation Frequency Estimates
87

Directions for Choosing Words to Obtain Semantic Representation Frequency Estimates
1. Co-occurrences define an orthographic representation’s semantic context, which includes its related semantic representations in Wordsmyth (i.e., the definitions included in a single dictionary entry)
2. Select the co-occurrence words using no more than 10 of the following, selected across
the related definitions a. The defining characteristics (i.e., single content words in the definitions that
characterize the meaning of the word) b. Synonyms listed in the dictionary entry c. Near synonyms listed in the dictionary entry d. Related words listed in the dictionary entry
i. NOTE – sometimes the related definitions refer to different aspects of words so make sure to use at least one word from each ‘distinct’ definition
ii. e.g., yield contains several related definitions including “to give forth or produce” and “to give up; surrender; relinquish” which are distinct and require different words to capture the majority of its senses
iii. Co-occurrence words should be chosen that encompass a majority of the related definitions of the words
e. Feel free to use different morphological inflections of words as co-occurrence (e.g., warn and warning) because sometimes the word being searched for occurs with both at some point.
3. Special case – Homographic homophones
a. Because homographic homophones have one orthographic representation for one phonologic representation and more than one unrelated semantic representation (as represented by having more than one dictionary entry in Wordsmyth) it is necessary to make sure that the co-occurrence words selected for these stimuli do NOT overlap.
b. That is, a co-occurrence word for these stimuli must be specific to each unrelated semantic representation. If it could overlap with the two of the unrelated semantic representations then it may NOT be included as a co-occurrence word for either unrelated semantic representation.
c. Suggestion: Do the homographic homophones first and then the other words because this will solidify the co-occurrence word criteria.
4. Examples
a. Control words – e.g., beep beep Browse the words alphabetically around "beep" See entries that contain "beep"
Syllables: beep Parts of speech: noun , intransitive verb , transitive verb Part of Speech noun Pronunciation
88

bip Definition1.a short, usu. high-pitched warning signal. Part of Speech intransitive verb Inflected Forms beeped, beeping, beeps Definition1.to emit a short warning signal. Example The microwave oven will beep when the food is ready. Part of Speech transitive verb Definition1.to cause to emit a short warning signal. Example He beeped his car horn at the dog in the road. For this you might select the co-occurrence words of warning, signal, horn, car, short, warn b. Heterographic homophones would be the same as control words. c. Homographic homophones – e.g., tag
tag1
Browse the words alphabetically around "tag1" See entries that contain "tag1"
Syllables: tag Parts of speech: noun , transitive verb , intransitive verb Part of Speech noun Pronunciation taeg
Definition1.a piece of cardboard, thin metal, plastic, or other material that identifies, labels, or shows the price of that to which it is attached. Synonyms tab (1) , label (1) , ticket (3) Similar Words docket , stub , sticker Definition2.any of various distinctive ends, esp. of something hanging loose, as a shoelace or an animal's tail. Synonyms trailer (1) , tail (1,2) Similar Words train , end Definition3.a floppy or ragged tatter or projection. Synonyms tail (4) , flap (1) , tatter (1) Similar Words lappet , stub , shred , lap2 Definition4.a phrase, speech, or the like that serves as an ending or summation. Synonyms appendix (1) , annex (2) Similar Words postscript , codicil , summation , rider Definition5.a phrase, nickname, or the like that serves to characterize someone or something. Synonyms name (2) , nickname (1) , label (2) Similar Words term , sobriquet , epithet Related Words name , appendix , appendage , adjunct , appellation , affix
Part of Speech transitive verb Inflected Forms tagged, tagging, tags Definition1.to attach a tag or tags to, as one or more items for sale. Synonyms ticket (2) , label (1) Similar Words tab Definition2.to identify or characterize, esp. with a word or phrase. Example She tagged him as an egotist. Synonyms nickname , label (2) , call (10) , term Crossref. Syn. mark , label Similar Words dub1 , designate Definition3.to add or append. Example The lawyer tagged an extra fee on my bill. Synonyms tack on {tack (vt 2)} , affix (2) , suffix (2) , append (1) , annex (1) Crossref. Syn. tack Similar Words attach Related Words add , style , mark , stamp , title , call , label , price , ticket
Part of Speech intransitive verb Definition1.(informal) to follow or accompany someone closely (usu. fol. by after or along). Example Being curious, he tagged along with us. Synonyms trail (2) , tail (2) Similar Words follow , pursue , dog (vt)
89
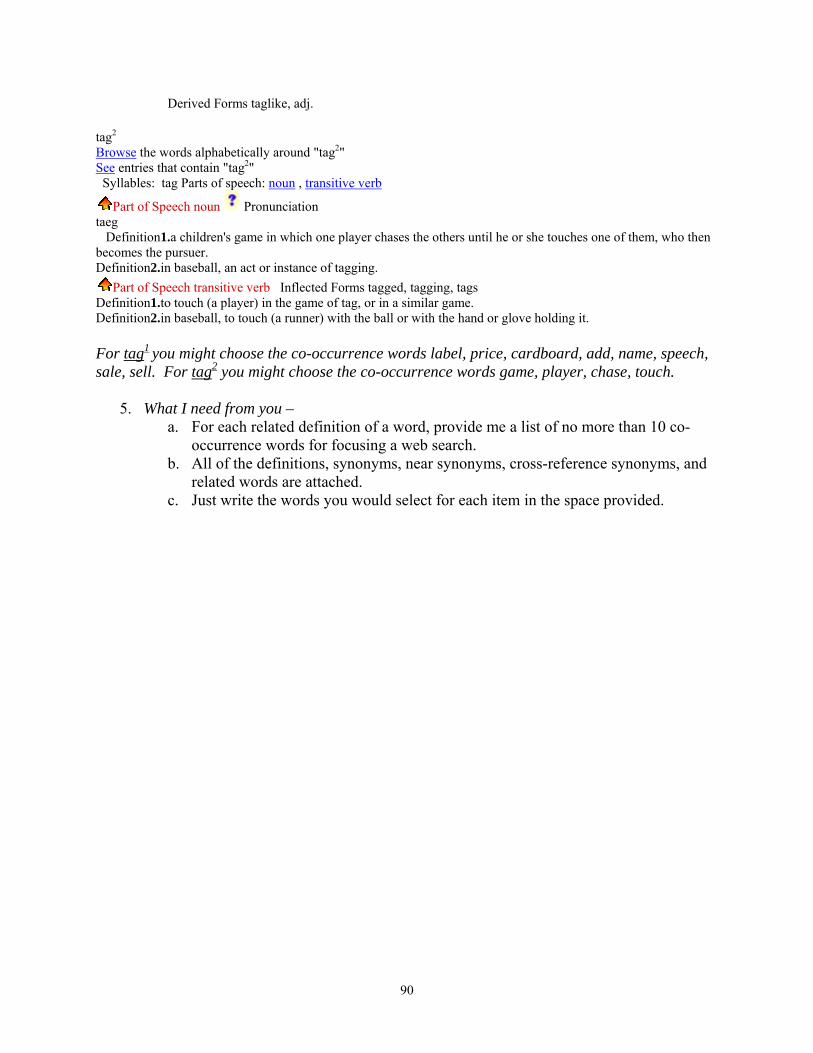
Derived Forms taglike, adj. tag2
Browse the words alphabetically around "tag2" See entries that contain "tag2" Syllables: tag Parts of speech: noun , transitive verb
Part of Speech noun Pronunciation taeg Definition1.a children's game in which one player chases the others until he or she touches one of them, who then becomes the pursuer. Definition2.in baseball, an act or instance of tagging.
Part of Speech transitive verb Inflected Forms tagged, tagging, tags Definition1.to touch (a player) in the game of tag, or in a similar game. Definition2.in baseball, to touch (a runner) with the ball or with the hand or glove holding it. For tag1 you might choose the co-occurrence words label, price, cardboard, add, name, speech, sale, sell. For tag2 you might choose the co-occurrence words game, player, chase, touch.
5. What I need from you – a. For each related definition of a word, provide me a list of no more than 10 co-
occurrence words for focusing a web search. b. All of the definitions, synonyms, near synonyms, cross-reference synonyms, and
related words are attached. c. Just write the words you would select for each item in the space provided.
90

91
APPENDIX E
Word Stimuli

Heterographic homophones
General Properties of Heterographic Homophones Visual Auditory
Phono Ortho Semantic Representation Semantic Rep Freq
Est
Semantic Dominance
Score
# Letters
Acoustic Duration
Mn LD Lat.
Mn Acc.
Mn LD Lat.
Mn Acc.
Visually Presented
arc any curved line; anything shaped like a bow or curve
3,510,000 69.37% 3 /erk/
ark (sometimes cap.) according to the Old Testament, a large boat built by Noah to preserve life during the Flood
1,550,000 30.63% 3
454.81 759.77 0.95 931.00 0.97
x
bard a poet 261,000 44.54% 4 /berd/ barred protected with bars, as a
window 325,000 55.46% 6
515.66 980.58 0.84 1,028.33 0.58 x
bight the loop or slack part of a rope, as opposed to the ends
18,800 0.28% 5
bite to seize with the teeth 3,140,000 46.60% 4
/be]t/
byte in computers, a basic unit of operation, usu. equal to eight binary digits or bits
3,580,000 53.13% 4
504.76 1,139.90 0.56 961.86 0.92
x
brews to make beer or ale, esp. as an occupation
164,000 51.57% 5 /bruz/
bruise to wound or damage without causing a break or rupture
154,000 48.43% 6
642.32 705.61 1.00 1,034.38 0.95
x
dear regarded fondly; expensive 5,920,000 74.94% 4 /dir/ deer any of a family of large,
swift, hoofed mammals, such as the white-tailed deer or the reindeer, the males of which usu. have antlers that grow and are shed yearly
1,980,000 25.06% 4 477.08 683.39 1.00 857.95 1.00
x
doe the female of certain mammals, such as deer and related animals, rabbits and hares, and goats
622,000 37.65% 3 /do[/
dough a thick mixture of flour or meal and a liquid such as
1,030,000 62.35% 5
471.99 712.09 0.97 1,000.31 0.95
x
92
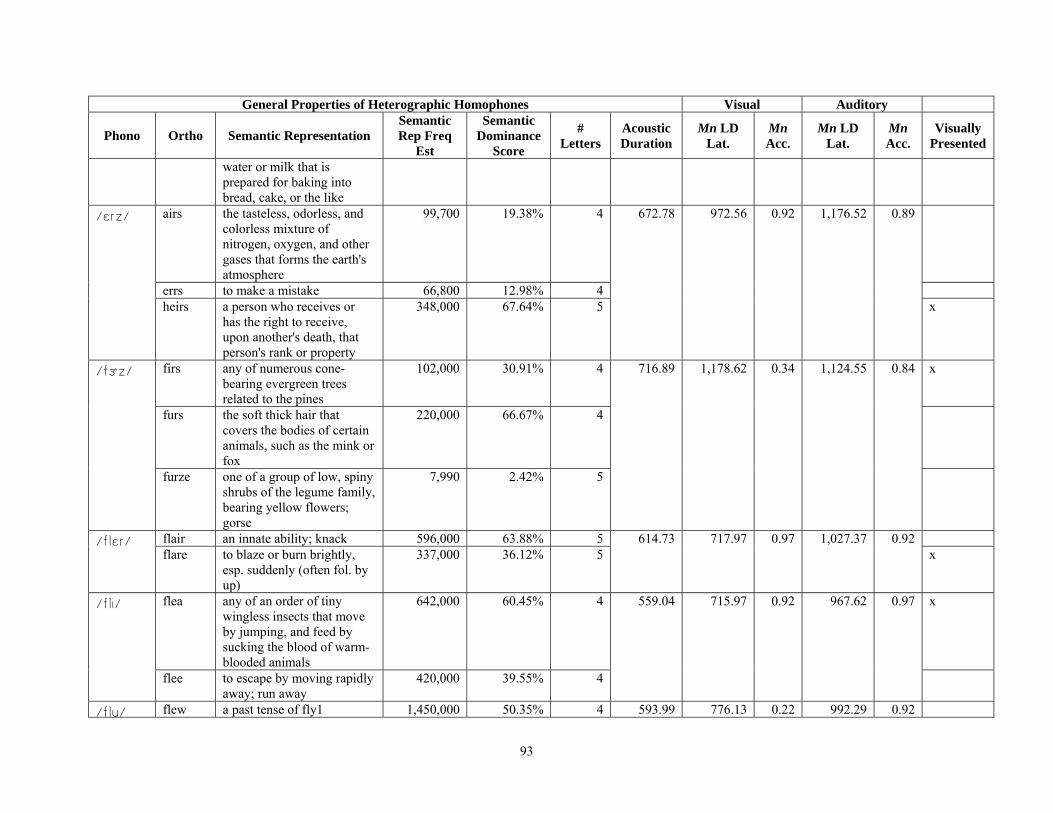
General Properties of Heterographic Homophones Visual Auditory
Phono Ortho Semantic Representation Semantic Rep Freq
Est
Semantic Dominance
Score
# Letters
Acoustic Duration
Mn LD Lat.
Mn Acc.
Mn LD Lat.
Mn Acc.
Visually Presented
water or milk that is prepared for baking into bread, cake, or the like
airs the tasteless, odorless, and colorless mixture of nitrogen, oxygen, and other gases that forms the earth's atmosphere
99,700 19.38% 4
errs to make a mistake 66,800 12.98% 4
/2rz/
heirs a person who receives or has the right to receive, upon another's death, that person's rank or property
348,000 67.64% 5
672.78 972.56 0.92 1,176.52 0.89
x
firs any of numerous cone-bearing evergreen trees related to the pines
102,000 30.91% 4 x
furs the soft thick hair that covers the bodies of certain animals, such as the mink or fox
220,000 66.67% 4
/f6z/
furze one of a group of low, spiny shrubs of the legume family, bearing yellow flowers; gorse
7,990 2.42% 5
716.89 1,178.62 0.34 1,124.55 0.84
flair an innate ability; knack 596,000 63.88% 5 /fl2r/ flare to blaze or burn brightly,
esp. suddenly (often fol. by up)
337,000 36.12% 5 614.73 717.97 0.97 1,027.37 0.92
x
flea any of an order of tiny wingless insects that move by jumping, and feed by sucking the blood of warm-blooded animals
642,000 60.45% 4 x /fli/
flee to escape by moving rapidly away; run away
420,000 39.55% 4
559.04 715.97 0.92 967.62 0.97
/flu/ flew a past tense of fly1 1,450,000 50.35% 4 593.99 776.13 0.22 992.29 0.92
93
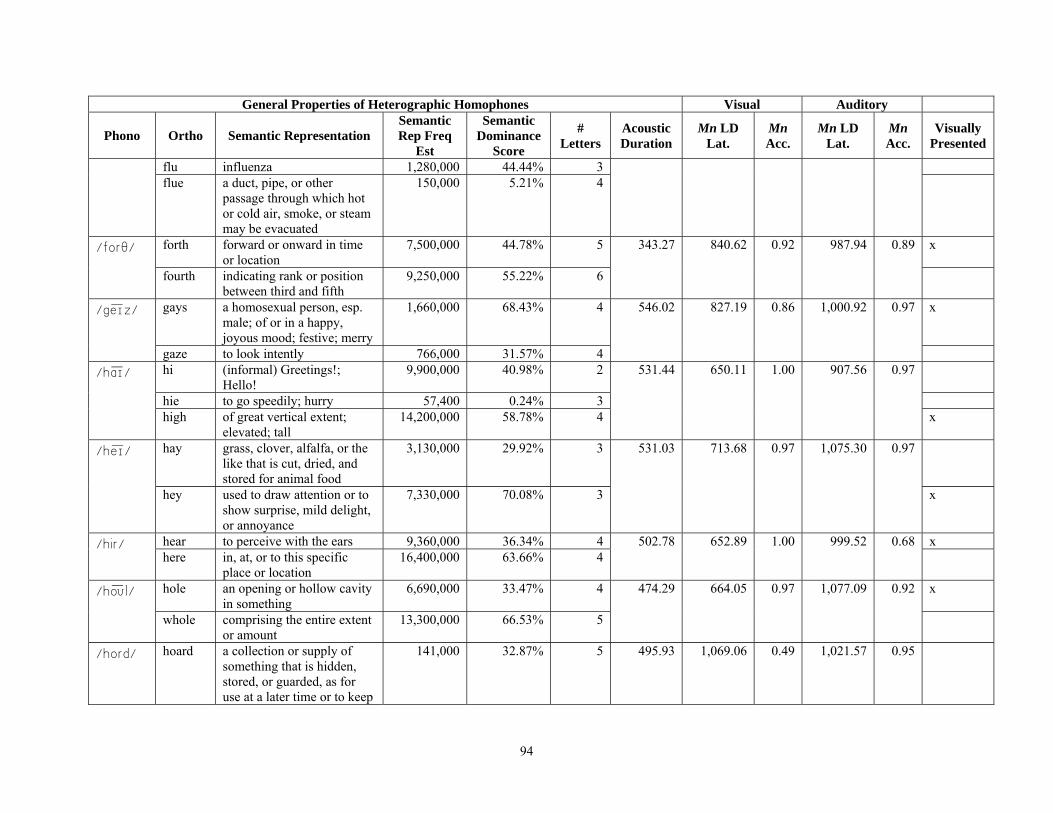
General Properties of Heterographic Homophones Visual Auditory
Phono Ortho Semantic Representation Semantic Rep Freq
Est
Semantic Dominance
Score
# Letters
Acoustic Duration
Mn LD Lat.
Mn Acc.
Mn LD Lat.
Mn Acc.
Visually Presented
flu influenza 1,280,000 44.44% 3 flue a duct, pipe, or other
passage through which hot or cold air, smoke, or steam may be evacuated
150,000 5.21% 4
forth forward or onward in time or location
7,500,000 44.78% 5 x /for'/
fourth indicating rank or position between third and fifth
9,250,000 55.22% 6
343.27 840.62 0.92 987.94 0.89
gays a homosexual person, esp. male; of or in a happy, joyous mood; festive; merry
1,660,000 68.43% 4 x /g3]z/
gaze to look intently 766,000 31.57% 4
546.02 827.19 0.86 1,000.92 0.97
hi (informal) Greetings!;
Hello! 9,900,000 40.98% 2
hie to go speedily; hurry 57,400 0.24% 3
/he]/
high of great vertical extent; elevated; tall
14,200,000 58.78% 4
531.44 650.11 1.00 907.56 0.97
x
hay grass, clover, alfalfa, or the like that is cut, dried, and stored for animal food
3,130,000 29.92% 3 /h3]/
hey used to draw attention or to show surprise, mild delight, or annoyance
7,330,000 70.08% 3
531.03 713.68 0.97 1,075.30 0.97
x
hear to perceive with the ears 9,360,000 36.34% 4 x /hir/ here in, at, or to this specific
place or location 16,400,000 63.66% 4
502.78 652.89 1.00 999.52 0.68
hole an opening or hollow cavity in something
6,690,000 33.47% 4 x /ho[l/
whole comprising the entire extent or amount
13,300,000 66.53% 5
474.29 664.05 0.97 1,077.09 0.92
/hord/ hoard a collection or supply of something that is hidden, stored, or guarded, as for use at a later time or to keep
141,000 32.87% 5 495.93 1,069.06 0.49 1,021.57 0.95
94

General Properties of Heterographic Homophones Visual Auditory
Phono Ortho Semantic Representation Semantic Rep Freq
Est
Semantic Dominance
Score
# Letters
Acoustic Duration
Mn LD Lat.
Mn Acc.
Mn LD Lat.
Mn Acc.
Visually Presented
it from being stolen; cache horde a large number, group, or
crowd; throng; multitude 282,000 65.74% 5 x
whored to engage in prostitution, as the seller or buyer of sexual acts
5,980 1.39% 6
yawn to open the mouth involuntarily while breathing in deeply, usu. as a sign of tiredness, boredom, or the like
175,000 57.19% 4 /yen/
yon from this location to another, esp. to a place at a great distance
131,000 42.81% 3
670.97 940.25 0.11 1,001.09 0.92
x
genes a section of a chromosome that determines the structure of a single protein or part of one, thereby influencing a particular hereditary characteristic, such as eye color, or a particular biochemical reaction
3,780,000 48.65% 5 x /jinz/
jeans (pl.) pants made from a heavy, often blue, twilled cotton cloth
3,990,000 51.35% 5
659.28 773.71 0.92 973.45 1.00
yoke a device used to join together a pair of draft animals, usu. comprising a crossbar with two U-shaped loops, each fitted around the head of an animal
296,000 63.25% 4 /yo[k/
yolk the yellow nutritive substance in an egg, consisting of protein and fat, that is involved directly in the formation of the embryo
172,000 36.75% 4
464.27 749.91 0.94 939.06 0.89
x
95

General Properties of Heterographic Homophones Visual Auditory
Phono Ortho Semantic Representation Semantic Rep Freq
Est
Semantic Dominance
Score
# Letters
Acoustic Duration
Mn LD Lat.
Mn Acc.
Mn LD Lat.
Mn Acc.
Visually Presented
cache a hiding place for treasures or supplies, esp. in the ground
3,120,000 25.66% 5 x /kqc/
cash money in exchangeable form, such as bills, coins, or checks; payment in such form
9,040,000 74.34% 4
649.00 933.37 0.71 1,046.16 0.84
clawed to scratch, tear, dig, or pull something with or as if with claws
83,400 63.33% 6 x /kled/
clod a lump of earth or clay 48,300 36.67% 4
557.44 765.78 1.00 1,265.95 0.57
core the center part of certain
fruits, containing hard material and seeds
7,100,000 62.61% 4 /kor/
corps a branch of the military that has a specialized function
4,240,000 37.39% 5
525.30 738.09 0.86 1,002.63 0.97
x
leach to extract (soluble matter) by means of a percolating liquid
236,000 69.62% 5 /li./
leech any of various primarily aquatic bloodsucking or carnivorous worms, one species of which was formerly used medicinally to bleed patients
103,000 30.38% 5
547.77 777.68 0.97 1,053.79 0.89
x
loot valuables taken by pillaging or plundering, usu. in wartime; spoils
174,000 51.18% 4 /lut/
lute an ancient stringed instrument having a bent, fretted neck and a pear-shaped body
166,000 48.82% 4
530.92 852.78 0.47 1,137.22 0.71
x
morn morning or dawn 132,000 32.27% 4 x /morn/ mourn to feel or show deep sorrow
or grief, esp. for the dead; grieve
277,000 67.73% 5 560.67 763.45 0.63 955.54 0.97
96
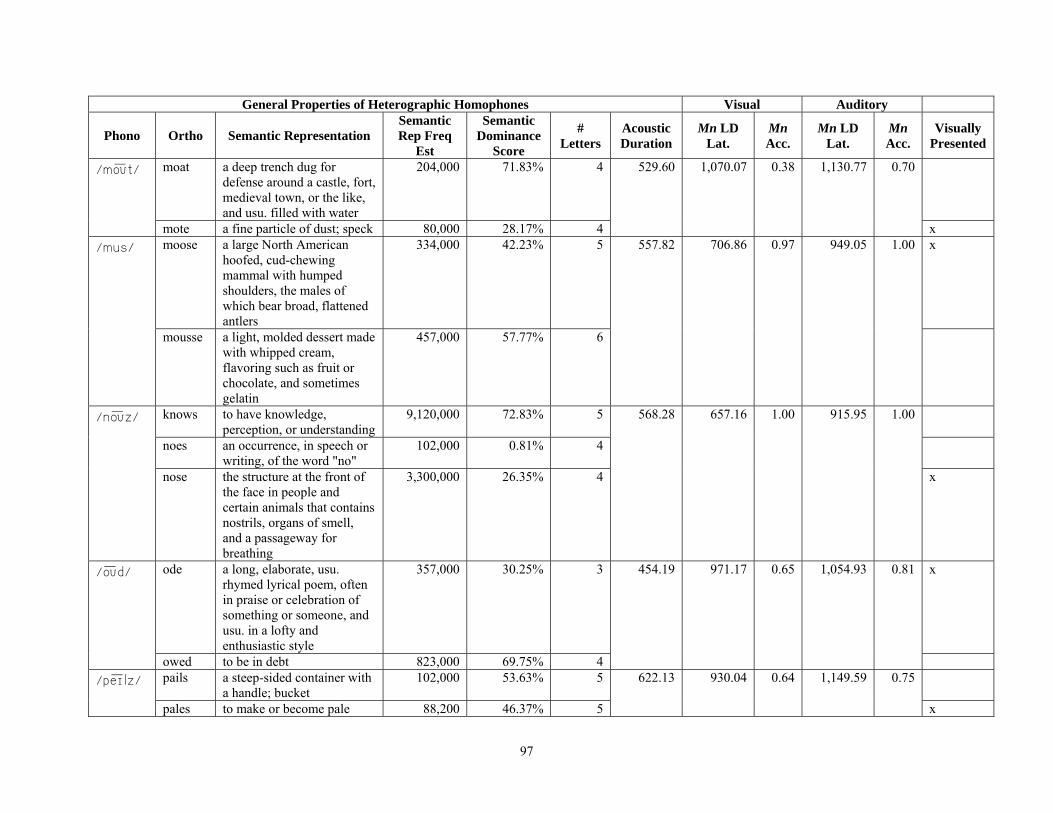
General Properties of Heterographic Homophones Visual Auditory
Phono Ortho Semantic Representation Semantic Rep Freq
Est
Semantic Dominance
Score
# Letters
Acoustic Duration
Mn LD Lat.
Mn Acc.
Mn LD Lat.
Mn Acc.
Visually Presented
moat a deep trench dug for defense around a castle, fort, medieval town, or the like, and usu. filled with water
204,000 71.83% 4 /mo[t/
mote a fine particle of dust; speck 80,000 28.17% 4
529.60 1,070.07 0.38 1,130.77 0.70
x moose a large North American
hoofed, cud-chewing mammal with humped shoulders, the males of which bear broad, flattened antlers
334,000 42.23% 5 x /mus/
mousse a light, molded dessert made with whipped cream, flavoring such as fruit or chocolate, and sometimes gelatin
457,000 57.77% 6
557.82 706.86 0.97 949.05 1.00
knows to have knowledge, perception, or understanding
9,120,000 72.83% 5
noes an occurrence, in speech or writing, of the word "no"
102,000 0.81% 4
/no[z/
nose the structure at the front of the face in people and certain animals that contains nostrils, organs of smell, and a passageway for breathing
3,300,000 26.35% 4
568.28 657.16 1.00 915.95 1.00
x
ode a long, elaborate, usu. rhymed lyrical poem, often in praise or celebration of something or someone, and usu. in a lofty and enthusiastic style
357,000 30.25% 3 x /o[d/
owed to be in debt 823,000 69.75% 4
454.19 971.17 0.65 1,054.93 0.81
pails a steep-sided container with
a handle; bucket 102,000 53.63% 5 /p3]lz/
pales to make or become pale 88,200 46.37% 5
622.13 930.04 0.64 1,149.59 0.75
x
97
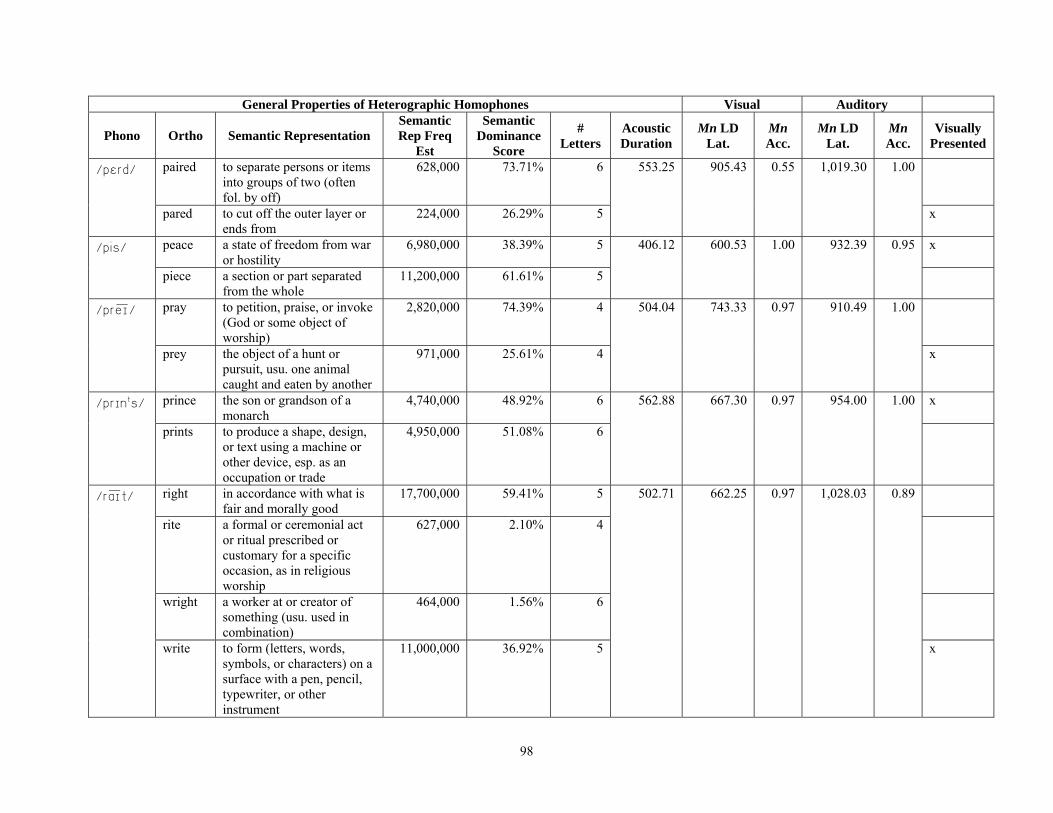
General Properties of Heterographic Homophones Visual Auditory
Phono Ortho Semantic Representation Semantic Rep Freq
Est
Semantic Dominance
Score
# Letters
Acoustic Duration
Mn LD Lat.
Mn Acc.
Mn LD Lat.
Mn Acc.
Visually Presented
paired to separate persons or items into groups of two (often fol. by off)
628,000 73.71% 6 /p2rd/
pared to cut off the outer layer or ends from
224,000 26.29% 5
553.25 905.43 0.55 1,019.30 1.00
x
peace a state of freedom from war or hostility
6,980,000 38.39% 5 x /pis/
piece a section or part separated from the whole
11,200,000 61.61% 5
406.12 600.53 1.00 932.39 0.95
pray to petition, praise, or invoke (God or some object of worship)
2,820,000 74.39% 4 /pr3]/
prey the object of a hunt or pursuit, usu. one animal caught and eaten by another
971,000 25.61% 4
504.04 743.33 0.97 910.49 1.00
x
prince the son or grandson of a monarch
4,740,000 48.92% 6 x /pr8nts/
prints to produce a shape, design, or text using a machine or other device, esp. as an occupation or trade
4,950,000 51.08% 6
562.88 667.30 0.97 954.00 1.00
right in accordance with what is fair and morally good
17,700,000 59.41% 5
rite a formal or ceremonial act or ritual prescribed or customary for a specific occasion, as in religious worship
627,000 2.10% 4
wright a worker at or creator of something (usu. used in combination)
464,000 1.56% 6
/re]t/
write to form (letters, words, symbols, or characters) on a surface with a pen, pencil, typewriter, or other instrument
11,000,000 36.92% 5
502.71 662.25 0.97 1,028.03 0.89
x
98

General Properties of Heterographic Homophones Visual Auditory
Phono Ortho Semantic Representation Semantic Rep Freq
Est
Semantic Dominance
Score
# Letters
Acoustic Duration
Mn LD Lat.
Mn Acc.
Mn LD Lat.
Mn Acc.
Visually Presented
rot to decompose or decay, as organic matter
689,000 40.08% 3 x /ret/
wrought a past tense and past participle of work
1,030,000 59.92% 7
594.35 778.25 0.86 1,053.20 0.81
rained to come down as water from the clouds
233,000 59.05% 6
reigned to exercise the authority of a monarch; act as an absolute ruler
114,000 28.89% 7 x
/r3]nd/
reined (usu. pl.) a set of leather straps attached to both ends of a bridle bit by which a driver or rider can control an animal such as a horse
47,600 12.06% 6
603.27 864.67 0.89 1,200.11 0.71
roles the character played by an actor or actress
4,000,000 52.42% 5 x /ro[lz/
rolls to move by rotating or turning over repeatedly
3,630,000 47.58% 5
597.26 677.89 0.97 1,016.71 0.82
serfs in feudal societies, a person who is held in servitude on a lord's land and who may be sold or otherwise transferred with the land
54,300 53.98% 5 /s6fs/
surfs to ride on the waves of the sea with a surfboard
46,300 46.02% 5
707.76 896.79 1.00 1,182.22 0.84
x
cells a microscopic unit of plant or animal life, containing a nucleus and surrounded by a very thin membrane
5,110,000 55.66% 5 /s2lz/
sells to be involved in selling anything
4,070,000 44.34% 5
629.78 832.43 0.95 1,106.58 0.87
x
/s2nt/ cent a monetary unit of numerous countries, including the United States and Canada; a hundredth part of certain currencies
5,670,000 30.22% 4 503.82 669.43 0.97 992.00 0.97 x
99

General Properties of Heterographic Homophones Visual Auditory
Phono Ortho Semantic Representation Semantic Rep Freq
Est
Semantic Dominance
Score
# Letters
Acoustic Duration
Mn LD Lat.
Mn Acc.
Mn LD Lat.
Mn Acc.
Visually Presented
scent a characteristic odor, esp. a pleasant one
1,090,000 5.81% 5
sent past tense and past participle of send
12,000,000 63.97% 4
scene the place where any event occurs
8,930,000 44.58% 5 x 578.01 664.11 1.00 1,043.78 /sin/
seen past participle of see1 11,100,000 55.42% 4
0.95
slay to kill or murder
deliberately and usu. violently
174,000 39.82% 4 x /sl3]/
sleigh a light horse-drawn cart on runners that is used to carry people over snow and ice
263,000 60.18% 6
623.32 789.75 0.97 1,122.97 0.95
steals to practice or commit theft 434,000 66.16% 6 /stilz/ steels a hard, strong metal alloy
composed of iron and carbon, and used for making machines, tools, knives, and the like
222,000 33.84% 6 759.94 751.74 0.73 1,197.42 0.97
x
son a person's male offspring, either natural or adopted
7,080,000 45.53% 3 x
3
549.50 640.68 1.00 976.21 1.00 /s4n/
sun the central star of the solar system around which the earth and other planets revolve and from which heat and light issue
8,470,000 54.47%
suite several things that collectively form a set or series
8,950,000 58.34% 5 /swit/
sweet having a flavor like that of sugar or honey; not bitter, salty, or sour in taste
6,390,000 5
616.02 666.55 1.00 1,003.92 0.97
41.66% x
/te]d/ tide the periodic change, occurring about every twelve hours, in the height of the surface of oceans and
2,060,000 50.61% 4 523.61 744.58 1.00 1,067.12 0.89
100

General Properties of Heterographic Homophones Visual Auditory
Phono Ortho Semantic Representation Semantic Rep Freq
Est
Semantic Dominance
Score
# Letters
Acoustic Duration
Mn LD Lat.
Mn Acc.
Mn LD Lat.
Mn Acc.
Visually Presented
bodies of water near or feeding into them, caused by the gravitational pull of the moon and sun
tied to form a connection or bond
2,010,000 49.39% 4 x
tail an animal's rearmost part, usu. an appendage and extension of the spinal column, that projects from the rear of the trunk
3,490,000 42.30% 4 x /t3]l/
tale an account of the details of a real or fictional occurrence; story
541.88 626.32 1.00 989.17 0.95
4,760,000 57.70% 4
throne the seat occupied by a ruler or high secular or religious official on ceremonial occasions or when holding audience
1,040,000 44.07% 6 x /'ro[n/
thrown to hurl, cast, or fling something
1,320,000 55.93% 6
624.92 794.67 0.97 1,048.28 0.95
vial a small, sometimes stoppered bottle of glass or plastic used for small amounts of liquid medicine, chemicals, perfume, or the like
299,000 43.65% 4 x
vile extremely bad, disgusting, or unpleasant
304,000 44.38% 4
/ve]l/
viol any of a group of stringed instruments of the sixteenth and seventeenth centuries having fretted necks and usu. six strings, and played with a curved bow
82,000 11.97% 4
678.01 773.31 0.83 1,086.75 0.95
/v3]l/ vale a valley 483,000 40.69% 4 649.79 813.22 0.61 1,133.03 0.84 x
101

General Properties of Heterographic Homophones Visual Auditory
Phono Ortho Semantic Representation Semantic Rep Freq
Est
Semantic Dominance
Score
# Letters
Acoustic Duration
Mn LD Lat.
Mn Acc.
Mn LD Lat.
Mn Acc.
Visually Presented
veil a thin piece of fabric or netting, usu. worn over the head, shoulders, and face
704,000 59.31% 4
vain not leading to a desirable or lasting effect; futile; fruitless
632,000 37.49% 4 x
vane a device mounted so that it rotates freely in the wind, indicating the wind's direction; weather vane
142,000 8.42% 4
/v3]n/
vein one of the many small vessels that transport blood to the heart
912,000 54.09% 4
672.44 729.28 0.95 1,095.11 0.95
warn to put on guard or give notice
1,050,000 33.02% 4 x 531.38 /wern/
worn past participle of wear 2,130,000 66.98% 4
707.16 0.97 1,034.05 1.00
wade to walk in water or another
substance that partially envelops one's legs, thereby hindering movement
1,230,000 62.60% 4 570.32 680.34 1.00 /w3]d/
weighed to have weight or a particular amount of weight
735,000 37.40% 7
1,121.61 0.94
x
ware (usu. pl.) manufactured products or other articles of commerce, including salable skills, knowledge, or the like; goods
2,930,000 35.65% 4 x
wear to carry on one's person as a covering or ornament
4,960,000 60.35% 4
4
516.86 547.71 /w2r/
weir a fence, as of brush, set in a stream to catch fish
329,000 4.00%
0.69 986.00 0.97
waits to keep oneself inactive or in one place until an anticipated event occurs (often fol. by for or until)
1,320,000 43.85% 5 x /w3]ts/
weights the heaviness of an object, 1,690,000 56.15% 7
577.84 700.11 1.00 1,084.73 0.89
102

General Properties of Heterographic Homophones Visual Auditory
Phono Ortho Semantic Representation Semantic Rep Freq
Est
Semantic Dominance
Score
# Letters
Acoustic Duration
Mn LD Lat.
Mn Acc.
Mn LD Lat.
Mn Acc.
Visually Presented
esp. as expressed in terms of a recognized system of measurement
waived to forgo or give up (a right, claim, or privilege)
590,000 67.43% 6 579.21 659.21 1.00 1,019.41 0.97 /w3]vd/
waved to move freely up and down or back and forth; flutter
285,000 32.57% 5 x
103

Homographic Homophones
General Characteristics of Homographic Homophones Visual Auditory
Ortho Phono # Letters
Acoustic Duration
Mn LD Lat.
# Unrelated Sem Reps
Semantic Representations Semantic Rep Frq
Est
Semantic Dominance
Score
Mn Acc.
Mn LD Lat.
Mn Acc.
either of the two upper limbs of the human body, between the shoulders and the wrists
8,090,000 57.10% arms /ermz/ 2
to become prepared for a state of war
4 655.59 643.54 1.00 902.47 1.00
5,320,000 42.90%
a thick cream soup made with shellfish, meat, or strained vegetables
108,000 43.37% bisque /b8sk/ 2 6 450.59 886.04 0.74 1,085.06 0.43
clay or porcelain that has been fired but not glazed
141,000 56.63%
held by bonds; tied 1,080,000 22.45% on the way to; headed (usu. fol. by for)
1,300,000 27.03%
to leap; spring 1,260,000 26.20%
bounds 4
to adjoin or border 1,170,000
6 584.14 774.26 /be[ndz/
24.32%
1.00 1,165.48 0.68
a fully grown male of certain animal species such as the deer, goat, rabbit, and sheep
2,640,000 28.76% buck /b4k/ 4 4 349.50 797.82 0.89
an object such as a buckhorn knife that was formerly placed before a player in a poker game to indicate the responsibility to deal
2,560,000 27.89%
a structure used to hold wood for sawing; sawhorse
2,350,000 25.60%
of a horse or similar animal, to leap off the ground and come down with stiff forelegs in order to throw off a rider
1,630,000 17.76%
1,094.36 0.61
104

General Characteristics of Homographic Homophones Visual Auditory
Ortho Phono # Letters
Acoustic Duration
Mn LD Lat.
# Unrelated Sem Reps
Semantic Representations Semantic Rep Frq
Est
Semantic Dominance
Score
Mn Acc.
Mn LD Lat.
Mn Acc.
to cut by hitting repeatedly, esp. with an ax or other sharp tool (often fol. by down or off)
807,000 45.90%
to suddenly shift direction; swerve, esp. with the wind
581,000 33.05%
chop /.ep/ 4
(usu. pl.) the jaws, cheeks, or mouth
370,000 21.05%
4 456.03 727.86 1.00 1,072.30 0.97
to cut off, cut out, or trim something
4,850,000 55.75% clips 2
a device that holds, grasps, or fastens, as a paper clip or hair clip
/kl8ps/
3,850,000 44.25%
5 572.43 673.00 1.00 1,022.39 0.84
a specific day or point in time, usu. described by indicating the month, day, and year
17,600,000 64.83% date /d3]t/ 2
9,550,000 35.17%
4 364.11 641.32 0.97 847.63 1.00
the edible fruit of the date palm tree of the Middle East to produce a hole or holes in something, as by the use of a drill
561,000 51.00% drilled /dr8ld/ 3 7 565.33 797.65 1.00 1,025.71 1.00
a sturdy twilled fabric, usu. of cotton
157,000 14.27%
to plant seeds in drills 382,000 34.73% to award the title of knight to by tapping or striking lightly on the shoulder, usu. with a sword
719,000 43.21% dubbed 3 6 379.38 815.71 0.78 /d4bd/
sounds that are added to or that replace sounds on a recording, such as a film
577,000 34.68%
to push, poke, or thrust at 368,000 22.12%
1,008.03 0.76
105

General Characteristics of Homographic Homophones Visual Auditory
Ortho Phono # Letters
Acoustic Duration
Mn LD Lat.
# Unrelated Sem Reps
Semantic Representations Semantic Rep Frq
Est
Semantic Dominance
Score
Mn Acc.
Mn LD Lat.
Mn Acc.
a mechanical apparatus, usu. driven by electricity, that creates an air current by moving several vanes or blades in rotation
5,970,000 43.45% fan /fqn/ 2 3 497.13 668.35 0.97 1,031.33
an enthusiastic follower of an activity such as a sport or a performing art, or of a person or persons who engage in that activity
7,770,000 56.55%
0.95
a piece of cloth, usu. rectangular or triangular, bearing any of various colors and designs and used for signaling or as the symbol or emblem of a country, organization, or the like; banner; pennant
5,140,000 40.86% flag /flqg/ 4 4 583.44 659.76 1.00 1,072.17 0.76
any of a variety of plants characterized by long, flat, pointed leaves, such as the iris, blue flag, or cattail
2,100,000 16.69%
to lose energy, strength, or interest
3,100,000 24.64%
a type of broad, flat stone used for covering surfaces such as a patio; flagstone
2,240,000 17.81%
in a horizontal position; level to the ground
922,000 48.30% flats /flqts/ 2
a group of rooms forming a residence on one floor of a house; apartment
987,000 51.70%
5 642.13 764.78 0.97 1,115.84 0.51
to flow or gush quickly and heavily
369,000 38.32% flushed /fl4ct/ 3
221,000 22.95%
7 501.73
to start up from cover or take flight, as a game bird
755.97 0.97 996.45 0.89
106
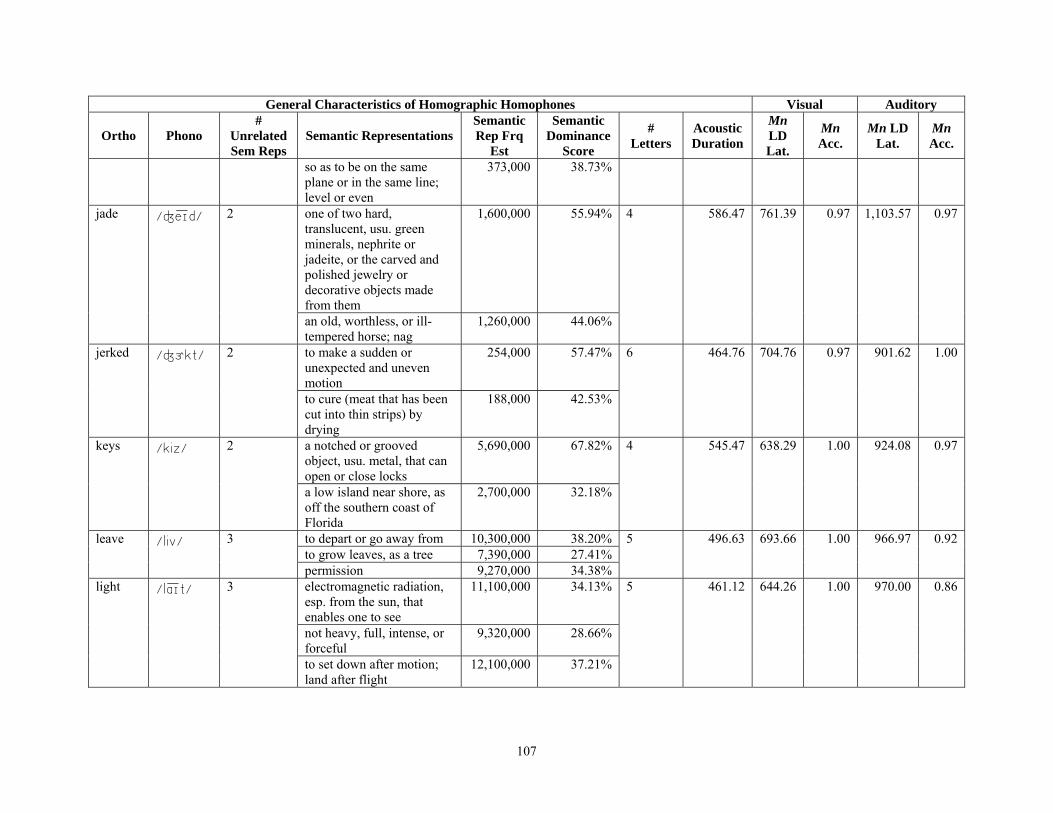
General Characteristics of Homographic Homophones Visual Auditory
Ortho Phono #
Unrelated Sem Reps
Semantic Representations Semantic Rep Frq
Est
Semantic Dominance
Score
# Letters
Acoustic Duration
Mn LD Lat.
Mn Acc.
Mn LD Lat.
Mn Acc.
so as to be on the same plane or in the same line; level or even
373,000 38.73%
one of two hard, translucent, usu. green minerals, nephrite or jadeite, or the carved and polished jewelry or decorative objects made from them
1,600,000 55.94% jade /j3]d/ 2
an old, worthless, or ill-tempered horse; nag
1,260,000 44.06%
4 586.47 761.39 0.97 1,103.57 0.97
to make a sudden or unexpected and uneven motion
254,000 57.47% jerked /j6kt/ 2
to cure (meat that has been cut into thin strips) by drying
188,000 42.53%
6 464.76 704.76 0.97 901.62 1.00
a notched or grooved object, usu. metal, that can open or close locks
5,690,000 67.82% keys /kiz/ 2
a low island near shore, as off the southern coast of Florida
2,700,000 32.18%
4 545.47 638.29 1.00 924.08 0.97
to depart or go away from 10,300,000 38.20% to grow leaves, as a tree 7,390,000 27.41%
leave /liv/ 3
permission 9,270,000 34.38%
5 496.63 693.66 1.00 966.97 0.92
electromagnetic radiation, esp. from the sun, that enables one to see
11,100,000 34.13%
not heavy, full, intense, or forceful
9,320,000 28.66%
light /le]t/ 3
to set down after motion; land after flight
12,100,000 37.21%
5 461.12 644.26 1.00 970.00 0.86
107
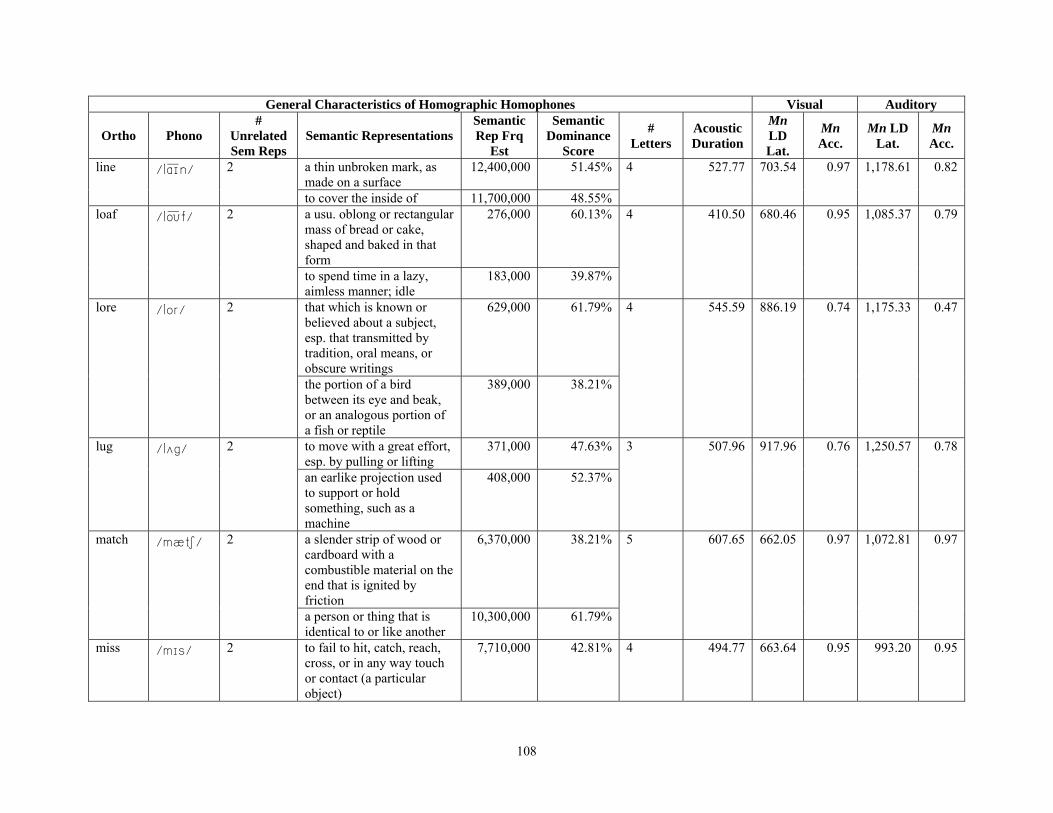
General Characteristics of Homographic Homophones Visual Auditory
Ortho Phono #
Unrelated Sem Reps
Semantic Representations Semantic Rep Frq
Est
Semantic Dominance
Score
# Letters
Acoustic Duration
Mn LD Lat.
Mn Acc.
Mn LD Lat.
Mn Acc.
a thin unbroken mark, as made on a surface
12,400,000 51.45% line /le]n/ 2
to cover the inside of 11,700,000 48.55%
4 527.77 703.54 0.97 1,178.61 0.82
a usu. oblong or rectangular mass of bread or cake, shaped and baked in that form
276,000 60.13% loaf /lo[f/ 2
to spend time in a lazy, aimless manner; idle
183,000 39.87%
4 410.50 680.46 0.95 1,085.37 0.79
that which is known or believed about a subject, esp. that transmitted by tradition, oral means, or obscure writings
629,000 61.79% lore /lor/ 2
the portion of a bird between its eye and beak, or an analogous portion of a fish or reptile
389,000 38.21%
4 545.59 886.19 0.74 1,175.33 0.47
to move with a great effort, esp. by pulling or lifting
371,000 47.63% lug /l4g/ 2
an earlike projection used to support or hold something, such as a machine
408,000 52.37%
3 507.96 917.96 0.76 1,250.57 0.78
a slender strip of wood or cardboard with a combustible material on the end that is ignited by friction
6,370,000 38.21% match /mq./ 2
a person or thing that is identical to or like another
10,300,000 61.79%
5 607.65 662.05 0.97 1,072.81 0.97
miss /m8s/ 2 to fail to hit, catch, reach, cross, or in any way touch or contact (a particular object)
7,710,000 42.81% 4 494.77 663.64 0.95 993.20 0.95
108

General Characteristics of Homographic Homophones Visual Auditory
Ortho Phono #
Unrelated Sem Reps
Semantic Representations Semantic Rep Frq
Est
Semantic Dominance
Score
# Letters
Acoustic Duration
Mn LD Lat.
Mn Acc.
Mn LD Lat.
Mn Acc.
the traditional title of an unmarried woman, preceding the surname, and currently often replaced by "Ms."
10,300,000 57.19%
a thick, soft cereal, usu. of corn meal boiled in water or milk
118,000 50.21% mush /m4c/ 2
to travel over snow by means of a dog sled
117,000 49.79%
4 531.33 856.26 0.82 1,080.25 0.84
the inner surface of the hand, between the wrist and the base of the fingers
1,180,000 44.03% palms /pelmz/ 2
any of numerous mainly tropical evergreen plants, usu. an unbranched tree having a crown of large divided leaves, or fronds
1,500,000 55.97%
5 607.53 696.89 1.00 1,084.70 0.89
to attack by hurling missiles or by repeated blows
74,700 47.88% pelt /p2lt/ 2
the skin or hide of an animal, usu. fur-bearing
91,300 52.12%
4 454.27 848.76 0.71 1,100.29 0.82
a rod, branch, or the like on which birds sit
363,000 52.99% perch /p6./ 2
any of various edible freshwater fishes that have spiny fins
322,000 47.01%
5 434.42 845.83 0.97 976.97 0.92
any of several large freshwater fishes with elongated, flattened snouts, that are caught for food or sport
1,150,000 31.79% pike /pe]k/ 4
a long pole with a sharp head, formerly used by foot soldiers as a weapon
816,000 22.56%
4 405.33 882.40 0.83 1,032.57 0.74
109

General Characteristics of Homographic Homophones Visual Auditory
Ortho Phono #
Unrelated Sem Reps
Semantic Representations Semantic Rep Frq
Est
Semantic Dominance
Score
# Letters
Acoustic Duration
Mn LD Lat.
Mn Acc.
Mn LD Lat.
Mn Acc.
a road on which a toll is charged; turnpike
1,400,000 38.71%
any sharp point, as on an arrow.
251,000 6.94%
a comparatively wide and deep hole dug or existing in the ground
2,290,000 68.98% pit /p8t/ 2
the hard seed at the center of an apricot, cherry, plum, or certain other fruits
1,030,000 31.02%
3 376.88 713.95 1.00 903.63 0.95
to throw or toss 2,590,000 51.49% pitch /p8./ 2 a dark sticky substance 2,440,000 48.51%
5 425.64 731.11 1.00 945.41 0.97
to form secret plans for an illegal or hostile purpose
1,600,000 57.97% plots /plets/ 2
a small piece of land, esp. one used for a specific purpose
1,160,000 42.03%
5 620.33 783.16 0.97 1,212.79 0.65
to hunt, fish, or trap illegally or on another's land
87,900 45.81% poached /po[.t/ 2
to cook by boiling or simmering in water or other liquid
104,000 57.14%
7 473.14 832.06 0.95 878.97 0.95
to take or hold a bodily position, as in modeling clothing or having one's portrait made
1,440,000 52.94% posed /po[zd/ 2
to puzzle or embarrass with a difficult problem or question
1,280,000 47.06%
5 611.66 897.00 0.97 1,178.41 0.97
to strike repeatedly and heavily
2,500,000 37.91% pound /pe[nd/ 3
a shelter for confining or housing homeless animals
755,000 11.45%
5 573.30 640.33 0.97 972.35 0.97
110

General Characteristics of Homographic Homophones Visual Auditory
Ortho Phono #
Unrelated Sem Reps
Semantic Representations Semantic Rep Frq
Est
Semantic Dominance
Score
# Letters
Acoustic Duration
Mn LD Lat.
Mn Acc.
Mn LD Lat.
Mn Acc.
a unit of weight equal to sixteen ounces or 453.592 grams in the avoirdupois weight system, and equal to twelve ounces or 373.242 grams in the apothecaries' and troy weight systems. (abbr.: lb.)
3,340,000 50.64%
to bear down on as if to crush or squeeze
12,400,000 71.84% press /pr2s/ 2
to force into military service; impress
4,860,000 28.16%
5 429.74 737.92 1.00 951.22 0.86
a physical object, such as a heavy beam, stick, or stone, used to support and hold something in place
1,940,000 57.23%
a piece of furniture or other article used for a theatrical presentation or the like; stage property
1,080,000 31.86%
prop /prep/ 3
(informal) a propeller, as on an airplane or boat
370,000 10.91%
4 424.14 879.41 0.86 950.73 0.87
the dried or partially dried fruit of any of various common plums
113,000 55.80% prunes /prunz/ 2
to cut or remove dead or unwanted branches, twigs, or the like from; trim
89,500 44.20%
6 682.72 823.58 0.87 1,084.11 0.97
a hard, quick blow with the fist
1,260,000 26.25% punch /p4n./ 3
a sweet drink comprising a mixture of ingredients such as fruit juices, soda, spices, or the like, often with wine or liquor added
1,610,000 33.54%
5 403.92 645.08 0.97 850.53 0.97
111

General Characteristics of Homographic Homophones Visual Auditory
Ortho Phono #
Unrelated Sem Reps
Semantic Representations Semantic Rep Frq
Est
Semantic Dominance
Score
# Letters
Acoustic Duration
Mn LD Lat.
Mn Acc.
Mn LD Lat.
Mn Acc.
a tool or machine used for making small holes or indentations or for impressing a design, as in leather
1,930,000 40.21%
to use a rake or similar tool 42,300 56.56% one who shamelessly carries on improper or immoral behavior; profligate; libertine
26,800 35.83% rakes /r3]ks/ 3
to slant away from a vertical or horizontal line; incline
5,690 7.61%
5 675.00 833.28 0.97 1,037.54 0.95
a large mass of hard mineral matter that lies under the earth's soil or forms a cliff, mountain, or the like.
5,580,000 35.14% rock /rek/ 2
to sway strongly back and forth or from side to side
10,300,000 64.86%
4 411.53 612.92 1.00 964.62 0.78
to flake off 367,000 35.02% scaled /sk3]ld/ 2 to climb, progress, or ascend, esp. in stages
681,000 64.98% 6 656.43 740.38 0.92 1,118.20 0.92
a simple, usu. one-story structure used for storage or shelter, or as a workshop, and either free-standing or attached to another building
466,000 58.99% sheds /c2dz/ 2
to cast off, take off, or let fall (a covering or growth)
324,000 41.01%
5 591.86 837.63 0.89 1,032.88 0.92
to move smoothly or with ease
771,000 37.59% slips /sl8ps/ 2
a cutting from a plant, intended for propagation
1,280,000 62.41%
5 606.04 825.92 0.97 1,087.58 1.00
spat /spqt/ 4 a short, insignificant quarrel
246,000 34.36% 4 562.71 869.60 0.95 1,102.19 0.82
112
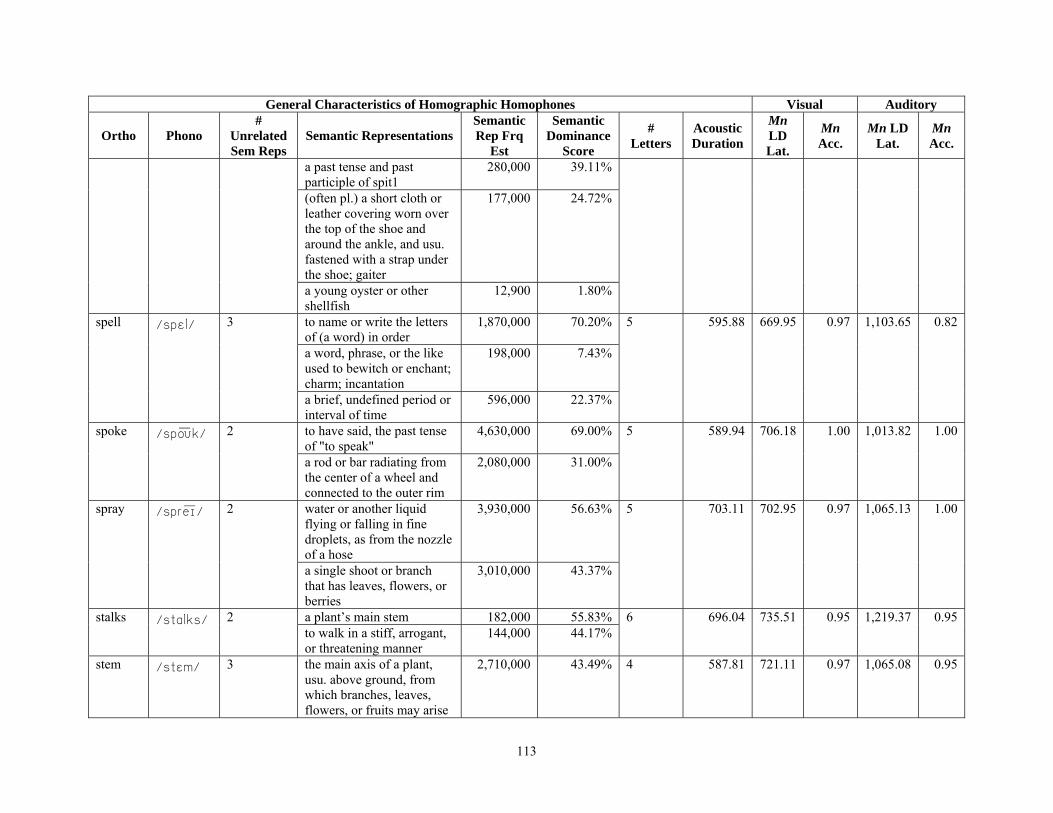
General Characteristics of Homographic Homophones Visual Auditory
Ortho Phono #
Unrelated Sem Reps
Semantic Representations Semantic Rep Frq
Est
Semantic Dominance
Score
# Letters
Acoustic Duration
Mn LD Lat.
Mn Acc.
Mn LD Lat.
Mn Acc.
a past tense and past participle of spit1
280,000 39.11%
(often pl.) a short cloth or leather covering worn over the top of the shoe and around the ankle, and usu. fastened with a strap under the shoe; gaiter
177,000 24.72%
a young oyster or other shellfish
12,900 1.80%
to name or write the letters of (a word) in order
1,870,000 70.20%
a word, phrase, or the like used to bewitch or enchant; charm; incantation
198,000 7.43%
spell /sp2l/ 3
a brief, undefined period or interval of time
596,000 22.37%
5 595.88 669.95 0.97 1,103.65 0.82
to have said, the past tense of "to speak"
4,630,000 69.00% spoke /spo[k/ 2
a rod or bar radiating from the center of a wheel and connected to the outer rim
2,080,000 31.00%
5 589.94 706.18 1.00 1,013.82 1.00
water or another liquid flying or falling in fine droplets, as from the nozzle of a hose
3,930,000 56.63% spray /spr3]/ 2
a single shoot or branch that has leaves, flowers, or berries
3,010,000 43.37%
5 703.11 702.95 0.97 1,065.13 1.00
a plant’s main stem 182,000 55.83% stalks /stelks/ 2 to walk in a stiff, arrogant, or threatening manner
144,000 44.17% 6 696.04 735.51 0.95 1,219.37 0.95
stem /st2m/ 3 the main axis of a plant, usu. above ground, from which branches, leaves, flowers, or fruits may arise
2,710,000 43.49% 4 587.81 721.11 0.97 1,065.08 0.95
113

General Characteristics of Homographic Homophones Visual Auditory
Ortho Phono #
Unrelated Sem Reps
Semantic Representations Semantic Rep Frq
Est
Semantic Dominance
Score
# Letters
Acoustic Duration
Mn LD Lat.
Mn Acc.
Mn LD Lat.
Mn Acc.
an upright, usu. curved beam at the bow of a nautical vessel, into which the side timbers are jointed
752,000 12.07%
to stop the flow of; dam up; stanch
2,770,000 44.45%
to bend the body forward and downward, as to pick up something
135,000 44.55% stoop /stup/ 2
a large step or small porch at the entrance to a home, often reached by a short flight of steps
168,000 55.45%
5 614.12 828.09 0.86 1,207.94 0.92
a nail or rivet with a protruding and often rounded knob or head, fixed in a surface as a protective or ornamental device
608,000 36.02% studs /st4dz/ 2
a domesticated male animal, such as a racehorse, that is kept for breeding
1,080,000 63.98%
5 656.58 823.24 0.92 1,108.17 0.97
to have an inclination or disposition to do something; be inclined
2,980,000 46.64% tend /t2nd/ 2
to care for or maintain; look after (a person or thing)
3,410,000 53.36%
4 550.25 683.59 0.97 1,180.68 0.78
the extreme end, esp. of something slender, tapered, or pointed
370,000 21.49%
a light touch; tap 338,000 19.63% to give someone a tip 470,000 27.29%
tipped /t8pt/ 4
to lean; slant; tilt 544,000 31.59%
6 449.17 757.49 0.97 907.86 0.95
toast /to[st/ 2 bread that has been sliced and browned in an oven,
1,200,000 63.49% 5 512.16 658.97 1.00 941.21 1.00
114
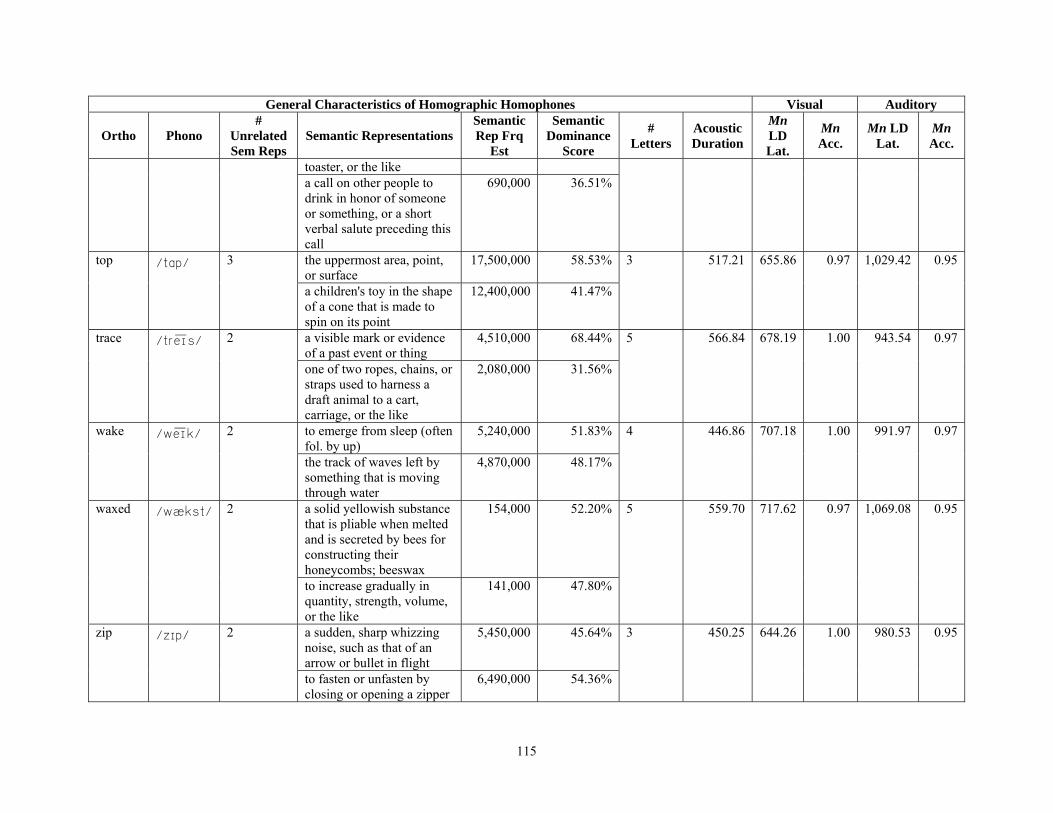
General Characteristics of Homographic Homophones Visual Auditory
Ortho Phono #
Unrelated Sem Reps
Semantic Representations Semantic Rep Frq
Est
Semantic Dominance
Score
# Letters
Acoustic Duration
Mn LD Lat.
Mn Acc.
Mn LD Lat.
Mn Acc.
toaster, or the like a call on other people to drink in honor of someone or something, or a short verbal salute preceding this call
690,000 36.51%
the uppermost area, point, or surface
17,500,000 58.53% top /tep/ 3
a children's toy in the shape of a cone that is made to spin on its point
12,400,000 41.47%
3 517.21 655.86 0.97 1,029.42 0.95
a visible mark or evidence of a past event or thing
4,510,000 68.44% trace /tr3]s/ 2
one of two ropes, chains, or straps used to harness a draft animal to a cart, carriage, or the like
2,080,000 31.56%
5 566.84 678.19 1.00 943.54 0.97
to emerge from sleep (often fol. by up)
5,240,000 51.83% wake /w3]k/ 2
the track of waves left by something that is moving through water
4,870,000 48.17%
4 446.86 707.18 1.00 991.97 0.97
a solid yellowish substance that is pliable when melted and is secreted by bees for constructing their honeycombs; beeswax
154,000 52.20% waxed /wqkst/ 2
to increase gradually in quantity, strength, volume, or the like
141,000 47.80%
5 559.70 717.62 0.97 1,069.08 0.95
a sudden, sharp whizzing noise, such as that of an arrow or bullet in flight
5,450,000 45.64% zip /z8p/ 2
to fasten or unfasten by closing or opening a zipper
6,490,000 54.36%
3 450.25 644.26 1.00 980.53 0.95
115

Control Words
General Characteristics of Control Words Visual Auditory Ortho Phono Semantic Representation Semantic Rep
Freq Est #
Letters Acoustic Duration
Mn LD Lat
Mn Acc
Mn LD Lat
Mn Acc
beep /bip/ a short, usu. high-pitched warning signal 300,000 4 433.16 756.13 1.00 946.25 0.95
belched /b2l.t/ to expel gas from the stomach through the mouth, in a spasmodic, noisy burst, as after eating or drinking
32,200 7 483.66 926.29 0.84 965.66 0.92
bouts /be[ts/ an athletic match, as between wrestlers or boxers
172,000 5 503.36 1,421.36 0.31 1,156.44 0.49
broom /brum/ a device for sweeping, consisting of a bundle of straw or bristles attached to a long handle
278,000 5 469.39 710.03 0.97 943.79 1.00
cease /sis/ to stop or come to an end 1,410,000 5 561.20 837.91 0.95 1,224.39 0.82
chafe /.3]f/ to abrade, irritate, or wear away by rubbing 47,200 5 392.05 973.15 0.34 1,121.50 0.76
crust /kr4st/ the hard browned dough on the outside of baked goods such as bread or pies
689,000 5 518.26 706.11 0.95 969.50 1.00
deaf /d2f/ partly or totally lacking the sense of hearing 1,600,000 4 332.72 723.97 0.97 967.74 0.71
deeps /dips/ to or at a great depth 66,700 5 478.11 715.04 0.64 1,029.38 0.57
dens /d2nz/ the resting place or retreat of a large predatory wild animal, such as a wolf or lion; lair
170,000 4 529.09 848.54 0.72 1,192.50 0.42
doffed /deft/ to take off (clothing) 25,900 6 495.09 1,158.20 0.14 1,390.00 0.03
domed /do[md/ to rise or swell in the shape of a dome 154,000 5 541.18 1,461.00 0.26 1,052.83 0.62
dragged /drqgd/ to pull along with force; haul 591,000 7 624.77 660.56 1.00 983.58 0.95
dull /d4l/ lacking in interest, originality, or liveliness; boring
987,000 4 450.90 714.63 1.00 994.32 0.74
fames /f3]mz/ widespread recognition; public esteem; renown 8,390 5 621.80 826.47 0.53 1,404.54 0.34
flub /fl4b/ (informal) to do badly; botch; bungle 13,400 4 467.56 830.45 0.30 1,042.09 0.30
forced /forst/ involuntary; imposed 7,440,000 6 531.74 728.37 1.00 1,009.49 0.97
ghouls /gulz/ an evil demon, esp. one of Islamic legend that eats people and corpses
95,600 6 508.50 1,010.34 0.81 1,118.96 0.76
116

General Characteristics of Control Words Visual Auditory Ortho Phono Semantic Representation Semantic Rep
Freq Est #
Letters Acoustic Duration
Mn LD Lat
Mn Acc
Mn LD Lat
Mn Acc
glowed /glo[d/ to shine with bright light, as something very hot but flameless
145,000 6 531.08 857.85 0.92 1,066.78 0.64
grove /gro[v/ a small wooded area, esp. one with little ground cover
4,070,000 5 595.74 805.89 0.92 1,178.69 0.86
grudge /gr4j/ a feeling of resentment harbored against someone because of a real or imagined injustice
156,000 6 492.21 764.22 0.97 995.13 0.84
hedged /h2jd/ to avoid commitment to a position or opinion by qualifying or evading; equivocate
81,400 6 492.08 860.80 0.83 1,063.10 0.53
hens /h2nz/ a female bird, esp. a chicken 241,000 4 462.42 799.89 0.97 976.06 0.87
hoax /ho[ks/ an act of deception, esp. a humorous or mischievous trick
247,000 4 527.93 805.14 0.97 1,054.43 0.79
hone /ho[n/ a fine-textured whetstone used to sharpen knives, razors, and other cutting tools
333,000 4 426.26 1,074.75 0.44 1,108.50 0.21
hope /ho[p/ an optimistic sense or feeling that events will turn out well
11,700,000 4 355.12 632.24 1.00 1,027.69 0.91
jut /j4t/ to project or extend sharply outward; protrude (often fol. by out)
84,200 3 374.20 960.59 0.47 998.00 0.68
lair /l2r/ a wild animal's shelter; den 664,000 4 439.49 780.07 0.79 1,071.64 0.66
lifts /l8fts/ to rise, as a plane or balloon 1,440,000 5 525.05 756.78 0.97 969.77 0.72
lymph /l8mf/ a transparent, usu. yellowish liquid produced by body tissues that is rich in white blood cells
5,270,000 5 478.22 940.15 0.87 1,161.48 0.76
men /m2n/ pl. of man 11,300,000 3 533.73 647.14 0.95 936.13 1.00
mugs /m4gz/ to use physical force on or assault, usu. with the intent to rob, and usu. on the street or in some other public place
1,060,000 4 628.43 749.34 1.00 1,087.46 0.95
note /no[t/ a brief written record or reminder 14,200,000 4 521.69 638.34 1.00 1,051.16 0.97
nouns /ne[nz/ in grammar, a word that names a person, place, thing, condition, or quality, that usu. has plural and possessive forms, and that functions as the subject of a sentence or as the object of a verb or preposition
314,000 5 629.80 750.46 0.97 1,072.68 0.97
part /pert/ a separate portion or segment of a whole 15,000,000 4 436.83 661.61 1.00 971.25 0.95
117

General Characteristics of Control Words Visual Auditory Ortho Phono Semantic Representation Semantic Rep
Freq Est #
Letters Acoustic Duration
Mn LD Lat
Mn Acc
Mn LD Lat
Mn Acc
patch /pq./ a small piece of material, esp. fabric, applied to a larger piece of the same or similar material to cover a hole or tear, or to strengthen a weakened place
4,710,000 5 590.82 726.71 1.00 1,127.83 0.95
plugs /pl4gz/ (informal) to work in a uniform, often uninspired way (often fol. by away or along)
1,510,000 5 545.80 729.94 0.97 1,058.10 0.79
pure /pyur/ composed of only one substance, element, or quality; not mixed
8,870,000 4 500.47 625.76 1.00 950.76 0.89
rice /re]s/ a grass that is widely cultivated in warm, wet areas, esp. in India and China
4,880,000 4 472.22 655.58 1.00 918.76 1.00
robes /ro[bz/ a long, loose gown or outer garment, such as one worn by certain officials or during certain ceremonies
526,000 5 594.35 858.29 0.92 1,051.93 0.78
score /skor/ the record of the total points earned in a competition or test
7,290,000 5 665.66 622.66 1.00 1,065.32 0.97
shame /c3]m/ emotional pain brought about by the knowledge that one has done something wrong, embarrassing, or disgraceful
2,730,000 5 710.07 684.94 0.95 1,105.89 0.97
shelf /c2lf/ a thin, flat, usu. rectangular piece of wood, metal, or glass attached horizontally to a wall or in a cabinet, case, or the like for things to be kept upon
3,660,000 5 528.36 689.00 1.00 1,098.53 0.97
sips /s8ps/ to drink slowly and a little at a time 109,000 4 529.30 798.24 0.89 998.87 1.00
skeet /skit/ a form of trapshooting in which targets are thrown at different heights and speeds to simulate birds in flight
142,000 5 626.89 1,024.17 0.32 1,388.47 0.43
slots /slets/ a long, narrow indentation or opening into which something may be put
3,590,000 5 719.13 799.33 0.97 1,483.92 0.35
smear /smir/ to spread or apply (a sticky, oily, or greasy substance) on or over a surface
239,000 5 670.96 716.62 0.92 1,022.68 0.92
smudged /sm4jd/ to become stained or dirtied; smear 38,800 7 738.41 841.56 0.91 1,152.24 1.00
sphere /sfir/ a round, three-dimensional geometric figure in which every point on the surface is an equal distance from the center
1,580,000 6 721.94 697.24 1.00 1,047.39 0.95
spun /sp4n/ past tense and past participle of spin 690,000 4 634.05 835.19 0.97 1,319.07 0.78
118

General Characteristics of Control Words Visual Auditory Ortho Phono Semantic Representation Semantic Rep
Freq Est #
Letters Acoustic Duration
Mn LD Lat
Mn Acc
Mn LD Lat
Mn Acc
squirm /skw6m/ to twist about; writhe; wriggle 92,100 6 797.67 835.19 0.97 1,119.08 0.97
store /stor/ a place where merchandise is sold 11,100,000 5 797.67 826.65 0.97 1,151.11 1.00
swum /sw4m/ past participle of swim 50,700 4 716.78 662.62 0.97 1,417.83 0.17
text /t2kst/ the body of a printed work as distinguished from its title, headings, notes, and the like
13,900,000 4 660.73 1,043.33 0.17 1,111.70 0.83
twirl /tw6l/ to cause to spin or revolve quickly; rotate 90,300 5 504.31 588.66 1.00 976.53 0.97
urge /6j/ to push or drive forward or onward 1,640,000 4 631.04 732.08 1.00 963.28 0.95
veered /vird/ to turn aside or away from a particular course; change direction; swerve
105,000 6 616.25 965.86 0.76 1,138.15 0.89
went /w2nt/ past tense of go1 11,000,000 4 520.31 683.38 0.97 968.09 0.95
worm /w6m/ any of numerous related invertebrates with long, thin, flexible, round or flat bodies and no limbs
2,430,000 4 532.32 768.59 0.97 942.03 0.97
zoom /zum/ to move quickly or rapidly while making a low-pitched humming sound
5,430,000 4 695.07 694.89 0.97 1,097.18 0.89
119
APPENDIX F
Reliability and Validity of Semantic Representation Frequency Estimates
120

Reliability and Validity of Semantic Representation Frequency Estimates
Reliability was calculated for the Internet frequency estimates for unrelated semantic
representations (Nixon et al, in prep). A reliability rater was provided with directions (Appendix
D) for selecting co-occurrence words related to semantic representations from the Wordsmyth
Internet Dictionary entries for a randomly selected subset of the stimulus words. The
independent rater was asked to provide co-occurrence words for 13 heterographic homophone
sets with all orthographic representations, 13 homographic homophone sets with all of its
semantic representations, and 13 control words. Intra-class correlations were calculated between
the semantic representation frequency estimates obtained using the co-occurrence words
provided by the reliability rater and the semantic representation frequency estimates obtained by
the author. The Intra-class Correlation Coefficient (ICC) between the independent rater’s and
the author’s semantic representation frequency estimates was large, positive and significant at
0.95 (p < .001), and these ratings did not differ significantly (F(1, 65) = 0.13, p = .73).
Accordingly, the independent rater was able to obtain similar semantic representation frequency
estimates for words when provided with the directions (Appendix D) and the same definitions
used by the original author.
One validity check consisted of calculating correlations between the semantic
representation frequency estimates and both the HAL corpus frequency counts11 (Balota et al.,
2002) and the Spelling Dictionary frequency counts (Rondthaler & Lias, 1986).12 Because the
HAL corpus and the Spelling Dictionary do not have frequency of occurrence for unrelated 11 The HAL (Hyperspace Analogue to Language) Corpus consists of words gathered from Usenet newsgroups. HAL corpus word frequencies provided better predictors of lexical decision latencies than the Kučera and Francis (1967) word frequency counts (for a complete discussion see Burgess & Livesay, 1998). 12 The Spelling Dictionary frequency counts updated the Kučera and Francis (1967) word frequency counts using words from the then current Merriam-Webster list of most used words, a similar McGraw-Hill list, the WES dictionary, and several lists of newer words. This yielded a vocabulary of almost 45,000 words. Frequency counts were adjusted for word use in other types of writing with a search of 100,000 words from personal and business correspondence (Rondthaler & Lias, 1986).
121

semantic representations, the semantic representation frequency estimates were summed across
all unrelated semantic representations for each homographic homophone. Of the stimulus words,
five did not have HAL frequency counts and were excluded from the correlation between HAL
frequency counts and semantic representation frequency estimates; and, 13 did not have Spelling
Dictionary frequency counts and were excluded from the correlation between Spelling
Dictionary frequencies and semantic representation frequency estimates. None of the word
frequency measures met the hypothesis of normality according to the Shapiro-Wilk test (W238
(Internet) = 0.25, p < .05; W238 (HAL) = 0.35, p < .05; W238 (Sp. Dic.) = 0.33, p < .05). The
nonparametric correlation coefficient, Spearman’s rho (rs) was used to test these associations.
Correlations of primary interest were large and significant: rs equaled 0.93 (p < .05) between
semantic representation frequency estimates and HAL frequency counts and 0.80 (p < .05)
between semantic representation frequency estimates and Spelling Dictionary frequency counts.
Thus, semantic representation frequency estimates summed across orthographic representations
appear to be valid estimators of direct word frequency counts.
To validate semantic representation frequency estimates as measures of semantic
representation use, correlations were calculated between the semantic representation frequency
estimates of each word type and objective frequencies from the CELEX (Baayen, Piepenbrock,
& van Rijn, 1993) and Wall Street Journal (WSJ; Marcus, Santorini, & Marcinkiewicz, 1993)
databases. The correlations between semantic representation frequency estimates and objective
frequency measures for heterographic homophones and control words should be positive and
larger than the correlation between semantic representation frequency estimates and objective
frequency measures for homographic homophones. Objective frequency measures should
overestimate homographic homophone semantic representation frequencies because objective
122

frequency measures are based on the frequency of occurrence for each orthographic
representation versus for each unrelated semantic representation within an orthographic
representation.13 The non-parametric correlation coefficient, Spearman’s rho, was used to test
these relationships because the frequency measures did not meet the hypothesis of normality.
Correlations between semantic representation frequency estimates and objective frequency
counts from the CELEX and WSJ databases are listed in Table 22 by word type. As predicted,
correlations between semantic representations frequency estimates of homographic homophones
and objective frequencies from the CELEX and WSJ databases were slightly weaker than the
other correlations. For example, CELEX (Baayen et al., 1993) objective frequencies account for
67.24% of the variance in semantic representation frequency estimates for control words but only
36.00% of the variance in semantic representation frequency estimates for homographic
homophones. This suggests that the semantic representation frequency estimates are valid
measures of semantic representation use frequency.
Table 22. Correlations between Semantic Representation Frequency Estimates and Objective Frequency Measures
Word Type CELEX WSJ Control Words .82** .86** Heterographic homophones .72** .77** Control Words + Heterographic homophones
.84** .86**
Homographic homophones .60** .68** Note. WSJ = Wall Street Journal **Correlation is significant at .01 level (2-tailed)
To validate that Internet semantic dominance scores reflected subjective judgments of
semantic dominance, 22 participants from the University of Pittsburgh between the ages of 18
and 23 (M = 18.77, SD = 1.34) were recruited to estimate the relative frequency with which they
encountered each semantic representation of 90 homographic homophones in written and spoken 13 Griffin (1999) used a similar procedure to determine whether subjective frequencies for specific semantic representations of heterographic homophones, homographic homophones, and control words reflected frequency of semantic representation use or objective frequency counts.
123

language. It was determined a priori that Internet semantic dominance scores would be
considered valid reflections of subjective ratings of semantic dominance if rs was greater than or
equal to 0.66. This value was selected based on studies comparing Internet-based and objective
frequency counts for heterographic homophones (words with a single pronunciation but more
than one spelling, such as bite/byte), which can be compared directly due to their different
spellings. Spearman’s rho correlations among objective frequency counts from the CELEX
(Baayen et al., 1993), WSJ (Marcus et al., 1993), and Zeno et al (1995) corpora ranged from 0.69
to 0.84. In addition, Spearman’s rho correlations14 between objective frequency-based meaning
dominance scores and Internet-based meaning dominance scores ranged from 0.66 to 0.73.
These values were consistent with correlations among three objective corpora, Caroll, Davies,
and Richman (1971), Kučera and Francis (1967), and Zeno et al (1995), which range from 0.73
to 0.84 (Lee, 2003). Because objective frequency counts vary from corpus to corpus, it is
reasonable to expect that meaning dominance scores will vary to this degree as well.
Participants were asked to assign a relative percentage of occurrence scores to each
semantic representation of a homographic homophone (Nixon et al., in preparation). After
obtaining the subjective ratings, difference scores were calculated by subtracting the Internet
semantic dominance score from the mean subjective semantic dominance score for each
semantic representation. Using these difference scores, four homographic homophone sets were
identified as outliers, which had at least one semantic representation with a difference score +2
SDs from the mean difference score. After removing these four outlying stimulus sets from the
14 Spearman’s rho correlations were used because the word frequency data did not meet the assumptions of normality.
124

analyses,15 86 homographic homophone sets remained with 198 unrelated meanings. The
correlation between subjective estimates of semantic dominance and Internet semantic
dominance scores was positive, large, and significant at rs = 0.71, p < 0.01. The correlation
reached the expected level and accounted for 49.70% of the variance providing further evidence
of the validity of the Internet-based measures. The remaining variability can likely be explained
by differences in the texts accessed on the Internet and/or by differences in personal experience
with particular words and meanings.
15 Of the 4 outliers, 3 were in the original stimulus set of 60 homonyms to be used in the lexical decision study. Accordingly, these were replaced with additional homonyms used in the validation study that were not outliers but met the other criteria for stimulus words in the dissertation study.
125

APPENDIX G
Nonword Stimuli
126

Nonwords
General Characteristics Visual Auditory
ortho phono # letters acoustic duration
Mn LD lat
Mn Acc
Mn LD lat Mn Acc
baved /l8./ 5 543.26 908.34 0.89 1,123.81 0.42
baxed /bqkst/ 5 523.33 836.35 0.89 1,176.82 0.89
beace /bis/ 5 429.96 919.34 1.00 1,144.92 0.68
bedged /b2jd/ 6 517.51 973.77 0.95 1,101.53 0.86
bext /b2kst/ 4 525.16 779.03 0.92 960.82 0.87
bips /b8ps/ 4 516.11 869.71 0.95 946.14 0.97
bley /bl3]/ 4 495.32 773.16 1.00 1,197.72 0.78
blirm /bl6m/ 5 557.23 842.87 1.00 1,124.51 1.00
blouns /ble[nz/ 6 687.88 791.26 1.00 1,205.91 0.92
boffed /beft/ 6 519.85 867.71 1.00 1,009.61 0.95
bomed /bo[md/ 5 496.95 1,120.65 0.94 1,187.13 0.65
bosed /bozd/ 5 585.68 947.47 0.86 1,279.33 0.87
brame /br3]m/ 5 509.00 903.64 0.95 1,150.15 0.87
brend /br2nd/ 5 511.74 914.15 0.87 1,175.77 0.79
bress /br2s/ 5 544.15 923.22 0.97 1,305.42 0.32
brince /br8nts/ 6 500.17 883.08 0.97 1,081.13 0.63
broast /bro[st/ 6 636.69 1,062.21 0.76 1,207.80 0.66
brone /bro[n/ 5 544.17 860.37 0.97 1,033.10 0.78
broop /brup/ 5 478.24 825.42 0.95 1,023.39 0.74
brop /brep/ 4 475.92 774.43 0.97 1,025.15 0.89
brose /bro[z/ 5 627.91 840.28 0.95 1,178.00 0.57
brove /bro[v/ 5 571.37 791.42 0.97 1,127.62 0.55
brum /br4m/ 4 527.63 852.00 0.95 1,032.84 0.50
bure /byur/ 4 526.78 855.97 0.97 1,161.84 0.50
burge /b6j/ 5 600.06 1,146.20 0.71 1,288.05 0.57
chakes /.3]ks/ 6 616.17 960.54 0.97 1,106.69 0.95
chark /.erk/ 5 542.20 881.73 0.97 1,194.34 0.92
cheds /.2dz/ 5 608.05 825.74 1.00 1,047.97 1.00
chent /.2nt/ 5 499.96 819.08 1.00 1,063.86 0.97
chod /.ed/ 4 575.37 819.83 0.76 1,119.86 0.95
chot /.et/ 4 591.41 819.22 0.97 1,109.79 0.89
chough /.o[/ 6 564.25 1,061.50 0.65 1,213.15 0.94
chun /.4n/ 4 569.61 920.03 0.94 1,117.49 0.95
clagged /klqgd/ 7 629.45 920.76 0.89 1,137.62 1.00
clats /klqts/ 5 688.12 869.97 0.97 1,236.36 0.95
127

General Characteristics Visual Auditory
ortho phono # letters acoustic duration
Mn LD lat
Mn Acc
Mn LD lat Mn Acc
clon /klen/ 4 673.59 796.95 0.97 1,181.35 0.97
clore /klor/ 5 567.56 870.17 0.95 1,148.22 0.97
corth /kor'/ 5 467.37 809.16 0.97 1,036.57 0.97
counds /ke[ndz/ 6 662.83 849.03 0.89 1,148.44 0.73
dake /d3]k/ 4 477.66 882.92 0.97 1,144.06 0.92
dalms /delmz/ 5 585.75 837.59 0.97 1,155.21 0.92
darms /dermz/ 5 636.04 840.70 0.97 1,023.57 0.97
darred /derd/ 6 581.44 1,132.86 0.83 1,096.37 0.92
datch /dq./ 5 547.77 872.03 1.00 1,045.20 0.92
dirl /d6l/ 4 556.62 890.95 1.00 1,152.06 0.86
dit /d8t/ 3 399.84 954.60 0.95 1,016.47 1.00
dop /dep/ 3 451.97 934.22 0.89 1,016.42 0.87
dorced /dorst/ 6 642.72 870.14 0.95 1,164.45 0.87
drales /dr3lz/ 6 698.44 834.54 0.92 1,213.88 0.89
dreak /drik/ 5 499.32 893.49 0.97 1,022.76 0.97
drock /drek/ 5 447.69 854.46 0.92 1,052.87 1.00
durfs /d6fs/ 5 538.30 855.44 0.94 957.16 1.00
dute /dut/ 4 430.34 819.49 0.92 979.53 0.95
dymph /d8mf/ 5 381.52 886.80 0.95 1,036.57 0.97
dyte /de]t/ 4 432.68 870.26 0.95 1,062.94 0.87
eigned /3]nd/ 6 527.72 940.74 0.97 1,071.35 0.68
feeps /fips/ 5 514.80 807.73 0.97 1,012.60 0.92
fene /fin/ 4 492.87 820.94 0.95 1,176.59 0.46
ferch /f6./ 5 562.34 786.76 0.92 1,063.97 0.95
fipped /f8pt/ 6 529.27 1,441.77 0.37 1,066.51 0.97
flens /fl2nz/ 5 722.51 862.38 0.97 1,147.56 0.92
floke /flo[k/ 5 539.53 881.45 0.82 1,139.74 0.92
flots /flets/ 5 681.09 937.03 0.92 1,134.60 0.95
flunes /flunz/ 6 719.24 849.24 0.87 1,157.44 0.95
fope /fo[p/ 4 458.37 794.47 1.00 1,056.62 0.97
frice /fre]s/ 5 571.80 841.94 0.95 1,182.96 0.68
frip /fr8p/ 4 475.36 795.41 0.97 979.11 0.97
fruise /fruz/ 4 545.72 813.78 0.95 1,297.62 0.76
frun /fr4n/ 6 652.30 753.49 1.00 1,192.10 0.82
frust /fr4st/ 5 676.90 986.15 0.89 1,284.67 0.32
gair /g2r/ 4 443.57 840.03 0.97 1,034.50 0.89
gan /gqn/ 3 512.11 806.51 0.97 1,089.30 0.97
128

General Characteristics Visual Auditory
ortho phono # letters acoustic duration
Mn LD lat
Mn Acc
Mn LD lat Mn Acc
gart /gert/ 4 427.06 833.53 0.97 1,016.69 0.92
glips /gl8ps/ 5 505.69 879.32 0.92 1,095.16 0.66
goaf /go[f/ 4 365.05 916.97 0.89 1,073.84 1.00
goom /gum/ 4 503.36 1,007.53 0.81 1,047.28 0.95
greered /grird/ 7 558.51 998.11 0.97 1,154.12 0.92
hain /h3]n/ 4 527.68 914.94 0.94 1,191.25 0.11
heech /hi./ 5 487.70 827.66 0.92 1,138.24 0.55
henes /hinz/ 5 664.72 916.24 0.97 1,265.47 0.86
hifts /hifts/ 5 512.33 905.00 1.00 1,066.74 0.84
hoached /ho[.t/ 7 567.96 1,091.21 0.78 1,319.33 0.08
horm /h6m/ 4 522.04 873.35 0.97 1,020.78 0.25
hote /ho[t/ 4 531.76 860.82 1.00 1,166.32 0.92
jelt /j2lt/ 4 501.49 964.97 0.83 1,067.73 0.97
jore /jor/ 4 546.36 846.30 0.97 1,134.03 0.92
jubbed /j4bd/ 6 551.39 922.00 0.86 1,087.97 0.97
keaf /k2f/ 4 343.19 796.81 0.95 950.48 0.73
kelched /k2l.t/ 7 557.59 866.64 0.92 1,055.59 0.97
kere /kir/ 4 499.06 759.79 1.00 1,056.66 0.92
knelf /n2lf/ 5 472.99 883.30 0.97 965.00 0.97
knugs /n4gz/ 5 572.52 819.58 1.00 1,124.12 0.87
litch /l8./ 5 568.14 1,127.26 0.61 1,308.97 0.78
meave /miv/ 5 551.54 934.49 0.92 1,190.13 0.81
misque /m8sk/ 6 569.34 1,013.46 0.73 1,320.00 0.87
moax /mo[ks/ 4 587.60 782.24 0.85 1,182.47 0.95
nared /n2rd/ 5 628.06 939.93 0.76 1,193.56 0.84
nobes /no[bz/ 5 719.38 943.91 0.92 1,194.00 0.97
nuck /n4k/ 4 414.71 878.29 0.94 1,060.13 0.86
pames /p3]mz/ 5 668.00 885.24 1.00 1,124.35 0.54
pight /pe]t/ 5 521.29 1,104.26 0.82 1,244.29 0.82
plare /pl2r/ 5 521.29 906.36 0.95 1,106.00 0.92
plear /plir/ 5 502.75 857.43 0.97 1,085.56 0.42
pleep /plip/ 5 436.08 895.08 0.95 1,002.84 0.97
plen /pl2n/ 4 522.40 772.61 1.00 1,216.68 0.97
pline /ple]n/ 5 550.40 811.44 0.95 1,240.35 0.68
pode /po[d/ 4 502.99 889.74 0.97 1,132.70 0.97
poom /pum/ 4 521.88 814.49 1.00 1,134.83 0.95
praled /pr3]ld/ 6 603.52 827.94 0.97 1,185.45 0.97
129

General Characteristics Visual Auditory
ortho phono # letters acoustic duration
Mn LD lat
Mn Acc
Mn LD lat Mn Acc
preet /prit/ 5 509.86 805.00 0.97 1,179.84 0.97
prilled /pr8ld/ 7 502.95 808.74 0.92 1,081.59 1.00
proose /prus/ 6 499.98 862.50 0.95 1,074.19 0.95
prots /prets/ 5 678.37 750.97 1.00 1,134.42 0.95
ratch /rq./ 5 649.09 979.61 0.82 1,281.92 0.68
reet /rit/ 4 487.05 820.11 0.95 1,240.27 0.68
rike /re]k/ 4 508.02 834.00 0.95 1,137.24 0.89
rolk /ro[lk/ 4 549.26 800.54 0.97 1,212.40 0.68
seirs /s2rz/ 5 760.94 816.40 0.95 1,287.32 1.00
shate /c3]t/ 5 648.97 949.19 0.97 1,370.39 0.74
shease /cis/ 5 563.86 876.73 1.00 1,348.20 0.13
shreys /criz/ 6 688.20 902.56 0.89 1,444.43 0.18
shried /cre]d/ 6 722.83 987.48 0.87 1,314.68 0.50
shrolls /cro[lz/ 7 801.87 852.87 1.00 1,301.19 0.72
shugs /c4gz/ 5 630.02 1,130.48 0.82 1,184.22 0.71
sleer /slir/ 5 703.34 900.68 0.92 1,166.08 0.97
slore /slor/ 5 636.70 952.79 1.00 1,190.50 1.00
smeels /smilz/ 6 811.81 930.97 0.94 1,161.97 1.00
smeighed /sm3]d/ 8 732.00 942.22 1.00 1,234.67 0.95
smigh /sme]/ 5 720.96 854.27 0.97 1,272.33 0.97
smole /smo[l/ 5 753.31 881.06 0.97 1,235.69 0.95
smub /sm4b/ 4 580.94 911.68 0.97 1,114.71 1.00
snace /sn3]s/ 5 734.05 821.89 0.97 1,156.45 1.00
snat /snqt/ 4 649.40 1,012.13 0.86 1,310.26 0.62
snay /sn3]/ 4 650.67 823.87 0.89 1,179.50 0.97
snirs /sn6z/ 5 809.29 835.51 0.97 1,123.68 0.97
snouls /snulz/ 6 851.56 875.91 0.92 1,276.17 0.95
snue /snu/ 3 771.59 748.72 0.97 1,287.31 0.95
sote /so[t/ 4 642.18 824.84 0.97 1,280.86 0.97
souts /se[ts/ 5 752.36 832.44 0.94 1,237.17 0.95
spag /spqg/ 4 720.83 823.97 1.00 1,237.27 0.97
spem /sp2m/ 4 693.45 879.65 0.92 1,259.78 0.95
spralks /sprelks/ 7 797.33 956.64 0.97 1,153.13 1.00
spround /spre[nd/ 7 750.12 997.22 0.95 1,220.15 0.94
squail /skw3]l/ 6 764.95 1,092.52 0.57 1,279.29 0.80
squarn /skwern/ 6 737.26 910.12 0.94 1,257.90 0.55
squerked /skw6kt/ 8 781.63 1,032.78 0.84 1,255.40 0.66
130

General Characteristics Visual Auditory
ortho phono # letters acoustic duration
Mn LD lat
Mn Acc
Mn LD lat Mn Acc
stea /sti/ 4 636.81 959.32 0.97 1,206.71 0.92
stell /st2l/ 5 650.85 967.86 0.92 1,331.86 0.76
stips /st8ps/ 5 703.30 943.38 0.84 1,334.76 0.76
strale /str3l/ 6 720.14 893.76 1.00 1,214.97 0.97
sut /s4t/ 3 594.58 848.32 0.84 1,150.97 0.91
swone /swo[n/ 5 691.96 879.51 0.97 1,181.78 0.95
swudged /sw4jd/ 7 735.61 891.46 0.97 1,210.69 0.97
tache /tqc/ 5 575.57 926.94 0.92 1,279.50 0.37
tade /t3]d/ 4 533.35 940.23 0.91 1,277.09 0.86
tays /t3]z/ 4 593.95 866.92 0.97 1,084.64 0.74
thafe /;3]f/ 5 475.76 797.92 1.00 1,028.37 0.97
thite /'e]t/ 5 601.71 864.42 1.00 1,214.00 0.22
thop /'ep/ 4 549.29 830.86 0.95 1,053.81 0.95
tiss /t8s/ 4 436.22 903.68 0.78 1,098.93 0.71
trowed /tro[d/ 6 582.01 862.63 0.79 1,192.29 0.82
truds /tr4dz/ 5 524.74 849.35 0.89 1,054.65 0.61
twey /tw3]/ 4 484.54 740.49 0.97 1,116.31 0.95
twial /twe]l/ 5 591.11 857.57 0.95 1,161.88 0.86
udge /4j/ 4 429.74 957.06 0.84 1,069.00 0.79
ushed /4ct/ 5 442.00 1,193.07 0.73 1,061.71 0.92
vaits /v3]ts/ 5 575.42 812.11 0.97 1,134.37 0.73
vens /v2nz/ 4 651.26 932.76 0.89 1,379.65 0.61
vorde /vord/ 5 551.73 808.40 0.95 1,214.03 0.78
vorn /vorn/ 4 623.79 818.79 0.89 1,188.36 0.76
vull /v4l/ 4 577.94 777.78 0.95 1,193.35 0.94
wrells /r2lz/ 6 592.73 801.42 1.00 1,101.39 1.00
wrunch /r4n./ 6 578.01 923.70 0.97 1,166.06 0.46
yare /y2r/ 4 588.67 918.15 0.87 1,118.03 0.92
yent /y2nt/ 4 568.06 888.23 0.95 1,092.73 0.97
yug /y4g/ 3 521.84 777.41 0.97 982.42 0.95
yush /y4c/ 4 552.86 857.57 0.95 1,056.16 1.00
zay /z3]/ 3 555.17 785.05 0.97 1,089.97 0.97
zear /zir/ 4 591.11 803.73 0.89 1,126.40 0.95
zore /zor/ 4 611.76 753.81 0.95 1,084.03 0.92
131

APPENDIX H
Directions to Participants
132

Directions to Participants
1. Hearing Screening:
I am going to present several tones to either your left or your right ear. Please raise the hand corresponding to the ear in which you hear each tone. Do you have any questions?
[PRESENT TONES] 2. Lexical Decision Task:
IF THE AUDITORY SAY THE FOLLOWING FIRST: First I need to set the volume of the headphones and then we will continue.
You are going to [SEE/HEAR] several hundred [WRITTEN/SPOKEN] words. Some of the words will be real words and some will be nonsense words. Please [READ/LISTEN TO] each item and show whether you think it is a word or a nonsense word by pressing the button on the left marked word if the item is a word and pressing the button on the right marked nonword if the item is not a word. Please respond using only one hand throughout the entire task – either your right hand or your left hand. You can use 2 fingers, just one hand. Which hand will you be using?
[RECORD RESPONSE]
Please respond as quickly and accurately as possible. You cannot change your response after you press a button. If you are unsure about an item, make your best guess. You must respond to each item. Do you have any questions?
[PRESS SPACEBAR]
Good! Let's try 30 items for practice. While practicing you will receive feedback about your speed and accuracy on the computer screen after you respond to each item. I will remain in the room for the practice trials in case you have any questions. Press the spacebar when you are ready to begin.
Participant goes through the practice trials.
Great! That's the end of the practice trials. Now you will [SEE/HEAR] several hundred more items. For these, there won't be any feedback. Please continue using the same hand as you used in the practice items and only that hand to respond. Also, continue responding as quickly and accurately as possible and remember that you must respond to every item. Do you have any questions? [WAIT FOR A RESPONSE!]
Okay. After I leave the room and shut the door and when you are ready to begin, press the spacebar.
[LEAVE THE ROOM]
133

APPENDIX I
Covariate Data
134

Mean Lexical Decision Latencies Adjusted on Covariates
Descriptive statistics after adjusting for covariates acoustic duration and semantic
representation frequency estimate are in Table 23. The ANCOVA indicated a significant Main
Effect of Word Type (Table 24).
Table 23. Lexical Decision Latencies Adjusted on the Covariates Acoustic Duration and Semantic Representation Frequency Estimate
Mn SD SEM Heterographic homophones 905.98 183.59 9.68 Homographic homophones 898.49 183.80 9.69 Control Words 942.70 182.62 9.63 Visual 777.45 149.10 7.86 Auditory 1,054.00 149.10 7.86 Total 915.72 105.44 5.56
Table 24. ANCOVA Results Adjusted for the Covariates Acoustic Duration and Semantic Representation Frequency Estimate
Variable df MS F d Power Main effect of word type 2 67,079.12 6.04** 0.28 0.88 Main effect of modality 1 6,882364.19 619.18** 3.03 1.00 Modality and Word Type 2 11,564.86 1.04 0.15 0.23 Within-cells error 352 11,115.30 Note. *p < 0.05, **p < 0.01
Tables 25 and 26 contain the descriptive statistics adjusted for the covariates in the visual
condition and auditory condition respectively. Within the visual and auditory conditions, there
significant Main Effects of Word Type (Tables 27 and 28). Visual lexical decision latencies
were significantly shorter to homographic homophones than to control words (Table 25).
Auditory lexical decision latencies were significantly shorter to heterographic homophones than
to control words and to homographic homophones than to control words (Table 26).
135

Table 25. Visual Lexical Decision Latencies Adjusted on the Covariates Acoustic Duration and Semantic Representation Frequency Estimates
Mn SD SEM Heterographic homophones 781.79ab 188.67 14.06 Homographic homophones 747.87a 188.88 14.08 Control Words 803.91a 187.66 13.99 Note. Within each section of the table, means that differ significantly (p < 0.05) are given different subscripts.
Table 26. Auditory Lexical Decision Latencies Adjusted on the Covariates Acoustic Duration and Semantic Representation Frequency Estimates
Mn SD SEM Heterographic homophones 1,029.22a 161.33 12.03 Homographic homophones 1,049.61a 161.49 12.04 Control Words 1,081.94b 160.47 11.96 Note. Within each section of the table, means that differ significantly (p < 0.05) are given different subscripts.
Table 27. One-Way ANCOVAs on Visual Lexical Decision Latencies Adjusted for the Covariates Acoustic Duration and Semantic Representation Frequency Estimate (n = 180)
Variable df SS MS F d Power Word Type 2 94,639.43 47,317.25 Error 175 2,053,926.81 11,736.73
4.03* 0.33 0.71
Note. *p < 0.05 **p <0.01
Table 28. One-Way ANCOVAs on Auditory Lexical Decision Latencies Adjusted for the Covariates Acoustic Duration and Semantic Representation Frequency Estimate (n = 180)
Variable df SS MS F d Power Word Type 2 84,589.88 42,294.94 Error 175 1,502,026.74 8,583.01
4.93** 0.36 0.80
Note. *p < 0.05 **p <0.01
136

APPENDIX J
Item Accuracy Outliers Removed
137

Analyses with Item Accuracy Outliers Removed
Response Accuracy Analyses
To determine whether these greater inaccuracy and longer lexical decision latencies for
control words reflect token inaccuracy in lexical decision tasks, response accuracy data was
submitted to statistical analyses by participants and items across word types. As with the initial
analyses, participant and item data are analyzed with 2 (Modality) x 3 (Word Type) ANOVAs
and One-way ANOVAs for visual lexical decision and auditory lexical decision. Response
accuracy data were submitted for analyses as a proportion (i.e., number correct divided total
possible correct).
Overall Response Accuracy Analyses
In sum, overall there were significant differences for response accuracy among word
types which were maintained within analyses specific to each modality. As hypothesized, there
were more control word accuracy outliers in each modality compared with the other stimulus
word types. Such a concentration item accuracy outliers may have skewed the initial results.
Accordingly, data are re-analyzed with item accuracy outliers excluded.
Descriptive statistics are presented in Table 29. In the 2 (Modality) x 3 (Word type) there
was a significant Main Effect of Word Type by participants (F1(2, 148) = 3.92, p = 0.02, MSE =
1,159.44, Cohen’s d = 0.06, Power = 0.70; F2(2, 330) = 0.62, p = 0.54, MSE = 8,637.09, Cohen’s
d = 0.10, Power = 0.15) and a significant Interaction between Modality and Word Type by
participants (F1(2, 148) = 3.07, p < 0.05, MSE = 1,159.44, Cohen’s d = 0.05, Power = 0.59; F2(2,
330) = 0.44, p = 0.65, MSE = 8,637.09, Cohen’s d = 0.06, Power = 0.12).
138

Table 29. Descriptive Statistics by Participants and Items as a Function of Word Type and Modality
Word Type Mn SD SEM Participants (N = 76)
Heterographic Homophones 892.30 195.31 22.40 Homographic Homophones 885.23 205.72 23.60 Control Words 900.68 213.46 24.49 Visual 750.04 204.26 23.43 Auditory 1,035.43 204.26 23.43
Items (N = 360) Heterographic Homophones 902.64 167.15 8.68 Homographic Homophones 891.42 171.48 8.56 Control Words 903.84 169.36 9.16 Visual 758.08 97.71 7.20 Auditory 1,040.52 87.41 7.17
Descriptive statistics for lexical decision latencies are in Table 30 for the visual condition
and in Table 31 for the auditory condition. The One-way ANOVAs on lexical decision latencies
yielded a significant main effect of word type by participants in the visual condition (F1(2, 74) =
3.30, p = .04 MSE = 1,077.45, Cohen’s d = 0.10, Power = 0.61; F2(2, 164) = 0.78, p = 0.46, MSE
= 9,572.69, Cohen’s d = 0.19, Power = 0.18) and in the auditory condition by participants (F1(2,
74) = 3.67, p = .03, MSE = 1,241.42, Cohen’s d = 0.13, Power = 0.66; F2(2, 166) = 0.21, p =
0.81, MSE = 7,712.77, Cohen’s d = 0.10, Power = 0.08). Heterographic homophones had
significantly longer visual lexical decision latencies than homographic homophones by
participants (Table 30). Control words had significantly longer auditory lexical decision
latencies than heterographic homophones (Table 31)
139

Table 30. Visual Lexical Decision Latencies as a Function of Word Type with Item Accuracy Outliers Excluded
Variable Mn SD SEM Participants (n = 38)
Heterographic homophones 757.48a 159.29 25.84 Homographic homophones 739.10 b 147.04 23.85 Control Words 753.53ab 165.85 26.90
Items (n = 167) Heterographic homophones 767.86 113.21 12.19 Homographic homophones 745.63 83.05 12.63 Control Words 760.75 96.09 13.57 Note. Within each section of the table, means that differ significantly (p < 0.05) are given different subscripts.
Table 31. Auditory Lexical Decision Latencies as a Function of Word Type with Item Accuracy Outliers Excluded
Variable Mn SD SEM Participants (n = 38)
Heterographic homophones 1,027.12a 120.87 19.61 Homographic homophones 1,031.35ab 142.51 23.12 Control Words 1,047.83b 142.76 25.84
Items (n = 169) Heterographic homophones 1,037.42 83.16 11.34 Homographic homophones 1,037.22 96.07 11.53 Control Words 1,046.93 83.20 12.30 Note. Within each section of the table, means that differ significantly (p < 0.05) are given different subscripts.
140

APPENDIX K
Morphologically Different Heterographic homophones Removed
141

Analyses with Morphologically Different Heterographic homophones Excluded
Morphologically different heterographic homophones were excluded from the stimulus
set used in the analysis with Item Accuracy Outliers Excluded (Appendix I). In visual lexical
decision, 5,256 data points remained of the 6,840 possible data points (76.84%). In auditory
lexical decision, 5,315 data points remained of the 6,840 possible data points (77.70%).
Descriptive statistics are shown in Table 32. The 2 (Modality) x 3 (Word type) ANOVAs
yielded a significant Main Effect of Word Type by participants (F1(2, 148) = 4.07, p = 0.02,
MSE = 1,149.64, Cohen’s d = 0.09, Power = 0.79; F2 (2, 311) = 0.51, p = 0.60, MSE = 8,294.11,
Cohen’s d = 0.06, Power = 0.13).
Table 32. Lexical Decision Latencies with Morphologically Heterographic Homophones Excluded
Word Type Mn SD SEM Participants (N = 76)
Heterographic Homophones 888.39 199.54 16.58 Homographic Homophones 886.10 205.58 16.69 Control Words 900.68 213.46 17.75 Visual 748.37 206.07 23.64 Auditory 1,035.08 206.07 23.64
Items (N = 360) Heterographic Homophones 896.84 168.03 9.30 Homographic Homophones 891.42 171.48 8.39 Control Words 903.84 169.36 8.97 Visual 754.72 94.18 7.29 Auditory 1,040.01 87.14 7.24
Tables 33 and 34 contain descriptive statistics for visual and auditory lexical decision
latencies, respectively. In the One-way (word type) ANOVA on visual lexical decision latencies
the main effect of word type did not approach significance, F1(2, 74) = 1.62, p = 0.21, MSE =
1,044.34, Cohen’s d = 0.07, Power = 0.33; F2 (2, 155) = 0.41, p = 0.67, MSE = 8,925.42,
Cohen’s d = 0.14, Power = 0.12. In the One-way (word type) ANOVA on auditory lexical
decision latencies, the main effect of word type reached significance by participants, F1(2, 74) =
142

3.91, p = 0.02, MSE = 1,252.94, Cohen’s d = 0.14, Power = 0.69; F2(2, 156) = 0.24, p = 0.78,
MSE = 7,686.85, Cohen’s d = 0.11, Power = 0.09. Heterographic homophones had significantly
shorter auditory lexical decision latencies than control words by participants (Table 34).
Table 33. Visual Lexical Decision Latencies with Morphologically Different Heterographic Homophones Excluded
Variable Mn SD SEM Participants (n = 38)
Heterographic homophones 750.72 161.13 26.14 Homographic homophones 740.84 148.39 24.07 Control Words 753.53 165.85 26.90
Items (n = 158) Heterographic homophones 757.79 105.99 13.93 Homographic homophones 745.63 83.05 12.20 Control Words 760.75 96.09 13.10 Note. Within each section of the table, means that differ significantly (p < 0.05) are given different subscripts.
Table 34. Auditory Lexical Decision Latencies with Morphologically Different Heterographic Homophones Excluded
Variable Mn SD SEM Participants (n = 38)
Heterographic homophones 1,026.06a 125.76 20.40 Homographic homophones 1,031.35ab 142.51 23.12 Control Words 1,047.83b 142.76 23.16
Items (n = 159) Heterographic homophones 1,035.89 81.29 12.38 Homographic homophones 1,037.22 96.07 11.50 Control Words 1,046.93 83.30 12.26 Note. Within each section of the table, means that differ significantly (p < 0.05) are given different subscripts.
143

BIBLIOGRAPHY
American Speech-Language-Hearing Association Audiologic Assessment Panel 1996 (1997).
Guidelines for audiologic screening. Rockville, MD: Author.
Azuma, T. (1996). Familiarity and relatedness ratings for 110 homographs. Behavioral Research Methods, Instruments, and Computers, 28, 109-124.
Azuma, T. & Van Orden, G. C. (1997). Why SAFE is better than FAST: The relatedness of a word’s meanings affects lexical decision times. Journal of Memory and Language, 36, 484-504.
Baayen, R. H., Piepenbrock, P., & van Rijn, H. (1993). The CELEX Lexical Database (CD-ROM). Linguistic Data Consortium, University of Pennsylvania, Philadelphia, PA.
Balota, D. A., Cortese, M. J., Hutchison, K. A., Neely, J. H., Nelson, D., Simpson, G. B., &
Treiman, R. (2002). The English lexicon project: A web-based repository of descriptive and behavioral measures for 40,481 English words and nonwords. HTTP://elexicon.wustl.edu
Balota, D. A., Cortese, M. J., Sergent-Marshall, S. D., Spieler, D. H., & Yap, M. J. (2004). Visual word recognition of single-syllable words. Journal of Experimental Psychology: General, 133 (2), 283-316.
Bell, L. C. & Perfetti, C. A. (1994). Reading skill: Some adult comparisons. Journal of Experimental Psychology, 86 (2), 244-255.
Blair, I. V., Urland, G. R., & Ma, J. E. (2002). Using internet search engines to estimate word frequency. Behavioral Research Methods, Instruments, and Computers, 34 (2), 286-290.
Borowsky, R. & Masson, M. E. J. (1996). Semantic ambiguity effects in word identification. Journal of Experimental Psychology: Learning, Memory, and Cognition, 22 (1), 63-85.
Brown, G. D. & Watson, F. L. (1987). First in, first out: Word learning age and spoken frequency as predictors of word familiarity and word naming latency. Memory and Cognition, 15 (3), 208-216.
Burgess, C. & Livesay, K. (1998). The effect of corpus size in predicting reaction time in a basic word recognition task: Moving on from Kučera and Francis. Behavior Research Methods, Instruments, and Computers, 30 (2), 272-277.
Carroll, J. B., Davies, P., & Richman, B. (1971). Word Frequency Book. Boston: Houghton Mifflin.
144

Cleland, A. A., Gaskell, M. G., Quinlan, P. T., & Tamminen, J. (2006). Frequency effects in spoken and visual word recognition: Evidence from dual-task methodologies. Journal of Experimental Psychology: Human Perception and Performance, 32 (1), 104-119.
Coltheart, M. (2004). Are there lexicons? The Quarterly Journal of Experimental Psychology, 57A (7), 1153-1171.
Coltheart, M., Rastle, K., Perry, C., Langdon, R., & Ziegler, J. (2001). DRC: A Dual Route Cascaded Model of visual word recognition and reading aloud. Psychological Review, 108 (1), 204-256.
Daneman, M., Reingold, E. M., & Davidson, M. (1995). Time course of phonological activation during reading: Evidence from eye fixations. Journal of Experimental Psychology: Learning, Memory, and Cognition, 21 (4), 884-898.
Davelaar, E., Coltheart, M., Besner, D., & Jonasson, J. T. (1978). Phonological recoding and lexical access. Memory and Cognition, 8, 195-209.
de Groot, A. M. B. (1989). Representational aspects of word imageability and word frequency as assessed through word association. Journal of Experimental Psychology: Learning, Memory, & Cognition, 15, 824-845.
De Moor, W., Verguts, T., Brysbaert, M. (2005). Testing the Multiple in the multiple read-out model of visual word recognition. Journal of Experimental Psychology: Learning, Memory, and Cognition, 31 (6), 1502-1508.
Dixon, P. & Twilley, L. C. (1999a). An integrated model of meaning and sense activation and disambiguation. Brain and Language, 68, 165-171.
Dixon, P. & Twilley, L. C. (1999b). Context and homograph meaning resolution. Canadian Journal of Experimental Psychology, 53 (4), 335-346.
Dobbs, A. R., Friedman, A., & Lloyd, J. (1985). Frequency effects in lexical decisions: a test of the Verification Model. Journal of Experimental Psychology: Human Perception and Performance, 11 (1), 81-92.
Edwards, J. D., Pexman, P. M., & Hudson, C. E. (2004). Exploring the dynamics of the visual word recognition system: Homophone effects in LDT and naming. Language and Cognitive Processes, 19 (4), 503-532.
Fiez, J. A., Balota, D. A., Raichle, M. E., & Petersen, S. E. (1999). Effects of word frequency, spelling-to-sound regularity, and lexicality on the functional anatomy of word reading. Neuron, 24, 205-218.
Folk, J. R. (1999). Phonological codes are used to access the lexicon during silent reading. Journal of Experimental Psychology: Learning, Memory, and Cognition, 25 (4), 892-906.
145

Folk, J. R. & Morris, R. K. (1995). Multiple lexical codes in reading: Evidence from eye movement, naming time, and oral reading. Journal of Experimental Psychology: Learning, Memory, and Cognition, 21 (6), 1412-1429.
Frost, R. (1998). Toward a strong phonological theory of Visual word recognition: True issues and false tails. Psychological Bulletin, 123 (1), 71-99.
Frost, S. J., Fowler, C. A., & Rueckl, J. G. (2003). Bidirectional orthographic-phonological consistency effects on auditory word perception and production. Manuscript submitted for publication.
Galanter, E. G. (1962). Contemporary psychophysics. In R. Brown, E. Galanter, E. H. Hess, & G. Mandler (Eds.), New Directions in Psychology (pp. 89-114). New York: Holt, Rinehart, & Winston.
Gaskell, M. G. & Marslen-Wilson, W. D. (1997). Integrating for and meaning: A distributed model of speech perception. Language and cognitive processes, 12 (5/6), 613-656.
Gaskell, M. G. & Marslen-Wilson, W. D. (2002). Representation and competition in the perception of spoken words. Cognitive Psychology, 25, 220-266.
Gibbs, P. & Van Orden, G. C. (1998). Pathway selection’s utility for control of word recognition. Journal of Experimental Psychology: Human Perception and Performance, 24 (4), 1162-1187.
Gilhooly, K. J. & Logie, R. H. (1980). Meaning-dependent ratings of imagery, age of acquisition, familiarity, and concreteness for 387 ambiguous words. Behavior Research Methods & Instrumentation, 12 (4), 428-450.
Goldinger, S. D. (1996). Auditory lexical decision. Language and Cognitive Processes, 11 (6), 559-567.
Gottlob, L. R., Goldinger, S. D., Stone, G. O., & Van Orden, G. C. (1999). Reading homographs: Orthographic, phonologic, and semantic dynamics. Journal of Experimental Psychology: Human Perception and Performance, 25 (2), 561-574.
Griffin, Z. M. (1999). Frequency of meaning use for ambiguous and unambiguous words. Behavior Research Methods, Instruments, and Computers, 31 (3), 520-530.
Grossberg, S. (2000). The complementary brain: Unifying brain dynamics and modularity. Trends in Cognitive Sciences, 4 (6), 233-246.
Harm, M. W. & Seidenberg, M. S. (2004). Computing the meanings of words in reading: Cooperative division of labor between visual and phonological processes. Psychological Review, 111 (3), 662-720.
146

Hino, Y., Lupker, S. J., & Pexman, P. M. (2002). Ambiguity and synonymy effects in lexical decision, naming, and semantic categorization tasks: Interactions between orthography, phonology, and semantics. Journal of Experimental Psychology: Learning, Memory, and Cognition, 28 (4), 686-713.
Hobbs, J. B. (1999). Homophones and homographs: An American dictionary (3rd ed.). Jefferson, NC: McFarland & Company, Inc.
Holden, J. G. (2002). Fractal characteristics of response time variability. Ecological Psychology, 14 (1-2), 53-86.
Huck, S. W. & Cormier, W. H. (1996). Reading Statistics and Research (2nd ed.). New York, NY: Longman.
Jared, D. (2002). Spelling-sound consistency and regularity effects in word naming. Journal of Memory and Language, 46 (4), 723-750.
Jared, D., Levy, B. A., & Rayner, K. (1999). The role of phonology in the activation of word meanings during reading: Evidence from proofreading and eye movements. Journal of Experimental Psychology: General, 128 (3), 219-264.
Kawamoto, A. H., Farrar, W. T., & Kello, C. T. (1994). When two meanings are better than one: Modeling the ambiguity advantage using a recurrent distributed network. Journal of Experimental Psychology: Human Perception and Performance, 20 (6), 1233-1247.
Kellas, G., Ferraro, F. R., & Simpson, G. B. (1988). Lexical ambiguity and the time course of attentional allocation in word recognition. Journal of Experimental Psychology: Human Perception and Performance, 14 (4), 601-609.
Klein, D. E. & Murphy, G. L. (2001). The representation of polysemous words. Journal of Memory and Language, 45, 259-282.
Klepousniotou, E. (2002). The processing of lexical ambiguity: Homonymy and polysemy in the mental lexicon. Brain and Language, 81, 205-223.
Kučera, H. & Francis, W. N. (1967). Computational Analysis of Present-Day American English. Providence, RI: Brown University Press.
Lee, C. J. (2003). Evidence-based selection of word frequency lists. Journal of Speech-Language Pathology and Audiology, 27, 170-173.
Lewellen, M. J., Goldinger, S. D., Pisoni, D. B., & Greene, B. G. (1993). Lexical familiarity and processing efficiency: Individual differences in naming, lexical decision, and semantic categorization. Journal of Experimental Psychology: General, 122 (3), 316-330.
Luce, P. A., Goldinger, S. D., Auer, E., & Vitevitch, M. S. (2000). Phonetic priming, neighborhood activation, and PARSYN. Perception and psychophysics, 62 (3), 615-625.
147

Luce, P. A. & Pisoni, D. (1998). Recognizing spoken words: The neighborhood activation model. Ear and Hearing, 19, 1-36.
Marcus, M. P., Santorini, B., & Marcinkiewicz, M. A. (1993). Building a large annotated corpus of English: The Penn treebank. Computational Linguistics, 19 (2), 313-330.
Martin, F. N. (1994). Introduction to Audiology (5th ed). Englewood Cliffs, NJ: Prentice-Hall, Inc.
McClelland, J. L. (1991). Stochastic interactive processes and the effect of context on perception. Cognitive Psychology, 23(1), 1-44.
McClelland, J. L. & Elman, J. L. (1986a). The TRACE Model of Speech Perception. Cognitive Psychology, 18, 1-86.
McClelland, J. L. & Elman, J. L. (1986b). Interactive processes in speech perception: The TRACE Model. In J. A. Feldman, P. J. Hayes, & D. E. Rumelhart (Eds.), Parallel Distributed Processing: Explorations in the microstructure of cognition. Psychological and Biological Models (Vol. 2). Cambridge, MA: The MIT Press.
McClelland, J. L. & Rumelhart, D. E. (1981). An interactive activation model of context effects in letter perception: I. An account of basic findings. Psychological Review, 88 (15), 375-407.
McLennan, C. T. & Luce, P. A. (2005). Examining the time course of indexical specificity effects in spoken word recognition. Journal of Experimental Psychology: Learning, Memory, and Cognition, 31 (2), 306-321.
Montant, M. (2000). Feedback: A general mechanism in the brain. Behavioral and Brain Sciences, 23 (3), 340-341.
Nixon, S. M. (2002). [Feedback and feedforward consistency of onsets and rimes in English]. Unpublished raw data.
Nixon, S. M. et al. (in preparation). Validating Internet-based estimates of meaning dominance.
Norris, D. G. (1994). Shortlist: A connectionist model of continuous speech recognition. Cognition, 52, 189-234
Norris, D., McQueen, J. M., & Cutler, A. (2000a). Feedback on feedback: It’s feedforward. Behavioral and Brain Sciences, 23, 352-370.
Norris, D., McQueen, J. M., & Cutler, A. (2000b). Merging information in speech recognition: Feedback is never necessary. Behavioral and Brain Sciences, 23, 299-370.
Pecher, D. (2001). Perception is a two-way junction: Feedback semantics in word recognition. Psychonomic Bulletin & Review, 8 (3), 545-551.
148

Peereman, R. & Content, A. (1997). Orthographic and phonological neighborhoods in naming: Not all neighbors are equally influential in orthographic space. Journal of Memory and Language, 37 (3), 382-410.
Peereman, R., Content, A., & Bonin, P. (1998). Is perception a two-way street? The case of feedback consistency in visual word recognition. Journal of Memory and Language, 39, 151-174.
Pexman, P. M., Hino, Y., & Lupker, S. J. (2004). Semantic ambiguity and the process of generating meaning from print. Journal of Experimental Psychology: Learning, Memory, and Cognition, 30 (6), 1252-1270.
Pexman, P. M. & Lupker, S. J. (1999). Ambiguity and visual word recognition: Can feedback explain both homophone and polysemy effects? Canadian Journal of Experimental Psychology, 53 (4), 323:334.
Pexman, P. M., Lupker, S. J., & Hino, Y. (2002). The impact of feedback semantics in visual word recognition: Number-of-feature effects in lexical decision and naming tasks. Psychonomic Bulletin and Review, 9 (3), 542-549.
Pexman, P. M., Lupker, S. J., & Jared, D. (2001). Homophone effects in lexical decision. Journal of Experimental Psychology: Learning, Memory, and Cognition, 27 (1), 139-156.
Pexman, P. M., Lupker, S. J., & Reggin, L. D. (2002). Phonological effects in visual word recognition: Investigating the impact of feedback activation. Journal of Experimental Psychology: Learning, Memory, and Cognition, 28 (3), 572-584.
Plaut, D. C., McClelland, J. L., Seidenberg, M. S., & Patterson, K. (1996). Understanding normal and impaired word reading: Computational principles in quasi-regular domains. Psychological Review, 103 (1), 56-115.
Protopapas, A. (1999). Connectionist modeling of speech perception. Psychological Bulletin, 125 (4), 410-436.
Radeau, M., Morais, J., Mousty, P., Saerens, M. & Bertelson, P. (1992). A listener’s investigation of printed word processing. Journal of Experimental Psychology: Human Perception and Performance, 18 (3), 861-871.
Radeau, M., Mousty, P., & Bertelson, P. (1989). The effect of the uniqueness point in spoken word recognition. Psychological Research, 51, 123-128.
Ratcliff, R., Gomez, P., & McKoon, G. (2004). A diffusion model account of the lexical decision task. Psychological Bulletin, 111 (1), 159-182.
Rodd, J. M., Gaskell, M. G., Marslen-Wilson, W. D. (2004). Modeling the effects of semantic ambiguity in word recognition. Cognitive Science, 28, 89-104.
149

Rodd, J., Gaskell, G., & Marslen-Wilson, W. (2002). Making sense of semantic ambiguity: Semantic competition in lexical access. Journal of Memory and Language, 46, 245-266.
Rondthaler, E. & Lias, E. J. (Eds.). (1986). Dictionary of simplified American spelling: An alternative spelling for English. New York, NY: The American Language Academy.
Rueckl, J. G. (2002). The dynamics of visual word recognition. Ecological Psychology, 14 (1-2), 5-19.
Rumelhart, D. E. & McClelland, J. L. (1982). An interactive activation model of contact effects in letter perception: II. The contextual enhancement effect and some tests and extension of the model. Psychological Review, 89 (1), 60-94.
Samuel, A. G. (2001). Some empirical tests of Merge’s architecture. Language and Cognitive Processes, 16 (5/6), 709-714.
Schneider, W., Eschman, A., & Zuccolotto, A. (2002). E-Prime (Version 1.1) [Computer software]. Pittsburgh, PA: Psychology Software Tools, Inc.
Sears, C. R., Hino, Y., & Lupker, S. J. (1995). Neighborhood size and neighborhood frequency effects in word recognition. Journal of Experimental Psychology: Human Perception & Performance, 21 (4), 876-900.
Seidenberg, M. S. & McClelland, J. L. (1989). A distributed, developmental model of word recognition and naming. Psychological Review, 96 (4), 523-68.
Smith, M. C. & Besner, D. (2001). Modulating semantic feedback in visual word recognition. Psychonomic Bulletin and Review, 8 (1), 111-117.
Starr, M. S. & Fleming, K. K. (2001). A rose by any other name is not the same: The role of orthographic knowledge in homophone confusion errors. Journal of Experimental Psychology: Learning, Memory, and Cognition, 27 (3), 744-760.
Stone, G. O., Vanhoy, M., & Van Orden, G. C. (1997). Perception is a two-way street: Feedforward and feedback phonology in visual word recognition. Journal of Memory and Language, 36, 337-359.
Stone, G. O. & Van Orden, G. C. (1994). Building a resonance framework for word recognition using design and system principles. Journal of Experimental Psychology: Human Perception and Performance, 20 (6), 1248-1268.
Tanenhaus, M. K., Magnuson, J. S., McMurray, B., & Aslin, R. N. (2000). No compelling evidence against feedback in spoken word recognition. Behavioral and Brain Sciences, 23 (3), 348-349.
Twilley, L. C. & Dixon, P. (2000). Meaning resolution processes for words: A parallel independent model. Psychonomic Bulletin & Review, 7 (1), 49-82.
150

Unsworth, S. J. & Pexman, P. M. (2003). The impact of reader skill on phonological processing in visual word recognition. The Quarterly Journal of Experimental Psychology, 56A (1), 63-81.
Van Orden, G. C. (2002). Nonlinear dynamics and psycholinguistics. Ecological Psychology, 14 (1-2), 1-4.
Van Orden, G. C., Bosman, A. M. T., Goldinger, S. D., & Farrar, W. T. (1997). A recurrent network account of reading, spelling, and dyslexia. In G. E. Stelmach & P. A. Vroon (Eds.) & J. W. Donahoe & V. Packard Dorsel (Vol. Eds.), Advances in Psychology: Vol. 121. Neural-Network Models of Cognition: Biobehavioral Foundations (pp. 522 - 538). New York, NY: Elsevier.
Van Orden, G. C. & Goldinger, S. D. (1994). Interdependence of form and function in cognitive systems explains perception of primed words. Journal of Experimental Psychology: Human Perception and Performance, 20 (6), 1269-1291.
Van Orden, G. C., Jansen op de Haar, M. A., & Bosman, A. M. T. (1997). Complex dynamic systems predict dissociations, but they do not reduce to autonomous components. Cognitive Neuropsychology, 14 (1), 131-165.
Van Orden, G. C., Pennington, B. F., & Stone, G. O. (1990). Word identification in reading and the promise of subsymbolic psycholinguistics. Psychological Review, 97 (4), 488-522.
Ventura, P., Morais, J., Pattamadilok, C., & Kolinsky, R. (2004). The locus of the orthographic consistency effect in auditory word recognition. Language and Cognitive Processes, 19 (1), 57-95.
Vitevitch, M. S. (2002). The influence of phonological similarity neighborhoods on speech production. Journal of Experimental Psychology: Learning, Memory, & Cognition, 28 (4), 735-747.
Whaley, C. P. (1978). Word-nonword classification time. Journal of Verbal Learning and Verbal Behavior, 17, 143-154.
Zeno, S. M., Ivens, S. H., Millard, R. T., & Ruvvuri, R. (1995). The Educator’s Word Frequency Guide. New York, NY: Touchstone Applied Science Associates.
Ziegler, J. C. & Ferrand, L. (1998). Orthography shapes the perception of speech: the consistency effect in auditory word recognition. Psychonomic Bulletin and Review, 5 (4), 683-689.
Ziegler, J. C., Ferrand, L., & Montant, M. (2004). Visual phonology: The effects of orthographic consistency on different auditory word recognition tasks. Memory and Cognition, 32 (5), 732-741.
Ziegler, J. C., Montant, M., & Jacobs, A. M. (1997). The feedback consistency effect in lexical decision and naming. Journal of Memory and Language, 37, 533-554.
151
Ziegler, J. C., Muneaux, M., & Grainger, J. (2003). Neighborhood effects in auditory word recognition: Phonological competition and orthographic facilitation. Journal of Memory and Language, 48, 779-793.
Zorzi, M. (2000). Serial processing in reading aloud: No challenge for a parallel model. Journal of Experimental Psychology: Human Perception and Performance, 26 (2), 847-856.
Zorzi, M., Houghton, G., & Butterworth, B. (1998). Two routes or one in reading aloud? A connectionist dual-process model. Journal of Experimental Psychology: Human Perception and Performance, 24 (4), 1131-1161.
152