effects of poe and carbon black on the ptc performance and
TRANSCRIPT
Research ArticleEffects of POE and Carbon Black on the PTC Performance andFlexibility of High-Density Polyethylene Composites
Feng Xue , Kangcai Li , Lei Cai, and Enyong Ding
College of Material Science and Engineering, South China University of Technology, Guangzhou 510640, China
Correspondence should be addressed to Feng Xue; [email protected]
Received 19 July 2021; Revised 28 October 2021; Accepted 30 October 2021; Published 10 November 2021
Academic Editor: Szczepan Zapotoczny
Copyright © 2021 Feng Xue et al. This is an open access article distributed under the Creative Commons Attribution License,which permits unrestricted use, distribution, and reproduction in any medium, provided the original work is properly cited.
High-density polyethylene (HDPE)/carbon black (CB) is widely used in positive temperature coefficient (PTC) composites. Inorder to expand its applications to fields that need good flexibility, polyolefin elastomer (POE) was incorporated intoHDPE/CB composites as a secondary thermoplastic elastomer phase to provide flexibility. The effects of POE and CB contenton the PTC performance and flexibility were investigated. Micro morphology and crystallization behavior are closely related toPTC properties. SEM was conducted to reveal phase morphology and filler dispersion, and DSC was conducted to researchcrystallization behavior. The results show that the incorporation of 18wt.% POE can decrease the percolation threshold ofconductive carbon black from 22.5 wt.% to 16wt.%. When the CB content is 30 wt.%, the room temperature resistivitygradually increases with the increasing content of POE because of the barrier effect of POE phase, and the PTC intensity isgradually enhanced. Meanwhile, the PTC switching temperature shifts down to a lower temperature. The incorporation of18wt.% POE significantly increases the elongation at break, reaching an ultrahigh value of 980wt.%, which means greatflexibility has been achieved in HDPE/POE/CB composites. This work provides a new method of fabricating PTC compositeswith balanced electrical and mechanical properties.
1. Introduction
In general, conductive polymer composites (CPCs) exhibit asharp electrical resistivity increase when the temperature isclose to the melting point of the polymer, which is calledthe positive temperature coefficient (PTC) effect [1]. As earlyas the 1950s, the PTC effect was found in carbon black-filledpolyolefin composites, which was first suggested by Fryd-man to be used in electrical circuit protection, self-regulating heaters, and temperature sensors [1]. Up tonow, they are still widely used in these fields [2–9]. Besides,some are seen in safety batteries [2, 10, 11]. Lithium-ion bat-teries are the dominant type of battery used in portable elec-tronic devices, electric vehicle, and large-scale energy storagesystem for their high-energy density, long cycle life, and fastcharging and discharging rate [12]. Under low temperature,batteries suffer from poor performance such as low chargingand discharging rate and low charge and discharge capacity[13]. A heating system is necessary for thermal management
[14]. PTC composites are expected to be the heating materialwith great development potential.
High-density polyethylene (HDPE)/carbon black (CB) isone of the most used conventional PTC composites for itssemicrystalline nature, good thermal stability, high thermalexpansion rate around the melting point, and notable PTCbehavior [9]. However, it is well known that the incorpora-tion of rigid fillers into polymers will increase their brittle-ness. When HDPE/CB is made into small thin sheets, it iseasy to fracture, restricting their application in the preciseand compact modern electronic equipment that requiregood flexibility [8, 15]. Therefore, it is urgent to impart car-bon black-filled polyolefin composites with both good flexi-bility and considerable PTC intensity.
The incorporation of carbonous fillers into polymercomposites is unfavorable for the flexibility [16–20]. It isreported that there are two methods of reducing the brittle-ness and improving the flexibility of conductive polymercomposites: one is to reduce the amount of conductive filler
HindawiAdvances in Polymer TechnologyVolume 2021, Article ID 1124981, 11 pageshttps://doi.org/10.1155/2021/1124981

needed to form the conductive network in the compositesystem, namely, reducing the percolation threshold [21].The other is to introduce rubber or thermoplastic elastomer(TPE) into the composite system [9, 22, 23]. Liu et al. [9]melt blended styrene–ethylene–butylene–styrene (SEBS)with a graphene nanoplatelet- (GNP-) filled HDPE master-batch. The results showed that the elongation at break ofHDPE/GNP/SEBS blend increased with increasing concen-tration of the thermoplastic elastomer, reaching a maximumof more than 300%. Meanwhile, it still exhibited certain self-regulating heating function. Wang and Cheng [23] com-pared the PTC effect of olefin block copolymer (OBC)/paraf-fin/graphite with that of low-density polyethylene(LDPE)/paraffin/graphite, finding that the composites withOBC had better flexibility than those with LDPE. The roomtemperature resistivity of the former was two orders of mag-nitude lower than the latter, but the problem is that the for-mer showed a relatively lower PTC intensity.
Polymer blending influences PTC properties in threeways. First, some researchers found that different polymermatrix with different polymer crystallization behavior canexhibit different thermal volume expansion behavior andthus influence PTC behavior [24–26]. Luo et al. [25] foundthat ethyl vinyl acetate (EVA)/LDPE/CB have lower PTCintensity and lower temperature at the maximum of resistiv-ity exists than LDPE/CB, which is believed to be the result ofimperfection of crystalline regions between EVA and LDPE.Secondly, the blending of other polymer components formsthe “sea island” effect or segregated structures to tune theconductive networks [15, 27, 28]. Zha et al. [21] fabricateda kind of nanocomposites with remarkably enhanced posi-tive temperature coefficient by blending ultrahigh molecularweight polyethylene (UHMWPE) with polyvinylidene fluo-ride (PVDF). The PTC intensity of UHMWPE/PVDE/CBis higher than that of UHMWPE/CB, and the initial resistiv-ity of UHMWPE/PVDE/CB is lower than that of UHMW-PE/CB for the volume exclusion effect of PVDF phase. TheSEM images prove the existence of segregated structureand the preferential distribution of carbon filler inUHMWPE phase. Thirdly, the PTC intensity of PTC com-posites is directly positively related to thermal expansioncoefficients of the matrix [4, 25, 29].
Conclusively, the phase morphology can be tuned bypolymer blending to impart composites with balanced andoptimised electrical and mechanical properties [30, 31].However, there still exist some problems such as low PTCintensity [9, 23]. POE is a type of TPE synthesized byethylene-octene random copolymerization, possessing theadvantages of good thermal stability, good processability,and good flexibility. Blending POE into polyolefin-basedPTC composites to improve the flexibility and PTC intensityhas still not been systematically studied. In this paper, in theCB-filled HDPE masterbatch, HDPE and POE were melt-blended in different ratios to tune the electrical and mechan-ical properties. Notably, the effects of CB content and POEcontent on the PTC behavior and flexibility were systemati-cally investigated. Micro morphology and crystallizationbehavior are closely related to PTC properties. Thus, SEMwas conducted to reveal phase morphology and filler distri-
bution and DSC was conducted to research crystallizationbehavior. This kind of PTC composites is expected to beapplied in fields that need good flexibility.
2. Materials and Methods
2.1. Raw Materials. The HDPE/CB masterbatch with trade-mark B2000, which is composed of 50wt.% HDPE and50wt.% CB, was supplied by Guangdong Meilian NewMate-rial Co. Ltd. HDPE with trademark 8008 was supplied byFujian United Petrochemical Co. Ltd., with a density of0.955 g/cm3 and a melt flow rate of 7.6 g/10min. POE withtrademark 8150 (a metallocene-catalysed copolymer of eth-ylene and 25.0wt.% 1-octene, with a density of 0.868 g/cm3
and a melt flow rate of 0.5 g/10min) was obtained from USDow Chemical Company.
2.2. Sample Preparation. According to the preset formulas,the dried HDPE, HDPE/CB masterbatch, and POE wereweighed. HDPE was first plasticated through a double-rollopen mill with roll temperature of 130°C and roll distanceof 0.5mm. After the plastication was completed, POE andHDPE/CB masterbatch were successively added and mixedfor 6~8 times triangle package and then lowered the roll dis-tance to 0.1mm and mixed them for another 4~6 times tri-angle package. Finally, using a plate vulcanizer (QLB-D350X2), all the blends were pressed into square sheets witha thickness of 1mm under a pressure of 10MPa at 170°C for10min and cooled to room temperature for 3min under thesame pressure. For brevity, the formulations of HDPE-basedcomposites were marked according to the loading of CB andPOE.
2.3. Characterization
2.3.1. Measurement of Volume Resistivity-TemperatureCurves. The sheets with a thickness of 1mm were cut intostraight sheets with dimensions of 75mm × 10mm × 1mm.In order to reduce the contact resistance, both ends of allsamples were coated with 15mm wide aluminum foils witheffective conductive length of 46mm. The aluminum foilswere compressed onto the sample with clips, and the elec-trodes were jointed onto the clips. The temperature was con-trolled by a constant temperature humidity chamber, variedfrom 20°C to 120°C. After stabilizing the temperature at eachpoint for 30min, the volume resistance of the samples wasmeasured by using a resistance meter RM3554 (HIOKI).The volume resistivity can be calculated by the followingformula:
ρ =hbRl
=R46
, ð1Þ
where ρ is the volume resistivity (Ω·cm) and h, b, and lare the thickness (cm), width (cm), and length (cm), respec-tively. R is the volumn resistance (Ω).
2.3.2. Tensile Properties. The straight sheet samples withdimensions of 1mm × 10mm × 75mm were used to deter-mine the tensile strength and elongation at break of the
2 Advances in Polymer Technology

samples on an ZWICK universal material test machine(Z010) according to ASTM D412 A. The crosshead speedwas 500mm·min-1, and at least three samples were testedto obtain the average results.
2.3.3. Scanning Electron Microscopy (SEM). The sampleswere brittle-fractured by means of liquid nitrogen, and thefractured surfaces were sputtered with gold before observa-tion. The phase morphology and filler distribution of sam-ples were characterized with a scanning electronmicroscope EVO18 (SEM, Carl Zeiss Germany).
2.3.4. Differential Scanning Calorimetry (DSC). The meltingbehaviors of the composites were measured using an auto-matic differential scanning calorimetry DSCAQ (USA, TACompany). Under nitrogen atmosphere, 3~5mg sampleswere first treated with a heating-cooling cycle to eliminatethe thermal history. Then, they were heated up to 180°C ata heating rate of 10°C/min and held at 180°C for 5min toobtain heating curves.
3. Results and Discussion
3.1. Electrical Properties of HDPE/CB and HDPE/POE/CB.The percolation threshold is defined as the critical concen-tration of CB particles to form a conductive network. Abovethe critical concentration, the resistivity of compositesdecreases significantly with increasing filler content. Keepingthe percolation threshold as low as possible can contribute tothe better flexibility of composites. Figure 1(a) shows theroom temperature resistivity of both HDPE/CB and HDPE/-POE/CB (the mass fraction of POE is 18wt.%) as a functionof the CB content (10wt.%~40wt.%). It was observed thatwith increasing loading of CB, both samples exhibit sharplydecreased volume resistivity. The room temperature resistiv-ity of HDPE/CB decreases dramatically by about 5.3 ordersof magnitude in the range of CB content from 20wt.% to25wt.%, while the room temperature resistivity of HDPE/-POE/CB decreases dramatically by about 3.0 orders of mag-nitude in the range of CB content from 15wt.% to 20wt.%,indicating that good conductive networks are formed inthe concentration ranges. Classical percolation theory issuitable to describe the resistivity change of the compositesby a power law:
ρ∝ ω − ωcð Þt , ð2Þ
where ρ is the volume resistivity, ω is the mass fractionof CB, ωc is the percolation threshold, and t is the criticalexponent [30–32]. As shown in Figure 1(b), by fitting ofexperimental results with percolation law, the percolationthreshold of HDPE/CB is calculated to be 22.5wt.% andthe percolation threshold of HDPE/POE/CB is calculatedto be 16wt.%. HDPE/POE/CB has a lower percolationthreshold than HDPE/CB, which means the incorporationof POE reduces the percolation threshold. Building segre-gated conductive structure enriches the conductive fillers inthe interfacial regions and the percolation threshold of CPCscan be effectively reduced, which is also called exclusion and
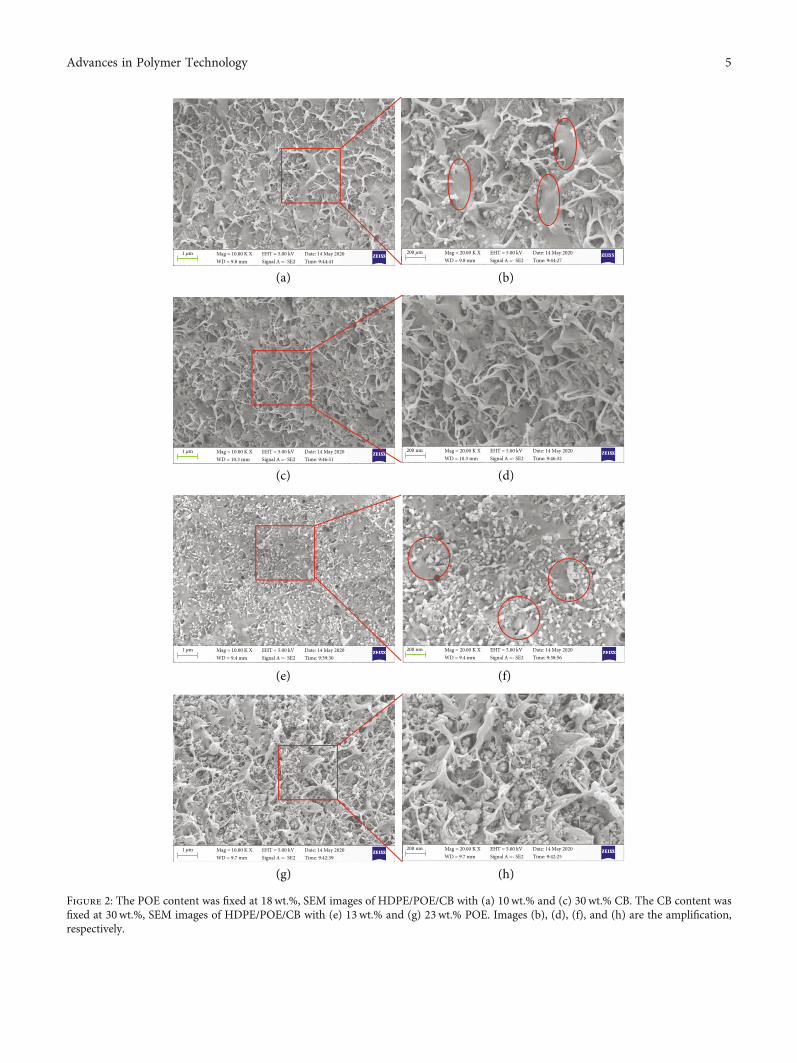
block effect [15, 31, 33–35]. Under the same CB content, thesegregated structure formed by the POE phases in the matrixcan bring about a denser conductive pathway, decreasing theresistance between CB particles, thus lowering the percola-tion threshold of HDPE/POE/CB. The segregated structurecan be observed in the SEM images of HDPE/POE/CB with10wt.% CB: Figures 2(a) and 2(b), in which the fibrous POEphase in red circles excludes CB aggregates into HDPEphase.
We compare results above with three CB-filled polyole-fin composites from other references in Table 1. The perco-lation threshold of HDPE/CB is calculated to be 22.5wt.% inthis article, close to the percolation threshold of HDPE/CB(20wt.%) studied in Reference [29]. The introduction of asecond polymer matrix can help form segregated structure.In this article, POE phase shows the volume exclusion effectand CB is selectively located in HDPE phase, whichdecreased the percolation threshold to 16.0wt.%. Similarbehaviors are seen in References [30, 31], in which the per-colation threshold of UHMWPE/PP/CB is 5.0wt.% and thepercolation threshold of HDPE/EVA/CB is 15.0wt.%.
The segregated structure can also decrease the resistivityof composites. According to Figure 1(a), when CB content isless than 25wt.%, the room temperature resistivity ofHDPE/POE/CB is lower than that of HDPE/CB for the seg-regated structure. However, when CB content is more than25wt.%, the room temperature resistivity of HDPE/POE/CBsurpasses that of HDPE/CB. This is probably because whenthe CB content is high enough, CB particles will migrate intoPOE phase and destroy the segregated structure. The POEphase will act as barriers or diluents [9] of the conductivepathways, which will make the room temperature resistivityof HDPE/POE/CB higher than HDPE/CB. This can be seenin the SEM images of HDPE/POE/CB with 30wt.% CB:Figures 2(c) and 2(d).
3.2. The PTC Behaviors of HDPE/POE/CB with Various CBContent and POE Content. PTC intensity reflects the signif-icant degree of PTC effect of composites. Generally, the PTCeffect is triggered by polymer phase transition. When thecrystalline phase of semicrystalline polymer compositestransforms to the amorphous phase, a significant thermalexpansion occurs, increasing the interparticle distances ofCB, reducing the number of conductive paths, thus resultingin dramatically increased resistivity of the materials [37].The calculation formula of PTC intensity is as follows:
PTC intensity = log ρmaxρRT
� �, ð3Þ
where ρRT is the room temperature resistivity and ρmax isthe maximum resistivity.
Figure 3(a) presents the volume resistivity-temperaturecurves of HDPE/POE/CB composites. Setting the POE con-tent as 18wt.%, as the CB content increases from 25wt.% to35wt.%, the whole resistivity-temperature curves movedown, which means the resistivity gradually decreases as aresult of increasing CB content [34]. The resistivity of eachsample sharply increases by more than four orders of
3Advances in Polymer Technology

magnitude in the same temperature range from 90°C to110°C. The improvement of CB content has little effect onthe PTC switching temperature. Figure 3(b) shows that thePTC intensity fluctuates with increasing loading of CB butshows an overall descending trend. In general, the highestPTC intensity appears near the percolation threshold ofCPCs [15, 18]. When CB content is above the percolationthreshold of 16wt.%, more conductive pathways have beenformed throughout the matrix and the PTC intensity versusCB content shows a similar behavior to the resistivity versusCB content: the more CB is incorporated, the lower PTCintensity and resistivity are. Therefore, a descending trendof PTC intensity is seen. The nonuniformity of the samplesgives rise to the experiment error and causes the PTC inten-sity fluctuation.
The PTC switching temperature typically corresponds tothe melting temperature of the polymer [39]. The meltingtemperature of POE is about 61.1°C and HDPE is about126.1°C as seen in Figure 4. The cocrystallization betweenHDPE and POE lowers melting temperature of the compos-ites, which can be proved through DSC in Figure 5(b) andTable 2 [26]. As shown in Figure 3(c), as the POE contentincreases from 0 to 28wt.%, the dramatically increased resis-tivity occurs at lower temperature, which means the lowerPTC switching temperature is obtained. Moreover,Figure 3(c) and Table 3 show that the resistivity of the com-posites gradually increases as the POE content increases. Thisis probably because when CB content is as high as 30wt.%, CBparticles migrate into the POE phase and destroy the segre-gated structure. The POE phases act as barriers or diluentsand decrease the number of the conductive pathways [9].
Besides, Figure 3(d) shows that the PTC intensity of thecomposites gradually increases from 6.10 to 8.51. Accordingto Table 3, the logarithm of resistivity change rate from 110°Cto 120°C of the composites is 4.62 for the sample POE-0%-CB-30% and the inclusion of POE (13wt.%~28wt.%) decreasesthe logarithm of resistivity change rate from 110°C to 120°C ofeach sample to 3.18. However, the logarithm of resistivity
change rate from 20°C to 110°C of the composites increasesfrom 1.49 to 5.34 with increasing POE content. It can be con-cluded that the inclusion of POE can greatly increase the resis-tivity change rate of low temperature range from 20°C to 110°Cand thus increase the PTC intensity across the whole tempera-ture range. This is because POE phase has a much lower melt-ing temperature with phase change that occurs at lowertemperature. This causes higher thermal expansion coefficientswithin low temperature range from 20°C to 110°C. The higherresistivity change rate of low temperature range can inhibit theoverheating at the early stage, which is favorable for the safetyof the PTC composites.
3.3. Tensile Properties of HDPE/POE/CB with Various CBContent and POE Content. Good flexibility allows PTC com-posites to be used in wearable electronic devices, soft robots,medical electronic equipment, and flexible electrodes [2]. Toguarantee enough flexibility of HDPE/POE/CB, the depen-dence of tensile strength and elongation at break on theCB and POE content is investigated as shown inFigures 6(a) and 6(b). In Figure 6(a), fixing the POE contentat 18wt.%, the tensile strength decreases from 18.8MPa to10.0MPa and the elongation at break decreases from1435% to 987% as the CB content increases from 15wt.%to 35wt.%. This is because the addition of rigid particlesCB into the composites improves the tensile modulus andhas an adverse effect on the flexibility and stretchability[17]. Fixing the CB content at 30wt.%, Figure 6(b) showsthat the addition of POE into the composites graduallyenhances their flexibility. Although the tensile strengthdecreases with increasing proportion of POE, the elongationat break experienced a distinguished improvement especiallywhen the POE content increases from 13wt.% to 18wt.%. Atough-brittle transition occurs at 18wt.%, and the flexibilityof the blends sharply increases. This can be attributed to theinherent low crystalline and high flexibility of POE. Whenthe POE content is above 13wt.%, the POE phase transformsfrom dispersed phase to continuous phase in the matrix,
10 15 20 25 30 35 40
0
2
4
6
8
10
12
Log𝜌
(𝛺·cm
)
Content of carbon black (%)
HDPE/CBHDPE/POE/CB
(a)
Log𝜌
(𝛺·cm
)
0.4 0.6 0.8 1.0 1.2 1.40
1
2
3
HDPE/CBHDPE/POE/CB
Log (𝜔-𝜔c)
𝜔c(HDPE/POE/CB)=16%
𝜔c(HDPE/CB)=22.5%
(b)
Figure 1: (a) Electrical conductivity as a function of the CB content; (b) fitting of experimental results with percolation law.
4 Advances in Polymer Technology
(a) (b)
(c) (d)
(e) (f)
(g) (h)
1 𝜇m Mag = 10.00 K XWD = 9.8 mm
EHT = 5.00 kVSignal A =- SE2
Date: 14 May 2020Time: 9:44:41
1 𝜇m Mag = 10.00 K XWD = 10.3 mm
EHT = 5.00 kVSignal A =- SE2
Date: 14 May 2020Time: 9:46:51
1 𝜇m Mag = 10.00 K XWD = 9.4 mm
EHT = 5.00 kVSignal A =- SE2
Date: 14 May 2020Time: 9:39:30
1 𝜇m Mag = 10.00 K XWD = 9.7 mm
EHT = 5.00 kVSignal A =- SE2
Date: 14 May 2020Time: 9:42:39
200 𝜇m Mag = 20.00 K XWD = 9.8 mm
EHT = 5.00 kVSignal A =- SE2
Date: 14 May 2020Time: 9:44:27
200 nm Mag = 20.00 K XWD = 10.3 mm
EHT = 5.00 kVSignal A =- SE2
Date: 14 May 2020Time: 9:46:32
200 nm Mag = 20.00 K XWD = 9.4 mm
EHT = 5.00 kVSignal A =- SE2
Date: 14 May 2020Time: 9:38:56
200 nm Mag = 20.00 K XWD = 9.7 mm
EHT = 5.00 kVSignal A =- SE2
Date: 14 May 2020Time: 9:42:25
Figure 2: The POE content was fixed at 18wt.%, SEM images of HDPE/POE/CB with (a) 10wt.% and (c) 30wt.% CB. The CB content wasfixed at 30wt.%, SEM images of HDPE/POE/CB with (e) 13wt.% and (g) 23wt.% POE. Images (b), (d), (f), and (h) are the amplification,respectively.
5Advances in Polymer Technology

which imparts the composites with elastomer-like proper-ties. But at the same time, the inherent low tensile strengthand the low degree of crystallinity of POE phase will causethe lower tensile strength of composites. These results fairly
conform to the research of Liu and Qiu [40] and Paul andKale [41]. They propose that the tough–brittle transitionoccurred at the 20wt.%~25wt.% of POE in polypropylene/-POE system.
20 40 60 80 100 120
2
4
6
8
Temperature (°C)
CB-25.0%CB-27.5%CB-30.0%
CB-32.5%CB-35.0%
Log𝜌
(𝛺·cm
)
(a)
25 30 354.0
4.5
5.0
5.5
PTC
inte
nsity
Content of CB (%)
(b)
20 40 60 80 100 1200
2
4
6
8
10
12
Temperature (°C)
Log𝜌
(𝛺·cm
)
POE-0.0%POE-13.0%POE-18.0%
POE-23.0%POE-28.0%
(c)
0 5 10 15 20 25 30
6
7
8
9
PTC
inte
nsity
Content of POE (%)
(d)
Figure 3: (a) The PTC behaviors of HDPE/POE/CB with various CB content (POE content is 18%). (b) Plot of PTC intensity ofHDPE/POE/CB with various CB content (POE content is 18%). (c) The PTC behaviors of HDPE/POE/CB with various POE content(CB content is 18%). (d) Plot of PTC intensity of HDPE/POE/CB with various POE content (CB content is 18%).
Table 1: The comparison of percolation threshold and filler distribution of different polymer composites.
Components of polymer composites Percolation threshold (wt.%) Main location of carbon black References
HDPE/CB 22.5 — This article
HDPE/POE/CB 16.0 HDPE phase This article
HDPE/CB 20.0 — Reference [36]
UHMWPE/PP/CB 5.0 Interface and PP phase Reference [37]
HDPE/EVA/CB 15.0 — Reference [38]
“—” means the related information is not mentioned in the related reference.
6 Advances in Polymer Technology

It is reported that as the rigid filler content increases,the degree of entanglement between the polymer and fillerincreases, which means the behavior of entanglementbetween the polymer and filler increases, while the C fac-tor gradually decreases, which means a lower proficiencyof the distribution of fillers and a lower effectiveness ofthe composites. Therefore, as the CB content increasesfrom 15wt.% to 35wt.%, the restricting effect of CB parti-cles on the polymer chain mobility enhances. This canexplain the decrease in the tensile strength and elongationat break of HDPE/POE/CB composites, as seen inFigure 6(a) [16–18, 42–44].
3.4. Phase Morphologies. The dispersion of CB particlesacross the composites is closely related to the electricalconductivity. Studying the dispersion of CB particles andthe morphology of the composites is helpful for us toexplain the conductive behavior. For comparison, first wetake the SEM images of HDPE/POE/CB (the mass fractionof POE is 18wt.%) with different CB content of 10wt.%and 30wt.%. Due to the same loading of POE, the fibrousPOE phase with the same distribution density is evenlydispersed across the whole region. It can be seen in redcircles in Figures 2(a) and 2(b) that when the CB contentis 10wt.%, the fibrous POE phase excludes CB aggregatesinto HDPE phase, which constructs the segregated con-ductive network and increases the effective concentrationof conductive CB particles, while in Figures 2(c) and2(d) when the CB content is 30wt.%, CB particles evenlydistribute across the whole region of matrix and the segre-gated conductive network is replaced by well-distributedconductive network. In this situation, the POE phase actsas barriers or diluents and decreases the number of theconductive pathways [45]. These SEM images can explainthe electrical properties of HDPE/CB and HDPE/POE/CB:when the CB content is less than 25wt.%, the room tem-perature resistivity and the percolation threshold ofHDPE/POE/CB is lower than that of HDPE/CB due to
the segregated structure. However, when the CB contentis more than 25wt.%, the room temperature resistivity ofHDPE/POE/CB surpasses that of HDPE/CB for the barriereffect of the POE phase [45].
Moreover, we also compare the SEM images ofHDPE/POE/CB (the mass fraction of CB is 30wt.%) withdifferent POE content of 13wt.% and 23wt.%, respectively,in Figures 2(e)–2(h). Under high CB content of 30wt.%,CB particles migrate into POE phase, evenly distributedacross the whole region of matrix, which destroy the seg-regated structure. In this situation, the POE phase acts asbarriers and cuts off the conductive pathways to lowerthe room temperature resistivity [9]. The dispersed phaseis seen in red circles in Figure 2(f) when the POE contentis 13wt.%, and the dispersed phase transforms into thecontinuous phase when the POE content reaches 23wt.%.The continuous phase has a more significant barrier effectthan the dispersed phase. It can be concluded that as thePOE content increases from 0 to 28wt.%, the barrier effectof the POE phase is gradually enhanced so the room tem-perature resistivity gradually increases. This kind of trans-formation of the phase morphologies can also explain thegreat improvement in elongation at break of HDPE/-POE/CB as the POE content increases from 13wt.% to23wt.%.
3.5. Differential Scanning Calorimetry (DSC). Most of poly-mer PTC composites are semicrystalline. The heating ofpolymer PTC composites generally induces thermal expan-sion, especially around the melting temperature. The dif-ference in thermal expansion coefficients betweenpolymer matrix and carbon black will provide enoughdriving force and space condition for the migration ofthe CB particles and significantly affect the conductive net-work in the matrix. Consequently, the resistivity willsharply increase [25]. Accordingly, the study of the melt-ing behaviors is necessary for us to deeply look into thePTC behaviors of the composites. Through DSC, the melt-ing behavior of pure HDPE and its composites is presentin Figures 5(a) and 5(b) and Table 2. Table 2 lists themelting peak temperature and crystalline degree of everysample.
From Figure 5(a) and Table 2, it is known that themelting peak temperature of the composites is between131°C and 134°C after loading CB particles. Increasingthe CB content has little effect on the melting peak tem-perature. This can explain why the PTC switching temper-ature remains the same in Figure 3(a). But it decreases thedegree of crystallinity. The reason may be that rigid CBparticles can partly hinder the movement the HDPEmolecular chains, which has an adverse effect on the crys-tallization [46].
Figure 5(b) shows that as the POE content increasesfrom 0 to 23wt.%, the variation of the melting peak tem-perature is also small, but a wide and weak melting peakappears at about 110°C (as seen in the red circle inFigure 5(b)). We believe that it is related to the meltingbehaviors of the cocrystallization between HDPE andPOE. We have known that the melting temperature of
40 60 80 100 120
126.1°CH
eat fl
ow
Temperature (°C)
HDPE/CB masterbatchNeat POE
Exo up
61.6°C
Figure 4: Plot of DSC analysis of HDPE/CB masterbatch and neatPOE.
7Advances in Polymer Technology

POE is about 61.1°C and that of HDPE is about 126.1°C.The HDPE polymer chain and the POE polymer chainentangle each other to form the cocrystallization. Thecocrystallization between HDPE and POE lowers the tem-perature range of melting transition of the composites[26]. This can explain why the PTC switching temperaturemoves to lower temperature. Table 2 shows that the crys-talline degree decreases from 56.1% to 44.3% with increas-ing POE content. As reported by Liu et al. [2], PTCintensity is not always proportional to the crystallinedegree of PTC composites. In fact, it is also related tothermal expansion coefficients of the matrix [4, 25, 29].
Although the inclusion of POE to a certain extentdecreases the crystalline degree of PTC composites, itimparts the composites with higher thermal expansioncoefficients because of the inherent higher thermal expan-sion coefficients of POE than HDPE. Therefore, the con-ductive pathways experience more severe destructionduring heating process and the PTC intensity tends to behigher. This conclusion is consistent with the conclusionin section 3.2: the inclusion of POE can greatly increasethe resistivity change rate of low temperature range andthus increase the PTC intensity across the whole tempera-ture range.
40 60 80 100 120 140 160
Hea
t flow
Temperature(°C)
Neat HDPECB-10%
CB-20%CB-30%
Exo up
(a)
40 60 80 100 120 140 160
Hea
t flow
Exo up
Temperature(°C)
CB-30%CB-30%/POE-13%CB-30%/POE-23%
(b)
Figure 5: Plot of DSC analysis of HDPE/POE/CB composites with (a) different CB content and (b) different POE content.
Table 2: Thermal behavior of HDPE/POE/CB composites with various CB content and POE content.
Sample Melting peak temperature (°C) Melting enthalpy (J/g) Crystalline degree (%)
Neat HDPE 133.9 211.3 73.4
POE-0%-CB-10% 132.5 167.4 64.6
POE-0%-CB-20% 131.0 144.5 62.7
POE-0%-CB-30% 129.7 113.1 56.1
POE-13%-CB-30% 130.0 78.48 48.7
POE-23%-CB-30% 128.5 58.65 44.3
Table 3: The room temperature resistivity and resistivity change rate in different temperature ranges.
SampleLog (room temperature
resistivity) (Ω·cm)Log (resistivity change rate
from 20°C to 110°C)Log (resistivity change rate
from 110°C to 120°C)PTC intensity
POE-0%-CB-30% 1.28 1.49 4.62 6.10
POE-13%-CB-30% 1.59 3.96 3.18 7.13
POE-18%-CB-30% 1.70 4.40 3.18 7.57
POE-23%-CB-30% 1.86 5.12 3.18 8.29
POE-28%-CB-30% 2.00 5.34 3.18 8.51
8 Advances in Polymer Technology

4. Conclusions
To gain balanced electrical and mechanical properties incarbon black-filled polyolefin composites, we introducedPOE into the HDPE/CB composites and investigated theeffect of the POE and CB content on the percolationthreshold, room temperature resistivity, PTC behavior,and tensile properties. Combined with SEM images andDSC, we researched the phase morphology, filler disper-sion, and crystallization behavior of the flexible PTC com-posites in detail. We tried to explain the electric andmechanical properties with micro morphology and crystal-lization behavior. It is found that the incorporation ofPOE decreases the percolation threshold of conductiveCB particles. Increasing POE content can not only bringabout the higher room temperature resistivity for its bar-rier effect but also cause the lower PTC switching temper-ature and the higher resistivity change rate within lowtemperature range. The higher resistivity change rate oflow temperature range brings about the higher PTC inten-sity. It is believed that higher resistivity change rate of lowtemperature range can inhibit the overheating at the earlystage, which is favorable for the safety of the PTC mate-rials. When the POE content increases from 13wt.% to18wt.%, the elongation at break of HDPE/POE/CB (themass fraction of CB is 30wt.%) improves from 158% to980%, showing excellent flexibility. This novel PTC mate-rial can be expected to be utilized in cases that requireenough flexibility. This work also provides a possibledirection for the development new types of high-performance flexible PTC composites.
Data Availability
The experimental data used to support the findings of thisstudy are available on request from the first author, whocan be contacted at [email protected].
Conflicts of Interest
The authors declare that they have no conflicts of interest.
Acknowledgments
The authors would like to thank Guangzhou TachibanaElectronic Co., Ltd. for funding and supporting thisresearch.
References
[1] M. B. Heaney, “Resistance-expansion-temperature behavior ofa disordered conductor–insulator composite,” Applied PhysicsLetters, vol. 69, no. 17, pp. 2602–2604, 1996.
[2] Y. Liu, H. Zhang, H. Porwal, J. J. C. Busfield, T. Peijs, andE. Bilotti, “Pyroresistivity in conductive polymer composites:a perspective on recent advances and new applications,” Poly-mer International, vol. 68, no. 3, pp. 299–305, 2019.
[3] P. Kar and B. B. Khatua, “PTCR characteristics of polycarbo-nate/nickel-coated graphite-based conducting polymeric com-posites in presence of poly(caprolactone),” PolymerComposites, vol. 32, no. 5, pp. 747–755, 2011.
[4] P. Kar and B. B. Khatua, “Highly reversible and repeatablePTCR characteristics of PMMA/Ag-coated glass bead com-posites based on CTE mismatch phenomena,” Polymer Engi-neering and Science, vol. 51, no. 9, pp. 1780–1790, 2011.
[5] A. Kono, K. Shimizu, H. Nakano et al., “Positive-temperature-coefficient effect of electrical resistivity below melting point ofpoly(vinylidene fluoride) (PVDF) in Ni particle-dispersedPVDF composites,” Polymer, vol. 53, no. 8, pp. 1760–1764,2012.
[6] J.-H. Lee, S. K. Kim, and N. H. Kim, “Effects of the addition ofmulti-walled carbon nanotubes on the positive temperaturecoefficient characteristics of carbon-black-filled high-densitypolyethylene nanocomposites,” Scripta Materialia, vol. 55,no. 12, pp. 1119–1122, 2006.
[7] Y. Li, H. Zhang, Y. Liu et al., “Synergistic effects of spray-coated hybrid carbon nanoparticles for enhanced electricaland thermal surface conductivity of CFRP laminates,”
15 20 25 30 35
10
12
14
16
18
20
Content of CB (%)
Tens
ile st
reng
th (M
Pa)
1000
1100
1200
1300
1400
1500
Elon
gatio
n at
bre
ak (%
)
Tensile strengthElongation at break
(a)
0 5 10 15 20 25 30
10
12
14
16
18
20
Content of POE (%)
Tens
ile st
reng
th (M
Pa)
0
500
1000
1500
Elon
gatio
n at
bre
ak (%
)
(b)
Figure 6: The POE content was fixed at 18wt.%, (a) shows the tensile properties of HDPE/POE/CB with various CB content; the CB contentwas fixed at 30wt.%, (b) shows the tensile properties of HDPE/POE/CB (30wt.%) with various POE content.
9Advances in Polymer Technology

Composites Part a-Applied Science and Manufacturing,vol. 105, pp. 9–18, 2018.
[8] Y. Liu, H. Zhang, H. Porwal et al., “Universal control on pyror-esistive behavior of flexible self-regulating heating devices,”Advanced Functional Materials, vol. 27, no. 39, 2017.
[9] Y. Liu, H. Zhang, H. Porwal et al., “Tailored pyroresistive per-formance and flexibility by introducing a secondary thermo-plastic elastomeric phase into graphene nanoplatelet (GNP)filled polymer composites for self-regulating heating devices,”Journal of Materials Chemistry C, vol. 6, no. 11, pp. 2760–2768, 2018.
[10] L. Lu, X. Han, J. Li, J. Hua, and M. Ouyang, “A review on thekey issues for lithium-ion battery management in electric vehi-cles,” Journal of Power Sources, vol. 226, pp. 272–288, 2013.
[11] M. Kise, S. Yoshioka, K. Hamano et al., “Development of newsafe electrode for lithium rechargeable battery,” Journal ofPower Sources, vol. 146, no. 1-2, pp. 775–778, 2005.
[12] D. Deng, “Li-ion batteries: basics, progress, and challenges,”Energy Science & Engineering, vol. 3, no. 5, pp. 385–418, 2015.
[13] J. Kim, J. Oh, and H. Lee, “Review on battery thermal manage-ment system for electric vehicles,” Applied Thermal Engineer-ing, vol. 149, pp. 192–212, 2019.
[14] S. M. Sun, X. Y. Zhang, and M. Q. Yang, “Lithium ion batteryefficient thermal management numerical simulation research,”Applied Mechanics and Materials, vol. 672-674, pp. 646–651,2014.
[15] Y. Qin, X. Haiping, Q. Houtian et al., “Preparation and PTCproperties of HIPS/HDPE/CB composites,” Chemical JournalOf Chinese Universities-Chinese, vol. 39, no. 6, pp. 1305–1310, 2018.
[16] A. K. Pandey, T. Pal, R. Sharma, and K. K. Kar, “Study ofmatrix-filler interaction through correlations between struc-tural and viscoelastic properties of carbonous-filler/polymer-matrix composites,” Journal of Applied Polymer Science,vol. 137, no. 27, article 48660, 2020.
[17] A. K. Pandey, R. Kumar, V. S. Kachhavah, and K. K. Kar,“Mechanical and thermal behaviours of graphite flake-reinforced acrylonitrile-butadiene-styrene composites andtheir correlation with entanglement density, adhesion, rein-forcement and C factor,” RSC Advances, vol. 6, no. 56,pp. 50559–50571, 2016.
[18] R. Kumar, K. K. Kar, and K. Dasgupta, “Enhanced electrical,mechanical, and viscoelastic properties of carbon-carbon com-posites using carbon nanotubes coated carbon textile as rein-forcement,” Journal of Composite Materials, vol. 55, no. 13,pp. 1733–1748, 2021.
[19] A. K. Pandey, K. Singh, and K. K. Kar, “Thermo-mechanicalproperties of graphite-reinforced high-density polyethylenecomposites and its structure-property corelationship,” Jour-nal of Composite Materials, vol. 51, no. 12, pp. 1769–1782,2017.
[20] R. Kumar, K. K. Kar, and K. Dasgupta, “Superior electrical,mechanical and viscoelastic properties ofCNTscoated carbontextile reinforced phenolic composite forhigh-performancestructural applications,” Journal of Applied Poly-mer Science, vol. 138, no. 10, p. 49968, 2021.
[21] J.-W. Zha, W. K. Li, R. J. Liao, J. Bai, and Z. M. Dang, “Highperformance hybrid carbon fillers/binary–polymer nanocom-posites with remarkably enhanced positive temperature coeffi-cient effect of resistance,” Journal of Materials Chemistry A,vol. 1, no. 3, pp. 843–851, 2013.
[22] T. Li, L. F. Ma, R. Y. Bao et al., “A new approach to constructsegregated structures in thermoplastic polyolefin elastomerstowards improved conductive and mechanical properties,”Journal of Materials Chemistry A, vol. 3, no. 10, pp. 5482–5490, 2015.
[23] R. J. Wang and W. L. Cheng, “A novel flexible room tempera-ture positive temperature coefficient material for thermal man-agement,” Advanced Composites and Hybrid Materials, vol. 2,no. 1, pp. 83–92, 2019.
[24] Y. P. Mamunya, Y. V. Muzychenko, E. V. Lebedev et al., “PTCeffect and structure of polymer composites based on polyethy-lene/polyoxymethylene blend filled with dispersed iron,” Poly-mer Engineering and Science, vol. 47, no. 1, pp. 34–42, 2007.
[25] Y. L. Luo, G. Wang, B. Zhang, and Z. Zhang, “The influence ofcrystalline and aggregate structure on PTC characteristic ofconductive polyethylene/carbon black composite,” EuropeanPolymer Journal, vol. 34, no. 8, pp. 1221–1227, 1998.
[26] P. Zhang and B.-B. Wang, “Positive temperature coefficienteffect and mechanism of compatible LLDPE/HDPE compos-ites doping conductive graphite powders,” Journal of AppliedPolymer Science, vol. 135, no. 27, 2018.
[27] J. Y. Feng and C. M. Chan, “Carbon black-filled immiscibleblends of poly(vinylidene fluoride) and high density polyethyl-ene: the relationship between morphology and positive andnegative temperature coefficient effects,” Polymer Engineeringand Science, vol. 39, no. 7, pp. 1207–1215, 1999.
[28] A. Rybak, G. Boiteux, F. Melis, and G. Seytre, “Conductivepolymer composites based on metallic nanofiller as smartmaterials for current limiting devices,” Composites Scienceand Technology, vol. 70, no. 2, pp. 410–416, 2010.
[29] J. F. Zhang, Q. Zheng, Y. Q. Yang, and X. S. Yi, “High-densitypolyethylene/carbon black conductive composites. II. Effect ofelectron beam irradiation on relationship between resistivity-temperature behavior and volume expansion,” Journal ofApplied Polymer Science, vol. 83, no. 14, pp. 3117–3122, 2002.
[30] H. Deng, L. Lin, M. Ji, S. Zhang, M. Yang, and Q. Fu, “Progresson the morphological control of conductive network in con-ductive polymer composites and the use as electroactive multi-functional materials,” Progress in Polymer Science, vol. 39,no. 4, pp. 627–655, 2014.
[31] L. Xie and Y. Zhu, “Tune the phase morphology to design con-ductive polymer composites: a review,” Polymer Composites,vol. 39, no. 9, pp. 2985–2996, 2018.
[32] C. S. Ha, S. J. Huang, and J. K. Lee, “Polymeric positive-temperature-coefficient materials: dynamic curing effect,” Col-loid and Polymer Science, vol. 282, no. 6, pp. 575–582, 2004.
[33] N. Ning, S. Li, H. Wu et al., “Preparation, microstructure, andmicrostructure-properties relationship of thermoplastic vulca-nizates (TPVs): A review,” Progress in Polymer Science, vol. 79,pp. 61–97, 2018.
[34] H. C. Tian, M. Tian, H. Zou, Z. Dang, and L. Zhang, “Specialelectrical conductivity of carbon black-filled two-phased ther-moplastic vulcanizates,” Journal of Applied Polymer Science,vol. 117, no. 2, pp. 691–699, 2010.
[35] A. de Alencar Padua Gabino, B. G. Soares, and A. A. Silva,“Attaining low percolation threshold in conductive polypropy-lene/nitrile rubber thermoplastic vulcanizates using carbonnanotube,” Journal of Applied Polymer Science, vol. 138,no. 7, article 49857, 2021.
[36] T. Jeevananda, Siddaramaiah, and J. Hee Lee, “Fabrication ofcarbon black/HDPE/polyaniline functionalized multi-walled
10 Advances in Polymer Technology

carbon nanotube composites for enhancing PTC characteris-tics,” Materials Today-Proceedings, vol. 5, no. 10, pp. 20890–20898, 2018.
[37] Q. Li, S. Basavarajaiah, N. H. Kim, S. B. Heo, and J. H. Lee,“Synergy effect of hybrid fillers on the positive temperaturecoefficient behavior of polypropylene/ultra-high molecularweight polyethylene composites,” Journal of Applied PolymerScience, vol. 116, no. 1, pp. 116–124, 2010.
[38] J. F. Zhang, Q. Zheng, Y. Q. Yang, and X. S. Yi, “High-densitypolyethylene/carbon black conductive composites. I. Effect ofCB surface modification on its resistivity-temperature behav-ior,” Journal of Applied Polymer Science, vol. 83, no. 14,pp. 3112–3116, 2002.
[39] L. Chen and J. M. Zhang, “Designs of conductive polymercomposites with exceptional reproducibility of positive tem-perature coefficient effect: a review,” Journal of Applied Poly-mer Science, vol. 138, no. 3, article 49677, 2021.
[40] G. Y. Liu and G. X. Qiu, “Study on the mechanical and mor-phological properties of toughened polypropylene blends forautomobile bumpers,” Polymer Bulletin, vol. 70, no. 3,pp. 849–857, 2013.
[41] S. Paul and D. D. Kale, “Impact modification of polypropylenecopolymer with a polyolefinic elastomer,” Journal of AppliedPolymer Science, vol. 76, no. 9, pp. 1480–1484, 2000.
[42] P. Paik and K. K. Kar, “Thermal degradation kinetics and esti-mation of lifetime of polyethylene particles: Effects of particlesize,” Materials Chemistry and Physics, vol. 113, no. 2-3,pp. 953–961, 2009.
[43] C. J. Hsu, L. W. Chang, S. Y. Miao, and J. T. Lue, “High molec-ular weight polyethylene nanospheres: synthesis, physical andmechanical Properties—Second harmonic generation,” Jour-nal of Nanoscience and Nanotechnology, vol. 8, no. 6,pp. 2979–2982, 2008.
[44] A. Tharayil, S. Banerjee, and K. K. Kar, “Dynamic mechanicalproperties of zinc oxide reinforced linear low density polyeth-ylene composites,” Materials Research Express, vol. 6, no. 5,2019.
[45] T.-N. Yue, Y. N. Gao, Y. Wang et al., “Processingtemperature‐dependentdistribution ofmultiwallcarbon nanotube in poly(-ethylene-co-1-octene)/high density polyethylene for electricalconductivity and microwave shielding enhancement,” PolymerComposites, vol. 42, no. 3, pp. 1396–1406, 2021.
[46] J.-Z. Liang and Q.-Q. Yang, “Effects of carbon black contentand size on conductive properties of filled high-density poly-ethylene composites,” Advances in Polymer Technology,vol. 37, no. 6, pp. 2238–2245, 2018.
11Advances in Polymer Technology