effects of spectral modification on perceived brightness
TRANSCRIPT

The Pennsylvania State University
The Graduate School
Department of Architectural Engineering
EFFECTS OF SPECTRAL MODIFICATION ON PERCEIVED BRIGHTNESS AND
COLOR DISCRIMINATION
A Thesis in
Architectural Engineering
by
Minchen Wei
2011 Minchen Wei
Submitted in Partial Fulfillment of the Requirements
for the Degree of
Master of Science
August 2011

ii
The thesis of Minchen Wei was reviewed and approved* by the following:
Kevin W. Houser
Associate Professor of Architectural Engineering
Thesis Advisor
Richard G. Mistrick
Associate Professor of Architectural Engineering
Jelena Srebric
Associate Professor of Architectural Engineering
Linda M. Hanagan
Associate Professor and Chair of Graduate Program of Architectural Engineering
*Signatures are on file in the Graduate School

iii
Abstract
This study characterized the effect of spectral modification on perceived brightness and color
discrimination under illumination provided by a pair of 32W, 4-foot, linear fluorescent lamps:
SPX 3000K (SPK3K) and the Reveal® linear fluorescent (RevLF). Sixty subjects participated,
with half 25 years or younger (mean = 22.5, std. dev. = 1.7) and half 60 years or older (mean =
81.4, std. dev. = 7.1).
The side-by-side evaluation mode was employed to characterize perceived brightness. Subjects
made a forced choice for each of 44 pairs of light settings that: were practice trials (4 pairs);
differed in spectrum at equal illuminance (8 pairs); varied in both spectrum and illuminance (24
pairs); or were identical (i.e. null condition trials, 8 pairs). Light settings were set within a range
of 240 to 330 lux and the rooms had neutral gray surfaces. Equal perceived brightness was
inferred from the paired comparisons, and found to occur when the photopic quantity (e.g.
illuminance, luminance) from the RevLF was 5% lower (younger subjects) or 8% lower (older
subjects) than that provided by the SPX3K lamps.
At equal illuminance of 330 lux, the room illuminated by the RevLF was preferred to the one
illuminated by the SPX3K by 67% of the younger subjects and 73% of the older subjects. Color
and brightness were most commonly cited as reasons for preference.
Color discrimination was characterized under 300 lux of RevLF and SPX3K illumination using
the Farnsworth-Munsell 100 Hue Test (FM-100). For color-normal people below 25 years of age,
and for those above 60 years of age who had cataract surgery, the red-green partial error score
was statistically better under RevLF illumination. A significant difference was not found in the
blue-yellow partial error score or in the total error score.

iv
When brightness perception is considered in isolation, the spectral advantages of the RevLF
cannot be offset by the disadvantage of lower luminous efficacy. That is, these data suggest that
at equal brightness a room illuminated with RevLF will consume more energy than an otherwise
identical room illuminated with SPX3K. When brightness and color discrimination are considered
together, as with visual clarity, it is unknown whether RevLF or SPX3K illumination would be
more energy efficient. Color discrimination, brightness perception, and overall preference all play
a role in occupants‘ gestalt evaluation, contribute to high performance building interiors, and play
a role in sustainable lighting solutions designed to address occupant needs.
v
TABLE OF CONTENTS
LIST OF FIGURES ..................................................................................................................... vii
LIST OF TABLES ........................................................................................................................ xi
Acknowledgements ..................................................................................................................... xiii
Chapter 1 Introduction.................................................................................................................. 1
1.1 Background ................................................................................................................................ 1
1.1.1 The Human Eye ...................................................................................................................... 1
1.1.2 Color ....................................................................................................................................... 6
1.1.3 Theories of Color Vision ...................................................................................................... 12
1.1.4 Changes with Age ................................................................................................................. 15
1.2 Objective .................................................................................................................................. 18
1.3 General Approach .................................................................................................................... 19
Chapter 2 Literature Review ...................................................................................................... 20
2.1 Lamp SPD Vs. Spatial Brightness ........................................................................................... 20
2.2 Experimental Methods for Brightness Perception ................................................................... 28
2.3 Color Discrimination ............................................................................................................... 30
2.4 Spectral Modification ............................................................................................................... 33
Chapter 3 Design of the Study and Methodology ..................................................................... 36
3.1 Apparatus ................................................................................................................................. 36
3.2 Subjects .................................................................................................................................... 39
3.3 Independent Variables ............................................................................................................. 40
3.3.1 Independent Variables for Perceived Brightness .................................................................. 40
3.3.2 Independent Variables for Color Discrimination .................................................................. 47
3.4 Dependent Variables ................................................................................................................ 47

vi
3.4.1 Dependent Variables for Perceived Brightness..................................................................... 47
3.4.2 Dependent Variables for Color Discrimination .................................................................... 47
3.5 Statistical Design ..................................................................................................................... 48
3.5.1 Statistical Design for Perceived Brightness .......................................................................... 48
3.5.2 Statistical Design for Color Discrimination .......................................................................... 51
3.6 Experimental Procedures ......................................................................................................... 51
Chapter 4 Analysis and Results .................................................................................................. 54
4.1 Data Reliability: Null Condition Trials and Tests for Bias ...................................................... 54
4.2 Perceived Brightness ................................................................................................................ 58
4.3 Color Discrimination ............................................................................................................... 71
Chapter 5 Discussion ................................................................................................................... 77
5.1 Perceived Brightness ................................................................................................................ 77
5.2 Color Discrimination ............................................................................................................... 85
Chapter 6 Conclusions ................................................................................................................. 91
Reference ...................................................................................................................................... 92

vii
LIST OF FIGURES
Figure 1-1 | A drawing of a section through the human eye [1] .............................................. 1
Figure 1-2 | A simple diagram of the organization of the retina [1] ........................................ 3
Figure 1-3 | Distribution of rods and cones in the retina [4] .................................................... 3
Figure 1-4 | Luminous efficiency functions recognized by CIE [8] ........................................ 5
Figure 1-5 | Normalized cone fundamentals and photopigment sensitivities [8] ..................... 6
Figure 1-6 | RGB color matching functions [8] ....................................................................... 8
Figure 1-7 | XYZ color matching functions [8] ....................................................................... 8
Figure 1-8 | The CIE 1976 USC with isotemperature lines ..................................................... 9
Figure 1-9 | Organization of Munsell Color System ................................................................ 11
Figure 1-10 | A possible diagram of the opponent system ....................................................... 14
Figure 1-11 | Opponent signals from the possible model of the opponent system (the
functions are linear transformation of CMFs) [8] .................................................................... 14
Figure 1-12 | The Change of pupil diameter with age [1] ........................................................ 16
Figure 1-13 | The change of absorbance of lens with age [1] .................................................. 17
Figure 1-14 | The transmission of the human donor lenses with age [18] ............................... 17
Figure 1-15 | Spectral power distribution of the SPX3K and the RevLF, adjusted so that
peak relative output is at 100% ................................................................................................ 18
Figure 2-1 | Chromaticity diagram of the locations of ten lamps and the average B/L
ratios [23] ................................................................................................................................. 21
Figure 2-2 | B/L ratio contours on the 1931CIE chromaticity diagram [25] ............................ 23

viii
Figure 2-3 | Section of the CIE 1931 chromaticity diagram including 16 lamps whose
chromaticity coordinates were close to the blackbody locus and B/L ratio versus CCT
[23] ........................................................................................................................................... 23
Figure 2-4 | Relationship between brightness and CCT. (a) Percentage of subjects
selecting 3500K lamps over 6500K lamps in side-by-side comparisons; (b) Mean
adjusted illuminance and standard deviations for two pairs of comparisons in the
brightness matching trials [28] ................................................................................................. 24
Figure 2-5 | Ratio of power of lights to total power (Left: ratio of the power of light at
variable wavelength to total power. Right: ratio of the power of two primary lights to
total power) Red lines indicate the wavelengths require less power, and blue lines
indicate the wavelengths require more power [33] .................................................................. 26
Figure 2-6 | Total Error Score (TES) of FM-100 versus the illuminance level for different
age groups [67] ........................................................................................................................ 32
Figure 2-7 | Color discrimination performance of FM-100 for each age group and
illuminance level [69] .............................................................................................................. 33
Figure 2-8 | Transmittance of the lens used for spectral modification [71] ............................. 34
Figure 3-1 | Photograph of the installation of the lamps, luminaires and baffles .................... 37
Figure 3-2 | A view from behind the subject‘s seated position in the session on perceived
brightness ................................................................................................................................. 38
Figure 3-3 | A view from behind the subject‘s seated position in the session on color
discrimination .......................................................................................................................... 39
Figure 3-4 | The SPDs of the two stimuli – the SPX3K and the RevLF - each an average
of measurements ...................................................................................................................... 41
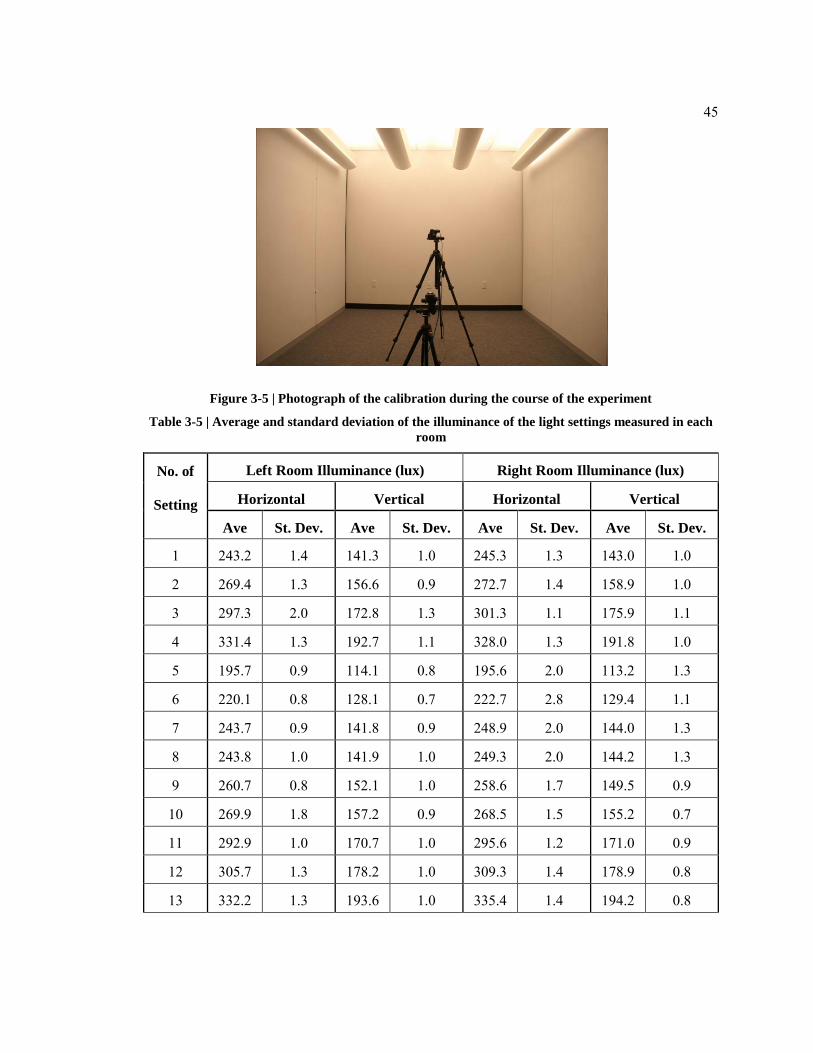
Figure 3-5 | Photograph of the calibration during the course of the experiment...................... 45

ix
Figure 3-6 | Chromaticity coordinates plotted in the 1931 CIE chromaticity diagram for
all measurements. The coordinates for each measurement can be enclosed by a four-step
MacAdam Ellipse. The measurements were taken at different times during the course of
the experiment for one of the light settings in one room each time ......................................... 46
Figure 3-7 | Example of light settings provided for counter-balance ....................................... 50
Figure 4-1 | Example of Chi-Squared test of independence between SPD and location
(results for all the pairs are summarized in Table 4-2) ............................................................ 56
Figure 4-2 | Plot of percentage of votes versus illuminance ratios at different illuminance
levels of SPX3K for younger group (a. 240 lux; b. 270 lux; c. 300 lux; d. 330 lux) ............... 60
Figure 4-3 | Plot of percentage of votes versus illuminance ratios at different illuminance
levels of SPX3K for older group (a. 240 lux; b. 270 lux; c. 300 lux; d. 330 lux) ................... 61
Figure 4-4 | Plot of percentage of votes versus illuminance ratios (a. younger age group;
b. older age group) ................................................................................................................... 63
Figure 4-5 | Plot of percentage of votes versus illuminance ratios at different illuminance
levels of SPX3K for the older subjects without cataract surgery (a. 240 lux; b. 270 lux; c.
300 lux; d. 330 lux) .................................................................................................................. 66
Figure 4-6 | Plot of percentage of votes versus illuminance ratios at different illuminance
levels of SPX3K for the older subjects with cataract surgery (a. 240 lux; b. 270 lux; c.
300 lux; d. 330 lux) .................................................................................................................. 67
Figure 4-7 | Plot of percentage of votes versus illuminance ratios (a. older subjects
without cataract surgery; b. older subjects with cataract surgery) ........................................... 70
Figure 4-8 | The mean Total Error Score (TES), Red-Green Partial Error Score (R-G
PES), and Blue-Yellow Partial Error Score (B-Y PES) of the subjects with normal color

x
vision in each age group for the FM-100 under each light setting, shown with individual
95% confidence interval bars ................................................................................................... 72
Figure 4-9 | The mean Total Error Score (TES), Red-Green Partial Error Score (R-G
PES), and Blue-Yellow Partial Error Score (B-Y PES) of the subjects in older group for
the FM-100 under each light setting, shown with individual 95% confidence interval bars. .. 76
Figure 5-1 | Neural Opponent Signals & SPDs of two lamps .................................................. 77
Figure 5-2 | Opponent signals adapted to the SPX3K and the RevLF ( a. Red-green
opponent signal; b. Blue-yellow opponent signal ) .................................................................. 78
Figure 5-3 | FM Gamut Area shown in the CIE 1960 UCS for the RevLF, the SPX3K,
and CIE Illuminant C ( Illuminant C is the reference source under which the samples
have approximately equal spacing) .......................................................................................... 87
Figure 5-4 | Plots of the chromaticity coordinates of FM sample 14 to sample 33 lit by the
RevLF and the SPX3K in the CIE 1960 UCS ......................................................................... 88

xi
LIST OF TABLES
Table 1-1 | Luminous efficiency functions for different usages .............................................. 5
Table 1-2 | Properties of the SPX3K and the RevLF in GE Catalog [19] ................................ 19
Table 2-1 | Studies giving reliable results of SPD effect on brightness [49] ........................... 29
Table 3-1 | Demographic summary of the subjects. (Of the 3 subjects in the older group
with abnormal color vision, all of them had had cataract surgery) .......................................... 40
Table 3-2 | Characterization of the average SPDs for the SPX3K and the RevLF .................. 42
Table 3-3 | Horizontal illuminance programmed for the SPX3K and the RevLF .................... 43
Table 3-4 | Summary information of light settings and nominal calibration characteristics.
Both rooms required and identical set of light setting, for a total of 28 light settings, each
corresponding to a scene programmed into one of the two Lutron Grafik Eye® controllers ... 43
Table 3-5 | Average and standard deviation of the illuminance of the light settings
measured in each room ............................................................................................................ 45
Table 4-1 | Summary data for null condition trials showing percentages of left/right
selected. None of the trials in either age group had a p-value smaller than 0.05; p-values
are only shown for the overall (i.e. age group pooled) category.............................................. 55
Table 4-2 | Summary of results for Chi-Squared test of independence. The SPD and
location are statistically independent (p-value>0.05) .............................................................. 57
Table 4-3 | Percentage of votes in younger group at different illuminance levels of
SPX3K ..................................................................................................................................... 59
Table 4-4 | Percentage of votes in older group at different illuminance levels of SPX3K (
The shaded cells in emboldened values represent results that are not statistically different
from chance according to the Chi-Square Goodness-of-Fit test with p-values > 0.05) ........... 59

xii
Table 4-5 | Summary of the regression lines and hypothesis testing for the plots of
younger and older groups ......................................................................................................... 62
Table 4-6 | Percentage of votes of 10 older subjects without cataract surgery at different
illuminance levels of SPX3K ................................................................................................... 64
Table 4-7 | Percentage of votes of 20 older subjects with cataract surgery, including three
with abnormal color vision, at different illuminance levels of SPX3K ................................... 65
Table 4-8 | Summary of the regression lines and hypothesis testing for the plots of
subjects with and without cataract surgery .............................................................................. 68
Table 4-9 | Summary of the results of FM-100 of the subjects with normal color vision in
each age group under each light setting ................................................................................... 71
Table 4-10 | Analysis of variance for R-G PES ....................................................................... 73
Table 4-11 | Analysis of Variance for B-Y PES ...................................................................... 73
Table 4-12 | Analysis of Variance for TES .............................................................................. 73
Table 4-13 | Summary of the results of Student‘s Paired Sample t-tests ................................. 74
Table 4-14 | Summary of the results of FM-100 of the color-deficient subjects in each age
group under each light setting .................................................................................................. 75
Table 5-1 | Lighting metrics and colorimetric properties of two SPDs. The calculations
were based on the average SPDs. ............................................................................................ 79
Table 5-2 | Standard deviations of the caps of three SPDs ...................................................... 88

xiii
Acknowledgements
I want to express my sincere thanks to the following people, without whom my research
would not have been finished:
Dr. Kevin Houser Dr. Richard Mistrick
Dr. Jelena Srebric Dr. Michael Royer
Andrea Wilkerson Craig Casey
Tony Esposito Yi Wei
Fengzhi Zhang
Dr. Kevin Houser, my advisor, who gave me the opportunity to participate in this project,
taught me how to do research, supported me to finish the project, and also serves as a
model for my professional career.
Dr. Richard Mistrick, who taught me a lot of knowledge in the lighting field outside my
research area and gave me good guidance on my project.
Dr. Jelena Srebric, who is my committee member and gave me good suggestions about
my research.
Dr. Michael Royer, Andrea Wilkerson, and Craig Casey, my good colleagues at Penn
State, who helped me a lot and gave me very good advice about my research and study
over the last two years. Tony Esposito, project assistant, who assisted me with apparatus
modification and data collection.
My father and mother, for supporting me unconditionally in China.
*This research was funded by GE Lighting.
1
Chapter 1 Introduction
1.1 Background
1.1.1 The Human Eye
The electromagnetic spectrum is the range of all possible frequencies of electromagnetic
radiation, covering from short wavelength to long wavelength. However, not all the wavelengths
are visible to the human visual system. Visible light is only a small part of the electromagnetic
spectrum, from 380nm to 780nm.
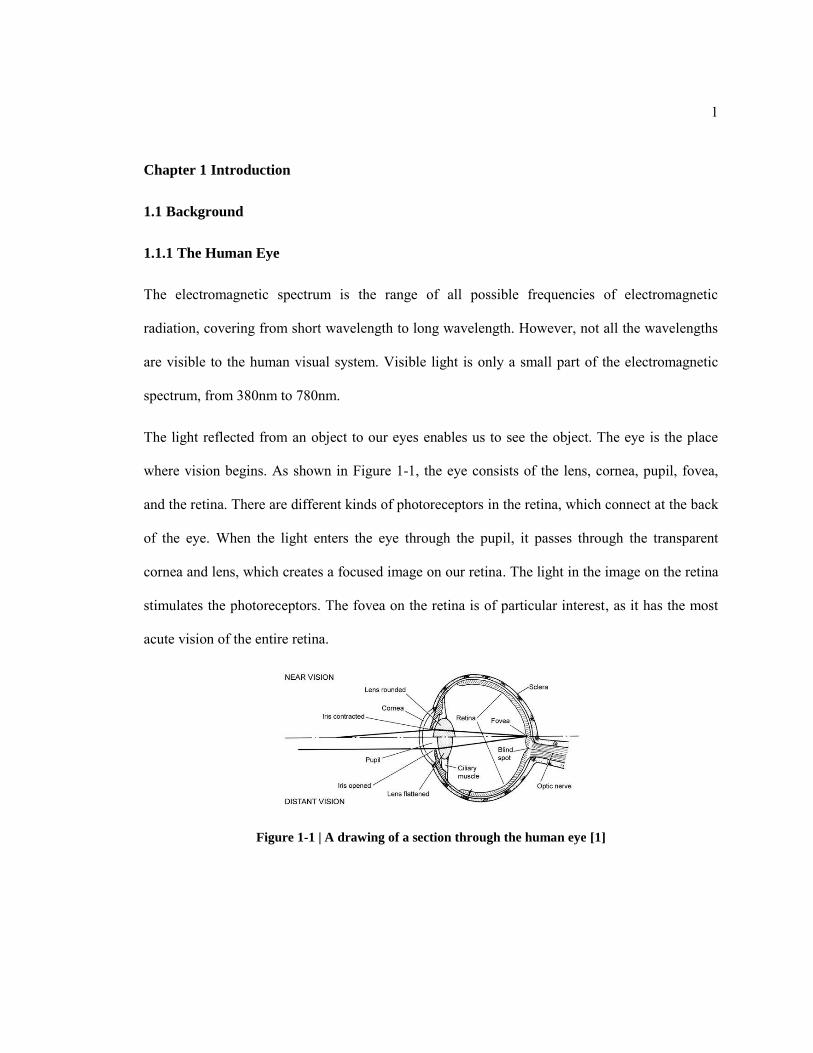
The light reflected from an object to our eyes enables us to see the object. The eye is the place
where vision begins. As shown in Figure 1-1, the eye consists of the lens, cornea, pupil, fovea,
and the retina. There are different kinds of photoreceptors in the retina, which connect at the back
of the eye. When the light enters the eye through the pupil, it passes through the transparent
cornea and lens, which creates a focused image on our retina. The light in the image on the retina
stimulates the photoreceptors. The fovea on the retina is of particular interest, as it has the most
acute vision of the entire retina.
Figure 1-1 | A drawing of a section through the human eye [1]
2
There is a kind of electrically excitable cell that can process and transmit information by
electrical and chemical signaling in our body, called a neuron. A photoreceptor is a specialized
type of neuron found in the retina, converting visible light into signals that can stimulate
biological processes. Rods and cones are the two classic photoreceptors in the retina, which are
part of the visual system. A third kind of photoreceptor was found in 2002 [2], intrinsically
photosensitive retina ganglion cell (ipRGC), which establishes a relationship between
neurophysiology and circadian photobiology.
Rods and cones are found in the photoreceptor layer of the retina and the names of them are
derived from their shapes [3]. Both of these photoreceptors contain light-sensitive chemicals
called photopigments, which react to light and trigger electrical signals. These signals flow
through a network of neurons and eventually reach the back of the eye in the optic nerve, which
conducts signals toward the brain. Figure 1-2 shows the organization of the retina. The fovea is
the most acute area in the retina, which only contains cones. The peripheral retina, which is the
entire area of the retina outside the fovea, contains both cones and rods. However, the blind spot
is the place in the retina that does not contain any photoreceptor. The distribution of the rods and
cones in the retina is shown in Figure 1-3.

3
Figure 1-2 | A simple diagram of the organization of the retina [1]
Figure 1-3 | Distribution of rods and cones in the retina [4]

4
The most important distinction between rods and cones is the visual function. Rods serve vision
at lower luminance levels (below 0.01 cd/m2), while cones serve vision at higher luminance levels
(above 3.0 cd/m2). At the luminance level between 0.01 cd/m2 and 3.0 cd/m2, both rods and cones
function simultaneously. The vision when only cones are active is called photopic vision, while
only rods are active is called scotopic vison. And mesopic vision is the vision in which both cones
and rods are active [4]. Cones are able to provide chromatic vision, which helps us to discriminate
different colors, while rods only provide achromatic vision.
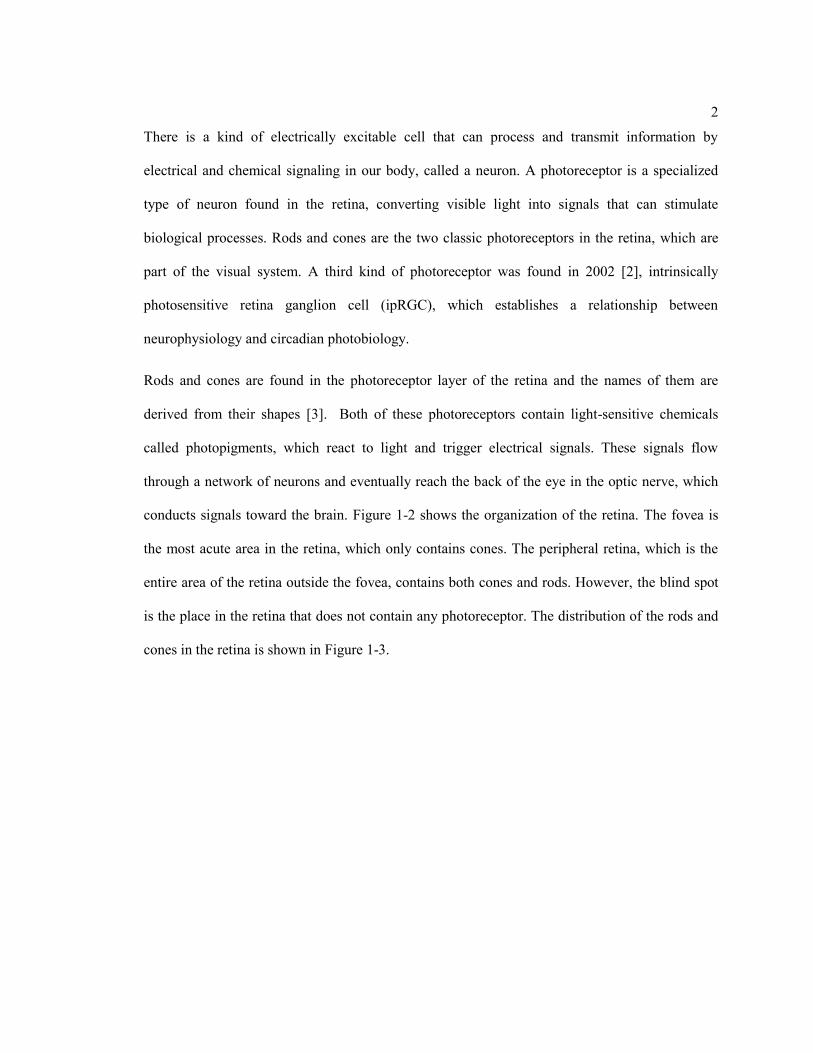
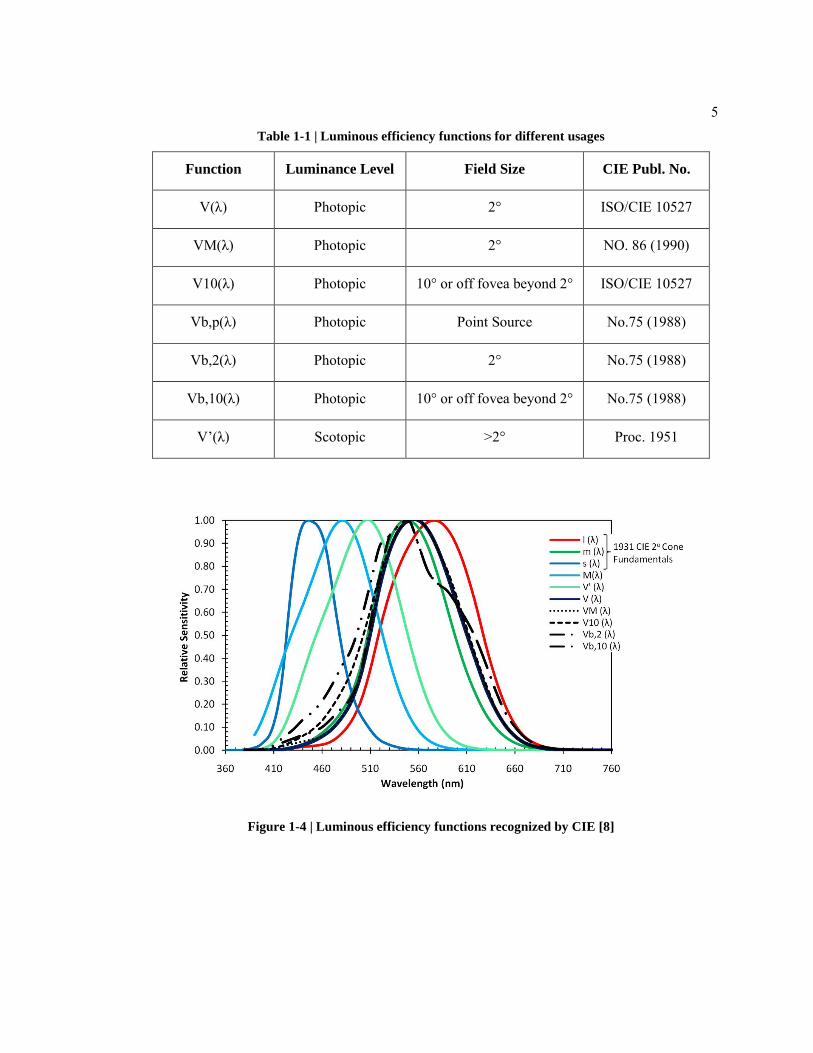
Besides visual function, rods and cones have different spectral sensitivity to light with different
wavelengths. A lot of studies and experiments have been done to investigate the luminous
efficiency function. 𝑉(𝜆), the luminous efficiency function for photopic vision, describes the
efficiency of radiant flux at stimulating the cones in the eye, which has a peak wavelength at
555nm. 𝑉′(𝜆), the luminous efficiency function for scotopic vision, describes the efficiency of
radiant flux at stimulating the rods in the eye, which has a peak wavelength at 507nm. Since 𝑉(𝜆)
is only valid for small filed view of about 2º, CIE developed some other spectral luminous
efficiency functions for different conditions, which are listed in Table 1-1 and shown in Figure
1-4. 𝑉 ′(𝜆) was measured when the visual angles were not less than 5º. With the combination of
rods and cones, the luminous efficiency function for mesopic vision is complex. The unified
System of Photometry (USP-system) [5], Mesopic Optimization of Visual Efficiency (MOVE-
system) [6], and Intermediate System (MES2-system) [7] are the major models for mesopic
vision.
5
Table 1-1 | Luminous efficiency functions for different usages
Function Luminance Level Field Size CIE Publ. No.
V(λ) Photopic 2° ISO/CIE 10527
VM(λ) Photopic 2° NO. 86 (1990)
V10(λ) Photopic 10° or off fovea beyond 2° ISO/CIE 10527
Vb,p(λ) Photopic Point Source No.75 (1988)
Vb,2(λ) Photopic 2° No.75 (1988)
Vb,10(λ) Photopic 10° or off fovea beyond 2° No.75 (1988)
V‘(λ) Scotopic >2° Proc. 1951
Figure 1-4 | Luminous efficiency functions recognized by CIE [8]
6
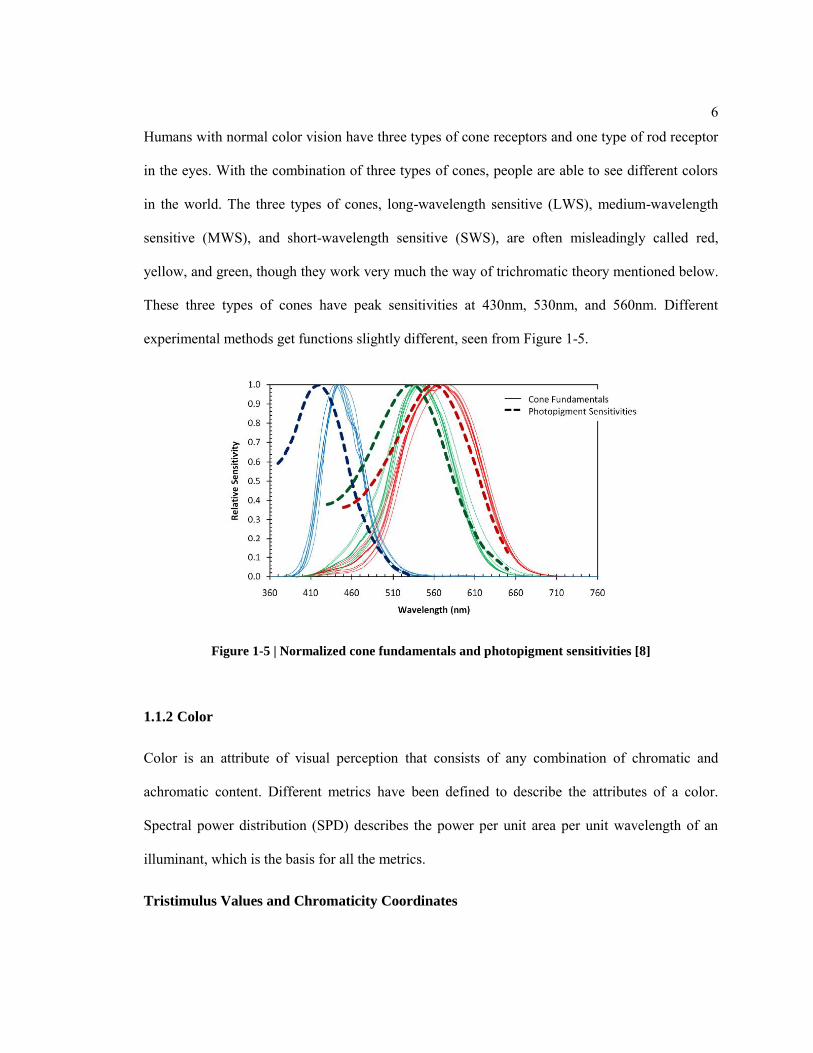
Humans with normal color vision have three types of cone receptors and one type of rod receptor
in the eyes. With the combination of three types of cones, people are able to see different colors
in the world. The three types of cones, long-wavelength sensitive (LWS), medium-wavelength
sensitive (MWS), and short-wavelength sensitive (SWS), are often misleadingly called red,
yellow, and green, though they work very much the way of trichromatic theory mentioned below.
These three types of cones have peak sensitivities at 430nm, 530nm, and 560nm. Different
experimental methods get functions slightly different, seen from Figure 1-5.
Figure 1-5 | Normalized cone fundamentals and photopigment sensitivities [8]
1.1.2 Color
Color is an attribute of visual perception that consists of any combination of chromatic and
achromatic content. Different metrics have been defined to describe the attributes of a color.
Spectral power distribution (SPD) describes the power per unit area per unit wavelength of an
illuminant, which is the basis for all the metrics.
Tristimulus Values and Chromaticity Coordinates

7
Trichromatic generalization summarizes the experimental laws of color matching, which states
that many color stimuli can be completely visually matched in color by mixing three fixed
primary stimuli with suitable radiant powers. A system of colorimetry was constructed based on
the principles of trichromacy and Grassmann‘s laws of additive color mixture. Three primary
stimuli were defined which can be mixed to get other colors and none of which can be color
matched by a mixture of the other two. In 1931, CIE adopted the 2º Standard Colorimetric
Observer, characterized by 𝑟 (𝜆), 𝑔 (𝜆), and 𝑏 (𝜆) Color Matching Functions (CMFs) (Figure 1-6),
which allows to represent a color by three tristimlus values. However, sometimes one of the three
primary stimuli have to be added to the test stimulus to match the mixture of the other two
primary stimuli, which will make this stimulus have negative value. A transformation from 𝑟 (𝜆),
𝑔 (𝜆), and 𝑏 (𝜆) to 𝑥 (𝜆), 𝑦 (𝜆), and 𝑧 (𝜆) (Figure 1-7) was established to guarantee the tristimulus
values X, Y, and Z are larger than zero. The sum of the percentage values of the three tristimulus
values is 1.0, thus the percentage values of the first two tristimulus values make up the
chromaticity coordinate, which can be plotted in the CIE 1931 chromaticity diagram. Sometimes,
two stimuli with different SPDs may have the same tristimulus values and chromaticity
coordinates, and they are visually indistinguishable, which is called metamerism.
Like the luminous efficiency function, CMFs were collected based on a 2º field of view. In 1964,
the CIE 10º Standard Colorimetric Observer was established (Figure 1-6, Figure 1-7).

8
Figure 1-6 | RGB color matching functions [8]
Figure 1-7 | XYZ color matching functions [8]
Color Temperature & Correlated Color Temperature
Color temperature is applied to highly selective radiators. When the light of a radiator has the
same or nearly the same chromaticity coordinate as a blackbody radiator at a certain temperature,
this temperature is called the color temperature of the selective radiator.

9
Correlated color temperature (CCT) is introduced when the chromaticity coordinate of a radiator
is not exactly the same as any of the chromaticity coordinate of the blackbody radiator. CCT is
defined as the temperature of the blackbody radiator whose perceived color is most like that of
the given radiator at the same brightness under specific viewing conditions. Figure 1-8 shows the
isotemperature lines calculated by Kelly [9].
Color Rendition
Color rendering ability of a light source is the effect the source has on the color appearance of
objects in comparison with their appearance under a reference source. Though different methods
have been established to evaluate a light source‘s color rendering ability, the most commonly
used method to assess color rendering by a single number is the CIE Color-Rendering Index
(CRI).
Figure 1-8 | The CIE 1976 USC with isotemperature lines

10
CRI is based on the average length of chromaticity-difference shifts between a test light source
and reference light source in the 1964 CIE UCS, which has a maximum value of 100 and
minimum value of zero. A set of eight test-color samples is used to compute CRI, and another set
of six test-color samples is used to compute special CRI. Light sources that render the eight test-
color samples close to the reference illuminant have smaller shifts and higher CRI. Conversely, a
lamp having lower CRI has large color shift for the eight test-color samples compared to the
reference illuminant. The reference illuminant is defined to have the same CCT of the testing
light source. For a lamp with CCT of 5000K or above, the CIE daylight model is used; while for
the lamp with CCT lower than 5000K, a blackbody radiator is used.
However, CRI has some limitations. It uses a single number derived from the color shifts of eight
color samples in the CIE 1964 UCS to describe the color rendering ability. None of these color
samples is highly saturated and the CIE 1964 UCS is non-uniform. Different reference
illuminants are used to calculate CRI for the lamps with different CCT, which does not allow
comparisons between different light sources. In addition, the reference illuminants are not always
ideal for color rendition, though they are defined to have 100 for CRI. With the development of
the light-emitting diode (LED), CRI has been shown to be a poor index to characterize narrow
band spectra [10]. Sometimes, R9 is used to characterize the rendering ability of a source for a
stronger red test color, since red-green contrast is considered important for color rendering [11,
12].
Some other indices of color rendition are commonly used, including Flattery Index (Rf) [13],
Color Discrimination Index (CDI) [14], Color Preference Index (CPI) [15], Gamut Area, FM
Gamut Area, and Color Quality Scale (CQS) [16].
Munsell Color System
11
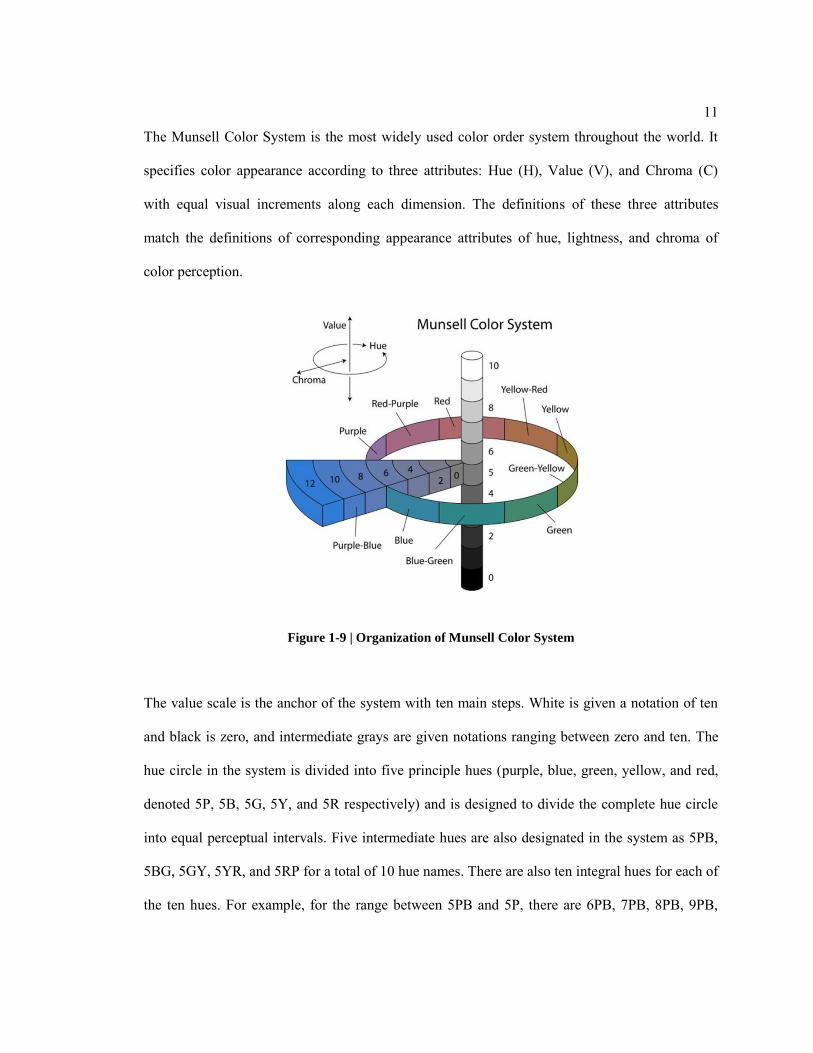
The Munsell Color System is the most widely used color order system throughout the world. It
specifies color appearance according to three attributes: Hue (H), Value (V), and Chroma (C)
with equal visual increments along each dimension. The definitions of these three attributes
match the definitions of corresponding appearance attributes of hue, lightness, and chroma of
color perception.
Figure 1-9 | Organization of Munsell Color System
The value scale is the anchor of the system with ten main steps. White is given a notation of ten
and black is zero, and intermediate grays are given notations ranging between zero and ten. The
hue circle in the system is divided into five principle hues (purple, blue, green, yellow, and red,
denoted 5P, 5B, 5G, 5Y, and 5R respectively) and is designed to divide the complete hue circle
into equal perceptual intervals. Five intermediate hues are also designated in the system as 5PB,
5BG, 5GY, 5YR, and 5RP for a total of 10 hue names. There are also ten integral hues for each of
the ten hues. For example, for the range between 5PB and 5P, there are 6PB, 7PB, 8PB, 9PB,
12
10PB, 1P, 2P, 3P, and 4P. This type of sequence continues around the entire hue circle, resulting
in 100 integer hue designations that are intended to be equal perceived hue intervals. The third
dimension is chroma. The chroma scale is designed to have equal visual increments from a
chroma of zero for neutral samples to increasing chromas for samples with stronger hue content.
There is no maximum value for the chroma scale. The highest chroma achieved depends on the
hue and value of the samples and the colorants used to produce it.
1.1.3 Theories of Color Vision
The most acceptable theory of color vision today is the product of multiple stages of visual
processing, which originated from Hurvich and Jameson in 1957. This theory is based on the
sequential combination of two prior theories, trichromatic theory and opponent process theory.
Trichromatic Theory
This theory is the first scientific theory of color vision which was initially proposed by George
Palmer, Thomas young, and Helmoholtz [17] individually in the late 1700s. The theory proposed
that there are three primary types of color receptors in the human eyes, nominally red, green, and
blue. All the other colors were explained as combinations of these primaries. These three types of
color receptors respond differently as a function of the wavelength of the light falling on them.
And these three kinds of receptors are regarded to produce peak stimuli in the short-wavelength,
medium-wavelength, and long wavelength region of the spectrum. The theory also explained
some basic phenomena of color vision, such as the three primary colors, the existence of
metamers, and color blindness.
Opponent Process Theory
13
Besides some basic phenomena that can be explained by trichromatic theory, there are still some
other facts that cannot be explained very well. The most striking phenomenon is the experience
that colors are never lost singly, which would be expected based on the trichromatic theory.
Yellow seems to be another primary color as red, green, and blue. In the late 1800s, Ewald
Hering established the opponent process theory, indicating there are four chromatic primaries
rather than three and they are structured into pairs of polar opposites: red-green and blue-yellow.
He agreed with Helmoholtz about three primitive mechanisms but thought there were three
opponent mechanisms instead of the trichromatic primaries. The opponent mechanisms he
believed existed were red-green receptor, yellow-blue receptor, and white-black receptor.
Dual Process Theory
Debates between the two theories above lasted for a long time. Hurvich and Jameson attributed
color vision to both processes. Three photoreceptors are the first step of color vision to perceive
color. The outputs of these three photoreceptors become the input into the opponent channels, as
shown in Figure 1-10. The cells in the retina, bipolar and ganglion cells were also found to
support the dual process theory.

14
Figure 1-10 | A possible diagram of the opponent system
Figure 1-11 | Opponent signals from the possible model of the opponent system (the functions are
linear transformation of CMFs) [8]

15
1.1.4 Changes with Age
The visual system of human beings can be regarded as an image-processing system. The factors
that determine the operating state of the system are the amount of light that reaches the retina and
the wavelengths that the light contains. The factors that determine the clarity of the retinal image
are the ability to focus the image of the external object on the retina, the extent to which light is
forward scattered as it passes through the eye, the presence of stray light produced by back
reflection from the components of the eye, transmittance through the eye wall, and the
fluorescence in the lens of the eye.
As an optical system, the eye has a fixed image distance and a variable object distance. In order to
make the objects with different distances focused onto the retina, the optical power of the eye has
to change, which is determined by the curvature of the cornea and the thickness of the lens. The
curvature of the cornea is fixed, while the thickness of the lens is variable. As the visual system
ages, the range of object distances that can be focused onto the retina decreases because of the
increasing rigidity of the lens. After 60 years old, the eye is virtually a fixed focus optical system.
The optical factors determining the amount of light reaching the retina are the pupil size and the
spectral absorption of the components of the eye. The area of the pupil varies as the amount of
light available changes. The pupil becomes larger to admit more light when there is little, while
the pupil becomes smaller when there is plenty of light. As a person ages, the ratio of the
maximum to the minimum pupil area decreases. The maximum decreases much more than the
minimum does, which means that old people are much less able to compensate for low light
levels by opening the pupils than young people.

16
Figure 1-12 | The Change of pupil diameter with age [1]
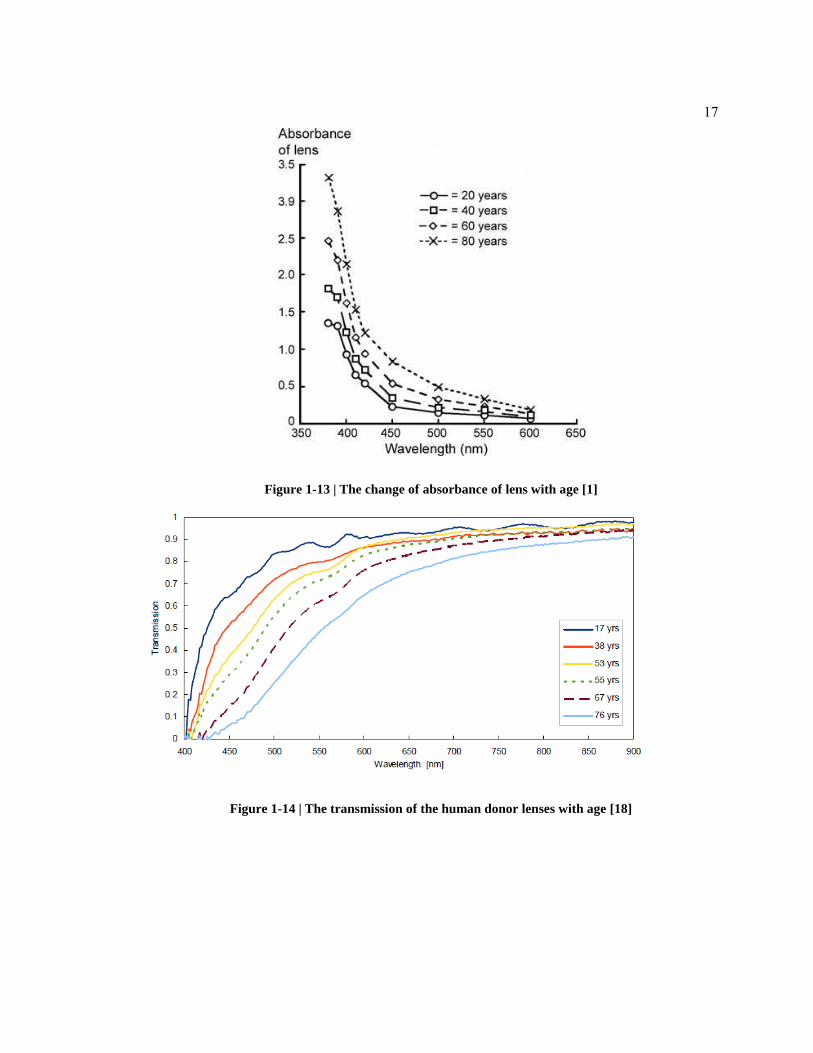
As the lens ages, its color changes from clear to yellow and finally brown. With the change of
color, the absorption is also changing. For the spectral absorption of the eye, the majority of the
absorption takes place on passage through the lens. As shown in Figure 1-13, the absorbance of
the lens increases exponentially from birth. The reduction of the optical radiation is not uniform
across the entire spectrum. When people are in their 80‘s or 90‘s, the transmittance of the short-
wavelengths is 10% compared to that at ten years old. Lundeman and his colleague studied the
transmittance of human eyes in donor lenses from the age of 17 to 76 years old. Figure 1-14
shows a significant decrease in transmission in the 400-500 nm range, while in the range of red
color, it only drops slightly [18].
17
Figure 1-13 | The change of absorbance of lens with age [1]
Figure 1-14 | The transmission of the human donor lenses with age [18]

18
A cataract is a clinical term used for a lens which is no longer transparent to light and it is treated
by removing the contents of the lens capsule and replacing the lens by an intraocular lens, called
cataract surgery.
1.2 Objective
In order to evaluate the attributes of light sources, many metrics have been developed in the last
several decades, such as efficacy, CRI, Gamut Area, CCT, and lumen-output. The properties of
lamps are generally indicated using these traditional measurement systems.
Recently, General Electric (GE) Lighting has developed a new family of lamps with non-standard
spectral power distribution, which appears to have better properties than what is indicated by the
traditional metrics. This new family is known as Reveal® and it is commercially available. The
SPDs of the lamps in this family are diminished in the yellow region, as shown in Figure 1-15.
Figure 1-15 | Spectral power distribution of the SPX3K and the RevLF, adjusted so that peak relative
output is at 100%
0%
20%
40%
60%
80%
100%
120%
350 450 550 650 750
Re
lati
ve O
utp
ut
Wavelength (nm)
SPX3K
RevLF

19
This study attempts to draw statistically sound conclusions regarding the differences between a
SPX 3000K Linear Fluorescent Lamp (SPX3K) that has the typical tri-band spectral power
distribution and a Reveal® Linear Fluorescent Lamp (RevLF) that has a diminished yellow
emission spectral power distribution.
Based on the traditional metrics, the SPX3K performs much better than the RevLF does. It has
better color rendition ability and is more efficient.
Table 1-2 | Properties of the SPX3K and the RevLF in GE Catalog
[19]
Power (W) CCT (K) Initial Lumen (lm) Mean Lumen (lm) CRI
SPX3K 32 3000 2950 2800 86
RevLF 32 2600 2475 2225 60
1.3 General Approach
The approach taken was to develop two side-by-side full-scale rooms that permitted the human
subjects to make brightness comparisons and conduct a color discrimination task. Details of the
experimental room are provided in Chapter 3 Design of the Study and Methodology. The
lighting fixtures in the room were specifically designed so that the rooms were indirectly
illuminated. The human subjects were not able to see the light sources directly and the luminance
distributions of the rooms were designed as close as possible when using different lamps.

20
Chapter 2 Literature Review
2.1 Lamp SPD Vs. Spatial Brightness
Brightness is an attribute of a visual sensation in which a stimulus appears to be radiating or
reflecting light. A draft definition of spatial brightness has been proposed by the Illuminating
Engineering Society (IES) Visual Effects of Lamp Spectral Distribution Committee: ―Spatial
brightness describes a visual sensation to the magnitude of the ambient lighting within an
environment, such as a room or lighted street.‖
Numerous studies have been carried out to investigate the relationship between SPD and
brightness perception, which provides some opportunities to reduce illuminance while
maintaining the same brightness perception. Spaces with the same illuminance level appear
differently bright because of the definition of the illuminance. Illuminance is defined based on
𝑉(𝜆), the CIE Standard Photopic Observer, which is different from the visual process of the
brightness perception. The visual system of a human being has three channels: one achromatic
channel and two chromatic channels, which have inputs from different combinations of three
types of cones [20]. 𝑉(𝜆), the CIE Standard Photopic Observer, was collected by flicker
photometry and step-by-step brightness matching which tend to minimize the activities of two
chromatic channels and only take the activity of the achromatic channel into account [3].
However, brightness perception is dependent on the activities of all three channels [21]. Though
the limitations of 𝑉(𝜆) in predicting brightness perception are known [22], including field size,
luminance levels, experimental conditions, and the additivity assumptions, it is still the most
widely used basis to model the quantities in illuminating engineering.
The relationships between brightness and the attributes of color stimuli, such as CCT, CRI,
chromaticity coordinate, saturation, and hue, have been studied by many researchers.
21
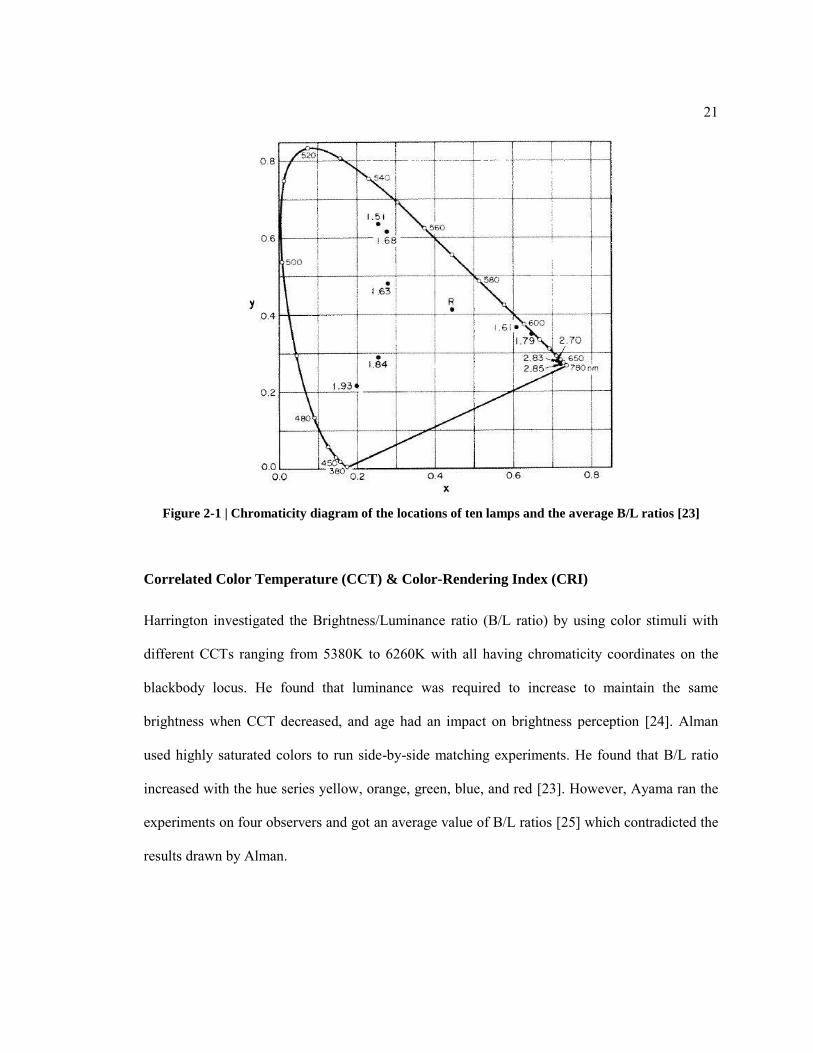
Figure 2-1 | Chromaticity diagram of the locations of ten lamps and the average B/L ratios [23]
Correlated Color Temperature (CCT) & Color-Rendering Index (CRI)
Harrington investigated the Brightness/Luminance ratio (B/L ratio) by using color stimuli with
different CCTs ranging from 5380K to 6260K with all having chromaticity coordinates on the
blackbody locus. He found that luminance was required to increase to maintain the same
brightness when CCT decreased, and age had an impact on brightness perception [24]. Alman
used highly saturated colors to run side-by-side matching experiments. He found that B/L ratio
increased with the hue series yellow, orange, green, blue, and red [23]. However, Ayama ran the
experiments on four observers and got an average value of B/L ratios [25] which contradicted the
results drawn by Alman.

22
Alman also found the trend for the colors close to the blackbody locus [23]. For colors with CCT
above 3000K, B/L ratio increased when CCT increased, while for the color with CCTs lower than
3000K, B/L ratio increased when CCT decreased, shown as Figure 2-2. Using semantic rating
scales to compare side-by-side booths, Delaney found approximately equal ratings of brightness
for lamps with CCT of 5000K and 4200K, but progressively better ratings for the lamps with
higher CCT as the difference in CCT increased [26]. Boyce and Cuttle compared four fluorescent
lamps with CCT of 2700K, 3500K, 4200K, and 6300K, with CRI in the range of 82-85. A 5-point
rating scale was employed in the experiment. They found that in achromatic rooms, CCT did not
affect the ratings of brightness and glare, while in colored rooms, rooms with 6300K were rated
less bright than the rooms with 2700K or 3500K [27]. Hu and her colleagues ran side-by-side
comparisons of brightness perception and side-by-side dimming adjustments for brightness
matching, showing that CCT and brightness perception were not related [28].

23
Figure 2-2 | B/L ratio contours on the 1931CIE chromaticity diagram [25]
Figure 2-3 | Section of the CIE 1931 chromaticity diagram including 16 lamps whose chromaticity
coordinates were close to the blackbody locus and B/L ratio versus CCT [23]

24
Figure 2-4 | Relationship between brightness and CCT. (a) Percentage of subjects selecting 3500K
lamps over 6500K lamps in side-by-side comparisons; (b) Mean adjusted illuminance and standard
deviations for two pairs of comparisons in the brightness matching trials [28]
CRI is regarded as another method to describe the attribute of a light source. Fotios summarized
the comparison between two lamps, A and B. If lamp A had a higher CCT and CRI than lamp B
does, the interior appeared brighter when using lamp A. If the lamps had similar CCTs, the
interior appears brighter when using the lamp with higher CRI. He also suggested that
consideration of CRI and CCT together provide a better prediction of color appearance. Lamps
with higher CRI and CCT would be perceived brighter, and could be set to a lower illuminance
level for equal perceived brightness [29].
All the studies above investigated the relationship between CCT, CRI, chromaticity coordinates,
and brightness perception. Most of the experiments were carried out for small viewing fields,
which is the same limitation of 𝑉(𝜆). They used different lamps to illuminate chips for observing
and evaluating brightness. However, the materials, and reflectance of the chip could be the factors
25
that affect the sensation of the observers. For architectural engineering and interior lighting,
perception mainly focuses on large viewing fields. All the conclusions made above should be
reconsidered if applied to a large viewing field. In short, none of CCT, CRI, Gamut Area, and
chromaticity coordinates alone would be able to predict the brightness response, which was
concluded by Fotios [29].
Prime Color Theory
In 1777, George Palmer found that there were three types of color receptors in a human‘s eyes,
which produce the primary color sensations. Thornton studied the trichromatic response from
several points-of-view, including brightness perception [30] and color preference. He called the
regions near 450nm, 530nm, and 610nm in spectrum the ―prime colors‖, which were able to
enhance both brightness and color perception. In contrast, the intermediate regions around 500nm
and 580nm were called the ―anti-prime colors‖, which can worsen brightness and color
perception. That is the basis for tri-phosphor fluorescent lamps.
Thornton concluded that the three most effective wavelengths in white light were near 450nm,
540nm, and 610nm for CRI. Conversely, composition of white light should avoid wavelengths
near 500nm and 580nm, which were ineffective. Elimination of wavelengths near 500nm or
580nm improved the CRI and color discrimination significantly [31, 32]. In the 1990s, a series of
experiments of perceived brightness were carried out by Thornton. Three primary colors were
used to match the broadband-white fluorescent lamps in brightness by the Maxwell Method:
452nm-533nm-607nm, 477nm-558nm-638nm, and 497nm-579nm-653nm. Two spectral lights
were held at primary wavelengths, while the third was varied through the remaining primary. He
found that the least power was required for brightness matching near 450nm, 530nm, and 610nm,
while the most power was required near 500nm or 570nm, which was independent both of

26
primaries and of colorimetric assumption [33]. Another experiment method, the Maximum
Saturation Method, was also used. A spectral light of variable wavelength was mixed with one of
the primary to match the other two primaries. The same three primaries sets were used [33].
Figure 2-5 | Ratio of power of lights to total power (Left: ratio of the power of light at variable
wavelength to total power. Right: ratio of the power of two primary lights to total power) Red lines
indicate the wavelengths require less power, and blue lines indicate the wavelengths require more
power [33]
Houser and his colleagues ran a pilot study based on Thornton‘s prime color theory. By
increasing the magnitude of radiation within the prime-color regions, brightness and color
preference were found to increase, which supported the prime color theory. A conclusion was
drawn that the perception of brightness and visual clarity depend on the placement of radiant
power within key spectral regions. More energy within the 450nm-530nm-610nm regions led to
enhanced brightness perception and color preference [34].
Opponent Process
Based on the theory of dual process of the visual system, some theories about brightness were
established based on the opponent system. Several simple linear models were established. The

27
brightness meter invented by Thornton was expressed as 𝛽 = 𝐿 + 𝐵 − 𝑌 + 𝐺 − 𝑅 [35]. The
brightness model established by Thornton was expressed as 𝛽 = 𝑌 + 𝑀 + 𝑁 [30]. And the
vector luminance model of Guth and Lodge was given by 𝐿 = 𝐴2 + 𝑇2 + 𝐷2 1/2 [36]. The
luminance model and brightness model were based on the chromatic and achromatic channels
from the transformation of the CIE 1931 Standard Colorimetric Observer. The perceived
brightness was the sum of the activities in three channels, but the summation is confused by the
arbitrary signs of the red-green and blue-yellow channels. Thus, Guth and Lodge used a vector
sum in the vector luminance model and Thornton summed the absolute values in the three
channels in his brightness model. The brightness meter established by Thornton was found to be
the most accurate among the three. Some other models were developed by Fotios [37-39],
Yaguchi [40], Nayatani [41], Fairchild [42], and Houser [22]. All of these models provide better
prediction of brightness than 𝑉(𝜆) does, though they are still not perfect [43].
S/P Ratio or C/P Ratio
Berman argued that rods contribute to the spatial brightness for large fields of view at photopic
vision. He thought the perception of spatial brightness is related to the ratio of scotopic to
photopic lumens (S/P ratio), suggesting that at equal luminance, lamps with a higher proportion
of energy in short-wavelength regions will be perceived brighter [44]. Based on psychophysical
experiments, he found differences in brightness between stimuli with the same chromaticity
coordinates and photopic luminance. He argued that the same chromaticity coordinates and
photopic luminance should provide equal excitation to the cone receptors, so the differences of
the brightness perception cannot solely be due to cone receptors. Rods must be active at these
light levels [44]. He promoted P(S/P)0.5 as a correlate for brightness perception and stating that
the lamps with a high S/P ratio should be promoted as a method for reducing energy

28
consumption. Berman also supported that the cirtopic spectral sensitivity is the true driver of the
brightness perception while scotopic sensitivity can explain the effect because the scotopic and
cirtopic functions have peaks near to each other [45]. The other reason to use C/P ratio is it
correlates with the change in pupil size driven by the intrinsically photosensitive Retinal
Ganglion Cell (ipRGC).
However, rod response is generally considered to be saturated at photopic levels, which means
rods should make little contribution to brightness perception. The response of SWS is considered
alternatively in the S/P ratio. Stockman [46] and Ingling [47] found the contribution of SWS to
brightness perception. A model of P(SWS/P)0.24 was proposed by Fotios to predict brightness
perception [39]. It was also mentioned by Berman that this relationship might not be accurate for
narrow band sources such as LEDs.
Houser and his colleagues ran experiments to test brightness perception. The stimuli of two S/P
ratios were applied in the experiment. Both of them were on the blackbody locus. Two luminance
levels were used. The conclusion from the experiments indicated that S/P ratio and CCT were not
able to predict brightness perception, at least for the stimuli on the blackbody locus, though the
stimuli in this experiment were not representative of light stimuli [48].
2.2 Experimental Methods for Brightness Perception
Over 60 studies have been carried out to investigate the relationship between SPD and spatial
brightness perception. Different experiments were designed and provided the different
conclusions. Some of them reported a significant effect of SPD, while others concluded little
effect. Experimental procedures should be designed carefully to get reliable results.

29
Joint and separate evaluations are the two major methods of evaluation. In separate evaluation,
stimuli are presented individually, while in joint evaluation, two or more stimuli are presented at
the same time. The joint evaluation method can be subdivided into simultaneous and sequential
modes. Simultaneous mode means the stimuli are presented side-by-side, while the sequential
mode means the stimuli are presented in temporal juxtaposition.
Rating, ranking, and matching are the three possible responses provided from the subjects. Rating
is the method that requires subjects to rate the level of brightness of a space. Providing a standard
for this rating is required to get reliable results. Ranking method requires the subjects to rank the
stimuli from brightest to darkest. Matching requires the subjects to dim one stimulus to match the
brightness of the other stimulus. Fotios provided a very good summary of the methods required
for reliable studies in Table 2-1 [49].
Table 2-1 | Studies giving reliable results of SPD effect on brightness [49]
Study Response Field Size Evaluation Mode
Akashi & Boyce [50] Yes/No Response to Statements Full Field Separate
Berman et al. [51] Forced Choice Full Field Sequential
Boyce [52] Matching Full Field Simultaneous
Boyce et al. [53] Yes/No Response to Statements Full Field Separate
Boyce and Cuttle [54] Rating Full Field Separate
Flynn and Spencer [55] Rating Full Field Separate
Fotios and Gado [56] Matching 40º high, 72º wide Simultaneous
Fotios and Levermore [57] Matching 22º high, 38º wide Simultaneous
Houser et al. [34] Forced Choice Full Field Simultaneous
Houser et al. [48] Forced Choice Full Field Simultaneous
Houser et al. [48] Forced Choice Full Field Sequential

30
Hu et al. [28] Matching Full Field Simultaneous
Thornton and Chen [58] Matching 30º high, 50º wide Simultaneous
Vrabel et al. [59] Forced Choice Full Field Sequential
Vrabel et al. [59] Rating Full Field Separate
Only 13 out of 60 previous studies seem to be reliable. The aspects of these procedures were
counterbalanced or randomized, null condition trials were included, and clear statistical analysis
was used in these studies. Counterbalanced or randomized procedures were used to guarantee that
there was no order or positional bias in the results.
Chromatic adaptation should be considered in the experiment. In simultaneous mode, subjects
adapt to a mixed spectrum where the white point is somewhere between the two stimuli. In rapid-
sequential mode, the duration of the stimuli need to be controlled within 3-5 seconds, at which
point the chromatic adaptation tends to be only about 60% complete.
When using side-by-side ranking tests, the frequency of stimuli may introduce bias. When a
forced-choice is required between reference illuminant and test illuminant, the subject may not
compare the test lights to the reference, but instead to the overall range of test lights, which
means the middle of the range presented will be the one found to be equally bright as the
reference [60].
2.3 Color Discrimination
Color rendering consists of three components, which may not be correlated well with each other.
The three components include the accurate rendition of colors or colors of objects as they appear

31
under the reference light source, the rendition of colors that make objects appear more pleasing
(vivid or flattering), and the capability of a lamp to allow for human beings to distinguish
between a large variety of colors when viewed simultaneously. These are noted as fidelity,
appeal, and discrimination [8]. Different metrics have been established for these. CRI is an index
to qualify the fidelity. FI [13] and CPI [15] measure the appeal of a lamp. CDI [14] and Gamut
Area Index (GAI) [61] provide a measurement of color discrimination. Jerome concluded that
maximizing one element might be detrimental to another [62].
Both CDI and GAI are calculating the area enclosed by the eight test-color samples used in CRI
in the CIE 1960 UCS. The difference between them is the scaling method to calculate the index.
The number of test color samples and the uniformity of UCS are the two limitations of CDI and
GAI. FM Gamut calculates the gamut area enclosed by the 85 color samples of Farnsworth-
Munsell 100 Hue Test (FM-100) in the CIE 1960 UCS, which is a similar method to CDI. Royer
and his colleague failed to find a good predictor among CRI, CDI and FM Gamut Area for color
discrimination [63]. Thus, it is not beneficial to use an index to predict the color discrimination
ability of a light source or a spectrum.
FM-100 was designed by Farnsworth in 1943 [64], which is widely used in color vision tests.
Many studies have been conducted to investigate the effects of SPD, illuminance level, age, and
color deficiency on the color discrimination by using FM-100.
In 1976, Boyce ran an experiment to see the impact of illuminance level on color discrimination.
Fifteen subjects performed the FM-100 under four different fluorescent lamps and two different
illuminance levels. Boyce drew the conclusion that the illuminance levels within 300-1000 lux
had no impact on color discrimination [65]. A study in 1977 carried out by Boyce included more
light sources showed the same results [66]. Bowman reviewed all the literature in 1980 and

32
carried an experiment with 10 subjects. He drew the conclusion that the Total Error Score (TES)
of FM-100 increased when the illuminance level decreased. When the illuminance level was
above 100 lux, the improvement of color discrimination was not statistically significant [67].
Figure 2-6 summarizes the results of TES of FM-100 versus illuminance level.
Figure 2-6 | Total Error Score (TES) of FM-100 versus the illuminance level for different age groups
[67]
For the relationship between stimulus and color discrimination performance of FM-100, Boyce
found that light sources with higher CRI improved color discrimination performance [65, 66].
And it was similar for CIE Gamut Area and CDI [66]. For the lamps with similar CRI, it was
found that higher CCT led to a reduction in TES [54]. However, no significant difference was
found among a 2900K halogen lamp, 3000K tri-band CFL, and 5000K full spectrum CFL [68].
Age is another factor that is thought to affect color discrimination performance. It has been
generally accepted that older people consistently produced much worse performance than

33
younger people and middle-aged people [66, 68, 69]. When changing light settings during
experiments, longer adaptation time was needed by the older subjects [68].
Figure 2-7 | Color discrimination performance of FM-100 for each age group and illuminance level
[69]
2.4 Spectral Modification
Many studies tried to modify SPD to improve visual performance for people.
Using goggles or contacts were the most widely used methods for spectral modification. In 1983,
Kinney compared the visual performance of subjects between yellow goggles and neutral goggles

34
with equal transmittance. Subjects wearing yellow goggles showed faster reaction time [70].
However, both of the chromatic channels, yellow-blue and red-green, were affected in the same
direction by yellow cutoff filters, so the relative contribution to the results was unknown. In 1990,
a similar experiment was carried out by Kelly to investigate the impact of yellow goggles on
brightness perception. He found that brightness perception was enhanced about 40% by yellow
goggles when the spatial extent of the stimulus exceeded to fovea [71], which also supported the
failure of S/P in predicting brightness.
Figure 2-8 | Transmittance of the lens used for spectral modification [71]
X-Chorm lens, a broadband red contact lens, is another way to modify the spectrum entering
people‘s eyes. In some instances, significant improvements in color discrimination have been
reported for color-deficient observers by using X-Chrom lens, whereas other investigations have
found minimal or no beneficial effects. Matsumoto summarized that these discrepancies may in
part be due to the different color tests that have been used to assess vision [72]. In general,

35
improvements in performance have been reported for evaluations performed with
pseudoisochromatic plates. Other tests, including FM-100, Farnsworth D-15, have shown
minimal or no effects of X-Chrom lens.
36
Chapter 3 Design of the Study and Methodology
3.1 Apparatus
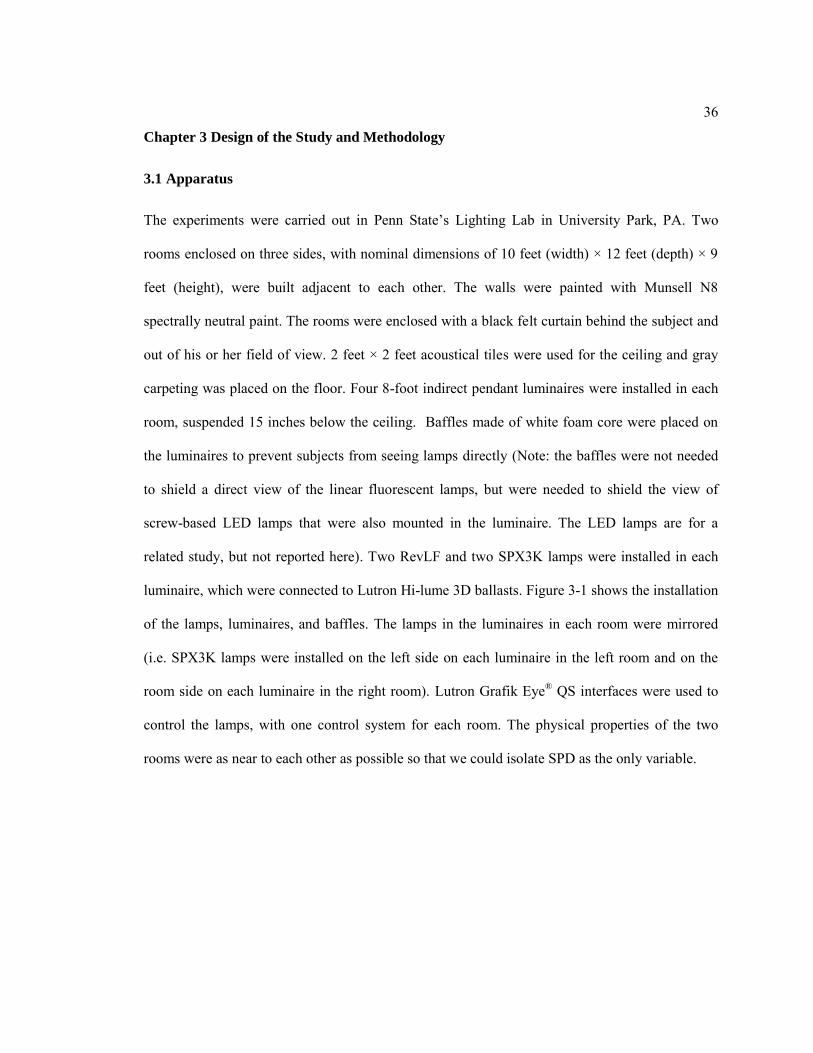
The experiments were carried out in Penn State‘s Lighting Lab in University Park, PA. Two
rooms enclosed on three sides, with nominal dimensions of 10 feet (width) × 12 feet (depth) × 9
feet (height), were built adjacent to each other. The walls were painted with Munsell N8
spectrally neutral paint. The rooms were enclosed with a black felt curtain behind the subject and
out of his or her field of view. 2 feet × 2 feet acoustical tiles were used for the ceiling and gray
carpeting was placed on the floor. Four 8-foot indirect pendant luminaires were installed in each
room, suspended 15 inches below the ceiling. Baffles made of white foam core were placed on
the luminaires to prevent subjects from seeing lamps directly (Note: the baffles were not needed
to shield a direct view of the linear fluorescent lamps, but were needed to shield the view of
screw-based LED lamps that were also mounted in the luminaire. The LED lamps are for a
related study, but not reported here). Two RevLF and two SPX3K lamps were installed in each
luminaire, which were connected to Lutron Hi-lume 3D ballasts. Figure 3-1 shows the installation
of the lamps, luminaires, and baffles. The lamps in the luminaires in each room were mirrored
(i.e. SPX3K lamps were installed on the left side on each luminaire in the left room and on the
room side on each luminaire in the right room). Lutron Grafik Eye® QS interfaces were used to
control the lamps, with one control system for each room. The physical properties of the two
rooms were as near to each other as possible so that we could isolate SPD as the only variable.

37
Figure 3-1 | Photograph of the installation of the lamps, luminaires and baffles
For the session on perceived brightness, a table was positioned against the dividing wall, such
that when the subject was seated his or her sagittal plane aligned with the middle of the two
spaces. The subject was seated with his or her head positioned in a chin and forehead rest. Eye
height was approximately 46.5 inch above the floor, varying slightly with the size of a subject‘s
head, which was computed based on the 95th percentiles of the static dimensions of the U.S.
civilian population [73]. The subject was instructed that he or she was free to rotate his or her
head within the rest, but to focus on the back walls of the rooms when making judgments. A view
from behind the subject‘s seated position is shown in Figure 3-2.

38
Figure 3-2 | A view from behind the subject’s seated position in the session on perceived brightness
For the session on color discrimination, a table with neutral grey top was placed in the center of
the room 9 feet from the back wall. The height of the table was 2.5 feet above the floor, where the
subject performed the color discrimination task. The subject was free to move and adjust the
height of the chair to sit comfortably. The color discrimination task was presented in the center of
the table to match the place where calibration measurements were taken. All of the color
discrimination experiments were carried out in the right room. A view from behind the subject‘s
seated position is shown in Figure 3-3.

39
Figure 3-3 | A view from behind the subject’s seated position in the session on color discrimination
3.2 Subjects
60 subjects were recruited, 30 in each age group. The younger group was 25 years or younger and
the older group was 60 years old or greater.
All subjects in the younger group were recruited via an email distribution list that includes
students at the University Park campus of Penn State University. Most of them were students in
Architectural Engineering. All of them were studying disciplines other than lighting. All subjects
in the older group were recruited from the residents of The Village at Penn State, a retirement
community in State College, PA. They were recruited with a flyer sent to the front desk of The
Village at Penn State. Interested residents selected an available time-slot and signed-up with the
receptionist. There were no criteria to exclude participants except age. Each subject was paid $75.

40
The recruitment materials and experimental procedures were approved by Penn State‘s
Institutional Review Board (IRB #35919). Each subject was assigned a randomly generated four-
digit ID to maintain confidentiality.
Table 3-1 summarizes demographic data for the subjects, including the mean age, age range,
gender, number of subjects with cataract surgery, and number of subjects with abnormal vision.
None of the subjects had knowledge about the lamps that were used in the experiment.
Table 3-1 | Demographic summary of the subjects. (Of the 3 subjects in the older group with
abnormal color vision, all of them had had cataract surgery)
Age Group
Number
of
Subjects
Average
Age
(Range)
Std.
Dev Gender
Number of
Subjects with
Cataract
Surgery
Number of
Subjects with
Abnormal Color
Vision
Younger (≤ 25 years of
age) 30 22.3
(19-24) 1.70 19 Males 11 Females 0 1
Older (≥60 years of
age) 30 81.4
(61-92) 7.09 11 Males 19 Females 20 3
3.3 Independent Variables
3.3.1 Independent Variables for Perceived Brightness
For the session on perceived brightness, the independent variables were age group, spectral power
distribution (SPD), and illuminance.
The RevLF and the SPX3K were employed to provide two different SPDs. A StellarNet
EPP2000c spectrometer was used to measure the SPDs, from 380 nm to 780 nm with 5 nm
increments. The remote integrating sphere was positioned on the table where the subject was

41
seated for the session on perceived brightness. The opening of the integrating sphere was oriented
up. The SPDs used in analysis were derived from the average of the measurements taken at
different times during the course of the experiment with one light setting in either room, which
provided a best description of the stimuli viewed by the subjects. Figure 3-4 shows the average
SPDs measured by the spectrometer and Table 3-2 is the summary of the characteristics of the
two SPDs.
Figure 3-4 | The SPDs of the two stimuli – the SPX3K and the RevLF - each an average of
measurements
0%
20%
40%
60%
80%
100%
120%
350 450 550 650 750
Re
lati
ve O
utp
ut
Wavelength (nm)
SPX3K
RevLF

42
Table 3-2 | Characterization of the average SPDs for the SPX3K and the RevLF
SPD CCT (K) CRI
1931 CIE 2°
chromaticity
coordinates
(x, y)
1976 CIE 2°
chromaticity
coordinates
(u’, v’)
SPX3K 2858 86 (0.436, 0.387) (0.258, 0.513)
RevLF 2577 61 (0.449, 0.377) (0.273, 0.512)
Illuminance levels for the perceived brightness sessions were selected to find the illuminance
ratio of RevLF to SPX3K, at which the rooms were perceived as equally bright. The Lutron
Grafik Eye® QS system was employed to dim the fluorescent lamps. Four scenes with
illuminance levels of 240 lux, 270 lux, 300 lux, and 330 lux, were programmed for the SPX3K.
At each of these four illuminance levels for the SPX3K, four scenes were programmed for the
RevLF, with percent of the SPX3K illuminance corresponding to 80%, 90%, 100%, and 110%, as
shown in Table 3-3. The reason for selecting these ratios is discussed in 3.5.1 Statistical Design
for Perceived Brightness. All illuminance levels are typical for interior spaces under photopic
vision. In all, there were ten different illuminance levels (each corresponding to a ‗scene‘, or
‗light setting‘) for the RevLF since some scenes could be reused for different levels of the
SPX3K. For example, 330 lux was one scene for the RevLF, which is both 110% of 300 lux and
100% of 300 lux. Totally, 14 different scenes were designed for the session on perceived
brightness, as summarized in
Table 3-4. A series pairs of light settings were presented to each subject to judge in the session on
perceived brightness, as described in 3.5.1 Statistical Design for Perceived Brightness.

43
Table 3-3 | Horizontal illuminance programmed for the SPX3K and the RevLF
Horizontal Illuminance of the
SPX3K (lux)
Horizontal Illuminance of the RevLF at different
illuminance ratios (lux)
80% 90% 100% 110%
240 192 216 240 264
270 216 243 270 297
300 240 270 300 330
330 264 297 330 363
Table 3-4 | Summary information of light settings and nominal calibration characteristics. Both
rooms required and identical set of light setting, for a total of 28 light settings, each corresponding to
a scene programmed into one of the two Lutron Grafik Eye® controllers
No. of Setting SPD Horizontal Illuminance (lux)
1 SPX3K 240
2 SPX3K 270
3 SPX3K 300
4 SPX3K 330
5 RevLF 192
6 RevLF 216
7 RevLF 240
8 RevLF 243
9 RevLF 264
10 RevLF 270
11 RevLF 297
12 RevLF 300
13 RevLF 330
14 RevLF 363

44
Each light setting was separately calibrated—in each room—to be as close to the target
illuminance as possible. On each experiment day, all lamps were turned on more than one hour
before arrival of the first subject. Before running the first subject and after the last subject of the
day, two Minolta T-10 illuminance meters were used to measure the illuminance in each room
and to verify the calibration settings. Both meters were calibrated immediately prior to this study
and NIST traceable calibration certificates are on file. The calibration and measurement
procedures were identical for both rooms. Within one of the rooms, one meter was oriented up
and positioned on a tripod centered in the room with the photocell 2.5 feet above the floor and 9
feet from the back wall, corresponding to where the subject performed the color discrimination
task. The other meter was positioned on a tripod 6 feet from the back wall, oriented vertically,
and aligned with a point 46.5 inch above the floor in the center of the back wall of the room, since
this corresponded to the viewing plane that each subject was asked to focus on when making
brightness judgments. Figure 3-5 is a photograph taken during calibration. The horizontal
illuminance measurements were used for calibration; the vertical measurements were taken to
verify the similarity of the luminance distribution in the two rooms. Table 3-5 shows the mean
and standard deviation for each of the 14 light settings in both rooms, summarizing the horizontal
and vertical illuminance measurements.
45
Figure 3-5 | Photograph of the calibration during the course of the experiment
Table 3-5 | Average and standard deviation of the illuminance of the light settings measured in each
room
No. of
Setting
Left Room Illuminance (lux) Right Room Illuminance (lux)
Horizontal Vertical Horizontal Vertical
Ave St. Dev. Ave St. Dev. Ave St. Dev. Ave St. Dev.
1 243.2 1.4 141.3 1.0 245.3 1.3 143.0 1.0
2 269.4 1.3 156.6 0.9 272.7 1.4 158.9 1.0
3 297.3 2.0 172.8 1.3 301.3 1.1 175.9 1.1
4 331.4 1.3 192.7 1.1 328.0 1.3 191.8 1.0
5 195.7 0.9 114.1 0.8 195.6 2.0 113.2 1.3
6 220.1 0.8 128.1 0.7 222.7 2.8 129.4 1.1
7 243.7 0.9 141.8 0.9 248.9 2.0 144.0 1.3
8 243.8 1.0 141.9 1.0 249.3 2.0 144.2 1.3
9 260.7 0.8 152.1 1.0 258.6 1.7 149.5 0.9
10 269.9 1.8 157.2 0.9 268.5 1.5 155.2 0.7
11 292.9 1.0 170.7 1.0 295.6 1.2 171.0 0.9
12 305.7 1.3 178.2 1.0 309.3 1.4 178.9 0.8
13 332.2 1.3 193.6 1.0 335.4 1.4 194.2 0.8

46
14 358.5 1.4 208.8 1.3 362.2 2.0 209.8 1.1
As mentioned above, SPDs were also measured at different times during the course of the
experiment. All chromaticity coordinates, which were computed from the SPDs, are enclosed by
a four-step MacAdam Ellipse, as shown in Figure 3-6 . Thus, the stimuli in each room were
similar to the other over the duration of the study; all subjects experienced comparable
conditions.
Figure 3-6 | Chromaticity coordinates plotted in the 1931 CIE chromaticity diagram for all
measurements. The coordinates for each measurement can be enclosed by a four-step MacAdam
Ellipse. The measurements were taken at different times during the course of the experiment for one
of the light settings in one room each time
0.35
0.36
0.37
0.38
0.39
0.40
0.41
0.42
0.43
0.44
0.45
0.40 0.41 0.42 0.43 0.44 0.45 0.46 0.47 0.48 0.49 0.50
y
x
SPX3K
RevFL
Blackbody Locus
SPX3K Left Room
SPX3K Right Room
RevFL Left Room
RevFL Right Room
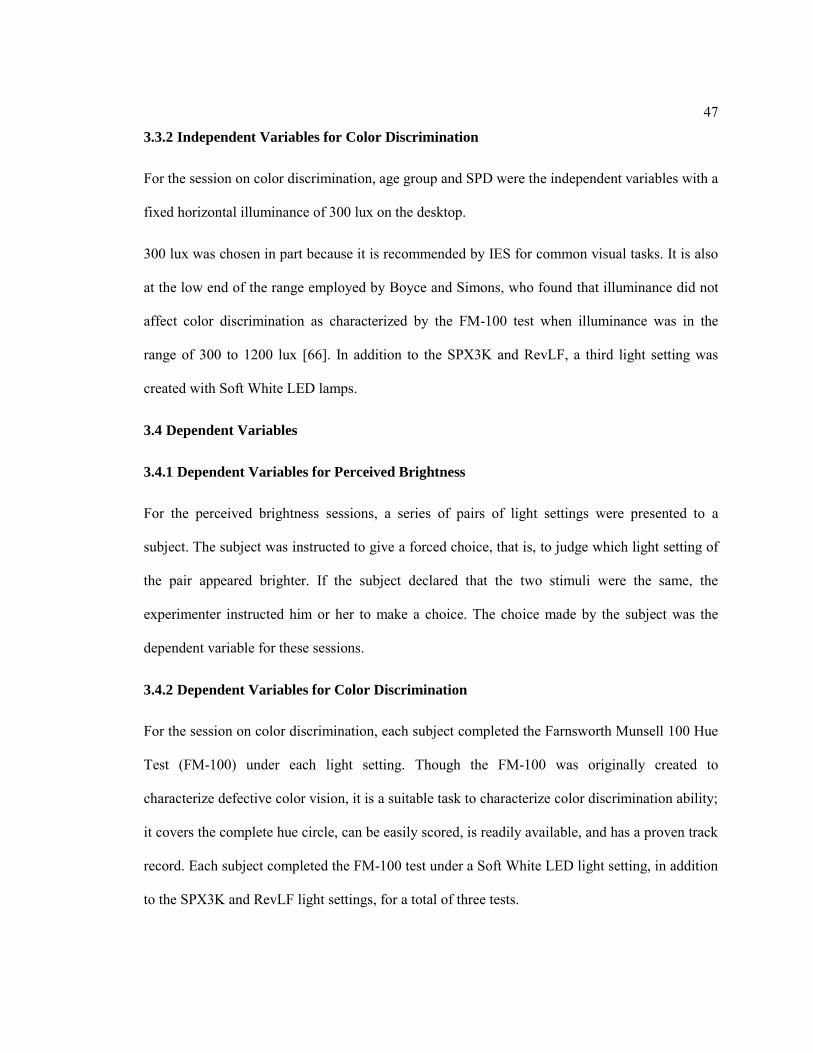
47
3.3.2 Independent Variables for Color Discrimination
For the session on color discrimination, age group and SPD were the independent variables with a
fixed horizontal illuminance of 300 lux on the desktop.
300 lux was chosen in part because it is recommended by IES for common visual tasks. It is also
at the low end of the range employed by Boyce and Simons, who found that illuminance did not
affect color discrimination as characterized by the FM-100 test when illuminance was in the
range of 300 to 1200 lux [66]. In addition to the SPX3K and RevLF, a third light setting was
created with Soft White LED lamps.
3.4 Dependent Variables
3.4.1 Dependent Variables for Perceived Brightness
For the perceived brightness sessions, a series of pairs of light settings were presented to a
subject. The subject was instructed to give a forced choice, that is, to judge which light setting of
the pair appeared brighter. If the subject declared that the two stimuli were the same, the
experimenter instructed him or her to make a choice. The choice made by the subject was the
dependent variable for these sessions.
3.4.2 Dependent Variables for Color Discrimination
For the session on color discrimination, each subject completed the Farnsworth Munsell 100 Hue
Test (FM-100) under each light setting. Though the FM-100 was originally created to
characterize defective color vision, it is a suitable task to characterize color discrimination ability;
it covers the complete hue circle, can be easily scored, is readily available, and has a proven track
record. Each subject completed the FM-100 test under a Soft White LED light setting, in addition
to the SPX3K and RevLF light settings, for a total of three tests.

48
The FM-100 consists of 85 color caps, which are presented in four trays. The two end caps of
each tray are fixed, while the rest of the caps are shuffled on the table. The subject is instructed to
arrange the caps in color order for each tray, making a regular color change between the two end
caps. The back of each cap has a number corresponding to the correct order. The arrangement of
the caps is graded by Total Error Score (TES), which is the sum of scores for all the individual
caps. The score for an individual cap is the sum of the differences between the number of that cap
and the numbers of the two adjacent caps minus two. For example, if three caps are arranged as 3-
6-5, the error score for cap 6 would be (6-3)+(6-5)-2=2. Furthermore, TES can be divided into
two Partial Error Scores (PESs), red-green (R-G PES) and blue-yellow (B-Y PES). The R-G PES
is the sum of the error scores of cap 13 to 33 and 55 to 75 and the B-Y PES is the sum of the error
scores of cap 1 to 12, 34 to 54, and 76 to 85. The scores associated with these caps characterize
color discrimination ability for red-green and blue-yellow colors, respectively. The lower the TES
and PES, the better the color discrimination ability. Thus, TES, R-G PES, and B-Y PES were the
three dependent variables for the color discrimination sessions.
3.5 Statistical Design
3.5.1 Statistical Design for Perceived Brightness
In the session on perceived brightness, each illuminance level of the SPX3K was compared with
the four illuminance levels of the RevLF, with RevLF to SPX3K illuminance ratios of 80%, 90%,
100%, and 110%. Subjects always judged pairs of light settings, with SPX3K illumination in one
room and RevLF illumination in the other, or, for the null condition trials, identical illumination
in both rooms.
To determine the illuminance ratio of RevLF to SPX3K where brightness was perceived to be
equal, two regression lines can be computed based on percentages of subject votes for the brighter

49
light setting of a pair. This analysis method is further described in 3.6 Experimental Procedures.
When considering a single paired comparison, it would have been undesirable to have all subjects
vote for the same light setting of the pair all the time. This would occur if the brightness
differences were very obviously different, for example by presenting twice as much illuminance
in one room versus the other. Such data would also be indeterminate because it would skew the
slope of the regression lines and the location of the intersection points. To avoid this situation,
three pilot studies were completed before the main experiment to study different illuminance
ratios and to fix those used in the main study. The increments of the pilot study were RevLF to
SPX3K illuminance ratios of: Pilot 1, 60%, 80%, 100%, 120%; Pilot 2, 70%, 85%, 100%, 115%;
and Pilot Study 3, 80%, 90%, 100%, 110%. A separate analysis, not provided, showed that
nearly 100% of the responses favored the higher illuminance when ratios of 60%, 70%, 115%,
and 120% were employed. In the pilot study where 10% increments (i.e. 80%, 90%, 100%,
110%) were employed, it became more difficult for the subjects to make the judgments, and
different judgments for the same pairs of light setting appeared. These increments were therefore
employed for the full study.
The stimulus frequency bias is a possible bias for side-by-side brightness ranking evaluation
mode. The stimulus frequency refers to the distribution of comparison illuminances above and
below the illuminance at which equal brightness is expected. If the distribution is fairly balanced,
having the same number of illuminances above and below the illuminance for equal brightness,
both stimuli will be selected as brighter on a near equal frequency. However, if the distribution is
not balanced, having unequal number of illuminances above and below the illuminance for equal
brightness, one stimulus will tend to be selected brighter more frequently than the other. And the
subjects would tend to respond as the frequency was balanced, which would suggest a difference

50
between two stimuli when it does not exist [74]. In this study, it was expected that the
illuminance ratio of RevLF to SPX3K was between 90% to 100% for equal brightness, so the
same number of ratios were required to above or equal 100% and below or equal 90%.
In order to counter a possible positional bias associated with the side-by-side method, all pairs of
SPX3K and RevLF light settings were presented in left-right and right-left scenarios, as shown in
Figure 3-7. Thus thirty-two pairs were compared between SPX3K and RevLF for each subject,
with eight for each illuminance level of SPX3K. Another eight null conditional pairs were
presented to each subject comprised of four pairs for SPX3K and four pairs for RevLF. For the
null condition trials, the same light setting was presented in both rooms, as shown in Figure 3-2,
such that the response should be based on chance.
Each session began with four practice trials, in which the subject was free to ask questions and
became familiar with the process. In total, each subject made 44 force choice comparisons (4
practice trials + 32 comparison trials + 8 null condition trials). The practice trials were not
randomized; they were instead purposely selected to present the range of conditions the subject
would experience, including the largest illuminance ratio difference and a null condition trial.
Figure 3-7 | Example of light settings provided for counter-balance

51
3.5.2 Statistical Design for Color Discrimination
In the session on color discrimination, each subject finished three FM-100 tests, with one under
each SPD at 300 lux (Note: subjects also performed the FM-100 test under Soft White LED
illumination. Data for that experiment are not reported here). The order of the SPD was
randomized, and under each SPD, the order of the four trays presented to each subject was also
randomized.
3.6 Experimental Procedures
This study was approved by Penn State‘s Institutional Review Board (IRB #35919). Upon arrival,
subjects read a brief description of the experiment, signed an informed consent form, and filled
out a general information survey which included a question about whether or not they had
cataract surgery. The Keystone Visual Skills Test and the 24 Plate Ishihara Color Vision Test
were administered. One male in the younger group, and two males and one female in older group
had abnormal results in the Ishihara Test.
After vision screening, the light settings in both experimental rooms were switched to the first
experiment condition for color discrimination. Before entering the room, the subject experienced
a washout period of two to three minutes, during which they sat in a windowless room
illuminated to 300 lux by 3000K linear fluorescent lamps. Once the washout period was
complete, the subject was escorted into the right room where he or she sat at the table. After
listening to the instruction read by the experimenter, one of the four FM-100 trays was brought
into the room and the caps were shuffled on the table in front of the subject. The instructions were
always read from a script to minimize the variation between subjects. After the experimenter left
the experimental room, the subject was instructed to start arranging the caps. There was no time
limit for the subject to finish each tray, but he or she was given a notification at two minutes.
52
When the subject indicated that he or she had finished arranging the caps, the next tray was
brought in and the previous was taken to be recorded by the experimenter. The order of the trays
shown to the subject was randomized. After finishing all four trays under the first light setting,
the subject was instructed to step out of the room to complete the three-minute washout period
and the light settings in both rooms were switched to the next light setting. The washout period
also allowed for the stabilization of the lighting system. After the washout period, the subject
returned into the room to perform the next FM-100.
After the session on color discrimination, the table used for FM-100 test was removed. Another
three-minute washout period was required. The subject sat outside the experiment room in a
windowless room illuminated to 300 lux with 3000K linear fluorescent lamps, during which the
lamps in both rooms were set at full output to assist with stabilization. Then the subject was
escorted through the felt curtain and seated at the table, which was set against the diving wall
between two rooms. He or she was instructed to adjust the height of the seat to comfortably place
his or her head in the chin and forehead rest. Next, the experimenter read the instructions and
answered questions raised by the subject. The instructions were always read from a script. After
four practice trials, the recorded trials began. The experimenter advanced the light settings to the
next pair according to a pre-written script. The subject was instructed to close his or her eyes
when the lamps were changed to the next pair. This was so that he or she would not compare the
new setting to what was previously seen, and instead focus only on the side-by-side comparisons.
This also helped to ensure that the lamps were stable when the subject first viewed the pair. After
several seconds the subject was instructed to open his or her eyes, then to simply observe while
holding judgment for at least 30 seconds to allow for adaptation to the new settings. The
experimenter prompted the subject after 30 seconds, but he or she was allowed to take as much

53
time as necessary to judge which room appeared brighter. The subject was instructed to make his
or her judgment only based on brightness rather than color difference. The experimenter recorded
the subject‘s response on a form, before moving to the next pair.
After finishing all 40 pairs, the light settings in both rooms were changed to 330 lux, with RevLF
in one room and SPX3K in the other. After 30 seconds, the subject was instructed to stand up and
walk into the rooms. He or she was free to walk back and forth and look around between both
rooms and to judge which room he or she preferred. Specific evaluation criteria were not given to
the subject. The experimenter recorded the subject‘s response and also the reason for the
preference, as explained by the subject. There was no time limit for the subject to make this
judgment or to share observations with the experimenter. The entire procedure took between 1.5
and 2 hours.

54
Chapter 4 Analysis and Results
4.1 Data Reliability: Null Condition Trials and Tests for Bias
As shown in Table 3-5, the average horizontal and vertical illuminance in the left room and right
room were not identical. Across all light settings, the mean horizontal and vertical illuminance in
the left room were 2.07 lux and 0.63 lux lower than the right room at the calibration point. By
presenting all pairs of light settings in both rooms, the effect of the difference was distributed
evenly across all stimuli. Null condition trials were included to establish the prevalence of bias.
The results of these tests are shown in Table 4-1. Overall, the subjects chose the left room 48
percent of the time in the null condition trials. None of the null condition trials had bias, with the
p-value for the Chi-Square Goodness-of-Fit Test larger than 0.05. Even only considering subjects
in each age group, none of the null condition trials had a p-value smaller than 0.05. The largest
difference in horizontal illuminance among null condition trials between two rooms was 5.28 lux,
corresponding to 2.2% of the calibration target; and the largest difference in vertical illuminance
was 3.03 lux, corresponding to 1.8% of the calibration target. These measurements and statistical
findings suggest that the two rooms were very close to each other over the duration of the
experiment.

55
Table 4-1 | Summary data for null condition trials showing percentages of left/right selected. None of
the trials in either age group had a p-value smaller than 0.05; p-values are only shown for the overall
(i.e. age group pooled) category
Null Condition
Trials SPD
Horizontal
Illuminance
(lux)
Left/Right
Age Group
Overall
p-value of the
Chi-Square
Goodness-of-
Fit test Younger Older
1-1 SPX3K 240 Left 43% 43% 43%
0.3017 SPX3K 240 Right 57% 57% 57%
2-2 SPX3K 270 Left 50% 53% 52%
0.7963 SPX3K 270 Right 50% 47% 48%
3-3 SPX3K 300 Left 57% 43% 50%
1.0000 SPX3K 300 Right 43% 57% 50%
4-4 SPX3K 330 Left 57% 47% 52%
0.7963 SPX3K 330 Right 43% 53% 48%
7-7 RevLF 240 Left 40% 43% 42%
0.1967 RevLF 240 Right 60% 57% 58%
10-10 RevLF 270 Left 57% 57% 57%
0.3017 RevLF 270 Right 43% 43% 43%
12-12 RevLF 300 Left 40% 47% 43%
0.3017 RevLF 300 Right 60% 53% 57%
13-13 RevLF 330 Left 43% 40% 42%
0.1967 RevLF 330 Right 57% 60% 59%
Combined null condition trials Left 48% 47% 48%
0.7963 Right 52% 53% 52%
Since the experimental design for the perceived brightness sessions provided complete
counterbalancing, random chance suggests that there should have been an even number of
selections for left/right among all subjects‘ judgments. When disregarding the null condition

56
trials, the left room was selected as brighter 48 percent of the time, which was not statically
different from 50 percent (Chi-Square Goodness-of-Fit Test, p = 0.110)
Because of the experimental design, the position (left/right) of the light setting should have been
independent from the selection made by the subjects. Considering all 16 pairs of light settings
with SPX3K in the left room and RevLF in the right room, the left room was selected 447 times
and the right room was 513 times. For the counterbalanced pairs, with RevLF in the left room and
SPX3K in the right room, the left room was selected 478 times and the right room 482 times. The
Chi-Squared Test of Independence between SPD and location fails to reject the null hypothesis of
independence (p = 0.959). Figure 4-1 provides the data structure for this test when all
comparisons are pooled and Table 4-2 provides individual values for each paired comparison.
Location Sum
Left Right
SPD RevLF 478 513 991
SPX3K 447 482 929
Sum 925 995 1930
Figure 4-1 | Example of Chi-Squared test of independence between SPD and location
(results for all the pairs are summarized in Table 4-2)

57
Table 4-2 | Summary of results for Chi-Squared test of independence. The SPD and location are
statistically independent (p-value>0.05)
Pairs of Light
Settings
Number of
Selection
Pairs of Light
Settings
Number of
Selection p-value of Chi-
Squared test of
independence Left Right Left Right Left Right Left Right
SPX3K 240 lux
RevLF 192 lux
54 6 RevLF 192 lux
SPX3K 240 lux
9 51 0.534
SPX3K 240 lux
RevLF 216 lux
41 19 RevLF 216 lux
SPX3K 240 lux
19 41 1.000
SPX3K 240 lux
RevLF 240 lux
12 48 RevLF 240 lux
SPX3K 240 lux
43 17 0.580
SPX3K 240 lux
RevLF 264 lux
5 55 RevLF 264 lux
SPX3K 240 lux
50 10 0.299
SPX3K 270 lux
RevLF 270 lux
16 44 RevLF 270 lux
SPX3K 270 lux
42 18 0.861
SPX3K 270 lux
RevLF 297 lux
3 57 RevLF 297 lux
SPX3K 270 lux
49 11 0.078
SPX3K 270 lux
RevLF 216 lux
50 10 RevLF 216 lux
SPX3K 270 lux
4 56 0.189
SPX3K 270 lux
RevLF 243 lux
36 24 RevLF 243 lux
SPX3K 270 lux
17 43 0.667
SPX3K 300 lux
RevLF 270 lux
41 19 RevLF 270 lux
SPX3K 300 lux
17 43 0.873
SPX3K 300 lux
RevLF 300 lux
14 46 RevLF 300 lux
SPX3K 300 lux
46 14 1.000
SPX3K 300 lux
RevLF 330 lux
4 56 RevLF 330 lux
SPX3K 300 lux
53 7 0.438
SPX3K 300 lux
RevLF 240 lux
52 8 RevLF 240 lux
SPX3K 300 lux
6 54 0.663
SPX3K 330 lux
RevLF 297 lux
42 18 RevLF 297 lux
SPX3K 330 lux
15 45 0.782
SPX3K 330 lux
RevLF 330 lux
14 46 RevLF 330 lux
SPX3K 330 lux
45 15 0.912
SPX3K 330 lux
RevLF 363 lux
6 54 RevLF 363 lux
SPX3K 330 lux
56 4 0.582
SPX3K 330 lux
RevLF 264 lux
57 3 RevLF 264 lux
SPX3K 330 lux
7 53 0.270
Total 447 513 Total 478 482 0.959

58
Though bias is unavoidable in any experiment, these tests and analyses suggest that the biases
derived from the apparatus, calibration, and experimental design were minimal. All judgments
made by the subjects should be based upon their perception of the light stimuli.
4.2 Perceived Brightness
Judgments made by subjects were recorded as left or right. These data were converted to binary
digits for the statistical analysis, with 0 presenting a vote for SPX3K and 1 for RevLF. The
inverse presentation (for example, Light Setting 1 on the left versus Light Setting 6 on the right,
and Light Setting 6 on the left versus Light Setting 1 on the right) were combined into one data
set, since, as shown above, the location of the stimulus did not affect the judgments made by the
subjects. The counts in each pair were summed and the percentage values computed. Thus, for
each illuminance level of the SPX3K, four percentage values of the subjects‘ votes for the RevLF
were computed (i.e. one for each illuminance ratio), as summarized in Table 4-3. Since the
subject gave a forced-choice response for each pair of light settings, the sum of percentages for
each pair is 100%. Table 4-3 and Table 4-4 summarize the percentage of votes for the younger
and older groups. All the counts in these two tables, except two counts in the shaded cells, are
statistically different from chance according to the Chi-Square Goodness-of-Fit Test (p > 0.05).
Percentage of votes versus illuminance ratio is plotted for each illuminance level of SPX3K, with
Figure 4-2 for younger group and Figure 4-3 for older group. These figures include two
regression lines per plot, one for each lamp type. The illuminance ratio for equal brightness at
each illuminance level of SPX3K can be interpolated as the intersection of the regression lines.
This point represents the illuminance ratio at which we would expect 50% of the votes for

59
RevLF, and 50% of the votes for SPX3K. Figure 4-2 and Figure 4-3 are plots of the data in Table
4-3 and Table 4-4, with one for each tabulated row of data.
Table 4-3 | Percentage of votes in younger group at different illuminance levels of SPX3K
Illuminance
Level of
SPX3K
Percentage of Votes for a SPD at Different Iilluminance Ratios
RevLF SPX3K
80% 90% 100% 110% 80% 90% 100% 110%
240 6.7% 23.3% 73.3% 88.3% 93.3% 76.7% 26.7% 11.77%
270 6.7% 28.3% 63.3% 86.7% 93.3% 71.7% 36.7% 13.3%
300 10.0% 28.3% 70.0% 90.0% 90.0% 71.7% 30.0% 10.0%
330 8.3% 18.3% 75.0% 90.0% 91.7% 81.7% 25.0% 10.0%
Overall 7.9% 24.6% 70.4% 88.8% 92.1% 75.4% 29.6% 11.2%
Table 4-4 | Percentage of votes in older group at different illuminance levels of SPX3K ( The shaded
cells in emboldened values represent results that are not statistically different from chance according
to the Chi-Square Goodness-of-Fit test with p-values > 0.05)
Illuminance
Level of
SPX3K
Percentage of Votes for a SPD at Different Illuminance Ratios
RevLF SPX3K
80% 90% 100% 110% 80% 90% 100% 110%
240 18.3% 40.0% 78.3% 86.7% 81.7% 60.0% 21.7% 13.3%
270 16.7% 40.0% 80.0% 90.0% 83.3% 60.0% 20.0% 10.0%
300 13.3% 31.7% 83.3% 91.7% 86.7% 68.3% 16.7% 8.3%
330 8.3% 36.7% 76.7% 93.3% 91.7% 63.3% 23.3% 6.6%
Overall 14.2% 37.1% 79.6% 90.4% 85.8% 62.9% 20.4% 9.6%

60
(a)
(b)
(c)
(d)
Percentage of votes that stated RevLF brighter than SPX3K
Percentage of votes that stated SPX3K brighter than RevLF
Log. (Percentage of votes that stated RevLF brighter than SPX3K)
Log. (Percentage of votes that stated SPX3K brighter than RevLF)
Figure 4-2 | Plot of percentage of votes versus illuminance ratios at different illuminance levels of
SPX3K for younger group
(a. 240 lux; b. 270 lux; c. 300 lux; d. 330 lux)
0%
20%
40%
60%
80%
100%
120%
0.7 0.8 0.9 1 1.1 1.2
Pe
rce
nta
ge o
f V
ote
s
Illuminance Ratio (RevLF / SPX3K)
0%
20%
40%
60%
80%
100%
120%
0.7 0.8 0.9 1 1.1 1.2
Pe
rce
nta
ge o
f V
ote
s
Illuminance Ratio (RevLF / SPX3K)
0%
20%
40%
60%
80%
100%
120%
0.7 0.8 0.9 1 1.1 1.2
Pe
rce
nta
ge o
f V
ote
s
Illuminance Ratio (RevLF / SPX3K)
0%
20%
40%
60%
80%
100%
120%
0.7 0.8 0.9 1 1.1 1.2
Pe
rce
nta
ge o
f V
ote
s
Illuminance Ratio (RevLF / SPX3K)
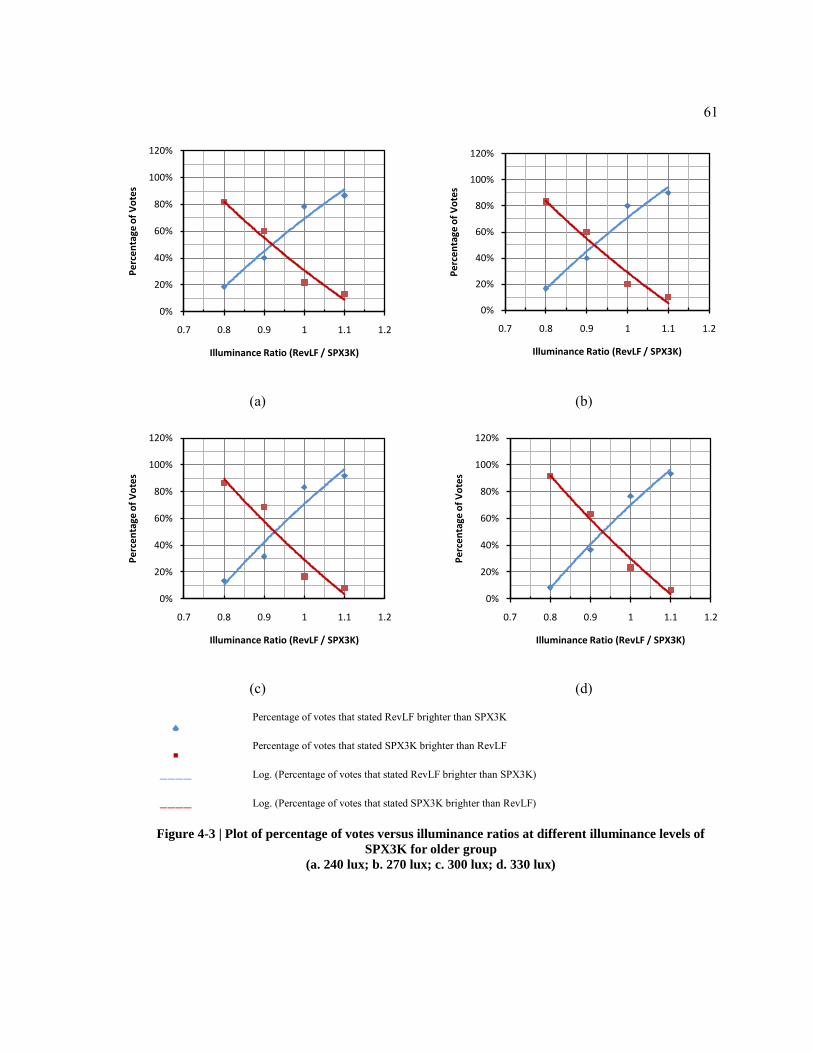
61
(a)
(b)
(c)
(d)
Percentage of votes that stated RevLF brighter than SPX3K
Percentage of votes that stated SPX3K brighter than RevLF
Log. (Percentage of votes that stated RevLF brighter than SPX3K)
Log. (Percentage of votes that stated SPX3K brighter than RevLF)
Figure 4-3 | Plot of percentage of votes versus illuminance ratios at different illuminance levels of
SPX3K for older group
(a. 240 lux; b. 270 lux; c. 300 lux; d. 330 lux)
0%
20%
40%
60%
80%
100%
120%
0.7 0.8 0.9 1 1.1 1.2
Pe
rce
nta
ge o
f V
ote
s
Illuminance Ratio (RevLF / SPX3K)
0%
20%
40%
60%
80%
100%
120%
0.7 0.8 0.9 1 1.1 1.2
Pe
rce
nta
ge o
f V
ote
s
Illuminance Ratio (RevLF / SPX3K)
0%
20%
40%
60%
80%
100%
120%
0.7 0.8 0.9 1 1.1 1.2
Pe
rce
nta
ge o
f V
ote
s
Illuminance Ratio (RevLF / SPX3K)
0%
20%
40%
60%
80%
100%
120%
0.7 0.8 0.9 1 1.1 1.2
Pe
rce
nta
ge o
f V
ote
s
Illuminance Ratio (RevLF / SPX3K)

62
Table 4-5 | Summary of the regression lines and hypothesis testing for the plots of younger and older
groups
Age
Group
Illuminance
of SPX3K
(lux)
Regression Results for
the Percentage of
Votes for RevLF Illuminance
Ratio at the
Intersection
Point
Mean of the
Illuminance
Ratios
p-value of testing
Regression
Model R
2
Equal
Slopes
Equal
Intercepts
Younger
240 y = 2.775
ln(x) + 0.6409
94.9% 95.1%
95.1% 0.975 0.961
270 y = 2.585
ln(x) + 0.6132
98.8% 95.7%
300 y = 2.647
ln(x) + 0.6501
97.1% 94.5%
330 y = 2.831
ln(x) + 0.6442
91.4% 95.0%
Older
240 y = 2.301
ln(x) + 0.6925
95.9% 92.0%
92.4% 0.786 0.961
270 y = 2.458
ln(x) + 0.7100
96.4% 91.8%
300 y = 2.705
ln(x) + 0.7077
93.2% 92.6%
330 y = 2.786
ln(x) + 0.6999
98.4% 93.1%
Table 4-5 summarizes the regression models. The illuminance ratios for equal brightness at each
illuminance of SPX3K were computed. For the subjects in the younger group, the illuminance
ratios of RevLF to SPX3K range within 94.5% to 95.7%; and for the subjects in the older group,
the ratios range within 91.8% to 93.1%. Within each group, the four regression lines are not

63
statistically different from each other (all p-values for testing equal slopes and intercepts are
larger than 0.05), which is also supported by the ANOVA results that show that illuminance ratio
was not a significant factor affecting the percentage of votes. It is possible to pool the data from
these four illuminance levels of the SPX3K for each age group, as shown in the last rows in Table
4-3 and Table 4-4. Figure 4-4(a) and (b) plots and regression lines for the younger and older
subject groups using the pooled data. A Student‘s Paired Sample t-test suggests a statistical
difference in the percentage of votes between the younger and older age groups, indicating a
different illuminance ratio for equal brightness. The illuminance ratios of the intersection points
are 95.1% for the younger group and 92.4% for the older group.
(a)
(b)
Percentage of votes that stated RevLF brighter than SPX3K
Percentage of votes that stated SPX3K brighter than RevLF
Log. (Percentage of votes that stated RevLF brighter than SPX3K)
Log. (Percentage of votes that stated SPX3K brighter than RevLF)
Figure 4-4 | Plot of percentage of votes versus illuminance ratios (a. younger age group; b. older age
group)
0%
20%
40%
60%
80%
100%
120%
0.7 0.8 0.9 1.0 1.1 1.2
Pe
rce
nta
ge o
f V
ote
s
Illuminance Ratio (RevLF / SPX3K)
0%
20%
40%
60%
80%
100%
120%
0.7 0.8 0.9 1.0 1.1 1.2
Pe
rce
nta
ge o
f V
ote
s
Illuminance Ratio (RevLF / SPX3K)

64
Thus, within an illuminance range of 240 to 330 lux, these data suggest that equal brightness will
occur in an environment illuminated with RevLF when they provide 5% (for occupants of ~ 20
years) and 8% (for occupants of ~ 80 years) lower illuminance than a similar environment
illuminated with SPX3K. More than likely, for occupants between the ages of 20 and 80, the
illuminance could be lowered within the range of 5 to 8%. Since the trends were so stable at 240,
270, 300 and 330 lux, and because all of these are conditions of photopic adaptation, we would
expect to find similar ratios over a wider range of photopic conditions.
Cataract Surgery
Twenty of the subjects in the older group had had cataract surgery and their responses can be
analyzed against those that had not. Summary tables and figures are provided as Figure 4-6,
Figure 4-7, Table 4-6, and Table 4-7.
Table 4-6 | Percentage of votes of 10 older subjects without cataract surgery at different illuminance
levels of SPX3K
Illuminance
Level of
SPX3K
Percentage of Votes for a SPD at Different Illuminance Ratios
RevLF SPX3K
80% 90% 100% 110% 80% 90% 100% 110%
240 20.0% 40.0% 75.0% 90.0% 80.0% 60.0% 25.0% 10.0%
270 15.0% 40.0% 70.0% 95.0% 85.0% 60.0% 30.0% 5.0%
300 15.0% 20.0% 90.0% 95.0% 85.0% 80.0% 10.0% 5.0%
330 10.0% 35.0% 80.0% 95.0% 90.0% 65.0% 20.0% 5.0%
Overall 15.0% 33.8% 78.8% 93.8% 85.0% 66.2% 21.2% 6.2%

65
Table 4-7 | Percentage of votes of 20 older subjects with cataract surgery, including three with
abnormal color vision, at different illuminance levels of SPX3K
Illuminance
Level of
SPX3K
Percentage of Votes for a SPD at Different Illuminance Ratios
RevLF SPX3K
80% 90% 100% 110% 80% 90% 100% 110%
240 18.0% 40.0% 80.0% 85.0% 82.0% 60.0% 20.0% 15.0%
270 18.0% 40.0% 85.0% 88.0% 82.0% 60.0% 15.0% 12.0%
300 13.0% 38.0% 80.0% 90.0% 87.0% 62.0% 20.0% 10.0%
330 8.0% 38.0% 75.0% 93.0% 92.0% 62.0% 25.0% 7.0%
Overall 13.8% 38.8% 80.0% 88.8% 86.2% 61.2% 20.0% 11.2%
(a)
(b)
0%
20%
40%
60%
80%
100%
120%
0.7 0.8 0.9 1 1.1 1.2
Pe
rce
nta
ge o
f V
ote
s
Illuminance Ratio (RevLF / SPX3K)
0%
20%
40%
60%
80%
100%
120%
0.7 0.8 0.9 1 1.1 1.2
Pe
rce
nta
ge o
f V
ote
s
Illuminance Ratio (RevLF / SPX3K)

66
(c)
(d)
Percentage of votes that stated RevLF brighter than SPX3K
Percentage of votes that stated SPX3K brighter than RevLF
Log. (Percentage of votes that stated RevLF brighter than SPX3K)
Log. (Percentage of votes that stated SPX3K brighter than RevLF)
Figure 4-5 | Plot of percentage of votes versus illuminance ratios at different illuminance levels of
SPX3K for the older subjects without cataract surgery
(a. 240 lux; b. 270 lux; c. 300 lux; d. 330 lux)
(a)
(b)
0%
20%
40%
60%
80%
100%
120%
0.7 0.8 0.9 1 1.1 1.2
Pe
rce
nta
ge o
f V
ote
s
Illuminance Ratio (RevLF / SPX3K)
0%
20%
40%
60%
80%
100%
120%
0.7 0.8 0.9 1 1.1 1.2
Pe
rce
nta
ge o
f V
ote
s
Illuminance Ratio (RevLF / SPX3K)
0%
20%
40%
60%
80%
100%
120%
0.7 0.8 0.9 1 1.1 1.2
Pe
rce
nta
ge o
f V
ote
s
Illuminance Ratio (RevLF / SPX 3000K)
0%
20%
40%
60%
80%
100%
120%
0.7 0.8 0.9 1 1.1 1.2
Pe
rce
nta
ge o
f V
ote
s
Illuminance Ratio (RevLF / SPX 3000K)

67
(c)
(d)
Percentage of votes that stated RevLF brighter than SPX3K
Percentage of votes that stated SPX3K brighter than RevLF
Log. (Percentage of votes that stated RevLF brighter than SPX3K)
Log. (Percentage of votes that stated SPX3K brighter than RevLF)
Figure 4-6 | Plot of percentage of votes versus illuminance ratios at different illuminance levels of
SPX3K for the older subjects with cataract surgery
(a. 240 lux; b. 270 lux; c. 300 lux; d. 330 lux)
0%
20%
40%
60%
80%
100%
120%
0.7 0.8 0.9 1 1.1 1.2
Pe
rce
nta
ge o
f V
ote
s
Illuminance Ratio (RevLF / SPX 3000K)
0%
20%
40%
60%
80%
100%
120%
0.7 0.8 0.9 1 1.1 1.2
Pe
rce
nta
ge o
f V
ote
s
Illuminance Ratio (RevLF / SPX 3000K)
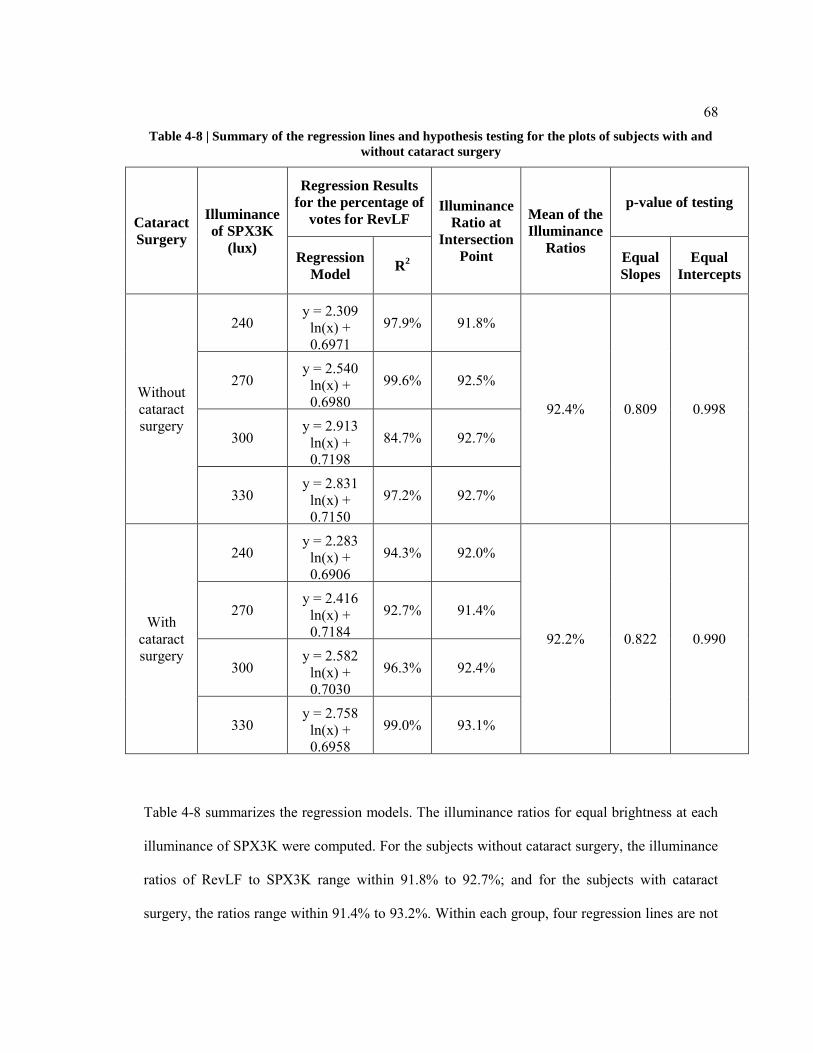
68
Table 4-8 | Summary of the regression lines and hypothesis testing for the plots of subjects with and
without cataract surgery
Cataract
Surgery
Illuminance
of SPX3K
(lux)
Regression Results
for the percentage of
votes for RevLF Illuminance
Ratio at
Intersection
Point
Mean of the
Illuminance
Ratios
p-value of testing
Regression
Model R
2
Equal
Slopes
Equal
Intercepts
Without cataract surgery
240 y = 2.309
ln(x) + 0.6971
97.9% 91.8%
92.4% 0.809 0.998
270 y = 2.540
ln(x) + 0.6980
99.6% 92.5%
300 y = 2.913
ln(x) + 0.7198
84.7% 92.7%
330 y = 2.831
ln(x) + 0.7150
97.2% 92.7%
With cataract surgery
240 y = 2.283
ln(x) + 0.6906
94.3% 92.0%
92.2% 0.822 0.990
270 y = 2.416
ln(x) + 0.7184
92.7% 91.4%
300 y = 2.582
ln(x) + 0.7030
96.3% 92.4%
330 y = 2.758
ln(x) + 0.6958
99.0% 93.1%
Table 4-8 summarizes the regression models. The illuminance ratios for equal brightness at each
illuminance of SPX3K were computed. For the subjects without cataract surgery, the illuminance
ratios of RevLF to SPX3K range within 91.8% to 92.7%; and for the subjects with cataract
surgery, the ratios range within 91.4% to 93.2%. Within each group, four regression lines are not

69
statistically different from each other (all p-values for testing equal slopes and intercepts are
larger than 0.05), which is also supported by the ANOVA results that show that illuminance ratio
was the only factor affecting the percentage of votes. It is possible to pool the data from these
four illuminance levels of the SPX3K for each group, as shown in the last rows in Table 4-6 and
Table 4-7. Figure 4-7 (a) and (b) plot the data and regression lines for the older subjects with and
without cataract surgery using the pooled data.
A Student‘s Paired Sample t-test suggest no statistical difference in the responses of the older
subjects with and without cataract surgery, indicating the same illuminance ratio for equal
brightness. Irrespective of whether or not the older subject had cataract surgery, the illuminance
ratio for equal brightness is 92.4%, which is statistically different from 100%.
To conclude, within an illuminance range of between 240 to 330 lux, these data suggest that equal
brightness will occur in an environment illuminated with RevLF when they provide about 8%
lower illuminance than the SPX3K for occupants with a mean age of ~ 80. This result was not
affected by whether or not the older subject had cataract surgery.
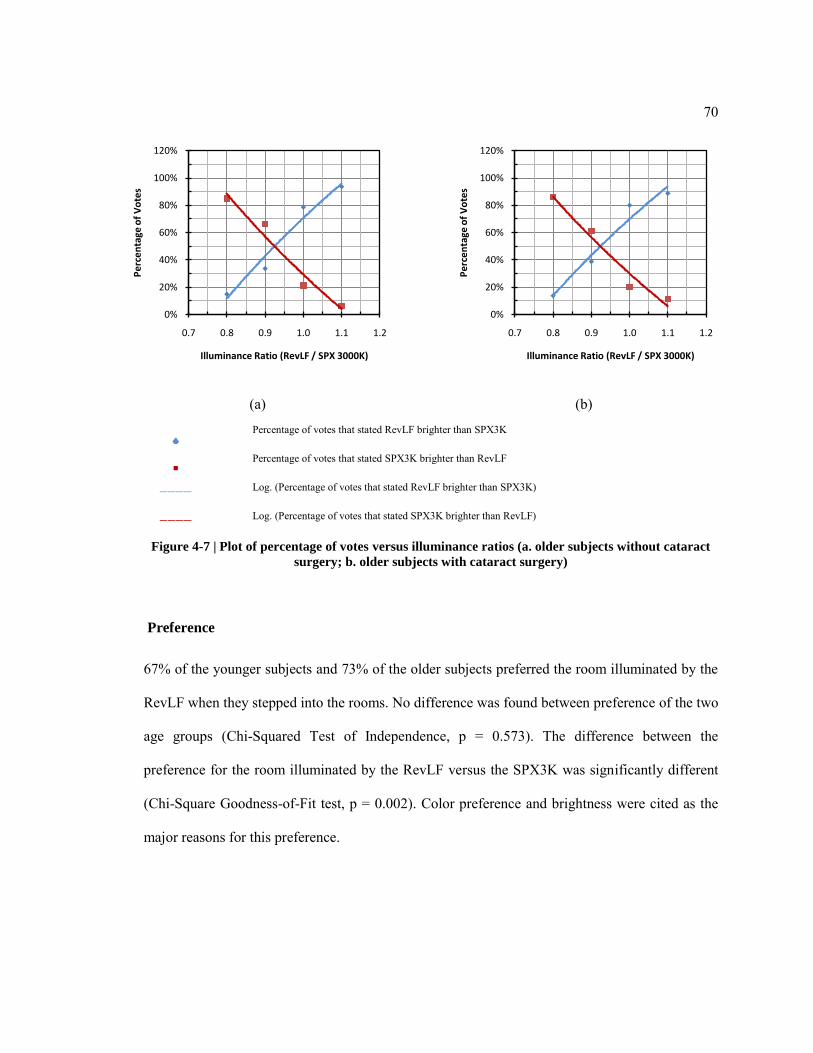
70
(a)
(b)
Percentage of votes that stated RevLF brighter than SPX3K
Percentage of votes that stated SPX3K brighter than RevLF
Log. (Percentage of votes that stated RevLF brighter than SPX3K)
Log. (Percentage of votes that stated SPX3K brighter than RevLF)
Figure 4-7 | Plot of percentage of votes versus illuminance ratios (a. older subjects without cataract
surgery; b. older subjects with cataract surgery)
Preference
67% of the younger subjects and 73% of the older subjects preferred the room illuminated by the
RevLF when they stepped into the rooms. No difference was found between preference of the two
age groups (Chi-Squared Test of Independence, p = 0.573). The difference between the
preference for the room illuminated by the RevLF versus the SPX3K was significantly different
(Chi-Square Goodness-of-Fit test, p = 0.002). Color preference and brightness were cited as the
major reasons for this preference.
0%
20%
40%
60%
80%
100%
120%
0.7 0.8 0.9 1.0 1.1 1.2
Pe
rce
nta
ge o
f V
ote
s
Illuminance Ratio (RevLF / SPX 3000K)
0%
20%
40%
60%
80%
100%
120%
0.7 0.8 0.9 1.0 1.1 1.2
Pe
rce
nta
ge o
f V
ote
s
Illuminance Ratio (RevLF / SPX 3000K)
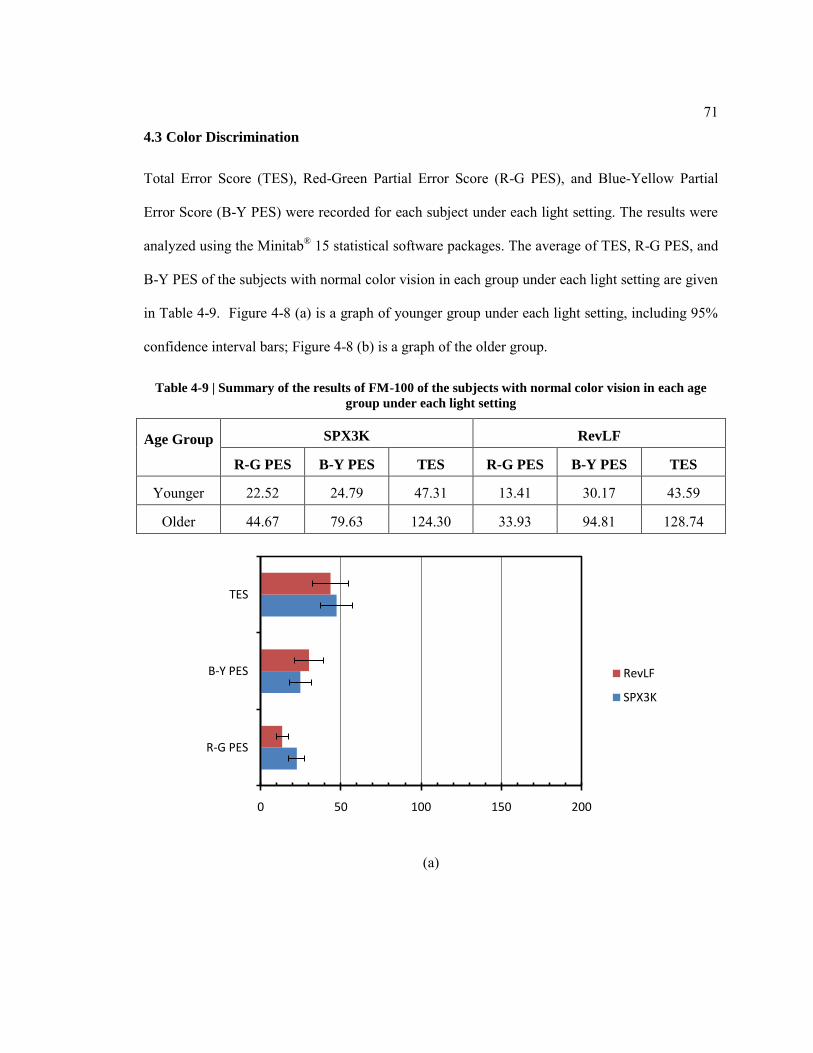
71
4.3 Color Discrimination
Total Error Score (TES), Red-Green Partial Error Score (R-G PES), and Blue-Yellow Partial
Error Score (B-Y PES) were recorded for each subject under each light setting. The results were
analyzed using the Minitab® 15 statistical software packages. The average of TES, R-G PES, and
B-Y PES of the subjects with normal color vision in each group under each light setting are given
in Table 4-9. Figure 4-8 (a) is a graph of younger group under each light setting, including 95%
confidence interval bars; Figure 4-8 (b) is a graph of the older group.
Table 4-9 | Summary of the results of FM-100 of the subjects with normal color vision in each age
group under each light setting
Age Group SPX3K RevLF
R-G PES B-Y PES TES R-G PES B-Y PES TES
Younger 22.52 24.79 47.31 13.41 30.17 43.59
Older 44.67 79.63 124.30 33.93 94.81 128.74
(a)
0 50 100 150 200
R-G PES
B-Y PES
TES
RevLF
SPX3K
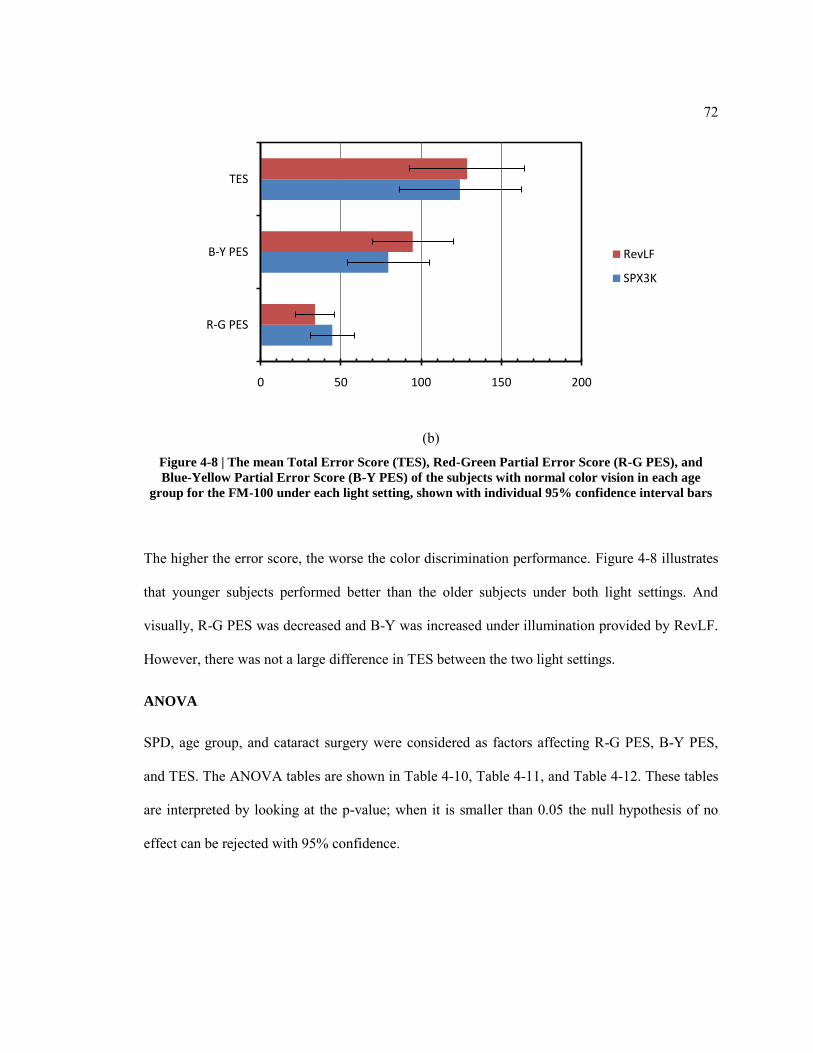
72
(b) Figure 4-8 | The mean Total Error Score (TES), Red-Green Partial Error Score (R-G PES), and
Blue-Yellow Partial Error Score (B-Y PES) of the subjects with normal color vision in each age
group for the FM-100 under each light setting, shown with individual 95% confidence interval bars
The higher the error score, the worse the color discrimination performance. Figure 4-8 illustrates
that younger subjects performed better than the older subjects under both light settings. And
visually, R-G PES was decreased and B-Y was increased under illumination provided by RevLF.
However, there was not a large difference in TES between the two light settings.
ANOVA
SPD, age group, and cataract surgery were considered as factors affecting R-G PES, B-Y PES,
and TES. The ANOVA tables are shown in Table 4-10, Table 4-11, and Table 4-12. These tables
are interpreted by looking at the p-value; when it is smaller than 0.05 the null hypothesis of no
effect can be rejected with 95% confidence.
0 50 100 150 200
R-G PES
B-Y PES
TES
RevLF
SPX3K

73
These results suggest that age and cataract surgery are significant factors affecting color
discrimination performance on the FM-100 test for subjects with normal color vision, including
discrimination ability for red-green colors, yellow-blue colors, and the overall performance. The
older subjects always had worse performance than the younger subjects. This result provides
statistical confirmation of the plots given in Figure 4-8. This result is consistent with previous
results found by others [66, 68, 69].
Table 4-10 | Analysis of variance for R-G PES
Source Df Seq SS Adj SS Adj MS F p-value
Cataract 1 730.3 4730.7 4730.7 8.85 0.004
Age 1 16724.2 16724.2 16724.2 31.29 <0.001
SPD 1 2740.3 2740.3 2740.3 5.13 0.026
Error 108 57720.1 57720.1 534.4
Total 111 77915.0
Table 4-11 | Analysis of Variance for B-Y PES
Source Df Seq SS Adj SS Adj MS F p-value
Cataract 1 5331 38530 38530 20.63 <0.001
Age 1 132998 132998 132998 71.21 <0.001
SPD 1 2860 2860 2860 1.53 0.219
Error 108 201722 201722 1868
Total 111 342911
Table 4-12 | Analysis of Variance for TES
Source Df Seq SS Adj SS Adj MS F p-value
Cataract 1 10007 70262 70262 17.76 <0.001
Age 1 244047 244047 244047 61.68 <0.001
SPD 1 1 1 1 0 0.986
Error 108 427298 427298 3956

74
Total 111 681354
Student’s Paired Sample t-test
In order to improve the precision of the analysis, Student‘s Paired Sample t-tests were employed
for subgroups of the sample: younger subjects; older subjects with cataract surgery; and older
subjects without cataract surgery. Each subject was regarded as a block in these analyses. Table
4-13 summarizes the results of these analyses.
Table 4-13 | Summary of the results of Student’s Paired Sample t-tests
Group N
Student’s
Paired Sample
t-test
Mean
Difference
(RevLF
minus
SPX3K)
t-value p-value
Younger subjects 29
R-G PES -9.10 -4.51 <0.001
B-Y PES 5.38 1.69 0.102
TES -3.72 -1.02 0.316
Older subjects with cataract
surgery 17
R-G PES -11.41 -3.03 0.008
B-Y PES 13.24 2.06 0.056
TES 1.82 0.19 0.848
Older subjects without cataract
surgery 10
R-G PES -9.60 -1.61 0.142
B-Y PES 18.5 1.75 0.114
TES 8.9 0.66 0.524
Clearer results can be drawn from the Student‘s Paired Sample t-tests:
The RevLF was able to decrease the Red-Green Partial Error Score (i.e. improve the
color discrimination ability for red and green colors of the FM-100 test) in comparison to

75
the SPX3K for the subjects below 25 years of age and the subjects with cataract surgery
above 60 years of age.
No statistically significant effect was found between the RevLF and SPX3K on overall
color discrimination ability or the ability to discriminate blue and yellow colors.
Color-deficient Subjects
Four subjects in this study were tested to have abnormal color vision, with one in the younger
group and three in the older group. Table 4-14 summarizes the FM-100 results of the color-
deficient subjects in each age group. Though some differences can be observed between two
SPDs, the sample size was not large enough to make statistically sound inferences.
Table 4-14 | Summary of the results of FM-100 of the color-deficient subjects in each age group
under each light setting
Age group
SPX3K RevLF
R-G
PES
B-Y
PES TES
R-G
PES
B-Y
PES TES
Younger 285 259 544 296 308 604
Older 83.7 132.3 216.0 78.3 185.7 264.0
Cataract Surgery
Figure 4-9 (a) graphs the error scores for the older subjects with cataract surgery under each light
setting, with 95% confidence interval bars; Figure 4-9 (b) is a graph of the older subjects without
cataract surgery. Cataract surgery was a significant factor affecting color discrimination ability.
The subjects with cataract surgery performed better than those without cataract surgery, having
lower R-G PES, B-Y PES, and TES.

76
(a)
(b)
Figure 4-9 | The mean Total Error Score (TES), Red-Green Partial Error Score (R-G PES), and
Blue-Yellow Partial Error Score (B-Y PES) of the subjects in older group for the FM-100 under each
light setting, shown with individual 95% confidence interval bars.
0 50 100 150 200 250 300
R-G PES
B-Y PES
TES
RevLF
SPX3K
0 50 100 150 200 250 300
R-G PES
B-Y PES
TES
RevLF
SPX3K

77
Chapter 5 Discussion
5.1 Perceived Brightness
The benefits of the RevLF, in terms of brightness-per-lumen and enhanced red-green color
discrimination, can be considered in terms of the opponent process of the visual system
established by De Valois [75], as shown in Figure 5-1.
Figure 5-1 | Neural Opponent Signals & SPDs of two lamps
The SPX3K has little energy within the ‗green‘ spectral region from 500 to 550 nm. Modification
on this spectrum to help the RevLF SPD increase the red-green opponent-process signals (Figure
5-2(a)), while slightly reducing the blue-yellow opponent-process signals (Figure 5-2(b)). By
scaling the two lamps to provide the same amount of lumens, the ratio of the total red-green
opponent-process signals of RevLF to SPX3K is 1.22 and the ratio of the total blue-yellow is
1.01.
-2.5
-2
-1.5
-1
-0.5
0
0.5
1
1.5
2
2.5
350 400 450 500 550 600 650 700 750 800Ou
tpu
t
Wavelength (nm)
Red-Green Opponent
Blue-Yellow Opponent
RevLF
SPX3K

78
(a)
(b)
SPX3K
RevLF
Figure 5-2 | Opponent signals adapted to the SPX3K and the RevLF
( a. Red-green opponent signal; b. Blue-yellow opponent signal )
-0.5
0
0.5
1
1.5
2
350 400 450 500 550 600 650 700 750 800
Sign
al
Wavelength (nm)
-2
-1.5
-1
-0.5
0
0.5
350 400 450 500 550 600 650 700 750 800
Sign
al
Wavelength (nm)
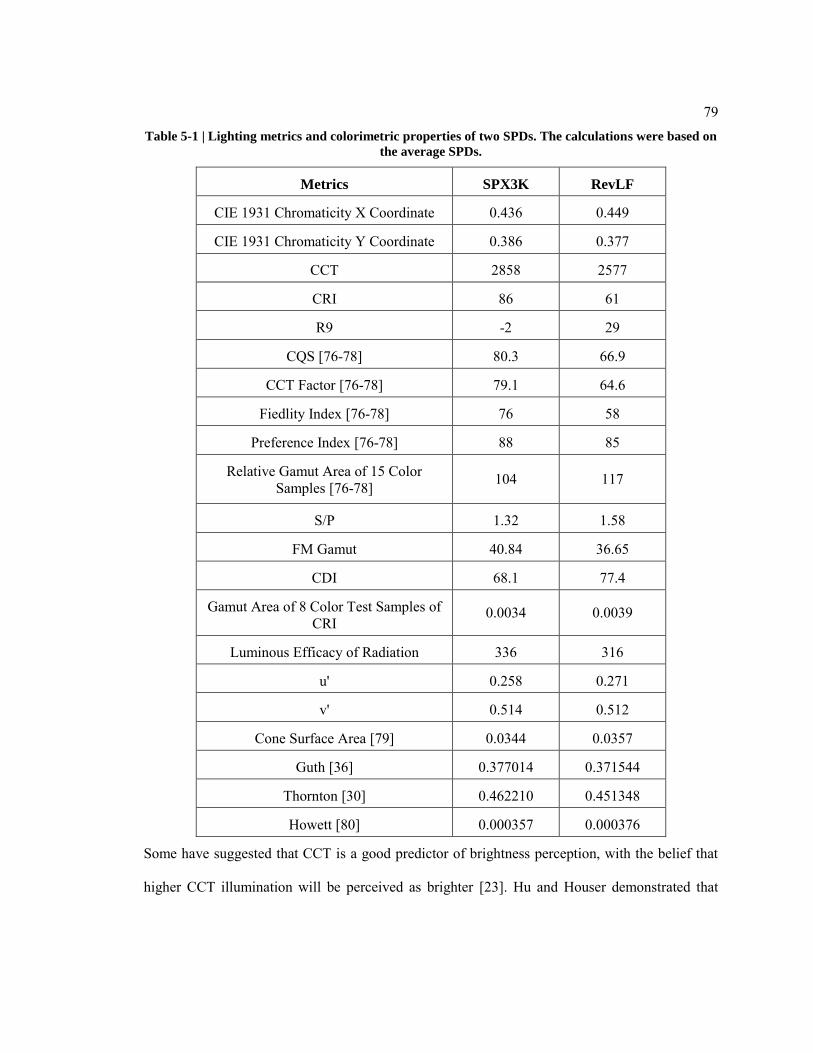
79
Table 5-1 | Lighting metrics and colorimetric properties of two SPDs. The calculations were based on
the average SPDs.
Metrics SPX3K RevLF
CIE 1931 Chromaticity X Coordinate 0.436 0.449
CIE 1931 Chromaticity Y Coordinate 0.386 0.377
CCT 2858 2577
CRI 86 61
R9 -2 29
CQS [76-78] 80.3 66.9
CCT Factor [76-78] 79.1 64.6
Fiedlity Index [76-78] 76 58
Preference Index [76-78] 88 85
Relative Gamut Area of 15 Color Samples [76-78] 104 117
S/P 1.32 1.58
FM Gamut 40.84 36.65
CDI 68.1 77.4
Gamut Area of 8 Color Test Samples of CRI
0.0034 0.0039
Luminous Efficacy of Radiation 336 316
u' 0.258 0.271
v' 0.514 0.512
Cone Surface Area [79] 0.0344 0.0357
Guth [36] 0.377014 0.371544
Thornton [30] 0.462210 0.451348
Howett [80] 0.000357 0.000376
Some have suggested that CCT is a good predictor of brightness perception, with the belief that
higher CCT illumination will be perceived as brighter [23]. Hu and Houser demonstrated that

80
CCT and brightness perception are not related [28], and recent work reasserts that they are not
related [48]. Although this study did not set out to demonstrate a specific hypothesis about CCT,
it provides further evidence that environments illuminated with lamps of lower CCT can be
perceived as brighter than environments illuminated with lamps of higher CCT when V(λ)-based
quantities are equal.
In a review of lamp color properties and brightness perception, Fotios concluded that rooms
illuminated with lamps of higher CRI would appear brighter than those illuminated with lamps of
lower CRI when CCT is similar [29]. However, his analysis also suggested that no general
relationship existed between CRI and brightness perception. The ratio of scotopic to photopic
lumens (a.k.a. S/P ratio) has been promoted by some to predict brightness perception, using the
expression P(S/P)0.5 [81]. Houser and his colleagues illustrated the failure of this expression to
predict the brightness perception [48]. The results found in this study indicate 95% and 92%
illuminance ratio of RevLF to SPX3K will have equal brightness, which is supposed to have
equal P(S/P)0.5 for two lamps based on this theory. The ratios of the P(S/P)0.5 of RevLF to SPX3K
are 1.04 and 1.01 for these two illumiannce ratios, which are not significantly different from 1.
Sometimes, P(S/P)0.5 can be used to predict brightness, like the lamp pairs used in this study, but
it cannot support the theory that P(S/P)0.5 is a good predictor of brightness.
Boyce proposed an equation based on the gamut area of the eight CIE test sample colors
employed in the computation of CRI as a predictor of the illuminance ratio of two lamps that will
yield equal brightness perception [82]:
𝐸1𝐸2= 1.0− 0.6 log10(
𝐺1𝐺2)
Where 𝐸1𝐸2
is the illuminance ratio of two lamps;

81
G1 and G2 are the gamut areas of the two lamps.
The illuminance ratio of RevLF to SPX3K computed from this equation is 96.5%. Though there
is some difference between the results from this equation and from this study, this study still
supported that the lamps having larger gamut area of the eight CIE test sample colors are
perceived brighter.
Both of the S/P ratio and the Gamut Area theory are correctly predicting the direction of the
brightness perception, but the magnitudes of the improvement are not accurate.
Thornton established the prime color theory, which first evolved from his work in fluorescent
lamp development, and was later refined with his experiments that employed heterochromatic and
Maxwell method color matching. One form of heterochromatic brightness matching employs two
visual-fields and four spectral lights, two in each visual-field. Consider any three randomly
selected spectral lights that do not form a line on a chromaticity diagram. If two illuminate one
visual field (i.e. the reference field), and the third is placed in the other visual field (i.e. the test
field), a fourth spectral light must be added to the test field in order to create a visual match.
Thornton showed that when the two illuminants are visually matched in brightness and color by
adjusting the relative powers of the four spectral lights, the least amount of power is required
when that fourth (variable) spectral light it is at or near 450, 530, or 610 nm. He coined the term
‗prime-color‘ for these three spectral regions, and suggested that these represent the peak
underlying spectral sensitivities of the eye-brain system [83]. In this same body of work,
Thornton identified the intermediate spectral regions at or near 500 and 570-580 nm as being
deleterious to brightness and the ability to make color matches. These spectral regions required
the greatest amount of power to make visual matches. He coined the term ‗anti-prime‘ for these
spectral regions [84]. Thornton noted that the anti-prime spectral region near 580 nm was

82
especially harmful to color and brightness perceptions [32]. Perhaps counterintuitively, his results
suggest that removing optical radiation from this spectral region would enhance color and
brightness perception, which is incompatible with the additivity of luminance.
Both of the RevLF and the SPX3K lamps have spectral peaks at 435 and 610 nm, which are near
the nominally ‗blue‘ and ‗red-orange‘ prime-color spectral regions. The SPX3K also has peaks at
490, 545, and 585 nm, while the RevLF has two peaks at 515 and 545 nm. After scaling the SPD
of the SPX3K and RevLF to produce the same amount of lumens, the power contained within the
SPD of the SPX3K lamp from 450 to 600 nm is 1.08 times the power of the RevLF. The peaks of
the SPX3K SPD that are near 490 and 585 nm are near the anti-prime spectral regions.
Conversely, the two peaks of the RevLF SPD are near the central prime-color region, which,
according to Thornton‘s prime-color theory, maximizes brightness perception per watt of optical
radiation. The findings in this study are consistent with Thornton‘s prime-color theory.
Three linear brightness models are also listed in Table 5-1, all of which are based on the
opponent-process model of the visual system. Guth and Thornton‘s models failed to predict the
direction of the brightness trend that we found. These linear brightness models were developed
more than 25 years ago. It is now widely agreed that brightness perception is non-linear. Still,
even a non-linear model should be expected to correctly order SPDs presented at constant
luminance, the relationship between opponent signals and perception of brightness needs further
investigation.
As people age, the visual system changes gradually, including changes to the lens, vitreous and
aqueous humors, retina, and range of pupil dilation and constriction. These changes should be
expected to affect brightness perception, color discrimination, visual acuity, and non-visual
biological responses. The transmittance of the lens is an especially important consideration,

83
especially in the short wavelengths. Our data suggests that the RevLF lamp would be more
beneficial, in terms of brightness perception, to seniors than to younger people RevLF. This may
be because the RevLF emits proportionally more radiation in short-wavelength region, which
may explain why the older subjects required lower illuminance for equal brightness, in
comparison to the younger subjects.
Cataract surgery is the removal of the natural lens of the eye. An artificial intraocular lens implant
is inserted into the eye after the surgery. This lens removal and replacement increases
transmittance, but this improvement in optical performance is not the only change. The biological
performance of the eye may also be improved, such as a reduction in dry eye [85]. Ikeda
mentioned that it was natural to suppose that the older people above 71.9 years of age had the
cataract in their eyes, though it might not be clear in the ophthalmoscope test [86].
Ikeda asked one subject to perform heterochromatic brightness matching before and after
cataract surgery [86]. Some differences were found between the results before and after the
surgery on the right eye, while no difference was found on the left eye. Kitakawa showed that the
length of time after the cataract surgery affects the color appearance of the objects to the
subjects, especially due to optical radiation in the short-wavelength region [87]. Different types of
intraocular lenses have different transmission properties. All of these factors may contribute to
the fact that cataract surgery had no effect on the illuminance ratio for equal brightness in this
study.
The efficacy of a lamp is defined as the ratio of the total luminous flux emitted by the lamp to the
total input power, which is expressed in lumens per watt (lm/W). For most conventional light
sources, lamp efficacy is the product of three components: radiant efficiency, radiation efficiency,
and luminous efficacy of radiation (LER). The radiant efficiency is defined as the ratio of the

84
radiant power to the total power consumed by the lamp. The radiation efficiency is defined as the
ratio of the radiant power in the visible region to the total power radiated by the lamp. LER is
defined as the ratio of the total luminous flux emitted to the total power within the visible region.
LER depends only on the SPD of the lamp in the visible spectrum.
The LER of the RevLF lamp is 94% of the LER of the SPX3K lamp. Coupled with the result that
the RevLF required 5 to 8% lower illuminance than the SPX3K for equal brightness, the RevLF
could theoretically provide equivalent brightness perception with 11 to 14% fewer watts, but only
if the conversion efficiency of both lamps were equivalent. However, the efficacy of the RevLF
lamp is only 79% of the SPX3K lamp. On the basis of brightness perception per input watt, the
advantage brought by the SPD of the RevLF is not offset by its lower efficacy. Said another way,
though a room illuminated with RevLF lamps requires a lower illuminance than a room
illuminated with SPX3K lamps when equal brightness is desired, the lower illuminance still
requires more power.
Though brightness is an important criterion for design, it may not always be the sole or even
primary consideration. Preference is important too. After the side-by-side comparison of
brightness, each subject stepped into the rooms to evaluate personal preference. The question
heard by the subjects was ―which room do you prefer‖, so the responses and reasons given by the
subjects should reflect the subjects‘ overall impression and feeling. Most subjects preferred the
room illuminated by the RevLF, citing color and/or brightness. The major reasons given by those
who preferred the room illuminated by the SPX3K were the same: color and brightness. Most of
the subjects who preferred the color of the room illuminated by the SPX3K were Asian, since
they generally prefer higher CCT [88]. Some of the subjects who preferred the room illuminated
by the SPX3K stated that the room illuminated by the RevLF was too bright. The illuminance

85
level was 330 lux when the subjects were asked to make a choice based on preference, which was
the highest illuminance employed in the study. It is possible that a higher percentage would have
preferred the room illuminated by the RevLF lamps if the forced choice comparison was made at
an illuminance of 300 or 270 lux.
Both the brightness comparisons and preference judgments took place in a neutral grey
environment, with grey walls, white ceilings, and grey carpet. The RevLF does not only increase
the red-green opponent signals (which likely contributes to increased brightness perception), it
also increases the red-green color contrast of lighted objects. If the evaluations had been
performed in a colorful environment, it is possible that the RevLF would have had an even
greater advantage. It is plausible that the same level of clarity and satisfaction could be reached at
a lower illuminance with a lamp type having SPD that enhances chromatic contrast by enhancing
the opponent signals. Such visual phenomenon have the potential to reduce energy if they can be
achieved at the same conversion efficiency as lamp designs optimized for V(λ) and CRI.
5.2 Color Discrimination
No statistical difference of TES was found between the RevLF and SPX3K lamps for either age
group, indicating similar color discrimination performance as characterized by the FM-100 test.
CDI, CRI, Gamut Area, and Farnsworth Munsell (FM) Gamut Area for the RevLF and SPX3K
lamps are listed in Table 5-1, predicting unequal colorimetric performance. The failure of the
CRI, CDI, or FM Gamut Area to predict TES is consistent with the results found by Royer and
his colleagues, who found that neither CRI, CDI, or FM Gamut Area was able to correctly order,
let alone correlate with, the TES of the FM-100 test under four types of illumination (i.e. two
types of linear fluorescent, tri-band LED, halogen). They questioned the concept of using gamut
area to characterize color discrimination [63].

86
R9 is one of the special indices in the CRI system; it is intended to characterize the ability of an
illuminant to render saturated reds. The SPX3K has an R9 value of -2, while the RevLF has a
value of 29. The difference in R9 indicates that the RevLF illumination is more similar to the
blackbody reference than the SPX3K illumination. Fidelity index and preference index are two
special indices in the CQS system established by NIST [76-78]. Fidelity index is calculated
without the saturation factor; while the preference index gets credit for increase of saturation. By
comparing the fidelity indices and the preference indices of the two lamps, it can be seen that the
RevLF gets more benefit when saturation is considered.
Figure 5-3 illustrates the gamut areas of the 85 FM samples under SPX3K and RevLF
illumination in the CIE 1960 UCS; the two lamps shift the gamut area in different ways. The
SPX3K shifts and expands the gamut toward violet / blue and yellow, while the RevLF shifts and
expands the gamut toward red. The difference between the gamut areas in the red region is
sharper than that in the violet / blue and yellow regions. The sharpness of the regional gamut
differences may account for why the R-G PES was statistically better under RevLF illumination,
but the B-Y PES was not.
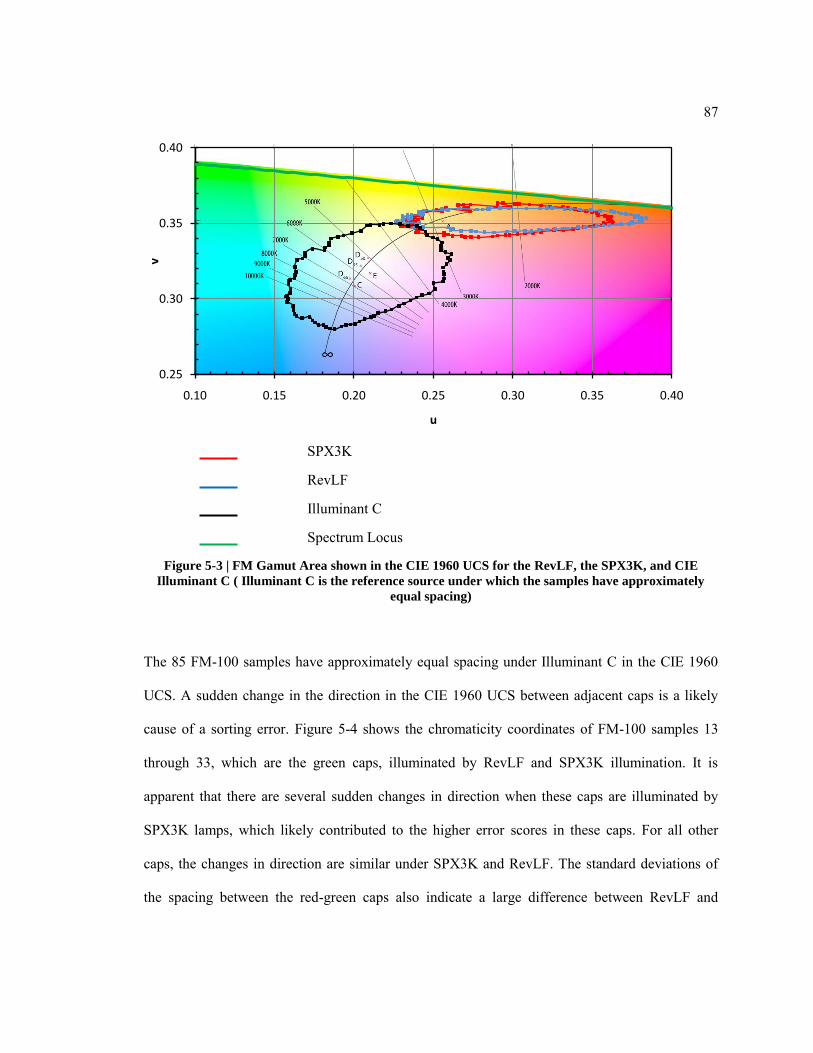
87
SPX3K
RevLF
Illuminant C
Spectrum Locus
Figure 5-3 | FM Gamut Area shown in the CIE 1960 UCS for the RevLF, the SPX3K, and CIE
Illuminant C ( Illuminant C is the reference source under which the samples have approximately
equal spacing)
The 85 FM-100 samples have approximately equal spacing under Illuminant C in the CIE 1960
UCS. A sudden change in the direction in the CIE 1960 UCS between adjacent caps is a likely
cause of a sorting error. Figure 5-4 shows the chromaticity coordinates of FM-100 samples 13
through 33, which are the green caps, illuminated by RevLF and SPX3K illumination. It is
apparent that there are several sudden changes in direction when these caps are illuminated by
SPX3K lamps, which likely contributed to the higher error scores in these caps. For all other
caps, the changes in direction are similar under SPX3K and RevLF. The standard deviations of
the spacing between the red-green caps also indicate a large difference between RevLF and
0.25
0.30
0.35
0.40
0.10 0.15 0.20 0.25 0.30 0.35 0.40
v
u

88
SPX3K, which are listed in Table 5-2. The graphical representation of the color chips shown in
Figure 5-3 and the standard deviations shown in Table 5-2 have potential to predict color
discrimination ability, are ripe to be considered in a future color discrimination measure, and may
be useful as spectral design tools.
Table 5-2 | Standard deviations of the caps of three SPDs
SPD Red-green caps Blue-yellow caps All 85 caps
CIE Illuminant C 0.001391 0.001091 0.001304
RevLF 0.002423 0.002846 0.003231
SPX3K 0.003266 0.002864 0.003077
SPX3K
RevLF
Blackbody locus
Spectrum Locus
Figure 5-4 | Plots of the chromaticity coordinates of FM sample 14 to sample 33 lit by the RevLF and
the SPX3K in the CIE 1960 UCS
0.33
0.34
0.35
0.36
0.37
0.38
0.24 0.25 0.26 0.27 0.28 0.29 0.30 0.31 0.32 0.33 0.34 0.35 0.36
v
u

89
As shown in Figure 5-2 (a), the modification associated with the RevLF SPD increases the red-
green opponent signals. Thus, the contrast between red and green colors is improved, which is
beneficial to the color discrimination of red and green colors. At the same time, the spectrum
modification reduces blue-yellow signals (Figure 5-2 (b)), which reduces contrast between yellow
and blue colors, leading to poorer color discrimination for yellow and blue colors. However, our
statistical results show only a significant improvement in color discrimination for red-green
colors by the RevLF. Neither overall color discrimination ability nor the ability for blue-yellow
colors was found to be improved under illumination of RevLF.
The improvement of the red-green color discrimination ability is expected to be beneficial to
people with red-green color deficiency. The extent of the improvement would be expected to
relate to the degree of a person‘s color deficiency. We cannot make any conclusions from this
study since the number of the color-deficient subjects was too small.
Age and cataract surgery were found to affect color discrimination scores. The older subjects
performed worse than the younger subjects, and the older subjects without cataract surgery
performed worse than the older subjects with cataract surgery. As mentioned previously, the lens
yellows with age, which distorts the SPD of the light received by the photoreceptors and reduces
the illuminance on the retina. The distortion of the SPD and the reduction in transmittance
decrease the opponent signals and color contrasts. After cataract surgery, transmittance improves
and the distortion disappears, and saturation increases, which all allow for better color contrasts
[89]. Whether or not RevLF is able to improve color discrimination in older subjects depends on
whether or not they had cataract surgery. The results suggest that RevLF is effective in improving
color discrimination for older people with cataract surgery, but is not for the older people without

90
cataract surgery. While true, on average, the results may not be true for all individual cases since
transmittance properties vary between lenses.
An illuminance of 300 lux was chosen for this study. Boyce and Simons found that illuminance
did not affect the color discrimination performance as characterized with the FM-100 test when
illuminance was in the range of 300 to 1200 lux. The results found in this study are expected to
remain valid for a wider range of illuminance levels, especially for younger people. Illuminance
is a consideration for elders since improved color discrimination performance has been shown by
increasing illuminance from 400 lux to 1200 lux [66].
Color discrimination was characterized in this study using the FM-100 test. Though the FM-100
is the most widely used test for color discrimination, all of the caps are equal in chroma and have
modest saturation. The real world contains not only medium-saturated colors, but also de-
saturated and saturated colors. In the future, it would be worth employing colors with different
levels of saturation, which may further bracket and characterize color discrimination under
different spectra.

91
Chapter 6 Conclusions
RevLF can be set to an illuminance that is about 5% or 8% lower than SPX3K for equal
brightness, within the range of 240 to 300 lux, in a colorless / neutral space perceived by
people below 25 years of age or people above 60 years of age, respectively. This
conclusion can likely be generalized for a wider range of illuminance, so long as the
observer is photopically adapted.
Based on the side-by-side experimental method, and at the same illuminance of 330 lux,
the room illuminated by RevLF was more preferred than an otherwise identical room
illuminated by SPX3K by a margin of 2 to 1. Subjects cited color and brightness
perception as the reasons for their preference.
When brightness perception is considered in isolation, the advantage of the SPD for the
RevLF (again, for brightness only) cannot offset the disadvantage of its lower efficacy.
At equal brightness, a room illuminated with RevLF will consume more energy than the
same room illuminated by SPX3K.
When brightness and color discrimination are considered together, as with visual clarity,
it is unknown whether or not RevLF or SPX3K illumination would be more energy
efficient. Preference also plays a role in the gestalt evaluation.
At 300 lux, no significant difference in overall color discrimination as characterized by
the FM-100 test was found under RevLF and SPX3K illumination. In comparison to
SPX3K illumination, RevLF illumination improved red-green color discrimination for
color-normal people below 25 years of age, and for those above 60 years of age who had
cataract surgery. This result is expected to be valid for a wider range of illuminance
levels.

92
Reference
1. Boyce, P.R., Human factors in lighting. 2nd ed. 2003, London ; New York: Taylor & Francis. xvi, 584 p.
2. Berson, D.M., Phototransduction by retinal ganglion cells that set the circadian clock. Science, 2002. 295(5557): p. 1070-3.
3. Wyszecki, G. and W.S. Stiles, Color science : concepts and methods, quantitative data,
and formulae. Wiley classics library ed. Wiley classics library. 2000, New York: John Wiley & Sons. xv, 950 p.
4. Rea, M.S. and Illuminating Engineering Society of North America., The IESNA lighting
handbook : reference & application. 9th ed. 2000, New York, NY: Illuminating Engineering Society of North America.
5. Rea, M.S., A proposed unified system of photometry. Lighting research and technology, 2004. 36(2): p. 85-111.
6. Eloholma, M., New model for mesopic photometry and its application to road lighting. Leukos, 2006. 2(4): p. 263-293.
7. CIE, CIE 191:2010 Recommended System for Visual Performance Based Mesopic
Photometry. 2010. 8. Royer, M.P., Tuning Optical Radiation for Visual and Non-Visual Impact, in
Architectural Engineering. 2011, The Pennsylvannia State University: University Park. 9. Kelly, K.L., Lines of constant correlated color temperature based on MacAdam's (u, v)
uniform chromaticity transformation of the cie diagram. Journal of the Optical Society of America, 1963. 53(8): p. 999-1002.
10. DiLaura, D., K. Houser, R. Mistrick, and G. Steffy, The IESNA Lighting Handbook:
Reference & Application. 2010. 11. Hashimoto, K., Visual clarity and feeling of contrast. Color research and application,
1994. 19(3): p. 171-85. 12. Worthey, J.A., Color rendering: asking the question. Color research and application,
2003. 28(6): p. 403-12. 13. Judd, D.B., A flattery index for artificial illuminants. Illuminating engineering, 1967.
62(10): p. 593-598. 14. Thornton, W.A., Color-discrimination index. Journal of the Optical Society of America,
1972. 62(2): p. 191-4. 15. Thornton, W.A., A validation of the color-preference index. Journal of the Illuminating
Engineering Society, 1974. 4(1): p. 48-52. 16. Hashimoto, K., New method for specifying color-rendering properties of light sources
based on feeling of contrast. Color research and application, 2007. 32(5): p. 361-71. 17. Helmholtz, H.v. and J.P.C. Southall, Helmholtz's treatise on physiological optics. 1924,
Rochester, N.Y.: The Optical Society of America. 18. Lundeman, J.H., K. Herbst, M. Larsen, and L. Kessel. Transmission measurements of
human lenses. in Therapeutic Laser Applications and Laser-Tissue Interactions IV, June
17, 2009 - June 18, 2009. 2009. Munich, Germany: SPIE. 19. GE, Lamp & Ballast Products Catalog. 2010. 20. Goldstein, E.B., Sensation and perception. 5th ed. 1999, Pacific Grove: Brooks/Cole Pub.
xxiv, 661 p.

93
21. Palmer, S.E., Vision science : photons to phenomenology. 1999, Cambridge, Mass.: MIT Press. xxii, 810 p.
22. Houser, K. The V(λ) Function: Limitations, Implications, and Prospects for Improvement. in 2001 Illuminating Engineering Society of Australia and New Zealand. 2001.
23. Alman, D.H., Errors of the standard photometric system when measuring the brightness
of general illumination light sources. Journal of the Illuminating Engineering Society, 1977. 7(1): p. 55-62.
24. Harrington, R.E., Effect of color temperature on apparent brightness. Journal of the Optical Society of America, 1954. 44(2): p. 113-116.
25. Ayama, M., Brightness-to-luminance ratio of colored light in the entire chromaticity
diagram. Color research and application, 1998. 23(5): p. 274-287. 26. DeLaney, W.B., Examination of visual clarity with high color rendering fluorescent light
sources. Journal of the Illuminating Engineering Society, 1978. 7(2): p. 74-84. 27. Boyce, P.R. and C. Cuttle, Effect of correlated colour temperature on the perception of
interiors and colour discrimination performance. Lighting research and technology, 1990. 22(1): p. 19-36.
28. Hu, X., Higher color temperature lamps may not appear brighter. Leukos, 2006. 3(1): p. 69-81.
29. Fotios, S.A., Lamp colour properties and apparent brightness: a review. International journal of lighting research and technology, 2001. 33(3): p. 163-81.
30. Thornton, W.A., A system of photometry and colorimetry based directly on visual
response. Journal of the Illuminating Engineering Society, 1973. 3(1): p. 99-111. 31. Thornton, W.A., Luminosity and color-rendering capability of white light. Journal of the
Optical Society of America, 1971. 61(9): p. 1155-63. 32. Thornton, W.A., Three-color visual response. Journal of the Optical Society of America,
1972. 62(3): p. 457-9. 33. Thornton, W., Toward a more accurate and extensible colorimetry. Part I. Introduction.
The visual colorimeter-spectroradiometer. Experimental results. Color research and application, 1992. 17(2): p. 79-122.
34. Houser, K., Tuning the fluorescent spectrum for the trichromatic visual responses a pilot
study. Leukos, 2004. 1(1): p. 7-23. 35. Thornton, W.A., Brightness meter. Journal of the Illuminating Engineering Society,
1980. 10(1): p. 52-63. 36. Guth, S., Heterochromatic additivity, foveal spectral sensitivity, and a new color model.
Journal of the Optical Society of America, 1973. 63(4): p. 450-462. 37. Fotios, S.A. and G.J. Levermore, Chromatic effect on apparent brightness in interior
spaces I: Introduction and colour gamut models. Lighting research and technology, 1998. 30(3): p. 97-102.
38. Fotios, S.A. and G.J. Levermore, Chromatic effect on apparent brightness in interior
spaces II: sws Lumens model. Lighting research and technology, 1998. 30(3): p. 103-106. 39. Fotios, S.A. and G.J. Levermore, Chromatic effect on apparent brightness in interior
spaces III: Chromatic brightness model. Lighting research and technology, 1998. 30(3): p. 107-110.
40. Ikeda, M., K. Uchikawa, and H. Yagughi. New photometric system for brightness
perception. in 13th Congress of the International Commission for Optics, Optics in
Modern Science and Technology, Conference Digest. 1984. Sapporo, Jpn: Int Commission for Optics, Organizing Committee.
94
41. Nayatani, Y., H. Sobagaki, K. Hashimoto, and T. Yano, Lightness dependency of chroma
scales of a nonlinear color-appearance model and its latest formulation. Color research and application, 1995. 20: p. 156-156.
42. Fairchild, M.D., Color appearance models. 2nd ed. Wiley-IS&T series in imaging science and technology. 2005, Chichester, West Sussex, England ; Hoboken, NJ: J. Wiley. xxi, 385 p.
43. Thornton, W.A., Toward a more accurate and extensible colorimetry. Part III.
Discussion (continued). Color research and application, 1992. 17: p. 240-240. 44. Berman, S.M., D.L. Jewett, G. Fein, G. Saika, and F. Ashford, Photopic luminance does
not always predict perceived room brightness. Lighting research and technology, 1990. 22: p. 37-41.
45. Berman, S.M., A new retinal photoreceptor should affect lighting practice. Lighting research and technology, 2008. 40: p. 373-376.
46. Stockman, A., D.I.A. MacLeod, and D.D. DePriest, The temporal properties of the
human short-wave photoreceptors and their associated pathways. Vision Research, 1991. 31: p. 189-208.
47. Ingling, C.R., Jr., S. Burns, and B.A. Drum, Desaturating blue increases only chromatic
brightness. Vision Research, 1977. 17: p. 501-3. 48. Houser, K.W., S.A. Fotios, and M.P. Royer, A test of the S/P ratio as a correlate for
brightness perception using rapid-sequential and side-by-side experimental protocols. LEUKOS - Journal of Illuminating Engineering Society of North America, 2009. 6: p. 119-138.
49. Fotios, S., Lighting in offices: Lamp spectrum and brightness. Coloration Technology, 2011. 127(2): p. 114-120.
50. Akashi, Y., A field study of illuminance reduction. Energy and buildings, 2006. 38(6): p. 588-599.
51. Berman, S.M., Photopic luminance does not always predict perceived room brightness. Lighting research & technology, 1990. 22(1): p. 37-41.
52. Boyce, P.R., Investigations of the subjective balance between illuminance and lamp
colour properties. International journal of lighting research and technology, 1977. 9(1): p. 11-24.
53. Boyce, P.R., The impact of spectral power distribution on the performance of an
achromatic visual task. Lighting research and technology, 2003. 35(2): p. 141-56. 54. Boyce, P.R., Effect of correlated colour temperature on the perception of interiors and
colour discrimination performance. Lighting research & technology, 1990. 22(1): p. 19-36.
55. Flynn, J., Effects of light source color on user impression and satisfaction. Journal of the Illuminating Engineering Society, 1977. 6(3): p. 167-179.
56. Fotios, S., A comparison of visual objectives used in side-by-side matching tests. Lighting research and technology, 2005. 37(2): p. 117-31.
57. Fotios, S., Perception of electric light sources of different colour properties. Lighting research & technology, 1997. 29(3): p. 161-71.
58. Thornton, W.A., What is visual clarity? Journal of the Illuminating Engineering Society, 1978. 7(2): p. 85-94.
59. Vrabel, P.L., Visual performance and visual clarity under electric light sources. II. Visual
clarity. Journal of the Illuminating Engineering Society, 1998. 27(1): p. 29-41.

95
60. Teller, D., M. Pereverzeva, and A. Civan, Adult brightness vs. luminance as models of
infant photometry: Variability, biasability, and spectral characteristics for the two age
groups favor the luminance model. Journal of vision, 2003. 3(5): p. 2-346. 61. Rea, M., Color rendering: A tale of two metrics. Color research and application, 2008.
33(3): p. 192-202. 62. Jerome, C.W., Flattery vs colour rendition. Journal of the Illuminating Engineering
Society, 1972. 1(3): p. 208-11. 63. Royer, M.P., K.W. Houser, and A.M. Wilkerson, Color Discrimination Capability Under
Highly Structured Spectra. Color research and application, 2011. (In Press). 64. Farnsworth, D., Farnsworth-Munsell 100-hue and dichotomous tests for colour vision.
Journal of the Optical Society of America, 1943. 33: p. 568-578. 65. Boyce, P.R., Illuminance, lamp type and performance on a colour discrimination task.
International journal of lighting research and technology, 1976. 8(4): p. 195-199. 66. Boyce, P.R. and R.H. Simons, Hue discrimination and light sources. International journal
of lighting research and technology, 1977. 9(3): p. 125-140. 67. Bowman, K.J. and B.L. Cole, A recommendation for illumination of the Farnsworth-
Munsell 100-hue test. American Journal of Optometry and Physiological Optics, 1980. 57(11): p. 839-843.
68. O'Connor, D., Lighting for the elderly: The effects of light source spectrum and
illuminance on color discrimination and preference. Leukos, 2005. 2(2): p. 123-132. 69. Knoblauch, K., Age and illuminance effects in the Farnsworth-Munsell 100-hue test.
Applied optics, 1987. 26(8): p. 1441-8. 70. Kinney, J.A.S., Reaction time to spatial frequencies using yellow and luminance-matched
neutral goggles. American Journal of Optometry and Physiological Optics, 1983. 60(2): p. 132-8.
71. Kelly, S.A., Effect of yellow-tinted lenses on brightness. Journal of the Optical Society of America. A, Optics and image science, 1990. 7(10): p. 1905-11.
72. Matsumoto, E.R., Effect of X-Chrom lens wear on chromatic discrimination and
stereopsis in color-deficient observers. American Journal of Optometry and Physiological Optics, 1983. 60(4): p. 297-302.
73. Sanders, M.S. and E.J. McCormick, Human factors in engineering and design. 7th ed. 1993, New York: McGraw-Hill. xiii, 790 p.
74. Fotios, S., The effect of a stimulus frequency bias in side-by-side brightness ranking tests. Lighting research and technology, 2008. 40(1): p. 43-50.
75. De Valois, R.L., Analysis of response patterns of LGN cells. Journal of the Optical Society of America, 1966. 56(7): p. 966-977.
76. Ohno, Y. Color rendering and luminous effcacy of white LED spectra. in SPIE Fourth
International Conference on Solid State lighting. 2004. Denver, CO. 77. Ohno, Y., Spectral design considerations for color rendering of white LED sources.
Optical Engineering, 2005. 44. 78. Davis, W. and Y. Ohno. Toward an improved color rendering metric. in Fifth
International Conference on Solid State Lighting. 2005. 79. Fotios, S., The perception of light sources of different colour properties. 1997, UMIST
UK: Machester. 80. Howett, G.L., Linear opponent-colors model optimized for brightness prediction, in
Other Information: Portions of this document are illegible in microfiche products.
Original copy available until stock is exhausted. 1986. p. Medium: X; Size: Pages: 125.

96
81. Berman, S. and B. Liebel, Essay by invitation. Lighting Design and Application, 1996(November): p. 12-17.
82. Boyce, P.R., Investigations of the subjective balance between illuminance and lamp color
properties. International journal of lighting research and technology, 1977. 9(1): p. 11-24. 83. Thornton, W.A., Toward a more accurate and extensible colorimetry. II. Discussion.
Color research and application, 1992. 17(3): p. 162-86. 84. Thornton, W.A., Toward a more accurate and extensible colorimetry. Part I.
Introduction. The visual colorimeter - spectroradiometer. Experimental results. Color Research & Application, 1992. 17(2): p. 79.
85. Toda, I., H. Fujishima, and K. Tsubota, Ocular fatigue is the major symptom of dry eye. Acta Ophthalmologica, 1993. 71(3): p. 347-352.
86. Ikeda, M., Desaturation of color by environment light in cataract eyes. Color research and application, 2008. 33(2): p. 142-147.
87. Kitakawa, T., Evaluation of early state of cyanopsia with subjective color settings
immediately after cataract removal surgery. Journal of the Optical Society of America. A, Optics, image science, and vision, 2009. 26(6): p. 1375-1381.
88. Quellman, E., The light source color preferences of people of different skin tones. Journal of the Illuminating Engineering Society, 2002. 31(1): p. 109-116.
89. Granville, W.C., Colors do look different after a lens implant! Color Research & Application, 1990. 15(1): p. 59-62.