effects of synthetic air entraining agents on compressive ... · air entrained concrete comprises...
TRANSCRIPT

Effects of Synthetic Air Entraining Agents on Compressive Strength of Portland Cement Concrete – Mechanism of Interaction and Remediation Strategy
FINAL REPORT
July 1999
Submitted by
NJDOT Research Project Manager Mr. Nicholas Vitillo
FHWA NJ 2001-021
In cooperation with
New Jersey Department of Transportation
Division of Research and Technology and
U.S. Department of Transportation Federal Highway Administration
*Dept of Civil & Materials Engineering University of Illinois at Chicago
Chicago, Illinois 60607-7023
Dr. Ali Maher *** Professor and Chairman
*** Center for Advanced Infrastructure & Transportation (CAIT) Civil & Environmental Engineering
Rutgers, The State University Piscataway, NJ 08854-8014
Zhijin Zhang * Doctoral Candidate
** Dept of Civil & Environmental Engineering New Jersey Institute of Technology (NJIT)
Newark, NJ, 07102
Allyn Luke ** Research Engineer
Dr. Farhad Ansari * Professor

Disclaimer Statement
"The contents of this report reflect the views of the author(s) who is (are) responsible for the facts and the
accuracy of the data presented herein. The contents do not necessarily reflect the official views or policies of the New Jersey Department of Transportation or the Federal Highway Administration. This report does not constitute
a standard, specification, or regulation."
The contents of this report reflect the views of the authors, who are responsible for the facts and the accuracy of the
information presented herein. This document is disseminated under the sponsorship of the Department of Transportation, University Transportation Centers Program, in the interest of
information exchange. The U.S. Government assumes no liability for the contents or use thereof.

1. Report No. 2. Government Accession No.
TECHNICAL REPORT STANDARD TITLE PAGE
3. Rec ip ient ’s Cata log No.
5 . Repor t Date
8. Performing Organization Report No.
6. Performing Organizat ion Code
4. Ti t le and Subt i t le
7. Author(s)
9. Performing Organization Name and Address 10. Work Unit No.
11. Contract or Grant No.
13. Type of Report and Period Covered
14. Sponsoring Agency Code
12. Sponsoring Agency Name and Address
15. Supplementary Notes
16. Abstract
17. Key Words
19. Security Classif (of this report)
Form DOT F 1700.7 (8-69)
20. Security Classif. (of this page)
18. Distribution Statement
21. No of Pages 22. Price
July 1999
CAIT/Rutgers/NJIT
Final Report 08/19/1997 - 12/31/1999
FHWA 2001 - 021
New Jersey Department of Transportation CN 600 Trenton, NJ 08625
Federal Highway Administration U.S. Department of Transportation Washington, D.C.
This document reports the results of a comprehensive study pertaining to the determination of causes and mechanisms resulting in a reduction of strength in concrete mixtures containing Synthetic air entraining admixtures. The study involved experimentation with concrete mixtures containing both the Synthetic and Vinsol resin admixtures. Tests involved determination of air content for fresh concrete and air bubble characteristics including size and distribution for hardened concrete. Compressive strength of concrete samples were determined at ages 7, 14, 28 & 56 days. Petrographic analysis of the hardened samples revealed that the Vinsol resin admixture produces more of the smaller bubbles desirable for protection against frost. However, Synthetic admixtures induce more of the larger air bubbles with the cement paste. This explains the much lower compressive strength associated with Synthetic air concretes. It is believed that the larger air bubbles are produced due to the inability of the Synthetic air entraining agents to lower the surface tension in the mixture. This will allow the smaller air bubbles to coalesce into larger ones. Based on the results of the study, recommendations were made that follow up research should involve determination of surface tension in such mixtures.
synthetic air, resin admixtures, strength reduction, concrete
Unclassified Unclassified
32
FHWA 2001 – 021
Dr. Farhad Ansari, Zhijin Zhang, Allan Luke, and Dr. Ali Maher
Effects of Synthetic Air Entraining Agents on compressive Strength of Portland Cement Concrete – Mechanism of Interaction and Remediation Strategy

Acknowledgements The authors wish to express their appreciation to the New Jersey Department of Transportation for the allotment of funds making this research possible. Special thanks are extended to Mr. Nicholas Vitillo of NJDOT for his support and extending the opportunity to participate in such a significant and extensive research program.

TABLE OF CONTENTS Page Summary…...................................................................................................……… 1 Statement of the Problem....................................................................................…. 2 Research Objectives……………….........................................................…………... 2 Background……............................................................................................……… 2 Frost resistance of Concrete by Air Entrainment ................................................... 3 Air Entraining Admixtures…… ..................................................................………… 3 Methods for the Determination of Air Content in Concrete...............................…… 4 I-Gravimetric Method…….............................………....................................……..… 4 Volumetric Method...........................................................................................……. 5 Pressure Method………………………….................................................………….. 5 Linear Traverse Method………………………………………………………...………. 5 Point Count Method.....................................…………………………………………... 6 High Pressure Method....................................................…………………………….. 6 Investigative Procedures.................................………………………………………... 6 Mix Design Requirements and Criteria………………………………………………… 9 Experimental Results……………………………………………………………………. 13 Rationale …………………………………………………………………………………. 14 Conclusions…………………….................................................……………………... 15

LIST OF FIGURES Figure 1. Automated Linear Traverse System 10 Figure 2. Sliced Concrete for Automated image Analysis System 11 Figure 3. Output for Image Processing System 12 Figure 4. Comparison of compressive strengths for Synthetic(A0120) and Vinsol(R0120) resin concretes(at 1.0 oz) 16 Figure 5. Comparison of compressive strengths for Synthetic(A0708) and Vinsol(R0707) resin concretes(at 1.5 oz) 17 Figure 6. Comparison of compressive strengths for Synthetic(A0428) and Vinsol(R0427) resin concretes(at 2.0 oz) 18 Figure 7. Bubble size distribution in the control sample 19 Figure 8. Comparison of bubble size distribution for samples containing
1.0 oz of air entraining admixture 20 Figure 9. Comparison of bubble size distribution for samples containing
2.0 oz of air entraining admixture 21 Figure 10. Air bubble size distribution at the same air content 24 Figure 11. Comparison of air and bubble size and distribution within the Same area of paste 26 LIST OF TABLES Table 1. Experimental Program 8 Table 2. Mix Design 9 Table 3. Comparison of air bubble distribution in Synthetic and Vinsol
Resin mixtures at 1.0 oz 22 Table 4. Comparison of air bubble distribution in Synthetic and Vinsol
Resin mixtures at 2.0 oz 23 Table 5. Comparison of air bubble size distribution in Synthetic and Vinsol
Resin mixtures at the same air content 25
1
EFFECTS OF SYNTHETIC AIR ENTRAINING AGENTS ON COMPRESSIVESTRENGTH OF PORTLAND CEMENT CONCRETE – MECHANISM OF
INTERACTION AND REMEDIATION STRATEGY
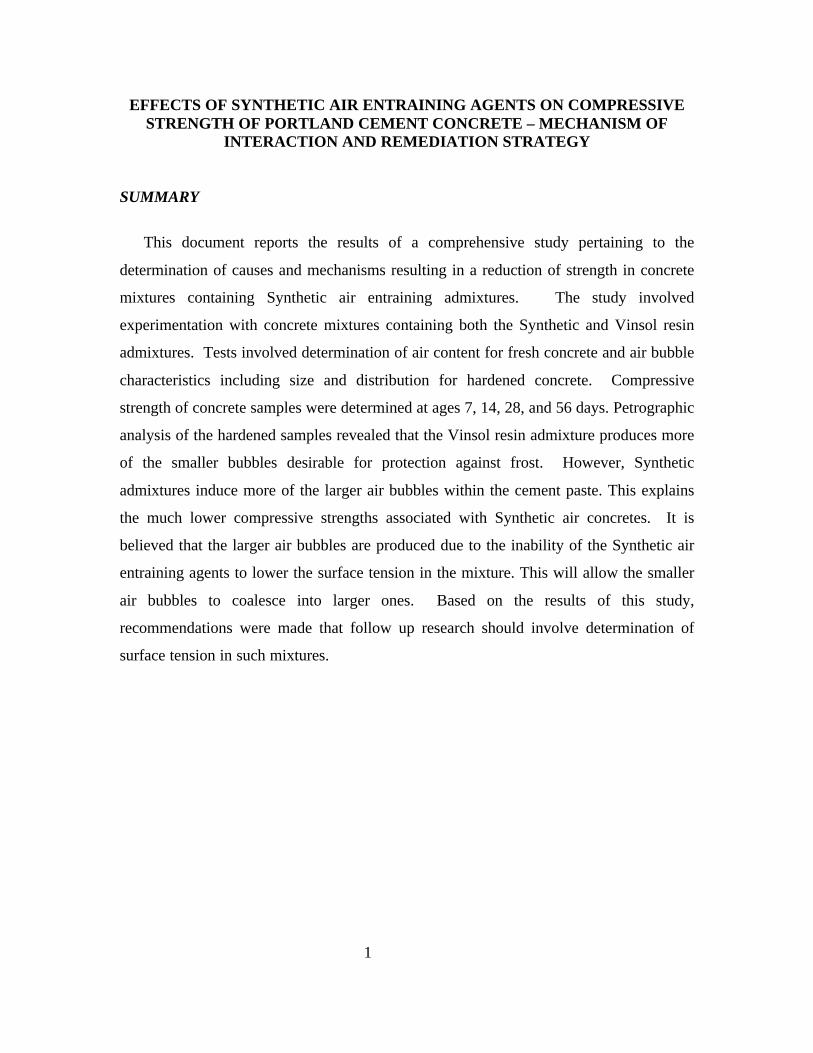
SUMMARY
This document reports the results of a comprehensive study pertaining to the
determination of causes and mechanisms resulting in a reduction of strength in concrete
mixtures containing Synthetic air entraining admixtures. The study involved
experimentation with concrete mixtures containing both the Synthetic and Vinsol resin
admixtures. Tests involved determination of air content for fresh concrete and air bubble
characteristics including size and distribution for hardened concrete. Compressive
strength of concrete samples were determined at ages 7, 14, 28, and 56 days. Petrographic
analysis of the hardened samples revealed that the Vinsol resin admixture produces more
of the smaller bubbles desirable for protection against frost. However, Synthetic
admixtures induce more of the larger air bubbles within the cement paste. This explains
the much lower compressive strengths associated with Synthetic air concretes. It is
believed that the larger air bubbles are produced due to the inability of the Synthetic air
entraining agents to lower the surface tension in the mixture. This will allow the smaller
air bubbles to coalesce into larger ones. Based on the results of this study,
recommendations were made that follow up research should involve determination of
surface tension in such mixtures.

2
EFFECTS OF SYNTHETIC AIR ENTRAINING AGENTS ON COMPRESSIVESTRENGTH OF PORTLAND CEMENT CONCRETE – MECHANISM OF
INTERACTION AND REMEDIATION STRATEGY
1. STATEMENT OF THE PROBLEMAir entrained concrete comprises the bulk of the cementitious material employed in
the construction of highway infrastructure. Besides improving freeze-thaw durability, air
entrainment increases the workability of concrete, and therefore allows for a reduction in
water to cement ratio (w/c). Lower w/c ratios that can be used with air entrained concrete
and better compaction characteristics result in more impermeable concrete and a better
overall resistance to aggressive agents.
In recent years, Synthetic air entraining admixtures have been more readily available
in construction projects. Data accumulated over the past decade indicates that Synthetic
air entraining agents cause a rather large reduction in compressive strength. An average
bias of 700 psi, 600 psi, and 300 psi has been estimated with Class A, Class B White, and
Class B Concrete respectively. According to NJDOT observations, this decrease in
strength has been isolated independently of parallel contributions from varying air
content, ambient temperature, Portland cement quality control, and alkali contents in
Portland cement. Such losses in strength were not observed with Vinsol resin type air
entraining agents. Therefore, the problem is why synthetic air entraining admixtures
give rise to greater strength loss.
2. RESEARCH OBJECTIVES
The primary objectives of the research described in this report were:a) To determine the cause and the mechanism for reduction in compressive
strength when Synthetic air entraining admixtures are used.
b) To provide a solution for the problem based on the results of the investigation
performed in the first stage of the research.
3. BACKGROUND
Full comprehension of the research approach undertaken during this investigation
3
requires a brief description as to the mechanisms of air entrainment, and the testing
procedures for determination of air content and air bubble characteristics in concrete.
This is accomplished in this section of the report.
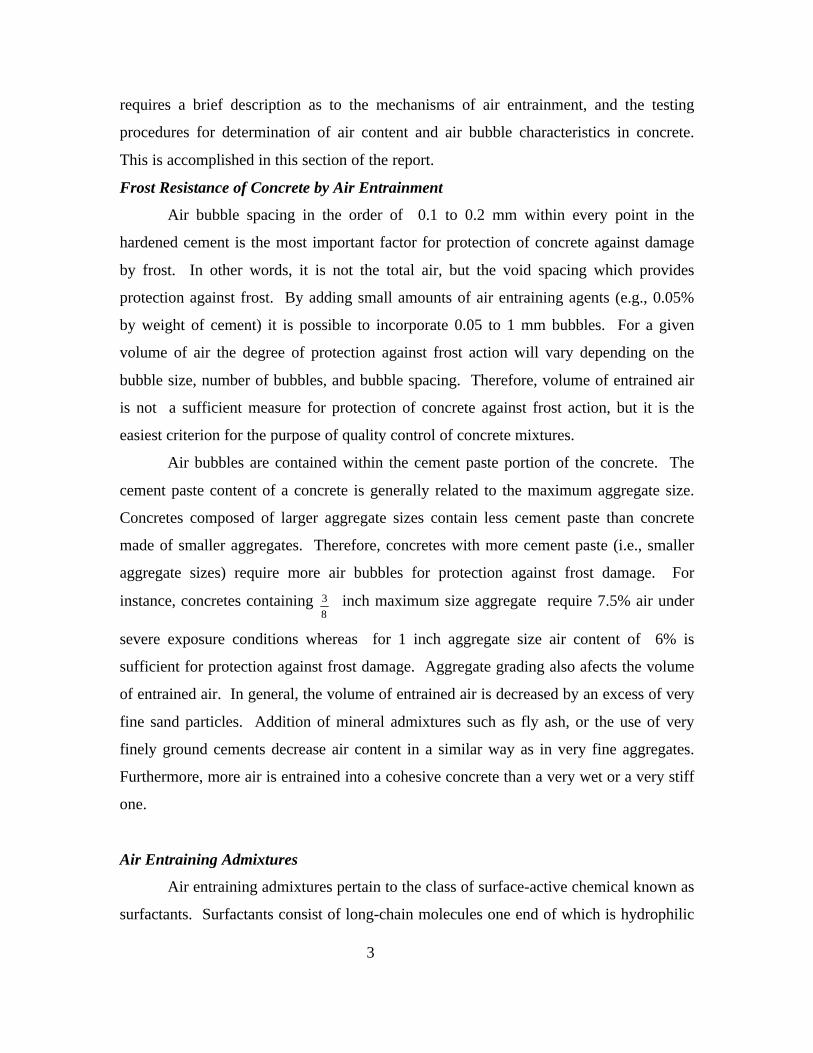
Frost Resistance of Concrete by Air Entrainment
Air bubble spacing in the order of 0.1 to 0.2 mm within every point in the
hardened cement is the most important factor for protection of concrete against damage
by frost. In other words, it is not the total air, but the void spacing which provides
protection against frost. By adding small amounts of air entraining agents (e.g., 0.05%
by weight of cement) it is possible to incorporate 0.05 to 1 mm bubbles. For a given
volume of air the degree of protection against frost action will vary depending on the
bubble size, number of bubbles, and bubble spacing. Therefore, volume of entrained air
is not a sufficient measure for protection of concrete against frost action, but it is the
easiest criterion for the purpose of quality control of concrete mixtures.
Air bubbles are contained within the cement paste portion of the concrete. The
cement paste content of a concrete is generally related to the maximum aggregate size.
Concretes composed of larger aggregate sizes contain less cement paste than concrete
made of smaller aggregates. Therefore, concretes with more cement paste (i.e., smaller
aggregate sizes) require more air bubbles for protection against frost damage. For
instance, concretes containing 3
8 inch maximum size aggregate require 7.5% air under
severe exposure conditions whereas for 1 inch aggregate size air content of 6% is
sufficient for protection against frost damage. Aggregate grading also afects the volume
of entrained air. In general, the volume of entrained air is decreased by an excess of very
fine sand particles. Addition of mineral admixtures such as fly ash, or the use of very
finely ground cements decrease air content in a similar way as in very fine aggregates.
Furthermore, more air is entrained into a cohesive concrete than a very wet or a very stiff
one.
Air Entraining Admixtures
Air entraining admixtures pertain to the class of surface-active chemical known as
surfactants. Surfactants consist of long-chain molecules one end of which is hydrophilic
4
(water-attracting) and the other hydrophilic (water-repelling). The hydrophilic end
contains one and or more polar groups responsible for ionic actions when adsorbed at the
air-water, and cement-water interfaces. At the air-water interface the polar groups are
oriented towards the water phase lowering the surface tension, promoting bubble
formation and countering for the tendency of dispersed bubbles to coalesce. At the
cement-water interface where directive forces exist in the cement surface, the polar
groups become bound to the cement with the non-polar groups oriented towards water,
making the cement surface hydrophobic so that air can displace water and remain
attached to the cement as bubbles. Air entraining admixtures generally consist of salts of
wood resins, petroleum acids, and some synthetic detergents.
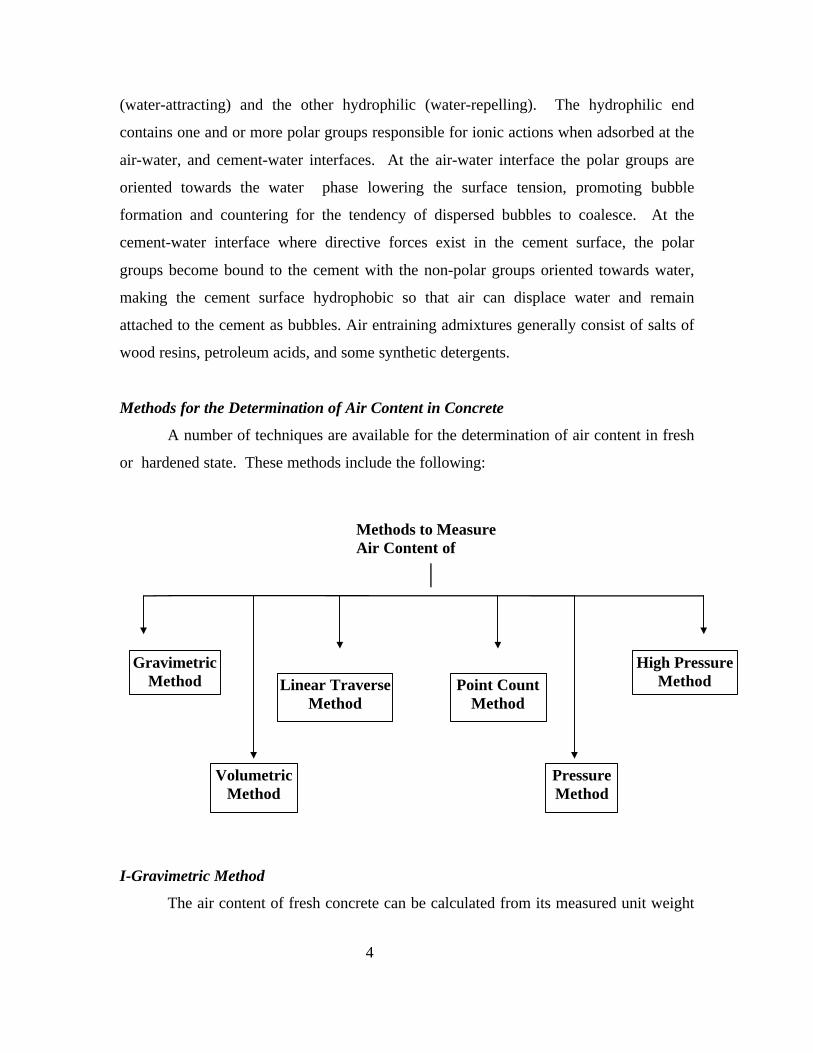
Methods for the Determination of Air Content in Concrete
A number of techniques are available for the determination of air content in fresh
or hardened state. These methods include the following:
I-Gravimetric Method
The air content of fresh concrete can be calculated from its measured unit weight
Methods to MeasureAir Content ofConcrete
GravimetricMethod
High PressureMethod
VolumetricMethod
PressureMethod
Linear TraverseMethod
Point CountMethod
5
and from the weights and densities of its ingredients. This proedure is standardized by
ASTM (C 138). This technique is highly accurate provided that the densities of concrete
constituents are accurately determined. Time required for measurement of air varies
depending on whether the accurate unit weights of constituents are available or they need
to be measured. Time required may vary from 45 minutes to about 2 hours.
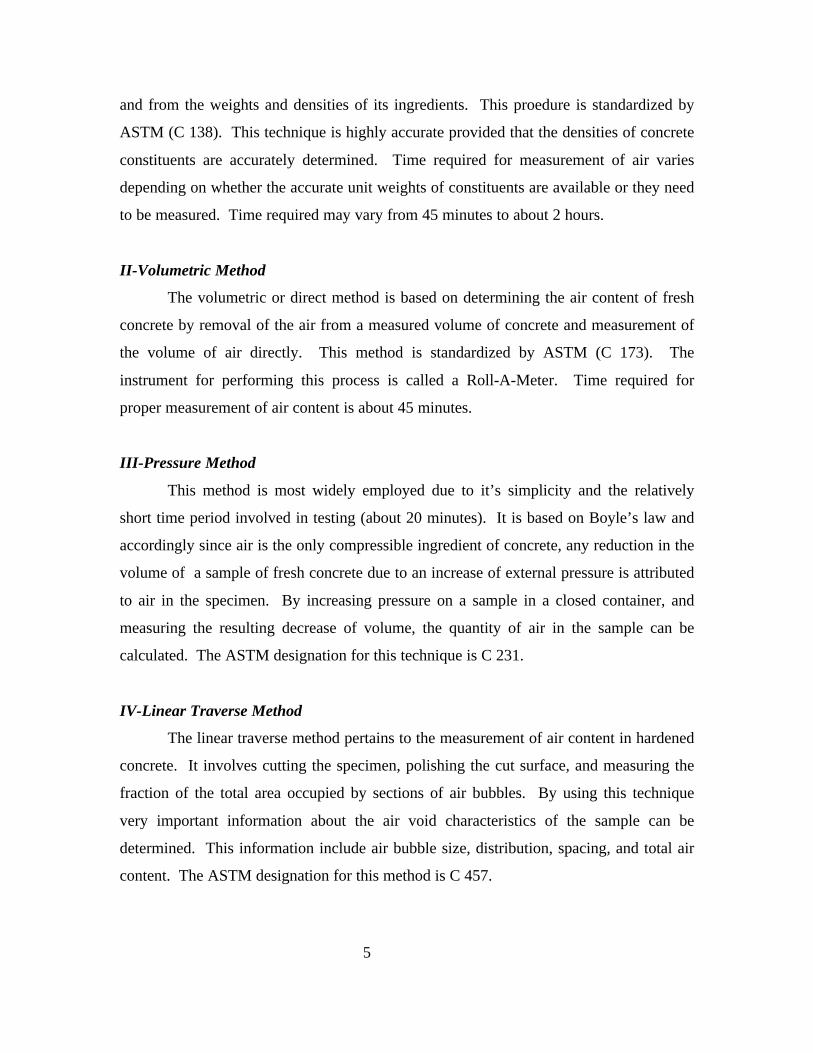
II-Volumetric Method
The volumetric or direct method is based on determining the air content of fresh
concrete by removal of the air from a measured volume of concrete and measurement of
the volume of air directly. This method is standardized by ASTM (C 173). The
instrument for performing this process is called a Roll-A-Meter. Time required for
proper measurement of air content is about 45 minutes.
III-Pressure Method
This method is most widely employed due to it’s simplicity and the relatively
short time period involved in testing (about 20 minutes). It is based on Boyle’s law and
accordingly since air is the only compressible ingredient of concrete, any reduction in the
volume of a sample of fresh concrete due to an increase of external pressure is attributed
to air in the specimen. By increasing pressure on a sample in a closed container, and
measuring the resulting decrease of volume, the quantity of air in the sample can be
calculated. The ASTM designation for this technique is C 231.
IV-Linear Traverse Method
The linear traverse method pertains to the measurement of air content in hardened
concrete. It involves cutting the specimen, polishing the cut surface, and measuring the
fraction of the total area occupied by sections of air bubbles. By using this technique
very important information about the air void characteristics of the sample can be
determined. This information include air bubble size, distribution, spacing, and total air
content. The ASTM designation for this method is C 457.

6
V-Point Count Method
This is another method for determination of air content on hardened concrete. It
is based on statistical considerations and requires a finely ground plane cross-section of
the specimen. In this procedure, a rectangular grid is placed on the plane specimen
surface, and each grid intersection that falls within a void section is counted. The air
content is equal to the number of such coincidences with voids divided by the total
number of grid intersections. This technique is also described in ASTM C 457.
VI-High Pressure Method
The high-pressure method is also applicable to hardened concrete. It involves
compressing the air in an oven dried and presoaked (for 48 hrs) specimen by means of
hydraulic pressure of about 5000 psi (as opposed to 10 psi for fresh concrete in the
pressure method). After applying correction factors, a value for air content is obtained.
This technique has not gained wide spread usage.
4. INVESTIGATIVE PROCEDURESThe logical approach in this investigation was to compare the air content and
compressive strength characteristics of the Vinsol and Synthetic resin type admixtures
through a detailed experimental program. The general overview of research program is
briefly described here.
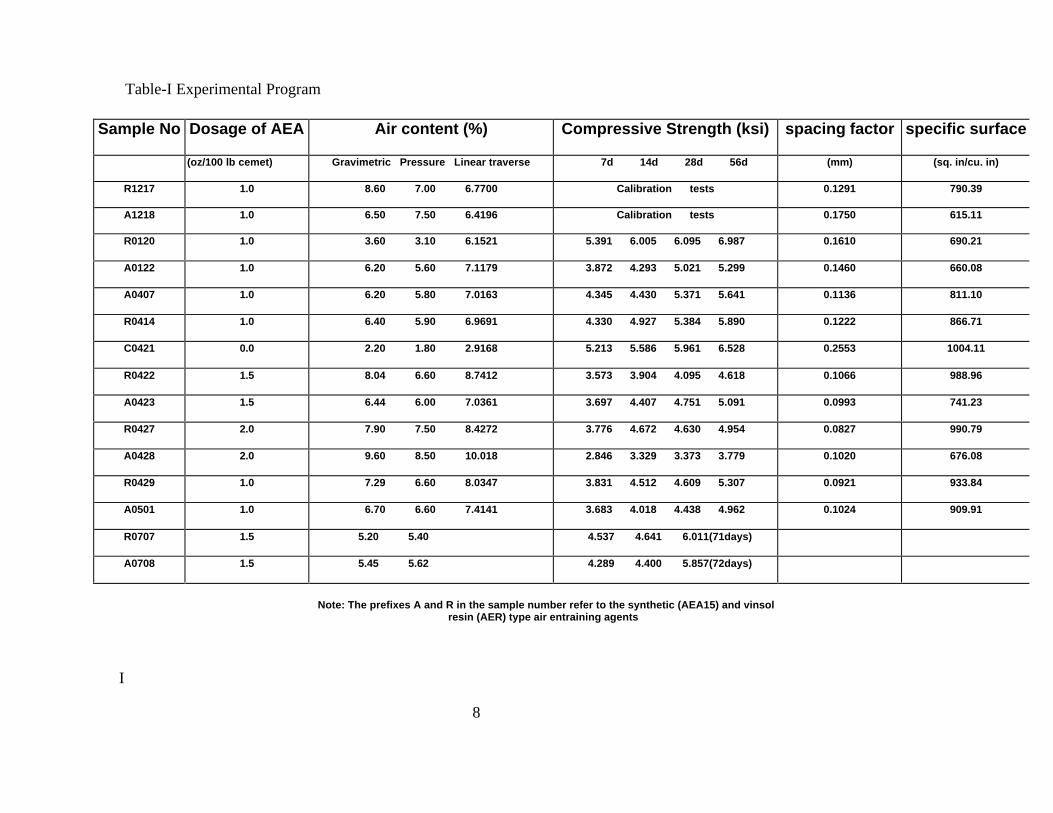
The experimental program is outlined in table 1. Experiments included preparation of
two series of concrete samples with Synthetic and Vinsol resin admixtures. The mix
proportions and constituent materials in all the concretes were identical in every respect
except for the air entraining agent type (table 2). The dosage of air entraining admixture
in most of the DOT applications corresponded to 1.5 oz/100 pounds of cement per cubic
yard. The experimental program included mixtures containing 1.0, 1.5, and 2.0 oz of
admixture per 100 pounds of cement. Air content of fresh concrete samples were
measured by using the gravimetric and the pressure test methods. Fifteen 4X8 inch
concrete cylinders were fabricated for each of the samples listed in table 1 in order to
determine the compressive strengths at 7, 14, 28, and 56 days, and prepare slices for the
petrographic analysis of samples. Average of three cylinders was used for computation of

7
strength at each age level. For each sample, three cylinders were sliced and used for
petrographic analysis. Compressive strength results were correlated against the air
content and air entraining admixture type. It is expected that the samples with synthetic
air to exhibit strength losses similar to those previously obtained by others. The
experimental program included both Synthetic and Vinsol resin admixtures. Data shown
in table 1 corresponds to air content as measured in the fresh state by the gravimetric as
well as the pressure methods.
Air content and the air bubble characteristics in the hardened state were determined
by the automated linear traverse system shown in Fig.1. The automated technique
employs digital image processing principles. Surface of the slices taken from the
concrete cylinders were polished through a rigorous procedure and prepared for image
analysis (Fig.2). As per ASTM C-457, a minimum traverse length of 95-inch is required
for petrographic analysis of concrete with a maximum aggregate size of 1-inch. A typical
slice is traversed along eight parallel strips, one-tenth of an inch apart. Each strip can
accommodate 13 images of 0.2-inch of width. Each image is traversed along five random
lines. This process yields a total traverse length of 104 inches computed as in the
following:
5×0.2×13×8 = 104 inch
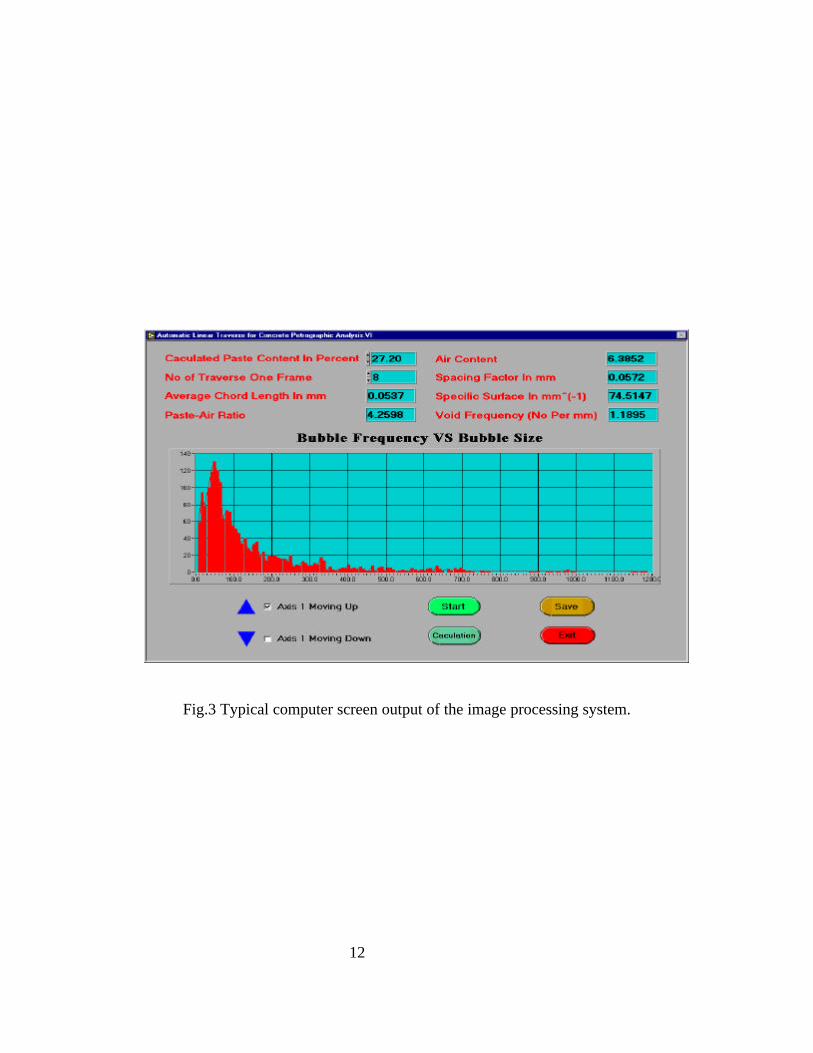
Spacing factor, specific surface air content and air bubble characteristics were evaluated
from the linear traverse results. Typical out put of image processing system in terms of
bubble frequency and size is shown in Fig.3. In addition to the measurements, the digital
images of the polished surface of the hardened samples were analyzed under the
microscope in order to develop a global mapping of air void system in the samples.
Results from this analysis would be useful in determining the dispersion characteristics of
bubbles. The exact bubble size, spacing, and dispersion characteristics of the Vinsol and
Synthetic resin air entrained concretes were determined through petrographic analysis of
polished concrete slices. Analysis of these results revealed the nature of the problem
associated with the use of synthetic air entraining agents in concrete. These results will
be discussed in the later sections of this report.
8
Sample No Dosage of AEA Air content (%) Compressive Strength (ksi) spacing factor specific surface
(oz/100 lb cemet) Gravimetric Pressure Linear traverse 7d 14d 28d 56d (mm) (sq. in/cu. in)
R1217 1.0 8.60 7.00 6.7700 Calibration tests 0.1291 790.39
A1218 1.0 6.50 7.50 6.4196 Calibration tests 0.1750 615.11
R0120 1.0 3.60 3.10 6.1521 5.391 6.005 6.095 6.987 0.1610 690.21
A0122 1.0 6.20 5.60 7.1179 3.872 4.293 5.021 5.299 0.1460 660.08
A0407 1.0 6.20 5.80 7.0163 4.345 4.430 5.371 5.641 0.1136 811.10
R0414 1.0 6.40 5.90 6.9691 4.330 4.927 5.384 5.890 0.1222 866.71
C0421 0.0 2.20 1.80 2.9168 5.213 5.586 5.961 6.528 0.2553 1004.11
R0422 1.5 8.04 6.60 8.7412 3.573 3.904 4.095 4.618 0.1066 988.96
A0423 1.5 6.44 6.00 7.0361 3.697 4.407 4.751 5.091 0.0993 741.23
R0427 2.0 7.90 7.50 8.4272 3.776 4.672 4.630 4.954 0.0827 990.79
A0428 2.0 9.60 8.50 10.018 2.846 3.329 3.373 3.779 0.1020 676.08
R0429 1.0 7.29 6.60 8.0347 3.831 4.512 4.609 5.307 0.0921 933.84
A0501 1.0 6.70 6.60 7.4141 3.683 4.018 4.438 4.962 0.1024 909.91
R0707 1.5 5.20 5.40 4.537 4.641 6.011(71days)
A0708 1.5 5.45 5.62 4.289 4.400 5.857(72days)
Note: The prefixes A and R in the sample number refer to the synthetic (AEA15) and vinsolresin (AER) type air entraining agents
I
Table-I Experimental Program
9
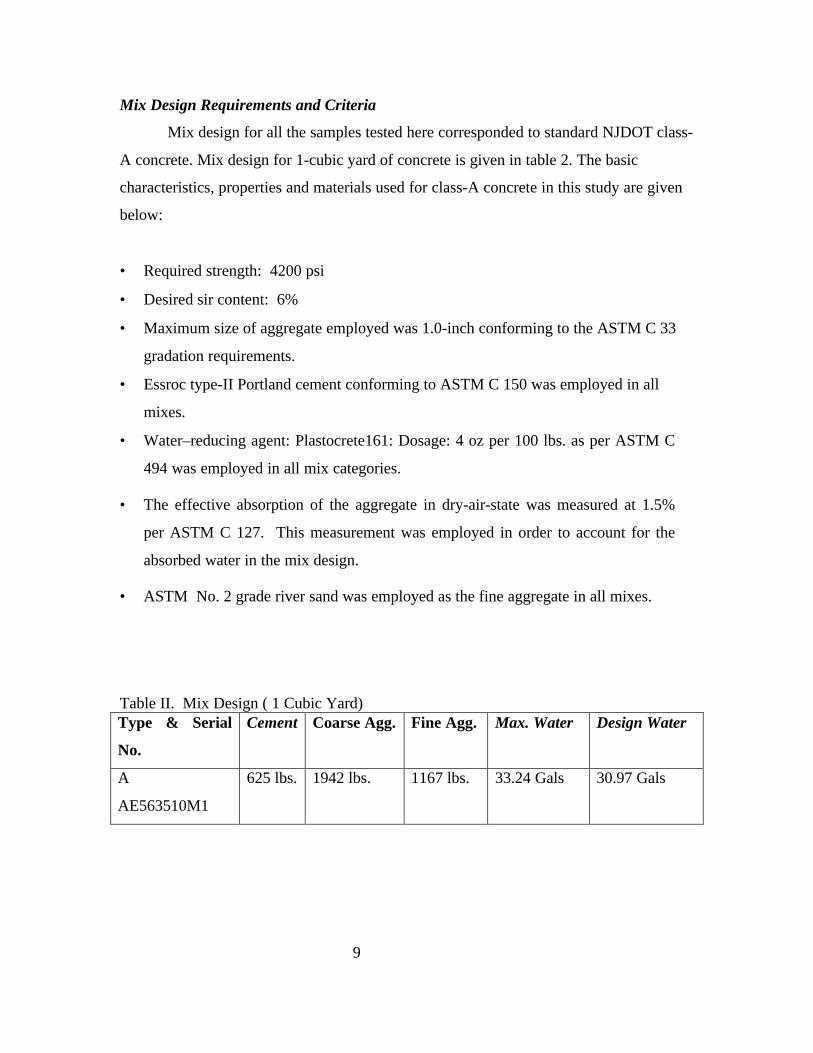
Mix Design Requirements and Criteria
Mix design for all the samples tested here corresponded to standard NJDOT class-
A concrete. Mix design for 1-cubic yard of concrete is given in table 2. The basic
characteristics, properties and materials used for class-A concrete in this study are given
below:
• Required strength: 4200 psi
• Desired sir content: 6%
• Maximum size of aggregate employed was 1.0-inch conforming to the ASTM C 33
gradation requirements.
• Essroc type-II Portland cement conforming to ASTM C 150 was employed in all
mixes.
• Water–reducing agent: Plastocrete161: Dosage: 4 oz per 100 lbs. as per ASTM C
494 was employed in all mix categories.
• The effective absorption of the aggregate in dry-air-state was measured at 1.5%
per ASTM C 127. This measurement was employed in order to account for the
absorbed water in the mix design.
• ASTM No. 2 grade river sand was employed as the fine aggregate in all mixes.
Table II. Mix Design ( 1 Cubic Yard)Type & Serial
No.
Cement Coarse Agg. Fine Agg. Max. Water Design Water
A
AE563510M1
625 lbs. 1942 lbs. 1167 lbs. 33.24 Gals 30.97 Gals

10
Fig.1 The automated linear traverse system.

11
Fig.2 Sliced Concrete Samples for the Automated Image Analysis System
Polished ConcreteSlice Polished Concrete
Slice Prepared forImage Analysis
12
Fig.3 Typical computer screen output of the image processing system.

13
5. EXPERIMENTAL RESULTS
Comparison of strength data of Vinsol and Synthetic mixes in table 1 supports the
previous observations of NJDOT in terms of strength loss associated with concretes
entrained with Synthetic type admixtures. The compressive strength of the air entrained
concretes for the Synthetic and Vinsol resin mixtures containing 1.0 oz/100 pounds of
admixture are compared in Fig.4. As shown in Fig.4, the Synthetic air concrete exhibited
lower compressive strengths than that of the Vinsol resin mixture at all ages. As shown
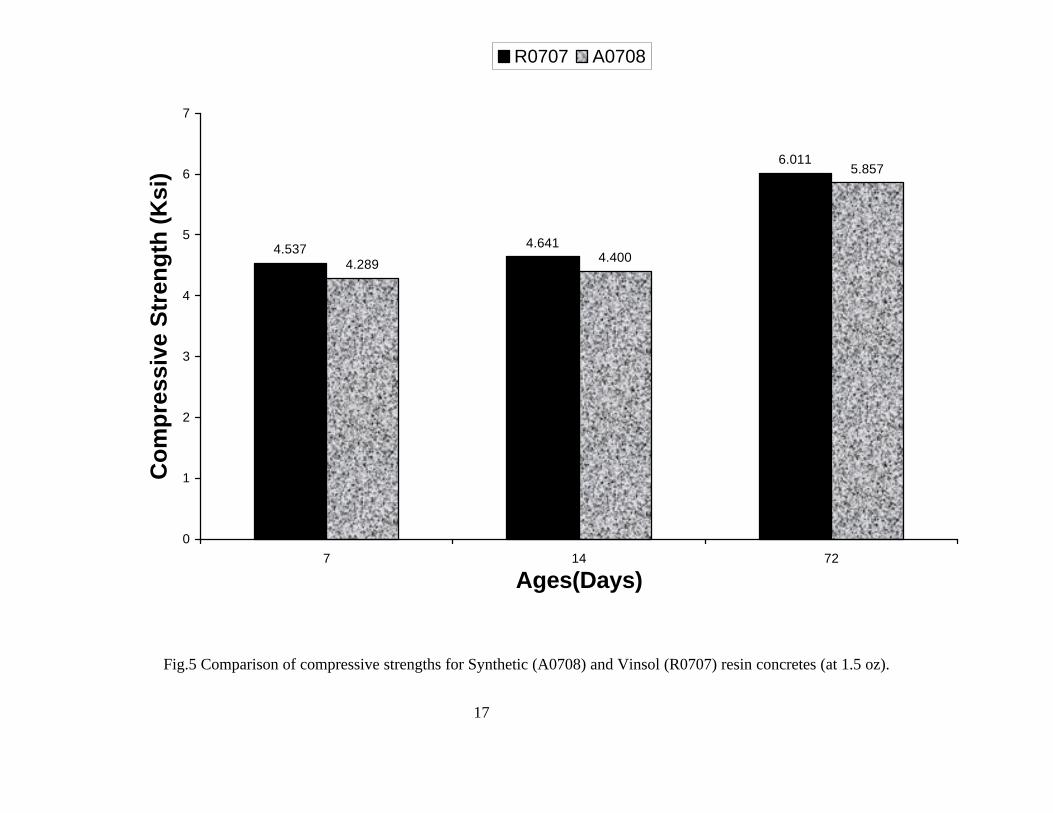
in Figs. 5 and 6, similar comparisons could be made for the 1.5 and 2.0 oz dosages of
admixtures. The 1.5-oz dosage did not produce consistent results in all cases, and more
experiments will be performed in future research to develop consistent data for this
dosage.
Results from the image analysis of the hardened concrete samples are given next. As
discussed earlier, the automated image analysis system facilitated a more thorough
examination of the network of air bubbles within the hardened paste. Typical data
corresponding to the air bubble size distribution and count (frequency) for the control
sample (non-air-entrained concrete) is shown in Fig.7. For air entrained concrete, data
were compared in a number of different ways in order to understand the effects of sir
entraining admixture type on the bubble characteristics. Figs. 8 and 9 correspond to the
comparison of typical Synthetic and Vinsol resin mixtures at the same dosage of air
entraining admixture.
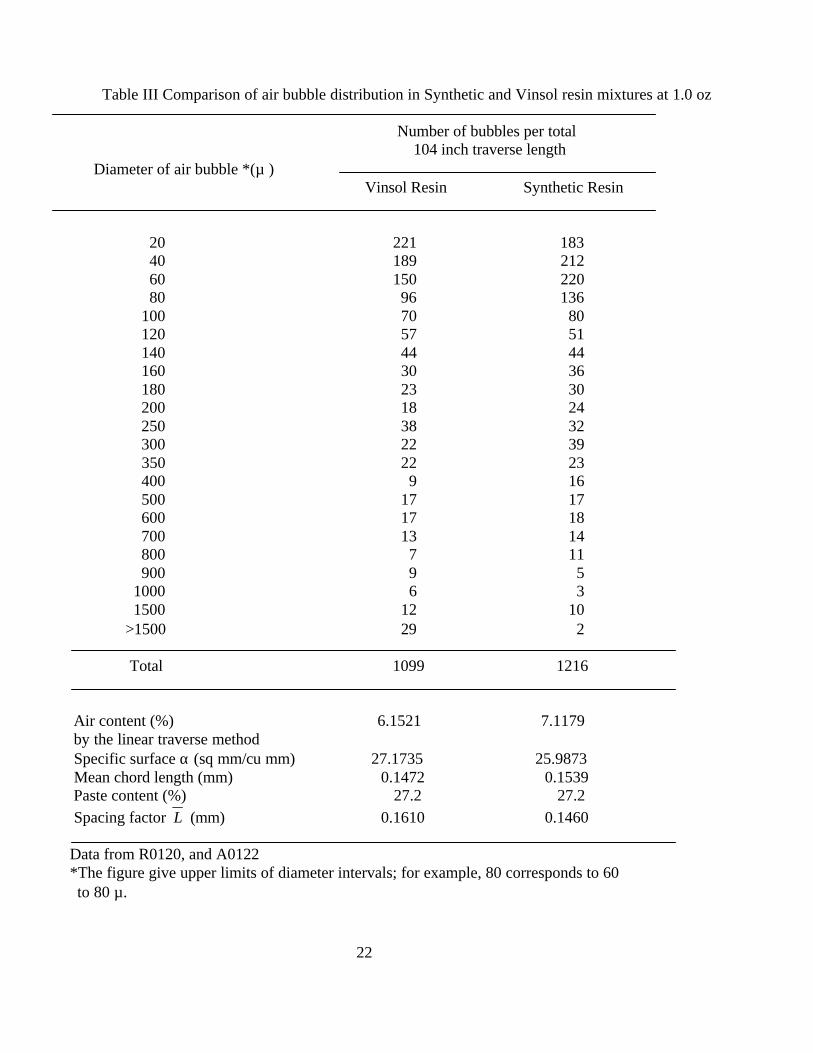
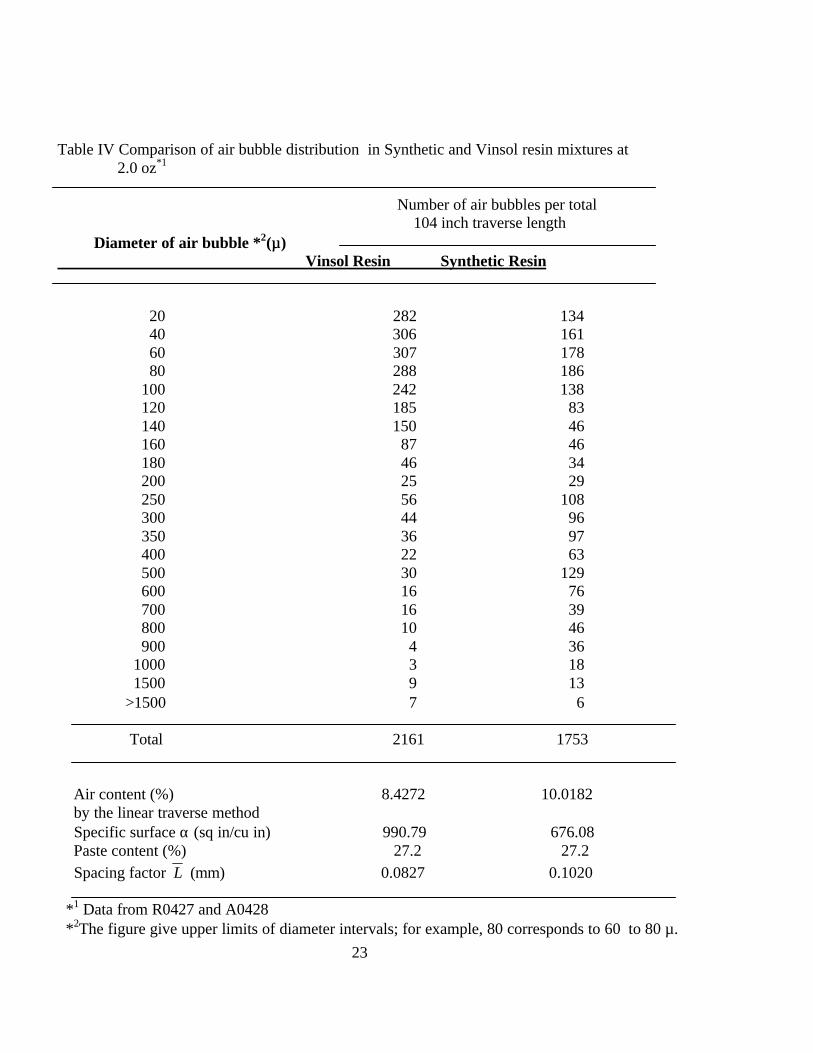
In a similar manner, tables 3 and 4 correspond to comparison of air bubble size
distribution for mixtures containing similar dosages of air entraining admixtures. Finally,
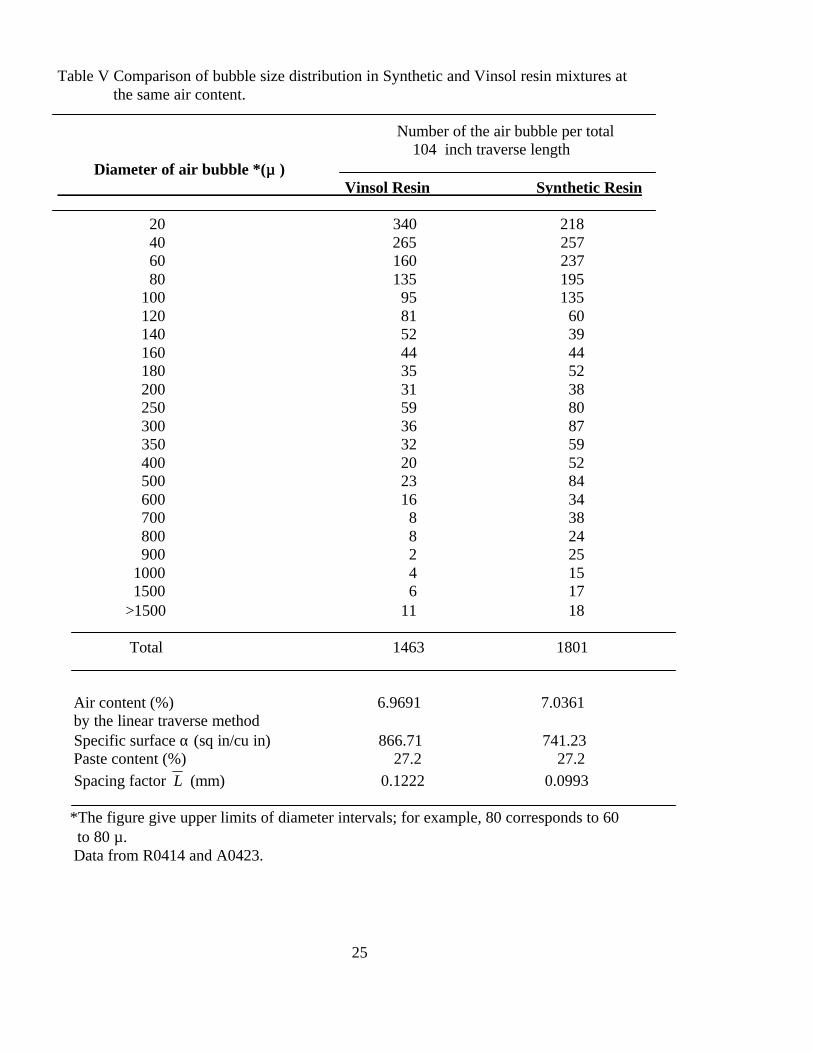
the air bubble distribution of the Synthetic and Vinsol resin mixtures at the same air
content are compared in Fig.10 and table 5. As shown by all these results, Vinsol resin
admixture produces more of the smaller bubble sizes desirable for protection against
frost. In fact, comparison of air bubble size count reveals that the main reason for higher
air contents in Synthetic mixtures is due to the increased number of larger air bubbles
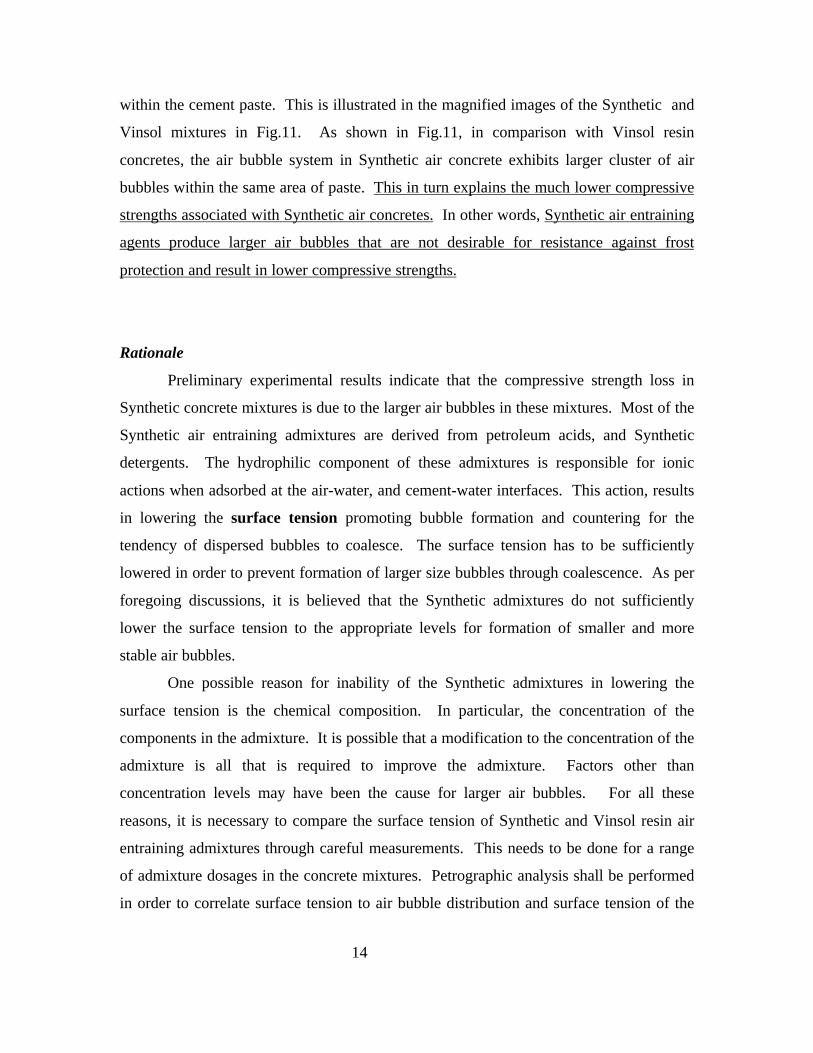
14
within the cement paste. This is illustrated in the magnified images of the Synthetic and
Vinsol mixtures in Fig.11. As shown in Fig.11, in comparison with Vinsol resin
concretes, the air bubble system in Synthetic air concrete exhibits larger cluster of air
bubbles within the same area of paste. This in turn explains the much lower compressive
strengths associated with Synthetic air concretes. In other words, Synthetic air entraining
agents produce larger air bubbles that are not desirable for resistance against frost
protection and result in lower compressive strengths.
Rationale
Preliminary experimental results indicate that the compressive strength loss in
Synthetic concrete mixtures is due to the larger air bubbles in these mixtures. Most of the
Synthetic air entraining admixtures are derived from petroleum acids, and Synthetic
detergents. The hydrophilic component of these admixtures is responsible for ionic
actions when adsorbed at the air-water, and cement-water interfaces. This action, results
in lowering the surface tension promoting bubble formation and countering for the
tendency of dispersed bubbles to coalesce. The surface tension has to be sufficiently
lowered in order to prevent formation of larger size bubbles through coalescence. As per
foregoing discussions, it is believed that the Synthetic admixtures do not sufficiently
lower the surface tension to the appropriate levels for formation of smaller and more
stable air bubbles.
One possible reason for inability of the Synthetic admixtures in lowering the
surface tension is the chemical composition. In particular, the concentration of the
components in the admixture. It is possible that a modification to the concentration of the
admixture is all that is required to improve the admixture. Factors other than
concentration levels may have been the cause for larger air bubbles. For all these
reasons, it is necessary to compare the surface tension of Synthetic and Vinsol resin air
entraining admixtures through careful measurements. This needs to be done for a range
of admixture dosages in the concrete mixtures. Petrographic analysis shall be performed
in order to correlate surface tension to air bubble distribution and surface tension of the

15
admixture. Analysis of these results will enable the manufacturers to make the necessary
adjustments to the chemical composition of their admixtures.
6. CONCLUSIONS
An experimental program of research was undertaken through which it was
possible to determine the cause and mechanisms leading to the lower compressive
strengths in concrete mixtures containing Synthetic air entraining admixtures. Research
involved testing of concrete samples in fresh as well as hardened state. Petrographic
analysis of the hardened samples revealed that the Vinsol resin admixture produces more
of the smaller bubbles desirable for protection against frost. Whereas, Synthetic
admixtures induce more of the larger air bubbles within the cement paste. This explains
the much lower compressive strengths associated with Synthetic air concretes. It is
believed that the larger air bubbles are produced due to the inability of the Synthetic air
entraining agents to lower the surface tension in the mixture. This will allow the smaller
air bubbles to coalesce into larger ones. Based on the results of this study,
recommendations were made that follow up research should involve determination of
surface tension in such mixtures. This will be done in the follow up stud

16
Fig.4 Comparison of compressive strengths for Synthetic (A0122) and Vinsol (R0120) resin concretes (at 1.0 oz).
5.391
6.005 6.095
6.987
3.782
4.293
5.0215.229
0
1
2
3
4
5
6
7
8
7 14 28 56
Age(Days)
Str
eng
th (
Ksi
)R0120 A0122
17
Fig.5 Comparison of compressive strengths for Synthetic (A0708) and Vinsol (R0707) resin concretes (at 1.5 oz).
4.537 4.641
6.011
4.289 4.400
5.857
0
1
2
3
4
5
6
7
7 14 72
Ages(Days)
Co
mp
ress
ive
Str
eng
th (
Ksi
)
R0707 A0708

18
Fig.6 Comparison of compressive strengths for Synthetic (A0428) and Vinsol (R0427) resin concretes (at 2.0 oz)
3.776
4.672 4.630
4.954
2.846
3.329 3.373
3.779
0.000
1.000
2.000
3.000
4.000
5.000
6.000
7 14 28 56
Age (days)
Str
eng
th (
ksi)
R0427 A0428

19
Fig.7 Bubble size distribution in the control sample (non-air entrained concrete).
0
20
40
60
80
100
1 5 9 13 17 21 25 29 33 37 41 45 49 53 57 61 65 69 73 77 81 85 89 93 97
Bubble Size (x10 micron)
Bu
bb
le F
req
uen
cy

20
Fig.8 Comparison of bubble size distribution for samples containing 1.0 oz of air entraining admixture.
0
20
40
60
80
100
120
140
Bubble Size (x10micron)
Bu
bb
le F
req
uen
cy
R0120 A0122
Synthetic Air Concrete
Vinsol Resin Concrete

21
Fig.9 Comparison of bubble size distribution for samples containing 2.0 oz of air entraining admixture.
0
20
40
60
80
100
120
140
160
180
1 11 21 31 41 51 61 71 81 91
Bubble Size(x10micron)
Bu
bb
le f
ren
qu
ency
A0428 R0427
Synthetic Air Concerte
Vinsol Resin Concrete
22
Table III Comparison of air bubble distribution in Synthetic and Vinsol resin mixtures at 1.0 oz
Number of bubbles per total 104 inch traverse length Diameter of air bubble *(µ ) Vinsol Resin Synthetic Resin
20 221 183 40 189 212 60 150 220 80 96 136 100 70 80 120 57 51 140 44 44 160 30 36 180 23 30 200 18 24 250 38 32 300 22 39 350 22 23 400 9 16 500 17 17 600 17 18 700 13 14 800 7 11 900 9 5 1000 6 3 1500 12 10 >1500 29 2
Total 1099 1216
Air content (%) 6.1521 7.1179 by the linear traverse method Specific surface α (sq mm/cu mm) 27.1735 25.9873 Mean chord length (mm) 0.1472 0.1539 Paste content (%) 27.2 27.2 Spacing factor L (mm) 0.1610 0.1460
Data from R0120, and A0122 *The figure give upper limits of diameter intervals; for example, 80 corresponds to 60 to 80 µ.
23
Table IV Comparison of air bubble distribution in Synthetic and Vinsol resin mixtures at 2.0 oz*1
Number of air bubbles per total 104 inch traverse length Diameter of air bubble *2(µµ) Vinsol Resin Synthetic Resin
20 282 134 40 306 161 60 307 178 80 288 186 100 242 138 120 185 83 140 150 46 160 87 46 180 46 34 200 25 29 250 56 108 300 44 96 350 36 97 400 22 63 500 30 129 600 16 76 700 16 39 800 10 46 900 4 36 1000 3 18 1500 9 13 >1500 7 6
Total 2161 1753
Air content (%) 8.4272 10.0182 by the linear traverse method Specific surface α (sq in/cu in) 990.79 676.08 Paste content (%) 27.2 27.2 Spacing factor L (mm) 0.0827 0.1020
*1 Data from R0427 and A0428 *2The figure give upper limits of diameter intervals; for example, 80 corresponds to 60 to 80 µ.

24
Fig.10 Air bubble size distribution at the same air content.
0
20
40
60
80
100
120
140
160
180
1 11 21 31 41 51 61 71 81 91
Bubble Size(x10micron)
Bu
bb
le f
ren
qu
ency
Synthetic Air Concrete Vinsol Resin Concrete
Synthetic Air Concerte
Vinsol Resin Concrete
Air content for bothmixtures is 6%
25
Table V Comparison of bubble size distribution in Synthetic and Vinsol resin mixtures at the same air content.
Number of the air bubble per total 104 inch traverse length Diameter of air bubble *(µµ ) Vinsol Resin Synthetic Resin
20 340 218 40 265 257 60 160 237 80 135 195 100 95 135 120 81 60 140 52 39 160 44 44 180 35 52 200 31 38 250 59 80 300 36 87 350 32 59 400 20 52 500 23 84 600 16 34 700 8 38 800 8 24 900 2 25 1000 4 15 1500 6 17 >1500 11 18
Total 1463 1801
Air content (%) 6.9691 7.0361 by the linear traverse method Specific surface α (sq in/cu in) 866.71 741.23 Paste content (%) 27.2 27.2 Spacing factor L (mm) 0.1222 0.0993
*The figure give upper limits of diameter intervals; for example, 80 corresponds to 60 to 80 µ. Data from R0414 and A0423.

26
Air bubble system inconcrete with VinsolResin type admixture
Air bubble system inconcrete with Synthetic
resin type admixture
5 mm
Fig.11 Comparison of air bubble size and distribution within the same area of paste.