effects of targeting pod modification on f/a-18c hornet ... on f/a-18c hornet weapons release c. w....
TRANSCRIPT

ABSTRACT
This paper describes a study that investigated the efficacy of modifications to the trailing end of
the externally mounted advanced targeting forward looking infrared pod (ATFLIR) on the store
separation characteristics of the F/A-18C aircraft. Prior work by Godiksen suggests that the trailing
end of the geometrically similar targeting forward looking infrared pod (TFLIR) is the likely source
of shock waves that can adversely impact the trajectory of a recently released store. In our study
five different modifications to the aft end of the ATFLIR were analysed using computational fluid
dynamics (CFD). The two most promising designs, an ogive shape such as that used in artillery
shells and rockets, and a simpler extended but truncated cone shape were then further investigated.
The moments that these trailing shapes produced on an adjacent released store were compared.
CFD analysis revealed that the simpler cone shape resulted in weaker shocks from the aft end of
the pod with a resultant smaller adverse moment on the store. While there is an extensive history
of using CFD to predict store separation behavior, results from our study should be compared with
wind tunnel data in order to validate the CFD simulations.
NOMENCLATURE
6-DOF six-degree of freedom
AOA angle-of-attack
ATFLIR advanced targeting forward looking infrared pod
CD drag coefficient
CFD computational fluid dynamics
THE AERONAUTICAL JOURNAL JULY 2012 VOLUME 116 NO 1181 743
Effects of targeting pod modification on F/A-18C Hornetweapons release
C. W. O’Brien and M. R. Snyder
Department of Mechanical Engineering,
United States Naval Academy (USNA)
Annapolis, USA
E. N. Hallberg
Department of Aerospace Engineering, USNA
Annapolis, USA
A. Cenko
Store Separation Consultant, Dunkirk
Maryland, USA
Paper No. 3555. Manuscript received 10 March 2010, revised version received 20 June 2011,
2nd revised version 11 December 2011, accepted 12 January 2012.

Cmx x direction moment coefficient
Cmy y direction moment coefficient
Cmz z direction moment coefficient
F/A-18C US Navy and Allied fighter attack aircraft
GBU glide bomb unit
IFM influence function method
JDAM joint direct attack munition
Mk-82 500lb gravity bomb
Mk-83 1,000lb gravity bomb
Mk-84 2,000lb gravity bomb
PSP pressure sensitive paint
S-3B USN carrier based high wing multi-purpose aircraft
SLAM-ER Standoff land attack missile – expanded response
TFLIR targeting forward looking infrared pod
TTCP The Technical Cooperative Program
USNA United States Naval Academy
1.0 INTRODUCTION
In order to establish safe flight conditions for the release of bombs or other stores from attack
aircraft, the US Navy conducts flight tests at various aircraft attitudes, Mach numbers and store
configurations and determines the initial path taken by the falling store. This determination of path
is generally made using a series of high speed photographs, known as photogrammetrics, or the
analysis of data taken from an accelerometer located on the store itself, known as telemetry. Though
very accurate, many such flight tests are necessary in order to approve a range of acceptable flight
conditions, and these are costly in both time and money. In the absence of pre-flight analysis, the
most benign flight condition is chosen as the starting point of the flight test, typically fully subsonic.
The release envelope is gradually expanded through subsequent releases by increasing the Mach
and altitude. Many such flights are required to reach the boundary of the aircraft flight envelope.
The number and duration of flights required can be significantly reduced by predicting trajec-
tories before flights are begun. This pre-flight flow analysis is accomplished in both the wind tunnel
and through computational fluid dynamics (CFD). Prior to any flight testing, predicted trajectories
are obtained using one or both of these methods, and these results are used to determine which
configurations require flight tests and to what extent. For instance, a clearance to Mach 0.95 may
require a build-up approach beginning at a benign flight condition such as Mach 0.80 and
progressing up to Mach 0.95 at incremental steps of Mach 0.05. Extensive wind tunnel and CFD
analysis could permit fewer steps in the build-up to the endpoint if CFD and wind tunnel analysis
shows the endpoint to be safe, and interim flight test steps match predictions.
2.0 BACKGROUND
The basis for this research began with routine bombing practice conducted in Fallon, Nevada in
December 1998. The pilot was flying an F/A-18C aircraft with a targeting forward looking
infrared pod (TFLIR) mounted on the side of the plane’s fuselage and a Mk-82 500lb bomb hanging
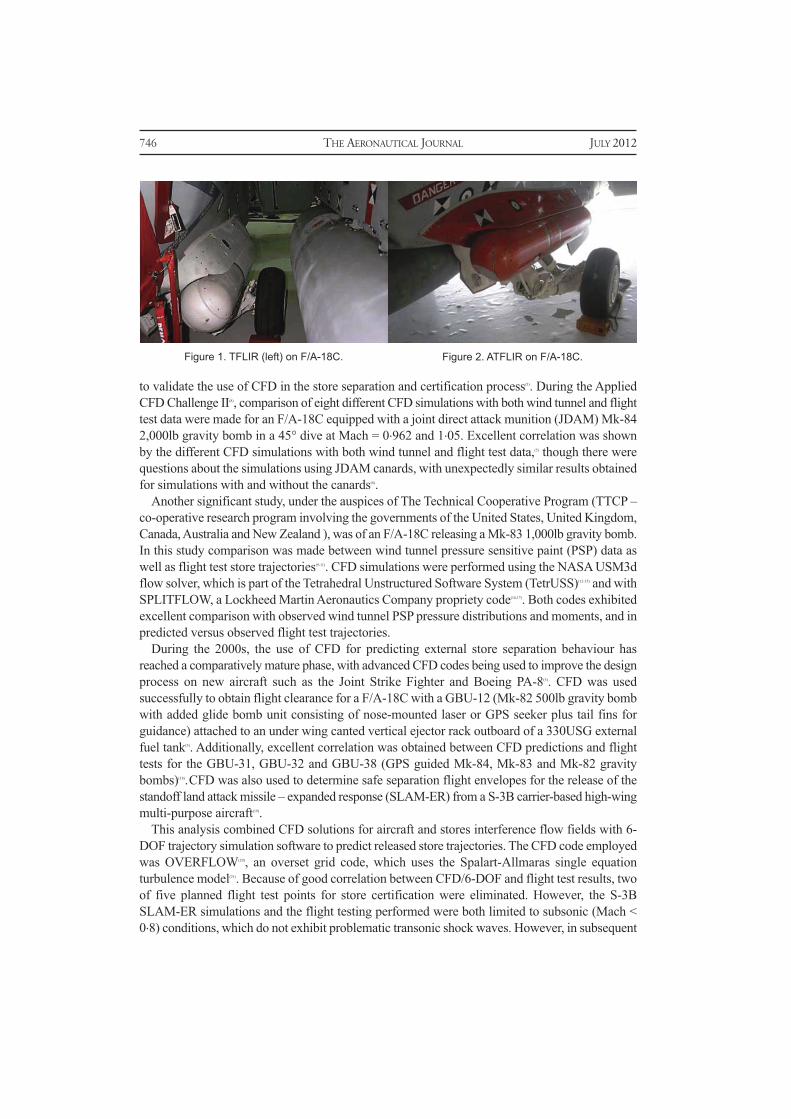
from the inboard wing pylon adjacent to the targeting pod. Figure 1 shows an F/A-18C aircraft
with a TFLIR attached to the fuselage and a fuel tank attached to the inboard pylon.
744 THE AERONAUTICAL JOURNAL JULY 2012

When the pilot released the Mk-82 from his aircraft, the nose of the bomb yawed away from
the fuselage which caused the bomb’s tail fins to impact the TFLIR. This result was unexpected
as this flight condition had been cleared for safe release in the aircraft’s tactical manual. An investi-
gation soon revealed that the TFLIR had been considered a part of the aircraft and that its effect
on store separation had been assumed to be negligible. As a result, neither wind tunnel nor flight
testing had been done to determine what affect the TFLIR might have on store release. After this
incident, the U.S. Navy began a flight test program in order to establish safe release parameters.
As will be discussed in a following section, analysis by Godiksen(1) showed that CFD could be useful
in predicting stores release behaviour on the F/A-18C equipped with the TFLIR pod.
At this same time the Navy introduced the advanced targeting forward looking infrared pod
(ATFLIR), which is geometrically similar to the TFLIR but significantly more capable. Figure 2
shows an ATFLIR mounted on an F/A-18C. The main difference in shape between these two pods
is the fairing on the leading end of the ATFLIR, which is not present on the TFLIR. In most other
aspects, these pods look essentially identical. There are subtle differences in the geometry of the
trailing end of the pods which were initially thought to be insignificant compared to the larger
differences in their front-end geometries. This assumption was later shown to be incorrect.
This pod was examined in the flight test program in the same manner as the TFLIR. It was expected
that the ATFLIR would have nearly the same effect on the aircraft’s flow field as the TFLIR due to
their geometric similarity. However, flight test results soon proved otherwise. At speeds just under
the speed of sound, between Mach 0.90 and 0.95, the flight test results showed significant differences
in the trajectories of bombs dropped next to the TFLIR versus those beside the ATFLIR. Although
the cause of this variance was not understood, time and schedule constraints precluded further
research. The flight test program concluded by restricting the release of certain stores in proximity
to either targeting pod to a subset of the full combat aircraft flight envelope.
While these test flights were successful in establishing safe store release conditions for these
pods, they did not produce a full understanding of the effect of the (A)TFLIR pod on the F/A-18C
flow field. Furthermore, the full operating envelope of the combat aircraft was restricted. Analysis
of this release condition is challenging. The geometric differences between the two pods are subtle
and the flow field at the Mach of interest is fully transonic with a number of shocks forming and
moving as the store is released. CFD may allow for a detailed investigation of the affect of different
ATFLIR aft section geometries on store separation.
3.0 LITERATURE REVIEW
Attempts to determine aircraft store separation characteristics using numerical methods date from
the late 1970s and early 1980s, where simple codes (e.g. 1,000 panels) were used to provide a solution
for an external store on an aircraft(2-4). These codes were very limited and were not accepted by wind
tunnel and flight test engineers as validated tools to determine store separation characteristics(5).
During the 1980s, as computational capabilities improved significantly, more advanced CFD
simulations, such as the influence function method (IFM)(6,7), were developed to help determine loads
and moments for external stores. The IFM method used CFD to determine the aircraft flow field
which was used to quantify the impact of the flow field on stores, with resultant store aerodynamic
coefficients applied to determine store trajectories with a six-degree-of-freedom (6-DOF)
programme. This was a one-way coupling method where store modification of the aircraft flow field
was not evaluated.
During the 1990s extensive efforts were made to validate and accelerate the use of CFD in the
store certification process. Four major international conferences were completed that attempted
O’BRIEN ET AL EFFECTS OF TARGETING POD MODIFICATION ON F-18C HORNET WEAPONS... 745
to validate the use of CFD in the store separation and certification process(5). During the Applied
CFD Challenge II(8), comparison of eight different CFD simulations with both wind tunnel and flight
test data were made for an F/A-18C equipped with a joint direct attack munition (JDAM) Mk-84
2,000lb gravity bomb in a 45° dive at Mach = 0.962 and 1.05. Excellent correlation was shown
by the different CFD simulations with both wind tunnel and flight test data,(5) though there were
questions about the simulations using JDAM canards, with unexpectedly similar results obtained
for simulations with and without the canards(8).
Another significant study, under the auspices of The Technical Cooperative Program (TTCP –
co-operative research program involving the governments of the United States, United Kingdom,
Canada, Australia and New Zealand ), was of an F/A-18C releasing a Mk-83 1,000lb gravity bomb.
In this study comparison was made between wind tunnel pressure sensitive paint (PSP) data as
well as flight test store trajectories(9-11). CFD simulations were performed using the NASA USM3d
flow solver, which is part of the Tetrahedral Unstructured Software System (TetrUSS)(12-15) and with
SPLITFLOW, a Lockheed Martin Aeronautics Company propriety code(16,17). Both codes exhibited
excellent comparison with observed wind tunnel PSP pressure distributions and moments, and in
predicted versus observed flight test trajectories.
During the 2000s, the use of CFD for predicting external store separation behaviour has
reached a comparatively mature phase, with advanced CFD codes being used to improve the design
process on new aircraft such as the Joint Strike Fighter and Boeing PA-8(5). CFD was used
successfully to obtain flight clearance for a F/A-18C with a GBU-12 (Mk-82 500lb gravity bomb
with added glide bomb unit consisting of nose-mounted laser or GPS seeker plus tail fins for
guidance) attached to an under wing canted vertical ejector rack outboard of a 330USG external
fuel tank(5). Additionally, excellent correlation was obtained between CFD predictions and flight
tests for the GBU-31, GBU-32 and GBU-38 (GPS guided Mk-84, Mk-83 and Mk-82 gravity
bombs)(18).CFD was also used to determine safe separation flight envelopes for the release of the
standoff land attack missile – expanded response (SLAM-ER) from a S-3B carrier-based high-wing
multi-purpose aircraft(19).
This analysis combined CFD solutions for aircraft and stores interference flow fields with 6-
DOF trajectory simulation software to predict released store trajectories. The CFD code employed
was OVERFLOW(20), an overset grid code, which uses the Spalart-Allmaras single equation
turbulence model(21). Because of good correlation between CFD/6-DOF and flight test results, two
of five planned flight test points for store certification were eliminated. However, the S-3B
SLAM-ER simulations and the flight testing performed were both limited to subsonic (Mach <
0.8) conditions, which do not exhibit problematic transonic shock waves. However, in subsequent
746 THE AERONAUTICAL JOURNAL JULY 2012
Figure 1. TFLIR (left) on F/A-18C. Figure 2. ATFLIR on F/A-18C.

work by Godiksen(1), simulations using USM3d of transonic shock waves at Mach = 0.8 and 0.95
interacting with released stores approximately matched flight test results.
Most examples, including those previously discussed, of the successful application of CFD to
stores separation analysis have been limited to aircraft modifications involving placement of stores
in a different location from what was previously cleared through extensive flight test and wind
tunnel testing. There is little published evidence, however, concerning the validation of CFD
analyses of new store designs on existing aircraft, existing store designs on new aircraft, new store
designs on new aircraft, or the behaviour of stores released from an internal cavity(5,22).
It is important to note that wind tunnel testing can have separate errors that can cause disparities
between wind tunnel data and CFD simulations. Wind tunnel testing of stores involves the use of
stings which are assumed to not produce moments on the store, though there is some data that
suggest this is not always the case(23,24). Wind tunnels also exhibit blockage effects, which are not
present in flight test nor usually modeled by CFD.
4.0 USE OF NASA USM3D IN STORE SEPARATIONANALYSIS
USM3d is one of several advanced CFD codes that have been used in store separation analysis.
As mentioned previously, it was used successfully in the Applied CFD Challenge II(8) and in the
TTCP F/A-18C/Mk-83 study(9-11). This section will discuss other more recent applications of
USM3d in store separation analysis.
Godiksen(1,25) used USM3d to complete a detailed study of the effects of different external targeting
pods, specifically the TFLIR, ATFLIR and Litening, on the store separation characteristics of the
F/A-18C. In this study Godiksen shows good comparison between CFD simulations and wind tunnel
testing for an F/A-18C in a clean configuration (no pods or stores) for flow up wash and side wash
angles at various points in the flow for both Mach 0.8 and 0.95. Godiksen completed separate CFD
simulations of a GBU-31 at Mach 0.95 and compared resultant forces and moments with wind tunnel
data for angle-of-attacks (AOA) between –20° and 30°. Comparisons were very close except for some
variation around 15° AOA. Godiksen speculated that the difference there may have arisen from the
CFD failing to capture the effect of vortices generated by body strakes impacting tail fins, or by
interference effects of the test apparatus in the wind tunnel. Simulations of the impact of the clean
and ATFLIR equipped F/A-18C on the released GBU-31 were completed using USM3d and then
compared with available flight test data. Comparison of horizontal and vertical position data
showed good correlation for the first 0.2 seconds after release. Predicted horizontal displacement
diverged after 0.2 seconds, though vertical displacement tracked well for the 0.4 second after release
period evaluated. CFD and flight test data for yaw and pitch angle track closely for the first 0.3
seconds after release, and then increasingly diverged. Godiksen noted, however, that the flight test
data was taken using cameras on an aircraft flying abeam of the aircraft releasing the store, with
resultant less accurate readings in the horizontal direction.
Simpson(26) used USM3d to compare developed pitch and yawing moments on a Mk-82 500lb
bomb from the ATFLIR pod and from the geometrically different and physically larger Litening
pod, with both targeting pods mounted externally on the fuselage of a F/A-18C. Both the CFD
simulations and limited wind tunnel testing(27,28) show that the Litening pod, as compared with the
physically smaller ATFLIR, has reduced pitch and yaw moments on a Mk-82 bomb released and
descending from an adjacent under wing pylon. In Simpson’s study the aircraft with the ATFLIR
used a 7.6m tetrahedral simulation while the aircraft with the Litening pod was modeled with 12.7m
O’BRIEN ET AL EFFECTS OF TARGETING POD MODIFICATION ON F-18C HORNET WEAPONS... 747

tetrahedral. Both simulations used a wall function boundary layer formulation(15) with the Spalart-
Allmaras(21) single equation turbulence model, the latter which was also used in the S-3B SLAM
ER study where CFD/6-DOF trajectories compared well with flight test trajectories(19). Although
Simpson’s CFD simulation store moments did not exactly match the wind tunnel test data, the
trends in moments did show general correlation (e.g. positive moment increasing with increasing
Mach). Some of the error could possibly be attributed to comparison of wind tunnel results from
two different wind tunnels that are different in size and scale (with aircraft models of different
scale), and using a plane of symmetry model of the aircraft in one of the tunnels. Also, the aircraft
models were modified to affix the balance from each wind tunnel.
Finally, in an analysis similar to that used herein, Shea(29) used USM3d to show that repositioning
an external air cooling intake scoop on the Litening Pod could improve the store separation
748 THE AERONAUTICAL JOURNAL JULY 2012
Figure 3. Original. Figure 4. Version 2.
Figure 5. Version 3. Figure 6. Version 4.
characteristics for a Mk-83 1,000lb gravity bomb released from an F/A-18C in the range 0.8 ≤
Mach ≤ 0.98. For an F/A-18C in a 60° dive at Mach 0.94 and 11,400ft, minimum miss distance
was increased from approximately 3 to 6 inches. However, and similar to this study, validation of
Shea’s results via wind tunnel testing was recommended.
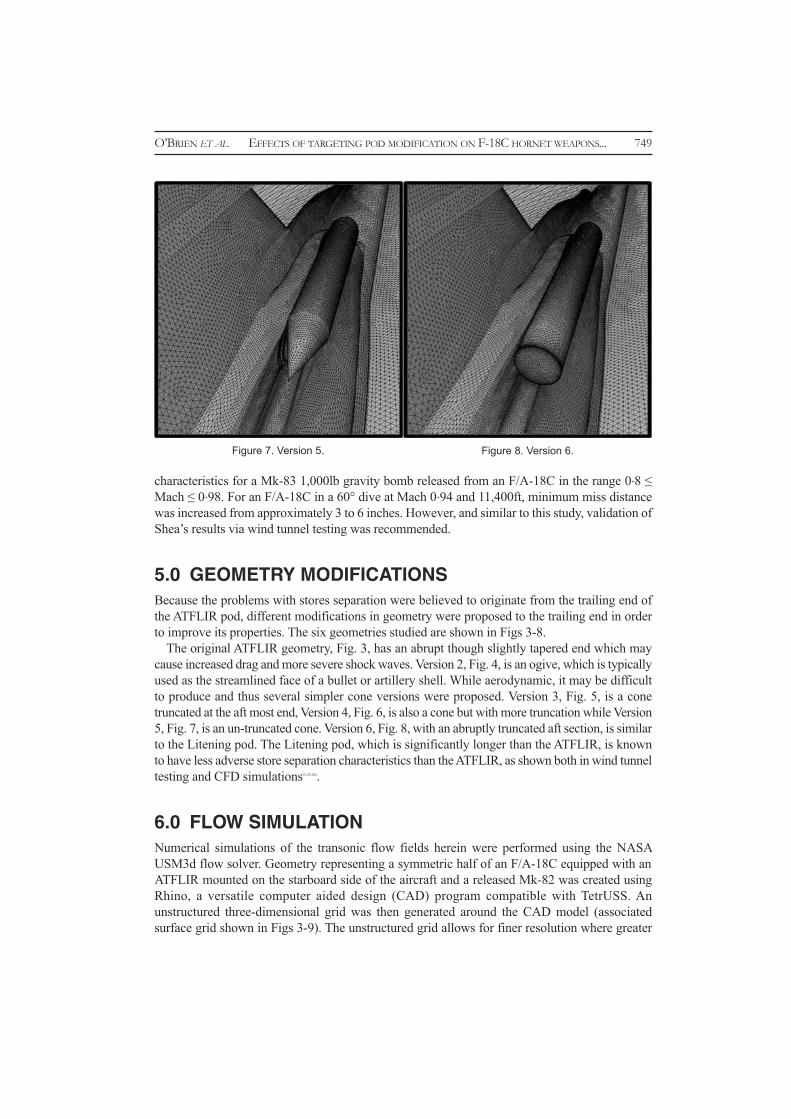
5.0 GEOMETRY MODIFICATIONSBecause the problems with stores separation were believed to originate from the trailing end of
the ATFLIR pod, different modifications in geometry were proposed to the trailing end in order
to improve its properties. The six geometries studied are shown in Figs 3-8.
The original ATFLIR geometry, Fig. 3, has an abrupt though slightly tapered end which may
cause increased drag and more severe shock waves. Version 2, Fig. 4, is an ogive, which is typically
used as the streamlined face of a bullet or artillery shell. While aerodynamic, it may be difficult
to produce and thus several simpler cone versions were proposed. Version 3, Fig. 5, is a cone
truncated at the aft most end, Version 4, Fig. 6, is also a cone but with more truncation while Version
5, Fig. 7, is an un-truncated cone. Version 6, Fig. 8, with an abruptly truncated aft section, is similar
to the Litening pod. The Litening pod, which is significantly longer than the ATFLIR, is known
to have less adverse store separation characteristics than the ATFLIR, as shown both in wind tunnel
testing and CFD simulations(1,25,26).
6.0 FLOW SIMULATIONNumerical simulations of the transonic flow fields herein were performed using the NASA
USM3d flow solver. Geometry representing a symmetric half of an F/A-18C equipped with an
ATFLIR mounted on the starboard side of the aircraft and a released Mk-82 was created using
Rhino, a versatile computer aided design (CAD) program compatible with TetrUSS. An
unstructured three-dimensional grid was then generated around the CAD model (associated
surface grid shown in Figs 3-9). The unstructured grid allows for finer resolution where greater
O’BRIEN ET AL EFFECTS OF TARGETING POD MODIFICATION ON F-18C HORNET WEAPONS... 749
Figure 7. Version 5. Figure 8. Version 6.

variation in air flow is expected. Different grids were generated for various prospective tail sections
on the ATFLIR.
All simulations were performed at a zero angle of attack, since this typically has been the most
limiting case for store separation from the F/A-18C(1). Since we were interested in incremental changes
in moments on the released Mk-82 due to changes in the ATFLIR aft geometry, and to simplify
calculations, air flow through the starboard side aircraft engine was not modeled in these simulations.
The grids for the ATFLIR were initially divided into approximately 12.7m tetrahedrals, each of
varying size and generated from the underlying surface grid. A second set of grids of approximately
19.7m tetrahedrals were also used as part of a subsequent grid refinement study. The tetrahedral
grids were divided into partitions to allow parallel processing on the US Naval Academy (USNA)
Thresher cluster. Simulations were performed using a full viscous or a wall function boundary
layer(15), both with Spalart-Allmaras(21) single equation turbulence model.
Moments on the released Mk-82 bomb were calculated by USM3d while flow visualisation was
done using TecPlot and EnSight visualisation software.
For the 12.7m tetrahedral grid a given solution would take approximately 32 hours to converge
on eight processors, for a total time of approximately 256 processor hours per solution.
Convergence was noted when the log of average residuals, or change in flow conditions in a given
tetrahedral between iterations, decreased by approximately –2.0 (or flow variation between
computational iterations had decreased to approximately 1% of the initial variation). Simulations
750 THE AERONAUTICAL JOURNAL JULY 2012
Figure 10. Original (left) vs version 4 (right) pressure distribution.
Figure 9. Surface grid of varying resolution.

were repeated for each ATFLIR version for 0.8 ≤ Mach ≤ 0.98 using the full viscous boundary layer
model. Simulations were repeated for Versions 2 and 4 at Mach 0.85, 0.90 and 0.95 using the wall
function boundary layer. Additional simulations were done for Versions 2 and 4 with the 19.7m
tetrahedral grid using the full viscous boundary layer at Mach 0.85, 0.90 and 0.95. The 19.7m
tetrahedral grid solutions required approximately 500 processor hours to converge. Total processor
hours required were approximately 24,500.
7.0 ANALYSIS METHODIn order to select the most promising versions for additional analysis, initial comparisons were made
of the overall drag coefficient CD exhibited by each ATFLIR version over the Mach range studied.
This analysis is based on the assumption that CD is an indicator of the pressure gradient on the
trailing end, and thus an indicator of the severity and angle of incidence of the shock wave. This
effect can be shown in the comparison of the original ATFLIR and Version 4 in Fig. 10. The less
shading on the modified version indicated a lower pressure, and thus a lower drag. Because the
shock wave is formed by a difference in pressure, this pressure and drag difference is often a good
indicator of the intensity and angle from the ATFLIR that the shock wave will form.
O’BRIEN ET AL EFFECTS OF TARGETING POD MODIFICATION ON F-18C HORNET WEAPONS... 751
Figure 11. ATFLIR on F/A-18C.
Figure 12. Improvement in drag counts over original ATFLIR vs Mach.
Figure 13. Drag coefficient vs Mach for original and modified ATFLIR.

Previous studies(1,25,26,28) have shown that the main source of adverse store separation character-
istics stems from the blunt aft section of the pod. This part of the pod can generate a shockwave
that hits the tail of the store, which can cause a detrimental yawing moment and thus, potentially,
a collision between the store and aircraft. Visualisation from underneath a F/A-18C with an
ATFLIR and a released Mk-82 is provided in Fig. 11. In this view it is clear that the shockwave
from the nose of the ATFLIR strikes the store in the middle of its body, whereas the shockwave
from the aft of the pod strikes close to the fins of the Mk-82. This flow visualisation shows how
the shock wave from the aft section of a targeting pod, which was previously thought to be
inconsequential, can have a large effect on the store separation properties.
8.0 RESULTSA ‘Mach sweep’ for all versions was conducted using the 12.7m tetrahedral grid with a full viscous
boundary layer. The resultant CD were then calculated and compared. Figure 12, which shows
incremental improvement in CD over the original ATFLIR, as measured by drag counts (one drag
count = .001 change in CD) indicates that all modifications produced less drag at all Mach than
the original version. The more positive the number shown in Fig. 12, then the greater the
improvement in drag counts over the original aft end configuration. In Fig. 12 the average of
Version 2 and Version 4 are also shown as horizontal lines. An average CD over all Mach analysed
was used to determine the best versions, although future work may want to put more emphasis
on a specific Mach range that is more critical to the aircraft flight envelope. From this analysis it
was determined that Version 2 and Version 4 were the two most promising modifications, with
752 THE AERONAUTICAL JOURNAL JULY 2012
Figure 14. Formation of shockwave. Figure 15. z direction moment coefficient (Cmz) vsMa.
Figure 16. z direction moment coefficient (Cmz) vs Ma for Version 2 (left) and Version 4 (right).

Version 4 having slightly less drag than Version 2, especially at higher Mach. Figure 13 shows
the drag coefficient as the Mach is increased. This figure shows the general behavior that would
be expected and helps to validate the results.
This reduction in overall drag by itself may be enough to justify ATFLIR aft end modifications.
The fuel savings from the decrease in drag could justify the addition of a tail cone to minimise
the formation of adverse trailing end shock waves. The modification thus has the potential to
both reduce aircraft fuel consumption and improve the store separation characteristics of the
ATFLIR.
Version 2 and Version 4 were then investigated further. The computational space was altered,
inserting an Mk-82 store just released from the inboard pylon carriage position as shown in Fig.
9. This position is the point where the expected maximum interference between the shockwave
and Mk-82 will occur. A Mach sweep of both versions was conducted in this configuration. The
shock waves emanating from the store were visualised, and the moment coefficient on the Mk-
82 was extracted. The position of the store relative to the aircraft can also be seen in Fig. 11,
which is a view from below the F/A-18C.
The shockwave emanating from the two different versions are shown in Fig. 14. The
shockwave from the leading end of the ATFLIR is shown to intersect the store at about
midsection. This would not cause a large moment on the store and is not thought to generate
an adverse moment that could cause the store to contact the aircraft. However, the shockwave
from the trailing end intersects the store close to the tail of the Mk-82. This would cause a large
moment on the store and cause it to rotate, possibly into the aircraft.
As shown in Fig. 14, the shockwave emanating from Version 2 is slightly closer to the fins
of the store than the shockwave from Version 4. It can be seen that the shock wave from the tail
end of Version 2 emerges at an angle greater than that of Version 4, and interferes more with
O’BRIEN ET AL EFFECTS OF TARGETING POD MODIFICATION ON F-18C HORNET WEAPONS... 753
Figure 17. Flow visualisation at Ma 0.85 for original grid (left), finer grid (centre) and original grid with second turbulence model (right).

the Mk 82. Of interest is that the shockwave from Version 2 starts further aft, it departs at a more
oblique angle to the ATFLIR, and comes closer to the fins of the Mk-82. This indicates that
Version 4 performs better.
The moment coefficient on the store was also obtained from the simulations. The z direction
moment coefficient Cmz is plotted against Mach in Fig. 15. Figure 15 indicates that Version 4
interferes less with the store than Version 2. Both versions have similar behavior at low Mach.
However, at Mach 0.96 and 0.98, Version 2 creates a moment on the store that is approximately
10-15% greater than that from Version 4.
9.0 GRID REFINEMENT AND BOUNDARY LAYERSIMULATION STUDY
In order to help validate the comparison between Versions 2 and 4, additional simulations were
performed using a finer unstructured grid (19.7m tetrahedrals) and with the original 12.7m
tetrahedral grid but with a wall function boundary layer instead of a full viscous boundary layer
model. Sample results are shown in Fig. 16, which compares z direction moment coefficient Cmz
vs Mach for the different cases analysed. For both versions Cmz shows consistent trends
between the three sets of simulations. Similar results were obtained for Cmx and Cmy.
Comparison can also be made in flow visualisation between the three sets of simulations.
Figure 17 compares the shock waves between the 12.7m tetrahedral grid with full viscous
boundary layer, the 19.7m tetrahedral grid with full viscous boundary layer and the 12.7m
tetrahedral grid with wall function boundary layer, all at Mach 0.85. Figure 17 clearly shows
nearly identical shock waves present in all three simulations. Figure 17 visualisations are
consistent with similar trends in Cmx, Cmy and Cmz obtained in the three different sets of
numerical simulations.
10.0 CONCLUSIONSOur numerical simulations show that Version 4 has less overall drag than Version 2. Version 4
also produced a smaller moment on the Mk-82, especially at higher Mach. By visual inspection
of the shock wave, Version 4 also has qualitatively better performance which correlates with the
calculated moment coefficients. Consequently, Version 4 has been predicted to reduce adverse
store moments better than Version 2.
This result is counter to what was originally expected. It was assumed that the smoother ogive
shape, which has been designed to reduce drag in artillery shells and rockets, would produce
the better performance. However, the simpler and easier to manufacture version appears to
perform better. These results should be compared to wind tunnel test data of the modified
ATFLIR. This could be used to determine whether the calculations performed were valid with
possible eventual implementation of the modification.
ACKNOWLEDGMENTA portion of this research was performed while then Midshipman O’Brien was a summer intern
at the Maui High Performance Computing Center. The summer internship was funded by the
Department of Defense High Performance Computing Modernization Program Office.
754 THE AERONAUTICAL JOURNAL JULY 2012

REFERENCES1. GODIKSEN, W. Effects of targeting pods addition on F/A-18C Hornet weapons release, 2008, AIAA 2008-6380:
Atmospheric Flight Mechanics Conference and Exhibition, 2008, Honolulu, Hawaii, USA. 2. ROGERS, R. A comparison between the Nielson and Woodward programs in predicting flow fields and stores loads,
1976, Naval Weapons Center TM2854. 3. CENKO, A. and TINOCO, E., PAN AIR – weapons, carriage and separation, 1979, Air Force Flight Dynamics
Laboratory TR-79-3142.4. STEGER, J., DOUGHERTY, F. and BENEK, J. A Chimera grid scheme, Advances in grid generation, 1983, American
Society of Mechanical Engineers Fluids Engineering Conference, 1983, Houston, Texas, USA. 5. CENKO, A. Store separation lessons learned during the last 30 years, 2010, ICAS 2010-2.11ST1, 27th International
Congress of the Aeronautical Sciences (ICAS), 2010, Nice, France.6. KEEN, K. Inexpensive calibrations for the influence function method using the interference distributed loads code,
J Aircr, January 1985, 22, (1), pp 85-87. 7. CENKO, A., MEYER, R. and TESSITORE, F. Further development of the Influence Function Method for store
aerodynamic analysis, J Aircr, August 1986, 23, (8), pp 656-661. 8. CENKO, A. and LUTTON, M. ACFD application to store separation – status report, Aeronaut J, October 2000, 104,
pp 459-466. 9. WALSH, J. and CENKO, A. USM3D Prediction of Mk-83 trajectories from the CF-18 Aircraft, 2001, AIAA 2002-2431,
19th Applied Aerodynamics Conference, 2001, Anaheim, CA, USA.10. RYCKERBUSCH, C., NIEWOEHNER, R., CENKO, A., SISCO, B. and WALSH, J. Evaluation of the capabilities of CFD to
predict store trajectories from attack aircraft, 2002, AIAA 2002-0279, 40th Aerospace Sciences Meeting, 2002,Reno, NV, USA.
11. CENKO, A., NIEWOEHNER, R. and RYCKEBUSCH, C. Evaluation of the capabilities of CFD to predict store trajectories fromattack aircraft, 2002, ICAS 2002-2.6.1, 23nd International Congress of Aeronautical Sciences, 2002, Toronto, Canada.
12. FRINK, N. Upwind scheme for solving the Euler equations on unstructured tetrahedral meshes, AIAA J, January1992, 30, (1), pp 70-77.
13. FRINK, N. Recent progress toward a three-dimensional unstructured Navier-Stokes flow solver, 1994, AIAA 1994-0061, 32nd Aerospace Sciences Meeting and Exhibition, 1994, Reno, NV, USA.
14. FRINK, N. Tetrahedral unstructured Navier-Stokes method for turbulent flows, AIAA J, November 1998, 36, (11), pp1975-1982.
15. FRINK, N., PIRZADEH, S., PARIKH, P., PANDYA, M. and BHAT, M. The NASA Tetrahedral Unstructured SoftwareSystems (TetrUSS), 2000, ICAS 2000-2.4.1(IL), 22nd International Congress of Aeronautical Sciences, 2000,Harrogate, UK.
16. WELTERLEN, T. and LEONE, C. Application of viscous, Cartesian CFD to aircraft store carriage and separationsimulation, 1996, AIAA 1996-2453, 14th Applied Aerodynamics Conference, 1996, Denver, CO, USA.
17. WELTERLEN, T. Store release simulation on the F/A-18C using split flow, 1999, AIAA 99-0124, 37th AerospaceSciences Meeting and Exhibition, 1999, Reno, NV, USA.
18. CENKO, A.T., CENKO, A.T., PIRANIAN, A. and DENIHAN, S. Utilizing flight test telemetry data to improve storetrajectory simulations, 2003 AIAA 2003-4225, 21st Applied Aerodynamics Conference, 2003, Orlando, FL, USA.
19. RAY, E. CFD method for separation of SLAM-ER from S-3B, 2003, AIAA 2003-4226, 21st Applied AerodynamicsConference, 2003, Orlando, FL, USA.
20. JESPERSEN, D., PULLIAM, T. and BUNING, P. Recent enhancements to OVERFLOW, 1997, AIAA 1997-0644, 35thAerospace Sciences Meeting and Exhibition, 1997, Reno, NV, USA.
21. SPALART, P. and ALLMARAS, S. A one-equation turbulence model for aerodynamic flows, 1992, AIAA 1992-0439,30th Aerospace Sciences Meeting and Exhibition, 1992, Reno, NV, USA.
22. CENKO, A. One CFD calculation to end point flight testing (has CFD finally replace the wind tunnel?), Aeronaut J,July 2006, 110.
23. CENKO, A. Lessons Learned in 30 years of store separation testing, 2009, AIAA 2009-98, 47th Aerospace SciencesMeeting, 2009, Orlando, FL, USA.
24. SNYDER, M., SHAH, R., O’BRIEN, C., DAVIS, N., METZGER, J., NORDLUND, R. and SMITH, M. Strut effects on storefreestream aerodynamics, 2011, AIAA 2011-3159, 29th Applied Aerodynamics Conference, 2011, Honolulu, HI, USA.
25. GODIKSEN, W. and HALLBERG, E. Targeting pod effects on weapons release from the F/A-18C, 2008, ICAS 2008-2.9.4, 26th Congress of International Council of the Aeronautical Sciences, 2008, Anchorage, AK, USA.
26. SIMPSON, S., SNYDER, M. and CENKO, A. Effects of the Litening and ATFLIR external targeting pods on F/A-18CHornet weapons release, 2011, AIAA 2011-3157, 29th Applied Aerodynamics Meeting, 2011, Honolulu, HI, USA.
27. VEAZEY, D. and HOPF, J. Comparison of aerodynamic data obtained in the Arnold Engineering Development Centerwind tunnels 4T and 16T, 1998, AIAA Paper 1998-2874, 20th Advanced Measurement and Ground TestingTechnology Conference, 1998, Albuquerque, NM, USA.
28. DROBIK, J. and LAM, S. Validation of plane of symmetry testing in the DSTO 0.8m wind tunnel, 2010, InternationalTest and Evaluation Association, 15th Aircraft/Stores Compatibility Symposium, Fort Walden Beach, 2010, FL, USA.
29. SHEA, M., CONSTANTINO, M., O’BRIEN, C., SNYDER, M., SIMPSON, S. and CENKO, A. Litening Pod modification toimprove Mk-83 trajectories, 2011, AIAA 2011-3158, Applied Aerodynamics Conference, 2011, Honolulu, HI, USA.
O’BRIEN ET AL EFFECTS OF TARGETING POD MODIFICATION ON F-18C HORNET WEAPONS... 755