effects of thermal treatments on the chemical reactivity of trichloroethylene · 2015-08-12 ·...
TRANSCRIPT

Office of Research and DevelopmentNational Risk Management Research Laboratory, Ada, Oklahoma 74820
Effects of Thermal Treatments on the Chemical Reactivity of Trichloroethylene
EPA 600/R-07/091 | August 2007 | www.epa.gov/ada

Office of Research and DevelopmentNational Risk Management Research Laboratory, Ada, Oklahoma 74820
Effects of Thermal Treatments on the Chemical Reactivity of Trichloroethylene
Jed Costanza, James Mulholland, and Kurt PennellGeorgia Tech University
Eva DavisProject Officer, Robert S. Kerr Environmental
Research Center

ii
Notice
The U.S. Environmental Protection Agency through its Office of Research and Development managed the research described here under EPA Coopera-tive agreement Contract No. R-82947401 to Georgia Institue of Technology, Atlanta, Georgia, through funds provided by the U.S. Environmental Protection Agency’s Office of Research and Development, National Risk Management Research Laboratory, Ada, Oklahoma. It has been subjected to the Agency’s peer and administrative review and has been approved for publication as an EPA document. Mention of trade names or commercial products does not constitute endorsement or recommendation for use.
All research projects making conclusions or recommendations based on environmental data and funded by the U.S. Environmental Protection Agency are required to participate in the Agency Quality Assurance Program. This project was conducted under an approved Quality Assurance Plan. Information on the plan and documentation of the quality assurance activities and results are available from the lead author.
iii
Foreword
The U.S. Environmental Protection Agency is charged by Congress with protecting the Nation’s land, air, and water resources. Under a mandate of national environmental laws, the Agency strives to formulate and implement actions leading to a compatible balance between human activities and the ability of natural systems to support and nurture life. To meet this mandate, EPA’s research program is providing data and technical support for solving environmental problems today and building a science knowledge base necessary to manage our ecological resources wisely, understand how pollutants affect our health, and prevent or reduce environmental risks in the future.
The National Risk Management Research Laboratory is the Agency’s center for investigation of technological and management approaches for preventing and reducing risks from pollution that threatens human health and the environment. The focus of the Laboratory’s research program is on methods and their cost-effectiveness for prevention and control of pollution to air, land, water, and subsurface resources; protection of water quality in public water systems; remediation of contaminated sites, sediments and ground water; prevention and control of indoor air pollution; and restoration of ecosystems. NRMRL collaborates with both public and private sector partners to foster technologies that reduce the cost of compliance and to anticipate emerging problems. NRMRL’s research provides solutions to environmental problems by: developing and promoting technologies that protect and improve the environment; advancing scientific and engineering information to support regulatory and policy decisions; and providing the technical support and information transfer to ensure implementation of environmental regulations and strategies at the national, state, and community levels.
This report describes laboratory experiments conducted to determine the reactivity of trichloroethylene (TCE), a commonly-used industrial solvent and a groundwater contaminant at many Superfund sites, under the conditions used for in situ thermal remediation. It was found that at temperatures below 420°C, TCE is essentially unreactive without the presence of some type of catalyst, such as a base or mineral. Thus, during in situ thermal remediation at these temperatures, TCE is recovered by volatilization and vapor extraction. At higher temperatures, significant reaction of TCE may occur; however, the products of these reactions may include larger molecular weight chlorinated compounds as well as carbon dioxide and hydrochloric acid, which would be the expected products when TCE is completely mineralized.
Stephen G. Schmelling, Director Ground Water and Ecosystems Restoration Division National Risk Management Research Laboratory

iv
Acknowledgment
EPA would like to thank the peer reviewers, Dr. Bill Mabey, Dr. Gorm Heron, and Dr. Rick Wilken, for their insightful and useful comments.

v
Contents
Project Summary . . . . . . . . . . . . . . . . . . . . . . . . . . . . . . . . . . . . . . . . . . . . . . . . . . . . . . . . . . . . . . . . . . . . . . . . . . . . . 11.1 Introduction . . . . . . . . . . . . . . . . . . . . . . . . . . . . . . . . . . . . . . . . . . . . . . . . . . . . . . . . . . . . . . . . . . . . . . . . . . 11.2 Research Objectives . . . . . . . . . . . . . . . . . . . . . . . . . . . . . . . . . . . . . . . . . . . . . . . . . . . . . . . . . . . . . . . . . . . 11.3 Experimental Systems . . . . . . . . . . . . . . . . . . . . . . . . . . . . . . . . . . . . . . . . . . . . . . . . . . . . . . . . . . . . . . . . . . 21.4 Conclusions and Recommendations . . . . . . . . . . . . . . . . . . . . . . . . . . . . . . . . . . . . . . . . . . . . . . . . . . . . . . . 2
1.4.1 Quartz Tube Reactor Experiments . . . . . . . . . . . . . . . . . . . . . . . . . . . . . . . . . . . . . . . . . . . . . . . . . . . . 21.4.2 Sealed Ampule Experiments . . . . . . . . . . . . . . . . . . . . . . . . . . . . . . . . . . . . . . . . . . . . . . . . . . . . . . . . 31.4.3 Implications to Field Applications . . . . . . . . . . . . . . . . . . . . . . . . . . . . . . . . . . . . . . . . . . . . . . . . . . . . 3
1.5 Report Organization . . . . . . . . . . . . . . . . . . . . . . . . . . . . . . . . . . . . . . . . . . . . . . . . . . . . . . . . . . . . . . . . . . . 6Background Information . . . . . . . . . . . . . . . . . . . . . . . . . . . . . . . . . . . . . . . . . . . . . . . . . . . . . . . . . . . . . . . . . . . . . . . 7
2.1 Trichloroethylene Properties . . . . . . . . . . . . . . . . . . . . . . . . . . . . . . . . . . . . . . . . . . . . . . . . . . . . . . . . . . . . . 72.2 TCE-Water Phase Behavior. . . . . . . . . . . . . . . . . . . . . . . . . . . . . . . . . . . . . . . . . . . . . . . . . . . . . . . . . . . . . . 82.3 Selected Experiments on the Stability of TCE . . . . . . . . . . . . . . . . . . . . . . . . . . . . . . . . . . . . . . . . . . . . . . . 8
2.3.1 TCE-NAPL Degradation by Oxygen . . . . . . . . . . . . . . . . . . . . . . . . . . . . . . . . . . . . . . . . . . . . . . . . . . 82.3.2 Hydrolysis of TCE-NAPL Degradation Products . . . . . . . . . . . . . . . . . . . . . . . . . . . . . . . . . . . . . . . . 102.3.3 Degradation of TCE Dissolved in Water at Elevated Temperatures . . . . . . . . . . . . . . . . . . . . . . . . . . 112.3.4 Thermal Degradation of TCE in a Water-Filled Reactor . . . . . . . . . . . . . . . . . . . . . . . . . . . . . . . . . . . 122.3.5 Degradation of Gas-Phase TCE within Heated Quartz Tubes . . . . . . . . . . . . . . . . . . . . . . . . . . . . . . . 152.3.6 TCE Degradation Products as a Function of the Cl:H Ratio . . . . . . . . . . . . . . . . . . . . . . . . . . . . . . . . 19
2.4 Operational Conditions of In Situ Thermal Treatment Technologies . . . . . . . . . . . . . . . . . . . . . . . . . . . . . . 212.4.1 Steam Flushing. . . . . . . . . . . . . . . . . . . . . . . . . . . . . . . . . . . . . . . . . . . . . . . . . . . . . . . . . . . . . . . . . . . 212.4.2 Thermal Conductive Heating . . . . . . . . . . . . . . . . . . . . . . . . . . . . . . . . . . . . . . . . . . . . . . . . . . . . . . . . 222.4.3 Electrical Resistive Heating . . . . . . . . . . . . . . . . . . . . . . . . . . . . . . . . . . . . . . . . . . . . . . . . . . . . . . . . . 232.4.4 Hybrid Thermal Technologies . . . . . . . . . . . . . . . . . . . . . . . . . . . . . . . . . . . . . . . . . . . . . . . . . . . . . . . 24
TCE Degradation in Flow-Through Quartz Tube Reactors. . . . . . . . . . . . . . . . . . . . . . . . . . . . . . . . . . . . . . . . . . . . . 253.1 Introduction . . . . . . . . . . . . . . . . . . . . . . . . . . . . . . . . . . . . . . . . . . . . . . . . . . . . . . . . . . . . . . . . . . . . . . . . . . 253.2 Experimental Materials and Methods . . . . . . . . . . . . . . . . . . . . . . . . . . . . . . . . . . . . . . . . . . . . . . . . . . . . . . 26
3.2.1 Materials. . . . . . . . . . . . . . . . . . . . . . . . . . . . . . . . . . . . . . . . . . . . . . . . . . . . . . . . . . . . . . . . . . . . . . . . 263.2.2 Quartz Tube Apparatus. . . . . . . . . . . . . . . . . . . . . . . . . . . . . . . . . . . . . . . . . . . . . . . . . . . . . . . . . . . . . 263.2.3 Experimental Procedures . . . . . . . . . . . . . . . . . . . . . . . . . . . . . . . . . . . . . . . . . . . . . . . . . . . . . . . . . . . 27
3.2.3.1 Experimental Series 1. . . . . . . . . . . . . . . . . . . . . . . . . . . . . . . . . . . . . . . . . . . . . . . . . . . . . . . . 273.2.3.2 Experimental Series 2. . . . . . . . . . . . . . . . . . . . . . . . . . . . . . . . . . . . . . . . . . . . . . . . . . . . . . . . 273.2.3.3 Experimental Series 3. . . . . . . . . . . . . . . . . . . . . . . . . . . . . . . . . . . . . . . . . . . . . . . . . . . . . . . . 273.2.3.4 Experimental Series 4. . . . . . . . . . . . . . . . . . . . . . . . . . . . . . . . . . . . . . . . . . . . . . . . . . . . . . . . 283.2.3.5 Experimental Series 5. . . . . . . . . . . . . . . . . . . . . . . . . . . . . . . . . . . . . . . . . . . . . . . . . . . . . . . . 28
3.2.4 Analytical Methods . . . . . . . . . . . . . . . . . . . . . . . . . . . . . . . . . . . . . . . . . . . . . . . . . . . . . . . . . . . . . . . 293.3 Experimental Results. . . . . . . . . . . . . . . . . . . . . . . . . . . . . . . . . . . . . . . . . . . . . . . . . . . . . . . . . . . . . . . . . . . 29
3.3.1 Results of Experimental Series 1-4 . . . . . . . . . . . . . . . . . . . . . . . . . . . . . . . . . . . . . . . . . . . . . . . . . . . 293.3.2 Results of Experimental Series 5 . . . . . . . . . . . . . . . . . . . . . . . . . . . . . . . . . . . . . . . . . . . . . . . . . . . . . 31
3.3.2.1 TCE Recovery . . . . . . . . . . . . . . . . . . . . . . . . . . . . . . . . . . . . . . . . . . . . . . . . . . . . . . . . . . . . . 323.3.2.2 Compounds in the DCM Trap . . . . . . . . . . . . . . . . . . . . . . . . . . . . . . . . . . . . . . . . . . . . . . . . . 333.3.2.3 Compounds Detected in Tedlar® Bags . . . . . . . . . . . . . . . . . . . . . . . . . . . . . . . . . . . . . . . . . . 353.3.2.4 Compounds Detected in the Water Rinse. . . . . . . . . . . . . . . . . . . . . . . . . . . . . . . . . . . . . . . . . 363.3.2.5 Compounds Detected in the Iso-Octane Rinse. . . . . . . . . . . . . . . . . . . . . . . . . . . . . . . . . . . . . 373.3.2.6 Mass Balance . . . . . . . . . . . . . . . . . . . . . . . . . . . . . . . . . . . . . . . . . . . . . . . . . . . . . . . . . . . . . . 39
3.4 Discussion . . . . . . . . . . . . . . . . . . . . . . . . . . . . . . . . . . . . . . . . . . . . . . . . . . . . . . . . . . . . . . . . . . . . . . . . . . . 403.4.1 Nitrogen as the Carrier Gas at 420°C. . . . . . . . . . . . . . . . . . . . . . . . . . . . . . . . . . . . . . . . . . . . . . . . . . 403.4.2 Air as the Carrier Gas at 420°C . . . . . . . . . . . . . . . . . . . . . . . . . . . . . . . . . . . . . . . . . . . . . . . . . . . . . . 423.4.3 Experiments Conducted at 120 and 240°C . . . . . . . . . . . . . . . . . . . . . . . . . . . . . . . . . . . . . . . . . . . . . 43
3.5 Summary . . . . . . . . . . . . . . . . . . . . . . . . . . . . . . . . . . . . . . . . . . . . . . . . . . . . . . . . . . . . . . . . . . . . . . . . . . . . 45
vi
3.6 Quality Assurance Summary for the Flow-Through Experiments . . . . . . . . . . . . . . . . . . . . . . . . . . . . . . . . 45TCE Degradation in Heated Ampules . . . . . . . . . . . . . . . . . . . . . . . . . . . . . . . . . . . . . . . . . . . . . . . . . . . . . . . . . . . . . 47
4.1 Introduction . . . . . . . . . . . . . . . . . . . . . . . . . . . . . . . . . . . . . . . . . . . . . . . . . . . . . . . . . . . . . . . . . . . . . . . . . . 474.2 Experimental Materials and Methods . . . . . . . . . . . . . . . . . . . . . . . . . . . . . . . . . . . . . . . . . . . . . . . . . . . . . . 47
4.2.1 Preparation of Solids . . . . . . . . . . . . . . . . . . . . . . . . . . . . . . . . . . . . . . . . . . . . . . . . . . . . . . . . . . . . . . 474.2.2 Preparation of Aqueous Solutions . . . . . . . . . . . . . . . . . . . . . . . . . . . . . . . . . . . . . . . . . . . . . . . . . . . . 484.2.3 Preparation of Ampules . . . . . . . . . . . . . . . . . . . . . . . . . . . . . . . . . . . . . . . . . . . . . . . . . . . . . . . . . . . . 484.2.4 Description of Ampule Experiments . . . . . . . . . . . . . . . . . . . . . . . . . . . . . . . . . . . . . . . . . . . . . . . . . . 49
4.2.4.1 Ampule Experiment 1 . . . . . . . . . . . . . . . . . . . . . . . . . . . . . . . . . . . . . . . . . . . . . . . . . . . . . . . 494.2.4.2 Ampule Experiment 2 . . . . . . . . . . . . . . . . . . . . . . . . . . . . . . . . . . . . . . . . . . . . . . . . . . . . . . . 494.2.4.3 Ampule Experiment 3 . . . . . . . . . . . . . . . . . . . . . . . . . . . . . . . . . . . . . . . . . . . . . . . . . . . . . . . 504.2.3.4 Ampule Experiment 4 . . . . . . . . . . . . . . . . . . . . . . . . . . . . . . . . . . . . . . . . . . . . . . . . . . . . . . . 50
4.2.4 Ampule Sampling Methods . . . . . . . . . . . . . . . . . . . . . . . . . . . . . . . . . . . . . . . . . . . . . . . . . . . . . . . . . 544.2.5 Analytical Methods . . . . . . . . . . . . . . . . . . . . . . . . . . . . . . . . . . . . . . . . . . . . . . . . . . . . . . . . . . . . . . . 55
4.3 Experimental Results. . . . . . . . . . . . . . . . . . . . . . . . . . . . . . . . . . . . . . . . . . . . . . . . . . . . . . . . . . . . . . . . . . . 564.3.1 Results of Ampule Experiment 1 . . . . . . . . . . . . . . . . . . . . . . . . . . . . . . . . . . . . . . . . . . . . . . . . . . . . . 564.3.2 Results of Ampule Experiment 2 . . . . . . . . . . . . . . . . . . . . . . . . . . . . . . . . . . . . . . . . . . . . . . . . . . . . . 564.3.3 Results of Ampule Experiment 3 . . . . . . . . . . . . . . . . . . . . . . . . . . . . . . . . . . . . . . . . . . . . . . . . . . . . . 584.3.2 Results of Ampule Experiment 4 . . . . . . . . . . . . . . . . . . . . . . . . . . . . . . . . . . . . . . . . . . . . . . . . . . . . . 61
4.3.2.1 Change in TCE Content . . . . . . . . . . . . . . . . . . . . . . . . . . . . . . . . . . . . . . . . . . . . . . . . . . . . . . 614.3.2.2 Change in pH . . . . . . . . . . . . . . . . . . . . . . . . . . . . . . . . . . . . . . . . . . . . . . . . . . . . . . . . . . . . . . 644.3.2.3 CO and CO2 in the Gas Phase . . . . . . . . . . . . . . . . . . . . . . . . . . . . . . . . . . . . . . . . . . . . . . . . . 674.3.2.4 Other Gas Phase Compounds. . . . . . . . . . . . . . . . . . . . . . . . . . . . . . . . . . . . . . . . . . . . . . . . . . 694.3.2.5 Aqueous Phase Compounds . . . . . . . . . . . . . . . . . . . . . . . . . . . . . . . . . . . . . . . . . . . . . . . . . . . 694.3.2.6 Mass Balance . . . . . . . . . . . . . . . . . . . . . . . . . . . . . . . . . . . . . . . . . . . . . . . . . . . . . . . . . . . . . . 74
4.4 Discussion . . . . . . . . . . . . . . . . . . . . . . . . . . . . . . . . . . . . . . . . . . . . . . . . . . . . . . . . . . . . . . . . . . . . . . . . . . . 764.4.1 Oxygen Initiated TCE Degradation . . . . . . . . . . . . . . . . . . . . . . . . . . . . . . . . . . . . . . . . . . . . . . . . . . . 764.4.2 Hydrogen Elimination Initiated TCE Degradation . . . . . . . . . . . . . . . . . . . . . . . . . . . . . . . . . . . . . . . 774.4.3 Oven Explosion . . . . . . . . . . . . . . . . . . . . . . . . . . . . . . . . . . . . . . . . . . . . . . . . . . . . . . . . . . . . . . . . . . 784.4.4 Comparison to Knauss et al. (1999) Results . . . . . . . . . . . . . . . . . . . . . . . . . . . . . . . . . . . . . . . . . . . . 78
4.5 Summary . . . . . . . . . . . . . . . . . . . . . . . . . . . . . . . . . . . . . . . . . . . . . . . . . . . . . . . . . . . . . . . . . . . . . . . . . . . . 794.6 Quality Assurance Summary for the Ampule Experiments. . . . . . . . . . . . . . . . . . . . . . . . . . . . . . . . . . . . . . 80
References . . . . . . . . . . . . . . . . . . . . . . . . . . . . . . . . . . . . . . . . . . . . . . . . . . . . . . . . . . . . . . . . . . . . . . . . . . . . . . . . . . 81APPENDIX A . . . . . . . . . . . . . . . . . . . . . . . . . . . . . . . . . . . . . . . . . . . . . . . . . . . . . . . . . . . . . . . . . . . . . . . . . . . . . . . 87 Detailed Experimental Methods for Flow-Through Quartz Tube Reactors. . . . . . . . . . . . . . . . . . . . . . . . . . . . . . . . . 87
A.1 Quartz Tube Preparation . . . . . . . . . . . . . . . . . . . . . . . . . . . . . . . . . . . . . . . . . . . . . . . . . . . . . . . . . . . . . . . . 87A.2 Quartz Tube Temperature Profile. . . . . . . . . . . . . . . . . . . . . . . . . . . . . . . . . . . . . . . . . . . . . . . . . . . . . . . . . . 87A.3 Modified TCE Introduction Method: Experimental Series 5 . . . . . . . . . . . . . . . . . . . . . . . . . . . . . . . . . . . . 87A.4 Effluent Trapping Procedures and Analytical Methods. . . . . . . . . . . . . . . . . . . . . . . . . . . . . . . . . . . . . . . . . 88A.5 Quartz Tube Rinse Procedure . . . . . . . . . . . . . . . . . . . . . . . . . . . . . . . . . . . . . . . . . . . . . . . . . . . . . . . . . . . . 89
APPENDIX B . . . . . . . . . . . . . . . . . . . . . . . . . . . . . . . . . . . . . . . . . . . . . . . . . . . . . . . . . . . . . . . . . . . . . . . . . . . . . . . 91 Change in Dissolved Oxygen . . . . . . . . . . . . . . . . . . . . . . . . . . . . . . . . . . . . . . . . . . . . . . . . . . . . . . . . . . . . . . 91 APPENDIX C . . . . . . . . . . . . . . . . . . . . . . . . . . . . . . . . . . . . . . . . . . . . . . . . . . . . . . . . . . . . . . . . . . . . . . . . . . . . . . . 93
C.1 Rates of TCE Degradation. . . . . . . . . . . . . . . . . . . . . . . . . . . . . . . . . . . . . . . . . . . . . . . . . . . . . . . . . . . . . . . 93C.2 Methods used to Determine TCE Dedradation Rate Parameters in Ampule Experiments . . . . . . . . . . . . . 94

vii
Figures
Figure 2.1 Water and TCE-NAPL vapor pressure as a function of solution temperature at 1 bar or 1.02 atm of total gas phase pressure. . . . . . . . . . . . . . . . . . . . . . . . . . . . . . . . . . . . . . . . . . . . . . . . . 8
Figure 2.2 Measured concentration of TCE vs. time along with the zero-order reaction model fit. . . . . . . . . . 14Figure 2.3 Natural log of the measured TCE concentration normalized by the initial TCE
concentration vs. time along with the first-order reaction model fit. . . . . . . . . . . . . . . . . . . . . . . . . 14Figure 2.4 Reciprocal of the measured concentration of TCE vs. time along with the second-order
reaction model fit.. . . . . . . . . . . . . . . . . . . . . . . . . . . . . . . . . . . . . . . . . . . . . . . . . . . . . . . . . . . . . . . 15Figure 2.5 Measured concentration of TCE vs. time for Experiment TCE-40 and radical chain
reaction model fit.. . . . . . . . . . . . . . . . . . . . . . . . . . . . . . . . . . . . . . . . . . . . . . . . . . . . . . . . . . . . . . . 15Figure 3.1 Quartz tube experimental apparatus. . . . . . . . . . . . . . . . . . . . . . . . . . . . . . . . . . . . . . . . . . . . . . . . . 26Figure 3.2 Amounts of TCE, PCE and carbon tetrachloride (CCl4) recovered during the first
experimental series. . . . . . . . . . . . . . . . . . . . . . . . . . . . . . . . . . . . . . . . . . . . . . . . . . . . . . . . . . . . . . 30Figure 3.3 Amounts of TCE, tetrachloroethylene (PCE) and carbon tetrachloride (CCl4) recovered
during the second experimental series. . . . . . . . . . . . . . . . . . . . . . . . . . . . . . . . . . . . . . . . . . . . . . . 30Figure 3.4 Recovery of TCE with nitrogen or air as the carrier gas, averaged over three relative
humidities (inlet temperatures). . . . . . . . . . . . . . . . . . . . . . . . . . . . . . . . . . . . . . . . . . . . . . . . . . . . . 32Figure 3.5 Amount of chloride detected in the post experiment water rinse. . . . . . . . . . . . . . . . . . . . . . . . . . . 37Figure 3.6 Amount of dichloroacetate detected in the post experiment water rinse. . . . . . . . . . . . . . . . . . . . . 37Figure 4.1 Picture of the 50 mL funnel-top ampule before and after sealing.. . . . . . . . . . . . . . . . . . . . . . . . . . 49Figure 4.2 Explosion-resistant ampule incubation apparatus. . . . . . . . . . . . . . . . . . . . . . . . . . . . . . . . . . . . . . . 53Figure 4.3 Illustration of the ampule gas sample collection method. . . . . . . . . . . . . . . . . . . . . . . . . . . . . . . . . 55Figure 4.4 Amount of TCE in the 100 mg/L anoxic (Batch 4) and oxic (Batch 3) ampules stored
at 22°C and incubated at 120°C. . . . . . . . . . . . . . . . . . . . . . . . . . . . . . . . . . . . . . . . . . . . . . . . . . . . 62Figure 4.5 Amount of TCE in anoxic 100 mg/L ampules with Ottawa sand (Batch 6) and Ottawa
sand+1% goethite (Batch 7) stored at 22°C and incubated at 120°C. . . . . . . . . . . . . . . . . . . . . . . . 63Figure 4.6 Amount of TCE in 100 mg/L anoxic ampules amended with NaOH (0.26 mM) to
pH 10 (Batch 5) stored at 22°C and incubated at 120°C.. . . . . . . . . . . . . . . . . . . . . . . . . . . . . . . . . 64Figure 4.7 The pH of anoxic (Batch 1) and oxic (Batch 2) ampules with 1,000 mg/L of TCE and
TCE-free controls stored at 22°C and incubated at 120°C. . . . . . . . . . . . . . . . . . . . . . . . . . . . . . . . 64Figure 4.8 The pH of anoxic (Batch 4) and oxic (Batch 3) ampules with 100 mg/L of TCE and
TCE-free controls stored at 22°C and incubated at 120°C. . . . . . . . . . . . . . . . . . . . . . . . . . . . . . . . 65Figure 4.9 The pH of anoxic ampules that contained acid-washed Ottawa sand with 100 mg/L
of TCE (Batch 6) and TCE-free controls stored at 22°C and incubated at 120°C. . . . . . . . . . . . . . 65Figure 4.10 The pH of anoxic ampules that contained acid-washed Ottawa sand+1%goethite with
100 mg/L of TCE (Batch 7) and TCE-free controls stored at 22°C and incubated at 120°C.. . . . . . . . . . . . . . . . . . . . . . . . . . . . . . . . . . . . . . . . . . . . . . . . . . . . . . . . . . . . . . . . . . . . . . . . 66
Figure 4.11 The pH of anoxic ampules amended with NaOH (0.26 mM) to pH 10 and 100 mg/L of TCE (Batch 5) along with TCE-free controls stored at 22°C and incubated at 120°C.. . . . . . . . 67
Figure 4.12 Amounts of CO and CO2 in anoxic (Batch 1) and oxic (Batch 2) ampules with 1,000 mg/L of TCE and incubated at 120°C. . . . . . . . . . . . . . . . . . . . . . . . . . . . . . . . . . . . . . . . . . . 67
Figure 4.13 Amounts of CO and CO2 in anoxic (Batch 4) and oxic (Batch 3) ampules with 100 mg/L of TCE and incubated at 120°C. No CO or CO2 was detected in ampules stored at 22°C. . . . . . . . . . . . . . . . . . . . . . . . . . . . . . . . . . . . . . . . . . . . . . . . . . . . . . . . . . . . . . . . . . 68
Figure 4.14 Amounts of CO and CO2 in anoxic ampules with Ottawa sand and 100 mg/L of TCE (Batch 6) stored at 22°C and incubated at 120°C. . . . . . . . . . . . . . . . . . . . . . . . . . . . . . . . . . . 68
Figure 4.15 Amounts of CO and CO2 in anoxic ampules with Ottawa sand+1%goethite and 100 mg/L of TCE (Batch 7) stored at 22°C and incubated at 120°C. . . . . . . . . . . . . . . . . . . . . . . . 69
Figure 4.16 Amounts of CO and CO2 in anoxic ampules amended with NaOH (0.26 mM) to pH 10 (Batch 5) and 100 mg/L of TCE incubated at 120°C. . . . . . . . . . . . . . . . . . . . . . . . . . . . . . . . . . . . 69
Figure 4.17 Mass spectrum of the 2.05 min chromatogram peak from the analysis of 1 mL of gas from Ampule 83. . . . . . . . . . . . . . . . . . . . . . . . . . . . . . . . . . . . . . . . . . . . . . . . . . . . . . . . . . . . . . . . 69

viii
Figure 4.18 Amount of chloride in anoxic (Batch 1) and oxic (Batch 2) ampules with 1,000 mg/L of TCE stored at 22°C and incubated at 120°C.. . . . . . . . . . . . . . . . . . . . . . . . . . . . . . . . . . . . . . . . 70
Figure 4.19 Amount of chloride in anoxic (Batch 4) and oxic (Batch 3) ampules with 100 mg/L of TCE stored at 22°C and incubated at 120°C. . . . . . . . . . . . . . . . . . . . . . . . . . . . . . . . . . . . . . . . . . . 70
Figure 4.20 Amount of chloride in anoxic ampules with Ottawa sand and 100 mg/L of TCE (Batch 6) stored at 22°C and incubated at 120°C. . . . . . . . . . . . . . . . . . . . . . . . . . . . . . . . . . . . . . . . . . . . . . . 70
Figure 4.21 Amount of chloride in anoxic ampules with Ottawa sand+1%goethite and 100 mg/L TCE (Batch 7) stored at 22°C and incubated at 120°C. . . . . . . . . . . . . . . . . . . . . . . . . . . . . . . . . . . 71
Figure 4.22 Amount of chloride in anoxic ampules amended with NaOH (0.26 mM) to pH 10 with 100 mg/L of TCE (Batch 5) stored at 22°C and incubated at 120°C. . . . . . . . . . . . . . . . . . . . . . . . 71
Figure 4.23 Concentration of dichloroacetate (DCAA) in the anoxic (Batch 1) and oxic (Batch 2) ampules with 1,000 mg/L of TCE stored at 22°C and incubated at 120°C.. . . . . . . . . . . . . . . . . . . 71
Figure 4.24 Concentration of chloroacetate in ampules amended with NaOH (0.26 mM) to pH 10 and 100 mg/L TCE (Batch 5) incubated at 120°C. . . . . . . . . . . . . . . . . . . . . . . . . . . . . . . . . . . . . . 71
Figure 4.25 Amount of glycolate and formate in anoxic (Batch 1) and oxic (Batch 2) ampules with 1,000 mg/L of TCE incubated at 120°C. . . . . . . . . . . . . . . . . . . . . . . . . . . . . . . . . . . . . . . . . . . . . . 72
Figure 4.26 Amount of glycolate and formate in anoxic (Batch 4) and oxic (Batch 3) ampules with 100 mg/L of TCE incubated at 120°C.. . . . . . . . . . . . . . . . . . . . . . . . . . . . . . . . . . . . . . . . . . . . . . . 72
Figure 4.27 Amount of glycolate and formate in anoxic ampules with Ottawa sand and 100 mg/L of TCE (Batch 6) stored at 22°C and incubated at 120°C. . . . . . . . . . . . . . . . . . . . . . . . . . . . . . . . . . . 72
Figure 4.28 Amount of formate in anoxic ampules with Ottawa sand+1%goethite and 100 mg/L of TCE (Batch 7) stored at 22°C and incubated at 120°C. . . . . . . . . . . . . . . . . . . . . . . . . . . . . . . . . . . 73
Figure 4.29 Amount of sulfate in anoxic ampules with Ottawa sand and 100 mg/L of TCE (Batch 6) stored at 22°C and incubated at 120°C. . . . . . . . . . . . . . . . . . . . . . . . . . . . . . . . . . . . . . . . . . . . . . . 73
Figure 4.30 Amount of glycolate in anoxic ampules amended with NaOH (0.26 mM) to pH 10 and with 100 mg/L of TCE (Batch 5) incubated at 120°C.. . . . . . . . . . . . . . . . . . . . . . . . . . . . . . . . . . . 73
Figure A.1 Temperature profile within the quartz tube heated to 120°C.. . . . . . . . . . . . . . . . . . . . . . . . . . . . . . 87Figure A.2 Quartz tube apparatus for the fifth quartz tube experimental series. . . . . . . . . . . . . . . . . . . . . . . . . 88Figure C.1 The change in anoxic ampule TCE content as a function of incubation time.. . . . . . . . . . . . . . . . . 95Figure C.2 The change in oxic ampule TCE content as a function of incubation time.. . . . . . . . . . . . . . . . . . . 95Figure C.3 The change in anoxic ampule TCE content, ampules with Ottawa sand, as a function of
incubation time. . . . . . . . . . . . . . . . . . . . . . . . . . . . . . . . . . . . . . . . . . . . . . . . . . . . . . . . . . . . . . . . . 95Figure C.4 The change in anoxic ampule TCE content, ampules with Ottawa sand and 1%
Goethite, as a function of incubation time. . . . . . . . . . . . . . . . . . . . . . . . . . . . . . . . . . . . . . . . . . . . 95Figure C.5 The change in anoxic ampule TCE content as a function of incubation time.. . . . . . . . . . . . . . . . . 95Figure C.6 The change in oxic ampule TCE content as a function of incubation time.. . . . . . . . . . . . . . . . . . . 95Figure C.7 The change in anoxic ampule TCE content, ampules with Ottawa sand, as a function of
incubation time. . . . . . . . . . . . . . . . . . . . . . . . . . . . . . . . . . . . . . . . . . . . . . . . . . . . . . . . . . . . . . . . . 96Figure C.8 The change in anoxic ampule TCE content, ampules with Ottawa sand and 1%
Goethite, as a function of incubation time. . . . . . . . . . . . . . . . . . . . . . . . . . . . . . . . . . . . . . . . . . . . 96Figure C.9 The change in anoxic ampule TCE content based on detected reaction products.. . . . . . . . . . . . . . 96Figure C.10 The change in oxic ampule TCE content based on detected reaction products. . . . . . . . . . . . . . . . 96Figure C.11 The change in anoxic ampule TCE content, ampules with Ottawa sand, based on
detected reaction products. . . . . . . . . . . . . . . . . . . . . . . . . . . . . . . . . . . . . . . . . . . . . . . . . . . . . . . . . 96Figure C.12 The change in anoxic ampule TCE content, ampules with Ottawa sand and 1%
Goethite, based on detected reaction products. . . . . . . . . . . . . . . . . . . . . . . . . . . . . . . . . . . . . . . . . 96
ix
Tables
Table 2.1 Selected Properties of TCE (McNeill, 1978) . . . . . . . . . . . . . . . . . . . . . . . . . . . . . . . . . . . . . . . . . . 7Table 2.2 Selected Properties of Water (Gebhart et al., 1988) . . . . . . . . . . . . . . . . . . . . . . . . . . . . . . . . . . . . 8Table 2.3 Selected TCE Stability Test Results 24 hour test (Carlisle and Levine, 1932) . . . . . . . . . . . . . . . . 9Table 2.4 Oxygen and TCE Gas-Phase and NAPL Degradation Products (McKinney et al., 1955). . . . . . . . 10Table 2.5 Hydrolysis of TCE NAPL Degradation Products (McKinney et al., 1955) . . . . . . . . . . . . . . . . . . . 10Table 2.6 Rate of Dichloroacetic Acid (DCAA) Disappearance from Heated Water (Prager et al., 2001) . . . 11Table 2.7 Summary of Knauss et al. (1999) Experimental Results . . . . . . . . . . . . . . . . . . . . . . . . . . . . . . . . . 13Table 2.8 Amount of TCE Degraded after Passing Through a Heated Quartz Tube Residence
Time of 2 Seconds (Graham et al., 1986). . . . . . . . . . . . . . . . . . . . . . . . . . . . . . . . . . . . . . . . . . . . . 16Table 2.9 Selected Degradation Products after Passing TCE through a Heated Quartz Tube
(Yasuhara and Morita, 1990) . . . . . . . . . . . . . . . . . . . . . . . . . . . . . . . . . . . . . . . . . . . . . . . . . . . . . . 17Table 2.10 Selected Degradation Products after Passing TCE through a Heated Quartz Tube
Containing Fly Ash, 0.9 to 1.5 second Residence Time (Froese and Hutzinger, 1994). . . . . . . . . . 17Table 2.11 Selected Degradation Products at 600°C as a Function of Quartz Tube Solids Content,
0.9 to 1.5 second Residence Time (Froese and Hutzinger, 1994) . . . . . . . . . . . . . . . . . . . . . . . . . . 18Table 2.12 Selected Compounds in a TCE Flame with Cl:H Ratio of 3 (Chang and Senkan, 1989) . . . . . . . . 19Table 2.13 Selected Compounds after Passing TCE through a Flame with Cl:H Ratio of 0.09
(Werner and Cool, 2000) . . . . . . . . . . . . . . . . . . . . . . . . . . . . . . . . . . . . . . . . . . . . . . . . . . . . . . . . . 20Table 3.1 Summary of Flow Through Quartz Tube Experiments . . . . . . . . . . . . . . . . . . . . . . . . . . . . . . . . . . 25Table 3.2 Fifth Experimental Series Matrix . . . . . . . . . . . . . . . . . . . . . . . . . . . . . . . . . . . . . . . . . . . . . . . . . . . 28Table 3.3 Amounts of TCE, PCE, and CCl4 from the Sand Filled Quartz Tube at 420°C. . . . . . . . . . . . . . . . 31Table 3.4 Amount of TCE, PCE, CCl4, and CO2 from an Empty Quartz Tube at 420°C . . . . . . . . . . . . . . . . 31Table 3.5 Experiments Completed for the Fifth Experimental Series . . . . . . . . . . . . . . . . . . . . . . . . . . . . . . . 31Table 3.6 TCE Recovery with Nitrogen as the Carrier Gas . . . . . . . . . . . . . . . . . . . . . . . . . . . . . . . . . . . . . . 32Table 3.7 TCE Recovery with Air as the Carrier Gas . . . . . . . . . . . . . . . . . . . . . . . . . . . . . . . . . . . . . . . . . . . 32Table 3.8 Concentration (ppmv) of Compounds Detected in the DCM Trap for the 420°C
Experiments with Nitrogen as the Carrier Gas . . . . . . . . . . . . . . . . . . . . . . . . . . . . . . . . . . . . . . . . 33Table 3.9 Concentration (ppmv) of Compounds Detected in the DCM Trap for the 420°C
Experiments with Air as the Carrier Gas . . . . . . . . . . . . . . . . . . . . . . . . . . . . . . . . . . . . . . . . . . . . . 34Table 3.10 Concentration of Compounds Detected in the Tedlar® Bag and Phosgene Trap for
the 420°C Experiments with Air as the Carrier Gas . . . . . . . . . . . . . . . . . . . . . . . . . . . . . . . . . . . . 35Table 3.11 Change in the Amount of CO2 and Phosgene Detected with Increase in Water Content
for the 420°C Experiments with Air as the Carrier Gas . . . . . . . . . . . . . . . . . . . . . . . . . . . . . . . . . 36Table 3.12 Amount of Haloacetic Acids in the Water Rinse from 240°C and 420°C Experiments
with Air as the Carrier Gas. . . . . . . . . . . . . . . . . . . . . . . . . . . . . . . . . . . . . . . . . . . . . . . . . . . . . . . . 38Table 3.13 Estimated Amounts (umol) of Compounds in Water Rinse from 420°C Experiment
with Air as the Carrier Gas . . . . . . . . . . . . . . . . . . . . . . . . . . . . . . . . . . . . . . . . . . . . . . . . . . . . . . . 38Table 3.14 Amounts (umol) of Compounds in the Iso-Octane Rinse from the 420°C Experiments
with Nitrogen as the Carrier Gas . . . . . . . . . . . . . . . . . . . . . . . . . . . . . . . . . . . . . . . . . . . . . . . . . . . 38Table 3.15 Amounts (umol) of Compounds in the Iso-Octane Rinse from the 420°C Experiments
with Air as the Carrier Gas. . . . . . . . . . . . . . . . . . . . . . . . . . . . . . . . . . . . . . . . . . . . . . . . . . . . . . . . 39Table 3.16 Distribution of Carbon and Chlorine for the 420°C Experiments with Nitrogen as the
Carrier Gas . . . . . . . . . . . . . . . . . . . . . . . . . . . . . . . . . . . . . . . . . . . . . . . . . . . . . . . . . . . . . . . . . . . . 40Table 3.17 Distribution of Carbon and Chlorine for the 420°C Experiments with Air as the Carrier
Gas . . . . . . . . . . . . . . . . . . . . . . . . . . . . . . . . . . . . . . . . . . . . . . . . . . . . . . . . . . . . . . . . . . . . . . . . . . 40Table 3.18 Carbon in the DCM Trap and Iso-Octane Rinse, and Chloride in the Water Rinse for
the 420°C Experiments with Nitrogen as the Carrier Gas . . . . . . . . . . . . . . . . . . . . . . . . . . . . . . . 41Table 3.19 Carbon in the DCM Trap and Iso-Octane Rinse, and Chloride in the Water Rinse for
the 420°C Experiments with Air as the Carrier Gas . . . . . . . . . . . . . . . . . . . . . . . . . . . . . . . . . . . . 43Table 3.20 Amount of Chloride and DCAA in the Water Rinse from the 120°C Experiments . . . . . . . . . . . . 44

x
Table 3.21 Amount of Chloride, DCAA, and TCAA in the Water Rinse from the 240°C Experiments . . . . . . . . . . . . . . . . . . . . . . . . . . . . . . . . . . . . . . . . . . . . . . . . . . . . . . . . . . . . . . . . . . . 44
Table 4.1 Ampule Experimental Matrix . . . . . . . . . . . . . . . . . . . . . . . . . . . . . . . . . . . . . . . . . . . . . . . . . . . . . 47Table 4.2 Experimental Matrix Used for the Fourth Ampule Experiment . . . . . . . . . . . . . . . . . . . . . . . . . . . 50Table 4.3 Summary of Ampules Prepared for the Fourth Ampule Experiment . . . . . . . . . . . . . . . . . . . . . . . 51Table 4.4 Schedule for Convection Oven Ampule Incubation . . . . . . . . . . . . . . . . . . . . . . . . . . . . . . . . . . . . 52Table 4.5 Schedule for Room Temperature Ampule Storage. . . . . . . . . . . . . . . . . . . . . . . . . . . . . . . . . . . . . . 53Table 4.6 Schedule for Explosion-Resistant Apparatus Ampule Incubation . . . . . . . . . . . . . . . . . . . . . . . . . 54Table 4.7 Results of the First Ampule Experiment After 6 Days at 120°C . . . . . . . . . . . . . . . . . . . . . . . . . . . 56Table 4.8 Results of Second Ampule Experiment After 10 Days at 120°C . . . . . . . . . . . . . . . . . . . . . . . . . . 57Table 4.9 Initial and Final TCE Concentrations in the Second Ampule Experiment. . . . . . . . . . . . . . . . . . . . 58Table 4.10 Initial and Final TCE Concentration in Anoxic Ampules from the Third Ampule
Experiment (1.4 uL of TCE added to each ampule, Initial DO = 0.79 mg/L) . . . . . . . . . . . . . . . . 58Table 4.11 Initial and Final TCE Concentration in Oxic Ampules from the Third Ampule
Experiment (TCE mixed into 250 mL of water prior to addition to each ampule, Initial DO = 8.22 mg/L) . . . . . . . . . . . . . . . . . . . . . . . . . . . . . . . . . . . . . . . . . . . . . . . . . . . . . . . . . 59
Table 4.12 Third Ampule Experiment Results for Anoxic Ampules (1.4 uL of TCE added to each ampule, Initial DO = 0.79 mg/L) . . . . . . . . . . . . . . . . . . . . . . . . . . . . . . . . . . . . . . . . . . . . . . 60
Table 4.13 Third Ampule Experiment Results for Oxic Ampules (TCE mixed into 250 mL of water prior to addition to each ampule, Initial DO = 8.22 mg/L) . . . . . . . . . . . . . . . . . . . . . . . . . . 60
Table 4.14 Amount (Aqueous and Gas Phases) of TCE in 1,000 mg/L (nominal) Anoxic (Batch 1) and Oxic (Batch 2) Ampules . . . . . . . . . . . . . . . . . . . . . . . . . . . . . . . . . . . . . . . . . . . . . . . . . . . . . . 62
Table 4.15 Amount (Aqueous and Gas Phases) of TCE in 100 mg/L (nominal) Anoxic (Batch 4) and Oxic (Batch 3) Ampules . . . . . . . . . . . . . . . . . . . . . . . . . . . . . . . . . . . . . . . . . . . . . . . . . . . . . . 63
Table 4.16 Amount (Aqueous and Gas Phases) of TCE in 100 mg/L (nominal) Anoxic Ampules with Sand (Batch 6) and Sand+1% Goethite (Batch 7) . . . . . . . . . . . . . . . . . . . . . . . . . . . . . . . . . 63
Table 4.17 Amount (Aqueous and Gas Phases) of TCE in 100 mg/L (nominal) Anoxic Ampules Amended with NaOH (0.26 mM) to pH 10 (Batch 5) . . . . . . . . . . . . . . . . . . . . . . . . . . . . . . . . . . . 64
Table 4.18 Elements Present in Ottawa Sand and Ottawa sand+1% Goethite . . . . . . . . . . . . . . . . . . . . . . . . . 66Table 4.19 Mass Balance Between Carbon and Chloride Lost as TCE and Detected as Degradation
Products in Ampules Incubated at 120°C . . . . . . . . . . . . . . . . . . . . . . . . . . . . . . . . . . . . . . . . . . . . 74Table 4.20 Amount of Carbon and Chloride Detected as Degradation Products and the Cl:C Ratio
for Ampules Incubated at 120°C . . . . . . . . . . . . . . . . . . . . . . . . . . . . . . . . . . . . . . . . . . . . . . . . . . . 75Table B.1 Dissolved Oxygen (DO) Concentration Range for Anoxic and Oxic Ampules with
1,000 and 100 mg/L of TCE (Batches 1-4) . . . . . . . . . . . . . . . . . . . . . . . . . . . . . . . . . . . . . . . . . . . 91Table B.2 Dissolved Oxygen (DO) Concentration Range for Anoxic Ampules that Contained
Solids (Ottawa sand and Ottawa Sand+1% Goethite) or NaOH (pH 10) (Batches 5-7) . . . . . . . . . 92Table C.1 Rate of TCE Disappearance from the 100 mg/L Ampules at 120°C . . . . . . . . . . . . . . . . . . . . . . . . 93

xi
List of Abbreviations
A, B, C constants in equationsACS American Chemical SocietyAIBN Azo-bis-isobutyronitrileASTM American Society of Testing and
MaterialsATSDR Agency for Toxic Substances and
Disease Registryatm atmosphereC CelsiusCg Gas phase concentration of
trichloroethyleneCo Initial concentration of
trichloroethyleneCw Aqueous phase concentration of
trichloroethyleneCTCE Concentration of trichloroethylenecfm cubic feet per minutecis-1,2-DCE cis-1,2-Dichloroethylenecm centimetercP centiPoiseDCA DichloroacetyleneDCAA Dichloroacetic acidDCM DichloromethaneDI DeionizedDNAPL Dense, non-aqueous phase liquidDO Dissolved oxygend dayEa Activation EnergyECD Electron Capture DetectorEGDY East Gate Disposal YardEPA Environmental Protection AgencyERH Electrical Resistance Heatinge- ElectronFID Flame Ionization DetectorFTIR Fourier-Transform Infraredft feetft3 cubic feetft/min feet per minuteGC Gas ChromatographyGC/MS Gas Chromatography/Mass
Spectrometryg gramsg/mL grams per milliliterg/mol grams per moleH Henry’s Law constantHCB HexachlorobenzeneHCDD Hexachlorodibenzo-p-dioxinHP Hewlett-PackardHPO Hydrous pyrolysis/oxidationHPLC High Performance Liquid
Chromatography
hrs hoursIC Ion chromatographyICP-MS Inductively Coupled Plasma – Mass
SpectrometryID Inner diameterISE Ion Selective ElectrodeIR InfraredJ Joulek or k rate constantko Zero-order rate constantk1 First-order rate constantk2 Second-order rate constantk1*, k2*, k3* Rate constants for radical-initiated
reactionskg kilogramskJ/mol kilojoules per moleL literLLNL Lawrence Livermore National
Laboratorylbs/day pounds per dayM MolarityM* Radical initiatorMCL Maximum Contaminant LevelMDL Method Detection LimitMPa Million PascalsMS Mass SpectrometryMSD Mass Select DetectorMTBE Methyl-tert-butyl etherMΩ-cm Mega ohms per centimetersm metermg milligramsmg/kg milligrams per kilogrammg/L milligrams per litermin minutemol/kg moles per kilogrammL millilitermL/g milliliters per grammL/hr milliliters per hourmL/min milliliters per minutemM millimolarmm millimetermm micrometermmol millimolesmmolal millimolalityN NormalityNA or na Not analyzedNAPL Non-aqueous phase liquidNM not measuredNPL National Priorities ListNo. Number

xii
n number of ampule results used to calculate statistics
nd amount not evident in graph or below analysis detection limit
nm nanometersnmol nanomolesnr not reportedOD Outer diameterPatm Atmospheric pressurePt Total pressurePo Pure phase vapor pressurePo
water Water vapor pressurePo
TCE Trichloroethylene vapor pressurePEEK Poly ether-ether ketonePCE TetrachloroethylenepH Hydroxide ion contentppmv parts per million volumepsi pounds per square inchR Universal Gas ConstantR2 correlation coefficientRH Relative HumidityRSD Relative standard deviationSEE Steam Enhanced ExtractionS.D. standard deviations secondT Temperature, KelvinTCAA TrichloroacetateTCE Trichloroethylene
TCE0 Trichloroethylene, initial molesTCE* Trichloroethylene radicalTCE-O2* Trichloroethylene-oxygen radicalTCD Thermal Conductivity DetectorTCH Thermal Conduction Heatingt Timetrans-1,2-DCE trans-1,2-DichloroethyleneU.S. United StatesUV ultravioletUZA Ultra zero grade airug/L micrograms per literuL microliteruL/L microliter per literuM micromolarityumol micromolesVOCs Volatile Organic CompoundsVol volumevs. versuswt weightXRD X-ray Diffraction(g) gas phase(aq) aqueous phaset1/2 half life< less than< greater than% percent~ approximately

xiii
Al AluminumAl2O3 Aluminum oxideAr ArgonC Carbon atomCHOO- FormateCH2O FormaldehydeCH3
· Methyl radicalCH4 MethaneC2H2O KeteneC2H4 EthyleneC2H6O Dimethyl etherCHCl3 ChloroformCH2Cl2 DichloromethaneC2HCl ChloroacetyleneC2H4 EtheneC2H6 EthaneC2HCl3 (also Cl2C=CHCl) TrichloroethyleneC2HClO ChloroketeneC2H2Cl2 DichloroethyleneC2H3Cl Vinyl ChlorideC2H4Cl2 DichloroethaneC3H8 PropaneC3HCl5 PentachlorocyclopropaneC3H2Cl4 TetrachloropropeneC4HCl5 PentachlorobutadieneC4H2Cl4 TetrachlorobutadieneC4H2Cl6 HexachlorobuteneC6HCl5 PentachlorobenzeneC6H5Cl7 Heptachlorocyclohexane:CCl2 DichlorocarbeneCCl4 Carbon Tetrachloride:C2Cl2 DichlorovinylideneC2Cl2 (also ClC≡ CCl) DichloroacetyleneC2Cl3 Trichloroethylene hydrolysis
productC2Cl3· Trichloroethylene radicalC2Cl4 TetrachloroethyleneC2Cl4H2 1,1,2,2-TetrachloroethaneC2Cl6 Hexachloroethane
C3Cl5 Pentachloro-1-propeneC3Cl6 HexachloropropeneC4Cl2OH4 3,4-Dichloro-3-butene-2-oneC4Cl4O PerchlorocyclobutenoneC4Cl6 HexachlorobutadieneC6Cl5OH PentachlorophenolC6Cl6 HexachlorobenzeneC6Cl6 Tetrachloro-1,3-cyclopentadiene-5-
dichloromethyleneC8Cl6 HexachlorophenylacetyleneC8Cl8 OctachlorostyreneC10Cl8 OctachloronaphthaleneCO Carbon monoxideCO2 Carbon dioxideCO3
2- Carbonate ionCOCl2 PhosgeneCaSO4 Calcium sulfateCl Chlorine atomCl- Chloride ionCl· Chlorine radicalClHO-. radical formed by the reaction of a
chlorine radical with waterClH2C2OCl Chloroacetyl chlorideClH2C2OO- ChloroacetateCl2 Chlorine gasCl2
-. Dichlorine radical anionsCl2COCHCl Trichloroethylene epoxideCl2C2HOH DichloroethenolCl2C2O DichloroketeneCl2HC2Cl2
· Tetrachloroethyl radicalCl2HC2OO- DichloroacetateCl2HC2Cl2OO· Peroxy radicalCl2HC2OCl Dichloroacetyl chlorideCl3C2
- (also Cl2C=CCl-) Trichlorovinyl anionCl3C2HCl· 1,1,1,2-Tetrachloroethyl radicalCl3C2OCl Trichloroacetyl chlorideCl3C2OO- TrichloroacetateCl3C2O2CH3 Trichloroacetic acid methyl esterClO· Chlorine-oxygen radicalCoCl2 Cobalt dichlorideCu Copper
Chemical Formulas

xiv
CuO Copper oxideFe (also Fe0) Iron, zero valentFe2+ Ferous iron ionFe3+ (also Fe(III)) Ferric iron ionFeOOH GoethiteFeNH4(SO4)2 Ferric ammonium disulfateFeS2 PyriteFeS2 Marcasite (polymorph of pyrite)Fe(SCN)2+ Iron-thiocyanate complexFe2O3 HematiteH Hydrogen atomH· Hydrogen radicalH+ Hydronum ionHCO3
- Bicarbonate ionHCOOH Formic acidHC2Cl ChloroacetyleneHC2Cl2 TCE hydrolysis productHClC2Cl· Vinyl radicalsHCl2C2OOH Dichloroacetic acidHOCH2COOH Glycolic acidHOC2OOH Oxoacetic acidHOC2OO- OxoacetateHOH2C2OO- GlycolateHOOC2OO- Oxalate
HCl Hydrochloric acidHNO3 Nitric acidHS- Hydrogen bisulfide ionH2 Hydrogen gasH2CO3 Carbonic acidH2ClC2OOH Monochloroacetic acidH2O WaterH2PO4
- Phosphate ionH2SO4 Sulfuric acidH4SiO4 Silicic acidH3O
+ Water, protonatedH3SiO4
- Silicic acid, dissociatedHgCl2 Mercuric chlorideHg(SCN)2 Mercuric thiochanateN2 NitrogenNO3
- Nitrate ionNaHCO3 Sodium bicarbonateNaOH Sodium hydroxideNa2CO3 Sodium carbonateO2 OxygenOH- Hydroxide ionSiO2 SilicaSO4
2- Sulfate ionTiCl4 Titanium tetrachloride

xv
Abstract
A series of experiments were completed to investigate abiotic degradation and reaction product formation of trichloroethylene (TCE) when heated to temperatures ranging from 60 to 480°C. The experimental systems were designed to simulate conditions anticipated during the thermal treatment of subsurface environments, most notably the inclusion of a gas phase which is essential because of the strong dependence of TCE vapor pressure and Henry’s Law constant on temperature. The two experimental systems, a 0.5 L quartz tube flow-though reactor and 50 mL borosilicate glass ampules, provided for the quantification of TCE degradation in the presence of three phases (solid, liquid, gas). The quartz-tube apparatus was used to study short residence time (<10 minutes) conditions that are thought to occur during thermal conductive heating and during the recovery of contaminants by vapor phase extraction. The glass ampules were used to study longer residence time conditions (>1 day) that are thought to occur during steam flushing and electrical resistive heating. No electrical potential was applied during the experiments, and hence, these experiments do not directly simulate electrical resistive heating.
The quartz tube experiments were conducted at the temperatures of 120, 240 and 420°C, in the presence of water vapor, and with either nitrogen or air as the carrier gas. Free chloride ions were detected at all three temperatures considered, which was interpreted as evidence of gas-phase TCE degradation. The amount of chloride formed in the 120°C experiments was small, representing less than 0.01% of the TCE that passed through the quartz tube. Passing TCE through the quartz tube heated to 420°C with nitrogen as the carrier gas resulted in substantially greater amounts of chloride (up to 6.5% of TCE). Chlorinated compounds (up to 7% as TCE) with 4 and 6 carbon atoms and at least 5 chlorine atoms were also detected at 420°C. Introducing air containing 21% oxygen into the quartz tube heated to 240°C resulted in the detection of chloride representing up to 0.4% of TCE introduced, as well as the detection of dichloroacetate and trichloroacetate. At 420°C, the presence of oxygen in the carrier gas resulted in significant increases in the number and amount of reaction products detected. Under these conditions, more than 20% of the carbon introduced as TCE was transformed into carbon monoxide and carbon dioxide, while up to 22% of the chlorine introduced as TCE was detected in the form of chlorinated carbon compounds. Increasing the quartz tube water content resulted in an increase in TCE recovery concurrent with a decrease in TCE degradation products with nitrogen as the carrier gas. With air as the carrier gas, increasing the quartz tube water content in the 420°C experiments may have served to hydrolyze phosgene and remove reactive chlorine from the gas phase while not impacting the amount of TCE degraded.
The ampule experiments were conducted in borosilicate glass ampules that were filled to approximately three-quarters capacity with aqueous solutions containing TCE at initial concentrations of 100 and 1,000 mg/L. The rate of TCE degradation and products formed was determined as function of dissolved oxygen concentration, hydroxide ion concentration, and solids content. There was no significant reduction (>10%) in TCE content of the ampules with initial concentration of 1,000 mg/L of TCE that were incubated over a 20-day period at 120°C. However, significant changes in solution pH were observed along with the detection of chloride ions and organic compounds other than TCE. The concentration of TCE decreased in ampules that initially contained 100 mg/L of TCE and were incubated at 120°C. The decrease in TCE content was matched with a decrease in ampule pH, an increase in the chloride, formate, and glycolate content of the aqueous phase, and an increase in the carbon monoxide and carbon dioxide content of the gas phase. Dichloroacetylene (DCA) was detected in ampules and may represent an intermediate formed during TCE degradation. DCA is a reactive compound that can interact with the variety of compounds present in soil such as organic carbon. Thus, the degradation products formed during the in-situ thermal treatment TCE may not be limited to those found in the ampule experiments since the ampules did not contain organic carbon other than TCE. The rates of TCE degradation in ampules with anoxic water, both with and without sand, and in oxic water were similar at 120°C. The degradation rate in ampules with anoxic water and sand was increased by adding 1% (wt) goethite.
The experimental results presented herein represent a first step toward understanding TCE chemical reactivity and reaction product formation during thermal treatment. Additional experimentation, both at the laboratory and field scale, is recommended to further elucidate TCE reaction pathways and rates, and to more accurately represent the complexities inherent in natural subsurface materials and field-scale application of thermal treatment technologies.


1
1.0Project Summary
1.1 IntroductionLaboratory studies on the hydrolysis of environmentally significant halogenated compounds have shown that trichloroethylene (C2HCl3) is extremely recalcitrant in aqueous environments, with a measured half-life as large as approximately 100,000 years under neutral conditions at 25°C (Jeffers and Wolfe, 1996). Other researchers found TCE to resist hydrolysis at 100°C (Dilling et al., 1975). However, in-situ aqueous phase degradation of trichloroethylene (TCE) into carbon dioxide (CO2) and chloride (Cl-) is claimed to occur during the thermal treatment of contaminated subsurface environments (Knauss et al., 2000). This claim is based on experimental results obtained from a completely water-filled, constant pressure, gold-walled reactor operated in the temperature range from 70 to 100°C (Knauss et al., 1999). The only degradation products reported in these experiments were dissolved carbon dioxide and chloride. However, no quantitative evaluation of the amounts of carbon dioxide and chloride recovered with respect to the initial mass of trichloroethylene was performed. While limited quantitative data are available on chemical reaction as a means of destroying contaminants in thermal remediation (Stegemeier and Vinegar, 2001), in-situ degradation of TCE into carbon dioxide and chloride has been observed during thermal conductive heating at temperatures ranging from 500 to 700°C (Baker and Kuhlman, 2002).
Subsurface environments are extremely complex systems, comprised of three phases including mixtures of solids, liquids, and gases. Subsurface solids are composed of minerals and organic matter, which may facilitate the abiotic degradation of TCE into products other than those found in pure water or gas reaction environments (Lee and Batchelor, 2003; 2004; Haderlein and Pecher, 1998). A comprehensive review of TCE degradation and the degradation products formed in heated environments in the presence of three phases (solid, liquid-water, and gas) does not currently exist. The potential TCE degradation products are not limited to carbon dioxide and chloride alone, but also include acutely toxic products such as dichloroacetyl chloride (Cl2HC2OCl) and phosgene (COCl2) that have been detected during the gas phase photocatalytic treatment of TCE (Haag et al., 1996; Amama et al., 2001).
As the use of thermal technologies, including steam flushing, electrical resistive heating and thermal conductive heating, to remediate chlorinated solvent source zones becomes more common, there is a need to
not only determine rates of TCE degradation and thus how much degradatation can be expected to occur in situ, but also to elucidate thermal reaction pathways and degradation products. Because of the strong dependence of TCE vapor pressure and Henry’s Law constant on temperature, it is essential that such experiments include a gas phase. For this reason, the experimental systems used in this work, a quartz tube reactor and sealed ampules, were specifically selected to provide for quantification of TCE degradation in presence of three phases (solid, liquid, gas). Although these experimental systems do not replicate field conditions, they represent a significant step forward from previous work, which considered TCE degradation in single-phase water (e.g., Knauss et al., 1999) or gas (e.g., Zhang and Kennedy, 2002) systems.
1.2 Research ObjectivesThe primary objective of this work was to determine if significant TCE transformation occurs in three-phase systems (gas, liquid-water, solid) at temperatures and conditions typically used for thermal remediation. Transformation of TCE was confirmed through the identification of reaction products. Identification of reaction products also allows some understanding of the likely dominant reaction mechanisms for the conditions studied. The research involved a series of laboratory experiments performed in either a flow-through quartz tube or sealed glass ampules that were designed to simulate conditions anticipated to occur during thermal treatment of porous media contaminated with TCE. Experimental conditions were varied in order to systematically evaluate the effects of temperature, oxygen concentration, hydroxide ion concentration, water content, and solids content on the rate of TCE degradation and degradation products formed. The following conditions (i.e., experimental variables) are anticipated in the subsurface during thermal treatment:
The temperature of the subsurface can range from •approximately 50 to 600°C or greater depending upon the thermal treatment technology employed.The subsurface can remain at an elevated •temperature for a period of one month to more than one year.The concentration of oxygen in the gas phase can •range from less than 1 up to 21%. The concentration of oxygen in the liquid phase can range from less than 0.1 up to 8 mg/L.

2
Within soil pore spaces water and TCE will be •converted from the condensed to vapor phase as the subsurface temperature increases.There may be significant changes in the •concentration of dissolved ionic species as the subsurface temperature increases.
In addition to changes that occur as a result of heating, the initial subsurface conditions prior to thermal treatment can vary depending upon:
The type and amount of mineral and organic matter •present in the solid phase.The initial amount of TCE present in the aqueous •phase, solid phase, and gas phase, and existing as a separate non-aqueous phase liquid (NAPL).
Based on a detailed review of previous experimental results described in Chapter 2.3 (see Table 2.4), the anticipated TCE degradation products under oxidative conditions include carbon monoxide (CO) and carbon dioxide (CO2) in the gas phase, and chloride, dichloroacetic acid, oxoacetic acid, and formic acid in the aqueous phase when the subsurface is heated to temperatures of less than 120°C (e.g., steam flushing, electrical resistive heating) and there are no other reactive species present. At temperatures greater than 300°C (e.g., thermal conductive heating), the expected gas phase TCE transformation products include CO, CO2, phosgene (COCl2), and chlorinated hydrocarbons (see Tables 2.8, 2.11, and 2.12) when there are no other reactive species present. Therefore, the experimental systems and analytical methods must be carefully designed and tested in order to collect and detect a wide range of degradation products that may occur in the gas, solid and aqueous phases.
1.3 Experimental SystemsWhile laboratory-scale apparatus are useful for investigating simulated subsurface conditions, the experimental materials must be relatively inert. In general, borosilicate glass provides thermal stability (softening point of 820°C), and is primarily composed of silica (SiO2) which is more similar to subsurface materials than metal based materials such as stainless-steel. The collection and analysis of samples from each phase within a dynamic or closed apparatus is required to quantify the TCE degradation and reaction product formation. Calculating the difference between the amount of carbon and chlorine atoms present before and after each experiment (i.e., mass balance) allows for an assessment of whether or not all possible reactants and products have been measured. The selectivity and sensitivity of each analytical method must be appropriate for the expected degradation products. Infrared spectroscopy is applicable for the analysis of dissolved carbon dioxide, but requires concentrations of greater
than 0.24 mM (Burt and Rau, 1994) for quantification. However, most of the carbon dioxide is expected to be present in the gas phase of three-phase systems, meaning that the collection and analysis of gas samples will be more sensitive to the amount of carbon dioxide formed. Sample preparation methods must also be appropriate. For example, the presence of haloacetic acids (i.e., dichloroacetic acid) may not be detected by traditional analytical techniques if the proper sample preparation methods are not used. Determining the presence of haloacetic acids requires addition of a strong acid to reach at least pH 2 for spectroscopic detection, and an additional derivitization step for gas chromatographic separation.
For the experiments conducted in this project, subsurface conditions were simulated using two experimental systems: 1) a 0.5 L flow-though quartz tube apparatus and 2) 25 and 50 mL borosilicate glass ampules. The quartz tube was used to study the high temperature (>120°C), short residence time (<10 minutes) reactions that are thought to occur within approximately 1 to 3 feet of heater wells used in thermal conductive heating. The gas-phase effluent from the flow-through tubes was passed through liquid traps and then captured in a Tedlar® bag. The liquid-trap fluids, Tedlar®-bag contents, and solid extracts were analyzed using gas chromatography (GC), ion chromatography (IC), and ion selective electrodes. The borosilicate glass ampules were used to study low temperature range (60 to 120°C) over longer residence times (>1 day), conditions that are likely to occur during steam flushing and electrical resistive heating. No electrical potential was applied to the ampules, and hence, the system does not directly simulate electrical resistive heating. The ampules were destructively sampled at specified time intervals and samples from each phase were collected for analysis using gas chromatography (GC), ion chromatography (IC), and ion selective electrodes. In addition, GC mass spectrometry (GC/MS) was employed to identify unknown compounds detected in the aqueous and gas phase effluent sample and solid phase rinses.
1.4 Conclusions and Recommendations
1.4.1 Quartz Tube Reactor ExperimentsA series of five quartz tube reactor experiments were completed over a temperature range of 22 to 480°C (Chapter 3). Specific experiments were conducted to investigate the effects of temperature, water vapor content, solids (Ottawa sand), and oxygen content on TCE degradation and reaction product formation. In all of the quartz tube experiments, some degree of TCE degradation was observed, however, the greatest amount of TCE was transformed (up to 48% of the TCE introduced) at temperature of 420°C in the presence

3
of oxygen (air as the carrier gas). The amount of TCE degraded was dependent on the temperature of the quartz tube, with more being degraded in the 420°C experiments than in the 120 or 240°C experiments. The amount of TCE degraded was also dependent on the amount of oxygen present in the 240 and 420°C experiments, with more TCE degraded when air (i.e., 21% O2) was used as the carrier gas. With nitrogen as the carrier gas, up to four TCE degradation products were identified in the liquid-trap fluids and quartz tube rinses, with no CO or CO2 detected for experiments completed at 420°C. The amount of TCE recovered for the 420°C experiments with nitrogen as the carrier gas was greater than 97%, with up to 3.4% detected as chlorinated hydrocarbon degradation products. The amount of TCE recovered as chlorine was greater than 100%, with up to 7% as chlorinated degradation products. The degradation products detected contained 4 and 6 carbon atoms with greater than 5 chlorine atoms per molecule. TCE degradation was proposed to be initiated by thermal induced unimolecular dissociation of TCE but was also influenced by chlorine induced degradation. Increasing the quartz tube water content resulted in an increase in TCE recovery concurrent with a decrease in TCE degradation products that was suggested to indicate a decrease in chlorine induced TCE degradation.
With air as the carrier gas, there was an increase in the amount of TCE degraded and an increase in the number of degradation products detected as compared with experiments completed with nitrogen as the carrier gas. The average recovery of TCE was greater than 94% with air as the carrier gas for the 120 and 240°C experiments, but decreased to approximately 53% in the 420°C experiments. Carbon-based TCE degradation products were detected in the 240 and 420°C experiments with air as the carrier gas. Three degradation products were identified in the quartz tube rinse from the 240°C experiments, and up to 13 degradation products were detected in the liquid-trap fluids and quartz tube rinses in the 420°C experiments. The degradation products ranged from single carbon compounds with 3 chlorine atoms (i.e., chloroform) to compounds with up to 6 carbons and 6 chlorine atoms (i.e., hexachlorobenzene). Carbon monoxide (CO), CO2, and phosgene were detected in the gas phase of the 420°C experiments only with air as the carrier gas. The amount of TCE recovered as carbon for the 420°C experiments with air as the carrier gas ranged from 79.1 to 91.5%, and the amount of chlorine recovered ranged from 74.6 to 88.8%. TCE degradation was proposed to be initiated by thermal induced unimolecular dissociation but was also influenced by the formation of peroxyl radicals due to the presence of oxygen. Increasing the quartz tube water content in the 420°C experiments with air as the carrier gas may have served to hydrolyze phosgene and remove reactive
chlorine from the gas phase, while not impacting the amount of TCE degraded.
1.4.2 Sealed Ampule ExperimentsFour series of ampule experiments were completed to investigate the effects of oxygen content, hydroxide ion content (pH), and solids (Ottawa sand and goethite) on TCE degradation at temperature ranging from 22 to 120°C for periods of up to 41 days (Chapter 4). The results of the ampule experiments demonstrate that TCE was degraded within sealed glass ampules that contained gas, water, and solids. The rates of TCE degradation in ampules with anoxic water, both with and without sand, and in oxic water were similar at 120°C. The degradation rate in ampules with anoxic water and sand was increased by adding 1% (wt) goethite, with a first order half-life on the order of 10 days at 120°C. The primary TCE degradation products included CO and CO2 in the gas phase and chloride, hydronium ions, formate, glycolate in the aqueous phase. Minor amounts (<1 mg/L) of dichloroacetic acid (DCAA) were detected in select ampules, most consistently in ampules that that were stored at 22°C and initially contained 1,000 mg/L TCE along with oxygen. Dichloroacetylene (DCA) was detected in minor amounts (i.e., DCA < 1% of TCE) in ampules that contained TCE and were incubated at 120°C.
Dichlororacetylene, in addition to being a TCE degradation product, was also thought to represent a key intermediate. The presence of DCA was proposed to indicate that the lone hydrogen atom in TCE was being eliminated by nucleophiles, such as sodium hydroxide (NaOH), which increased the rate of TCE degradation and amount of DCA when added to the ampules as NaOH. Dichloroacetylene was proposed to be hydrolyzed to form chlorinated organic acids, such as DCAA, which were then hydrolyzed at 120°C to form the non-chlorinated organic acids, glycolate and formate.
1.4.3 Implications to Field ApplicationsThe results in this report are important for demonstrating that transformation reactions can occur during thermal remediaton. However, extending these laboratory results toward predicting the rate of TCE degradation during the in-situ thermal treatment of TCE contaminated subsurface regions involves a significant degree of speculation. Laboratory experiments are performed on simplified systems or with materials that have, in some way, been altered from their natural state in the subsurface environment. Most thermal remediation projects for TCE are focused on physical recovery through vaporization and vacuum extraction. The transformation reactions demonstrated here will occur simultaneously with vaporization, and the relative rates of the two processes will be controlled by site specific conditions. A remediation system could not be
4
designed or operated for one of the processes without the other process also occurring. In most cases, however, vaporization rates are likely to be much faster than the transformation reactions demonstrated here, as thermal treatment of TCE contaminated sites are often completed in much shorter times (less than one year) than would be required to reduce TCE concentrations to a similar degree by the in situ transformation processes found here. Thus, in situ thermal remediation systems for TCE require robust extraction and treatment systems that can recover and treat the transformation products as well as the unreacted TCE.
Ampules such as those used in the aqueous phase experiments here have been used successfully by other researchers to study transformation rates of volatile organic compounds. The ampule experiments reported here extend that work by the addition of Ottawa sand or 1% (wt) goethite, materials collected from the subsurface and commonly found in soil environments. However, the Ottawa sand was acid-washed, which could remove surface coatings, while the goethite was ground prior to use, potentially creating fresh active surfaces (Papirer et al., 1993).
The water used in all experiments was deionized, whereas natural groundwater contains ions. For example, sodium hydroxide (an anion) was used in the ampule experiments to simulate a strong nucleophile and was shown to increase the rate of TCE degradation at 120°C by an order-of-magnitude compared to the rate determined for deionized water. The primary nucleophiles expected in the subsurface environment include hydrogen bisulfide (HS-), hydroxide (OH-), phosphate (H2PO4
2-), bicarbonate (HCO3-), sulfate
(SO42-), and nitrate (NO3
-) in order of decreasing nucleophilicity with hydrogen bisulfide as the strongest nucleophile and nitrate as the weakest. Thus the anionic content of natural groundwater, in addition to the iron containing minerals present, may strongly influence the rate of TCE degradation. Therefore, predicting the potential rate of TCE degradation during in-situ thermal treatment requires specific information regarding the geochemistry of the site being treated, keeping in mind that the increase in temperature can affect the geochemistry. For example, significant levels of sulfate (> 1 mM) were formed in ampules incubated at 120°C from the dissolution of pyrite and marcasite found in the Ottawa sand.
Free radical reactions may contribute to contaminant transformation during thermal remedation. Under ambient conditions free radicals may be created in the subsurface by the reaction of chlorinated compounds with naturally occurring iron-containing materials (Kriegman-King and Reinhard, 1992; 1994). However, a significant variation from natural conditions in these
laboratory experimental systems is the absence of naturally occurring organic matter. Although naturally occurring organic matter has not been found to have an effect on reactions such as hydrolysis (Haag and Mill, 1988), it has been found to have significant effects on free radical reactions. Haag and Hoigne (1985) found that fast consumption of hydroxyl radicals by natural dissolved organic solutes and bicarbonate ions decreased the amount of organic pollutants oxidized.
With regard to free radical reactions, TCE has been found to be virtually unreactive in oxidation reactions without a radical initiator (Kucher et al., 1990). Radical-mediated reactions are important for TCE decomposition in both the aqueous and vapor phase, and TCE is known to react with hydroxyl radicals (Buxton et al., 1988). As discussed in Section 2.3.4, the kinetic data reported by Knauss et al. (1999) are consistent with a radical chain reaction, but this is essentially an experimental observation, and the details of the reaction mechanism are unknown. It is not possible to assess the importance of this reaction in situ during thermal remediation. According to Buxton et al. (1988), radicals can be generated in the laboratory in aqueous solution by radiolysis of water, photolysis, high frequency electric discharge, sonolysis, and Fenton-type reactions. However, none of these types of radical-generating processes may be present in the subsurface during thermal remediation.
High temperatures such as that found in an incinerator flame may generate free radicals in the vapor state (Taylor et al., 1990), and the possibility exists for this to occur in the subsurface near heaters or electrodes. The species of radicals formed depends on the temperature of the system, the compounds present, and the fuel to oxygen ratio. At temperatures below 750 - 800°C, diatomic radicals are sufficiently stable to contribute to organic reactions, which may form larger molecules rather than break down chemicals, while at higher temperatures atomic radicals are prevalent and more likely lead to the breakdown of compounds (Taylor et al., 1990). Naturally occurring organic matter is likely to play a significant role in reaction rates and products formed in free radical reactions occurring in the subsurface, but natural organic matter (particularly humic substances) can be both a source (radical initiator) and sink (inhibitor, radical termination step) for free radicals.
Steam flushing and electrical resistive heating are expected to heat TCE contaminated subsurface regions to temperatures between 70 to 120°C. Based on the results for the ampule experiments, the rate of thermally induced TCE degradation in the 70 to 120°C range could be significant depending on the mineral species present in the soil (e.g., goethite) and the anion concentration
5
of the soil water (e.g., HS-). However, in situ changes in the phase distribution of TCE as the temperature is increased must be considered. Prior to heating, the contaminant (i.e., TCE) will be distributed between the organic liquid (NAPL) (if present), aqueous, solid, and gas phases. As the temperature increases, the aqueous solubility of TCE-NAPL has been shown to increase, which is likely to result in somewhat higher groundwater concentrations. However, gas-phase concentration of TCE would be expected to increase substantially due to the increase in vapor pressure and Henry’s law constant (Heron et al., 1998). In addition, the gas-phase content of a soil will increase as water evaporates, increasing the fraction of contaminant mass in the gas-phase. The application of a vacuum to the thermally-treated zone is used to enhance the removal of gas-phase constituents from the subsurface, but requires continuity of gas flow pathways to be effective.
Although in some steam injection systems air is injected with steam to enhance the movement of vapor phase contaminants to recovery wells or in an effort to increase oxidation reactions, many contaminated subsurface environments, such as those found at Cape Canaveral (Interagency DNAPL Consortium, 2002) or Fort Lewis’s East Gate Disposal Yard (Truex et. al, 2007) appear to have reductive conditions rather than oxidative conditions. This may be advantageous, because despite the known recalcitrance of TCE under oxidative conditions, laboratory experiments on the abiotic degradation of TCE have shown reduction may occur under some anaerobic conditions. Bulter and Hayes (2001) found TCE transformation to occur with freshly prepared iron sulfide, but not with an ‘aged’ iron sulfide with a slightly more crystalline structure. Su and Puls (1999) detected TCE degradation with several types of zero valent iron; however, the reaction rate constant and activation energy varied significantly. Nevertheless, at least a one order-of-magnitude increase in reaction rate was found with each of the zero valent irons as the temperature was increased from 10 to 55°C. This process could contribute to TCE degradation in some ERH remediation systems where iron is used as backfill around electrodes.
During thermal conductive heating three broad temperature regimes can be envisioned to emanate radially from the heater wells: a 700 to 900°C region located in the immediate vicinity of and within the heater well, a 500 to 700°C region within a 1 to 3 foot radius of the heater well, and a 100 to 250°C region located 10 to 20 feet from or between heater wells. Temperatures at the heating wells for thermal conductive heating are often in the range that can generate radicals, thus it may be possible to form free radicals in these systems in the immediate area around the heater wells. Some of the free radicals formed could react with naturally occurring
organic matter rather than TCE, forming unknown products, and effectively quenching the free radical chain reaction. Thus, the amount of TCE transformed during actual remediation may be less than what was found in laboratory experiments. Based on the results of the quartz tube experiments, TCE is expected to be transformed at temperature above 400°C into other chlorinated hydrocarbons, and if sufficient oxygen is present, into CO and CO2. Carbon monoxide (CO) and CO2 were only detected when oxygen was present, while no CO or CO2 was detected in experiments completed without oxygen. Phosgene (COCl2), a toxic gas, will also form with oxygen present. Phosgene is a gas at ambient temperature; thus, it would be recovered by the vacuum extraction system. Phosgene is relatively stable in incineration environments (Taylor et al., 1990), and thus may pass through the reaction chamber of a thermal oxidizer and into the scrubber, where it readily hydrolyzes to nontoxic products with water and thus would be anticipated to be removed (Haag et al., 1996).
The more volatile chlorinated-hydrocarbon degradation products (e.g., chloroform, carbon tetrachloride) can be recovered by a properly designed and operated vacuum extraction system. Less volatile degradation products such as hexachlorobenzene are also likely to be sufficiently vaporized to be recovered in the vapor extraction system at the temperatures commonly used in these systems, although some mass may condense or be sorbed by soil particles. Chlorinated organic acids such as dichloroacetic and trichloroacetic acid may also be formed in the subsurface, although their yields would be expected to be only a very small percentage of the TCE (less than 0.1% combined). These organic acids are water soluble (trichloroacetic acid is a solid at ambient temperatures), with low vapor pressures and moderate boiling points (194 and 197°C, respectively; Verschueren, 2001). A small fraction of their mass may be recovered by a gas-phase vacuum extraction system, while mass remaining in the water phase could hydrolyze in the heated water (see Table 2.6).
The complete transformation of TCE to CO2, CO, hydrocloric acid (HCl) and water, without the formation of chlorinated degradation products, has been shown to require temperatures on the order of 900 to 1,000°C (Chang and Senkan, 1989; Werner and Cool, 2000). Since the heater wells normally reach temperatures of up to 800°C, a fraction of the TCE contaminant mass may undergo complete oxidation to nontoxic products within the heater wells prior to extraction to the above ground treatment system. In the lower temperature zones outside of the heater wells, the formation of higher molecular weight chlorinated organic compounds will be favored if high concentrations of chlorinated chemicals are present, and some of these, such as tetrachloroethylene and hexachlorobenzene, are more
6
difficult to degrade than TCE (Dilling et al., 1975; Taylor et al., 1990). Thus, a robust vapor extraction system must be employed as well as an off-gas treatment system to ensure destruction or removal of chlorinated hydrocarbons that may exist in the effluent gas stream.
Clearly, the experimental results presented herein represent only a first step toward understanding TCE chemical reactivity and reaction product formation during thermal treatment. Additional experimentation, both at the laboratory and field scale, is recommended to further elucidate TCE reaction pathways and rates, and to more accurately represent the complexities inherent in natural subsurface materials and field-scale application of thermal treatment technologies.
1.5 Report OrganizationFollowing this project summary (Chapter 1), background information (Chapter 2) related to the stability of TCE in heated systems is presented, followed by a description of operational conditions for steam flushing, thermal conductive heating, and electrical resistive heating. Experimental methods and results for the quartz tube studies are presented in Chapter 3, followed by the experimental methods and results for the ampule studies in Chapter 4, with cited references listed in Chapter 5. Appendix A describes detailed experimental methods used for the quartz tube reactor studies, Appendix B contains dissolved oxygen data from some of the ampule experiments, and Appendix C contains rate constants calculated for TCE degradation assuming a first order reaction rate and a description of the methods used to compute these rates from the ampule experimental results.

7
2.0Background Information
Trichloroethylene (TCE) is a contaminant commonly found in the subsurface at industrial and military installations in the United States and abroad. Improper disposal or release of liquid or “neat” TCE to the environment frequently results in the presence of a separate organic phase contaminant, commonly referred to as a non-aqueous phase liquid (NAPL), that can become entrapped within soil pore spaces as individual droplets and ganglia (Hunt et al., 1988). These entrapped NAPL droplets and ganglia are immobile under normal groundwater flow regimes. If sufficient NAPL is released to the subsurface, the organic liquid is likely to accumulate in “pools” above layers of lower permeability media. In general, NAPLs will not enter a lower permeability layer unless the entry pressure is exceeded, that is, the pressure exerted by a continuous NAPL pool must be sufficient to displace water from the pore space. The presence of TCE-NAPL in the subsurface often represents a long-term source of contamination as TCE slowly dissolves into the groundwater flowing through the “source zone.” Pumping of groundwater and soil gas from the subsurface followed by above ground treatment is often used to control the migration of dissolved-phase TCE plumes, and in some limited cases, to restore the subsurface. Increasing the subsurface temperature has been shown to increase the transfer of TCE mass from the NAPL to the water and gas phases, which increases the rate and amount of TCE that can be removed from the subsurface by extraction methods. Thus, subsurface heating can be employed to dramatically enhance TCE mass recovery (Davis, 1997) and holds the potential to transform TCE into nontoxic products via thermally-induced chemical reactions (e.g., Knauss et al., 1999).
The following sections describe relevant physical and chemical properties of TCE, selected results from experiments on the thermal stability of TCE reported in the literature, and the operational conditions associated with commonly used in-situ thermal treatment technologies.
2.1 Trichloroethylene PropertiesTCE is an important solvent used for cleaning metal parts and electrical components, and in the manufacture of hydrofluorocarbon refrigerants (HSIA, 2001). TCE is a colorless, sweet smelling, volatile liquid that is acutely toxic to humans when ingested (Mertens, 1999). Even though TCE is referred to as a non-flammable liquid, it should be kept away from open flames and
metal surfaces with temperatures greater than 176°C due to the flammability of its vapors (Mertens, 1999). If TCE is exposed to a temperature greater than 420°C when oxygen is present, it will spontaneously ignite (Mallinckrodt and Baker, 2003a).
Even though TCE has low solubility in water, TCE is one of the most commonly found groundwater contaminants in the United States, and is present at 305 of the 1,236 National Priority List (NPL) sites (U.S. EPA, 2003). While the long-term health effects of drinking water contaminated with small amounts of TCE are not yet known, the U.S. EPA has set the maximum contaminant level (MCL) for drinking water at 5 µg/L (ATSDR, 1997). If TCE is found in groundwater at concentrations greater than 5 µg/L, treatment or control of the groundwater is usually required. Selected properties of TCE and water as a function of temperature are given in Tables 2.1 and 2.2.
Table 2.1 Selected Properties of TCE (McNeill, 1978)
Molecular Weight (g/mol) 131.39
Melting Point (°C) -87.1Boiling Point (°C) 86.7Critical Temperature (°C) 271.0
Critical Pressure (MPa) 5.02
Koc† (mL/g) 160Log Kow† 2.38
Properties at Temperature (°C) 20 60 100
TCE Explosive Limit in Air (Vol%) 8 to 10.5 no
data 8 to 52
TCE Viscosity (cP = 100×g/cm s) 0.58 0.42 no data
TCE Liquid Density (g/mL) 1.465 no
data 1.325
Solubility in Water (mg/L) 1,068 1,219 no data
Henry’s Law Constant* (dimensionless)
0.3 1.5 5.3 (95°C)
Vapor Pressure of TCE (MPa) 0.008 0.042 0.148
MPa = 1.00 bar = 1.02 atm* Heron et al., 1998; † LaGrega et al., 2001

8
Table 2.2 Selected Properties of Water (Gebhart et al., 1988)
Properties at Temperature (°C) 20 60 100
Water Viscosity (cP = 100×g/cm s) 0.99 0.46 0.28
Water Density (g/mL) 0.998 0.983 0.958
Water Solubility in TCE (mg/L) 330 1,090 no
data
Vapor Pressure of Water (MPa) 0.002 0.020 0.101
MPa = 1.00 bar = 1.02 atm
2.2 TCE-Water Phase BehaviorBoiling of a water and TCE-NAPL mixture occurs at 73.4°C, which is below the boiling point of either water (100°C) or TCE-NAPL (86.7°C). Boiling occurs when the vapor pressure of a liquid mixture exceeds the surrounding gas phase pressure. For a mixture consisting of two immiscible liquids, such as water and TCE-NAPL, the total vapor pressure is equal to the sum of the vapor pressures of each pure constituent (Dalton’s Law: Pt = Po
water + PoTCE), and the mixture will
boil when the total vapor pressure is equal to the local gas phase pressure (Pt = Patm) (Atkins, 1998). As long as TCE-NAPL is present, the mixture will boil at the lower temperature (73.4°C), and since TCE-NAPL has a greater vapor pressure than water, the composition of the boiling vapor is 93% TCE and 7% water by weight (Horvath, 1982). This phenomenon serves as the basis for steam distillation, in which TCE is separated from water at temperatures below its normal (pure) boiling point.
The diagram in Figure 2.1 shows the pure phase vapor pressures calculated using the Antoine equation [Po = 10(A-(B/(T+C))] and parameters measured for TCE-NAPL (McDonald, 1944) and water (Bridgeman and Aldrich, 1964) along with the total vapor pressure which is the sum of the pure phase vapor-pressures. Figure 2.1 also contains the weight percent of TCE based on the fraction of TCE vapor pressure relative to the total vapor pressure. Boiling of the TCE-NAPL and water mixture would occur at 73.4°C, assuming that the surrounding gas phase pressure was at 1 bar, with 93% of the vapor consisting of TCE by weight.
Figure 2.1 Water and TCE-NAPL vapor pressure as a function of solution temperature at 1 bar or 1.02 atm of total gas phase pressure.
2.3 Selected Experiments on the Stability of TCE
The following sections provide information on the methods and results of laboratory experiments performed to investigate the thermal stability of TCE. The first four sections (2.3.1 through 2.3.4) focus on the stability of TCE-NAPL and the products formed after exposing TCE to oxygen and water. The subsequent two sections (2.3.5 and 2.3.6) address the stability of gas-phase TCE and the products formed after introducing TCE into heated quartz tubes along with the importance of the chlorine to hydrogen ratio on the distribution of degradation products.
2.3.1 TCE-NAPL Degradation by OxygenThe stability of TCE-NAPL in industrial process equipment has been a research topic since at least 1932. Experiments were initially performed to determine the conditions that caused the degradation of TCE and the formation of corrosive degradation products, which could damage industrial equipment. Carlisle and Levine (1932) studied TCE degradation by placing TCE-NAPL and pure oxygen, or air, into 85 mL glass vials and heating the sealed vials to a temperature between 24 and 130°C. The vials were opened after 24 hours and 25 mL of the NAPL contents were equilibrated with 25 mL of water to determine the amount of chloride that had formed. The water contained phenolphthalein indicator and the resulting solution was titrated with a 0.01 N sodium hydroxide (NaOH) solution until a pink color appeared. The amount of NaOH required to neutralize the indicator solution was reported as the amount of free acid formed within the TCE-NAPL, and represented the water soluble TCE degradation products. No analysis of gas-phase constituents present in the head space of glass vials was performed.

9
In the presence of pure oxygen, the amount of TCE degraded increased with increasing temperature (Table 2.3) as indicated by the increase in the amount of NaOH required to titrate the phenolphthalein indicator to pink. The minimum amount of TCE degraded in 24 hours was 0.001% (mole basis) at 24°C, while the maximum of 2.52% (mole basis) occurred at a temperature of 130°C. The maximum first-order half-life for the disappearance of TCE with pure oxygen present was 475 years at 24°C, and 99 days at 130°C based on the %TCE degraded in 24 hours. A lower TCE degradation rate was observed with air present, presumably due to the decrease in oxygen content. The trend of increasing TCE degradation with temperature, as observed with pure oxygen, was not observed above 90°C with air present. Carlisle and Levine (1932) suggested that a shift to non-acid degradation products occurred above 90°C when air was present since the acid titration analysis method was only sensitive to hydronium ions.
Mugdan and Wimmer (1934) quantified the degradation products in the gas phase and NAPL after passing oxygen gas through TCE-NAPL heated to temperatures between 50 and 70°C. The gas-phase products included hydrochloric acid (HCl), carbon monoxide (CO), and
phosgene (COCl2), while the only product found in the NAPL was dichloroacetyl chloride (Cl2HC2OCl). After passing oxygen gas through TCE-NAPL heated to 60°C, Kirkbride (1942) observed the formation of additional products in the NAPL, including TCE epoxide (Cl2COCHCl) and hexachlorobutene (C4H2Cl6).
McKinney et al. (1955) found that TCE-NAPL was completely degraded to 15% gas-phase products and 85% NAPL products, on a molar basis, after passing oxygen through TCE-NAPL at 70°C. The gas-phase products included HCl, CO, and phosgene (COCl2), while the NAPL reaction product was water-soluble, had a density of 1.545 g/mL at 20°C, and was a nearly equal mixture of dichloroacetyl chloride (Cl2HC2OCl) and TCE epoxide (Cl2COCHCl) (Table 2.4). McKinney et al. (1955) completed experiments using 1) TCE stabilized with triethylamine, 2) unstabilized TCE, and 3) TCE that had been used for extracting oil from soybeans. The triethylamine stabilizer was removed from TCE-NAPL by the soybean oil extraction process meaning that this used, or waste TCE, which was historically released into the environment, was no longer stabilized against reacting with oxygen. The complete degradation of TCE-NAPL was reported after 193 hours of bubbling oxygen through TCE-NAPL at 70°C. However, the
Table 2.3 Selected TCE Stability Test Results 24 hour test (Carlisle and Levine, 1932)
Temperature (°C) 24 40 50 70 90 110 130
TCE NAPL and Pure Oxygen (100% O2)
mL of NaOH added to 25 mL of water 0.4 416 440 500 520 590 700
H+ formed (mole)* 4.0x10⁻⁶ 4.2 x10⁻³ 4.4 x10⁻³ 5.0 x10⁻³ 5.2 x10⁻³ 5.9 x10⁻³ 7.0 x10⁻³
%TCE degraded (mole basis)† 0.00 1.50 1.59 1.80 1.87 2.13 2.52
TCE NAPL and Air (21% O2, 79% N2)
mL of NaOH added to 25 mL of water 2.2 -- 2.5 192 191 119 130
H+ formed (mole)* 2.2x10⁻⁵ 2.5 x10⁻⁵ 1.9 x10⁻³ 1.9 x10⁻³ 1.2 x10⁻³ 1.3 x10⁻³
%TCE degraded (mole basis)† 0.01 0.01 0.69 0.69 0.43 0.47
* Calculated based on the results of Carlisle and Levine assuming 1 mole of OH- was equal to 1 mole H+.† Assuming one Cl atom lost per TCE molecule (HC2Cl2 hydrolysis product).

10
reaction rate was determined after addition of benzoyl peroxide to TCE, where benzoyl peroxide is known to generate peroxyl radical initiator compounds above 70°C (Fossey et al., 1995). McKinney et al. (1955) also found that partially-oxidized TCE influenced the rate of TCE degradation.
Table 2.4 Oxygen and TCE Gas-Phase and NAPL Degradation Products (McKinney et al., 1955)
Reaction Product PhaseApproximate
Amount (% mole basis)
hydrochloric acid (HCl) gas 5
carbon monoxide (CO) gas 5
phosgene (COCl2) gas 5
dichloroacetyl chloride (Cl2HC2OCl) NAPL 47
TCE epoxide (Cl2COCHCl) NAPL 38
The reaction between oxygen and TCE-NAPL is thought to involve a radical chain reaction mechanism (Kaberdin and Potkin, 1994). Kucher et al. (1990) used azo-bis-isobutyronitrile, a known temperature induced radical chain initiator, to study the oxidation of TCE in acetonitrile at 75°C. The reaction products included TCE epoxide (Cl2COCHCl) and dichloroacetyl chloride (Cl2HC2OCl) in a ratio of 3:1 after 1 hour of reaction time.
In summary, exposing TCE-NAPL to oxygen in the temperature range from 50 to 75°C, in the absence of water, resulted in the formation of gas-phase and NAPL reaction products that were thought to result from a radical chain reaction mechanism. The next section covers past experiments performed to examine the compounds formed after exposing the TCE-NAPL and oxygen degradation products to water.
2.3.2 Hydrolysis of TCE-NAPL Degradation Products
Placing the TCE-NAPL degradation products dichloroacetyl chloride and TCE epoxide in water at 27 and 75°C resulted in the formation of gas- and aqueous-phase products (Table 2.5). The gas-phase products included CO and CO2, and the aqueous-phase products included chloride ions, dicholoroacetic acid (HCl2C2OOH) along with oxoacetic (HOC2OOH) and formic acid (HCOOH). The temperature of the reaction (27 or 75°C) appeared to have little effect on the distribution of hydrolysis products. Similar reaction product distributions were also noted in water that
contained NaOH at 10 and 30°C. McKinney et al. (1955) speculated that dichloroacetic acid (DCAA) was the hydrolysis product of dichloroacetyl chloride, while the non-chlorinate organic acids were formed from the hydrolysis of TCE epoxide.
Table 2.5 Hydrolysis of TCE NAPL Degradation Products (McKinney et al., 1955)
Reactor Temperature (°C) 27 75
Reaction Product Phasemoles formed per 147.4 g of liquid reaction products
carbon monoxide (CO) gas 0.087 0.100
carbon dioxide (CO2) gas 0.005 na
chloride ion (Cl-) aqueous 1.410 1.200
dichloroacetic acid (HCl2C2OOH) aqueous 0.740 0.850
oxoacetic acid (HOC2OOH) aqueous 0.180 0.057
formic acid (HCOOH) aqueous 0.033 0.060
na – not analyzed
The degradation of TCE epoxide was determined in a separate experiment by Kline et al. (1978) that involved injecting TCE epoxide into a solution of acetone (0.2 mL) which contained 1.5 mL of 0.5 M sodium phosphate buffer. Dichloroacetic acid (DCAA) was the only reported degradation product after 4 minutes at 37°C. Cai and Guengerich (1999) prepared TCE epoxide from TCE using m-chloroperbenzoic acid, a known radical initiator compound, and then placed TCE epoxide in water at 0°C, and the degradation products were measured as a function of pH. The products formed included CO in the gas phase, formic acid, oxoacetic acid, and DCAA in the aqueous phase over a pH range from 0 to 14. The amount of CO and formic acid formed increased with pH, the amount of oxoacetic acid decreased with pH, and the amount of DCAA formed was independent of pH.
Based on the work described above, TCE can be transformed into dichloroacetyl chloride and TCE epoxide after exposure to oxygen with TCE epoxide, and potentially dichloroacetyl chloride, transformed into DCAA upon exposure to water. Thus, DCAA is one of the TCE degradation products anticipated to

11
form during the thermal treatment of TCE contaminated subsurface environments. DCAA is a colorless liquid at room temperature (25°C) with a density of 1.57 g/mL, a melting point of between 9 and 11°C, and a boiling point of 197°C (Mallinckrodt and Baker, 2003b). DCAA has been classified as a probable human carcinogen with the maximum contaminant level goal of 0 ug/L (U.S. EPA, 1998). DCAA is soluble in water with a practical drinking water treatment level of 6 ug/L.
Haag et al. (1996) measured the rate of DCAA disappearance from water heated to between 88 and 180°C as a function of NaOH concentration. The authors obtained a half-life of 1.71 days for the hydrolysis of DCAA at 103°C and pH 7, and a half-life of 1.27 hours with 0.96 M of NaOH present. Prager et al. (2001) showed that DCAA was hydrolyzed to chloride and oxoacetic acid in heated water and that a temperature of 180°C was required to achieve complete degradation of DCAA in 8 minutes.
The expected half-life for DCAA in water at pH 7 calculated from the Arrhenius parameters determined by Prager et al. (2001) are given in Table 2.6. Thus DCAA is expected to accumulate in water during the degradation of TCE at temperatures less that 70°C while DCAA is expected to be degraded into oxoacetic acid within a few days at temperatures greater than 90°C based on the half-lives given in Table 2.6.
Table 2.6 Rate of Dichloroacetic Acid (DCAA) Disappearance from Heated Water (Prager et al., 2001)
Temperature (°C)First Order
Disappearance Rate (1/day)
Half-Life (day)
60 9.3x10⁻⁴ 742
70 4.8x10⁻³ 143
80 2.3x10⁻² 30.5
90 9.8x10⁻² 7.0
100 39.3x10⁻² 1.8
120 5.1 0.14
2.3.3 Degradation of TCE Dissolved in Water at Elevated Temperatures
Carlisle and Levine (1932) placed approximately 25 mL of TCE-NAPL and 25 mL of water into 80 mL glass vials with nitrogen gas in the headspace to determine if TCE was degraded by water at elevated temperatures. The vials were sealed and heated to fixed temperatures between 50 and 150°C for 24 hours. After cooling the
vials to room temperature, the acid content of the water, an indicator of TCE degradation via the formation of acidic compounds, was determined by titrating with a 0.01 M NaOH solution until the phenolphthalein indicator turned pink. Less than 0.35% by weight of the TCE-NAPL was lost assuming that one chlorine atom was removed per TCE molecule, which led Carlisle and Levine (1932) to conclude that TCE does not readily hydrolyze in water. The observed reduction in TCE content was attributed to the small amount of oxygen within the vials at the beginning of each experiment. Assuming that oxygen-saturated water (8 mg/L O2) was present at the start of each experiment, then approximately 6.25x10⁻⁵ moles of oxygen were available to react with TCE. Although this is a sufficient amount of oxygen to account for the acid formed in vials heated to 50°C, it is insufficient by 2 to 15 times to account for the acid formed at temperatures greater than 50°C. Carlisle and Levine (1932) stated that the thermal decomposition of TCE at higher temperatures had probably occurred, although no reaction mechanism or reaction products were proposed or measured.
Dilling et al. (1975) completed a year-long experiment at ambient conditions to measure the persistence of TCE dissolved in water. Oxygen-saturated water (8 mg/L O2) containing 1.0 mg/L of TCE was loaded into each of three ice-cooled Pyrex tubes so that approximately one-half of the tube volume was filled with solution (i.e., gas phase was present) and then the tubes were flame sealed. The sealed tubes were placed in a dark container and stored at approximately 25°C. One tube was destructively sampled after 6 months (182 days), and the remaining two tubes were destructively sampled after one year (365 days). Only aqueous samples were collected and they were only analyzed for TCE content. The reported first-order disappearance rate was 2.1x10⁻³ day-1, corresponding to a first-order half-life of 326 days at 25°C. In a separate experiment, Pearson and McConnell (1975) measured the persistence of TCE in water using sealed glass bottles and reported an estimated half-life of 2.5 years (912 days) for the disappearance of TCE from water at 25°C.
Jeffers and Wolfe (1996) studied the disappearance of TCE dissolved in water by placing approximately 0.3 mL of TCE contaminated water in glass tubes and flame sealing both ends to create a sealed bulb with approximately 0.02 mL of headspace. The TCE contaminated water was prepared by mixing water with TCE-NAPL for 2 minutes at room temperature to yield an initial concentration estimated to be 10% of the solubility limit for TCE (i.e., 110 mg/L for TCE) (Jeffers et al., 1989). Experiments were completed in water with 0.01 M HCl adjusted to pH 7 (Jeffers and Wolfe, 1996) and in alkaline water containing from 0.1 to 0.001 M NaOH (Jeffers et al., 1989; Jeffers and Wolfe, 1996).

12
The water used was deionized, distilled, and boiled prior to use, which probably resulted in low dissolved oxygen content, however, no dissolved oxygen measurements were reported. The bulbs were heated to temperatures between 60 and 190°C for an unspecified period of time. The bulbs were then cooled to room temperature and the liquid content was analyzed by gas chromatography for TCE content only. The only data reported were the activation energy (120 kJ/mol) and pre-exponential factor (5.0×10⁹ 1/minute) for the Arrhenius equation [k = A×exp(-Ea/RT)] which was used to estimate a first-order rate constant of 4.5×10⁻¹² (1/mintues) along with an estimated half-life of greater than 100,000 years for the disappearance of TCE from water at ambient temperature (25°C). The calculated first-order rate constant at 90°C was 2.7×10⁻⁸ (1/mintues) with a half-life of approximately 49 years based on the Arrhenius parameters reported by Jeffers and Wolfe (1996).
Gu and Siegrist (1997) increased the rate of TCE disappearance from water by adding sodium hydroxide (NaOH). They reported the complete disappearance of TCE after 300 minutes from an aqueous solution that had an initial TCE concentration of 630 mg/L after amending with 2 M of NaOH and heating to greater than 60°C. The primary reaction products included chloride and glycolic acid (HOCH2COOH), with intermediate products including DCAA and monochloroacetic acid (H2ClC2OOH). Nearly all the chlorine atoms originally present as TCE were recovered as chloride in the reactor effluent at 80°C, however, only 60% of the carbon atoms introduced were recovered as organic acids. Gu and Siegrist (1997) suggest that the unaccounted for carbon may have been lost to gas phase degradation products (i.e., CO2) that were not captured for analysis, however, the alkaline solution would be expected to serve as a trap for CO2. The authors also acknowledged that the organic-acid detection limit (50 mg/L) for the high pressure liquid chromatography (HPLC) analysis method made it difficult to account for all the organic acid degradation products.
Atwater et al. (1996) demonstrated the removal of TCE from water using a flow-through reactor that contained ruthenium and platinum on activated carbon granular solids heated to between 90 and 120°C. The water contained TCE at 15 mg/L and dissolved oxygen in stoichiometric excess. When operated at 120°C, the reactor was capable of removing 91% of the influent TCE with a residence time of 12 seconds. However, the appearance of chloroform (CHCl3) in the reactor effluent led Atwater et al. (1996) to increase the residence time to 5 minutes in order to achieve the complete degradation of TCE without forming the unwanted chloroform degradation product.
In summary, TCE dissolved in water is degraded with
a half-life ranging from approximately 1 year (Dilling et al., 1975) to greater than 100,000 years (Jeffers and Wolfe, 1996) at room temperature (25°C). The rate of TCE degradation can be increased by heating with the half-life reduced to 49 years at 90°C based on results by Jeffers and Wolfe (1996). The rate of TCE degradation can be further increased by adding sodium hydroxide or solid catalysts with the completed degradation of TCE after 300 minutes at 60°C when amended with 2 M NaOH and after 5 minutes at 120°C with the ruthenium catalyst.
2.3.4 Thermal Degradation of TCE in a Water-Filled Reactor
Knauss et al. (1999) measured the disappearance of TCE from a water-filled reactor in an effort to demonstrate that dissolved-phase TCE could be degraded in-situ during thermal treatment of TCE contaminated aquifers. The reactor consisted of a gold-walled cylinder with a wall thickness of 0.01 inch and an outside diameter of 1.75 inches by 7 inches long for a total volume of approximately 250 mL (Seyfried et al., 1979). The gold cylinder was sealed with a titanium head piece that contained a single gold capillary tube for sample collection. The gold cylinder and titanium seal were held within a steel housing that was pressurized to between 0.1 to 3.4 mPa (1 to 340 bar) and heated to between 70 and 100°C. Pressurizing the gold cylinder caused all reaction products to remain dissolved in water and allowed small liquid samples to be forced from the reactor through the gold capillary tube. Seyfried et al. (1987) recommended rinsing the titanium head with dilute HCl solution followed by concentrated nitric acid (HNO3) solution to remove any potential sources of contamination. They also recommended heat treating the titanium head at 300°C in air to develop an inert surface oxide layer. For example, McCollom and Seewald (2003) reported heating their titanium fittings in air for 24 hours at 400°C prior to use in experiments on the hydrothermal stability of formic acid. Knauss et al. (1999) did not discuss procedures used to prepare their reactor.
Knauss et al. (1999) reported results obtained for nine separate experimental runs (Table 2.7). Each experiment was completed with air-saturated water (8 mg/L O2) that contained 150 mg/L of phosphate buffer (pH 7.2). Water solutions with initial TCE concentrations between 0.3 and 21 mg/L were placed into the gold-walled reactor with no headspace and heated to a fixed temperature between 70 and 100°C at a constant pressure of 1 MPa (10 bar) for an extended time period. Aqueous samples were collected from the reactor periodically through the gold capillary tube into 1 mL gas tight syringes. Analysis for inorganic ions, including chloride, was completed using a HPLC (HP 1090) connected to a

13
conductivity detector. The aqueous phase TCE content was determined using purge and trap separation with analysis by a gas chromatograph connected to a flame ionization detector.
Knauss et al. (1999) reported that chloride, hydronum ions (H+), and dissolved CO2 were the only degradation products detected during preliminary experiments designed to look for intermediates. However, no analysis of the experimental results was provided to demonstrate that the initial amount of TCE in the reactor was accounted for by the degradation products detected at the end of the experiment (i.e., mass balance). Based on the data presented by Knauss et al. (1999) for the amount of chloride and CO2 detected, the carbon and chloride mass balances were calculated and are provided in Table 2.7. The final amount of chloride was within 11% of the initial amount introduced as TCE (moles Cl- = 3×moles TCE) for experiments TCE-35 through -41 but was greater than the initial amount for experiments TCE-42 through -53. For example, the amount of chloride reported in experiment TCE-42 was 244% of the initial amount of TCE present in the reactor. The amount of chlorine formed during experiments TCE-51 and -53 must have been reported incorrectly since these values are orders-of-magnitude in excess of the amount of chlorine initially present in the reactor as TCE.
There was greater variability in the carbon mass balance shown in Table 2.7 as compared to the chloride balance, which may have been due to the difficulty in measuring dissolved phase CO2 at these low concentrations. Knauss et al. (1999) determined the amount of dissolved total CO2 formed, stated as the sum of carbonic acid (H2CO3),
bicarbonate (HCO3-), and carbonate (CO3
-2), using direct infrared (IR) spectroscopy. No description of the IR analysis method (e.g., sorption bands used or scan time) was provided, although the reported detection limit was 0.068 mM. Falk and Miller (1992) studied fourier-transform infrared (FTIR) spectroscopy as an analytical method for determining the aqueous phase concentration of total CO2 using the co-added signals from 400 interferograms (5-minute scan time) with 4 cm-1 band resolution. Falk and Miller (1992) concluded that this was not a feasible analysis technique for HCO3
- or CO3
-2 because the adsorption bands (1385 and 1360 cm-1, respectively) overlapped and were within the water vapor region. Analysis of dissolved CO2 was found to be feasible at the 2342.9 cm-1 adsorption band, with an estimated detection limit of 0.4 mM. Falk and Miller (1992) stated that increasing the scan time could have decreased the detection limit. Burt and Rau (1994) reported a dissolved CO2 detection limit of 0.24 mM. Hence, the detection limit reported by Knauss et al. (1999) is 3.5 to 6 times lower than those reported by Burt and Rau (1994) and Falk and Miller (1992). The ratio of the CO2 found to CO2 (as TCE) in the feed, as reported in Table 2.7, was consistently greater than one, which may indicate that the IR analysis method employed by Knauss et al. (1999) was not sensitive to the low CO2 concentrations because the signal to noise ratio was too small to accurately resolve the 2342.9 cm-1 adsorption band.
Knauss et al. (1999) provided the following expression for the rate of TCE disappearance based on the experiments completed at 90°C when dissolved oxygen
Table 2.7 Summary of Knauss et al. (1999) Experimental Results
Experiment Duration (days)
Temperature (°C)
Initial TCE (mg/L)
Final Cl- (mM)
Cl found/ Cl feed (%)
Final CO2 (mM)
CO2 found/ CO2 feed (%)
TCE-35 6.11 100 5.96 0.151 111 0.157 173
TCE-37 19.2 81 5.87 0.114 100 0.116 152
TCE-39 11.1 90 21.30 0.400 92 0.310 107
TCE-40 43.3 70 5.50 0.145 118 0.182 224
TCE-41 4.24 90 1.45 0.035 105 0.070 315
TCE-42 7.28 90 2.87 0.016 244 N/A N/A
TCE-43 2.23 90 1.62 0.049 143 0.056 246
TCE-51 7.2 90 6.09 5.563* 4012 0.120 130
TCE-53 3.31 90 5.15 3.809* 3517 0.104 144
* Data presented by Knauss et al. (1999) Table 1, but appears to be incorrectly reported. Reported analytical detection limits: TCE = 0.0002 mM, Cl- = 0.003 mM, CO2 = 0.068 mM.
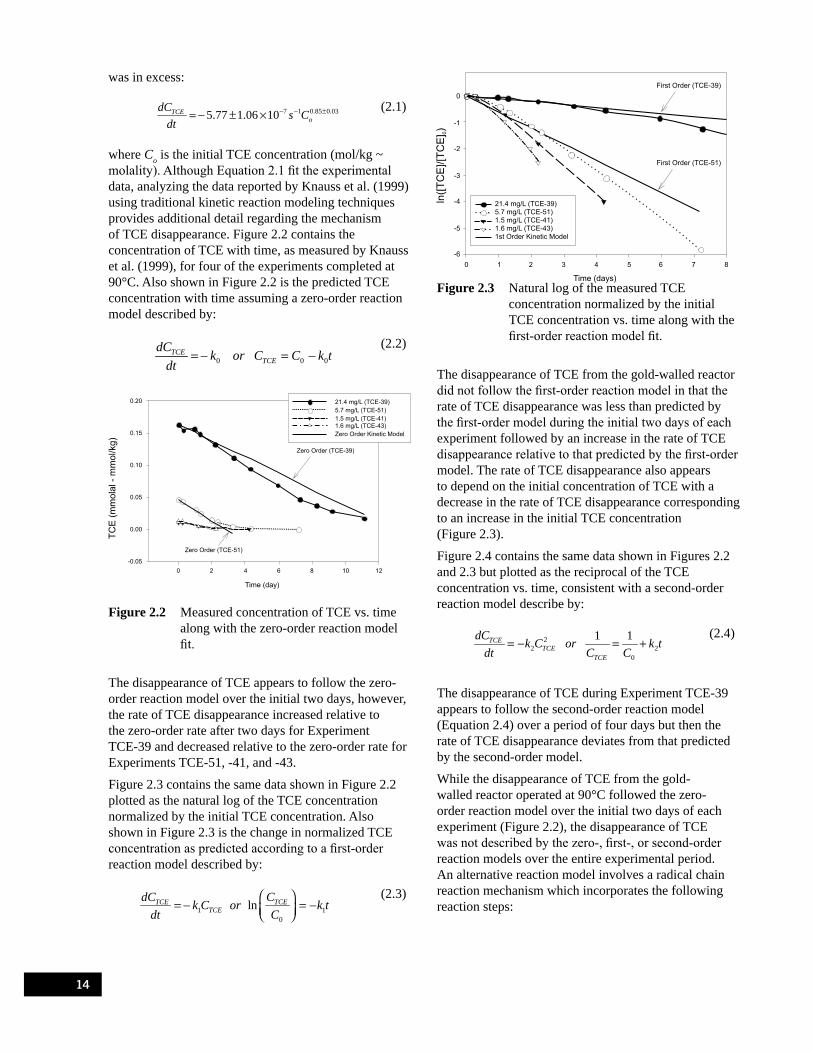
14
was in excess:
7 1 0.85 0.035.77 1.06 10TCEo
dC s Cdt
− − ±= − ± × (2.1)
where Co is the initial TCE concentration (mol/kg ~ molality). Although Equation 2.1 fit the experimental data, analyzing the data reported by Knauss et al. (1999) using traditional kinetic reaction modeling techniques provides additional detail regarding the mechanism of TCE disappearance. Figure 2.2 contains the concentration of TCE with time, as measured by Knauss et al. (1999), for four of the experiments completed at 90°C. Also shown in Figure 2.2 is the predicted TCE concentration with time assuming a zero-order reaction model described by:
0 0 0
TCETCE
dC k or C C k tdt
= − = − (2.2)
Figure 2.2 Measured concentration of TCE vs. time along with the zero-order reaction model fit.
The disappearance of TCE appears to follow the zero-order reaction model over the initial two days, however, the rate of TCE disappearance increased relative to the zero-order rate after two days for Experiment TCE-39 and decreased relative to the zero-order rate for Experiments TCE-51, -41, and -43.
Figure 2.3 contains the same data shown in Figure 2.2 plotted as the natural log of the TCE concentration normalized by the initial TCE concentration. Also shown in Figure 2.3 is the change in normalized TCE concentration as predicted according to a first-order reaction model described by:
1 1
0
lnTCE TCETCE
dC Ck C or k tdt C
= − = −
(2.3)
Figure 2.3 Natural log of the measured TCE concentration normalized by the initial TCE concentration vs. time along with the first-order reaction model fit.
The disappearance of TCE from the gold-walled reactor did not follow the first-order reaction model in that the rate of TCE disappearance was less than predicted by the first-order model during the initial two days of each experiment followed by an increase in the rate of TCE disappearance relative to that predicted by the first-order model. The rate of TCE disappearance also appears to depend on the initial concentration of TCE with a decrease in the rate of TCE disappearance corresponding to an increase in the initial TCE concentration (Figure 2.3).
Figure 2.4 contains the same data shown in Figures 2.2 and 2.3 but plotted as the reciprocal of the TCE concentration vs. time, consistent with a second-order reaction model describe by:
22 2
0
1 1TCETCE
TCE
dC k C or k tdt C C
= − = + (2.4)
The disappearance of TCE during Experiment TCE-39 appears to follow the second-order reaction model (Equation 2.4) over a period of four days but then the rate of TCE disappearance deviates from that predicted by the second-order model.
While the disappearance of TCE from the gold-walled reactor operated at 90°C followed the zero-order reaction model over the initial two days of each experiment (Figure 2.2), the disappearance of TCE was not described by the zero-, first-, or second-order reaction models over the entire experimental period. An alternative reaction model involves a radical chain reaction mechanism which incorporates the following reaction steps:

15
Figure 2.4 Reciprocal of the measured concentration of TCE vs. time along with the second-order reaction model fit.
Initiation: TCE + M* → TCE* k1* (2.5)
Peroxyl Radical: TCE* + O2 → TCE-O2* k2* (2.6)
Propagation: TCE + TCE-O2* → TCE epoxide + dichloroacetyl chloride k3* (2.7)
The symbol M* represents some radical initiator such as the gold or titanium surface within the reactor or chlorine radicals which transfer a single electron to TCE and results in the formation of the TCE radical species (TCE*). This three step TCE disappearance mechanism was based on work by Kucher et al. (1990) and was used to fit the results for the Knauss et al. (1999) experiment completed at 70°C (TCE-40). The 70°C experiment was chosen because the rate of TCE disappearance was slower as compared to the 90°C experiments and thus the features that indicate a radical chain mechanism, including a delayed reaction rate during the initial three days (reactor heat-up was less than one day) as the concentration of the peroxyl radicals increased followed by an increase in the TCE disappearance rate between day 10 and 40 (Figure 2.5), were more pronounced.
Figure 2.5 shows the concentration of TCE vs. time data as reported by Knauss et al. (1999), along with the best fit using the reaction model described by Equations 2.5 through 2.7 determined using finite difference analysis with time steps of 0.1 days. The disappearance of TCE followed the radical chain model over the 43 day experimental period with the reaction rate coefficients for the initiation and peroxyl radical formation (k1* and k2*) equal to 1.62 and 1.80 mmolal-1 day-1 respectively, while the rate coefficient for the peroxyl radical attack on TCE (k3*) was equal to 132.6 mmolal-1 day-1.
The close agreement between the radical chain model and the measured TCE disappearance for Experiment TCE-40 does not necessarily validate this model.
Figure 2.5 Measured concentration of TCE vs. time for Experiment TCE-40 and radical chain reaction model fit.
However, the radical chain model is consistent with two of the key observations made by Knauss et al. (1999), namely that the rate of TCE disappearance was dependent on the initial TCE concentration and that the rate of TCE disappearance was independent of the dissolved oxygen concentration as long as it was in excess of the initial amount of TCE present. The dependence on the initial TCE concentration is due to the slow rate of radical initiation (k1* and k2*) compared to the fast rate of the peroxyl-radical TCE reaction (k3*). That is, the formation of peroxyl radicals is the rate limiting step (k2*/k3* = 0.01).
Knauss et al. (1999) found that dissolved-phase TCE could be degraded in a heated reactor with CO2 and chloride as the only detected degradation products. The time for one-half of the initial amount of TCE to be degraded at 90°C ranged from approximately 1 to 5 days depending on the initial TCE concentration (Figure 2.2). Knauss et al. (1999) reported that the rate of TCE disappearance from the heated reactor was best described using a pseudo first-order reaction model (Equation 2.1). Analysis of the Knauss et al. (1999) data provided herein suggests that a radical chain reaction mechanism provided the best fit for the disappearance of TCE over the entire experimental period.
2.3.5 Degradation of Gas-Phase TCE within Heated Quartz Tubes
One method of treating unwanted waste TCE is by feeding the waste into incinerators operated at temperatures greater than 1,000°C. The degradation of TCE and the products formed during the incineration process have been studied by passing gas-phase TCE through heated quartz tubes, trapping the effluent leaving the quartz tubes, and analyzing the traps to determine the TCE degradation products formed. The following section provides details of past quartz tube experimental

16
results with the goal of anticipating the degradation products that might form during the high-temperature treatment of subsurface environments contaminated with TCE.
Pyrolysis is a general term used to describe organic chemical reactions that occur at elevated temperatures (Brown, 1980; Moss, 1994). Pyrolysis has also been used to indicate high temperature gas-phase reactions that occur in the absence of oxygen (Mulholland et al., 1992), whereas pyrolysis has been used by others to describe high temperature gas-phase reactions that occur with oxygen present (Yasuhara and Morita, 1990). The term pyrolysis is avoided in the following sections because of the ambiguity with regard to the presence of oxygen, instead of using this terminology, the oxygen content of the gas phase will be stated when appropriate.
Graham et al. (1986) measured the amount of TCE degraded after injecting TCE-NAPL into a heated quartz tube (2 second residence time) as a function of quartz tube temperature and oxygen concentration (Table 2.8). The amount of TCE degraded increased with quartz tube temperature and oxygen content. TCE degradation was initiated at 600°C when the amount of oxygen present was equal to the stoichiometric amount required for the complete combustion of TCE (2.5 moles of O2 per mole TCE) and decreased to 500°C when the amount of oxygen present was in excess to the stoichiometric amount. Temperatures greater than 800°C were required to degrade 99% of the TCE introduced into the quartz tube, independent of oxygen content. Graham et al. (1986) detected the greatest number of TCE degradation products at 750°C with some products detected at 1000°C after 99.9% of the parent TCE had been degraded; however, the exact identity and distribution of products was not reported.
Increasing the residence time within a quartz tube has been shown to decrease the temperature at which TCE degradation is initiated. Yasuhara and Morita (1990)
passed air (80% N2 and 20% O2) at 50 mL/min through chilled TCE and into a quartz tube that was maintained at a temperature between 300 and 800°C. The amount of oxygen present, approximately 1.6 moles O2 per mole TCE, was less than the stoichiometric amount required for complete combustion. The residence time within the quartz tube ranged from 23 to 43 seconds (Table 2.9), and the degradation of TCE was initiated at a temperature of less than 300°C with approximately 99% of the TCE degraded at 500°C. Therefore, an increase in the quartz tube residence time to greater than 20 seconds resulted in 200 and 300°C reduction in the temperature required for the initiation of TCE degradation and for 99% destruction of TCE, respectively. Zhang and Kennedy (2002) found that TCE degradation within a surface boundary layer with residence time of approximately 0.04 seconds did not occur until the temperature reached 1000°C.
Yasuhara and Morita (1990) also quantified condensable TCE degradation products by passing the effluent gas stream leaving the quartz tube through a dichloromethane (CH2Cl2) filled trap. The greatest number of reaction products (23 compounds) was identified in the dichloromethane trap fluid after 1 hour of feeding TCE into a quartz tube maintained at 400°C. The most prevalent compounds found at 400°C included TCE, tetrachloroethylene (C2Cl4), carbon tetrachloride (CCl4), hexachloroethane (C2Cl6), hexachlorobutadiene (C4Cl6), and hexachlorobenzene (C6Cl6). TCE was not present (i.e., > 99% destruction) in the dichloromethane trap fluid when the quartz tube was maintained at temperatures greater than 600°C, while tetrachloroethylene (C2Cl4) and carbon tetrachloride (CCl4) were detected at all temperatures between 300 and 800°C (Table 2.9).
Froese and Hutziner (1994) determined the amount of chlorinated benzenes and phenols formed after passing TCE and air (0.9 to 1.5 second residence time) through a heated quartz tube that contained 0.5 grams of solids.
Table 2.8 Amount of TCE Degraded after Passing Through a Heated Quartz Tube Residence Time of 2 Seconds (Graham et al., 1986)
Quartz Tube Temperature (°C) 500 600 650 700 800 950 1000
Oxygen Content Amount TCE degraded (wt%)
None* NM 0 10 40 75 99.9 NM
Stoichiometric NM 0 NM 85 98.5 NM NM
Excess 0 20 70 90 98.5 NM NM
* Measurements completed by injecting a mixture of chlorobenzene, carbon tetrachloride, TCE, trichloro-trifluoroethane and toluene. Pure TCE-NAPL was only used in the Stoichiometric and Excess experiments.
NM – not measured

17
The solids included fly ash collected from an incinerator and a series of silica gel (SiO2) solids that were amended with aluminum oxide (Al2O3) (10 wt% Al), hematite (Fe2O3) (10 wt% Fe), and copper oxide (CuO) (1 wt% Cu) (Table 2.10). The effluent from the quartz tube reactor was passed through a tube filled with activated carbon (Carbotrap) to collect condensable degradation products. The Carbotrap and quartz tube reactor were extracted with dichloromethane, toluene, and a 1:1 hexane/dichloromethane mixture to determine the amount of chlorinated benzenes and phenols formed. The quartz tube and solids was extracted with toluene, methanol, and the 1:1 hexane/dichloromethane mixture. Lower molecular weight compounds such as carbon tetrachloride (CCl4) or tetrachloroethylene (C2Cl4) were not analyzed.
The amount of chlorinated benzenes and phenols formed as a function of temperature at 400, 500, and 600°C was determined only with fly ash as the solid phase (Table 2.10). A number of di-, tri-, tetra-, penta-, and hexa- chlorinated benzene and phenol compounds were detected, primarily condensed within the quartz tube and on the solids. However, the penta- and hexachlorinated compounds were formed in the greatest abundance. The greatest amount of chlorinated compounds was formed at 600°C, with hexachlorobenzene reported as the predominant TCE degradation product (Table 2.10).
Table 2.10 Selected Degradation Products after Passing TCE through a Heated Quartz Tube Containing Fly Ash, 0.9 to 1.5 second Residence Time (Froese and Hutzinger, 1994)
Quartz Tube Temperature (°C) 400 500 600
Selected Reaction Products wt% of TCE in feed
pentachlorobenzene (C6HCl5)
nd 1x10⁻² 40.0x10⁻³
hexachlorobenzene (C6Cl6)
nd 1x10⁻² 300.0x10⁻³
pentachlorophenol (C6Cl5OH) 5x10⁻⁶ 3x10⁻⁵ 1.3x10⁻³
Values estimated from graphs found in Froese and Hutzinger (1994).
nd – amount not evident in graph
Table 2.9 Selected Degradation Products after Passing TCE through a Heated Quartz Tube (Yasuhara and Morita, 1990)
Quartz Tube Temperature (°C) 300 400 500 600 700 800
Residence Time (seconds) 43 36 32 28 25 23
Selected Reaction Products Amount present in liquid trap after 1 hour (% of Carbon in Feed)
trichloroethylene (C2HCl3) 65.51 31.02 0.17 0.00 0.00 0.00
tetrachloroethylene (C2Cl4) 0.30 6.95 11.78 13.92 4.68 0.03
carbon tetrachloride (CCl4) 0.02 0.76 3.58 6.81 4.48 2.87
hexachloroethane (C2Cl6) 0.18 1.94 0.27 0.06 0.04 0.00
hexachlorobutadiene (C4Cl6) 0.21 0.94 0.91 0.18 0.00 0.00
hexachlorobenzene (C6Cl6) 0.00 0.24 0.43 0.09 0.01 0.00
Total 66.21 41.84 17.13 21.06 9.21 2.90

18
The effect of solids on the amount of chlorinated benzenes and phenols formed in the quartz tube was evaluated at 600°C (Table 2.11). Only 11% of the quartz tube volume was filled with solids, which were located near the effluent end of the tube. The presence of the silica gel (SiO2) was shown to have no impact on the formation of chlorinated benzenes and phenols, while the presence of fly ash and aluminum oxide increased the formation of these products and the presence of hematite (Fe2O3) and copper oxide (CuO) resulted in a decrease in the amount of chlorinated benzenes and phenols formed.
Mulholland et al. (1992) determined the condensed-phase products formed after passing TCE and nitrogen (no oxygen present) through a heated quartz tube (1.5 second residence time) at temperatures ranging from 800 and 1200°C. The solids produced by the degradation of TCE were collected on a filter, which was subsequently rinsed with dichloromethane (CH2Cl2) to determine the tar and soot fractions, where soot was defined as the fraction that is insoluble in dichloromethane. The chemical species present in the tar fraction were identified using mass spectrometry (MS), liquid chromatography, and IR analysis. Approximately 10% (wt) of the TCE that passed through the quartz tube heated to 800°C was converted into tar. Hexachlorobenzene (C6Cl6), hexachlorophenylacetylene (C8Cl6), octachlorostyrene (C8Cl8), and octachloronaphthalene (C10Cl8) were the most abundant compounds found in the tar based on MS response.
Mulholland et al. (1992) suggested that dichloroacetylene (C2Cl2) was a key intermediate that led to the formation of the higher molecular weight compounds. Wu and Lin (2004) detected dichloroacetylene (C2Cl2) as one of the primary TCE degradation products after passing TCE and a
stoichiometric amount of oxygen through a quartz tube (residence time between 0. to 1.5 seconds) heated to between 575 to 850°C.
Chang and Senkan (1989) measured the intermediates and products that formed after burning a mixture of TCE (22.6%), oxygen (33.1%), and argon (Ar; 44.3%), where oxygen was in excess of the stoichiometric requirement for complete combustion. The mixture burned as a two-stage flame, with the initial stage at approximately 1,000°C and the final stage at 1,500°C. The final degradation products included (in order of abundance) CO, HCl, chlorine gas (Cl2), and CO2. Intermediates identified in the initial flame stage included phosgene (COCl2), tetrachloroethylene (C2Cl4), carbon tetrachloride (CCl4), dichloroacetylene (C2Cl2), dichloroacetyl chloride (Cl2HC2OCl), and trichloroacetyl chloride (Cl3C2OCl) among others (Table 2.12).
The data reported by Chang and Senkan (1989) demonstrate that passing TCE through a temperature gradient from 600 to 1,000°C, with oxygen present, produced a variety of chlorinated compounds. These chlorinated compounds were then transformed into non-chlorinated carbon compounds (e.g., CO2), but only at temperatures in excess of 1,000°C in the final stage of the flame.
In summary, passing gas-phase TCE through quartz tubes heated between 300 and 800°C resulted in the formation of a wide variety of compounds from carbon tetrachloride (CCl4) and tetrachloroethylene (C2Cl4) to hexachlorobenzene (C6Cl6). Thus, the possibility exists that these compounds could be formed during the in-situ thermal treatment of regions contaminated with TCE where temperatures exceed 300°C. Based on the work by Chang and Senkan (1989), temperatures in excess of 1,000°C would be required to destroy these compounds. Reducing the amount of chlorinated degradation
Table 2.11 Selected Degradation Products at 600°C as a Function of Quartz Tube Solids Content, 0.9 to 1.5 second Residence Time (Froese and Hutzinger, 1994)
Quartz Tube Contents (solids were 11% of tube volume)
Empty SiO2 SiO2/Al2O3 SiO2/Fe2O3 SiO2/CuO SiO2/Flyash
Products Formed wt% of TCE in feed
pentachlorobenzene 0.0058 0.0035 0.012 1.2x10⁻⁴ 3x10⁻⁴ 0.04
hexachlorobenzene 0.0025 0.0058 0.080 2.2x10⁻⁴ 5x10⁻⁴ 0.30
pentachlorophenol nr 1.4x10⁻⁴ 8.2x10⁻⁴ 3.0x10⁻⁴ 0.4x10⁻⁴ 1.3x10⁻³
Values estimated from graphs found in Froese and Hutzinger (1994).nr – not reported

19
products and increasing the non-chlorinated products is thought to be dependent on the amount of chlorine and hydrogen in the high-temperature region. The following section provides a discussion of experiments performed to investigate changes in TCE degradation product distribution as a function of the chlorine to hydrogen (Cl:H) ratio.
2.3.6 TCE Degradation Products as a Function of the Cl:H Ratio
Mulholland et al. (1992) suggested that the ratio of the chlorine to hydrogen (Cl:H) present in the quartz tube would affect the type of degradation products formed. With a Cl:H ratio of less than one (Cl:H < 1), chlorine would preferentially react with hydrogen to form HCl, and with a Cl:H ratio of greater than 1 (Cl:H>1), chlorine was predicted to react with carbon to form chlorinated hydrocarbons. The experiments completed by Chang and Senkan (1989) and Mulholland et al. (1992) represent results for TCE degradation with a Cl:H ratio of 3, thus the observed chlorinated hydrocarbons were the expected TCE degradation products.
In contrast, Werner and Cool (2000) measured the
products formed during combustion of TCE using a chlorine to hydrogen ratio of less than 1 (Table 2.13). Here, the authors introduced TCE into a methane (CH4) flame that consisted of 17% CH4, 35% O2, 46% Ar, and 2% TCE by volume for a Cl:H ratio of approximately 0.09. A two-stage flame was not observed in contrast to the high Cl:H ratio experiment by Chang and Senkan (1989). The final combustion products included (in order of abundance) H2O, CO2, CO, HCl, methane (CH4), and O2. Intermediates identified in the flame adjacent to the burner surface (200 to 1000°C) included dichloroethylene (C2H2Cl2), vinyl chloride (C2H3Cl), ethylene (C2H4), dichloroethenol (Cl2C2HOH), dichloroketene (Cl2C2O), chloroketene (C2HClO), and ketene (C2H2O), indicating that the oxidation state of the TCE carbon atoms was being reduced within the flame with Cl:H ratio of less than one. The observation that the TCE carbons were reduced in low Cl:H ratio flames is also supported by the results of Yang and Kennedy (1993) who found acetylene, ethylene, and ethane were the primary intermediates after introducing TCE into a methane flame with Cl:H ratio of 0.14.
Table 2.12 Selected Compounds in a TCE Flame with Cl:H Ratio of 3 (Chang and Senkan, 1989)
Species in FlameInitial Stage
(600-1000°C) (% mole basis)
Final Stage (1500°C) (% mole basis)
carbon monoxide (CO) 15.00 1
carbon dioxide (CO2) 4.00 20
hydrochloric acid gas (HCl) 10.00 10
chlorine gas (Cl2) 9.00 9
tetrachloroethylene (C2Cl4) 2.00 nd
phosgene (COCl2) 1.80 nd
carbon tetrachloride (CCl4) 1.50 nd
dichloroacetyl chloride (Cl2HC2OCl) 1.00 nd
trichloroacetyl chloride (Cl3C2OCl) 0.80 nd
dichloroacetylene (C2Cl2) 0.80 nd
hexachloropropene (C3Cl6) 0.50 nd
hexachlorobutadiene (C4Cl6) 0.35 nd
hexachloroethane (C2Cl6) 0.15 nd
Maximum measured values estimated from graphs found in Chang and Senkan (1989).nd – below analysis detection limit
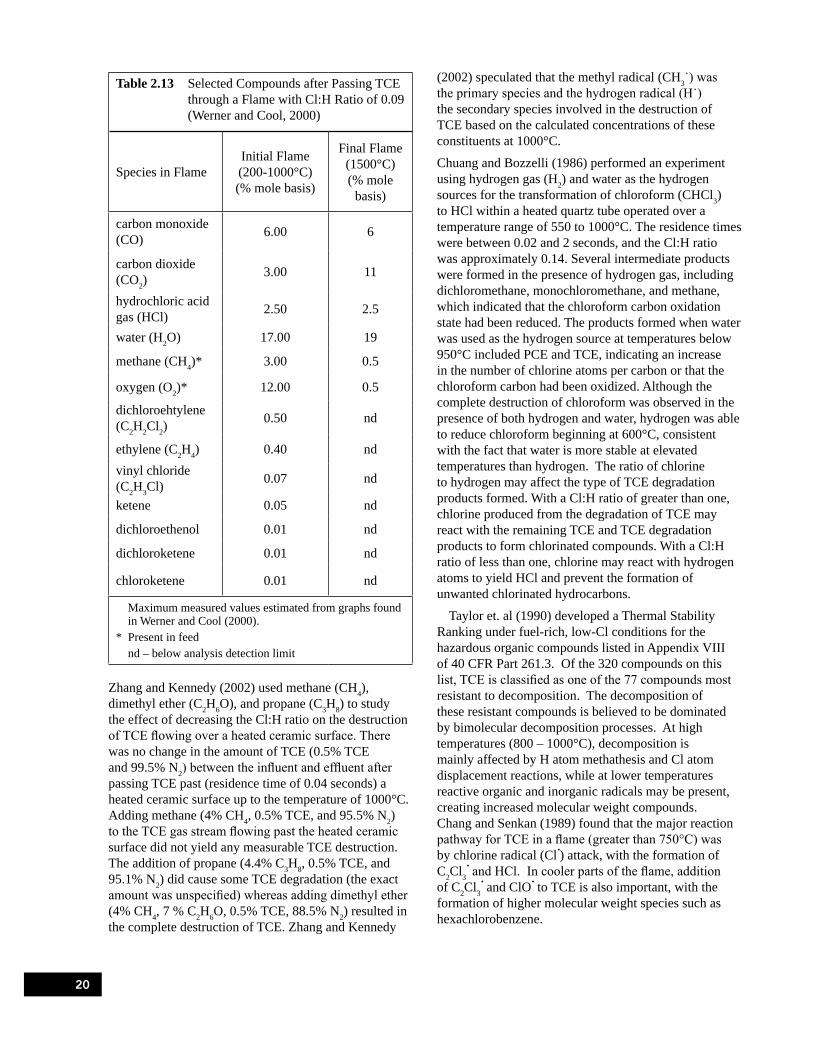
20
Table 2.13 Selected Compounds after Passing TCE through a Flame with Cl:H Ratio of 0.09 (Werner and Cool, 2000)
Species in FlameInitial Flame (200-1000°C) (% mole basis)
Final Flame (1500°C) (% mole
basis)
carbon monoxide (CO) 6.00 6
carbon dioxide (CO2)
3.00 11
hydrochloric acid gas (HCl) 2.50 2.5
water (H2O) 17.00 19
methane (CH4)* 3.00 0.5
oxygen (O2)* 12.00 0.5
dichloroehtylene (C2H2Cl2)
0.50 nd
ethylene (C2H4) 0.40 ndvinyl chloride (C2H3Cl) 0.07 nd
ketene 0.05 nd
dichloroethenol 0.01 nd
dichloroketene 0.01 nd
chloroketene 0.01 nd
Maximum measured values estimated from graphs found in Werner and Cool (2000).
* Present in feed nd – below analysis detection limit
Zhang and Kennedy (2002) used methane (CH4), dimethyl ether (C2H6O), and propane (C3H8) to study the effect of decreasing the Cl:H ratio on the destruction of TCE flowing over a heated ceramic surface. There was no change in the amount of TCE (0.5% TCE and 99.5% N2) between the influent and effluent after passing TCE past (residence time of 0.04 seconds) a heated ceramic surface up to the temperature of 1000°C. Adding methane (4% CH4, 0.5% TCE, and 95.5% N2) to the TCE gas stream flowing past the heated ceramic surface did not yield any measurable TCE destruction. The addition of propane (4.4% C3H8, 0.5% TCE, and 95.1% N2) did cause some TCE degradation (the exact amount was unspecified) whereas adding dimethyl ether (4% CH4, 7 % C2H6O, 0.5% TCE, 88.5% N2) resulted in the complete destruction of TCE. Zhang and Kennedy
(2002) speculated that the methyl radical (CH3˙) was the primary species and the hydrogen radical (H˙) the secondary species involved in the destruction of TCE based on the calculated concentrations of these constituents at 1000°C.
Chuang and Bozzelli (1986) performed an experiment using hydrogen gas (H2) and water as the hydrogen sources for the transformation of chloroform (CHCl3) to HCl within a heated quartz tube operated over a temperature range of 550 to 1000°C. The residence times were between 0.02 and 2 seconds, and the Cl:H ratio was approximately 0.14. Several intermediate products were formed in the presence of hydrogen gas, including dichloromethane, monochloromethane, and methane, which indicated that the chloroform carbon oxidation state had been reduced. The products formed when water was used as the hydrogen source at temperatures below 950°C included PCE and TCE, indicating an increase in the number of chlorine atoms per carbon or that the chloroform carbon had been oxidized. Although the complete destruction of chloroform was observed in the presence of both hydrogen and water, hydrogen was able to reduce chloroform beginning at 600°C, consistent with the fact that water is more stable at elevated temperatures than hydrogen. The ratio of chlorine to hydrogen may affect the type of TCE degradation products formed. With a Cl:H ratio of greater than one, chlorine produced from the degradation of TCE may react with the remaining TCE and TCE degradation products to form chlorinated compounds. With a Cl:H ratio of less than one, chlorine may react with hydrogen atoms to yield HCl and prevent the formation of unwanted chlorinated hydrocarbons.
Taylor et. al (1990) developed a Thermal Stability Ranking under fuel-rich, low-Cl conditions for the hazardous organic compounds listed in Appendix VIII of 40 CFR Part 261.3. Of the 320 compounds on this list, TCE is classified as one of the 77 compounds most resistant to decomposition. The decomposition of these resistant compounds is believed to be dominated by bimolecular decomposition processes. At high temperatures (800 – 1000°C), decomposition is mainly affected by H atom methathesis and Cl atom displacement reactions, while at lower temperatures reactive organic and inorganic radicals may be present, creating increased molecular weight compounds. Chang and Senkan (1989) found that the major reaction pathway for TCE in a flame (greater than 750°C) was by chlorine radical (Cl·) attack, with the formation of C2Cl3
· and HCl. In cooler parts of the flame, addition of C2Cl3
· and ClO· to TCE is also important, with the formation of higher molecular weight species such as hexachlorobenzene.

21
2.4 Operational Conditions of In Situ Thermal Treatment Technologies
The following sections provide a brief review of steam flushing, thermal conductive heating, and electrical resistive heating, three thermal remediation techniques commonly used to treat chlorinated solvent contaminated aquifers (U.S. EPA, 2004). The purpose of these sections is to discuss subsurface conditions (e.g., temperature, residence time) that might exist during application of these thermal technologies. The increase in subsurface temperature resulting from thermal treatments will lead to substantial changes in the distribution of volatile organic contaminants between the solid, liquid, and gas phases. For example, the vapor pressures and Henry’s Law constants of TCE and PCE increase markedly with temperature (Heron et al., 1998; Sleep and Ma, 1997), indicating that a substantial fraction of the contaminant mass will exist in the gas phase during thermal remediation. As a result, thermal treatment systems incorporate a vacuum extraction system to recover gas-phase contaminants from the subsurface. The following sections are not intended to provide a comprehensive review of thermal treatment methods or their application, but rather to provide the reader with a brief summary of the basic approaches and principles.
2.4.1 Steam FlushingInjecting steam into the subsurface through wells has been shown to be effective for mobilizing fluids, heating the subsurface, and removing TCE (Udell, 1997). When steam is injected into the subsurface, it initially condenses, releasing the latent heat of vaporization which heats the soil and interstitial fluids. With continued injection, three distinct zones develop: a nearly isothermal steam zone at steam temperature surrounding the injection point, a relatively narrow variable temperature zone, and an isothermal zone at ambient temperature. The temperature of the injected steam is limited by the injection depth, as the injection pressure must remain below the overburden pressure to avoid steam breakthrough at the ground surface, and specifying the steam pressure fixes the steam temperature. In general, pressures of less than 0.5 psi ft of overburden are employed in unconsolidated media to avoid breakthrough of the steam front at the surface (Davis, 1997; Udell, 1997). Thus, steam temperatures are normally in the range of 120 to 140°C for injection depths between 40 and 120 feet below ground surface. Interstital fluids are displaced in front of the steam zone, and residual liquids held in the pore space and adsorbed contaminants are vaporized when the steam zone reaches them, and are then transported to the steam front. Within the ambient temperature zone, these vapors can condense, forming a contaminant bank. When the contaminant is a dense, non-aqueous phase liquid (DNAPL) such as TCE, this can lead to
downward mobilization of the DNAPL (Schmidt et al., 1998; Kaslusky and Udell, 2002). Thus, when treating DNAPLs such as TCE, air co-injection is now commonly used. Co-injecting air with the steam has the effect of carrying part of the heat as well as contaminant vapors to the extraction wells more quickly, creating a much wider variable temperature zone and somewhat reducing the temperatures within the steam zone (Kaslusky and Udell, 2002).
The depth of steam injection sets a maximum injection pressure that can be used, but some field applications of steam injection have chosen to employ lower pressures and temperatures. Thus, a wide range of temperatures have been used in field applications of steam injection remediation. The following two case studies describe steam injection demonstration projects where the purpose of the demonstration was to document in situ oxidation of TCE during steam injection.
Steam-air coinjection was used for the steam injection demonstrataion at Launch Complex 34, Cape Canaveral, Florida to recover TCE from the surficial aquifer. The vendor claimed that hydrous pyrolysis/oxidation (HPO) of TCE would occur during the demonstration. Air was injected into the deep wells at rates ranging from approximately 3,000 – 8,000 lbs/day. Steam was injected at rates generally in the range of 15,000 – 80,000 lbs/day, which lead to subsurface temperatures in the steam zone ranging from about 90 to 150°C (Integrated Water Resources, 2003). Groundwater dissolved oxygen concentrations prior to steam injection were less than 1 mg/l, the redox potential was negative, and cis-1,2-DCE was detected in most groundwater samples with concentrations as high as 260 mg/l. Vinyl chloride was not detected prior to steam injection (detection limits were as high as 83 mg/l). After steam and air co-injection, dissolved oxygen remained low (oxygen is not readily soluble in hot water), redox potential ranged from negative to positive values, cis-1,2-DCE was detected at concentrations as high as 52 mg/l, and vinyl chloride was now detected at concentrations as high as 0.128 mg/l. Chloride concentrations and alkalinity, which would have been expected to increase if significant TCE oxidation had occurred, instead showed decreases (Interagency DNAPL Consortium, 2002). However, the inside-out design of this remediation system caused groundwater from outside the steam treatment area to be continuously pulled towards the treatment area, and this may have masked changes in groundwater concentrations that occurred within the heated zone.
A steam enhanced extraction demonstration using a single injection and extraction well was carried out at Beale Air Force Base (Carroll et al., 2004). The purpose of the demonstration was to produce conditions in the subsurface for HPO of TCE to be optimized,

22
thereby minimizing the need to extract volatilized contaminants. Oxygen was co-injected with the steam into a single well for 48 hours, then the well was shut in to allow reaction to occur before dual phase extraction was initiated and a volume of water in excess of the amount injected as steam was extracted. Measured temperatures reached as high as 113°C. Prior to the demonstration the groundwater was essentially anoxic and dechlorination of the TCE was occurring; however, during the demonstration dissolved oxygen levels increased to 4 – 5.5 mg/l within the heated zone. Thus it appears that some groundwater samples during steam and air injection were supersaturated with oxygen. Trends in dissolved oxygen, alkalinity and ion concentrations suggest that HPO occurred; however, the authors acknowledge that, “Distinguishing between the relative importance of HPO, Steam Enhanced Extraction (SEE) and other potential mechanisms for destruction or removal of chlorinated VOCs has proved to be problematic with the available data.”
Thus, during steam injection remediation, volatile contaminants are found dissolved in the aqueous phase, as a separate phase (NAPL), and in the gas phase. Contaminants are exposed to soil at elevated temperatures, oxygen, and steam during their migration toward vacuum extraction wells. Steam injection systems are normally designed to allow for a couple weeks to a month for the steam zone to reach the extraction wells. Establishing steam zones throughout the area to be heated, allowing heat conduction into low permeability zones that do not readily take steam, and pressure cycling to aid in contaminant recovery usually requires several months of time for a full scale steam remediation. Residence times for vapors in the subsurface will depend on the air and steam injection rates and the vacuum pressure at the recovery wells, but can be expected to be relatively short, on the order of a day. However, dissolved and adsorbed phase contaminants may be exposed to high temperatures for considerably longer time periods, on the order of months.
The residence time of gas-phase contaminants in the heated subsurface is difficult to anticipate since each steam drive application is tailored to specific subsurface conditions. The residence time at the Visalia Superfund site was determined by measuring the time to recover xenon and helium gas tracers. The initial displacement stage residence time was 10 hours between an injection and extraction well that were 24 meters apart based on the xenon tracer (Newmark et al., 1998). For most steam flushing applications, the residence time of gas-phase contaminants flowing through heated soil during transport to vapor recovery wells is expected to be less than one day.
2.4.2 Thermal Conductive HeatingSteel wells containing resistive heating elements can be used to heat subsurface regions contaminated with TCE via thermal conduction heating (TCH) with recovery of the volatilized TCE accomplished by applying vacuum extraction through the heated steel well screens. Heating elements within the heater wells typically operate at temperatures between 650 and 800°C, and the heat is conducted radially into the soil. Vapors that are generated move countercurrent to the direction of the heat as they are extracted at the heater wells. When volatile organic compunds (VOCs) are to be remediated using thermal conductive heating, the target treatment temperature for the midpoint between wells is generally 100°C. Steep temperature gradients are formed, drying out the soil nearest the heater wells. If there is a water table present and the soil has sufficient permeability, much of the area between heater wells will remain saturated and thus at temperatures below 100°C. For treatment zones above the water table, greater drying of the soil will occur, and the high temperature zones will extend further from the heater wells. Heater well spacings on the order of 12 to 18 feet are commonly used when treating VOCs, with treatment times on the order of 4 to 6 months.
In one of the earliest applications of TCH for the remediation of VOCs, Vinegar et al. (1999) reported using heater well temperatures between 745 and 900°C to remediate a site located in Portland, Indiana, that was contaminated with TCE and PCE. The heater wells were located every 7.5 feet resulting in one heater well every 50 square feet with the soil temperatures between heater wells ranging from 100 up to 250°C after heating for 5 months. Stegemeier and Vinegar (2001) speculate that the high temperature soil region (500 to 700°C) extends approximately 1 foot radially from each heater well. The residence time of TCE within this 1-foot region is controlled by the rate of gas extraction. The treatment zone area was 7,500 square feet to a depth of 18 feet, which represents a treatment volume of approximately 40,500 cubic feet, assuming a gas filled porosity of 0.3. A single 1,800 cfm blower was used to extract gas from 130 heater/vacuum wells. Using the reported blower capacity and the estimated treatment volume yields an estimate for the overall gas residence time of 22.5 minutes (40,500 ft3 ÷ 1,800 ft3/min = 22.5 min). A first-cut estimate of the gas residence time within the 1-foot high-temperature zone that is adjacent to each heater well is 0.5 minutes according to:
π 12 ft2 18 ft 130 wells 0.3 ft3 void min = 0.5 min
ft3 soil 4,669 ft3
(2.8)

23
which represents the circular area around the well, the length of well screen, the number of wells, and the porosity of soil divided by flow rate. Here, the gas flow rate was corrected to 500°C using the ideal gas law according to:
1,800 ft3 773 K= 4,669 ft3/min at 500°C
min 298 K
(2.9)A second application of thermal conductive heating used a 3,000 cfm blower to extract gas from 761 heater/vacuum wells at a TCE-contaminated site in Eugene, OR (Stegemeier and Vinegar, 2001). The estimated residence time in the 1-foot high temperature zone for this case was 1.1 minutes, calculated following the approach described above. These residence time estimates assume that gas is uniformly removed from each well and that no preferential flow channels exist. In reality, the gas flow through each 1-foot high temperature zone could range from seconds to days depending on the soil gas permeability and pressure distribution within the vacuum manifold system.
In conductive heating remedial systems, gas from uncontaminated subsurface regions flows into the contaminated treatment zone that have been heated to temperatures between 100 to 250°C, and becomes saturated with the volatile contaminants (e.g., TCE). Vapors entering the heated treatment zone are not likely to be atmospheric air with 21% oxygen as vapor barriers are commonly used if the treatment area is close to the ground surface. Thus, the vapors more likely come from other subsurface regions that have lower oxygen content due to microbiologic consumption. The contaminant-saturated gas then travels through a high temperature region located adjacent to each heater/vacuum extraction well. Baker and Kuhlman (2002) suggest that TCE degradation occurs as vapors migrate through the soil region adjacent to the heater/vacuum well, which may reach temperatures of 500 to 700°C. This high temperature zone is claimed to function as a “packed-bed reactor that is hot enough to accomplish rapid decomposition by either pyrolysis, if oxygen is deficient, or by oxidation, if oxygen is available” (Baker and Kuhlman, 2002).
According to data from Kim and Choo (1983) on pyrolysis of TCE via a dehydrochlorination reaction pathway which forms dichloroacetylene (presented by Baker and Kuhlman, 2002), the destruction of 99% of the TCE entering the 500 to 700°C region would require a residence time of approximately 7 days at 500°C and 7 seconds at 700°C. The thought is that TCE enters into the high temperature zone at 500°C and is transformed into intermediate products. The intermediate products formed from TCE degradation at 500°C then
undergo further transformations as they encounter temperatures near 700°C closer to the heater/vacuum wells. As discussed in Section 2.3.5, dichloroacetylene is thought to lead to the formation of higher molecular weight compounds. To date, there is no data available to determine the amount of TCE destruction or the reaction byproducts that may be expected from conductive heating remediation of TCE.
Based on the examples discussed above, thermal conductive heating may result in gas phase TCE being exposed to temperatures ranging from 100 to 250°C for a period of time greater than a month, and to temperatures ranging from 500 to 700°C for a period from days to seconds. Vapors in the treatment area are likely to be low in oxygen content. Water vapor may or may not be present depending on whether the target treatment area is above or below the water table. To date, well-controlled experiments have not been conducted to confirm or refute TCE reactivity and byproduct formation under these conditions.
2.4.3 Electrical Resistive HeatingElectrical resistance heating (ERH) passes an electrical current through the subsurface zone targeted for treatment. The current is actually conducted by water within the pores of the soil, and the resistance of soils to carrying current results in resistive heating (Beyke and Fleming, 2005). The electrical current is delivered through steel rods (electrodes) installed into the contaminated soil. If the system is above the water table or in low permeability soils, water is injected into the annular space between the soil and electrodes during heating to prevent the soil adjacent to the electrodes from drying out. The temperature of the subsurface increases relatively slowly, and reaches 100 to 120°C, the boiling point of water at the local pressure, generally after about two to three months of heating time. Because water is needed in the pore spaces to carry current between electrodes, the temperature cannot go higher than the boiling point of water at the local pressure, and the soil cannot be allowed to dry out. Volatile organic compounds and water within the heated soil are subsequently recovered by vacuum extraction through the electrodes or through extraction wells located within the heated soil region. For example, a TCE-contaminated aquifer was heated to a temperature of 100°C for 6 months using ERH (Beyke and Fleming, 2005), and approximately 30,000 pounds of TCE was recovered through vapor extraction wells located within the heated aquifer formation. Heron et al. (1998) demonstrated electrical resistive heating in a controlled laboratory-scale box filled with TCE-contaminated water. An average temperature of 90°C was maintained within the box for a period of 25 days, and a single centrally-located extraction well was used to recover gas-phase TCE.
24
Between 2003 and 2007, three areas containing spent chlorinated solvent NAPL at the Fort Lewis Army Logistics Center’s East Gate Disposal Yard (EGDY) near Tacoma, Washington, were remediated using ERH. The main objective of the remediation was to recover TCE DNAPL, which was the source for a plume more than a mile long downgradient of the site. Pre-remediation site characterization activities showed that there were considerable petroleum hydrocarbons present as well as cis-1,2-DCE from the reductive dechlorination of TCE. During the remediation of the third NAPL area, groundwater and vapor samples were collected and analyzed to determine if dechlorination (either biotic or abiotic) continued as the temperature of the site was increased. Vapor and dissolved phase consitutents that were analyzed for included methane, ethane, ethene, and acetylene, as well as cis- and trans-1,2-DCE, and vinyl chloride. Although cis-1,2-DCE concentrations were high in some areas of EGDY prior to the remediation, very little vinyl chloride was found. Baseline samples for gases analyzed prior to the initiation of heating showed significant methane concentrations, but ethane, ethene, and acetylene were below detection limits. Within a week after the initiation of heating, at which time two small areas of the site had reached temperatures as high as 70°C while most of the site was between 10 and 15°C, the ethene concentration in the effluent vapors was 30 percent of the TCE concentration. During the second week of operations, ethane concentrations also reached approximately 30 percent of the TCE concentration. However, as heating of the site continued, the concentrations of ethane and ethene both dropped significantly in the effluent vapors. Acetylene also appeared in the effluent stream soon after heating began, but its concentration remained low. Methane concentrations ranged from 100 percent to 2 percent of the TCE concentrations, with an average of about 20 percent. Once the average temperatures of the site reached approximately 90°C, ethane, ethene, and acetylene concentrations again fell to below detection limits, while methane concentrations remained as significant portion of the effluent vapors (Davis, 2007).
In summary, electrical resistive heating will result in the exposure of liquid contaminants to slowly increasing temperatures, which eventually can reach up to 120°C. Once a volatile contaminant is vaporized, it likely will not remain in the heated subsurface for a period of time greater than one day. There will always be water vapor present in the effluent stream, however, the vapors are likely to be low in oxygen content. Ambient air will not likely enter the heated subsurface region; if the treatment zone is near the ground surface a vapor barrier is commonly used to prevent atmospheric air from being pulled into the system. The residence time of gas
phase contaminants that pass through heated soil during transport to vapor recovery wells is expected to be less than one day.
2.4.4 Hybrid Thermal TechnologiesSteam flushing and electrical resistive heating may be implemented simultaneously. For example, the thermal treatment design for the Young-Rainey Science, Technology, and Research Center located in Largo, Florida, involved a combination of electrical resistance heating to initially heat surrounding and underlying soils, followed by steam drive to flush contaminants from soils within the preheated region to extraction wells (U.S. DOE, 2003). In practice, this would mean potentially exposing TCE to temperatures approaching 120°C for more than a day before driving the TCE from high permeability soils via steam flushing.

25
3.0TCE Degradation in Flow-Through Quartz
Tube Reactors3.1 IntroductionA series of controlled experiments were conducted to investigate TCE reactivity and degradation product formation when passing gas-phase TCE through a quartz tube reactor that was heated to temperatures ranging from 60 and 480°C. The experiments were intended to approximate conditions that could occur during the extraction of gas-phase TCE either from or through a heated subsurface region, and to explore the potential effects of oxygen content, water content and solids (Ottawa sand) on TCE reactivity under these conditions. However, these experiments were not intended to precisely replicate all of the conditions and variables that could be encountered in the field. The first experimental series was performed to determine the minimum temperature at which TCE degradation products could be detected when the quartz tube reactor was partially filled with Ottawa sand. The second set of experiments was performed with the reactor tube empty at temperatures up to 480°C in order to obtain experimental data that could be directly compared to results reported by Yasuhara and Morita (1990) for a similar empty reactor system. The third experimental series focused on determining TCE degradation products from quartz tube reactors that were either partially- or completely-filled with Ottawa sand, and operated at 420°C. The fourth experimental series was designed to investigate
the effect of water, introduced as vapor into the TCE saturated carrier gas, on the degradation products formed within an empty quartz tube reactor operated at 420°C. Results obtained from the first four experiments were used to refine methods and design the fifth experimental series, which was conducted to determine the amounts of TCE degradation products formed as a function of three experimental variables; 1) quartz tube temperature, 2) oxygen content, and 3) water vapor content. A summary of the quartz tube reactor experiments is presented in Table 3.1.
A description of the quartz tube reactor apparatus and the methods used to collect and measure chemical compounds found in the gas-phase effluent exiting the quartz tube are presented in Section 3.2. Experimental methods specific to each of the five experimental series are given in Section 3.2.3. Results of all five experimental series are presented in Section 3.3. Detailed experimental procedures related to quartz tube preparation, temperature profile, TCE introduction, and effluent trapping are provided in Appendix A. The final two sections of the chapter provide a discussion (Section 3.4) of the quartz tube results in terms of potential chemical reaction mechanisms and a summary (Section 3.5) of quartz tube experimental results and conclusions.
Table 3.1 Summary of Flow Through Quartz Tube Experiments
Experimental Series Quartz Tube Contents Temperature Range
(°C) Purpose
1 100 grams sand 24 to 420 Identify degradation products
2 Empty 22 to 480 Compare with literature results
3 100 grams sand and completely sand filled 420 Partially vs. completely sand filled quartz
tube
4 Empty 420 Evaluate effect of water
5 Empty 120 to 420 Degradation products as a function of oxygen and water vapor content

26
3.2 Experimental Materials and Methods
3.2.1 MaterialsOttawa sand (ASTM 20-30 mesh) was obtained from U.S. Silica Co. (Berkeley Springs, WV). Prior to use, 2,000 grams of sand was placed into a 3 L capacity Pyrex glass drying tray and a 1 N solution of nitric acid was added to completely cover the sand. The sand was then allowed to soak in the nitric acid solution for 30 minutes before draining the excess liquid. The 1 N nitric acid soaking process was repeated, and then the sand was rinsed in DI water. The wet sand was placed into a drying oven and heated to 130°C for 3 hours to remove excess moisture, and then heated to 200°C for and additional 2 hours to complete the drying process.
A 2 L bottle of 99.5% American Chemical Society (ACS) reagent-grade TCE was obtained from Sigma-Aldrich, Inc. (Milwaukee, WI). The TCE was not stabilized with an anti-oxidant. TCE from the 2 L bottle was used in all experiments described herein, and for the preparation of calibration solutions. A dedicated 40 mL vial with Teflon lined septum affixed with a screw cap was periodically filled with TCE from the 2 L bottle. TCE used in each experiment was dispensed directly from the 40 mL vial. The 40 mL vial and 2 L bottle of TCE were stored in the flammable storage locker at room temperature.
3.2.2 Quartz Tube ApparatusThe quartz tube experimental system consisted of a quartz-glass tube, a quartz-glass pre-mix chamber, and a quartz-glass effluent transition (Figure 3.1). The quartz tube was General Electric Type 124 fused quartz (Technical Glass Products, Mentor, OH), with an outer diameter (OD) of 38 mm, wall thickness of 2 mm, and a length of 53 cm. Two quartz tubes were used in the experiments: the first was customized (Lillie Glassware, Marietta, GA) by installing a slotted quartz-glass shelf located at the midpoint of the quartz tube (quartz tube #1) to hold sand, and the second section of quartz tube was completely open (quartz tube #2). The pre-mix chamber was manufactured by Lillie Glassware (Marietta, GA) to provide an approximate 70 mL chamber in which influent gas and TCE could mix before entering the quartz tube. The effluent connection was custom made by Lillie Glassware (Marietta, GA) from quartz glass to transition the gas flow from the 38 mm OD tube down to an 8 mm OD tube. The pre-mix chamber and effluent transition were connected to the quartz tube using custom made 38 mm ID, 316 grade stainless steel (316-SS) adapters (Swagelok Co., Salon, OH) fitted with Viton® o-rings.
Figure 3.1 Quartz tube experimental apparatus.
The flow rate of the TCE-free carrier gas at 22°C entering into the experimental apparatus was determined using a mass flow meter (Model 179A, MKS Instruments, Andover, MA). The mass flow meter was calibrated using an ADM 2000 gas flow meter (J&W Scientific, Folsom, CA) that had been calibrated by California Integrated Coordinators (Placerville, CA). The pressure within the reaction system was determined using a pressure transducer (Honeywell, Freeport, IL), which was calibrated using water- (0.02 to 0.05 bar) and mercury- (0.07 to 0.7 bar) filled manometers. Both the mass flow meter and pressure transducer were connected to a data logger (CR23X, Campbell Scientific, Logan UT) to automatically record the gas flow rate and pressure within the quartz tube system at one second intervals during each isothermal experiment.
The effluent end of the quartz tube was connected to a 40 mL screw-thread vial via a 10 cm long section of 1/16 inch OD poly ether-ether ketone (PEEK) tubing. The PEEK tubing was affixed to the 38 to 8 mm effluent transition by a 316-SS Swagelok (Solon, OH) union with Teflon ferules and was inserted through a pre-drilled hole in a Teflon lined septum affixed to the 40 mL vial with an open-hole screw cap. The 40 mL vial contained approximately 30 mL of dichloromethane (DCM) and

27
was located in a 500 mL beaker filled with crushed ice. The purpose of the DCM filled 40 mL vial was to trap all compounds with greater than two carbons (e.g., PCE) exiting the quartz tube. After passing the TCE saturated carrier gas through the heated quartz tube, the DCM trap was removed, sealed with a Teflon lined septum without holes, and weighed using an analytical balance (Model# AG245, Mettler-Toledo, Columbus, OH). The weight of the DCM filled trap was used to estimate the volume of DCM in the 40 mL vial assuming a DCM density of 1.325 g/mL.
Post-experiment sand samples (5 grams each) were collected and placed into separate 25 mL test tubes along with 2 mL of DI water. Each test tube was sealed with a Teflon lined septum affixed with an aluminum crimp and then placed in a freezer. The frozen sand samples were then processed using a hot solvent extraction method that involved incubating the 5 gram soil samples in a 1:1 (volume) iso-octane and methanol mixture at 85°C for 24 hours. Previous studies performed at Georgia Tech have shown that the hot solvent extraction procedure, which is based on the methods of Sawhney et al. (1988) and Huang and Pignatello (1990), is equivalent to Soxhlet extraction for chlorinated benzenes (Prytula, 1998).
3.2.3 Experimental Procedures3.2.3.1 Experimental Series 1Nine (9) experiments were completed with one quartz-tube apparatus assembly for tube oven temperatures of 24, 40, 60, 120, 180, 240, 300, 360, and 420°C at 1 atm of carrier gas pressure during the first experimental series. These experiments were conducted to determine if TCE could be degraded within the quartz tube, and if the quartz tube could withstand operating in the temperature range from ambient to 600°C. The first experimental series involved passing dry air (Airgas-South, Inc., Marietta, GA) through a gas-washing bottle (250 mL Pyrex) filled with TCE-NAPL at 22°C. The TCE saturated air flowed through the quartz tube that contained 100 grams of acid washed 20-30 mesh Ottawa sand positioned on quartz-glass wool (Technical Glass Products, Mentor, OH) and held at the midpoint of the quartz tube by a slotted quartz-glass shelf (quartz tube #1). The TCE-saturated air was passed through the reactor system for a period of approximately 16 minutes, which represented 3 pore volumes (320 mL total quartz tube pore volume assuming sand porosity of 0.3), and resulted in approximately 450 mg of TCE being transferred into the quartz tube. The mass of TCE delivered to the tube was determined gravimetrically by measuring the weight (PG503-S, Mettler-Toledo, Inc., Columbus, OH) of the TCE-filled gas washing bottle before and after each 16 minute run period. The airflow rate was approximately 60 mL/min, which resulted in
a residence time of approximately 5 minutes at 25°C. The effluent from the heated quartz tube passed through a vial containing dichloromethane (DCM) to trap all condensable products; no gas samples were collected. At the end of 16 minutes, the airflow was stopped and the gas pressure within the quartz tube apparatus was monitored for a period of 5 minutes to test for gas leaks. No additional volume of air was passed through the quartz tube after each 16 minute TCE introduction period meaning that at least 1 pore volume of TCE saturated air remained in the tube at the end of each 16 minute trial. The temperature of the quartz tube was increased, allowed to stabilize for 30 minutes, and the 16 minute TCE introduction period was repeated. The apparatus was not disassembled between each isothermal run.
3.2.3.2 Experimental Series 2The second experimental series involved passing dry air that was saturated with TCE through the quartz tube used in the first experimental series (quartz tube #1), but without sand present (empty). The empty reactor experiments were performed to replicate results reported by Yasuhara and Morita (1990), who passed TCE-saturated air through an empty quartz tube over a temperature range of 300 to 800°C. Nine (9) experiments were completed (including 2 replicates at 120 and 240°C) at temperatures of 24, 120, 240, 300, 360, 420, and 480°C at 1 atm of carrier gas pressure. The quartz tube apparatus was disassembled and decontaminated between each isothermal trial completed above 300°C due to the presence of degradation products observed during the first experimental series. The airflow rate was approximately 60 mL/min, which resulted in a residence time of approximately 5 minutes at 25°C. The TCE-saturated air flowed through the empty tube reactor for a period of 20 minutes, which represented 3 pore volumes (400 mL total quartz tube pore volume) and resulted in approximately 700 mg of TCE being transferred into the quartz tube. Although these experiments were intended to include temperatures up to 600°C, experiments were only completed up to 480°C because the quartz tube shattered into many small pieces while heating to 540°C. The destruction of the quartz tube at 540°C was unexpected as these tubes were rated to 1,200°C (Technical Glass Products, Mentor, OH). Repeated attempts to operate the reactor at temperatures above 500°C resulted in destruction of the quartz tubes.
3.2.3.3 Experimental Series 3The third experimental series involved passing dry air saturated with TCE through a quartz tube that was partially or completely filled with Ottawa sand. The purpose of this experiment was to determine if filling the empty volume of the tube with sand had any effect

28
on the amount of TCE degraded and the degradation products formed. These experiments were completed at a single temperature of 420°C, since operation of the reactor at this temperature in the second experimental series was found to degrade a significant amount of TCE and produce detectable amounts of degradation products. The partially sand-filled quartz tube experiment was completed with 100 g of acid treated 20-30 mesh Ottawa sand located on a quartz shelf (quartz tube #1), and was operated under the same flow conditions (16 minute TCE introduction period) as in the first experimental series.
The completely sand-filled experiment was conducted with 700 grams of acid treated 20-30 mesh Ottawa sand located in the quartz without the glass shelf (quartz tube #2). TCE-saturated air was passed through the completely filled quartz tube operated at a temperature of 420°C and 1 atm carrier gas pressure for a period of approximately 16 minutes. This time represents 5.4 tube pore volumes (177 mL pore volume assuming a porosity of 0.3) and resulted in 551 mg of TCE being introduced into the tube. The airflow rate was approximately 60 mL/min, which resulted in a residence time of approximately 3 minutes at 25°C. At the end of each 16 minute run, airflow was stopped and the system pressure was monitored for a period of 3 minutes to test for gas leaks. Hence, at least 1 pore volume of TCE saturated air remained in the apparatus. A second trapping sequence was then completed by passing dry air without TCE through the apparatus for a period of 20 minutes to flush any residual gas-phase TCE from the tube. After effluent trapping was completed, the tube was capped and allowed to cool to room temperature overnight. The apparatus was disassembled the following day and 5 gram sand samples were collected from near the entrance, at the mid-point, and exit of the sand-filled quartz tube. A sample of the glass wool located at the exit of the quartz tube was also collected. The sand and glass wool samples were processed using a hot solvent extraction method described above (Section 3.2.2).
3.2.3.4 Experimental Series 4The fourth experimental series involved passing humidified air and gas-phase TCE through an empty quartz tube operated at 420°C. The experiments were
completed using three different carrier gas humidity levels; 0, 25, and 100% relative humidity (RH). The 25% RH experiment used a 1:3 ratio of air that had passed through a water-filled gas washing bottle at 22°C and air saturated with TCE at 22°C. The 100% RH experiment involved passing air through a gas washing bottle that contained an approximate 1:1 (volume) mixture of TCE-NAPL and water at 22°C. A 1.6 L Tedlar® bag was used to capture all of the gas leaving the DCM trap. The gas within the Tedlar® bag was analyzed for CO2 content using a gas chromatograph (GC) equipped with a thermal conductivity detector (TCD).
3.2.3.5 Experimental Series 5The fifth experimental series was designed based on the results of the initial four experimental series with the goal of accounting for all TCE degradation products in an effort to close the mass balance. The experiments were planned so that the amount of each TCE degradation product could be determined as a function of three experimental variables; 1) quartz tube temperature, 2) oxygen content, and 3) water vapor content (Table 3.2). The quartz tube temperatures were fixed at 120, 240, and 420°C to reduce the number of individual experiments in the series.
For the fifth experimental series, TCE was introduced into the pre-mix chamber as neat liquid TCE at a fixed rate of 0.68 mL/hr using a syringe pump (Model 11, Harvard Apparatus, Holliston, MA). This allowed the rate of TCE introduction to be fixed while adjusting the amount of water entering the quartz tube to vary the chlorine to hydrogen ratio inside the apparatus. Ultra zero grade air (Airgas-South, Inc., Marietta, GA) or nitrogen (Airgas-South, Inc., Marietta, GA) was used as the carrier gases. Ultra zero grade air (UZA) was used as received, while the nitrogen was passed through an oxygen trap (Alltech Associates, Inc., Deerfield, IL) before entering the quartz tube.
The residence time through the quartz tube was fixed at approximately 4.3 minutes for all isothermal trials during the fifth experimental series. This represented a gas flow rate of approximately 85 mL/min (at 22°C) with the empty quartz tube at 120°C, which was the upper measurement limit of the mass flow meter and thus
Table 3.2 Fifth Experimental Series Matrix
Tube (°C) Inlet (°C) Reactor Contents Carrier Gas Runs Variable
120, 240, 420 20, 80, 100 Empty N2 3x3x1x1 = 9 baseline
120, 240, 420 20, 80, 100 Empty Zero air 3x3x1x1 = 9 oxygen
Sum 9x2 = 18

29
fixed the residence time for all subsequent experiments completed at temperatures greater than 120°C. The gas flow rates to achieve a 4.3 minute residence time were calculated using the ideal gas law to correct for the gas expansion within the quartz tube at elevated temperatures. The gas flow rate used with the empty quartz tube at 240°C was approximately 65 mL/min (at 22°C), and approximately 48 mL/min (at 22°C) with the quartz tube at 420°C.
3.2.4 Analytical MethodsThe concentration of TCE in the DCM trap fluid was determined by collecting three, 2 mL DCM samples, which were placed in separate autosampler vials. An internal standard, 1,1,1-trichloroethane, was added to each vial, which was then capped with Teflon®-lined septa affixed by a crimp seal. The analysis of DCM fluids consisted of using an automatic liquid sampler (HP6890) to inject 1 uL of DCM into a GC (Hewlett Packard 6890) equipped with a 30 m by 0.32 mm OD DB-5 column (Agilent Technologies, Palo Alto, CA) that was connected to a Flame Ionization Detector (FID). The GC inlet was operated at 9.45 psi in the split mode (10:1) at 200°C with helium as the carrier gas and a constant column flow rate of 2 mL/min. The GC oven temperature was isothermal at 50°C for 8 minutes followed by a 20°C/min ramp to 150°C. The FID was operated at 300°C with 400 mL/min of air, 30 mL/min hydrogen, and 40 mL/min of nitrogen as the makeup gas.
TCE calibration standards in the concentration range from 8,000 to 20,000 mg/L were analyzed by GC/FID to determine the amount of TCE in the DCM trap fluid. The calibration standards were prepared by first adding approximately 30 mL of DCM to 50 mL glass volumetric flasks (50±0.05mL at 20°C), which were sealed with ground-glass stoppers. The initial weight of the flasks and DCM was determined using an analytical balance (Model# AG245, Mettler-Toledo, Columbus, OH) after allowing the flasks to stand for a period of 30 minutes. Neat TCE was then introduced into each flask using a gas tight syringe, the stopper inserted into each flask, and then the weight of each 50 mL flask with TCE was recorded. Each flask was filled to the indicator mark with DCM, sealed and inverted several times to mix the solution. The concentration of each calibration solution was calculated using the weight of TCE added and the volume of DCM. GC/FID analysis of an EPA 8240B/8260A Matrix Spike Mix (Sigma-Aldrich #47412) spiked into DCM was performed to verify TCE retention time and concentration.
The identity of compounds associated with unidentified chromatographic peaks from the GC/FID analysis of DCM trap fluids was determined using a GC (Varian
Star 3600CX) equipped with a 30 m by 0.25 mm OD CP-Sil 8 CB Low Bleed/MS capillary column (Varian) connected to a Varian Saturn 2000 Ion Trap Mass Spectrometer (MS). Compounds were identified using software (SaturnView ver. 5.41, Varian, Inc., Palo Alto, CA) that matched their mass spectra with reference mass spectra in the NIST/EPA/NIH Mass Spectral Library (NIST98). Compounds were identified when their mass spectrum fit with a matching NIST98 library spectrum with purity of greater than 700. The mass spectrometer was tuned to optimize the detector voltage (EM-Voltage) and mass axis calibrated using perflurorotributylamine (FC-43) prior to each use.
3.3 Experimental Results3.3.1 Results of Experimental Series 1-4The amount of TCE recovered in the DCM trap fluid of the first experimental series is shown in Figure 3.2 as function of temperature. At temperatures less than 240°C, the amount of TCE recovered in the DCM trap fluid was less than the amount delivered to the quartz tube. The missing mass of TCE was attributed, in part, to the residual gas-phase TCE that remained within the quartz tube as no attempt was made to flush TCE from the apparatus after the 16 minute introduction period. At temperatures of 300°C and above, PCE and carbon tetrachloride (CCl4) were detected in the DCM trap fluid, and the amounts of PCE and CCl4 detected continued to increase as the tube temperature was raised to 420°C. The experimental series was terminated prior to reaching 600°C due to repeated failure of the quartz tube at temperatures of 480°C and above. These data indicate that TCE underwent thermally induced degradation when flowing through a quartz tube containing 100 g of Ottawa sand and heated to temperatures greater than 300°C. PCE and CCl4 were the degradation products detected in the DCM trap and represent chlorinated oxidation products that were expected during TCE degradation because the Cl:H ratio was equal to 3 and TCE was the only source of chlorine and hydrogen (Mulholland et al., 1992, see also Section 2.3.6)
Results of the second experimental series, in which gas-phase TCE was passed through an empty quartz tube reactor at temperatures up to 480°C, are shown in Figure 3.3. The lower mass recoveries at 22 and 120°C occurred prior to implementation of flushing step to capture residual gas phase mass in the reactor. Dry air without TCE was passed through the quartz tube for 15 minutes following the 20 minute TCE introduction period in all experiments completed above 240°C. Consequently, the amount of TCE collected in the DCM trap for the 240°C yielded a mass recovery of ~98%, indicating that TCE was not degraded at temperatures less than 240°C for these experimental conditions.

30
Starting at temperatures of 300 to 360°C, TCE, PCE and carbon tetrachloride (CCl4) were detected in the effluent DCM trap. The extent of TCE degradation increased as the temperature was raised to 480°C, with no measurable amounts of TCE observed at 480°C. These findings are consistent with data presented by Yasuhara and Morita (1990), which followed similar trends; a sharp decline in TCE coincident with the appearance of PCE and CCl4 between 300 and 500°C, and no detectable amounts of TCE at temperatures of 500°C and above.
Results of the second experimental series indicate that TCE degradation products in addition to PCE and CCl4 are likely to have formed at 420°C as the amount of TCE, PCE, and CCl4 detected in the DCM trap accounted for less than 35% of the amount of TCE introduced into the quartz tube reactor. The missing degradation products are hypothesized to be CO and CO2 based on the experimental work described in Section 2.3.5 (Chang and Senkan, 1989). Experimental procedures were modified in experimental series five to collect and measure CO and CO2.
The results of the third experimental series, in which TCE was introduced into quartz tube reactors that were either partially- or completely-filled with Ottawa sand at 420°C, are summarized in Table 3.3. The completely sand-filled tube produced more PCE and had lower TCE recovery than the tube containing 100 grams of sand (Table 3.3). No CCl4 was detected in the DCM trap during the third experimental series as compared to the significant amount detected during the initial experimental series. However, the first and third experimental series results are not directly comparable since a decontamination step was not completed between each isothermal experiment during the first experimental series. PCE was the only compound detected in the iso-
octane extracts and only from the sand sample collected at the tube exit. An initial sand-filled experiment was completed for tube temperatures of 120 and 240°C, however, the sand-filled quartz tube shattered at 400°C while heating to 420°C. Based on this experience and the quartz tube failures during preliminary experiments, it was concluded that sand-filled quartz tubes are not capable of consistently withstanding temperatures greater than 400°C.
In the fourth experimental series, gas containing both water and TCE passed through empty quartz tube reactors at 420°C. Results from these experiments indicate that increasing the quartz tube water-vapor content led to an increase in the amount of CO2 and CCl4 detected (Table 3.4). However, the amount of CO2 represented less than 5% of the total amount of carbon introduced into the quartz tube as TCE. Thus, we hypothesize that additional degradation products formed during the fourth experimental series. This observation led to the development of a method to detect carbon monoxide (CO) and CO2 along with the use of an additional liquid filled trap to determine the amount of phosgene (COCl2) formed.
The ratio of chlorine to hydrogen in the fourth experimental series was greater than one. Based on the prior experimental results described in Section 2.3.6 (Mulholland et al., 1992; Werner and Cool, 2000), a Cl:H of less than 1.0 provides an insufficient amount of hydrogen to reduce the amount of chlorinated degradation products. This line of reasoning provides justification to conduct experiments with chlorine to hydrogen ratios of less than one (i.e., more water vapor) to determine if TCE could be degraded without forming chlorinated degradation products.
Figure 3.2 Amounts of TCE, PCE and carbon tetrachloride (CCl4) recovered during the first experimental series.
Figure 3.3 Amounts of TCE, tetrachloroethylene (PCE) and carbon tetrachloride (CCl4) recovered during the second experimental series.

31
3.3.2 Results of Experimental Series 5Empty quartz-tube experiments were completed for tube temperatures of 120, 240, and 420°C at carrier gas pressures of 1 atm. Separate experiments were completed with the inlet at 22, 60, and 100°C for each tube temperature to evaluate the effect of increasing the quartz-tube water content on TCE degradation and the degradation products formed. Separate experiments were completed with nitrogen and air (UZA) as the carrier
gas to evaluate the effect of oxygen on TCE degradation (Table 3.5). The following sections describe the recovery of TCE after being introduced into the empty heated quartz-tube, along with the identity and quantity of TCE degradation products detected in the DCM trap, water rinse, iso-octane rinse, and Tedlar® bag. The latter sample devices were installed in an attempt to collect and identify a wider range of potential degradation products and to improve mass balance closure.
Table 3.3 Amounts of TCE, PCE, and CCl4 from the Sand Filled Quartz Tube at 420°C
Amount of Sand Amount TCE Introduced (mg)
Amount TCE Recovered (mg)
TCE Recovered (%)
Amount PCE (mg)
Amount CCl4 (mg)
100 grams partially filled (Exp. Series 1)
456 273 60 63 28.5
100 grams partially filled (Exp. Series 3)
503 226 45 156 None*
700 grams completely filled
(Exp. Series 3)551 172 31 250 None†
* Other degredation products detected included hexachloroethane, penta- and hexachloro-propene, and penta- and hexachloro-butadiene.
† Other degredation products detected included penta- and hexachloroethane.
Table 3.4 Amount of TCE, PCE, CCl4, and CO2 from an Empty Quartz Tube at 420°C
% RH TCE Introduced (mmol)
TCE Recovered (mmol) PCE (mmol) CCl4 (mmol) CO2 (mmol)
0 9.51 4.23 0.29 0.18 0.08
25 5.96 2.64 0.19 0.38 0.11
100 8.69 4.69 0.34 0.39 0.38
Table 3.5 Experiments Completed for the Fifth Experimental Series
Tube (°C) Inlet (°C) Tube Contents Carrier Gas Variable
120, 240, 420 20, 80, 100 Empty N2 baseline
120, 240, 420 20, 80, 100 Empty Zero air oxygen

32
3.3.2.1 TCE RecoveryThe amount of TCE detected in the DCM trap with respect to the amount introduced into the quartz tube as a function of quartz tube temperature and carrier gas is shown in Figure 3.4. The average recovery of TCE with nitrogen as the carrier gas was greater than 94% at all the reactor temperatures and inlet stream relative humidities. With air as the carrier gas, the average recovery of TCE was greater than 94% for tube temperatures of 120 and 240°C but dropped to approximately 53% for the tube at 420°C. The amount of TCE recovered at each tube temperature shown in Figure 3.4 represents the average for the three experiments completed at different quartz-tube water contents (inlet temperatures). Table 3.6 contains the average amount of TCE recovered as a function of quartz-tube water content with nitrogen as the carrier gas. The low TCE recovery observed for the 60°C inlet temperature and 120°C tube temperature was due to a leak in the experimental apparatus, and this value was not used to calculate the average recovery at 120°C shown in Figure 3.4. The amount of TCE recovered as a function of quartz-tube water content with air as the carrier gas is shown in Table 3.7. The average values reported in Tables 3.6 and 3.7 are shown graphically in Figure 3.4.
Figure 3.4 Recovery of TCE with nitrogen or air as the carrier gas, averaged over three relative humidities (inlet temperatures).
Tables 3.6 and 3.7 also contain the Pearson correlation coefficient (R2) that describes the variability in TCE recovery as a function of quartz tube water content along with the P-Value, which indicates the significance of the correlation between the quartz-tube water content and TCE recovery. The statistical calculations were performed using MINITAB software (Release 14, Minitab Inc., State College, PA). A linear relationship between the quartz tube water content and the amount of TCE recovered was not obtained (R2<0.3 and P-Value>0.5) for the 240°C experiment with nitrogen as the carrier gas (Table 3.6). In contrast, the increase
in TCE recovery was linearly related (R2=0.994 and P-Value=0.05) to the increase in water content for the 420°C experiment. With air as the carrier gas, there was no linear relationship (R2<0.2 and P-Value>0.5) between the quartz tube water content and the amount of TCE recovered for the 120°C and 420°C experiments. The decrease in TCE recovery was linearly related (R2=0.998 and P-Value=0.03) to the increase in water content for the 240°C experiment with air as the carrier gas (Table 3.7).
Table 3.6 TCE Recovery with Nitrogen as the Carrier Gas
(%Recovery = TCE in DCM Trap ÷ TCE injected × 100)
Inlet Temperature
(°C) (Relative
Humidity, %)
Quartz Tube Temperature (°C)
120 240 420
22 (2) 91.2±6.0 98.7±1.3 93.1±1.9
60 (20) *68.0±4.6 101.7±2.9 95.5±1.5
100 (95) 96.9±4.5 96.2±1.0 99.1±1.9
Average ± Standard Deviation
94.0±7.6 98.8±3.3 95.9±3.1
Correlation Coefficient
(R2)NA
0.227 (P-Value =0.68)
0.994 (P-Value =0.05)
* Leak in experimental system, average based on 22 and 100°C inlet temperatures.
Table 3.7 TCE Recovery with Air as the Carrier Gas(%Recovery = TCE in DCM Trap ÷ TCE injected × 100)
Inlet Temperature
(°C) (Relative
Humidity, %)
Quartz Tube Temperature (°C)
120 240 420
22 (2) 95.3±1.2 96.2±1.2 52.4±1.2
60 (20) 97.7±2.1 94.1±0.6 54.6±0.2100 (95) 96.3±1.7 92.0±1.5 51.7±0.9
Average ± Standard Deviation
96.4±3.0 94.1±2.0 52.9±1.5
Correlation Coefficient
(R2)
0.144 (P-Value =0.75)
0.998 (P-Value =0.03)
0.052
(P-Value =0.85)
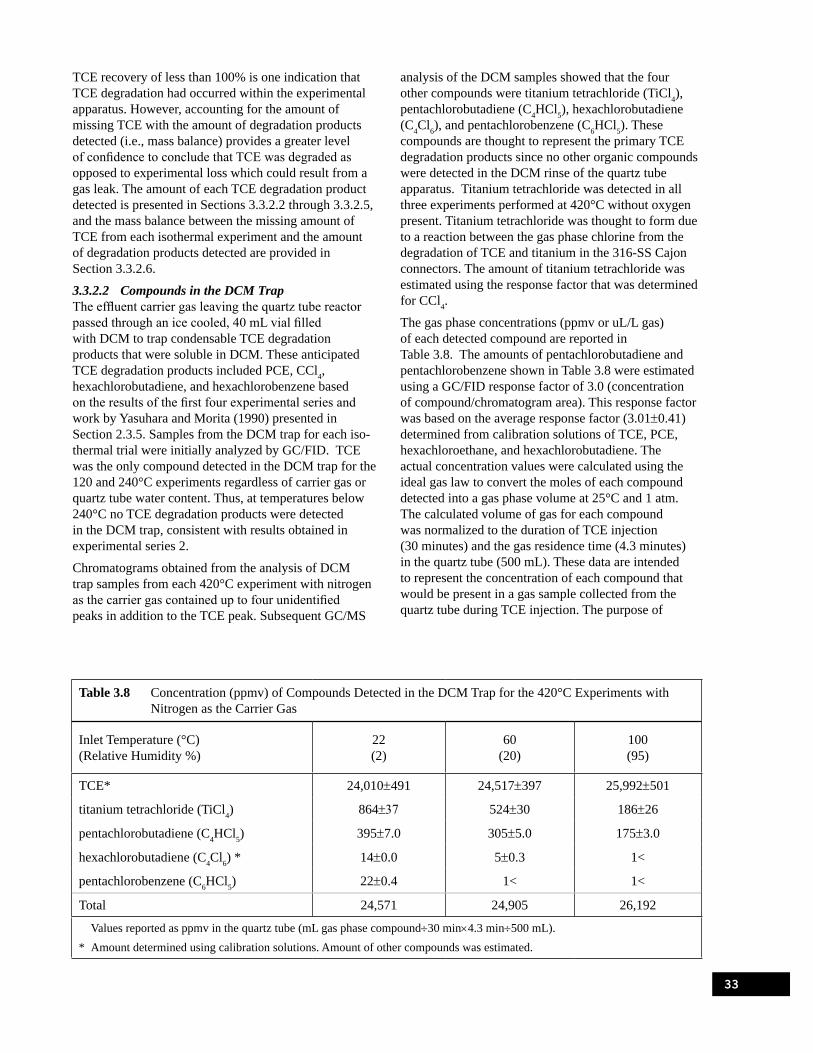
33
TCE recovery of less than 100% is one indication that TCE degradation had occurred within the experimental apparatus. However, accounting for the amount of missing TCE with the amount of degradation products detected (i.e., mass balance) provides a greater level of confidence to conclude that TCE was degraded as opposed to experimental loss which could result from a gas leak. The amount of each TCE degradation product detected is presented in Sections 3.3.2.2 through 3.3.2.5, and the mass balance between the missing amount of TCE from each isothermal experiment and the amount of degradation products detected are provided in Section 3.3.2.6.
3.3.2.2 Compounds in the DCM TrapThe effluent carrier gas leaving the quartz tube reactor passed through an ice cooled, 40 mL vial filled with DCM to trap condensable TCE degradation products that were soluble in DCM. These anticipated TCE degradation products included PCE, CCl4, hexachlorobutadiene, and hexachlorobenzene based on the results of the first four experimental series and work by Yasuhara and Morita (1990) presented in Section 2.3.5. Samples from the DCM trap for each iso-thermal trial were initially analyzed by GC/FID. TCE was the only compound detected in the DCM trap for the 120 and 240°C experiments regardless of carrier gas or quartz tube water content. Thus, at temperatures below 240°C no TCE degradation products were detected in the DCM trap, consistent with results obtained in experimental series 2.
Chromatograms obtained from the analysis of DCM trap samples from each 420°C experiment with nitrogen as the carrier gas contained up to four unidentified peaks in addition to the TCE peak. Subsequent GC/MS
analysis of the DCM samples showed that the four other compounds were titanium tetrachloride (TiCl4), pentachlorobutadiene (C4HCl5), hexachlorobutadiene (C4Cl6), and pentachlorobenzene (C6HCl5). These compounds are thought to represent the primary TCE degradation products since no other organic compounds were detected in the DCM rinse of the quartz tube apparatus. Titanium tetrachloride was detected in all three experiments performed at 420°C without oxygen present. Titanium tetrachloride was thought to form due to a reaction between the gas phase chlorine from the degradation of TCE and titanium in the 316-SS Cajon connectors. The amount of titanium tetrachloride was estimated using the response factor that was determined for CCl4.
The gas phase concentrations (ppmv or uL/L gas) of each detected compound are reported in Table 3.8. The amounts of pentachlorobutadiene and pentachlorobenzene shown in Table 3.8 were estimated using a GC/FID response factor of 3.0 (concentration of compound/chromatogram area). This response factor was based on the average response factor (3.01±0.41) determined from calibration solutions of TCE, PCE, hexachloroethane, and hexachlorobutadiene. The actual concentration values were calculated using the ideal gas law to convert the moles of each compound detected into a gas phase volume at 25°C and 1 atm. The calculated volume of gas for each compound was normalized to the duration of TCE injection (30 minutes) and the gas residence time (4.3 minutes) in the quartz tube (500 mL). These data are intended to represent the concentration of each compound that would be present in a gas sample collected from the quartz tube during TCE injection. The purpose of
Table 3.8 Concentration (ppmv) of Compounds Detected in the DCM Trap for the 420°C Experiments with Nitrogen as the Carrier Gas
Inlet Temperature (°C) (Relative Humidity %)
22 (2)
60 (20)
100 (95)
TCE* 24,010±491 24,517±397 25,992±501
titanium tetrachloride (TiCl4) 864±37 524±30 186±26
pentachlorobutadiene (C4HCl5) 395±7.0 305±5.0 175±3.0
hexachlorobutadiene (C4Cl6) * 14±0.0 5±0.3 1<
pentachlorobenzene (C6HCl5) 22±0.4 1< 1<
Total 24,571 24,905 26,192
Values reported as ppmv in the quartz tube (mL gas phase compound÷30 min×4.3 min÷500 mL).* Amount determined using calibration solutions. Amount of other compounds was estimated.
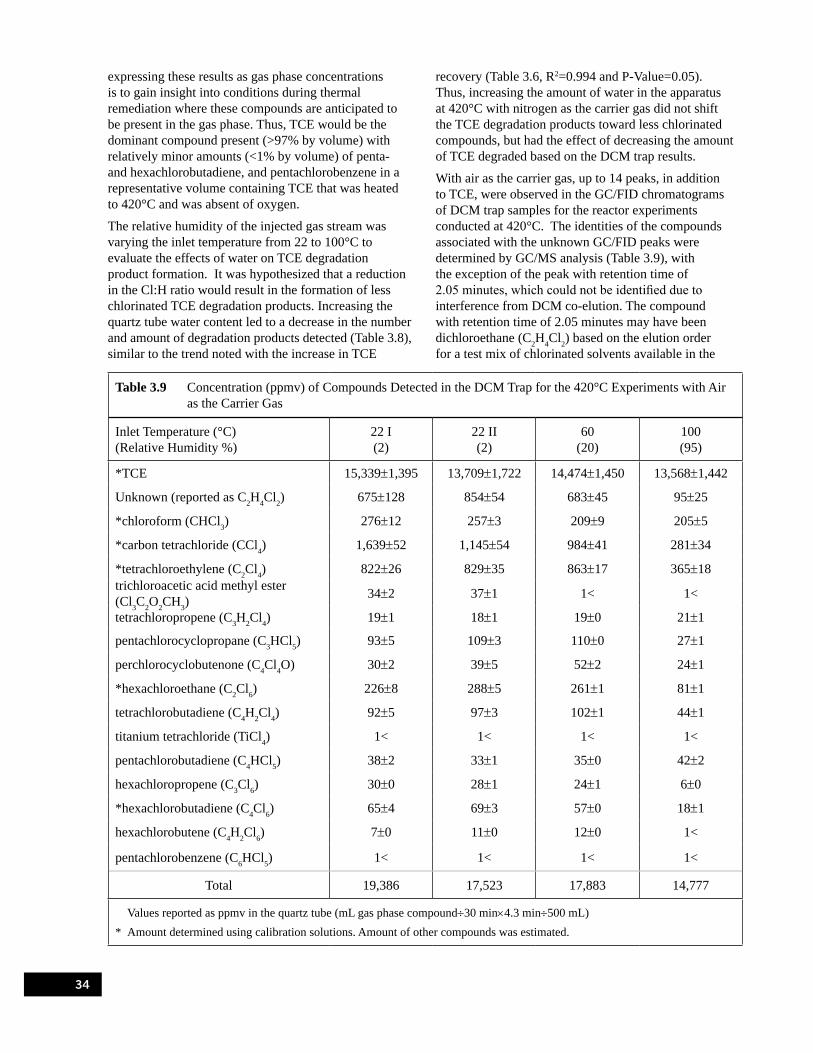
34
expressing these results as gas phase concentrations is to gain insight into conditions during thermal remediation where these compounds are anticipated to be present in the gas phase. Thus, TCE would be the dominant compound present (>97% by volume) with relatively minor amounts (<1% by volume) of penta- and hexachlorobutadiene, and pentachlorobenzene in a representative volume containing TCE that was heated to 420°C and was absent of oxygen.
The relative humidity of the injected gas stream was varying the inlet temperature from 22 to 100°C to evaluate the effects of water on TCE degradation product formation. It was hypothesized that a reduction in the Cl:H ratio would result in the formation of less chlorinated TCE degradation products. Increasing the quartz tube water content led to a decrease in the number and amount of degradation products detected (Table 3.8), similar to the trend noted with the increase in TCE
recovery (Table 3.6, R2=0.994 and P-Value=0.05). Thus, increasing the amount of water in the apparatus at 420°C with nitrogen as the carrier gas did not shift the TCE degradation products toward less chlorinated compounds, but had the effect of decreasing the amount of TCE degraded based on the DCM trap results.
With air as the carrier gas, up to 14 peaks, in addition to TCE, were observed in the GC/FID chromatograms of DCM trap samples for the reactor experiments conducted at 420°C. The identities of the compounds associated with the unknown GC/FID peaks were determined by GC/MS analysis (Table 3.9), with the exception of the peak with retention time of 2.05 minutes, which could not be identified due to interference from DCM co-elution. The compound with retention time of 2.05 minutes may have been dichloroethane (C2H4Cl2) based on the elution order for a test mix of chlorinated solvents available in the
Table 3.9 Concentration (ppmv) of Compounds Detected in the DCM Trap for the 420°C Experiments with Air as the Carrier Gas
Inlet Temperature (°C) (Relative Humidity %)
22 I (2)
22 II (2)
60 (20)
100 (95)
*TCE 15,339±1,395 13,709±1,722 14,474±1,450 13,568±1,442
Unknown (reported as C2H4Cl2) 675±128 854±54 683±45 95±25
*chloroform (CHCl3) 276±12 257±3 209±9 205±5
*carbon tetrachloride (CCl4) 1,639±52 1,145±54 984±41 281±34
*tetrachloroethylene (C2Cl4) 822±26 829±35 863±17 365±18trichloroacetic acid methyl ester (Cl3C2O2CH3)
34±2 37±1 1< 1<
tetrachloropropene (C3H2Cl4) 19±1 18±1 19±0 21±1
pentachlorocyclopropane (C3HCl5) 93±5 109±3 110±0 27±1
perchlorocyclobutenone (C4Cl4O) 30±2 39±5 52±2 24±1
*hexachloroethane (C2Cl6) 226±8 288±5 261±1 81±1
tetrachlorobutadiene (C4H2Cl4) 92±5 97±3 102±1 44±1
titanium tetrachloride (TiCl4) 1< 1< 1< 1<
pentachlorobutadiene (C4HCl5) 38±2 33±1 35±0 42±2
hexachloropropene (C3Cl6) 30±0 28±1 24±1 6±0
*hexachlorobutadiene (C4Cl6) 65±4 69±3 57±0 18±1
hexachlorobutene (C4H2Cl6) 7±0 11±0 12±0 1<
pentachlorobenzene (C6HCl5) 1< 1< 1< 1<
Total 19,386 17,523 17,883 14,777
Values reported as ppmv in the quartz tube (mL gas phase compound÷30 min×4.3 min÷500 mL)* Amount determined using calibration solutions. Amount of other compounds was estimated.
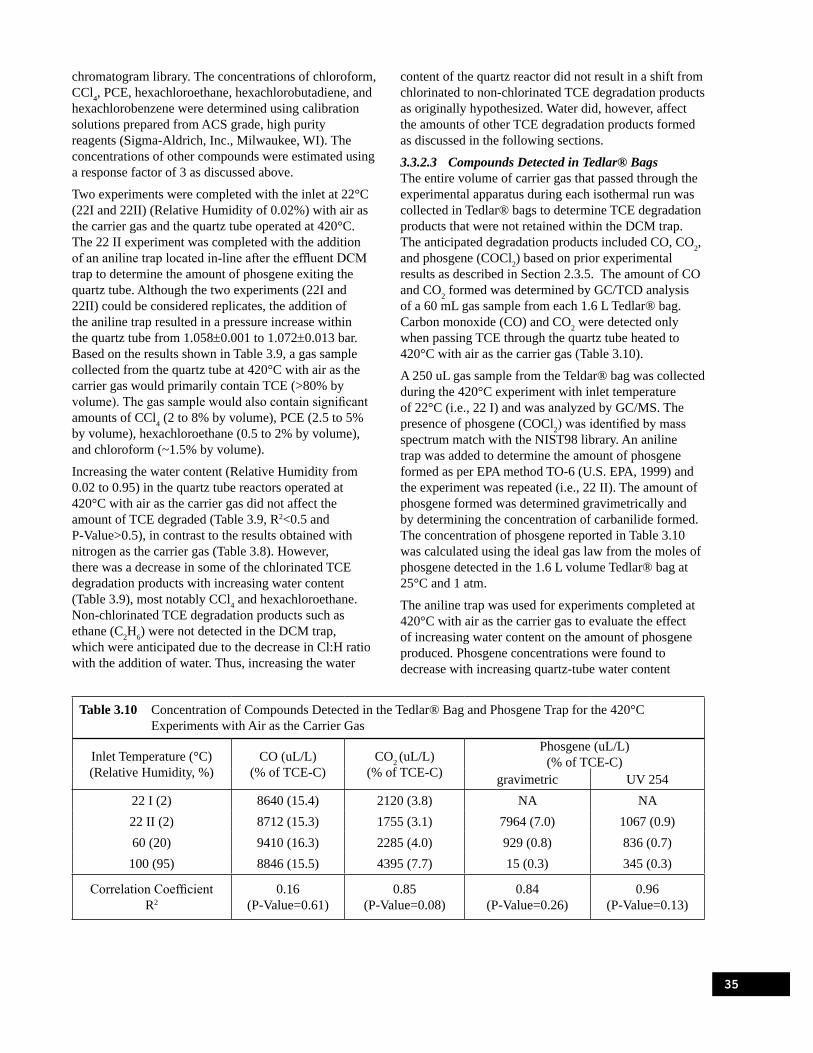
35
chromatogram library. The concentrations of chloroform, CCl4, PCE, hexachloroethane, hexachlorobutadiene, and hexachlorobenzene were determined using calibration solutions prepared from ACS grade, high purity reagents (Sigma-Aldrich, Inc., Milwaukee, WI). The concentrations of other compounds were estimated using a response factor of 3 as discussed above.
Two experiments were completed with the inlet at 22°C (22I and 22II) (Relative Humidity of 0.02%) with air as the carrier gas and the quartz tube operated at 420°C. The 22 II experiment was completed with the addition of an aniline trap located in-line after the effluent DCM trap to determine the amount of phosgene exiting the quartz tube. Although the two experiments (22I and 22II) could be considered replicates, the addition of the aniline trap resulted in a pressure increase within the quartz tube from 1.058±0.001 to 1.072±0.013 bar. Based on the results shown in Table 3.9, a gas sample collected from the quartz tube at 420°C with air as the carrier gas would primarily contain TCE (>80% by volume). The gas sample would also contain significant amounts of CCl4 (2 to 8% by volume), PCE (2.5 to 5% by volume), hexachloroethane (0.5 to 2% by volume), and chloroform (~1.5% by volume).
Increasing the water content (Relative Humidity from 0.02 to 0.95) in the quartz tube reactors operated at 420°C with air as the carrier gas did not affect the amount of TCE degraded (Table 3.9, R2<0.5 and P-Value>0.5), in contrast to the results obtained with nitrogen as the carrier gas (Table 3.8). However, there was a decrease in some of the chlorinated TCE degradation products with increasing water content (Table 3.9), most notably CCl4 and hexachloroethane. Non-chlorinated TCE degradation products such as ethane (C2H6) were not detected in the DCM trap, which were anticipated due to the decrease in Cl:H ratio with the addition of water. Thus, increasing the water
content of the quartz reactor did not result in a shift from chlorinated to non-chlorinated TCE degradation products as originally hypothesized. Water did, however, affect the amounts of other TCE degradation products formed as discussed in the following sections.
3.3.2.3 Compounds Detected in Tedlar® BagsThe entire volume of carrier gas that passed through the experimental apparatus during each isothermal run was collected in Tedlar® bags to determine TCE degradation products that were not retained within the DCM trap. The anticipated degradation products included CO, CO2, and phosgene (COCl2) based on prior experimental results as described in Section 2.3.5. The amount of CO and CO2 formed was determined by GC/TCD analysis of a 60 mL gas sample from each 1.6 L Tedlar® bag. Carbon monoxide (CO) and CO2 were detected only when passing TCE through the quartz tube heated to 420°C with air as the carrier gas (Table 3.10).
A 250 uL gas sample from the Teldar® bag was collected during the 420°C experiment with inlet temperature of 22°C (i.e., 22 I) and was analyzed by GC/MS. The presence of phosgene (COCl2) was identified by mass spectrum match with the NIST98 library. An aniline trap was added to determine the amount of phosgene formed as per EPA method TO-6 (U.S. EPA, 1999) and the experiment was repeated (i.e., 22 II). The amount of phosgene formed was determined gravimetrically and by determining the concentration of carbanilide formed. The concentration of phosgene reported in Table 3.10 was calculated using the ideal gas law from the moles of phosgene detected in the 1.6 L volume Tedlar® bag at 25°C and 1 atm.
The aniline trap was used for experiments completed at 420°C with air as the carrier gas to evaluate the effect of increasing water content on the amount of phosgene produced. Phosgene concentrations were found to decrease with increasing quartz-tube water content
Table 3.10 Concentration of Compounds Detected in the Tedlar® Bag and Phosgene Trap for the 420°C Experiments with Air as the Carrier Gas
Inlet Temperature (°C) (Relative Humidity, %)
CO (uL/L) (% of TCE-C)
CO2 (uL/L) (% of TCE-C)
Phosgene (uL/L) (% of TCE-C)
gravimetric UV 25422 I (2) 8640 (15.4) 2120 (3.8) NA NA22 II (2) 8712 (15.3) 1755 (3.1) 7964 (7.0) 1067 (0.9)60 (20) 9410 (16.3) 2285 (4.0) 929 (0.8) 836 (0.7) 100 (95) 8846 (15.5) 4395 (7.7) 15 (0.3) 345 (0.3)
Correlation Coefficient R2
0.16 (P-Value=0.61)
0.85 (P-Value=0.08)
0.84 (P-Value=0.26)
0.96 (P-Value=0.13)

36
(Table 3.10). However, the compound formed after passing the quartz tube effluent through the aniline trap may not have been due to phosgene alone. For example, O’Mara et al. (1971) found that gas phase HCl formed during the combustion of vinyl chloride caused aniline to polymerize in a liquid trap and form a compound that had a UV absorbance of 254 nm which interfered with the detection of phosgene. While the concentration of HCl in the quartz tube effluent was not determined, the amount of chloride found in the water rinse (see Section 3.3.2.4 and Figure 3.5) suggests that gas phase HCl was present in the quartz tube effluent. Thus, the decrease in phosgene concentration with increase in quartz tube water content shown in Table 3.10 may have been due to phosgene hydrolysis alone, or may represent a reduction in effluent HCl concentration along with phosgene hydrolysis. Hydrolysis of phosgene can occur in the gas- and aqueous phases, and is reported to yield CO2 according to (Ryan et al., 1996):
COCl2 + H2O → CO2 + 2HCl (3.2)
An increase in the amount of CO2 produced with increasing in quartz tube water content was apparent. In contrast, the concentration of CO in the effluent (8,902±349 ppmv) and TCE recovery remained consistent (Table 3.7), implying a shift in degradation product distribution with phosgene being converted to CO2 as expected based on Equation 3.2. The amounts (moles) of CO2 and phosgene formed along with the difference between the amount of CO2 found with the inlet at 22°C (22 II), at 60°C, and at 100°C are shown in Table 3.11. The increase in CO2 production with increase in quartz tube water content (i.e., CO2 Gain, Table 3.11) was approximately 33% of the amount of phosgene lost between the inlet temperatures of 22°C and 100°C based on the phosgene gravimetric analysis, but was 6 times greater than the amount of phosgene lost based on the UV 254 analysis. The gravimetric results suggest that the increase in CO2 was primarily due to phosgene hydrolysis. However, the UV 254 analysis results suggest that not all the solids formed in the aniline trap represented carbanilide.
3.3.2.4 Compounds Detected in the Water RinseAfter each isothermal run, approximately 30 mL of freshly dispensed DI water were used to rinse the quartz tubes once they had cooled to room temperature (22°C). The water rinse was performed to determine the water-soluble TCE degradation products formed after passing TCE through the heated quartz tube. The anticipated degradation products included chloride, due to the loss of chlorine atoms from TCE (i.e., dechlorination), and haloacetic acids such as dichlororacetate, based on the past experimental work described in Section 2.3.2 (e.g., McKinney et al., 1995).
The amounts of chloride in the water rinse as a function of quartz tube temperature, carrier gas, and inlet temperature (water content) is shown in Figure 3.5. Chloride was detected in the water rinse from each isothermal experiment regardless of carrier gas used. This result suggests that TCE was degraded, to some extent, in all of the quartz tube experiments performed in the fifth experimental series. The amount of chloride in the 120°C experiment with the inlet temperature at 22°C and nitrogen as the carrier gas was 0.06 umol, which was below the method detection limit (MDL) of 0.07 umol, and the concentration of chloride with air as the carrier gas was 0.10 mg/L with a MDL of 0.05 mg/L; all other chloride concentrations were at least an order-of-magnitude above their MDL. The amount of chloride increased with increasing quartz tube water content (i.e., inlet temperature), even for experiments completed at the lowest quartz tube temperature of 120°C where TCE recovery was greater than 94% (Figure 3.4), and no TCE degradation products were detected in the DCM trap. The amount of chloride measured in the 240 and 420°C experiments with air as the carrier gas was greater than the amount of chloride detected in experiments with nitrogen as the carrier gas, which was consistent with the lower TCE recovery noted in Figure 3.4 with air as the carrier gas. The amount of chloride was greatest in the water rinse after the 420°C experiments where TCE degradation products were detected in the DCM trap.
Table 3.11 Change in the Amount of CO2 and Phosgene Detected with Increase in Water Content for the 420°C Experiments with Air as the Carrier Gas
Inlet Temperature (°C) (Relative Humidity, %) CO2 (mmol) CO2 Gain
CO2 – CO2 (22II)Phosgene (mmol)
gravimetrically UV 25422 I (2) 0.28 -0.05 NA NA
22 II (2) 0.23 0.00 0.52 0.07
60 (20) 0.30 0.07 0.06 0.05
100 (95) 0.58 0.35 0.00 0.02
NA – not analyzed
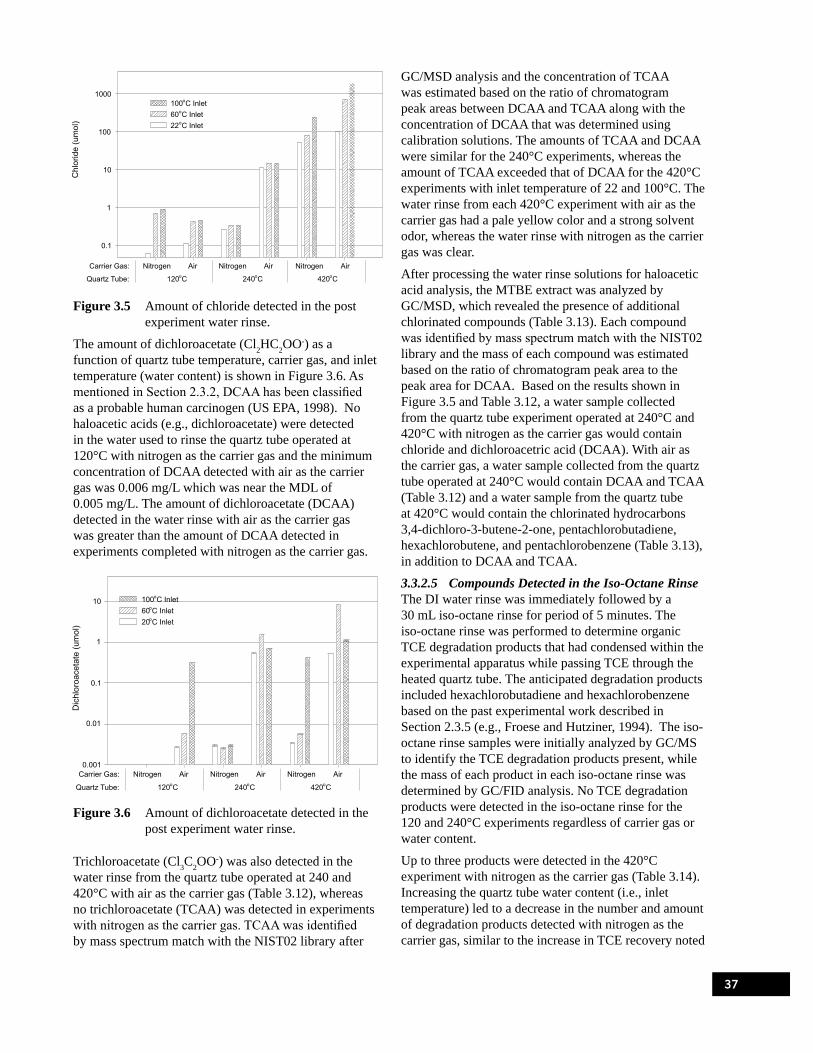
37
Figure 3.5 Amount of chloride detected in the post experiment water rinse.
The amount of dichloroacetate (Cl2HC2OO-) as a function of quartz tube temperature, carrier gas, and inlet temperature (water content) is shown in Figure 3.6. As mentioned in Section 2.3.2, DCAA has been classified as a probable human carcinogen (US EPA, 1998). No haloacetic acids (e.g., dichloroacetate) were detected in the water used to rinse the quartz tube operated at 120°C with nitrogen as the carrier gas and the minimum concentration of DCAA detected with air as the carrier gas was 0.006 mg/L which was near the MDL of 0.005 mg/L. The amount of dichloroacetate (DCAA) detected in the water rinse with air as the carrier gas was greater than the amount of DCAA detected in experiments completed with nitrogen as the carrier gas.
Figure 3.6 Amount of dichloroacetate detected in the post experiment water rinse.
Trichloroacetate (Cl3C2OO-) was also detected in the water rinse from the quartz tube operated at 240 and 420°C with air as the carrier gas (Table 3.12), whereas no trichloroacetate (TCAA) was detected in experiments with nitrogen as the carrier gas. TCAA was identified by mass spectrum match with the NIST02 library after
GC/MSD analysis and the concentration of TCAA was estimated based on the ratio of chromatogram peak areas between DCAA and TCAA along with the concentration of DCAA that was determined using calibration solutions. The amounts of TCAA and DCAA were similar for the 240°C experiments, whereas the amount of TCAA exceeded that of DCAA for the 420°C experiments with inlet temperature of 22 and 100°C. The water rinse from each 420°C experiment with air as the carrier gas had a pale yellow color and a strong solvent odor, whereas the water rinse with nitrogen as the carrier gas was clear.
After processing the water rinse solutions for haloacetic acid analysis, the MTBE extract was analyzed by GC/MSD, which revealed the presence of additional chlorinated compounds (Table 3.13). Each compound was identified by mass spectrum match with the NIST02 library and the mass of each compound was estimated based on the ratio of chromatogram peak area to the peak area for DCAA. Based on the results shown in Figure 3.5 and Table 3.12, a water sample collected from the quartz tube experiment operated at 240°C and 420°C with nitrogen as the carrier gas would contain chloride and dichloroacetric acid (DCAA). With air as the carrier gas, a water sample collected from the quartz tube operated at 240°C would contain DCAA and TCAA (Table 3.12) and a water sample from the quartz tube at 420°C would contain the chlorinated hydrocarbons 3,4-dichloro-3-butene-2-one, pentachlorobutadiene, hexachlorobutene, and pentachlorobenzene (Table 3.13), in addition to DCAA and TCAA.
3.3.2.5 Compounds Detected in the Iso-Octane RinseThe DI water rinse was immediately followed by a 30 mL iso-octane rinse for period of 5 minutes. The iso-octane rinse was performed to determine organic TCE degradation products that had condensed within the experimental apparatus while passing TCE through the heated quartz tube. The anticipated degradation products included hexachlorobutadiene and hexachlorobenzene based on the past experimental work described in Section 2.3.5 (e.g., Froese and Hutziner, 1994). The iso-octane rinse samples were initially analyzed by GC/MS to identify the TCE degradation products present, while the mass of each product in each iso-octane rinse was determined by GC/FID analysis. No TCE degradation products were detected in the iso-octane rinse for the 120 and 240°C experiments regardless of carrier gas or water content.
Up to three products were detected in the 420°C experiment with nitrogen as the carrier gas (Table 3.14). Increasing the quartz tube water content (i.e., inlet temperature) led to a decrease in the number and amount of degradation products detected with nitrogen as the carrier gas, similar to the increase in TCE recovery noted
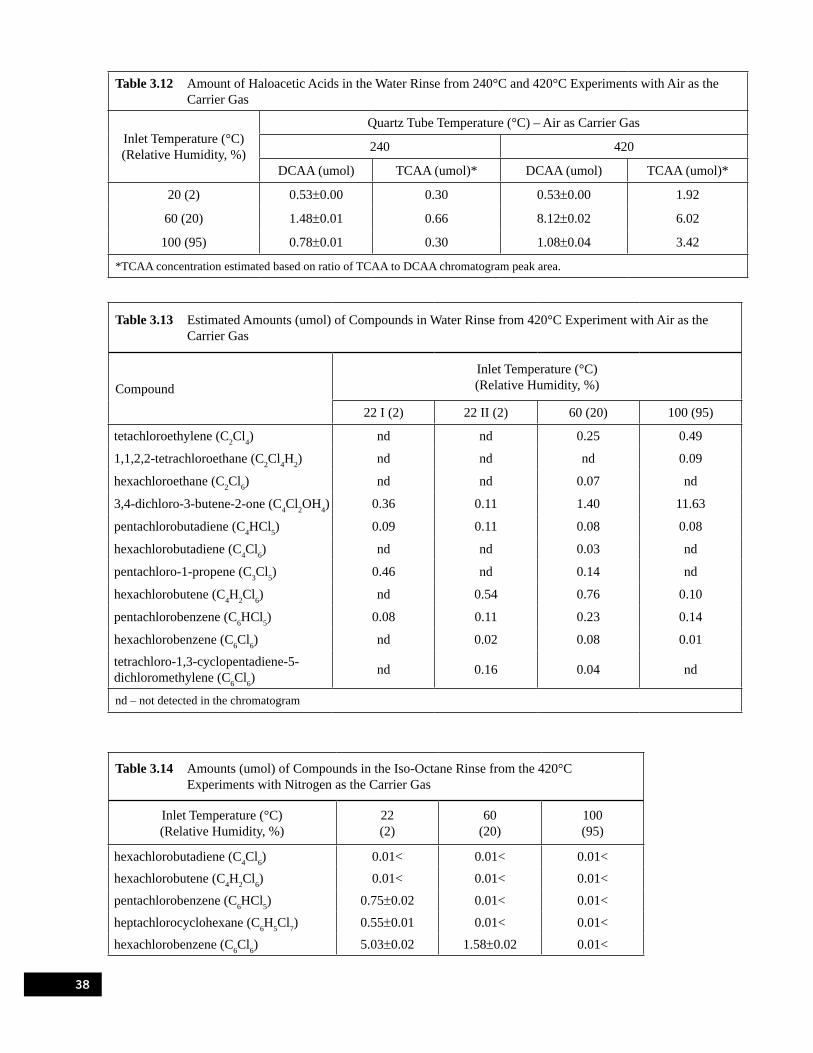
38
Table 3.12 Amount of Haloacetic Acids in the Water Rinse from 240°C and 420°C Experiments with Air as the Carrier Gas
Inlet Temperature (°C) (Relative Humidity, %)
Quartz Tube Temperature (°C) – Air as Carrier Gas
240 420
DCAA (umol) TCAA (umol)* DCAA (umol) TCAA (umol)*
20 (2) 0.53±0.00 0.30 0.53±0.00 1.92
60 (20) 1.48±0.01 0.66 8.12±0.02 6.02
100 (95) 0.78±0.01 0.30 1.08±0.04 3.42
*TCAA concentration estimated based on ratio of TCAA to DCAA chromatogram peak area.
Table 3.13 Estimated Amounts (umol) of Compounds in Water Rinse from 420°C Experiment with Air as the Carrier Gas
CompoundInlet Temperature (°C) (Relative Humidity, %)
22 I (2) 22 II (2) 60 (20) 100 (95)
tetachloroethylene (C2Cl4) nd nd 0.25 0.49
1,1,2,2-tetrachloroethane (C2Cl4H2) nd nd nd 0.09
hexachloroethane (C2Cl6) nd nd 0.07 nd
3,4-dichloro-3-butene-2-one (C4Cl2OH4) 0.36 0.11 1.40 11.63
pentachlorobutadiene (C4HCl5) 0.09 0.11 0.08 0.08
hexachlorobutadiene (C4Cl6) nd nd 0.03 nd
pentachloro-1-propene (C3Cl5) 0.46 nd 0.14 nd
hexachlorobutene (C4H2Cl6) nd 0.54 0.76 0.10
pentachlorobenzene (C6HCl5) 0.08 0.11 0.23 0.14
hexachlorobenzene (C6Cl6) nd 0.02 0.08 0.01
tetrachloro-1,3-cyclopentadiene-5-dichloromethylene (C6Cl6)
nd 0.16 0.04 nd
nd – not detected in the chromatogram
Table 3.14 Amounts (umol) of Compounds in the Iso-Octane Rinse from the 420°C Experiments with Nitrogen as the Carrier Gas
Inlet Temperature (°C) (Relative Humidity, %)
22 (2)
60 (20)
100 (95)
hexachlorobutadiene (C4Cl6) 0.01< 0.01< 0.01<
hexachlorobutene (C4H2Cl6) 0.01< 0.01< 0.01<
pentachlorobenzene (C6HCl5) 0.75±0.02 0.01< 0.01<
heptachlorocyclohexane (C6H5Cl7) 0.55±0.01 0.01< 0.01<
hexachlorobenzene (C6Cl6) 5.03±0.02 1.58±0.02 0.01<

39
in Table 3.6 (R2=0.994). There were no degradation products detected by GC/FID analysis in the iso-octane rinse of the 420°C experiment with the inlet temperature at 100°C which represented the maximum water content (relative humidity of 95%) for the fifth experimental series.
There were up to five compounds detected in the 420°C experiments with air as the carrier gas (Table 3.15). Hexachlorobutadiene and hexachlorobutene were detected in addition to penta- and hexachlorobenzne in the iso-octane rinse for the inlet temperature of 22°C. Penta- and hexachlorobenzene were detected in the iso-octane rinse with the inlet at 100°C. These compounds were also detected in the MTBE extract of the water rinse (Table 3.13) that was completed prior to the iso-octane rinse for the 420°C experiment with air as the carrier gas. Based on the results presented in Tables 3.14 and 3.15, hexachlorobenzene is likely to be the most prominent degradation product formed under these experimental conditions, and increasing the amount of water vapor entering the reactor would decrease the amount of TCE degradation products formed.
Table 3.15 Amounts (umol) of Compounds in the Iso-Octane Rinse from the 420°C Experiments with Air as the Carrier Gas
Inlet Temperature (°C) (Relative Humidity, %)
22 I (2)
22 II (2)
60 (20)
100 (95)
hexachlorobutadiene (C4Cl6)
0.66 0.47 NA 0.01<
hexachlorobutene (C4H2Cl6)
1.55 1.26 NA 0.01<
pentachlorobenzene (C6HCl5)
0.95 0.75 NA 0.65
heptachlorocyclohexane (C6H5Cl7)
0.01< 0.01< NA 0.01<
hexachlorobenzene (C6Cl6)
4.29 4.23 NA 1.56
NA – not analyzed, sample broken during storage
3.3.2.6 Mass BalanceThe amount of TCE as moles of carbon (moles carbon = 2 × moles TCE) detected in the DCM trap with respect to the moles of TCE as carbon that were injected into the experimental apparatus operated at 420°C with nitrogen as the carrier gas is provided in Table 3.16 as “%Carbon in Feed.” Similarly, the amount of TCE recovered as moles of chlorine (moles chlorine = 3 × moles TCE) with respect to the moles of TCE as chlorine that were injected into the apparatus is also provided in Table 3.16 as “%Chlorine in Feed.” These measures of TCE
recovery are analogous to those presented for TCE in Section 3.3.2.1, and in Figure 3.4 and Table 3.6.
The amount of TCE degradation products detected in the DCM trap and quartz tube rinses are also reported in Table 3.16 as moles of carbon and chlorine with respect to the amount of carbon and chlorine delivered to the quartz tube apparatus as TCE. The purpose of reporting the amount of carbon or chlorine detected is to show the distribution of each TCE degradation product in the apparatus and to determine if all the carbon and chlorine atoms were accounted for (i.e., mass balance). For example, while 93.1% of the carbon delivered during the experiment with the inlet at 22°C was detected in the DCM trap as TCE (Table 3.16), 3.4% of the carbon delivered was detected in the DCM trap as TCE degradation products that were presented in Table 3.8, and 0.5% of the carbon delivered was detected in the quartz tube rinses as TCE degradation products as listed in Table 3.14. Thus, the net recovery of the TCE injected with the inlet at 22°C increased from 93.1% when TCE recovery alone was considered to 97.1% on a carbon basis, and increased to 101.2% on a chlorine basis when the TCE degradation products were included.
TCE was the predominant (>93%) compound detected in the DCM trap, and there were more chlorinated TCE degradation products condensed within the DCM trap than found in the water or iso-octane rinses of the 420°C experiments with nitrogen as the carrier gas. Increasing the quartz-tube water content resulted in a decrease in the amount of TCE degradation products in the DCM trap while the amount of chloride found in the water rinse increased. Overall, very good mass recovery of TCE on a carbon (>97%) and chlorine (>100%) basis was obtained in the 420°C experiment with nitrogen as the carrier gas.
The distribution of carbon and chlorine in the experimental apparatus operated at 420°C with air as the carrier gas is provided in Table 3.17. Approximately 18-23% of the carbon introduced as TCE was converted to CO and CO2, while the other half consisted of chlorinated hydrocarbons detected in the DCM trap and as phosgene for the experiment with inlet temperature of 22°C. Increasing the quartz tube water content resulted in a decrease in the amount of chlorinated carbon compounds in the DCM trap and in the water and iso-octane rinses of the quartz tube, along with an increase in the amount of chloride found in the water rinse.
The amount of carbon and chlorine recovered in the DCM trap, water and iso-octane rinses, and in the Tedlar® bag decreased with increasing quartz tube water content for the 420°C experiments with air as the carrier gas (Table 3.17). The amounts of missing carbon and chlorine were nearly equal, suggesting that the missing compounds could have consisted of chlorinated

40
hydrocarbons. It is possible that the unaccounted for chlorinated hydrocarbons were present in the Tedlar® bag and went undetected during the GC/TCD analysis for CO/CO2 content due to adsorption on the Carboxen 1010 capillary column.
3.4 DiscussionThe goal of the quartz tube experiments was to determine the identity and amount of TCE degradation products formed after exposing gas phase TCE to temperatures from 60 to 480°C. The following sections present potential TCE degradation mechanisms based on the quartz tube experimental results.
3.4.1 Nitrogen as the Carrier Gas at 420°CThe 420°C experiment with nitrogen as the carrier gas involved passing TCE and water vapor through the quartz tube heated to 420°C. Nitrogen and water are inert relative to oxygen and are not thought to have caused TCE degradation under the experimental conditions. Therefore, the degradation of TCE, as indicated by the detection of carbon compounds and chloride ions in the DCM trap and quartz tube rinses is hypothesized to have occurred via unimolecular dissociation of TCE rather than a bimolecular reaction with nitrogen or water.
The compounds formed after passing gas-phase TCE at 320°C through a laser beam include HCl, dichlorovinylidene (:C2Cl2), dichloroacetylene (C2Cl2), vinyl radicals (HClC2Cl˙), and chlorine atoms (Cl) according to (Yokoyama et al., 1995):
Table 3.16 Distribution of Carbon and Chlorine for the 420°C Experiments with Nitrogen as the Carrier Gas
Inlet Temperature (°C) (Relative Humidity, %)
22 (2)
60 (20)
100 (95)
22 (2)
60 (20)
100 (95)
Phase Compound %Carbon in Feed %Chlorine in Feed
Compounds in DCM Trap
TCE 93.1±1.9 95.5±1.5 99.1±1.9 93.1±1.9 95.5±1.5 99.1±1.9
All Other 3.4±0.1 2.4±0.0 1.3±0.0 7.3±0.2 4.7±0.2 1.1±0.0
Compounds in Gas Phase CO/CO2 <1.4 <1.4 <1.4 <1.4 <1.4 <1.4
Condensed in Quartz Tube
Water + Iso-Octane Rinses 0.5±0.0 0.1±0.0 0.0±0.0 0.8±0.1 0.9±0.1 2.2±0.3
Net Recovery 97.1±1.9 98.1±1.5 100.4±1.9 101.2±1.9 101.1±1.6 102.4±1.9
Table 3.17 Distribution of Carbon and Chlorine for the 420°C Experiments with Air as the Carrier Gas
Inlet Temperature (°C) (Relative Humidity, %)
22 II (2)
60 (20)
100 (95)
22 II (2)
60 (20)
100 (95)
Phase Compound % Carbon in Feed % Chlorine in Feed
Compounds in DCM Trap
TCE 52.4±1.2 54.6±0.2 51.7±0.9 52.4±1.2 54.6±0.2 51.7±0.9
All Other 13.2±0.3 11.9±0.2 3.2±0.1 20.3±0.4 18.0±0.3 4.9±0.1
Compounds in Gas Phase
CO/CO2 18.4 20.3 23.2 0.0 0.0 0.0Phosgene 7.0 0.8 0.0 14.0 1.1 0.0
Condensed in Quartz Tube
Water + Iso-Octane Rinses 0.6±0.0 0.6±0.0 1.0±0.0 2.0±0.0 6.7±0.4 17.8±1.8
Net Recovery 91.5±1.2 88.1±0.3 79.1±0.9 88.8±1.3 80.5±0.5 74.6±2.0

41
(3.3)
While Yokoyama et al. (1995) found spectroscopic evidence to suggest that dichlorovinyl radicals (3.3c) had formed after passing TCE through the laser beam, the branching ratio for the Cl (3.3c) to HCl elimination (3.3a and 3.3b) reactions was 0.17, which indicates that the HCl elimination pathway produced approximated 5 times more TCE degradation products than the Cl elimination reaction pathway under these experimental conditions. The predominance of the HCl elimination pathway (3.3a and 3.3b) is supported by the results of Reiser et al. (1979) which indicate that HCl and dichloroacetylene were the primary products from the photolysis of TCE at 25°C.
The elimination of HCl from TCE (Equations 3.3a and 3.3b) was proposed to occur at elevated temperatures after passing TCE through a flame (Chang and Senkan, 1989) and after passing gas-phase TCE through a heated quartz tube (Wu and Lin, 2004) based on the detection of dichloroacetylene. Passing TCE through the quartz tube apparatus used herein at 420°C with nitrogen as the carrier gas is proposed to have caused the unimolecular dissociation of TCE described by Equation 3.3. The products in Equation 3.3 are reactive compounds thought to have rapidly transformed into the chlorinated, 4 and 6 carbon compounds that were detected in experiments completed herein using the empty quartz tube with nitrogen as the carrier gas (Tables 3.8 and
3.14). Goodall and Howlett (1954) also found HCl and hexachlorobenzene as the primary TCE degradation products after passing gas phase TCE through a Pyrex tube heated between 385 and 445°C with nitrogen as the carrier gas.
Increasing the water content of the quartz tube at 420°C with nitrogen as the carrier gas resulted in an increase in TCE recovery, an increase in the amount of chloride detected in the water rinse, and a decrease in the amount of degradation products detected in the DCM trap and in the iso-octane rinse (Table 3.18). These results indicated that increasing the amount of water in the quartz tube at 420°C resulted in a decrease in the amount of TCE degraded.
The role that water played in reducing TCE degradation is not known. Water may have reacted with the unimolecular degradation products shown in Equation 3.3 and prevented them from reacting with TCE, thereby decreasing the amount of TCE degraded. For example, chlorine initiated TCE degradation has been shown to occur at 25°C and is thought to proceed by forming tetrachloroethyl radicals (Cl2HC2Cl2˙) according to (Catoire et al., 1997):
(3.4)
Increasing the quartz-tube water content in the experiments completed at 420°C with nitrogen as the carrier gas could have prevented the chlorine radicals produced by the unimolecular dissociation of TCE (Equation 3.3c) from reacting with TCE. However, chlorine radicals are not thought to react with water based on the equilibrium coefficient for the aqueous phase reaction as shown in Equation 3.5 which is 1.4×10⁻⁷ at 24°C (Yu et al., 2004).
Cl• + H2O → ClHO–• + H+ (3.5)
Table 3.18 Carbon in the DCM Trap and Iso-Octane Rinse, and Chloride in the Water Rinse for the 420°C Experiments with Nitrogen as the Carrier GasInlet Temperature (°C) 22 60 100
(Relative Humidity, %) (2) (20) (95)TCE Recovery (%) 93.1±1.9 95.5±1.5 99.1±1.9Carbon in DCM trap other than TCE (umol) 251.6 176.7 99.7Carbon in iso-octane rinse (umol) 38.0 9.4 0.0Carbon in water rinse (umol) 0.01 0.01 0.84Chloride in water rinse (umol) 52.0 83.9 242.7Note: No CO or CO2 was detected in the experiments with nitrogen as the carrier gas.

42
While chlorine radicals are not expected to react with water, they are known to react with chloride-ions dissolved in water to form dichlorine radical anions (Cl2
-˙) (Yu and Barker, 2003).
Cl• + Cl– → Cl2– • (3.6)
Since the amount of chloride increased with quartz tube water content, water may have reduced the amount of gas-phase chlorine radicals and thus reduced the amount of TCE degraded. The source of the chloride ions is thought to be from the HCl produced during the unimolecular dissociation of TCE according to Equations 3.3a and 3.3b since HCl readily ionizes in water. For example, the presence of water molecules in a gas stream with HCl molecules at 25°C was shown to cause an increase in the hydrogen to chlorine bond length at the water to HCl molar ratio of 1:1 and the complete ionization of HCl with the water to HCl molar ratio at 5:1 (Farnik et al., 2003).
HCl has been proposed as a source of chlorine radicals in the post-flame zone of combustion chambers (Procaccini et al., 2003). However, the experimental work completed to date suggests that HCl is stable at 420°C, with an estimated dissociation half-life of 3×10⁹ years (Baulch et al., 1981). Thus, HCl is not expected to yield chlorine radicals at 420°C with nitrogen as the carrier gas. Even though HCl is not expected to dissociate to yield chlorine radicals at 420°C there is experimental evidence to suggest that HCl reacts with organic compounds at elevated temperatures. The presence of HCl caused the chlorination of gas phase hexachlorodibenzo-p-dioxin (HCDD) at 248°C with the formation of hepta- and octachlorodibenzo-p-dioxins whereas less chlorinated dibenzo-p-dioxins were found in experiments completed without HCl (Addink et al., 1996). Procaccini et al. (2003) found that adding gas-phase HCl and benzene to a post ethene (C2H4) combustion zone at 640°C resulted in the formation of chlorobenzene and chlorophenols, demonstrating that HCl could react with benzene. The reaction between HCl and benzene was proposed to involve chlorine radicals based on the similarity in product distribution after using Cl2 gas and HCl in combination with benzene (Procaccini et al., 2003). Thus, HCl may be reacting with TCE in the experiments completed herein at 420°C with nitrogen as the carrier gas. Increasing the water content of the 420°C experiment with nitrogen as the carrier gas is proposed to have decreased the amount of HCl and chlorine radicals available to react with TCE. An alternative explanation is that the increase in water content could cause an increase in the HCl elimination pathways (Equations 3.3a and 3.3b) and a decrease in the chlorine radical pathway (Equation 3.3c).
3.4.2 Air as the Carrier Gas at 420°CThe 420°C experiment conducted with air (21% oxygen) as the carrier gas involved passing TCE and water vapor through the quartz tube heated to 420°C. The presence of molecular oxygen in the 420°C experiments resulted in a decrease in TCE recovery and an increase in the number and amount of TCE degradation products detected as compared to the experiments completed with nitrogen as the carrier gas. Thus, the presence of oxygen in the 420°C experiments resulted in an increase in the amount of TCE degraded in excess of the amount of TCE degraded by unimolecular dissociation alone (Equation 3.3). The increase in TCE degradation with oxygen present is thought to involve the formation of peroxyl radical species. Molecular oxygen is suspected to have reacted with tetrachloroethyl radicals produced from the reaction between chlorine and TCE as shown in Equation 3.4 to form peroxyl radicals (Cl2HC2Cl2OO˙) according to (Catoire et al., 1997; Nimlos et al., 1993):
(3.7)
The peroxyl radicals are suspected to react with TCE in a radical chain mechanism resulting in an increase in the amount of TCE degraded at 420°C as compared to the amount degraded with nitrogen as the carrier gas.
The TCE degradation products detected in the DCM trap (Table 3.9), water rinse (Table 3.13), and iso-octane rinse (Table 3.15) are thought to have formed by reactions involving radicals such as the tetrachloroethyl radical, by reactions involving non-radical compounds such as dichlorocarbene, or a combination of radical and non-radical interactions. For example, trichloroacetate (TCAA) was detected in the DCM trap and in the water rinse (Table 3.12) of the quartz tube after the 420°C experiments with air as the carrier gas. The formation of 1,1,1,2-tetrachloroethyl radicals (Cl3C2HCl˙) from the chlorine initiated TCE degradation (Equation 3.8) is suspected as the key intermediate that reacted with molecular oxygen to yield TCAA.
(3.8)
The formation of tetrachloroethyl radical isomers may have been due to the additional chlorine radicals produced during the peroxyl induced degradation of TCE. TCAA is known to yield dichlorocarbene (:CCl2) and CO2 upon heating (Kaberdin and Potkin, 1994; p. 250, Smith and March, 2001). Dichlorocarbene is a reactive compound that is known to combine with TCE to yield pentachlorocyclopropane (Sepiol and Soulen,
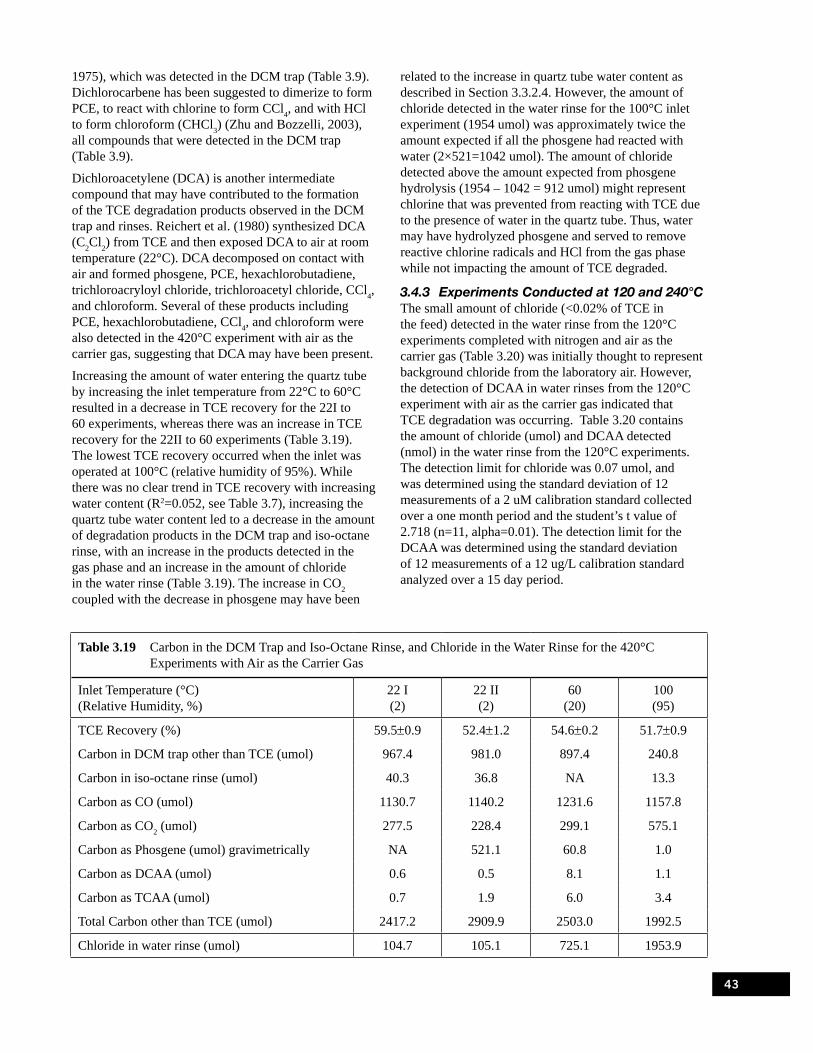
43
1975), which was detected in the DCM trap (Table 3.9). Dichlorocarbene has been suggested to dimerize to form PCE, to react with chlorine to form CCl4, and with HCl to form chloroform (CHCl3) (Zhu and Bozzelli, 2003), all compounds that were detected in the DCM trap (Table 3.9).
Dichloroacetylene (DCA) is another intermediate compound that may have contributed to the formation of the TCE degradation products observed in the DCM trap and rinses. Reichert et al. (1980) synthesized DCA (C2Cl2) from TCE and then exposed DCA to air at room temperature (22°C). DCA decomposed on contact with air and formed phosgene, PCE, hexachlorobutadiene, trichloroacryloyl chloride, trichloroacetyl chloride, CCl4, and chloroform. Several of these products including PCE, hexachlorobutadiene, CCl4, and chloroform were also detected in the 420°C experiment with air as the carrier gas, suggesting that DCA may have been present.
Increasing the amount of water entering the quartz tube by increasing the inlet temperature from 22°C to 60°C resulted in a decrease in TCE recovery for the 22I to 60 experiments, whereas there was an increase in TCE recovery for the 22II to 60 experiments (Table 3.19). The lowest TCE recovery occurred when the inlet was operated at 100°C (relative humidity of 95%). While there was no clear trend in TCE recovery with increasing water content (R2=0.052, see Table 3.7), increasing the quartz tube water content led to a decrease in the amount of degradation products in the DCM trap and iso-octane rinse, with an increase in the products detected in the gas phase and an increase in the amount of chloride in the water rinse (Table 3.19). The increase in CO2 coupled with the decrease in phosgene may have been
related to the increase in quartz tube water content as described in Section 3.3.2.4. However, the amount of chloride detected in the water rinse for the 100°C inlet experiment (1954 umol) was approximately twice the amount expected if all the phosgene had reacted with water (2×521=1042 umol). The amount of chloride detected above the amount expected from phosgene hydrolysis (1954 – 1042 = 912 umol) might represent chlorine that was prevented from reacting with TCE due to the presence of water in the quartz tube. Thus, water may have hydrolyzed phosgene and served to remove reactive chlorine radicals and HCl from the gas phase while not impacting the amount of TCE degraded.
3.4.3 Experiments Conducted at 120 and 240°CThe small amount of chloride (<0.02% of TCE in the feed) detected in the water rinse from the 120°C experiments completed with nitrogen and air as the carrier gas (Table 3.20) was initially thought to represent background chloride from the laboratory air. However, the detection of DCAA in water rinses from the 120°C experiment with air as the carrier gas indicated that TCE degradation was occurring. Table 3.20 contains the amount of chloride (umol) and DCAA detected (nmol) in the water rinse from the 120°C experiments. The detection limit for chloride was 0.07 umol, and was determined using the standard deviation of 12 measurements of a 2 uM calibration standard collected over a one month period and the student’s t value of 2.718 (n=11, alpha=0.01). The detection limit for the DCAA was determined using the standard deviation of 12 measurements of a 12 ug/L calibration standard analyzed over a 15 day period.
Table 3.19 Carbon in the DCM Trap and Iso-Octane Rinse, and Chloride in the Water Rinse for the 420°C Experiments with Air as the Carrier Gas
Inlet Temperature (°C) (Relative Humidity, %)
22 I (2)
22 II (2)
60 (20)
100 (95)
TCE Recovery (%) 59.5±0.9 52.4±1.2 54.6±0.2 51.7±0.9
Carbon in DCM trap other than TCE (umol) 967.4 981.0 897.4 240.8
Carbon in iso-octane rinse (umol) 40.3 36.8 NA 13.3
Carbon as CO (umol) 1130.7 1140.2 1231.6 1157.8
Carbon as CO2 (umol) 277.5 228.4 299.1 575.1
Carbon as Phosgene (umol) gravimetrically NA 521.1 60.8 1.0
Carbon as DCAA (umol) 0.6 0.5 8.1 1.1
Carbon as TCAA (umol) 0.7 1.9 6.0 3.4
Total Carbon other than TCE (umol) 2417.2 2909.9 2503.0 1992.5
Chloride in water rinse (umol) 104.7 105.1 725.1 1953.9

44
Table 3.20 Amount of Chloride and DCAA in the Water Rinse from the 120°C Experiments
Inlet Temperature
(°C) (Relative
Humidity, %)
Nitrogen as Carrier Gas Air as Carrier Gas
Cl- (umol)
DCAA (nmol)
Cl- (umol)
DCAA (nmol)
22 (2) <0.07 <0.5 0.11 2.70±0.03
60 (20) 0.74 <0.5 0.45 1.89±0.06
100 (95) 0.94 0.8 0.48 2.08±0.05
No estimate of uncertainty, only one Cl- measurement performed.
If the chloride detected in the 120°C experiments represents the degradation of TCE, then carbon degradation products in addition to DCAA should have been detected. Dichloroacetylene (C2Cl2) is the expected product after elimination of HCl from TCE (Equations 3.3a and 3.3b). With nitrogen as the carrier gas, dichloroacetylene should have been collected in the Tedlar® bag; however, the bag was only analyzed for CO and CO2 content and none was detected. With air as the carrier gas, dichloroacetylene was expected to react with oxygen to form CO and CO2 and, based on the amount of chloride detected, there should have been from 2 to 30 ppmv of CO2 in the Tedlar® bag. The CO2 content of the Tedlar® bag for the experiment at 120°C with air as the carrier gas was determined using a GC/TCD method; however, the detection limit for this method was 500 ppmv, and no CO or CO2 was detected.
Increasing the tube temperature to 240°C did not significantly increase the amount of chloride detected with nitrogen as the carrier gas (Table 3.21) as compared to the amount detected in the 120°C experiments (Table 3.20). The presence of oxygen in the 240°C
experiments resulted in an increase in the amount of DCAA, TCAA, and chloride detected relative to the experiments completed with nitrogen as the carrier gas (Figures 3.7 and 3.8). This suggests that chlorine initiated TCE degradation occurred to yield the 1,1,1,2-tetrachloroethyl radical, which reacted with oxygen to yield TCAA. No other chlorinated hydrocarbon compounds were detected indicating that there was insufficient thermal energy for the radical chain reaction to propagate.
Increasing the water content of the quartz tube in the 240°C experiment with air as the carrier gas resulted in a decrease in TCE recovery (R2=0.998 and P-Value=0.03, see Table 3.7), while no trend in TCE recovery was apparent for the 240°C experiment completed with nitrogen as the carrier gas (R2=0.227 and P-Value=0.68, see Table 3.6). Thus, water did have an effect on the recovery of TCE when combined with oxygen, which may have been to induce TCE degradation. However, the amount of chloride, DCAA, and TCAA detected in the water rinse did not significantly increase with quartz tube water content. Additional carbon degradation products should have been detected to confirm that water was causing TCE degradation since the amount of DCAA and TCAA detected in the 240°C experiment with air as the carrier gas represented less than 1% of the missing TCE as carbon. The range of CO2 concentrations, assuming the missing TCE was completely converted to CO2, would have been from 2170 to 4596 ppmv, well above the GC/TCD method detection limit; however, no CO or CO2 was detected. The two explanations for the decrease in TCE recovery with increasing water content for the 240°C experiments with air as the carrier gas are: 1) there were additional chlorinated carbon reaction products, such as dichloroacetylene, that went undetected or 2) more TCE partitioned into the water in the quartz tube with air as the carrier gas than with nitrogen as the carrier gas.
Table 3.21 Amount of Chloride, DCAA, and TCAA in the Water Rinse from the 240°C Experiments
Inlet Temperature (°C)Nitrogen as Carrier Gas Air as Carrier Gas
Cl- (umol) DCAA (nmol) Cl- (umol) DCAA (nmol) TCAA (nmol)
22 0.27 2.9±0.1 11.2±0.9 528±4 299
60 0.36 2.5±0.1 15.5±2.2 1481±8 662
100 0.34 2.9±0.1 14.9±0.2 711±13 305

45
3.5 SummaryThe average recovery of TCE with nitrogen as the carrier gas was greater than 94% at all the experimental temperatures. Carbon-based TCE degradation products were only detected in the experiments completed at 420°C with nitrogen as the carrier gas. Up to four degradation products were identified in the DCM trap, two in the water rinse, three in the iso-octane rinse, and no CO or CO2 was detected for experiments completed at 420°C with nitrogen as the carrier gas. The amount of TCE recovered as carbon for the 420°C experiments with nitrogen as the carrier gas was greater than 97%, with 93% as TCE. The amount recovered as chlorine was greater than 100% with up to 7% as chlorinated degradation products. The degradation products detected contained 4 and 6 carbon atoms, with greater than 5 chlorine atoms per molecule. TCE degradation was proposed to be initiated by thermal induced unimolecular dissociation but was also influenced by chlorine induced degradation. Increasing the quartz tube water content resulted in an increase in TCE recovery which was suggested to indicate a decrease in chlorine induced TCE degradation.
The average recovery of TCE was greater than 94% with air as the carrier gas for the 120 and 240°C experiments, but dropped to approximately 53% in the 420°C experiments. The small amount (<0.02% TCE) of chloride detected in experiments completed at 120°C and at 240°C was thought to represent TCE degradation. However, no carbon degradation products were identified that could account for the missing TCE. Carbon based TCE degradation products were detected in the 240 and 420°C experiments with air as the carrier gas. There were three degradation products identified in the water rinse from the 240°C experiments. Up to 13 degradation products were detected in the DCM trap, 13 in the water rinse, and five in the iso-octane rinse in the 420°C experiments. The degradation products ranged from single carbon compounds with 3 chlorine atoms (i.e., chloroform) to compounds with 6 carbons and 6 chlorine atoms (i.e., hexachlorobenzene). Carbon monoxide (CO), CO2, and phosgene were detected in the gas phase of the 420°C experiments. The amount of carbon recovered for the 420°C experiments with air as the carrier gas was 91.5% for the 22°C inlet experiment but decreased to 79.1% for the experiment completed with the inlet at 100°C. The amount of chlorine recovered followed a similar trend with 88.8% recovered for the 22°C inlet experiment and just 74.6% recovered with the inlet at 100°C. TCE degradation was proposed to be initiated by thermal induced unimolecular dissociation but was also influenced by the formation of peroxyl radicals due to the presence of oxygen. Increasing the quartz tube water content in the 420°C experiments with air as the carrier gas may have
hydrolyzed phosgene and served to remove reactive chlorine radicals and HCl from the gas phase while not impacting the amount of TCE degraded.
The experiments reported herein represent one of only a few efforts to quantify gas-phase TCE degradation and reaction product formation under well-controlled thermal treatment conditions. Several of the important results of this work are: (1) little, if any, TCE degradation occurred at temperatures below 240°C; (2) at 420°C, up to 34 degradation products were detected in the effluent solvent trap (e.g., CCl4, PCE, hexachloroethane), solvent and water rinses of the reactor (DCAA, TCAA), and effluent gas (e.g., CO, CO2, and phosgene); (3) at 420°C, with nitrogen as the carrier gas degradation products accounted for 1 to 4% of the TCE-carbon feed, and with air (22% oxygen) as the carrier gas degradation products accounted for 28 to 38% of the TCE-carbon feed, with 18 to 23% of the carbon attributed to the formation of CO and CO2. Here, it is important to recognize that these results are specific to the experimental conditions employed in these laboratory studies, and do not precisely replicate the field conditions. For example, the following differences between the reported laboratory studies and thermal treatment conditions in the field could alter TCE degradation and product formation: (1) natural minerals and organic matter present in subsurface soils could either facilitate or quench specific reaction pathways, (2) temperatures near thermal wells can be much higher (e.g., 600-800°C) than those studied here (22 to 420°C), which could lead to complete oxidation of reaction products, (3) oxygen may be depleted in the thermal treatment swept zone which could alter reaction product distributions. Nevertheless, the experimental results reported here provide quantitative measurements of gas-phase TCE degradation and reaction product formation in heated, flow-through reactors, and provide important insight into the reaction products and pathways that could potentially occur during thermal treatment of TCE-contaminated soil.
3.6 Quality Assurance Summary for the Flow-Through Experiments
These experiments involved passing a carrier gas that contained TCE through a quartz tube heated to between 25 and 480°C. The quality assurance efforts for these experiments focused on:
Assessing system cleanliness prior to each 1. experiment (pre-rinse/pre-trap) Estimating the variability in sample collection and 2. analyses (replicates) Demonstrating analysis method performance 3. relative to methylene chloride (matrix spike)

46
Determining if contaminants were introduced during 4. sample storage (storage blanks)
System Cleanliness. The apparatus was assembled and rinsed with freshly dispensed dichloromethane (DCM) prior to each experimental run. Then carrier gas was passed through the apparatus followed by a DCM filled vial prior to TCE introduction. Samples from the DCM rinse and trap were then analyzed to determine if the decontamination methods were adequate. During preliminary experiments it was discovered that rinsing the apparatus with iso-octane was inadequate for removing all the products formed after passing TCE through the apparatus operated at 300°C; the results of this experimental trial were discarded and not used. Consequently, the decontamination method was modified so that the apparatus was disassembled, washed in 45°C soapy water, rinsed with deionized water, and heated in a drying oven at 240°C for at least an hour. No compounds were detected in samples from either the DCM rinse or carrier gas trap collected prior to each subsequent experiment.
Sample Collection and Analyses Variability. At least two samples were collected from the DCM trap, iso-octane rinse, and methyl-tert-butyl ether (MTBE) used to extract compounds from a water rinse of the apparatus. These replicates samples were used to assess the range of compounds in the samples and any variability introduced during sample collection and analysis. Variability was low, less than 10% relative standard deviation (RSD) for all replicates, and less than 5% RSD for select experiments. Given that analytical grade solvents were used in these experiments, the low variability was expected.
Method Performance. Assessing method performance involved adding 1 mL of EPA 8240B/8260A Matrix Spike Mix (Sigma-Aldrich #47412) to the solvent being analyzed (i.e., DCM, iso-octane, or MTBE) and analyzing the matrix spike. The resulting analyses were within 10% of the expected concentrations. This was not unexpected as the matrix used for these experiments were analytical grade solvents.
Storage Blanks. Vials filled with freshly dispensed solvent were stored with each batch. No compounds were detected in any of the storage blanks.
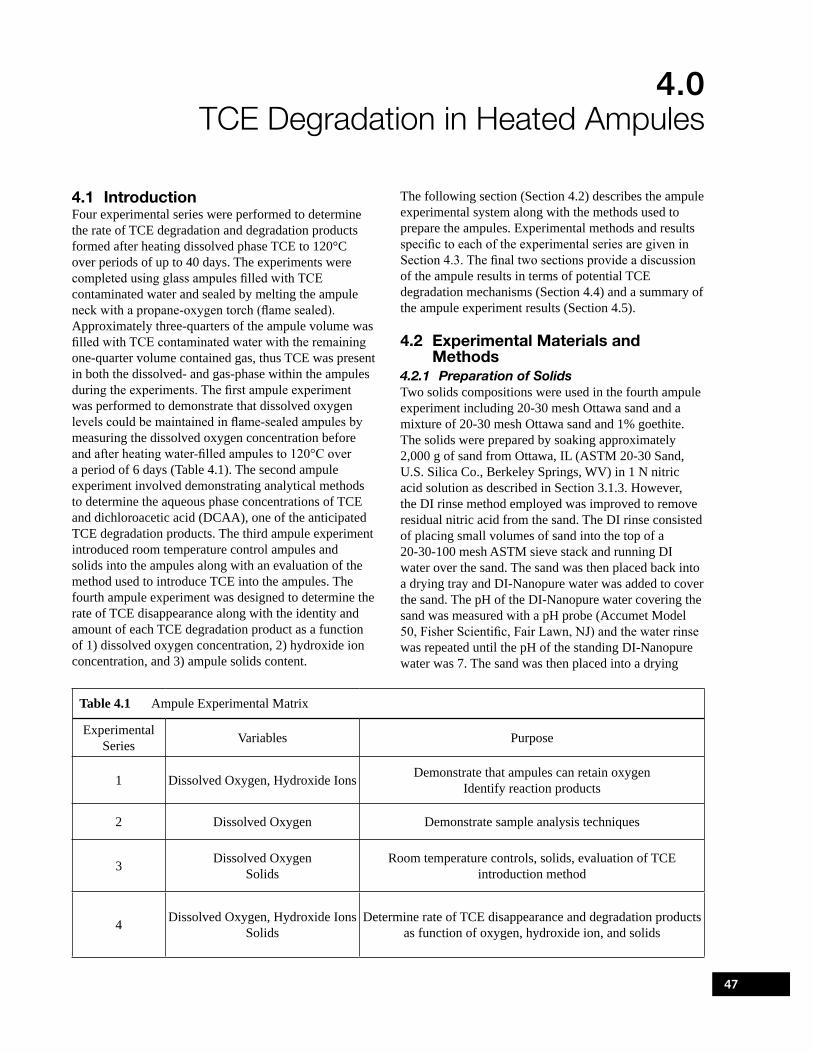
47
4.0TCE Degradation in Heated Ampules
4.1 IntroductionFour experimental series were performed to determine the rate of TCE degradation and degradation products formed after heating dissolved phase TCE to 120°C over periods of up to 40 days. The experiments were completed using glass ampules filled with TCE contaminated water and sealed by melting the ampule neck with a propane-oxygen torch (flame sealed). Approximately three-quarters of the ampule volume was filled with TCE contaminated water with the remaining one-quarter volume contained gas, thus TCE was present in both the dissolved- and gas-phase within the ampules during the experiments. The first ampule experiment was performed to demonstrate that dissolved oxygen levels could be maintained in flame-sealed ampules by measuring the dissolved oxygen concentration before and after heating water-filled ampules to 120°C over a period of 6 days (Table 4.1). The second ampule experiment involved demonstrating analytical methods to determine the aqueous phase concentrations of TCE and dichloroacetic acid (DCAA), one of the anticipated TCE degradation products. The third ampule experiment introduced room temperature control ampules and solids into the ampules along with an evaluation of the method used to introduce TCE into the ampules. The fourth ampule experiment was designed to determine the rate of TCE disappearance along with the identity and amount of each TCE degradation product as a function of 1) dissolved oxygen concentration, 2) hydroxide ion concentration, and 3) ampule solids content.
The following section (Section 4.2) describes the ampule experimental system along with the methods used to prepare the ampules. Experimental methods and results specific to each of the experimental series are given in Section 4.3. The final two sections provide a discussion of the ampule results in terms of potential TCE degradation mechanisms (Section 4.4) and a summary of the ampule experiment results (Section 4.5).
4.2 Experimental Materials and Methods
4.2.1 Preparation of SolidsTwo solids compositions were used in the fourth ampule experiment including 20-30 mesh Ottawa sand and a mixture of 20-30 mesh Ottawa sand and 1% goethite. The solids were prepared by soaking approximately 2,000 g of sand from Ottawa, IL (ASTM 20-30 Sand, U.S. Silica Co., Berkeley Springs, WV) in 1 N nitric acid solution as described in Section 3.1.3. However, the DI rinse method employed was improved to remove residual nitric acid from the sand. The DI rinse consisted of placing small volumes of sand into the top of a 20-30-100 mesh ASTM sieve stack and running DI water over the sand. The sand was then placed back into a drying tray and DI-Nanopure water was added to cover the sand. The pH of the DI-Nanopure water covering the sand was measured with a pH probe (Accumet Model 50, Fisher Scientific, Fair Lawn, NJ) and the water rinse was repeated until the pH of the standing DI-Nanopure water was 7. The sand was then placed into a drying
Table 4.1 Ampule Experimental Matrix
Experimental Series Variables Purpose
1 Dissolved Oxygen, Hydroxide Ions Demonstrate that ampules can retain oxygen Identify reaction products
2 Dissolved Oxygen Demonstrate sample analysis techniques
3 Dissolved Oxygen Solids
Room temperature controls, solids, evaluation of TCE introduction method
4 Dissolved Oxygen, Hydroxide Ions Solids
Determine rate of TCE disappearance and degradation products as function of oxygen, hydroxide ion, and solids

48
oven and heated to 130°C for 3 hours to remove excess moisture and then baked at 200°C for 2 hours. The oven temperature was lowered to 100°C and the sand was allowed to cool for 3 hours.
Approximately 1,000 g of the acid-washed sand was placed into a second glass drying tray to which 10 grams of goethite powder was added to create a uniform 1% (wt) mixture. Research grade goethite chips, approximately 1 gram each, were obtained from Ward’s Natural Science (Rochester, NY), and were reported to have been collected from Grants County, New Mexico. The goethite chips were ground into a fine powder (silt to clay size particles) using a mortar and pestle prior to mixing with the sand. The drying trays were then autoclaved with steam at 17 psi (121°C) for 25 minutes and the water from the autoclave process was allowed to vent from the trays for a period of approximately 30 minutes. Ampules that had been autoclaved and cooled in a desiccator according to procedures outlined in Section 4.1.1 were loaded with approximately 20 grams of either Ottawa sand or Ottawa sand+1% goethite and then sealed with aluminum foil.
4.2.2 Preparation of Aqueous SolutionsAll aqueous solutions were prepared with deionized (DI) water that was freshly dispensed from a Nanopure® analytical deionization system (model D4741, Barnstead International, Dubuque, IA). The Nanopure® system has four inline purification cartridges that produce organic free, Type I reagent grade water in accordance with the specifications provided in the ASTM D1193-99e1, “Standard Specification for Reagent Water.” The DI water was dispensed only after the electrical resistance of the water was greater than 18 MΩ-cm at room temperature (22°C) and through a 0.2 μm pore size filter.
Aqueous solutions with low dissolved oxygen content (<0.3 mg/L), referred to as anoxic water, were prepared prior to each experiment by sparging freshly dispensed DI-Nanopure water with argon gas (Airgas-South, Inc., Marietta, GA) after passing through an oxygen trap (part# 4001, Alltech Associates, Inc., Deerfield, IL). The anoxic water was sparged with argon for at least 1 hour and had a dissolved oxygen concentration between 0.2 and 0.3 mg/L as indicated by the Rhodazine D method (part# K7501, CHEMetrics, Inc., Calverton, VA). Oxygen-saturated water, referred to as oxic water, was prepared by sparging DI-Nanopure water with ultra zero grade air (UZA) (Airgas-South, Inc., Marietta, GA). The oxic water was sparged with UZA for at least 1 hour and had a dissolved oxygen concentration between 8 and 10 mg/L as indicated by the Indigo Carmine method (part# K7512, CHEMetrics, Inc., Calverton, VA). Gas sparging was accomplished by passing the carrier gas through a glass tube fitted with a fritted glass disk that generated small bubbles to enhance gas transfer.
Sparging was completed within a 4 L aspiration carboy that had been autoclaved with 17 psi of steam (121°C) for 25 minutes prior to each use.
Stock solutions of TCE were prepared by transferring either argon- or UZA-sparged DI-Nanopure water from a 4 L carboy (Section 4.1.2) via gravity drainage into 2 L volumetric flasks. The 2 L flasks were prepared prior to use by autoclaving with steam at 17 psi (121°C) for 25 minutes, rinsing with DI-Nanopure water (>18 MΩ/cm), and drying at 200°C for 2 hours. The flasks were allowed to cool to room temperature within the drying oven and were then flushed with argon gas prior to filling with sparged DI-Nanopure water. Argon was used instead of nitrogen due to the greater density of argon, 0.98 g/mL for argon vs. 0.68 g/mL for nitrogen at 25°C (calculated using the ideal gas law), which was thought to minimize the introduction of atmospheric oxygen during anoxic ampule preparation. A Teflon-coated stir bar was placed into each water-filled flask, to which neat TCE was added using a gas-tight syringe. Approximately 1.37 mL of TCE was added to create 1,000 mg/L solutions (1.37 mL×1.46 g/mL÷ 2 L = 1000 mg/L), and 0.14 mL of TCE was added to create 100 mg/L solutions (0.14 ml×1.46 g/mL÷2 L = 102 mg/L). The 2 L flasks were then sealed with glass stoppers and then the stoppers were wrapped with parafilm. The 2 L flasks were wrapped in aluminum foil to minimize exposure to light, and placed on a magnetic stir plate where the contents of each flask were mixed at room temperature for at least 24 hours. The pH 10 stock solution was prepared by adding 10 mL of a NaOH solution (901.4 mg/L) to the 2 L flask containing 100 mg/L of TCE just prior to ampule loading. The resulting NaOH concentration was 0.26 mM in the 2 L volume with 100 mg/L of TCE. American Chemical Society (ACS) certified NaOH obtained from Fisher Scientific (Fair Lawn, NJ) was used to prepare the stock solution.
4.2.3 Preparation of AmpulesThe ampule experiments were conducted in clear, 25 mL (Kimble-Kontes, Vineland, NJ) or 50 mL (Wheaton Science Products, Millville, NJ) borosilicate glass ampules (Figure 4.1). The 25 mL ampules were used for the initial three experimental series and the 50 mL funnel-top ampules were used for the fourth experiment to minimize the amount of carbon monoxide and carbon dioxide (CO/CO2) introduced during the flame sealing process. The ampules were autoclaved with 17 psi of steam (121°C) for 25 minutes, then rinsed with deionized (DI) water (>18 MΩ/cm), and dried in an oven at 200°C for 2 hours. The ampules were then removed from the oven and placed in a glass desiccator that contained approximately 100 grams of indicator drierite (97 % CaSO4 and 3% CoCl2) to maintain water

49
free conditions. For the anoxic and oxic experiments, the desiccator was evacuated to 750 mm Hg of vacuum and then backfilled with either argon gas or ultra zero grade air (UZA), respectively. Each ampule was then flushed with argon or UZA just prior to filling with aqueous solution. Each water-filled ampule was temporarily sealed with aluminum foil until a complete batch of ampules was prepared (~10 minutes). Ampules containing solids were prepared in an identical fashion, but filled with either sand or sand+1% goethite as they were removed from the desiccator.
The ampules were flame sealed using a propane-oxygen torch (BernzOMatic, Medina, NY) that has a maximum flame temperature of approximately 2,500°C. The flame sealing process consisted of heating the ampule neck using the outer portion of the torch flame to vaporize any water droplets present within the neck followed by melting the glass using the inner portion of the torch flame. The flame seal location was approximately 3 cm above the gold band (Figure 4.1) in accordance with Wheaton Science instructions. The vaporization of water required approximately 10 seconds, while melting the glass to form the seal required less than 5 seconds. The sealed ampule was then placed in a rack and allowed to cool to room temperature.
Figure 4.1 Picture of the 50 mL funnel-top ampule before and after sealing.
Each ampule was labeled with a permanent marker to indicate the sequential ampule number, preparation date, and ampule contents. The ampules were then weighed using an analytical balance (Model# AG245,
Mettler-Toledo, Columbus, OH) after checking the balance accuracy with an ASTM E617 class 2 certified traceable 20±0.0001 gram weight (Cat. # 820000.2, Denver Instruments, Denver, CO).
4.2.4 Description of Ampule Experiments4.2.4.1 Ampule Experiment 1The first ampule experiment consisted of filling each of 4, 25 mL ampules with 20 mL of DI-Nanopure water (>18 MΩ-cm), leaving approximately 5 mL of gas headspace in each ampule. Two (2) ampules were filled with nitrogen sparged water with initial dissolved oxygen (DO) concentration of less than 0.5 mg/L (anoxic water) and 2 ampules were filled with ultra zero grade air (UZA) sparged water with initial DO concentration of 8.17 mg/L (oxic water). Approximately 1.4 uL of neat TCE was then injected into each of the 4 ampules through a temporary aluminum film seal to create aqueous solutions containing approximately 100 mg/L of TCE. The ampule with anoxic water and TCE represented the control since Knauss et al. (1999) had found that dissolved oxygen affected the rate of TCE disappearance. Two (2) of the 4 ampules were amended with solid sodium hydroxide (NaOH) chips to adjust the solution pH to approximately 11. No duplicate ampules were prepared in this first ampule experiment. All 4 ampules were flame-sealed and placed in an oven maintained at 120°C for a period of 6 days.
At the end of 6 days the oven was turned off and allowed to cool for 12 hours to room temperature (22°C). The ampules were destructively sampled and the gas-phase CO2 concentrations was determined using a GC (HP 6890) equipped with a gas sampling valve, a Supel-Q PLOT capillary column (Supelco, Bellefonte, PA), and a thermal conductivity detector (TCD). The Supel-Q PLOT column was only capable of separating CO2 from the ampule gas and using this column resulted in a detection limit of 200 ppmv for CO2. The DO concentration of each sample was determined using a membrane-covered voltammetric sensor (YSI 5010 BOD Probe, YSI, Inc. Yellow Springs, OH). Aqueous samples were collected from each ampule and injected into a GC (Varian 3600CX) equipped with a Varian Saturn 2000 mass spectrometer (MS) to analyze for TCE degradation products.
4.2.4.2 Ampule Experiment 2The second ampule experiment consisted of filling each of 8, 25 mL ampules with 20 mL of DI-Nanopure water, leaving approximately 5 mL of gas headspace in each ampule. Four (4) ampules were filled with nitrogen sparged water with initial DO concentration of 0.68 mg/L (anoxic water) as measured using the YSI voltammetric sensor, and 4 ampules were filled with UZA sparged water with initial DO of 9.8 mg/L (oxic water). Approximately 1.4 uL of neat TCE was added to
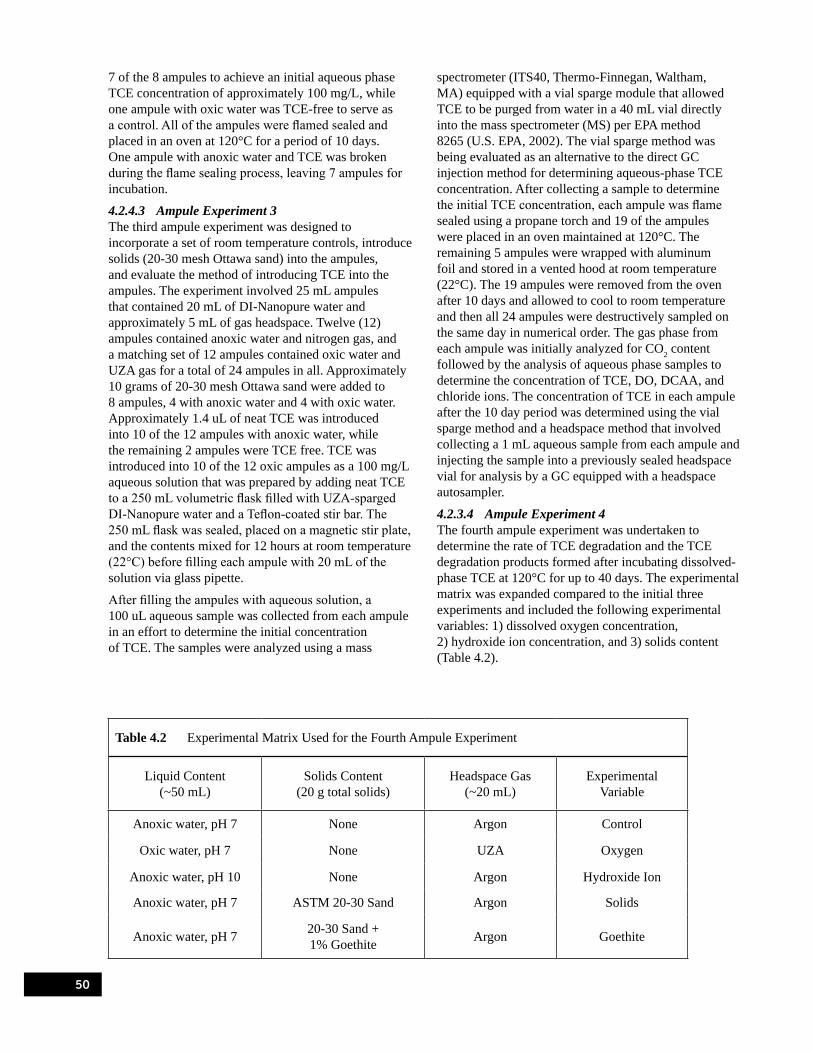
50
7 of the 8 ampules to achieve an initial aqueous phase TCE concentration of approximately 100 mg/L, while one ampule with oxic water was TCE-free to serve as a control. All of the ampules were flamed sealed and placed in an oven at 120°C for a period of 10 days. One ampule with anoxic water and TCE was broken during the flame sealing process, leaving 7 ampules for incubation.
4.2.4.3 Ampule Experiment 3The third ampule experiment was designed to incorporate a set of room temperature controls, introduce solids (20-30 mesh Ottawa sand) into the ampules, and evaluate the method of introducing TCE into the ampules. The experiment involved 25 mL ampules that contained 20 mL of DI-Nanopure water and approximately 5 mL of gas headspace. Twelve (12) ampules contained anoxic water and nitrogen gas, and a matching set of 12 ampules contained oxic water and UZA gas for a total of 24 ampules in all. Approximately 10 grams of 20-30 mesh Ottawa sand were added to 8 ampules, 4 with anoxic water and 4 with oxic water. Approximately 1.4 uL of neat TCE was introduced into 10 of the 12 ampules with anoxic water, while the remaining 2 ampules were TCE free. TCE was introduced into 10 of the 12 oxic ampules as a 100 mg/L aqueous solution that was prepared by adding neat TCE to a 250 mL volumetric flask filled with UZA-sparged DI-Nanopure water and a Teflon-coated stir bar. The 250 mL flask was sealed, placed on a magnetic stir plate, and the contents mixed for 12 hours at room temperature (22°C) before filling each ampule with 20 mL of the solution via glass pipette.
After filling the ampules with aqueous solution, a 100 uL aqueous sample was collected from each ampule in an effort to determine the initial concentration of TCE. The samples were analyzed using a mass
spectrometer (ITS40, Thermo-Finnegan, Waltham, MA) equipped with a vial sparge module that allowed TCE to be purged from water in a 40 mL vial directly into the mass spectrometer (MS) per EPA method 8265 (U.S. EPA, 2002). The vial sparge method was being evaluated as an alternative to the direct GC injection method for determining aqueous-phase TCE concentration. After collecting a sample to determine the initial TCE concentration, each ampule was flame sealed using a propane torch and 19 of the ampules were placed in an oven maintained at 120°C. The remaining 5 ampules were wrapped with aluminum foil and stored in a vented hood at room temperature (22°C). The 19 ampules were removed from the oven after 10 days and allowed to cool to room temperature and then all 24 ampules were destructively sampled on the same day in numerical order. The gas phase from each ampule was initially analyzed for CO2 content followed by the analysis of aqueous phase samples to determine the concentration of TCE, DO, DCAA, and chloride ions. The concentration of TCE in each ampule after the 10 day period was determined using the vial sparge method and a headspace method that involved collecting a 1 mL aqueous sample from each ampule and injecting the sample into a previously sealed headspace vial for analysis by a GC equipped with a headspace autosampler.
4.2.3.4 Ampule Experiment 4The fourth ampule experiment was undertaken to determine the rate of TCE degradation and the TCE degradation products formed after incubating dissolved-phase TCE at 120°C for up to 40 days. The experimental matrix was expanded compared to the initial three experiments and included the following experimental variables: 1) dissolved oxygen concentration, 2) hydroxide ion concentration, and 3) solids content (Table 4.2).
Table 4.2 Experimental Matrix Used for the Fourth Ampule Experiment
Liquid Content (~50 mL)
Solids Content (20 g total solids)
Headspace Gas (~20 mL)
Experimental Variable
Anoxic water, pH 7 None Argon Control
Oxic water, pH 7 None UZA Oxygen
Anoxic water, pH 10 None Argon Hydroxide Ion
Anoxic water, pH 7 ASTM 20-30 Sand Argon Solids
Anoxic water, pH 7 20-30 Sand + 1% Goethite Argon Goethite

51
Of particular note, the solids were expanded to include goethite, a common Fe-containing soil mineral which is known to be chemically reactive. The experimental methods were refined or modified based on the results of the initial three ampule experiments. Several batches of ampules were prepared over a period of two weeks to evaluate the experimental variables listed in Table 4.2. The ampules prepared with TCE were designed to evaluate the rate of TCE degradation and the degradation products formed. Ampules prepared without TCE or solids were intended to determine if CO and CO2 were being introduced during the flame sealing process. Ampules without TCE but with solids were intended to determine the amount of CO2 that could be attributed to the presence of solids. The number of ampules prepared for each experimental batch are listed in Table 4.3.
An initial TCE concentration of 100 mg/L was intended for all experiments, however, a miscalculation led to the preparation of a 1,000 mg/L TCE solution used for the initial 2 batches of ampules (Ampules 1-61), which were added to the experimental matrix. Three (3) additional ampules (Nos. 3a, 6a, and 10a) were prepared in the first batch to replace ampules that had to be re-sealed. These 3 re-sealed ampules were retained to evaluate the effect of exposing the ampule contents to the propane-oxygen flame. Only 6 TCE-free ampules were prepared in the second batch instead of the 18 that were planned since
the 1,000 mg/L TCE concentration was in addition to the planned 100 mg/L concentration. In Batch 6 and 7, one of the TCE-free sand and one of goethite-containing ampules cracked open during preparation and were not replaced. In all, 242 ampules were prepared for the fourth ampule experiment.
The initial concentration of TCE in the ampules was determined by analyzing aqueous samples from 3 of the ampules in each batch just prior to flame sealing (Section 4.5.2). The average initial TCE concentration for Batch 1 was 893±21 mg/L, 878±44 mg/L for Batch 2, 95.2±3.5 mg/L for Batch 3, 85.3±2.5 mg/L for Batch 5, and 77.0±6.4 mg/L for Batch 4 based on the direct GC analysis method as the headspace GC equipment was unavailable. The solids-containing ampules had an average initial TCE concentration of 87.5±3.6 mg/L, as both the Ottawa sand and Ottawa sand+1%goethite ampules (Batches 6 and 7) were prepared using the same anoxic TCE solution. The average initial TCE concentration for the 1,000 mg/L solutions prepared for Batch 1 and 2 was less than 1,000 mg/L, as was the TCE concentration in the 100 mg/L solutions prepared for Batches 3 through 7 (Table 4.4). Thus the 1,000 mg/L and 100 mg/L ampules are in name only (i.e., nominal), with the actual initial concentrations provided in Table 4.4.
Table 4.3 Summary of Ampules Prepared for the Fourth Ampule Experiment
Ampule Batch No.
Number of Ampules Prepared
Nominal Initial TCE
Concentration (mg/L)
Oxygen Content Solids Content Ampule
Numberwith TCE
without TCE
1 21 18 1,000 Anoxic None 1 – 36
2 18 6 1,000 Oxic None 37 – 61
3 18 18 100 Oxic None 62 – 97
4 18 18 100 Anoxic None 98 – 133
5 18 18 100 Anoxic None (pH 10) 134 – 170
6 18 17 100 Anoxic Sand+ 1% Goethite
171 – 188 209 – 225
7 18 18 100 Anoxic Sand 189 – 207 226 – 243

52
After flame-sealing the ampules in each batch, the ampules were divided in half so that 18 ampules (9 with TCE and 9 without TCE) were incubated at 120°C in a convection oven (VWR Model 1320, VWR International, West Chester, PA), while the remaining 18 ampules (9 with TCE and 9 without TCE) were stored at room temperature (22°C) in the dark. The ampules for oven incubation were contained in a 3 L Pyrex glass drying tray that was placed in the convection oven at 120°C where the temperature was measured using a certified traceable thermometer (part# 15-060-223, Fisher Scientific, Fair Lawn, NJ) located within the oven enclosure. The ampules stored at room temperature were placed in a storage rack located inside an insulated container (ice chest) to minimize exposure to light.
Ampules with TCE and without TCE were removed from the oven and room temperature storage at 10 and 20 day intervals for destructive sampling according to the schedule listed in Table 4.4 and 4.5. Four days after placing the solids filled ampules in the convection oven, an explosion occurred that destroyed the 82 ampules being incubated within the oven. The 82 ampules that were stored at room temperature (Table 4.5) were moved to a 4°C chamber to minimize the formation of potentially explosive TCE degradation products.
Following the explosion, the remaining 1,000 mg/L ampules that had been stored at room temperature (Table 4.5) along with the 20-day, 100 mg/L oxic ampules that had been removed from the oven just prior to the explosion were destructively sampled to determine if dichloroacetylene (C2Cl2) had formed. Dichloroacetylene (DCA) is reportedly a spontaneously explosive compound (Urben et al., 1999) and was suspected to have caused the oven explosion. DCA was one of the TCE degradation products detected during the high temperature degradation of TCE in quartz tubes (Wu and Lin, 2004; Kim and Choo, 1983) but was not anticipated to form in the ampules at 120°C with water present. DCA was detected in the gas phase from the 100 mg/L oxic ampules that had been incubated at 120°C in the convection oven and thus the ampule experiment was considered to be an explosion hazard. Butler and Hayes (2001) warn of the possibility of ampules popping or exploding as a result of the buildup of gases such as hydrogen when metals are present in the ampules. As a consequence, an explosion-resistant incubation apparatus was constructed to incubate the 72, 100 mg/L ampules that were being stored in the 4°C chamber.
The explosion-resistant apparatus consisted of a block of aluminum into which 2 inch diameter holes were drilled to accommodate the ampules. The aluminum
Table 4.4 Schedule for Convection Oven Ampule Incubation
Initial TCE Concentration
(mg/L)
Oxygen Content
Batch No. No. of Ampules
10 day No. of Ampules
20 day
No. of Ampules
30 day
No. of Ampules
893±21 Anoxic1 oven exploded
18 [9] 6 [3] 6 [3] 6 [3] Lost
878±44 Oxic2 oven exploded
12 [9] 4 [3] 4 [3] 4 [3] Lost
95.2±3.5 Oxic3 oven exploded
18 [9] 6 [3] 6 [3] 6 [3] Lost
77.0±6.4* Anoxic4 oven exploded oven exploded
18 [9] 6 [3] 6 [3] Lost 6 [3] Lost
85.3±2.5 Anoxic5 oven exploded oven exploded oven exploded
18 [9] 6 [3] Lost 6 [3] Lost 6 [3] Lost
87.5±3.6 Anoxic6 oven exploded oven exploded oven exploded
18 [9] 6 [3] Lost 6 [3] Lost 6 [3] Lost
87.5±3.6 Anoxic7 oven exploded oven exploded oven exploded
18 [9] 6 [3] Lost 6 [3] Lost 6 [3] Lost
*Analyzed using the direct GC injection method, all other ampules by headspace analysis.(#) – Batch number corresponds to Table 4.10.[#] – Number of ampules that contained TCE.

53
Table 4.5 Schedule for Room Temperature Ampule Storage
Initial TCE Concentration
(mg/L)
Oxygen Content
Batch No. No. of Ampules
10 day No. of Ampules
20 day No. of Ampules
30 day No. of Ampules
893±21 Anoxic 121 [12] 8 [5] 7 [4] 6 [3]
878±44 Oxic 212 [9] 4 [3] 4 [3] 4 [3]
95.2±3.5 Oxic 318 [9] 6 [3] 6 [3] 6 [3]
77.0±6.4 Anoxic 418 [9] 6 [3] 6 [3] 6 [3]
85.3±2.5 Anoxic 518 [9] 6 [3] 6 [3] 6 [3]
87.5±3.6 Anoxic 617 [9] 6 [3] 6 [3] 5 [3]
87.5±3.6 Anoxic 718 [9] 6 [3] 6 [3] 6 [3]
(#) – Batch number corresponds to Table 4.3.[#] – Number of ampules that contained TCE.
block was heated using a standard bench top hot plate (Fisher Scientific, Fair Lawn, NJ) and the temperature of the block was determined using a K-type thermocouple connected to a data logger (Model# CR23X, Campbell Scientific, Inc., Logan, UT), which automatically recorded the temperature at 15-minute intervals. As shown in Figure 4.2, the hot plate and aluminum block were located behind a 2 by 2 foot, 1/2 inch thick sheet
of polycarbonate (Part# 8574K57, McMaster-Carr, Atlanta, GA) that served to shield laboratory personnel from exploding ampules. The ampules were manipulated behind the polycarbonate sheet using an 18-inch long pair of metal tongs. In addition, laboratory personnel wore a polycarbonate face shield (Fisher Scientific, Fair Lawn, NJ) when manipulating ampules.
Figure 4.2 Explosion-resistant ampule incubation apparatus.

54
Incubation of the ampules that were stored in the 4°C chamber was done according to the schedule given in Table 4.6. The ampules had been stored in the 4°C chamber for approximately 5 months prior to incubating in the explosion-resistant apparatus. The ampules that contained Ottawa sand+1% goethite (Batch 6) were incubated first with the duration of incubation at 120°C limited to 4 days since the oven explosion occurred 4 days after placing the solids-filled ampules in the oven. The ampules containing pH 10 water (Batch 5) were then incubated over a 4-day period. The ampules with sand (Batch 7) were incubated for 40 days at 120°C after significant levels of DCA had been detected in the pH 10 ampules. The remaining oxic ampules (Batch 3) were then incubated at 120°C for 30 days and the anoxic ampules (Batch 4) for 30 and 41 days. A limited number of ampules from each batch were stored at room temperature including: 4 of the sand+goethite, 4 of the pH 10, 4 of the sand, 2 of the oxic, and 4 of the anoxic ampules.
4.2.4 Ampule Sampling MethodsThe ampule sampling process was initiated by removing the ampules from the oven and placing them in a
darkened vent hood to allow the hot ampules to cool to room temperature. The ampules were then weighed using the same analytical balance used to determine the initial ampule weight. The ampule opening method consisted of inverting the ampule and measuring the distance of the gas-filled space to estimate the volume of gas in each ampule (Step 1, Figure 4.3). The ampule neck was then broken by hand along the pre-scored line (Step 2, Figure 4.3). The water within the ampule body did not drain out since gas could not flow past the water that blocked the ampule opening which was smaller in diameter than the ampule body. The opened ampule was then placed into a custom made sampling collection apparatus that was filled with a stream of argon gas flowing at 100 mL/min to minimize the introduction of oxygen and carbon dioxide during sample collection (Step 4, Figure 4.3). The sample collection apparatus consisted of a 60 mL plastic syringe body that was cut in half with an 18-gauge, 30 cm long stainless steel needle affixed to the syringe body. A 10 mL syringe (Becton Dickinson and Co., Franklin Lakes, NJ) was attached to the 30 cm long needle via a Luer lock connection in an effort to collect a gas sample from the inverted ampule.
Table 4.6 Schedule for Explosion-Resistant Apparatus Ampule Incubation
Ampule Content No. of Ampules Time (days) No. Ampules
Time (days) No. Ampules
Time (days) No. Ampules
Batch 4 No. Ampules
Sand+Goethite
(6)
1 2 3 --
12 [6] 4 [2] 4 [2] 4 [2]
pH 10
(5)
1 2 3 4
14 [7] 4 [2] 4 [2] 4 [2] 2 [1]
Sand
(7)
10 30 40 --
14 [7] 4 [2] 4 [2] 6 [3]
Oxic
(3)
30 -- -- --
3 [2] 3 [2]
Anoxic
(4)
30 41 -- --
8 [4] 4 [2] 4 [2]
(#) – Batch number corresponds to Table 4.10.[#] – Number of ampules that contained TCE.

55
4.2.5 Analytical MethodsThe dissolved oxygen (DO) concentration was determined using a membrane-covered voltammetric sensor (YSI 5010 BOD Probe, YSI, Inc. Yellow Springs, OH) during the initial three experiments. This method required transferring the aqueous phase from each ampule into a second vial that could accommodate the YSI probe body. The dissolved oxygen concentration of ampules in the fourth experiment was determined using the Rhodazine D method (part# K7501, CHEMetrics, Inc., Calverton, VA) for DO between 0 and 1 mg/L or the Indigo Carmine method (part# K7512, CHEMetrics, Inc., Calverton, VA) for DO between 1 and 10 mg/L. The CHEMets method was contained within a self-filling ampule that was inserted into the ampule neck (Step 3, Figure 4.3) to determine the DO concentration while waiting for argon to flush ambient air from the 60 mL syringe body. A 10 mL sample of the gas within the ampule was then collected by slowly retracting the syringe plunger (10 mL in 30 seconds) and allowing the argon gas to bubble through the liquid-filled portion of the ampule and backfill the gas-filled space as the gas sample was being removed. The 10 mL gas sample was analyzed within 60 seconds of collection using a gas chromatograph (HP 6890) equipped with a thermal conductivity detector (TCD). The ampule was then removed from the 60 mL syringe body and placed upright to allow for collection of liquid samples. The water within the ampule was then transferred into a pre-washed 50 mL borosilicate glass vial and sealed with a Teflon® lined septum affixed with an open-top screw cap. The pH of the ampule water was measured in the 50 mL glass vial by placing a DI water rinsed pH probe (Fisher Scientific, Fair Lawn, NJ) into the vial and
waiting approximately 5 minutes before recording the pH value. The vial was then labeled using a permanent marker and stored in a 4°C chamber.
Aqueous phase concentrations of TCE were determined by gas chromatography (GC) using a headspace method and a direct GC injection method. The headspace method consisted of transferring a 1 mL aqueous sample into a 20 mL vial that was sealed with a Teflon-lined, butyl rubber stopper (West Pharmaceutical Services, Inc., Lionville, PA) affixed with an aluminum crimp cap. The headspace vials were placed in an autosampler (HP 7694) that was programmed to heat each sample to 70°C for a period of 15 minutes prior to transferring the headspace gas into an HP 6890 GC for analysis. The GC was equipped with a 30 m x 0.32 mm DB-624 column (Agilent Technologies, Palo Alto, CA) connected to a flame ionization detector (FID). Calibration standards containing 60, 80, and 100 mg/L TCE were analyzed with each experimental sample batch. The calibration standards were prepared by injecting small volumes of 10,000 mg/L TCE methanol stock solution into 100 mL flasks that contained DI-Nanopure water cooled to 4°C. The direct GC injection method involved introducing 1 uL of aqueous solution into a HP 6890 GC equipped with a 990 uL inlet liner, a 30 m x 0.32 mm OD DB-5 column (Agilent Technologies, Palo Alto, CA), and a FID. The inlet was operated at 200°C with a constant helium pressure of 20 psi and a 2:1 split ratio: these inlet parameters served to minimize water vapor back-flash after injecting the 1 uL aqueous sample.
Immediately prior to flame sealing, the initial aqueous-phase concentration of TCE in the ampules was determined by collecting a 1 mL water sample from
Figure 4.3 Illustration of the ampule gas sample collection method.

56
three randomly-selected ampules in each experimental batch of 18 ampules. The TCE concentration measured immediately prior to sealing the ampules was considered to be representative of the initial aqueous phase TCE concentration. Following incubation, the aqueous phase TCE concentrations were determined by collecting 3, 1 mL water samples from each ampule immediately after collecting a 10 mL gas sample. Two (2) of the 3, 1 mL water samples, which contained 1,1,1-trichloroethane as an internal spike, were analyzed by the direct GC injection method and the third 1 mL water sample was analyzed by the headspace method.
The concentrations of formate (CHOO-), glycolate (HOH2C2OO-), sulfate (SO4
2-), and chloride (Cl-) in aqueous phase samples from the ampules were determined using a Dionex DX-100 Ion Chromotograph (IC) equipped with an AS14A IonPac column with 8 mM Na2CO3/1 mM NaHCO3 eluent concentrate flowing at 1 mL/min. Organic acid calibration standards were prepared from 1 M stock solutions in the concentration range from 0.02 to 0.50 mM. Formate and glycolate solutions were prepared from 99% grade solids (glycolic acid and sodium formate, ACROS Organics, Morris Plains, NJ). One limitation of IC analysis is the relatively high detection limit: the average method detection limits for glycolate and formate were 0.86 mg/L and 0.31 mg/L, respectively. The chloride ion content of aqueous samples was determined by IC analysis to allow for comparisons with chloride concentrations measured using the titration method of Bergmann and Sanik (1957). The DO content of water held within the ampule neck was measured immediately after opening using the CHEMets ampules (Step 3, Figure 4.2). The aqueous phase concentration of DCAA was determined using the modified EPA method 552.2.
4.3 Experimental Results4.3.1 Results of Ampule Experiment 1Carbon dioxide (CO2) was detected in the 2 ampules without NaOH, regardless of the initial dissolved oxygen content (Table 4.7). No TCE was detected in water
samples collected from the NaOH amended ampules while TCE was present in the ampules without NaOH. The concentration of TCE was not determined. The absence of CO2 and TCE in the NaOH amended ampules indicated that other TCE degradation products had formed, which was suspected to be dichloroacetic acid (DCAA) based on the past experimental work presented in Section 2.3.2. Additional aqueous phase samples were collected from the NaOH amended ampules and the pH of the samples were adjusted to less than 1 by adding concentrated sulfuric acid. The pH adjustment was performed to convert any organic ions that may have been present from the anionic to the acid form because organic acids can be detected using an ultraviolet (UV) light spectrophotometer. After adjusting the pH of each sample to less than 1, the water samples from the NaOH amended ampules absorbed light at 270 nm in a Varian UV-visible spectrophotometer, which, based on the similarity to work by Mertens and von Sonntag (1994), suggested that DCAA was present.
The first ampule experiment demonstrated that DO levels in the ampules could be maintained with greater than 95% of the initial amount of the DO detected after incubating the sealed ampules for 6 days at 120°C. In addition, the importance of NaOH on the rate of TCE disappearance was demonstrated in that no TCE was detected in NaOH amended ampules after 6 days at 120°C, while TCE was detected in the ampules without NaOH. It was evident that a method to determine the DCAA content of water solutions needed to be developed based on the observation of UV light absorbance in water samples from the NaOH amended ampules. A method to determine the concentration of TCE in water was also found to be necessary in effort to determine if small changes in TCE content were equal to the amount of CO2 detected.
4.3.2 Results of Ampule Experiment 2After cooling to room temperature, the ampules were destructively sampled to determine the amount of CO2 in the gas phase and the concentration of DO, TCE, and DCAA in the aqueous phase. Gas samples from
Table 4.7 Results of the First Ampule Experiment After 6 Days at 120°C
Ampule Contents Initial DO (mg/L) Final DO (mg/L) Final pH CO2 in Gas Phase (uL/L)
Water and TCE <0.5 <0.5 6.74 1032
Water and TCE 8.17 7.8 6.60 1000
Water, TCE, and NaOH <0.5 <0.5 11.24 nd
Water, TCE, and NaOH 8.17 7.9 10.75 nd
nd – below detection limit (~200 uL/L)

57
3 of the 7 ampules were not analyzed because these ampules were damaged during the opening process which resulted in the ampule contents being exposed to ambient air (~500 uL/L CO2) and potentially biasing the amount of CO2 in those samples. The TCE content of the ampule aqueous phase was determined by injecting a 1 uL water sample from each ampule directly into a gas chromatograph (GC) equipped with a flame ionization detector (FID). The DCAA concentration of the ampule water was determined using the modified EPA method 552.2.
The ampules with oxic water had DO at concentrations ranging from approximately 7.5 to 8.6 mg/L after 10 days at 120°C (Table 4.8) as determined using the YSI voltammetric sensor. The similarity between initial and final DO concentrations of the control ampule (9.08 vs. 8.52 mg/L), and minimal changes in ampule weights (≤ 0.0006%) were taken to indicate that the flame-sealed ampules provided a gas-tight environment over the 10-day, 120°C incubation period. For ampules that contained TCE, the pH decreased from 7 to approximately 6.2, and CO2 was detected in the ampules with both anoxic and oxic water. As anticipated, CO2 was not detected in the gas headspace of the TCE-free control ampule. Dichloroacetic acid (DCAA) was detected at concentrations near the method detection limit (~5 ug/L) in 3 of the 7 ampules.
The pH of the TCE-free control ampule increased from 7.15 to 8.19, which was attributed to the thermal enhanced dissolution of silica (SiO2) from the borosilicate glass ampule walls. As SiO2 dissolves into water it forms silicic acid (H4SiO4), which is a weak acid with an initial dissociation constant of pKa = 9.5
(H4SiO4→H3SiO4- + H+) (Stumm and Morgan, 1996).
Thus the dissociation of silicic acid would cause the pH of the solution to increase as SiO2 was dissolved from the ampule walls.
The initial concentration of TCE was not determined using the direct GC injection technique but was in the 95 to 115 mg/L range as estimated based on the mass of TCE added to each ampule and the volume of water in each ampule (Table 4.9). The concentration after incubating the ampules at 120°C for 10 days was determined using the direct GC injection technique and was less than the initial, calculated TCE concentration. The relative standard deviation (%RSD= standard deviation ÷ average × 100) is one measure of the precision associated with an analysis method. A %RSD of less than 15% is considered adequate for determining the concentration of TCE in aqueous samples (U.S. EPA, 1996). The %RSD values shown in Table 4.4 were determined by analyzing three separate water samples collected from each ampule and shows that the direct GC injection method was capable of determining aqueous phase TCE concentration with adequate precision.
There appeared to be a significant reduction in the amount of TCE after 10 days at 120°C based on the results shown in Table 4.9; however, the small amount of CO2 detected and DCAA indicated that the apparent reduction in TCE was due to an overestimation in the initial concentration of TCE. This led to the conclusion that the initial concentration of TCE should be measured rather than estimated and an additional set of ampules should be maintained at room temperature to help in quantifying any temperature induced changes in TCE content.
Table 4.8 Results of Second Ampule Experiment After 10 Days at 120°C
Ampule Contents Initial DO (mg/L)
Final DO (mg/L)
Initial pH Final pH Weight Change
(%) CO2 (uL/L)
Water and TCE* 0.68 na 7.34 na 0.0006 1007
Water and TCE* 0.68 na 7.34 6.1 0.0006 na
Water and TCE 0.68 na 7.34 na 0.0006 na
Water and TCE 9.08 7.5 7.15 6.3 0.0003 na
Water and TCE* 9.08 8.55 7.15 6.47 0.0006 879
Water and TCE 9.08 8.43 7.15 6.16 0.0000 739
Water 9.08 8.52 7.15 8.19 0.0006 nd
DO – dissolved oxygen* DCAA detected in water samples near detection limit of 5 ug/L. na – not analyzed, contents lost after breaking ampule neck nd – not detected, below detection limit of ~200 uL/L

58
4.3.3 Results of Ampule Experiment 3The initial concentration estimated by the mass of TCE added was greater than the concentration determined by the vial sparge method (Table 4.10). The difference between the estimated and measured TCE concentration was thought to be due to non-equilibrium between the neat TCE droplet that was added to each ampule and the ampule water because the sample used to determine the initial TCE concentration was collected within 30 minutes of injecting the neat TCE. The non-equilibrium condition between the neat TCE droplet and ampule water was indicated by the significant difference (P-value=0.01, alpha=0.05) between the initial TCE concentration determined for Ampule 1 (46.9±1.0 mg/L) and for the other identically prepared ampules (69.4±3.8 mg/L for Ampule 2 and 69.4±3.8 mg/L for Ampule 3) even though a similar amount of neat TCE was added to each ampule (2.1, 2.3, and 2.2 mg TCE, respectively). The difference in the initial concentration
between ampules indicated that the neat TCE in Ampule 1 was not completely dissolved into the ampule water at the time when the water sample was collected in an effort to estimate the initial TCE concentration. The concentration of TCE in Ampule 1 measured after 10 days at 120°C increased from 46.9 mg/L to 66.7 mg/L which supports the conclusion that a portion of the neat TCE was not dissolved when the sample used to establish the initial TCE concentration was collected. In addition to the non-equilibrium condition, there must have been a loss of TCE mass after injecting the neat TCE droplet into each ampule since the concentration, as determined by the vial sparge method, was less than the concentration estimated from the mass of TCE added to each ampule. Thus it was concluded that injecting neat TCE to establish an initial mass of TCE was not desirable since estimating the initial concentration of TCE was complicated by the non-equilibrium condition and loss of TCE mass during the loading process.
Table 4.9 Initial and Final TCE Concentrations in the Second Ampule Experiment
Ampule Contents Initial TCE (mg/L)* Final TCE (mg/L)† Relative Standard Deviation (%RSD)
Water and TCE* 110.0 57.9 3.4
Water and TCE* 95.0 66.5 0.5
Water and TCE 105.0 42.9 5.2
Water and TCE 100.0 49.5 0.6
Water and TCE* 100.0 60.2 3.2
Water and TCE 115.0 65.3 4.7
Water not added nd not determined
* Calculated based on the mass of TCE added to each ampule and volume of water in each ampule.† Determined using direct GC injection technique. nd – not detected
Table 4.10 Initial and Final TCE Concentration in Anoxic Ampules from the Third Ampule Experiment (1.4 uL of TCE added to each ampule, Initial DO = 0.79 mg/L)
Contents Temperature (°C)
Initial TCE (mg/L) Final TCE (mg/L)
Estimated Vial Sparge Vial Sparge Headspace
TCE, water120 110±7.1 58.2±15.9 62.4±6.2 61.5±3.7
22 110 77.8 80.6 69.9
TCE, water, sand120 107±7.6 87.9±12.2 62.5±5.1 63.2±5.7
22 110 84.8 80.6 81.2
Error represents one standard deviation calculated from duplicate ampule results.

59
Table 4.11 contains the initial and final concentration of TCE in the ampules filled with oxic water. Here, instead of amending each ampule with 1.4 uL of neat TCE, as done with the ampules filled with anoxic water (Table 4.10), the ampules with oxic water were filled with an aqueous mixture that had been prepared by mixing neat TCE with water at room temperature for a period of 12 hours. The average concentration of TCE in the mixture was 71.7±4.1 with a %RSD of 5.7. This average was calculated based on the analysis of a 100 uL sample collected from each of the 10 ampules after filling with the aqueous TCE mixture, which shows the adequate precision of the vial sparge analysis method and degree of TCE homogeneity in the mixture. The vial sparge method was not used in subsequent experiments since there was no substantial improvement in analysis precision over the direct GC injection or headspace methods and because the vial sparge method was time-consuming due to the manual sample-injection step. TCE was introduced into each ampule in the subsequent experiment as an aqueous solution that was prepared by mixing neat TCE with a 2 L volume of water for 24 hours at room temperature.
The concentration of TCE increased in the ampules with anoxic water from 58.2 to 62.4 mg/L after 10 days at 120°C while it decreased from 87.9 to 62.5 mg/L in ampules that contained Ottawa sand and anoxic water (Table 4.10); however, these changes are in comparison
to the initial TCE concentration which, as described above, did not represent the true initial condition due to non-equilibrium between neat TCE and water. In ampules with oxic water (Table 4.11), there was a significant decrease in TCE concentration (P-value= 0.01, alpha=0.05) from 72.5 to 57.2 mg/L after 10 days at 120°C and from 69.9 to 58.3 mg/L in ampules with sand and oxic water, which may have indicated that TCE was being degraded. However, there was also a decrease in TCE concentration in the matching ampules stored at 22°C where TCE was not expected to degrade over 10 days. No statistical comparison between the 22°C and 120°C results was possible as only one ampule was stored at 22°C for each experimental variable. Thus the variability (the basis for statistical tests) of the TCE concentration in the ampules stored at 22°C was unknown. A matching number of 22°C control ampules were prepared in the subsequent experiment to allow for statistical comparisons between 22°C and 120°C results. If TCE was being degraded in the ampules incubated at 120°C, the rate of disappearance, based on the results shown in Table 4.11, was approximately 1.5 mg/L·day, which meant that 24 days would have been required to degrade 50% of the initial amount of TCE, assuming a zero-order reaction model. The subsequent experiment was extended up to 40 days in effort to observe a greater change in TCE concentration potentially caused by the degradation of TCE.
Table 4.11 Initial and Final TCE Concentration in Oxic Ampules from the Third Ampule Experiment (TCE mixed into 250 mL of water prior to addition to each ampule, Initial DO = 8.22 mg/L)
Contents Temperature (°C)
Initial TCE (mg/L) Final TCE (mg/L)
Vial Sparge Vial Sparge Headspace
TCE, water120 72.5±6.0 57.2±3.6 59.9±1.2
22 73.3 69.1 65.7
TCE, water, sand
120 69.9±3.5 58.3±3.2 64.7±1.3
22 71.4 58.0 66.8
Error represents one standard deviation calculated from duplicate ampule results.
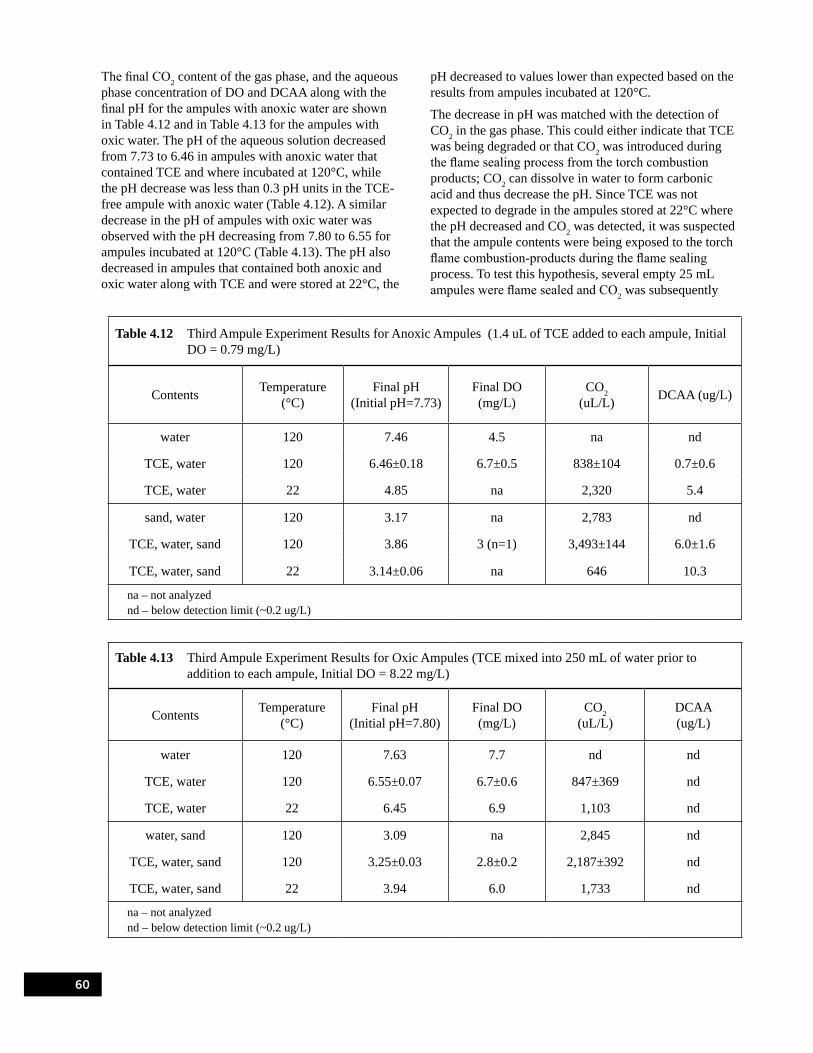
60
The final CO2 content of the gas phase, and the aqueous phase concentration of DO and DCAA along with the final pH for the ampules with anoxic water are shown in Table 4.12 and in Table 4.13 for the ampules with oxic water. The pH of the aqueous solution decreased from 7.73 to 6.46 in ampules with anoxic water that contained TCE and where incubated at 120°C, while the pH decrease was less than 0.3 pH units in the TCE-free ampule with anoxic water (Table 4.12). A similar decrease in the pH of ampules with oxic water was observed with the pH decreasing from 7.80 to 6.55 for ampules incubated at 120°C (Table 4.13). The pH also decreased in ampules that contained both anoxic and oxic water along with TCE and were stored at 22°C, the
pH decreased to values lower than expected based on the results from ampules incubated at 120°C.
The decrease in pH was matched with the detection of CO2 in the gas phase. This could either indicate that TCE was being degraded or that CO2 was introduced during the flame sealing process from the torch combustion products; CO2 can dissolve in water to form carbonic acid and thus decrease the pH. Since TCE was not expected to degrade in the ampules stored at 22°C where the pH decreased and CO2 was detected, it was suspected that the ampule contents were being exposed to the torch flame combustion-products during the flame sealing process. To test this hypothesis, several empty 25 mL ampules were flame sealed and CO2 was subsequently
Table 4.12 Third Ampule Experiment Results for Anoxic Ampules (1.4 uL of TCE added to each ampule, Initial DO = 0.79 mg/L)
Contents Temperature (°C)
Final pH (Initial pH=7.73)
Final DO (mg/L)
CO2 (uL/L) DCAA (ug/L)
water 120 7.46 4.5 na nd
TCE, water 120 6.46±0.18 6.7±0.5 838±104 0.7±0.6
TCE, water 22 4.85 na 2,320 5.4
sand, water 120 3.17 na 2,783 nd
TCE, water, sand 120 3.86 3 (n=1) 3,493±144 6.0±1.6
TCE, water, sand 22 3.14±0.06 na 646 10.3
na – not analyzed nd – below detection limit (~0.2 ug/L)
Table 4.13 Third Ampule Experiment Results for Oxic Ampules (TCE mixed into 250 mL of water prior to addition to each ampule, Initial DO = 8.22 mg/L)
Contents Temperature (°C)
Final pH (Initial pH=7.80)
Final DO (mg/L)
CO2 (uL/L)
DCAA (ug/L)
water 120 7.63 7.7 nd nd
TCE, water 120 6.55±0.07 6.7±0.6 847±369 nd
TCE, water 22 6.45 6.9 1,103 nd
water, sand 120 3.09 na 2,845 nd
TCE, water, sand 120 3.25±0.03 2.8±0.2 2,187±392 nd
TCE, water, sand 22 3.94 6.0 1,733 nd
na – not analyzed nd – below detection limit (~0.2 ug/L)

61
detected in the ampules after destructive sampling. Thus the CO2 detected in the ampules may have been introduced during the flame sealing process and not from the degradation of TCE. This finding prompted the use of “funnel top” ampules in all subsequent experiments, which can be flame sealed without exposing the ampule contents directly to the torch flame.
The pH of the water in the ampules that contained sand decreased from approximately 7.7 to less than 4.0 regardless of TCE content, initial DO concentration, or incubation temperature. It was suspected that the 20-30 mesh Ottawa sand, which had been treated by soaking in a 0.5 N nitric acid solution and then rinsed with DI water, contained residual nitric acid due to an inadequate DI rinse. A separate test was performed by placing 100 grams of the acid treated Ottawa sand in a beaker and adding enough freshly dispensed DI-Nanopure water to cover the sand. The pH of the DI water decreased from 7.7 to 4.2 indicating that the DI rinse after the 0.5 N nitric acid treatment was not sufficient to remove the residual nitric acid. This result prompted additional rinsing procedures for the subsequent experiment that included rinsing the sand until the rinse water was at pH 7.
The chloride content of the water samples was determined using an ion selective electrode (ISE). However, the ISE failed to yield consistent values for the 1 mM chloride solution used to check probe response during measurements. As a result, chloride data are not reported here, and alternative analytical methods that included a colorimetric technique by Bergmann and Sanik (1957) and use of Ion Chromatography as described in Section A.5 were employed in the subsequent experiment. The DO concentration in ampules filled with anoxic water increased from 0.79 to greater than 4.5 (Table 4.12). The DO concentration was determined using the YSI voltammetric sensor that was used in the first and second ampule experiments, which required exposing the sample to air followed by vigorous stirring thus potentially introducing oxygen into the samples. To minimize exposure to oxygen during the measurement process, a colorimetric method (Chemets) for measuring dissolved oxygen was adopted for the subsequent ampule experiment.
4.3.2 Results of Ampule Experiment 4The following sections describe results obtained from 38 ampules that were incubated at 120°C in the convection oven prior to the oven explosion (Table 4.4), 51 ampules incubated at 120°C in the explosion resistant apparatus (Table 4.6), and 67 ampules that were stored at 22°C (Table 4.5). No results were obtained from the convection oven incubation of the pH 10 or the solids-filled ampules (Batch 5, 6 and 7) because these ampules were destroyed in the oven explosion.
The dissolved oxygen data collected from these ampules showed evidence of problems with the analysis. The data could not be used to draw conclusions on TCE reactions, but is presented in Appendix B for completeness.
4.3.2.1 Change in TCE ContentThe average amount of TCE in the 1,000 mg/L (nominal) ampules with time is shown in Table 4.14. The amount of TCE in each ampule was calculated based on the aqueous phase TCE concentration and the estimated gas phase TCE concentration. The gas phase TCE concentration was estimated using Henry’s law (Cg = HCw), assuming equilibrium conditions, with Cw equal to the TCE aqueous phase concentration as determined by GC analysis, and the dimensionless Henry’s Law constant (H) equal to 0.318 at 25°C (Staudinger and Roberts, 1996). The inclusion of TCE in the gas phase accounts for differences in gas phase volume between ampules, which typically represented less than 15% of the total TCE content. These estimates were performed to correct for the differences in the volume of gas (headspace) between ampules that were due to slight differences in the volume of water initially added to each ampule. The amount of TCE (i.e., micro moles or umol) in each ampule was then calculated based on the concentration of TCE and the volume of water and volume of gas in each ampule. The volume of water in each ampule was determined by the difference between the weight of the sealed ampule and the weight of the empty ampule and neck after destructive sampling along with a density of water equal to 0.997 g/mL. The volume of gas in each ampule was estimated based on the length of gas filled space and the ampule diameter that was equal to 3 cm. The amount of TCE in the ampules shown in Table 4.14 is the average along with the standard deviation (i.e., average±S.D.) calculated from the number (n) ampules at each time period.
There was more TCE in the 1,000 mg/L ampules incubated at 120°C than stored at 22°C (Table 4.14), with the exception of the oxic 20-day ampules. However, a paired t-test performed on these data suggest that the difference between the average amount of TCE in the 1,000 mg/L ampules incubated at 120°C and stored at 22°C was not significant (P-Values>0.22, alpha=0.05). Thus there was no apparent change in the TCE content for the 1,000 mg/L ampules. The one exception was Ampule 58 from Batch 2, which had a 50.9% reduction in the amount of TCE after 20 days at 120°C. The result from Ampule 58 was not used in calculating the 20 day average shown in Table 4.14.
The average amount of TCE in the 100 mg/L (nominal) anoxic (Batch 4) and oxic (Batch 3) ampules, based on the amount detected in the aqueous phase and that estimated in the gas phase, is shown in Figure 4.4 as a

62
function of time. There was little change in the amount of TCE in the anoxic ampules (Batch 4) incubated at 120°C or stored at 22°C over the 41 day period. There was no statistical difference (P-Values>0.05, Table 4.15) between the amount of TCE in the anoxic ampules incubated at 120°C and stored at 22°C over 41 days, which supports the claim that there was little change in the amount of TCE in the anoxic ampules.
Figure 4.4 Amount of TCE in the 100 mg/L anoxic (Batch 4) and oxic (Batch 3) ampules stored at 22°C and incubated at 120°C.
In contrast, there was a decrease in the amount of TCE in the oxic ampules that contained 100 mg/L of TCE after 10, 20, and 30 days at 22°C and 120°C (P-Value<0.05) as compared to the initial amount of TCE in Batch 3. There was less TCE in the oxic ampules incubated at 120°C than was present in the ampules stored at room temperature after 10 and 20 days (P-Values<0.05, Table 4.15). These results suggest that the presence of oxygen affected the amount of TCE found in the ampules incubated at 120°C and stored at 22°C.
The average amount of TCE decreased in the anoxic ampules that contained solids (Batches 6 and 7) as a function of time as shown in Figure 4.5. The amount of TCE detected in the ampules that contained either Ottawa sand alone or Ottawa sand+1% goethite and were incubated at 120°C was significantly less (P-Value>0.05) than the amount in the corresponding ampules stored at 22°C (Table 4.16). There was 22.8% less TCE in the ampules with sand after 30 days at 120°C with 20.8% less TCE in the ampules with sand+1%goethite after 4 days at 120°C as compared to the amount in the ampules stored at 22°C. This result indicated that the rate of TCE disappearance was greater in the ampules that contained Ottawa sand+1% goethite as compared to ampules with Ottawa sand alone.
Table 4.14 Amount (Aqueous and Gas Phases) of TCE in 1,000 mg/L (nominal) Anoxic (Batch 1) and Oxic (Batch 2) Ampules
Content DayTotal TCE (umol) P-Value
(120 vs. 22°C) 120°C n 22°C n
Anoxic
Initial TCE (umol) = 368±8
10 202±49* 3 175±49* 3 0.22
20 337±22 2† 276±55 3 0.09
30 Lost 317±12 3 --
Oxic
Initial TCE (umol) = 350±17
10 355±14 3 338±2 3 0.09
20 337±26 2‡ 343±22 3 0.40
30 Lost 342±11 3 --
n – Number of ampules used to calculate average and standard deviation.* TCE by direct GC injection.Lost – Ampules destroyed in oven explosion.† Ampule 7 contents lost during opening.‡ Ampule 58 results excluded due to significant difference in TCE content.

63
Figure 4.5 Amount of TCE in anoxic 100 mg/L ampules with Ottawa sand (Batch 6) and Ottawa sand+1% goethite (Batch 7) stored at 22°C and incubated at 120°C.
The average amount of TCE in the anoxic ampules that contained water amended with NaOH to achieve a pH of 10 (Batch 5) decreased as a function of time as shown in Figure 4.6. There was 10.8% less TCE in the pH 10 ampules after 4 days at 120°C compared to the amount of TCE in the 22°C ampules (Table 4.17).
Table 4.15 Amount (Aqueous and Gas Phases) of TCE in 100 mg/L (nominal) Anoxic (Batch 4) and Oxic (Batch 3) Ampules
Content DayTotal TCE (umol) P-Value
(120 vs. 22°C)120°C n 22°C n
Anoxic Initial TCE (umol) =
31.4±2.6*
10 30.5±2.3 3 32.8±1.6 3 0.1230† 31.3±2.8 2 33.2 1 0.34
41† 30.9±1.7 2 32.5 1 0.29
Oxic Initial TCE (umol) =
39.0±1.0
10 34.8±2.5 3 37.3±1.0 3 0.0620 32.5±0.3 3 35.9±0.6 3 0.0130† 31.3±2.5 2 35.3 1 0.21
n – Number of ampules used to calculate average and standard deviation.* TCE by direct GC injection.† Incubated using the explosion resistant apparatus, all other ampules incubated in convection oven.
Table 4.16 Amount (Aqueous and Gas Phases) of TCE in 100 mg/L (nominal) Anoxic Ampules with Sand (Batch 6) and Sand+1% Goethite (Batch 7)
Content DayTotal TCE (umol) P-Value
(120 vs. 22°C)120°C n 22°C n
Sand Initial TCE (umol)
= 30.6±0.9
10 22.5±0.4 2 0.0420 17.3±0.5 2 0.0430 19.6±2.2 3 25.4±1.0 2 0.01
Sand + 1% Goethite
Initial TCE (umol) = 30.6±0.9
1 25.4±1.7 2 0.35
2 20.6±1.9 2 0.073 25.0±0.5 2 --4 19.8±2.3 2 0.07
n – Number of ampules used to calculate average and standard deviation.

64
Figure 4.6 Amount of TCE in 100 mg/L anoxic ampules amended with NaOH (0.26 mM) to pH 10 (Batch 5) stored at 22°C and incubated at 120°C.
4.3.2.2 Change in pHThe pH of ampules was expected to decrease with the degradation of TCE. Assuming that all the TCE initially present was transformed into CO2 and chloride, then the pH in ampules would have decreased from 7 to approximately 2 based on the initial amount of TCE present in the 1,000 mg/L ampules and from 7 to 3 in ampules with 100 mg/L. The aqueous phase pH of anoxic (Batch 1) and oxic (Batch 2) ampules with 1,000 mg/L (nominal) of TCE are shown in Figure 4.7. The pH decreased in both the anoxic and oxic ampules from 7.0 to 4.34±0.08 (n=2) and 3.65±0.19 (n=2), respectively, after 20 days at 120°C. The pH of the oxic 1,000 mg/L ampules stored at 22°C also decreased, from 7.0 to 4.74±0.35 (n=3) after 20 days but did not substantially decrease after an additional 10 day period. In contrast, the pH of the anoxic 1,000 mg/L ampules stored at 22°C increased from 7.0 to 7.43±0.82 (n=3) after 20 days (Figure 4.7). The pH of the TCE-free anoxic and oxic ampules (controls) increased from 7.0
to 8.45±0.16 (n=12), this average was calculated from the pH of TCE-free ampules after 10, 20, and 30 days at 22°C and 120°C. The pH measurements for the TCE-free controls were from 12 of the 24 ampules that were initially prepared in Batch 1 and 2 (Table 4.4). The pH increase in TCE-free ampules was thought to represent the dissolution of SiO2 from the ampule glass walls as discussed in Section 4.3, whereas the pH decrease in TCE containing ampules was thought to represent the release of hydrogen atoms from TCE molecules due to the degradation of TCE.
Figure 4.7 The pH of anoxic (Batch 1) and oxic (Batch 2) ampules with 1,000 mg/L of TCE and TCE-free controls stored at 22°C and incubated at 120°C.
The aqueous phase pH of anoxic (Batch 4) and oxic (Batch 3) ampules with 100 mg/L (nominal) of TCE are shown in Figure 4.8. The pH of the anoxic (Batch 4) ampules incubated at 120°C decreased from 7.0 to 4.69±0.04 (n=3) after 10 days, to 6.60±0.04 (n=2) after 30 days, and to 6.36±0.08 (n=2) after 40 days. It should be noted that the 30 and 41 day results for
Table 4.17 Amount (Aqueous and Gas Phases) of TCE in 100 mg/L (nominal) Anoxic Ampules Amended with NaOH (0.26 mM) to pH 10 (Batch 5)
Content DayTotal TCE (umol) P-Value
(120 vs. 22°C)120°C n 22°C n
NaOH
Initial TCE (umol) = 35.3±1.0
1 28.5±0.7 2 0.09
2 26.8±1.7 2 0.01
3 24.4±4.1 2 0.07
4 28.0 1 31.4±1.9 2 --
n – Number of ampules used to calculate average and standard deviation.
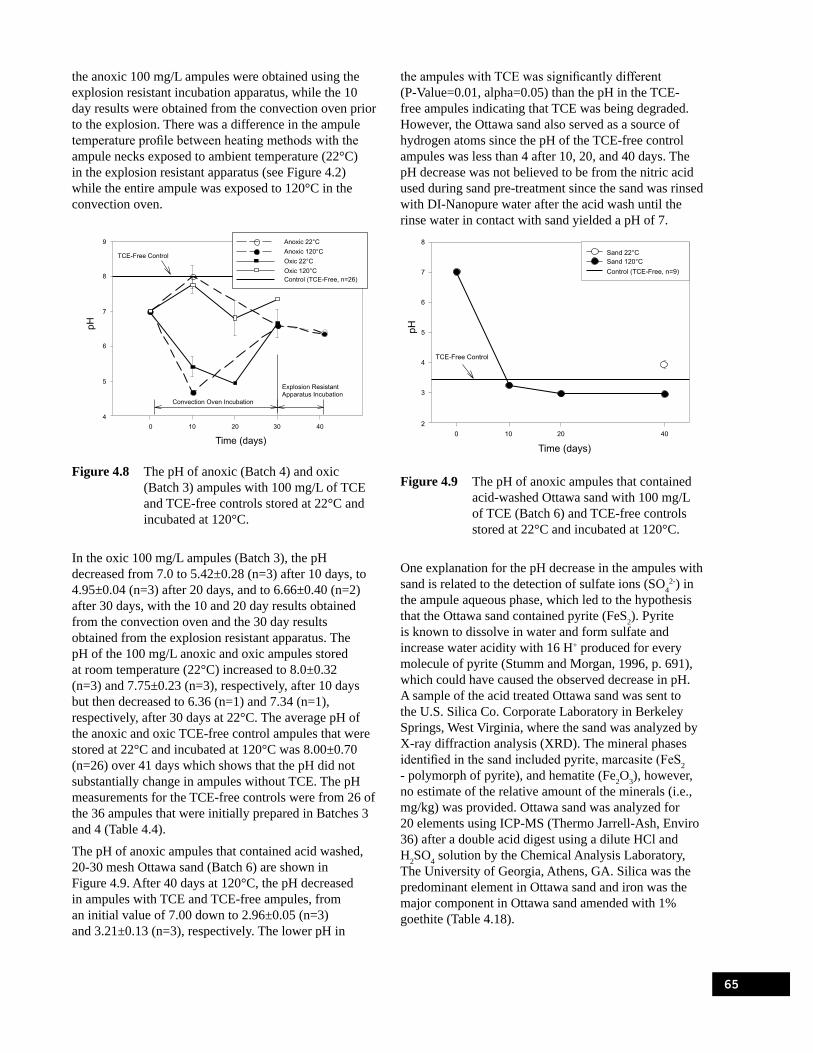
65
the anoxic 100 mg/L ampules were obtained using the explosion resistant incubation apparatus, while the 10 day results were obtained from the convection oven prior to the explosion. There was a difference in the ampule temperature profile between heating methods with the ampule necks exposed to ambient temperature (22°C) in the explosion resistant apparatus (see Figure 4.2) while the entire ampule was exposed to 120°C in the convection oven.
Figure 4.8 The pH of anoxic (Batch 4) and oxic (Batch 3) ampules with 100 mg/L of TCE and TCE-free controls stored at 22°C and incubated at 120°C.
In the oxic 100 mg/L ampules (Batch 3), the pH decreased from 7.0 to 5.42±0.28 (n=3) after 10 days, to 4.95±0.04 (n=3) after 20 days, and to 6.66±0.40 (n=2) after 30 days, with the 10 and 20 day results obtained from the convection oven and the 30 day results obtained from the explosion resistant apparatus. The pH of the 100 mg/L anoxic and oxic ampules stored at room temperature (22°C) increased to 8.0±0.32 (n=3) and 7.75±0.23 (n=3), respectively, after 10 days but then decreased to 6.36 (n=1) and 7.34 (n=1), respectively, after 30 days at 22°C. The average pH of the anoxic and oxic TCE-free control ampules that were stored at 22°C and incubated at 120°C was 8.00±0.70 (n=26) over 41 days which shows that the pH did not substantially change in ampules without TCE. The pH measurements for the TCE-free controls were from 26 of the 36 ampules that were initially prepared in Batches 3 and 4 (Table 4.4).
The pH of anoxic ampules that contained acid washed, 20-30 mesh Ottawa sand (Batch 6) are shown in Figure 4.9. After 40 days at 120°C, the pH decreased in ampules with TCE and TCE-free ampules, from an initial value of 7.00 down to 2.96±0.05 (n=3) and 3.21±0.13 (n=3), respectively. The lower pH in
the ampules with TCE was significantly different (P-Value=0.01, alpha=0.05) than the pH in the TCE-free ampules indicating that TCE was being degraded. However, the Ottawa sand also served as a source of hydrogen atoms since the pH of the TCE-free control ampules was less than 4 after 10, 20, and 40 days. The pH decrease was not believed to be from the nitric acid used during sand pre-treatment since the sand was rinsed with DI-Nanopure water after the acid wash until the rinse water in contact with sand yielded a pH of 7.
Figure 4.9 The pH of anoxic ampules that contained acid-washed Ottawa sand with 100 mg/L of TCE (Batch 6) and TCE-free controls stored at 22°C and incubated at 120°C.
One explanation for the pH decrease in the ampules with sand is related to the detection of sulfate ions (SO4
2-) in the ampule aqueous phase, which led to the hypothesis that the Ottawa sand contained pyrite (FeS2). Pyrite is known to dissolve in water and form sulfate and increase water acidity with 16 H+ produced for every molecule of pyrite (Stumm and Morgan, 1996, p. 691), which could have caused the observed decrease in pH. A sample of the acid treated Ottawa sand was sent to the U.S. Silica Co. Corporate Laboratory in Berkeley Springs, West Virginia, where the sand was analyzed by X-ray diffraction analysis (XRD). The mineral phases identified in the sand included pyrite, marcasite (FeS2 - polymorph of pyrite), and hematite (Fe2O3), however, no estimate of the relative amount of the minerals (i.e., mg/kg) was provided. Ottawa sand was analyzed for 20 elements using ICP-MS (Thermo Jarrell-Ash, Enviro 36) after a double acid digest using a dilute HCl and H2SO4 solution by the Chemical Analysis Laboratory, The University of Georgia, Athens, GA. Silica was the predominant element in Ottawa sand and iron was the major component in Ottawa sand amended with 1% goethite (Table 4.18).

66
Table 4.18 Elements Present in Ottawa Sand and Ottawa sand+1% Goethite
ElementOttawa Sand
(mg/kg)
Ottawa Sand+1%Goethite
(mg/kg)
Silica 4.54 11.31
Calcium 3.96 32.25
Iron 3.23 119.4
Zinc 2.33 4.51
Sodium 2.27 4.64
Aluminum 2.10 3.61
Nickel 1.75 0.14
Magnesium 1.10 2.40
Potassium 0.89 2.46
Assuming all the iron in the Ottawa sand represented FeS2 and that all pyrite present was oxidized to sulfate, then the pH in the ampules would be expected to decrease from 7 to 3.34 in ampules with Ottawa sand based on the following calculations.
3.23 mg Fe
20 g sand kg mmol
Fe ampule 1,000 mL =0.029
mM Fekg ampule 1,000 g 55.84 mg
40 mL water L
16 H+ 0.029 mM Fe = 0.46 mM H+
Fe ampule
pH = -log[0.46×10⁻³ M + 1×10⁻⁷ M] = 3.34
Transformation of the sulfur in pyrite and marcasite into sulfate requires a source of dissolved oxygen or ferric iron (Fe3+) (Stumm and Morgan, 1996). While no measurement for ferric iron was performed, the hematite identified in the Ottawa sand may have served as a source of ferric iron and thus accounts for the detection of sulfate in the anoxic ampules.
Another source of acidity was the CO2 found after incubating ampules amended with Ottawa sand (Section 4.3.2.4). Assuming that gas phase CO2 was in equilibrium with the ampule water at 25°C and using
a value of 0.0339 M/atm for the Henry’s coefficient between CO2(g) and dissolved phase CO2(aq), which is assumed to transform into carbonic acid (H2CO3), results in a decrease from pH 7 to approximately 4 in the ampules with Ottawa sand. Thus there are at least two potential sources of acidity in the Ottawa sand that could account for the observed decrease in ampule pH.
The pH of anoxic ampules that contained acid-washed Ottawa sand+1% goethite (Batch 7) is shown in Figure 4.10. The pH decreased from 7.00 to 3.64±0.05 (n=2) in ampules with 100 mg/L of TCE after 4 days at 120°C and to 4.44±0.18 after 3 days at 22°C. The pH in TCE-free ampules stored at 22°C and incubated at 120°C decreased to 4.79±0.35 (n=8). The pH of the anoxic ampules that contained water amended with NaOH to achieve an initial pH of 10 (Batch 5) is shown in Figure 4.11. At 120°C, the pH of NaOH-amended ampules that contained 100 mg/L of TCE decreased from 10.0 to 7.06 (n=1) after 4 days. In contrast, the pH of the TCE-free control ampules remained at 9.03±0.11 (n=9) and the ampules with 100 mg/L TCE were at pH of 9.37±0.04 (n=2) after 4 days at 22°C (Figure 4.11).
Figure 4.10 The pH of anoxic ampules that contained acid-washed Ottawa sand+1%goethite with 100 mg/L of TCE (Batch 7) and TCE-free controls stored at 22°C and incubated at 120°C.

67
Figure 4.11 The pH of anoxic ampules amended with NaOH (0.26 mM) to pH 10 and 100 mg/L of TCE (Batch 5) along with TCE-free controls stored at 22°C and incubated at 120°C.
4.3.2.3 CO and CO2 in the Gas PhaseA 10 mL gas sample was collected from each ampule using a gas-tight syringe and approximately 6 mL of the gas sample was analyzed by a GC/TCD equipped with a Carboxen 1010 capillary column capable of separating CO and CO2 from the ampule gas samples. Carbon monoxide (CO) and CO2 were anticipated TCE degradation products based on the past experimental work presented in Section 2.3.2. The amount (umol) of CO and CO2 in each ampule was calculated based on the gas-phase concentration determined for CO and CO2, and the estimated volume of headspace gas in each flame-sealed ampule. The amount of CO2 reported does not include the amount of CO2 dissolved in the aqueous phase, which was expected to be substantial given the Henry’s law coefficient of 0.83 M(aq)/M(g) for 25°C (Stumm and Morgan, 1996, p. 214). Using the average gas volume of 20 mL and liquid volume of 45 mL for the ampules shows that the amount of dissolved CO2 is expected to be 1.7 times greater than the amount in the gas phase. The additional amount of dissolved CO2 was incorporated in calculating the rate of TCE degradation based on the rate of carbon products formed (Table 4.22).
The amounts of CO and CO2 in ampules that initially contained 1,000 mg/L of TCE (Batch 1 and 2) and were incubated at 120°C are shown in Figure 4.12. The CO and CO2 content of the ampules increased during the 120°C incubation period, with nearly identical amounts of CO and CO2 detected in all of the
ampules after 10 days regardless of the initial oxygen content (anoxic or oxic). After 20 days of incubation at 120°C, the amount of CO and CO2 detected in the oxic ampules nearly doubled, while the amount detected in the anoxic ampules remained similar to the 10-day incubation values. The average amount of CO and CO2 shown in Figure 4.12 excludes the amount detected in Ampules 9, 55, and 58, which were incubated at 120°C. In the case of Ampule 9, an anoxic ampule with 1,000 mg/L of TCE from Batch 1, there was a significant difference (P-Value=0.02, alpha=0.05) between the amount of CO and CO2 detected after 20 days (CO+CO2 = 12,386 ppmv) compared to the amount detected in the companion replicate ampules, Ampules 7 and 8 (2,057±387 ppmv). There was a significant difference (P-Value=0.06, alpha=0.05) between the amount of CO and CO2 detected after 10 days in Ampule 55 (4,250 ppmv) and in replicate Ampules 53 and 54 (1,983±419 ppmv), oxic ampules with 1,000 mg/L of TCE from Batch 2. In this case, Ampule 55 had to be flame sealed a second time during preparation thus the ampule contents may have been exposed to the propane-oxygen flame. The greatest difference between replicate Batch 2 ampules was obtained after 20 days for Ampule 58 (123,143 ppmv) and Ampules 56 and 57 (4,515±304 ppmv).
Figure 4.12 Amounts of CO and CO2 in anoxic (Batch 1) and oxic (Batch 2) ampules with 1,000 mg/L of TCE and incubated at 120°C.
The amounts of CO and CO2 detected in anoxic (Batch 4) and oxic (Batch 3) ampules that initially contained 100 mg/L of TCE and were incubated at 120°C for up to 41 days are shown in Figure 4.13. Carbon monoxide (CO) and CO2 were not detected in ampules stored at 22°C that contained 100 mg/L of TCE and were without TCE (TCE-free). Carbon

68
monoxide (CO) was detected in ampules that contained TCE and were incubated at 120°C using the convection oven, whereas CO wasn’t detected in ampules using the explosion resistant apparatus until 41 days at 120°C. This result may indicate that the difference in temperature profile between the two incubation systems led to differences in TCE degradation rate.
Figure 4.13 Amounts of CO and CO2 in anoxic (Batch 4) and oxic (Batch 3) ampules with 100 mg/L of TCE and incubated at 120°C. No CO or CO2 was detected in ampules stored at 22°C.
The amounts of CO and CO2 detected in anoxic ampules that contained 20-30 mesh Ottawa sand (Batch 6) are shown in Figure 4.14. The average amount of CO detected (0.97±0.08 umol) in ampules that contained TCE and were incubated at 120°C over a 40-day period was approximately twice the amount detected in the ampules stored at 22°C for 40 days. Carbon monoxide (CO) was not detected in ampules without TCE that were stored at 22°C and incubated at 120°C. For the ampules incubated at 120°C, the amount of CO2 increased with incubation time, with amount of CO2 detected in ampules with TCE in excess of the amount of CO2 detected in ampules without TCE.
Figure 4.14 Amounts of CO and CO2 in anoxic ampules with Ottawa sand and 100 mg/L of TCE (Batch 6) stored at 22°C and incubated at 120°C.
The amounts of CO and CO2 detected in anoxic ampules that contained 20-30 mesh Ottawa sand + 1% goethite (Batch 7) are shown in Figure 4.15. The amount of CO increased during incubation over 4 days at 120°C. In contrast, no CO was detected in TCE-free ampules that were stored at 22°C. At 120°C, the amount of CO2 increased with incubation time in excess of the amount of CO2 detected in the TCE-free ampules. Relative the data shown in Figure 4.14, the amount of CO2 generated in the presence of 1% goethite was greater than detected in ampules that contained Ottawa sand alone. Figure 4.16 shows the amount of CO and CO2 detected in the ampules that contained 0.26 mM of NaOH. The amount of CO increased over the initial 2 days of the incubation period at 120°C and then decreased over the last 2 days. No CO was detected in the ampules without TCE at 120°C and with TCE that were stored at 22°C. The amount of CO2 increased with incubation time until reaching a plateau of approximately 0.8 umol on day 3 and 4.

69
Figure 4.15 Amounts of CO and CO2 in anoxic ampules with Ottawa sand+1%goethite and 100 mg/L of TCE (Batch 7) stored at 22°C and incubated at 120°C.
Figure 4.16 Amounts of CO and CO2 in anoxic ampules amended with NaOH (0.26 mM) to pH 10 (Batch 5) and 100 mg/L of TCE incubated at 120°C.
4.3.2.4 Other Gas Phase CompoundsAfter analyzing 6 mL of the 10 mL gas sample for CO/CO2 content, the 10 mL syringe with 4 mL of gas sample was removed from the GC/TCD injection loop and the syringe needle tip was sealed with a rubber septum. Approximately 1 mL of the gas sample was then injected directly into the inlet of a Varian 3600CX GC equipped with a 30 m long by 0.32 mm OD Varian CP-Sil 8MS column connected to a Varian Saturn 2000 mass spectrometer (MS). The purpose of injecting the gas sample directly into the GC/MS was to screen for the presence of compounds other than CO, CO2, and TCE. This analysis step was added after the oven explosion had occurred to determine if potentially explosive TCE degradation products were present in the ampule gas
phase. The first gas samples analyzed by GC/MS were from Ampules 83, 84, and 85 (Batch 3), oxic ampules that contained 100 mg/L of TCE and had been incubated at 120°C for 20 days in the convection oven. The gas samples were found to contain dichloroacetylene (DCA), CO2, and TCE. Dichloroacetylene was identified by mass spectrum match with the NIST98 library (Figure 4.17).
Figure 4.17 Mass spectrum of the 2.05 min chromatogram peak from the analysis of 1 mL of gas from Ampule 83.
The concentration of DCA was not determined, as this compound is unstable and difficult to prepare for calibration purposes. The abundance of dichloroacetylene was less than 1% of the TCE present (base peak). Dichloroacetylene (DCA) was not present in the gas samples from Ampules 95, 96, and 97, the matching 100 mg/L oxic ampules that were stored at 22°C. Dichloroacetlylene (DCA) was consistently identified in gas samples from ampules that were incubated at 120°C for Batch 3 through 7, no gas samples from Batch 1 or 2 ampules were analyzed by GC/MS. The greatest amount of DCA was detected in the gas phase of the pH 10 ampules (Batch 5) by GC/MS analysis. An unidentified peak was present in the headspace GC/FID chromatogram from the analysis of 1 mL water samples collected from the pH 10 ampules. The identity of the GC/FID peak was assigned to DCA based on the GC/MS results and the estimated dissolved phase DCA concentration was 1.8±0.5 mg/L for the pH 10 ampules incubated at 120°C, estimated using the headspace response factor for TCE.
4.3.2.5 Aqueous Phase CompoundsThe amount of chloride detected in both anoxic and oxic ampules incubated at 120°C increased for all

70
experimental conditions considered and in excess of the amount measured in paired ampules stored at 22°C (Figures 4.18 through 4.22). Thus increasing the temperature of ampules resulted in an increase in the rate of TCE degradation since TCE was the only source of chloride within the ampules. The presence of oxygen appeared to have an affect on the amount of TCE degraded in the 1,000 mg/L ampules (Batches 1 and 2) as there was a greater amount of chloride (P-Value=0.001, alpha=0.05) in the 1,000 mg/L ampules with oxygen after 10 and 20 days at 120°C (Figure 4.18). However, there was no discernable difference (P-Value=0.66, alpha=0.05) between the amount of chloride in the anoxic (Batch 4) and oxic (Batch 3) ampules with 100 mg/L of TCE after 10 and 30 days at 120°C (Figure 4.19). The amount of chloride detected in the 100 mg/L oxic (Batch 3) ampules increased from 7.6±1.3 umol after 10 days to 9.9±0.6 umol after 20 days at 120°C using the convection oven incubation but was 6.0±0.1 umol after 30 days using the explosion resistant apparatus. There was a similar trend for chloride in the anoxic 100 mg/L ampules with more chloride detected after 10 days in the convection oven that after 30 and 41 days in the explosion resistant apparatus.
Figure 4.18 Amount of chloride in anoxic (Batch 1) and oxic (Batch 2) ampules with 1,000 mg/L of TCE stored at 22°C and incubated at 120°C.
Figure 4.19 Amount of chloride in anoxic (Batch 4) and oxic (Batch 3) ampules with 100 mg/L of TCE stored at 22°C and incubated at 120°C.
The presence of 20-30 mesh Ottawa sand (Batch 6) caused an increase in the amount of chloride (Figure 4.20) in ampules incubated at 120°C compared to the amount of chloride in the anoxic (Batch 4) ampules that were without sand (Figure 4.19); both batches were incubated in the explosion resistant apparatus. There was 13.8±1.9 umol of chloride detected in the anoxic ampules that contained 20-30 mesh Ottawa sand after 30 days at 120°C as compared to 6.3±0.0 umol of chloride in the ampules with anoxic water alone.
Figure 4.20 Amount of chloride in anoxic ampules with Ottawa sand and 100 mg/L of TCE (Batch 6) stored at 22°C and incubated at 120°C.

71
The addition of goethite to the Ottawa sand resulted in 6.8±1.7 umol of chloride (Figure 4.21) after 4 days at 120°C while the amount of chloride in the pH 10 ampules was 13.8 umol (n=1) after 4 days at 120°C (Figure 4.22).
Aqueous samples collected from the ampules were analyzed for haloacetic acids content, including chloroacetate (ClH2C2OO-), dichloroacetate (Cl2HC2OO-), and trichloroacetate (Cl3C2OO-). While dichloroacetate (DCAA) was not detected (>2 ug/L) in any of the ampules containing 100 mg/L of TCE (Batches 3-7), DCAA was detected in several of the ampules containing 1,000 mg/L of TCE (Batch 1 and 2). In 3 of the anoxic ampules, DCAA was detected at the following concentrations: 16 ug/L after 10 days at 22°C, 7 ug/L after 20 days at 120°C, and 6.1 ug/L after 30 days at 22°C. The one exception was the 125 ug/L of DCAA detected in Ampule 9, the 1,000 mg/L anoxic ampule that also had more CO and CO2 than in its companion replicate ampules. DCAA was detected in all of the oxic ampules with 1,000 mg/L of TCE (Batch 2), with the largest DCAA concentration detected in ampules that were stored at 22°C (Figure 4.23). DCAA was detected in the ampules that contained solids (Batch 6 and 7), but at relatively low concentrations (i.e., < 5 ug/L). Chloroacetate was detected in pH 10 ampules that were incubated at 120°C (Figure 4.24), whereas the chloroacetate concentration in the pH 10 ampules stored at 22°C were less that 5 ug/L.
Figure 4.21 Amount of chloride in anoxic ampules with Ottawa sand+1%goethite and 100 mg/L TCE (Batch 7) stored at 22°C and incubated at 120°C.
Figure 4.22 Amount of chloride in anoxic ampules amended with NaOH (0.26 mM) to pH 10 with 100 mg/L of TCE (Batch 5) stored at 22°C and incubated at 120°C.
Figure 4.23 Concentration of dichloroacetate (DCAA) in the anoxic (Batch 1) and oxic (Batch 2) ampules with 1,000 mg/L of TCE stored at 22°C and incubated at 120°C.
Figure 4.24 Concentration of chloroacetate in ampules amended with NaOH (0.26 mM) to pH 10 and 100 mg/L TCE (Batch 5) incubated at 120°C.

72
The aqueous solution that remained after the haloacetic acid and chloride analysis (~5 mL) was analyzed by Ion Chromatography (IC) to determine if other anionic species were present. The IC chromatogram contained three elution peaks with retention times of 3.35, 3.73, and 4.75 minutes. The 4.75 minute peak was attributed to chloride based on comparison with the elution time for a 1 mM chloride standard solution. The 3.35 and 3.73 minute peaks were attributed to formate (CHOO-) and to glycolate (HOH2C2OO-), respectively, based on comparison with elution times for a solution containing 1 mM of glycolate, acetate, and formate. Glycolate and formate were detected in all ampules that contained 1,000 mg/L of TCE (Batch 1 and 2) and were incubated at 120°C (Figure 4.25). The average values shown in Figure 4.25 do not include the results from Ampules 9, 55, and 58 as the results from these ampules were significantly different from the other ampules as discussed in Section 4.6.4. The amount of formate increased with time at 120°C in the oxic and anoxic ampules that contained 1,000 mg/L of TCE while the amount of glycolate decreased with incubation time. There was more glycolate than formate after 10 days in all the 1,000 mg/L ampules, while there was more formate than glycolate after 20 days. Glycolate and formate were not detected in ampules stored at 22°C that contained 1,000 mg/L of TCE or in the TCE-free control ampules.
Figure 4.25 Amount of glycolate and formate in anoxic (Batch 1) and oxic (Batch 2) ampules with 1,000 mg/L of TCE incubated at 120°C.
Glycolate and formate were detected in both the anoxic (Batch 4) and oxic (Batch 3) ampules that contained 100 mg/L of TCE and were incubated at 120°C (Figure 4.26). Formate was not detected in either the anoxic or oxic ampules with 100 mg/L of TCE after 30 days at 120°C. However, it should be noted that the 30 and 40 day results for the anoxic ampules were obtained using the explosion resistant incubation
apparatus, whereas the 10 and 20 day results for the oxic ampules were obtained using the convection oven. Glycolate and formate were not detected in the anoxic and oxic ampules that contained 100 mg/L of TCE and were stored at 22°C or in the TCE-free control ampules.
The amount of formate detected in the anoxic ampules that contained 20-30 mesh Ottawa sand and 100 mg/L of TCE (Batch 6) decreased with time at 120°C, while the amount of glycolate increased over the 40-day incubation period (Figure 4.27). Formate was the only organic acid detected in the ampules that contained Ottawa sand + 1% goethite (Batch 7) and the amount of formate increased over the 4-day incubation period at 120°C (Figure 4.28).
Figure 4.26 Amount of glycolate and formate in anoxic (Batch 4) and oxic (Batch 3) ampules with 100 mg/L of TCE incubated at 120°C.
Figure 4.27 Amount of glycolate and formate in anoxic ampules with Ottawa sand and 100 mg/L of TCE (Batch 6) stored at 22°C and incubated at 120°C.

73
Figure 4.28 Amount of formate in anoxic ampules with Ottawa sand+1%goethite and 100 mg/L of TCE (Batch 7) stored at 22°C and incubated at 120°C.
Sulfate (SO42-) was an additional anion detected in
ampules that contained solids. The amount of sulfate detected in anoxic ampules with 20-30 mesh Ottawa sand that were stored at 22°C and incubated at 120°C is shown in Figure 4.29. Sulfate was present at aqueous phase concentrations of greater than 1 mM and is hypothesized to have been formed from the thermal decomposition of pyrite and marcasite (FeS2), which were found to be present in the 20-30 mesh Ottawa sand (Dr. Matt Paige, facsimile communication, 30 August 2004) as discussed in Section 4.6.2. Similar amounts of sulfate were detected in ampules that contained goethite in addition to 20-30 mesh Ottawa sand (data not shown).
Glycolate was the only organic acid detected in the 100 mg/L ampules with NaOH (Batch 5) that were incubated at 120°C as shown in Figure 4.30.
Figure 4.29 Amount of sulfate in anoxic ampules with Ottawa sand and 100 mg/L of TCE (Batch 6) stored at 22°C and incubated at 120°C.
Figure 4.30 Amount of glycolate in anoxic ampules amended with NaOH (0.26 mM) to pH 10 and with 100 mg/L of TCE (Batch 5) incubated at 120°C.

74
4.3.2.6 Mass BalanceA balance between the loss of TCE and the moles of carbon and chloride detected in ampules incubated at 120°C is provided in Table 4.19. The moles of TCE lost were determined by subtracting the moles of TCE detected after each 120°C incubation period from the initial moles of TCE as determined immediately prior to flame sealing the ampules. The moles of carbon lost were calculated as twice the moles of TCE lost (2×TCE lost) and the moles of chlorine lost as three times the moles of TCE lost (3×TCE lost). The mass balance is a unitless ratio of the moles of TCE lost divided by the moles of degradation products detected with a value of 1 indicating an ideal balance between what was lost and what was found. A value of less than zero corresponds to
a gain in the moles of TCE present in the ampule.
The results shown in Table 4.19 indicate that more TCE was lost than could be accounted for by the moles of carbon detected in the gas phase as CO and CO2, and in the aqueous phase as formate, glycolate, and haloacetic acids (i.e., mass balance > 1). There was also more TCE lost than could be accounted for by the moles of chlorine detected in the aqueous phase as chloride. The failure to achieve mass balance could be attributed to the following explanations: 1) more organic compounds were present than were detected, 2) experimental error occurred during the analysis of TCE, and/or degradation products, or 3) losses occurred during the sample collection process, in particular volatile degradation products.
Table 4.19 Mass Balance Between Carbon and Chloride Lost as TCE and Detected as Degradation Products in Ampules Incubated at 120°C
Ampule Content (Batch No.)
Incubation Time (days) C lost/C detected Cl lost/Cl detected
Anoxic 1000 mg/L TCE
(1)
10 6.4±13.0 6.9±14.4
20 3.7±2.7 2.9±0.6
Oxic 1000 mg/L TCE
(2)
10 -2.5±5.2 -1.0±4.1
20 2.7±4.4 2.4±3.1
Oxic 100 mg/L TCE
(3)
10 1.9±1.1 1.8±1.220 1.8±0.0 2.0±0.230 2.5±0.7 3.9±1.2
Anoxic 100 mg/L TCE
(4)
10 0.4±1.0 0.3±0.830 0.1±0.9 0.1±1.341 0.2±0.5 0.2±0.8
Ottawa Sand 100 mg/L TCE
(6)
10 1.2±1.6 1.0±1.230 2.3±1.4 1.9±2.240 1.6±2.5 1.4±2.4
Ottawa Sand + 1% Goethite
100 mg/L TCE (7)
1 -0.2±1.8 -0.4±2.02 2.0±2.2 3.2±2.0
4 1.8±2.5 2.7±2.4
pH 10 100 mg/L TCE
(5)
1 2.5±0.2 3.5±0.32 1.7±0.2 1.9±0.3
3 2.1±1.2 2.6±1.84 1.4 (n=1) 1.4 (n=1)

75
The ratio of the TCE degradation products—moles of chloride divided by the moles of carbon as CO, CO2, formate and glycolate—provides another measure to determine if all degradation products were detected and has the advantage of being independent of the TCE analysis. The ideal ratio of chlorine to carbon (Cl:C), assuming TCE is the only parent compound, is
1.5 (3Cl:2C). The values for Cl:C shown in Table 4.20 are all close to 1.5, suggesting that the compounds detected represent the majority of the TCE degradation products. Therefore, the poor overall mass balance results shown in Table 4.19 most likely reflect losses in TCE during sample collection and analysis.
Table 4.20 Amount of Carbon and Chloride Detected as Degradation Products and the Cl:C Ratio for Ampules Incubated at 120°C
Ampule Content (Batch No.)
Incubation Time (days) C detected (umol) Cl detected (umol) Cl:C
Anoxic 1000 mg/L TCE
(1)
10 6.5±0.3 5.6±0.3 0.9±0.1
20 6.0±0.7 13.0±1.5 2.2±0.3
Oxic 1000 mg/L TCE
(2)
10 5.3±1.7 9.5±0.3 1.8±0.6
20 9.0±2.0 21.1±6.3 2.3±0.9
Oxic 100 mg/L TCE
(3)
10 4.5±0.5 7.7±1.3 1.7±0.220 7.3±1.0 9.9±0.6 1.4±0.130 6.1±0.2 6.0±0.1 1.0±0.0
Anoxic 100 mg/L TCE
(4)
10 4.7±0.6 8.3±1.1 1.8±0.230 6.6±1.0 6.3±0.0 1.0±0.141 7.1±0.1 6.6±0.4 0.9±0.1
Ottawa Sand 100 mg/L TCE
(6)
10 5.2±1.2 8.8±0.4 1.7±0.430 7.1±0.8 13.1±1.9 1.8±0.340 7.3±0.8 12.7±0.6 1.7±0.2
Ottawa Sand + 1% Goethite
100 mg/L TCE (7)
1 3.3±0.5 2.7±0.9 0.8±0.32 4.5±1.1 4.3±0.6 1.0±0.34 5.9±0.8 6.0±0.3 1.0±0.1
pH 10 100 mg/L TCE
(5)
1 5.5±0.1 5.8±0.1 1.1±0.02 9.8±0.7 13.6±0.7 1.4±0.1
3 11.1±2.0 14.2±4.8 1.3±0.54 10.1 (n=1) 16.2 (n=1) 1.6
* Corrected for the moles of carbon found in paired ampules without TCE
76
4.4 DiscussionThe primary objectives of the ampule experiments were to determine the rate of TCE degradation and the TCE degradation products formed after exposing dissolved-phase TCE to temperatures of 22 and 120°C for periods of up to 40 days. The primary gas phase degradation products observed in these experiments were CO and CO2 (>99%), while the primary aqueous phase products included chloride, hydronium ions, glycolate, and formate (>99%). The following sections provide a discussion of possible TCE degradation initiation mechanisms, including oxygen addition to TCE and hydrogen elimination from TCE. A reaction sequence is presented to explain the oven explosion, and a separate section provides comparisons between the ampule experimental results obtained herein and those of Knauss et al. (1999).
4.4.1 Oxygen Initiated TCE DegradationBased on the review of thermal reaction experiments presented in Sections 2.3.1, passing pure oxygen through liquid TCE-NAPL heated to 70°C is known to yield hydrochloric acid (HCl), carbon monoxide (CO), and phosgene (COCl2) as gas phase products, and TCE epoxide (Cl2COCHCl) and dichloroacetyl chloride (Cl2HC2OCl) as NAPL products. This reaction can be stated as (McKinney et al., 1955):
Cl2C=CHCl + O2(g) 70 C → HCl(g) + CO(g) +
COCl2(g) + Cl2COCHCl + Cl2HC2OCl (4.1)
McKinney et al. (1955) obtained these results after adding benzoyl peroxide or partially-oxidized TCE to liquid TCE-NAPL and Kucher et al. (1990) observed the same reaction products after adding azo-bis-isobutyronitrile (AIBN) to liquid TCE-NAPL. Benzoyl peroxide and AIBN are known to produce radical initiator compounds upon heating to temperatures greater than 70°C (Fossey et al., 1995). The reaction between TCE and oxygen is thought to involve a radical chain reaction mechanism (Kaberdin and Potkin, 1994). No radical initiator compounds were added to the ampule experiments. However, it is possible that partially-oxidized TCE was generated during the flame sealing process. The radical initiation mechanism for the aqueous oxidation of TCE is unknown and was not determined in the experiments herein.
If the reaction products including HCl, phosgene, dichloroacetyl chloride, and TCE epoxide shown in Equation 4.1 were to form in the presence of an aqueous phase, they would likely undergo subsequent degradation reactions as discussed in Section 2.3.2. Hydrochloric acid gas would generate hydronium and chloride ions in the aqueous phase. Phosgene would undergo hydrolysis to form CO2 according to Mertens and von Sonntag (1994):
COCl2(g) 2H O,25 C →
CO2 + 2HCl (4.2) k = 6 (s-1) at 25°C
Dichloroacetyl chloride would be expected to undergo hydrolysis to form dichloroacetate (Cl2HC2OO-) (Kivinen, 1972). TCE epoxide has been synthesized and the hydrolysis products included CO in the gas phase, and formate, dichloroacetate, and oxoacetate (HOC2OO-) in the aqueous phase (Cai and Guengerich, 1999). Dichloroacetate (DCAA) is a stable end-product at room temperature, as indicated by its detection in the oxic ampules that contained 1,000 mg/L of TCE and were stored at 22°C (see Figure 4.24). As discussed in Section 2.3.2, Prager et al. (2001) demonstrated that DCAA is rapidly (t1/2 = 0.14 day or 3.4 hrs) hydrolyzed to oxoacetate (HOC2OO-) at 120°C according to:
Cl2HC2OO- 2H O,120 C →
HOC2OO- + 2HCl (4.3)
Oxoacetate was not detected in any of the ampules incubated at 120°C. Prager et al. (2001) suggest that glycolate (HOH2C2OO-) and oxalate (HOOC2OO-) were likely products from the aqueous phase thermal degradation of oxoactetate. While oxalate was not detected, glycolate and formate (CHOO-), two closely related organic acids, were found in the ampule aqueous phase and are thought to be the products of DCAA degradation in the ampule experiments reported herein. Decarboxylation of glycolate (HOH2C2OO-) is thought to form CO2 and formaldehyde (CH2O) according to Belsky et al. (1999):
HOH2C2OO- + H+→ CH2O + CO2 + H2 (4.4)
Formaldehyde would then be hydrolyzed to formate (CHOO-) and hydroxide ions (OH-) according to:
CH2O + H2O → CHOO- + OH- + 2H+ (4.5)
Formate was suggested as a stable end-product below temperatures of 150°C by Shende and Mahajani (1997). However, any one of these organic acids could be present during the thermal remediation process as they have been cited as the end products after thermal treatment of organic compounds by wet air oxidation (Mishra et al., 1995) and supercritical water oxidation (Buhler et al. 2002).
Dichloroacetyl chloride, TCE epoxide, and phosgene were not detected in the aqueous or gas phase samples collected from the ampules incubated at 120°C in the experiments reported herein. While the exact mechanism of oxygen initiated TCE degradation is not known (Kaberdin and Potkin, 1994), phosgene, TCE epoxide, and dichloroacetyl chloride are proposed as intermediates that were hydrolyzed to form HCl, CO,

77
CO2, dichloroacetate, glycolate, and formate within the ampule reaction environment.
4.4.2 Hydrogen Elimination Initiated TCE Degradation
An alternative to the oxygen-initiated TCE degradation mechanism presented above is based on the belief that the lone hydrogen atom in TCE has an acid character and is susceptible to elimination by strong nucleophiles such as hydroxide ions (OH-) (Smith and March, 2001). For example, passing gas-phase TCE over potassium or sodium hydroxide (NaOH) at 130°C has long been known to degrade TCE to yield dichloroacetylene (DCA) (Delavarenne and Viehe, 1969). Pielichowski and Popielarz (1984) reported a 70% yield of DCA after adding TCE to a NaOH solution heated to 70°C. The elimination of the acidic hydrogen from TCE has been proposed to form an unstable intermediate, a trichlorovinyl anion (Cl3C2
-), which reacts spontaneously to form DCA (C2Cl2) after loss of a chlorine atom (Pielichowski and Popielarz, 1984) according to:
Cl2C=CHCl + OH- 120 C→
[Cl2C=CCl-] 120 C→
ClC≡CCl + Cl- + H2O (4.6)
DCA was identified in all gas phase samples collected from ampules that contained TCE and were incubated at 120°C, whereas DCA was not detected in ampules with TCE that were stored at 22°C. Thus the TCE degradation observed in the ampules was suspected to have involved hydrogen elimination based on the presence of DCA.
The addition of NaOH to the ampules resulted in an increase in the rate of TCE degraded along with an increase in the amount of DCA detected, as compared to the results from the deionized water ampules, which was consistent with the proposed hydrogen-elimination initiation mechanism. In ampules with deionized water, the elimination of the lone TCE hydrogen atom may have been initiated by water or hydroxide ions (10-7 M). Increasing the ampule temperature from 22°C to 120°C would have increased the hydroxide ion concentration from 10-7 to 10-6 M (Marshall and Frank, 1981) and increased the interaction between TCE and water molecules by lowering the water dielectric strength. An increase in hydroxide ion concentration would be expected to increase the rate of hydrogen elimination from TCE and the increase in TCE and water interaction may have allowed the electrophilic oxygen atom in water to act as a nucleophile and eliminate the TCE hydrogen. However, the mode of hydrogen elimination from TCE in deionized water is not currently known.
The addition of goethite to the ampules that contained anoxic water and sand increased the rate of TCE degradation. While the TCE degradation mechanism with goethite is unknown, chloroacetylene (HC2Cl), a
compound closely related to DCA, has been detected during the degradation of chloroethenes by zero valent iron (Arnold and Roberts, 2000). Where zero valent iron (Fe0) is thought to serve as an electron donor (Fe0 → Fe2+ + 2e-) during the reductive dechlorination of TCE, goethite is not expected to serve as an electron source since the iron in goethite is oxidized (Fe3+). Instead, goethite may serve as a source of hydroxide ions through a dissolution reaction:
FeOOH + H2O → Fe3+ + 3OH- (4.7)
The dissolution of goethite would be expected to increase the ampule pH with the formation of hydroxide ions, however, the pH in ampules with goethite decreased over the 4 day incubation period (Figure 4.10). Using pH to indicate the presence of hydroxide ions may not be accurate since pH is the hydronium ion concentration in the bulk ampule solution rather than at the goethite-water interface and because the pH measurement was performed after cooling the ampules to room temperature (22°C).
Chloroacetylene has also been detected during TCE degradation by zero valent zinc (Arnold and Roberts, 1998) and vitamin B12 (Burris et al., 1996). Dichloroacetylene, in addition to chloroacetylene, have been detected during the sonolysis of TCE contaminated water (Drijvers et al., 1996). The presence of chloroacetylenes under this range of reaction conditions suggests that the elimination of hydrogen is an important reaction pathway for the degradation of TCE. The degradation of the chloroacetylenes intermediates is equally important because acetylenes can engage in a wide variety of reactions (Hopf and Witulski, 1995).
Dichloroacetylene (DCA) is known to react explosively with oxygen to form CO, CO2, and phosgene (COCl2) (Ott et al., 1930), but is also stabilized against oxygen in the presence of excess TCE (Williams, 1972; Reichert et al., 1975). Aqueous solutions of DCA have been prepared at concentrations up to 70 mg/L and are reported to be stable over a period of 24 hours at room temperature (Reichert et al., 1983; Arnold and Roberts, 1998). There are also reports of DCA spontaneously igniting upon mixing with water (Ott and Packendroff, 1931; Riemschneider and Klaus, 1961). While DCA is known to react with oxygen, the amount of oxygen present in the ampules did not decline over the experimental period (see Table 4.18, excluding Ampule 58). DCA was detected in the oxic ampules with 100 mg/L of TCE and was most likely stabilized by the excess amount of TCE present. Therefore, DCA is hypothesized to have been stabilized against reacting with the oxygen in the oxic ampules.
Acetylene is known to react with water in both the aqueous and gas phase to form acetaldehyde, which

78
hydrolyzes to form acetate (Nieuwland and Vogt, 1945). The addition of water to acetylene is rate limited and requires acidic conditions along with elevated temperature (Lucchini and Modena, 1990). The pH decrease in ampules that were incubated at 120°C (Section 4.6.2) may have provided the acidic and temperature conditions necessary to cause the hydrolysis of DCA and produce chloroacetyl chloride (ClH2C2OCl), the analog of acetaldehyde, according to:
ClC≡CCl + H3O+ 120 C→
ClH2C2OCl + H+ (4.8)
Chloroacetyl chloride could then have reacted with water to form chloroacetate (ClH2C2OO-). For example, chloroacetate is the reaction product formed when passing TCE through heated concentrated sulfuric acid (Kaberdin and Potkin, 1994). Chloroacetate was detected in the pH 10 ampules which also had the greatest concentration of DCA. Chloroacetate is known to react with water (i.e., hydrolyze) to form glycolate (Prager et al., 2001), and glycolate was detected in the pH 10 ampules. Therefore, DCA could have been hydrolyzed to DCAA, which was then degraded at 120°C (Equation 4.3) to the non-chlorinated organic acids, glycolate and formate, observed in the ampules that were not amended with NaOH. However, since DCA is reactive and could potentially interact or react with soil constituents such as organic carbon, DCA formed during the in-situ thermal treatment of TCE could degrade to form non-chlorinated organic acids.
4.4.3 Oven ExplosionThe oven explosion is hypothesized to have been caused by the detonation of DCA in at least one ampule. Reichert et al. (1975) showed that DCA is stable in the presence of excess TCE, however, once the ratio of DCA to TCE exceeds 1:2, a spontaneous reaction occurs with oxygen. The explosion occurred 4 days after introducing the sand, sand+1% goethite, and pH 10 ampules into the oven, and 20 days after incubation of the 1,000 and 100 mg/L ampules began. The explosion scenario involves the formation of DCA in many ampules and in excess of TCE in at least one ampule. Some event then occurred to initiate the rapid DCA decomposition resulting in the detonation of at least one ampule and the force from that one ampule exploding is thought to have caused the other ampules to break open and release additional DCA into the air resulting in an explosion that destroyed the oven.
Goethite was initially suspected of having caused the formation of DCA in an amount in excess of TCE. However, the goethite ampules contained argon sparged water and argon gas, meaning that the oxygen content was limited to approximately 3 umol. The reaction of 3 umol of DCA with oxygen to yield CO, CO2, and
phosgene would have released approximately 1.4 J of energy based on the heats of reaction (Zhu and Bozzelli, 2002) which is estimated to result in a 1 bar pressure increase within an ampule. The ampules have a rated pressure capacity of approximately 14 bar, thus the estimated 1 bar pressure increase in the ampules with goethite would be insufficient to cause an ampule to break open. In addition to the goethite ampules, there were ampules with 1,000 mg/L of TCE that contained air sparged water with air in the headspace and had been in the oven for 24 days. There was approximately 100 umol of oxygen in these oxic ampules and a reaction with DCA would have released approximately 48 J of energy or an estimated pressure increase of 47 bar, about three times greater than the rated pressure capacity of the ampules.
A significant amount of DCA could have been generated in the sand+1% goethite or pH 10 ampules, rendering these ampules potentially explosive. However, the amount of oxygen present in these ampules was limited to less than 3 umol making it unlikely that they initiated the oven explosion. The 1,000 mg/L oxic ampules that had been incubating for a period of 24 days at 120°C are more likely to have initiated the explosion due to the presence of approximately 100 umol of oxygen.
4.4.4 Comparison to Knauss et al. (1999) Results
The in-situ transformation of TCE to CO2 and chloride ions has been claimed to occur during the thermal treatment of subsurface environments contaminated with TCE according to researchers working in the Applied Geology and Geophysics Group at the U.S. Department of Energy, Lawrence Livermore National Laboratory (LLNL). The LLNL group based their claim on experimental results obtained by measuring the disappearance of dissolved-phase TCE along with the appearance of dissolved phase CO2 and chloride ions. The experiments were completed over a period of up to 43 days within a heated, constant pressure, gold-walled reactor that was completely water filled (Knauss et al., 1999). The ampule experiment reported herein was conducted, in part, to independently evaluate the conclusions reached by the LLNL group.
The results of the gold-walled experiments conducted by Knauss et al. (1999) were significantly different than those reported herein. TCE concentrations decreased to 50% of the initial concentration within 2 days in the gold-walled reactor operated at 90°C. In contrast, approximately 80.2% of the initial amount of TCE (Table 4.15) remained after 30 days of incubation at 120°C in the oxic ampules. Knauss et al. (1999) stated that chloride and carbonate were the only TCE degradation products detected in the gold-walled experiment. The primary compounds detected in the

79
ampule experiments included CO and CO2 in the gas phase, chloride, hydronium, glycolate, and formate in the aqueous phase. Knauss et al. (1999) analyzed the aqueous phase from their gold-walled reactors using a direct infrared spectroscopic method and a high pressure liquid chromatograph (HP 1090) connected to a conductivity detector. Details regarding operation conditions for these methods were not provided, but if chloride were detected then organic acids, such as glycolate and formate, should have been detected if present. However, Gu and Siegrist (1997) reported that the liquid chromatography method had a detection limit of 50 mg/L for glycolate, which is at least twice the initial concentration of TCE used by Knauss et al. (1999). Therefore, organic acids may have formed in the Knauss et al., (1999) experiments, but may have been well below detection limit of the analytical method.
The difference in experimental results between these two studies may also be associated with the differences in reactor wall materials. While the gold-walled reactor is supposedly chemically “inert” (Seyfried et al., 1979), gold powder has also been used as a catalyst to increase the rate of reactions. The glass ampules used herein may not be entirely chemically “inert” either. The use of the 2,500°C flame to seal the ampule may have generated radical species that caused an increase in the rate of TCE degradation. For example, there was a 50.9% reduction in the amount of TCE in Ampule 58 along with a consumption of dissolved oxygen and a reduction in the amount of gas phase oxygen by an estimated 50%. The half-life for TCE degradation in Ampule 58 was approximately 20 days, similar to the disappearance rate reported by Knauss et al. (1999) for an initial TCE concentration of 1,000 mg/L.
There were other significant differences between the Knauss et al. (1999) gold-walled experiment and the ampule experiment reported herein. The gold-walled experiment used a completely water-filled reactor under a pressure of 10 bar. The ampule experiments were completed in glass ampules that were partially filled with water at a pressure of approximately 1.4 bar at 120°C. The gold-walled experiment involved measuring the concentration of TCE in a single gold-walled vessel every day over a period of days. The ampule experiment used destructive sampling of individually prepared ampules after incubation periods to determine the TCE degradation products.
Due to these differences, a direct comparison regarding the rate of TCE degradation determined by Knauss et al. (1999) and the results reported herein is not possible. However, the results of both studies can be used to conclude that TCE can be degraded in sealed containers incubated at elevated temperatures for up to 40 days.
4.5 SummaryThe results obtained from the four ampule experiments demonstrate that TCE was degraded within sealed glass ampules that contained gas, water, and solids. The rates of TCE degradation in ampules with anoxic water, both with and without sand, and in oxic water were similar at 120°C. The degradation rate in ampules with anoxic water and sand was increased by adding goethite at 120°C. The primary TCE degradation products included CO and CO2 in the gas phase and chloride, hydronium ions, formate, glycolate in the aqueous phase, which represented less than 15% of the initial amount of TCE initially present when incubated at 22 and 120°C for periods of up to 40 days. Minor amounts (<1 mg/L) of dichloroacetic acid (DCAA) were detected in select ampules, most consistently in ampules that were stored at 22°C and initially contained 1,000 mg/L TCE along with oxygen. Dichloroacetylene (DCA) was detected in minor amounts (i.e., DCA < 1% of TCE) in ampules that contained TCE and were incubated at 120°C.
Dichlororacetylene, in addition to being a TCE degradation product, was also thought to represent a key intermediate. The presence of DCA is proposed to indicate that the lone hydrogen atom in TCE was being eliminated by nucleophiles, such as sodium hydroxide, which increased the rate of TCE degradation and amount of DCA when added to the ampules as NaOH. Dichloroacetylene was proposed to be hydrolyzed to form chlorinated organic acids, such as DCAA, which were then hydrolyzed at 120°C to form the non-chlorinated organic acids, glycolate and formate. However, DCA is a reactive compound that can interact with the variety of compounds present in soil such as organic carbon. Therefore, the degradation products formed during the in-situ treatment of TCE may not be limited to those found in the ampule experiments reported herein.
From a practical perspective, these findings suggest that abiotic TCE degradation during thermal treatment may vary considerably depending on site conditions and operational variables, but it is likely that gas phase recovery of TCE will be the most important process in thermal remediation at temperatures up to 120°C. Additional laboratory-scale studies and treatability tests with a range of soils and soil constituents are warranted to further elucidate factors controlling abiotic TCE reaction pathways, byproduct formation, and reaction rates. Field samples should also be analyzed to determine if significant concentrations of byproducts are formed during in situ thermal remediation.

80
4.6 Quality Assurance Summary for the Ampule Experiments
These experiments involved placing water with dissolved phase TCE into glass ampules that were flame sealed and incubated at 22 and 120°C for up to 40 days. The quality assurance efforts for these experiments focused on:
Assessing system cleanliness (clean controls) 1. Estimating the variability between ampules 2. (replicate ampules) Demonstrating analysis method performance 3. relative to water (matrix spike) Determining if contaminants were introduced during 4. sample storage (storage blanks)
Ampule Cleanliness. Immediately before use, ampules were rinsed with Nanopure deionized (DI) water, autoclaved at 121°C for 20 minutes followed by DI water rinse before being dried in an oven at 240°C for at least 2 hours. Ampules with DI water and gas alone were prepared to evaluate the compounds formed in ampules without TCE. These clean controls also served to determine if compounds (e.g., O2 and CO2) were being introduced during sample collection and analysis. No compounds were detected in the ampules filled with DI water and gas alone. Therefore, the ampules were initially clean and no compounds were introduced during sample collection or analyses.
Variability. Replicate samples were not collected due to the limited volume of gas and DI water within each ampule. Instead, variability was assessed by preparing 3 replicate ampules and collecting one sample from each ampule phase. This approach provided a measure of the experimental variability which was thought to be more important than the analytical variability measured by replicate samples. Experimental variability was low for these experiments, less than 15% RSD in all cases and less than 5% RSD for most results. This was expected as efforts were employed to mix solutions and solids before loading into ampules. Also, care was taken to collect and analyze samples using consistent methods and procedures.
An explosion occurred during the incubation of ampules which limited the number of replicate ampules to 2 and eliminated replicates in one case (NaOH ampules, day 4 incubation). While this limited the ability to assess experimental variability, it did not preclude an estimate of variability and thus had limited impact on the overall experimental objectives.
Method Performance. Analytical method performance was determined using solutions spiked with compounds obtained from commercial sources. For example, chloride standards were prepared from a certified reference solution with the same DI water source used to fill the ampules. Method performance during analysis
of each sample batch was evaluated using the spiked solutions and solutions that were free of compounds (blanks). In all cases, method performance was within 5% of the expected response for spiked solutions and no compounds were detected in method blanks.
Storage Blanks. Vials with DI water were prepared and stored with each sample batch. No compounds were detected in any storage blanks. No storage blanks were prepared for the gas samples as they were analyzed immediately after collection.
81
5.0References
Addink, R., M. Antonioli, K. Olie, and H.A. Govers. Reactions of dibenzofuran and 1,2,3,4,7,8 - hexachlorodibenzo-p-dioxin on municipal waste incinerator fly ash. Environ. Sci. Technol. 30 (3): 833-836 (1996).
Amama, P.B., K. Itoh, and M. Murabayashi. Photocatalytic oxidation of trichloroethylene in humidified atmosphere. J. Mol. Catalysis A: Chem. 176: 165-172 (2001).
Agency for Toxic Substances and Disease Registry (ATSDR). Toxicological Profile for Trichloroethylene, ATSDR, Division of Toxicology/Toxicology Information Branch, Atlanta, GA, 1997.
Arnold, W.A. and A.L. Roberts. Pathways of chlorinated ethylene and chlorinated acetylene reaction with Zn(0). Environ. Sci. Technol. 32(19): 3017-3025 (1998).
Arnold, W.A. and A.L. Roberts. Pathways and kinetics of chlorinated ethylene and chlorinated acetylene reaction with Fe(0) particles. Environ. Sci. Technol. 34(9): 1794-1805 (2000).
Atkins, P.W. Physical Chemistry, 6th Edition, W.H. Freeman and Co., New York, NY, 1998.
Atwater, J.E., J.R. Akse, J.A. McKinnis, and J.O. Thompson. Aqueous phase heterogeneous catalytic oxidation of trichloroethylene. Appl. Catalysis B: Environ. 11(1): L11-L18 (1996).
Baker, R.S. and M. Kuhlman. “A description of the mechanisms of in-situ thermal destruction (ISTD) reactions.” Presented at the 2nd International Conf. on Oxidation and Reduction Technologies for Soil and Groundwater, ORTs-2, Toronto, Ontario, Canada, November 17-21, 2002. Available at: www.terratherm.com.
Baulch, D.L., J. Duxbury, S.J. Grant, and D.C. Montaque. Evaluated kinetic data for high-temperature reactions, Vol. 4. Homogeneous gas-phase reactions of halogen-containing and cyanide-containing species. J. Phys. Chem. Ref. Data 10: 1-721, Supplement 1 (1981).
Belsky, A.J., P.G. Maiella, and T.B. Brill. Spectroscopy of hydrothermal reactions 13. Kinetics and mechanisms of decarboxylation of acetic acid derivatives at 100-260°C under 275 bar. J. Phys. Chem. A 103 (21): 4253-4260 (1999).
Bergmann, J.G. and J.Sanik, Jr. Determination of trace amounts of chloride in naptha. Anal. Chem. 29 (2): 241-243 (1957).
Beyke, G. and D. Fleming. In situ thermal remediation of DNAPL and LNAPL using electrical resistance heating. Remediation Summer, 5-22 (2005).
Bridgeman, O.C. and E.W. Aldrich. Vapor pressure tables for water. J. Heat Trans. 86: 279-286 (1964).
Brown, R.F. “Pyrolytic Methods in Organic Chemistry.” Academic Press, New York, NY, 1980.
Buhler, W., E. Dinjus, H.J. Ederer, and A. Kruse. Ionic reactions and pyrolysis of glycerol as competing reaction pathways in near- and supercritical water. J. Supercritical Fluids 22: 37-53 (2002).
Burris, D.R., C.A. Belcomyn, M.H. Smith, and A.L. Roberts. Reductive dechlorination of tetrachloroethylene and trichloroethylene catalyzed by vitamin B12 in homogeneous and heterogeneous systems. Environ. Sci. Technol. 30(10): 3047-3052 (1996).
Burt, E.E. and A.H. Rau. The determination of the level of bicarbonate, carbonate, or carbon dioxide in aqueous solutions. Drug Develop. Industrial Pharm. 20(19): 2955-2964 (1994).
Butler, E.C. and K.F. Hayes. Factors influencing rates and products in the transformation of trichloroethylene by iron sulfide and iron metal. Environ. Sci. Technol. 35: 3884-3891 (2001).
Buxton, G. V., C.L. Greenstock, W.P. Helman, and A.B. Ross. Critical-review of rate constants for reactions of hydrated electrins, hydrogen-atoms and hydroxyl radicals (.OH/.O-) in aqueous-solutions. J. Phys. Chem. Ref. Data 17(2): 513-886 (1988).
Cai, H. and F. P. Guengerich. Mechanism of aqueous decomposition of trichloroethylene oxide. J. Am. Chem. Soc. 121 (50): 11656-11663 (1999).
Carlisle, P.J. and A.A. Levine. Stability of chlorohydrocarbons: II. Trichloroethylene. Industrial Eng. Chem. 24(10): 1164-1168 (1932).
Carroll, S., G. Heron, R. Aines, R. Newmark, A. Gavaskar, W.-S. Yoon, and K. Greene. “Single well steam-enhanced extraction and HPO of chlorinated solvents.” Paper 2B-03, A.R. Gavaskar and A.S.C. Chen (eds.), Remediation of Chlorinated and Recalcitrant Compounds, Monterey, CA, May, 2004.
Catoire, V., P.A. Ariya, H. Niki, and G.W. Harris. FTIR study of the Cl- and Br-atom initiated oxidation of trichloroethylene. Int. J. Chem. Kinetics 29(9): 695-704 (1997).

82
Chang, W.D. and S.M. Senkan. Detailed chemical kinetic modeling of fuel-rich C2HCl3/O2/Ar flames. Environ. Sci. Technol. 23(4): 442-450 (1989).
Chuang, S.C. and J.W. Bozzelli. Conversion of chloroform to HCl by reaction with hydrogen and water vapor. Environ. Sci. Technol. 20(6):568-574 (1986).
Davis, E.L. How Heat Can Enhance In-situ Soil and Aquifer Remediation. EPA/540/S-97/502. Cincinnati, OH: U.S. Environmental Protection Agency, 1997. Available at: http://www.epa.gov/ada/pubs/reports.html.
Davis, E.L., personnel communication, 2007.
Delavarenne, S.Y. and H.G. Viehe. 1-Halogenoacetylenes, Chapter 10. In Chemistry of Acetylenes. H.G. Viehe (ed.), Marcel Dekker, New York, NY 1969.
Dilling, W.L., N.B. Tefertiller, and G.J. Kallos. Evaporation rates and reactivities of methylene chloride, chloroform, 1,1,1-trichloroethane, trichloroethylene, tetrachloroethylene, and other chlorinated compounds in dilute aqueous solutions. Environ. Sci. Technol. 9(9): 833-838 (1975).
Drijvers, D., R. De Baets., A. De Visscher, and H. Van Langenhove. Sonolysis of trichloroethylene in aqueous solution: volatile organic intermediates. Ultrasonics Sonochem. 3(2): S83-S90 (1996).
Falk, M and A.G. Miller. Infrared spectrum of carbon dioxide in aqueous solution. Vibrational Spectroscopy 4: 105-108 (1992).
Farnik, M., M. Weimann, and M.A. Suhm. 2003. Acidic protons before take-off: A comparative jet Fourier transform infrared study of small HCl- and HBr-solvent complexes. J. Chem. Physics 118(22): 10120-10136 (2003).
Fossey, J., D. Lefort, and J. Sorba. “Free Radicals in Organic Chemistry.” John Wiley and Sons, Inc., New York, NY, 1995.
Froese, K.L. and O. Hutzinger. The formation of chlorinated benzenes and phenols in fly ash catalyzed reactions of trichloroethylene. Chemosphere 28(11): 1977-1987 (1994).
Gebhart, B., Y. Jaluria, R.M. Mahajan, and B. Sammakia. “Buoyancy-Induced Flows and Transport.” Hemisphere Publishing Company, New York, NY, 1988.
Goodal, A.M. and K.E. Howlett. The pyrolysis of chloroalkenes. Part II. Trichloroethylene. J. Chem. Soc. (JUL):2599-2603 (1954).
Graham, J.L., D.L. Hall, and B. Dellinger. Laboratory investigation of thermal degradation of a mixture of hazardous organic compounds. 1. Environ. Sci. Technol. 20(7): 703-710 (1986).
Gu, B. and R.L. Siegrist. Dehalogenation of chlorinated organic compounds by strong alkalis. J. Environ. Eng. 123(10): 982-987 (1997).
Haag, W.R., and J. Hoigne. Photo-sensitized oxidation in natural water via .OH radicals. Chemosphere 14: 1659-1671 (1985).
Haag, W.R., M.D. Johnson, and R. Scofield. Direct photolysis of trichloroethene in air: Effect of co-contaminants, toxicity of products, and hydrothermal treatment of products. Environ. Sci. Technol. 30(2): 414-421 (1996).
Haag, W.R., and T. Mill. Effect of a subsurface sediment on hydrolysis of haloalkanes and epoxides. Environ. Sci. Technol. 22: 658-663 (1988).
Haderlein, S.B. and K. Pecher. “Pollutant reduction in heterogeneous Fe(II)-Fe(III) systems.” Chapter 17, In Kinetics and Mechanisms of Reactions at the Mineral/Water Interface, by D.L. Sparks and T. Grundl (eds.), ACS Symposium Series Volume 715, Division of Geochemistry, American Chemical Society, Washington, DC, 1998.
Halogenated Solvents Industry Alliance (HSIA). Trichloroethylene White Paper. HSIA, Inc., Washington, D.C., 2001. Available at: http://www.hsia.org.
Heron, G., T.H. Christensen, and C.G. Enfield. Henry’s Law constant for trichloroethylene between 10 and 95°C. Environ. Sci. Technol. 32(10): 1433-1437 (1998).
Heron, G., M. Van Zutphen, T.H. Christensen, and C.G. Enfield. Soil heating for enhanced remediation of chlorinated solvents: A laboratory study on resistive heating and vapor extraction in a silty, low-permeable soil contaminated with trichloroethylene. Environ. Sci. Technol. 32(10): 1474-1481 (1998).
Hopf, H. and B. Witulski. “Functionalized acetylenes in organic synthesis.” Chapter 2, In Modern Acetylene Chemistry, by P.J. Stang and F. Diederich (eds.), VCH, New York, NY 1995.
Horvath, A.L. Halogentated Hydrocarbons, Solubility-Miscibility with Water, Marcel Dekker, Inc., New York, NY, 1982.
Huang, L.Q. and J.J. Pignatello. Improved extraction of atrazine and metolachlor in field soil samples. J. Assoc. Anal. Chemists 73: 443-446 (1990).

83
Hunt, J.R., N. Sitar, and K.S. Udell. Nonaqueous phase liquid transport and cleanup 1. Analysis of mechanisms. Water Resour. Res. 24(8): 1247-1258 (1988).
Interagency DNAPL Consortium. Steam injection treatment of a DNAPL source zone at Launch Complex 34, Cape Canaveral Air Station, Draft Final Innovative Technology Evaluation Report. Prepared by Battelle, Columbus, OH, August 20, 2002.
Interagency DNAPL Consortium. Demonstration of resistive heating treatment of DNAPL source zone at Launch Complex 34 in Cape Canaveral Air Force Station, Florida, Final Innovative Technology Evaluation Report. Prepared by Battelle, Columbus, OH, February 19, 2003.
Integrated Water Resources. Deployment of a steam injection/extraction system at LC34, Cape Canaveral Air Station. Prepared for MSE-Technology Applications, Butte, Montana, March 2003.
Jeffers, P.M. and N.L. Wolfe. Homogeneous hydrolysis rate constants. 2. Additions, corrections and halogen effects. Environ. Toxicol. Chem. 15(7): 1066-1070 (1996).
Jeffers, P.M., L.M. Ward, L.M. Woytowitch, and N.L. Wolfe. Homogeneous hydrolysis rate constants for selected chlorinated methanes, ethanes, ethenes, and propanes. Environ. Sci. Technol. 23(8): 965-969 (1989).
Kaberdin, R.V. and V.I. Potkin. Trichloroethylene in organic synthesis. Russian Chem. Rev. 63(8): 641-659 (1994).
Kaslusky, S.F. and K.S. Udell. A theoretical model of air and steam co-injection to prevent the downward migration of DNAPLs during steam-enhanced extraction. J. Contam. Hydrol. 55: 213-232 (2002).
Kim, H.J. and K.Y. Choo. Arrhenius rate parameters for the thermal decomposition of trichloroethylene. Bull. Korean Chem. Soc. 4(5): 203-208 (1983).
Kirkbride, F.W. Oxidation of Trichloroethylene. United States Patent no. 2,292,129. Issued August 4, 1942.
Kivinen, A. “Mechanisms of substitution at the COX group.” Chapter 6, In The Chemistry of Acyl Halides, by S. Patai (ed.), Interscience Publishers, New York, NY, 1972.
Kline, S.A., J.J. Solomon, and B.L. Van Duuren. Synthesis and reactions of chloroalkene epoxides. J. Org. Chem. 43(18): 3596-3600 (1978).
Knauss, K.G., S.C. Copenhaver, and R.D. Aines. Hydrous Pyrolysis/Oxidation Process for In Situ Destruction of Chlorinated Hydrocarbon and Fuel Hydrocarbon contaminants in Water and Soil. U. S. Patent no. 6,127,592. Issued October 3, 2000.
Knauss, K.G., M.J. Dibley, R.N. Leif, D.A. Mew, and R.D. Aines. Aqueous oxidation of trichloroethylene (TCE) a kinetic analysis. Appl. Geochem. 14: 531-541 (1999).
Kriegman-King, M.R. and M. Reinhard. Transformation of carbon tetrachloride in the presence of sulfide, biotite, and vermiculite. Environ. Sci. Technol. 26: 2198-2206 (1992).
Kriegman-King, M.R. and M. Reinhard. Transformation of carbon tetrachloride by pyrite in aqueous solution. Environ. Sci. Technol. 28: 692-700 (1994).
Kucher, R.V., R.I. Flyunt, Y.A. Pazderskii, V.I. Timokhin, I.P. Shevchuk, O.I. Makogon, and A.A. Berlin. Mechanism of liquid-phase oxidation of trichloroethylene. Doklady Phys. Chem., Proc. Acad. Sci. USSR (translated) 309(4-6): 953-956 (1990).
LaGrega, M.D., P.L. Buckingham, and J.C. Evans. Hazardous Waste Management, McGraw-Hill, Boston, MA, 2001.
Lee, W. and B. Batchelor. Abiotic reductive dechlorination of chlorinated ethylenes by soil. Chemosphere 55(5): 705-713 (2004).
Lee, W. and B. Batchelor. Reductive capacity of natural reductants. Environ. Sci. Technol. 37(3): 535-541 (2003).
Lucchini, V. and G. Modena. Kinetics of acid-catalyzed hydration of acetylene. Evidence for the presence in the solution phase of unsubstituted vinyl cation. J. Am. Chem. Soc. 112(17): 6291-6296 (1990).
Mallingckrodt and Baker, Inc. Material Safety Data Sheet: Trichloroethylene. 2003a. Available at: www.jtbaker.com/msds/englishhtml/t4940.htm.
Mallingckrodt and Baker, Inc. Material Safety Data Sheet: Dichloroacetic acid. 2003b. Available at: www.jtbaker.com/msds/englishhtml/D2144.htm.
Marshall, W.L. and E.U. Frank. Ion product of water substance, 0-1000°C, 1-10,000 bars. New international formulation and its background. J. Phys. Chem. Ref. Data 10(2): 295-304 (1981).
McCollom, T.M. and J.S. Seewald. Experimental constraints on the hydrothermal reactivity of organic acids and acid anions: I. Formic acid and formate. Geochimica et Cosmochimica Acta 67(19): 3625-3544 (2003).

84
McDonald, H.J. The vapor pressure and heat of vaporization of trichloroethylene. J. Phys. Chem. 48(2): 47-50 (1944).
McKinney, L.L., E.H. Uhing, J.L. White, and J.C. Picken, Jr. Autoxidation products of trichloroethylene. J. Agricultural Food Chem. 3(5): 413-419 (1955).
McNeill, W.C. “Trichloroethylene.” In Kirk-Othmer Encyclopedia of Chemical Technology, 3rd Edition. M. Grayson and D. Eckroth (eds.), John Wiley and Sons, New York, NY, 1978, Volume 5, 745-753.
Mertens, J.A. “Trichloroethylene.” In Kirk-Othmer Concise Encyclopedia of Chemical Technology, 4th Edition. J. Kroschwitz (ed.), John Wiley and Sons, New York, NY, 1999, p. 429.
Mertens, R. and C. von Sonntag. Reaction of the OH radical with tetrachloroethene and trichloroacetaldehye (hydrate) in oxygen-free aqueous-solution. J. Chem. Soc. Perkin Trans. 2(10): 2181-2185 (1994).
Mishra, V.S., V.V. Mahajani, and J.B. Joshi. Wet air oxidation. Industrial Eng. Chem. Res. 34(1): 2-48 (1995).
Moss, G.P. Glossary of Terms Used in Physical Organic Chemistry. International Union of Pure and Applied Chemistry (IUPAC) 1994. Available at: http://www.chem.qmul.ac.uk/iupac/gtpoc/.
Mugdan, M. and J. Wimmer. “Manufacture of Oxidation Products of Trichloroethylene.” United States Patent 1,976,265. Issued October 9, 1934.
Mulholland, J.A., A.F. Sarofim, P. Sosothikul, P.A. Monchamp, E.F. Plummer, and A.L. LaFleur. Formation of perchloroaromatics during trichlororehtylene pyrolysis. Combustion Flame 89: 103-115 (1992).
Newmark, R.L., R.D. Aines, K. Knauss, R. Leif, M. Chiarappa, B. Hudson, C. Carrigan, A. Thompson, J. Richards, C. Eaker, R. Wiedner, and T. Sciarotta. In Situ Destruction of Contaminants via Hydrous Pyrolysis/Oxidation: Visalia Field Test. Lawrence Livermore National Laboratory, UCRL-ID-132671, Livermore, CA, 1998.
Nieuwland, J.A. and R.R. Vogt. The Chemistry of Acetylene. American Chemical Society Monograph Series, Reinhold Publishing Corp., New York, NY, 1945.
Nimlos, M.R., W.A. Jacoby, D.M. Blake, and T.A. Milne. Direct mass spectrometric studies of the destruction of hazardous wastes. 2. Gas-phase photocatalytic oxidation of trichloroethylene over TiO2: Products and mechanisms. Environ. Sci. Technol. 27(4): 732-740 (1993).
O’Mara, M.M., L.B. Crider, and R.L. Daniel. Combustion products from vinyl chloride monomer. Am. Industrial Hygiene Assoc. J. 32(1): 153-157 (1971).
Ott, E. and K. Packendorff. Dichloroacetylene II. The influence of the reaction velocity on the stereochemical course of halogen addition at the acetylene union. Berichte 64B: 1324-1329 (1931).
Ott, E., W. Ottemeyer and K. Packendorff. Dichloroacetylene. Berichte 63B: 1941-1944 (1930).
Papirer, E., J.-M. Perrin, B. Siffert, G. Philipponneau, and J.-M. Lamerant. The influence of grinding on the surface properties of a-Aluminas. J. Colloid Interface Sci. 156: 104-108 (1993).
Pearson, C.R. and G. McConnell. Chlorinated C1 and C2 hydrocarbons in the marine environment. Proc. Royal Soc. London. Series B, Biological Science 189(1096): 305-332 (1975).
Pielichowski, J. and R. Popielarz. Trichloroethylene in organic synthesis: I. A new catalytic synthesis of dichloroacetylene. Synthesis-Stuttgart 433-434 (1984).
Prager, L, P. Dowideit, H. Langguth, H.P. Schuchmann, and C. von Sonntag. Hydrolytic removal of the chlorinated products from oxidative free-radical-induced degradation of chloroethylenes:acid chlorides and chlorinated acetic acids. J. Chem. Soc. Perkin Trans. 2, 2001(9): 1641-1647 (2001).
Procaccini, C., J.W. Bozzelli, J.P. Longwell, A.F. Sarofim, and K.A. Smith. Formation of chlorinated aromatics by reactions of Cl˙, Cl2, and HCl with benzene in the cool-down zone of a combustor. Environ. Sci. Technol. 37 (8): 1684-1689 (2003).
Prytula, M.T. Bioavailability and Microbial Dehalogenation of Chlorinated Benzenes Sorbed to Estuarine Sediments. Ph.D. Thesis. Georgia Institute of Technology, Atlanta, GA, 1998.
Riemschneider, R. and B. Klaus. Halogenated acetylenes: I. Density and refractive index of dichloroacetylene. Justus Liebig’s Annalen der Chemie 640: 1-5 (1961).
Reichert, D., T. Neudecker, U. Spengler, and D. Henschler. Mutagenicity of dichloroacetylene and its degradation products trichloroacetyl chloride, trichloroacryloyl chloride and hexachlorobutadiene. Mutation Res. 117: 21-29 (1983).
Reichert, D., M. Metzler, and D. Henschler. Decomposition of the neuro- and nephrotoxic compound dichloroacetylene in the presence of oxygen: Separation and identification of novel products. J. Environ. Pathol. Toxicol. 4(2,3): 525-532 (1980).

85
Reichert, D., D. Ewald, and D. Henschler. Generation and inhalation toxicity of dichloroacetylene. Food Cosmetics Toxicol. 13(5): 511-515 (1975).
Reiser, C., F.M. Lussier, C.C. Jensen and J.I. Steinfeld. Infrared photochemistry of halogenated ethylenes. J. Am. Chem. Soc. 101(2): 350-357 (1979).
Ryan, T.A., C. Ryan, E.A. Seddon, and K.R. Seddon. “Phosgene and Related Carbonyl Chlorides.” Monograph 24, Topics in Inorganic and General Chemistry. R.J.H. Clark (ed.), Elsevier Science, B.V., Amsterdam, The Netherlands, 1996.
Sawhney, B.L., J.J. Pignatello, and S.M. Steinberg. Determination of 1,2-dibromoethane (EDB) in field soils: Implications for volatile organic compounds. J. Environ. Qual. 17: 149-152 (1988).
Schmidt, R., C. Betz, and A. Farber. LNAPL and DNAPL behavior during steam injection into the unsaturated zone. International Association of Hydrological Sciences 250: 111-117 (1998).
Sepiol, J. and R.L. Soulen. Preparation of monocyclopropene and diiodocyclopropene. J. Organic Chem. 40(25): 3791-3793 (1975).
Seyfried, W.E., D.R. Janecky, and M.E. Berndt. “Rocking autoclaves for hydrothermal experiments II. The flexible reaction-cell system.” Chapter 9, In Hydrothermal Experimental Techniques, by G.C. Ulmer and H.L. Barnes (eds.), John Wiley and Sons, New York, NY, 1987.
Seyfried, W.E., P.C. Gordon, and F.W. Dickson. A new reaction cell for hydrothermal solution equipment. Am. Mineralogist 64: 646-649 (1979).
Shende, R. and V.V. Mahajani. Kinetics of wet oxidation of formic acid and acetic acid. Industrial Eng. Chem. Res. 36(11): 4809-4814 (1997).
Sleep, B.E. and Y. Ma. Thermal variation of organic fluid properties and impact on thermal remediation feasibility. J. Soil Contam. 6(3): 281-306 (1997).
Smith, M. and J. March. March’s Advanced Organic Chemistry: Reactions, Mechanisms, and Structure, 5th Edition. John Wiley and Sons, Inc., New York, NY, 2001.
Staudinger, J. and P.V. Roberts. A critical review of Henry’s law constants for environmental applications. Critical Rev. Environ. Sci. Technol. 26(3): 205-297 (1996).
Stegemeier, G.L and H.J. Vinegar. “In situ thermal desorption of soils.” In Hazardous & Radioactive Waste Treatment Technologies Handbook, by J. Chang (ed.), CRC Press, Boca Raton, FL, 2001, 1-37.
Stumm, W. and J.J. Morgan. Aquatic Chemistry, 3rd Edition. John Wiley and Sons, Inc., New York, NY, 1996.
Su, C., and R.W. Puls. Kinetics of trichloroethene reduction by zerovalent iron and tin: Pretreatment effect, apparent activation energy, and intermediate products. Environ. Sci. Technol. 33:163-168 (1999).
Taylor, P.H., B. Dellinger, and C.C. Lee. Development of a thermal stability based ranking of hazardous organic compound incinerability. Environ. Sci. Technol. 24: 316-328 (1990).
Truex, M., T. Powell, and K. Lynch. In situ dechlorination of TCE during aquifer heating. Ground Water Monitoring and Remediation 27(2): 96-105 (2007).
Udell, K.S. “Thermally enhanced removal of liquid hydrocarbon contaminants from soils and groundwater.” In Subsurface Restoration, by C.H. Ward et al, (eds.), Ann Arbor Press, Chelsea, MI, 1997, 251-270.
United States Department of Energy (U.S. DOE). Pinellas Environmental Restoration Project, Northeast Site Area A NAPL Remediation Final Report, GJO-2003-482-TAC. Washington, DC, 2003. Available at: http://www.gjo.doe.gov/lm/sites/maps/fl/pinellas/pinellas.htm
United States Environmental Protection Agency (U.S. EPA). In Situ Treatments of Chlorinated Solvents: Fundamentals and Field Applications, EPA/542/R-04/010, Washington, DC, 2004. Available at: www.cluin.org.
United States Environmental Protection Agency (U.S. EPA). 2003. Common Chemicals Found at Superfund Sites. Washington, DC, 2003. Available at http://www.epa.gov/superfund/resources/chemicals.htm.
United States Environmental Protection Agency (U.S. EPA). Method 8265, Volatile Organic Compounds in Water, Soil, Soil Gas, and Air by Direct Sampling Ion Trap Mass Spectrometry (DSITSM). SW-846 Test Methods for Evaluating Solid Wastes Physical/Chemical Methods. Revision 0. Washington, DC, 2002. Available at: http://www.epa.gov/epaoswer/hazwaste/test/pdfs/8265.pdf
United States Environmental Protection Agency (U.S. EPA). Compendium of Methods for the Determination of Toxic Organic Compounds in Ambient Air – Second Edition, EPA/625/R-96/010b. Washington, DC, 1999. Available at: www.epa.gov/ttn/amtic/airtox.html.
United States Environmental Protection Agency (U.S. EPA). National Primary Drinking Water Regulations: Disinfectants and Disinfection Byproducts; Final Rule. Federal Register 63: 69389-69476, 1998.
86
United States Environmental Protection Agency (U.S. EPA). Method 8260B, Volatile Organic Compounds by Gas Chromatography/Mass Spectrometry (GC/MS). SW-846 Test Methods for Evaluating Solid Wastes Physical/Chemical Methods. Revision 2. Washington, DC, 1996. Available at: http://www.epa.gov/epaoswer/hazwaste/test/8_series.htm
United Stated Environmental Protection Agency (U.S. EPA). Method 552.2: Determination of Haloacetic Acids and Dalapon in Drinking Water by Liquid-Liquid Extraction, Derivatization, and Gas Chromatography with Electron Capture Detector. Revision 1.0. In Methods for the Determination of Organic Compounds in Drinking Water. EPA/600/R-95/131, Supplement III. Washington, DC, 1995.
Urben, P.G., L. Bretherick, and M.J. Pitt. Bretherick’s Handbook of Reactive Chemical Hazards. 6th Edition. Butterworth-Heinemann, Boston, MA, 1999.
Verschueren, K. Handbook of Environmental Data on Organic Chemicals, 2nd ed., Van Nostrand Reinhold, New York, 1983.
Vinegar, H.J., G.L. Stegemeier, F.G. Carl, J.D. Stevenson, and R.J. Dudley. “In situ desorption of soils impacted with chlorinated solvents.” Paper #99-450 presented at the Air and Waste Management Association Annual Meeting, St. Louis, MO, 1999.
Werner, J.H. and T.A. Cool. The kinetics of the combustion of trichloroethylene for low Cl/H ratios. Combustion Flame 120: 125-142 (2000).
Williams, F.W. Determination of dichloroacetylene in complex atmospheres. Anal. Chemist 44(7): 1317-1321 (1972).
Wu, Y.G. and Y.F. Lin. The oxidation of trichloroethene with methane: Experimental and kinetic modeling. Combustion Flame 137(3): 376-402 (2004).
Yang, G. and I.M. Kennedy. The effect of strain on laminar diffusion flames of chlorinated hydrocarbons. Combustion Flame 92: 187-196 (1993).
Yasuhara, A. and M. Morita. Formation of chlorinated compounds in pyrolysis of trichloroethylene. Chemosphere 21(4-5): 479-486 (1990).
Yokoyama, K., G. Fujisawa, and A. Yokoyama. The mechanism of unimolecular dissociation of trichloroethylene CHCl=CCl2 in the ground electronic state. J. Chem. Physics 102(20): 7902-7909 (1995).
Yu, X.Y and J.R. Barker. Hydrogen peroxide photolysis in acidic aqueous solutions containing chloride ions. I. Chemical mechanism. J. Phys. Chem. A 107(9): 1313-1324 (2003).
Zhang, Y and I.M. Kennedy. Oxidation of trichloroethene in stagnation flows over inert and catalytic heated ceramic surfaces. Combustion Flame 131: 436-451 (2002).
Zhu, L. and J.W. Bozzelli. Kinetics and mechanisms for the thermal chlorination of chloroform in the gas phase. International J. Chem. Kinetics 35(12): 647-660 (2003).
Zhu, L. and J.W. Bozzelli. Thermodynamic properties of chloroacetylene, dichloroacetylene, ethynyl radical, and chloroethynyl radical. Chem. Physics Letters 362(5-6): 445-452 (2002).

87
Detailed Experimental Methods for Flow-Through Quartz Tube Reactors
A.1 Quartz Tube PreparationThe quartz tube and associated connectors were prepared prior to each isothermal experiment by washing in hot (45°C) tap water with detergent (Versa-Clean, Fisher Scientific). The tube and connectors were then rinsed with deionized (DI) water and placed in a drying oven at 200°C for a period of 2 hours. The tube and connectors were allowed to cool to room temperature and the experimental apparatus was assembled and rinsed with approximately 20 mL of dichloromethane (DCM) for a period of 5 minutes. A 2 mL sample of the DCM rinse was collected and stored at 4°C until analyzed to demonstrate the organic-free initial experimental condition. After collecting the DCM rinse, the experimental apparatus was disassembled and remained in the vent hood for a period of 5 minutes to remove the residual DCM. The apparatus was then re-assembled after placing the quartz tube within piece of a 1.5 inch ID galvanized steel pipe that was located in the tube oven (Model 21100, Barnstead-Thermolyne, Dubuque, IA). The steel pipe served to minimize heat transfer between the tube oven lining and quartz tube.
A.2 Quartz Tube Temperature ProfileThe temperature profile within the empty quartz tube from the gas inlet to outlet was determined while the tube oven was operated at 120°C (Figure A.1). The temperature within the quartz tube was measured by inserting a certified traceable oven thermometer encased in a vermiculite filled enclosure (Fisher Scientific, Fair Lawn, NJ) into the heated quartz tube. The oven thermometer was held at a specific location within the quartz tube for 5 minutes and removed to read the temperature value. This temperature measurement procedure was repeated over the entire length of the quartz tube from inlet to outlet in approximately 5 cm increments. There was no gas flow during the temperature profile measurement procedure.
The temperature profile in the quartz tube was determined after 30, 60, 90 and 120 minutes of heating with the temperature profiles after heating the tube for 90 and 120 minutes nearly identical. As shown in Figure A.1, the quartz tube is not at a uniform temperature. TCE entering the quartz tube experiences increasing temperatures (temperature gradient) with the
tube inlet at 70°C and the maximum tube temperature (130°C) located approximately 25 cm or about 10 inches from the tube inlet. This temperature gradient is similar in length to the one foot wide, 500 to 700°C high-temperature zone claimed to cause the in-situ destruction of TCE during thermal conductive heating (Section 2.4.2). An attempt was made to measure the temperature profile of the quartz tube with the oven at 240°C, however, the thermometer enclosure began to smoke after being inserted into the tube and the enclosure was not advanced further to avoid causing the enclosure to catch fire. No attempt was made to measure the temperature profile of the quartz tube at 420°C; the high temperature profile is thought to be similar to that shown in Figure A.1 with the region approximately 25 cm from the inlet at 420°C and the tube inlet near ambient temperature since it is located outside the oven.
Figure A.1 Temperature profile within the quartz tube heated to 120°C.
A.3 Modified TCE Introduction Method: Experimental Series 5
The process of introducing TCE into the pre-mix chamber consisted of initially recording the weight of a 1 mL gas-tight syringe that contained approximately 0.34 mL (~0.5 g) of neat TCE using an analytical balance (Model# AG245, Mettler-Toledo, Columbus, OH) with 0.001 gram readability. The analytical balance had been checked using an ASTM E617 class 2 certified traceable 20±0.0001 gram weight (Cat. # 820000.2, Denver Instruments, Denver, CO) prior to determining the syringe weight. The syringe needle was the inserted through a Teflon lined septum affixed with a crimp seal
6.0APPENDIX A

88
to a port located on the pre-mix chamber and TCE was injected at the slow rate of 0.68 mL/hr for a period of 30 minutes. There were no drops of neat TCE visible at the syringe needle tip, which was located inside the premix chamber, when using this TCE injection rate so that TCE entered the quartz tube in the gas phase. The syringe was removed from the pre-mix chamber and the final weight recorded using the analytical balance and the amount of TCE introduced into the apparatus was determined by the difference in weight between the initial TCE-filled syringe and the final syringe weight after the 30 minute TCE injection period. The apparatus was flushed with TCE-free humidified carrier gas for 45 minutes after removing the syringe to recover as much of the TCE introduced into the experimental apparatus as possible.
The carrier gas was humidified by passing through a mini-bubbler (ACE Glass, Vineland, NJ) filled with approximately 30 mL of deionized (DI) water prior to entering the quartz tube (Figure A.2). The DI water was freshly dispensed from a Nanopure® analytical deionization system (model D4741, Barnstead International, Dubuque, IA) with a conductance of greater than 18 MΩ-cm. The amount of water vapor entering the quartz tube was adjusted by increasing the temperature of the mini-bubbler and pre-mix chamber
using a resistant-wire based heat tape (McMaster-Carr, Atlanta, GA) that was wrapped around the mini-bubbler and pre-mix chamber and connected to a feedback voltage controller equipped with a K-type thermocouple. Three inlet temperatures were used including room temperature (22), 60 and 100°C. The temperatures were chosen to explore a range of chloride to hydrogen (Cl:H) ratios based on the work presented in Section 2.3.6. The room temperature inlet condition had a calculated Cl:H ratio of 1 at a carrier-gas flow rate of 85 mL/min with the TCE liquid influent rate fixed at 0.68 mL/hr. The 60°C inlet temperature had a calculated Cl:H ratio of 0.28 and the 100°C inlet temperature had a Cl:H ratio of 0.07. The 100°C inlet temperature represented a condition where the number of hydrogen atoms in water was approximately 15 times greater than the number of chlorine atoms in TCE.
A.4 Effluent Trapping Procedures and Analytical Methods
The gas stream leaving the ice-cooled, DCM filled trap (Section 3.1.5) was collected in 1.6 L Tedlar® bags to retain all single-carbon, non-condensable degradation products (e.g., carbon dioxide). Each bag was flushed three times with nitrogen gas prior to use. The Tedlar® bag was removed from the quartz tube
Figure A.2 Quartz tube apparatus for the fifth quartz tube experimental series.

89
effluent stream when full and a gas sample from the bag was immediately analyzed to determine the amount of CO and CO2 formed by the degradation of TCE in the heated quartz tube. The gas sample from the Tedlar® bag was collected by pulling approximately 60 mL of the Tedlar® bag contents through a 250 uL gas sample loop attached to a gas sampling valve heated to 120°C and located within an insulated box on a Hewlett-Packard (HP) 6890 Gas Chromatograph (GC). The gas sample in the 250 uL sample loop was then injected into the GC inlet that was operated at 8.90 psi in the splitless mode for 0.75 minutes at 200°C and was connected to a 30 m by 0.32 mm OD Carboxen-1010 column (Part# 24246, Supleco, Bellefonte, PA) attached to a thermal conductivity detector (TCD). Helium was used as the capillary column carrier-gas at a constant flow of 2 mL/min and the GC oven was operated at 35°C for 7 minutes followed by a 40°C/min temperature ramp to 130°C for 5 minutes. The TCD was operated at 210°C with a helium reference flow of 15 mL/min and helium makeup flow at 5 mL/min. The Carboxen-1010 column is capable of separating O2, N2, CO, CO2, and water. However, TCE and other organic compounds are retained within the carbon molecular sieve based column; the column was periodically conditioned at 200°C to remove organic compounds. The GC/TCD was calibrated using serial dilution of an initial 100 mL volume of certified carbon dioxide (15%), carbon monoxide (7%), oxygen (5%), and nitrogen (73%) gas mixture (Cat. No. 23442, Scotty Specialty Gases, Plumsteadville, PA). The serial dilution was performed in a 500 mL syringe (Model S-500, Hamilton Company, Reno, NV) with nitrogen as the dilution gas. At least three CO/CO2 concentrations were used to calibrate the GC/TCD response. This technique had a detection limit of approximately 300 uL/L (ppmv) for CO and 500 uL/L (ppmv) CO2.
In addition to the DCM trap, a second 40 mL vial filled with approximately 30 mL of toluene that contained 2% (wt) aniline was added to the 420°C UZA experiments to determine the amount of phosgene formed during the degradation of TCE. Any phosgene present in the effluent reacted with the aniline to form carbanilide (1,3-diphenylurea), a stable compound. The toluene/aniline traps were analyzed by first removing all the tolulene from the trap by passing nitrogen at 20 mL/min through the trap while heating the trap to 60°C. The trap was taken to complete dryness and weighed to determine the mass of carbanilide formed. A 10 mL volume of acetonitrile was then added to dissolve the dry carbanilide and the concentration of carbanilide was determined by measuring the ultraviolet (UV) light absorbance at 254 nm. Calibration solutions were prepared using carbanilide (Sigma-Aldrich, Milwaukee, WI) in acetonitrile. This second trap and
analysis methods was based on U.S. EPA method TO-6 (U.S. EPA, 1999).
The GC/MS analysis of the DCM trap fluids from the 420°C experiments identified a number of TCE degradation products. However, the amounts of chloroform (CHCl3), carbon tetrachloride (CCl4), tetrachloroethylene (PCE), hexachloroethane (C2Cl6), hexachlorobutadiene (C4Cl6), and hexachlorobenzene (C6Cl6) were determined by GC/FID analysis. Master stock solutions (10,000 mg/L) for each of the previous compounds were prepared in DCM using ACS grade reagents (Sigma-Aldrich, Milwaukee, WI). Hexachlorobenzene (HCB) master stock was prepared by adding HCB solids to iso-octane. The GC/FID response was determined for each compound using at least four calibration standards prepared by volumetric dilution of the master stock at concentrations in the expected range.
A.5 Quartz Tube Rinse ProcedureThe quartz tube was removed from the tube oven after cooling to room temperature and the interior of the apparatus was rinsed with DI water and iso-octane to determine the TCE degradation products that had formed and condensed or adsorbed onto the quartz glass surfaces. The apparatus was initially rinsed with approximately 30 mL of DI water for a period of 5 minutes to collect the water-soluble compounds (i.e., chloride) that formed during each isothermal experiment. The second rinse used 30 mL of iso-octane for a period of 5 minutes to collect the non-polar TCE degradation products (i.e., hexachlorobenzene) from the experimental apparatus.
The chloride content of all water solutions was measured using a colorimetric method described by Bergmann and Sanik (1957). The method involved a selective chemical reaction between free chloride, mercuric thiocyanate [Hg(SCN)2], and iron (III) ions from ferric ammonium disulfate [FeNH4(SO4)2] as shown in Equation A.1:
2Cl- + Hg(SCN)2 + 2FeNH4(SO4)2 → HgCl2 + 2Fe(SCN)2+ + 2NH4(SO4)2
3- (A.1)
The resulting iron-thiocyanate complex [Fe(SCN)2+] forms a yellow color that is directly related to the amount of chloride present in water samples. The method consisted of placing 2 mL of a water sample into a 3 mL capacity Suprasil quartz cuvette (Fisher Scientific, Fair Lawn, NJ). Next, 200 uL of a 9 M nitric acid solution with 250 mM of ferric ammonium sulfate was added to the cuvette followed by 200 uL of ethanol saturated with mercuric thiocyanate. The cuvette was capped with a Teflon lid, inverted 4 times to mix the contents, and then placed in a Varian spectrometer

90
(Model Cary 3E). The light absorption at 460 nm was measured after 10 minutes with reference to DI water contained in a second transmission matched cuvette. Calibration solutions at concentrations of 2, 20, 50, 100, 200, 400, 600, and 1000 uM were prepared in 100 mL volumetric flasks using a certified 1,000 mg/L chloride master stock (SPEX CertiPrep, Metuchen, NJ). The detection limit for this technique was approximately 0.1 mg/L.
The haloacetic acid content of water samples was determined using procedures based on EPA method 552.2 (U.S. EPA, 1995). This procedure involved 1) pH adjustment, 2) liquid-liquid extraction, 3) derivatization, and 4) neutralization followed by GC analysis. The water-rinse samples were contained in 40 mL glass vials sealed with Teflon lined septa affixed with a screw caps. The pH of each water rinse sample was adjusted to less than 0.5 by adding 1.5 mL of concentrated sulfuric acid (H2SO4) to convert any carboxylates present into the acid form. The pH adjustment was followed by adding 5 mL of methyl-tert butyl ether (MTBE) to the 40 mL vials which were then resealed and hand-shaken for 2 minutes to extract the haloacetic acids. Approximately 3 mL of the MTBE was then transferred from each 40 mL vial to 14 mL glass vials using a Pasteur pipette. One mL of acidic methanol (10% H2SO4) was added to each 14 mL vial, which were sealed with a Teflon lined septa affixed with a screw cap and then placed in an oven at 50°C for a period of 2 hours to convert the carboxylic acids to their derivatized, methyl ester form. After cooling the 14 mL vials to room temperature, the MTBE extract and acid methanol mixture was neutralized by adding 2 mL of saturated sodium bicarbonate solution. Two 1 mL samples of the MTBE extracts were transferred from the 14 mL vials into 2 mL autosampler vials and the internal standard, 1,2,3-trichloropropane, was added to each 2 mL vial. The vials were then sealed with Teflon lined septa affixed with aluminum crimps.
The analysis of the MTBE extracts consisted of using an automatic liquid sampler (HP7683) to inject 1 uL of sample into a GC (HP6890) equipped with a 30 m by 0.32 mm OD HP-1 capillary column connected to an electron capture detector (ECD). The GC inlet was operated at 7.00 psi in the splitless mode for 0.5 minutes at 200°C with helium as the column carrier gas at a constant flowrate of 2 mL/min. The GC oven was operated at 35°C for 21 minutes followed by an 11°C/min temperature ramp to 136°C for 3 minutes, and a final temperature ramp of 20°C/min to 230°C for 3 minutes. The ECD was operated at 250°C with a nitrogen gas makeup flow of 60 mL/min. Dichloroacetic acid calibration standards at concentrations of 12, 50, 100, and 400 ug/L were prepared from a 60 mg/L primary dilution standard made from ACS grade
dichloroacetic acid (Sigma-Aldrich, Milwaukee, WI). The calibration samples were processed with each sample batch along with at least two uncontaminated water samples including freshly dispensed DI water and a storage blank.
The GC/ECD chromatograms from the analysis of the MTBE extracts collected from the 420°C UZA experiments contained peaks that eluted at times different than dichloroacetic acid. A GC (HP 6890) equipped with a 30 m by 0.32 mm DB-5ms column connected to a mass select detector (MSD, HP5973) was used to identify the compounds associated with the unknown peaks. The GC operating conditions were identical to the GC/ECD method given above. Compounds were identified using software (ChemStation ver. D.00.00.38, Agilent Technologies, Palo Alto, CA) that matched their mass spectra with reference mass spectra in the NIST/EPA/NIH Mass Spectral Library (NIST02). The unknown compound was identified when the mass spectrum fit with a matching NIST02 library spectrum with quality of greater than 70. The ChemStation software rated the mass spectrum match on a scale of 0 to 100 whereas the Varian software used a scale of from 0 to 1,000. The iso-octane rinse was initially analyzed using the Varian GC/MS to determine the identity of TCE degradation products. The amount of each degradation product was then determined using GC/FID analysis.

91
Change in Dissolved OxygenDissolved oxygen (DO) was determined using a colorimetric method that reports DO concentration (mg/L) in a range between two values (e.g., 6 to 8 mg/L). An estimate of the average DO concentration range for each set of ampules, as a function of time, was made based on the colorimetric analysis result for each vial (Table B.1). The DO concentration in the oxic ampules (Batches 2 and 3) remained constant (6-8 mg/L)
or increased by one increment (8-10 mg/L) over the 30-day incubation period, with the exception of Ampule 58 (1,000 mg/L TCE). The DO concentration in Ampule 58 decreased from 6-8 mg/L to 0.6-0.8 mg/L after incubation at 120°C for 20 days. This result suggests that oxygen was not consumed during ampule incubation at 120°C, with the exception of Ampule 58 where oxygen was consumed in conjunction with a greater than 50% decrease in TCE content after 20 days at 120°C.
7.0APPENDIX B
Table B.1 Dissolved Oxygen (DO) Concentration Range for Anoxic and Oxic Ampules with 1,000 and 100 mg/L of TCE (Batches 1-4)
Ampule Temperature (°C) Time (days) 1,000 mg/L anoxic
(1)1,000 mg/L
oxic (2)100 mg/L anoxic
(4)100 mg/L oxic (3)
Initial 0 0.2 to 0.3 6 to 8 0.2 to 0.3 6 to 8
12010
4 to 5 6 to 8 2 to 3 6 to 822 3 to 5 6 to 8 2 to 3 6 to 8
120 and 22 (Controls) 1 to 3 6 to 8 2 to 3 6 to 8120
201 to 3 8 to 10*
NA8 to 10
22 2 to 3 8 to 10 8 to 10120 and 22 (Controls) 3 to 4 8 to 10 8 to 10
12030
Lost Lost 0.8 to 1.0 6 to 822 4 to 5 8 to 10 0.8 to 1.0 6 to 8
120 and 22 (Controls) 5 to 6 8 to 10 0.8 to 1.0 6 to 8120
41 NA NA0.8 to 1.0
NA22 0.8 to 1.0120 and 22 (Controls) 0.8 to 1.0
(#) – Batch number Controls – TCE-free ampules* Excludes Ampule 58 results, DO between 0.6 and 0.8 mg/L after 20 days at 120°C.Lost – Ampules destroyed in oven explosionNA – No ampules analyzed for DO at time interval

92
The DO concentration tended to increase in anoxic ampules with TCE and without TCE (TCE-free). The DO concentration increased in anoxic ampules that contained 1,000 mg/L of TCE (Batch 1) from an initial value of 0.2-0.3 mg/L to final values up to 4-5 mg/L after 30 days at 22°C and 120°C. The DO concentration also increased in TCE-free controls for the Batch 1 ampules from 0.2-0.3 mg/L to 5-6 mg/L over the course of the incubation period. Anoxic ampules with 100 mg/L of TCE and without TCE (Batch 4) exhibited slight increases in oxygen content on day 10 (2-3 mg/L), followed by declines on day 30 (0.8-1.0 mg/L).
The DO concentrations of ampules that contained Ottawa sand (Batch 6), Ottawa sand+1% goethite (Batch 7), and amended with NaOH (Batch 5) are provided in Table B.2. All of the sampled ampules
exhibited a slight increase in dissolved oxygen concentration, ranging from the initial anoxic condition (0.2-0.3 mg/L) up to 1-2 mg/L for the TCE-free control ampules containing Ottawa sand+1% goethite (Batch 6). However, the observed increases in dissolved oxygen concentration in ampules containing solids and NaOH (Batches 5-7) were less than in the anoxic ampules containing 1,000 mg/L TCE (Batch 1, Table B.1). For Batch 6 and 7 ampules, solids filled the ampule neck thus preventing the measurement of dissolved oxygen using the procedures illustrated in Figure 4.2. Hence, the DO concentration for these ampules had to be made within the main ampule body to gain access to sand-free water, and for this reason, DO was measured in ampules that contained solids but not TCE where the CHEMets reagents may have led to interferences during subsequent analyses for TCE degradation products.
Table B.2 Dissolved Oxygen (DO) Concentration Range for Anoxic Ampules that Contained Solids (Ottawa sand and Ottawa Sand+1% Goethite) or NaOH (pH 10) (Batches 5-7)
Ampule Temperature (°C) Time (days)
Batch 6 Sand
DO (mg/L)
Time (days)
Batch 7 Sand+1%Goethite
DO (mg/L)
Batch 5 pH 10
DO (mg/L)
Initial 0 0.2 to 0.3 0 0.2 to 0.3 0.2 to 0.3
120 10
NA1
NA 0.8 to 1.0
120 (Controls) 0.8 to 1.0 1 to 2 0.4 to 0.6
120 30
NA2
NA 0.8 to 1.0
120 (Controls) 0.6 to 0.8 1 to 2 0.4 to 0.5
22
40
NA
3
NA 0.8 to 1.0
120 (Controls) 22 (Controls)
0.3 to 0.4 0.8 to 1.0
1 to 2 1 to 2
0.4 to 0.6 0.8 to 1.0
(#) – Batch numberControls – TCE-free ampulesNA – Did not measure DO in solids filled ampules that contained TCE

93
C.1 Rates of TCE DegradationPrevious studies performed by Knauss et al. (1999) and Jeffers and Wolfe (1996) reported the rate of TCE disappearance based on the first-order reaction rate model. Thus, for comparison purposes, the rate of TCE disappearance is reported in Table C.1 based on a fit of the natural log of TCE concentration vs. incubation time, and a fit of the natural log of total carbon and chlorine degradation products versus incubation time. The rate for ampules with 1,000 mg/L of TCE (Batches 1 and 2) are not presented as these results were from only 2 time periods.
While the rate of TCE disappearance from the anoxic (Batch 4) ampules could not be determined using the TCE concentration results, there was a measurable increase in the amount of carbon with incubation time whereas the rate of chlorine production did not fit a first-order rate model. The rates of TCE disappearance from the oxic (Batch 3) ampules, based on the decrease in the amount of TCE and the increase in carbon degradation products were similar; however, the uncertainty in the first order fit based on the carbon degradation products makes this similarity statistically insignificant. The rate of chlorine production in the oxic ampules did not fit a
8.0APPENDIX C
Table C.1 Rate of TCE Disappearance from the 100 mg/L Ampules at 120°C
Basis Decrease in TCE Increase in Carbon Increase in Chloride
Rate Rate (1/day) ×1000
Half-Life (days)
Rate (1/day) ×1000
Half-Life (days)
Rate (1/day) ×1000
Half-Life (days)
Anoxic (4) No Change -- 2.6±0.8
R2 = 0.83 262 1.2±1.3 R2 = 0.30 591
Oxic (3) 3.4±0.8 R2 = 0.89 201 2.8±1.2
R2 = 0.72 248 1.8±1.6 R2 = 0.37 393
Sand (6) 6.2±2.6 R2 = 0.74 111 2.8±1.0
R2 = 0.80 244 3.5±1.2 R2 = 0.81 200
Sand+ 1%Goethite (7)
53.4±20.1 R2 = 0.78 13 23.3±6.3
R2 = 0.87 30 15.8±3.2 R2 = 0.92 44
NaOH (5) 34.0±21.9 R2 = 0.45 20 39.9±11.9
R2 = 0.79 17 42.0±8.1 R2 = 0.90 17
Knauss et al. (1999) -606 1.1 Not Reported -- Not Reported --
Jeffers and Wolfe (1996) -0.8 858 Not Reported -- Not Reported --

94
first-order rate model, similar to the results for the anoxic ampules. Note that the anoxic and oxic ampule results span different incubation systems, necessitated by the convection oven explosion, thus the results for these two series are not strictly comparable for all incubation times.
The rate of degradation based on carbon detected as degradation products was similar within an order-of-magnitude between the anoxic (Batch 4), oxic (Batch 3), and anoxic ampules that contained sand (Batch 6) suggesting that oxygen and sand had no influence on the rate of TCE disappearance from the ampules. The addition of goethite increased the rate of TCE disappearance by an order of magnitude, demonstrating that a commonly found mineral could have a significant impact on the rate of TCE disappearance during thermal treatment. The rate of TCE disappearance reported by Knauss et al. (1999), reported in Table C.1 assuming an initial TCE concentration of 100 mg/L and a temperature of 120°C, was an order-of-magnitude greater than the rate measured using the ampules with goethite and two orders-of-magnitude greater than ampules with oxic and anoxic water. The rate of TCE disappearance reported by Jeffers and Wolfe (1996), assuming a temperature of 120°C, was approximately an order-of-magnitude less than that determined for the anoxic and oxic ampules, and approximately 3 orders-of-magnitude less than the rate reported by Knauss et al. (1999).
These rates are not necessarily comparable since they were obtained using different experimental systems. The most significant difference between the experimental systems was that Knauss et al. (1999) used a gold walled reactor that was completely water filled (no gas phase present) while Jeffers and Wolfe (1996) used Pyrex tubing (0.3 mL) with gas phase present, and the work completed herein used borosilicate glass ampules (50 mL) with a gas phase present.
C.2 Methods used to Determine TCE Dedradation Rate Parameters in Ampule Experiments
Three methods were evaluated for determining the rate of TCE degradation. The first method consisted of plotting the natural log of the average number of moles of TCE (Tables 4.15 and 41.6) normalized by the average initial moles of TCE as a function of incubation time as described by the following equation:
0
ln or lnmolesTCE TCEinitial molesTCE TCE
(C.1)
Figures C.1 through C.4 show plots of Equation C.1 for all four ampule experiments along with the first order decay coefficient as determined from the slope of a linear
regression analysis. There was no significant change in the amount of TCE in the anoxic ampules (Figure C.1) and thus no rate of TCE loss was determined for the anoxic ampules based on TCE content. There was an apparent loss of TCE from the other ampules at 22°C and 120°C based on the data shown in Figures C.2 through C.4. However, the apparent loss of TCE from the ampules incubated at 120°C may not have been entirely attributable to degradation alone. No reaction products were detected (i.e., chloride or organic acids) in the companion ampules stored at 22°C while a rate of TCE loss was apparent in these ampules. Thus, a second method for interpreting the rate of TCE loss from ampules incubated at 120°C involved adding the apparent amount of TCE lost from the ampules, based on the amount of TCE detected in the ampules stored at 22°C, to the amount of TCE detected in the 120°C ampules. Non-degradative loss of TCE was thought to occur after cooling the 120°C ampules to room temperature (22°C), which was potentially due to sorption to ampule walls or solids, when present. Equation C.2 corrects for the loss of TCE from the 22°C ampules:
0
0
25 120 Cln
TCETCE TCE TCE − −
(C.2)
The loss of TCE after correcting for the apparent loss from the 22°C ampules is shown in Figures C.5 through C.8. The first order rates shown in these figures are reported in Table C.1.
The final method used to determine the rate of TCE degradation was based on the amount of reaction products detected. The sum of carbon represented by CO, CO2, formate, and glycolate were subtracted from the average initial amount of TCE according to the following equation:
[ ]0
0
2ln
CarbonTCE
TCE
Σ−
(C.3)
The rate of TCE degradation was also determined based on the amount of chloride detected using Equation C.4:
[ ]0
0
3ln
ChlorideTCE
TCE
Σ−
(C.4)
Figures C.9 through C.12 show plots of Equations C.2, C.3, and C.4 for the ampule results.
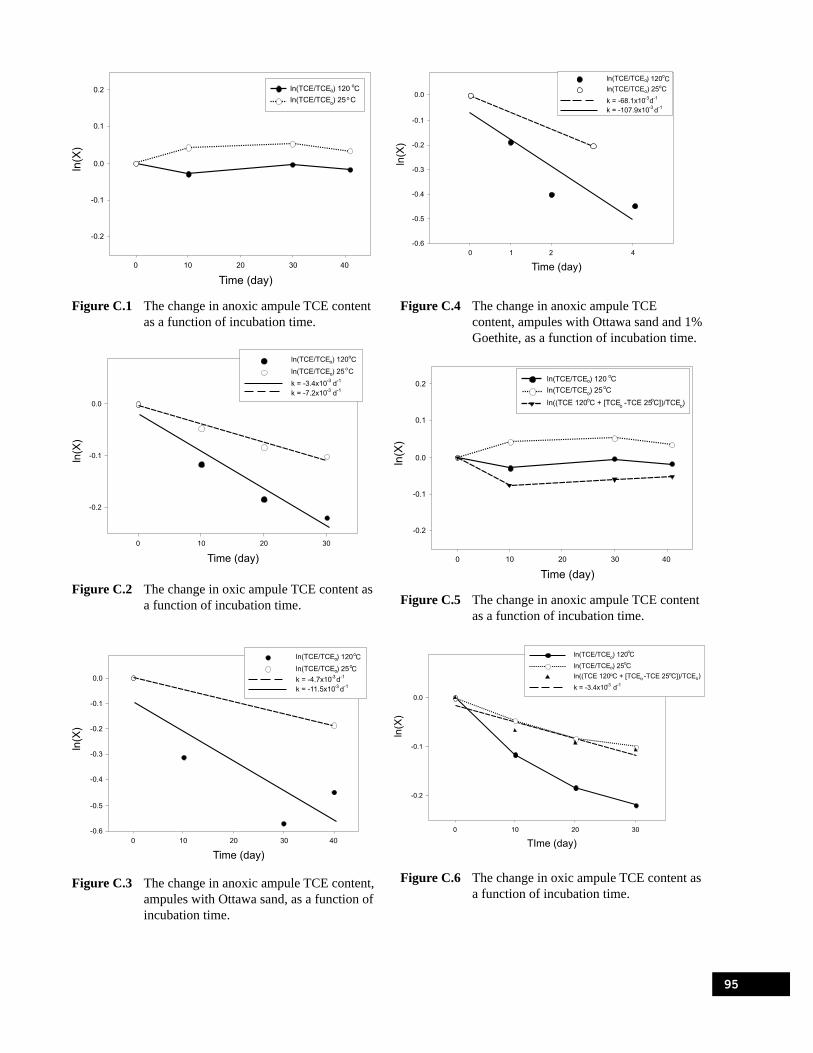
95
Figure C.1 The change in anoxic ampule TCE content as a function of incubation time.
Figure C.2 The change in oxic ampule TCE content as a function of incubation time.
Figure C.3 The change in anoxic ampule TCE content, ampules with Ottawa sand, as a function of incubation time.
Figure C.4 The change in anoxic ampule TCE content, ampules with Ottawa sand and 1% Goethite, as a function of incubation time.
Figure C.5 The change in anoxic ampule TCE content as a function of incubation time.
Figure C.6 The change in oxic ampule TCE content as a function of incubation time.

96
Figure C.7 The change in anoxic ampule TCE content, ampules with Ottawa sand, as a function of incubation time.
Figure C.8 The change in anoxic ampule TCE content, ampules with Ottawa sand and 1% Goethite, as a function of incubation time.
Figure C.9 The change in anoxic ampule TCE content based on detected reaction products.
Figure C.10 The change in oxic ampule TCE content based on detected reaction products.
Figure C.11 The change in anoxic ampule TCE content, ampules with Ottawa sand, based on detected reaction products.
Figure C.12 The change in anoxic ampule TCE content, ampules with Ottawa sand and 1% Goethite, based on detected reaction products.


Office of Research and Development (8101R) Washington, DC 20460
Official Business Penalty for Private Use $300
PRESORTED STANDARDPOSTAGE & FEES PAID
EPAPERMIT NO. G-35

EPA
/600/R-07/091 E
ffects of T
hermal Treatm
ents on the C
hemical R
eactivity of Trichlo
roethylene