effects of tourism on rates of serious crime in hawai`i
TRANSCRIPT

JOHN M. KNOX & ASSOCIATES, INC.
EFFECTS OF TOURISM ON RATES
OF SERIOUS CRIME IN HAWAI`I
Prepared for Use of the Hawai`i State Department of the Attorney General, Crime Prevention and Justice Assistance Division (Portion of a report originally prepared for the Project, “ Planning for Sustainable Tourism in Hawai`i,” under the auspices of the Hawai`i State Department of Business, Economic Development & Tourism) Prepared by: John M. Knox & Associates, Inc.
April 2004
________________________________________________ 1001 Bishop St., ASB Tower 1542 Honolulu, Hawai`i 96813 USA Phone (808) 523-1352 Fax (808) 523-1353 E-Mail [email protected]

Effects of Tourism on Rates of Serious Crime in Hawai`i April 2004
INTRODUCTORY COMMENT This study was originally one chapter in a larger report entitled “Socio-Cultural Impacts of Tourism in Hawai`i: Impacts on the General Population.” That report was Volume II of the Public Input and Socio-Cultural Component for the Project “Planning for Sustainable Tourism in Hawai`i,” sponsored by the Hawai`i State Department of Business, Economic Development, & Tourism (DBEDT). The original report was completed in 2003. Because of frequent requests about the effects of tourism on crime in Hawai`i, the Crime Prevention and Justice Assistance Division of the Department of the Attorney General asked if it could be repackaged as a “stand-alone” report for their use and distribution. This stand-alone version has been somewhat updated. That is, the original contained information about crime, tourism, and most other topics from 1975 through 2001. We are now able to report figures for crime and most other topics through 2002. However, we were unable to obtain information for Sentenced Prison Admissions past 2000. Therefore, correlations and the multiple regression analysis are still based on original figures (i.e., through 2000 only).
ADDITIONAL OBSERVATION REGARDING 2002 DATA As shown in Appendix A charts, Hawai`i property crime rates have again been increasing since 1999, and took a particular jump in 2002. U.S. crime rates continued to decline, so Hawai`i’s property crime rates, at least when expressed as a percentage of national rates, reached record or near-record levels in 2002. Neither tourism nor other possible crime predictors examined in this report changed in 2002 (or the previous year) to anywhere near the extent that property crime did. Obviously, there are many possible determinants of crime that we have not identified. Some, like drug use, may not be directly measurable in a valid and reliable way.
ACKNOWLEDGEMENTS Data and related information were provided by a number of State agencies – the DBEDT Tourism Research Branch, the Department of Labor and Industrial Relations, the Department of Public Safety, and the Department of the Attorney General’s Crime Prevention and Justice Assistance Division. Research assistance came from Marcella Alohalani Boido (assembling data from diverse sources) and Makena Coffman (contributions to literature review). Research associate Aja K. Devoll did much of the production for this 2004 report. Finally, particular acknowledgement is due Dr. John Gartrell – of the University of Hawai`i’s Social Science Research Institute – for his assistance in explaining and conducting statistical analyses at the conclusion of this study.
John M. Knox & Associates, Inc. Page i
Effects of Tourism on Rates of Serious Crime in Hawai`i April 2004
SUMMARY This study involved both a review of the literature about tourism-crime links (in Hawai`i and elsewhere), and also original analysis of Hawai`i crime data. Our analysis and most of the literature focuses on “serious” crime. These are the seven offenses designated by national Uniform Crime Reporting (UCR) procedures – larceny-theft, burglary, auto theft, robbery, aggravated assault, rape, and murder – for which fairly reliable data are kept by law enforcement agencies. While tourism may well be linked with problems like drugs and prostitution, solid data are just not available for these types of crimes. We found that past statistics-based studies almost always turned up some relationship between crime and tourism, but that the exact nature of the relationship varied from time to time or place to place. For example, one study would find a link between tourism and, say, robbery, but no link with larceny. Another study – in a different time or place – would find a link between tourism and larceny, but no link with robbery. This was also generally true for the limited number of past Hawai`i studies, though there was some tendency in previous Hawai`i research to find links with burglary and (to a lesser extent) rape. There are many ways to research possible relationships between crime and tourism. One way is to see if visitors are more likely to be victimized than are residents. Some past studies and one effort of our own suggested this is probably the case in Hawai`i, though more for larceny-theft (“rip-offs” at the beach or from cars) than any other crime. However, these studies do not indicate whether such a difference is large enough to make a real dent in crime statistics. Our major analysis involved looking at 28 crime rate trends (seven “serious” crimes in Hawai`i's four different counties) and comparing these trends to changes in visitors as a percentage of overall population, for the period from 1975 to 2002. We found very little match between the overall long-term crime trends and the overall long-term visitor population trends. In fact, for 14 of the 28 comparisons, the correlation was moderately or strongly negative – crime rates tended to be decreasing while visitor rates were increasing.* This does not prove that tourism decreases crime, but it is hardly consistent with the idea that tourism is a major contributor to increases in crime. To the extent that data permitted, we looked at other possible explanations for crime – demographics, unemployment, law enforcement effectiveness – and
* In fact, the only tourism-crime relationships that were consistent over all four counties were negative relationships with murder and with the crime that had been the most consistently linked with tourism in earlier Hawai`i studies – burglary.
John M. Knox & Associates, Inc. Page ii

Effects of Tourism on Rates of Serious Crime in Hawai`i April 2004
found these were almost always more powerful predictors than tourism. Thus, while visitors probably get victimized more than residents, over time this effect is “drowned out” by more powerful forces. Tourism’s effect on crime appears to be a matter of circumstance, not an inevitable outcome. It makes great sense to continue current efforts to control crimes against tourists – volunteer patrols, witness return programs, actions to reimburse victims – but probably more because crime has a negative effect on tourism than the other way around.
John M. Knox & Associates, Inc. Page iii

Effects of Tourism on Rates of Serious Crime in Hawai`i April 2004
CONTENTS
Page
TOURISM AND CRIME IN HAWAI`I 1
A. Introduction and Conclusions 2
B. The Nature of Crime Statistics 3
C. Hawai`i Vs. National Crime Statistics: Quick Overview 5
D. Results of Past Studies on Crime and Tourism 6
1. Academic Literature 6 2. Other Published Information from Hawai`i 10
E. Official Hawai`i Crime Reports Vs. Tourism, 1975-2002 14
1. Description of Data, Study Design, and Rationale 14 2. Results for Long-Term Trends 18
F. Multiple Regression Analysis (Partial Findings) 29
1. Difficulties in Conducting Multiple Regression
with Available Data 30 2. Limited Findings from Multiple Regression
Analysis Residuals 31
APPENDICES APPENDIX A: HAWAI`I STATEWIDE CRIME RATES VS. NATIONAL CRIME RATES A-1 APPENDIX B: DATA USED IN HAWAI`I TOURISM - CRIME ANALYSIS, 1975-2002 B-1 APPENDIX C: REFERENCES FOR TOURISM-CRIME STUDY (FOR EXHIBIT 1) C-1
John M. Knox & Associates, Inc. Page iv
Effects of Tourism on Rates of Serious Crime in Hawai`i April 2004
EXHIBITS No. Page
1 Summary of Academic Studies on Tourism-Crime Linkages 7 2 West Hawai`i Crime Rates 10 3 Hawai`i Tourist and Resident Crime Victimization Survey Results 13 4 Trends for Tourism Vs. Index Offense Crimes, 1975-2002-O`AHU 20 5 Other Possible Predictors and Correlations with Crime Rates 21 6 Trends for Tourism Vs. Index Offense Crimes, 1971-2002 - HAWAI`I COUNTY 22 7 Other Possible Predictors and Correlations with Crime Rates - HAWAI`I COUNTY 23 8 Trends for Tourism Vs. Index Offense Crimes, 1975-2002 - KAUA`I COUNTY 24 9 Other Possible Predictors and Correlations with Crime Rates - KAUA`I COUNTY 25 10 Trends for Tourism Vs. Index Offense Crimes, 1975-2002 - MAUI COUNTY 26 11 Other Possible Predictors and Correlations with Crime Rates - MAUI COUNTY 27 12 Regression Analysis of Residuals, Using O`ahu Aggravated Assault As Dependent Variable 33 13 Regression Analysis of Residuals, using O`ahu Larceny As Dependent Variable 33 14 Regression Analysis of Residuals, Using Maui Aggravated Assault As Dependent Variable 34 APPENDIX A: HAWAI`I STATEWIDE CRIME RATES VS. NATIONAL CRIME RATES, 1975-2002 A-1 Comparing Hawai`i Vs. U.S. Total Crime Rates 37 A-2 Comparing Hawai`i Vs. U.S. Larceny – Theft Rates 38 A-3 Comparing Hawai`i Vs. U.S. Burglary Rates 39 A-4 Comparing Hawai`i Vs. U.S. Motor Vehicle Theft Rates 40 A-5 Comparing Hawai`i Vs. U.S. Aggravated Assault Rates 41 A-6 Comparing Hawai`i Vs. U.S. Robbery Rates 42 A-7 Comparing Hawai`i Vs. U.S. Forcible Rape Rates 43 A-8 Comparing Hawai`i Vs. U.S. Murder Rates 44 APPENDIX B: DATA USED IN HAWAI`I TOURISM – CRIME ANALYSIS, 1975-2002 B-1 Raw Data Used for O`ahu Analyses 46 B-2 Raw Data Used for Hawai`i County Analyses 47 B-3 Raw Data Used for Kaua`i County Analyses 48 B-4 Raw Data Used for Maui County Analyses 49
John M. Knox & Associates, Inc. Page v
Effects of Tourism on Rates of Serious Crime in Hawai`i April 2004
TOURISM AND CRIME IN HAWAI`I
John M. Knox & Associates, Inc. Page 1

Effects of Tourism on Rates of Serious Crime in Hawai`i April 2004
TOURISM AND CRIME IN HAWAI`I
A. Introduction and Conclusions In recent surveys sponsored by the State government, roughly half of Hawai`i residents have said they believe tourism makes crime “worse.”1 The purpose of this part of the study is to review available evidence about the extent to which this is actually true. We will both examine past studies and also present some original analysis based on annual “serious crime” data – i.e., government-defined “Index Offenses” – since 1975. (We cannot analyze effects on relatively “minor” crimes such as prostitution and drugs, though these may well be tourism-linked.) Since our procedure involves looking at a variety of data and studies, our conclusions cannot be a simple “yes” or “no.” Rather, this study will show that:
• The relationship between serious crime and tourism varies from place to place and time to time. It is a matter of local circumstances.
• Past studies – in Hawai`i and elsewhere – have usually found some link
between some type/definition of “crime” (e.g., change in larceny rates) and some type/definition of “tourism” (e.g., change in numbers of tourists) … but not between others (e.g., no relationship to violent crime, or no relationship when “tourism” is defined in terms of rooms or jobs).
• The past studies we reviewed usually found that tourism was more
statistically linked to certain property crimes than to violent crimes. However, there was no universal crime-tourism relationship that always held true in every place at every time.
• Some Hawai`i studies, backed up by new analysis in this report based
on crime victimization surveys, suggest tourists are more likely than residents to report being the victims of some crimes – particularly larceny-theft (e.g., thefts from parked cars or valuables left in public places). Compared to other states, Hawai`i has a very high larceny rate.
• However, changes in various county crime rates from 1975 to 2002 do
not usually seem to relate in any clear and consistent way with changes in tourism during the same period. An apparent link between crime and tourism in one county was often not apparent in others.
1 Percentages saying tourism makes crime “worse” were 44% in 1999, 63% in 2001, and 41% in 2002. (In 2002, only 8% said tourism makes the crime situation “better.”) Market Trends Pacific, Inc. and John M. Knox & Associates, Inc., “2002 Survey on Resident Sentiments on Tourism in Hawai`i.” Prepared for DBEDT and the Hawai`i Tourism Authority. Honolulu. 2003.
John M. Knox & Associates, Inc. Page 2

Effects of Tourism on Rates of Serious Crime in Hawai`i April 2004
• In many cases, certain crime rates (e.g., Burglary and Murder) generally
went down while tourism generally went up. This is the opposite of public expectations. It does not necessarily prove that “tourism makes crime better,” but it would be consistent with, say, the idea that tourism helps the economy, which in turn dampens the crime rate.
• We tried a more sophisticated statistical approach to find out if tourism
has a greater effect on crime than other measurable factors (such as unemployment or demographic changes). The results were again mixed, possibly due to some limitations in the data. There was a moderate positive link between Aggravated Assault and tourism on O`ahu, countered by negative links between tourism and various other crimes on Maui. But there were no consistent overall tourism-crime linkages.
“Bottom Line:” Tourism can generate crime, but it doesn’t have to. Sometimes it may even have the opposite effect. And in the period of Hawai`i’s history from 1975 to 2002, it seems to have had no major statistical link with Hawai`i crime rates. Tourists may be more likely to get “ripped off” than are locals, but this seems to have less effect on overall crime rates than things like demographics, unemployment, and the effectiveness of the law enforcement system. B. The Nature of Crime Statistics There are many ways to measure crime, including data on things like arrests, juvenile crime, etc. However, most studies look at one or both of two types of crime statistics: 1. Victimization surveys, in which random samples are asked if they have been
victims of any crimes (and/or particular crimes) during a recent specified period of time. The Hawai`i Attorney General’s office conducted a series of such surveys in the 1990s, now discontinued, for residents only.
2. Official police data on reported crime, which, under the FBI’s “Uniform Crime
Reporting” (UCR) system, in turn consist of two categories:
• “Index Offenses” (formerly called “Part 1” crimes), consisting of seven serious crimes which are believed to be reported in a fairly consistent way over different times and places – Murder, Rape, Robbery, and Aggravated Assaults (sometimes added together as a “Total Violent Crime” index), plus Vehicle Theft, Burglary, and Larceny-Theft (sometimes added together as a “Total Property Crime” index).
• “Other Offenses” (formerly called “Part 2” crimes), consisting of everything else. The most important reason these are not included with the “Index Offenses” is that they are far more subject to changes over
John M. Knox & Associates, Inc. Page 3

Effects of Tourism on Rates of Serious Crime in Hawai`i April 2004
time and place in regard to (a) public likelihood of reporting, and/or (b) local law enforcement policies about recording and enforcement.
Following a literature review, this study will primarily focus on Index Offenses and, secondarily, some limited information from victimization surveys. The Index Offenses are considered the most reliable and valid type of crime data. The exclusion of “Other Offenses” (the old “Part 2” category) means we will pay relatively little attention to other crimes often believed to be associated with tourism – including prostitution and drugs.2 The problem is that data for such things are generally confined to arrests rather than reported criminal activities, and changes in arrest data over time may have far less to do with “real” changes in the prevalence of criminal or immoral activity than with changes in law enforcement practices, or other conditions. For example, drug arrests are heavily dependent on the availability of police resources, so that new federal grants (or new airport security systems implemented after the Sept. 11 terrorist attacks) can result in a sudden spike in arrests. These should not be interpreted as a “real” increase in actual drug activity. Index Offenses can be either:
• Raw numbers – the simple count of reports for various types of crime, or
• Crime rates – the number of crimes per 100,000 population.
Rates are generally preferred, because they make it possible to compare the extent of crime as the population in one place changes over time, or to compare two places with very different populations (e.g., O`ahu vs. Kaua`i). However, this leads to the question of what type of “population” will be used to calculate rates:
o Full-time resident population – this is the standard basis used by the FBI for comparing one state’s crime rate to another, or to the national figures.
o “De facto” population (including visitors) – calculated as number of
residents, minus estimated number of residents temporarily away on an average day, plus estimated average daily visitor census. This approach is rarely if ever used by national crime statisticians, but makes sense for Hawai`i because of the high visitor count here.
2 We will, however, include some survey data showing that solicitation by drug dealers is the most frequently type of crime or “safety problem” actually reported by Hawai`i visitors, with solicitation by prostitutes not far behind. Simple observation and anecdotal evidence strongly suggest that prostitution and drug sales are common in more urban tourist areas such as Waikīkī, though it is less certain whether they are as prevalent in more rural Neighbor Island resort areas.
John M. Knox & Associates, Inc. Page 4
Effects of Tourism on Rates of Serious Crime in Hawai`i April 2004
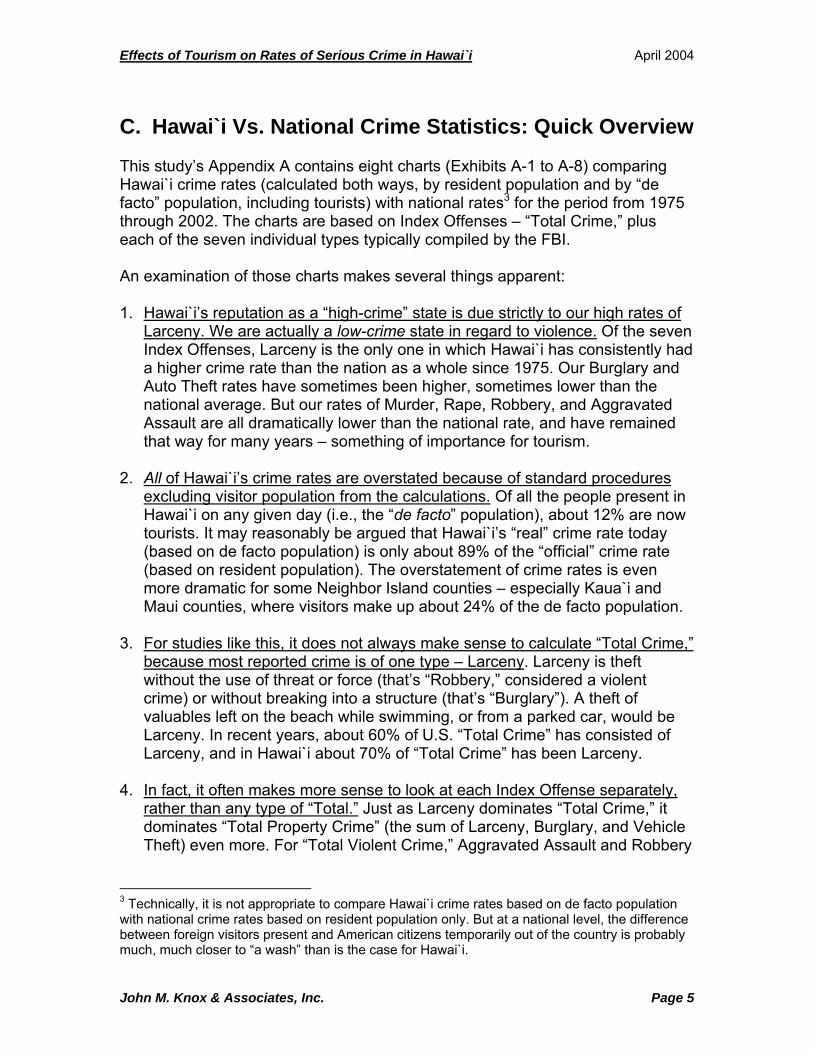
C. Hawai`i Vs. National Crime Statistics: Quick Overview This study’s Appendix A contains eight charts (Exhibits A-1 to A-8) comparing Hawai`i crime rates (calculated both ways, by resident population and by “de facto” population, including tourists) with national rates3 for the period from 1975 through 2002. The charts are based on Index Offenses – “Total Crime,” plus each of the seven individual types typically compiled by the FBI. An examination of those charts makes several things apparent: 1. Hawai`i’s reputation as a “high-crime” state is due strictly to our high rates of
Larceny. We are actually a low-crime state in regard to violence. Of the seven Index Offenses, Larceny is the only one in which Hawai`i has consistently had a higher crime rate than the nation as a whole since 1975. Our Burglary and Auto Theft rates have sometimes been higher, sometimes lower than the national average. But our rates of Murder, Rape, Robbery, and Aggravated Assault are all dramatically lower than the national rate, and have remained that way for many years – something of importance for tourism.
2. All of Hawai`i’s crime rates are overstated because of standard procedures
excluding visitor population from the calculations. Of all the people present in Hawai`i on any given day (i.e., the “de facto” population), about 12% are now tourists. It may reasonably be argued that Hawai`i’s “real” crime rate today (based on de facto population) is only about 89% of the “official” crime rate (based on resident population). The overstatement of crime rates is even more dramatic for some Neighbor Island counties – especially Kaua`i and Maui counties, where visitors make up about 24% of the de facto population.
3. For studies like this, it does not always make sense to calculate “Total Crime,”
because most reported crime is of one type – Larceny. Larceny is theft without the use of threat or force (that’s “Robbery,” considered a violent crime) or without breaking into a structure (that’s “Burglary”). A theft of valuables left on the beach while swimming, or from a parked car, would be Larceny. In recent years, about 60% of U.S. “Total Crime” has consisted of Larceny, and in Hawai`i about 70% of “Total Crime” has been Larceny.
4. In fact, it often makes more sense to look at each Index Offense separately,
rather than any type of “Total.” Just as Larceny dominates “Total Crime,” it dominates “Total Property Crime” (the sum of Larceny, Burglary, and Vehicle Theft) even more. For “Total Violent Crime,” Aggravated Assault and Robbery
3 Technically, it is not appropriate to compare Hawai`i crime rates based on de facto population with national crime rates based on resident population only. But at a national level, the difference between foreign visitors present and American citizens temporarily out of the country is probably much, much closer to “a wash” than is the case for Hawai`i.
John M. Knox & Associates, Inc. Page 5
Effects of Tourism on Rates of Serious Crime in Hawai`i April 2004
far outweigh Murder or Rape – so it is better to look at them individually rather than in combination.
The charts in Appendix A Exhibits A-1 to A-8 show this difference for “Total Crime” and each of the seven individual types. The part of the initial exhibit for “Total Crime” – i.e., the upper part, based just on resident population – shows total Hawai`i crime rate to be higher than the national rate for each and every year from 1975 through 2002. But when Hawai`i’s crime rate is based on de facto population, for the period from the mid 1980s through the early 1990s our rate was actually slightly below the national average for that timeframe.
5. Since 1975, some types of crime seem to be cyclical, while others are generally rising or falling. Larceny, Vehicle Theft, and Robbery have risen and fallen several times in a cyclical or wave-like fashion, both nationally and in Hawai`i. By contrast, Murder and Burglary has generally been falling over time since 1975, albeit with a disturbing recent upturn for Burglary in Hawai`i. Aggravated Assault (at least in Hawai`i) tends to increase on average. Most, though not all, crimes seem to have strong underlying patterns over time.
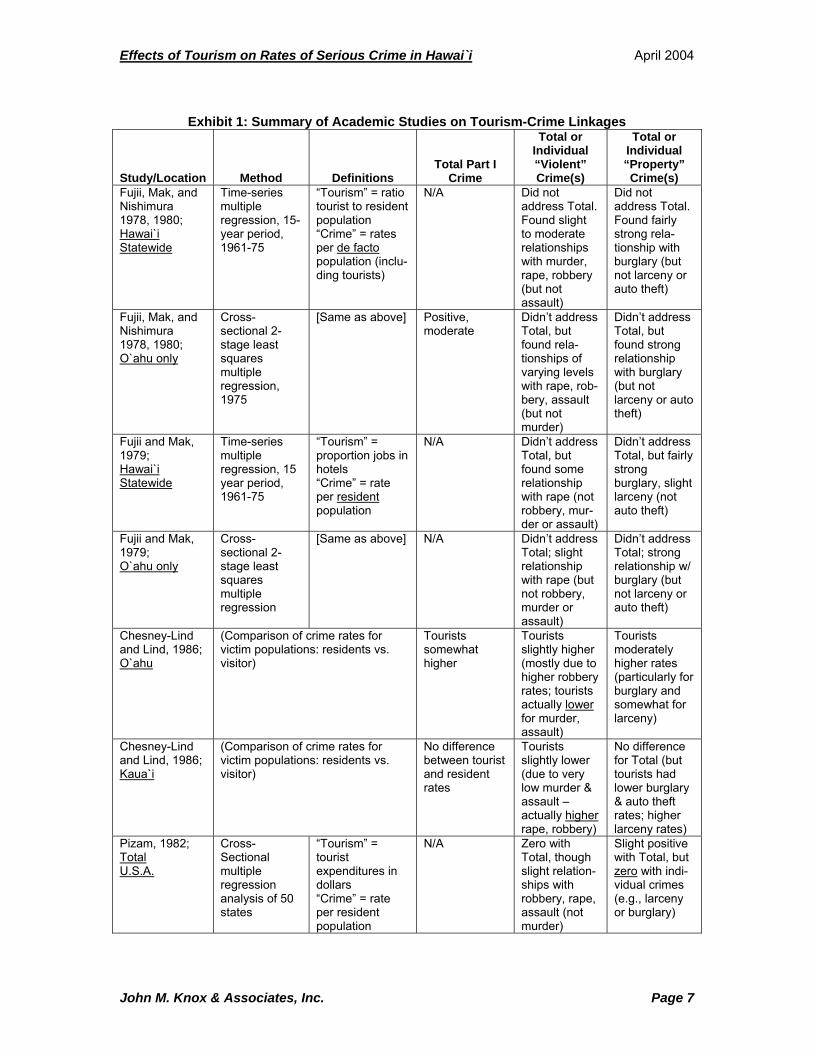
D. Results of Past Studies on Crime and Tourism Our “review of the literature” for this report cannot be as extensive as might be done for an academic journal article, but we believe we have examined most of the more important source materials from (1) academic journals, and (2) other published Hawai`i information, including victimization surveys. 1. Academic Literature Exhibit 1 summarizes key studies conducted in Hawai`i and elsewhere. The Hawai`i studies are now somewhat dated. Several articles by University of Hawai`i economist James Mak and colleagues used data from the 1960s and early 1970s. UH Sociologist Meda Chesney-Lind and her colleague Ian Lind used police data from the late 1970s and early 1980s. Most of the studies conducted outside Hawai`i also go back to the 1970s and early 1980s. Academic literature tends to focus on underlying theories about crime and tourism. The most common theory is that tourism can increase crime because of opportunistic factors – i.e., tourists are often careless with property and/or are available “easy marks.” This suggests that tourism would tend to generate some or all forms of property crimes, but not necessarily violent crimes (with the possible exception of Rape). An alternative but more infrequent hypothesis is that tourism contributes to substantial social disruption (e.g., political resentments), which would also suggest increases in violent crime.
John M. Knox & Associates, Inc. Page 6
Effects of Tourism on Rates of Serious Crime in Hawai`i April 2004
Exhibit 1: Summary of Academic Studies on Tourism-Crime Linkages
Study/Location
Method
Definitions
Total Part I
Crime
Total or Individual “Violent” Crime(s)
Total or Individual “Property” Crime(s)
Fujii, Mak, and Nishimura 1978, 1980; Hawai`i Statewide
Time-series multiple regression, 15-year period, 1961-75
“Tourism” = ratio tourist to resident population “Crime” = rates per de facto population (inclu-ding tourists)
N/A Did not address Total. Found slight to moderate relationships with murder, rape, robbery (but not assault)
Did not address Total. Found fairly strong rela-tionship with burglary (but not larceny or auto theft)
Fujii, Mak, and Nishimura 1978, 1980; O`ahu only
Cross-sectional 2-stage least squares multiple regression, 1975
[Same as above] Positive, moderate
Didn’t address Total, but found rela-tionships of varying levels with rape, rob- bery, assault (but not murder)
Didn’t address Total, but found strong relationship with burglary (but not larceny or auto theft)
Fujii and Mak, 1979; Hawai`i Statewide
Time-series multiple regression, 15 year period, 1961-75
“Tourism” = proportion jobs in hotels “Crime” = rate per resident population
N/A Didn’t address Total, but found some relationship with rape (not robbery, mur-der or assault)
Didn’t address Total, but fairly strong burglary, slight larceny (not auto theft)
Fujii and Mak, 1979; O`ahu only
Cross-sectional 2-stage least squares multiple regression
[Same as above] N/A Didn’t address Total; slight relationship with rape (but not robbery, murder or assault)
Didn’t address Total; strong relationship w/ burglary (but not larceny or auto theft)
Chesney-Lind and Lind, 1986; O`ahu
(Comparison of crime rates for victim populations: residents vs. visitor)
Tourists somewhat higher
Tourists slightly higher (mostly due to higher robbery rates; tourists actually lower for murder, assault)
Tourists moderately higher rates (particularly for burglary and somewhat for larceny)
Chesney-Lind and Lind, 1986; Kaua`i
(Comparison of crime rates for victim populations: residents vs. visitor)
No difference between tourist and resident rates
Tourists slightly lower (due to very low murder & assault – actually higher rape, robbery)
No difference for Total (but tourists had lower burglary & auto theft rates; higher larceny rates)
Pizam, 1982; Total U.S.A.
Cross-Sectional multiple regression analysis of 50 states
“Tourism” = tourist expenditures in dollars “Crime” = rate per resident population
N/A Zero with Total, though slight relation-ships with robbery, rape, assault (not murder)
Slight positive with Total, but zero with indi-vidual crimes (e.g., larceny or burglary)
John M. Knox & Associates, Inc. Page 7

Effects of Tourism on Rates of Serious Crime in Hawai`i April 2004
Exhibit 1: Summary of Academic Studies on Tourism-Crime Linkages
Study/Location
Method
Definitions
Total Part I
Crime
Total or Individual “Violent” Crime(s)
Total or Individual “Property” Crime(s)
Jud, 1975; Total Mexico
Cross-sectional regression analysis of 32 states
“Tourism” = no. of int’l level hotel rooms per capita resident population “Crime” = rate per resident population
Positive, moderate (but only for crimes by males)
Strong with robbery, slight with rape (but zero for murder or assault)
Moderate rela-tionship with larceny
McPheters and Strong, 1974; Miami, Florida
Time-series simple regression for months of one year featuring seasonal fluctuation
“Tourism” = employment in eating and drinking places “Crime”= numbers of reported offenses
Positive, slight/moderate
Moderate pos-itive relation-ship for robbery only (but not murder, rape, or assault)
Strong to moderate with burglary and larceny (but not auto theft)
Schiebler, Crotts, and Hollinger, 1996; ten “most visited counties” in Florida
Simple correlation between reported tourist victimization rates and various possible predictors, including annual number of visitors
“Tourist” = Non-resident of Florida “Crimes against Tourists” = total number of crimes (Part I) divided by estimated total number of visitors without regard to length of stay, victimization rate
Tourist crime rates were higher in areas with higher rates of poverty and minority populations.
Study did not address crimes below “Total Part 1” level. This was really not so much a study of whether tourism is associ-ated with more crime as it was a study of where crimes against tourists are more likely to occur. The conclusion was that areas with conditions conducive to high level of criminality will result in more crimes against tourists, even if more police or security personnel are present.
Albuquerque and McElroy, 1999; Barbados
Comparison of crime rates for victim populations: residents vs. visitor for three years
“Tourism” = total # of stayover tourists in day x avg. length of stay + daily arrival on cruise ships “Crime” = serious offenses (violent/property) committed against tourists/residents
Tourists higher victimization rates overall (because crime is mostly property).
Tourists much lower for murder and “major wound-ing,” though higher for robbery; rape varies by year
Tourists significantly higher for Total and various specific types of larceny and burglary
Walmsey, Boskovic, and Pigram, 1983; Tweed Heads, Ballina, and Port Macquarie (coastal resorts) Australia
Comparison of the percentage distribution of types of crimes (“tourist towns” vs. control areas), for one year
“Tourism” = Coastal resort areas “Crime” = indicator based on police work loads
More crime in non-tourist areas than tourist areas, crime rate activities in tourist areas coincide with “tourist seasons”
On percentage basis, fewer sexual assaults in non-tourist locations
More drug offenses and “day-time crime” in non-tourist locations
Note: See Appendix C for full citations for studies referenced in this exhibit.
John M. Knox & Associates, Inc. Page 8
Effects of Tourism on Rates of Serious Crime in Hawai`i April 2004
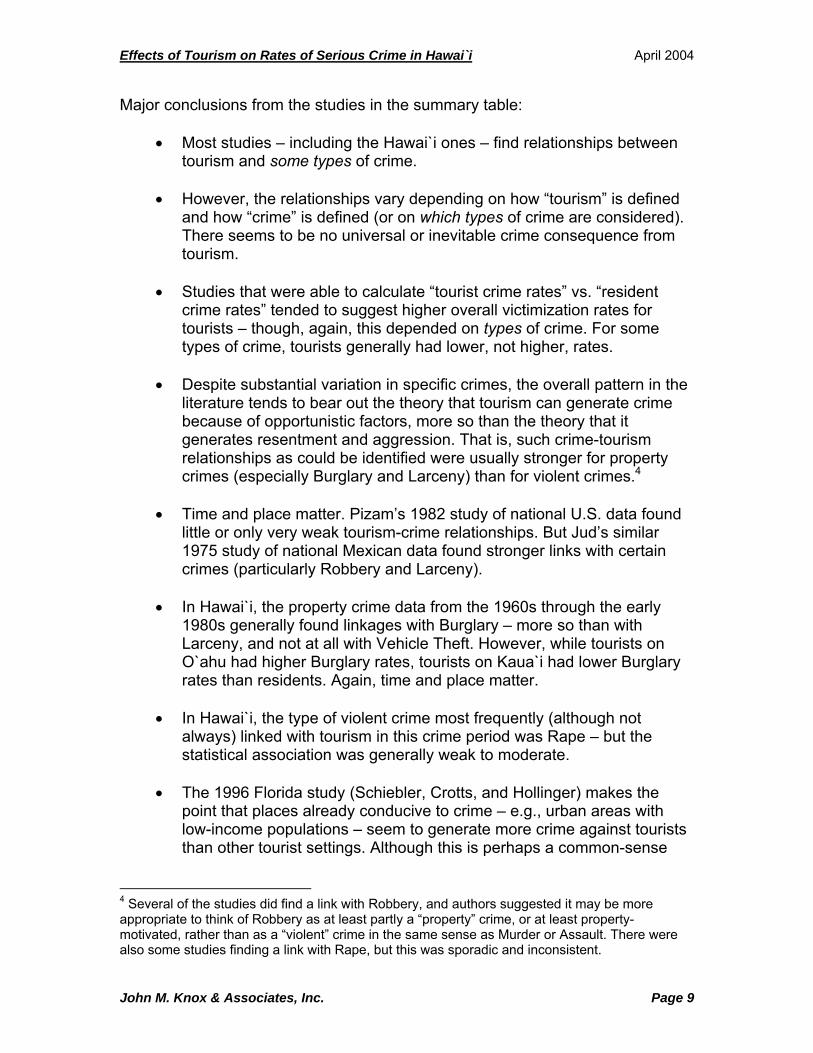
Major conclusions from the studies in the summary table: • Most studies – including the Hawai`i ones – find relationships between
tourism and some types of crime.
• However, the relationships vary depending on how “tourism” is defined and how “crime” is defined (or on which types of crime are considered). There seems to be no universal or inevitable crime consequence from tourism.
• Studies that were able to calculate “tourist crime rates” vs. “resident
crime rates” tended to suggest higher overall victimization rates for tourists – though, again, this depended on types of crime. For some types of crime, tourists generally had lower, not higher, rates.
• Despite substantial variation in specific crimes, the overall pattern in the
literature tends to bear out the theory that tourism can generate crime because of opportunistic factors, more so than the theory that it generates resentment and aggression. That is, such crime-tourism relationships as could be identified were usually stronger for property crimes (especially Burglary and Larceny) than for violent crimes.4
• Time and place matter. Pizam’s 1982 study of national U.S. data found
little or only very weak tourism-crime relationships. But Jud’s similar 1975 study of national Mexican data found stronger links with certain crimes (particularly Robbery and Larceny).
• In Hawai`i, the property crime data from the 1960s through the early
1980s generally found linkages with Burglary – more so than with Larceny, and not at all with Vehicle Theft. However, while tourists on O`ahu had higher Burglary rates, tourists on Kaua`i had lower Burglary rates than residents. Again, time and place matter.
• In Hawai`i, the type of violent crime most frequently (although not
always) linked with tourism in this crime period was Rape – but the statistical association was generally weak to moderate.
• The 1996 Florida study (Schiebler, Crotts, and Hollinger) makes the
point that places already conducive to crime – e.g., urban areas with low-income populations – seem to generate more crime against tourists than other tourist settings. Although this is perhaps a common-sense
4 Several of the studies did find a link with Robbery, and authors suggested it may be more appropriate to think of Robbery as at least partly a “property” crime, or at least property-motivated, rather than as a “violent” crime in the same sense as Murder or Assault. There were also some studies finding a link with Rape, but this was sporadic and inconsistent.
John M. Knox & Associates, Inc. Page 9
Effects of Tourism on Rates of Serious Crime in Hawai`i April 2004
conclusion, it argues against “statewide” analysis of Hawai`i tourism-crime data, since O`ahu and Neighbor Island conditions differ greatly.
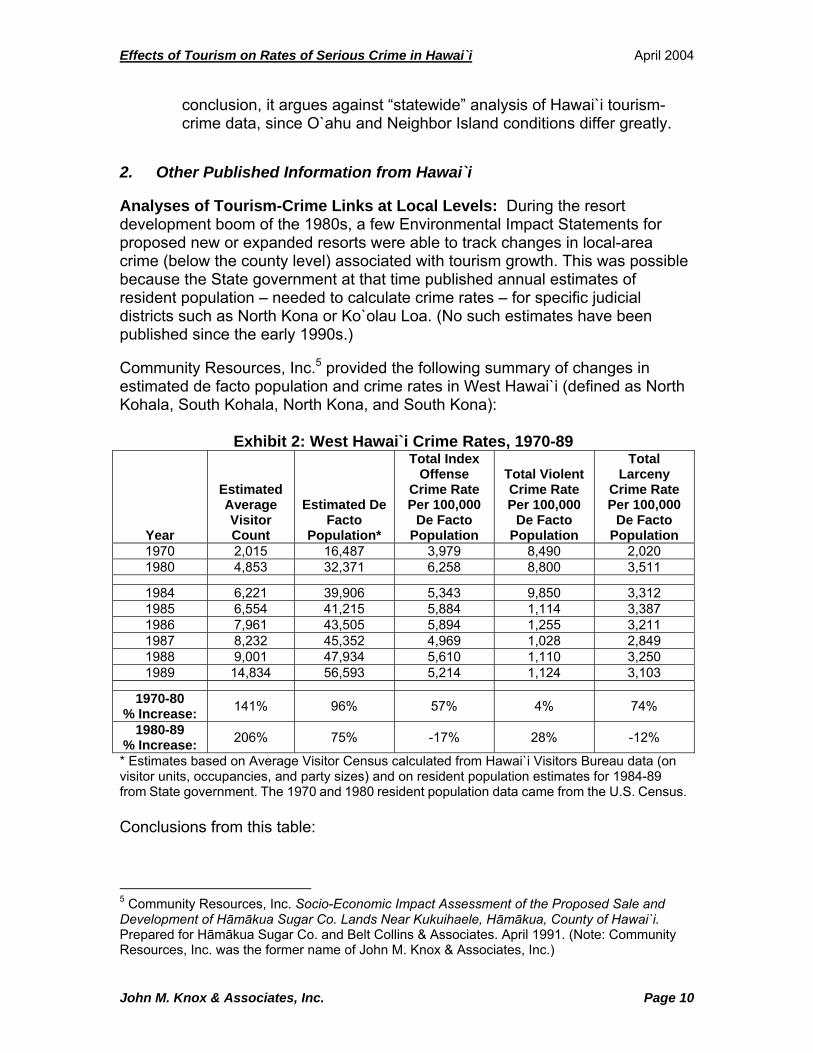
2. Other Published Information from Hawai`i Analyses of Tourism-Crime Links at Local Levels: During the resort development boom of the 1980s, a few Environmental Impact Statements for proposed new or expanded resorts were able to track changes in local-area crime (below the county level) associated with tourism growth. This was possible because the State government at that time published annual estimates of resident population – needed to calculate crime rates – for specific judicial districts such as North Kona or Ko`olau Loa. (No such estimates have been published since the early 1990s.) Community Resources, Inc.5 provided the following summary of changes in estimated de facto population and crime rates in West Hawai`i (defined as North Kohala, South Kohala, North Kona, and South Kona):
Exhibit 2: West Hawai`i Crime Rates, 1970-89
Year
Estimated Average Visitor Count
Estimated De Facto
Population*
Total Index Offense
Crime Rate Per 100,000
De Facto Population
Total Violent Crime Rate Per 100,000
De Facto Population
Total Larceny
Crime Rate Per 100,000
De Facto Population
1970 2,015 16,487 3,979 8,490 2,020 1980 4,853 32,371 6,258 8,800 3,511
1984 6,221 39,906 5,343 9,850 3,312 1985 6,554 41,215 5,884 1,114 3,387 1986 7,961 43,505 5,894 1,255 3,211 1987 8,232 45,352 4,969 1,028 2,849 1988 9,001 47,934 5,610 1,110 3,250 1989 14,834 56,593 5,214 1,124 3,103
1970-80 % Increase: 141% 96% 57% 4% 74%
1980-89 % Increase: 206% 75% -17% 28% -12%
* Estimates based on Average Visitor Census calculated from Hawai`i Visitors Bureau data (on visitor units, occupancies, and party sizes) and on resident population estimates for 1984-89 from State government. The 1970 and 1980 resident population data came from the U.S. Census. Conclusions from this table:
5 Community Resources, Inc. Socio-Economic Impact Assessment of the Proposed Sale and Development of Hāmākua Sugar Co. Lands Near Kukuihaele, Hāmākua, County of Hawai`i. Prepared for Hāmākua Sugar Co. and Belt Collins & Associates. April 1991. (Note: Community Resources, Inc. was the former name of John M. Knox & Associates, Inc.)
John M. Knox & Associates, Inc. Page 10
Effects of Tourism on Rates of Serious Crime in Hawai`i April 2004
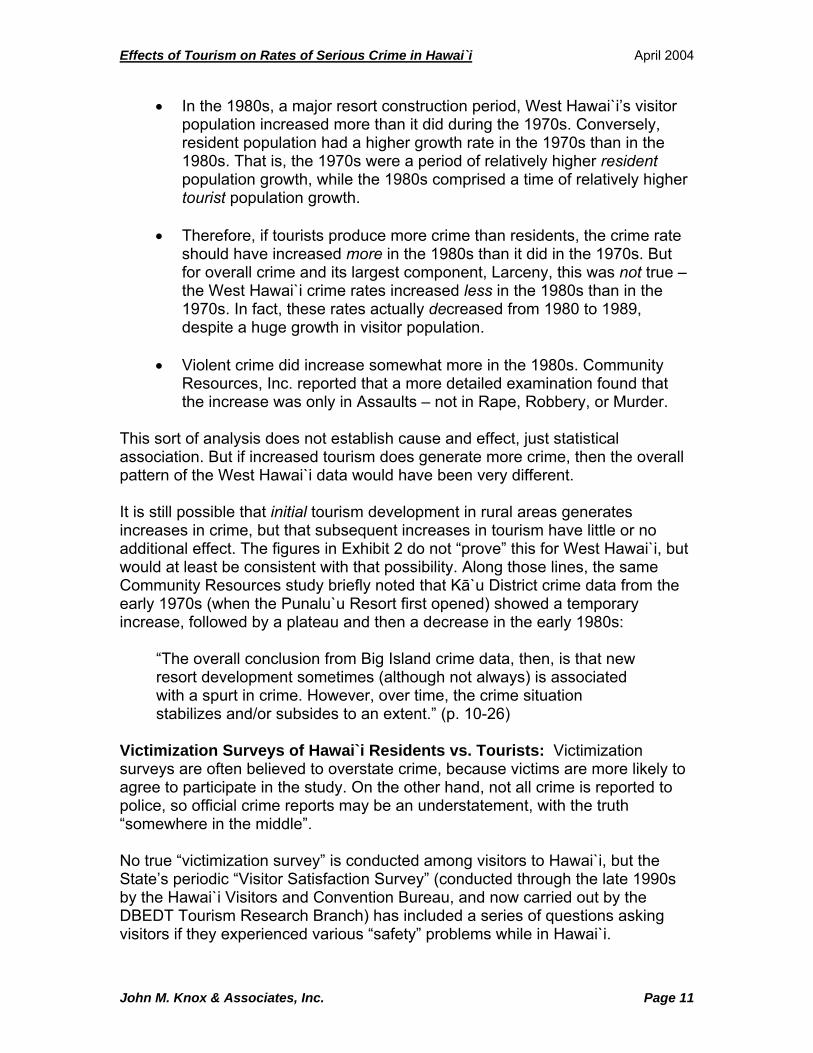
• In the 1980s, a major resort construction period, West Hawai`i’s visitor population increased more than it did during the 1970s. Conversely, resident population had a higher growth rate in the 1970s than in the 1980s. That is, the 1970s were a period of relatively higher resident population growth, while the 1980s comprised a time of relatively higher tourist population growth.
• Therefore, if tourists produce more crime than residents, the crime rate
should have increased more in the 1980s than it did in the 1970s. But for overall crime and its largest component, Larceny, this was not true – the West Hawai`i crime rates increased less in the 1980s than in the 1970s. In fact, these rates actually decreased from 1980 to 1989, despite a huge growth in visitor population.
• Violent crime did increase somewhat more in the 1980s. Community
Resources, Inc. reported that a more detailed examination found that the increase was only in Assaults – not in Rape, Robbery, or Murder.
This sort of analysis does not establish cause and effect, just statistical association. But if increased tourism does generate more crime, then the overall pattern of the West Hawai`i data would have been very different. It is still possible that initial tourism development in rural areas generates increases in crime, but that subsequent increases in tourism have little or no additional effect. The figures in Exhibit 2 do not “prove” this for West Hawai`i, but would at least be consistent with that possibility. Along those lines, the same Community Resources study briefly noted that Kā`u District crime data from the early 1970s (when the Punalu`u Resort first opened) showed a temporary increase, followed by a plateau and then a decrease in the early 1980s:
“The overall conclusion from Big Island crime data, then, is that new resort development sometimes (although not always) is associated with a spurt in crime. However, over time, the crime situation stabilizes and/or subsides to an extent.” (p. 10-26)
Victimization Surveys of Hawai`i Residents vs. Tourists: Victimization surveys are often believed to overstate crime, because victims are more likely to agree to participate in the study. On the other hand, not all crime is reported to police, so official crime reports may be an understatement, with the truth “somewhere in the middle”. No true “victimization survey” is conducted among visitors to Hawai`i, but the State’s periodic “Visitor Satisfaction Survey” (conducted through the late 1990s by the Hawai`i Visitors and Convention Bureau, and now carried out by the DBEDT Tourism Research Branch) has included a series of questions asking visitors if they experienced various “safety” problems while in Hawai`i.
John M. Knox & Associates, Inc. Page 11

Effects of Tourism on Rates of Serious Crime in Hawai`i April 2004
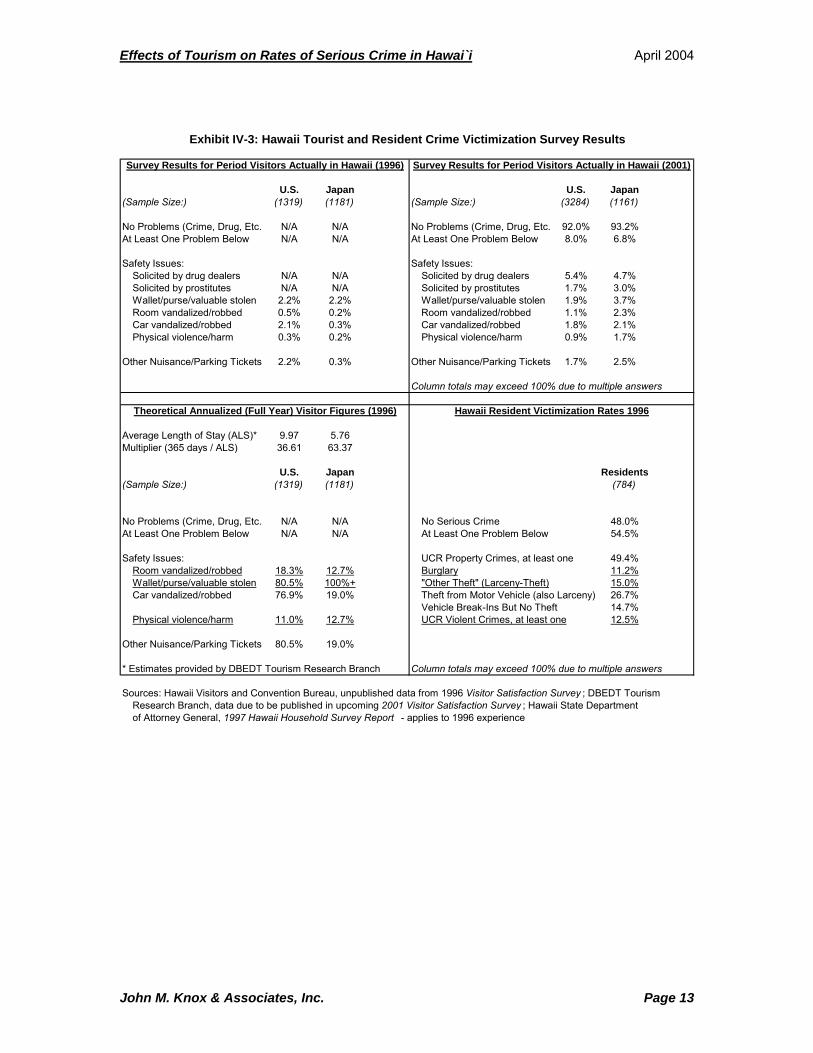
In the 1990s, the Hawai`i State Department of Attorney General conducted a series of household surveys about attitudes toward crime, including victimization questions. Data were collected covering reported crime victimization experiences for each year from 1993 through 1997. The top half of Exhibit 3 shows results of the visitor questions for 1996 vs. 2001. (In 2001, DBEDT added several items about solicitation by prostitutes or drug dealers, and also included an analysis of how many people had experienced none of the “safety” problems at all.) This top part indicates:
• Among Japanese visitors, reported crime victimization percentages increased in all categories from 1996 to 2001. The figures for U.S. visitors did not change so clearly or consistently.
• In 2001, the most frequently reported “safety” issue was solicitation by
drug dealers. Japanese visitors also had a relatively high rate of reported solicitation by prostitutes, more so than U.S. visitors.
The bottom half of Exhibit 3 provides a rough comparison of crime victimization rates for tourists vs. residents in 1996, the last year in which data are available for both groups.6 The questions and methods are not the same in the two surveys, and so caution should be exercised in drawing conclusions. Also, the visitor figures have been annualized, to make them more comparable to the resident figures. That is, if 1% of a group of tourists report a particular crime, and if this group happens to stay in Hawai`i for an average of one week, we would assume the “annualized” figure for a full 52-week year would grow to 52%. Key results from this comparison would be:
• As of 1996, resident and annualized tourist victimization rates were very similar for violent crimes and for burglary (“room break-ins” for tourists). The U.S. tourist room break-in rate was on the high side, but given sampling error and the rough nature of the comparison, the numbers are still in the “same ballpark.”7
6 This year, 1996, happened to be a peak year for international (mostly Japanese) visitors to Hawai`i. It was also a peak year for reported crime victimization among Hawai`i residents for the 1993-97 surveys. However, as will be seen shortly, official data for crime reported to police put the previous year, 1995, as the peak for the last several decades. 7 However, if the 2001 tourist percentages were annualized in the same way, they would have been much higher than the 1996 resident figures both for violence and for room break-in/burglary. It is hard to know what to make of that, because we do not know what residents would have said in 2001. Given media attention to high crime rates in Hawai`i the past few years, it is arguable that reported resident crime on surveys would have been higher, too.
John M. Knox & Associates, Inc. Page 12
Effects of Tourism on Rates of Serious Crime in Hawai`i April 2004
John M. Knox & Associates, Inc. Page 13
U.S. Japan U.S. Japan(Sample Size:) (1319) (1181) (Sample Size:) (3284) (1161)
No Problems (Crime, Drug, Etc. N/A N/A No Problems (Crime, Drug, Etc. 92.0% 93.2%At Least One Problem Below N/A N/A At Least One Problem Below 8.0% 6.8%
Safety Issues: Safety Issues:Solicited by drug dealers N/A N/A Solicited by drug dealers 5.4% 4.7%Solicited by prostitutes N/A N/A Solicited by prostitutes 1.7% 3.0%Wallet/purse/valuable stolen 2.2% 2.2% Wallet/purse/valuable stolen 1.9% 3.7%Room vandalized/robbed 0.5% 0.2% Room vandalized/robbed 1.1% 2.3%Car vandalized/robbed 2.1% 0.3% Car vandalized/robbed 1.8% 2.1%Physical violence/harm 0.3% 0.2% Physical violence/harm 0.9% 1.7%
Other Nuisance/Parking Tickets 2.2% 0.3% Other Nuisance/Parking Tickets 1.7% 2.5%
Column totals may exceed 100% due to multiple answers
Average Length of Stay (ALS)* 9.97 5.76Multiplier (365 days / ALS) 36.61 63.37
U.S. Japan Residents(Sample Size:) (1319) (1181) (784)
No Problems (Crime, Drug, Etc. N/A N/A No Serious Crime 48.0%At Least One Problem Below N/A N/A At Least One Problem Below 54.5%
Safety Issues: UCR Property Crimes, at least one 49.4%Room vandalized/robbed 18.3% 12.7% Burglary 11.2%Wallet/purse/valuable stolen 80.5% 100%+ "Other Theft" (Larceny-Theft) 15.0%Car vandalized/robbed 76.9% 19.0% Theft from Motor Vehicle (also Larceny) 26.7%
Vehicle Break-Ins But No Theft 14.7%Physical violence/harm 11.0% 12.7% UCR Violent Crimes, at least one 12.5%
Other Nuisance/Parking Tickets 80.5% 19.0%
* Estimates provided by DBEDT Tourism Research Branch Column totals may exceed 100% due to multiple answers
Sources: Hawaii Visitors and Convention Bureau, unpublished data from 1996 Visitor Satisfaction Survey ; DBEDT Tourism Research Branch, data due to be published in upcoming 2001 Visitor Satisfaction Survey ; Hawaii State Departmentof Attorney General, 1997 Hawaii Household Survey Report - applies to 1996 experience
Exhibit IV-3: Hawaii Tourist and Resident Crime Victimization Survey Results
Theoretical Annualized (Full Year) Visitor Figures (1996) Hawaii Resident Victimization Rates 1996
Survey Results for Period Visitors Actually in Hawaii (1996) Survey Results for Period Visitors Actually in Hawaii (2001)
Effects of Tourism on Rates of Serious Crime in Hawai`i April 2004
• However, the tourist larceny (approximated as “wallet/purse/valuables stolen”) numbers were dramatically higher than those for residents. Theoretically, tourists who remained a full year in 1996 would have had an 80% chance of experiencing theft if they were from the U.S. and a 100% chance if they were from Japan.
• Theft from cars is a form of larceny, and the surveys ask about this
issues in differing ways that somewhat interfere with comparison. However, it is apparent that car thefts/break-ins are among the most frequently reported problems for both residents and visitors.
So larceny – the most common type of “serious” crime – emerges as the source of the clearest distinction between visitor and resident self-reported crime on crime victimization surveys. Hawai`i’s high larceny rates, it may be recalled, comprise the one consistent difference between this state’s official reported crime numbers and average national figures over the past quarter-century. However, the question remains whether more “objective” data – i.e., official police reports – will also show any association between tourism and larceny, or tourism and any other crime. That is the focus of the remaining parts of this study. E. Official Hawai`i Crime Reports Vs. Tourism, 1975-2002 Original analysis for this study is presented in this and the following section. This Section E contains simpler information that requires relatively less knowledge of statistics, while the following Section F is more complex and requires relatively more statistical knowledge on the part of the reader. 1. Description of Data, Study Design, and Rationale The basic approach used in this analysis was to gather annual information for the period 1975-2002 for crime, for tourism, and for other things besides tourism that might affect crime in Hawai`i. We defined all our final variables in terms of rates (e.g., crime rates rather than raw numbers of crimes) or percentages (e.g., defining “tourism” as the percent of total de facto population consisting of tourists). However, before explaining this approach further, it may be useful to note some other possible study designs that we decided not to use. Approaches Considered but Not Used: As evident from the foregoing review of literature, conclusions about crime-tourism links can depend on the design of the analysis and the choice of what to measure to represent “crime” or “tourism.”
John M. Knox & Associates, Inc. Page 14
Effects of Tourism on Rates of Serious Crime in Hawai`i April 2004
We looked at, but rejected, several alternative approaches to study design and/or definition of “tourism:” 1. Cross-Sectional (Geographical) Analysis: Instead of looking at trends over
time, we might have taken data for one particular year; calculated the number of various crime reports in particular geographical areas (“tourist areas” vs. other); divided by population to come up with crime rates; and determined whether crime is higher in “tourist areas” than in others. A few of the previous studies mentioned in Exhibit 1 used this approach. The definition of “tourism” here would of course be geographical in nature.
We rejected this approach for two reasons: (a) difficulties in coming up with good criteria for identifying “tourist areas” – e.g., O`ahu tourists often spend time outside Waikīkī and may have cars broken into at coastal or other sites all over the island; and (b) even, more importantly, we have no solid way to determine local-area de facto population outside hotel areas, and that is needed to convert crime counts into actual crime rates.
2. Victim Identification Data in Police Reports: The Chesney-Lind and Lind
(1986) study mentioned in Exhibit 1 used this approach with older O`ahu and Kaua`i data – using police reports to determine whether tourists report crime victimization more than residents do. This would have led to an analysis much like the one just done in Exhibit 3, except using complete data for actual reports to police rather than a victimization survey based just on a sample that might or might not be truly representative. The definition of “tourism” here would be (comparative) reported visitor experience with crime.
This approach proved impractical because the Honolulu Police Department (which has perhaps the best-developed computerized database) advised us that special permission from the Chief would be needed, and manpower shortages in the research department would assure the request would be given low priority. So unlike the possible cross-sectional approach above, we had no conceptual or methodological objection to this approach; we just couldn’t readily do it.
3. Using Simple Number of Tourists Over Time as a Measure of “Tourism”: We
did not do this because increases in the simple number of living human bodies in Hawai`i will always generate both more crime victims and more crime perpetrators. The question is whether “tourist bodies” produce more crime than “resident bodies.”8 So we used tourists as a percentage of total.
4. Using “Visitor Units” as a Measure of “Tourism” in a Time-Series Analysis: We
decided to attempt an analysis based on changes over time, much like that done in Hawai`i by Fujii, Mak, and Nishimura in the late 1970s (see Exhibit
8 And if crime is defined as a rate rather than just total crime numbers, then the number of tourists appears on both sides of the potential equation, since it would be part of the de facto population used in calculating rates. The “tourism” measure needs to be on just one side.
John M. Knox & Associates, Inc. Page 15

Effects of Tourism on Rates of Serious Crime in Hawai`i April 2004
1).9 Their definition of “tourism” in that study was actually the one we have chosen for this – visitors as percentage of de facto population. However, we did look at an available option: Number of visitor units (rooms in hotels, condos, known vacation rentals, etc.) per resident population. Changes over time in this ratio might arguably generate stress and disruption in the resident socio-economic fabric, especially during times of rapid construction outpacing labor supply and thus producing housing shortages.
We ran preliminary time-series analyses using both possible definitions of “tourism” – based on visitors and based on visitor units. In almost every case, such relationships as were found were stronger between crime and tourists than they were between crime and visitor units.10 Therefore, we decided to look only at the previously-stated definition of “tourism” – visitors as a percent of total de facto population (see further discussion immediately below).
Definitions Used for “Crime” and “Tourism:” We chose to examine –
• A definition of “tourism” that consists of percentage of total de facto population comprised of visitors. The logic here is that, if tourists generate significantly more crime of some type, then in years when the population composition shifts to having a higher proportion of visitors relative to residents, those crime rates should go up. That was the same logic used by Fujii, Mak, and Nishimura when they did find a relationship between tourism and some types of Hawai`i crime based on 1961-75 data.
• Separate data for each of the seven “Index Offenses” rather than
summary “Total Crime” or “Total Property Crime” indices, for reasons explained at the beginning of this study.
• Crime rates calculated on a de facto population basis (i.e., including
visitors) rather than a resident-only population basis, also for reasons explained at the beginning of this study.
• Separate data for each of Hawai`i’s four counties, because tourism and
other socio-economic conditions potentially related to crime vary greatly, particularly between O`ahu and the Neighbor Islands but also to some extent among the three Neighbor Island counties.
Having worked through this logic and set of decisions, we gathered the raw data shown in Appendix B Exhibits B-1 to B-4 for each county, and thereafter calculated county-specific crime rates for the seven UCR Index Offenses and
9 They used statewide data, which consists primarily of O`ahu information. So, as previously noted, we thought it better to look separately at results for each county. 10 The only exception out of 28 pairs of correlations examined was Rape, only on O`ahu. One out of 28 suggests a chance relationship, an accidental and not truly meaningful relationship.
John M. Knox & Associates, Inc. Page 16

Effects of Tourism on Rates of Serious Crime in Hawai`i April 2004
county-specific data on “visitors as percent of de facto population” for the 1975-2002 period.11 Definitions Used for Other Possible Predictors of Crime: Based on the Fujii, Mak, and Nishimura study design, on other crime literature, and on the availability of data, we decided to include the following other possible predictors of crime in the analysis: 1. Percent of Resident Population Comprised of Young Males (Aged 15-24):
This is the classic “high-crime cohort,” the portion of the population most likely to commit crimes. If it expands or shrinks, there is a good chance the crime rate will grow or decline. The U.S. Census actually counts people by age and gender during decennial Census years (e.g., 1990 and 2000), and it publishes estimates during the intercensal years.12
2. Unemployment Rate: Many types of crimes (especially property crimes) are
believed to be at least partly “economic” in nature. While no single available variable can be said to be a perfect measure of “The Economy,” unemployment rates published by the Hawai`i State Department of Labor and Industrial Relations are generally considered the best sole indicator.
3. Sentenced Prison Admissions Per Adult Resident Population: An effective law
enforcement system is often presumed to have a deterrent effect on crime. The question is what variable best measures the “effectiveness” of the law enforcement system.13 After discovering the local judicial and prosecutorial systems have no such indicators they consider valid and reliable over time, we looked at three possibilities, all based on unpublished data provided by the Hawai`i State Department of Public Safety:
• Total new prison admissions per 100,000 adult residents aged 20+:14
This includes both people arrested while awaiting trial, those actually beginning sentences, and others such as probation violators.
11 Although earlier studies in Exhibit 1 used crime and tourism data going back to 1961, the 1975 – 2002 data are what the State Attorney General’s office currently has available in published form. Also, it would have been difficult to gather pre-1975 figures for some of the alternative predictors discussed on this page. 12 Exhibits in this section will show a suspicious sudden upswing in the percentages for Hawai`i and Kaua`i Counties in 2000. However, such underestimates for a few years would have only a minor effect on our calculations. (Note: At the time of the original 2003 analysis, data for this and other population variables were available only April 2000. We now can show figures from July 2000 through 2002 in the following charts [although the new 2000-02 data represent estimates from the Centers for Disease Control rather than from the U.S. Census Bureau, so there is a risk of discontinuity in the data source]. However, because we cannot update all other variables through 2002, correlations are still based on 1975-2000.) 13 Fujii, Mak, and Nishimura – in their several studies looking at 1961-75 Hawai`i data – used the ratio of police to population. However, they concluded this ratio was more a response to past crime than an inhibiting determinant of future crime. 14 We used “20+” rather than “18+” as our definition of “adult” simply because the latter population figure was not available from the U.S. Census for intercensal years.
John M. Knox & Associates, Inc. Page 17

Effects of Tourism on Rates of Serious Crime in Hawai`i April 2004
• New prison admissions based on sentenced offenders only: This would be a sub-set of the above, focusing just on those actually given prison sentences.
• Sentenced offenders as percent of total admissions: This presumably
reflects the odds that somebody arrested is actually both convicted and given prison sentences rather than other punishment.
We found all three numbers had increased sharply over time in all counties,15 meaning the data were quite inter-correlated and so it made sense to choose just one. We again looked at the simple correlations with different crimes in different counties. Although the choice was a little less clear-cut than with the different definitions of “tourism,” the best option in terms of relatively strong correlations seemed to be the “Sentenced Admissions,” which also captured the deterrence effect of actual prison sentences and not just arrests. It should be noted that the State data for this variable was available only from 1977 – 2000 (and, on Kaua`i, only from 1979 – 2000), with 1991 data missing due to a change in record-keeping system.
4. Military Population as Percent of De Facto Population: We follow Fujii, Mak,
and Nishimura in including this variable. However, because military population is negligible on the Neighbor Islands, this was considered only for O`ahu. There are a number of slightly differing sources of information about military population. We selected data from the U.S. Dept. of Defense website: http://web1.whs.osd.mil/mmid/military/history/309hist.htm .
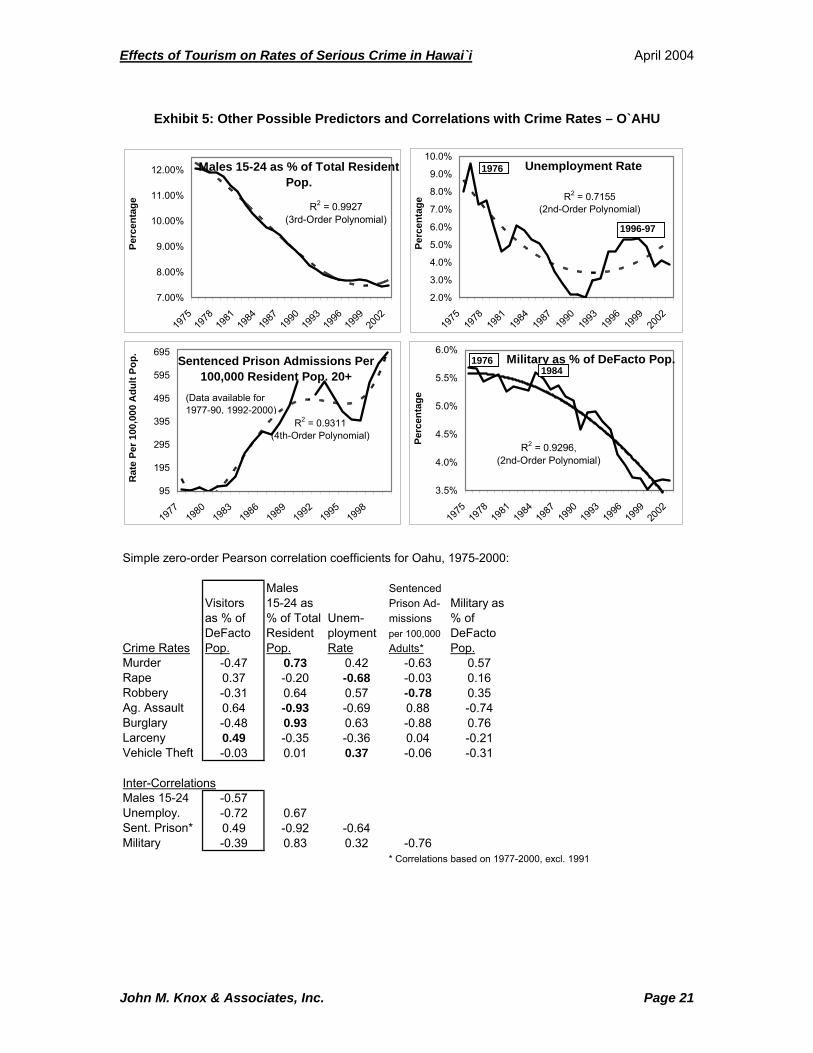
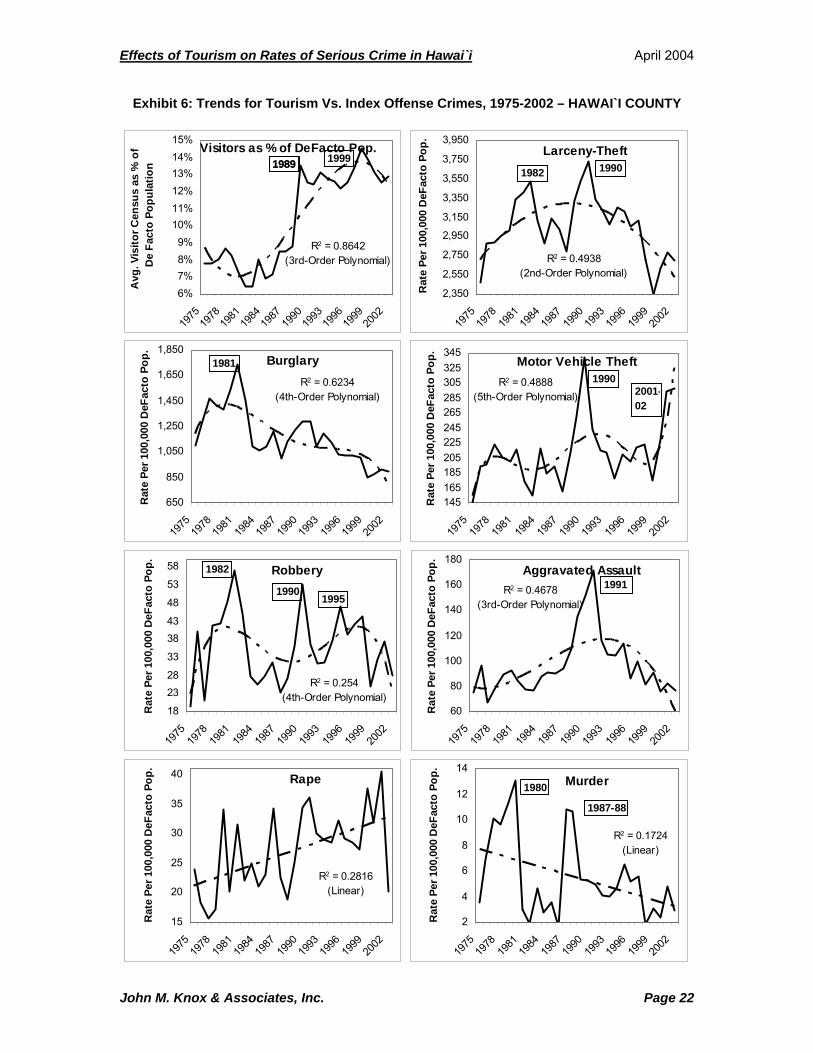
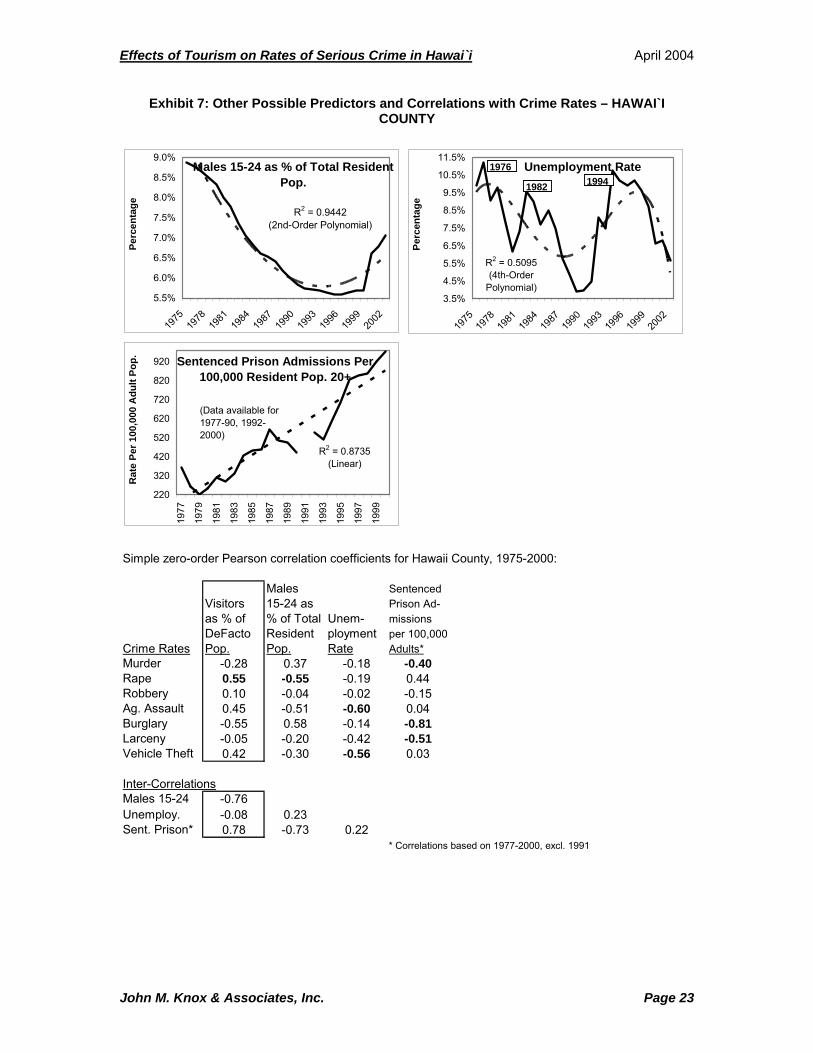
Again, we first gathered the raw data – which is also included in Appendix B Exhibits B-1 to B-4 – and thereafter calculated appropriate rates and percentages for these four variables. 2. Results for Long-Term Trends How Results Are Presented: The first step in a time-series analysis – and probably the one most understandable to non-statisticians – is just to look at the “pictures” of trends over the entire time period for which data are available. Exhibits 4 to 11 provide those pictures for each county.16 These exhibits also provide simple correlations over time. To make it easier to see how the long-term trend lines for crime rates compare to tourism or other possible predictors, each graph in these exhibits contains:
15 Our understanding is that these increases reflect stricter arrest and punishment policies, particularly for drug-related offenses. 16 Separate data for the different islands of Maui County were not available because de facto population estimates are no longer published for intercensal years since the early 1990s.
John M. Knox & Associates, Inc. Page 18

Effects of Tourism on Rates of Serious Crime in Hawai`i April 2004
• Years in which “peaks” or “spikes” are apparent, so one can see if various crime spikes tend to occur in the same year as – or just after – spikes in tourism or other possible predictors of crime.
• Trend lines (shown as dashed lines) which show either the straight line
(“linear”) or curved line (“polynomial”) representing a mathematical equation that gives the “best fit” with actual observed data.17 Each graph includes a note about the type of line that proved the best fit, as well as the R2 value showing whether the fit was fairly good (a higher R2, closer to the upper bound of 1.0) or very poor (low R2, closer to 0.0).
These trend lines – if they are good fits (higher R2 values) – help to smooth out the “noise” in the charts and make it more obvious whether any two charts are similar in appearance.
What the Pictorial Results Say: For each county, the “picture” of change over time in Tourism (“Visitors as % of De Facto Pop.”) does not match well with any of the seven crime “pictures.” The crime peak years rarely match the tourism peak years. And the overall shapes of the four county tourism trend line “pictures” bear little resemblance to the shapes of the trend line “pictures” for the crime rates in the same counties. The only faint exceptions are some vague resemblances between underlying trend lines for O`ahu Tourism and O`ahu Aggravated Assault (and possibly O`ahu Larceny) and between Maui Tourism and Maui Aggravated Assault. But for other counties, the shape of the trend lines for none of the crimes – including Aggravated Assault and Larceny – are a good match with Tourism trend lines. By contrast, some of the pictures for alternative crime predictors – Percent of Young Males in Population, Unemployment, etc. – are a much better match for at least a few of the crime variables in the preceding exhibits. For example, O`ahu’s Burglary rate has dropped fairly steady since 1975, closely matching similar declines in the percentages of population comprised by Young Males and/or Military. Another result from the graphs is that crime data are generally more erratic (present a less clear “picture,” both visually and as shown by low R2 values) for Kaua`i and Hawai`i Counties. This will have implications for subsequent analyses in Section F. What the Correlation Results Say: Exhibits 5, 7, 9, and 11 present simple correlation coefficients for these data over time. Correlation coefficients are a statistical measure of the degree of “match” between two charts such as 17 In the original 2003 study, we did not attempt to fit anything higher than a 4th-order polynomial (i.e., M- or W-shaped curve), but this year observed some patterns that clearly called for 5th-order polynomial “best-fit.” We also checked for other possibilities, such as logarithmic or power curves.
John M. Knox & Associates, Inc. Page 19

Effects of Tourism on Rates of Serious Crime in Hawai`i April 2004
John M. Knox & Associates, Inc. Page 20
Exhibit 4: Trends for Tourism Vs. Index Offense Crimes, 1975-2002 – O`AHU
Burglary
R2 = 0.8386 (Linear)
650
850
1,050
1,250
1,450
1,650
1,850
1975
1978
1981
1984
1987
1990
1993
1996
1999
2002
Rat
e Pe
r 100
,000
DeF
acto
Pop
.
Murder
R2 = 0.5908 (Linear)
2
3
4
5
6
7
8
9
1975
1978
1981
1984
1987
1990
1993
1996
1999
2002
Rat
e Pe
r 100
,000
DeF
acto
Pop
.
19751980
Larceny-TheftR2 = 0.6505
(5th-Order Polynomial)
3,000
3,500
4,000
4,500
5,000
5,500
1975
1978
1981
1984
1987
1990
1993
1996
1999
2002
Rat
e Pe
r 100
,000
DeF
acto
Pop
.
1980
1995Visitors as % of De Facto Pop.
R2 = 0.5146(Pow er Curve)
6.0%6.5%7.0%7.5%8.0%8.5%9.0%9.5%
10.0%10.5%
1975
1978
1981
1984
1987
1990
1993
1996
1999
2002
Avg
. Vis
itor C
ensu
s as
% o
f D
e Fa
cto
Popu
latio
n 1989
Robbery
R2 = 0.7158(4th-Order Polynomial)
90
110
130
150
170
190
210
230
1975
1978
1981
1984
1987
1990
1993
1996
1999
2002
Rat
e Pe
r 100
,000
DeF
acto
Pop
.
1996
1980 Aggravated Assault
R2 = 0.8866(3rd-Order Polynomial)
40
60
80
100
120
140
160
1975
1978
1981
1984
1987
1990
1993
1996
1999
2002
Rat
e Pe
r 100
,000
DeF
acto
Pop
.
19951990
Motor Vehicle Theft
R2 = 0.6113(5th-Order Polynomial)
280
380
480
580
680
780
880
980
1975
1978
1981
1984
1987
1990
1993
1996
1999
2002
Rat
e Pe
r 100
,000
DeF
acto
Pop
.
1995
1979
2002
Rape
R2 = 0.5358(3rd-Order Polynomial
20222426283032343638
1975
1978
1981
1984
1987
1990
1993
1996
1999
2002
Rat
e Pe
r 100
,000
DeF
acto
Pop
.
19871992
2002
Effects of Tourism on Rates of Serious Crime in Hawai`i April 2004
Exhibit 5: Other Possible Predictors and Correlations with Crime Rates – O`AHU
Simple zero-order Pearson correlation coefficients for Oahu, 1975-2000:
Males SentencedVisitors 15-24 as Prison Ad- Military asas % of % of Total Unem- missions % ofDeFacto Resident ployment per 100,000 DeFacto
Crime Rates Pop. Pop. Rate Adults* Pop.Murder -0.47 0.73 0.42 -0.63 0.57Rape 0.37 -0.20 -0.68 -0.03 0.16Robbery -0.31 0.64 0.57 -0.78 0.35Ag. Assault 0.64 -0.93 -0.69 0.88 -0.74Burglary -0.48 0.93 0.63 -0.88 0.76Larceny 0.49 -0.35 -0.36 0.04 -0.21Vehicle Theft -0.03 0.01 0.37 -0.06 -0.31
Inter-CorrelationsMales 15-24 -0.57Unemploy. -0.72 0.67Sent. Prison* 0.49 -0.92 -0.64Military -0.39 0.83 0.32 -0.76
* Correlations based on 1977-2000, excl. 1991
19761984
Males 15-24 as % of Total Resident Pop.
R2 = 0.9927(3rd-Order Polynomial)
7.00%
8.00%
9.00%
10.00%
11.00%
12.00%
1975
1978
1981
1984
1987
1990
1993
1996
1999
2002
Perc
enta
ge
Sentenced Prison Admissions Per 100,000 Resident Pop. 20+
R2 = 0.9311(4th-Order Polynomial)
95
195
295
395
495
595
695
1977
1980
1983
1986
1989
1992
1995
1998
Rat
e Pe
r 100
,000
Adu
lt Po
p.
(Data available for 1977-90, 1992-2000)
Unemployment Rate
R2 = 0.7155(2nd-Order Polynomial)
2.0%
3.0%
4.0%
5.0%
6.0%
7.0%
8.0%
9.0%
10.0%
1975
1978
1981
1984
1987
1990
1993
1996
1999
2002
Perc
enta
ge
1976
1996-97
Military as % of DeFacto Pop.
R2 = 0.9296,(2nd-Order Polynomial)
3.5%
4.0%
4.5%
5.0%
5.5%
6.0%
1975
1978
1981
1984
1987
1990
1993
1996
1999
2002
Perc
enta
ge
19761984
John M. Knox & Associates, Inc. Page 21
Effects of Tourism on Rates of Serious Crime in Hawai`i April 2004
John M. Knox & Associates, Inc. Page 22
Exhibit 6: Trends for Tourism Vs. Index Offense Crimes, 1975-2002 – HAWAI`I COUNTY
Visitors as % of DeFacto Pop.
R2 = 0.8642(3rd-Order Polynomial)
6%7%8%9%
10%11%12%13%14%15%
1975
1978
1981
1984
1987
1990
1993
1996
1999
2002
Avg
. Vis
itor C
ensu
s as
% o
f D
e Fa
cto
Popu
latio
n 1989 19991989
Rape
R2 = 0.2816(Linear)
15
20
25
30
35
40
1975
1978
1981
1984
1987
1990
1993
1996
1999
2002
Rat
e Pe
r 100
,000
DeF
acto
Pop
.Larceny-Theft
R2 = 0.4938(2nd-Order Polynomial)
2,350
2,550
2,750
2,950
3,150
3,350
3,550
3,750
3,950
1975
1978
1981
1984
1987
1990
1993
1996
1999
2002
Rat
e Pe
r 100
,000
DeF
acto
Pop
.
1982 1990
BurglaryR2 = 0.6234
(4th-Order Polynomial)
650
850
1,050
1,250
1,450
1,650
1,850
1975
1978
1981
1984
1987
1990
1993
1996
1999
2002
Rat
e Pe
r 100
,000
DeF
acto
Pop
.
1981 Motor Vehicle TheftR2 = 0.4888
(5th-Order Polynomial)
145165185205225245265285305325345
1975
1978
1981
1984
1987
1990
1993
1996
1999
2002
Rat
e Pe
r 100
,000
DeF
acto
Pop
.
19902001-02
Robbery
R2 = 0.254(4th-Order Polynomial)
18
2328
33
3843
48
53
58
1975
1978
1981
1984
1987
1990
1993
1996
1999
2002
Rat
e Pe
r 100
,000
DeF
acto
Pop
.
19901995
1982 Aggravated AssaultR2 = 0.4678
(3rd-Order Polynomial)
60
80
100
120
140
160
180
1975
1978
1981
1984
1987
1990
1993
1996
1999
2002
Rat
e Pe
r 100
,000
DeF
acto
Pop
.
1991
Murder
R2 = 0.1724(Linear)
2
4
6
8
10
12
14
1975
1978
1981
1984
1987
1990
1993
1996
1999
2002
Rat
e Pe
r 100
,000
DeF
acto
Pop
.
1980
1987-88
Effects of Tourism on Rates of Serious Crime in Hawai`i April 2004
Exhibit 7: Other Possible Predictors and Correlations with Crime Rates – HAWAI`I COUNTY
Simple zero-order Pearson correlation coefficients for Hawaii County, 1975-2000:
Males SentencedVisitors 15-24 as Prison Ad-as % of % of Total Unem- missionsDeFacto Resident ployment per 100,000
Crime Rates Pop. Pop. Rate Adults*Murder -0.28 0.37 -0.18 -0.40Rape 0.55 -0.55 -0.19 0.44Robbery 0.10 -0.04 -0.02 -0.15Ag. Assault 0.45 -0.51 -0.60 0.04Burglary -0.55 0.58 -0.14 -0.81Larceny -0.05 -0.20 -0.42 -0.51Vehicle Theft 0.42 -0.30 -0.56 0.03
Inter-CorrelationsMales 15-24 -0.76Unemploy. -0.08 0.23Sent. Prison* 0.78 -0.73 0.22
* Correlations based on 1977-2000, excl. 1991
Males 15-24 as % of Total Resident Pop.
R2 = 0.9442(2nd-Order Polynomial)
5.5%
6.0%
6.5%
7.0%
7.5%
8.0%
8.5%
9.0%
1975
1978
1981
1984
1987
1990
1993
1996
1999
2002
Perc
enta
ge
Sentenced Prison Admissions Per 100,000 Resident Pop. 20+
R2 = 0.8735(Linear)
220
320
420
520
620
720
820
920
1977
1979
1981
1983
1985
1987
1989
1991
1993
1995
1997
1999
Rat
e Pe
r 100
,000
Adu
lt Po
p.
(Data available for 1977-90, 1992-2000)
Unemployment Rate
R2 = 0.5095(4th-Order
Polynomial)3.5%
4.5%
5.5%
6.5%
7.5%
8.5%
9.5%
10.5%
11.5%
1975
1978
1981
1984
1987
1990
1993
1996
1999
2002
Perc
enta
ge
1976
1982 1994
John M. Knox & Associates, Inc. Page 23

Effects of Tourism on Rates of Serious Crime in Hawai`i April 2004
John M. Knox & Associates, Inc. Page 24
Exhibit 8: Trends for Tourism Vs. Index Offense Crimes, 1975-2002 – KAUA`I COUNTY
Larceny
R2 = 0.6599(5th-Order
Polynomial)2,0002,2002,4002,6002,8003,0003,2003,4003,6003,800
1975
1978
1981
1984
1987
1990
1993
1996
1999
2002
Rat
e Pe
r 100
,000
DeF
acto
Pop
.
1980-82
1996
Visitors as % of DeFacto Pop.R2 = 0.6195(4th-OrderPolynomial)
13%
15%
17%19%
21%
23%
25%
27%
29%
19751978
19811984
19871990
19931996
19992002
Avg
. Vis
itor C
ensu
s as
% o
f D
e Fa
cto
Popu
latio
n 19891999
1993 = Iniki
Motor Vehicle Theft
R2 = 0.6158(5th-OrderPolynomial)
90
140
190
240
290
1975
1978
1981
1984
1987
1990
1993
1996
1999
2002
Rat
e Pe
r 100
,000
DeF
acto
Pop
.
19801992
Burglary
R2 = 0.8744(2nd-Order Polynomial)
600
800
1,000
1,200
1,400
1,600
1,800
1975
1978
1981
1984
1987
1990
1993
1996
1999
2002
Rat
e Pe
r 100
,000
DeF
acto
Pop
.
1977
Robbery
R2 = 0.429(2nd-Order Polynomial)
9
19
29
39
49
59
1975
1978
1981
1984
1987
1990
1993
1996
1999
2002
Rat
e Pe
r 100
,000
DeF
acto
Pop
.
1981
Rape
R2 = 0.0231(3rd-Order Polynomial)
6
11
16
21
26
31
36
41
1975
1978
1981
1984
1987
1990
1993
1996
1999
2002
Rat
e Pe
r 100
,000
DeF
acto
Pop
.
1980 MurderR2 = 0.1324
(4th-Order Polynomial)
0
2
4
6
8
10
12
1975
1978
1981
1984
1987
1990
1993
1996
1999
2002
Rat
e Pe
r 100
,000
DeF
acto
Pop
.
1978
Aggravated AssaultR2 = 0.7566
(4th-Order Polynomial)
30507090
110130150170190210
1975
1978
1981
1984
1987
1990
1993
1996
1999
2002
Rat
e Pe
r 100
,000
DeF
acto
Pop
.

Effects of Tourism on Rates of Serious Crime in Hawai`i April 2004
Exhibit 9: Other Possible Predictors and Correlations with Crime Rates – KAUA`I COUNTY
Simple zero-order Pearson correlation coefficients for Kauai County, 1975-2000:
Males SentencedVisitors 15-24 as Prison Ad-as % of % of Total Unem- missionsDeFacto Resident ployment per 100,000
Crime Rates Pop. Pop. Rate Adults*Murder -0.22 0.21 -0.03 0.09Rape 0.01 -0.05 0.01 0.18Robbery -0.58 0.68 -0.18 -0.61Ag. Assault -0.53 0.79 -0.33 -0.47Burglary -0.72 0.94 -0.26 -0.87Larceny -0.58 0.68 -0.13 -0.76Vehicle Theft -0.37 0.55 -0.34 -0.53
Inter-CorrelationsMales 15-24 -0.66Unemploy. -0.32 -0.39Sent. Prison* 0.46 -0.85 0.48
* Correlations based on 1979-2000, excl. 1991
1977-79
Sentenced Prison Admissions Per 100,000 Resident Pop. 20+
R2 = 0.8482 (Linear)
185
285
385
485
585
685
785
885
985
1979
1982
1985
1988
1991
1994
1997
2000
Rat
e Pe
r 100
,000
Adu
lt Po
p.
(Data available for 1979-90, 1992-2000)
Unemployment RateR2 = 0.5152
(4th-Order Polynomial)
2.5%
4.5%
6.5%
8.5%
10.5%
12.5%
14.5%
1975
1978
1981
1984
1987
1990
1993
1996
1999
2002
Perc
enta
ge
1983
1994
1976
Males 15-24 as % of Total Resident Pop.
R2 = 0.9774(3rd-OrderPolynomial)
5.8%
6.3%
6.8%
7.3%
7.8%
8.3%
1975
1978
1981
1984
1987
1990
1993
1996
1999
2002
Perc
enta
ge
1977-79
2002
John M. Knox & Associates, Inc. Page 25

Effects of Tourism on Rates of Serious Crime in Hawai`i April 2004
John M. Knox & Associates, Inc. Page 26
Exhibit 10: Trends for Tourism Vs. Index Offense Crimes, 1975-2002 – MAUI COUNTY
Burglary
R2 = 0.7713(3rd-Order Polynomial)
825
1,025
1,225
1,425
1,625
1,825
2,025
2,225
1975 1979 1983 1987 1991 1995 1999
Rat
e Pe
r 100
,000
DeF
acto
Pop
. 1977
Robbery
R2 = 0.5403(4th-OrderPolynomial)
2530354045505560657075
1975 1979 1983 1987 1991 1995 1999
Rat
e Pe
r 100
,000
DeF
acto
Pop
. Aggravated Assault
R2 = 0.4479(3rd-OrderPolynomial)
50
70
90
110
130
150
170
190
210
1975 1979 1983 1987 1991 1995 1999
Rat
e Pe
r 100
,000
DeF
acto
Pop
.1979 1996-97 1987-89
Rape
R2 = 0.5754(4th-OrderPolynomial)
4
9
14
19
24
29
34
1975 1979 1983 1987 1991 1995 1999
Rat
e Pe
r 100
,000
DeF
acto
Pop
. 1981-82 1992
Murder
R2 = 0.8116(3rd-Order Polynomial)
0
2
4
6
8
10
12
1975 1979 1983 1987 1991 1995 1999
Rat
e Pe
r 100
,000
DeF
acto
Pop
. 1976
Visitors as % of De Facto Pop.
R2 = 0.8686(2nd Order Polynomial)
13%15%17%19%21%23%25%27%29%31%
19751978
19811984
19871990
19931996
19992002
Avg
. Vis
itor C
ensu
s as
% o
f D
e Fa
cto
Popu
latio
n 1989Larceny-Theft
R2 = 0.6735(5th-Order Polynomial)
2,800
3,300
3,800
4,300
4,800
1975 1979 1983 1987 1991 1995 1999
Rat
e Pe
r 100
,000
DeF
acto
Pop
. 1980
Motor Vehicle Theft
R2 = 0.511(4th-Order Polynomial)
180
230
280
330
380
430
480
530
1975 1979 1983 1987 1991 1995 1999
Rat
e Pe
r 100
,000
DeF
acto
Pop
. 1979
2002

Effects of Tourism on Rates of Serious Crime in Hawai`i April 2004
Exhibit 11: Other Possible Predictors and Correlations with Crime Rates – MAUI COUNTY
Simple zero-order Pearson correlation coefficients for Maui County, 1975-2000:
Males SentencedVisitors 15-24 as Prison Ad-as % of % of Total Unem- missionsDeFacto Resident ployment per 100,000
Crime Rates Pop. Pop. Rate Adults*Murder -0.79 0.74 0.60 -0.51Rape -0.38 0.26 0.25 -0.37Robbery 0.03 -0.26 0.24 0.30Ag. Assault 0.36 -0.01 -0.66 -0.34Burglary -0.71 0.86 0.13 -0.89Larceny -0.49 0.47 0.12 -0.65Vehicle Theft -0.68 0.73 0.18 -0.56
Inter-CorrelationsMales 15-24 -0.86Unemploy. -0.55 0.32Sent. Prison* 0.61 -0.87 0.02
* Correlations based on 1977-2000, excl. 1991
1976-78Males 15-24 as % of Total Resident
Pop.
R2 = 0.9825(3rd Order Polynomial)
6.2%
6.7%
7.2%
7.7%
8.2%
1975
1978
1981
1984
1987
1990
1993
1996
1999
2002
Perc
enta
ge
Sentenced Prison Admissions Per 100,000 Resident Pop. 20+
R2 = 0.9264(Linear)
130
330
530
730
930
1,130
1977
1979
1981
1983
1985
1987
1989
1991
1993
1995
1997
1999
Rat
e Pe
r 100
,000
Adu
lt Po
p.
(Data available for 1977-90, 1992-2000)
Unemployment Rate
R2 = 0.5022(3rd-Order Polynomial)
2.5%
3.5%
4.5%
5.5%
6.5%
7.5%
8.5%
9.5%
10.5%
1975
1978
1981
1984
1987
1990
1993
1996
1999
2002
Perc
enta
ge
1976
1982-83
1992
1997
John M. Knox & Associates, Inc. Page 27
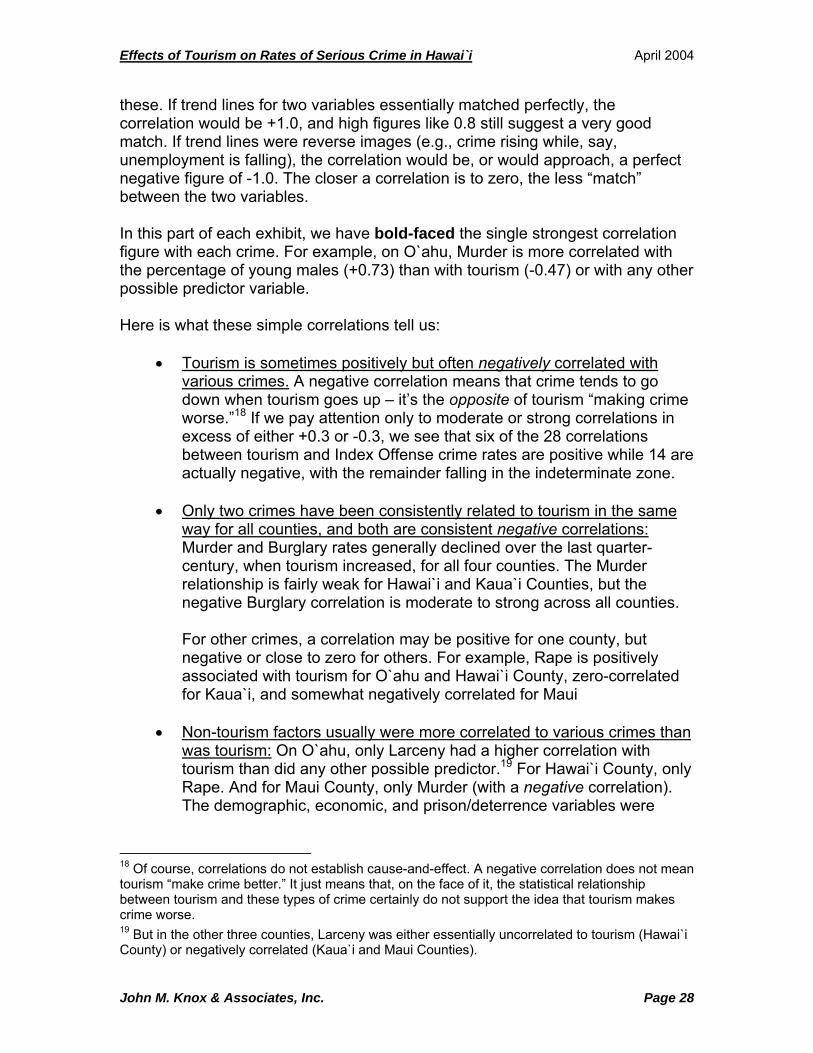
Effects of Tourism on Rates of Serious Crime in Hawai`i April 2004
these. If trend lines for two variables essentially matched perfectly, the correlation would be +1.0, and high figures like 0.8 still suggest a very good match. If trend lines were reverse images (e.g., crime rising while, say, unemployment is falling), the correlation would be, or would approach, a perfect negative figure of -1.0. The closer a correlation is to zero, the less “match” between the two variables. In this part of each exhibit, we have bold-faced the single strongest correlation figure with each crime. For example, on O`ahu, Murder is more correlated with the percentage of young males (+0.73) than with tourism (-0.47) or with any other possible predictor variable. Here is what these simple correlations tell us:
• Tourism is sometimes positively but often negatively correlated with various crimes. A negative correlation means that crime tends to go down when tourism goes up – it’s the opposite of tourism “making crime worse.”18 If we pay attention only to moderate or strong correlations in excess of either +0.3 or -0.3, we see that six of the 28 correlations between tourism and Index Offense crime rates are positive while 14 are actually negative, with the remainder falling in the indeterminate zone.
• Only two crimes have been consistently related to tourism in the same
way for all counties, and both are consistent negative correlations: Murder and Burglary rates generally declined over the last quarter-century, when tourism increased, for all four counties. The Murder relationship is fairly weak for Hawai`i and Kaua`i Counties, but the negative Burglary correlation is moderate to strong across all counties.
For other crimes, a correlation may be positive for one county, but negative or close to zero for others. For example, Rape is positively associated with tourism for O`ahu and Hawai`i County, zero-correlated for Kaua`i, and somewhat negatively correlated for Maui
• Non-tourism factors usually were more correlated to various crimes than was tourism: On O`ahu, only Larceny had a higher correlation with tourism than did any other possible predictor.19 For Hawai`i County, only Rape. And for Maui County, only Murder (with a negative correlation). The demographic, economic, and prison/deterrence variables were
18 Of course, correlations do not establish cause-and-effect. A negative correlation does not mean tourism “make crime better.” It just means that, on the face of it, the statistical relationship between tourism and these types of crime certainly do not support the idea that tourism makes crime worse. 19 But in the other three counties, Larceny was either essentially uncorrelated to tourism (Hawai`i County) or negatively correlated (Kaua`i and Maui Counties).
John M. Knox & Associates, Inc. Page 28

Effects of Tourism on Rates of Serious Crime in Hawai`i April 2004
more likely to have the strongest relationships – though these were also sometimes positive and sometimes negative, varying by county.
• Tourism was often more correlated with other possible predictor
variables than with crime rate variables: There was also a high degree of inter-correlation among the other predictor variables – young males, unemployment rates, etc.
This last finding poses a serious problem for the intended next phase of the analysis, as discussed in the following Section F. Discussion: This sort of analysis is never definitive, because (1) there is still a possibility that Tourism can have short-term effects on crime despite the lack of match or correlation between the general long-term trends; and (2) as noted, correlations do not establish cause-and-effect in any case. But what Exhibits 4 through 11 do make very apparent is that tourism in Hawai`i during this period was not a sole or major determinant of any serious Index Offense crime rate in any county. That is, no form of crime in Hawai`i seems to be consistently linked over time (in the expected positive way) to general changes in visitor population. How can we find so little apparent crime-tourism relationship for the period since 1975, when an earlier study did find relationships for 1961-75, at least on a statewide basis? There are several possible explanations:
• As previously noted, tourism-crime relationships seem to be a matter of circumstance, not a “law of nature.” So it is possible that an observable relationship can exist for one period in time but not another, even in the same place.
• The earlier study using 1961-75 data went farther than our analysis has
done so far. It used complex statistical techniques to try to measure the effects of tourism on crime when other factors – such as unemployment or demographics – were held equal. So our last section will look at what might also be possible if these statistical procedures were applied to our present dataset.
F. Multiple Regression Analysis (Partial Findings) This section assumes the reader has at least a conceptual understanding of Ordinary Least Squares (OLS) multiple regression and the uses of regression in time series analysis, the techniques used in many previous crime-tourism studies.
John M. Knox & Associates, Inc. Page 29
Effects of Tourism on Rates of Serious Crime in Hawai`i April 2004
Multiple regression theoretically has the potential to disentangle inter-correlations among predictor variables and then provide a predictive equation that tells us – • Whether tourism is part of the equation at all for predicting crime; • If so, whether tourism is relatively more important than other explanations we
have measured (such as unemployment); and • Whether an equation involving tourism does a good job predicting crime, or
whether other things we have not measured (including simple random chance) are probably more important.
Unfortunately, however, we encountered problems in the data that limited the conclusions we could draw from multiple regression analysis. 1. Difficulties in Conducting Multiple Regression with Available Data Multiple regression, like many other advanced statistical techniques, depends on assumptions about the nature of the data. Despite its theoretical potential to answer questions about tourism-crime data, there are many things that can make a multiple regression analysis problematic. Two of them are worth emphasizing here: (1) Independent variables should not be highly inter-correlated: As was already
noted, Exhibits 5 to 11 showed us time-series data for tourism, unemployment, sentenced prison rates, etc. that unfortunately are highly inter-correlated in most counties for this time period.
(2) For time-series data such as these, more years of observation are usually
needed to overcome “auto-correlation” issues.20 Typically, statisticians would wish for at least 50 observations in order to analyze a complex time series that consists of anything other than a very simple trend. We have at best 26 or 27 years of observations and we have even fewer when considering prison data.
“Auto-correlation” means that a variable is related to itself. For a set of social statistics gathered over time, such as our crime figures – the best predictor of Year 10 crime results would be the crime rates before year 10, not changes in some other variable. Auto-correlation becomes an issue because repeated observations in a time series often show a trend over time. (This is because the underlying factors that produce a crime rate in a particular year will themselves
20 From a statistical point of view, the key issue is that “observations are not independent” in time-series analyses. But the practical implication for this study has to do with the need to have lots of years of observations in order to help overcome this problem.
John M. Knox & Associates, Inc. Page 30

Effects of Tourism on Rates of Serious Crime in Hawai`i April 2004
change in highly predictable ways over time, so that they produce similar crime rates in following years.) As was noted at the very beginning of this analysis, many Hawai`i crime rates do show clear trends, though the nature of those trends vary depending on the crime and the county – the “picture” for some of them is close to a straight line going up or down, while others rise and fall over time like waves. Also, Exhibits 5 to 11 showed that most of the other possible predictors of crime (unemployment, etc.) themselves have clear trends. When this is the case, multiple regression analyses become more complicated, and even a simple analysis without complicated modeling may require two different steps. These steps involve disaggregating each variable’s time series into two different components: • Long-Term Trends: The first component would be the underlying general
trends shown by the “best-fit” trend lines super-imposed on Exhibits 4 to 11. We could go beyond the simple analysis done in the foregoing Section E (i.e., just describing the trends) by doing an actual multiple regression analysis to determine whether the Tourism trend line has a relationship with any of the crime best-fit trend lines for various counties.
• Short-Term Changes: The second component looks at year-to-year differences over time between actual observed values and the expected value according to the “best-fit” general trend line. In other words, a particular crime rate may be changing over time in a way that is best described by a straight line going up or down – but the actual data are close to a straight line rather than perfectly forming the straight line. The differences between the line and the actual data can be measured, and are called residuals. It is possible to conduct a second and separate multiple regression analysis based not on the original data, but rather on the residuals. The question here is not whether crime and tourism seem to be moving in the same direction over the long haul, but whether short-term “peaks” or “valleys” in tourism are associated with immediate “peaks” or “valleys” in crime.21
2. Limited Findings from Multiple Regression Analysis of Residuals We elected not to attempt a multiple regression for the long-term trend lines because we felt it was unnecessary and because the independent variables in such an analysis are generally highly inter-correlated. The simple visual analysis of peak years and best-fit trends lines in Section E was sufficient to make the point that long-term trends for tourism and crime rates are generally not very similar. Trying to do a multiple regression using the best-fit trends lines would 21 We should remember that in addition to meaningful short-term year-to-year variation, all measurement errors for each variable are also contained in that residual.
John M. Knox & Associates, Inc. Page 31
Effects of Tourism on Rates of Serious Crime in Hawai`i April 2004
make sense only if we are testing some sort of theory which related to trends of a particular predicted nature. That seemed a more appropriate task for an academic analysis. We did, however, feel it would be appropriate to attempt some multiple regression analysis for the short-term residuals, despite the data limitations. This type of analysis addresses the kind of question that social agencies – or, for that matter, the general public – might often ask: “If tourism suddenly rises unexpectedly a whole lot next year, will crime suddenly rise a whole lot, too?”22 Knowing that our results would be tentative and constrained by the previously discussed data limitations, we decided to conduct analyses just for O`ahu and Maui.23 And in order to keep the number of observations as high as possible, we: • Dropped the “sentenced prison admission rate” from our set of independent
variables for this particular analysis; • Kept the number of observations at 27 for all variables by assuming that the
2001 value for “% of young males” would be identical to the 2000 value;24 • Restricted our analysis to “synchronous” (same-year) effects, rather than
searching for “lagged” relationships (e.g., seeing if crime in one year responded to tourism changes in a preceding year rather than the same year);
• For the analysis of residuals, sometimes chose “best-fit” trend lines that
minimized loss of observations (“degrees of freedom”) even though a more complicated line would actually fit better – e.g., several O`ahu crimes clearly had wave patterns with several peaks, and 4th-order polynomials would fit better, but we worked instead with simple curves and 2nd- or 3rd-order polynomial equations to maximize the power of the analysis.
O`ahu Results: First, we calculated correlations between the residuals for Tourism and the residuals for the seven Index Offense crimes. We found one statistically significant correlation and one that was not significant but somewhat approached significance. Interestingly, these were for the two crimes that also appeared to have some possible long-term relationship as well with tourism on O`ahu, as was noted in the foregoing Section E:
22 The analysis of “peak years” in Section E has already shown us this has not been the case historically. However, analysis of residuals is really asking a slightly more complicated question: “If tourism suddenly rises a whole lot next year – but everything else that might affect crime stays the same” – would crime rise a whole lot, too (independent of other factors)?” 23 As may be seen in Exhibits 4, 6, 8, and 10, the underlying trend lines – around which residuals are measured – provide fairly good fits for most crimes on O`ahu and Maui. However, the Hawai`i and Kaua`i County “best-fit” lines often had extremely low R2 values. 24 At the time of the analysis, we had data for this variable only through the year 2000.
John M. Knox & Associates, Inc. Page 32
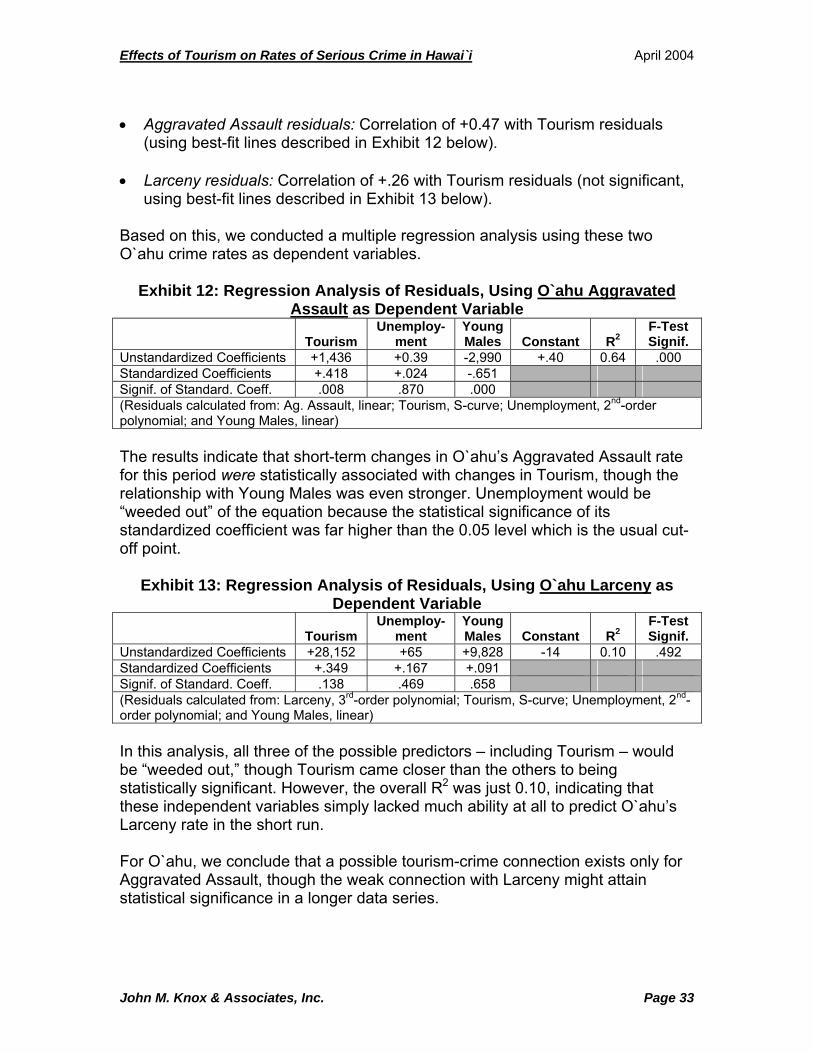
Effects of Tourism on Rates of Serious Crime in Hawai`i April 2004
• Aggravated Assault residuals: Correlation of +0.47 with Tourism residuals
(using best-fit lines described in Exhibit 12 below). • Larceny residuals: Correlation of +.26 with Tourism residuals (not significant,
using best-fit lines described in Exhibit 13 below). Based on this, we conducted a multiple regression analysis using these two O`ahu crime rates as dependent variables.
Exhibit 12: Regression Analysis of Residuals, Using O`ahu Aggravated Assault as Dependent Variable
Tourism Unemploy-
ment Young Males Constant R2
F-Test Signif.
Unstandardized Coefficients +1,436 +0.39 -2,990 +.40 0.64 .000 Standardized Coefficients +.418 +.024 -.651 Signif. of Standard. Coeff. .008 .870 .000 (Residuals calculated from: Ag. Assault, linear; Tourism, S-curve; Unemployment, 2nd-order polynomial; and Young Males, linear) The results indicate that short-term changes in O`ahu’s Aggravated Assault rate for this period were statistically associated with changes in Tourism, though the relationship with Young Males was even stronger. Unemployment would be “weeded out” of the equation because the statistical significance of its standardized coefficient was far higher than the 0.05 level which is the usual cut-off point.
Exhibit 13: Regression Analysis of Residuals, Using O`ahu Larceny as Dependent Variable
Tourism Unemploy-
ment Young Males Constant R2
F-Test Signif.
Unstandardized Coefficients +28,152 +65 +9,828 -14 0.10 .492 Standardized Coefficients +.349 +.167 +.091 Signif. of Standard. Coeff. .138 .469 .658 (Residuals calculated from: Larceny, 3rd-order polynomial; Tourism, S-curve; Unemployment, 2nd-order polynomial; and Young Males, linear) In this analysis, all three of the possible predictors – including Tourism – would be “weeded out,” though Tourism came closer than the others to being statistically significant. However, the overall R2 was just 0.10, indicating that these independent variables simply lacked much ability at all to predict O`ahu’s Larceny rate in the short run. For O`ahu, we conclude that a possible tourism-crime connection exists only for Aggravated Assault, though the weak connection with Larceny might attain statistical significance in a longer data series.
John M. Knox & Associates, Inc. Page 33

Effects of Tourism on Rates of Serious Crime in Hawai`i April 2004
Maui Results: Again we calculated correlations between Maui Tourism residuals and those for the seven Index Offenses. We found some significant negative correlations between Tourism and the crimes of Rape, Burglary, and (unlike O`ahu, where the relationship was positive) Larceny. These match and reinforce the overall negative long-term negative correlations for these and other crimes reported for Maui back in Exhibit 11. So the principal finding for Maui – both long-term and short-term – would be that “Crime does not make tourism worse there.” Correlational data do not establish cause and effect, but most of the Maui results would be more consistent with a hypothesis that tourism increases are associated with economic improvement that reduces crime. We found one barely-significant positive correlation of Tourism residuals with a Maui crime rate residual series: • Aggravated Assault residuals: Correlation of +0.35 with Tourism residuals
(using best-fit lines described in Exhibit 14 below). Especially because of apparent consistency with O`ahu results, we proceeded with the multiple regression analysis of residuals to see if the Tourism-Assault relationship would survive or would be “weeded out” (i.e., explained by the effects of other variables):
Exhibit 14: Regression Analysis of Residuals, Using Maui Aggravated Assault as Dependent Variable
Tourism Unemploy-
ment Young Males Constant R2
F-Test Signif.
Unstandardized Coefficients +4.1 -12.5 -9.5 .000 .36 .016 Standardized Coefficients +.233 -.507 -.036 Signif. of Standard. Coeff. .227 .016 .859 (Residuals calculated from: Ag. Assault, 3rd-order polynomial; Tourism, 2nd-order polynomial; Unemployment, 2nd-order polynomial; and Young Males, 3rd-order polynomial) Exhibit 14 shows the Tourism effect on Maui’s short-term Aggravated Assault crime rate was in fact “weeded out,” apparently due to inter-relationship with Unemployment. However, the effect of Unemployment on Aggravated Assault in this equation is a highly counter-intuitive negative one, and Young Males – the sole statistically significant predictor of short-term O`ahu Aggravated Assault residuals in Exhibit 12 – is shown to have inconsequential effects on Maui. Concluding Statement: Multiple regression is a potentially powerful statistical tool, but the limitations in the data – inter-correlated predictors and a relatively small number of years of observations for a time-series – result in somewhat muddy results.
John M. Knox & Associates, Inc. Page 34
Effects of Tourism on Rates of Serious Crime in Hawai`i April 2004
And yet, muddy results are the norm for tourism-crime studies. It is typical to find a statistical link between tourism and one type of crime (but not others) in one place, and between tourism and another type of crime in a different place. We pushed the limit of statistical methodology in doing these analyses so that we could say we made the greatest possible effort to test the hypothesis that “tourism makes crime worse.” We found only a few hints that this might occasionally be true in Hawai`i. We found more hints that the reverse is true equally or more often – that many types of crime have declined as tourism has increased. Overall, though, we found little evidence of consistent and systematic links over time between Hawai`i crime and tourism in the various counties of the state.
John M. Knox & Associates, Inc. Page 35


Effects of Tourism on Rates of Serious Crime in Hawai`i April 2004
APPENDIX A: HAWAI`I STATEWIDE CRIME RATES
VS. NATIONAL CRIME RATES, 1975 – 2002
John M. Knox & Associates, Inc. Page A-1
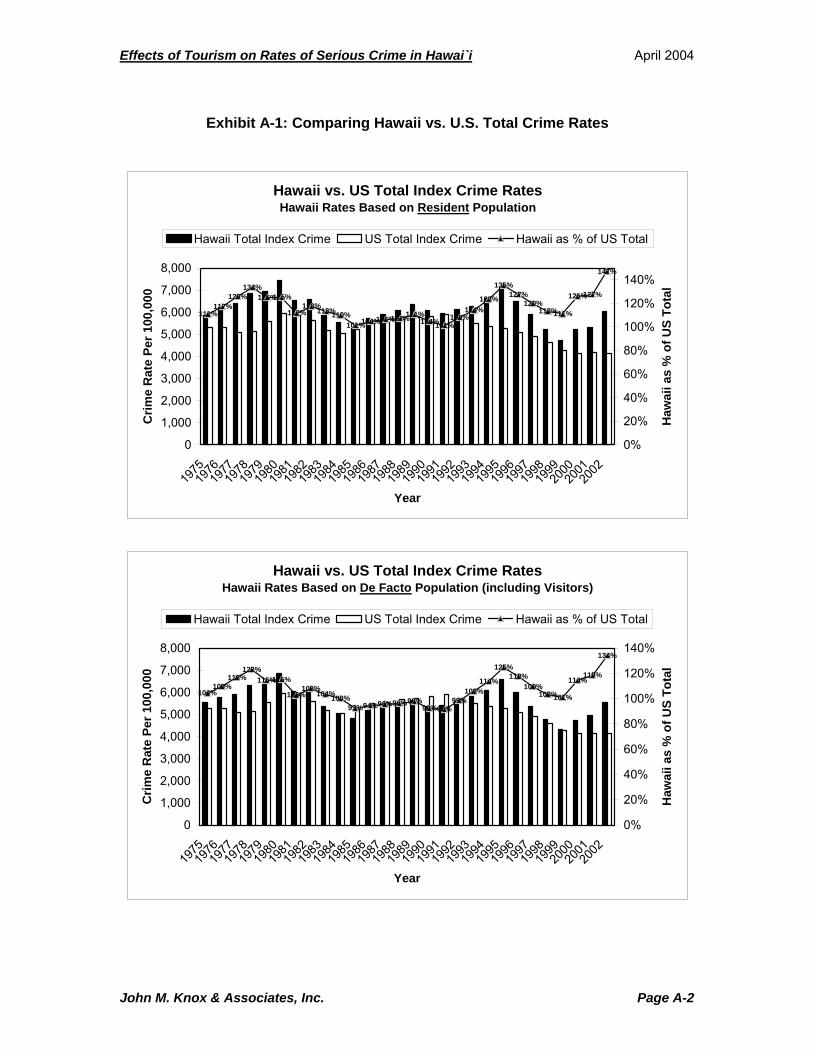
Effects of Tourism on Rates of Serious Crime in Hawai`i April 2004
John M. Knox & Associates, Inc. Page A-2
Exhibit A-1: Comparing Hawaii vs. U.S. Total Crime Rates
Hawaii vs. US Total Index Crime RatesHawaii Rates Based on Resident Population
111%117%
126%134%
125%125%
112%118%113%110%
101%104%106%107%111%104%101%
108%114%
123%
135%127%
120%113%111%
126%127%
147%
0
1,000
2,000
3,000
4,000
5,000
6,000
7,000
8,000
197519
7619
7719
7819
7919
8019
8119
8219
8319
8419
8519
8619
8719
8819
8919
9019
9119
9219
9319
9419
9519
9619
9719
9819
9920
0020
0120
02
Year
Crim
e R
ate
Per 1
00,0
00
0%
20%
40%
60%
80%
100%
120%
140%
Haw
aii a
s %
of U
S To
tal
Hawaii Total Index Crime US Total Index Crime Hawaii as % of US Total
Hawaii vs. US Total Index Crime RatesHawaii Rates Based on De Facto Population (including Visitors)
104%109%
116%123%
115%115%
103%108%
104%100%93%94%96%96%98%
92%92%99%
106%114%
125%118%
109%103%101%
114%119%
134%
0
1,000
2,000
3,000
4,000
5,000
6,000
7,000
8,000
197519
7619
7719
7819
7919
8019
8119
8219
8319
8419
8519
8619
8719
8819
8919
9019
9119
9219
9319
9419
9519
9619
9719
9819
9920
0020
0120
02
Year
Crim
e R
ate
Per 1
00,0
00
0%
20%
40%
60%
80%
100%
120%
140%H
awai
i as
% o
f US
Tota
l
Hawaii Total Index Crime US Total Index Crime Hawaii as % of US Total

Effects of Tourism on Rates of Serious Crime in Hawai`i April 2004
John M. Knox & Associates, Inc. Page A-3
(Scale for Exhibit A-2 identical to that for Exhibit A-2 to facilitate comparison; scales for remaining Exhibits A-3 to A-8 are necessarily different.)
Exhibit A-2: Comparing Hawaii vs. U.S. Larceny-Theft Rates
Hawaii vs. US Larceny-Theft Crime RatesHawaii Rates Based on Resident Population
120%123%
140%
152%142%
148%
133%138%134%133%
124%126%133%133%136%131%129%
141%146%
154%164%
153%140%
132%131%
144%145%
0
1,000
2,000
3,000
4,000
5,000
6,000
7,000
8,000
1975
1976
1977
1978
1979
1980
1981
1982
1983
1984
1985
1986
1987
1988
1989
1990
1991
1992
1993
1994
1995
1996
1997
1998
1999
2000
2001
Year
Crim
e R
ate
Per 1
00,0
00
0%
20%40%
60%
80%100%
120%
140%160%
Haw
aii a
s %
of U
S To
tal
Hawaii Larceny-Theft US Larceny-Theft Hawaii as % of US Lar.-Theft
Hawaii vs. US Larceny-Theft Crime RatesHawaii Rates Based on De Facto Population (including Visitors)
113%115%
130%140%
130%136%
122%127%122%121%113%114%
120%120%121%116%117%128%
135%142%
152%141%
128%121%119%
131%135%
0
1,000
2,000
3,000
4,000
5,000
6,000
7,000
8,000
1975
1976
1977
1978
1979
1980
1981
1982
1983
1984
1985
1986
1987
1988
1989
1990
1991
1992
1993
1994
1995
1996
1997
1998
1999
2000
2001
Year
Crim
e R
ate
Per 1
00,0
00
0%
20%
40%
60%
80%
100%
120%
140%
160%
Haw
aii a
s %
of U
S To
tal
Hawaii Larceny-Theft US Larceny-Theft Hawaii as % of US Lar.-Theft
Scale for this crime rate has been kept the same as on preceding page, to facilitate comparison between Larceny-Theft and Total rates.

Effects of Tourism on Rates of Serious Crime in Hawai`i April 2004
John M. Knox & Associates, Inc. Page A-4
Exhibit A-3: Comparing Hawaii vs. U.S. Burglary Rates
Hawaii vs. US Burglary Crime RatesHawaii Rates Based on Resident Population
116%
127%131%130%
115%109%
104%111%
101%97%91%
101%
88%97%
107%99%98%96%
103%113%117%
112%114%106%
101%
121%120%
137%
0
300
600
900
1,200
1,500
1,800
2,100
197519
7619
7719
7819
7919
8019
8119
8219
8319
8419
8519
8619
8719
8819
8919
9019
9119
9219
9319
9419
9519
9619
9719
9819
9920
0020
0120
02
Year
Crim
e R
ate
Per 1
00,0
00
0%
20%
40%
60%
80%
100%
120%
140%
Haw
aii a
s %
of U
S To
tal
Hawaii Burglary US Burglary Hawaii as % of US Burglary
On this and remaining pages, scale for individual crimes rates differs from preceding pages -- based on rough maximal levels observed.
Hawaii vs. US Burglary Crime RatesHawaii Rates Based on De Facto Population (including Visitors)
110%119%122%120%
105%100%
96%102%
92%88%83%
91%
79%87%
95%88%89%88%
96%104%108%
104%104%97%
92%
110%112%
125%
0
300
600
900
1,200
1,500
1,800
2,100
197519
7619
7719
7819
7919
8019
8119
8219
8319
8419
8519
8619
8719
8819
8919
9019
9119
9219
9319
9419
9519
9619
9719
9819
9920
0020
0120
02
Year
Crim
e R
ate
Per 1
00,0
00
0%
20%
40%
60%
80%
100%
120%
140%
Haw
aii a
s %
of U
S To
tal
Hawaii Burglary US Burglary Hawaii as % of US Burglary

Effects of Tourism on Rates of Serious Crime in Hawai`i April 2004
John M. Knox & Associates, Inc. Page A-5
Exhibit A-4: Comparing Hawaii vs. U.S.Motor Vehicle Theft Rates
Hawaii vs. US Vehicle Theft Crime RatesHawaii Rates Based on Resident Population
108%118%
106%119%
136%121%
91%92%98%
81%
62%65%70%63%63%58%
51%59%
74%
91%
122%113%
106%100%92%
122%126%
184%
0
100
200
300
400
500
600
700
800
197519
7619
7719
7819
7919
8019
8119
8219
8319
8419
8519
8619
8719
8819
8919
9019
9119
9219
9319
9419
9519
9619
9719
9819
9920
0020
0120
02
Year
Crim
e R
ate
Per 1
00,0
00
0%20%40%60%80%100%120%140%160%180%
Haw
aii a
s %
of U
S To
tal
Hawaii Motor Vehicle Theft US Motor Vehicle Theft Hawaii as % of US Veh. Theft
Hawaii vs. US Vehicle Theft Crime RatesHawaii Rates Based on De Facto Population (including Visitors)
102%110%
98%110%
124%111%
84%84%90%
73%
57%59%63%57%56%51%46%
54%
69%
84%
113%104%
96%91%83%
111%117%
168%
0
100
200
300
400
500
600
700
800
197519
7619
7719
7819
7919
8019
8119
8219
8319
8419
8519
8619
8719
8819
8919
9019
9119
9219
9319
9419
9519
9619
9719
9819
9920
0020
0120
02
Year
Crim
e R
ate
Per 1
00,0
00
0%20%40%60%80%100%120%140%160%180%
Haw
aii a
s %
of U
S To
tal
Hawaii Motor Vehicle Theft US Motor Vehicle Theft Hawaii as % of US Veh. Theft
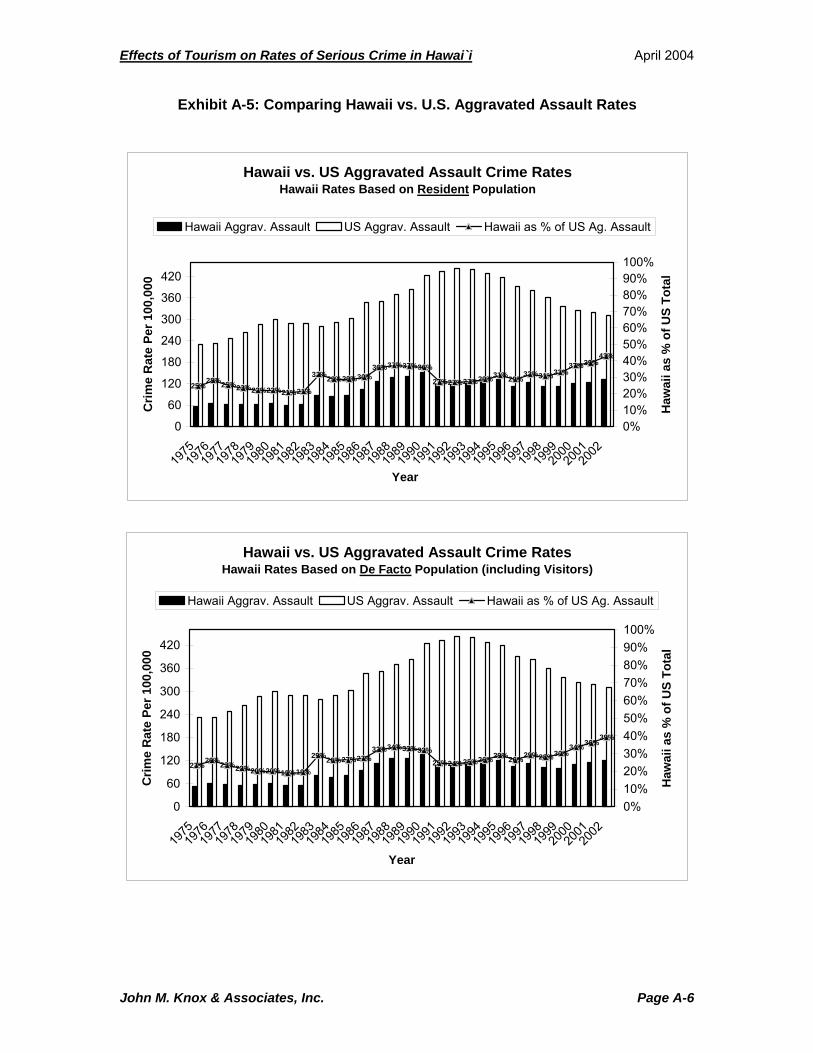
Effects of Tourism on Rates of Serious Crime in Hawai`i April 2004
John M. Knox & Associates, Inc. Page A-6
Exhibit A-5: Comparing Hawaii vs. U.S. Aggravated Assault Rates
Hawaii vs. US Aggravated Assault Crime RatesHawaii Rates Based on Resident Population
25%28%25%23%22%22%21%21%
32%29%29%30%36%37%37%36%
27%27%27%29%31%29%32%31%33%
37%39%43%
0
60
120
180
240
300
360
420
197519
7619
7719
7819
7919
8019
8119
8219
8319
8419
8519
8619
8719
8819
8919
9019
9119
9219
9319
9419
9519
9619
9719
9819
9920
0020
0120
02
Year
Crim
e R
ate
Per 1
00,0
00
0%10%20%30%40%50%60%70%80%90%100%
Haw
aii a
s %
of U
S To
tal
Hawaii Aggrav. Assault US Aggrav. Assault Hawaii as % of US Ag. Assault
Hawaii vs. US Aggravated Assault Crime RatesHawaii Rates Based on De Facto Population (including Visitors)
23%26%23%22%20%20%19%19%
29%26%27%27%32%34%33%32%
25%24%25%26%29%26%29%28%30%34%36%
39%
0
60
120
180
240
300
360
420
197519
7619
7719
7819
7919
8019
8119
8219
8319
8419
8519
8619
8719
8819
8919
9019
9119
9219
9319
9419
9519
9619
9719
9819
9920
0020
0120
02
Year
Crim
e R
ate
Per 1
00,0
00
0%10%20%30%40%50%60%70%80%90%100%
Haw
aii a
s %
of U
S To
tal
Hawaii Aggrav. Assault US Aggrav. Assault Hawaii as % of US Ag. Assault

Effects of Tourism on Rates of Serious Crime in Hawai`i April 2004
John M. Knox & Associates, Inc. Page A-7
Exhibit A-6: Comparing Hawaii vs. U.S. Robbery Rates
Hawaii vs. US Robbery Crime RatesHawaii Rates Based on Resident Population
56%
65%65%
85%81%
76%
57%66%
61%57%
48%48%47%39%36%35%32%
38%40%43%
59%66%
62%61%57%64%62%
67%
0
50
100
150
200
250
300
197519
7619
7719
7819
7919
8019
8119
8219
8319
8419
8519
8619
8719
8819
8919
9019
9119
9219
9319
9419
9519
9619
9719
9819
9920
0020
0120
02
Year
Crim
e R
ate
Per 1
00,0
00
0%10%20%30%40%50%60%70%80%90%100%
Haw
aii a
s %
of U
S To
tal
Hawaii Robbery US Robbery Hawaii as % of US Robbery
Hawaii vs. US Robbery Crime RatesHawaii Rates Based on De Facto Population (including Visitors)
53%
61%61%
79%74%
69%
53%
60%55%
52%
44%43%42%
35%32%31%29%34%
37%40%
54%61%
57%56%52%
58%58%61%
0
50
100
150
200
250
300
197519
7619
7719
7819
7919
8019
8119
8219
8319
8419
8519
8619
8719
8819
8919
9019
9119
9219
9319
9419
9519
9619
9719
9819
9920
0020
0120
02
Year
Crim
e R
ate
Per 1
00,0
00
0%10%20%30%40%50%60%70%80%90%100%
Haw
aii a
s %
of U
S To
tal
Hawaii Robbery US Robbery Hawaii as % of US Robbery
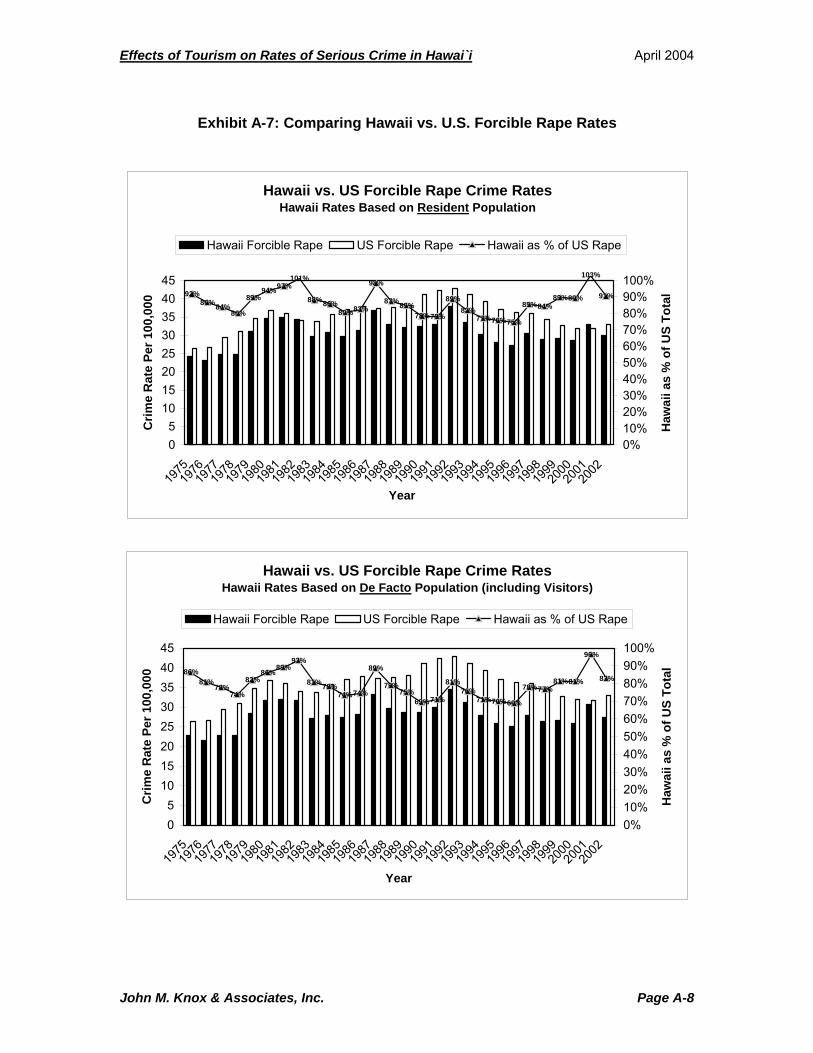
Effects of Tourism on Rates of Serious Crime in Hawai`i April 2004
John M. Knox & Associates, Inc. Page A-8
Exhibit A-7: Comparing Hawaii vs. U.S. Forcible Rape Rates
Hawaii vs. US Forcible Rape Crime RatesHawaii Rates Based on Resident Population
92%86%84%
80%
89%94%97%
101%
88%86%80%83%
98%
87%85%78%78%
89%82%
77%76%75%
85%84%89%89%
103%
91%
05
1015202530354045
197519
7619
7719
7819
7919
8019
8119
8219
8319
8419
8519
8619
8719
8819
8919
9019
9119
9219
9319
9419
9519
9619
9719
9819
9920
0020
0120
02
Year
Crim
e R
ate
Per 1
00,0
00
0%10%20%30%40%50%60%70%80%90%100%
Haw
aii a
s %
of U
S To
tal
Hawaii Forcible Rape US Forcible Rape Hawaii as % of US Rape
Hawaii vs. US Forcible Rape Crime RatesHawaii Rates Based on De Facto Population (including Visitors)
86%81%
78%74%
82%86%
89%93%
81%78%74%74%
89%
79%75%
69%71%
81%76%
71%70%69%
78%77%81%81%
96%
83%
05
1015202530354045
197519
7619
7719
7819
7919
8019
8119
8219
8319
8419
8519
8619
8719
8819
8919
9019
9119
9219
9319
9419
9519
9619
9719
9819
9920
0020
0120
02
Year
Crim
e R
ate
Per 1
00,0
00
0%10%20%30%40%50%60%70%80%90%100%
Haw
aii a
s %
of U
S To
tal
Hawaii Forcible Rape US Forcible Rape Hawaii as % of US Rape

Effects of Tourism on Rates of Serious Crime in Hawai`i April 2004
John M. Knox & Associates, Inc. Page A-9
Exhibit A-8: Comparing Hawaii vs. U.S. Murder Rates
Hawaii vs. US Murder Crime RatesHawaii Rates Based on Resident Population
79%70%
79%72%71%
85%
49%
34%
68%
42%52%
57%58%50%
56%
42%40%39%40%47%
57%
45%
57%
31%
64%
53%46%
34%
0
2
4
6
8
10
197519
7619
7719
7819
7919
8019
8119
8219
8319
8419
8519
8619
8719
8819
8919
9019
9119
9219
9319
9419
9519
9619
9719
9819
9920
0020
0120
02
Year
Crim
e R
ate
Per 1
00,0
00
0%10%20%30%40%50%60%70%80%90%100%
Haw
aii a
s %
of U
S To
tal
Hawaii Murder US Murder Hawaii as % of US Murder
Hawaii vs. US Murder Crime RatesHawaii Rates Based on De Facto Population (including Visitors)
74%
65%
73%
66%65%
78%
45%
31%
62%
38%
47%51%52%
45%49%
37%37%36%37%43%
53%
41%
52%
29%
58%
48%43%
32%
0
2
4
6
8
10
197519
7619
7719
7819
7919
8019
8119
8219
8319
8419
8519
8619
8719
8819
8919
9019
9119
9219
9319
9419
9519
9619
9719
9819
9920
0020
0120
02
Year
Crim
e R
ate
Per 1
00,0
00
0%10%20%30%40%50%60%70%80%90%100%
Haw
aii a
s %
of U
S To
tal
Hawaii Murder US Murder Hawaii as % of US Murder

Effects of Tourism on Rates of Serious Crime in Hawai`i April 2004
APPENDIX B: DATA USED IN HAWAI`I TOURISM-
CRIME ANALYSIS, 1975 – 2002
John M. Knox & Associates, Inc. Page B-1
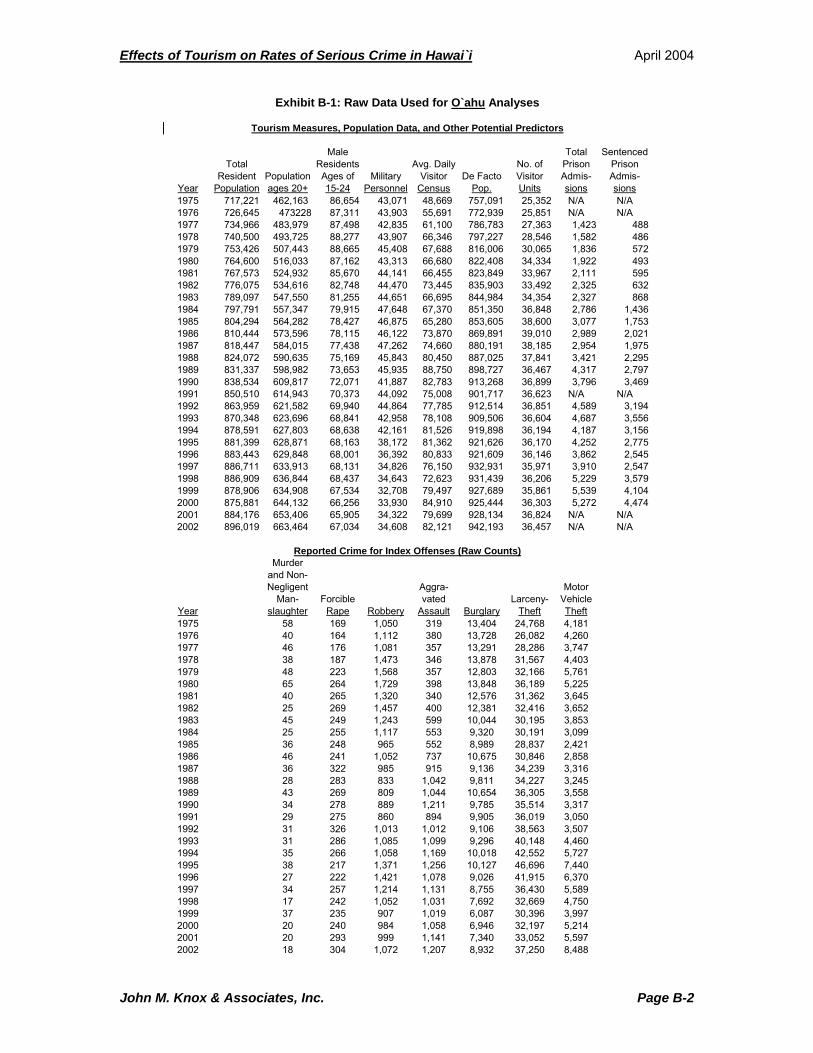
Effects of Tourism on Rates of Serious Crime in Hawai`i April 2004
John M. Knox & Associates, Inc. Page B-2
Year
Total Resident
PopulationPopulation ages 20+
Male Residents Ages of 15-24
Military Personnel
Avg. Daily Visitor
CensusDe Facto
Pop.
No. of Visitor Units
Total Prison Admis-sions
Sentenced Prison Admis-sions
1975 717,221 462,163 86,654 43,071 48,669 757,091 25,352 N/A N/A1976 726,645 473228 87,311 43,903 55,691 772,939 25,851 N/A N/A1977 734,966 483,979 87,498 42,835 61,100 786,783 27,363 1,423 4881978 740,500 493,725 88,277 43,907 66,346 797,227 28,546 1,582 4861979 753,426 507,443 88,665 45,408 67,688 816,006 30,065 1,836 5721980 764,600 516,033 87,162 43,313 66,680 822,408 34,334 1,922 4931981 767,573 524,932 85,670 44,141 66,455 823,849 33,967 2,111 5951982 776,075 534,616 82,748 44,470 73,445 835,903 33,492 2,325 6321983 789,097 547,550 81,255 44,651 66,695 844,984 34,354 2,327 8681984 797,791 557,347 79,915 47,648 67,370 851,350 36,848 2,786 1,4361985 804,294 564,282 78,427 46,875 65,280 853,605 38,600 3,077 1,7531986 810,444 573,596 78,115 46,122 73,870 869,891 39,010 2,989 2,0211987 818,447 584,015 77,438 47,262 74,660 880,191 38,185 2,954 1,9751988 824,072 590,635 75,169 45,843 80,450 887,025 37,841 3,421 2,2951989 831,337 598,982 73,653 45,935 88,750 898,727 36,467 4,317 2,7971990 838,534 609,817 72,071 41,887 82,783 913,268 36,899 3,796 3,4691991 850,510 614,943 70,373 44,092 75,008 901,717 36,623 N/A N/A1992 863,959 621,582 69,940 44,864 77,785 912,514 36,851 4,589 3,1941993 870,348 623,696 68,841 42,958 78,108 909,506 36,604 4,687 3,5561994 878,591 627,803 68,638 42,161 81,526 919,898 36,194 4,187 3,1561995 881,399 628,871 68,163 38,172 81,362 921,626 36,170 4,252 2,7751996 883,443 629,848 68,001 36,392 80,833 921,609 36,146 3,862 2,5451997 886,711 633,913 68,131 34,826 76,150 932,931 35,971 3,910 2,5471998 886,909 636,844 68,437 34,643 72,623 931,439 36,206 5,229 3,5791999 878,906 634,908 67,534 32,708 79,497 927,689 35,861 5,539 4,1042000 875,881 644,132 66,256 33,930 84,910 925,444 36,303 5,272 4,4742001 884,176 653,406 65,905 34,322 79,699 928,134 36,824 N/A N/A2002 896,019 663,464 67,034 34,608 82,121 942,193 36,457 N/A N/A
Year
Murder and Non-Negligent
Man- slaughter
Forcible Rape Robbery
Aggra-vated
Assault BurglaryLarceny-
Theft
Motor Vehicle Theft
1975 58 169 1,050 319 13,404 24,768 4,1811976 40 164 1,112 380 13,728 26,082 4,2601977 46 176 1,081 357 13,291 28,286 3,7471978 38 187 1,473 346 13,878 31,567 4,4031979 48 223 1,568 357 12,803 32,166 5,7611980 65 264 1,729 398 13,848 36,189 5,2251981 40 265 1,320 340 12,576 31,362 3,6451982 25 269 1,457 400 12,381 32,416 3,6521983 45 249 1,243 599 10,044 30,195 3,8531984 25 255 1,117 553 9,320 30,191 3,0991985 36 248 965 552 8,989 28,837 2,4211986 46 241 1,052 737 10,675 30,846 2,8581987 36 322 985 915 9,136 34,239 3,3161988 28 283 833 1,042 9,811 34,227 3,2451989 43 269 809 1,044 10,654 36,305 3,5581990 34 278 889 1,211 9,785 35,514 3,3171991 29 275 860 894 9,905 36,019 3,0501992 31 326 1,013 1,012 9,106 38,563 3,5071993 31 286 1,085 1,099 9,296 40,148 4,4601994 35 266 1,058 1,169 10,018 42,552 5,7271995 38 217 1,371 1,256 10,127 46,696 7,4401996 27 222 1,421 1,078 9,026 41,915 6,3701997 34 257 1,214 1,131 8,755 36,430 5,5891998 17 242 1,052 1,031 7,692 32,669 4,7501999 37 235 907 1,019 6,087 30,396 3,9972000 20 240 984 1,058 6,946 32,197 5,2142001 20 293 999 1,141 7,340 33,052 5,5972002 18 304 1,072 1,207 8,932 37,250 8,488
Reported Crime for Index Offenses (Raw Counts)
Exhibit B-1: Raw Data Used for O`ahu Analyses
Tourism Measures, Population Data, and Other Potential Predictors

Effects of Tourism on Rates of Serious Crime in Hawai`i April 2004
John M. Knox & Associates, Inc. Page B-3
Year
Total Resident
PopulationPopulation ages 20+
Male Residents Ages of 15-24
Military Personnel
Avg. Daily Visitor
CensusDe Facto
Pop.
No. of Visitor Units
Total Prison Admis-sions
Sentenced Prison Admis-sions
1975 77,212 49,163 6,844 N/A 6,496 83,258 5,348 N/A N/A1976 80,480 51,747 7,063 N/A 6,782 86,850 6,045 N/A N/A1977 82,608 53,617 7,154 N/A 7,195 89,348 5,929 642 1951978 85,661 56,097 7,275 N/A 8,094 93,350 6,002 591 1491979 89,069 58,764 7,417 N/A 7,996 96,712 6,093 652 1311980 92,900 61,314 7,434 N/A 7,195 99,181 5,889 724 1561981 96,122 64,055 7,473 N/A 6,561 101,597 6,705 678 2001982 98,798 66,147 7,282 N/A 6,725 104,087 7,167 713 1921983 100,764 67,764 7,112 N/A 8,690 108,331 7,469 555 2271984 103,528 69,871 7,047 N/A 7,570 109,480 7,149 600 2981985 105,900 71,582 7,004 N/A 8,040 112,343 7,511 809 3241986 108,362 73,725 7,081 N/A 9,870 116,451 7,280 741 3371987 111,735 76,436 7,158 N/A 10,210 120,289 7,328 857 4311988 113,439 77,719 7,029 N/A 10,690 122,038 8,823 966 3951989 116,585 80,036 7,024 N/A 17,760 131,153 8,161 1,069 3951990 121,572 84,019 7,116 N/A 16,698 133,202 8,952 1,156 3731991 127,266 87,287 7,322 N/A 17,535 141,240 9,383 N/A N/A1992 131,630 89,780 7,513 N/A 19,244 146,421 9,170 1,572 4921993 135,085 91,463 7,692 N/A 18,974 148,014 9,140 1,366 4701994 137,713 92,727 7,761 N/A 18,902 150,311 9,595 1,482 5741995 140,492 94,199 7,872 N/A 18,547 152,482 9,577 1,599 6651996 141,935 95,044 7,954 N/A 19,285 154,364 9,558 1,370 7881997 144,445 96,884 8,148 N/A 21,656 161,225 9,913 1,171 8201998 145,833 98,152 8,294 N/A 23,993 165,205 9,655 993 8421999 146,970 99,099 8,356 N/A 22,736 164,570 9,815 1,152 9122000 149,261 105,857 9,862 N/A 21,831 166,446 9,774 1,192 1,0302001 151,709 106,372 10,313 N/A 21,064 168,150 9,944 N/A N/A2002 154,794 109,194 10,914 N/A 22,277 172,468 9,297 N/A N/A
Year
Murder and Non-
Negligent Man-
slaughterForcible
Rape Robbery
Aggra-vated
Assault BurglaryLarceny-
Theft
Motor Vehicle Theft
1975 3 20 16 63 912 2,057 1211976 6 16 35 84 1,101 2,493 1691977 9 14 19 60 1,312 2,576 1761978 9 16 39 74 1,326 2,767 2081979 11 33 41 86 1,338 2,911 1991980 13 20 48 92 1,526 3,309 1991981 3 32 58 86 1,763 3,461 2201982 2 23 47 81 1,516 3,666 1811983 5 27 30 83 1,182 3,374 1681984 3 23 28 96 1,163 3,146 2381985 4 26 31 103 1,223 3,518 2061986 2 40 37 105 1,408 3,521 2261987 13 27 28 114 1,198 3,360 1931988 13 23 33 134 1,391 4,057 2591989 7 33 47 178 1,613 4,613 3401990 7 46 71 202 1,711 4,972 4511991 7 51 52 242 1,815 4,716 3431992 6 44 46 171 1,601 4,713 3141993 6 43 47 155 1,767 4,548 3141994 7 43 57 157 1,690 4,895 2671995 10 49 72 174 1,568 4,881 3201996 8 45 61 133 1,581 4,718 3091997 9 46 68 161 1,651 5,029 3531998 3 45 73 134 1,660 4,474 3681999 5 62 41 149 1,400 3,870 2882000 4 53 54 126 1,449 4,355 3842001 8 68 63 138 1,538 4,677 4932002 5 35 48 133 1,539 4,663 513
Reported Crime for Index Offenses (Raw Counts)
Exhibit B-2: Raw Data Used for Hawai`i County Analyses
Tourism Measures, Population Data, and Other Potential Predictors

Effects of Tourism on Rates of Serious Crime in Hawai`i April 2004
John M. Knox & Associates, Inc. Page B-4
Year
Total Resident
PopulationPopulation ages 20+
Male Residents Ages of 15-24
Military Personnel
Avg. Daily Visitor
CensusDe Facto
Pop.
No. of Visitor Units
Total Prison Admis-sions
Sentenced Prison Admis-sions
1975 33,305 21,296 2,609 N/A 4,941 38,074 3,102 N/A N/A1976 34,765 22,456 2,760 N/A 5,445 40,083 3,520 N/A N/A1977 35,414 23,115 2,830 N/A 6,025 41,262 3,657 N/A N/A1978 36,696 24,177 2,934 N/A 7,069 43,609 3,786 N/A N/A1979 38,011 25,246 3,036 N/A 7,394 45,211 4,202 264 471980 39,400 26,139 3,073 N/A 7,259 46,341 4,322 223 541981 40,457 27,157 3,099 N/A 7,225 47,246 4,738 294 511982 41,804 28,203 3,066 N/A 7,050 48,304 5,147 414 551983 42,796 29,011 3,036 N/A 7,990 50,419 4,193 540 811984 43,634 29,710 3,015 N/A 10,930 54,027 5,313 625 1791985 44,357 30,259 3,005 N/A 11,470 55,086 5,656 523 1311986 45,567 31,309 3,076 N/A 14,840 59,599 5,922 586 1661987 47,203 32,624 3,154 N/A 15,510 62,007 5,956 495 1341988 48,549 33,637 3,164 N/A 16,400 64,090 7,180 602 1671989 49,847 34,630 3,193 N/A 19,140 67,300 7,398 593 1741990 51,676 36,145 3,237 N/A 17,378 66,699 7,546 566 1671991 53,379 37,054 3,201 N/A 17,720 69,605 7,567 N/A N/A1992 54,439 37,546 3,221 N/A 13,479 66,076 7,778 672 2841993 55,461 37,948 3,262 N/A 8,283 61,262 4,631 694 2831994 56,478 38,472 3,318 N/A 13,268 67,161 5,870 411 1961995 57,068 38,720 3,344 N/A 14,439 68,844 6,315 548 2941996 57,688 39,031 3,362 N/A 15,572 70,474 6,760 597 3121997 57,712 39,083 3,369 N/A 15,999 71,763 6,589 570 3031998 57,843 39,309 3,418 N/A 17,909 73,920 6,969 623 3601999 58,264 39,722 3,448 N/A 18,214 74,441 6,872 659 3472000 58,560 41,711 3,676 N/A 18,041 74,711 7,159 809 4142001 59,105 42,801 3,998 N/A 16,830 74,088 7,202 N/A N/A2002 59,946 42,884 4,333 N/A 17,432 75,246 7,037 N/A N/A
Year
Murder and Non-Negligent
Man- slaughter
Forcible Rape Robbery
Aggra-vated
Assault BurglaryLarceny-
Theft
Motor Vehicle Theft
1975 0 10 14 83 553 1,050 621976 1 12 14 72 736 1,245 891977 2 10 12 80 788 1,152 811978 5 9 17 82 707 1,480 1061979 2 13 17 69 667 1,594 1101980 1 21 15 58 730 1,672 1401981 2 10 29 52 667 1,660 851982 0 15 14 28 685 1,688 851983 3 3 10 78 573 1,569 671984 1 15 9 82 546 1,416 761985 2 11 9 61 582 1,397 711986 1 19 10 71 591 1,610 1161987 0 15 12 51 645 1,688 1321988 3 17 16 51 641 1,674 1221989 1 22 12 62 676 1,866 1351990 0 13 12 88 597 1,766 1201991 3 17 20 55 555 1,632 941992 1 20 6 43 633 1,624 1701993 3 21 14 66 545 1,562 1351994 1 15 18 33 488 1,729 811995 3 22 17 30 541 1,931 931996 4 20 13 25 590 2,242 831997 1 19 8 29 644 2,068 801998 0 18 12 30 465 1,658 801999 0 24 13 25 460 1,486 682000 6 23 14 101 591 1,764 792001 2 15 12 67 506 1,648 962002 1 23 17 138 726 2,015 125
Reported Crime for Index Offenses (Raw Counts)
Exhibit B-3: Raw Data Used for Kaua`i County Analyses
Tourism Measures, Population Data, and Other Potential Predictors
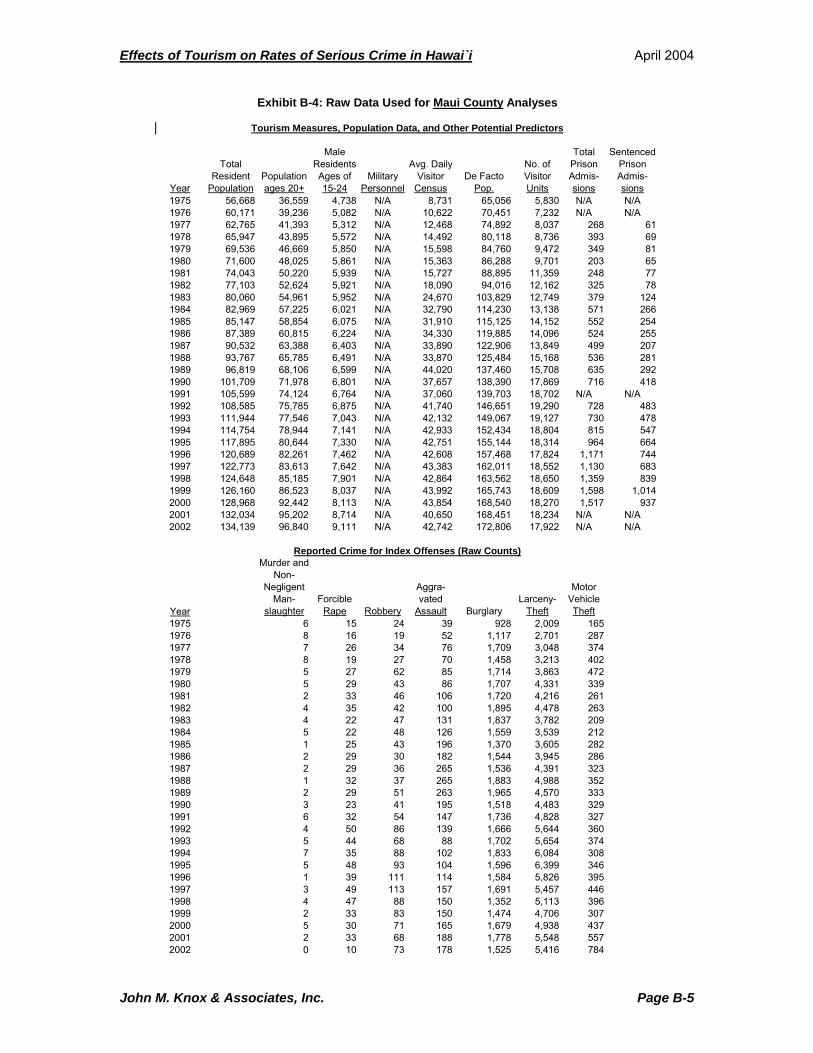
Effects of Tourism on Rates of Serious Crime in Hawai`i April 2004
John M. Knox & Associates, Inc. Page B-5
Year
Total Resident
PopulationPopulation ages 20+
Male Residents Ages of 15-24
Military Personnel
Avg. Daily Visitor
CensusDe Facto
Pop.
No. of Visitor Units
Total Prison Admis-sions
Sentenced Prison Admis-sions
1975 56,668 36,559 4,738 N/A 8,731 65,056 5,830 N/A N/A1976 60,171 39,236 5,082 N/A 10,622 70,451 7,232 N/A N/A1977 62,765 41,393 5,312 N/A 12,468 74,892 8,037 268 611978 65,947 43,895 5,572 N/A 14,492 80,118 8,736 393 691979 69,536 46,669 5,850 N/A 15,598 84,760 9,472 349 811980 71,600 48,025 5,861 N/A 15,363 86,288 9,701 203 651981 74,043 50,220 5,939 N/A 15,727 88,895 11,359 248 771982 77,103 52,624 5,921 N/A 18,090 94,016 12,162 325 781983 80,060 54,961 5,952 N/A 24,670 103,829 12,749 379 1241984 82,969 57,225 6,021 N/A 32,790 114,230 13,138 571 2661985 85,147 58,854 6,075 N/A 31,910 115,125 14,152 552 2541986 87,389 60,815 6,224 N/A 34,330 119,885 14,096 524 2551987 90,532 63,388 6,403 N/A 33,890 122,906 13,849 499 2071988 93,767 65,785 6,491 N/A 33,870 125,484 15,168 536 2811989 96,819 68,106 6,599 N/A 44,020 137,460 15,708 635 2921990 101,709 71,978 6,801 N/A 37,657 138,390 17,869 716 4181991 105,599 74,124 6,764 N/A 37,060 139,703 18,702 N/A N/A1992 108,585 75,785 6,875 N/A 41,740 146,651 19,290 728 4831993 111,944 77,546 7,043 N/A 42,132 149,067 19,127 730 4781994 114,754 78,944 7,141 N/A 42,933 152,434 18,804 815 5471995 117,895 80,644 7,330 N/A 42,751 155,144 18,314 964 6641996 120,689 82,261 7,462 N/A 42,608 157,468 17,824 1,171 7441997 122,773 83,613 7,642 N/A 43,383 162,011 18,552 1,130 6831998 124,648 85,185 7,901 N/A 42,864 163,562 18,650 1,359 8391999 126,160 86,523 8,037 N/A 43,992 165,743 18,609 1,598 1,0142000 128,968 92,442 8,113 N/A 43,854 168,540 18,270 1,517 9372001 132,034 95,202 8,714 N/A 40,650 168,451 18,234 N/A N/A2002 134,139 96,840 9,111 N/A 42,742 172,806 17,922 N/A N/A
Year
Murder and Non-
Negligent Man-
slaughterForcible
Rape Robbery
Aggra-vated
Assault BurglaryLarceny-
Theft
Motor Vehicle Theft
1975 6 15 24 39 928 2,009 1651976 8 16 19 52 1,117 2,701 2871977 7 26 34 76 1,709 3,048 3741978 8 19 27 70 1,458 3,213 4021979 5 27 62 85 1,714 3,863 4721980 5 29 43 86 1,707 4,331 3391981 2 33 46 106 1,720 4,216 2611982 4 35 42 100 1,895 4,478 2631983 4 22 47 131 1,837 3,782 2091984 5 22 48 126 1,559 3,539 2121985 1 25 43 196 1,370 3,605 2821986 2 29 30 182 1,544 3,945 2861987 2 29 36 265 1,536 4,391 3231988 1 32 37 265 1,883 4,988 3521989 2 29 51 263 1,965 4,570 3331990 3 23 41 195 1,518 4,483 3291991 6 32 54 147 1,736 4,828 3271992 4 50 86 139 1,666 5,644 3601993 5 44 68 88 1,702 5,654 3741994 7 35 88 102 1,833 6,084 3081995 5 48 93 104 1,596 6,399 3461996 1 39 111 114 1,584 5,826 3951997 3 49 113 157 1,691 5,457 4461998 4 47 88 150 1,352 5,113 3961999 2 33 83 150 1,474 4,706 3072000 5 30 71 165 1,679 4,938 4372001 2 33 68 188 1,778 5,548 5572002 0 10 73 178 1,525 5,416 784
Reported Crime for Index Offenses (Raw Counts)
Exhibit B-4: Raw Data Used for Maui County Analyses
Tourism Measures, Population Data, and Other Potential Predictors
Effects of Tourism on Rates of Serious Crime in Hawai`i April 2004
APPENDIX C: REFERENCES FOR TOURISM-CRIME STUDY (FOR EXHIBIT 1)
Albuquerque, K. and McElroy, J. Tourism and Crime in the Caribbean. Annals of Tourism Research. Volume 26, pp. 968-984. 1999. Chesney-Lind, M., and Lind, I. Visitors As Victims: Crimes Against Tourists in Hawai`i. Annals of Tourism Research. Volume 13, pp. 167-191. 1986. Frank, J. A. American Journal of Community Psychology. Economic Change and Mental Health in an Uncontaminated Setting. Volume 9, pp. 395-410. 1981. Fujii, E. T., and Mak, J. The Impact of Alternative Regional Development Strategies on Crime Rates: Tourism Vs. Agriculture. Annals of Regional Science. Volume 13, pp. 42-56. 1979 Fujii, E. T., Mak, J., and Nishimura, E. Tourism and Crime. Tourism Research Publications, Occasional Paper No. 2 Joint Project of The School of Travel Industry Management and the Social Science Research Institute, University of Hawai`i at Mānoa, Honolulu, Hawai`i, 1978. Fujii, E. T., Mak, J. Tourism and Crime: Implications for Regional Development Policy. Regional Studies. Volume 14, pp. 27-36. 1980. Jud G. D. Tourism and Crime in Mexico. Social Science Quarterly. Volume 56, pp. 324-330. 1975. McPheters, L. R. and Stronge, W. B. Crime as an Environmental Externality of Tourism. Land Economics. Volume 50, pp.288-292. 1974 Pizam, B. P. Tourism and Crime: Is There a Relationship? Journal of Travel Research. Volume 20 (Winter), pp. 7-10. 1982. Schiebler, S., Crotts, J., and Hollinger, R. Florida Tourists’ Vulnerability to Crime. In Tourism, Crime and International Security Issues. Mansfield and Pizam, eds., pp. 37-49. New York: Wiley. 1996. Walmsey, J. D., Boskovic, R. M., and Pigram, J. J. Tourism and Crime: An Australian Perspective. Journal of Leisure Research. Volume 15, pp. 136-155. 1983.
John M. Knox & Associates, Inc. Page C-1