effects of war losses on mortality estimates for italy: a ... · effects of war losses on mortality...
TRANSCRIPT

Demographic Research a free, expedited, online journal of peer-reviewed research and commentary in the population sciences published by the Max Planck Institute for Demographic Research Konrad-Zuse Str. 1, D-18057 Rostock · GERMANY www.demographic-research.org
DEMOGRAPHIC RESEARCH VOLUME 13, ARTICLE 15, PAGES 363-388 PUBLISHED 17 NOVEMBER 2005 http://www.demographic-research.org/Volumes/Vol13/15/ DOI: 10.4054/DemRes.2005.13.15 Research Article
Effects of war losses on mortality estimates for Italy: a first attempt
Dana A. Glei
Silvia Bruzzone
Graziella Caselli
This article is part of Demographic Research Special Collection 4, “Human Mortality over Age, Time, Sex, and Place: The 1st HMD Symposium”. Please see Volume 13, publications 13-10 through 13-20. © 2005 Max-Planck-Gesellschaft.

Table of Contents
1 Introduction 364 2 Hypothetical example of the effects of war 365 3 Vallin’s prior work on France 367 3.1 World War I 367 3.2 World War II 368 4 Total versus civilian mortality: the case of France 369 5 Accounting for Italian war mortality 372 5.1 Estimating deaths for the total population during World War I 372 5.1.1 Distribution by calendar year 372 5.1.2 Age distribution 374 5.1.3 Adjustment for non-Italian deaths 375 5.2 Estimating deaths for the civilian population during World War I 375 5.3 Estimating population exposure during World War I 375 5.4 Estimating mortality for the total population during World War
II 378
6 Total versus civilian mortality: the case of Italy 381 7 Implications for inter-country comparisons 384 8 Conclusion 387 9 Acknowledgements 387 References 388

Demographic Research: Volume 13, Article 15
a research article
http://www.demographic-research.org 363
Effects of war losses on mortality estimates for Italy: a first attempt
Dana A. Glei 1
Silvia Bruzzone 2
Graziella Caselli 3
Abstract
For countries that experience substantial war losses in a given time period, the exclusion of military deaths can have an important impact on estimates of mortality and life expectancy. In this paper, we start by reviewing Vallin’s work in accounting for French war losses. We then attempt to apply comparable methods to Italy in order to account for the effects of war. The results indicate that estimates currently available from the Human Mortality Database (HMD) greatly underestimate period mortality during wartime among all Italian males, and may even underestimate mortality among civilian males. Finally, we discuss how failing to account for war mortality presents problems in making inter-country mortality comparisons.
This article is part of Demographic Research Special Collection 4, “Human Mortality over Age, Time, Sex, and Place: The 1st HMD Symposium”. Please see Volume 13, Publications 13-10 through 13-20.
1 University of California, Berkeley; 1512 Pembleton Place, Santa Rosa, CA, 95403-2349, USA. Phone/Fax: (707) 544-3006; E-mail: [email protected]. 2 Istat – Istituto Nazionale di Statistica – Rome 3 Università di Roma "La Sapienza"

Glei, Bruzzone & Caselli: Effects of war losses on mortality estimates for Italy: a first attempt
364 http://www.demographic-research.org
1. Introduction
Estimates of life expectancy are commonly-used indicators of population health for a given country. These estimates are often used for comparative purposes to assess differences in mortality and to evaluate possible factors that may explain those differences. Furthermore, period and cohort life tables are used to gauge the pace of mortality improvement over time. Therefore, accuracy of these estimates is important in order to separate true differences in mortality from those resulting from a statistical artifact.
For countries that experience substantial war losses, the exclusion of military deaths can have a huge impact on estimates of mortality and life expectancy during wartime. Moreover, cohort mortality estimates may greatly underestimate the true experience of those cohorts who suffer heavy war losses. In most cases, vital registration systems cover only the civilian population, while excluding a large number of military deaths during wartime. Even if one is interested only in civilian mortality, population exposure may be overestimated if estimation does not account for troops mobilized during war. Consequently, civilian death rates may be underestimated because the numerator (deaths) excludes the military population while the denominator (exposure) does not.
We should note that the definition of the civilian population used in this paper differs from conventional use. Here, civilian deaths include all deaths reported by the civil registration system, even though they may include some military personnel. For example, during 1911-19, the death counts reported by the Italian civil authority included 104,103 deaths to military personnel—most of whom died from disease rather than direct combat (Mortara 1925). We include these deaths in the civilian population, but we do not include the 651,010 military-reported deaths for 1915-1920 in the civilian population. Similarly, during wartime, civilian population estimates are adjusted to exclude those on active military duty. During peacetime, the civilian and total mortality series are identical.
Failure to account for war mortality can also have important consequences for standard methods. For example, war creates two problems for using intercensal survival to estimate population size between censuses. First, if both censuses occur during peacetime—which is typically the case because a census is often delayed if a country is at war—but a war occurs between censuses, intercensal estimates will not account for increased population movement resulting from the war. Large numbers of people, particularly young adult men, may be absent because they were drafted or joined the military.
Second, failure to account for war losses may also affect population estimates during peacetime. After accounting for deaths during the intercensal period, differences

Demographic Research: Volume 13, Article 15
http://www.demographic-research.org 365
between the size of a cohort at the beginning of the census interval and the size of that same cohort at the end of the interval are generally attributed to migration and/or error. If combat-related losses are excluded, it creates additional error that is then redistributed across the entire interval. Yet, in the case of war during the intercensal period, this excess error may result from missing war deaths that occurred in selected years during wartime. Thus, we may underestimate civilian population size prior to the war (because too much error is attributed to those years) and overestimate it during wartime.
2. Hypothetical example of the effects of war
Consider a hypothetical example. Suppose we start with a cohort of males born in 1895 (who will turn age 20 in 1915), of which 100,000 males survived until a census occurred on January 1, 1910. Ten years later, on January 1, 1920, another census was taken, at which time 85,000 men remained from that birth cohort. During the intercensal period (1910-19), vital statistics reported 5,000 deaths for that cohort of males. So, by the 1920 census, we are missing 10,000 men from this cohort. If we attribute this difference to migration/error and redistribute it uniformly across the census interval, we would subtract an additional 1,000 men each year during the interval. Yet, what if those 10,000 men are missing because they died during World War I (WWI), but were not counted in the vital statistics?
Suppose we assume that the civilian deaths recorded in vital statistics for this cohort are distributed uniformly across the interval (500 per year). Further suppose that: 25,000 men from this cohort were mobilized on January 1, 1915; 2,500 of these men died in combat each year during 1915-18; and the remaining 15,000 were demobilized on January 1, 1919. As demonstrated in Figure 1, civilian death counts exclude a large proportion of deaths during wartime for this cohort of young males.
Figure 2 shows the effect on population estimates. If we fail to account for military deaths and troops mobilized during war, and use intercensal survival to estimate population size based on the standard assumption that “error” is distributed uniformly across the interval, the resulting estimates underestimate the true civilian population prior to the war. In contrast, during wartime we overestimate the civilian population. Meanwhile, the estimates based on standard assumptions underestimate the total population over most of the intercensal period. For example, we estimate the size of this cohort on January 1, 1914, at 94,000, whereas the true population size is 98,000 (Figure 2). In contrast, our estimate of 92,500 as of January 1, 1915, greatly overestimates the actual civilian population (72,500), while underestimating the total population (97,500).

Glei, Bruzzone & Caselli: Effects of war losses on mortality estimates for Italy: a first attempt
366 http://www.demographic-research.org
Figure 1: Deaths among the male 1895 birth cohort, 1910-19, hypothetical example
0
500
1000
1500
2000
2500
3000
3500
1910 1911 1912 1913 1914 1915 1916 1917 1918 1919
Nu
mb
er o
f D
eath
s
Civilian Military
Figure 2: January 1st population size of the male 1895 birth cohort, 1910-20, hypothetical example
50,000
60,000
70,000
80,000
90,000
100,000
1910 1911 1912 1913 1914 1915 1916 1917 1918 1919 1920
Pop
ula
tion
Siz
e
Standard Assumptions Civilian Total
(Age 14) (Age 24)
Figure 3 demonstrates the implications of these errors for the estimated death rates. Although the effects are quite small during peacetime, there are large differences during wartime. For example, using standard assumptions and ignoring the effects of war, we

Demographic Research: Volume 13, Article 15
http://www.demographic-research.org 367
estimate the death rate for this cohort of males at 0.5% in 1915, whereas the actual death rate is 0.7% for civilians and 3.1% for the total population.
Figure 3: Death rates among the male 1895 birth cohort, 1910-19, hypothetical example
0.0
0.5
1.0
1.5
2.0
2.5
3.0
3.5
4.0
1910 1911 1912 1913 1914 1915 1916 1917 1918 1919
Dea
th r
ate
(%)
Standard Assumptions Civilian Total
3. Vallin’s prior work on France
Jacques Vallin’s methods of adjusting French demographic estimates to account for war mortality and population movements provides a model for making similar adjustments for other countries. Below we briefly describe the methods he used for France (Vallin 1973).
3.1 World War I
For the WWI period, Vallin starts with the distribution of military deaths (all male) by calendar year and the estimated distribution of military deaths by age from an alternative source (Huber 1931). Taking into account differences in territorial coverage, he then redistributes these deaths by cohort for each calendar year (Vallin 1973:63-64). For most birth cohorts, he distributes deaths based on the age distribution for all military deaths (1914-19) among those same cohorts. The younger cohorts (born after 1895) are assumed to be mobilized rapidly once they come of age, and older cohorts (born before 1872) are assumed to be demobilized more rapidly with age.
Glei, Bruzzone & Caselli: Effects of war losses on mortality estimates for Italy: a first attempt
368 http://www.demographic-research.org
Thus, Vallin obtains the distribution of military deaths during WWI by calendar year and birth cohort (Vallin 1973:66, Table XVIII).
To derive civilian population estimates during WWI, Vallin starts with the population estimates by age as of January 1, 1914. For each cohort, he subtracts civilian deaths and troops mobilized during 1915; adds military personnel who returned to a civilian job, refugees, and immigrants during 1915; and adds births in 1914 for that cohort. Thus, he obtains population estimates by age as of January 1, 1915. Population estimates for subsequent years (through January 1, 1920) are obtained in a similar fashion, with the exception that in 1918 and 1919 he adds back to the civilian population those troops that were demobilized. For each of the subpopulations that are added or subtracted, Vallin first redistributes the counts by age and year based on various assumptions (for details, see Vallin 1973:48-60). Because these estimates result from multiple approximations, Vallin calculates an alternative estimate for the population as of January 1, 1920, by working backwards from the 1921 census. He adds the deaths that occurred during 1920 for each cohort and subtracts estimated annual net migration based on the intercensal period 1921-26. For males, he also subtracts those still in the military on 1/1/1920 and refugees during 1920 for each respective cohort. Comparing the two sets of estimates for January 1, 1920, he makes a correction to the first set of estimates by redistributing a portion of the differences between the two sets of estimates (Vallin 1973:62-63).
For the total population, Vallin first derives estimates of the military population and then adds those estimates to the civilian estimates. Starting with the number of men in the military (by cohort) at the start of the war, he subtracts deaths and those reassigned to civilian jobs, and adds the number of troops mobilized in 1914 for each respective cohort to get an estimate of the military population on January 1st, 1915. Estimates for subsequent years are derived in a similar fashion (Vallin 1973:64-67).
3.2 World War II
For the World War II (WWII) period, Vallin begins with the total number of military and other non-civilian deaths from other sources (La documentation française 1949, Henry 1953, Vincent 1946). Using data on population movements, he distributes these deaths by sex and calendar year. He then further distributes deaths by age based on various assumptions (see Vallin 1973:78-79 for details).

Demographic Research: Volume 13, Article 15
http://www.demographic-research.org 369
To obtain civilian population estimates4, Vallin starts with the January 1st population estimates by age and sex for 1939 and 1946. For each cohort, he interpolates to derive annual January 1st population estimates for 1940-45. He then compares the sum of these estimates for each calendar year with alternative estimates based on population movements and redistributes the differences between these two estimates using various assumptions about age structure (see Vallin 1973:73-77 for details). Estimates of the total population are also obtained by interpolation between 1939 and 1946, with a correction for net migration (Vallin 1973:77, 286-289).
4. Total versus civilian mortality: the case of France
For mortality comparisons between the civilian and total population in France, we use civilian death counts from annual vital statistics publications by the Institut national de la statistique et des études économiques (INSEE) with corrections for false stillbirths prior to 1975 (Vallin 1973, Vallin and Meslé 2001). Death counts for the total population come from Vallin and Meslé (2001). With the exception of war years, population estimates originally came from INSEE and were republished by Vallin and Meslé (2001). During 1914-1920 and 1939-1945, estimates for the civilian population4
come from Vallin (1973:268-271, 282-287) and estimates for the total population come from Vallin and Meslé (2001). Death rates and estimated life expectancy for the total population come from the Human Mortality Database (2004), while those for the civilian population were calculated using HMD methods (Wilmoth 2002).
Figure 4 demonstrates the difference in period life expectancy at birth (e0) between the civilian and total French population. Among males, e0 is much lower for the total population than for civilians during both WWI and WWII. For example, e0 was 40.9 years in 1915 for civilian males versus 27.1 for all males. Among females, the two series are identical during WWI because there were no combat deaths. During WWII, however, there is a noticeable difference between female civilian and total population mortality, albeit the gap is much smaller than for males.
4 In fact, Vallin estimates the population présente rather than the true civilian population. Because of the short duration of French war
operations (Sept. 1939 – June 1940), Vallin argues that subtracting the effective military forces from the January 1st population would risk
overestimating civilian mortality because the majority of military were not exposed to risk of military mortality. Therefore, Vallin defines the
population “présente”, which excludes only military POWs.

Glei, Bruzzone & Caselli: Effects of war losses on mortality estimates for Italy: a first attempt
370 http://www.demographic-research.org
Figure 4: Period life expectancy at birth (e0) by sex, total versus civilian, France, 1910-50
MALES
Life
exp
ecta
ncy
(e0
)
YEAR
Total Civilian
1910 1915 1920 1925 1930 1935 1940 1945 1950
20
30
40
50
60
70
FEMALES
Life
exp
ecta
ncy
(e0)
YEAR
Total Civilian
1910 1915 1920 1925 1930 1935 1940 1945 1950
20
30
40
50
60
70
We focus on males aged 20-24 because they suffer the heaviest combat mortality.
In 1915, the difference between civilian and total deaths among this age group is staggering: there were around 5,000 deaths to the civilian population, whereas deaths totaled more than 85,000 among the total male population aged 20-24 (Figure 5). Nonetheless, the civilian population was also smaller than the total population during war years because a large proportion of young adult males went into the military

Demographic Research: Volume 13, Article 15
http://www.demographic-research.org 371
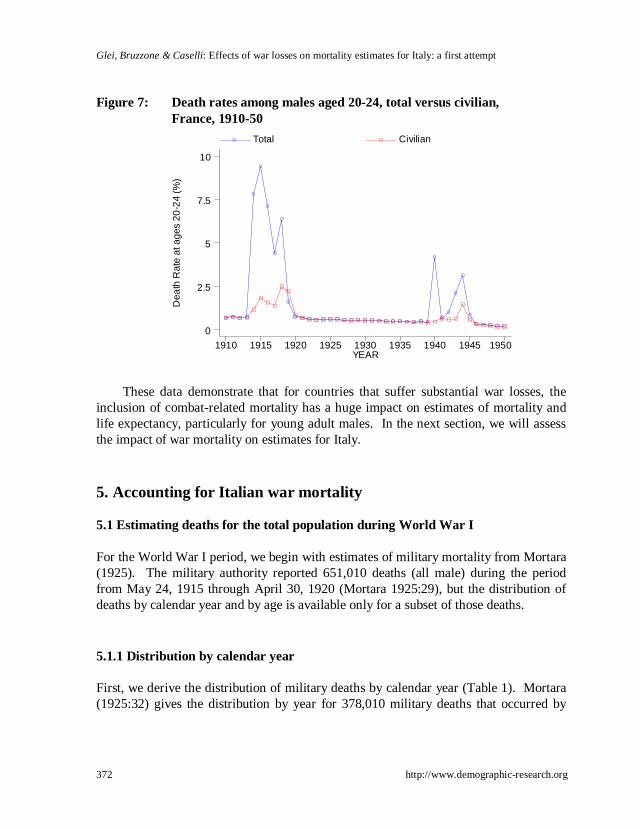
(Figure 6). Among males aged 20-24 in 1915, the exposure estimate for civilians was 271,000 compared with 908,000 for the total population. Even so, the difference in the period death rates is striking: among males in this age group, 1.8% civilians died in 1915 versus 9.4% of all males (Figure 7).
Figure 5: Deaths among males aged 20-24, total versus civilian, France, 1910-50
Dea
ths
at a
ges
20-2
4
YEAR
Total Civilian
1910 1915 1920 1925 1930 1935 1940 1945 1950
0
20,000
40,000
60,000
80,000
100,000
Figure 6: Exposure estimates among males aged 20-24, total versus civilian, France, 1910-50
Po
pula
tion
Exp
osur
e (in
mill
ions
)
YEAR
Total Civilian
1910 1915 1920 1925 1930 1935 1940 1945 1950
0.0
0.5
1.0
1.5
2.0
Glei, Bruzzone & Caselli: Effects of war losses on mortality estimates for Italy: a first attempt
372 http://www.demographic-research.org
Figure 7: Death rates among males aged 20-24, total versus civilian, France, 1910-50
Dea
th R
ate
at a
ges
20-2
4 (%
)
YEAR
Total Civilian
1910 1915 1920 1925 1930 1935 1940 1945 1950
0
2.5
5
7.5
10
These data demonstrate that for countries that suffer substantial war losses, the
inclusion of combat-related mortality has a huge impact on estimates of mortality and life expectancy, particularly for young adult males. In the next section, we will assess the impact of war mortality on estimates for Italy.
5. Accounting for Italian war mortality
5.1 Estimating deaths for the total population during World War I
For the World War I period, we begin with estimates of military mortality from Mortara (1925). The military authority reported 651,010 deaths (all male) during the period from May 24, 1915 through April 30, 1920 (Mortara 1925:29), but the distribution of deaths by calendar year and by age is available only for a subset of those deaths.
5.1.1 Distribution by calendar year
First, we derive the distribution of military deaths by calendar year (Table 1). Mortara (1925:32) gives the distribution by year for 378,010 military deaths that occurred by
Demographic Research: Volume 13, Article 15
http://www.demographic-research.org 373
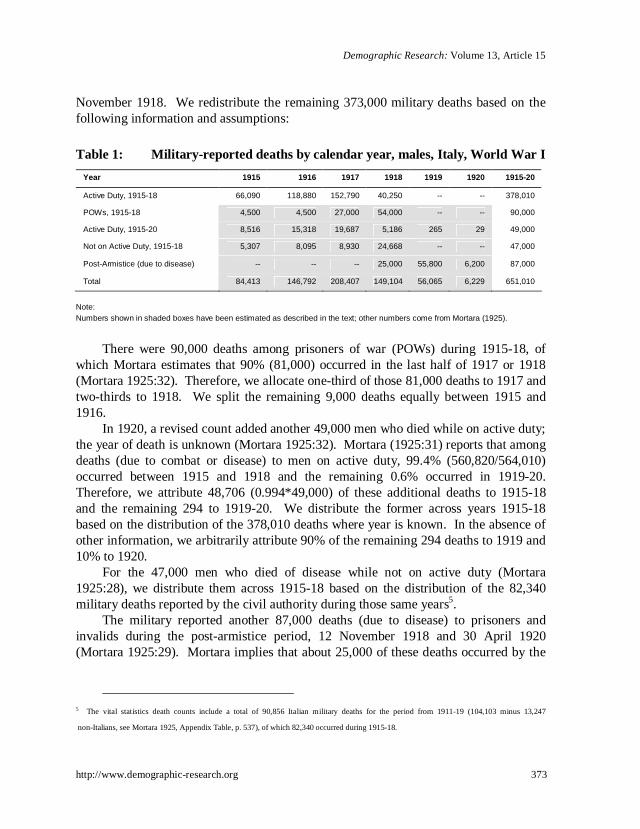
November 1918. We redistribute the remaining 373,000 military deaths based on the following information and assumptions:
Table 1: Military-reported deaths by calendar year, males, Italy, World War I
Year 1915 1916 1917 1918 1919 1920 1915-20
Active Duty, 1915-18 66,090 118,880 152,790 40,250 -- -- 378,010
POWs, 1915-18 4,500 4,500 27,000 54,000 -- -- 90,000
Active Duty, 1915-20 8,516 15,318 19,687 5,186 265 29 49,000
Not on Active Duty, 1915-18 5,307 8,095 8,930 24,668 -- -- 47,000
Post-Armistice (due to disease) -- -- -- 25,000 55,800 6,200 87,000
Total 84,413 146,792 208,407 149,104 56,065 6,229 651,010
Note: Numbers shown in shaded boxes have been estimated as described in the text; other numbers come from Mortara (1925).
There were 90,000 deaths among prisoners of war (POWs) during 1915-18, of
which Mortara estimates that 90% (81,000) occurred in the last half of 1917 or 1918 (Mortara 1925:32). Therefore, we allocate one-third of those 81,000 deaths to 1917 and two-thirds to 1918. We split the remaining 9,000 deaths equally between 1915 and 1916.
In 1920, a revised count added another 49,000 men who died while on active duty; the year of death is unknown (Mortara 1925:32). Mortara (1925:31) reports that among deaths (due to combat or disease) to men on active duty, 99.4% (560,820/564,010) occurred between 1915 and 1918 and the remaining 0.6% occurred in 1919-20. Therefore, we attribute 48,706 (0.994*49,000) of these additional deaths to 1915-18 and the remaining 294 to 1919-20. We distribute the former across years 1915-18 based on the distribution of the 378,010 deaths where year is known. In the absence of other information, we arbitrarily attribute 90% of the remaining 294 deaths to 1919 and 10% to 1920.
For the 47,000 men who died of disease while not on active duty (Mortara 1925:28), we distribute them across 1915-18 based on the distribution of the 82,340 military deaths reported by the civil authority during those same years5.
The military reported another 87,000 deaths (due to disease) to prisoners and invalids during the post-armistice period, 12 November 1918 and 30 April 1920 (Mortara 1925:29). Mortara implies that about 25,000 of these deaths occurred by the
5 The vital statistics death counts include a total of 90,856 Italian military deaths for the period from 1911-19 (104,103 minus 13,247
non-Italians, see Mortara 1925, Appendix Table, p. 537), of which 82,340 occurred during 1915-18.

Glei, Bruzzone & Caselli: Effects of war losses on mortality estimates for Italy: a first attempt
374 http://www.demographic-research.org
end of 1918 (p. 31). Thus, we attribute 25,000 deaths to 1918, and arbitrarily assign 90% of the remaining 62,000 to 1919 and 10% to 1920.
5.1.2 Age distribution
Next, we estimate the age distribution for these deaths (Table 2). We use information from a survey conducted in the province of Bologna comprising a sample of 10,085 deaths that occurred by the end of 1918, where the age distribution (15, 16…40, 41+) is given (Mortara 1924:42-45). Mortara argues that these data are of high quality and can be considered representative of all deaths. Thus, we apply this age distribution to all military deaths during 1915-18. These data do not provide greater age detail above age 40, but the military deaths reported by the civil authority are available by 10-year age groups to age 85+ (Mortara 1925:537). Therefore, we redistribute deaths above age 40 into age groups (41-44, 45-54…75-84, 85+) based on the distribution of all military deaths (1915-18) reported by the civil authority. For deaths in 1919-20, we apply the age distribution given for military deaths reported by the civil authority for 1919.
Table 2: Military-reported deaths by age group and calendar year, males, Italy, World War I
Age Group 1915 1916 1917 1918 1919 1920
15-19 4,662.2 8,107.4 11,510.4 8,235.1 4,119.4 457.7
20-24 32,585.0 56,664.6 80,448.8 57,557.0 18,813.7 2,090.3
25-34 37,012.8 64,364.5 91,380.6 65,378.1 19,465.0 2,162.6
35-44 8,773.4 15,256.8 21,660.7 15,497.1 10,546.6 1,171.8
45-54 585.9 1,018.9 1,446.6 1,035.0 2,149.8 238.8
55-64 317.1 551.4 782.8 560.0 417.3 46.4
65-74 220.7 383.8 544.9 389.8 281.4 31.3
75-84 208.3 362.3 514.4 368.0 221.3 24.6
85+ 47.5 82.6 117.3 83.9 50.6 5.6
Total 84,412.9 146,792.4 208,406.5 149,104.2 56,065.0 6,229.0
Note: This distribution has been estimated based on the assumptions described in the text.
Demographic Research: Volume 13, Article 15
http://www.demographic-research.org 375
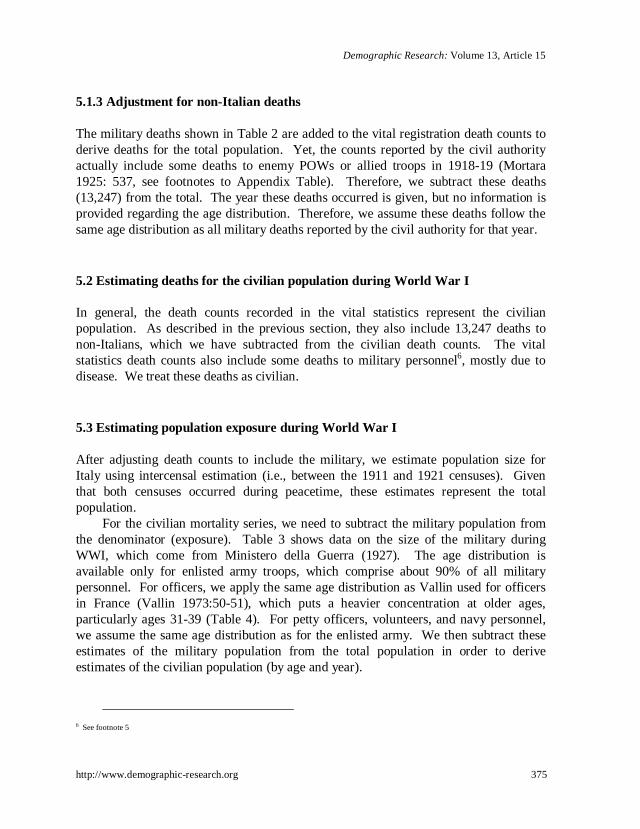
5.1.3 Adjustment for non-Italian deaths
The military deaths shown in Table 2 are added to the vital registration death counts to derive deaths for the total population. Yet, the counts reported by the civil authority actually include some deaths to enemy POWs or allied troops in 1918-19 (Mortara 1925: 537, see footnotes to Appendix Table). Therefore, we subtract these deaths (13,247) from the total. The year these deaths occurred is given, but no information is provided regarding the age distribution. Therefore, we assume these deaths follow the same age distribution as all military deaths reported by the civil authority for that year.
5.2 Estimating deaths for the civilian population during World War I
In general, the death counts recorded in the vital statistics represent the civilian population. As described in the previous section, they also include 13,247 deaths to non-Italians, which we have subtracted from the civilian death counts. The vital statistics death counts also include some deaths to military personnel6, mostly due to disease. We treat these deaths as civilian.
5.3 Estimating population exposure during World War I
After adjusting death counts to include the military, we estimate population size for Italy using intercensal estimation (i.e., between the 1911 and 1921 censuses). Given that both censuses occurred during peacetime, these estimates represent the total population.
For the civilian mortality series, we need to subtract the military population from the denominator (exposure). Table 3 shows data on the size of the military during WWI, which come from Ministero della Guerra (1927). The age distribution is available only for enlisted army troops, which comprise about 90% of all military personnel. For officers, we apply the same age distribution as Vallin used for officers in France (Vallin 1973:50-51), which puts a heavier concentration at older ages, particularly ages 31-39 (Table 4). For petty officers, volunteers, and navy personnel, we assume the same age distribution as for the enlisted army. We then subtract these estimates of the military population from the total population in order to derive estimates of the civilian population (by age and year).
6 See footnote 5

Glei, Bruzzone & Caselli: Effects of war losses on mortality estimates for Italy: a first attempt
376 http://www.demographic-research.org
Table 3: Size of the military as of December 31st by calendar year, males, Italy, World War I
As of December 31st:
1915 1916 1917 1918
Army
Officers† 82,825 111,232 139,874 178,386
Petty Officers‡ 43,199 45,761 49,939 48,815
Volunteers‡ 5,078 4,185 4,633 4,123
Enlisted Troops‡ 2,010,295 2,697,891 2,754,256 1,899,437
Navy§ 74,000 84,000 103,000 125,000
Total Military 2,215,397 2,943,069 3,051,702 2,255,761
Source: Ministero della Guerra, Ufficio Statistico. (1927). La Forza dell'Escercito. Statistica dello Sforzo Militare Italiano nello
Guerra Mondiale. Roma: Provveditorato Generale dell Stato Libreria. †The number of army officers comes from: “Table 4 - Ufficiali esistenti alle principali date” (pp. 13-20). These figures exclude
officers in the reserves (“riserva”). ‡The number of petty officers (“sottufficiali di carriera raffermati e musicanti”), volunteers (“volontari per la durata della guerra”), and
enlisted troops comes from: “Forza alle armi al 1st Gennaio 1916; 1917; 1918; 1919” (pp. 66-67, 74-75, 82-83, 91-92). §The number of navy personnel comes from p. XXVI.

Demographic Research: Volume 13, Article 15
http://www.demographic-research.org 377
Table 4: Estimated military population as of December 31st by calendar year and age, males, Italy, World War I
31 December 1915 31 December 1916 31 December 1917 31 December 1918
Age Officers Other† Officers Other† Officers Other† Officers Other†
18 0.0 0.0 0.0 0.0 0.0 240,836.8 0.0 187,730.5
19 0.0 264,581.5 0.0 225,460.4 0.0 164,398.9 0.0 177,720.8
20 0.0 208,597.5 0.0 204,249.3 0.0 173,349.5 0.0 151,216.3
21 0.0 179,695.3 0.0 186,975.3 0.0 154,071.7 0.0 150,936.9
22 0.0 162,978.8 0.0 172,175.7 0.0 143,950.5 0.0 140,888.1
23 1,840.6 150,307.3 2,471.8 162,188.3 3,108.3 139,025.3 3,964.1 128,241.1
24 1,840.6 137,188.1 2,471.8 151,267.6 3,108.3 132,020.2 3,964.1 126,499.0
25 1,840.6 121,742.4 2,471.8 148,460.0 3,108.3 127,479.5 3,964.1 121,116.9
26 1,840.6 111,387.7 2,471.8 140,758.2 3,108.3 120,961.1 3,964.1 113,624.1
27 1,840.6 94,591.7 2,471.8 137,086.9 3,108.3 113,261.2 3,964.1 106,457.4
28 2,760.8 111,175.6 3,707.7 126,255.5 4,662.5 116,728.3 5,946.2 99,381.8
29 2,760.8 97,920.5 3,707.7 123,890.0 4,662.5 108,631.4 5,946.2 100,792.1
30 2,760.8 47,375.4 3,707.7 115,888.3 4,662.5 102,055.6 5,946.2 92,963.5
31 5,521.7 46,863.0 7,415.5 116,439.3 9,324.9 96,913.6 11,892.4 86,027.3
32 5,521.7 41,913.2 7,415.5 113,639.4 9,324.9 99,841.0 11,892.4 82,618.5
33 5,521.7 42,985.7 7,415.5 108,733.6 9,324.9 96,250.0 11,892.4 81,320.3
34 5,521.7 65,271.5 7,415.5 104,875.3 9,324.9 92,137.5 11,892.4 27,185.8
35 5,521.7 44,942.9 7,415.5 80,792.4 9,324.9 89,458.5 11,892.4 22,424.4
36 5,521.7 53,787.0 7,415.5 75,962.4 9,324.9 91,211.8 11,892.4 20,224.5
37 5,521.7 54,345.0 7,415.5 96,948.8 9,324.9 75,806.3 11,892.4 18,981.8
38 4,601.4 51,009.8 6,179.6 82,451.2 7,770.8 77,683.7 9,910.3 12,901.7
39 4,601.4 43,911.8 6,179.6 79,999.0 7,770.8 76,719.8 9,910.3 10,341.3
40 2,760.8 0.0 3,707.7 77,340.3 4,662.5 93,378.1 5,946.2 5,584.8
41 2,760.8 0.0 3,707.7 0.0 4,662.5 96,783.9 5,946.2 4,779.1
42 2,760.8 0.0 3,707.7 0.0 4,662.5 47,571.9 5,946.2 4,101.2
43 2,760.8 0.0 3,707.7 0.0 4,662.5 41,301.9 5,946.2 1,774.6
44 2,760.8 0.0 3,707.7 0.0 4,662.5 0.0 5,946.2 1,541.2
45 1,840.6 0.0 2,471.8 0.0 3,108.3 0.0 3,964.1 0.0
46 1,840.6 0.0 2,471.8 0.0 3,108.3 0.0 3,964.1 0.0
Total 82,825.0 2,132,572.0 111,232.0 2,831,837.0 139,874.0 2,911,828.0 178,386.0 2,077,375.0
Note: This distribution has been estimated based on the assumptions described in the text. †Includes petty officers, volunteers, enlisted troops, and navy personnel.

Glei, Bruzzone & Caselli: Effects of war losses on mortality estimates for Italy: a first attempt
378 http://www.demographic-research.org
Adjustment for the absence of military troops has a particularly big effect on exposure estimates for civilian males aged 20-24. In 1917, the exposure for all males was about 1.5 million, whereas the estimated civilian male exposure was less than 0.7 million (Figure 8).
Figure 8: Population exposure among males aged 20-24, total versus civilian, Italy, 1910-25
Pop
ulat
ion
Exp
osur
e (in
mill
ions
)
YEAR
Total Civilian
1910 1915 1920 1925
0.0
0.5
1.0
1.5
2.0
5.4 Estimating mortality for the total population during World War II
Estimates of the number of military deaths and missing persons during WWII total 291,340 (Istituto Centrale di Statistica 1957). These data are available by sex and calendar year (with 1943 split into the pre- and post-armistice periods), although the year is unknown for 1,115 deaths and 5,845 of those missing7. Within each subgroup (deaths and missing), we redistribute those counts where year is unknown based on the distribution of those where the year is known (Table 5).
7 We include only those deaths designated as “militari” (159,957 dead and 131,419 missing). To the best of our knowledge, those labeled “civili”
(99,884 dead and 2,216 missing), “civili al seguito di militari” (2,598 dead and 398 missing), and “non indicato se civili o militari” (796 dead and
243 missing) are already included in the vital statistics.

Demographic Research: Volume 13, Article 15
http://www.demographic-research.org 379
Table 5: Military deaths* by sex and year, Italy, World War II
Year Total Female Male
Pre-Armistice
1940 12,775.6 - 12,775.6
1941 40,928.4 - 40,928.5
1942 63,999.3 - 63,999.5
1943 (1 Jan - 8 Sept) 86,370.3 - 86,370.6
Post-Armistice
1943 (9 Sept - 31 Dec) 20,623.7 5.0 20,618.6
1944 41,771.0 14.0 41,756.8
1945 24,907.6 17.0 24,890.4
Total 291,376.0 36.0 291,340.0
Source: Istituto Centrale di Statistica. (1957). Morti e disperse per cause belliche negli anni 1940-45. Roma: Istituto Centrale di
Statistica, Table 1-1; We have redistributed deaths/missing of unknown calendar year as described in the text. *These counts include 131,419 persons reported “missing”.
Data on military deaths by sex and age group are also available (Istituto Centrale
di Statistica 1957), although age is unknown for 2,800 deaths and 4,033 missing persons. Within each subgroup, we redistribute counts of unknown age based on distribution of those where age is known. Istituto Centrale di Statistica (1957) reports the deaths by age disaggregated into those occurring pre-armistice and those occurring post-armistice, but not by calendar year8. To derive estimates of military deaths by sex, calendar year, and age group, we apply the age distribution by sex within each period (pre- and post-armistice) to the estimated number of deaths (excluding missing persons) by sex and year (Table 5). Finally, we apply the age distribution for missing persons (which are not available by sex and war period) to the estimated number of missing persons by sex and year. The resulting estimates of deaths (including missing persons) are shown in Table 6. From this point on, our use of the term “deaths” includes missing persons. These counts are then added to the vital statistics death counts to get deaths for the total population.
Like for World War I, we derive estimates for total population size using the intercensal survival method (i.e., between the 1936 and 1951 censuses) after adjusting deaths to include the military. Unfortunately, we have not yet located data on the size
8 More detailed age groups at older ages (…50-54, 55-59, 60-64, 65+) are given for deaths (including missing) over the entire war period (Istituto
Centrale di Statistica 1957:25, Tav. 2-6) than for deaths (excluding missing) disaggregated into pre- and post-Armistice periods (..50-59, 60+)
(Istituto Centrale di Statistica 1957:24, Tav. 2-5). Within each of the latter age groups (50-59, 60+), we redistribute deaths during the pre- and
post-Armistice periods based on the more detailed age distribution over the entire war period.

Glei, Bruzzone & Caselli: Effects of war losses on mortality estimates for Italy: a first attempt
380 http://www.demographic-research.org
of the Italian military forces during WWII. Without such estimates, we cannot estimate the civilian population during this period.
Table 6: Estimated military deaths* by sex, year, and age group, Italy, World War II
1940 1941 1942 1943 1944 1945 Total
Males
15-19 400.3 1,277.6 1,920.1 3,728.3 3,023.3 1,933.3 12,282.7
20-24 5,684.1 18,319.4 30,460.4 51,119.2 17,228.5 9,971.4 132,783.0
25-29 3,843.5 12,286.7 18,775.7 30,115.9 9,037.2 5,183.7 79,242.6
30-34 1,743.5 5,587.3 8,764.2 15,058.6 6,949.9 4,229.0 42,332.6
35-39 518.7 1,635.0 2,112.8 3,693.6 2,686.2 1,721.3 12,367.6
40-44 260.1 812.0 919.6 1,515.7 1,162.8 754.4 5,424.7
45-49 161.1 500.8 528.2 878.2 788.5 517.0 3,373.8
50-54 95.6 297.1 313.0 535.2 515.2 338.4 2,094.6
55-59 43.9 136.0 134.6 228.5 239.4 158.3 940.8
60-64 16.0 49.5 46.3 75.7 81.2 53.9 322.6
65+ 8.8 27.1 24.7 40.3 44.5 29.6 175.0
Total 12,775.6 40,928.5 63,999.5 106,989.2 41,756.8 24,890.4 291,340.0
Females
15-19 0.0 0.0 0.0 0.8 2.3 3.2 6.3
20-24 0.0 0.0 0.0 2.1 5.8 6.7 14.6
25-29 0.0 0.0 0.0 0.8 2.1 2.2 5.1
30-34 0.0 0.0 0.0 0.8 2.1 2.6 5.5
35-39 0.0 0.0 0.0 0.2 0.5 0.6 1.3
40-44 0.0 0.0 0.0 0.4 1.1 1.6 3.1
45-49 0.0 0.0 0.0 0.0 0.0 0.0 0.0
50-54 0.0 0.0 0.0 0.0 0.0 0.0 0.0
55-59 0.0 0.0 0.0 0.0 0.0 0.0 0.0
60-64 0.0 0.0 0.0 0.0 0.0 0.0 0.0
65+ 0.0 0.0 0.0 0.0 0.0 0.0 0.0
Total 0.0 0.0 0.0 5.0 14.0 17.0 36.0
Note: This distribution has been estimated based on the assumptions described in the text. *These counts include 131,419 persons reported “missing”.

Demographic Research: Volume 13, Article 15
http://www.demographic-research.org 381
6. Total versus civilian mortality: the case of Italy
We start with the original vital statistics and census counts published or otherwise provided by the Istituto Nazionale di Statistica (ISTAT). We then make adjustments for war mortality (see 5.1 and 5.4) to derive death counts for total population in Italy. Population estimates are derived using intercensal survival (Wilmoth 2002). For the civilian series, we use the death counts from ISTAT and the population estimates adjusted for the absence of military troops during WWI (see 5.3). Because we lack data on the size of the military population during WWII, we end the civilian series in 1939. Death rates and life expectancy are calculated using standard methods.
There were no military deaths among Italian females during World War I and very few during World War II. Therefore, the civilian and total mortality series for females are, for all practical purposes, identical. Italian males, however, suffered heavy military losses. Figure 9 shows the total number of male deaths for the civilian and total populations. Total mortality was clearly much higher during wartime than peacetime, but even among civilians there appears to be excess wartime mortality, particularly during WWII. The large spike in deaths during 1918 results only in part from the war. A large part of this excess mortality was probably caused by the flu epidemic, and many these deaths would likely have occurred even if there had not been a war (although the war may have amplified the impact of the epidemic).
Figure 9: Deaths among males of all ages, total versus civilian, Italy, 1910-50
Dea
ths
YEAR
Total Civilian
1910 1915 1920 1925 1930 1935 1940 1945 1950
0
200,000
400,000
600,000
800,000
Young males aged 20-24 bore the largest share of war losses. For example, there
were 11,181 deaths to civilian males in this age group in 1917 versus 92,034 deaths

Glei, Bruzzone & Caselli: Effects of war losses on mortality estimates for Italy: a first attempt
382 http://www.demographic-research.org
among all corresponding males (Figure 10). Similar differences occurred during World War II although smaller in magnitude.
Figure 10: Deaths among males aged 20-24, total versus civilian, Italy, 1910-50 D
eath
s at a
ges
20-2
4
YEAR
Total Civilian
1910 1915 1920 1925 1930 1935 1940 1945 1950
0
20,000
40,000
60,000
80,000
100,000
Figure 11 presents the death rates among these young adult males for the total
population and the civilian population during the WWI period. Not surprisingly, the death rates were much higher among all young males relative to their civilian counterparts. The biggest difference occurred in 1917: the death rate for all Italian males aged 20-24 was 6.2% versus 1.7% for civilians. Yet, because the exposure for civilians is less than for the total population, the gap in the death rates is not as large as the differences in absolute death counts might suggest.
Comparing these rates to those of the corresponding French population (Figure 7), it appears that young adult males in France suffered higher mortality early in the WWI (e.g., 9.6% for France in 1915 vs. 3.1% for Italy). The French experienced their peak war losses in 1915 whereas the heaviest losses for the Italians occurred in 1917, at which time the death rate for young adult males was higher than for France (6.2% vs. 4.2%, respectively). During WWII, the distribution of war losses again differed for France and Italy. Whereas France experienced their heaviest losses at the beginning of the war (after being invaded), the Italians suffered the highest mortality during 1943. For example, in 1940 the death rate among French males aged 20-24 was 3.6% versus 0.7% for their Italian counterparts. In 1943, however, the comparable death rates were 2.0% vs. 3.4%, respectively.

Demographic Research: Volume 13, Article 15
http://www.demographic-research.org 383
Figure 11: Death rates among males aged 20-24, total versus civilian, Italy, 1910-50
Dea
th R
ates
age
d 20
-24
(%)
YEAR
Total Civilian
1910 1915 1920 1925 1930 1935 1940 1945 1950
0
2.5
5
7.5
10
Figure 12: Male life expectancy at birth, Human Mortality Database (HMD), total, and civilian, Italy, 1910-50
20.0
30.0
40.0
50.0
60.0
70.0
1910 1915 1920 1925 1930 1935 1940 1945 1950
Lif
e E
xpec
tan
cy (
e0)
HMD Total Civilian In Figure 12, we present male life expectancy at birth (e0) for the total and civilian
populations as well as the estimates currently available from the HMD. In the HMD, death counts for Italy represent the civilian population, whereas the population estimates are probably closer to the total population because they do not account for the
Glei, Bruzzone & Caselli: Effects of war losses on mortality estimates for Italy: a first attempt
384 http://www.demographic-research.org
absence of military troops mobilized during war. Thus, the HMD estimates overestimate period e0 during war periods because military deaths are excluded. For example, in 1917 the current HMD estimate of e0 is 45.8 years while the estimate based on the total male population is only 31.4 years. Moreover, civilian e0 is also overestimated during wartime because the exposure estimates do not account for the absence of military troops. Our estimate of e0 for male civilians in 1917 is 42.0 years—3.8 years less than the HMD estimate.
7. Implications for inter-country comparisons
For inter-country comparisons, it is crucial that the data represent the same population coverage. In the HMD, the mortality data for France represent the total population (including military), yet the data for most other countries represent largely the civilian population. For reasons already noted, those data may not be very representative even of the civilian population during wartime (especially for males) if population estimates do not account for increased population movement resulting from war. As previously shown, the HMD estimates for Italy do not accurately represent either the total or the civilian population during wartime.
Consequently, a comparison of the HMD mortality estimates for Italy versus France can be misleading. Figure 13 presents HMD estimates of e0 for males in France and Italy during 1910-1950 (HMD 2004). These data suggest that male life expectancy during WWI and most of WWII is much lower in France than in Italy (e.g., in 1915, 27.1 vs. 45.4 years, respectively). During peacetime, however, e0 for French males is often higher than for Italians. Notably, the two countries were involved in the World Wars for different time periods, which can account for some differences in causalities. France entered WWI much earlier (August 3, 1914) than Italy (May 24, 1915); the armistice was signed on November 11, 1918. France also entered WWII earlier (September 3, 1939) than Italy (June 10, 1940). Although the war in Europe did not end until “V.E. day” (May 8, 1945), French war operations ended in June 1940, and Italy surrendered on September 8, 1943.
For an appropriate comparison between Italy and France, we use the estimates of Italian mortality for the total male population (Figure 14). These data indicate that during wartime, male life expectancy in France was sometimes lower than in Italy (e.g., 27.1 vs. 38.4 in 1915, respectively) and at other times higher (e.g., 35.7 vs. 31.4 in 1917, respectively).

Demographic Research: Volume 13, Article 15
http://www.demographic-research.org 385
Figure 13: Male life expectancy at birth, Human Mortality Database, France versus Italy, 1910-50
20.0
30.0
40.0
50.0
60.0
70.0
1910 1915 1920 1925 1930 1935 1940 1945 1950
Life
Exp
ecta
ncy
(e0)
France Italy
Source: Human Mortality Database (www.mortality.org). Retrieved on 10 June 2004.
Figure 14: Male life expectancy at birth, total population, France versus Italy, 1910-50
20.0
30.0
40.0
50.0
60.0
70.0
1910 1915 1920 1925 1930 1935 1940 1945 1950
Lif
e E
xpec
tan
cy (
e0)
France Italy Figure 15 shows a similar comparison using the estimates for the civilian
population. Although we were unable to estimate mortality for Italian civilians during

Glei, Bruzzone & Caselli: Effects of war losses on mortality estimates for Italy: a first attempt
386 http://www.demographic-research.org
WWII, the data suggest that French civilians generally enjoyed higher life expectancy than their Italian counterparts, especially among females. Nonetheless, in the early part of WWI, French males had slightly lower life expectancy than Italians.
Figure 15: Life expectancy at birth by sex, civilian population, France versus Italy, 1910-50
Males
20.0
30.0
40.0
50.0
60.0
70.0
1910 1915 1920 1925 1930 1935 1940 1945 1950
Lif
e E
xpec
tan
cy (
e0)
France Italy
Females
20.0
30.0
40.0
50.0
60.0
70.0
1910 1915 1920 1925 1930 1935 1940 1945 1950
Lif
e E
xpec
tan
cy (
e0)
France Italy

Demographic Research: Volume 13, Article 15
http://www.demographic-research.org 387
8. Conclusion
In this paper, we have demonstrated that accounting for the effects of war on demographic patterns has a substantial impact on mortality estimates for countries that experience high combat-related mortality. Vallin’s work in estimating French total and civilian populations and mortality during wartime provides an important foundation for making similar adjustments in other countries. We have attempted to apply comparable methods to Italy in order to account for war mortality. The resulting mortality series for the total population shows that during war the estimates currently available from the HMD greatly underestimate period mortality among males because military-reported deaths are excluded. Moreover, estimates for civilians during WWI suggest that the HMD estimates also underestimate civilian mortality because they do not account for the mobilization of military troops.
Consequently, inter-country comparisons during wartime can be misleading if the populations being represented are not comparable. Because available data may be limited or difficult to obtain, making appropriate adjustments to account for war mortality can be challenging. Yet, the evidence provided here indicates that this problem cannot be ignored if we want accurate mortality estimates during wartime.
Deriving a mortality series for the civilian population can be equally challenging. As yet, we have been unable to complete the Italian civilian series through WWII because we lack data on the number of troops mobilized during the war. In the future, we hope to locate data on the size of the military—preferably by calendar year and age—in order to complete the series. Nonetheless, even allowing for such adjustments, there is still some ambiguity in the definition of the “civilian” population. It may be impossible to exclude all military deaths because vital statistics counts may include some military personnel (e.g., who died in a hospital within the country).
9. Acknowledgements
We gratefully acknowledge financial support for this project from the National Institute of Aging (grant RO1 AG11552). We thank Vanda Wilcox and Hew Strachan at Oxford University, and John Gooch at the University of Leeds for their help in locating data on the size of the Italian military during WWI. We also express our appreciation to Dmitri Jdanov and Domantas Jasilionis at the Max Planck Institute for Demographic Research for their helpful suggestions and to all the participants of the HMD Symposium in 2004 for their feedback.

Glei, Bruzzone & Caselli: Effects of war losses on mortality estimates for Italy: a first attempt
388 http://www.demographic-research.org
References
Henry, L. 1953. "Au sujet des pertes de guerre." Population 7(3):372-373.
Huber, M. 1931. La population de la France pendant la guerre. Paris: Presses Universitaires de France.
Institut national de la statistique et des études économiques (INSEE). 1939-1942, 1943, 1944. Statistiques du mouvement de la population, Tome XIX, XX, and XXI. Paris: Imprimerie Nationale.
Istituto Centrale di Statistica. 1957. Morti e disperse per cause belliche negli anni 1940-45. Roma: Instituto Centrale di Statistica.
La documentation française. 1949. "Les pertes humaines de 1939 à 1945." Cahiers d’information 15 January 1949.
Ministero della Guerra, Ufficio Statistico. 1927. Statistica dello sforzo militare Italiano nella Guerra Mondiale, La forza dell’esercito. Roma: Provveditorato Generale dello Stato Libreria.
Mortara, G. 1925. La Salute pubblica in Italia durante e dopo la guerra. New Haven: Yale University Press, pp. 27-48, 523-28, 536-38.
University of California, Berkeley and Max Planck Institute for Demographic Research. 2004. "Human Mortality Database.", Retrieved June 10, 2004 (http://www.mortality.org).
Vallin, J. 1973. La mortalité par génération en France, depuis 1899; Travaux et Documents, Cahier no. 63. Paris: Presses University de France.
Vallin, J. and F. Meslé. 2001. Tables de mortalité françaises pour les XIXe et XXe siècles et projections pour le XXIe siècle (includes CD-ROM). Paris: Institut national d’études démographiques.
Vincent, P. 1946. "Conséquences de dix années de guerre sur la population française." Population 1(3):434.
Wilmoth, J. R. with the assistance of K. Andreev, M. Bubenheim, D. Jdanov, D. Philipov, V. Shkolnikov, and P. Vachon. 2002. "Methods Protocol for the Human Mortality Database.", Retrieved June 10, 2004 (http://www.mortality.org/Public/Docs/MethodsProtocol.pdf).