contents efficiency... · chapter_6_oil_gas_and_energy.pdf #1: measure energy use ... how tnb can...
TRANSCRIPT


CONTENTS
How electricity is delivered Why save electricity
Background on Energy Efficiency Your Energy Status
Saving Opportunities •Commercially •Technically
HOW ELECTRICITY DELIVERED 3
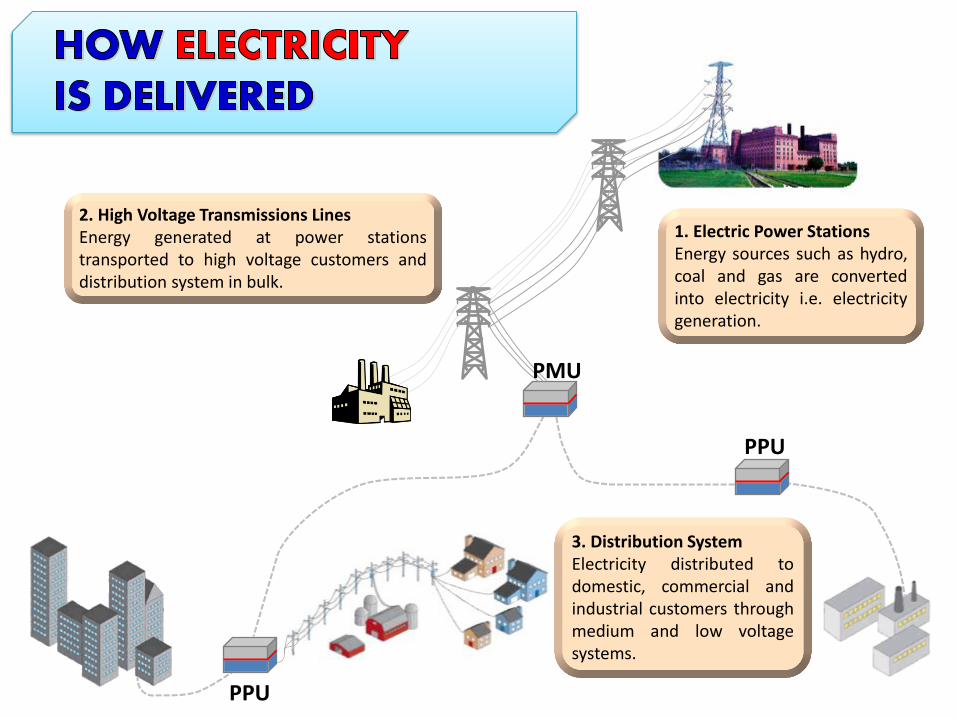
1. Electric Power Stations Energy sources such as hydro, coal and gas are converted into electricity i.e. electricity generation.
2. High Voltage Transmissions Lines Energy generated at power stations transported to high voltage customers and distribution system in bulk.
3. Distribution System Electricity distributed to domestic, commercial and industrial customers through medium and low voltage systems.
PMU
PPU
PPU

WHY SAVE ELECTRICITY
5

6

WHY SAVE ELECTRICITY
Energy Scenario
& Environmental
Impact
7

Energy Scenario
8
• Malaysia’s electricity generation is primarily using depleting fossil fuel resources.
Electricity generation by type of energy resources in Semenanjung Malaysia
Electricity Supply in Semenanjung Malaysia
• Malaysia’s energy supply increased significantly over last 20 years.
Source: Brief Outlook On Malaysian Electricity Supply Industry,
http://www.csee.net.cn/data/zt_aorc_cigre2013/ppt/ps4.pdf
Source: Malaysia Energy Information Hub - http://meih.st.gov.my/

The problems with fossil fuels
Limited supply
Environmental Impact
9

Limited Supply of Fossil Fuel
Source: Petronas
• Total accumulated sources are reduced although oil exploration activities have been increased.
• More oil exploration but less quantity of oil & gas extracted from each well.
• Fossil fuel sources is depleting and we have passed the peak oil era.
• Cost of extraction of resources from the earth is higher than previously.
Source: energywatchgroup.org

Energy Consumption
CO2 Emissions
Green House Effect
Global Warming
Impact of fossil fuel in electricity
generation on the environment
11
Malaysia’s electricity generation is
heavily dependent on depleting fossil
fuel which emits CO2 that contributes to
global warming due to green house
effect.
Improving energy efficiency is the key factor in controlling/reducing Green House Effect and sustaining the depleting energy resources for our future generation.

WHY SAVE ELECTRICITY
National Policy
& Law-Related
12

Malaysia’s Commitment During COP 15
• A reduction of 40% in carbon emission will have to be
achieved through:
• Energy Efficiency
• Energy Conservation
• Renewable Energy 13
“I would also like to announce here in
Copenhagen that Malaysia is adopting an
indicator of a voluntary reduction of up to
40% in terms of emissions intensity of
GDP by the year 2020 compared to 2005
levels. This indicates conditional on
receiving the transfer of technology and
finance of adequate and corresponds to
what is required in order to achieve this
indicator”
Prime Minister

Efficient Management Of Electrical
Energy Regulations 2008
• A regulation under Electricity Supply Act (1990) effective 15 December 2008.
• Any installation which receive electrical energy from a licensee or supply authority with a total electrical energy consumption equal to / or exceeding 3,000,000 kWh as measured at one metering point or more over any period not exceeding 6 consecutive months.
– To implement Electrical Energy Management & appoint Registered Electrical Energy Manager (paragraph 6)

WHY SAVE ELECTRICITY
Economy
15

Economic Benefits
16
REDUCE ENERGY BILL
REDUCE OPERATIONAL COST
INCREASE PROFIT
By implementing energy efficiency, your energy consumption can be reduced. Thus the following benefits can be achieved:
GOVERNMENT INCENTIVES (e.g. MIDA)

ELECTRICAL ENERGY STATUS

MONITOR YOUR BILL
Bill nr XXX69641 Read Date 01/03/2014 RM Payable 124,894.50
KWH 247,975
KW 727
KVARh 88,358
Power factor
0.94

Sample Energy Trend
0.00
0.05
0.10
0.15
0.20
0.25
0.30
Mill
ion
s (k
Wh
)
Total Energy Consumption
0.00
50.00
100.00
150.00
200.00
250.00
Tho
usa
nd
s (R
M)
RM Payable (Monthly Electricity Bill)
0.89
0.90
0.91
0.92
0.93
0.94
0.95
0.96
0.97
01
.04
.20
12
01
.05
.20
12
01
.06
.20
12
01
.07
.20
12
01
.08
.20
12
01
.09
.20
12
01
.10
.20
12
01
.11
.20
12
01
.12
.20
12
01
.01
.20
13
01
.02
.20
13
01
.03
.20
13
01
.04
.20
13
01
.05
.20
13
01
.06
.20
13
01
.07
.20
13
01
.08
.20
13
01
.09
.20
13
01
.10
.20
13
01
.11
.20
13
01
.12
.20
13
01
.01
.20
14
01
.02
.20
14
01
.03
.20
14
Power Factor
0
100
200
300
400
500
600
700
800
01
.04
.20
12
01
.05
.20
12
01
.06
.20
12
01
.07
.20
12
01
.08
.20
12
01
.09
.20
12
01
.10
.20
12
01
.11
.20
12
01
.12
.20
12
01
.01
.20
13
01
.02
.20
13
01
.03
.20
13
01
.04
.20
13
01
.05
.20
13
01
.06
.20
13
01
.07
.20
13
01
.08
.20
13
01
.09
.20
13
01
.10
.20
13
01
.11
.20
13
01
.12
.20
13
01
.01
.20
14
01
.02
.20
14
01
.03
.20
14
kW
MD
*Spikes >200k - tunggakkan

BACKGROUND ON ENERGY EFFICIENCY
20

Energy Saving Approach
21
ENERGY EFFICIENCY
ENERGY CONSERVATION
COST
RENEWABLE ENERGY
ENERGY EFFICIENCY
ENERGY CONSERVATION

• Behaviour and life style change.
• Rational use of energy.
Examples:
22

• Reduction in the energy used for a given service (cooling, lighting, etc.)
• Usually associated with technological changes i.e. equipment or processes.
Examples
23

How Energy Used
24
Energy
NEEDS
WASTE OR
UNNECESSARY
TECHNICAL
LOSSESS
Energy savings can be achieved by reviewing and optimizing NEEDS and reducing WASTE & LOSSESS

ENERGY SAVING OPPORTUNITIES

ENERGY SAVING OPPORTUNITIES
Commercial
Aspect
26

Tariff Switching
• Switch to lower tariff.
– e.g. From C1 to C2

Maximum Demand Management
• Reschedule energy intensive & non-critical activities from peak to off-peak period to reduce maximum demand charges
– E.g. use thermal storage system : Operate the A/C chillers during Off-Peak period to produce CHW in storage and use / discharge it during the Peak period.
❶
❷
❸
Service: Energy consumption monitoring

Power Factor Correction
• Eliminate Power factor penalty – penalties on
customers with low PF
• Below 0.85 (LV & MV)
• Below 0.9 (HV)
29
Active Power (kW): Produces useful works
Reactive Power (kVAR): Sets up magnetic fields

0.75
0.80
0.85
0.90
0.95
1.00
po
wr
fact
or
Power Factor
30
PF PF Charge
Petaling Jaya 0.75 817.78

How TNB can help you be more energy efficient
• Through our subsidiary company, TNBES, we can offer a wide range of energy efficiency related services.
Front view Power Factor
Correction Module Sample
Power Factor Correction
• Capacity : 20kVAR – 45kVAR • Cost estimation : RM3,400 – RM4,100 • Payback period : < 12 months • Warranty : 1 year

ENERGY SAVING OPPORTUNITIES
Technical
Aspect
32

Source: http://etp.pemandu.gov.my/upload/etp_handbook_
chapter_6_oil_gas_and_energy.pdf
#1: Measure energy use
• Can be determined through thorough energy audit.
• Energy audit results enable customers to determine suitable energy saving strategy and action plan.
Service: Energy Audit

How Your Equipment Affect Your Energy
Bill Components
Energy Consumption = kWh
Maximum Demand (MD) = kW
kW h
kW (kilowatt) Size & number of
equipment installed
• Larger equipment capacity & number of equipment = more
energy consumed.
• More equipment operate at the same time =, higher MD.
h (hour) Duration of operation
Longer operation time (switched
on) = more energy consumed.
*Number of equipment and their capacity will be measured / calculated in energy audit.

e.g. Motors loading are too low, improve cooling system efficiency by reducing the number of chilled water
pumps.
Outcome of Energy Audit
e.g. Potential area for de-lamping due to over lit.
Energy Audit enable customers to identify which area is using energy
more than necessary.
In energy audit, efficiency of equipment and systems are assessed
kWh
Energy
NEEDS
WASTE
TECHNICAL
LOSSES

How TNB can help you be more energy efficient
• Through our subsidiary company, TNBES, we can offer a wide range of energy efficiency related services.
Walk Through Energy Audit
Comprehensive Energy Audit
Advisory Services
Consultancy
Century Square 1 & 2,
Enterprise Building
(EB) 1, 2 & 3,
Ericsson, Cyberjaya
TNB Head Quarters
Bangsar,
Kuala Lumpur
Wisma SESB, KK Wisma SEDCO,
KK
Hotel Best
Western,
KK
MOE – SM Teknik
Kajang
UNITEN,
Putrajaya
Campus
TNBES Track Record (Energy Audit)
KLCC
Urusharta
Sdn Bhd
Plaza Angsana,
Johor Bahru
Wisma Daiman,
Johor Bahru

How TNB can help you be more energy efficient
• Through our subsidiary company, TNBES, we can offer a wide range of energy efficiency related services.
Renewable Energy Systems ACMV, Pump System
Optimization, Lighting System, Energy Monitoring System
Energy Performance Contract (EPC)
EE Project Implementation
TNBES Track Record
Solar Hybrid
RPS Kemar, Gerik
Solar Hybrid
Johor
Solar PV @ Car Park,
TNB Head Quarters
Bangsar, Kuala Lumpur

#2: Consider Total Life Cycle
Procurement
Installation
Operation
Maintenance
To get the best energy saving results, energy efficiency & energy conservation should be observed throughout the
equipment lifecycle:

#2: Equipment Lifecycle
39
Procurement

Energy Efficient Equipments
40
• Energy efficiency label was introduced in 2006.
• Under purview of Energy Commission (ST)
• In collaboration with SIRIM.

#2: Equipment Lifecycle
41
Operation

Alternatives
• Use alternative option whenever possible.
– E.g. Day light.
42

Conserve Energy
• Reduce consumption wherever or whenever possible.
• Reduction in duration of using of electrical equipment: – Labelling: “Please switch
off the lights” – Turn off lights and air-
conditioning in the rooms not in use.
– Install timer – Install sensor at less traffic
area
43
Light with motion sensor
Switch Timer

Standby Mode = Vampire Power
• Do not leave equipment on standby mode unless necessary.
• Turn off the switch or unplug appliances.
Yearly cost (Tariff = C1):
• (1W/1000W) × 24hours × 365days × RM0.312 = RM 2.73
• 10W = RM 27.33 • 50W = RM 136.66 • 100W = RM 273.31 • 1,000W = RM 2,733.12
2.2 W 22- 80 W Sleep Mode CPU: 10 W
CRT Monitor: 10W LCD: 2-4W
Sleep Mode 40-300W

#2: Equipment Lifecycle
45
Maintenance

Maintenance
• Proper maintenance is vital in ensuring equipment’s efficiency and prolonging their life.
– Clean dusts on lamps.
– Dusts on lamps and reflectors reduce brightness and its efficiency.
46

#3: Improve Existing Processes
47
Recover heat from cooling system for hot water.
Use chilled water tank. e.g. used at Greentech Malaysia
Building Management System.

#4: Protecting from The
Elements
48 Stop air infiltration to maintain room temperature.
Improve insulation to reduce indirect solar heat gain.
Control heat gain from the sun to reduce energy
for cooling.
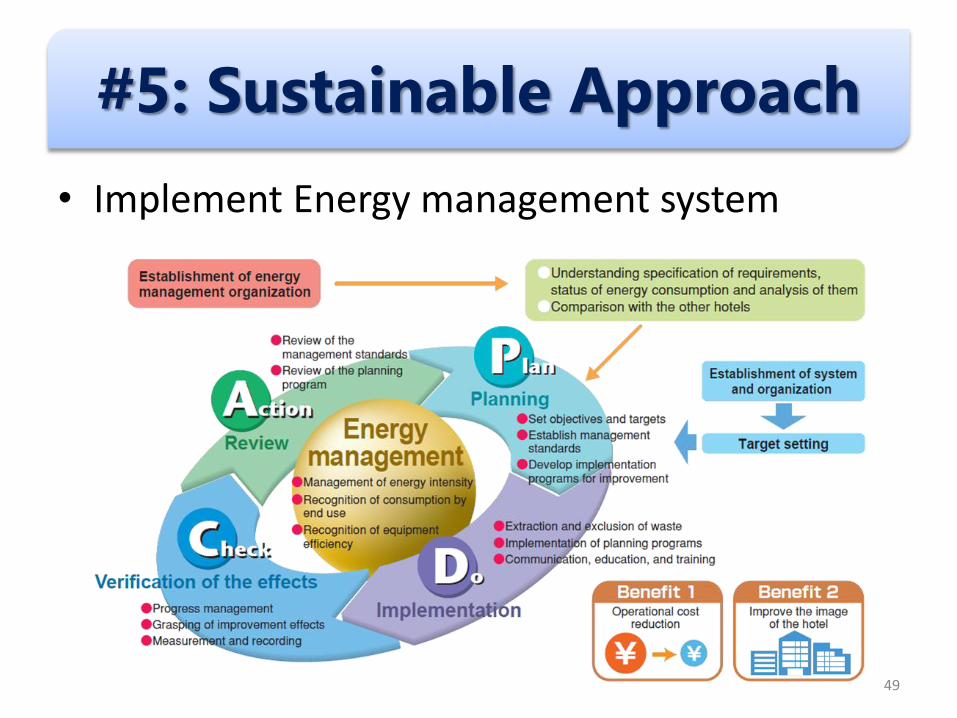
#5: Sustainable Approach
• Implement Energy management system
49

Energy cost cycle of the energy conservation programme without sustainable energy management system
Energy cost cycle of the energy conservation programme with sustainable energy management system
50

51
Evaluation of Energy Management Status
Organisation Preparation
Implementation of Energy Conservation Measures
System Integration
Energy Management Matrix
Energy Policy Energy Committee Set up EM Component Awareness Training
Detailed Energy Audit Select Energy Target & Plan Set up Sustainable Improvement Team Technical Training
Accreditation Scheme Integrate to ISO1400/Total Productivity Maintenance Procedural Training
ACTIVITIES/OUTCOME STAGES

SOLUTION PROVIDER
TNB Energy Services

Solution Provider
• Energy Services Company
– Audit, Advisory, Project Implementation
– TNB Energy Services Sdn Bhd
– Visit http://www.tnbes.com.my
53
