efficiency-morality trade-offs in repugnant transactions ...ftp.iza.org/dp10187.pdf · iza...
TRANSCRIPT

Forschungsinstitut zur Zukunft der ArbeitInstitute for the Study of Labor
DI
SC
US
SI
ON
P
AP
ER
S
ER
IE
S
Efficiency-Morality Trade-Offs in RepugnantTransactions: A Choice Experiment
IZA DP No. 10187
September 2016
Julio EliasNicola LaceteraMario Macis

Efficiency-Morality Trade-Offs in Repugnant Transactions:
A Choice Experiment
Julio Elias Universidad del CEMA
Nicola Lacetera
University of Toronto
Mario Macis
Johns Hopkins University and IZA
Discussion Paper No. 10187 September 2016
IZA
P.O. Box 7240 53072 Bonn
Germany
Phone: +49-228-3894-0 Fax: +49-228-3894-180
E-mail: [email protected]
Any opinions expressed here are those of the author(s) and not those of IZA. Research published in this series may include views on policy, but the institute itself takes no institutional policy positions. The IZA research network is committed to the IZA Guiding Principles of Research Integrity. The Institute for the Study of Labor (IZA) in Bonn is a local and virtual international research center and a place of communication between science, politics and business. IZA is an independent nonprofit organization supported by Deutsche Post Foundation. The center is associated with the University of Bonn and offers a stimulating research environment through its international network, workshops and conferences, data service, project support, research visits and doctoral program. IZA engages in (i) original and internationally competitive research in all fields of labor economics, (ii) development of policy concepts, and (iii) dissemination of research results and concepts to the interested public. IZA Discussion Papers often represent preliminary work and are circulated to encourage discussion. Citation of such a paper should account for its provisional character. A revised version may be available directly from the author.

IZA Discussion Paper No. 10187 September 2016
ABSTRACT
Efficiency-Morality Trade-Offs in Repugnant Transactions: A Choice Experiment*
Societies prohibit many transactions considered morally repugnant, although potentially efficiency-enhancing. We conducted an online choice experiment to characterize preferences for the morality and efficiency of payments to kidney donors. Preferences were heterogeneous, ranging from deontological to strongly consequentialist; the median respondent would support payments by a public agency if they increased the annual kidney supply by six percentage points, and private transactions for a thirty percentage-point increase. Fairness concerns drive this difference. Our findings suggest that cost-benefit considerations affect the acceptance of morally controversial transactions, and imply that trial studies of the effects of payments would inform the public debate. JEL Classification: C91, D01, D63, D64, I11 Keywords: repugnant transactions, efficiency, morality, markets, preferences Corresponding author: Mario Macis Johns Hopkins University Carey Business School 100 International Dr. Baltimore, MD 21202 USA E-mail: [email protected]
* We benefited from conversations with Sandro Ambuehl, Leo Burstzyn, Jon de Quidt, Liran Einav, Christine Exley, Ori Heffetz Alessandro Iaria, Jeffrey Kahn, Judd Kessler, Matt Mitchell, Matt Osborne, Gerard Padro i Miquel, Jim Rebitzer, Al Roth, Heather Royer and Justin Sydnor; and from the comments of the attendants of presentations at Duke University, Harvard Business School, LMU and Center for Economic Studies in Munich, McMaster University, University of Bologna, University of Bonn, University of Bristol, University of Toronto, the 2016 SITE Experimental Economics Workshop, the Workshop on Natural Experiments and Controlled Field Trials in Munich, the American Society of Health Economists’ meetings in Philadelphia, the Southern Economic Association meetings in New Orleans, and the Conference on The Ethics of Bodily Commodification at The College of New Jersey. We received ethics approval from the Research Ethics Board at the University of Toronto (protocol 30238) and the Homewood Institutional Review Board at Johns Hopkins University (protocol 00001991); the registration number at the American Economic Association’s Registry for Randomized Controlled Trials is AEARCTR-00007. We gratefully acknowledge the financial support of the Johns Hopkins University Catalyst Award, a sub-grant from the research program “The Economics of Knowledge Contribution and Distribution” (funded by the Sloan Foundation), and a Research and Scholarly Fund grant from the University of Toronto Mississauga. Nicola Lacetera is thankful to the Center for Economic Studies in Munich for the hospitality during the development of part of this study.
2
1. Introduction
A variety of factors affect individual and social choices beyond standard economic determinants.
Scholars have studied how, for example, fairness concerns, identity, religious beliefs, political
ideology, dignity, and social status influence utility and decisions (Akerlof and Kranton 2000;
Bénabou and Tirole [2009, 2011]; Bénabou, Ticchi and Vindigni 2015; Benjamin, Heffetz,
Kimball and Rees-Jones 2012; Benjamin, Choi and Fisher 2016; Bursztyn, Callen, Ferman,
Gulzar, Hasanain and Yuchtman 2015; Kuziemko, Norton, Saez and Stantcheva 2015).
Understanding the influence of these factors is challenging, particularly because in several cases
not all of the relevant options can be observed. In addition to building theoretical models and
relying on observational data, researchers have also used laboratory experiments or surveys
based on vignettes and hypothetical choices, offering influential insights as well as implications
for public policy in many contexts (e.g., taxation, labor relations, and so on).
In this paper we study the role of moral repugnance in influencing individual preferences for
allowing certain transactions to occur in a society. Roth (2007) defines repugnance for a
transaction as the aversion toward other individuals engaging in it, even if the parties directly
involved benefit from that trade. Societies limit or prohibit many transactions because of moral
considerations, with differences across places and times. For example, prostitution is illegal in
the United States but not in Germany, whereas Germany bans commercial surrogacy and the
U.S. allows it; indentured servitude contracts were once permitted, but they are now universally
prohibited; conversely, life insurance contracts were considered immoral in the past. Studying
why uninterested third parties accept or condemn certain transactions is important to understand
why certain markets are not allowed to exist, an issue of interest to economists. However, until
recently the discussion on the constraints to market transactions due to moral considerations
occurred mostly in disciplines other than economics.
We study preferences for the ethics and efficiency of morally controversial transactions,
focusing on one specific case: the provision of payments to kidney donors. Although some
incentives, such as allocation priority and kidney exchanges, are allowed in certain countries
(Kessler and Roth 2012; Roth et al. 2004; Roth 2007; Stoler, Kessler et al. 2016), direct
monetary compensation is generally opposed on ethical grounds, and the practice is illegal

3
everywhere.‡ Moral concerns include the potential exploitation of vulnerable participants (for
example if payments were particularly attractive to poor individuals), the possible harm resulting
from coercion or undue influence, and the possibility of an unfair allocation of organs for
transplantation, with only the rich being able to afford transplants.§ Additional sources of
aversion are the idea that placing a monetary value on human organs violates human dignity
(Council of Europe 2015; WHO 2004), and the concern that payments would corrupt sacred or
protected values (Delmonico et al. 2002; Grant 2011; Sandel 2012).
Prohibiting a transaction can bear costs, and in the context of organ donations, these costs are
large.** Each year in the U.S., approximately 35,000 new patients require a kidney transplant, but
only about 17,000 obtain one (Held et al. 2016). This shortage has led to a long and growing
waiting list, currently including about 100,000 patients; the average wait time for a transplant has
also increased and it is currently over 4.5 years, with thousands of Americans dying while
waiting for a transplant. Recent estimates indicate that each additional transplant leads to about
$200,000 in direct savings; the social benefits rise to $1.1 million per kidney recipient if we add
the value of the increased life expectancy and quality. The total cost of the kidney shortage in the
U.S. is estimated to be about $20 billion annually.††
Scholars and practitioners have discussed the introduction of monetary incentives to donors;
Becker and Elías (2007), for example, estimate that payments between $15,000 and $30,000
would eliminate the waiting list in a few years.‡‡ The wording that the most outspoken opponents
of compensation employ, however, is telling; Delmonico et al. (2002) state that payments are
“ethically unacceptable […] despite the purported benefits of such a sale for both the buyer and
‡ Remuneration is prohibited in all countries except in the Islamic Republic of Iran. In the U.S., the key legislative reference is the 1984 National Organ Transplant Act (NOTA). § In addition to a mostly theoretical literature in philosophy and bioethics, Ambuehl (2016) and Ambuehl, Niederle and Roth (2015) provide the first experimental evidence of the role of undue influence that remuneration may have. ** Although our focus is on ethically sanctioned transactions that are potentially efficiency-enhancing, the relationship between morality and efficiency is often ambiguous (Shleifer 2004). †† The direct savings come mostly from stopping dialysis. See Held et al. (2016) for details on the calculations. ‡‡ Leider and Roth (2010) and Niederle and Roth (2014) performed surveys to gauge opinions about the introduction of different incentives for donors, including cash payments and “hero” medals. Both the New York Times and the Washington Post hosted debates about the introduction of remuneration for organ donors in 2014 and 2015, respectively (http://www.nytimes.com/roomfordebate/2014/08/21/how-much-for-a-kidney; https://www.washingtonpost.com/news/in-theory/wp/2015/12/28/compensation-for-organ-donors-a-primer/). The American Medical Association has passed some resolutions over time that express favor toward testing the effects of remunerating organ donors (https://profiles.nlm.nih.gov/ps/access/NNBCYP.pdf; http://www.thecentralline.com/?p=3201).

4
the seller. […] Fundamental truths of our society, life and liberty, should not have monetary
price” (italics added). This is essentially the definition of a morally repugnant transaction.
If indeed the population shared this repugnance, and considered it a sacred value, i.e. a
position that cannot be traded for other considerations, then the prohibition and the ensuing costs
would be justified. Cultural beliefs are important factors in the cohesion of a society and, as
such, can themselves enhance welfare; the respect of deeply held principles, in particular, may
trump considerations about the potential efficiency gains from a payment system. Calls for social
scientists to consider ethical forces as guiding decisions have a long history (Marshall 1890; Sen
1999), but empirical studies are scarce. Exceptions include Falk and Szech (2013) on whether
market interactions erode values such as the respect for the life of certain animals, and Gibson,
Tanner and Wagner (2013) on how hypothetical monetary returns from lying affect preferences
for truthfulness (see also Gneezy 2005).§§ Shleifer (2004) discusses the effect of market forces
on the diffusion of certain morally censurable behaviors. Evidence of whether and how
individuals perceive trade-offs between ethical beliefs and cost-benefit considerations in the
context of repugnant transactions is, however, virtually non-existent.
In this study we characterize preferences for the morality and efficiency of payments to
kidney donors, and address the following questions: Are there finite increases in the supply of
kidneys for transplants generated by payments that would lead individuals to express a
preference for a paid-donor system versus an unpaid-donor alternative, even if payments were
considered morally problematic? Are attitudes toward different procurement systems, and
payments in particular, deontological or consequentialist?*** In other words, is there an
“efficiency price” for moral repugnance? Understanding the nature of the trade-offs that people
perceive between their moral beliefs and economic efficiency provides insights as to the range of
acceptable policies to reduce the organ shortage, given their expected efficiency gains. Our
approach also gives a basis to address the same questions with regards to other repugnant
transactions, and is informative of whether the acceptability of these transactions depends on the
magnitude of the efficiency gains that would accrue to society, thus offering insights about why
attitudes change over time.
§§ Studies at the intersection of law, philosophy and psychology adopted experimental methods to study moral dilemmas; see for example Foot (1967) and Thomson (1985), and Knobe et al. (2012) for a review. *** For analyses of deontological versus consequentialist orientations, see, among many others, Tanner, Medin and Iliev (2008) and Tetlock et al. (2000).

5
Section 2 introduces a simple framework to guide our empirical analysis. We assume that
individual utility from allowing a given transaction in a society is determined both by the
efficiency (societal gains) of that transaction, and by how ethically repugnant a person considers
that transaction. We make predictions on the shape of the utility function with respect to the
moral repugnance and the efficiency of a transaction, according to whether an individual
perceives finite trade-offs between these two features or does not accept trade-offs (i.e., she
considers her repugnance to be a sacred value).
In Section 3 we describe our research design. We elaborated a randomized survey experiment
based on hypothetical scenarios. We recruited 2,918 U.S. residents through Amazon Mechanical
Turk (mTurk hereafter). After providing an overview of the state of organ procurement and
allocation in the United States, we asked the participants to consider three alternative
procurement systems to increase living undirected kidney donations: a system based on unpaid
donors with allocation based on priority rules determined by the patients’ medical situation, age,
time on the waiting list, etc. (the current system); a system where donors would receive $20,000
from a public agency, with allocation based on the same priority algorithm; and a system of
individual, private transactions, where again donors would receive $20,000 and the organ
recipient would pay (out of pocket or through privately purchased insurance, for example). The
variation between systems thus concerned the presence of payments, the allocation mechanism,
and the identity of the payer. After receiving this information, respondents expressed their
opinion, through a rating system, about features of these three systems related to their morality
(how coercive, exploitative, unfair to the patients, unfair to the donors, and against human
dignity they thought each system was, and an overall assessment of how much a system was in
contrast with the respondent’s values). These ratings defined our main measures of “moral
repugnance” of an individual toward a certain organ procurement and allocation system.
Respondents were then asked to assume that each system would result in a given outcome, and
they were asked to choose their preferred system. For a random half of participants, the outcome
was expressed as the number of kidneys for transplantation procured annually (and the
corresponding share of annual demand for kidneys); for the remaining half we also included the
estimated net monetary savings for taxpayers that would result under each system because of
avoided dialysis and other medical costs. In the paper, we use the term “efficiency” to indicate
these outcomes. The efficiency levels were randomly determined, and each participant was

6
presented with three choice opportunities, in a sequential manner. The random assignment and
the experimental design thus created variation in the systems’ efficiency between and within
individuals. We then used the collected data to estimate preferences for efficiency and
repugnance of a transaction with discrete choice models. In Section 3 we also describe a set of
pre-tests that informed our research design, and discuss some challenges of our methodological
approach and how we addressed them – in particular, the hypothetical nature of the survey, the
fact that a key choice factor (the degree of moral repugnance) was self-assessed by the
participants, the possibility that the expected efficiency of a system might affect its perceived
morality, the reliance on mTurk respondents, and the stability of the respondents’ preferences.
Section 4 is dedicated to the description of the data that we collected, and to their analysis.
We found that both efficiency and moral considerations affected choices, and the respondents on
average perceived a trade-off between the two. Estimates from discrete-choice models show that
the median respondent would favor payments to organ donors made by a public agency if it
increased the annual supply of kidneys by about 6 percentage points; this corresponds to about
2,000 additional kidneys, which would reduce the shortage by around 11 percent and would
result in $250 million saved annually by taxpayers. However, to accept a system based on private
transactions, the median respondent would require about a 30 percentage point increase in
supply, corresponding to 10,000 extra kidneys procured (which would reduce the shortage by
more than 50 percent), and $1.26 billion savings for taxpayers. This difference in the estimated
tradeoffs appears to derive from the fact that the public agency paid-donor system was
considered less repugnant than the private transactions system along all of the morality features
that we included. In particular, participants rated the public agency system as being equally “fair
to the patients” as the unpaid donor system (these two systems allocated organs to patients based
on the same priority rules), whereas private transactions (in which the allocation is purely
market-based) were considered highly unfair.
There was, however, heterogeneity in the population, ranging from respondents with
deontological preferences who were not willing to allow payments, irrespective of the expected
number of lives saved, to consequentialist individuals who placed a large weight on efficiency
over moral concerns. This heterogeneity did not generally relate to the respondents’ socio-
demographic characteristics, but was correlated to broader attitudes as measured by a set of
moral dilemmas typically used in psychology, thus providing further evidence that ethical views

7
in these choices are central. In Section 4 we also report additional analyses to probe the
robustness of our findings. In particular, we obtained similar results when we replaced the
systems’ subjectively-assessed moral repugnance with the averages in the sample, and when we
repeated the experiment in a follow-up study conducted three weeks after the original study.
In Section 5 we summarize our main findings and advance scholarly and policy implications;
in particular, we stress how our work connects the discussions in economics and ethics, thereby
furthering our understanding of why societies keep certain activities and transactions out of the
marketplace. We also note that because individual preferences appear to depend on expected
efficiency in addition to ethical considerations, pilot trials testing the outcomes of different
arrangements may enhance the ability of a population to determine the preferred organ
procurement and allocation system.
2. Motivating framework
A decision maker expresses a preference for how a particular transaction should be arranged. To
stay close to our empirical setting, assume that the transaction is the procurement of kidneys for
transplants. For simplicity, assume that the individual considers only two system features: how
many kidneys the system is expected to procure (efficiency), and how (un)ethical the individual
considers the transaction. Figure 1 presents three possible options in the (repugnance (R),
efficiency (E)) space, assuming that both features can be measured and ranked. Option A is
expected to deliver a small number of kidneys (low “efficiency”), but is very low on the
repugnance scale. Option B is both more efficient and more repugnant to the individual than A,
and option C is even more efficient and more repugnant. The preferences can be expressed by
the utility function U(E,R) (supposing that all other factors affecting utility are fixed). We
assume that efficiency enters as a good in the utility function, whereas repugnance is a bad; thus
if the systems were equally repugnant to the individual, she would prefer the most efficient one,
and if the systems had the same level of efficiency, then she would prefer the transaction to be
organized according to the least repugnant system. A may represent a system based on unpaid
donors, whereas B and C may contemplate payments, for compensation will increase supply but
also be considered less morally acceptable, and different forms of payments and procurement
have different efficiency and moral repugnance. The indifference curves have slopes

8
/
/ at any (E,R) combination. This is the marginal rate of substitution between efficiency
and repugnance of a transaction.
An individual with utility represented by the indifference curve a in Figure 1 prefers system
A to the others (because R is a bad, higher utility is obtained as indifference curves move toward
the top-left of the graph). In this case the decision maker has a strong preference for ethical over
more efficient options -- her marginal rate of substitution is high. An individual who opts for B
considers that option to be more repugnant than A, but she places more value on the efficiency
gains -- in other words, she requires smaller efficiency gains to prefer an option that she
considers less ethical. A person who opts for C has a very low marginal rate of substitution, or is
much more sensitive to efficiency than to repugnance.†††
The objective of our empirical analysis is to determine what types of preferences individuals
have for efficiency and morality when considering procurement systems for kidneys, and to
explore heterogeneity in these preferences.
3. Research design
3.1 Survey and randomization
We elaborated and conducted an online randomized survey with 2,918 respondents, all U.S.
residents, whom we recruited on mTurk. The objective of the survey and its randomizations was
to estimate the role of efficiency and morality considerations in a choice setting concerning
ethically controversial transactions.
Figure 2 offers a graphical representation of the flow of the experiment. After the usual
informed consent process, participants were directed to a survey website that we set up using
Qualtrics.‡‡‡ The first screen provided information on the current state of kidney procurement in
the United States, such as the size of the kidney shortage and the various types of kidney
donations (deceased and living donors, directed and undirected donors). This ensured that all
participants had the same initial information about the topic. We also informed participants that
††† It is possible than one’s ethical considerations about a transaction may also be directly affected by the efficiency of that transactions -- in our framework, R=R(E). This would create additional challenges in identifying preferences. As described in more detail in the next section, this does not seem to be the case in our setting, i.e. people’s repugnance ratings were not affected by the efficiency of the system that they were evaluating. ‡‡‡ A detailed description of the survey, as well as reproductions of survey materials (e.g. texts and snapshots from Qualtrics) are in the Appendix (Section A).

9
the survey focused on alternative organ procurement and allocation systems concerning live,
undirected kidney donations.
The second screen reported a description of three different systems of procurement and
allocation of kidneys from live donors:
In System A, donors did not receive any payment; the kidneys donated to anonymous
candidates on the waiting list would be allocated by a public agency according to priority
rules based on patients’ medical urgency, blood and tissue match with the donor, time on the
waiting list, age and distance to the donor.§§§
In System B, kidney donors would receive $20,000 from a public agency, and the agency
would allocate the kidneys according to the same priority rules as in system A.
In System C donors would receive $20,000 directly from the recipient (e.g., out of pocket or
through privately purchased health insurance), a public agency would keep a registry of
patients in need of a kidney and of potential donors, and transactions would occur directly
between the paying recipient and the donor or through a private agency.
The end of the page summarized the key features of the systems in a table format, and informed
the participants that they would next be asked to answer a few questions about these systems.
Both systems B and C, therefore, contemplate payments; system C represents a more
standard market transaction, whereas in system B payments are from a third party and the
allocation is based on priority rules. We included these two ways of procuring kidneys through
payments to study more precisely the sources of opposition to payments, in particular whether
the aversion is to payments per se, or if it is related to the identity of the payer and the overall
organization of the transaction. Some proponents of compensation, for example, argue that
payments are more ethically acceptable if carried out by a public agency (Satel 2006). However,
in its strong form the opposition to payments appeals to deeper reasons (e.g., violation of human
dignity) that make any form of payments unacceptable, irrespective of regulation and public
intervention (Delmonico et al. 2002; Sandel 2012).****
§§§In all systems, donors could also decide to donate to specific recipients; however we asked respondents to focus on undirected donations. **** A few commentators suggested that other forms of payments, in particular less liquid and delayed in time such as a contribution to a college or retirement funds, might be more viable because less repugnant. In one of the pre-tests that we performed, we found that the repugnance ratings do not change if the payment is different from direct cash. The identity of the payer (public agency versus patient through a private transaction) remains the strongest predictor of repugnance ratings. Systems with non-cash payments (such as a priority in the waitlist, symbolic

10
The third phase of the survey was designed to gauge the degree of moral repugnance that
participants felt toward each of the systems. We followed the literature in philosophy and
bioethics that focuses on five key ethical concerns particularly related to the remuneration of
organ donors and which, to date, have been key arguments for excluding any form of “valuable
consideration” for donors.†††† For each system, we asked the respondents to rate, on a scale from
0 to 100, the extent to which they found that system coercive, exploitative, unfair toward donors,
unfair toward patients, and against human dignity. Respondents could choose on a slider any
integer number in this interval; we also provided, above the sliders, verbal expressions to guide
the interpretation of different potential values. We wrote, for example, “no coercion” above the
zero mark, “minor coercion” above the 25 mark, “moderate coercion” over the 50 mark,
“considerable coercion” above the 75 mark, and “max coercion” above the 100 mark. We added
a sixth question that asked whether a given system was against the respondent’s values (with the
same scale as for the other answers) to measure any other moral considerations that the
respondents may have had.
Fourth, we asked the respondents to choose their preferred system. We offered three different
choice sets to each individual, in a sequential manner. For each choice set, we asked the
participants to indicate which system they thought should be implemented. The systems among
which to choose were the same in the three choice sets (systems A, B and C described above).
However, within each of the three choice sets we asked the respondents to assume that each
system j (with j = A, B or C) would procure nj kidneys per year (with nj expressed both in
absolute value and as a percentage of the annual demand); the value of nj was randomly assigned
between systems, participants, and choice sets. For the unpaid donor system (system A), we
assigned either 17,000 or 21,500 kidneys, whereas the nj values of the two paid-donor systems
(systems B and C) were randomly selected between five values: 17,000, 21,500, 26,000, 30,500
and 35,000. We opted for a discrete and relatively small set of supply levels to keep the survey
manageable, and we chose this range of values because the annual demand for kidneys in the US
consists of approximately 35,000 patients (Held et al. 2016), but currently only about 17,000 are
medals, as well as kidney exchanges) received very low repugnant ratings, similar to the unpaid donor regime. Details of this test are in Section C1 of the appendix. †††† See for example Council of Europe (2015), Nuffield Council on Bioethics (1995), Radin (1996), Satz (2008), United States Task Force on Organ Transplantation (1986), and World Health Organization (2004).

11
able to obtain a transplant.‡‡‡‡ Therefore those procurement values represent 49%, 61%, 74%,
87% and 100% of annual demand. We chose a broader range for the payment-based systems
because we were especially interested in testing the trade-offs implied by these systems. Studies
mentioned above predict that payments would increase supply, and we also expected that the
respondents would consider systems that included payments more repugnant.
In addition to the information about the number of kidneys and the corresponding share of
annual demand covered, we also gave a random half of the participants information about the
financial savings for taxpayers that would result from the transplants produced by each of the
systems. To compute the expected net financial savings for taxpayers, we followed Held et al.
(2016). Currently, a kidney transplant generates an average of $191,000 in direct savings
(difference between the cost of dialysis and the cost of the transplant) over the lifetime of a
kidney recipient. Because taxpayers currently bear about 75% of the medical costs associated
with dialysis and transplants, these calculations imply $146,000 net financial savings for
taxpayers for each kidney recipient.§§§§ In the case with compensation for kidney donors from a
public agency, we subtracted the $20,000 from the taxpayers’ savings, because the government
would bear this cost. (In the case of private transactions, taxpayers would save the full
$146,000). We added the financial information to test whether individuals perceived trade-offs
between efficiency and morality differently according to the type of information about efficiency
that was provided. For example, the additional information on monetary savings may increase
the weight people give to efficiency when choosing a system. Conversely, the information about
financial savings (as opposed to only the number of additional transplants that would occur)
might reduce the respondents’ willingness to support transactions that they consider morally
questionable.***** In addition to having the participants select a system as the one they think
should be implemented, we also asked them to express an overall rating of each system (in each
choice set) on a 0-100 scale.
The structure of our experiment thus produced 2x5x5=50 different triplets with efficiency
information expressed in terms of the number of kidneys procured, and an equal number of
‡‡‡‡ According to UNOS, 16,487 kidney transplants were performed in 2012, 16,895 in 2013, 17, 108 in 2014 and 17, 878 in 2015. See also Appendix A2. §§§§ See Appendix A1 for the exact language used in the survey, and Appendix A2 for the details of the calculations. ***** A further treatment would have given only financial information; however, we were concerned that providing only that information without explaining how it was obtained (i.e., without mentioning the effects on the kidney supply), would be perceived as incomplete and hard to understand.

12
different triplets with added information on financial savings for the taxpayers. With three
triplets per subject, each individual had a chance of about 3% to be assigned to one particular
triplet, resulting in about 90 observations (one per individual) on each of the 100 triplets. In
addition to these 100 triplets, we introduced one (assigned with 1/20 probability as the first
choice opportunity) in which we did not report efficiency levels; we did so both to have a
baseline distribution of preferences over systems, and to check whether preferences for a system
were different when individuals did not observe a specific efficiency level.
Having more than one choice set per individual allows for more precise and informative
analyses of any heterogeneity in preferences between subjects; we will explain this further when
we introduce our econometric models.
We then added an attention check, and a question to gauge additional information on the
nature of the respondents’ preferences for the different systems. First, we asked the respondents
to remember their choices of systems. The three non-exclusive options read: “I chose system X in
at least one of the choice opportunities”, with X being each of the three systems considered. The
overwhelming majority (96 percent) of the respondents had consistent recall; also, almost all
respondents (98 percent) chose the option to which they also gave the highest rating, providing
us with further indication that the participants filled the survey with care. Second, we offered
three, non-exclusive (although not all true for a subject) sentences. The sentences read “I would
have never chosen system X, regardless of how many kidneys it would procure”. In addition to
serving as a further consistency check, the answer to this last question is informative of whether
some individuals held “extreme” preferences, i.e. they were not willing to select a given system
even if it had been much more efficient than the other two.†††††
The fifth stage of the survey included socio-demographic questions (gender, age, income,
education, religious beliefs, political orientation on social and economic matters, relationship
status, and if the respondents had children) and questions on whether the respondents made
donations or volunteered in the recent past, had a blood transfusion or knew anyone who did, had
an organ transplant, were waiting for a transplant, or knew anyone in those conditions.
††††† We detected an error in the survey, after 643 participants had completed it, which prevented a response to the question on whether a subject would ever accept some of the systems that we proposed. As a consequence, we did not collect this information for these 643 participants. Each time we refer to analyses that include this variable, we therefore use a smaller sample of about 2,275 respondents. All findings that we obtained from the full sample are nearly identical if we limit the analyses to the smaller sample.

13
We concluded the survey by asking participants to rate their agreement, on a 7-point scale,
with four statements or vignettes reporting ethical questions and dilemmas used in the
psychology literature.‡‡‡‡‡ One vignette described the dilemma of a doctor who has to decide
whether to inject two patients with two drugs, one of which would provide a vaccine against a
spreading deadly disease and the other would be deadly itself, but the two vials cannot be
distinguished; respondents expressed their agreement with the claim that the doctor should inject
the two substances (thus surely killing one of the two patients but allowing to find out which vial
has the vaccine). Three other questions asked for the level of agreement with the claims that:
people should have the freedom of doing things that others consider immoral, provided that no
one is harmed; that some aspects of humanity are sacred and should never be violated no matter
the possible material gains; that allowing people to experience pain and suffering in the name of
maintaining a set of principles is morally unacceptable. The reason for adding this final step was
to assess any correlation between the morality-efficiency trade-offs that respondents would
reveal in the case of kidney procurement systems, and their more general moral beliefs as
assessed by standard questions used in moral psychology.
3.2 A discussion of some methodological choices
Before describing the data and findings, we clarify a few methodological choices that we made.
First, our survey instrument asked for hypothetical rather than actual choices. On the one
hand, this is a limitation because we cannot necessarily conclude that the respondents (or the
population in general) would express the same preferences if these options were actually
available and if the subjects were incentivized. On the other hand, the unavailability of some of
the options considered in this study is the very reason why actual choice experiments cannot be
done. The choice we faced was therefore between not attempting to assess individual preferences
over efficiency and morality of repugnant transactions (or just to rely on the positions of
“experts”), or proceeding with hypothetical scenarios. This challenge is common to other studies,
such as Benjamin, Kimball et al. (2014) on the analysis of subjective well-being and the
relationship between happiness and choice; Kuziemko et al. (2015) on preferences for
redistribution; Andreoni and Sprenger (2012) and Callen et al. (2014) on time and risk
preferences; and Kessler and Roth (2014) on priority rules and organ donor registration.
‡‡‡‡‡ See for example Harrison et al. (2008), Robinson (2012), and Tetlock et al. (2000).

14
Benjamin, Kimball et al. (2014) also note that a hypothetical framework may actually be
preferable to gauge “normative” opinions, because it allays social pressure concerns. The
phrasing of our choice questions also stressed this normative aspect because we asked the
participants to select the system that they thought should be implemented.
Second, although the random assignment of efficiency levels ensures that this feature of each
system as well as the relative efficiency across systems were orthogonal to any observable or
unobservable individual characteristics, repugnance ratings were not randomly assigned but
determined by the respondents. The introduction of self-assessed attributes among the factors
affecting preferences is also a departure from the standard choice models on which we base the
econometric analyses below. Moral considerations of a given procurement system, however, are
inherently subjective and could not reasonably be assigned exogenously to a person. Moreover,
the heterogeneity in individuals’ evaluations of the morality of the various systems, combined
with differences in the efficiency of the systems across choice sets, is an important source of
variation that allows us to estimate the preference parameters of interest. The issue is similar to
Benjamin, Heffetz et al. (2014), where medical doctors self-assessed several features of different
residency options, and these assessments were employed as regressors to establish what factors
related to choice and subjective well-being; and to Fisman et al. (2006), where mate selection
depended also on characteristics evaluated by the decision maker. One concern is that these
ratings are correlated with other relevant variables. In particular, morality concerns may also
depend on the expected efficiency of a system. This would introduce challenges to our
econometric identification. We ran a number of pre-tests to assess if indeed individual
repugnance assessments were affected by the efficiency of a system, and the answer was
negative; although morality concerns differed markedly between systems, within a system the
level of efficiency did not affect morality considerations (details on these tests are in Section C2
of the Appendix). Informed by the results of our pre-tests, we chose to ask the respondents to
rate the morality features of each system before showing the (randomly assigned) efficiency
levels; in addition to addressing some of our concerns about identification, this also simplified
the survey because we did not need to gauge morality ratings three times. The structure of the
survey would therefore provide information on morality considerations and preferred systems
after having expressed the morality considerations and having observed the characteristic of the
options, including their hypothesized efficiency.

15
Third, the self assessment of moral repugnance also introduces a problem of comparability
between individuals. To address this issue, we proceeded in two ways. First, the verbal
expressions above each slider at different focal points, described above, served as a way to
clarify and narrow the range of comprehension of the questions. Our objective was to have the
respondents focus on a specific feature and a common interpretation of the scale. Second, we
checked the robustness of our main results to two alternative operationalizations of the main
regressors. In one case, we standardized the ratings for each system within individuals (by
subtracting the mean and dividing by the standard deviation); we did so to account for individual
differences both in the levels (e.g., ratings of 10, 15 and 20 by one person would be made equal
to ratings of 85, 90 and 95 by another person) and dispersion of the ratings (e.g., ratings of 10, 15
and 20 would translate into different values as ratings of 7, 15 and 23 for the three systems). In
the second test, we substituted the individual repugnance ratings with the sample averages by
system. These average values can arguably be considered exogenous to a given individual; the
main cost of using these averages, however, is the drastic reduction in the variability of this
measure. Overall, the findings from these alternative specifications were similar to those of our
preferred specifications (as described in Section 4 below). Given the similarity of the results, and
considering the extreme reduction in variability especially when using overall means, we chose
to rely on the individual morality assessments in our preferred specifications.
A fourth concern is about the reliability and representativeness of our sample of mTurk
workers. We follow Kuziemko et al. (2015) in the analysis of the costs and benefit of relying on
mTurk participants over other samples, and also note that most of our analysis considers
differences rather than absolute values (e.g. in the preferences for a system), thus allaying
concerns about external validity. The growing reliance on mTurk in several studies in economics
suggests that more researchers recognize, on the balance, that benefits overcome the costs in
several cases. Below and in the Appendix (Section A) we describe our data collection process,
including how we addressed some potential pitfalls of using these online pools (e.g., similar to
Kuziemko et al. (2015), we limited participation to US residents, and to respondents with at least
80 percent past approval rating).
Fifth, to keep the survey manageable, we included only three organ procurement and
allocation systems. A possible concern is that our findings may have been different if we had
considered different versions of the systems. In particular, in our paid-donor systems the

16
payments to the donors were in cash, and one could argue that results may change if we included
non-cash payments and if respondents perceived these different forms of compensation less
morally repugnant. In a test that we conducted prior to the main experiment, we presented
respondents with ten possible organ procurement and allocation systems, including cases where
kidney donors would receive cash and non-cash payments valued at the same dollar amount. The
non-cash payments consisted of contributions to the donor’s retirement account or to a college
fund. As described in detail in Section C1 of the Appendix, the modality of payment did not
affect the morality ratings.
A final issue regards the stability of preferences; because subjects were not incentivized, their
responses might not reflect their actual, “long-term” beliefs. To assess whether the findings
described below were stable, we re-surveyed the subjects three weeks after the main survey. In
section 4.2 below, we show that the results from the follow-up study were similar to those from
the main study. As others have also pointed out (Peer et al. 2014), respondents on mTurk
(particularly those with already high approval rates) care about their reputation on the platform,
and this may explain the high degree of consistency of our participants’ responses.
4. Data and findings
4.1 The data
We imposed restrictions to participation: first, the subjects had to be U.S. residents (Amazon
records the respondents’ home address, and mTurk defines a filter based on that); second, to
exclude robots, we restricted participation to respondents with a past approval rate of at least
80%. Each respondent received $2 for approximately 13 minutes, i.e. a $9.2 hourly wage.
Payment was conditional on completing the survey, and on providing the random number that
the software generated at the end of the survey and that we used to match the survey responses to
the individual respondents on mTurk). We run the survey on Thursday, March 31 and Friday,
April 1 between 10AM and 10PM EST.
About 50% of the 2,918 respondents were men, and the average age was 34 years. 77.5% of
the subjects were non-Hispanic whites, 7.2% black or African American, and 5.7% Hispanics.
About 38% were married, 53% had a college degree, 57% were employed and 6% unemployed,
and 55% reported an annual household income of less than $50,000. Approximately 57%
declared to be religious; 54% stated that they held liberal social views, and 37% held liberal

17
economic views. Table 1 provides a comparison of our sample with an online sample from
RAND’s American Life Panel (ALP), which is more representative of the U.S. population than
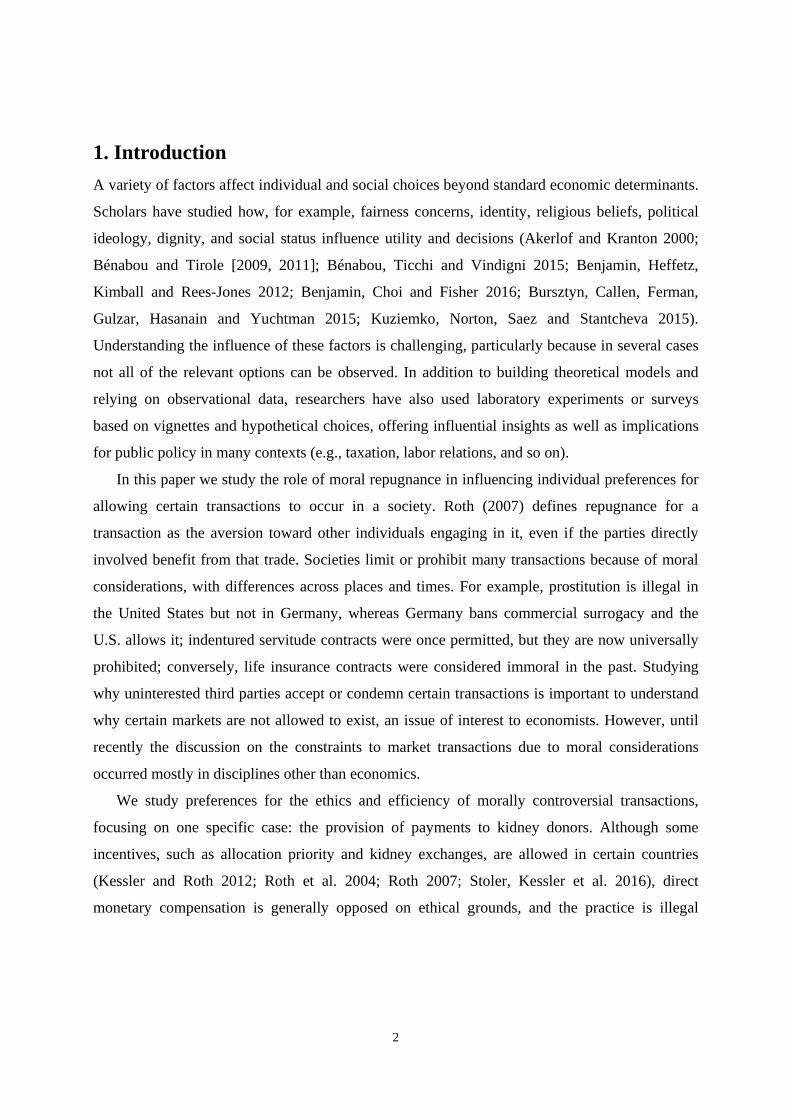
mTurk, but also much more expensive. Figure 3 shows the distribution of a few demographic
characteristics of the respondents. Compared to the ALP, our sample has more males, is younger
and more white, has more unmarried individuals, and has a larger share of college graduates.
In Figure 4 we report the results of randomization checks. For each of the 100 combinations
of our three systems’ efficiency levels (as described above), we show the mean and confidence
intervals for several individual characteristics (sex, age, education, political views, etc.). The
horizontal line in each figure is the mean value for the 101st combination, i.e. the one with
efficiency not reported for one of the three choice opportunities. As the figure shows, the
deviations from the horizontal line are almost never statistically different from zero.
4.2 Descriptive evidence
Repugnance ratings
Figures 5 and 6 show how respondents rated the systems in terms of the six ethics features. The
unpaid donor systems received very low ratings, i.e. individuals, for the most part, did not
express concerns about this system being exploitative, coercive, unfair to donors or patients and,
against human dignity or contrary to the respondents’ values in general. The two paid-donor
systems received, in general, higher repugnance ratings than the unpaid-donor system. However,
there was a large difference according to whether the system contemplated payments by a public
agency or by the recipients in private transactions, with the latter resulting as the most repugnant
system. In our sample, the institutional rules around payments, and not just payments per se, had
a large effect on moral acceptance. As shown in Figure 5, the ranking and relative rating or
repugnance between the three systems was the same for each of the six morality features that we
considered, with the exception of “unfairness to the donor” and “unfairness to the patient”; in the
former case, the public agency payment system had the lowest rate (least unfair to the donor),
and in the latter the unpaid-donor system and the public agency payment system had similarly
low rates (least unfair to the patient).

18
In general, the average across the six features is a reasonably good summary of the
individuals’ moral assessment of the systems; in most of the analyses we use this average.§§§§§ It
has a value of 14.2 for the unpaid donor system, 21.6 for the public agency payment system, and
47.2 for the private payment system. The distribution of these averages, reported in Figure 6,
shows that, although for the unpaid donor system there was agreement among respondents, with
most values being concentrated on the low end of the repugnance scale, there was more variance
in the public agency system, and even more heterogeneity in the morality assessment of the
private payments system.
The strong moral concerns, and high controversy, for the private payments system are
particularly interesting because private transactions are ubiquitous (particularly in the United
States) and arguably do not generate moral objections in most cases. To appreciate the
differences in the perception of a procurement system between a morally controversial and a
more neutral transaction, we compare our findings to those of a separate survey designed along
the lines of our main survey but where we gathered opinions on the morality of different ways to
organize the production and procurement of fresh apples. Details are in the appendix (Section
C4); in brief, respondents considered a system where buying and selling apples is prohibited, and
producers can only donate apples for free, as less desirable and much more repugnant (across all
of the repugnance features that we defined) than systems including payments; a system with a
public agency buying the apples and distributing for free is less repugnant than the “unpaid”
system, but considerably more repugnant that a “standard” market system. One implication of
these findings is that the moral opposition to private market transactions (even with respect to
payments by a public third party) is not general, and most likely confined to morally censured
commodities and services. Second, one cannot explain the findings only in terms of a moral
preference for the status quo; if this was the case, we should not see differences in moral
considerations and overall preferences for the two systems that are not currently in place
(payments for kidneys on the one hand, and an unpaid system or public payment and
procurement for apples), which is not what we observe.
§§§§§ Basic principal component factor analyses of the six features result in one dominating factors summarizing all six, with this factor being highly correlated with the average.

19
Choices and the relative efficiency of the systems
A second relevant descriptive finding is that, although the support for a system increased with
the efficiency of that system, the effect of efficiency was not the same for all systems. In Figure
7 we consider five different cases of the distribution of system choices, as a function of the
information that the subjects had about the efficiency of each system: (1) subjects did not
observe efficiency levels; (2) efficiency levels were the same for the three systems (i.e., all three
systems were expected to yield either all 17,000 kidneys per year, or 21,500); (3) the unpaid
donor system and the system with public agency payments were assumed to produce 17,000
kidneys, whereas the private payment system was set at the maximum, 35,000; (4) the
hypothetical supply level of the unpaid donor system and the system with private payments was
17,000 kidneys, against a supply of 35,000 with the public agency payment ; (5) both systems
including payments were set at 17,000 kidneys and the unpaid donor system at 21,500 kidneys.
Without information on efficiency, about 64% of choices went to systems that included
payments; of these, however, the vast majority (about 90%) were for the system with payments
by a public agency; the shares are very similar for the case where respondents assumed the same
number of kidneys for each system. Because our sample is not fully representative, we need to
take these levels with caution, although the approval rates for payments, especially from a public
agency, are close to what previous studies found (Leider and Roth 2010). We therefore mostly
focus on the changes in approvals.
The preference for a given system increased when that system was assumed to produce more
kidneys: compare, for example, cases 3 and 4 with case 2. Therefore this factor was important
for determining the system that the respondents would like to see implemented. However, these
increases in preferences with efficiency were asymmetric; in particular, the changes in the
approval rates for the two paid-donor systems (and not only the levels) were different when they
were more efficient than the others, with respondents showing a stronger preference for the
public agency pay system than for the private transactions system. In the fifth case shown in
Figure 5, where the unpaid donor system was only marginally more efficient than the systems
that allowed remunerating donors, the preference for the unpaid system increased just as much as
the increase in the public agency pay when it was twice as efficient as the unpaid system.
Figure 8 provides further details on the preference rates for different efficiency levels of the
three systems. Not only was the size of the changes in the preferred options specific to the

20
system, but also the patterns of change were system-specific. The asymmetry in the choice
responses to variations in assumed efficiency indicates that, although increases in the number of
kidneys supplied have a large influence, they are not the only factor affecting choice. The
evidence presented above about the heterogeneous perception of moral features of each system
makes suggest that the moral repugnance of a system influences choices too. Below we show
that this is indeed the case.
The morality-efficiency tradeoff
Figures 9 and 10 provide descriptive evidence of how both repugnance and efficiency
contributed to determining preferences for the various kidney procurement and allocation
systems, how they did so in relatively independent ways, and how respondents perceived a trade-
off between these two features of the systems. For each of the 8,613 choice opportunities where
we reported efficiency levels, we ranked the three options in terms of their efficiency and
repugnance ratings given by the respondents;****** we characterized each option, therefore, by a
pair (r, e), where r indicated low, medium or high repugnance in a given choice set, and e
indicated low, medium or high efficiency. We calculated the times in which an individual faced
an option in a set that was, for example, of medium efficiency and low repugnance, and of all
these instances, the share of times in which a participant chose that particular combination.
Figure 9 shows that the likelihood of choosing a particular combination of repugnance and
efficiency ranks increased in efficiency ranks and decreased in repugnance ranks. Respondents
thus preferred options with higher efficiency and those considered less repugnant, but also
acknowledged, through their choices, a general trade-off between these two aspects. Figure 10
shows how the overall ratings for an option were positively related to efficiency and negatively
related to repugnance in the raw data as well as within a given level of the other relevant feature
(i.e., correlated to repugnance while keeping efficiency constant, and vice versa), and within a
given system (ratings for each of the three systems increased, on average, when the reported
efficiency was higher, and decreased if the repugnance ratings were higher).
****** We assigned ties to the “low” or “high” case according to whether the tied cases were on the lower or higher end. In case of three-way ties, we classified them all as “low”. Excluding the choice opportunities with tied efficiency levels did not alter the findings described here.

21
4.3 Estimating a choice model
Our next step in assessing the role of efficiency and morality concerns in preferences for
controversial transactions is to move from descriptive evidence to estimating the relevance of
these factors and the related trade-offs. Our research design and the structure of the data, with
respondents expressing a choice, with multiple choice opportunities per individual, efficiency
levels assigned randomly, and repugnance ratings that do not depend on efficiency, lend
themselves to performing discrete-choice analyses.
Econometric framework
For our estimates of marginal utilities and rates of substitution we adapt a discrete choice model
to our context. Assume that the utility that an individual i derives from the implementation of a
given system j of procurement and allocation of kidney from transplants depends on the
efficiency of that system, expressed by a variable , and by how morally repugnant the
individual considers that system, expressed by . In what follows we express as a
percentage of demand covered by the assumed supply of kidneys, (values between 49 and 100),
and as the average individual ratings across the six repugnance features (values between 0
and 100). Other factors will of course affect utility; for example, other aspects of a system
differing from its efficiency and repugnance, or individual characteristics of the decision makers.
Formally, and with reference to our case where individuals consider three systems, we express
individual utility as a linear combination of these determinants:
, 1, 2, 3; 1, … . (1)
The parameters and represent the marginal utility to repugnance and efficiency,
respectively. If we reasonably take efficiency to be a “good” and repugnance to be a “bad”, then
we should expect to be non-positive and to be non-negative. An individual for whom only
morality matters for different kidney procurement systems, regardless of their expected
efficiency, will have a value of equal to zero. Her marginal rate of substitution between
repugnance and efficiency, expressed by / , will be infinity. An individual for whom both
efficiency and morality contribute to utility will show finite values for both marginal utilities,
and therefore for their ratio. We would expect that preferences for systems be guided almost
exclusively by repugnance considerations in the former case, whereas, in the latter case,
individual will perceive a tradeoff between efficiency and repugnance, and will be willing to

22
accept, for example, a systems that they find more morally controversial to the extent that it is
expected to produce more kidneys for transplant.
A random-utility model based on Equation (1) allows us to subject our choice data to
structural estimation. We add a random term to the individual utility, and assume that it is
distributed according to a Type I extreme distribution, such as the cumulative distribution
function . A given individual will prefer (and then choose) system 1 over 2 and
3 if and . In our data, if we define an outcome variable Y that takes a value of
1 for the system that an individual chooses, and 0 for the others, we can derive the following
likelihood function that characterizes the conditional logit model (McFadden 1974):
1| ∑ 0 , ; ∑
(2)
∀ 1, … .
Maximum likelihood techniques allow estimating the marginal utilities, and the estimated
marginal rate of substitution would be , . The random assignment of efficiency
levels ensures orthogonality of this variable to unobservables. Because the conditional logit
model implicitly controls for individual unobserved heterogeneity, and under the reasonable
assumption that repugnance ratings may be related to individual features, we can also take the
repugnance measures in the model to be conditionally exogenous.
The conditional logit approach that we just introduced assumes that all individuals have the
same marginal utilities to the factors of interest. The evidence that we reported in the previous
section, however, showed wide heterogeneity in repugnance ratings in the population; there also
was large variance in the responses to the general morality questions that we asked at the end of
the survey; finally, about 36% of the respondents stated that they would never express a
preference for a private payment system, regardless of how many more kidneys it would
produce. Given the overall higher repugnance expressed toward this system, it is likely that these
individuals have more extreme preferences with regards to efficiency and morality of a
transaction. A model that assumes the same structure of preferences for all the individuals may,
in particular, hide extreme preferences and their incidence in a population, and assessing these
extreme preferences is important for our study. Although we maintain a framework with standard

23
preferences and finite tradeoffs, we assess heterogeneity in preferences, including potential
extreme cases, in different ways.
First, we rely on a latent class conditional logit model to infer different groups of respondents
in terms of their preferences for morality and efficiency. Adapting the framework of Bhat (1997)
and Train (2008) to our setting with three choice opportunities ( 1,2,3 , each between three
options ( 1,2,3 , the probability S of a sequence of choices for an individual i is:
∑ ∏ ∏∑
, (3)
where 1,2, … , indicates that the individuals belong to a class or subgroup c out of C
groups, and is an indicator for the choice j made in a given choice opportunity . The
function represents the probability that decision marker i belongs to class c: ∑
, with 0. The log-likelihood function across individuals is therefore Λ ∑ .
To keep the analysis simple while accounting for the presence of relevant subpopulations, we
consider a model with four latent classes. Because we focus on two factors affecting utility and
choice, efficiency and repugnance, individuals may classify as having consideration for both in
their decision, for only (or mostly) one of the two features of a system, or for none.
Second, instead of considering a finite number of classes or a discrete distribution of the
parameters of interest, we estimate conditional logit models where marginal utilities are
distributed according to a continuous distribution F with parameters . The continuous version
of the probability of a choice sequence represented in Equation (3) above is therefore:
∏ ∏∑
| . (4)
The distribution of the marginal utilities (vector ) can be estimated by simulated maximum
likelihood following Hole (2007), Revelt and Train (1998), and Train (2003). In addition to
estimating moments of the distribution of the parameters (such as the mean and standard
deviation), we estimate the expected values of the parameters of interest for each subject, as well
as the distribution of the estimated individual marginal rates of substitution – a random variable
itself. We assume a lognormal distribution for both parameters and for the MRS, because we
expect these to be of a given sign—positive on efficiency, and negative on repugnance, given the
descriptive evidence, and therefore a positive MRS.

24
4.4 Results
Conditional logit
As shown in column 1 of Table 2, the conditional logit model (with standard errors clustered at
the respondent’s level) estimates a marginal utility to efficiency of 0.065 (s.e. = 0.002), and a
marginal utility to repugnance of -.045 (s.e. = 0.001). The implied marginal rate of substitution is
0.7: taken at face value, this means that, on average, respondents were willing to trade one
“repugnance point” for an increase of 0.7 percentage points in the supply of kidneys. Because the
average difference in repugnance between the unpaid donor system and the public agency
payment system is of about 7.4 points (14.2 vs. 21.6), our conditional logit estimates imply that
individuals are on average willing to accept the latter system over the current one if it were to
yield a growth in annual supply of about 5.2 percentage points; these correspond to about 1,800
additional yearly transplants from live donors. In order for the average respondent to accept a
private payments system, an increase of over 23 percentage points would be required (33
repugnance points difference * 0.7), corresponding to more than 8,000 additional kidneys
procured annually.
A possible concern with these estimates is the presence of an omitted variables bias; in
particular, other features of the three systems may the respondents’ choices. To explore this
possibility, we re-estimated the conditional logit model including system fixed effects, and we
report the results in column 2 of Table 2. The estimated marginal utility of morality is essentially
unchanged (-0.043, s.e = 0.002), and the estimated marginal utility of efficiency is slightly
smaller (0.057, s.e. = 0.002), implying a marginal rate of substitution of 0.75, which is very close
to what we obtained without controlling for system effects. This indicates that morality and
efficiency as we defined them here are indeed measuring our trade-off of interest.
Latent class logit
Table 3 reports the estimates of the marginal utility to efficiency and repugnance from the latent
class model with four classes. Although there is no mechanical reason that the estimation would
produce the four distinct preference types that we hypothesized,†††††† all four categories were
present in the data. 14.4% of the sample was estimated to have only minimal sensitivity to both
efficiency and repugnance; the procedure assigned 50.2% of the respondents, the vast majority,
†††††† See also Kranton et al. (2013) for similar considerations.

25
to marginal utilities to repugnance and efficiency closer to each other in absolute value (-0.088
and 0.104 respectively); for 25.1% of individuals, the estimated marginal utility to efficiency was
substantially higher than the marginal disutility to repugnance (0.196 vs. -0.046). Finally, about
10% of the sample was estimated to have preferences consistent with repugnance reflecting
sacred values, with a marginal disutility to repugnance of 2.2 against a marginal utility of
efficiency of 0.132. This 10% of individuals is showing “deontological” preferences with regard
to the morality of a transaction, i.e. they consider the ethical aspects a sacred value that should
not be traded against other gains, such as a higher supply of kidneys. Most of the population is
better characterized, however, as having a “consequentialist” view about the balance between
morality and repugnance, because these subjects are willing to accept types of transactions that
they consider less moral if the supply of kidneys were (finitely) higher. Among these, the
majority attributed nearly equal weights to morality and efficiency, whereas about a third showed
a much stronger preference for efficiency.
Random coefficient models
Figures 11 and 12 show the results from the estimation of the random coefficient model in
Equation (4). In Figure 11 we plotted the individual estimates of the marginal utility to efficiency
and repugnance. The average estimates are, respectively, 0.12 and -0.087; these are precisely
estimated and so are their standard deviations. The majority of the respondents clustered around
the average values; for a given marginal utility to efficiency, there is wide variety in the
relevance given to repugnance, with a few extreme negative values of the estimated marginal
utility, again pointing to the presence of individuals for whom this moral aversion is a sacred
value. There is also heterogeneity in the response to efficiency levels.
We show the distribution of the estimated individual marginal rates of substitution in Figure
12. The average MRS over the 2,918 individuals is 1.274. This value is higher than the implied
MRS from the simple conditional logit estimate above. Some extreme values, especially in the
distribution of the marginal utility to repugnance, drive the average MRS up. The median value
is arguably more relevant to consider, and it is 0.896, closer to the previous estimates and, in
particular, to the implied MRS of the dominant class in the latent class model. To better
appreciate the shape of the distribution, the density in Figure 12 excludes the top 1% of
estimated values (between 5.5 and 13.8). The implication of these values is that an increase in

26
supply of 7.4*0.89 = about 6.6 percentage points produced by a public-agency pay system
would lead the majority of respondents to prefer this system to the unpaid one; this corresponds
to about 2,300 additional kidneys procured annually, which would reduce the shortage by about
11 percent. However, an increase of almost 30 percentage points (corresponding to about 10,300
additional kidneys or a 56 percent reduction of the shortage) would be needed for the majority of
the respondents in our sample to accept a system with private payments over the unpaid system.
In a more detailed way than with the assumption of a finite number of classes, the distribution
shows again a large mass of individuals around the median value of the MRS, a sizeable share of
the population with low MRS, and a “right tail” of respondents closer to having deontological
views about repugnance as implied by their high estimated MRS.
Robustness to alternative specifications of repugnance and efficiency
As mentioned in Section 3.2, we also estimated our conditional logit, latent class logit and
random coefficient models using alternative measures of efficiency and repugnance. First, we
replaced the individual, self-assessed repugnance ratings with the sample average repugnance
ratings at the system level; second, we replaced the efficiency and repugnance measures with
their standardized values at the individual level (i.e., we subtracted the individual mean and
divided by the standard deviation). We report the results of these robustness analyses in Section
B of the Appendix. Overall, the findings from these alternative models were close to the main
ones. Interestingly, the conditional logit estimates with sample average repugnance ratings are
very similar to the ones reported in Table 2 when we controlled for system fixed effects (column
2) –when using the overall sample averages, we cannot add system fixed effects to the
regressors. The implied MRS in the conditional logit estimates and the median estimated MRS in
the random coefficient analyses are, again, close to the estimates from the main analyses.
Results from a follow-up survey
Three weeks after the main survey, we re-contacted the respondents and asked them to complete
the survey again.‡‡‡‡‡‡ 1,636 respondents (corresponding to 56% of the total) participated. The
main goal of the follow-up survey was to assess the stability of the responses and of our
‡‡‡‡‡‡ At the end of the original survey we asked the respondents whether we could contact them again for a follow-up within a few weeks; 97% of them agreed.

27
estimated parameters of interest. As described in detail in the Appendix (Section C3), there was a
high correlation (about 0.8) in the morality ratings expressed by the individuals in the original
survey and in the follow-up, and the estimates of interests were close to those obtained from the
full sample in the original survey, as well as from the subsample of participants who re-took the
survey. The high correlations and the similarity of the results suggest that the effects that we
found were not ephemeral, and that our survey measured the respondents’ preferences well.
Heterogeneity of preferences across socio-demographic groups
As a further exploration of heterogeneities in preferences, we also studied how the distribution of
the estimated marginal rates of substitution varies according to the individual characteristics that
we collected in the survey. Figure 13 shows the median values of the MRS for subgroups of the
respondent sample. Differences are small across the most relevant socio-demographic factors,
such as gender, age, education, income, and political and religious beliefs;§§§§§§ also, providing
efficiency information in the form of financial savings did not affect the MRS estimates in any of
the analyses that we performed. Conversely, larger differences emerge in relation to some of the
more general moral attitudes that we gauged with the survey. In particular, individuals who
stated that they would never approve of a private payment system for the procurement and
allocation of kidneys, regardless of how more efficient this system may be, had patterns of
choices corresponding to a much higher median MRS than the other participants (1.14 vs. 0.77);
furthermore, individuals who, in answering the question about vaccine testing, expressed
agreement with testing the vaccine and poison, thus revealing a more consequentialist view, have
a median MRS significantly lower than those who disagree, thus showing a more deontological
view (1.07 vs. 0.83). In a median (quantile) regression of the individual MRS on the various
socio-demographic variables and measures of attitudes toward moral dilemmas, the regressors
for which estimated parameters were statistically significant are the agreement/disagreement
with injecting the vaccine, the agreement/disagreement with the morality of inflicting pain in
§§§§§§ We transformed the variables expressed as “continuous” (e.g. age) or by multiple categories (e.g. income, educational attainment) into dichotomous indicators for simplicity of the analysis; for example, we separated individuals according to whether they reported an annual income below or above $50,000, or whether they had at least a 2yr college degree versus less.

28
name of higher values, and the absolute opposition to a private pay system. Figure 14, finally,
reports the distribution of the estimated individual MRSs for a few subsamples.*******
The fact that our MRS estimates are related to separate measures of one’s general approach
to certain moral dilemmas lends more credibility to our research design, whose objective was to
identify the role of moral beliefs toward certain transactions and how they relate to other aspects
of these transactions, such as their expected efficiency. The absence of meaningful differences in
tradeoffs between different socio-demographic groups indicates that moral beliefs and, more
generally, the way in which people balance different principles is a deeper individual
characteristic that observable demographics do not predict; this absence of differences also allays
some concerns about the external validity of our analyses.
5. Conclusion
We quantified the trade-off between the morality and the efficiency of an ethically controversial
and nearly universally prohibited transaction. We showed that both efficiency and morality
considerations affect individuals’ preferences for how to procure and allocate kidneys for
transplantation. Although systems that allow for payments to donors raise higher moral concerns
than a system with no payments, a majority of individuals make finite tradeoffs between higher
efficiency and ethical concerns. That is, a majority of individuals would be willing to accept a
more repugnant system provided that it produced a sufficiently large additional number of
transplants. We stress two findings and we describe the scholarly and policy implications of our
study.
First, the size of the estimated trade-off did not depend just on the presence of a monetary
payment, but varied depending on whether the exchanges occurred through private transactions
or whether a third party provided payment to donors and allocated organs to recipients. In
particular, a system whereby a public agency pays donors and organs are allocated on the basis
of priority rules requires relatively small efficiency gains (a reduction of about 10% of the annual
shortage) to receive the support of a majority, whereas individual transactions between organ
donors and recipients would require larger supply increases (a 56% reduction of the shortage).
******* With regard to the answer to the questions in moral dilemmas, we excluded from the analysis the subjects who selected the mid category “neither agree nor disagree”, and attributed the responses “Strongly disagree”, “disagree” and “somewhat disagree” on the one hand, and “Strongly agree”, “Agree” and “Somewhat agree” on the other hand, to two different categories (Agree and Disagree).

29
Our analysis indicates that fairness to the recipients is a particularly important factor affecting
the moral repugnance toward a paid-donor system; private transactions are considered highly
unfair to the recipients, whereas a system with public agency payments and organ allocation
reduces fairness concerns to a level similar to that of unpaid donations, arguably because this
system is perceived to guarantee equal access to life-saving organs to all patients in need. This
finding is consisted with an aversion to health-related inequities that other studies documented,
(Evans et al. 2011), as well as with evidence showing that people are more egalitarian when
allocating physical pain compared to money (Davis et al. 2015; Story et al. 2016).
The second key finding is the heterogeneity in the willingness to trade off morality and
efficiency, and that this heterogeneity was unrelated to socio-economic characteristics, but was
related to individuals’ overall ethical stances. The sources of the dissenting positions on whether
to allow and how to regulate morally controversial transactions appear to reside in deep beliefs
that go beyond demographics, religious attitudes or political preferences, and thus need to be
measured separately. In fact, one of our contributions is to define a framework to quantify these
different positions in “tradeoff” terms and characterize their distribution.
We believe that our findings can inform scholars about the nature of preferences in morally
controversial transactions. We see our work as an attempt to connect the discourse in economics
and ethics. In fact, we expect our methodology to be applicable to other morally controversial
transactions. For example, there is evidence that legalizing indoor prostitution potentially
enhances social welfare by reducing violence and STD incidence (Cunningham and Shah 2014).
Our methodology can be used to assess whether these welfare gains are sufficient to induce a
majority of voters to legalize a transaction in spite of moral concerns. Other transactions to
analyze within our framework include commercial surrogacy, donation of human eggs, and
participation in clinical trials. These transactions raise ethical concerns similar to those of organ
donations, while at the same time arguably generating surplus for the transacting parties.
In the case that we analyzed, our results can inform policymakers about what options are
morally viable to address the shortage of organs and tissues for transplant. The finding that
individuals are willing to make tradeoffs between the efficiency and the morality of a
transaction, and that their willingness to allow certain transactions depends on the magnitude of
the efficiency gains implies that empirical evidence can play a crucial role. In particular, trial

30
studies assessing the effects of paid donations could significantly enhance the ability of a
population to determine what the preferred organ procurement and allocation system should be.
References Akerlof, G. A., & Kranton, R. E. (2000). Economics and identity. Quarterly Journal of Economics, 715-753.
Ambuehl, S. (2016). An Offer You Can't Refuse? Incentives change how we think, working paper, Stanford University.
Ambuehl, S., Niederle, M., & Roth, A. E. (2015). More money, more problems? Can high pay be coercive and repugnant?. American Economic Review Papers and Proceedings, 105(5), 357-360.
Andreoni, J., & Sprenger, C. (2012). Risk preferences are not time preferences. American Economic Review, 102(7), 3357-3376.
Basu, K. (2007). Coercion, Contract and the Limits of the Market. Social Choice and Welfare, 29 (4), 559-579. Becker, G. S., & Elias, J. J. (2007). Introducing incentives in the market for live and cadaveric organ donations. The
Journal of Economic Perspectives, 21(3), 3-24.
Bénabou, R., & Tirole, J. (2009). Over my dead body: Bargaining and the price of dignity. American Economic Review, 99(2), 459-465.
Bénabou, R., & Tirole, J. (2011). Identity, morals, and taboos: Beliefs as assets. Quarterly Journal of Economics, 126(2), 805-855.
Bénabou, R., Ticchi, D., & Vindigni, A. (2015). Forbidden fruits: the political economy of science, religion, and growth (No. w21105). National Bureau of Economic Research.
Benjamin, D. J., Choi, J. J., & Fisher, G. (2016). Religious Identity and Economic Behavior, Review of Economics and Statistics, forthcoming.
Benjamin, D. J., Heffetz, O., Kimball, M. S., & Rees-Jones, A. (2012). What do you think would make you happier? What do you think you would choose?. American Economic Review, 102(5), 2083.
Benjamin, D. J., Heffetz, O., Kimball, M. S., & Rees-Jones, A. (2014). Can marginal rates of substitution be inferred from happiness data? Evidence from residency choices. American Economic Review, 104(11), 3498-3528.
Benjamin, D. J., Kimball, M. S., Heffetz, O., & Szembrot, N. (2014). Beyond Happiness and Satisfaction: Toward Well-Being Indices Based on Stated Preference. American Economic Review, 104(9), 2698-2735.
Bhat, C. R. (1997). An endogenous segmentation mode choice model with an application to intercity travel. Transportation Science, 31(1), 34-48.
Bursztyn, L., Callen, M., Ferman, B., Hasanain, A., & Yuchtman, N. (2015). Identifying Ideology: Experimental Evidence on Anti-Americanism in Pakistan.
Callen, M., Isaqzadeh, M., Long, J. D., & Sprenger, C. (2014). Violence and risk preference: Experimental evidence from Afghanistan. American Economic Review, 104(1), 123-148.
Council of Europe (2015). Council of Europe Convention against Trafficking in Human Organs.
Cunningham, S. and Shah, M., 2014: “Decriminalizing indoor prostitution: Implications for sexual violence and public health,” NBER working paper 20281.
Davis, A. L., Jehli, N. R., Miller, J. H., & Weber, R. A. (2015). Generosity across contexts. CESIFO WORKING PAPER NO. 5272. Available at SSRN: http://papers.ssrn.com/sol3/papers.cfm?abstract_id=2592357. Date of access: 09/06/2016.

31
Delmonico, F. et al. (2002). Ethical incentives—not payment—for organ donation. New England Journal of Medicine, 346(25).
Evans, T., Whitehead, M., Diderichsen, F., Bhuiya, A., Wirth, M., 2001. Introduction. In: Evans, T., Whitehead, M., Diderichsen, F., Bhuiya, A., Wirth, M. (Eds.), Challenging Inequities in Health: From Ethics to Action. Oxford University Press, Oxford.
Falk, A., & Szech, N. (2013). Morals and markets. Science, 340(6133), 707-711.
Fisman, R., Iyengar, S. S., Kamenica, E., & Simonson, I. (2006). Gender differences in mate selection: Evidence from a speed dating experiment. Quarterly Journal of Economics, 121(2), 673-697.
Foot, P. (1967). The problem of abortion and the doctrine of the double effect. Oxford Review, 5, 5-15.
Gibson, R., Tanner, C., & Wagner, A. F. (2013). Preferences for truthfulness: Heterogeneity among and within individuals. American Economic Review, 103, 532-548.
Gneezy, U. (2005). Deception: The role of consequences. American Economic Review, 95(1), 384-394.
Grant, R. W. (2011). Strings attached: Untangling the ethics of incentives, Princeton University Press.
Harrison, B. J., Pujol, J., López-Solà, M., Hernández-Ribas, R., Deus, J., Ortiz, H., & Cardoner, N. (2008). Consistency and functional specialization in the default mode brain network. Proceedings of the National Academy of Sciences, 105(28), 9781-9786.
Held, P. J., McCormick, F., Ojo, A., & Roberts, J. P. (2016). A Cost‐Benefit Analysis of Government Compensation of Kidney Donors. American Journal of Transplantation, 16(3) 877–885.
Hole, A. R. (2007). Estimating mixed logit models using maximum simulated likelihood. Stata Journal, 7(3), 388-401.
Kessler, J. B., & Roth, A. E. (2012). Organ Allocation Policy and the Decision to Donate. American Economic Review, 102(5), 2018-2047.
Knobe, J., Buckwalter, W., Nichols, S., Robbins, P., Sarkissian, H., & Sommers, T. (2012). Experimental philosophy. Annual Review of Psychology, 63, 81-99.
Kranton, R., Pease, M., Sanders, S., and Huettel, S. (2013). Identity, Group Conflict, and Social Preferences. Unpublished manuscript, Duke University.
Kuziemko, I., Norton, M. I., & Saez, E. (2015). How Elastic Are Preferences for Redistribution? Evidence from Randomized Survey Experiments. American Economic Review, 105(4), 1478-1508.
Leider, S., & Roth, A. E. (2010). Kidneys for sale: Who disapproves, and why?. American Journal of Transplantation, 10(5), 1221-1227.
Marshall, A. (1890). 1920. Principles of economics. London: Mac-Millan.
McFadden, D. L. (1974). Conditional logit analysis of qualitative choice behavior. In Frontiers in Econometrics, ed. P. Zarembka, 105-142. New York: Academic Press.
Niederle, M., & Roth, A. E. (2014). Philanthropically Funded Heroism Awards for Kidney Donors. Law & Contemp. Probs., 77, 131.
Nuffield Council on Bioethics (1995). Human Tissue: Ethical and Legal Issues, London.
Peer E., Vosgerau J., and Acquisti A. (2014). Reputation as a sufficient condition for data quality on Amazon Mechanical Turk. Behavior Research Methods. 2014 Dec;46(4):1023-31.
Radin, M. J. (1996). Contested commodities:[the trouble with trade in sex, children, body parts, and other things]. Cambridge, MA: Harvard University Press.
Revelt, D., & Train, K. (1998). Mixed logit with repeated choices: households' choices of appliance efficiency level. Review of Economics and Statistics, 80(4), 647-657.
Robinson, J. S. (2012). The Consequentialist Scale: Elucidating the Role of Deontological and Utilitarian Beliefs in Moral Judgments, University of Toronto.

32
Ross, L. F., Rubin, D. T., Siegler, M., Josephson, M. A., Thistlethwaite Jr, J. R., & Woodle, E. S. (1997). Ethics of a paired-kidney-exchange program. New England Journal of Medicine, 336(24), 1752-1755.
Roth, A. E. (2007). Repugnance as a Constraint on Markets. Journal of Economic Perspectives, 21(3), 37-58.
Roth, A., Sönmez, T., & Unver, U. (2004). Kidney Exchange. Quarterly Journal of Economics, 119(2), 457-488.
Sandel, M. J. (2012). What money can't buy: the moral limits of markets. Macmillan.
Satel, S. (2006). Organs for sale. The American.
Satz, D. (2008). The Moral Limits of Markets: The Case of Human Kidneys. In Proceedings of the Aristotelian Society, 108(1), 269-288.
Sen, A. (1999). On ethics and economics. OUP Catalogue.
Shleifer, A. (2004). Does Competition Destroy Ethical Behavior? American Economic Review, 94(2), 414-418.
Stoler, A., Kessler, J. B., Ashkenazi, T., Roth, A. E., & Lavee, J. (2016). Incentivizing Organ Donor Registrations with Organ Allocation Priority. Health Economics.
Story, G. W., Vlaev, I., Metcalfe, R. D., Crockett, M. J., Kurth-Nelson, Z., Darzi, A., & Dolan, R. J. (2015). Social redistribution of pain and money.Scientific reports, 5.
Tanner, C., Medin, D. L., & Iliev, R. (2008). Influence of deontological versus consequentialist orientations on act choices and framing effects: When principles are more important than consequences. European Journal of Social Psychology, 38(5), 757-769.
Tetlock, P. E., Kristel, O. V., Elson, S. B., Green, M. C., & Lerner, J. S. (2000). The psychology of the unthinkable: taboo trade-offs, forbidden base rates, and heretical counterfactuals. Journal of Personality and Social Psychology, 78(5), 853.
Thomson, J. J. (1985). Double effect, triple effect and the trolley problem: Squaring the circle in looping cases. Yale Law Journal, 94(6), 1395-1415.
Train, K. E. (2003). Discrete choice methods with simulation. Cambridge University Press.
Train, K. E. (2008). EM algorithms for nonparametric estimation of mixing distributions. Journal of Choice Modelling, 1(1), 40-69.
United States Task Force on Organ Transplantation (1986). Issues and Recommendations. Task Force on Organ Transplantation, US Department of Health and Human Services. Public Health Service, Health Resources and Services Administration.
World Health Organization (2004). World Health Assembly Resolution 57.18, Human organ and tissue transplantation, 22 May 2004, http://www.who.int/gb/ebwha/pdf_files/WHA57/A57_R18‐en.pdf.

33
Table 1: Summary statistics of the sample and comparison with other online data. This table reports average values (or shares) for selected demographics that we collected, and compare them to the mTurk
sample used by Kuziemko et el. (2015), and statistics from the American Life Panel as reported by Kuziemko et el.
(2015), Table 1.
Our mTurk samplemTurk sample from
Kuziemko et al. (2015)American Life Panel
Male 0.5 0.428 0.417
Age (years) 33.96 35.41 48.94
White (non‐hispanic) 0.775 0.778 0.676
Black 0.072 0.076 0.109
Hispanic 0.057 0.044 0.18
Other racial/ethnic group 0.097 0.076 0.041
Employed (full‐ or part‐time) 0.572 0.465 0.557
Unemployed 0.062 0.123 0.103
Married 0.379 0.397 0.608
Has college degree 0.529 0.433 0.309

34
Table 2: Conditional logit estimates. This table reports the coefficient estimates from conditional logit
regressions where the outcome variable is equal to 1 for the system chosen and 0 for the others. The standard errors in parentheses were clustered at the individual level. Efficiency is expressed as a percentage of the annual demand for kidneys (values between 49 and 100), and Moral Repugnance is the average individual ratings across the six repugnance features (values between 0 and 100).
Table 3: Latent class logit estimates. This table reports estimates from a latent class conditional logit
model with four classes obtained through an Expectation‐Maximisation algorithm (Bhat 1997, Train 2008). Standard errors are in parentheses.
Marginal utility parameter
estimates
(1) (2)
Efficiency 0.065 0.057
(0.002) (0.002)
Moral Repugnance ‐0.045 ‐0.043
(0.001) (0.002)
Publ. Agency pay system 0.762
(0.047)
Private pay system 0.186
(0.074)
Number of observations 25,839 25,839
Marginal utility
parameter estimatesClass 1 Class 2 Class 3 Class 4
Efficiency 0.013 0.132 0.104 0.196
(0.004) (0.055) (0.007) (0.022)
Moral Repugnance ‐0.006 ‐2.185 ‐0.088 ‐0.046
(0.003) (0.647) (0.006) (0.006)
Mixing proportions 14.40% 10.30% 50.20% 25.10%

35
Figure 1: Efficiency‐repugnance trade‐offs for different preference types

36
Figure 2: Experiment flow chart

37
Figure 3: Distribution of some individual characteristics
0.0
5.1
.15
Fra
ctio
n
15 30 45 60 75
Age (Avg=33.96)
0.1
.2.3
.4F
ract
ion
<=8th Some HS HS Some coll. 2yr coll 4yr coll. MS/MA PhD Prof.
Educational attainment
0.0
5.1
.15
.2F
ract
ion
<$10K $10-19K $20-29K $30-39K $40-49K $50-74K $75-99K $100-149K $150-199K $200K+
Income category
0.1
.2.3
.4.5
Fra
ctio
n
Atheist Christian Jewish Muslim Other
Religion
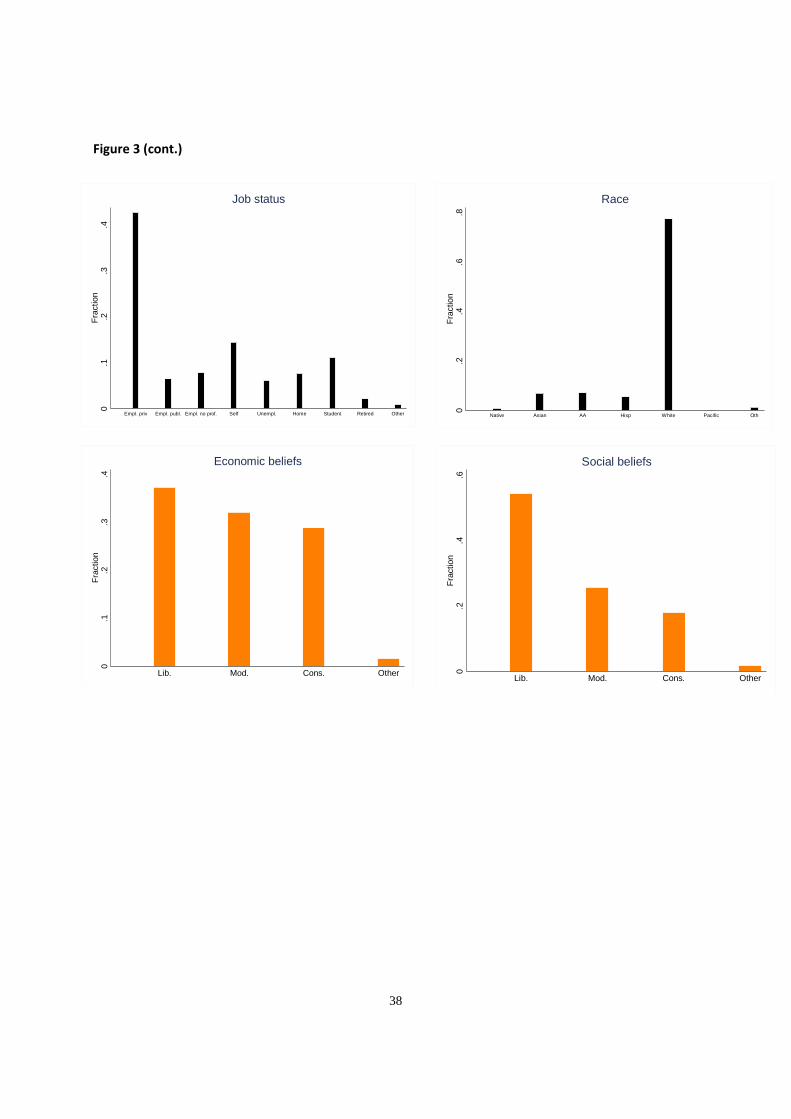
38
Figure 3 (cont.)
0.1
.2.3
.4F
ract
ion
Empl. priv Empl. publ. Empl. no prof. Self Unempl. Home Student Retired Other
Job status
0.2
.4.6
.8F
ract
ion
Native Asian AA Hisp White Pacific Oth
Race
0.1
.2.3
.4F
ract
ion
Lib. Mod. Cons. Other
Economic beliefs0
.2.4
.6F
ract
ion
Lib. Mod. Cons. Other
Social beliefs
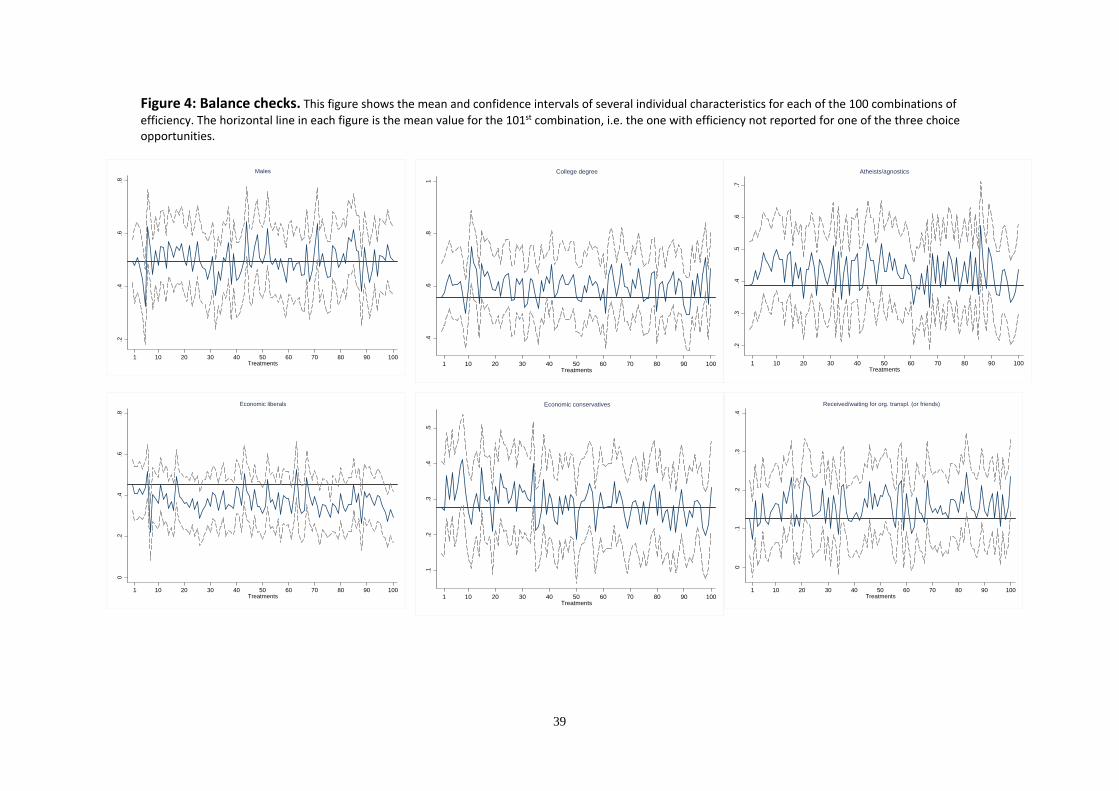
39
Figure 4: Balance checks. This figure shows the mean and confidence intervals of several individual characteristics for each of the 100 combinations of
efficiency. The horizontal line in each figure is the mean value for the 101st combination, i.e. the one with efficiency not reported for one of the three choice opportunities.
.2.4
.6.8
1 10 20 30 40 50 60 70 80 90 100Treatments
Males
.4.6
.81
1 10 20 30 40 50 60 70 80 90 100Treatments
College degree
.2.3
.4.5
.6.7
1 10 20 30 40 50 60 70 80 90 100Treatments
Atheists/agnostics
0.2
.4.6
.8
1 10 20 30 40 50 60 70 80 90 100Treatments
Economic liberals
.1.2
.3.4
.5
1 10 20 30 40 50 60 70 80 90 100Treatments
Economic conservatives
0.1
.2.3
.4
1 10 20 30 40 50 60 70 80 90 100Treatments
Received/waiting for org. transpl. (or friends)

40
Figure 5: Average repugnance ratings by feature and system

41
Figure 6: Distribution of average repugnance ratings by system
0.1
.2.3
.4F
ract
ion
0 20 40 60 80 100
Overall repugnance -- Unpaid system (Avg=14.19)
0.1
.2.3
.4F
ract
ion
0 20 40 60 80 100
Overall repugnance -- 3rd payer system (Avg=21.56)
0.1
.2.3
.4F
ract
ion
0 20 40 60 80 100
Overall repugnance -- Private system (Avg=47.19)

42
Figure 7: Preferences for the three systems at different levels of relative efficiency. This figure reports the share of cases in which respondents choose each system, for a subset of combinations of efficiency levels as reported on the x‐axis.
36.2%40.5%
23.4%
14.8%
74.5%
56.7% 49.7%
22.1%
79.0%
20.8%
7.1% 9.8%
54.5%
6.2% 4.7%
No efficiency reported Same # kidneys #kidneys in Unpaid and Publ.agency pay = 17K, #kidneys
private pay 35K
#kidneys in Unpaid andprivate pay = 17K, #kidneys
Publ. agency pay 35K
#kidneys in Publ. agency payand private pay = 17K,
#kidneys in unpaid 21.5K
Unpaid Publ. agency pay Priv. pay

43
Figure 8: Preference rates for each of the three systems, for any given efficiency comparison with the other two. This figure shows the percentage of choices made for each system, at various efficiency
differences with the other systems in a given choice opportunity.
0%
10%
20%
30%
40%
50%
60%
70%
80%
90%
100%
‐18K ‐13.5K ‐9K ‐4.5K 0 4.5K
Share choosing Unpaid
#kidneys(Unpaid) ‐ #kidneys(Publ. ag. pay)
#(Priv. pay)‐#(unpaid)=‐18K #(Priv. pay)‐#(unpaid)=‐13.5K
#(Priv. pay)‐#(unpaid)=‐9K #(Priv. pay)‐#(unpaid)=‐4.5K
#(Priv. pay)‐#(unpaid)=0 #(Priv. pay)‐#(unpaid)=4.5K
0%
10%
20%
30%
40%
50%
60%
70%
80%
90%
100%
‐18K ‐13.5K ‐9K ‐4.5K 0 4.5K 9K 13.5K 18K
Share choosing publ. ag. pay
#kidneys(Publ. ag. pay) ‐ #kidneys(Private pay)
#(Publ. ag. pay)‐#(unpaid)=‐4.5K #(Publ. ag. pay)‐#(unpaid)=0
#(Publ. ag. pay)‐#(unpaid)=4.5K #(Publ. ag. pay)‐#(unpaid)=9K
#(Publ. ag. pay)‐#(unpaid)=13.5K #(Publ. ag. pay)‐#(unpaid)=18K
0%
10%
20%
30%
40%
50%
60%
70%
80%
90%
100%
‐18K ‐13.5K ‐9K ‐4.5K 0 4.5K 9K 13.5K 18K
Share choosing Priv. pay
#kidneys(Private pay) ‐ #kidneys(Publ. ag. pay)
#(Priv. pay)‐#(unpaid)=‐4.5K #(Priv. pay)‐#(unpaid)=0
#(Priv. pay)‐#(unpaid)=4.5K #(Priv. pay)‐#(unpaid)=9K
#(Priv. pay)‐#(unpaid)=13.5K #(Priv. pay)‐#(unpaid)=18K

44
Figure 9: Choice rate for a system, given its efficiency and repugnance ranking within a given choice opportunity. Each column represents the relative choice frequency of an option within a set as defined
by its (rank‐)relative efficiency and repugnance. We excluded all choice sets with ties between options (e.g. two systems with the same efficiency levels); adding those cases produces very similar results.

45
Figure 10: correlation between overall system ratings, efficiency and repugnance. Panels A and D report scatter plots of different efficiency levels and average repugnance ratings on the overall rating for the corresponding system. Panels B and E display scatter plots of the residuals from regression of overall ratings on repugnance ratings, and different corresponding efficiency levels (B); and of the residuals from regression of overall ratings on efficiency levels, and different corresponding repugnance ratings (E). Panels C and F show scatter plots of residuals of a regression of overall ratings on system‐level fixed effects, and efficiency levels (C) or repugnance ratings (F). Each graph also includes the linear fit (and confidence interval) for the relationship between the y and x variables in the graphs.
A: Ratings and efficiency ‐‐ Raw data
B: Rating and efficiency, keeping repugnance constant
C: Rating and efficiency, within systems
D: Ratings and repugnance ‐‐ Raw data E: Rating and repugnance, keeping efficiency constant F: Rating and repugnance, within systems
02
04
06
08
01
00
Ra
ting
s
49 61 74 87 100Efficiency (%)
Overall ratings on systems by efficiency level
-75
-50
-25
025
5075
Res
idua
ls49 61 74 87 100
Efficiency (%)
Residuals from regression of ratings on repugnance, by efficiency level
-75
-50
-25
02
55
07
5R
esi
du
als
49 61 74 87 100Efficiency (%)
Residuals from regression of ratings on systems, by efficiency level
020
4060
8010
0R
atin
gs
0 20 40 60 80 100Repugnance
Overall ratings on systems by repugnance
-75
-50
-25
025
5075
Res
idua
ls
0 20 40 60 80 100Repugnance
Residuals from regression of ratings on efficiency, by repugnance
-75
-50
-25
025
5075
Res
idua
ls
0 20 40 60 80 100Repugnance
Residuals from regression of ratings on systems, by repugnance

46
Figure 11: Individual marginal utilities to efficiency and repugnance. Each point in the scatter plot is a combination of estimated individual coefficients on efficiency and repugnance from a random coefficient logit model.
0.1
.2.3
.4M
U(e
ffici
ency
)
-1.5 -1 -.5 0MU(repugnance)
Estimated individual marginal utilities of efficiency and repugnance
47
Figure 12: Distribution of estimated individual marginal rated of substitution between efficiency and repugnance. Individual MRSs were derived from a random coefficient conditional logit
estimation in WTP space, where efficiency, expressed in percentage of the total annual demand for kidneys, was the numeraire. Both efficiency and the MRS were assumed to be lognormally distributed. The average estimated MRS is 1.27, and the median is 0.89. The density reported below excludes the top 1% of values of the estimated MRS.
0.2
.4.6
.8D
ensi
ty
0 2 4 6Estimated MRS
Distribution of estimated MRS between efficiency and repugnance

48
Figure 13: Median MRS for different subsamples of respondents. This figure reports the median values (and confidence intervals) of the
individual marginal rates of substitution (whose distribution is in Figure 12 above) for subsets of the respondent population.
0.7
0.8
0.9
1
1.1
1.2
1.3Median M
RS

49
Figure 14: Distribution of estimated individual marginal rated of substitution between efficiency and repugnance for select subgroups. The densities reported below display the full distribution of the estimated individual MRS, for selected subsample of the population. As in Figure 12 above, we excluded the top 1% of the estimated MRS values.
0.2
.4.6
.8D
ensi
ty
0 2 4 6Estimated MRS
Men Women
0.2
.4.6
.8D
ensi
ty
0 2 4 6Estimated MRS
Religious Atheist/agnostic
0.2
.4.6
.8D
ensi
ty
0 2 4 6Estimated MRS
Social liberal Social conservative
0.2
.4.6
.8D
ensi
ty
0 2 4 6Estimated MRS
Economic liberal Economic conservative
0.2
.4.6
.8D
ensi
ty
0 2 4 6Estimated MRS
Agree to test vaccine Disagree to test vaccine
0.2
.4.6
.81
Den
sity
0 2 4 6Estimated MRS
Never switch to private pay Open to switching to private pay

APPENDIX FOR
MORALITY‐EFFICIENCY TRADEOFFS IN REPUGNANT TRANSACTIONS: A CHOICE EXPERIMENT
Julio Elias, Nicola Lacetera and Mario Macis
TABLE OF CONTENT
A. DESCRIPTION OF THE MAIN EXPERIMENT ii
A1. SET‐UP, TEXT AND QUESTIONS ii
A2. SOURCES OF INFORMATION AND CALCULATIONS OF FINANCIAL BENEFITS FOR TAXPAYERS xviii
B. ADDITIONAL TABLES AND FIGURES FROM THE EXPERIMENT xix
C. AUXILIARY EXPERIMENTS xxi
C1. REPUGNANCE RATINGS OF VARIOUS ORGAN PROCUREMENT AND ALLOCATION POLICIES xxi
C2. RELATIONSHIP BETWEEN EFFICIENCY LEVELS AND REPUGNANCE RATINGS xxviii
C3. FOLLOW‐UP SURVEY xxxi
C4. FRESH APPLES MARKET SURVEY xxxv

ii
A. DESCRIPTION OF THE MAIN EXPERIMENT
A1. SET‐UP, TEXT AND QUESTIONS
We conducted the experiment in a single round on March 31 2016 on Amazon Mechanical Turk (mTurk),
with 2,918 respondents using Qualtrics as the survey software. We recruited respondents on mTurk,
where we posted the assignment and included a link to the survey. The description of the task specified
that respondents would receive $2 for a survey that would take approximately 10‐12 minutes to
complete diligently, corresponding to $10‐$12 hourly wage. The average and median time per
assignment were 12.48 minutes and 11.57 minutes, respectively. We limited participation to US
residents, and specified this restriction in the text. We also restricted participation to mTurk members
with an approval rate of at least 80 percent. Respondents were given up to 30 minutes to complete the
assignment, and they could drop out at any time. We also provided our contact information as well as
contact information for the Research Ethics Offices at the Johns Hopkins University (HIRB) and the
University of Toronto (REB). The text below is the full mTurk task description.
Computerized Questionnaire ‐ US Residents only. PLEASE READ CAREFULLY. You will be asked to complete a computerized questionnaire. No foreseeable risks, harms, or inconveniences accompany the completion of these procedures. We kindly ask that respondents read the text(s) carefully before answering the questions. The questionnaire should take an average of 10‐12 minutes to complete diligently. After completing the study (and entering the survey code in the space below), $2.00 will be paid to your Mechanical Turk account. The survey is best taken from a computer as opposed to a mobile device. In case you encounter any issues with the survey, we would much appreciate if you would let us know by leaving a comment in the space provided at the end of the survey. Participation in this study is entirely voluntary. Payment is conditional on diligently completing the entire questionnaire and entering the code that will you receive at the end; however, withdrawal is possible at any time, if you so desire. All of your responses will be held confidential and anonymous. The data will only be accessible to the researchers involved in this study. Should you choose to withdraw from the study, our records of your data will be destroyed immediately. This study is being conducted by Drs. Nicola Lacetera and Mario Macis, who can be contacted for questions, including details about the research after completing the survey. Contact information for Dr. Lacetera: phone n. (416) 978‐4423; e‐mail at [email protected]. Contact information for Dr. Macis: phone n. (410) 234‐9431; e‐mail: [email protected]. If you have questions about your rights as a research participant, you may contact the Office of Research Ethics at

iii
[email protected] or (416) 946‐3273 or the Homewood Institutional Review Board at Johns Hopkins University at (410) 516‐6580, e‐mail: [email protected]. If you agree to participate in this study, please click on the link below. If you do not wish to participate in this study, please close this window now and your session will end. SURVEY LINK: http://tinyurl.com/elm3questionnaire
After completing the survey, please enter the survey code below, and then click on "submit".
Submit
The link to the experiment is: http://jhubusiness.qualtrics.com/SE/?SID=SV_b8CD9m8iXQD3vdH
Below we describe the details of the experiment, by going through the different steps (or screens) of the
computerized survey.
1. Information about organ procurement and allocation in the United States
In the first screen we displayed a text with information about organ procurement and allocation in the
United States:
Kidney transplantation is often the best treatment for patients with advanced and permanent kidney failure. Each year in the United States approximately 35,000 new patients require a kidney transplant, but only about 17,000 obtain one. Currently, about 100,000 patients are on the waiting list for a kidney transplant. In 2014, 17,107 kidney transplants were performed in the United States. 11,570 (68%) kidneys came from deceased donors, and 5,537 (32%) from live donors. There are three types of living kidney donation: direct donation, in which the donor generally knows the recipient and donates directly to them; paired exchange donation, where a donor donates their kidney to another recipient in exchange for a compatible kidney for their loved one; and undirected donation whereby the donor gives to a stranger ‐ which might initiate a chain of transplants. In 2014, 86.6% of live donations were from direct donors, 10% were from exchanges, and 3.4% from undirected donors.

iv
The current organ procurement system is based on unpaid donors. Several alternative organ procurement and allocation systems are currently being debated. In what follows we will focus on living undirected donations. You will read about three alternative systems to organize these donations, and you will be asked to express your opinion on several aspects of these systems. Please pay attention to the details of each system, and answer as carefully and truthfully as possible.
2. Description of three possible systems of organ procurement and allocation
Next, we provided a description of three possible systems of organ procurement and allocation
concerning living undirected donations:
Consider the following three procurement and allocation systems.
In System A, unpaid donors can donate a kidney to a specific recipient
or to an anonymous candidate on the waiting list. Kidneys donated to
anonymous candidates are allocated by an agency (coordinated by the
U.S. Department of Health and Human Services) according to priority
rules based on patients' medical urgency, blood and tissue match with
the donor, time on the waiting list, age and distance to the donor.
In System B, kidney donors can receive $20,000 from a public agency.
Kidneys from paid donors are allocated by an agency (coordinated by
the U.S. Department of Health and Human Services) according
to priority rules based on patients' medical urgency, blood and tissue
match with the donor, time on the waiting list, age and distance to the
donor. Donors can decide not to be paid, and can also make directed
unpaid donations.
In System C, kidney donors can receive $20,000 directly from the
kidney recipient (e.g., out of pocket or through privately purchased
health insurance). A registry of patients in need of a kidney and of
potential donors is kept by an agency (coordinated by the U.S.
Department of Health and Human Services); transactions occur directly
between the paying recipient and the donor or through a private
agency. Donors can decide not to be paid, and can also make directed
unpaid donations.
The table below summarizes the main characteristics of each system.
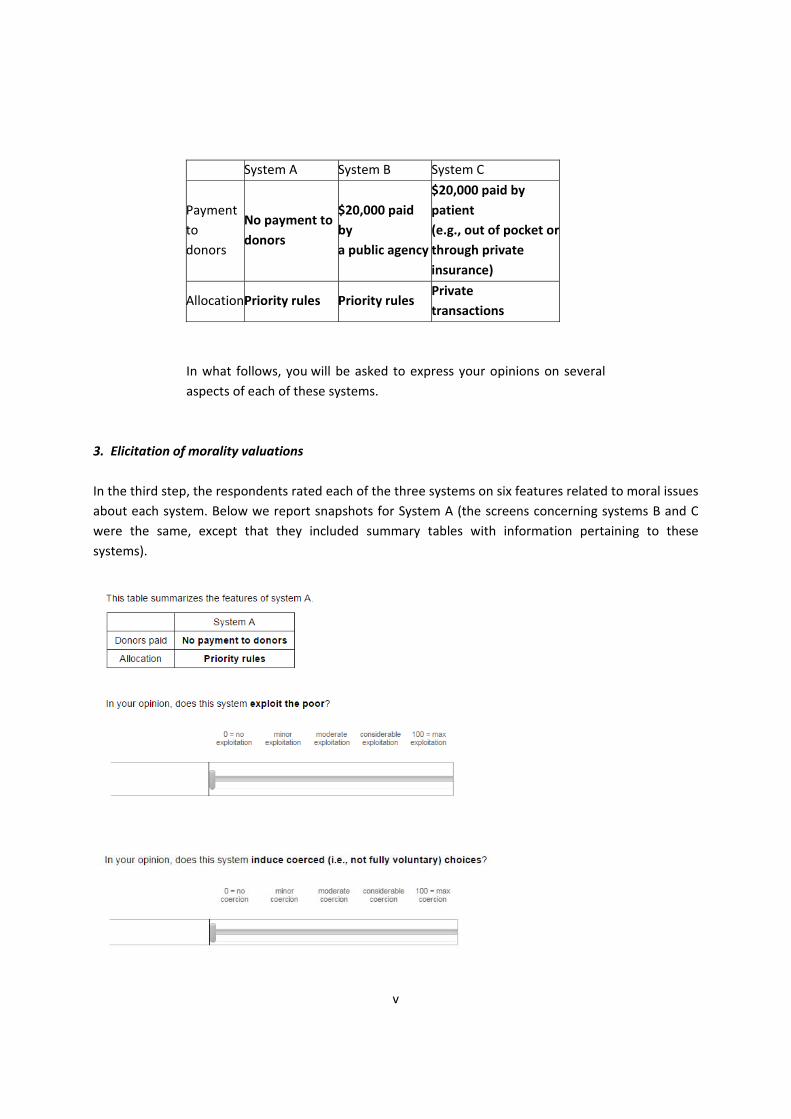
v
System A System B System C
Payment
to
donors
No payment to
donors
$20,000 paid
by
a public agency
$20,000 paid by
patient
(e.g., out of pocket or
through private
insurance)
AllocationPriority rules Priority rules Private
transactions
In what follows, you will be asked to express your opinions on several
aspects of each of these systems.
3. Elicitation of morality valuations
In the third step, the respondents rated each of the three systems on six features related to moral issues
about each system. Below we report snapshots for System A (the screens concerning systems B and C
were the same, except that they included summary tables with information pertaining to these
systems).
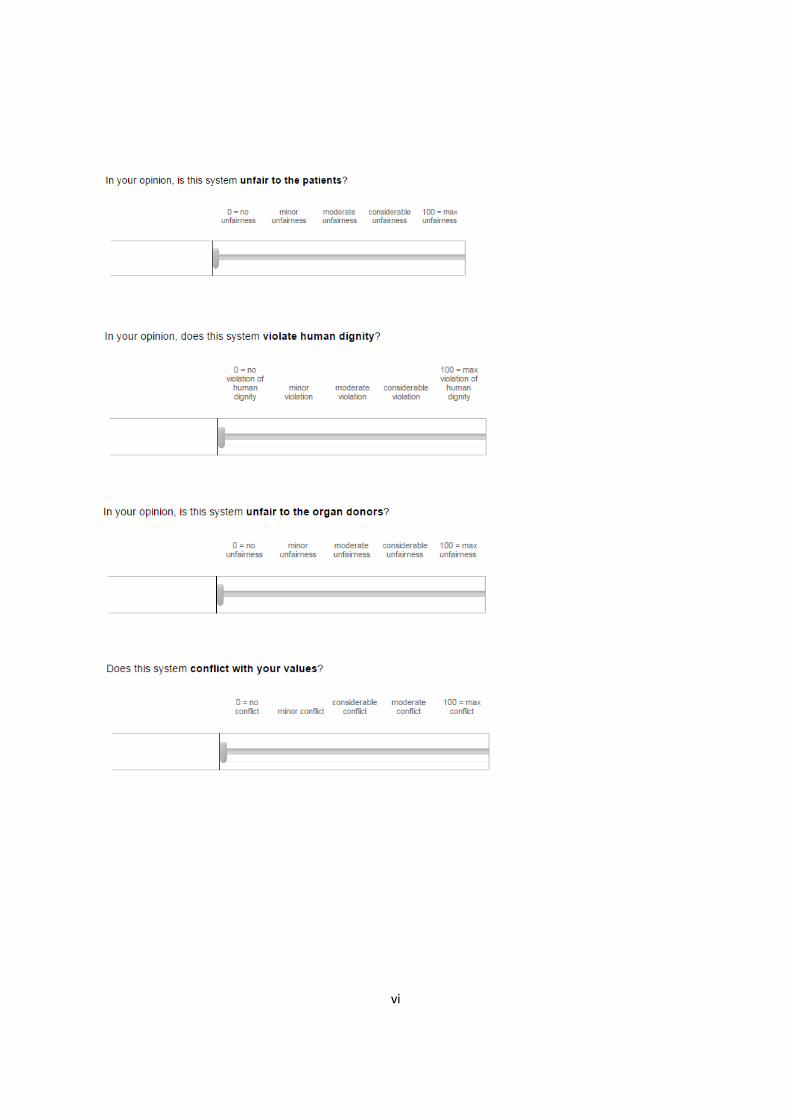
vi

vii
4. Randomized assignment of efficiency levels, and choice and rating of the systems
In the following section of the survey, we randomized respondents into treatment conditions as follows:
5% of the respondents were asked to choose their preferred system between A, B and C, with no additional information on the systems’ outcomes. These respondents also expressed their overall favor for each system. The relevant parts of the survey are below.
The remaining subjects observed hypothetical efficiency levels for each system. For a random 50%
of these respondents, we expressed the systems’ efficiency as the number of kidneys procured, and the corresponding percentage of annual demand satisfied; for the remaining 50%, we also included information about the financial savings for the taxpayers (see Section A2 below for details about the calculation of the financial savings).
Within each of these two groups, respondents were then randomly assigned to one of 50 experimental
conditions defined by the efficiency assigned to each of the three systems. The three systems could take
one of the following efficiency values:
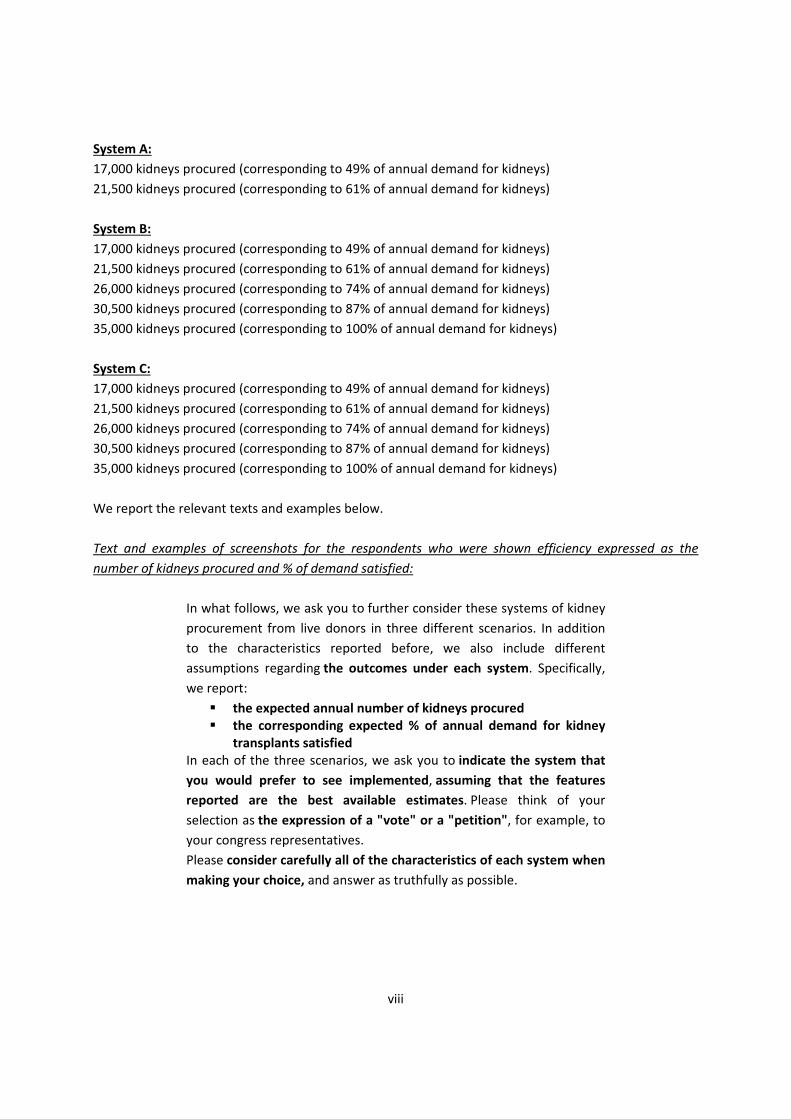
viii
System A:
17,000 kidneys procured (corresponding to 49% of annual demand for kidneys)
21,500 kidneys procured (corresponding to 61% of annual demand for kidneys)
System B:
17,000 kidneys procured (corresponding to 49% of annual demand for kidneys)
21,500 kidneys procured (corresponding to 61% of annual demand for kidneys)
26,000 kidneys procured (corresponding to 74% of annual demand for kidneys)
30,500 kidneys procured (corresponding to 87% of annual demand for kidneys)
35,000 kidneys procured (corresponding to 100% of annual demand for kidneys)
System C:
17,000 kidneys procured (corresponding to 49% of annual demand for kidneys)
21,500 kidneys procured (corresponding to 61% of annual demand for kidneys)
26,000 kidneys procured (corresponding to 74% of annual demand for kidneys)
30,500 kidneys procured (corresponding to 87% of annual demand for kidneys)
35,000 kidneys procured (corresponding to 100% of annual demand for kidneys)
We report the relevant texts and examples below.
Text and examples of screenshots for the respondents who were shown efficiency expressed as the
number of kidneys procured and % of demand satisfied:
In what follows, we ask you to further consider these systems of kidney
procurement from live donors in three different scenarios. In addition
to the characteristics reported before, we also include different
assumptions regarding the outcomes under each system. Specifically,
we report:
the expected annual number of kidneys procured the corresponding expected % of annual demand for kidney
transplants satisfied In each of the three scenarios, we ask you to indicate the system that
you would prefer to see implemented, assuming that the features
reported are the best available estimates. Please think of your
selection as the expression of a "vote" or a "petition", for example, to
your congress representatives.
Please consider carefully all of the characteristics of each system when
making your choice, and answer as truthfully as possible.

ix
Text and examples of screenshots for the respondents who were shown efficiency expressed as the
number of kidneys procured, % of demand satisfied, and financial savings for taxpayers:
In what follows, we ask you to further consider these systems of kidney
procurement from live donors in three different scenarios. In addition
to the characteristics reported before, we also include different
assumptions regarding the outcomes under each system. Specifically,
we report:
the expected annual number of kidneys procured the corresponding expected % of annual demand for kidney
transplants satisfied the estimated net financial savings to taxpayers due to the
patients’ no longer needing dialysis treatment (currently the government covers most of these costs); wherever payments to donors come from a public agency, the monetary value of these payments is subtracted from the taxpayer savings
In each of the three scenarios, we ask you to indicate the system that
you would prefer to see implemented, assuming that the features

x
reported are the best available estimates. Please think of your
selection as the expression of a "vote" or a "petition", for example, to
your congress representatives.
Please consider carefully all of the characteristics of each system when
making your choice, and answer as truthfully as possible.
Each respondent observed three triplets (and choice opportunities), randomly selected with no
repetitions within respondent.
The 5% of respondents who received the “no efficiency” triplet that we described above saw that triplet
as the first choice opportunity, and then received two more triplets that included efficiency information.

xi
5. Attention check and question on willingness to choose a paid‐donor system
To assess whether respondents were paying attention while completing the survey, we included the
following question:
The respondents could select one, two or three of the options above, and we compared their answer to
this question with their actual choices.
We included a further question, reported below, to gauge additional information to that implied by their
choices. We were interested in whether the respondents would have been willing to choose a certain
system (A, B or C) if its efficiency had been sufficiently high, or whether they would have never chosen a
certain system, irrespective of how many organs it could procure.

xii
6. Socio‐demographic information
We collected socio‐demographic information through the following questions (screenshots from the
Qualtrics survey)

xiii

xiv

xv

xvi
7. Moral issues and dilemmas
In this part of the survey, we presented the respondents with the following four questions:
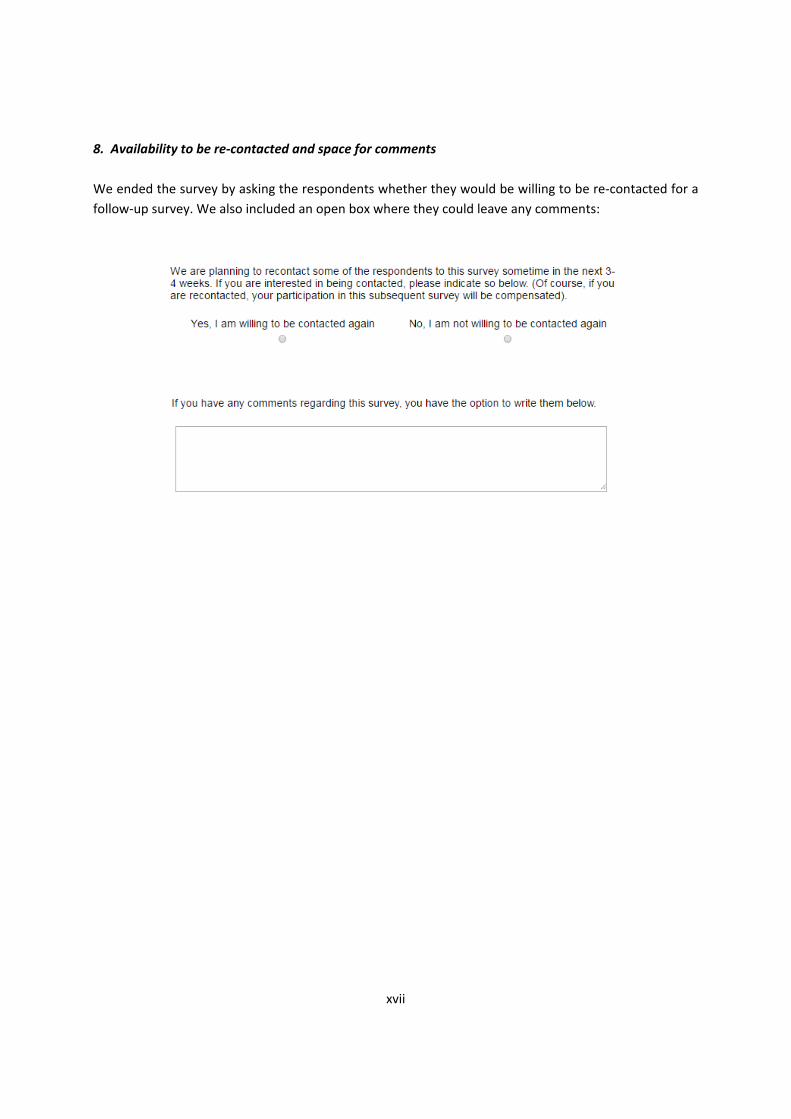
xvii
8. Availability to be re‐contacted and space for comments
We ended the survey by asking the respondents whether they would be willing to be re‐contacted for a
follow‐up survey. We also included an open box where they could leave any comments:

xviii
A2. SOURCES OF INFORMATION AND CALCULATIONS OF FINANCIAL BENEFITS FOR TAXPAYERS
Our source of data on the number of kidney transplants currently performed in the United States and
the breakdown by source (living or deceased, directed or undirected, etc.) was the Organ Procurement
and Transplantation Network (OPTN). We obtained the information in Table A2‐1 below was taken from:
https://optn.transplant.hrsa.gov/data/view‐data‐reports/national‐data/#.
Table A2‐1
We relied on Held et al. (2016) as a source of information on the annual demand for kidneys in the
United States, and for the estimated financial savings for taxpayers resulting from additional transplants
being performed. Held et al. estimate the annual “steady‐state” demand for kidneys to be about 35,000
kidneys per year (see section 9 of Held et al.’s Supporting Information, Supplement 1, page 6). As for the
estimated financial savings for the taxpayers, Held et al. compute that the present discounted value of
the financial savings to taxpayers resulting from each additional kidney transplant would be equal to
$146,000 (see Held et al.’s Supporting Information, Supplement 2, pages 13‐14). Below we report the
details of our calculations. Note that for System B we subtracted the amount of money paid to the
kidney donor ($20,000), because under this system that would be an extra cost to the taxpayers.
Table A2‐2
2015 2014 2013 2012 2011
N. of kidney transplants 17,878 17,108 16,896 16,487 16,816
% from Deceased Donor 68.5% 64.7% 62.4% 60.8% 61.8%
% from Living Donor 31.5% 32.4% 33.9% 34.1% 34.3%
2015 2014 2013 2012 2011
Total n. of kidney transplants
from living donors 5,628 5,538 5,733 5,619 5,773
% Directed (biological and non‐biological) 85.9% 86.3% 86.4% 87.3% 89.1%
% Paired donations 10.4% 10.4% 10.5% 9.8% 8.2%
% Undirected (anonymous donor) 3.7% 3.3% 3.1% 2.9% 2.7%
N. of kidneys
procured
17,000 49% 146,000*17,000 2.48
21,500 61% 146,000*21,500 3.14
17,000 49% (146,000‐20,000)*17,000 2.14
21,500 61% (146,000‐20,000)*21,500 2.71
26,000 74% (146,000‐20,000)*26,000 3.28
30,500 87% (146000‐20,000)*30,500 3.84
35,000 100% (146,000‐20,000)*35,000 4.41
17,000 49% 146,000*17,000 2.48
21,500 61% 146,000*21,500 3.14
26,000 74% 146,000*26,000 3.8
30,500 87% 146,000*30,500 4.45
35,000 100% 146,000*35,000 5.11
System
% of
annual demand
F inancia l savings
for the taxpayers (bi l l i on $)
A
B
C

xix
B. ADDITIONAL TABLES AND FIGURES FROM THE EXPERIMENT
In this section we report the results from alternative specifications of the main explanatory variables of
interest, performed mainly to address concerns about the fact that the repugnance ratings are self‐
assessed rather than “objective” features of each kidney procurement and allocation regime.
Specifically, in one specification we standardized the ratings for each system across individuals (by
subtracting the individual mean and dividing by the standard deviation); this was done to account for
individual differences both in the levels of the ratings (e.g., the normalization will make ratings of 10, 15
and 20 by one person equal to ratings of 85, 90 and 95 by another person) and in their dispersion (e.g.,
ratings of 10, 15 and 20 will translate into different values as ratings of 7, 15 and 23 for the three
systems). In a second specification, we substituted the individual repugnance ratings for each system
with the sample averages by system across all participants. These average values can arguably be
considered as “exogenous” to a given individual.
Overall, the findings from these alternative models are very close to the main ones. Interestingly, the
conditional logit estimates with overall average repugnance ratings are very similar to the ones reported
in Table 2 of the main text when we controlled for system fixed effects (column 2) – note than when
using the overall averages, we cannot add system fixed effects to the regressors. The implied MRS in the
conditional logit estimates and the median estimated MRS in the random coefficient analyses are, again,
close to the estimates from the main analyses.
The tables below report the estimated marginal utilities and imply MRS from conditional logit models,
the estimated marginal utilities from latent class logit models with four classes, and the median
estimated MRS from random coefficient models. For comparison, in each table we also report the
corresponding estimates from our main specifications as described in the main text.
Table B1‐1: Conditional Logit estimates. Like the estimates reported in Table 2 of the main text, the
estimates in the table below are the average of 1,000 conditional logit regressions, where in each
repetition one choice opportunity is considered for each individual. Standard deviations of the averages
are in parentheses.
Original survey (N= 2918
respondents)
Overall average repugnance
ratings (N= 2918 respondents)
Standardized efficiency and
repugnance (N= 2896 respondents)
Efficiency 0.065 0.059 1.086
(0.002) (0.001) (.026)
Moral Repugnance ‐0.045 ‐0.047 ‐0.827
(0.001) (0.001) (0.021)
Implied MRS 0.692 0.797 0.762

xx
Table B1‐2: Latent class estimates
Table B1‐3: Random coefficient estimates
Class 1 Class 2 Class 3 Class 4 Class 1 Class 2 Class 3 Class 4 Class 1 Class 2 Class 3 Class 4
Efficiency 0.013 0.132 0.104 0.196 0.019 ‐0.083 0.094 0.262 0.418 0.206 1.968 4.09
(0.004) (0.055) (0.007) (0.022) (0.005) (.078) (0.003) (0.030) (0.113) (0.123) (0.099) (0.561)
Moral Repugnance ‐0.006 ‐2.185 ‐0.088 ‐0.046 0.06 ‐0.669 ‐0.108 ‐0.026 0.072 ‐0.875 ‐2.099 ‐0.735
(0.003) (0.647) (0.006) (0.006) (0.005) (0.120) (0.004) (0.006) (0.064) (.) (0.104) (0.140)
Mixing proportions 14.4% 10.3% 50.2% 25.1% 7.7% 7.8% 61.2% 23.2% 13.2% 14.6% 47.2% 24.3%
Original survey (N= 2918 respondents)Overall average repugnance ratings (N=
2918 respondents)
Standardized efficiency and repugnance
(N= 2896 respondents)
Original survey (N= 2918
respondents)
Overall average repugnance ratings
(N= 2918 respondents)
Standardized efficiency and repugnance
(N= 2896 respondents)
Median MRS 0.896 0.806 0.826

xxi
C. AUXILIARY EXPERIMENTS
C1. REPUGNANCE RATINGS OF VARIOUS ORGAN PROCUREMENT AND ALLOCATION POLICIES
We conducted this experiment in March 2016 with 300 respondents. The goal of this experiment was to
elicit morality evaluations regarding a variety of possible organ procurement and allocation policies. The
results of this pre‐test informed our choice of what systems to include in the main experiment.
Description:
In the first screen, we included the following introductory text:
Kidney transplantation is often the best treatment for patients with advanced and permanent kidney failure. Each year in the United States approximately 35,000 new patients require a kidney transplant, but only about 17,000 obtain one. Currently, about 100,000 patients are on the waiting list for a kidney transplant. In 2014, 17,107 kidney transplants were performed in the United States. 11,570 (68%) kidneys came from deceased donors, and 5,537 (32%) from live donors. There are three types of living kidney donation: direct donation, in which the donor generally knows the recipient and donates directly to them; paired exchange donation, where a donor donates their kidney to another recipient in exchange for a compatible kidney for their loved one; and undirected donation whereby the donor gives to a stranger ‐ which might initiate a chain of transplants. In 2014, 86.6% of live donations were from direct donors, 10% were from exchanges, and 3.4% from undirected donors. The current organ procurement system is based on unpaid donors. Several alternative organ procurement and allocation systems are currently being debated. In what follows we will focus on living undirected donations. In the next page you will read about ten possible systems to organize these donations; the systems differ in the way organs are procured and allocated to recipients, and in whether and how donors are remunerated. You will then be asked to express your opinion on several aspects of some of these systems. Please pay attention to the details of each system, and answer as carefully and truthfully as possible.

xxii
The second screen presented a description of the following ten organ procurement and allocation
systems:
Please recall that we are focusing on living undirected kidney donations.
Below, you will read about ten possible systems to organize these
donations. Please read the descriptions carefully. In the next module,
you will be asked to express your opinion on several aspects of some of
these systems.
In System A, unpaid donors can donate a kidney to a specific recipient or
to an anonymous candidate on the waiting list. Kidneys donated to
anonymous candidates are allocated by an agency (coordinated by the
U.S. Department of Health and Human Services) according to priority
rules based on patients' medical urgency, blood and tissue match with
the donor, time on the waiting list, age and distance to the donor.
In System B, kidney donors can receive $20,000 from a public agency.
Kidneys from paid donors are allocated by an agency (coordinated by the
U.S. Department of Health and Human Services) according to priority
rules based on patients' medical urgency, blood and tissue match with
the donor, time on the waiting list, age and distance to the donor.
Donors can decide not to be paid, and can also make directed unpaid
donations.
In System C, kidney donors can receive $20,000 directly from the kidney
recipient (e.g., out of pocket or through private health insurance). A
registry of patients in need of a kidney and of interested donors is kept
by an agency (coordinated by the U.S. Department of Health and Human
Services), but transactions occur directly between the paying recipient
and the donor. Donors can decide not to be paid, and can also make
directed unpaid donations.
In System D, kidney donors can receive $20,000 from a public agency, to
be deposited in a retirement fund. Kidneys from paid donors are
allocated by an agency (coordinated by the U.S. Department of Health
and Human Services) according to priority rules based on patients'
medical urgency, blood and tissue match with the donor, time on the
waiting list, age and distance to the donor. Donors can decide not to be
paid, and can also make directed unpaid donations.
In System E, kidney donors can receive $20,000 directly from the kidney
recipient (e.g., out of pocket or through private health insurance), to be

xxiii
deposited in a retirement fund. A registry of patients in need of a kidney
and of interested donors is kept by an agency (coordinated by the U.S.
Department of Health and Human Services), but transactions occur
directly between the paying recipient and the donor. Donors can decide
not to be paid, and can also make directed unpaid donations.
In System F, kidney donors can receive $20,000 from a public agency, to
be deposited in a college fund to be used by the donors or relatives of
the donor (e.g. their children). Kidneys from paid donors are allocated by
an agency (coordinated by the U.S. Department of Health and Human
Services) according to priority rules based on patients' medical urgency,
blood and tissue match with the donor, time on the waiting list, age and
distance to the donor. Donors can decide not to be paid, and can also
make directed unpaid donations.
In System G, kidney donors can receive $20,000 directly from the kidney
recipient (e.g., out of pocket or through private health insurance), to be
deposited in a college fund to be used by the donors or relatives of the
donor (e.g. their children). A registry of patients in need of a kidney and
of interested donors is kept by an agency (coordinated by the U.S.
Department of Health and Human Services), but transactions occur
directly between the paying recipient and the donor. Donors can decide
not to be paid, and can also make directed unpaid donations.
In System H, kidney donors are eligible to receive a “Heroes” medal from
the President of the United States. Kidneys are allocated by an agency
(coordinated by the U.S. Department of Health and Human Services)
according to priority rules based on patients' medical urgency, blood and
tissue match with the donor, time on the waiting list, age and distance to
the donor. Donors can decide not to accept the award, and can also
make directed unpaid donations (not eligible for the medal).
In System I, kidney donors receive priority in the wait list for a transplant,
should they need in a kidney for themselves in the future. Kidneys are
allocated by an agency (coordinated by the U.S. Department of Health
and Human Services) according to priority rules based on patients'
medical urgency, blood and tissue match with the donor, time on the
waiting list, age and distance to the donor. Donors can decide not to take
advantage of their priority status, and can also make directed unpaid
donations (not eligible for the priority status).

xxiv
In System J, paired exchanges are organized whereby an individual, who
cannot donate to a loved one because of incompatibility, donates their
kidney to another compatible recipient in exchange for a compatible
kidney from a friend or relative of the recipient to be given to their loved
one. Kidney exchanges are coordinated by United Network for Organ
Sharing (UNOS). Donors can also make directed unpaid donations.
The key features of these systems are summarized in the table below.
System Payment to donors Allocation
A No Payment to donors Priority rules
B $20,000 paid by a public agency Priority rules
C $20,000 paid by patient (e.g., out of pocket
or through private insurance)
Private
transactions
D $20,000 paid by a public agency, to be
deposited in a retirement fund Priority rules
E
$20,000 paid by patient (e.g., out of pocket
or through private insurance), to be
deposited in a retirement fund
Private
transactions
F $20,000 paid by a public agency, to be
deposited in a college fund Priority rules
G
$20,000 paid by patient (e.g., out of pocket
or through private insurance), to be
deposited in a college fund
Private
transactions
H
No payment. Donors are eligible to receive
a “Heroes” medal from the President of the
United States
Priority rules
I No payment. Donors receive priority in the
wait list for a transplant Priority rules
J No Payment to donors Paired
exchanges
Next, the survey randomly assigned the respondents to five of the above ten systems, and asked them
to rate each of them on the same six morality aspects as in the main experiment. Again, before eliciting
the morality evaluations, tables summarized the features of each system as a reminder.
Finally, we asked the respondents to predict the number of kidneys that each of the five systems would
produce. The following snapshot presents, as an example, the case of System A:

xxv
The survey can be accessed here: http://jhubusiness.qualtrics.com/jfe/form/SV_3C1zSe2ibuw5n4V
Results:
The modality of payment, in particular free cash vs. constrained and delayed payments (e.g. college funds or retirement funds) did not affect the morality ratings independently of the identity of the payer and allocation mechanism. In particular, system with payments coming from the kidney recipients and organized through private transactions (C, E, G) received the highest repugnance ratings; systems with payments by a public agency and priority allocation (B, D, F) received lower repugnance ratings, but higher than the unpaid system (A), systems with symbolic rewards (H and I) and paired kidney exchanges (J).
The average morality ratings for the three systems we included in the main experiment were very similar to the ones in the main experiment (overall and for each of the six morality features).
Respondents predicted on average that the systems that did not include (immediate or delayed) monetary payments would produce fewer kidneys. Moreover, they predicted that immediate cash payments would produce more kidneys than non‐cash, delayed payments.

xxvi
Figure C1‐1: Average repugnance ratings for ten kidney procurement and allocation systems. This
figure shows the average of the six morality features for each of the ten procurement and allocation
systems. Respondents could select values between 0 and 100. The number of ratings per system was
between 134 and 172.
12.5 13.6 14.8 13.0
23.1 21.2 20.3
37.635.1 35.0

xxvii
Figure C1‐2: Predicted annual kidney supply. This figure shows the average predicted supply of kidneys
(in thousands) for each procurement and allocation systems. The number of ratings per system was
between 134 and 172.
9.8 9.4 9.6 10.3
21.1
15.314.2
15.8
12.4 13.3
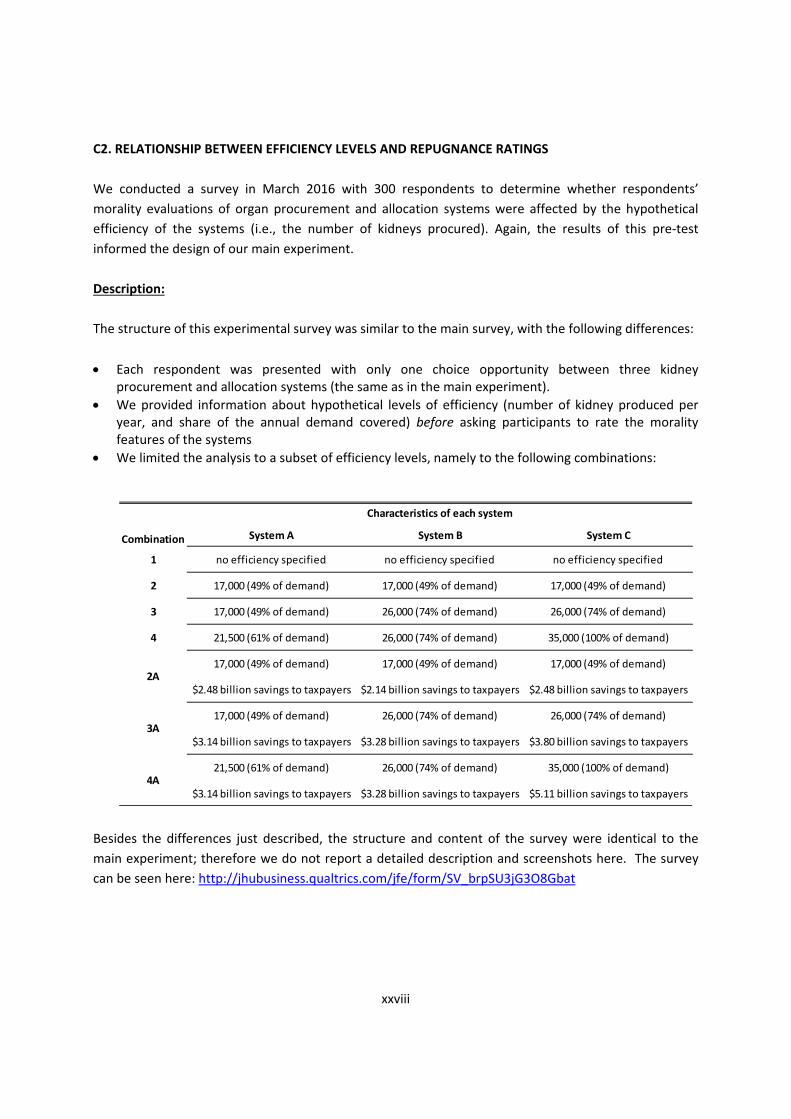
xxviii
C2. RELATIONSHIP BETWEEN EFFICIENCY LEVELS AND REPUGNANCE RATINGS
We conducted a survey in March 2016 with 300 respondents to determine whether respondents’
morality evaluations of organ procurement and allocation systems were affected by the hypothetical
efficiency of the systems (i.e., the number of kidneys procured). Again, the results of this pre‐test
informed the design of our main experiment.
Description:
The structure of this experimental survey was similar to the main survey, with the following differences:
Each respondent was presented with only one choice opportunity between three kidney procurement and allocation systems (the same as in the main experiment).
We provided information about hypothetical levels of efficiency (number of kidney produced per year, and share of the annual demand covered) before asking participants to rate the morality features of the systems
We limited the analysis to a subset of efficiency levels, namely to the following combinations:
Besides the differences just described, the structure and content of the survey were identical to the
main experiment; therefore we do not report a detailed description and screenshots here. The survey
can be seen here: http://jhubusiness.qualtrics.com/jfe/form/SV_brpSU3jG3O8Gbat
Combination System A System B System C
1 no efficiency specified no efficiency specified no efficiency specified
2 17,000 (49% of demand) 17,000 (49% of demand) 17,000 (49% of demand)
3 17,000 (49% of demand) 26,000 (74% of demand) 26,000 (74% of demand)
4 21,500 (61% of demand) 26,000 (74% of demand) 35,000 (100% of demand)
17,000 (49% of demand) 17,000 (49% of demand) 17,000 (49% of demand)
$2.48 billion savings to taxpayers $2.14 billion savings to taxpayers $2.48 billion savings to taxpayers
17,000 (49% of demand) 26,000 (74% of demand) 26,000 (74% of demand)
$3.14 billion savings to taxpayers $3.28 billion savings to taxpayers $3.80 billion savings to taxpayers
21,500 (61% of demand) 26,000 (74% of demand) 35,000 (100% of demand)
$3.14 billion savings to taxpayers $3.28 billion savings to taxpayers $5.11 billion savings to taxpayers
2A
3A
4A
Characteristics of each system

xxix
Results:
As shown in Figure C2‐1 below, within each system, the assumed level of efficiency had only a minimal
impact on the average repugnance ratings. Figure C2‐2 shows a plot of the residuals from a regression of
overall ratings of a system on system fixed effects, versus efficiency levels. The best linear fit is flat. The
r‐squared from regressing ratings on system dummies is 0.273; adding the efficiency levels to the
regressors, the R‐squared is 0.275.
Figure C2‐1. Average repugnance ratings by system and efficiency level. This figure shows the average
of the six morality features for each of the three procurement and allocation systems considered in the
survey, separate by level of assumed efficiency. Respondents could select values between 0 and 100
after having observed an efficiency level (randomly assigned) for each system. Efficiency is expressed in
thousands of kidneys supplied per year. “No efficiency” indicates that we did not provide efficiency
information (35 respondents were in that condition). The number of observations for each combination
of systems and efficiency levels is between 82 and 174. For about half of these respondents, we also
provided efficiency information in forms of taxpayer money saved. There was no significant difference in
ratings when adding this information.
12.3
23.9
47.6
16.7
22.4
45.4
13.7
24.0
47.644.9
Unpaid Publ. agency pay Private pay
No efficiency
17K
21.5K
26K
35K

xxx
Figure C2‐2: Residuals from regressing average repugnance on system effects, by efficiency level. This
figure reports the residuals from a linear regression of average repugnance ratings on binary indicators
for two of the three systems (unpaid system indicator omitted), plotted against different efficiency
levels expressed in thousands of kidney supplied per year. The value of zero indicates the cases where
we did not provide any efficiency information.
-100
-75
-50
-25
02
55
07
51
00R
esid
ual
s
0 17 21.5 26 35Efficiency

xxxi
C3. FOLLOW‐UP SURVEY
Of the 2,918 respondents to the original main survey, 2,817 (about 97%) agreed to be contacted again
within a few weeks. We contacted them on April 21 2016, three weeks after they took part in the
original experiment, and 1,636 of them (corresponding to 56% of the total, and to 58% of those who
agreed to be contacted again) participated. The main goal of the follow‐up survey was to assess the
stability of the responses and of our estimated parameters of interest.
Description:
The structure of the survey was for the most part the same as the original one, so we do not report all
the details and snapshots here. One additional goal of the follow‐up survey was to test whether the
respondents’ morality valuations were affected by including in the introductory text a sentence that
informed the respondents that some health organizations oppose payments to donors, whereas other
organizations are favorable. To this aim, we showed a random 50% of the respondents to the follow‐up
survey the following version of the introductory text (the additional paragraph is highlighted below for
illustrative purposes, but was not highlighted in the actual survey):
Kidney transplantation is often the best treatment for patients with advanced and permanent kidney failure. Each year in the United States approximately 35,000 new patients require a kidney transplant, but only about 17,000 obtain one. Currently, about 100,000 patients are on the waiting list for a kidney transplant. In 2014, 17,107 kidney transplants were performed in the United States. 11,570 (68%) kidneys came from deceased donors, and 5,537 (32%) from live donors. There are three types of living kidney donation: direct donation, in which the donor generally knows the recipient and donates directly to them; paired exchange donation, where a donor donates their kidney to another recipient in exchange for a compatible kidney for their loved one; and undirected donation whereby the donor gives to a stranger ‐ which might initiate a chain of transplants. In 2014, 86.6% of live donations were from direct donors, 10% were from exchanges, and 3.4% from undirected donors. The current organ procurement system is based on unpaid donors. Several alternative organ procurement and allocation systems are currently being debated. In particular, payments to organ donors have been proposed. Proponents of payments to organ donors argue that removing the current ban to compensation would increase the supply of kidneys, thereby reducing waiting times and deaths. Recently, the American

xxxii
Society of Transplantation and the American Medical Association expressed approval of testing incentives. However, many individuals (including transplant surgeons and bioethicists) as well as national and international health agencies (including the World Health Organization) are opposed to payments, mainly on moral grounds. In what follows we will focus on living undirected donations. You will read about three alternative systems to organize these donations, and you will be asked to express your opinion on several aspects of these systems. Please pay attention to the details of each system, and answer as carefully and truthfully as possible.
The link to the follow‐up survey is: http://jhubusiness.qualtrics.com/jfe/form/SV_aVmtTtnaKYZUcKh
Results:
Table C3‐1 below compares socio‐demographic characteristics of the full sample and the follow‐up
respondents, revealing that the two samples are very similar on all of the characteristics considered.
Table C3‐1: Demographic characteristics of the full sample and the follow‐up sample.
Next, we summarize the results of the follow‐up survey, and describe how they relate to the findings in
the original survey:
The distribution of repugnance ratings was nearly identical to the one in the initial survey. The correlation coefficient of average ratings at the individual level was 0.801.
The marginal utility estimates from a conditional logit model, computed as described in Section 4 of the paper, were 0.078 and ‐0.057 for efficiency and repugnance, respectively, with an implied
Main survey
full sample
Follow‐up
sample
Male 0.500 0.477
Age (years) 33.96 35.26
White (non‐hispanic) 0.775 0.795
Black 0.072 0.060
Hispanic 0.057 0.048
Other racial/ethnic group 0.097 0.097
Employed (full‐ or part‐time) 0.572 0.557
Unemployed 0.062 0.070
Married 0.379 0.396
Has college degree 0.529 0.556
N 2,918 1,636

xxxiii
estimated MRS of 0.731, compared with estimated marginal utilities of 0.065 and ‐0.045, and estimated MRS of 0.692 from the main survey.
Latent class logit estimates were, again, very similar to those in from the original survey.
The median estimated MRS from the random coefficient model was 0.936, compared to the median of 0.896 in the main experiment.
Inclusion of the additional paragraph described above had no effect on the respondents’ morality valuations of the three systems.
Tables C3‐2, C3‐3 and C3‐4 below report the estimated marginal utilities and implied MRS from
conditional logit models, the estimated marginal utilities from latent class logit models with four classes,
and the median estimated MRS from random coefficient models. For comparison, in each table we also
report the corresponding estimates from our main specifications as described in the main text.
Table C3‐2: Conditional Logit estimates. Like the estimates reported in Table 2 of the main text, the
estimates in the table below are the average of 1,000 conditional logit regressions, where in each
repetition one choice opportunity is considered for each individual. Standard deviations of the averages
are in parentheses.
Table C3‐3: Latent class estimates. These estimates were obtained as described in Section 4 of the
paper.
Original survey (N= 2918
respondents)
Survey re‐take (N=1636
respondents)
Efficiency 0.065 0.078
(0.002) (0.002)
Moral Repugnance ‐0.045 ‐0.057
(0.001) (0.002)
Implied MRS 0.692 0.731
Class 1 Class 2 Class 3 Class 4 Class 1 Class 2 Class 3 Class 4
Efficiency 0.013 0.132 0.104 0.196 0.021 0.059 0.122 0.264
(0.004) (0.055) (0.007) (0.022) (0.007) (0.025) (0.008) (0.042)
Moral Repugnance ‐0.006 ‐2.185 ‐0.088 ‐0.046 ‐0.009 ‐0.609 ‐0.108 ‐0.075
(0.003) (0.647) (0.006) (0.006) (0.005) (0.390) (0.011) (0.010)
Mixing proportions 14.4% 10.3% 50.2% 25.1% 9.7% 11.8% 51.0% 27.5%
Original survey (N= 2918 respondents) Survey re‐take (N=1636 respondents)

xxxiv
Table C3‐4: Random coefficient estimates. These estimates were obtained as described in Section 4 of
the paper.
Original survey (N= 2918
respondents)
Survey re‐take (N=1636
respondents)
Median MRS 0.896 0.936

xxxv
C4. FRESH APPLES MARKET SURVEY
Description
To appreciate the differences in the moral perception of a procurement system between a morally
controversial and a more neutral transaction, we compared our findings to those of a separate survey
where we gathered opinions on the morality of different ways to organize the production and
procurement of apples. We conducted this additional survey in June 2016 on a sample of 942
respondents. Both the language and basic structure of this survey were designed to mimic those from
our main experiment. All respondents received the same information and completed the same
questionnaire. Again, respondents were recruited on mTurk and the survey was in Qualtrics.
The first screen of the survey reported the text below describing the market for fresh apples in the
United States:
Please read the following text: Apples are one of the most widely grown tree fruits and the third most internationally traded fruit behind only bananas and grapes. Apples are commonly consumed not only because of their taste but also because of the important nutrients that they contain, including high levels of antioxidants, vitamins, and dietary fiber. Apples are used in many forms, with roughly two‐thirds of U.S. production consumed as fresh fruit. The remaining U.S. production is converted into processed apple products, such as juice, jellies, preserves, sauces, and pastry fillings. About 10,000 million pounds are produced nationally. In what follows we will focus on the fresh apples sector. The apple industry encompasses growers, packers, shippers, and processors. Apples destined for the fresh market are shipped from the orchard either to a packer or to a farmers’ market that supplies consumers directly. The majority of apples are sent to packers, who pack and then distribute the product to retailers and exporters. Consumers in the United States buy most of their apples through retailers such as grocery stores. Historically, packers and marketers sold most of their produce to retailers at public auctions in open markets. Although this practice still occurs, its importance has decreased because of dramatic price fluctuations and concerns regarding consistency of supply. Most sales are now made on the spot market. A buyer will call a packer or shipper and negotiate prices for specific grades and quantities. Growers are paid based on the average price that a packer receives for the specific grades and quantity of the fruit that the grower supplied. The produce arrives at the packing facility from the grower in large bins, and tracking labels

xxxvi
are used so that the source of the fruit, often down to the specific row in an orchard, can be tracked throughout the supply chain. This tracking technology is crucial for determining grower compensation. The current average retail price of apples is about $2 per pound. In what follows we will focus on the mechanisms of procurement and allocation of fresh apples from producers to intermediaries (packers and retails), and from the latter to the final consumers. You will read about three alternative systems to organize this market, and you will be asked to express your opinion on several aspects of these systems. Please pay attention to the details of each system, and answer as carefully and truthfully as possible.
The survey then showed the respondents three alternative systems of apples procurement and
allocation as follows:
Consider the following three systems of procurement and allocation of fresh
apples.
In System A, buying and selling apples is not allowed. The production of apples
can occur on a voluntary basis, and a government agency collects the donations
of apples by voluntary producers and allocates them to the population
according to priority rules based on health, nutrition needs and distance to the
consumer.
In System B, the sale of apples is allowed; a government agency buys all the
production at $2 per pound. Apples are then allocated to the population by the
agency according to priority rules based on health, nutrition needs and distance.
In System C, consumers buy apples directly from intermediaries (e.g., grocery
stores) or from the original producers at $2 per pound, and transactions occur
directly between consumers and producers or distributors.
The table below summarizes the main characteristics of each system.
System A System B System C
Payment to Producers of
Apples
No payment
to producers
$2 per pound
paid by a public
agency
$2 per pound
paid by consumers
Allocation of Apples to
Consumers Priority rules Priority rules
Private
transactions

xxxvii
In what follows, you will be asked to express your opinions on several aspects of each of these
systems.
Next, we asked the respondents to rate each of the three systems on the following six morality aspects:

xxxviii
The following screen included a question prompting the respondents to choose their preferred system;
we also asked the respondents to rate each system on a scale from 0 to 100:
Next, we asked the respondents to predict the quantity of apples that would be obtained under each of
the three systems:

xxxix
The survey also included the following moral dilemma, and a question on how much the respondent
agrees with its proposed solution:

xl
Finally, we asked the respondents to provide socio‐demographic information (including sex, gender, age,
education, relationship status, occupation, religion, and political attitudes).
The link to this follow‐up experiment is:
http://jhubusiness.qualtrics.com/jfe6/form/SV_0PMuRyx8bZxHpxX
Results
Respondents considered a system where buying and selling apples is prohibited, and producers can only
donate apples for free, as much more morally repugnant (across all of the repugnance features that we
defined) than systems where producers are paid; a system with a public agency buying the apples and
distributing for free is less repugnant that the “unpaid producer” system, but considerably more
repugnant that a “standard” market system. Details are in figure C4‐1 below.
Moreover, as shown in Figure C4‐2 below, 76.11% of respondents selected the “market” system as the
systems that they thought should be in place to organize the production and distribution of apples;
22.19% indicated the system with payments from a public agency as the preferred one, and 1.7% (16
individuals) indicated the system of voluntary, unpaid production. As a comparison, in our main
experiment about kidney procurement, 7.1% of respondents who indicated the system to be
implemented without observing efficiency levels selected the market system, 56.7% chose the system
with payments from a public agency, and 36.2% indicated the unpaid voluntary system.
Finally, respondents on average predicted that a system of voluntary, unpaid production of apples
would yield annually 4.984 billion pounds, whereas a system with public agency payments 10.919 billion
pounds and a market system 12.508 billion pounds.

xli
Figure C4‐1: Average repugnance ratings by feature and system. This figure shows the average ratings
on the six morality features for each of the three apples procurement and allocation systems.
Respondents could select values between 0 and 100.
79.5
68.4
52.8
83.6
57.3
70.868.7
32.3
46.348.5
34.235.9
46.6
40.7
13.7 14.716.6
12.0 11.914.7 13.9
Exploitative Coercive Unfair toconsumer
Unfair toproducer
Against humandignity
Against myvalues
Average
Repugnance feature
Unpaid
Publ. agency pay
Mkt system