efficiency targets for 2020 and towards the … · assessment of the progress made by member states...
TRANSCRIPT

EN EN
EUROPEAN COMMISSION
Brussels, 18.11.2015
SWD(2015) 245 final
PART 1/2
COMMISSION STAFF WORKING DOCUMENT
Accompanying the document
REPORT FROM THE COMMISSION TO THE EUROPEAN PARLIAMENT AND
THE COUNCIL
Assessment of the progress made by Member States towards the national energy
efficiency targets for 2020 and towards the implementation of the Energy Efficiency
Directive 2012/27/EU as required by Article 24 (3) of Energy Efficiency Directive
2012/27/EU
{COM(2015) 574 final}

2
TABLE OF CONTENTS
1. Introduction ..................................................................................................................................... 4
2. Current progress .............................................................................................................................. 4
3. National targets ............................................................................................................................... 7
4. Energy consumption trends .......................................................................................................... 11
4.1. Industry .................................................................................................................................. 14
4.2. Residential sector .................................................................................................................. 16
4.3. Service sector ........................................................................................................................ 18
4.4. Transport sector .................................................................................................................... 20
4.5. Generation sector .................................................................................................................. 23
5. Final energy savings in 2016 required by the Energy Services Directive 2006/32/EC .................. 27
6. Overview........................................................................................................................................ 29
Annex I – Indicative national energy efficiency targets 2020 ............................................................... 31
Annex II – Indicators of the Annual Reports ......................................................................................... 32
1. Austria ........................................................................................................................... 33
2. Belgium .......................................................................................................................... 35
3. Bulgaria .......................................................................................................................... 37
4. Czech Republic ............................................................................................................... 39
5. Croatia ........................................................................................................................... 41
6. Cyprus ............................................................................................................................ 43
7. Denmark ........................................................................................................................ 45
8. Estonia ........................................................................................................................... 47
9. Finland ........................................................................................................................... 49
10. France ........................................................................................................................ 51
11. Germany .................................................................................................................... 53
12. Greece ....................................................................................................................... 55
13. Hungary ..................................................................................................................... 57
14. Ireland ........................................................................................................................ 59
15. Italy ............................................................................................................................ 61
16. Latvia ......................................................................................................................... 63
17. Lithuania .................................................................................................................... 65
18. Luxembourg ............................................................................................................... 67
19. Malta ......................................................................................................................... 69
20. Netherlands ............................................................................................................... 71

3
21. Poland ........................................................................................................................ 73
22. Portugal ..................................................................................................................... 75
23. Romania ..................................................................................................................... 77
24. Slovakia ...................................................................................................................... 79
25. Slovenia ..................................................................................................................... 81
26. Spain .......................................................................................................................... 83
27. Sweden ...................................................................................................................... 85
28. UK .............................................................................................................................. 87
4
1. INTRODUCTION
Article 24(3) of Directive 2012/27/EU on Energy Efficiency (EED) requires the Commission
to evaluate the National Energy Efficiency Action Plans (NEEAPs) and Annual Reports of
Member States and to assess their progress towards the implementation of the Directive. The
Commission submitted its assessment in Report from the Commission to the European
Parliament and the Council COM(2015) 574.
Report COM(2015) 574 is based on a set of indicators and an assessment of the information
provided by Member States in their NEEAPs and Annual Reports. This staff working
document provides further information on the analysis which has been undertaken by the
Commission. The chosen indicators are described in detail in the following subchapters and
additional graphs of the main indicators provided in the Annual Reports can be found in
Annex II.
2. CURRENT PROGRESS
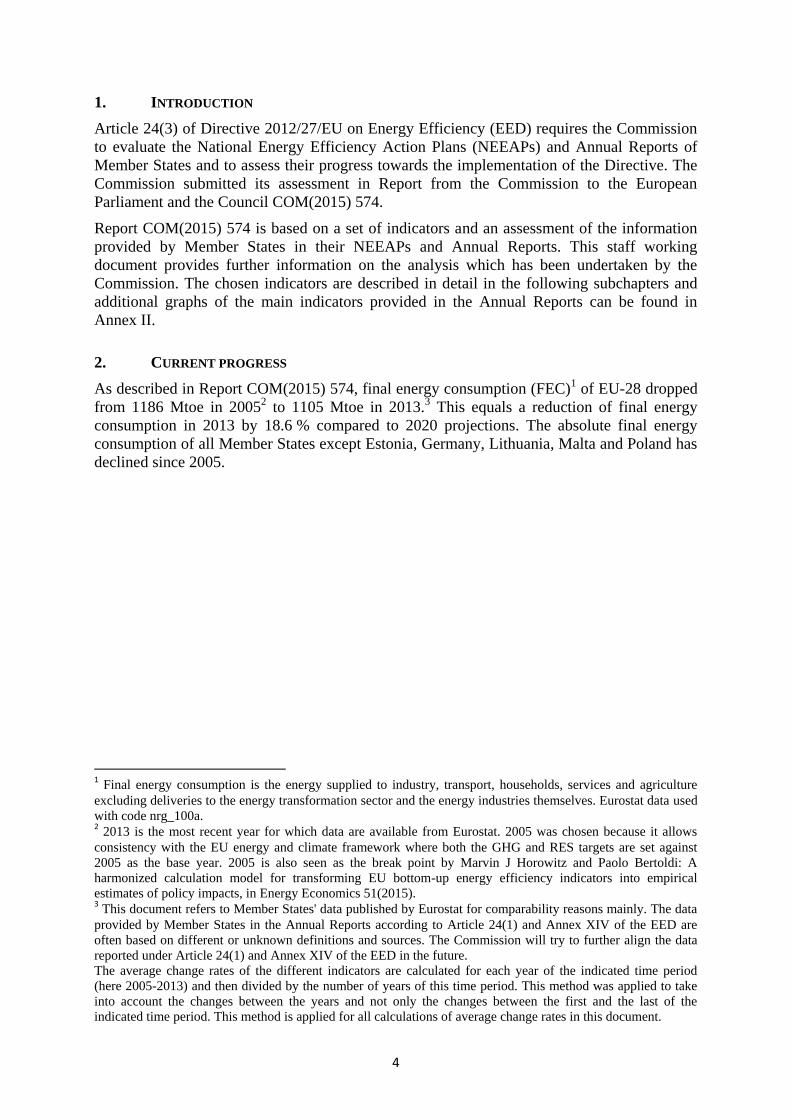
As described in Report COM(2015) 574, final energy consumption (FEC)1 of EU-28 dropped
from 1186 Mtoe in 20052 to 1105 Mtoe in 2013.
3 This equals a reduction of final energy
consumption in 2013 by 18.6 % compared to 2020 projections. The absolute final energy
consumption of all Member States except Estonia, Germany, Lithuania, Malta and Poland has
declined since 2005.
1 Final energy consumption is the energy supplied to industry, transport, households, services and agriculture
excluding deliveries to the energy transformation sector and the energy industries themselves. Eurostat data used
with code nrg_100a. 2 2013 is the most recent year for which data are available from Eurostat. 2005 was chosen because it allows
consistency with the EU energy and climate framework where both the GHG and RES targets are set against
2005 as the base year. 2005 is also seen as the break point by Marvin J Horowitz and Paolo Bertoldi: A
harmonized calculation model for transforming EU bottom-up energy efficiency indicators into empirical
estimates of policy impacts, in Energy Economics 51(2015). 3 This document refers to Member States' data published by Eurostat for comparability reasons mainly. The data
provided by Member States in the Annual Reports according to Article 24(1) and Annex XIV of the EED are
often based on different or unknown definitions and sources. The Commission will try to further align the data
reported under Article 24(1) and Annex XIV of the EED in the future.
The average change rates of the different indicators are calculated for each year of the indicated time period
(here 2005-2013) and then divided by the number of years of this time period. This method was applied to take
into account the changes between the years and not only the changes between the first and the last of the
indicated time period. This method is applied for all calculations of average change rates in this document.
5
Figure 1: Final energy consumption 2005 -2013
Source: Eurostat
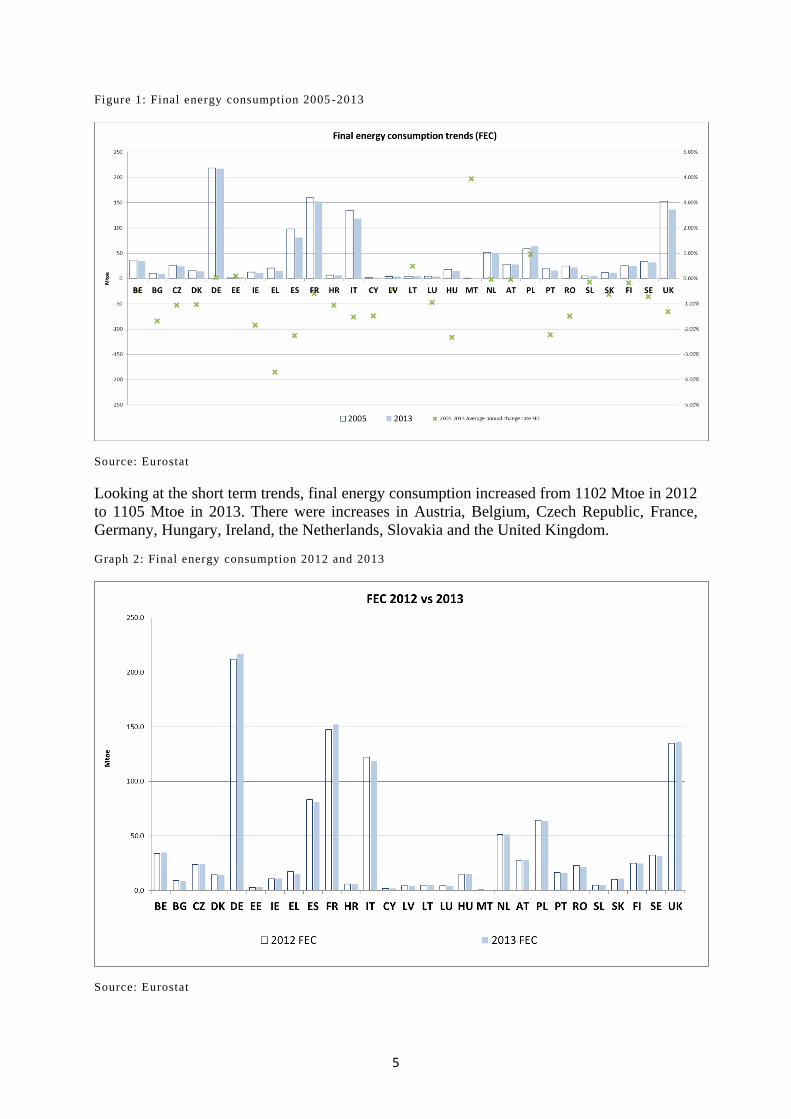
Looking at the short term trends, final energy consumption increased from 1102 Mtoe in 2012
to 1105 Mtoe in 2013. There were increases in Austria, Belgium, Czech Republic, France,
Germany, Hungary, Ireland, the Netherlands, Slovakia and the United Kingdom.
Graph 2: Final energy consumption 2012 and 2013
Source: Eurostat

6
Primary energy consumption (PEC)4 of EU-28 dropped from 1709 Mtoe in 2005 to 1567
Mtoe in 2013. This equals a reduction of primary energy consumption in 2013 by 15.5 %
compared to 2020 projections. The absolute primary energy consumption of all Member
States except Estonia and Poland has declined since 2005.
Figure 3: Primary energy consumption 2005 -2013
Source: Eurostat
When looking only at the short term trends from 2012 to 2013 which are provided in the
Annual Reports 2015 and are available on Eurostat, it can be seen that most Member States
lowered their primary energy consumption to close their gap towards the 2020 target.
However Belgium, Denmark, Germany, Estonia, France, Poland, Portugal and Slovakia
increased their primary energy consumption in 2013 compared to 2012.
4 Primary energy consumption is the gross inland consumption excluding non-energy uses. It includes
generation/ transformation losses, the consumption of the energy transformation sector and network losses
compared to final energy consumption. Eurostat data used with code nrg_100a.

7
Graph 4: Primary energy consumption 2012 and 2013
Source: Eurostat
3. NATIONAL TARGETS
Article 3 of the EED sets out the Union's energy consumption target for 2020 of not more
than 1483 Mtoe of primary energy consumption or not more than 1086 Mtoe of final energy
consumption. This equates to a 20 % saving compared to projections made in 2007.
In 2013, when national energy efficiency indicative targets for 2020 were set for the first time,
the Commission calculated that the sum of national targets set by Member States, in terms of
primary energy, corresponded to 16.4% of primary energy savings compared to projections.
In 2014, the Commission concluded in its Energy Efficiency Communication of July 2014
(COM(2014) 520 final) that the EU will achieve energy savings of around 18-19 % in 2020
taking into account the effects of the economic recession and other factors like the impacts of
e.g. Ecodesign which will further help to reduce energy consumption. It was highlighted that
the full implementation of the existing energy efficiency legislative framework and the
improvement of the financing conditions of energy efficiency investments are key to achieve
the 20 % energy efficiency target by 2020.
Several Member States have changed the level of ambition of their national targets as regards
primary and/or final energy consumption compared to their initial targets set in 2013.5
Austria, Bulgaria, Croatia, Cyprus, Greece, Hungary, Italy, Slovakia, and Spain have set more
ambitious targets for 2020 expressed in final energy consumption which will help the
European Union to achieve its 2020 target. Only Malta and Poland have notified less
ambitious targets compared to their initial targets.
5 The new targets were notified to the European Commission in the NEEAPs of 2014 or directly to the
Commission. An overview of the indicative targets can be found in Annex I.
8
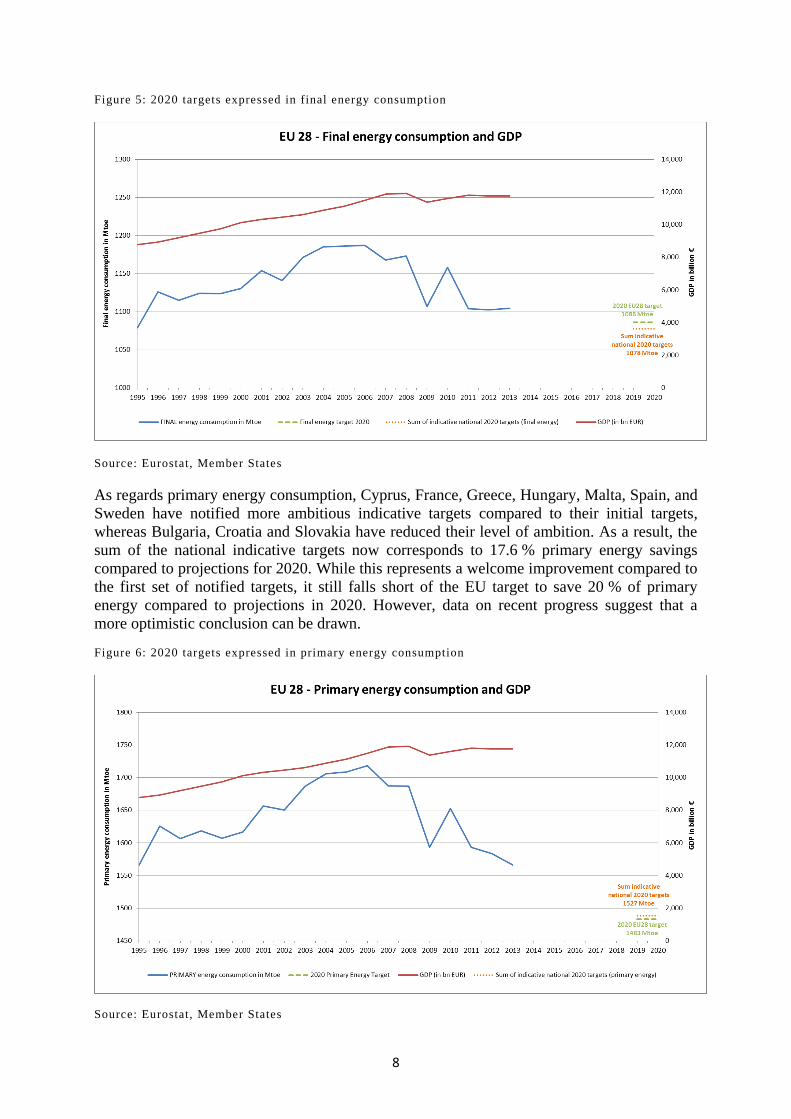
Figure 5: 2020 targets expressed in final energy consumption
Source: Eurostat, Member States
As regards primary energy consumption, Cyprus, France, Greece, Hungary, Malta, Spain, and
Sweden have notified more ambitious indicative targets compared to their initial targets,
whereas Bulgaria, Croatia and Slovakia have reduced their level of ambition. As a result, the
sum of the national indicative targets now corresponds to 17.6 % primary energy savings
compared to projections for 2020. While this represents a welcome improvement compared to
the first set of notified targets, it still falls short of the EU target to save 20 % of primary
energy compared to projections in 2020. However, data on recent progress suggest that a
more optimistic conclusion can be drawn.
Figure 6: 2020 targets expressed in primary energy consumption
Source: Eurostat, Member States

9
The scale of the challenge for the achievement of their 2020 target for individual Member
States can be measured by comparing the average annual change in energy consumption
between 2014 and 2020 which will be necessary to achieve the national indicative target with
the expected economic growth (for 2014-2016 from the ECFIN spring 2015 forecasts6 and for
2017-2020 from ECFIN 2015 medium term forecast). The objective of energy efficiency is to
decouple energy consumption from economic growth due to efficiency gains. Therefore,
energy consumption should not be proportionate to economic growth.
Austria, Belgium, France, Germany, Malta, Netherlands, Sweden and the United Kingdom
have set themselves ambitious targets with regard to their GDP forecast for 2014-2020.
However, Croatia, Finland, Greece and Romania have set indicative primary energy
consumption targets for 2020 which would allow them to increase their primary energy
consumption in the next years considerably, even more rapidly than the expected average
GDP growth in 2014-2020.
Figure 7: Average annual regi stered and forecasted GDP 2014-2020 vs average annual PEC reductions
2014-2020 necessary to reach national indicative PEC targets in %.
Source: Eurostat, ECFIN, notifications of Member States 7
Using the expected primary energy consumption and GDP in 20208 to calculate the energy
intensity of the whole economy shows that Croatia would increase its energy intensity to 312
ktoe/M€ in 2020 compared to 205 ktoe/M€, which was the level in 2013. Accordingly, the
2020 energy intensity would be higher than the maximum historical energy intensities in the
period 2005-2013 (228 ktoe/M€ in 2005). For all other Member States, the estimated energy
intensity in 2020 is within the range of historical energy intensities from 2005-2013 or even
lower.
6 European Commission, European Economic Forecast Spring 2015
http://ec.europa.eu/economy_finance/publications/european_economy/2015/pdf/ee2_en.pdf. 7 The average annual change PEC from 2014 to 2020 to achieve the 2020 PEC target is 0% for the Czech
Republic, Denmark, Estonia. Therefore, no column appears for these Member States in the graph. 8 Based on the ECFIN 2015 medium term forecast.

10
The situation is similar when looking at the level of ambition of the indicative 2020 targets
expressed in terms of final energy consumption compared to GDP forecasts for 2014 to 2020.
the level of the indicative targets set by Croatia, Cyprus, Finland, Greece, Italy, Portugal and
Romania are not ambitious enough as final energy consumption is projected to be higher than
the forecast GDP development from 2014 to 2020.
Figure 8: Average annual registered and forecast GDP 2014 -2020 vs average annual FEC reductions
2014-2020 necessary to reach national indicative FEC targets in %.
Source: Eurostat, ECFIN, notifications of Member States
Figure 9 shows the average annual change in primary and final energy consumption which
Member States need to realise from 2013 until 2020 to achieve their indicative national
targets in 2020. The required efforts depend on the ambition level of each Member State and
the progress achieved already. For some Member States the required efforts to achieve the
2020 target expressed in primary energy consumption might differ from the effort needed to
achieve the 2020 target expressed in final energy consumption as Member States have set
different ambition levels for the two. Whereas some concentrate on the decrease of primary
energy consumption (e.g. through an increase of efficiency in their generation sector or the
decrease of network losses) other Member States focus mainly on the final energy sector.
Data show that Austria, Belgium, Germany, France, Sweden and the United Kingdom would
need to further decrease their current energy consumption expressed in primary and final
energy consumption to achieve their indicative national targets. Malta and the Netherlands
would need to further reduce their primary energy consumption; Bulgaria, Estonia, Lithuania,
Slovakia and Spain would need to focus on final energy reductions in particular.
Even if the other Member States might have already achieved a level of energy consumption
which equals or is below their indicative national 2020 targets, they would need to make an
effort to keep this level or to further decrease it. In particular, if GDP is projected to grow in

11
the next years, weather conditions change or other factors change, holding consumption more
or less constant is challenging if a Member States does not implement strong energy
efficiency measures. It needs to be highlighted that figure 9 gives just an indication on the
pace of energy consumption reduction which is needed in the next years to achieve Member
States' indicative 2020 targets (allowed increase in energy consumption for Member States
which have set indicative 2020 higher than their 2013 energy consumption levels). Figure 9
does not take into account possible future changes in economic growth, change in weather
conditions or other factors influencing the future energy consumption.
Figure 9: Necessary annual PEC and FEC reduction from 2013 to 2020 to reach the 2020 targets
Source: DG ENER calculations based on Eurostat and notifications of Member States
4. ENERGY CONSUMPTION TRENDS
As described in Report COM(2015) 574, the trend in energy consumption between a base
year (2005 in the case of this analysis) and the most recent year for which data are available
from Eurostat (2013) can be compared with the trend in energy consumption between that
base year and the year 2020 which would be necessary to reach the target. This comparison
can be used as one indicator to analyse the progress of Member States. As only 2013 data are
available, this comparison cannot take into account the impact of recently implemented
energy efficiency measures on meeting the new obligations under the EED, nor the impact of
some of the measures recently adopted under Ecodesign, energy labelling and the Energy
Performance of Buildings Directive (2010/31/EU). In addition, this comparison does not
make it possible to carry out a conclusive assessment of whether Member States are on track
to meet their indicative 2020 energy efficiency targets. This is because the future effects
(positive or negative) of changes in the economy (e.g. an increase/decrease of economic
activity or a shift from energy intensive industries to the service sector), changes in energy
prices, fuel switching or climate variations cannot be foreseen until 2020.
As shown in a report recently published by the European Environment Agency9 and in figure
10 below, the majority of Member States decreased their primary and final energy
9 See European Environmental Agency (2015): Trends and projections in Europe 2015 (see
http://www.eea.europa.eu/publications).

12
consumption in the period 2005 to 2013 at a rate which was higher than the rate of decrease
which would be needed in the period 2005 to 2020 to meet their primary and final energy
consumption targets in 2020. The exceptions are Belgium, Estonia, France, Germany, the
Netherlands, Poland and Sweden (for primary energy consumption) and Austria, Belgium,
Estonia, France, Germany, Lithuania, Malta and Slovakia (for final energy consumption).
Figure 10: 2005-2013 PEC trend versus 2005-2020 trajectory to reach the 2020 PEC targets
Source: Eurostat
Figure 11: 2005-2013 FEC trend versus 2005-2020 trajectory to reach the 2020 FEC targets
Source: Eurostat
When describing efficiency trends it is meaningful to compare absolute trends with trends in
terms of economic output, not only because energy consumption and economic growth are
correlated, but also because a decoupling of these two indicators can be considered as a proxy
for increasing energy efficiency.
13
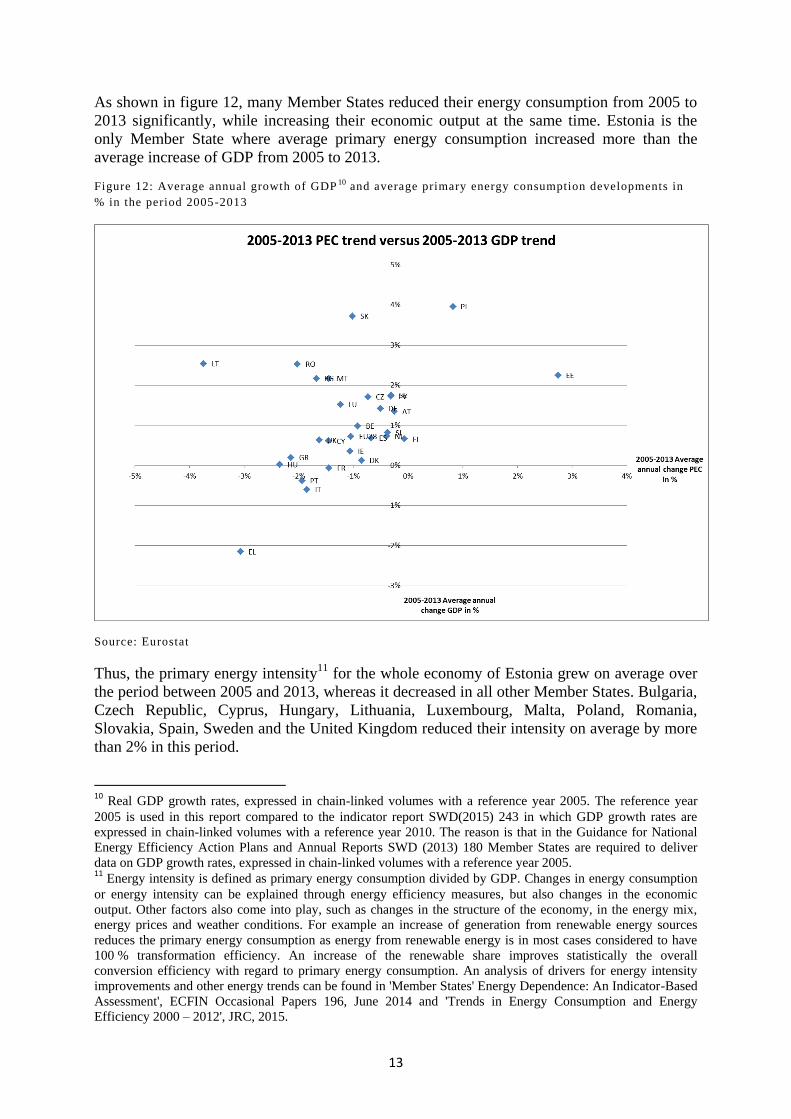
As shown in figure 12, many Member States reduced their energy consumption from 2005 to
2013 significantly, while increasing their economic output at the same time. Estonia is the
only Member State where average primary energy consumption increased more than the
average increase of GDP from 2005 to 2013.
Figure 12: Average annual growth of GDP 10 and average primary energy consumption developments in
% in the period 2005-2013
Source: Eurostat
Thus, the primary energy intensity11
for the whole economy of Estonia grew on average over
the period between 2005 and 2013, whereas it decreased in all other Member States. Bulgaria,
Czech Republic, Cyprus, Hungary, Lithuania, Luxembourg, Malta, Poland, Romania,
Slovakia, Spain, Sweden and the United Kingdom reduced their intensity on average by more
than 2% in this period.
10 Real GDP growth rates, expressed in chain-linked volumes with a reference year 2005. The reference year
2005 is used in this report compared to the indicator report SWD(2015) 243 in which GDP growth rates are
expressed in chain-linked volumes with a reference year 2010. The reason is that in the Guidance for National
Energy Efficiency Action Plans and Annual Reports SWD (2013) 180 Member States are required to deliver
data on GDP growth rates, expressed in chain-linked volumes with a reference year 2005. 11 Energy intensity is defined as primary energy consumption divided by GDP. Changes in energy consumption
or energy intensity can be explained through energy efficiency measures, but also changes in the economic
output. Other factors also come into play, such as changes in the structure of the economy, in the energy mix,
energy prices and weather conditions. For example an increase of generation from renewable energy sources
reduces the primary energy consumption as energy from renewable energy is in most cases considered to have
100 % transformation efficiency. An increase of the renewable share improves statistically the overall
conversion efficiency with regard to primary energy consumption. An analysis of drivers for energy intensity
improvements and other energy trends can be found in 'Member States' Energy Dependence: An Indicator-Based
Assessment', ECFIN Occasional Papers 196, June 2014 and 'Trends in Energy Consumption and Energy
Efficiency 2000 – 2012', JRC, 2015.

14
Figure 13: 2005-2013 Average change rate of PEC energy intensity in %
Source: Eurostat
4.1. Industry
Final energy consumption of industry decreased in absolute terms from 327 Mtoe in 2005 to
277 Mtoe in 2013 (15%). All Member States reduced their levels compared to 2005, except
Austria, Germany, Hungary and Latvia.
Figure 14: Industry sector, final energy consumption 2005 vs 2013
Source: Eurostat
In the short term, final energy consumption of industry increased from 2012 to 2013 in
Austria, Belgium, Bulgaria, Cyprus, Estonia, France, Germany, Hungry, Poland, Spain and
the United Kingdom. In their Annual Reports, Estonia and Poland indicated that this was due
to changes in economic activity.
15
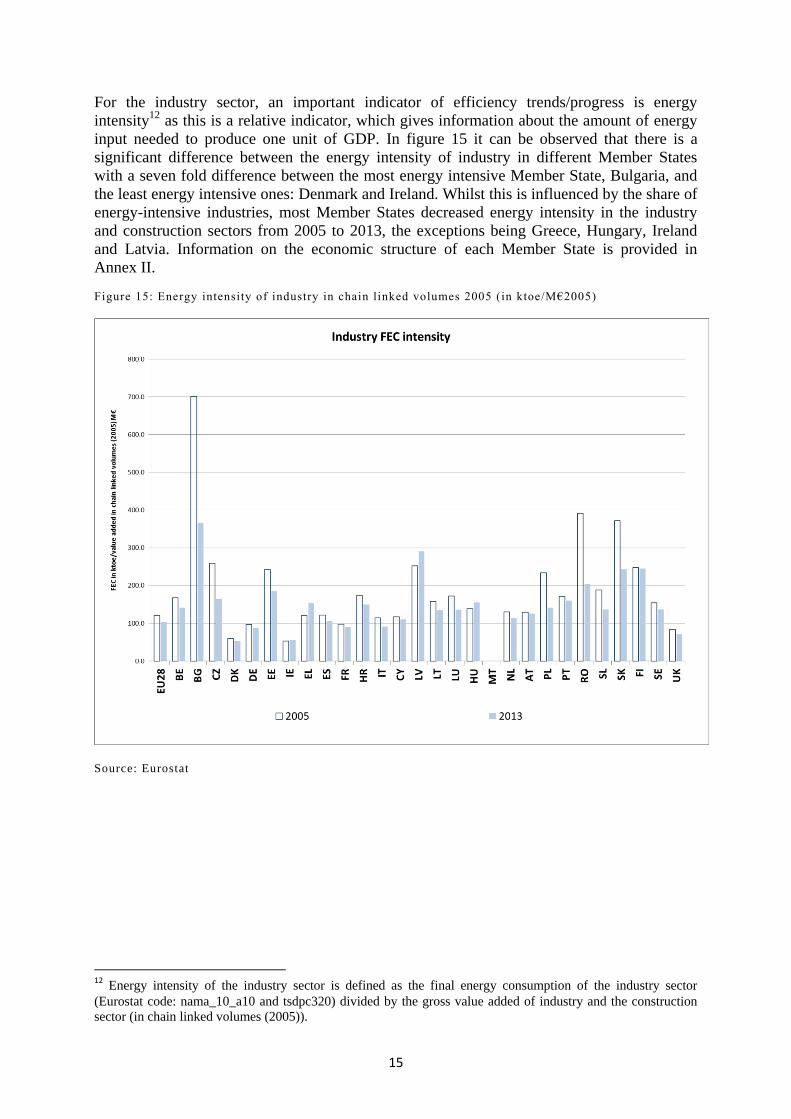
For the industry sector, an important indicator of efficiency trends/progress is energy
intensity12
as this is a relative indicator, which gives information about the amount of energy
input needed to produce one unit of GDP. In figure 15 it can be observed that there is a
significant difference between the energy intensity of industry in different Member States
with a seven fold difference between the most energy intensive Member State, Bulgaria, and
the least energy intensive ones: Denmark and Ireland. Whilst this is influenced by the share of
energy-intensive industries, most Member States decreased energy intensity in the industry
and construction sectors from 2005 to 2013, the exceptions being Greece, Hungary, Ireland
and Latvia. Information on the economic structure of each Member State is provided in
Annex II.
Figure 15: Energy intensity of industry in chain linked volumes 2005 (in ktoe/M€2005)
Source: Eurostat
12 Energy intensity of the industry sector is defined as the final energy consumption of the industry sector
(Eurostat code: nama_10_a10 and tsdpc320) divided by the gross value added of industry and the construction
sector (in chain linked volumes (2005)).
16
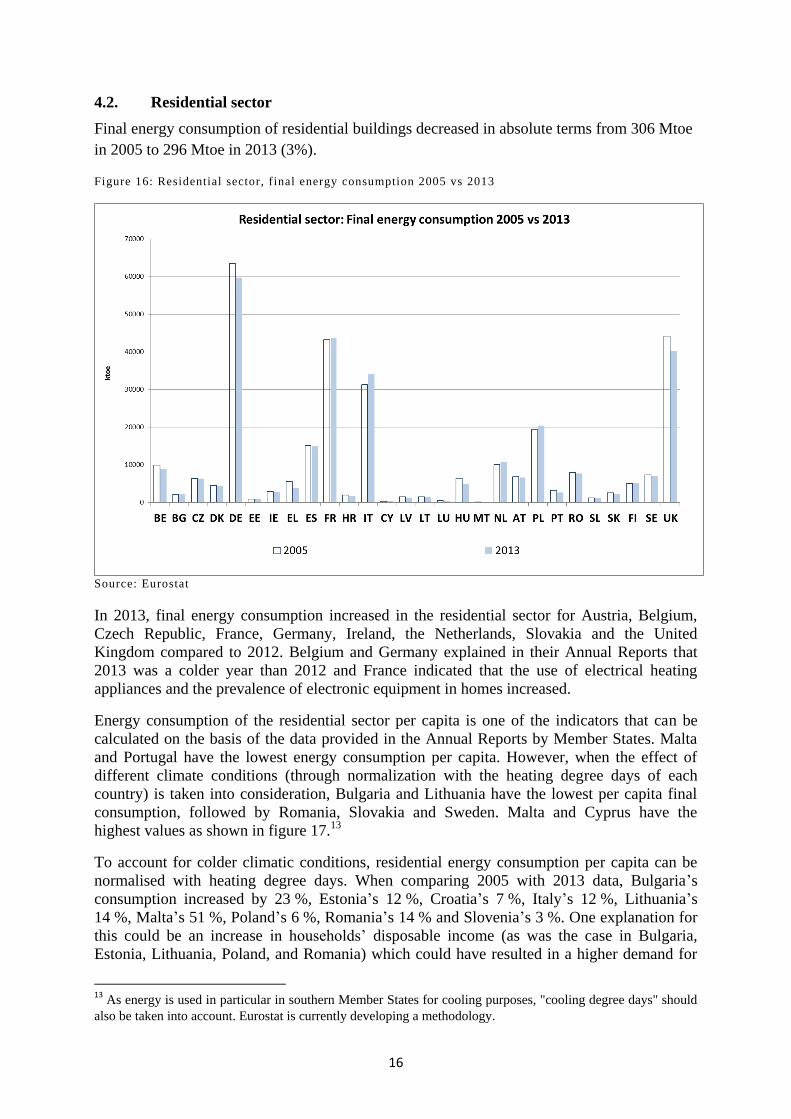
4.2. Residential sector
Final energy consumption of residential buildings decreased in absolute terms from 306 Mtoe
in 2005 to 296 Mtoe in 2013 (3%).
Figure 16: Residential sector, final energy consumption 2005 vs 2013
Source: Eurostat
In 2013, final energy consumption increased in the residential sector for Austria, Belgium,
Czech Republic, France, Germany, Ireland, the Netherlands, Slovakia and the United
Kingdom compared to 2012. Belgium and Germany explained in their Annual Reports that
2013 was a colder year than 2012 and France indicated that the use of electrical heating
appliances and the prevalence of electronic equipment in homes increased.
Energy consumption of the residential sector per capita is one of the indicators that can be
calculated on the basis of the data provided in the Annual Reports by Member States. Malta
and Portugal have the lowest energy consumption per capita. However, when the effect of
different climate conditions (through normalization with the heating degree days of each
country) is taken into consideration, Bulgaria and Lithuania have the lowest per capita final
consumption, followed by Romania, Slovakia and Sweden. Malta and Cyprus have the
highest values as shown in figure 17.13
To account for colder climatic conditions, residential energy consumption per capita can be
normalised with heating degree days. When comparing 2005 with 2013 data, Bulgaria’s
consumption increased by 23 %, Estonia’s 12 %, Croatia’s 7 %, Italy’s 12 %, Lithuania’s
14 %, Malta’s 51 %, Poland’s 6 %, Romania’s 14 % and Slovenia’s 3 %. One explanation for
this could be an increase in households’ disposable income (as was the case in Bulgaria,
Estonia, Lithuania, Poland, and Romania) which could have resulted in a higher demand for
13 As energy is used in particular in southern Member States for cooling purposes, "cooling degree days" should
also be taken into account. Eurostat is currently developing a methodology.

17
thermal comfort, a higher number of domestic appliances, or larger dwellings. Figure 17
below shows how the indicator developed on average over the period.
Figure 17: Final energy consumption in the residential sector per capita (HDD normalized)
Source: Eurostat
This indicator does not fully reflect impacts of energy efficiency measures as energy
efficiency policies are often targeted to address household/dwelling and the relevant
inhabitants sharing the energy services in this dwelling. Therefore, another useful indicator is
final energy consumption per square metre. Eurostat does not collect this data but findings
from the Odyssee-Mure project14
can be taken into account. The data from Odyssee-Mure
show that between 2005 and 2013 energy consumption per square metre decreased in all
Member States except in Italy where it increased by 10%, and Estonia, where it was
constant.15
14 See for further details: http://www.odyssee-mure.eu/project.html. 15 See Odyssee-Mure database: http://www.indicators.odyssee-mure.eu/online-indicators.html. The increase in
Italy is due to a revision of the biomass consumption in recent years according to the Odyssee-Mure (2015):
Energy Efficiency Trends and Policies in Buildings.

18
Figure 18: Unit consumption per square meter with climatic corrections
Source: Odyssee-Mure
4.3. Service sector
The added value of the service sector increased by 11% from 2005 to 2013, whereas the final
energy consumption of this sector increased from 144 Mtoe in 2005 by 6% to 153 Mtoe in
2013.
Figure 19: Service sector, final energy consumption 2005 vs 2013
Source: Eurostat
19
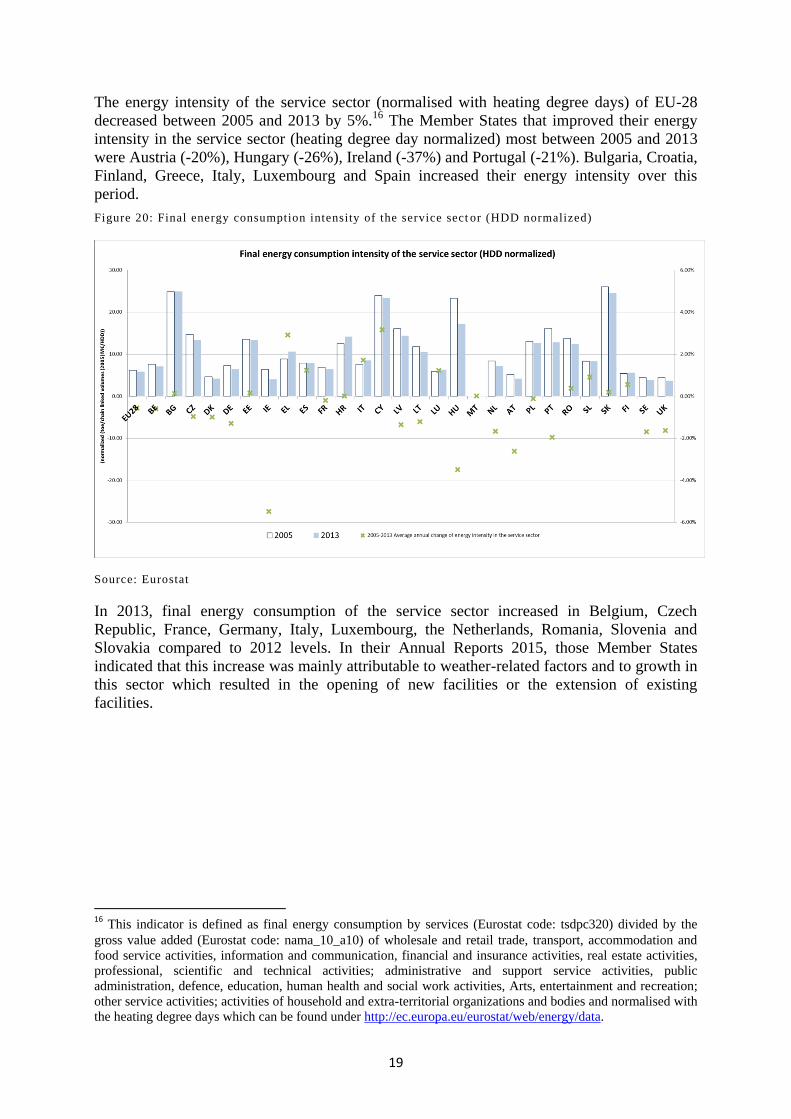
The energy intensity of the service sector (normalised with heating degree days) of EU-28
decreased between 2005 and 2013 by 5%.16
The Member States that improved their energy
intensity in the service sector (heating degree day normalized) most between 2005 and 2013
were Austria (-20%), Hungary (-26%), Ireland (-37%) and Portugal (-21%). Bulgaria, Croatia,
Finland, Greece, Italy, Luxembourg and Spain increased their energy intensity over this
period.
Figure 20: Final energy consumption intensity of the service sect or (HDD normalized)
Source: Eurostat
In 2013, final energy consumption of the service sector increased in Belgium, Czech
Republic, France, Germany, Italy, Luxembourg, the Netherlands, Romania, Slovenia and
Slovakia compared to 2012 levels. In their Annual Reports 2015, those Member States
indicated that this increase was mainly attributable to weather-related factors and to growth in
this sector which resulted in the opening of new facilities or the extension of existing
facilities.
16 This indicator is defined as final energy consumption by services (Eurostat code: tsdpc320) divided by the
gross value added (Eurostat code: nama_10_a10) of wholesale and retail trade, transport, accommodation and
food service activities, information and communication, financial and insurance activities, real estate activities,
professional, scientific and technical activities; administrative and support service activities, public
administration, defence, education, human health and social work activities, Arts, entertainment and recreation;
other service activities; activities of household and extra-territorial organizations and bodies and normalised with
the heating degree days which can be found under http://ec.europa.eu/eurostat/web/energy/data.
20
4.4. Transport sector
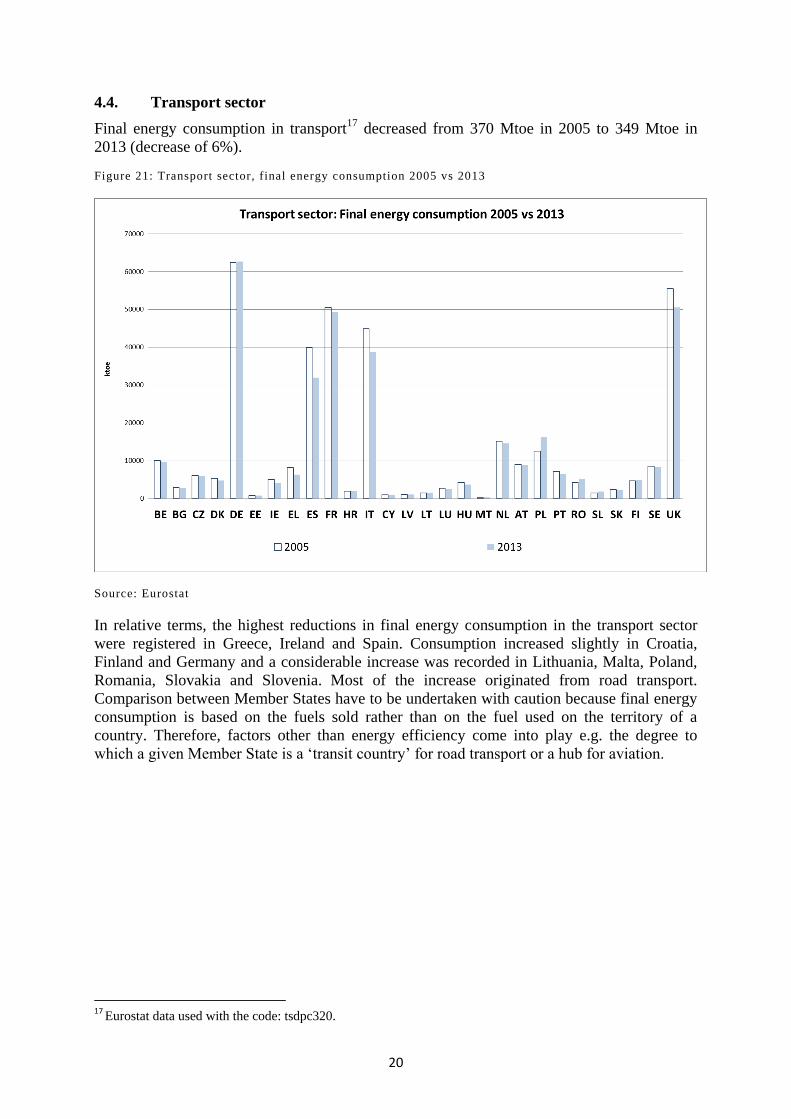
Final energy consumption in transport17
decreased from 370 Mtoe in 2005 to 349 Mtoe in
2013 (decrease of 6%).
Figure 21: Transport sector, final energy consumption 2005 vs 2013
Source: Eurostat
In relative terms, the highest reductions in final energy consumption in the transport sector
were registered in Greece, Ireland and Spain. Consumption increased slightly in Croatia,
Finland and Germany and a considerable increase was recorded in Lithuania, Malta, Poland,
Romania, Slovakia and Slovenia. Most of the increase originated from road transport.
Comparison between Member States have to be undertaken with caution because final energy
consumption is based on the fuels sold rather than on the fuel used on the territory of a
country. Therefore, factors other than energy efficiency come into play e.g. the degree to
which a given Member State is a ‘transit country’ for road transport or a hub for aviation.
17
Eurostat data used with the code: tsdpc320.

21
Figure 22: 2005-2013 Average annual change of FEC transport in %
Source: Eurostat
To provide an in-depth analysis of the evolution of energy efficiency in transport, it would be
appropriate to strip out the effects of economic growth and to look at physical indicators
(energy used per tonne of goods transported for freight; energy used per kilometre travelled
by passengers in the case of passenger transport). Currently, Member States do not provide
Eurostat with the split of final energy consumption by passenger and freight transport and the
traffic activity expressed in passenger-kilometres and tonne-kilometres cannot therefore be
aggregated. Therefore, official statistics are not available at this stage for providing
meaningful energy intensity indicators for the transport sector but data availability will be
further explored in the future. For those Member States that have notified the relevant data to
Eurostat, the trends of total final energy consumption compared to passenger-kilometres and
tonne-kilometres are shown for Member States in Annex II.
Eurostat provides the percentage of public transport (trains, motor coaches, buses and trolley
buses).18
Between 2005 and 2013 the share of public transport increased in Austria, Belgium,
Croatia, Czech Republic, Finland, Greece, Hungary, Luxembourg, the Netherlands, the
United Kingdom, Portugal, Slovenia, Spain and Sweden. In the remaining Member States the
share of passenger cars increased (no data were available for Cyprus and Malta).
18
The indicator is defined as the share of trains, motor coaches, buses and trolley buses (Eurostat code:
tran_hv_psmod).

22
Figure 23: Share of trains, motor coaches, buses and trolley buses for passenger transport (passenger -
km) 2005 vs. 2013 in %
Source: Eurostat
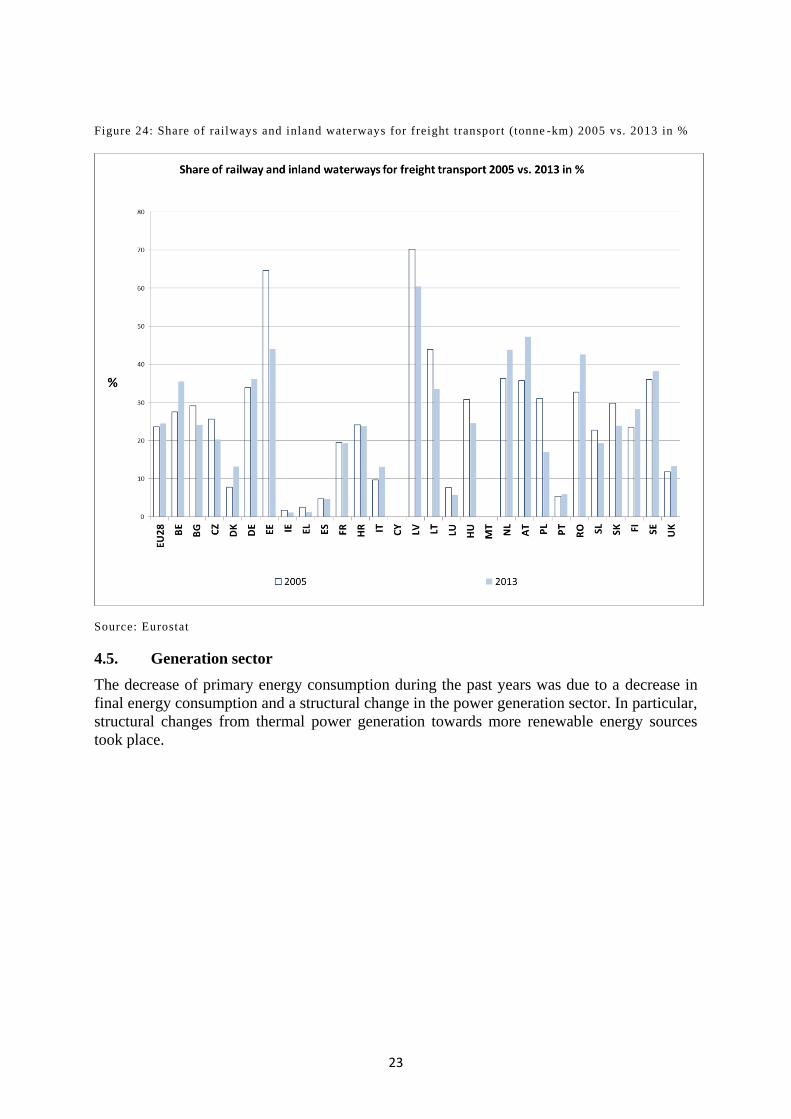
Eurostat also provides the percentage of railway and inland waterways for freight transport.19
Austria, Belgium, Denmark, Finland, Germany, Italy, the Netherlands, Portugal, Romania,
Sweden and the United Kingdom increased their shares in 2013 compared to 2005 levels.
19
The indicator is defined as the share of railways and inland waterways for freight transport (Eurostat code:
tran_hv_frmod).
23
Figure 24: Share of railways and inland waterways for freight transport (tonne -km) 2005 vs. 2013 in %
Source: Eurostat
4.5. Generation sector
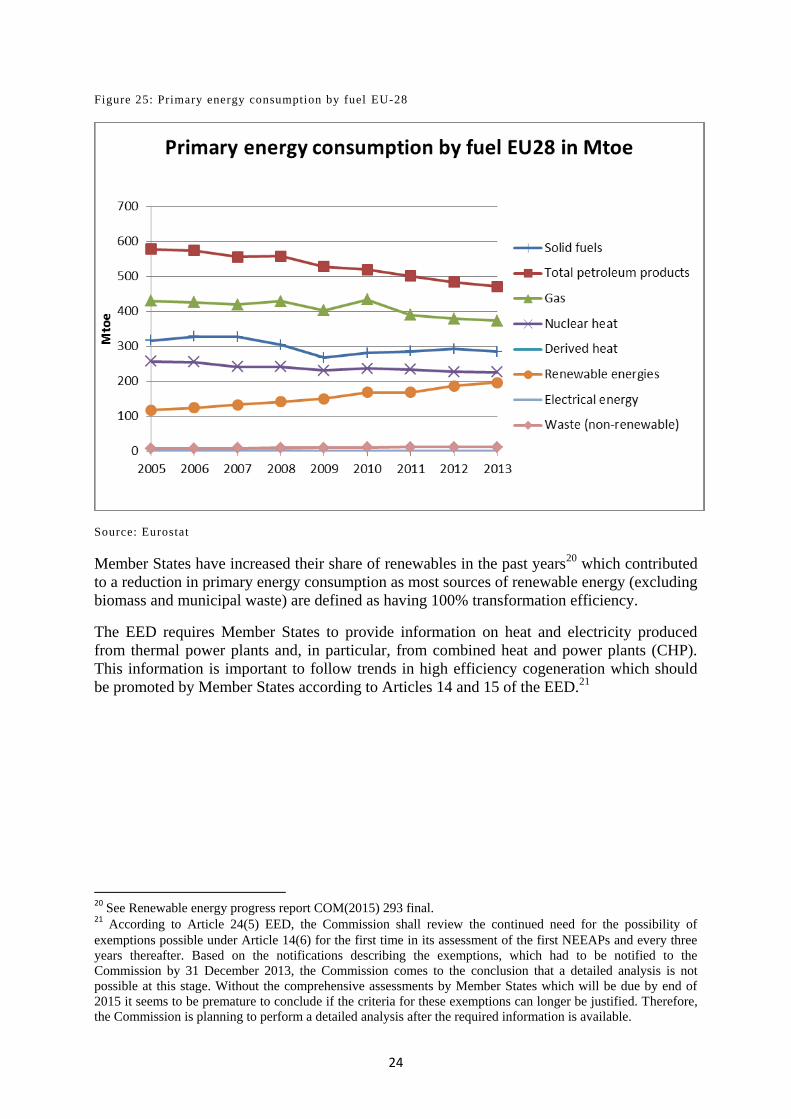
The decrease of primary energy consumption during the past years was due to a decrease in
final energy consumption and a structural change in the power generation sector. In particular,
structural changes from thermal power generation towards more renewable energy sources
took place.
24
Figure 25: Primary energy consumption by fuel EU-28
Source: Eurostat
Member States have increased their share of renewables in the past years20
which contributed
to a reduction in primary energy consumption as most sources of renewable energy (excluding
biomass and municipal waste) are defined as having 100% transformation efficiency.
The EED requires Member States to provide information on heat and electricity produced
from thermal power plants and, in particular, from combined heat and power plants (CHP).
This information is important to follow trends in high efficiency cogeneration which should
be promoted by Member States according to Articles 14 and 15 of the EED.21
20 See Renewable energy progress report COM(2015) 293 final. 21 According to Article 24(5) EED, the Commission shall review the continued need for the possibility of
exemptions possible under Article 14(6) for the first time in its assessment of the first NEEAPs and every three
years thereafter. Based on the notifications describing the exemptions, which had to be notified to the
Commission by 31 December 2013, the Commission comes to the conclusion that a detailed analysis is not
possible at this stage. Without the comprehensive assessments by Member States which will be due by end of
2015 it seems to be premature to conclude if the criteria for these exemptions can longer be justified. Therefore,
the Commission is planning to perform a detailed analysis after the required information is available.

25
Figure 26: Heat generation from CHP
Source: Eurostat
Figure 26 shows the heat produced from CHP plants for Member States in 2005 compared to
2013. The heat produced from CHP plants decreased from 46 Mtoe in 2005 by 9% to 42 Mtoe
in 2013.22
More detailed information – in particular on the basis of CHP units - is expected from the data
collection under Article 24(6) of the EED and from the forthcoming Heating & Cooling
strategy which the Commission intends to put forward in early 2016.
The EED also sets the framework to trigger investments in efficient district heating and
cooling. A positive trend can be observed in nine Member States where the transformation
output from district heating plants increased on average between 2005 and 2013.
Nevertheless, in the remaining twelve Member States having district heating a decreasing
trend can be observed.23
Therefore, to fully exploit the energy-efficiency potential in the
generation sector, the full implementation of Article 14 and the comprehensive assessments
22 This indicator is defined as the sum of gross heat production from 1) Main activity CHP plants – Nuclear; 2)
Autoproducer CHP plants – Nuclear; 3) Main activity CHP plants – Geothermal; 4) Autoproducer CHP plants –
Geothermal; 5) Main activity CHP plants – Solar; 6) Autoproducer CHP plants – Solar; 7) Main activity CHP
plants - Combustible Fuels; 8) Autoproducer CHP plants - Combustible Fuels; 9) Main activity CHP plants -
Heat Pumps; 10) Autoproducer CHP plants - Heat Pumps; 11) Main activity CHP plants - Electric Boilers; 12)
Autoproducer CHP plants - Electric Boilers; 13) Autoproducer CHP plants - Electric Boilers; 14) Main activity
CHP plants - Other Sources; 15) Autoproducer CHP plants - Other Sources (Eurostat code: nrg_106a). 23 Eurostat data 'Transformation output - District Heating Plants' used from complete energy balances - annual
data (Eurostat code: nrg_110a). No data is available for Cyprus, Greece, Ireland, Italy, Malta, Portugal and
Spain.

26
Member States are required to undertake by end 2015 (analysing their potential for applying
high-efficiency cogeneration and efficient district heating and cooling) are of major
importance.
Figure 27: Transformation output - District Heating Plants
Source: Eurostat
Due to the use of energy from renewable sources and other measures, the efficiency of
electricity production in the EU increased from 43.6 % in 2005 to 46.4 % in 2013.24
The ratio of transformation output of thermal power generation compared to fuel input
improved in Austria, Croatia, Cyprus, Belgium, Bulgaria, Denmark, Germany, Greece,
Ireland, Italy, Lithuania, Luxembourg, Malta, Portugal, Slovenia and Sweden in the period
2005-2013. However, in other Member States the ratio worsened as shown in figure 28.25
24 See the document 'η (eta) time series (1990-2013)' available under
http://ec.europa.eu/eurostat/c/portal/layout?p_l_id=4703568&p_v_l_s_g_id=0. 25 This indicator is defined as the transformation output from Conventional Thermal Power Stations, District
Heating Plants and Nuclear Power Stations (Eurostat codes: B_101101, B_101109, B_101102) divided by the
transformation input of the same type of beforehand mentioned plants (Eurostat code: nrg_100a).

27
Figure 28: Thermal power generat ion: Transformation output / fuel input for 2005 vs. 2013
Source: Eurostat
5. FINAL ENERGY SAVINGS IN 2016 REQUIRED BY THE ENERGY SERVICES DIRECTIVE
2006/32/EC
Directive 2006/32/EC required Member States to set – and aim to achieve – a national
indicative energy savings target of at least 9 % of final energy savings in 2016. Most of the
provisions in this Directive have been replaced by more precise provisions in the EED.
However, the requirements related to the 9 % target will not be repealed until 2017. So
Member States were required to provide information on their 2016 saving target in their 2014
NEEAPs: 19 Member States state that the required savings will be achieved by 2016; for 7
Member States it is not clear from the NEEAPs if the saving target will be achieved.26
26 The final NEEAPs of Hungary and Romania were notified in 2015 only. Therefore, a detailed analysis has not
yet taken place.

28
Table 1: Assessment of final energy savings for 2016
Source: JRC
Notes
Value Units Value Units
AT 80.40652 PJ 80.4 PJ 84.234 PJ Yes 104.8% 9.4%
BE 27516 GWh 38957 GWh Yes 141.6%
BG 7294 GWh/y 7291 GWh/y Unclear 0.0% The forecast savings for 2016 have not been provided
CY 165.8 ktoe 185 ktoe 238.908 ktoe Yes 129.1% 13.0%
The forecast savings provided are the sum of savings for the
measures taken in the period 2004-2013 (163 158 toe) and
estimated energy savings from the implementation of
additional measures (75 750 toe).
CZ 71.4297 PJ 19.7244 PJ Unclear
While the forecast savings are not provided, savings
calculated by means of the top-down method for the period
from 2008 to 2010 are estimated to be 27097 PJ, representing
137% of the 2016 target.
DE 833.49 PJ 2246 PJ Unclear 24.3%
DK 56.8 PJ 59.4 PJ57.6 (top down), 64.8
(bottom up)PJ Yes
97.0% (top down),
109.1% (bottom up)
The target is to be reached only if the forecast savings under
the bottom up method are considered
EE 9.9 PJ 9.9 PJ 12 PJ Yes 121.2% 10.9%
The target of 9.9 PJ was extracted from AR2013. Despite the
forecast savings of 12 PJ being higher than the target, the
introduction of the NEEAP 2014 states that "since the
forecast energy saving by 2016 is insufficient, Estonia will
have to implement additional energy efficiency measures to
ensure that the final energy consumption efficiency
objectives and the objectives specified in Directive
2006/32/EC on energy end-use efficiency and energy
services will be achieved."
EL 16.46 TWh 16.46 TWh 16.46 TWh Yes 100.0% 9.0%The forecast savings for 2016 seem to be exactly the same
with the target.
ES 6390 ktoe 10993 ktoe Yes 172.0%
FI 17.8 TWh 17.8 TWh 25.4 TWh Yes 142.7% 12.8%
FR 12 Mtep Unclear
The forecast savings for 2016 have not been provided.
Instead, the NEEAP provides the savings between 2007 and
2012 which are estimated at 9.039 Mtep (excluding the
tertiary sector) and states that it appears that France is
ahead of schedule with reference to the achievement of the
target set under the ESD directive
HR 19.77 PJ 19.77 PJ Yes 100.0%
The progress towards the target is estimated by using both
top-down and bottom-up methods and is the same (100%) -
see Tables 2-7 and 2-8
HU 15.95 TWh Unclear Translated NEEAP is missing
IE 13116.69 GWh 13117 GWh 14285 GWh Yes 108.9% 9.8%
IT 10.186 Mtoe 10.88 Mtoe/y 10.88 Mtoe/y Yes 100.0% 9.6%
The forecast savings (10.88 PJ) by 2016 seem to be the same
with the target. The savings achieved in 2015-2012 are 6.38
PJ.
LT 324.6786 ktoe 327 ktoe 340.67 ktoe Yes 104.2% 9.4%
LU 1581.894 GWh 1769 GWh/a 2814 GWh/a Yes 159.1% 16.0%
LV 3483 GWh 3483 GWh 3483 GWh Yes 100.0% 9.0%
The forecast savings for 2016 seem to be exactly the same
with the target. In terms of achieved savings, it is stated that
Latvia achieved 2069 GWh (7.4 PJ) energy savings by 2010. In
a different section of the document (page 15) it is, however,
stated that "the total cumulative energy savings obtained
during the 2008-2012 period, calculated with a top-down
method, are 1801 GWh". A clarification on these figures is
needed (i.e. energy savings in 2010 > 2012?).
MT 32.46 ktoe 32.84 ktoe Unclear
The target is not communicated in the NEEAP 2014. Intstead
the NEEAP states that Malta expects to reach 24% energy
efficiency by 2016
NL 51189.89 GWh 51190 GWh 57282 GWh Yes 111.9% 10.1%
PL 4.596 Mtoe 4.59 Mtoe 7.09 Mtoe Yes 154.5% 13.9%
PT 1651.23 ktoe 1501.305 ktoe Unclear
The forecast savings for 2016 have not been provided.The
only value regarding the achievement of the target is the
value of savings achieved by 2010 that is 729ktoe which
represents an achievement of 49% of the overall target.
RO 1875.636 ktoe Unclear Translated NEEAP is missing
SE 32.31 TWh 33.2 TWh 48.7 TWh Yes 146.7% 13.6%
SI 4261.392 GWh 4261 GWh 6872 GWh Yes 161.3% 14.5%
SK 40932.95 TJ Unclear
UK 136.566 TJ 136.5 161.6 TWh Yes 118.4% 10.6%
2016 ESD target expected to
be reached based on NEEAP
2014 estimates (i.e. forecast
savings/reference
consumption)
Target final energy savings for 2016
under ESD declared in NEEAP 2014
Forecast final energy savings for
2016 reported in NEEAP 2014
9% Calculation
("theoretical" target)
Is 2016 ESD target
expected to be met
(i.e. forecast
savings>target
savings)?
Extent to which target is
expected to be met or
missed (i.e. forecast
savings/target savings)
29
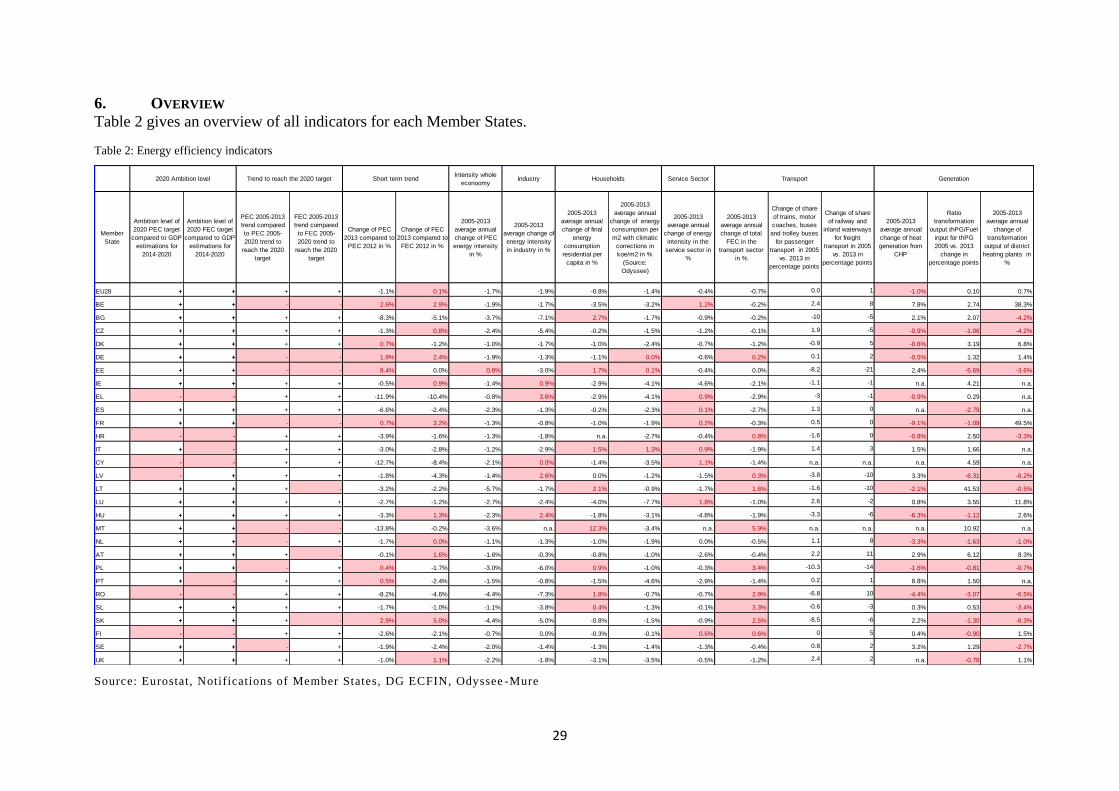
6. OVERVIEW
Table 2 gives an overview of all indicators for each Member States.
Table 2: Energy efficiency indicators
Source: Eurostat, Notifications of Member States, DG ECFIN, Odyssee -Mure
Intensity whole
econoomyIndustry Service Sector
Member
State
Ambition level of
2020 PEC target
compared to GDP
estimations for
2014-2020
Ambition level of
2020 FEC target
compared to GDP
estimations for
2014-2020
PEC 2005-2013
trend compared
to PEC 2005-
2020 trend to
reach the 2020
target
FEC 2005-2013
trend compared
to FEC 2005-
2020 trend to
reach the 2020
target
Change of PEC
2013 compared to
PEC 2012 in %
Change of FEC
2013 compared to
FEC 2012 in %
2005-2013
average annual
change of PEC
energy intensity
in %
2005-2013
average change of
energy intensity
in industry in %
2005-2013
average annual
change of final
energy
consumption
residential per
capita in %
2005-2013
average annual
change of energy
consumption per
m2 with climatic
corrections in
koe/m2 in %
(Source:
Odyssee)
2005-2013
average annual
change of energy
intensity in the
service sector in
%
2005-2013
average annual
change of total
FEC in the
transport sector
in %
Change of share
of trains, motor
coaches, buses
and trolley buses
for passenger
transport in 2005
vs. 2013 in
percentage points
Change of share
of railway and
inland waterways
for freight
transport in 2005
vs. 2013 in
percentage points
2005-2013
average annual
change of heat
generation from
CHP
Ratio
transformation
output thPG/Fuel
input for thPG
2005 vs. 2013
change in
percentage points
2005-2013
average annual
change of
transformation
output of district
heating plants in
%
EU28 + + + + -1.1% 0.1% -1.7% -1.9% -0.8% -1.4% -0.4% -0.7% 0.0 1 -1.0% 0.10 0.7%
BE + + - - 2.6% 2.9% -1.9% -1.7% -3.5% -3.2% 1.2% -0.2% 2.4 8 7.8% 2.74 38.3%
BG + + + + -8.3% -5.1% -3.7% -7.1% 2.7% -1.7% -0.9% -0.2% -10 -5 2.1% 2.07 -4.2%
CZ + + + + -1.3% 0.8% -2.4% -5.4% -0.2% -1.5% -1.2% -0.1% 1.9 -5 -0.9% -1.06 -4.2%
DK + + + + 0.7% -1.2% -1.0% -1.7% -1.0% -2.4% -0.7% -1.2% -0.9 5 -0.6% 3.19 6.8%
DE + + - - 1.9% 2.4% -1.9% -1.3% -1.1% 0.0% -0.6% 0.2% 0.1 2 -0.5% 1.32 1.4%
EE + + - - 8.4% 0.0% 0.8% -3.0% 1.7% 0.1% -0.4% 0.0% -8.2 -21 2.4% -5.69 -3.6%
IE + + + + -0.5% 0.9% -1.4% 0.9% -2.9% -4.1% -4.6% -2.1% -1.1 -1 n.a. 4.21 n.a.
EL - - + + -11.9% -10.4% -0.8% 3.6% -2.9% -4.1% 0.9% -2.9% -3 -1 -0.9% 0.29 n.a.
ES + + + + -6.6% -2.4% -2.3% -1.3% -0.2% -2.3% 0.1% -2.7% 1.3 0 n.a. -2.79 n.a.
FR + + - - 0.7% 3.2% -1.3% -0.8% -1.0% -1.9% 0.2% -0.3% 0.5 0 -9.1% -1.09 49.5%
HR - - + + -3.9% -1.6% -1.3% -1.8% n.a. -2.7% -0.4% 0.8% -1.6 0 -0.8% 2.50 -3.3%
IT + - + + -3.0% -2.8% -1.2% -2.9% 1.5% 1.3% 0.9% -1.9% 1.4 3 1.5% 1.66 n.a.
CY - - + + -12.7% -8.4% -2.1% 0.0% -1.4% -3.5% 1.1% -1.4% n.a. n.a. n.a. 4.59 n.a.
LV - + + + -1.8% -4.3% -1.4% 2.6% 0.0% -1.2% -1.5% 0.3% -3.8 -10 3.3% -6.31 -8.2%
LT + + + - -3.2% -2.2% -5.7% -1.7% 2.1% -0.9% -1.7% 1.6% -1.6 -10 -2.1% 41.53 -0.5%
LU + + + + -2.7% -1.2% -2.7% -2.4% -4.0% -7.7% 1.8% -1.0% 2.6 -2 0.8% 3.55 11.8%
HU + + + + -3.3% 1.3% -2.3% 2.4% -1.8% -3.1% -4.8% -1.9% -3.3 -6 -6.3% -1.12 2.6%
MT + + - - -13.8% -0.2% -3.6% n.a. 12.3% -3.4% n.a. 5.9% n.a. n.a. n.a. 10.92 n.a.
NL + + - + -1.7% 0.0% -1.1% -1.3% -1.0% -1.9% 0.0% -0.5% 1.1 8 -3.3% -1.63 -1.0%
AT + + + - -0.1% 1.6% -1.6% -0.3% -0.8% -1.0% -2.6% -0.4% 2.2 11 2.9% 6.12 8.3%
PL + + - + 0.4% -1.7% -3.0% -6.0% 0.9% -1.0% -0.3% 3.4% -10.3 -14 -1.6% -0.81 -0.7%
PT + - + + 0.5% -2.4% -1.5% -0.8% -1.5% -4.6% -2.9% -1.4% 0.2 1 8.8% 1.50 n.a.
RO - - + + -8.2% -4.6% -4.4% -7.3% 1.8% -0.7% -0.7% 2.9% -6.8 10 -4.4% -3.07 -6.5%
SL + + + + -1.7% -1.0% -1.1% -3.8% 0.4% -1.3% -0.1% 3.3% -0.6 -3 0.3% 0.53 -3.4%
SK + + + - 2.9% 5.0% -4.4% -5.0% -0.8% -1.5% -0.9% 2.5% -8.5 -6 2.2% -1.30 -8.3%
FI - - + + -2.6% -2.1% -0.7% 0.0% -0.3% -0.1% 0.6% 0.6% 0 5 0.4% -0.90 1.5%
SE + + - + -1.9% -2.4% -2.0% -1.4% -1.3% -1.4% -1.3% -0.4% 0.8 2 3.2% 1.29 -2.7%
UK + + + + -1.0% 1.1% -2.2% -1.8% -3.1% -3.5% -0.5% -1.2% 2.4 2 n.a. -0.78 1.1%
Trend to reach the 2020 target Households TransportShort term trend Generation2020 Ambition level
30
The analysis of the indicators described above demonstrates the trends for Member State in
the industry, residential, services, transport and generation sector. For EU-28, the different
performance indicators 2005-2013 used to analyse progress on energy efficiency show that
most have improved on the European level but an increase in final energy consumption from
2012 to 2013 and a decrease of heat generated by CHP plants between 2005 and 2013
occurred. Most Member States have increased their effort considerably and either
strengthened existing energy efficiency measures or introduced new ones which show already
a positive impact on the performance indicators as shown in the table above.
Having in mind that the EU-28 needs to reduce primary energy consumption annually on
average by 11.9 Mtoe (2.7 Mtoe expressed in final energy consumption) from the 2013 level
to achieve its 2020 targets, it can be concluded that – despite the achievements of previous
years – additional efforts are needed in particular in the buildings, transport and generation
sectors as described in Report COM(2015) 574. To close the remaining gap towards the 2020
target expressed in primary energy consumption, Member States should accelerate their
efforts in order to achieve their national energy efficiency targets for 2020 or to go beyond
them. It is worth noting that some Member States – Austria, Belgium, France, Germany,
Malta, the Netherlands, Sweden and the United Kingdom – have already set themselves
particularly ambitious targets. Croatia, Finland, Greece and Romania, which have set less
ambitious targets for 2020 in light of expected GDP growth in 2014-2020, could benefit from
assessing again how an increased level of energy efficiency could increase their security of
supply, competitiveness and sustainability.
The Commission will continue to closely follow Member States' progress towards their
indicative national energy efficiency targets for 2020 and the implementation of the EED and
update its assessment annually as part of the State of the Energy Union. This exercise has
shown that more indicators based on official statistical data might be needed to fully assess
Member States' progress towards their energy efficiency targets. In addition, detailed
information is needed on a sectoral level. To distinguish impacts of energy efficiency
measures from other factors like changes in economic structure, economic growth/downturn
impacts, changes in the energy mix, weather variations, population growth, increasing wealth,
impacts of other policies and other external factors, the Commission will further analyse how
to improve or extend the performance indicators. In addition, the Commission will work on
the further development of methods such as decomposition analysis or other suitable methods.
31
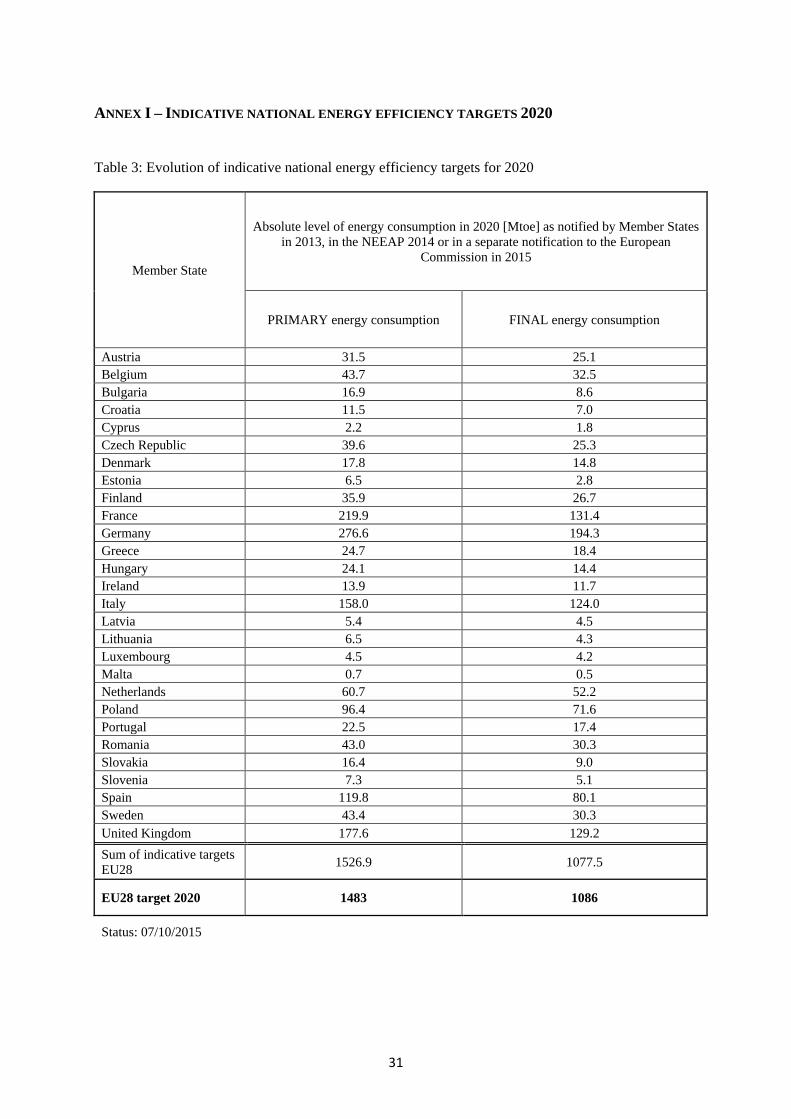
ANNEX I – INDICATIVE NATIONAL ENERGY EFFICIENCY TARGETS 2020
Table 3: Evolution of indicative national energy efficiency targets for 2020
Member State
Absolute level of energy consumption in 2020 [Mtoe] as notified by Member States
in 2013, in the NEEAP 2014 or in a separate notification to the European
Commission in 2015
PRIMARY energy consumption FINAL energy consumption
Austria 31.5 25.1
Belgium 43.7 32.5
Bulgaria 16.9 8.6
Croatia 11.5 7.0
Cyprus 2.2 1.8
Czech Republic 39.6 25.3
Denmark 17.8 14.8
Estonia 6.5 2.8
Finland 35.9 26.7
France 219.9 131.4
Germany 276.6 194.3
Greece 24.7 18.4
Hungary 24.1 14.4
Ireland 13.9 11.7
Italy 158.0 124.0
Latvia 5.4 4.5
Lithuania 6.5 4.3
Luxembourg 4.5 4.2
Malta 0.7 0.5
Netherlands 60.7 52.2
Poland 96.4 71.6
Portugal 22.5 17.4
Romania 43.0 30.3
Slovakia 16.4 9.0
Slovenia 7.3 5.1
Spain 119.8 80.1
Sweden 43.4 30.3
United Kingdom 177.6 129.2
Sum of indicative targets
EU28 1526.9 1077.5
EU28 target 2020 1483 1086
Status: 07/10/2015

32
ANNEX II – INDICATORS OF THE ANNUAL REPORTS
This Annex gives an overview of the indicators which Member States have to report in their
Annual Reports. This staff working document refers to Member States' data published by
Eurostat for comparability reasons as the data provided by Member States in their Annual
Reports according to Article 24(1) and Annex XIV of the EED was often based on different
or unknown definition and sources.

33
1. Austria
0
2
4
6
8
10
20
05
20
06
20
07
20
08
20
09
20
10
20
11
20
12
20
13
[Mill
ions T
OE
]
AT) Industry: final energy breakdown
Mining and quarrying Iron and steel Non-ferrous metals
Non-metallic minerals Chemical and petrochemical Paper, pulp and print
Textile and leather Wood and wood products Food and tobacco
Transport equipment Machinery Construction
Non-specified FEC of energy-intensive industry
60%
80%
100%
120%
140%
20
05
20
06
20
07
20
08
20
09
20
10
20
11
20
12
20
13
AT) Transport: final energy consumption vs passenger-kilometers and tonne-kilometers
National final energy of transport (pipeline transport excl.) (2005 =100%)
National passenger-kilometers by road and rail (2005 = 100%)
National tonne-kilometers by road, rail and waterway (2005 = 100%)
0
2
4
6
8
10
20
05
20
06
20
07
20
08
20
09
20
10
20
11
20
12
20
13
[Mill
ions T
OE
]
AT) Transport: final energy breakdown
Road Rail Domestic aviation
International aviation Domestic navigation Non-specified
0
25
50
75
100
0
100
200
300
400
20
05
20
06
20
07
20
08
20
09
20
10
20
11
20
12
20
13
20
14
20
15
20
16
20
17
20
18
20
19
20
20
Energ
y [
Mill
ions T
OE
]
GD
P [
Bill
ions E
UR
O]
AT) Primary and final energy consumption vs GDP
GDP, 2005 chain-linked volumes + ECFIN forecast Final energy consumption
Primary energy consumption Final energy linear target path 2005-2020
Primary energy linear target path 2005-2020 Final energy 2020 target
Primary energy 2020 target
0
25
50
75
100
125
150
20
05
20
06
20
07
20
08
20
09
20
10
20
11
20
12
20
13
[TO
E/M
illio
ns E
UR
O]
AT) Final energy intensity (FEC / GDP)
National final energy intensity EU28 final energy intensity
0
50
100
150
20
05
20
06
20
07
20
08
20
09
20
10
20
11
20
12
20
13
[TO
E/M
illio
ns E
UR
O]
AT) Industry: final energy intensity (FEC / value added)
National final energy intensity of industry
EU28 final energy intensity of industry

34
60%
80%
100%
120%
140%
20
05
20
06
20
07
20
08
20
09
20
10
20
11
20
12
20
13
AT) Residential: final energy consumption, HDD normalized vs disposable income of households
National final energy, HDD normalized (2005 = 100%)
National disposable income of households (2005 = 100%)
EU28 final energy, HDD normalized (2005 = 100%)
EU28 disposable income of households (2005 = 100%)
0
2
4
6
8
20
05
20
06
20
07
20
08
20
09
20
10
20
11
20
12
20
13
[Mill
ions T
OE
]
AT) Energy generation from thermal power and CHP
Electricity from thermal power (CHP included)
Electricity from CHP
Heat from thermal power (CHP included)
Heat from CHP
Input to thermal power (CHP included)
0
1
2
3
20
05
20
06
20
07
20
08
20
09
20
10
20
11
20
12
20
13
[Mill
ions T
OE
]
AT) Electricity generation breakdown
Nuclear power stations (CHP excluded)
Autoproducer conventional thermal power stations (CHP excluded)
Main activity conventional thermal power stations (CHP exluded)
Autoproducer CHP
Main activity CHP
0
100
200
300
20
05
20
06
20
07
20
08
20
09
20
10
20
11
20
12
20
13
[TO
E/M
illio
ns o
f P
ers
ons/H
DD
]
AT) Residential: final energy consumption per capita, HDD normalized
National final energy per capita, HDD normalized
EU28 final energy per capita, HDD normalized
0
50
100
15020
05
20
06
20
07
20
08
20
09
20
10
20
11
20
12
20
13
[TO
E/M
illio
ns o
f P
ers
ons/H
DD
]
AT) Services: final energy consumption per capita, HDD normalized
National final energy per capita, HDD normalized
EU28 final energy per capita, HDD normalized
60%
80%
100%
120%
140%
20
05
20
06
20
07
20
08
20
09
20
10
20
11
20
12
20
13
AT) Services: final energy intensity (FEC / value added), HDD normalized
National final energy intensity, HDD normalized (2005 = 100%)
EU28 final energy intensity, HDD normalized (2005 = 100%)

35
2. Belgium
0
3
6
9
12
15
20
05
20
06
20
07
20
08
20
09
20
10
20
11
20
12
20
13
[Mill
ions T
OE
]
BE) Industry: final energy breakdown
Mining and quarrying Iron and steel Non-ferrous metals
Non-metallic minerals Chemical and petrochemical Paper, pulp and print
Textile and leather Wood and wood products Food and tobacco
Transport equipment Machinery Construction
Non-specified FEC of energy-intensive industry
80%
100%
120%
20
05
20
06
20
07
20
08
20
09
20
10
20
11
20
12
20
13
BE) Transport: final energy consumption vs passenger-kilometers
National final energy of transport (pipeline transport excl.) (2005 =100%)
National passenger-kilometers by road and rail (2005 = 100%)
EU28 final energy of transport (pipeline transport excl.) (2005 = 100%)
0
3
6
9
12
15
20
05
20
06
20
07
20
08
20
09
20
10
20
11
20
12
20
13
[Mill
ions T
OE
]
BE) Transport: final energy breakdown
Road Rail Domestic aviation
International aviation Domestic navigation Non-specified
0
25
50
75
100
0
100
200
300
40020
05
20
06
20
07
20
08
20
09
20
10
20
11
20
12
20
13
20
14
20
15
20
16
20
17
20
18
20
19
20
20
Energ
y [
Mill
ions T
OE
]
GD
P [
Bill
ions E
UR
O]
BE) Primary and final energy consumption vs GDP
GDP, 2005 chain-linked volumes + ECFIN forecast Final energy consumption
Primary energy consumption Final energy linear target path 2005-2020
Primary energy linear target path 2005-2020 Final energy 2020 target
Primary energy 2020 target
0
25
50
75
100
125
150
20
05
20
06
20
07
20
08
20
09
20
10
20
11
20
12
20
13
[TO
E/M
illio
ns E
UR
O]
BE) Final energy intensity (FEC / GDP)
National final energy intensity EU28 final energy intensity
0
50
100
150
200
20
05
20
06
20
07
20
08
20
09
20
10
20
11
20
12
20
13
[TO
E/M
illio
ns E
UR
O]
BE) Industry: final energy intensity (FEC / value added)
National final energy intensity of industry
EU28 final energy intensity of industry

36
60%
80%
100%
120%
140%20
05
20
06
20
07
20
08
20
09
20
10
20
11
20
12
20
13
BE) Residential: final energy consumption, HDD normalized vs disposable income of households
National final energy, HDD normalized (2005 = 100%)
National disposable income of households (2005 = 100%)
EU28 final energy, HDD normalized (2005 = 100%)
EU28 disposable income of households (2005 = 100%)
0
5
10
15
20
25
20
05
20
06
20
07
20
08
20
09
20
10
20
11
20
12
20
13
[Mill
ions T
OE
]
BE) Energy generation from thermal power and CHP
Electricity from thermal power (CHP included)
Electricity from CHP
Heat from thermal power (CHP included)
Heat from CHP
Input to thermal power (CHP included)
0
2
4
6
8
10
20
05
20
06
20
07
20
08
20
09
20
10
20
11
20
12
20
13
[Mill
ions T
OE
]
BE) Electricity generation breakdown
Nuclear power stations (CHP excluded)
Autoproducer conventional thermal power stations (CHP excluded)
Main activity conventional thermal power stations (CHP exluded)
Autoproducer CHP
Main activity CHP
0
100
200
300
400
20
05
20
06
20
07
20
08
20
09
20
10
20
11
20
12
20
13
[TO
E/M
illio
ns o
f P
ers
ons/H
DD
]
BE) Residential: final energy consumption per capita, HDD normalized
National final energy per capita, HDD normalized
EU28 final energy per capita, HDD normalized
0
50
100
150
200
20
05
20
06
20
07
20
08
20
09
20
10
20
11
20
12
20
13
[TO
E/M
illio
ns o
f P
ers
ons/H
DD
]BE) Services: final energy consumption per capita,
HDD normalized
National final energy per capita, HDD normalized
EU28 final energy per capita, HDD normalized
80%
100%
120%
20
05
20
06
20
07
20
08
20
09
20
10
20
11
20
12
20
13
BE) Services: final energy intensity (FEC / value added), HDD normalized
National final energy intensity, HDD normalized (2005 = 100%)
EU28 final energy intensity, HDD normalized (2005 = 100%)
37
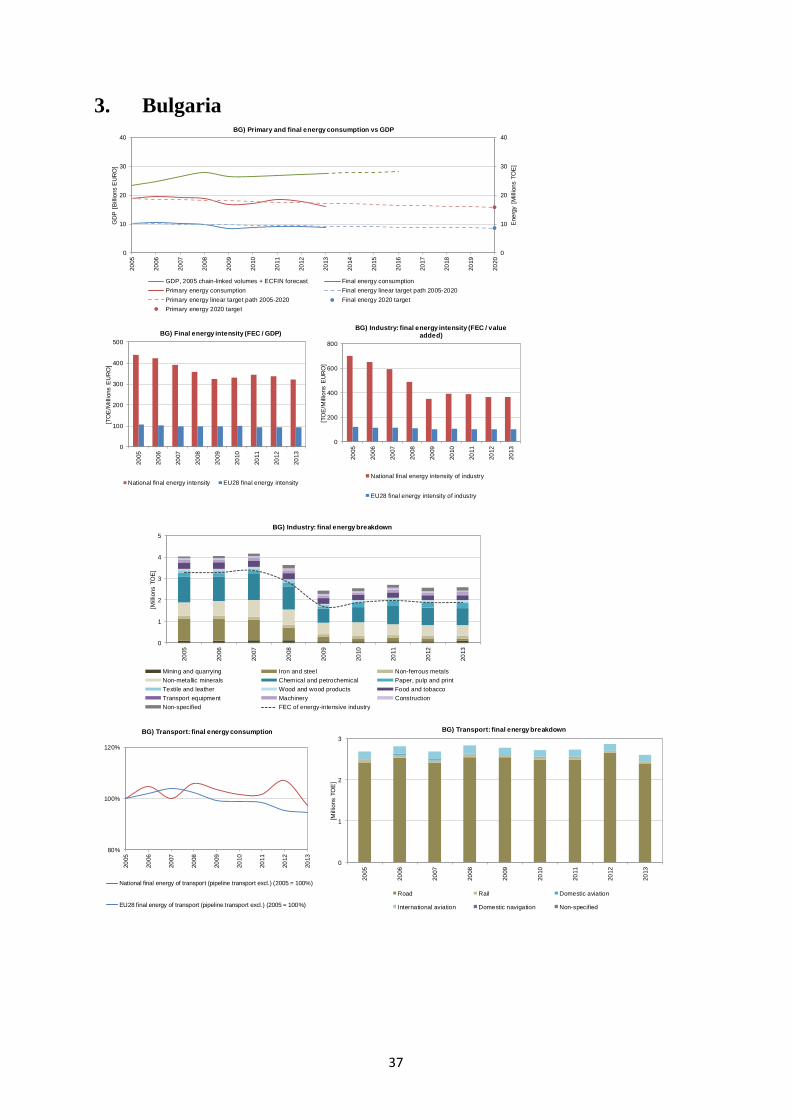
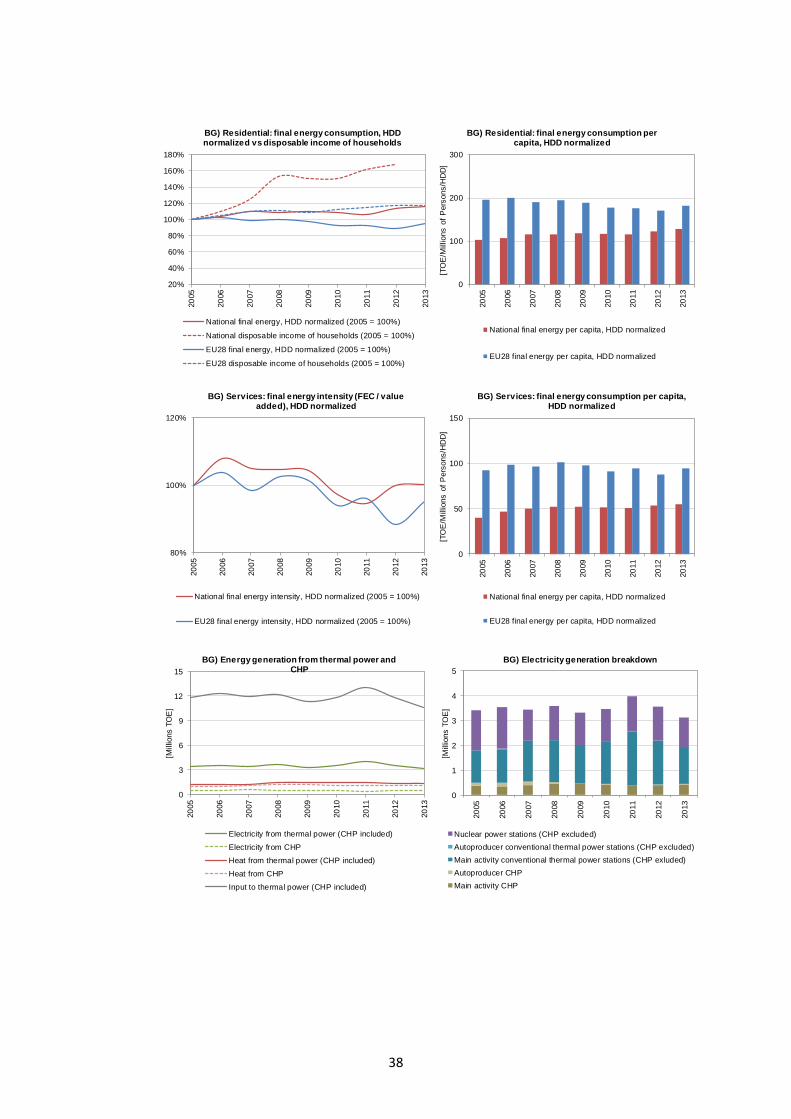
3. Bulgaria
0
1
2
3
4
5
20
05
20
06
20
07
20
08
20
09
20
10
20
11
20
12
20
13
[Mill
ions T
OE
]
BG) Industry: final energy breakdown
Mining and quarrying Iron and steel Non-ferrous metals
Non-metallic minerals Chemical and petrochemical Paper, pulp and print
Textile and leather Wood and wood products Food and tobacco
Transport equipment Machinery Construction
Non-specified FEC of energy-intensive industry
80%
100%
120%
20
05
20
06
20
07
20
08
20
09
20
10
20
11
20
12
20
13
BG) Transport: final energy consumption
National final energy of transport (pipeline transport excl.) (2005 = 100%)
EU28 final energy of transport (pipeline transport excl.) (2005 = 100%)
0
1
2
3
20
05
20
06
20
07
20
08
20
09
20
10
20
11
20
12
20
13
[Mill
ions T
OE
]
BG) Transport: final energy breakdown
Road Rail Domestic aviation
International aviation Domestic navigation Non-specified
0
10
20
30
40
0
10
20
30
40
20
05
20
06
20
07
20
08
20
09
20
10
20
11
20
12
20
13
20
14
20
15
20
16
20
17
20
18
20
19
20
20
Energ
y [
Mill
ions T
OE
]
GD
P [
Bill
ions E
UR
O]
BG) Primary and final energy consumption vs GDP
GDP, 2005 chain-linked volumes + ECFIN forecast Final energy consumption
Primary energy consumption Final energy linear target path 2005-2020
Primary energy linear target path 2005-2020 Final energy 2020 target
Primary energy 2020 target
0
100
200
300
400
500
20
05
20
06
20
07
20
08
20
09
20
10
20
11
20
12
20
13
[TO
E/M
illio
ns E
UR
O]
BG) Final energy intensity (FEC / GDP)
National final energy intensity EU28 final energy intensity
0
200
400
600
800
20
05
20
06
20
07
20
08
20
09
20
10
20
11
20
12
20
13
[TO
E/M
illio
ns E
UR
O]
BG) Industry: final energy intensity (FEC / value added)
National final energy intensity of industry
EU28 final energy intensity of industry
38
20%
40%
60%
80%
100%
120%
140%
160%
180%
20
05
20
06
20
07
20
08
20
09
20
10
20
11
20
12
20
13
BG) Residential: final energy consumption, HDD normalized vs disposable income of households
National final energy, HDD normalized (2005 = 100%)
National disposable income of households (2005 = 100%)
EU28 final energy, HDD normalized (2005 = 100%)
EU28 disposable income of households (2005 = 100%)
0
3
6
9
12
15
20
05
20
06
20
07
20
08
20
09
20
10
20
11
20
12
20
13
[Mill
ions T
OE
]
BG) Energy generation from thermal power and CHP
Electricity from thermal power (CHP included)
Electricity from CHP
Heat from thermal power (CHP included)
Heat from CHP
Input to thermal power (CHP included)
0
1
2
3
4
5
20
05
20
06
20
07
20
08
20
09
20
10
20
11
20
12
20
13
[Mill
ions T
OE
]
BG) Electricity generation breakdown
Nuclear power stations (CHP excluded)
Autoproducer conventional thermal power stations (CHP excluded)
Main activity conventional thermal power stations (CHP exluded)
Autoproducer CHP
Main activity CHP
0
100
200
300
20
05
20
06
20
07
20
08
20
09
20
10
20
11
20
12
20
13
[TO
E/M
illio
ns o
f P
ers
ons/H
DD
]
BG) Residential: final energy consumption per capita, HDD normalized
National final energy per capita, HDD normalized
EU28 final energy per capita, HDD normalized
0
50
100
150
20
05
20
06
20
07
20
08
20
09
20
10
20
11
20
12
20
13
[TO
E/M
illio
ns o
f P
ers
ons/H
DD
]
BG) Services: final energy consumption per capita, HDD normalized
National final energy per capita, HDD normalized
EU28 final energy per capita, HDD normalized
80%
100%
120%
20
05
20
06
20
07
20
08
20
09
20
10
20
11
20
12
20
13
BG) Services: final energy intensity (FEC / value added), HDD normalized
National final energy intensity, HDD normalized (2005 = 100%)
EU28 final energy intensity, HDD normalized (2005 = 100%)
39
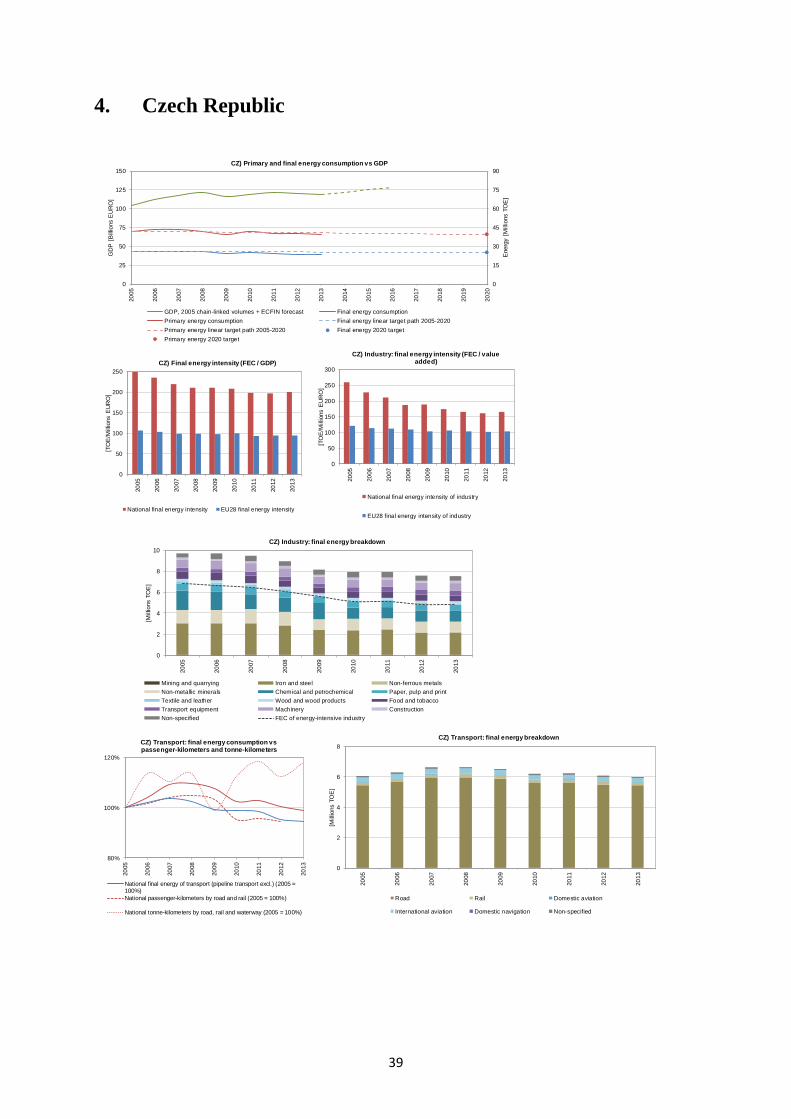
4. Czech Republic
0
2
4
6
8
10
20
05
20
06
20
07
20
08
20
09
20
10
20
11
20
12
20
13
[Mill
ions T
OE
]
CZ) Industry: final energy breakdown
Mining and quarrying Iron and steel Non-ferrous metals
Non-metallic minerals Chemical and petrochemical Paper, pulp and print
Textile and leather Wood and wood products Food and tobacco
Transport equipment Machinery Construction
Non-specified FEC of energy-intensive industry
80%
100%
120%
20
05
20
06
20
07
20
08
20
09
20
10
20
11
20
12
20
13
CZ) Transport: final energy consumption vs passenger-kilometers and tonne-kilometers
National final energy of transport (pipeline transport excl.) (2005 =100%)
National passenger-kilometers by road and rail (2005 = 100%)
National tonne-kilometers by road, rail and waterway (2005 = 100%)
0
2
4
6
8
20
05
20
06
20
07
20
08
20
09
20
10
20
11
20
12
20
13
[Mill
ions T
OE
]
CZ) Transport: final energy breakdown
Road Rail Domestic aviation
International aviation Domestic navigation Non-specified
0
15
30
45
60
75
90
0
25
50
75
100
125
150
20
05
20
06
20
07
20
08
20
09
20
10
20
11
20
12
20
13
20
14
20
15
20
16
20
17
20
18
20
19
20
20
Energ
y [
Mill
ions T
OE
]
GD
P [
Bill
ions E
UR
O]
CZ) Primary and final energy consumption vs GDP
GDP, 2005 chain-linked volumes + ECFIN forecast Final energy consumption
Primary energy consumption Final energy linear target path 2005-2020
Primary energy linear target path 2005-2020 Final energy 2020 target
Primary energy 2020 target
0
50
100
150
200
250
20
05
20
06
20
07
20
08
20
09
20
10
20
11
20
12
20
13
[TO
E/M
illio
ns E
UR
O]
CZ) Final energy intensity (FEC / GDP)
National final energy intensity EU28 final energy intensity
0
50
100
150
200
250
300
20
05
20
06
20
07
20
08
20
09
20
10
20
11
20
12
20
13
[TO
E/M
illio
ns E
UR
O]
CZ) Industry: final energy intensity (FEC / value added)
National final energy intensity of industry
EU28 final energy intensity of industry
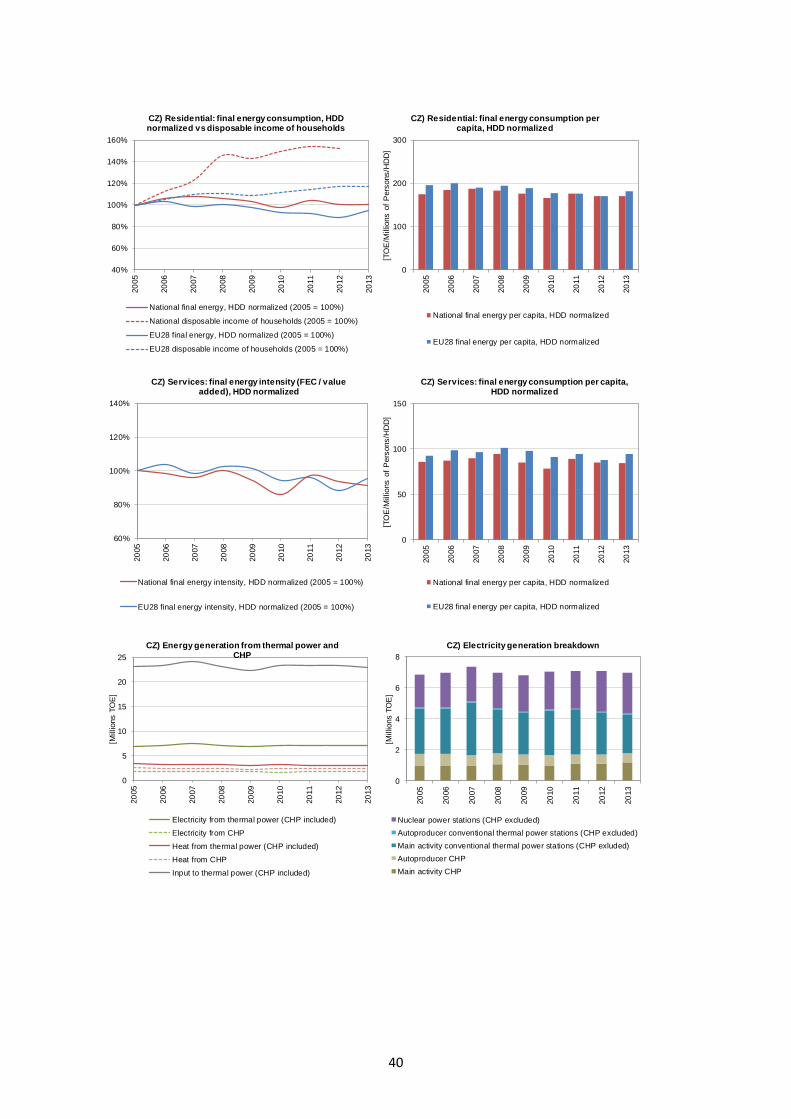
40
40%
60%
80%
100%
120%
140%
160%20
05
20
06
20
07
20
08
20
09
20
10
20
11
20
12
20
13
CZ) Residential: final energy consumption, HDD normalized vs disposable income of households
National final energy, HDD normalized (2005 = 100%)
National disposable income of households (2005 = 100%)
EU28 final energy, HDD normalized (2005 = 100%)
EU28 disposable income of households (2005 = 100%)
0
5
10
15
20
25
20
05
20
06
20
07
20
08
20
09
20
10
20
11
20
12
20
13
[Mill
ions T
OE
]
CZ) Energy generation from thermal power and CHP
Electricity from thermal power (CHP included)
Electricity from CHP
Heat from thermal power (CHP included)
Heat from CHP
Input to thermal power (CHP included)
0
2
4
6
8
20
05
20
06
20
07
20
08
20
09
20
10
20
11
20
12
20
13
[Mill
ions T
OE
]
CZ) Electricity generation breakdown
Nuclear power stations (CHP excluded)
Autoproducer conventional thermal power stations (CHP excluded)
Main activity conventional thermal power stations (CHP exluded)
Autoproducer CHP
Main activity CHP
0
100
200
300
20
05
20
06
20
07
20
08
20
09
20
10
20
11
20
12
20
13
[TO
E/M
illio
ns o
f P
ers
ons/H
DD
]
CZ) Residential: final energy consumption per capita, HDD normalized
National final energy per capita, HDD normalized
EU28 final energy per capita, HDD normalized
0
50
100
150
20
05
20
06
20
07
20
08
20
09
20
10
20
11
20
12
20
13
[TO
E/M
illio
ns o
f P
ers
ons/H
DD
]CZ) Services: final energy consumption per capita,
HDD normalized
National final energy per capita, HDD normalized
EU28 final energy per capita, HDD normalized
60%
80%
100%
120%
140%
20
05
20
06
20
07
20
08
20
09
20
10
20
11
20
12
20
13
CZ) Services: final energy intensity (FEC / value added), HDD normalized
National final energy intensity, HDD normalized (2005 = 100%)
EU28 final energy intensity, HDD normalized (2005 = 100%)
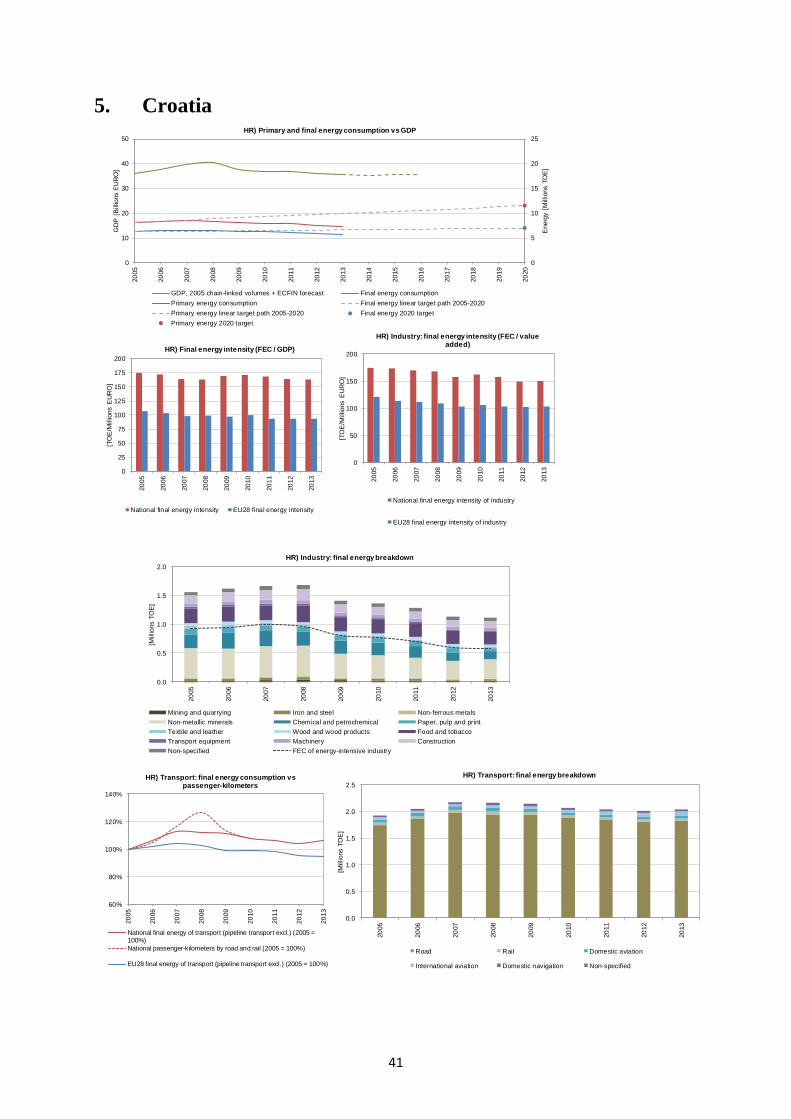
41
5. Croatia
0.0
0.5
1.0
1.5
2.0
20
05
20
06
20
07
20
08
20
09
20
10
20
11
20
12
20
13
[Mill
ions T
OE
]
HR) Industry: final energy breakdown
Mining and quarrying Iron and steel Non-ferrous metals
Non-metallic minerals Chemical and petrochemical Paper, pulp and print
Textile and leather Wood and wood products Food and tobacco
Transport equipment Machinery Construction
Non-specified FEC of energy-intensive industry
60%
80%
100%
120%
140%
20
05
20
06
20
07
20
08
20
09
20
10
20
11
20
12
20
13
HR) Transport: final energy consumption vs passenger-kilometers
National final energy of transport (pipeline transport excl.) (2005 =100%)
National passenger-kilometers by road and rail (2005 = 100%)
EU28 final energy of transport (pipeline transport excl.) (2005 = 100%)
0.0
0.5
1.0
1.5
2.0
2.5
20
05
20
06
20
07
20
08
20
09
20
10
20
11
20
12
20
13
[Mill
ions T
OE
]
HR) Transport: final energy breakdown
Road Rail Domestic aviation
International aviation Domestic navigation Non-specified
0
5
10
15
20
25
0
10
20
30
40
5020
05
20
06
20
07
20
08
20
09
20
10
20
11
20
12
20
13
20
14
20
15
20
16
20
17
20
18
20
19
20
20
Energ
y [
Mill
ions T
OE
]
GD
P [
Bill
ions E
UR
O]
HR) Primary and final energy consumption vs GDP
GDP, 2005 chain-linked volumes + ECFIN forecast Final energy consumption
Primary energy consumption Final energy linear target path 2005-2020
Primary energy linear target path 2005-2020 Final energy 2020 target
Primary energy 2020 target
0
25
50
75
100
125
150
175
200
20
05
20
06
20
07
20
08
20
09
20
10
20
11
20
12
20
13
[TO
E/M
illio
ns E
UR
O]
HR) Final energy intensity (FEC / GDP)
National final energy intensity EU28 final energy intensity
0
50
100
150
200
20
05
20
06
20
07
20
08
20
09
20
10
20
11
20
12
20
13
[TO
E/M
illio
ns E
UR
O]
HR) Industry: final energy intensity (FEC / value added)
National final energy intensity of industry
EU28 final energy intensity of industry
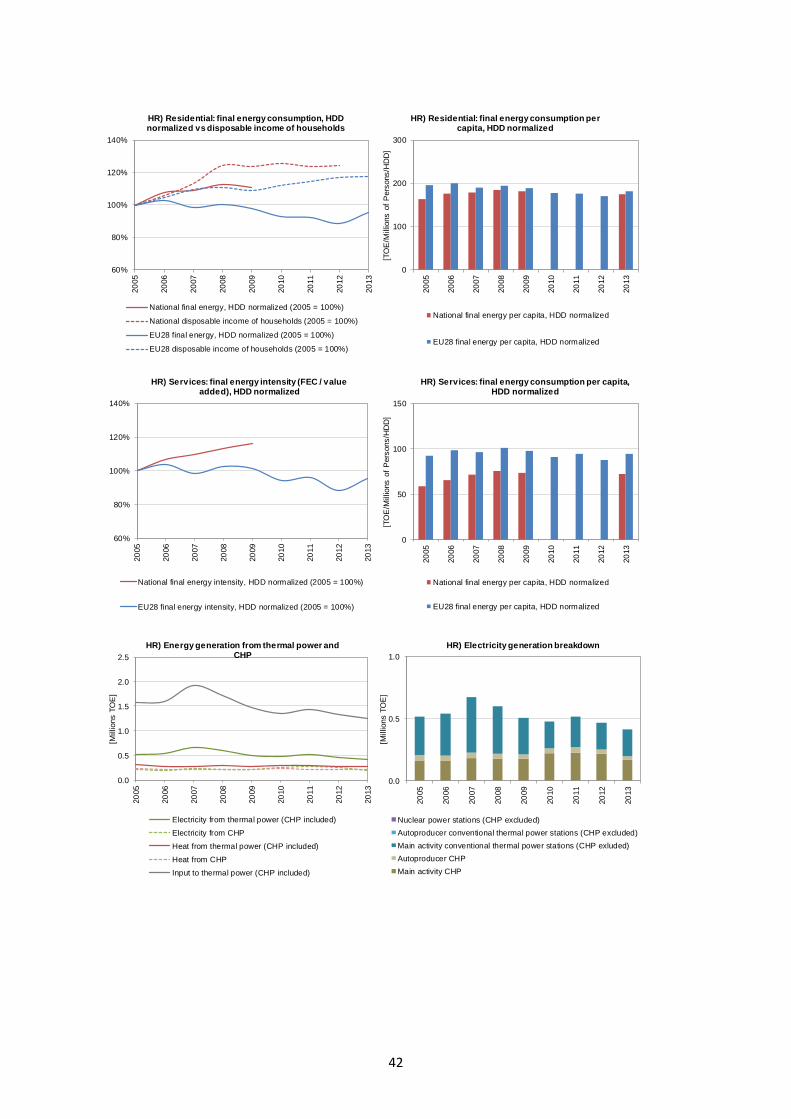
42
60%
80%
100%
120%
140%20
05
20
06
20
07
20
08
20
09
20
10
20
11
20
12
20
13
HR) Residential: final energy consumption, HDD normalized vs disposable income of households
National final energy, HDD normalized (2005 = 100%)
National disposable income of households (2005 = 100%)
EU28 final energy, HDD normalized (2005 = 100%)
EU28 disposable income of households (2005 = 100%)
0.0
0.5
1.0
1.5
2.0
2.5
20
05
20
06
20
07
20
08
20
09
20
10
20
11
20
12
20
13
[Mill
ions T
OE
]
HR) Energy generation from thermal power and CHP
Electricity from thermal power (CHP included)
Electricity from CHP
Heat from thermal power (CHP included)
Heat from CHP
Input to thermal power (CHP included)
0.0
0.5
1.0
20
05
20
06
20
07
20
08
20
09
20
10
20
11
20
12
20
13
[Mill
ions T
OE
]
HR) Electricity generation breakdown
Nuclear power stations (CHP excluded)
Autoproducer conventional thermal power stations (CHP excluded)
Main activity conventional thermal power stations (CHP exluded)
Autoproducer CHP
Main activity CHP
0
100
200
300
20
05
20
06
20
07
20
08
20
09
20
10
20
11
20
12
20
13
[TO
E/M
illio
ns o
f P
ers
ons/H
DD
]
HR) Residential: final energy consumption per capita, HDD normalized
National final energy per capita, HDD normalized
EU28 final energy per capita, HDD normalized
0
50
100
150
20
05
20
06
20
07
20
08
20
09
20
10
20
11
20
12
20
13
[TO
E/M
illio
ns o
f P
ers
ons/H
DD
]HR) Services: final energy consumption per capita,
HDD normalized
National final energy per capita, HDD normalized
EU28 final energy per capita, HDD normalized
60%
80%
100%
120%
140%
20
05
20
06
20
07
20
08
20
09
20
10
20
11
20
12
20
13
HR) Services: final energy intensity (FEC / value added), HDD normalized
National final energy intensity, HDD normalized (2005 = 100%)
EU28 final energy intensity, HDD normalized (2005 = 100%)
43
6. Cyprus
0.0
0.1
0.2
0.3
0.4
20
05
20
06
20
07
20
08
20
09
20
10
20
11
20
12
20
13
[Mill
ions T
OE
]
CY) Industry: final energy breakdown
Mining and quarrying Iron and steel Non-ferrous metals
Non-metallic minerals Chemical and petrochemical Paper, pulp and print
Textile and leather Wood and wood products Food and tobacco
Transport equipment Machinery Construction
Non-specified FEC of energy-intensive industry
60%
80%
100%
120%
140%
20
05
20
06
20
07
20
08
20
09
20
10
20
11
20
12
20
13
CY) Transport: final energy consumption
National final energy of transport (pipeline transport excl.) (2005 = 100%)
EU28 final energy of transport (pipeline transport excl.) (2005 = 100%)
0.0
0.3
0.6
0.9
1.2
20
05
20
06
20
07
20
08
20
09
20
10
20
11
20
12
20
13
[Mill
ions T
OE
]
CY) Transport: final energy breakdown
Road Rail Domestic aviation
International aviation Domestic navigation Non-specified
0
2
4
6
8
0
5
10
15
20
20
05
20
06
20
07
20
08
20
09
20
10
20
11
20
12
20
13
20
14
20
15
20
16
20
17
20
18
20
19
20
20
Energ
y [
Mill
ions T
OE
]
GD
P [
Bill
ions E
UR
O]
CY) Primary and final energy consumption vs GDP
GDP, 2005 chain-linked volumes + ECFIN forecast Final energy consumption
Primary energy consumption Final energy linear target path 2005-2020
Primary energy linear target path 2005-2020 Final energy 2020 target
Primary energy 2020 target
0
25
50
75
100
125
150
20
05
20
06
20
07
20
08
20
09
20
10
20
11
20
12
20
13
[TO
E/M
illio
ns E
UR
O]
CY) Final energy intensity (FEC / GDP)
National final energy intensity EU28 final energy intensity
0
50
100
15020
05
20
06
20
07
20
08
20
09
20
10
20
11
20
12
20
13
[TO
E/M
illio
ns E
UR
O]
CY) Industry: final energy intensity (FEC / value added)
National final energy intensity of industry
EU28 final energy intensity of industry
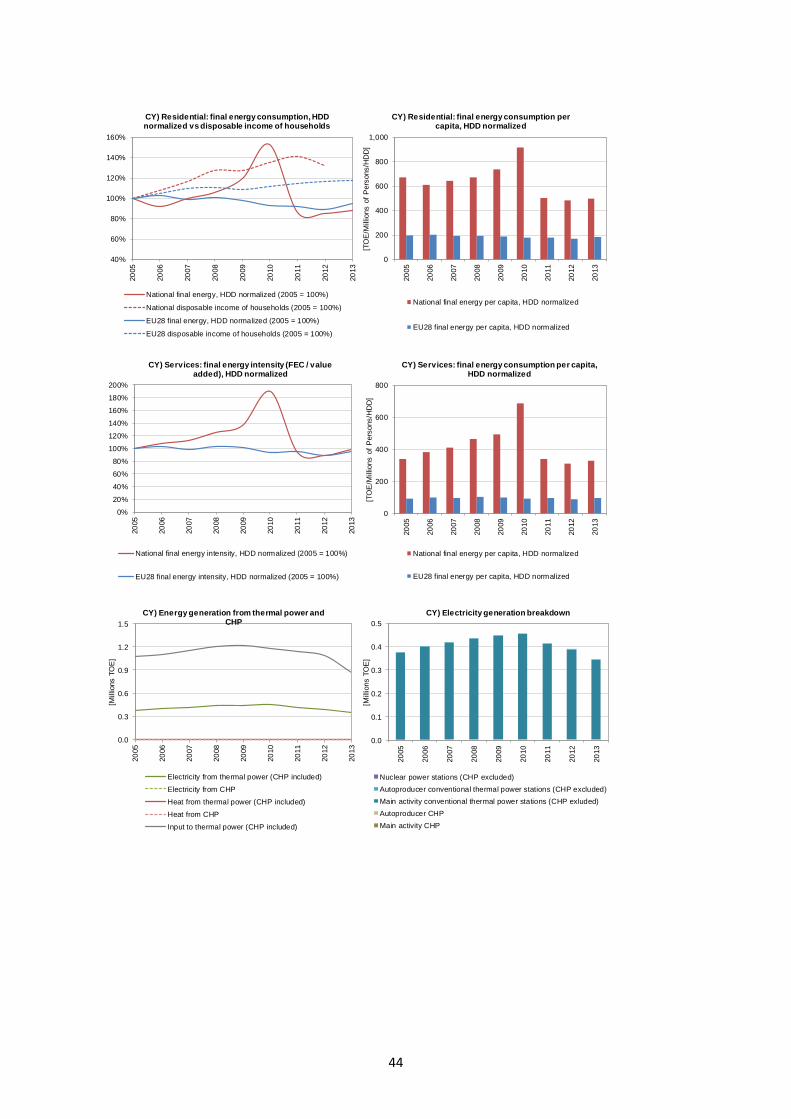
44
40%
60%
80%
100%
120%
140%
160%20
05
20
06
20
07
20
08
20
09
20
10
20
11
20
12
20
13
CY) Residential: final energy consumption, HDD normalized vs disposable income of households
National final energy, HDD normalized (2005 = 100%)
National disposable income of households (2005 = 100%)
EU28 final energy, HDD normalized (2005 = 100%)
EU28 disposable income of households (2005 = 100%)
0.0
0.3
0.6
0.9
1.2
1.5
20
05
20
06
20
07
20
08
20
09
20
10
20
11
20
12
20
13
[Mill
ions T
OE
]
CY) Energy generation from thermal power and CHP
Electricity from thermal power (CHP included)
Electricity from CHP
Heat from thermal power (CHP included)
Heat from CHP
Input to thermal power (CHP included)
0.0
0.1
0.2
0.3
0.4
0.5
20
05
20
06
20
07
20
08
20
09
20
10
20
11
20
12
20
13
[Mill
ions T
OE
]
CY) Electricity generation breakdown
Nuclear power stations (CHP excluded)
Autoproducer conventional thermal power stations (CHP excluded)
Main activity conventional thermal power stations (CHP exluded)
Autoproducer CHP
Main activity CHP
0
200
400
600
800
1,000
20
05
20
06
20
07
20
08
20
09
20
10
20
11
20
12
20
13
[TO
E/M
illio
ns o
f P
ers
ons/H
DD
]
CY) Residential: final energy consumption per capita, HDD normalized
National final energy per capita, HDD normalized
EU28 final energy per capita, HDD normalized
0
200
400
600
800
20
05
20
06
20
07
20
08
20
09
20
10
20
11
20
12
20
13
[TO
E/M
illio
ns o
f P
ers
ons/H
DD
]CY) Services: final energy consumption per capita,
HDD normalized
National final energy per capita, HDD normalized
EU28 final energy per capita, HDD normalized
0%
20%
40%
60%
80%
100%
120%
140%
160%
180%
200%
20
05
20
06
20
07
20
08
20
09
20
10
20
11
20
12
20
13
CY) Services: final energy intensity (FEC / value added), HDD normalized
National final energy intensity, HDD normalized (2005 = 100%)
EU28 final energy intensity, HDD normalized (2005 = 100%)
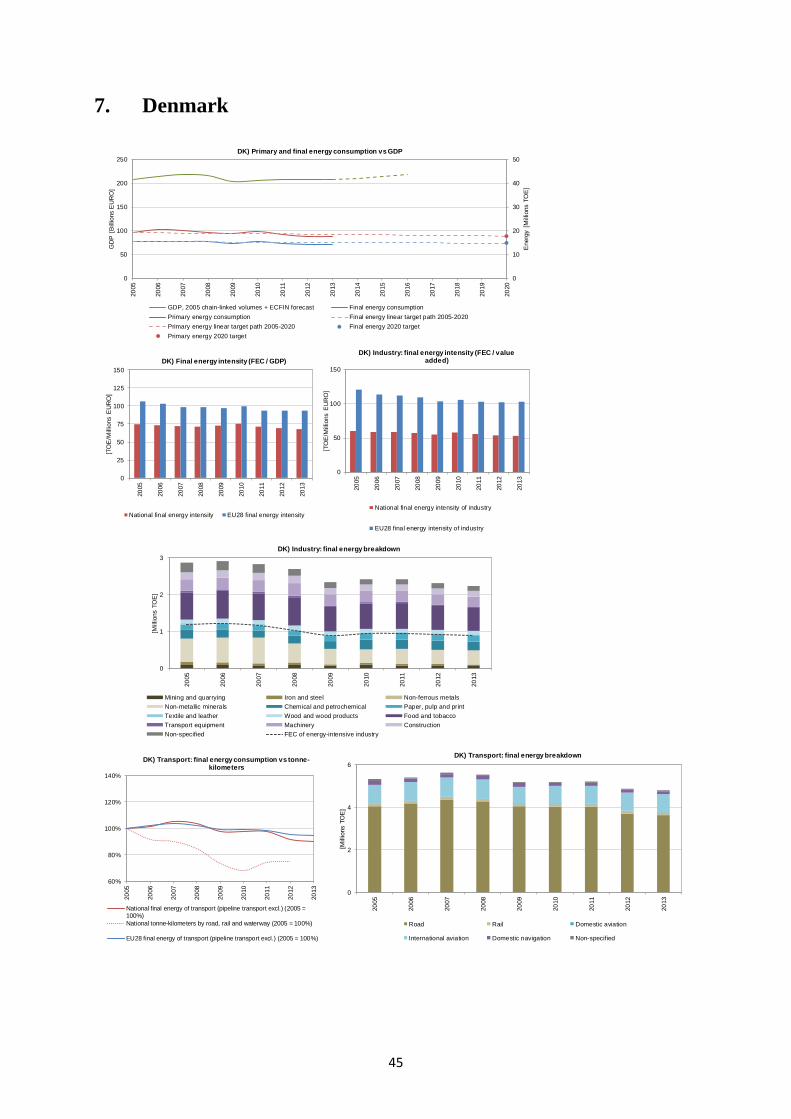
45
7. Denmark
0
1
2
3
20
05
20
06
20
07
20
08
20
09
20
10
20
11
20
12
20
13
[Mill
ions T
OE
]
DK) Industry: final energy breakdown
Mining and quarrying Iron and steel Non-ferrous metals
Non-metallic minerals Chemical and petrochemical Paper, pulp and print
Textile and leather Wood and wood products Food and tobacco
Transport equipment Machinery Construction
Non-specified FEC of energy-intensive industry
60%
80%
100%
120%
140%
20
05
20
06
20
07
20
08
20
09
20
10
20
11
20
12
20
13
DK) Transport: final energy consumption vs tonne-kilometers
National final energy of transport (pipeline transport excl.) (2005 =100%)
National tonne-kilometers by road, rail and waterway (2005 = 100%)
EU28 final energy of transport (pipeline transport excl.) (2005 = 100%)
0
2
4
6
20
05
20
06
20
07
20
08
20
09
20
10
20
11
20
12
20
13
[Mill
ions T
OE
]
DK) Transport: final energy breakdown
Road Rail Domestic aviation
International aviation Domestic navigation Non-specified
0
10
20
30
40
50
0
50
100
150
200
250
20
05
20
06
20
07
20
08
20
09
20
10
20
11
20
12
20
13
20
14
20
15
20
16
20
17
20
18
20
19
20
20
Energ
y [
Mill
ions T
OE
]
GD
P [
Bill
ions E
UR
O]
DK) Primary and final energy consumption vs GDP
GDP, 2005 chain-linked volumes + ECFIN forecast Final energy consumption
Primary energy consumption Final energy linear target path 2005-2020
Primary energy linear target path 2005-2020 Final energy 2020 target
Primary energy 2020 target
0
25
50
75
100
125
150
20
05
20
06
20
07
20
08
20
09
20
10
20
11
20
12
20
13
[TO
E/M
illio
ns E
UR
O]
DK) Final energy intensity (FEC / GDP)
National final energy intensity EU28 final energy intensity
0
50
100
150
20
05
20
06
20
07
20
08
20
09
20
10
20
11
20
12
20
13
[TO
E/M
illio
ns E
UR
O]
DK) Industry: final energy intensity (FEC / value added)
National final energy intensity of industry
EU28 final energy intensity of industry

46
60%
80%
100%
120%
140%20
05
20
06
20
07
20
08
20
09
20
10
20
11
20
12
20
13
DK) Residential: final energy consumption, HDD normalized vs disposable income of households
National final energy, HDD normalized (2005 = 100%)
National disposable income of households (2005 = 100%)
EU28 final energy, HDD normalized (2005 = 100%)
EU28 disposable income of households (2005 = 100%)
0
3
6
9
12
20
05
20
06
20
07
20
08
20
09
20
10
20
11
20
12
20
13
[Mill
ions T
OE
]
DK) Energy generation from thermal power and CHP
Electricity from thermal power (CHP included)
Electricity from CHP
Heat from thermal power (CHP included)
Heat from CHP
Input to thermal power (CHP included)
0
1
2
3
4
20
05
20
06
20
07
20
08
20
09
20
10
20
11
20
12
20
13
[Mill
ions T
OE
]
DK) Electricity generation breakdown
Nuclear power stations (CHP excluded)
Autoproducer conventional thermal power stations (CHP excluded)
Main activity conventional thermal power stations (CHP exluded)
Autoproducer CHP
Main activity CHP
0
100
200
300
20
05
20
06
20
07
20
08
20
09
20
10
20
11
20
12
20
13
[TO
E/M
illio
ns o
f P
ers
ons/H
DD
]
DK) Residential: final energy consumption per capita, HDD normalized
National final energy per capita, HDD normalized
EU28 final energy per capita, HDD normalized
0
50
100
150
20
05
20
06
20
07
20
08
20
09
20
10
20
11
20
12
20
13
[TO
E/M
illio
ns o
f P
ers
ons/H
DD
]DK) Services: final energy consumption per capita,
HDD normalized
National final energy per capita, HDD normalized
EU28 final energy per capita, HDD normalized
60%
80%
100%
120%
140%
20
05
20
06
20
07
20
08
20
09
20
10
20
11
20
12
20
13
DK) Services: final energy intensity (FEC / value added), HDD normalized
National final energy intensity, HDD normalized (2005 = 100%)
EU28 final energy intensity, HDD normalized (2005 = 100%)