efficiency wages and deferred payments in...
TRANSCRIPT

Efficiency Wages and Deferred Payments in Agriculture
Enrico Moretti*Jeffrey M. Perloff**
July 1999
* Graduate Student, Department of Economics, University of California, Berkeley** Professor, Department of Agricultural and Resource Economics and member of the
Giannini Foundation, University of California, Berkeley
We thank Daniel Carroll of the Office of the Assistant Secretary for Policy,U.S. Department of Labor for permission to use data from the National Agri-cultural Workers Survey. The views expressed here are those of the authorsand do not necessarily reflect the views of the Department of Labor. HowardRosenberg and Vijay Pradhan made very helpful suggestions. We are gratefulto the Giannini Foundation and the Institute for Industrial Relations at Berkeleyfor support.
Contact:Jeffrey M. Perloff 510/642-9574 510/643-8911 (fax)Department of Agricultural and Resource Economics207 Giannini HallUniversity of CaliforniaBerkeley, California [email protected]
Table of Contents
Preventing Shirking 2Piece Rates 2Monitoring 3Bonding, Deferred Payments, and Efficiency Wages 4Farm Labor Contractors 8
National Agricultural Worker Survey 9
Results 11Wages 11Fringes 13
Alternative Explanations 14
Conclusions 16
References 18

Efficiency Wages and Deferred Payments in Agriculture
Employers may pay an efficiency wage — an unusually high current or deferred wage
— or use deferred payments to reduce the costs of monitoring workers (Lazear 1979, Yellen
1984, Shapiro and Stiglitz 1984, and Stiglitz 1987). A high wage or deferred payment serves
the same function as an employment bond, making the threat of losing a job greater so that
less monitoring is required to prevent shirking. If the efficiency-wage theory is correct, it
may explain a number of puzzles about why the labor-management and compensation
practices in agriculture differ from those in other labor markets. We examine whether the
basic predictions of this model are consistent with the data from a randomized national survey
of agricultural workers.
We are unaware of any existing empirical studies of efficiency wage theory in
agriculture. The few empirical studies of efficiency wage theory in other sectors investigate
labor markets in which only time-rate compensation is used and usually all workers are
employed directly by the firm producing the final good.1 In contrast in agriculture, one in
eight workers nationally (and roughly one in four in the west, north east, and south east) is
paid a piece rate and one in nine nationally (and nearly one in three in the west) is employed
by a farm labor contractor (FLC).
We expect monitoring problems to differ across piece-rate jobs, where maintaining
quality is the key objective, and time-rate jobs, where increasing speed is the primary
1 The one exception of which we are aware is Rebitzer (1995), which examines thepetrochemical industry where some maintenance workers are hired directly by an employer orwhose services are obtained through a contract with another firm.

2
concern. Piece rates and other incentive payments may be used to ensure productivity in lieu
of efficiency wages or monitoring.
In many regions of the country, especially in California, growers use FLCs to provide
labor and often to supervise these workers. FLCs tend to pay lower wages than direct-hire
growers. We will empirically examine whether the tradeoff between higher wages and
monitoring costs can help explain differences in wages between FLCs and direct-hire
employers.
We first discuss the underlying theories. Then we describe the data set. Next we
report on a number of studies that test for efficiency wages and deferred wages. We then
consider some alternative explanations. In our concluding section, we list some reasons why
the use of efficiency wages has important policy implications.
PREVENTING SHIRKING
A major objective of any employer is to prevent shirking and maintain high levels of
output by employees. Employers try to prevent workers from shirking using productivity
incentives such as piece rates, monitoring, or efficiency wages (or other forms of bonding).
Piece Rates
The most direct approach to preventing shirking, providing productivity bonuses or
piece-rate compensation, is widely used in agriculture but is less common in other labor
markets. Extensive prior research shows that workers who are paid by the piece rather than
by the hour work much faster though possibly less carefully (which matters when harvesting
delicate fruit). For example, Billikopf (1995) reports that employees paid by the piece prune

3
a vineyard in only 19 hours of work per acre compared to 26 hours for employees paid by the
hour. Foster and Rosenzweig (1994) find that agriculture workers (in the Philippines) who
are self employed or who are paid by the piece use up 10% more body mass net of calorie
consumption — indicating that they put forth greater effort — than do time-rate workers.
Monitoring
Closely supervising workers can also maintain high levels of productivity. There are
two problems with extensive monitoring. First, it is expensive. Second, research in other
labor markets indicates that excessively close monitoring can backfire. Workers may perceive
extensive or increased monitoring as an indication of distrust, which may cause them to
reduce their work effort. Frey (1993) hypothesizes that this "crowding out of work effort"
effect is likely to dominate when the relationship between supervisors and employees is
personal (as one might expect in agriculture), while the "disciplining" effect is likely to
dominate when the relationship is distant (as in a competitive market setting). A study by
Barkema (1995) of 116 managers in medium-sized Dutch firms supports this view. Managers
work effort was measured by their hours of work. The intensity of monitoring was measured
by the regularity with which their performance is evaluated, the formality of the evaluation
procedure, and the degree to which the managers were evaluated by well-defined criteria.
The effectiveness of monitoring depended on who was monitoring. When managers were
monitored by the parent company (a relatively impersonal relationship), more monitoring lead
to more effort. When managers were monitored by their firm’s chief executive (a relatively
personal relationship), monitoring lead to less effort. And, when managers were monitored by

4
a board of directors (an intermediate case), monitoring did not have a statistically significant
effect.
Relatively little is known about which agricultural employers extensively supervise and
which do not. Employer who can speak Spanish, for example, are more likely to directly
supervise workers than those who do not. Using a random sample of Fresno County growers,
Isé et al. (1994, 1996) found that farmers who speak Spanish well are twice as likely to hire
directly as to use FLCs, whereas those who do not speak Spanish at all are twice as likely to
use FLCs as to hire directly.
Smaller-scale employers are more likely to directly monitor workers than larger ones.
Isé et al. (1994, 1996) find that larger farms, which need more workers, rely more heavily on
farm labor contractors: the direct-hire growers in their Fresno County sample have smaller
farms: 328 acres on average compared to 407 acres for those that use farm labor contrac-
tors.2
Bonding, Deferred Payments, and Efficiency Wages
Another approach to maintaining a high level of productivity is to require workers to
post a performance bond that is forfeited if the employee is discovered behaving badly. The
higher the bond, the less frequently the employer needs to monitor to prevent shirking.
Although performance bonds are used by couriers and in a few other labor markets, they are
rarely used in most labor markets, even those involving wealthier workers than those in
agriculture.
2 Unfortunately, our data set does not contain extensive information on the characteristicof employers.

5
If workers place a value ofG on taking it easy on the job and the only punishment
they face for shirking is dismissal, some workers will shirk. If, given the firm’s level of
monitoring, the probability that a worker is caught isθ, and a worker must post a bond ofB
dollars that the worker forfeits if caught not working, a worker who shirks expects to loseθB.
A risk-neutral worker chooses not to shirk if the certain gain from shirking,G, is less than or
equal to the expected penalty,θB, from forfeiting the bond if caught:G ≤ θB. Thus, the
larger the bond, the less monitoring is required to prevent shirking.
Because of agricultural workers have little wealth, posting a bond is obviously
infeasible. Effectively, firms can post bonds for their employees through the use of deferred
payments. For example, a firm pays new workers a low wage for some initial period of
employment. Then, over time, workers that are caught shirking are fired, and those who
remain get higher wages. In another form of deferred wages, the firm provides bonuses or
pensions to only workers who remain with the firm for a substantial period of time. Deferred
payments serve the same function as bonds: By raising the cost of being fired, the firm needs
less monitoring to deter shirking.
Workers care about the present value of their earnings stream over their lifetime. A
firm may offer its workers one of two wage-payment schemes. In the first, the firm paysw
per year for each year that the worker is employed by the firm. In the second arrangement,
the starting wage is less thanw but rises over the years to a wage that exceedsw.
If employees can borrow against future earnings, those who work for one company for
their entire career are indifferent between the two wage-payment schemes if those plans have
identical present values. The firm prefers deferred payments because employees work harder
6
to avoid being fired and losing the high future earnings. If the employer and employee share
the extra output from eliminating shirking in the form of higher profit and larger lifetime
earnings, both the firm and workers prefer the deferred-payment scheme that lowers incen-
tives to shirk.
For the two payment streams to have the same present value, the deferred-payment
scheme must start with very low wages. Because agriculture is a very low wage sector, the
minimum wage largely precludes this possibility (though see Moretti and Perloff, 1999).
If the present value of the deferred payments exceeds that from the constant wage
stream, the deferred payments scheme has elements of an efficiency wage: an unusually high
wage that a firm pays workers as an incentive to avoid shirking. If a worker fired for
shirking can immediately go to another firm and earn the same wage, the worker risks
nothing by shirking. In contrast, a high wage payment raises the cost of getting fired, so it
discourages shirking.3
Suppose that a firm pays each worker an efficiency wagew, which is more than the
going wagew, which an employee would earn elsewhere after being fired for shirking. The
less frequently the firm monitors workers, the greater must be the wage differential between
w andw to prevent shirking.
3 There are other explanations for why efficiency wages lead to higher productivity.Some economists claim that, in less-developed countries, employers pay an efficiency wage— more than they need to hire workers — to ensure that workers can afford to eat wellenough that they can work hard. Other economists (such as Akerlof 1982) and managementexperts, contend that the higher wage acts like a gift, making workers feel beholden or loyalto the firm, so that less (or no) monitoring is needed.

7
A worker decides whether to shirk by comparing the expected loss of earnings from
getting fired to the value,G, that the worker places on shirking. A shirking worker expects to
loseθ(w - w), whereθ is the probability that a shirking worker is caught and fired and the
term in parentheses is the lost earnings from being fired. A risk-neutral worker does not
shirk if the expected loss from being fired is greater than or equal to the gain from shirking:
θ(w - w) ≥ G. Thus, the smallest amount by whichw can exceedw and prevent shirking is
determined where this expression holds with equality,θ(w - w) = G, or w - w = G/θ. The
extra earnings,w - w, is the equivalent of a performance bond in discouraging bad behavior.
From the possible pairs of monitoring levels and efficiency wages that deter shirking,
the firm picks the combination that minimizes its labor cost. The greater the firm’s monitor-
ing cost, the higher the wage paid by the firm to prevent shirking.
Research in other labor markets shows that higher pay or deferred pay may substitute
effectively for direct monitoring and supervision of workers. For example, Rebitzer (1995)
shows that there is an explicit tradeoff between level of supervision and of wages in the
petrochemical industry.
Krueger (1991) finds a tradeoff between higher or deferred wages versus monitoring
by fast-food restaurants. Lack of adequate monitoring in fast-food restaurants leads to absen-
teeism, high turnover, theft, poor service, waste, and neglect of equipment. Shirking and
other bad behavior is more likely to be a problem at restaurants owned by the fast-food chain
than at restaurants they franchise. If the manager of a restaurant is the owner of the franchi-
see, the manager has strong profit motive to work hard and closely supervise employees. In
contrast, at chain-owned restaurants, managers are employees who receive a fixed salary and
8
do not receive bonuses based on performance or the restaurant’s profit, so they are less likely
to carefully monitor other employees. Because company-owned restaurants have a more
severe monitoring problem than franchised restaurants, we would expect them to be more
likely to use financial incentives such as deterred wages or higher wages to prevent shirking.
Krueger finds that, controlling for tasks performed and characteristics of workers, company-
owned restaurants pay low-level managers 9 percent more and crew workers 1 to 2 percent
more than do franchise restaurants. The tenure-earnings profile is steeper at company-owned
restaurants for both managers and crew workers.
Farm Labor Contractors
Farm Labor Contractors are extensively and increasingly used in California and to a
lesser extent in other areas of the country. Some FLCs provide only labor, but many also
supervise the workers for the grower.Farm Labor Contractors in California(1992) reports
on a large random survey of FLCs. This study finds that 53 percent of FLCs are responsible
for setting performance standards of workers, 14 percent share this decision with growers, and
the remaining third are not involved because that is the grower’s responsibility. Supervision
of workers at the field or site is most often given by foremen and supervisors (64 percent) or
the FLC (29 percent) though a few growers (4 percent) directly supervise.
Whether FLCs are better or worse supervisors than direct-hire growers is not known
and may depend on specific circumstances. If the compensation scheme is such that the FLC
has no vested interest in the productivity of the workers, the FLC may provide minimal
supervision. On the other hand, with appropriate incentives, a FLC who speaks the language
of the workers, may be a better supervisor than a grower who speaks only English. Thus, we

9
cannot predict whether efficiency or deferred payments are used more or less frequently for
FLC employees rather than direct-hire employees.
NATIONAL AGRICULTURAL WORKER SURVEY
Our data set consists of 4,603 observations from the National Agricultural Worker
Survey (NAWS) for 1992 to 1995. The Department of Labor commissioned the NAWS
starting in 1988 in response to the Immigration Reform and Control Act of 1986, which
required the Secretaries of Agriculture and Labor to assess annually the quantity and quality
of agricultural workers in the United States.
The NAWS is an annual survey of a random sample of hired seasonal agricultural
services (SAS) workers. Although only SAS workers are interviewed in the NAWS, SAS is
defined broadly as most field work in perishable crop agriculture. SAS crops are the vast
majority of nursery products, cash grains, field crops, as well as all fruits and vegetables, but
do not include the production of poultry, livestock, silage or other animal fodder (Mines,
Gabbard, and Samardick).
A nationally representative cross-section of SAS workers from 72 counties in 25 states
representing 12 distinct agricultural regions are sampled. For each of the interviewing cycles,
30 counties were selected randomly as interview sites. The number of interviews conducted
during a given cycle is proportional to the share of SAS activity at that time of the year.
Interviews are conducted every four months — in January ("winter" in our tables), May
("spring"), and October — to ensure as diverse a representation of workers as possible. See
Mines, Gabbard, and Boccalandro for complete details on the sampling procedure.

10
Table 1 presents summary statistics for the data set. The FLC dummy equals one if
the worker is employed by a FLC and equals zero if the worker is directly employed by a
farmer. The piece-rate dummy equals one if the worker receives any piece-rate compensa-
tion, even if the worker also receives some time-rate compensation.
The tenure variable is the number of years (rounded up to an integer) that an individu-
al has worked with the current employer. Figure 1 shows that the distribution of tenure
(truncated at 22 years where the frequency becomes essentially zero) is very skewed. The
mean tenure is 4 years and the median is 2 years. Over a third (36%) of all workers are em-
ployed for one year or a shorter period. Over half (54%) are employed two years or fewer,
and two-thirds (67%) are employed 57% three years or fewer. The longest observed tenure in
the sample is 38 years.
The mean value of tenure is 7.02 time-rate, direct-hire employees, 8.76 for time-rate,
FLC workers, 6.59 for piece-rate, direct-hire workers, and 8.62 for piece-rate, FLC workers.
Because the tenure distributions are highly skewed, the means are much higher than the
medians.
In addition to citizens, there are three other legal status categories. The base group in
our regressions is immigrants who are lack legal permission to work in this country. Some
undocumented immigrants received amnesty under IRCA, so that they can become permanent
residents or citizens and work legally in this country. The final category is other immigrants
who can legally work in this country, most of whom are permanent residents.

11
RESULTS
Using the NAWS, we tested whether the implications of the efficiency wage and
deferred wage theories are consistent with wage and fringe benefits in agriculture.
Wages
We regress the logarithm of the wage on standard individual characteristics, job
tenure, an FLC dummy, the interaction between tenure and FLC, a piece-rate compensation
dummy, and an interaction between tenure and the piece-rate dummy.4 If wage earnings are
deferred, wages should increase with tenure.
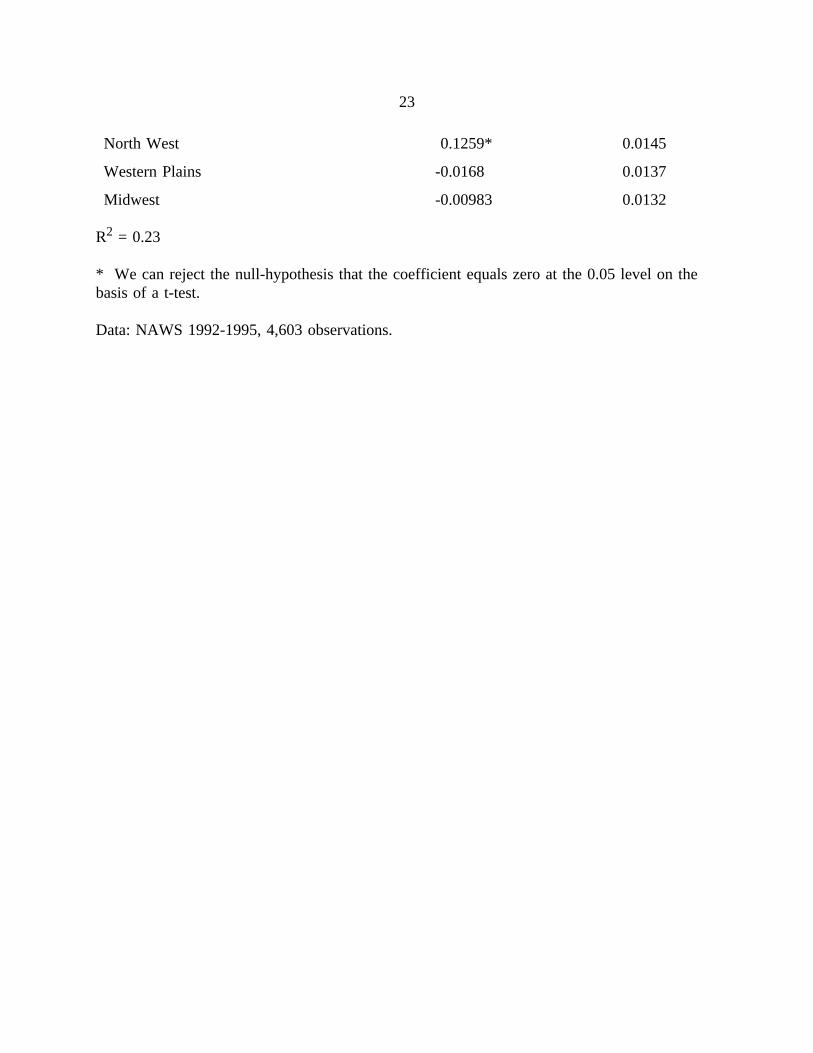
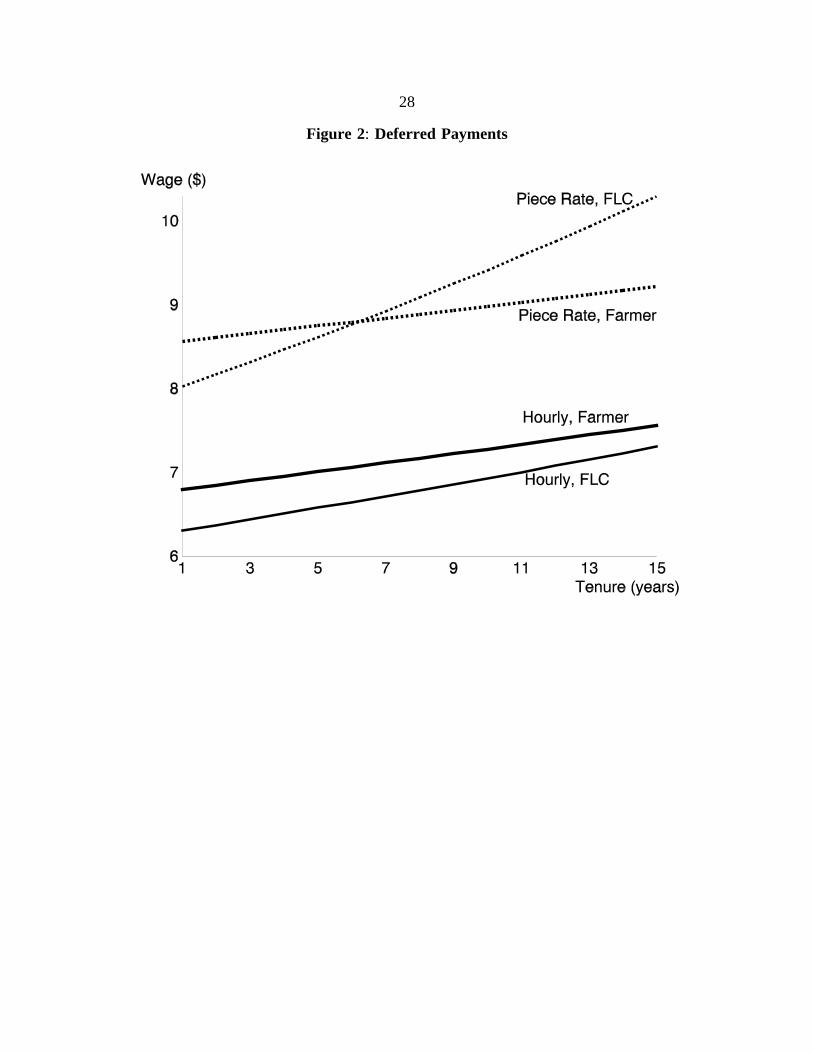
Table 2 shows the estimated log wage equation. The coefficients on the demographic
variables that are usually included in wage equations have the expected signs. The equation
strongly supports the view that wages increase with tenure. Figure 2 shows that the wage-
tenure profile is statistically significantly upward sloping for all four compensation-employ-
ment groups.5 The F-statistic that the tenure variables are collectively different from zero is
21.9. The comparable F-statistic on the piece-rate terms is 219.2 and that on the FLC terms
is 14.3. Thus, we reject all three null-hypotheses that the tenure, piece rate, and FLC terms
are irrelevant.
4 The regression is estimated using ordinary least squares. Though one might argue thatsome of these variables are endogenous, we do not have enough instruments to practically useinstrumental variables techniques. As a consequence, some caution should be shown ininterpreting our coefficients and test statistics.
5 Because the tenure measure is censored (the length of employment is rounded up tointeger value of years), the coefficient on the tenure variables are likely to be biased down-ward, which works against the efficiency wage hypothesis. Thus, we are confident thatdeferred wages are paid.
12
The wage-tenure profile for time-rate employees of direct-hire farmers lies strictly
above that for time-rate, FLC employees. The difference in the slopes of these two curves is
not statistically significantly different at the 0.05 level. Thus, consistent with our expectation,
FLCs pay 7.4 percent less than do direct-hire growers (the coefficient on the FLC dummy is -
0.0776). This differential may indicate that direct-hire growers pay an efficiency wage that is
higher than the wage paid by FLCs, the employer of last resort.
If FLCs provide less (more) supervision of workers than do direct-hire farmers,
efficiency wage theory predicts that the tenure-FLC dummy should have a positive (negative)
coefficient. The coefficient is a small positive number that is not statistically significantly
different from zero at the 0.05 level. Thus, the slope of the time-rate workers’ wage-tenure
curves for FLCs and direct-hire farmers are essentially identical. Because both curves have
an upward slope, we may infer that both type of employers use deferred payment similarly to
encourage productive work.
The piece-rate dummy has a positive coefficient as we expected: Piece-rate compensa-
tion provides an incentive for employees to work harder. The coefficient on the piece-rate
dummy is 0.233, so piece-rate workers earn 26 percent more than time-rate employees. We
expect the tenure-piece-rate interaction term to have a zero or negative coefficient for direct-
hire employees. The coefficient is negative and statistically insignificant at the 0.05 level.
In contrast, the tenure-piece-rate-FLC interaction term is relatively large, positive, and
statistically significantly different than zero. Indeed the steepest of the four wage-tenure
profiles is that of the piece-rate, FLC workers. Apparently FLCs are more likely to use
heavily back-loaded deferred payments for piece-rate rather than time-rate employees. The

13
piece-rate, FLC wage-tenure curve intersects the piece-rate, farmer wage-tenure curve from
below at about five years. As the mean is 2.9 years and the median is 2 years for this group
(and virtually none of them have more than 4 or 5 years or tenure), most piece-rate FLC
employees earn less than comparable workers employed directly by farmers.
We repeated this analysis regressing log weekly earnings instead of log wages on the
same right-hand-side variables. The results are similar. The coefficient on tenure is 0.0133
(compared to 0.00761 in the wage equation) with a standard error of 0.00186. Each extra
year of tenure results in 1.3 percent higher weekly earnings. None of the interactions
between tenure and the various dummies is statistically significantly different from zero.
Thus the effect of extra tenure on earnings is the same for all four groups.
Fringes
We examine four fringe benefits by estimating probit equations.6 Two of these
fringes are deferred payments: paid holidays and an end-of-season bonus. We expect these
two to be positively related to tenure in general. We expect the bonus based on the employ-
er’s profit, which should be relatively uncorrelated with an individual worker’s productivity,
to be unrelated to tenure. The incentive bonus should be unrelated or negatively related to
tenure as it serves as a direct incentive and hence is a substitute for deferred payments.
Our results confirm these predictions. In both the paid holidays and end-of-season
bonus probits, tenure has a statistically significant, positive coefficient. None of the interac-
tions with tenure have statistically significant coefficients in the paid holidays equation, but
6 Because many workers failed to provide information about fringes, the sample size forthe probits (1,223) is substantially smaller than for the regression analysis (4,603).

14
the tenure-FLC coefficient is significantly positive. (FLCs are more likely to provide paid
holidays than are direct-hire growers.)
As expected, none of the tenure variables in the employer’s profit probit have a
statistically significant coefficient. An incentive bonus is an alternative to deferred payments.
In the incentive bonus probit equation, tenure has a statistically significant negative coeffi-
cient (and none of the interactions with tenure are statistically significant).
Table 4 shows the marginal effects of a change in tenure on the probability that a
worker receives a given bonus for each of our four groups of workers. The marginal effects
are evaluated at the sample mean of the right-hand-side variables. These effects are relatively
small.
ALTERNATIVE EXPLANATIONS
Our results are consistent with efficiency wage theory. Are there alternative explana-
tions for these phenomenon? We show that three widely used candidate theories — on-the-
job training, dual labor markets, and insurance — do not explain the observed phenomena in
agricultural labor markets.
Employer-financed specific training could explain why the wage rises with tenure.
Although this explanation may be important in other labor markets, it is implausible in
agriculture that such training takes place over a period that lasts more than a few weeks at
most. Our tenure variable is measured in years.
The dual-labor-market theory holds that there are "good" and "bad" jobs, where the
good jobs pay higher wages and provide better working conditions. The former requires more
disciplined workers who are reliable and hard working (toilet training rather than human-

15
capital training). The existence of dual labor markets could explain two levels of wages. For
example, direct-hire growers may provide the good employment wages and conditions and
FLCs the bad wages and conditions. However, this theory fails to explain the presence of
deferred wages and benefits, unlike the efficiency-wage theory.
An efficiency-wage explanation for why direct-hire growers pay higher wages than
FLCs is that these extra payments serve as a bond to prevent shirking. That is, FLCs are
employers of last resort who hire less-skilled or disciplined workers — the ones rejected by
direct-hire growers — and pay them a relatively low "shirker’s" wage.
An alternative explanation is that FLCs can pay a lower wage because they provide
insurance in the form of more steady or longer-term employment. To test this hypothesis, we
regressed the logarithm of tenure on the same right-hand-side variables as in the previous
analyses (other than those involving tenure). The coefficient on the tenure variable is -0.193
(with a standard error of 0.028), so FLC employees have 18 percent less tenure than do those
who work for farmers.7 When we regress hours worked per week on the same right-hand
side variables, the coefficient on the FLC term is -0.145, so FLC employees also work fewer
hours.8 Thus, we reject the alternative theory that FLC can pay a lower wage because they
provide more hours per week or longer-term employment.
7 The coefficient on the piece-rate term is -0.096 (with a standard error of 0.024), sothat piece-rate workers have 9 percent less tenure than time-rate employees.
8 The coefficient on the piece-rate term is -0.190 (with a standard error of 0.016).

16
CONCLUSIONS
We find empirical regularities that are consistent with efficiency wage theory and
inconsistent with three competing theories. Based on this evidence, we believe that the higher
wages that direct-hire growers pay relative to those of FLCs are efficiency wages. All
employers increase wages with tenure to provide an incentive for workers to avoid being fired
due to shirking. Similarly, the probability of receiving a fringe benefit that provides deferred
payments increases with tenure; whereas, the probability of receiving other fringe benefits
does not.
Future research may be able to test efficiency-wage theory directly. A direct test
would be to show that efficiency wages and deferred payments increase productivity (as has
been shown for piece rates).
It is important to know if efficiency wage theory holds in agriculture as it would have
important implications for various policies. Because agricultural workers are among the
lowest paid workers in the United States, state and federal governments regularly debate laws
to assist and protect agricultural workers including mandating certain benefits (vacation and
other bonuses, health insurance, unemployment insurance); regulating employer-provided
housing, tools, travel, and sanitation; and setting special provisions in minimum wage laws.
Some economists and growers question the wisdom of requiring benefits and regulat-
ing on the grounds that doing so will lower wages — a tradeoff that is predicted by the
traditional compensating wage differential theory. One response to this argument is that the
compensating wage differential theory apparently does not hold in this market. There is
substantial evidence (e.g., Hashida) that agricultural employers who provide superior benefits

17
also tend to pay high wages. Efficiency wage theory may explain some of these noncompen-
sating wage effects.
Similarly, the effect of minimum wage laws could depend crucially on whether
efficiency wages are paid. Rebitzer and Taylor (1995) showed theoretically that minimum
wage laws could increase employment in a market in which efficiency wages are used for
much the same reason as in a monopsony market.

18
References
Akerlof, George A., "Labor Contracts as Partial Gift Exchanges,"Quarterly Journal of
Economics, 97(4), November 1982:543-69.
Barkema, Harry G., "Do Top Managers Work Harder When They Are Monitored?"Kyklos,
48(1), 1995:19-42.
Billikopf, Gregory Encina, "High Piece-Rate Wages Do Not Reduce Hours Worked,"Califor-
nia Agriculture, 49(1), January-February 1995:17-8.
Foster, Andrew D., and Mark R. Rosenzweig, "A Test for Moral Hazard in the Labor Market:
Contractual Arrangements, Effort, and Health,"Review of Economics and Statistics,
76(2), May 1994:213-27.
Farm Labor Contractors in California, Labor Market Information Division, Employment
Development Department, California Agricultural Studies 92-2, 1992.
Frey, Bruno S., "Does Monitoring Increase Work Effort? The Rivalry with Trust and
Loyalty," Economic Inquiry, 31(4), October 1993:663-70.
Hashida, Emiko, "The Effects of Work Histories on Agricultural Wages," in her University of
California, Berkeley Ph.D. Dissertation, 1995.
Isé, Sabrina, Jeffrey M. Perloff, Stephen R. Sutter, and Suzanne Vaupel,Directly Hiring
Workers Versus Using Farm Labor Contractors, U. C. Cooperative Extension,
Agricultural Personnel Management Program, Publication APMP003, 1994.
Isé, Sabrina, Jeffrey M. Perloff, Stephen R. Sutter, and Suzanne Vaupel, "Why Do Some
Growers Use Farm Labor Contractors and Others Hire Workers Directly?"California
Agriculture, 60(2), March-April 1996: 17-20.
19
Krueger, Alan B., "Ownership, Agency, and Wages: An Examination of Franchising in the
Fast Food Industry,"Quarterly Journal of Economics, 106(1), February 1991:75-101.
Lazear, Edward P., "Why Is There Mandatory Retirement?"Journal of Political Economy,
87(6), December 1979:606-20.
Mines, Richard, Susan Gabbard, and Beatriz Boccalandro.Findings from the National
Agricultural Workers Survey (NAWS) 1990: A Demographic and Employment Profile
of Perishable Crop Farm Workers, Office of Program Economics, Research Report
No. 1. Office of the Assistant Secretary for Policy, U.S. Department of Labor, 1991.
Mines, Richard, Susan Gabbard, and Ruth Samardick.U.S. Farmworkers in the Post-IRCA
Period: Based on Data from the National Agricultural Workers Survey (NAWS), Office
of Program Economics, Research Report No. 4. Office of the Assistant Secretary for
Policy, U. S. Department of Labor, 1993.
Moretti, Enrico, and Jeffrey M. Perloff. "Minimum Wage Laws Lower Some Agricultural
Wages." Department of Agricultural and Resource Economics, University of Califor-
nia, Berkeley Working Paper, 1999.
Rebitzer, James B. "Is There a Trade-Off Between Supervision and Wages?"Journal of
Economic Behavior and Organization, 28(1), September 1995:107-29.
Rebitzer, James B., and Lowell J. Taylor. "The Consequences of Minimum Wage Laws:
Some New Theoretical Ideas."Journal of Public Economics56(2), February
1995:245-55.

20
Table 1: Means
Mean(Standard Error)
Binary Variables
Farm Labor Contractor (FLC) Employee 0.09
Paid a Piece Rate 0.12
White 0.61
Hispanic 0.77
Female 0.21
Citizen 0.33
Amnesty 0.35
Other Legal Immigrant 0.25
Speak English Well 0.26
Read English Well 0.32
Spring 0.24
Summer 0.46
West 0.34
South East 0.08
North West 0.06
Western Plains 0.19
Midwest 0.11
Paid Holidays 0.16
End-of-Season Bonus 0.42
Bonus based on Employer’s Profit 0.19
Incentive Bonus 0.15
Continuous Variables
Wage ($) 5.76(1.90)
Tenure (years) 3.96(4.55)

21
Age (years) 35.94(11.75)
Age2 1429.61(946.84)
U.S. Farmwork Experience (years) 12.54(9.45)
U.S. Farmwork Experience2 246.43(372.64)
Education (grades) 7.48(3.91)
Data: NAWS 1992-1995, 4,603 observations.

22
Table 2: Log Wage Regression
Variable Coefficient Standard Error
Constant 1.542* 0.0381
Tenure 0.00761* 0.000924
FLC -0.0776* 0.0135
Tenure*FLC 0.00285 0.00302
Piece Rate (PR) 0.233* 0.0126
Tenure*PR -0.00233 0.00260
Tenure*FLC*PR 0.00961* 0.00470
White 0.0246* 0.00785
Hispanic -0.0535* 0.0132
Female -0.0493* 0.00930
Citizen 0.0138 0.0159
Amnesty 0.0169 0.0107
Other Legal Immigrant 0.0301* 0.0123
Age 0.00734* 0.00177
Age2 -0.00010* 0.00002
U.S. Farm Experience 0.00464* 0.00118
U.S. Farm Experience2 -0.00010* 0.00003
Education 0.00454* 0.00116
Speak English Well 0.0205 0.0138
Read English Well 0.00295 0.0172
1992 0.0410 0.0774
1993 -0.0995* 0.00987
1994 -0.0420* 0.00997
Spring -0.0246* 0.0101
Summer 0.00422 0.00859
West 0.00580 0.0121
South East -0.0998* 0.0144
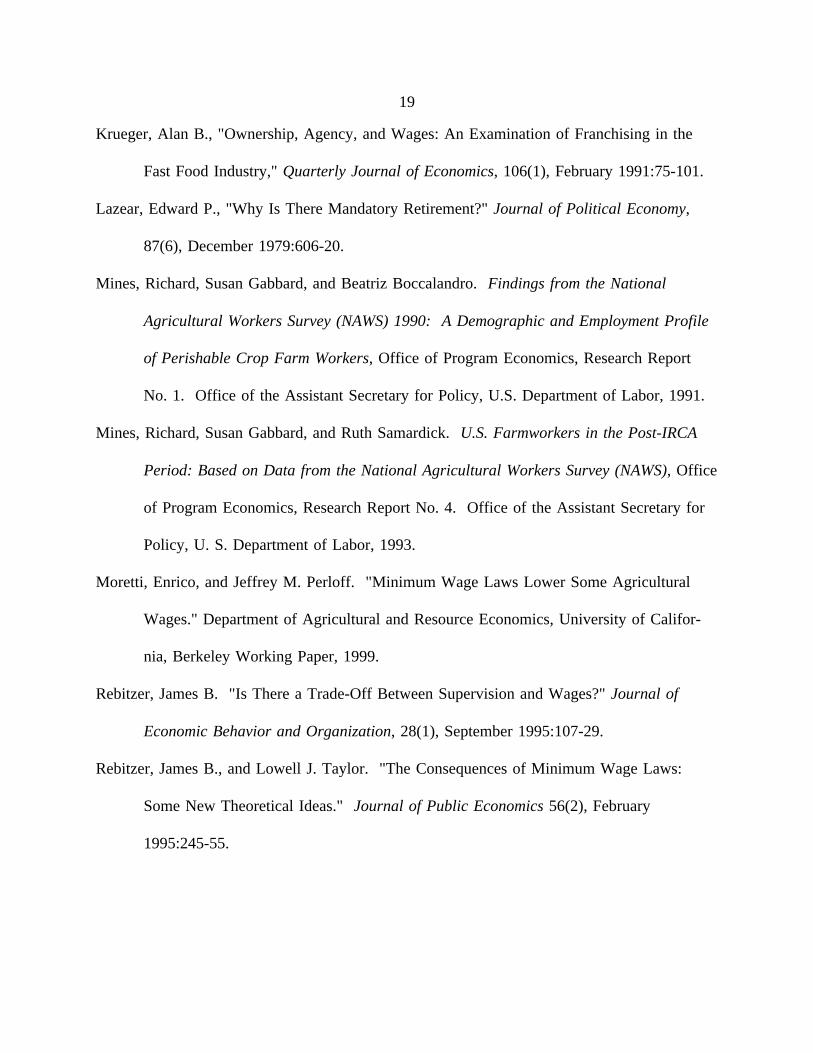
23
North West 0.1259* 0.0145
Western Plains -0.0168 0.0137
Midwest -0.00983 0.0132
R2 = 0.23
* We can reject the null-hypothesis that the coefficient equals zero at the 0.05 level on thebasis of a t-test.
Data: NAWS 1992-1995, 4,603 observations.

24
Table 3: Probit
Paid HolidaysEnd-of-Season
BonusBonus based on
Employer’s Profit Incentive Bonus
Constant -1.1706* 0.3008 -1.3713* -2.2813*
Tenure 0.0243* 0.0177* -0.0096 -0.0244*
FLC 0.7152* -1.0995* -0.9002** 1.1496*
Tenure × FLC -0.0207 0.0838* 0.0269 0.0114
Piece Rate (PR) -0.1393 0.0786 0.2788 0.2624
Tenure × PR -0.0951 -0.0203 0.0147 0.0241
Tenure × FLC × PR 0.1079 -0.2458 -0.1231 -0.0010
White 0.0413 -0.3461* 0.5865* 0.1233
Hispanic -0.5305* 0.8844* -0.2378 -0.4188*
Female 0.1774 0.0913 -1.0391* 0.1315
Citizen -0.1626 0.1138 0.0758 0.2241
Amnesty -0.4090* 0.0521 0.6368* -0.1868
Other legal Immigrant -0.3263 -0.3612* 0.3803 0.3394
Age 0.0327 -0.0225 -0.0004 0.0341
Age2 -0.0005 0.0004 0.00003 -0.0005
U.S. Farmwork Experience -0.0206 0.0109 0.0574* -0.0045
U.S. Farmwork Experience2 0.0007** -0.0005 -0.0017* 0.0005
Education -0.0199 0.0019 -0.0016 0.0062
Speak English Well 0.0897 -0.0091 -0.1747 0.0200
Read English Well 0.0047 0.0819 0.3259 -0.3795
1992 -3.2564 3.0379 6.0520 -2.4196
1993 -0.3440* -0.2988* -0.2274 0.4637*
1994 -0.3733* -0.1925 -0.6292* 0.8195*
Spring 0.1010 -0.5792* -0.1549 0.3420*
Summer -0.3487 -0.5876* 0.2493 0.3518*
West 0.3468 0.1828 -0.9230* 0.0322
South East 1.3095 -0.4353* -0.1817 -0.2046
North West 1.1309 -0.2856 -0.4544** -0.5693
Western Plains 1.0363 -1.0820* 1.1501* -0.8068*
Midwest 1.0331 0.0936 -1.7463* 0.2657

25
Percentage CorrectlyPredicted
88 72 90 85
Predicted
Actual 0 1 0 1 0 1 0 1
0 1,025 18 540 164 952 42 1,006 20
1 134 46 177 342 76 153 168 29
* We can reject the null-hypothesis that the coefficient equals zero at the 0.05 level on the basis of a t-test.** We can reject the null-hypothesis that the coefficient equals zero at the 0.05 level on the basis of a t-test.
Data: NAWS 1992-1995, 1,223 observations.

26
Table 4: Marginal Effects(The derivative of the probability function with respect to tenure at sample means)
Time Rate Piece Rate
Farmer FLC Farmer FLC
Paid Holidays 0.009 0.001 -0.028 0.006
End-of-Season Bonus 0.007 0.040 -0.001 -0.065
Bonus based on Employer’s Profit -0.003 0.006 0.002 -0.036
Incentive Bonus -0.009 -0.005 -0.000 0.004

27
Figure 1: Tenure Distribution
28
Figure 2: Deferred Payments