efficient body motion quantification and similarity
TRANSCRIPT

This article has been accepted for inclusion in a future issue of this journal. Content is final as presented, with the exception of pagination.
IEEE TRANSACTIONS ON SYSTEMS, MAN, AND CYBERNETICS: SYSTEMS 1
Efficient Body Motion Quantification and SimilarityEvaluation Using 3-D Joints Skeleton Coordinates
Aouaidjia Kamel , Bin Sheng , Ping Li , Jinman Kim , and David Dagan Feng , Fellow, IEEE
Abstract—Evaluating whole-body motion is challengingbecause of the articulated nature of the skeleton structure. Eachjoint moves in an unpredictable way with uncountable possi-bilities of movements direction under the influence of one ormany of its parent joints. This paper presents a method forhuman motion quantification via three-dimensional (3-D) bodyjoints coordinates. We calculate a set of metrics that influence thejoints movement considering the motion of its parent joints with-out requiring prior knowledge of the motion parameters. Onlythe raw joints coordinates data of a motion sequence are neededto automatically estimate the transformation matrix of the jointsbetween frames. We also consider the angles between limbs asa fundamental factor to follow the joints directions. We classifythe joints motion as global motion and local motion. The globalmotion represents the joint movement according to a fixed joint,and the local motion represents the joint movement accordingto its first parent joint. In order to evaluate the performance ofthe proposed method, we also propose a comparison algorithmbetween two skeletons motions based on the quantified metrics.We measured the comparative similarity between the 3-D jointscoordinates on Microsoft Kinect V2 and UTD-MHAD dataset.User studies were conducted to evaluate the performance underdifferent factors. Various results and comparisons have shownthat our method effectively quantifies and evaluates the motionsimilarity.
Index Terms—Human–computer interaction, motion quan-tification, similarity evaluation, three-dimensional (3-D) humanmotion representation.
Manuscript received December 4, 2018; revised February 21, 2019;accepted May 4, 2019. This work was supported in part by the NationalNatural Science Foundation of China under Grant 61872241 and Grant61572316, in part by the National Key Research and Development Programof China under Grant 2017YFE0104000 and Grant 2016YFC1300302, inpart by the Macau Science and Technology Development Fund under Grant0027/2018/A1, and in part by the Science and Technology Commission ofShanghai Municipality under Grant 18410750700, Grant 17411952600, andGrant 16DZ0501100. This paper was recommended by Associate EditorR. Roberts. (Corresponding author: Bin Sheng.)
A. Kamel is with the Department of Computer Science and Engineering,Shanghai Jiao Tong University, Shanghai 200240, China.
B. Sheng is with the Department of Computer Science and Engineering,Shanghai Jiao Tong University, Shanghai 200240, China, and also with theMoE Key Laboratory of Artificial Intelligence, Shanghai Jiao Tong University,Shanghai 200240, China (e-mail: [email protected]).
P. Li is with the Department of Computing, Hong Kong PolytechnicUniversity, Hong Kong (e-mail: [email protected]).
J. Kim and D. D. Feng are with the Biomedical and MultimediaInformation Technology Research Group, School of InformationTechnologies, University of Sydney, Sydney, NSW 2006, Australia (e-mail:[email protected]).
Color versions of one or more of the figures in this paper are availableonline at http://ieeexplore.ieee.org.
Digital Object Identifier 10.1109/TSMC.2019.2916896
I. INTRODUCTION
UNDERSTANDING human behavior is indispensable forautomating many tasks. Human body motion analysis
is a branch of understanding human behavior, and itis fundamental for various applications, such as surveil-lance [1]–[3], human–computer interaction [4]–[6], healthcare of the elderly [7], [8], human gait analysis [9], [10],and robotics [11]–[16]. A variety of motion capture systemshave been built to capture the human motion using differenttechniques, including wearable devices and sensors, multiplecameras, or even a single camera. Some of the systemscombine many devices together to improve the capturingquality and generate accurate positions of the human bodyjoints. Recently, the fast development in machine learningalgorithms [17], [18] greatly improved the quality of motiondata. Microsoft Kinect [19] can accurately estimate three-dimensional (3-D) human body joints to form a skeletonmodel from a single depth image using the method in [20].Real-time motion capture from just a single RGB image isproposed in [21] via a deep learning convolutional neuralnetwork (CNN) model to estimate accurate 3-D human bodyposes.
The accuracy of the body key joints generated from therecently developed systems motivated researchers to work onunderstanding and analyzing the human motion to extractinformative data that can be useful for exploitation in severalapplications. A lot of attempts have been made to recognizethe human actions from a 3-D skeleton model through pro-cessing the joints coordinates [22]–[24]. However, all thoseproposed methods can only recognize a limited number ofactions from training samples of a dataset because there areunlimited possibilities of the body movements that make itextremely difficult to recognize all possible actions. One bigchallenge facing the human motion analysis in general is thesensitivity of the joints motion in 3-D space. The articulatednature of the human body complicates the representation andthe quantification of the body motion because the movementof any joint can be due to itself or due to the movement of oneor many of its parent joints. This restriction makes it ambigu-ous to distinguish the motions just by looking at the jointmovement. For example, the movement of the wrist joint canbe due to itself, due to the elbow, due to the shoulder, or dueto the movement of the whole body. Moreover, without a clueabout the joints direction, the movement of a joint from rightto left or left to right will be considered the same if they havethe same trajectory shape. Furthermore, it is difficult to knowexactly whether the shape of the joint movement trajectory
2168-2216 c© 2019 IEEE. Personal use is permitted, but republication/redistribution requires IEEE permission.See http://www.ieee.org/publications_standards/publications/rights/index.html for more information.
This article has been accepted for inclusion in a future issue of this journal. Content is final as presented, with the exception of pagination.
2 IEEE TRANSACTIONS ON SYSTEMS, MAN, AND CYBERNETICS: SYSTEMS
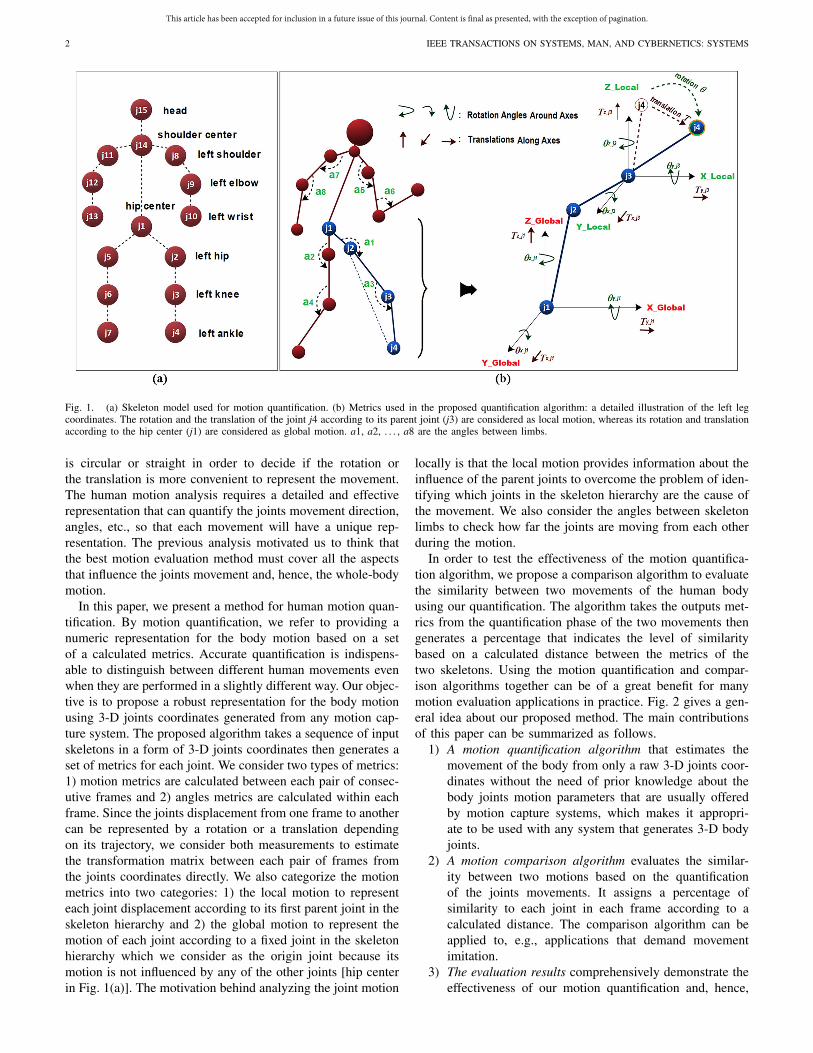
Fig. 1. (a) Skeleton model used for motion quantification. (b) Metrics used in the proposed quantification algorithm: a detailed illustration of the left legcoordinates. The rotation and the translation of the joint j4 according to its parent joint (j3) are considered as local motion, whereas its rotation and translationaccording to the hip center (j1) are considered as global motion. a1, a2, . . . , a8 are the angles between limbs.
is circular or straight in order to decide if the rotation orthe translation is more convenient to represent the movement.The human motion analysis requires a detailed and effectiverepresentation that can quantify the joints movement direction,angles, etc., so that each movement will have a unique rep-resentation. The previous analysis motivated us to think thatthe best motion evaluation method must cover all the aspectsthat influence the joints movement and, hence, the whole-bodymotion.
In this paper, we present a method for human motion quan-tification. By motion quantification, we refer to providing anumeric representation for the body motion based on a setof a calculated metrics. Accurate quantification is indispens-able to distinguish between different human movements evenwhen they are performed in a slightly different way. Our objec-tive is to propose a robust representation for the body motionusing 3-D joints coordinates generated from any motion cap-ture system. The proposed algorithm takes a sequence of inputskeletons in a form of 3-D joints coordinates then generates aset of metrics for each joint. We consider two types of metrics:1) motion metrics are calculated between each pair of consec-utive frames and 2) angles metrics are calculated within eachframe. Since the joints displacement from one frame to anothercan be represented by a rotation or a translation dependingon its trajectory, we consider both measurements to estimatethe transformation matrix between each pair of frames fromthe joints coordinates directly. We also categorize the motionmetrics into two categories: 1) the local motion to representeach joint displacement according to its first parent joint in theskeleton hierarchy and 2) the global motion to represent themotion of each joint according to a fixed joint in the skeletonhierarchy which we consider as the origin joint because itsmotion is not influenced by any of the other joints [hip centerin Fig. 1(a)]. The motivation behind analyzing the joint motion
locally is that the local motion provides information about theinfluence of the parent joints to overcome the problem of iden-tifying which joints in the skeleton hierarchy are the cause ofthe movement. We also consider the angles between skeletonlimbs to check how far the joints are moving from each otherduring the motion.
In order to test the effectiveness of the motion quantifica-tion algorithm, we propose a comparison algorithm to evaluatethe similarity between two movements of the human bodyusing our quantification. The algorithm takes the outputs met-rics from the quantification phase of the two movements thengenerates a percentage that indicates the level of similaritybased on a calculated distance between the metrics of thetwo skeletons. Using the motion quantification and compar-ison algorithms together can be of a great benefit for manymotion evaluation applications in practice. Fig. 2 gives a gen-eral idea about our proposed method. The main contributionsof this paper can be summarized as follows.
1) A motion quantification algorithm that estimates themovement of the body from only a raw 3-D joints coor-dinates without the need of prior knowledge about thebody joints motion parameters that are usually offeredby motion capture systems, which makes it appropri-ate to be used with any system that generates 3-D bodyjoints.
2) A motion comparison algorithm evaluates the similar-ity between two motions based on the quantificationof the joints movements. It assigns a percentage ofsimilarity to each joint in each frame according to acalculated distance. The comparison algorithm can beapplied to, e.g., applications that demand movementimitation.
3) The evaluation results comprehensively demonstrate theeffectiveness of our motion quantification and, hence,

This article has been accepted for inclusion in a future issue of this journal. Content is final as presented, with the exception of pagination.
KAMEL et al.: EFFICIENT BODY MOTION QUANTIFICATION AND SIMILARITY EVALUATION USING 3-D JOINTS SKELETON COORDINATES 3
Fig. 2. Framework of the proposed motion quantification and comparison method. The motion metrics of the skeleton sequences are calculated (quantification),followed by a comparison between the two metrics according to given thresholds to evaluate the similarity between the two bodies movements.
comparison algorithm. Besides the evaluation on abenchmark dataset, a user study is carried out throughrecording sports movements and comparing the users’performance to test the effectiveness of the proposedmethod in real situations.
The rest of this paper is organized as follows. A review ofthe related work is presented in Section II. Technical details ofour approach are given in Section III followed by the exper-imental results and user study in Section IV. The proposedwork is concluded in Section V.
II. RELATED WORK
In this section, we discuss some of the motion capturesystems and methods used for generating 3-D joints coordi-nates, where our method can be applied. After that we reviewsome of the recent human motion analysis methods followedby a discussion about motion comparison.
A. Motion Capture Systems
Motion capture systems vary by the type of devices usedto capture the motion of the human body, including wearabledevices and sensors, multiple cameras, a single camera, orinvolving multiple types of equipment together. Arsenault andWhitehead [25] presented a system composed of ten wearableinertial sensors connected in the form of a network to deter-mine the change in the body movement. Zhang and Zhang [26]proposed an inexpensive human motion capture system pro-totype using a flexible architecture and distributed computingtechnology. Tao et al. [27] proposed a wearable motion capture
microsensor system to capture the motion in real time, then a3-D model of the human body is employed to reconstruct themotion. The introduction of time-of-flight cameras provideddepth cues of the human body, which makes using wear-able devices less required for capturing the human motion.Later on, depth cameras became the basis of several proposedmotion capture systems. Ganapathi et al. [28] proposed analgorithm involves a generative model and a discriminativemodel to filter a stream of monocular depth images in order tocapture the human motion at the frame rate from a single depthcamera. Microsoft Kinect [19] is a popular depth sensor thatcan capture the human motion by generating an accurate bodyjoints from a single depth image using the algorithm proposedin [20]. A matching algorithm between the depth map and 3-Dfull-body point cloud is proposed in [29] for accurate poseestimation from a single depth image. Multiple depth cam-eras were exploited in [30] to improve the human body poserecognition using different views. Their method uses multipledepth maps as inputs of a classifier to identify body part regionthrough segmentation, then all the views are merged in a single3-D point clouds to estimate the body pose. Shuai et al. [31]involved multiple Kinect depth cameras to capture the pointcloud of the human body from different views with the helpof a designed ellipsoid-based skeleton to capture the geome-try details of the tracked body. The fusion of multisensors forcapturing human motion is presented in [32]. They combinedvideo data with a small number of inertial sensors to overcomethe weaknesses of using one type of data.
The recent development in machine learning field moti-vated researchers to work on capturing human motion from

This article has been accepted for inclusion in a future issue of this journal. Content is final as presented, with the exception of pagination.
4 IEEE TRANSACTIONS ON SYSTEMS, MAN, AND CYBERNETICS: SYSTEMS
a single RGB image via estimating the body parts positionusing trained models with large datasets. Even though poseestimation from a single RGB image is a challenging taskdue to the lack of depth cues, the complexity of the back-ground, clothing color, and the uncountable possible positionof body parts, many recent successful approaches can esti-mate 3-D body poses from a single RGB image, which makescapturing the human motion easier and cheaper than previousapproaches that involve depth cameras and wearable sen-sors. Moreno-Noguer [33] proposed a human pose estimationmethod using a single RGB image. The method infers 3-Dposes from two-dimensional (2-D) poses, then improves poseestimation precision by representing the problem as a learning2-D to 3-D human poses using a distance matrix for regression.Predicting 3-D human poses from multiview RGB images isproposed in [34] to avoid using large dataset for training.VNect [21] is a recent successful method that captures 3-Dhuman poses in real time from a single RGB image. Themethod jointly predicts 2-D and 3-D human body poses usingCNNs, then a skeleton kinematic model is used for fitting 2-Dto 3-D poses to generate stable angles between joints.
B. Motion Analysis
The development in motion capture systems opened theway to exploit the data for motion analysis and understandinghuman behavior. A variety of algorithms based on machinelearning have been proposed to recognize the human actionsfrom a 3-D skeleton model. Gaglio et al. [22] exploitedthe joints detected by Microsoft Kinect for activity recog-nition using three machine learning algorithms: 1) K-meansclustering to find the joints involved in the activity; 2) sup-port vector machines (SVMs) for postures refinement; and3) hidden Markov models (HMMs) to model human activities.Du et al. [35] transformed the skeleton joints coordinates toan RGB image where each of the three channels of the imagerepresents the motion features along one of the Cartesian coor-dinates axes. In [23], the skeleton of the human body is dividedinto five parts, each part is used as an input to five recurrentneural networks which are fused together to classify humanactions. Wang et al. [24], [36] transformed the skeleton jointstrajectories shapes from 3-D space into three images to rep-resent the front view, the top view, and the side view of thejoints trajectories shapes. The three views are given to a CNNmodel for action classification.
To the best of our knowledge, there are very limitedproposed approaches for motion quantification or compari-son. Chen and Koskela [37] proposed an alignment methodbetween two motion sequences using dynamic time warp-ing, one sequence was recorded by the Kinect and the othersequence was recorded by another motion capture system.Their method calculates a similarity matrix between the twosequences to find the minimum distance for alignment. In [38],a comparison between human and robot motions based on theskeleton data is proposed. The movement of both human androbot are modeled by an HMM. However, their method worksonly on limited types of movements learned by the model.
III. METHOD
A. Overview
The challenge facing human motion analysis and evalua-tion is the lack of a strong representation that can provide adistinctive description of each movement even though whenthe difference in motion is small. In spite of the fact thatthe previous approaches mentioned in Section II tried to rec-ognize a limited number of human actions by classificationbased on predefined movements, the human motion needsa detailed representation to model any type of movement,which is the key factors for many human–machine interactionapplications. From the literature of the state-of-the-art motioncapture systems and motion analysis methods, we found thatthe best data type to represent the motion of the human bodyis a skeleton model of 3-D joints since it provides preciseinformation about the body movement. In this paper, we usethe skeleton model presented in Fig. 1(a) for motion analy-sis and experiments. We chose 15 essential joints which areenough to cover informative details of the human motion.First, we propose an algorithm to quantify the motion basedon metrics calculated from the 3-D joints. Second, in orderto test the performance of the quantification algorithm, wepropose a comparison algorithm between two motions basedon the quantification metrics to evaluate the motion similaritybetween two existing movements.
B. Motion Quantification
There are unlimited possibilities of the joints movementdirection because of the articulated nature of the human body,which makes taking the changing in 3-D Cartesian coordi-nates of the joints as a factor for motion quantification is notenough. As a matter of fact, two similar motions may have dif-ferent Cartesian coordinates due to the large numerical spaceof the coordinates values. Even though when two motionshave the same joints coordinates, we do not know whether ajoint is moving by itself or under the influence of other joints.Furthermore, the movement direction is unknown. We proposea set of metrics that analyze the skeleton joints motion frommany aspects for the sake of providing a distinctive representa-tion of each motion, including the rotation and the translationof the joints according to the whole body and according toits parent joints. We also consider the angles between limbsas an essential metric to gather information about the jointsdirection. The only input data required to apply the quantifi-cation algorithm are the raw Cartesian coordinates of the 15joints [Fig. 1(a)], then our proposed algorithm will estimatethe motion metrics automatically.
The mathematic geometric representation of any point dis-placement in 3-D space can be defined by the rotation and thetranslation in the form of a transformation matrix. We adoptthis mathematic transformation to represent the movement ofthe joints from frame to another during the motion. The rota-tion is defined as the changing in the angles around the threeaxes of the Cartesian coordinates system, and the translation isdefined as the changing in the distance along the three axes.We use both metrics to represent the joints motion in 3-Dcoordinates system. In order to make the hip center the origin

This article has been accepted for inclusion in a future issue of this journal. Content is final as presented, with the exception of pagination.
KAMEL et al.: EFFICIENT BODY MOTION QUANTIFICATION AND SIMILARITY EVALUATION USING 3-D JOINTS SKELETON COORDINATES 5
Algorithm 1 Motion Quantification1: function QUANTIFY (Sk, N_frms)2: Sk: Skeleton joints3: Gr, Gt: Global Rotation and Global Translation4: GM, LM: Global and Local transformation Matrices5: for i = 1 to N_frms do
6: for j = 1 to 15 do
7: [Gr(i, j), Gt(i, j)] = Kabsch([Sk(i−1,j), Sk(i,j), Sk(i+1,j)])
8: GM(i, j) = [Gr(i, j) Gt(i, j) [0 0 0 1]t]
9: [G_θx(i, j), G_θy(i, j), G_θz(i, j)] = Eurler(Gr(i, j))
10: LM(i, j) = GM(i, j) × [LM(i, p1) × . . . × LM(i, 1)]−1
11: [Lr(i, j), Lt(i, j)] = LM(i, j)
12: [L_θx(i, j), L_θy(i, j), L_θz(i, j)] = Eurler(Lr(i, j))
13: G_Motion(i, j) = [G_θx(i, j), G_θy(i, j), G_θz(i, j), Gt(i, j)]
14: L_Motion(i, j) = [L_θx(i, j), L_θy(i, j), L_θz(i, j), Lt(i, j)]
15: end for
16: for k = 1 to 8 do
17: Angles(k) = CalcAngle(Sk(i, k), Sk(i, pr), Sk(i, ch))
18: end for
19: end for
20: return G_Motion, L_Motion, Angles
21: end function
of the coordinate system, we normalize the joints coordinatesby subtracting the coordinates of the hip center j1 (Fig. 1)from their coordinates values. As we previously mentioned,we categorize the motion into global and local. The globalmotion is evaluated according to the hip center joint, and thelocal motion is evaluated by taking the first parent joint as theorigin of the system. Besides the local and the global motionmetrics, we also consider the angles between skeleton limbs asan essential factor for analysis. The angles between limbs pro-vide critical information about the joints direction by knowinghow the joints are moving from each other during the motion.Algorithm 1 (motion quantification) presents a detailed illus-tration of the motion quantification. In the following sections,we illustrate in details the quantification method.
1) Global Motion (Global Transformation Matrix): Wedefine the global motion as the joints movement by consider-ing the hip center joint as the origin of the coordinates system.For the global motion, we only care about how the jointsmove around the origin without taking into consideration themovement of its parent joints. The rotation and the transla-tion of a joint can be deduced from the transformation matrix.However, the only motion data that we have are the jointscoordinates in each frame. We propose an approach to esti-mate the rotation and the translation of the joints from onlythe joints coordinates by using the Kabsch [39] algorithm,which was proposed to estimate the rotation and the transla-tion between two groups of 3-D points given the start and theend coordinates of their displacement, where all the points areassumed to be moved with the same rotation and translation.Each group must contain at least two points. However, duringthe movement of the human body, the joints do not move inthe same way due to the articulated skeleton structure, which
Fig. 3. Two sets (A and B) formed from the same joint to determine its trans-formation using the Kabsch algorithm. The two sets represent the movementof the same joint from the frame i − 1 to the frame i and from the frame i tothe frame i + 1.
makes choosing a group of joints that move from a frame i toa frame i + 1 is impossible.
Since the change in the joints coordinates from a frame toanother during the motion is unnoticeable with a high framerate, we suppose that any joint displacement from the framei − 1 to the frame i and from the frame i to the frame i + 1has the same transformation matrix. We use the coordinatesof each joint to create two sets of its displacement from oneframe to another to determine its transformation matrix usingthe Kabsch algorithm. Each set contains two points. The firstset A contains the coordinates of the joint j in the frames i−1and i. The second set B contains the coordinates of the joint jin the frames i and i+1. Fig. 3 illustrates the formation of thetwo sets used to apply the Kabsch algorithm, and (1) definesthe problem of determining the rotation and the translationof a joint (point) X of a set A to its corresponding coordi-nates Y of a set B. Equations (2)–(6) illustrate the steps ofthe Kabsch algorithm to calculate the rotation matrix R andthe translation vector T , and hence, the transformation matrix.The goal of this calculation is to get the global rotation angles(θx, θy, θz) around the three axes, and the global translation(tx, ty, tz) along the three axes (last column of the transforma-tion matrix). In spite of the fact that we involved the framei − 1 in the calculation to apply the Kabsch algorithm, ourobjective is to determine the joint movement from the framei to the frame i + 1
X = R × Y + T (1)

This article has been accepted for inclusion in a future issue of this journal. Content is final as presented, with the exception of pagination.
6 IEEE TRANSACTIONS ON SYSTEMS, MAN, AND CYBERNETICS: SYSTEMS
where R is the rotation matrix and T is the translation vector.X is the starting point of the movement and Y is the endingpoint of the movement
SetA ={
P1A, P2
A, . . . , PNA
}
SetB ={
P1B, P2
B, . . . , PNB
}(2)
CentA = 1
N
N∑i=1
PiA CentB = 1
N
N∑i=1
PiB (3)
where SetA and SetB are the starting and the ending sets of3-D joints. Pj
A is the coordinates of the joint j in the startingframe and Pj
B represents its corresponding joint coordinatesin the ending frame. In our case, we use only sets of twojoints coordinates (Fig. 3), where in our case N = 2 (twojoints). CentA and CentB are the centroid of SetA and SetB,respectively
H =N∑
i=1
(Pi
A − CentA)(
PiB − CentB
)t(4)
[U, S, V] = SVD(H) R = VUt (5)
T = −R × CentA + CentB (6)
where H is the covariance matrix. SVD is theSingularValueDecomposition function that factorizes thematrix H into three matrices (U, S, and V). The rotationmatrix R is calculated from the matrices U and V . T is thetranslation vector where T = [tx ty tz]t. It represents themovement of the points along the axes X, Y , and Z
TF =
⎡⎢⎢⎣
txR ty
tz0 0 0 1
⎤⎥⎥⎦ (7)
where TF is the transformation matrix of the joints movementfrom SetA to SetB
θx, θy, θz = Euler(R) (8)
where Euler is a function calculates the rotation angles θx, θy,and θz around the axes X, Y , and Z, respectively, from therotation matrix R.
2) Local Motion (Local Transformation Matrix): We definethe local motion as the movement of each joint according toits parent joint. The calculation of the local motion metrics isbased on taking the parent joint as the origin instead of thehip center joint. Fig. 1(b) illustrates the difference betweenthe global and the local joint metrics. For example, the localmotion of the joint j4 in the figure is calculated according toits parent joint j3 with the coordinate system Xj3, Yj3, and Zj3.However, the global motion of the joint j4 is calculated accord-ing to the joint j1 (hip center) with the coordinate systemXj1, Yj1, and Zj1. Same case for the joint j3 with its localmotion according to its parent joint j2 and the global motionaccording to the joint j1. The case of the joint j2 is a little dif-ferent because its parent joint is the same as the origin joint,which makes the local motion metrics are the same as theglobal metrics.
The global transformation matrix of a joint can be writ-ten as the product of the local transformations of its parentjoints in the hierarchy sequence until the hip center joint. Inorder to obtain the local transformation matrix of a joint, wemultiply the global transformation (calculated previously) andthe inverse of the product of the local transformations of itsparent joints. After calculating the local transformation matrix,we get the local rotation (θx, θy, θz) and translation metrics(tx, ty, tz) using (7) and (8)
Mglobal(j) =∏
Mlocal(j) · Mlocal(j−1) · · · · Mlocal(j1) (9)
Mlocal(j) = Mglobal(j).[Mlocal(j−1) · · · · Mlocal(j1)
]−1 (10)
where Mglobal(j) is the global transformation matrix of the jointj, and Mlocal(j) is the local transformation matrix of the joint j.Mlocal(j−1) · · · · Mlocal(j1) are the local transformation matricesof the parent joints from the joint j − 1 to the origin j1 (hipcenter) in the hierarchy.
3) Angles Between Limbs: The angles between limbs deter-mine the direction of the joints by checking the size of theangles in each frame, which we consider as an essential param-eter in the motion quantification that provides informationcannot be extracted from the transformation matrix. Fig. 1(b)shows the eight angles (a1, a2, . . . , a8) selected to evaluate themotion between limbs. For example, the change in the anglea3 (left leg) provide clues about the direction of the joint j4.When the angle a3 getting larger, the direction of the joint j4is toward the bottom, and when the angle getting smaller, thejoint direction is toward the top.
We use the law of cosines to calculate the angle of a triangleformed by the limbs based on the coordinates of its vertices.In our case, each of the eight angles is considered as oneof the vertices of the triangle formed with the two adjacentjoints. Fig. 1(b) shows the triangle formed by the joints j2–j4to calculate the angle of the joint j3. Unlike the transforma-tion matrix of the joints that are calculated between frames tomodel the displacement from a frame i to a frame i + 1, theangles between limbs are calculated in each frame i
d(ja,jb) = ‖j(xa, ya, za) − j(xb, yb, zb)‖ (11)
a3 = Ang(j3) = cos−1
(d2(j2,j3)
+ d2(j4,j3)
− d2(j4,j2)
2 ∗ d(j2,j3) ∗ d(j4,j3)
)
(12)
where d(ja,jb) is the Euclidian distance between two joints.Ang(j3) is the angle of the joint j3 calculated from its twoadjacent joints j2 and j4 [a3 in Fig. 1(b)].
C. Motion Comparison
We propose a comparison algorithm between two skele-tons motions to evaluate the performance of the quantificationand provide an evaluation of motion similarity, which canbe used for many human–computer interaction applicationsthat demand imitating movements and automatic similarityevaluation. The comparison algorithm calculates the distancebetween two motions metrics, then evaluates their similaritydepending on a given threshold for each metric. There are

This article has been accepted for inclusion in a future issue of this journal. Content is final as presented, with the exception of pagination.
KAMEL et al.: EFFICIENT BODY MOTION QUANTIFICATION AND SIMILARITY EVALUATION USING 3-D JOINTS SKELETON COORDINATES 7
Algorithm 2 Motion ComparisonInput: Skel1, Skel2, N_frmsOutput: Similarity_PercentageThreshols: Gthθ , Lthθ , Gtht, Ltht, th_angles = [tha1, tha2 . . . tha8]Percentages: Gθ%, Lθ%, Gt%, Lt%, angles% = [a1%, a2% . . . a8%],GFrame% = 0, LFrame% = 0, AngFrame% = 0
1: [G_Motion1, L_Motion1, Angles1] = QUANTIFY(Skel1, Nfrms)
2: [G_Motion2, L_Motion2, Angles2] = QUANTIFY(Skel2, Nfrms)
3: for i = 1 to N_frms do
4: for j = 1 to 15 do
5: [G_dθ, G_dt] = Distance(G_Motion1(i, j), G_Motion2(i, j))
6: [L_dθ, L_dt] = Distance(L_Motion1(i, j), L_Motion2(i, j))
7: if G_dθ ≤ Gthθ then GFrame% = GFrame% + Gθ% end
8: if G_dt ≤ Gtht then GFrame% = GFrame% + Gt% end
9: if L_dθ ≤ Lthθ then LFrame% = LFrame% + Lθ% end
10: if L_dt ≤ Ltht then LFrame% = LFrame% + Lt% end
11: end for12: for k = 1 to 8 do13: [da1, da2, . . . , da8] = Distance(Angles1(i, k), Angles2(i, k))14: if da1 ≤ tha1 then AngFrame% = AngFrame% + a1% end
15:...
16: if da8 ≤ tha8 then AngFrame% = AngFrame% + a8% end17: end for18: if AngFrame% > 65% then19: Frame% = ((GFrame% + LFrame%) + AngFrame%)/220: else21: Frame% = 022: end if23: Sum_Frames = Sum_Frames + Frame%24: end for25: Similarity_Percentage = Sum_Frames / N_frms26: return Similarity_Percentage
three levels for evaluation, joints comparison, frames compar-ison, then whole motion comparison. While the evaluation isbased on a frame with frame comparison, it requires that thetwo motions have the same number of frames. In case thatthe number of frames is different, the algorithm compares thesequence of smaller frames number with the first subsequenceof the second sequence to check the similarity, then the firstsequence is slid to the next subsequence by one frame andthe motion similarity is checked again, etc. The subsequencethat generates high similarity result is considered as the finalresults of the comparison. The superiority of our algorithm lieson checking in which part of the sequence exactly the motionsare similar. For example, the sequence of larger frames maycontain all the skeleton position of the sequence of smallerframes but they are distributed over the sequence. By com-paring the same number of frames, we guaranty that all thepositions must be consecutive in order to generate high similar-ity. The inputs of the comparison algorithm are the metrics oftwo skeleton motions generated from the quantification algo-rithm including, local and global joints transformations, andthe angles between limbs. Algorithm 2 (motion comparison)gives a detailed illustration of the comparison process.
1) Distance Between the Two Motions: In order to comparethe two motions, we calculate the distance between the skele-tons metrics of the two sequences. The distance determineshow different are the translations, rotations, and the angles
between limbs of one skeleton from the other skeleton of thesame joint at the same frame number. Large distance indicatesthat there is a large difference between the joints motions.The diversity of the metrics used for motion quantificationare efficient for motion comparison. For instance, if the dis-tance between the global rotation joints reveals that the jointsmovements are similar, the local rotation distance gives moreproof whether the joints were moved in similar ways. The dis-tance between the angles of the limbs of the two skeletons ateach frame improves the comparison precision by checkingthe joints direction.
2) Threshold Comparison: It is impossible to find twomotions that have exactly the same metrics because of thesensitivity of the joints to the change in the coordinates val-ues. We set a threshold for each metric distance to allow anerror margin for the comparison. During our experiments, thethresholds values were set according to the importance of themetrics and their impact weight on the whole motion. Forexample, we set the threshold of the global rotation greaterthan the local rotation, and the threshold of some angles of thelimbs are set greater than others according to their sensitivityto the change during the motion. For example, the elbow anglea6 is more changeable than the shoulder angle a5 (Fig. 1). InSection IV, we show the influence of changing the thresholdson the motion comparison.
3) Percentage Similarity: The evaluation of the joints sim-ilarity is based on assigning a percentage to each joint toindicate its similarity rate. This rate is calculated based ongiving a partial percentage to each of the joints metrics, includ-ing rotation angles, translation vectors, and limbs angels. Thepartial percentage is assigned to a metric if it is less than athreshold. We consider the sum of the partial percentages ofthe rotation angles and the translation vectors as the first partof the joint evaluation, and the partial percentage of the anglesbetween limbs as the second part. The two parts are averagedto get the final similarity percentage of the joint. After that theevaluation of the whole skeleton motion in each frame is calcu-lated by averaging the percentages of the 15 joints. In the end,the percentage similarity of the whole motion is the averageof all frames percentages calculated previously (Algorithm 2).
IV. EXPERIMENTAL RESULTS
We evaluated our quantification method using the com-parison algorithm on skeleton motions of actions from theUTD-MHAD dataset, and we also performed an evaluation ofmotions on a dataset that we recorded using Microsoft KinectV2 [19] for motion comparison and user study. In both cases,we consider only 15 joints presented in Fig. 1(a) for experi-ments. Also, a comparison on skeleton alignment with existingmethods was also conducted.
A. UTD-MHAD Dataset
1) UTD-MHAD Results: UTD-MHAD dataset [40] wascollected using Microsoft Kinect depth sensor and inertialwearable sensors for action recognition. The dataset contains27 actions, namely right arm swipe to the left, right arm swipeto the right, right-hand wave, two hand front clap, right arm

This article has been accepted for inclusion in a future issue of this journal. Content is final as presented, with the exception of pagination.
8 IEEE TRANSACTIONS ON SYSTEMS, MAN, AND CYBERNETICS: SYSTEMS
Fig. 4. Similarity comparison on pairs of similar actions types from the UTD-MHAD dataset. S: subject (user) and T: trial.
throw, cross arms in the chest, basketball shooting, right-handdraw x, right-hand draw circle (clockwise), right-hand drawcircle (counter clockwise), draw triangle, bowling (right hand),front boxing, baseball swing from right, tennis right-hand fore-hand swing, arm curl (two arms), tennis serve, two hand push,right-hand knock on a door, right-hand catch an object, right-hand pick up and throw, jogging in place, walking in place,sit to stand, stand to sit, forward lunge (left foot forward),and squat (two arms stretch out). The actions have been per-formed by eight subjects, and each subject repeated the actionfour times.
In spite of the fact that the goal of the dataset is to beused to recognize human actions which is different from ourgoal, we exploit the fact that there are similar actions per-formed in different ways by different people to evaluate themotion similarity using our proposed method. Our evaluationmethod is based on choosing two similar actions performedby different subjects or by the same subject, then we applythe proposed algorithm to quantify and compare two actions.The results expected from the algorithm should generate ahigh similarity percentage for actions of the same type anda low percentage for different actions. Fig. 4 shows the eval-uation of the comparison results of randomly selected pairsof subjects performed the same action. The evaluation resultsshow a similarity percentage above 70% in most cases whichis evidence that the proposed quantification and comparisonalgorithms can effectively represent and evaluate the humanmotion. The results vary from one pair to another depending onhow the same action is performed. Many factors could influ-ence the action performance, such as the speed of the subject,and the body parts direction during the movement. For exam-ple, the action: hand catch can be performed with an arm at
the upper body side or at the lower body side which makes thecomparison generates 74% of similarity percentage. However,the actions that are usually performed in similar ways wherethere is no possibility for a large difference in performance,such as: knock on the door, the algorithm generates a highsimilarity percentage (94.22%).
In order to test the performance of the algorithm when themotions are different, we selected 22 pairs of different actionstypes performed by different subjects. Fig. 5 shows a percent-age similarity lower than 40% in all cases. This time also thealgorithm shows the stability in evaluating different actionsby generating a low similarity percentage. The lowest simi-larity percentage is generated for the actions: walking—sit tostand with 19.24% and the actions: sit to stand—stand to sitwith 19.27%. We can notice that the actions are completelydifferent during the skeleton motion which reflects the lowsimilarity percentage. However, for the actions: forward lunge(left foot)—squat, the algorithm generates the highest similar-ity percentage (39.1%) because most of the body parts havecommon movement since both actions performed by bend-ing down. The only difference is that the first action requiresmoving the leg forward while bending. Generally, the resultsgenerated from the proposed quantification and comparisonalgorithms presented in Fig. 4 and Fig. 5 shows that whenthe two motions performed with the same body parts in thesame direction but with a little difference in the performance,the comparison algorithm generates high similarity percentage.However, when there is a difference in the movement direc-tion even in only one body part, the comparison algorithmgenerates a low similarity percentage.
2) Threshold Influence on the UTD-MHAD DatasetActions: Since the comparison between the two motions is

This article has been accepted for inclusion in a future issue of this journal. Content is final as presented, with the exception of pagination.
KAMEL et al.: EFFICIENT BODY MOTION QUANTIFICATION AND SIMILARITY EVALUATION USING 3-D JOINTS SKELETON COORDINATES 9
Fig. 5. Similarity comparison on pairs of different actions types from the UTD-MHAD dataset. S: subject and T: trial.
Fig. 6. Influence of the thresholds on the motion comparison using the UTD-MHAD dataset. On pairs of the (a) same actions and (b) different actions.
based on calculating the distance between the metrics, thejudgment of the motion similarity is based on thresholds. Inorder to investigate the impact of the thresholds on the com-parison, each time we change the thresholds and evaluate thecomparison results. We define two lists of thresholds. The firstlist THiRT = [Gr, Gt, Lr, Tt] represents the threshold list i ofthe rotations and translations. Gr, Gt, Lr, and Lt are the globaland local rotation angles and translation vectors thresholds.The second list THiAngles = [a1, a2, . . . , a8] represents thethresholds list i of the angles a1–a8.
Fig. 6(a) shows the comparison results of four pairs of sim-ilar actions at different thresholds. In Fig. 6(a) top, we fix theangle thresholds at THAngles = [12, 12, 10, 10, 8, 5, 8, 5] andwe changed the THiRT thresholds from TH1RT to TH7RT ,then we check the comparison results. We notice that fromTH4RT to TH7RT , the algorithm generates correct judgmentsfor the four actions pairs. However, for the thresholds TH2RT
and TH3RT , only one pair of actions is judged correctly. Thecomparison results at TH1RT are incorrect for all the fouractions pairs. The reason is that the threshold is too smallso that similar actions were judged as different actions whenthere is a small difference in motion. In Fig. 6(a) bottom,we fix the thresholds THiRT at THiRT = [40, 20, 40, 20] andwe change the angles thresholds from TH1Ang to TH5Ang,then we check the results again. At TH4Ang and TH5Ang, thealgorithm generates a high percentage similarity for the fouractions, but at thresholds TH2RT and TH3RT , only one pairof actions is evaluated as having similar motions. However, atTH1Ang, the algorithm generates a very low percentage sim-ilarity for the four actions because of the small values of theangles thresholds.
In Fig. 6(b), this time, we show the threshold impact onfour pairs of different actions types. We repeat the same pro-cess using the same thresholds values as in Fig. 6(a). InFig. 6(b) top, we fix the angles thresholds at THiAng =[12, 12, 10, 10, 8, 5, 8, 5], then we change the thresholdsTHiRT . The algorithm generates correct judgment for theactions with a percentage of similarity less than 40% forall the four actions pairs from TH1RT to TH6RT . Only onepair of actions is judged as similar at TH7RT because ofthe large thresholds values. However, in Fig. 6(b) bottom,fixing the rotations and translations thresholds at THiRT =[40, 20, 40, 20] and changing the angles threshold fromTH1Ang to TH5Ang generates correct judgment with percent-age similarity less than 40% for all the actions pairs at all thethresholds.
B. User Movements Comparison Study Using Kinect
1) Experimental Settings: Microsoft Kinect can accu-rately estimate 3-D human body joints from a single depthimage [20], which makes it a useful device for human motionanalysis. We recorded four sports movements performed withfive users using Kinect V2 to evaluate the performance ofthe quantification algorithm and analyze its use in real situa-tions with different users. The experiments settings are shownin Fig. 7. The user stands in front of the Kinect, then per-forms the movement from a predefined distance. The sportsmovements are basketball shooting, football kick, baseball batswing, and tennis racquet swing. In fact, each of those sportsmovements can be performed in different ways. For example,

This article has been accepted for inclusion in a future issue of this journal. Content is final as presented, with the exception of pagination.
10 IEEE TRANSACTIONS ON SYSTEMS, MAN, AND CYBERNETICS: SYSTEMS
Fig. 7. Experimental settings to record users motion for user study.
the basketball shooting can be performed with jumping orwithout jumping. Each user performs the movement twice.One time from a distance of 1.8 m from the Kinect andanother time from a distance of 3.6 m. In both cases, theuser performs the movement in the same way. We asked theusers to perform the movements in the way that they know,without teaching them how to perform them. We only requirethat the same movement must be performed with the samebody parts for all the users. For example, the football kickmovement must be performed with the right leg by each user.The reason behind such a restriction is that we want to testthe performance of the algorithms in evaluating the motionsimilarity for the applications that require movements imita-tion, such as sports movements learning. During our analysisof the users’ motions, we check factors that may influence themotion similarity besides the joints movement direction. Wecalculate the motion similarity from two different distances,with users of slightly different heights, and with differentspeed of movements. The five users are named as User1,User2, . . . , User5, which have the heights 1.7, 1.6, 1.78, 1.73,and 1.78 m, respectively. We define the speed of the motionas the number of frames required by the user to complete themovement. Each pair of users performs the same movement,then we compare their performance and check the influenceof the speed, the distance, and the height.
2) Movement Comparison: Here, we categorize themovements by four sports types. For each category, we showthe comparison results of each pair of users. The similaritygenerated from our algorithm in the following experiments isbased on a threshold that was set according to our desiredlevel of similarity after a set of initial trials. Generally, a sim-ilarity value between 50% and 60% is generated when themovements have common motion. When the similarity is get-ting larger above 60%, it means that the movements have morecommon body parts that move in similar directions with almostthe same angles between limbs during the motion. Since thevisual judgment in our method plays an important role, andin order to show the performance of the user compared to thesimilarity generated from the algorithm, in Fig. 8, for eachuser movement, we show the depth frames that indicate a clearchange in motion.
1) Basketball Shooting: Table I (basketball shooting) showsthe similarity comparison of four pairs performed the
TABLE ISIMILARITY COMPARISON ON THE FOUR SPORTS MOVEMENTS
basketball movement which are User3–User5, and Fig. 8(basketball shooting) shows the performance of thethree users from 1.8 m of the camera distance. Wenotice that the performance of User3 is close to User4.Both users imitated shooting the ball without jumping.However, User5 imitated the movement with differentbody position and with jumping while shooting. ThePair1 includes the movements of User3 and User4 fromthe same distance with a difference in speed of nineframes, a difference in height of 5 cm, and a small differ-ence in their positions while performing the movement.While there is no big difference between the conditionsof the two performers, the similarity between them isjudged as 72.08%. In Pair2, the same user performedthe movement twice in the same way presented in Fig. 8(basketball shooting) from short and long distances witha difference in speed of eight frames. This time thealgorithm also generates a high similarity percentage of88.81%. Although the distance from the camera is dif-ferent, the similarity still accurate. A difference in speedof 19 frames between the movements of the Pair3 gener-ates a similarity of 60.4% and a difference of 27 framesfor Pair4 generates a similarity of 44.68. The reasonfor the low similarity generated from the algorithm isthat there is a big difference between their performance.While the algorithm is based on comparing frames of thesame number of order, the difference in speed means thatsimilar frames are not in the same order, and hence, themovements are evaluated as different in performance.

This article has been accepted for inclusion in a future issue of this journal. Content is final as presented, with the exception of pagination.
KAMEL et al.: EFFICIENT BODY MOTION QUANTIFICATION AND SIMILARITY EVALUATION USING 3-D JOINTS SKELETON COORDINATES 11
Fig. 8. Key depth frames of the four sports movements used for user study.
2) Football Kick: The evaluation of the football kickmovements is presented in Table I (football kick), andthe performance of the two users involved in the compar-ison is shown in Fig. 8 (football kick). Pair1 representsthe comparison of the same user (User4) performed themovement from different distances with a small differ-ence in speed of four frames, which leads to generate asimilarity of 75.27%. As we previously have seen withthe basketball movements, the distance from the cam-era does not influence the motion similarity, we canconclude that only the performance of the movementinfluences the motion similarity in this case, given thatthere is a small difference in the speed. The Pair2includes a comparison between User5 and User2 with adifference in height of 18 cm, from the same camera dis-tance and with a large difference in speed (39 frames).By looking at how the movements are performed, we cansay that the low similarity generated from the algorithms(45.74%) is due to the difference in the performance anda large difference in the speed.
3) Baseball Bat Swing: In Table I (baseball bat swing),we show a comparison of a pair of users performed thebaseball bat movement from the same short camera dis-tance with a relatively small difference in height. Theuser’s key body positions are shown in Fig. 8 (baseballbat swing). By looking at the depth frames, we noticethat the movements are different at the beginning andat the end of the two sequences. However, in the restof the frames, the movements look similar according to
the visual observation. The large difference in speed (24frames) and performance leads to a similarity value of65.77%.
4) Tennis Racquet Swing: Table I (tennis racquet swing)shows comparison results of two pairs performing thetennis racquet swing. Pair1 shows a motion similarityof 72.11% for the same user (User1) performed themovement from long and short distances with a differ-ence in speed of nine frames. The key body positionsof User3’s performance are shown in Fig. 8 (tennis rac-quet swing). The second pair (Pair2) shows the results ofthe User1 and the User2 performed the movement fromdifferent distances with the same speed of 45 frames.The position of the bodies during the movement of thetwo users are different from each other. User1 used twohands while swinging, but User3 used only his right-hand while moving his body from the right side to thefront of the camera. The similarity between the two userswas judged as 60% since they have the same speed butdifferent performance. The big difference lies in usingone hand by User1 and two hands by User3.
Fig. 9 presents the 3-D trajectories of the users’ jointsmotion performing the sports movements, including the box-ing movement, and labeled with the speed and the cameradistance. The global shape of all the joints trajectories lookssimilar for the same sport type, whereas due to the sensitiv-ity of the joints to the motion change, rarely when we canhave exactly similar trajectories shapes and size even whenthe depth frames appearance in Fig. 8 look similar.

This article has been accepted for inclusion in a future issue of this journal. Content is final as presented, with the exception of pagination.
12 IEEE TRANSACTIONS ON SYSTEMS, MAN, AND CYBERNETICS: SYSTEMS
Fig. 9. Skeleton motions trajectories of some users mentioned in Table I and Fig. 8.
3) Influential Factors: In the previous analysis of theuser study, we considered some factors (user height, cameradistance, and speed) to check their impact on the motion com-parison using the proposed quantification. By observing theresults of the comparison, we conclude that the height and thedistance from the camera do not have an impact on the motioncomparison. As we have already seen, some of the pairs per-formed the movement from different distances in the sameway but the comparison algorithm generates high similaritypercentage. Same case for the height, where the algorithmgenerates a high similarity percentage regardless of the differ-ence in height. A difference in height and distance means adifference in the joints coordinates values. While the proposedquantification algorithm focuses on how the joints move andnot where the joints are, the height and the distance do notinfluence the comparison. However, the speed has a big influ-ence on the comparison as it is related to user performance.Our algorithm considers the comparison between every twoframes of the same rank, which generates low similarity per-centage for the frames when the difference in speed is largebecause the same body position of the first user could befound after the next n frames of the second user movement.Overall, we notice that when the speed increases, the motionsimilarity decreases in both cases of similar and differentmotions. However, in some cases, when the motions have avery high level of similarity, the difference in speed of fewerthan ten frames does not affect the comparison. Finally, themain factor that influences the motion similarity is how themovement is performed. If a user performs the movement withdifferent body parts from the other user or in different trajec-tory direction, the comparison algorithm will generate a low
similarity percentage even when the two users have the samemovement speed.
4) Thresholds Adjustment: Because of the sensitivity ofjoints coordinates change in 3-D space, it is almost impos-sible to find two motions that have exactly the same metricsvalues even though when they look exactly the same accordingto the visual observation. A threshold is a necessity to allow aninterval of error. Therefore, the adjustment of the threshold isvery important for motion comparison. As we previously haveseen with the evaluation of similar and different actions onthe UTD-MHAD dataset, different thresholds generate differ-ent results. When we want to consider two motions as similareven though there is a small difference in the performance,large thresholds must be used. But if we want the compar-ison algorithm to be very strict in the evaluation, we mustuse small thresholds. For example, the results generated withthe previous user study of the sports movements are gener-ated by adjusting the thresholds each time, then we check theresults of the algorithm with visual observation. The thresholdsused for comparing the sports movements require larger val-ues than the thresholds of UTD-MHAD dataset. Dependingon the level of similarity we are looking for, with othertypes of movements, the algorithm may need larger or smallerthreshold values. In practice, choosing the threshold dependon the experts of the field where the comparison algorithmis applied. For example, applying the algorithm to learn auser practicing some movements, such as martial art sportsmovement based on existing saved movement for comparison,requires the intervention of a coach to decide at what level thecomparison should be strict to set the right threshold. Settingthe right threshold requires initially a set of trails of different

This article has been accepted for inclusion in a future issue of this journal. Content is final as presented, with the exception of pagination.
KAMEL et al.: EFFICIENT BODY MOTION QUANTIFICATION AND SIMILARITY EVALUATION USING 3-D JOINTS SKELETON COORDINATES 13
Fig. 10. Alignment results of seven pairs of skeletons motions generated by SS-DTW, cross-correlation, and our algorithm. The arrows indicate the firstalignment frame of the skeleton sequence in red color with the sequence in blue color.
movements to check the level of similarity each time untilgetting the desired similarity results.
C. Comparison With Existing Methods
According to our knowledge, the closely related work toours is the work proposed in [37]. They presented an algo-rithm to align two sequences of skeletons using subsequencedynamic time warping (SS-DTW), which is a revised ver-sion of DTW. It was used to measure the similarity betweensequences vary in speed and length. The measurement is basedon calculating the distance matrix between the two sequencesand choose the path that corresponds to the minimum dis-tance. Following their experimental settings, we also compareour results with other techniques by using the Euclidian dis-tance (Edist) [37] metric to measure the difference between thealigned sequences as ground truth for evaluation. Our compar-ison was performed with SS-DTW and cross-correlation [37]to evaluate the alignment accuracy of the seven pairs of skele-tons motion presented in Fig. 10. The motions were extractedfrom the sports movements in a way that the large sequence(in blue color) has to contain some of the similar frames ofthe smaller sequence (red color). Due to the limited space,we show only the key frames. Each time we slide the smallersequence by one frame, then we calculate the SS-DTW, cross-correlation, and the similarity between the two sequences usingour comparison algorithm. With each slide, we obtain distancevalues of SS-DTW and cross-correlation, and also a similarityvalue from our algorithm. The sliding process finishes when
the last frames of the two sequences are aligned. The firstframe index of the best alignment for each method is saved,then the Edist is measured to evaluate the three algorithmsdecisions by calculating the distance between the sequencesbased on the previously saved frame index. The algorithmwhich has the minimum distance is considered to have thebest alignment. The results of the comparison are presented inFig. 10. Our algorithm generates distances with less or equalvalues to the other methods in all cases, which means that thealignment decided by our approach is the best one. The figurealso shows the first alignment frame decided by each methodin the seven samples.
V. CONCLUSION
A method for human motion quantification and compari-son has been proposed in this paper. The proposed methodshowed a novel algorithm based on estimating motion met-rics to model the human movement based on the 3-D jointscoordinates. This paper tried to solve a challenging problemin the field of human motion analysis by proposing a set ofmetrics that quantify the human joints movement based onthe rotation and the translation of the joints, and the anglesbetween limbs. The main advantage of the proposed methodis that it can estimate the motion from only 3-D Cartesiancoordinates of the body joints without prior knowledge aboutthe movement parameters. In order to test the effectiveness ofthe motion quantification algorithm, we also proposed a com-parison algorithm to evaluate the similarity between the two
This article has been accepted for inclusion in a future issue of this journal. Content is final as presented, with the exception of pagination.
14 IEEE TRANSACTIONS ON SYSTEMS, MAN, AND CYBERNETICS: SYSTEMS
motions. The overall motion evaluation results and user studyshowed that on the one hand, our motion quantification algo-rithm can effectively model the human movement, and on theother hand, using the quantification with the comparison algo-rithm is efficient to judge the similarity between two humanmovements. Furthermore, the flexibility of adjusting the com-parison threshold allows the proposed technique in this paperto be used for many types of applications.
REFERENCES
[1] G. C. Hapsari and A. S. Prabuwono, “Human motion recognition inreal-time surveillance system: A review,” J. Appl. Sci., vol. 10, no. 22,pp. 2793–2798, 2010.
[2] Y. Nie, C. Xiao, H. Sun, and P. Li, “Compact video synopsis via globalspatiotemporal optimization,” IEEE Trans. Vis. Comput. Graphics,vol. 19, no. 10, pp. 1664–1676, Oct. 2013.
[3] Y. Nie, H. Sun, P. Li, C. Xiao, and K.-L. Ma, “Object movementssynopsis via part assembling and stitching,” IEEE Trans. Vis. Comput.Graphics, vol. 20, no. 9, pp. 1303–1315, Sep. 2014.
[4] J. Schrammel, L. Paletta, and M. Tscheligi, “Exploring the possibilitiesof body motion data for human computer interaction research,” in Proc.Symp. Austrian HCI Usability Eng. Group, 2010, pp. 305–317.
[5] A. Kamel, B. Sheng, P. Yang, P. Li, R. Shen, and D. D. Feng, “Deepconvolutional neural networks for human action recognition using depthmaps and postures,” IEEE Trans. Syst., Man, Cybern., Syst., to bepublished.
[6] D. Lin, R. Zhang, Y. Ji, P. Li, and H. Huang, “SCN: Switchable contextnetwork for semantic segmentation of RGB-D images,” IEEE Trans.Cybern., to be published.
[7] B. Najafi, K. Aminian, A. Paraschiv-Ionescu, F. Loew, C. J. Büla, andP. Robert, “Ambulatory system for human motion analysis using a kine-matic sensor: Monitoring of daily physical activity in the elderly,” IEEETrans. Biomed. Eng., vol. 50, no. 6, pp. 711–723, Jun. 2003.
[8] B. Sheng et al., “Retinal vessel segmentation using minimum span-ning superpixel tree detector,” IEEE Trans. Cybern., vol. 49, no. 7,pp. 2707–2719, Jul. 2019.
[9] B. Zhang, S. Jiang, K. Yan, and D. Wei, “Human walking analysis,evaluation and classification based on motion capture system,” in HealthManagement: Different Approaches and Solutions, K. Smigorski, Ed.Rijeka, Croatia: IntechOpen, 2011, ch. 20, pp. 361–398.
[10] E. Gianaria, M. Grangetto, M. Lucenteforte, and N. Balossino, “Humanclassification using gait features,” in Proc. Int. Workshop BiometricAuthentication, 2014, pp. 16–27.
[11] N. García, J. Rosell, and R. Suárez, “Motion planning by demonstrationwith human-likeness evaluation for dual-arm robots,” IEEE Trans. Syst.,Man, Cybern., Syst., to be published.
[12] B. Brahmi, M. Saad, M. H. Rahman, and C. Ochoa-Luna, “Cartesian tra-jectory tracking of a 7-DOF exoskeleton robot based on human inversekinematics,” IEEE Trans. Syst., Man, Cybern., Syst., vol. 49, no. 3,pp. 600–611, Mar. 2019.
[13] Y. Tao, Y. Shen, B. Sheng, P. Li, and R. W. H. Lau, “Video decolorizationusing visual proximity coherence optimization,” IEEE Trans. Cybern.,vol. 48, no. 5, pp. 1406–1419, May 2018.
[14] B. Huang, Z. Li, X. Wu, A. Ajoudani, A. Bicchi, and J. Liu,“Coordination control of a dual-arm exoskeleton robot using humanimpedance transfer skills,” IEEE Trans. Syst., Man, Cybern., Syst.,vol. 49, no. 5, pp. 954–963, Mar. 2019.
[15] J. Hwang, J. Kim, A. Ahmadi, M. Choi, and J. Tani, “Dealing withlarge-scale spatio-temporal patterns in imitative interaction between arobot and a human by using the predictive coding framework,” IEEETrans. Syst., Man, Cybern., Syst., to be published.
[16] C.-L. Hwang and G.-H. Liao, “Real-time pose imitation by mid-sizehumanoid robot with servo-cradle-head RGB-D vision system,” IEEETrans. Syst., Man, Cybern., Syst., vol. 49, no. 1, pp. 181–191, Jan. 2019.
[17] Z. Chen, T. Gao, B. Sheng, P. Li, and C. L. P. Chen, “Outdoor shadowestimating using multiclass geometric decomposition based on BLS,”IEEE Trans. Cybern., to be published.
[18] B. Sheng, P. Li, C. Gao, and K.-L. Ma, “Deep neural representationguided face sketch synthesis,” IEEE Trans. Vis. Comput. Graphics, tobe published.
[19] Z. Zhang, “Microsoft Kinect sensor and its effect,” IEEE MultiMedia,vol. 19, no. 2, pp. 4–10, Feb. 2012.
[20] J. Shotton et al., “Real-time human pose recognition in parts from singledepth images,” in Proc. IEEE Conf. Comput. Vis. Pattern Recognit.,2011, pp. 1297–1304.
[21] D. Mehta et al., “VNect: Real-time 3D human pose estimation with asingle RGB camera,” ACM Trans. Graph., vol. 36, no. 4, p. 44, 2017.
[22] S. Gaglio, G. L. Re, and M. Morana, “Human activity recognition pro-cess using 3-D posture data,” IEEE Trans. Human–Mach. Syst., vol. 45,no. 5, pp. 586–597, Oct. 2015.
[23] Y. Du, W. Wang, and L. Wang, “Hierarchical recurrent neural networkfor skeleton based action recognition,” in Proc. IEEE Conf. Comput. Vis.Pattern Recognit., 2015, pp. 1110–1118.
[24] P. Wang, Z. Li, Y. Hou, and W. Li, “Action recognition based on jointtrajectory maps using convolutional neural networks,” in Proc. ACMMultimedia, 2016, pp. 102–106.
[25] D. Arsenault and A. Whitehead, “Wearable sensor networks for motioncapture,” in Proc. Int. Conf. Intell. Technol. Interact. Entertainment,2015, pp. 158–167.
[26] H. Zhang and Z.-Y. Zhang, “Human motion capture system based ondistributed wearable sensing technology,” in Proc. Int. Conf. WirelessCommun. Sensor Netw., 2014, pp. 383–390.
[27] G. Tao, S. Sun, S. Huang, Z. Huang, and J. Wu, “Human modelingand real-time motion reconstruction for micro-sensor motion capture,”in Proc. IEEE Int. Conf. Virt. Environ. Human–Comput. Interfaces Meas.Syst., 2011, pp. 1–5.
[28] V. Ganapathi, C. Plagemann, D. Koller, and S. Thrun, “Real time motioncapture using a single time-of-flight camera,” in Proc. IEEE Conf.Comput. Vis. Pattern Recognit., 2010, pp. 755–762.
[29] M. Ye, X. Wang, R. Yang, L. Ren, and M. Pollefeys, “Accurate 3D poseestimation from a single depth image,” in Proc. IEEE Int. Conf. Comput.Vis., 2011, pp. 731–738.
[30] A. Shafaei and J. J. Little, “Real-time human motion capture withmultiple depth cameras,” in Proc. Conf. Comput. Robot Vis., 2016,pp. 24–31.
[31] L. Shuai, C. Li, X. Guo, B. Prabhakaran, and J. Chai, “Motion capturewith ellipsoidal skeleton using multiple depth cameras,” IEEE Trans.Vis. Comput. Graphics, vol. 23, no. 2, pp. 1085–1098, Feb. 2017.
[32] G. Pons-Moll, A. Baak, T. Helten, M. Müller, H.-P. Seidel, andB. Rosenhahn, “Multisensor-fusion for 3D full-body human motioncapture,” in Proc. IEEE Conf. Comput. Vis. Pattern Recognit., 2010,pp. 663–670.
[33] F. Moreno-Noguer, “3D human pose estimation from a single image viadistance matrix regression,” in Proc. IEEE Conf. Comput. Vis. PatternRecognit., 2017, pp. 1561–1570.
[34] H. Rhodin et al., “Learning monocular 3D human pose estimation frommulti-view images,” in Proc. IEEE Conf. Comput. Vis. Pattern Recognit.,2018, pp. 1–10.
[35] Y. Du, Y. Fu, and L. Wang, “Skeleton based action recognition with con-volutional neural network,” in Proc. IAPR Asian Conf. Pattern Recognit.,2015, pp. 579–583.
[36] P. Wang, W. Li, C. Li, and Y. Hou, “Action recognition based on jointtrajectory maps with convolutional neural networks,” Knowl. Based Syst.,vol. 158, pp. 43–53, Oct. 2018.
[37] X. Chen and M. Koskela, “Sequence alignment for RGB-D and motioncapture skeletons,” in Proc. Int. Conf. Image Anal. Recognit., 2013,pp. 630–639.
[38] D. Kulic, M. Choudry, G. Venture, K. Miura, and E. Yoshida,“Quantitative human and robot motion comparison for enabling assis-tive device evaluation,” in Proc. IEEE-RAS Int. Conf. Humanoid Robots(Humanoids), 2013, pp. 196–202.
[39] W. Kabsch, “A solution for the best rotation to relate two sets of vectors,”Acta Crystallographica A Found. Adv., vol. 32, no. 5, pp. 922–923, 1976.
[40] C. Chen, R. Jafari, and N. Kehtarnavaz, “UTD-MHAD: A multimodaldataset for human action recognition utilizing a depth camera and awearable inertial sensor,” in Proc. IEEE Int. Conf. Image Process., 2015,pp. 168–172.
Aouaidjia Kamel received the M.Eng. degreein computer science from the Abbès LaghrourUniversity of Khenchela, Khenchela, Algeria, in2009. He is currently pursuing the Ph.D. degree incomputer science with the Department of ComputerScience and Engineering, Shanghai Jiao TongUniversity, Shanghai, China.
His current research interests include understand-ing human behavior, human–machine interaction,human pose estimation, machine learning, and deepneural networks.

This article has been accepted for inclusion in a future issue of this journal. Content is final as presented, with the exception of pagination.
KAMEL et al.: EFFICIENT BODY MOTION QUANTIFICATION AND SIMILARITY EVALUATION USING 3-D JOINTS SKELETON COORDINATES 15
Bin Sheng received the Ph.D. degree in computerscience and engineering from the Chinese Universityof Hong Kong, Hong Kong, in 2011.
He is currently an Associate Professor with theDepartment of Computer Science and Engineering,Shanghai Jiao Tong University, Shanghai, China. Hiscurrent research interests include machine learning,virtual reality, and computer graphics.
Ping Li received the Ph.D. degree in computer sci-ence and engineering from the Chinese Universityof Hong Kong, Hong Kong, in 2013.
He is currently with Hong Kong PolytechnicUniversity, Hong Kong. He has one image/videoprocessing national invention patent, and has excel-lent research project reported worldwide by ACMTechNews. His current research interests includeimage/video stylization, GPU acceleration, and cre-ative media.
Jinman Kim received the B.S. (Hons.) and Ph.D.degrees in computer science from the University ofSydney, Sydney, NSW, Australia, in 2000 and 2005,respectively.
Since 2006, he has been a Research Associatewith Royal Prince Alfred Hospital, Camperdown,NSW, Australia. From 2008 to 2012, he was anARC Post-Doctoral Research Fellow, one year leavefrom 2009 to 2010 to join the MIRALab ResearchGroup, Geneva, Switzerland, as a Marie Curie SeniorResearch Fellow. Since 2013, he has been with the
School of Information Technologies, University of Sydney, where he wasa Senior Lecturer, and became an Associate Professor in 2016. His cur-rent research interests include medical image analysis and visualization,computer-aided diagnosis, and telehealth technologies.
David Dagan Feng (F’03) received the M.Eng.degree in electrical engineering and computer sci-ence from Shanghai Jiao Tong University, Shanghai,China, in 1982, and the M.Sc. degree in biocyber-netics and the Ph.D. degree in computer sciencefrom the University of California at Los Angeles(UCLA), Los Angeles, CA, USA, in 1985 and 1988,respectively.
He is currently the Head of the School ofInformation Technologies, the Director of theBiomedical and Multimedia Information Technology
Research Group, and the Research Director with the Institute of BiomedicalEngineering and Technology, University of Sydney, Sydney, NSW, Australia.He has published over 700 scholarly research papers, pioneered several newresearch directions, and made a number of landmark contributions in his fields.Many of his research results have been translated into solutions to real-lifeproblems and have made tremendous improvements to the quality of life forthose concerned.
Dr. Feng was a recipient of the Crump Prize for Excellence in MedicalEngineering from UCLA. He has served as the Chair of the InternationalFederation of Automatic Control Technical Committee on Biological andMedical Systems, organized/chaired over 100 major international confer-ences/symposia/workshops, and has been invited to give over 100 keynotepresentations in 23 countries and regions. He is a fellow of the AustralianAcademy of Technological Sciences and Engineering.