efficient coding of natural scenes in the lateral ... coding of natural scenes in the lateral...
TRANSCRIPT
The Journal of Neuroscience, May 15, 1996, 16(10):3351-3362
Efficient Coding of Natural Scenes in the Lateral Geniculate Nucleus: Experimental Test of a Computational Theory
Yang Dan,’ Joseph J. Atick, and R. Clay Reid’
Laboratories of lNeurobiology and 2Computational Neuroscience, The Rockefeller University, New York, New York 70021
A recent computational theory suggests that visual processing in the retina and the lateral geniculate nucleus (LGN) serves to recode information into an efficient form (Atick and Redlich, 1990). Information theoretic analysis showed that the represen- tation of visual information at the level of the photoreceptors is inefficient, primarily attributable to a high degree of spatial and temporal correlation in natural scenes. It was predicted, there- fore, that the retina and the LGN should recode this signal into a decorrelated form or, equivalently, into a signal with a “white” spatial and temporal power spectrum. In the present study, we tested directly the prediction that visual processing at the level of the LGN temporally whitens the natural visual input. We recorded the responses of individual neurons in the LGN of the cat to natural, time-varying images (movies) and, as a control, to white-noise stimuli. Although there is substantial temporal
correlation in natural inputs (Dong and Atick, 1995b), we found that the power spectra of LGN responses were essentially white. Between 3 and 15 Hz, the power of the responses had an average variation of only tlO.3%. Thus, the signals that the LGN relays to visual cortex are temporarily decorrelated. Fur- thermore, the responses of X-cells to natural inputs can be well predicted from their responses to white-noise inputs. We there- fore conclude that whitening of natural inputs can be explained largely by the linear filtering properties (Enroth-Cugell and Rob- son, 1966). Our results suggest that the early visual pathway is well adapted for efficient coding of information in the natural visual environment, in agreement with the prediction of the computational theory.
Key words: lateral geniculate nucleus; coding; natural scenes; information theory; power spectrum; efficiency; visual cortex
In natural environments, visual signals are highly redundant, so the representation of the input by the activity of photoreceptors is inefficient. Efficiency of information coding, however, potentially has significant evolutionary and computational advantages (Atick, 1992). It is thus reasonable to assume that an important task of the early stages of the visual pathway is to recode the incoming visual signals to improve efficiency (Barlow, 1961, 1989; Atick and Redlich, 3 990; Atick, 1992).
The primary sources of redundancy in the visual signals at the level of the photoreceptors are the temporal and spatial correla- tions in natural scenes. The activity of photoreceptors is not independent at different times and between different cells. In other words, much information is represented repetitively over time and by different neurons. To improve efficiency, the neuronal signals must be recoded into a decorrelated form. When trans- formed into the frequency domain, this decorrelation is expressed as the flattening or “whitening” of the temporal and spatial power spectra of the neuronal signals. Previous studies have shown that the power spectrum of light intensity in the natural visual envi- ronment obeys a simple statistical rule: it is proportional to l/k”, where k is the spatial frequency and, at low spatial frequencies,
~~--- .--- --..-.- ---__ Received Oct. 16, 1995; revised Feb. 21, 1996; accepted Feb. 26, 19%.
This research is supported by National Institutes of Health EY05253, EY10115, the KIingcnstein Fund. Y.D. is a Schering-Plough Fellow of the Lift Scicnccs Research Foundation. We are grateful to Dr. Torsten Wiesel for his support during all phases of this work. We thank Dr. Robert Shapley for his comments on the earlier versions of the manuscript. Karl Gegenfurtncr generously allowed us to use his library of subroutines, YARL, to write programs for our visual stimuli.
Correspondence should bc addressed to Dr. R. Clay Reid, Department of Neu- robiology, Harvard Medical School, 220 Longwood Avenue, Boston, MA 02115.
Drs. Dan and Reid’s current address: Department of Neurobiology, Harvard Medical School, 220 Longwood Avenue, Boston, MA 02115.
Copyright 0 1996 Society for Neuroscience 0270-6474/96/l 6335 1 - 12$05.01)/O
1/02, where o is the temporal frequency (Field, 1987; Dong and Atick, 1995a,b).
It has been proposed that the retina and the lateral geniculate nucleus (LGN) are dedicated to recoding and whitening the input signals (Barlow, 1961, 1989; Atick and Redlich, 1990; Atick, 1992). Using information theory (Shannon and Weaver, 1949) to assess the efficiency of information representation, Atick and coworkers performed a series of theoretical studies of retinal and geniculate processing. They derived a theory of retinal processing that successfully explained the spatial and, in the primate, the chromatic receptive fields of retinal ganglion cells for the entire range of adaptation levels. Their only assumptions were that retinal processing serves to spatially whiten natural inputs and that there was a certain level of noise (Atick and Redlich, 1992; Atick et al., 1992). Theoretical analysis of temporal decorrelation led to an explanation of not only the temporal tuning properties of LGN neurons but also the existence of lagged and nonlagged cells (Dong and Atick, 1995a), which have been observed experimen- tally in the cat (Mastronarde, 1987; Humphrey and Weller, 1988a,b).
The spatial and temporal response properties of the LGN cells of the cat have been well characterized over the past few decades (So and Shapley, 1981; Dawis et al., 1984; Saul and Humphrey, 1990). It is not certain, however, to what extent the responses of LGN neurons to the simple stimuli used in these studies can predict their function in coding natural visual signals. In particu- lar, nonlinearities such as the contrast gain control (Shapley and Victor, 1978, 1981), rectification at zero spikes per second, and saturation can profoundly alter the responses to stimuli with different statistics. Because the visual system develops-and, of course, evolved-in the natural environment, an important step in understanding its function would be to study the input-output
3352 J. Neurosci., May 15, 1996, 76(10):3351-3362 Dan et al. l Coding of Natural Scenes
relationship with stimuli that resemble natural scenes. The maior difficulty in studying the visual system with natural stimuli resides in the complexity of the input signal and the lack of appropriate methods for characterizing it. To overcome this difficulty, we used a statistical approach to study the visual system with a complex input ensemble. In contrast to the conventional, deterministic approach, in which the properties of neurons are studied by correlating their responses to individual, simple stimuli, the sta- tistical approach characterizes both input and output by measur- ing their ensemble properties. As demonstrated in our studies, this approach can provide new insights into the function of the visual system and may prove to be an important complement to conventional approaches.
a more realistic limit. The waveforms of the spikes were saved on disk. The spike discrimination was first done roughly during the experiment. The sorting was carried out more rigorously in postprocessing.
Visual stimulation The data-acquisition PC contained an AT-Vista graphics card (Truevi- sion, Indianapolis, IN), which was used to present a variety of visual stimuli at a frame rate of 128 Hz. All stimuli were programmed using subroutines from a runtime library, YARL, written by Karl Gegenfurtner. Spatiotemporal white-noise stimuli were generated to map the receptive fields of the neurons. The system is well suited for the efficient real-time production of these stimuli using the m-sequence temporal signal (Sutter, 1987; Reid and Shapley, 1992). Spatially, the white-noise stimuli were made up of 16 x 16 grids of square regions (pixels). The pixel sizes were adjusted to map receptive fields with a reasonable level of detail (0.2-0.4’ at 5-10’ eccentricity). For every frame of the stimulus, the pixels were either black or white according to the m-sequence. The receptive field maps of the neurons were calculated using the reverse correlation method (Jones and Palmer, 1987). For each delay between stimulus onset and action potential, the average spatial stimulus that preceded each impulse was calculated, This calculation was performed with the fast m-transform (Sutter, 1987). Full-field white noise, in which the whole screen was temporally modulated by a single m-sequence signal, was also used to study the dynamics of some neurons in response to low spatial frequency stimuli.
Drifting gratings of various spatial and temporal frequencies were used to measure the spatial and temporal tuning properties of the neurons, Contrast reversal gratings were used in the null test to make the X/Y classification (Enroth-Cugell and Robson, 1966; Hochstein and Shapley, 1976). Only X-cells were included in the analysis, because this is the-type
of cells on which the computational theory was based. Few lagged cells were encountered with these electrodes, and none was included in this study.
In this experimental investigation, we characterized the statis- tical properties of LGN neurons in response to natural visual input. We tested directly the hypothesis that the representation of natural visual information at the LGN is temporally decorrelated. Movies of natural scenes were used as visual inputs, responses of single LGN neurons were recorded, and their temporal correla- tions and power spectra were analyzed. Our results largely con- firm the prediction based on the assumption of efficient coding and information-theoretic anaIysis. Further investigation of the mechanism of recoding indicates that the temporal whitening of natural signals is largely attributable to the linear filtering prop- erties of LGN neurons [see Golomb et al. (1994) for a similar relationship between linear response properties ’ and temporal coding by LGN neurons].
Video recordings of time-varying natural scenes were used as stimuli to
MATERIALS AND METHODS Physiological prepara ti0n Adult cats ranging in weight from 2 to 3 kg were used in all the experiments. The animals were initially anesthetized with ketamine HCl (10 mgikg, i.m.), followed by sodium pentothal (20 mgikg, iv., supple- mented as needed). A local anesthetic (lidocaine) was injected before all incisions. Anesthesia was maintained for the duration of the experiment with sodium pentothal at a dosage of 6 mg/hr.
A tracheostomy was performed for artificial ventilation. Then the cat was transferred to a Horsley-Clarke stereotaxic frame. The cat was suspended by clamping the spinous process of one of the lumbar verte- brae to minimize respiratory movements,
Pupils were dilated with a topical application of 1% atropine sulfate, and the nictitating membranes were retracted with 10% phenylephrine. Eyes were refracted, fitted with appropriate contact lenses, and focused on a tangent screen. The positions of the areae centrales were plotted with the aid of a fundus camera. Eye positions were stabilized mechani- tally by gluing the sclerae to metal posts attached to the stereotaxic apparatus.
A craniotomy (-0.5 cm in diameter) was made over the LGN, and the underlying dura was removed. The hole was filled with 3% agar in physiological saline to improve the stability of the recordings.
The animal was paralyzed with Norcuron (0.2 mglkgihr, i.v.) and artificially ventilated. Ventilation was adjusted so that the end-expiratory CO, was near 3.5%. Core body temperature was monitored and main- tained at 38°C. The electrocardiogram and electroencephalogram were also monitored continuously.
Electrophysiological recording
study the statistical properties of the LGN response. It was assumed that all the long sequences of natural, time-varying images have common statistics, i.e., they tend to have the same spatiotemporal power spectra (Field, 1987; Dong and Atick, 1995a,b) regardless of the details of the images. Because we were interested in the coding of natural scenes in general, we chose not to impose any restriction in our selection of movies other than that they were not disproportionally dominated by static scenes. Up to 10 different movies were used. Figure la shows an image from CasabZanca, one of the movies used in the experiments. The power spectra of the LGN responses to different movies were qualitatively very similar, as long as the movies were longer than several minutes. We therefore pooled all the data in the analysis. In some experiments, a videocassette recorder and a television monitor were used to present movies 20-60 min long* In others, movie clips 2-3 min long were presented repetitively over a similar duration with the computer software Media Player. There was a small 15 Hz artifact in these movies, as can be seen from the small secondary peaks in Figure 2u, cells 2 and 3, The AT-Vista board was not used for studying the statistical properties of the LGN responses, because its limited memory precluded the presentation of long movies with appropriate statistics (see below).
For the linear prediction of the response to natural scenes, we pre- sented eight different short movies with the AT-Vista board. These short movies were digitized segments of video recordings. The use of the Vista board in this study was necessary, because the prediction of the instan- taneous firing rate signals requires precise spatiotemporal alignment between the receptive fields, which were measured with white noise, and the movie stimuli. Because of the Iimited memory of the Vista board, each movie was restricted to 16 set long. Each frame contained 64 X 64 pixels, with a spatial resolution of 0.2”/pixel. To test the linear prediction, short movies were in fact desirable, because multiple repeats were re-
Individual LGN neurons were recorded with a single tungsten electrode or a multielectrode array (System Eckhorn, Marburg, Germany) (Eck- horn and Thomas, 1993). The array allows seven fiber electrodes to be positioned independently with a vertical accuracy of 1 pm. We used a glass guide tube to restrict the lateral scattering of the electrodes in the array. The inner diameter at the tip of the guide tube was ~400 ,um. All recordings were made in layer A or Al of the LGN.
Recorded signals were amplified, filtered, and passed to an 80486 PC running Datawave Discovery software (Broomfield, CO). The system
quired to assess the reproducibility of the responses. To obtain an “actual” response, each movie was repeated eight times. A post-stimulus time histogram (PSTI-I) was obtained for the response to each repeat with a bin width of 7.7 msec (the same as the interframe interval of the short movies and the white-noise stimuli). The instantaneous firing rate of the LGN neuron was calculated as the PSTH averaged over all eight repeats or over interleaved repeats-l, 3, 5, 7 or 2, 4, 6, 8.
Data analysis accepts inputs from up to eight waveforms can be discriminated
single on a s1
elec trodes. Up to eight different ngle electrode, but two or three is
Calculation of autocomla tion function. The recorded spike train was originally represented as a list of times for the occurrence of spikes with
Dan et al. l Coding of Natural Scenes J. Neurosci., May 15, 1996, 76(10):3351-3362 3363
a resolution of 0.1 msec. This list was binned with a bin width of 5 msec to yield a spike-rate signal sampled at 200 Hz. The autocorrelation function of this signal was then computed. So that only the contribution from different spikes was considered, the total number of spikes was subtracted from the central bin of the autocorrelation function.
Calculation of power spectrum. We calculated the two-sided power- spectral density functions of the spike trains by Fourier transforming overlapping segments of data and windowing (Press et al., 1988). The spike trains (20-60 min long) were binned with a bin width of 4 msec and divided into 4 set segments, with 2 set overlaps between consecutive segments. For each segment, a Welch window was applied to reduce the spectral leakage caused by the finite duration of the segments (Harris, 1978), and a two-sided power spectrum was calculated using the standard fast Fourier transform procedure, with a frequency resolution of 0.25 Hz and a range from -125 to 125 Hz. Finally, the power spectrum of the whole spike train was obtained by averaging all the data segments.
Linear prediction of responses to natural movies. We predicted the responses of LGN cells to natural visual inputs by performing a linear convolution of the spatiotemporal receptive fields with the luminance signals of the movies, followed by a rectification procedure. The under- lying assumption is that the output, which is the firing rate of the LGN neuron, is the result of a rectifying spike-generation mechanism operating on the intracellular potential, which is linearly related to the visual input (Rodieck, 1965; Enroth-Cugell and Robson, 1966; Brodie et al., 1978). Because, of course, we did not record the intracellular signal, its receptive field was calculated from the spike train recorded extracellularly. The receptive field of the intracellular potential is equivalent to the first-order Wiener kernel (Marmarelis and Marmarelis, 1978) calculated from the spike rate multiplied by a factor of 2, assuming a perfect half-wave rectification of the LGN cells in response to white noise. (This is a reasonable first-order assumption, since the resting-state firing rate or the threshold for spike generation is, in general, much lower than the re- sponse to the white-noise stimuli with a 100% contrast.) The linear convolution is given by:
R(t) = C2*K(x,y, t’) -S(x,y, t - t’), X,Y, f
where R(t) is proportional to the estimated intracellular potential but in units of imnulses oer second: K(x. v. t’) is the first-order Wiener kernel of the neuron’ measured in units of impulses per second per unit contrast; 5(.x, y, t - t’) is the luminance of individual pixels in the movie, normal- ized so that the mean luminance of the entire movie is 0 and the minimum value is - 1; and x and y are the positions of the pixels. The white-noise stimuli used for measuring the receptive fields had the same pixel size and frame rate as those of the movies. These two stimuli were spatially aligned so that the correspondence between the pixels in the receptive field K(x, y, t’) and those in the movies S(x, y, t - t’) could be determined unambiguously.
The intracellular potential R(t) thus estimated had both positive and negative values. The output of the neuron O(t) was predicted by applying a simple rectification procedure, which presumably simulates the spike- generation mechanism:
O(t) = (R(t) + N) *H(R(t) + N),
where H is the Heaviside step function defined as:
H(x)=l, x>o
0, x50.
When N is positive, it represents the resting-state firing rate of the cell; when negative, N represents the threshold for spike generation. The value of N was adjusted so that the predicted mean firing rate (O(t)) over the duration of the movie was equal to the actual mean rate of the same cell.
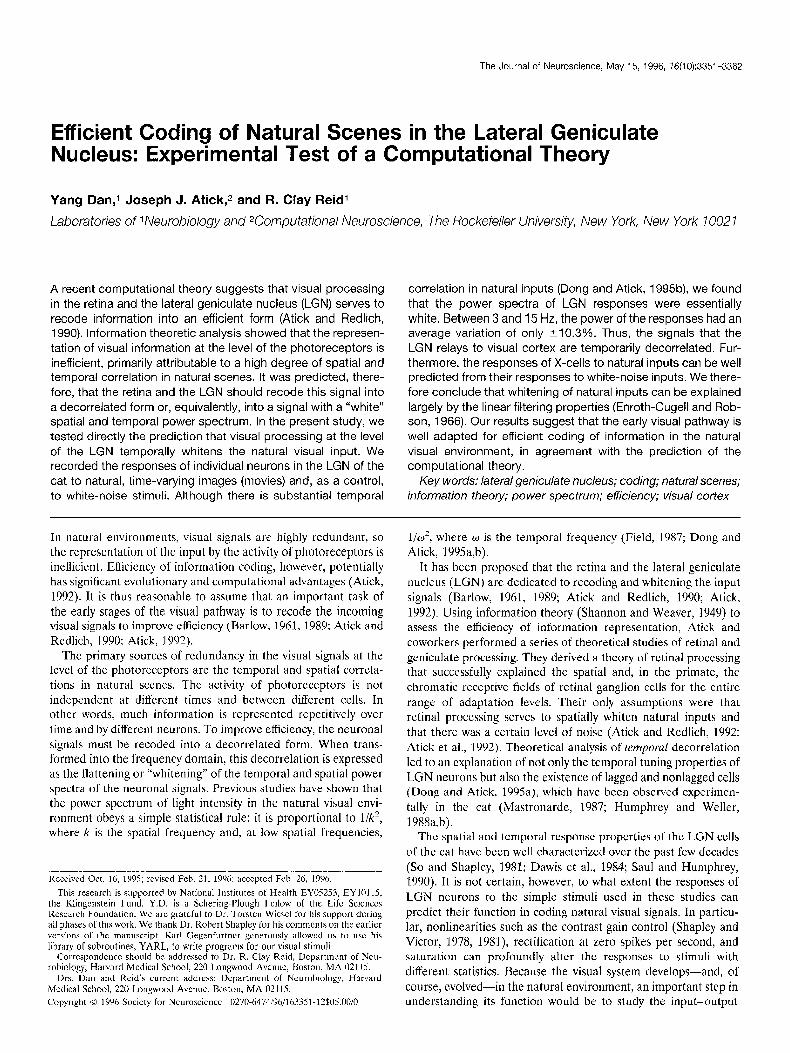
RESULTS Responses of LGN neurons to natural scenes and white noise In the first part of the study, we characterized the statistical properties of the LGN spike trains in response to time-varying natural visual stimuli. A typical image is shown in Figure la. The position of the stimulation monitor was adjusted so that the re- ceptive field of the LGN neuron fell within the screen. The movies were presented to the cat, and the spike trains of LGN neurons
a
b
Figure 1. Visual stimuli used in the current study: natural scenes and spatiotemporal white noise. a, A single frame from the movie Casablanca, which, together with other movies, was used as a natural stimulus. b, A single frame from spatiotemporal white noise with 100% contrast. A complete white-noise stimulus consists of 2r5 frames of these pseudoran- dom checkboard patterns.
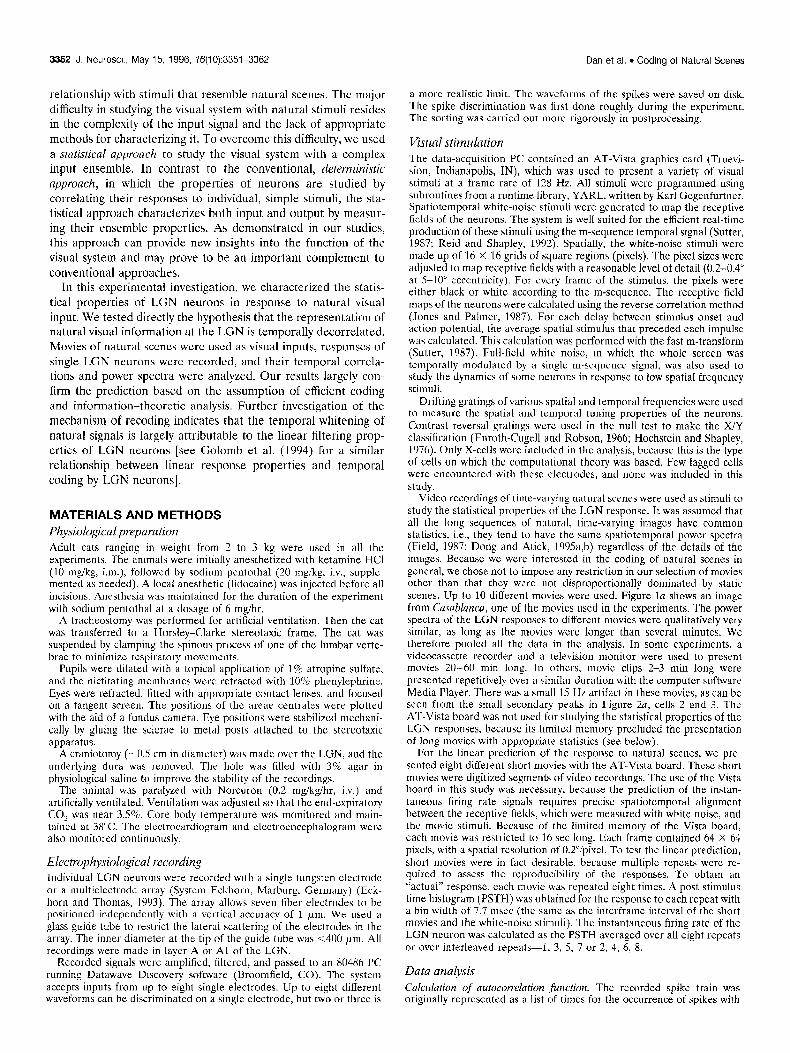
were recorded for 20-60 min to accumulate a minimum of 10,000 spikes. Autocorrelation functions and power spectra of these spike trains were calculated. Figure 2, a and b, shows the auto- correlation functions and the power spectra, respectively, of three LGN neurons in response to movies. Figure 2c summarizes the power spectra of 51 LGN neurons. For 45 cells, the mean firing rate during the period of movie presentation was 13.1 impulses/ set, whereas that in the absence of visual stimuli was 6.0 impulses/ sec. Among these, 33 cells showed an increase in mean firing rate by at least 2 impulses/set during stimulation by movies. A consid- erable degree of temporal variation of the instantaneous firing rate was observed during the movie presentations, in apparent correspondence to various movie scenes. These observations sug- gest that the spiking activity of the LGN neurons was significantly modulated by the natural visual input.
The autocorrelation functions of the responses to movies (Fig.
3354 J. Neurosci., May 15, 1996, X(10):3351-3362 Dan et al. l Coding of Natural Scenes
b
Cell 1
I I I
Time (msec)
15 ’ Cell 2
0 5 10 15
Cell 3
*OoO 1 5000 4 l
4000 -
3000 -
2000 -
1ooa -
-loo:l\! -600 -300 0 300 800
Cell 3
0 5 10 15
Frequency (Hz)
C 4 --
3-
L a
s 2-
0 &
l-
o I I I I 0 5 10 15
Frequency (Hz)
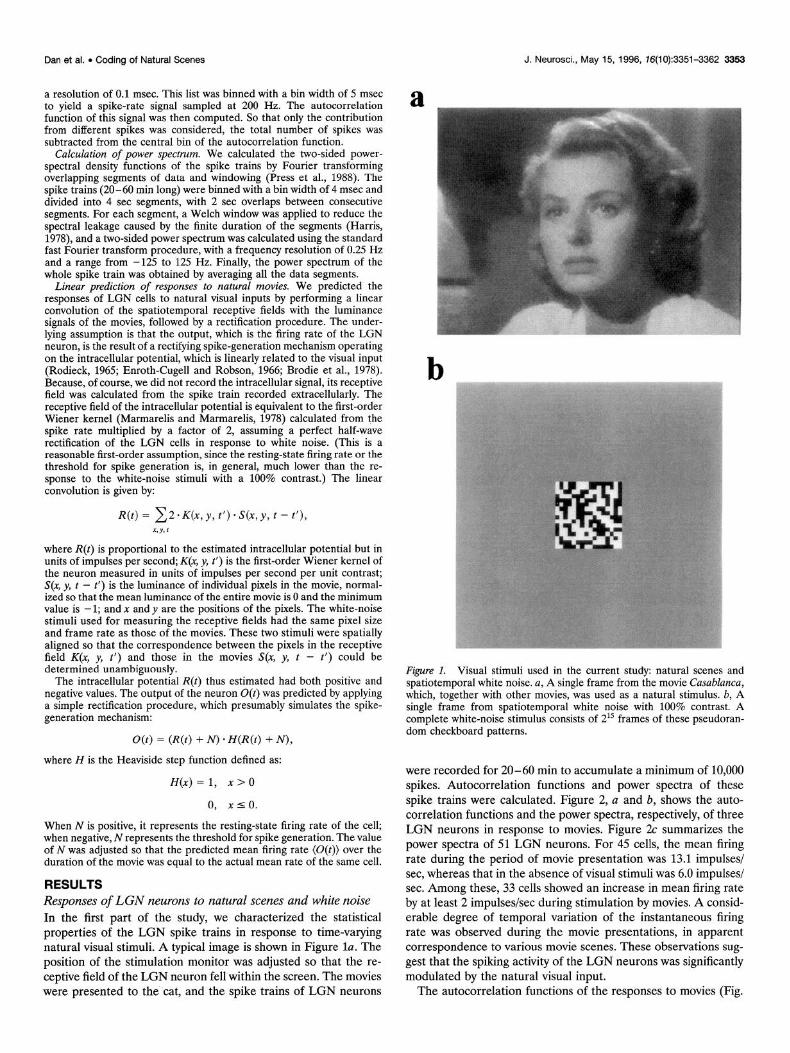
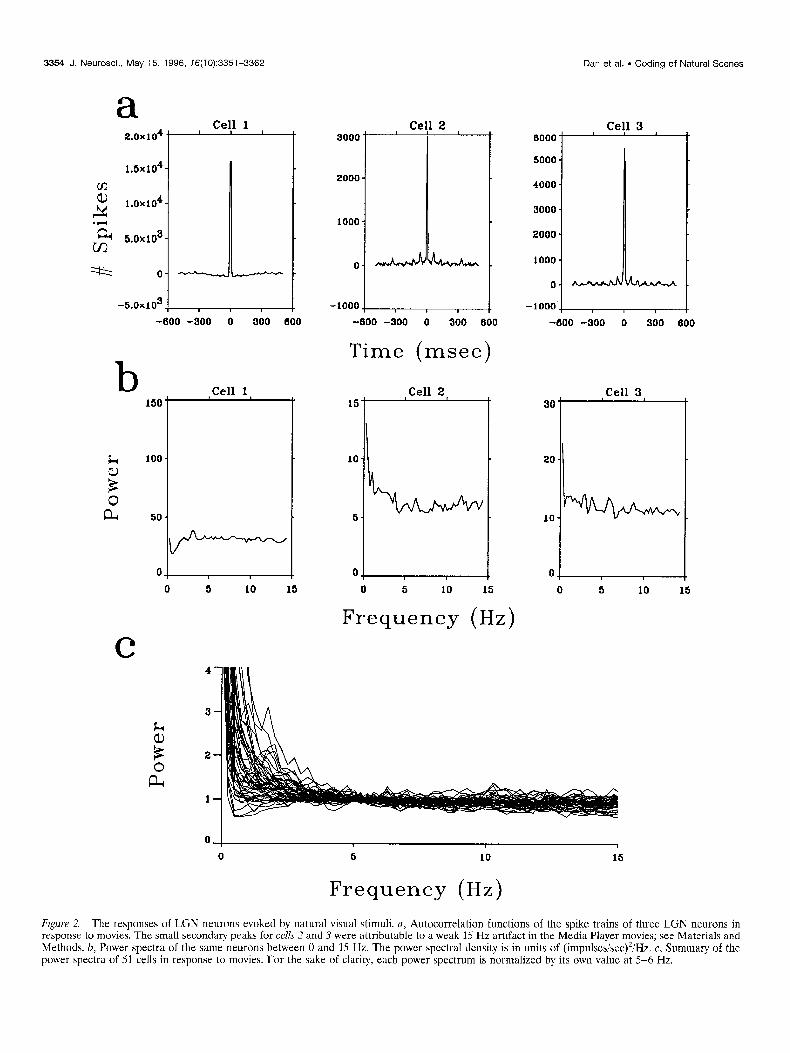
Figure 2. The responses of LGN neurons evoked by natural visual stimuli. a, Autocorrelation functions of the spike trains of three LGN neurons in response to movies. The small secondary peaks for cells 2 and 3 were attributable to a weak 15 Hz artifact in the Media Player movies; see Materials and Methods. b, Power spectra of the same neurons between 0 and 15 Hz. The power spectral density is in units of (impulses/sec)‘/Hz. c, Summary of the power spectra of 51 cells in response to movies. For the sake of clarity, each power spectrum is normalized by its own value at 5-6 Hz,
Dan et al. l Coding of Natural Scenes J. Neurosci., May 15, 1996, 76(10):3351-3362 3355
a 1.5x10⁴
LOxlO cn Q)
Lu! n n LOxlO
c14
cn
Cell 3 Cell 2
-600 -300 0 300 600
Time (msec)
-800 -300 0 300
150
100
50
b
k aJ 3 0 &
C
Ceil 2 Cell 3
0 5 10 15
Frequency (Hz)
o 1 1 I 1 0 5 10 15
Frequency (Hz)
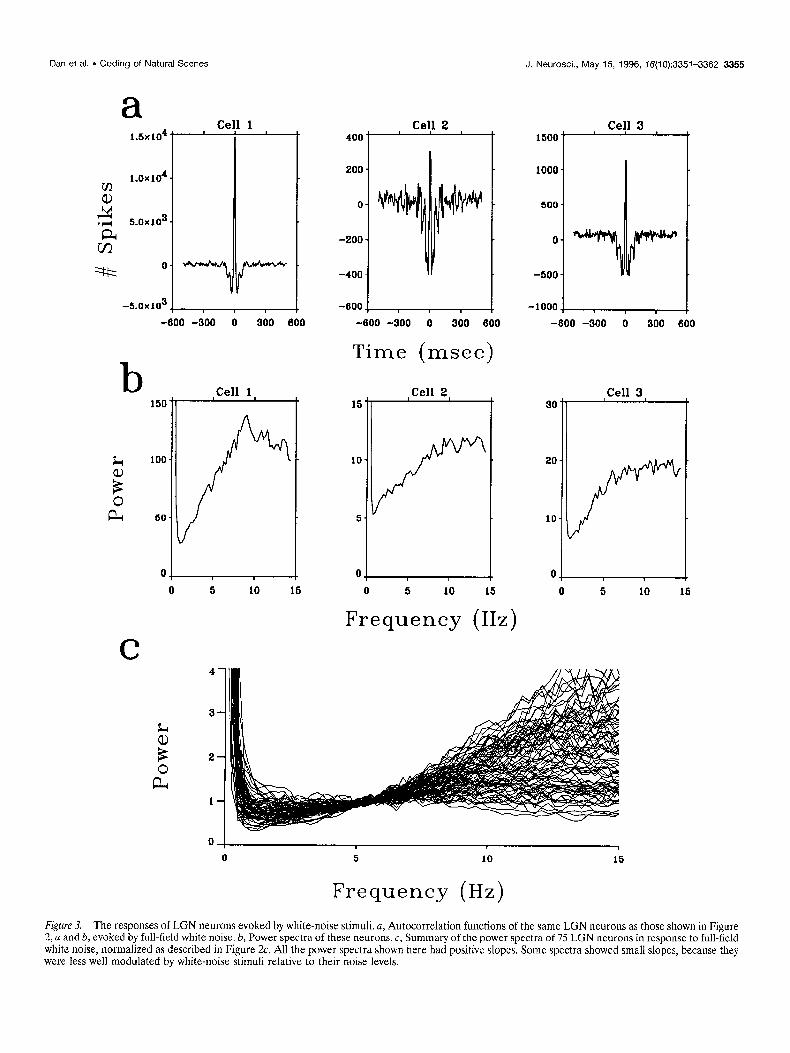
Figure 3. The responses of LGN neurons evoked by white-noise stimuli. a, AutocorreIation functions of the same LGN neurons as those shown in Figure 2, a and b, evoked by full-field white noise. b, Power spectra of these neurons. c, Summary of the power spectra of 75 LGN neurons in response to full-field white noise, normalized as described in Figure 2~. All the power spectra shown here had positive slopes. Some spectra showed small slopes, because they were less we12 modulated by white-noise stimuli relative to their noise 1eveIs.

3356 J. Neurosci., May 15, 1996, 16(10):3351-3362 Dan et al. l Coding of Natural Scenes
a
0
b
Frequency (Hz) Figure 4. Temporal-filtering properties of an LGN neuron measured with different methods. a, Power spectrum of an LGN spike train in response to full-field white noise with 100% contrast. b, The square of the Fourier transform of the temporal rcccptive field measured with the same full-field white noise as in a. For a perfect Iinear filter, this should be equivalent to the power spectrum of the response, as shown in a, except for the presence of additional noise in a. The fact that a and b have the same shape but differ in amplitude by a factor of 2 is caused largely by the rectification. c, The square of the temporal-tuning function of the same neuron. The temporal-tuning function is defined as the amplitudes of responses to sinusoidally modulated inputs with unit contrast but at different temporal frequencies. In this experiment, it was measured with spatially uniform, but temporally modulated stimuli at 25% contrast. All three functions were normalized by the power of their respective input and therefore reflect the intrinsic tuning properties of the neuron. The fact that c has a higher amplitude than both a and h suggests either a saturation in the response to 100% contrast full-field white noise or a contrast gain-control mechanism. The unit of all three power spectra is (impulses/sec)2/Hz.
2a) showed narrow peaks (centered at 0 msec with half widths of lo-20 msec) and were essentially flat beyond the peak. This indicates that the LGN output was temporally decorrelated. The decor-relation is also revealed by the power spectra of the re- sponses (Fig. 2b,c), which are equivalent to the Fourier transforms of the autocorrelation functions. The spectra were largely flat between 3 and 15 Hz, consistent with the theoretical prediction that the natural visual signals at the level of the LGN are white. Thus the redundancy at the level of the photoreceptors is largely eliminated at the LGN. As discussed below, the deviation from whiteness in the power spectra beyond the range of 3-15 Hz can be accounted for by the finite duration of the neuronal impulse response and the requirement of optimal coding in the presence of noise (Atick and Redlich, 1992).
As a comparison with the temporally decorrelated response to natural scenes, we analyzed the autocorrelations and power spec- tra of LGN neurons in response to a white-noise input (Sutter, 1987). White noise provides a rich input ensemble, the statistical structure of which differs from that of natural input; therefore, it provides an appropriate control stimulus. Figure 3a shows the autocorrelation functions of the white-noise responses of the same LGN neurons as those shown in Figure 2~. In contrast to the responses to natural input, the autocorrelation functions of the white-noise responses exhibited a dip between 10 and 100 msec. This is reflected in their power spectra, which showed a positive slope between 1 and 10 Hz (Fig. 3b), Figure 3c summa- rizes the power spectra of 75 LGN neurons in response to full- field white noise. The great majority of these spectra showed a
positive slope between 3 and 15 Hz and significantly deviated from whiteness.
To quanti@ the difference between the power spectra in Figures 2c and 3c, each power spectrum was fitted with a quadratic function between 3 and 15 Hz to smooth the data. The average deviation of these smoothed spectra from their midpoint was 10.8% 2 7.3 for the responses to natural stimuli (Fig, 2c) but was 50.7 ? 20.6 for the responses to white noise (Fig. 3~). We presented white-noise stimuli both before and after the movie stimuli and observed a consistent difference between the temporal characteristics of the responses to movies and to white noise. Spatiotemporal white noise (Fig. lb) and full-field white noise evoked responses with similar power spectra. Thus the LGN cells under study were visually driven, and the power spectra of their responses depended on the nature of the input. As shown below, the LGN responses to white-noise input reflect their temporal- filtering properties, which form the basis of efficient recoding of natural scenes.
Linear prediction of the responses to naturul stimuli To bridge the statistical and the deterministic approaches and to understand the mechanism of recoding at the LGN, we examined whether the temporal whitening of natural visual input can be accounted for by the classical response properties of geniculate cells. It is well known that both retinal and geniculate X-cells behave as approximately linear filters (Enroth-Cugell and Rob- son, 1966; Hochstein and Shapley, 1976; Derrington and Fuchs, 1979; Dawis et al., 1984), and the temporal-tuning properties of

Dan et al. l Coding of Natural Scenes J. Neurosci., May 15, 1996, 76(10):3351-3362 3357
a
b -
Figure 5. Convolution of the spatiotemporal receptive fields of the LGN neurons and the short movies. a, Sixteen consecutive frames of a movie, with an interframe interval of 31.1 msec and a spatial resolution of 64 X 64 pixels. b, Receptive field of an on-center/o$-surround X-cell. The 16 graphs represent the spatial receptive fields at 16 consecutive temporal frames, with an interframe interval of 7.7 msec. Each graph shows a 14 X 14 portion of the entire kernel, chosen to include both center and sur- round. The pixel luminance indicates the sign and magnitude of neural excitation evoked by a light signal at the position of the pixel. The magnitude of the contrast between pixels is roughly proportional to neural excitation in impulses per second. The grid separating the pixels is set to the mean luminance. The size and the signature of the surround are best appreciated by noting the large region where the receptive field is darker than the background grid (i.e., where the grid appears light). For the sake of clarity, the receptive field has been spatially magnified relative to the movie. The white squares in a indicate the areas in the images that correspond to each frame in b. To measure the actual responses, each frame in a was repeated four times so that the movie and the white-noise stimuli had the same frame rate.
Impulse Response 1001 I I I I I
I I I I I
20 40 60 60 100 Time (msec)
Figure 6. Summed impulse responses for the pixels in the center and those in the surround of the receptive field shown in Figure 56. Responses were measured in terms of the average increase in the firing rate, in impulses per second, after the light phase of the stimulus. The center of the receptive field was defined by the following procedure. First, the largest single response of the spatiotemporal receptive field (as mapped with the luminance stimulus) was located. This peak defined the position of the greatest sensitivity at the optimal latency. Next, the spatial receptive field was analyzed at the peak latency. Contiguous spatial positions were included in the center if the responses were of the same sign as the strongest response and were greater than two SD above the measurement noise. The measurement noise was estimated by examining the calculated responses at long delays between stimulus and response, i.e., when any correlation was spurious. The surround was defined as all the remaining pixels (shown in the 14 X 14 portion of the entire screen).
LGN neurons, as reflected by the power spectra of their responses to white noise (see Discussion), are roughly the inverse of the power spectra of natural inputs (Dong and Atick, 1995a,b). It is likely, therefore, that the temporal whitening of natural inputs is largely attributable to the linear filtering properties of X-cells. Figure 4 provides a qualitative demonstration of the sort of arguments used in the theoretical literature. It shows the power spectrum of an X-cell in response to 100% contrast full-field white noise (Fig. 4u), the square of the Fourier transform of its impulse response (Fig. 4b), and the square of its actual temporal tuning function (see legend to Fig. 4c). The temporal tuning function was measured with full-field, temporally modulated sinusoidal stimuli at 25% contrast between 0.5 and 15 Hz. All three functions were approximately proportional to o’, the inverse of the temporal power spectra of natural inputs in the range of low spatial fre- quencies. It is worth noting, however, that the magnitudes of the response sensitivity measured with these three methods showed a two- to threefold difference. This reflects the existence of nonlin- earities such as the contrast gain control (Shapley and Victor, 1978, 1981), rectification, and response saturation. To investigate in more detail the extent to which the linear-filtering properties contribute to the whitening of natural input, we tested whether the responses to natural scenes can be predicted by the linear convolution of the luminance signals of the movies and the spa- tiotemporal receptive fields of the neurons (Brodie et al., 1978).
The spatiotemporal receptive fields of the cells were measured with white-noise stimuli and the reverse-correlation method. Fig- ure Sb shows the time evolution of an on-center/off-surround receptive field between 0 and 116 msec. The magnitudes of center and surround components (the impulse responses) of the recep-

3358 J. Neurosci., May 15, 1996, 16(10):3351-3362 Dan et al. 0 Coding of Natural Scenes
a Predicted
Actual 1
Actual 2
b C
zoou
Time (msec)
400
300
200
100
- //I- 0 * 0 O
90
Q
0
0
0
0 0
400
0 100 200 300 400 0 100 200 300 400
Actual I (impulses/set) Actual I (impulses/set)
Figure 7. Comparison of the predicted and the actual responses to a natural movie. a, Top trace, The predicted response of an X-cell to a movie, as calculated by convoluting the movie with the spatiotemporal receptive field of the neuron, with a subsequent rectification, Middle trace, The actual firing rate of the same neuron in response to the movie, as averaged from the responses to one set of repeats: 1, 3, 5, 7. Bottom trace, The actual response averaged from the other set of repeats: 2, 4, 4, 8. b, The predicted (top trace in Fig. 7a) versus the actual response (middle trace in Fig. 7a, Actual 1) at corresponding temporal frames. c, The response averaged from one set of repeats (2, 4, 6, 8, bottom trace, Actual 2) versus that from the interleaved set (1, 3, 5, 7, middle trace, Actual 1).
Dan et al. l Coding of Natural Scenes J- Neurosci., May 15, 1996, 76(10):3351-3362 3359
a Predicted-Actual b 10 .
Actual-Actual
10 . I I I I I 1 t I
0.8 0.8
ti 0.6
w
i
0.4
0 u 0.2
0.0
-02 l I 1 I 1 1 f I I
12345678
0.0
-02 .
:
I t
i % It
n
I
i
‘I I I f I I I 1
Movie Index
12345678
Movie Index
0.6
0.0 0.2 0.4 0.6 O-8 1.0
Corr. Eff. (predicted-actual)
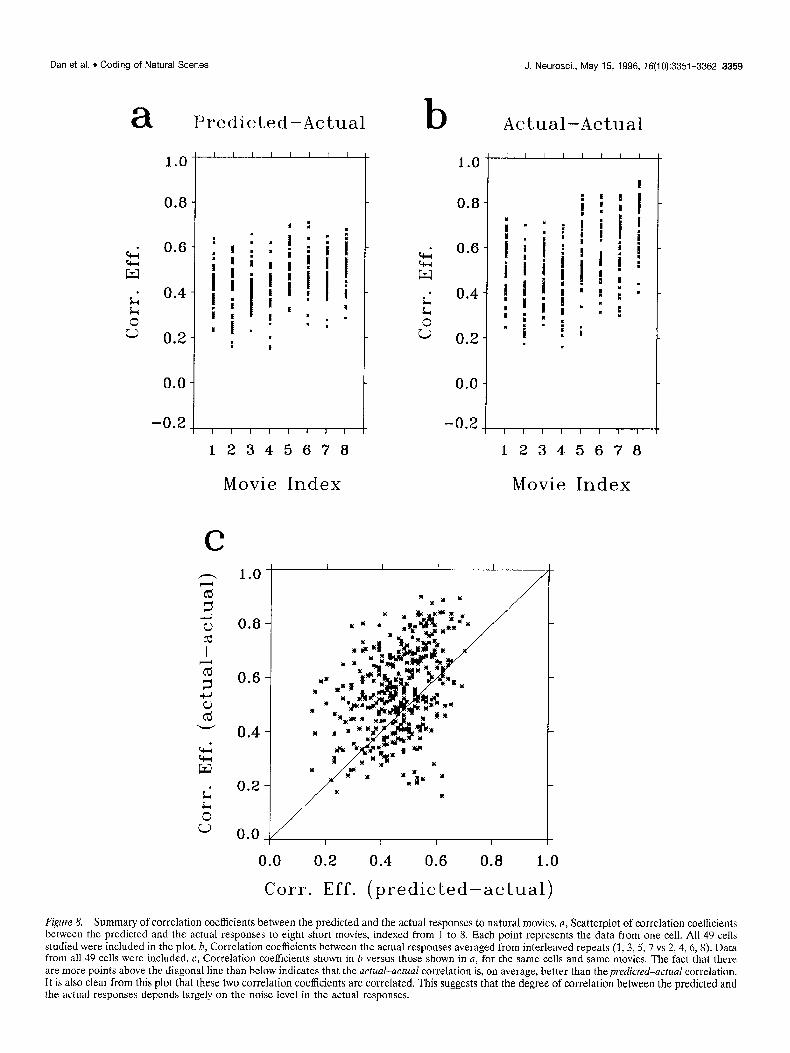
Figure 8. Summary of correlation coefficients between the predicted and the actual responses to natural movies. a, Scatterplot of correlation coefficients between the predicted and the actual responses to eight short movies, indexed from 1 to 8. Each point represents the data from one cell. Al1 49 cells studied were included in the plot. b, Correlation coefficients between the actual responses averaged from interleaved repeats (1,3,5, 7 vs 2, 4, 6,s) Data from all 49 cells were included. c, Correlation coefficients shown in b versus those shown in a, for the same cells and same movies. The fact that there are more points above the diagonal line than below indicates that the act&-actual correlation is, on average, better than the predicted-actual correlation, It is also clear from this plot that these two correlation coefficients are correlated. This suggests that the degree of correlation between the predicted and the actual responses depends largely on the noise level in the actual responses.

3360 J. Neurosci., May 15, 1996, 76(10):3351-3362
b C
Dan et al. l Coding of Natural Scenes
Predicted Short Movie
6
Actual Short Movie
Actual Long Movie
18 0 6 10 lb
Frequency (Hz)
0 6 10 15
Figure 9. Linear prediction of the power spectrum in response to natural movies. a, Power spectrum of one cell in response to a short movie, calculated from the predicted firing rate. b, Power spectrum of the same cell in response to the same movie, calculated from the actual response. These spectra were not white, attributable to the imperfect statistics of the short movie. The power spectrum of the same neuron in response to a long movie is shown in c. All the power spectral-density functions are in units of (impulses/sec)‘/Hz.
tive field are illustrated in Figure 6. Given the spatiotemporal receptive fields, we compared the predicted and the actual re- sponses to eight different short movies, each 16 set long. Linear convolution of the movie (Fig. Sa) and the receptive field (Fig. 5b), followed by a rectification (see Materials and Methods), was used to obtain the predicted firing rate as a function of time. To measure the actual responses, each movie was presented eight times. The instantaneous firing rate was calculated as the PSTH averaged over multiple repeats. We found that the basic features of the predicted responses closely resemble those of the actual responses. Figure 7a shows a 4 set sample of the predicted response of one LGN neuron to a movie (top trace), its actual response averaged from repeat 1, 3, 5, 7 (middle trace), and that averaged from repeat 2, 4, 6, 8 (bottom trace). The variability of the actual responses measured in different repeats can be appre- ciated by comparing the middle and the bottom traces in Figure 7a. This was, in general, comparable to the difference between the predicted (top trace) and the actual responses. A more precise comparison was made by plotting the predicted versus the actual response (Fig. 7b) and the actual response averaged from one set of repeats versus that from another (Fig. 7c), all sampled at 128 Hz. Similar correlation was found in both cases, suggesting that the difference between the predicted and the actual responses can be accounted for largely by the intrinsic variability of the neuronal response.
The correlation coefficients between the predicted and the actual responses for 49 cells, each tested with eight movies, are summarized in Figure 8a. The average correlation coefficient between the predicted and the actual responses for the same movies was 0.48 2 0.11 (SD). This was significantly higher than the average correlation between the predicted and the actual responses for different movies (0,004 t 0.05, SD), which repre-
sents the correlation by chance. The correlation coefficients be- tween the actual responses averaged from interleaved repeats, i.e., repeat 1, 3, 5, 7 and 2, 4, 6, 8, are summarized in Figure 8b, and the correlation between the actual responses from interleaved repeats versus that between the predicted and the actual re- sponses is shown in Fig. 8c for all 49 cells studied. The actual- actual correlation is comparable to but slightly better than the predicted-actual correlation. We believe that this can be ac- counted for, at least partly, by the fact that the predicted and the actual responses were calculated based on two recordings sepa- rated in time and that the condition of the neurons was likely to change over time.
We calculated the power spectra of the predicted and the actual responses evoked by the 16 set short movies. Figure 9, a and b, shows the power spectra of the predicted and the actual re- sponses, respectively, of one LGN neuron. They agreed quantita- tively. These power spectra, however, were not white. This was attributable to the imperfect: statistics of the short movies, because the response of the same cell evoked by a long movie exhibited a power spectrum that was white between 3 and 15 Hz (Fig. SC). Taken together, these results indicate that the responses of LGN cells to natural stimuli can be well predicted from their linear receptive-field properties. Thus the whitening of natural visual signals at the level of the LGN can be largely, if not entirely, explained by the linear filtering properties of the cells.
DISCUSSION In the present study, we have directly confirmed the prediction that the representation of natural visual information at the level of the LGN is temporally decorrelated, particularly between 3 and 15 Hz. It is important to note that the power spectrum of the LGN activity was white only in response to natural input but not to our
Dan et al. l Coding of Natural Scenes J. Neurosci., May 15, 1996, 76(10):3351-3362 3361
control stimulus (white noise). This suggests that white (i.e., random) patterns of activity are not the intrinsic property of LGN neurons. Rather, the early visual pathway has specifically adapted for efficient coding of natural visual information during evolution and/or development.
We would like to point out that the concept of “efficient coding” has been used with a rather specific definition in this paper; it is only one of several mechanisms that may facilitate sensory pro- cessing. The temporally decorrelated signal at the LGN is still a faithful, point-to-point and moment-to-moment representation of natural visual input. The improvement of efficiency at this level is independent of the meaning or importance of particular visual scenes. Another useful strategy in sensory processing is to selec- tively amplify important signals and/or suppress the unimportant ones. This is likely to be achieved at higher levels of the brain and is distinct from the efficient coding discussed here.
The power spectra of LGN neurons in response to natural input deviate significantly from whiteness beyond the range of 3-15 Hz. The failure of whitening below 3 Hz is not surprising, considering the finite duration of the impulse responses of these cells. For a typical LGN cell, the impulse response function has a duration of less than 200 msec. The finite memory of the system limits its ability to selectively attenuate signals below 2-3 Hz. This deficiency, however, may be allevi- ated at higher levels of the visual pathway, where the neurons tend to integrate visual information over a longer period (Ham- ilton et al., 1989; Reid et al., 1991). The failure of whitening above 15 Hz may be related to the theoretical finding that whitening at higher frequencies is not advantageous for opti- mal coding in the presence of noise (Atick and Redlich, 1992). At high frequencies, noise may dominate in the visual input. The attenuation of high frequency signals could therefore serve to avoid amplification of this noise. As a concrete example, it has been demonstrated that the receptive field properties of visual neurons change at different adaptation levels (Shapley and Enroth-Cugell, 1985; Purpura et al., 1988, 1990). This is consistent with the theory of efficient coding, because at low adaptation levels photon noise begins to dominate at higher frequencies.
The temporal tuning of geniculate cells measured in our exper- iments seemed somewhat different from those reported by several other investigators. This may be explained by the differences in experimental procedures. It is well known that retinal X-cells resemble low-pass temporal filters for low-contrast input and become more bandpass with high-contrast stimuli (Shapley and Victor, 1978; 1981). The use of relatively high-contrast, supra- threshold input in our studies may explain the prominent band- pass temporal tuning that was not observed in some studies using low-contrast stimuli (Lehmkuhle et al., 1980). In addition, differ- ent recording electrodes may result in differences in sampling of cells. This may explain why cells recorded in our experiments have, in general, higher cutoff frequencies than those studied by Saul and Humphrey (1990) and Hamamoto et al. (1994). Our electrodes almost certainly sampled larger cells, since very few lagged cells were encountered. It would be interesting to investi- gate whether the cells that were not well sampled in our current study also serve to temporally whiten natural inputs.
We have shown that the whitening of natural signals is largely attributable to the linear-filtering properties of LGN neurons. The temporal-tuning functions of LGN cells generally show a band- pass behavior: within the range of 3-15 Hz, the response is roughly proportional to the frequency. This tuning property can
explain the power spectra of the LGN responses scenes and white noise. For a linear neuron:
to both natural
This is an approximate description ignoring the spatial dimension. ] O(w) 1 2 is the temporal power spectrum of the output, K(w) is the Fourier transform of the receptive field (first-order Wiener kernel), which is equivalent to the temporal-tuning function of the neuron, and I S (or)) j 2 is the power spectrum of the stimulus. As mentioned above, I K(o) I * 3~ w* is a good approximation of the temporal tuning functions of LGN neurons within the range of 3-15 Hz. In natural scenes (particularly at low spatial frequen- cies), I S(U) I 2 m 1/02; therefore, the output is white. For white-noise inputs, however, I S(o) I 2 0~ 1; hence, I O(w) I 2 cf 1 K(o) j * m w2*
Finally, lateral interactions and feedback could have resulted in responses to natural scenes that are not quantitatively predictable from the individual receptive fields. The agreement between the predicted and the actual responses to short movies argues that this is not the case. This agreement also establishes the possibility of a firm connection between the statistical and the deterministic ap- proaches to studying sensory neurons.
REFERENCES Atick JJ (1992) Could information theory provide an ecological theory of
sensory processing? Network: Comput Neural Sys 3:213-251. Atick JJ, Redlich AN (1990) Towards a theory of early visual processing.
Neural Comput 2:308-320. Atick JJ, Redlich AN (1992) What does the retina know about natural
scenes? Neural Comput 4: 196-210. Atick JJ, Li 2, Redlich AN (1992) Understanding retinal color coding
from first principles. Neural Comput 4:559-572. Barlow HB (1961) Possible principles underlying the transformation of
sensory messages. In: Sensory communication (Rosenblith WA, ed). Cambridge: MIT.
Barlow HB (1989) Unsupervised learning. Neural Comput 1:295-311. Brodie SE, Knight BW, Ratliff F (1978) The response of the limulus
retina to moving stimuli: a prediction by Fourier synthesis. J Gen Physiol 72:129-165.
Dawis S, Shapley R, Kaplan E, Tranchina D (1984) The receptive field organization of X-cells in the cat: spatiotemporal coupling and asym- metry. Vision Res 24~549-561.
Derrington AM, Fuchs AF (1979) Spatial and temporal properties of X and Y cells in the cat lateral geniculate nucleus. J Physiol (Lond) 2933347-364.
Dong DW, Atick JJ (1995a) Temporal decorrelation: a theory of lagged and nonlagged responses in the lateral geniculate nucleus. Network: CompuE Neural Sys 6159-178.
Dong DW, Atick JJ (1995b) Statistics of natural time-varying images. Network: Comput Neural Sys 6:345-358.
Eckhorn R, Thomas U (1993) A new method for the insertion of multi- ple microprobes into neural and muscular tissue, including fiber elec- trodcs, fine wires, needles and microsensors. J Neurosci Methods 491175-179.
Enroth-Cugell C, Robson JG (1966) The contrast sensitivity of retinal ganglion cells of the cat. J Physiol (Lond) 187:517-552.
Field DJ (1987) Relations between the statistics of natural images and the response properties of cortical cells. J Opt Sot Am A 4:2379-2394.
Golomb D, Kleinfeld D, Reid RC, Shapley RM, Shraiman BI (1994) On temporal codes and the spatiotemporal response of neurons in the lateral geniculate nucleus. J Neurophysiol 72:2990 -3003.
Hamamoto J, Cheng H, Yoshida K, Smith ITT EL, Chino YM (1994) Transfer characteristics of lateral geniculate nucleus X-neurons in the cat: effect of temporal frequency. Exp Brain Res 98:191-199.
Hamilton DB, Albrecht DC;, Geisler WS (1989) Visual cortical receptive fields in monkey and cat: spatial and temporal phase transfer function. Vision Res 29: 1285-1308.
Harris FJ (1978) On the use of windows for harmonic analysis with the discrete Fourier transform. Proc IEEE 66:5 I- 84.

3362 J. Neurosci., May 15, 1996, 16(10):3351-3362 Dan et al. l Coding of Natural Scenes
Hochstein S, Shapley R (1976) Quantitative analysis of retinal ganglion cell classifications. J Physiol (Lond) 262:237-264.
Humphrey AL, Weller RE (1988a) Functionally distinct groups of X-cells in the lateral geniculate nucleus of the cat. J Camp Neural 268:429-447.
Humuhrev AL. Weller RE (1988b) Structural correlates of functionallv disiinct’x-cells in the lateral geniculate nucleus of the cat. J Camp Neurol 26X:448-468.
Jones JP, Palmer LA (1987) The two-dimensional spatial structure of simple receptive fields in cat striate cortex. J Neurophysiol 58:1187-1211.
Lehmkuhle S, Kratz KE, Mange1 SC, Sherman SM (1980) Spatial and temporal sensitivity of X- and Y-cells in dorsal lateral geniculate nu- cleus of the cat. J Neurophysiol 43:520-541.
Marmarelis PZ, Marmarclis VZ (1978) Analysis of physiological systems. New York: Plenum.
Mastronarde DM (1987) Two classes of single-input X-cells in cat lateral geniculate nucleus. 1. Receptive field properties and classification of cells. J Neurophysiol 57:357-380.
Press HP, Flannery BP, Teukolsky SA, Vetterling WT (1988) Numerical recipes in C: the art of scientific computing. Cambridge: Cambridge UP.
Purpura K, Kaplan E, Shapley RM (1988) Background light and the contrast gain of primate P- and M-retinal ganglion cells. Proc Nat1 Acad Sci USA X5:4534-4537.
Purpura K, Tranchina D, Kaplan E, Shapley RM (1990) Light adaptation in the primate retina: analysis of changes in gain and dynamics of monkey retinal ganglion cells. Vis Neurosci 4:75-93.
Reid RC, Shapley RM (1992) Spatial structure of cone inputs to recep- tive fields in primate lateral geniculate nucleus. Nature 356:716-718.
Reid RC, Victor JD, Shapley RM (1992) Broadband temporal stimuli decrease the integration time of neurons in cat striate cortex. Vis Neurosci 9:39-45.
Rodieck RW (1965) Quantitative analysis of cat retinal ganglion cell response to visual stimuli. Vision Res 5:583-601.
Saul AB, Humphrey AL (1990) Spatial and temporal response properties of lagged and nonlagged cells in cat lateral geniculate nucleus. J Neu- rophysiol 64:206-224.
Shannon CE, Weaver W (1949) The mathematical theory of communi- cation. Urbana, IL: University of Illinois.
Shapley R, Enroth-Cugell C (1985) Visual adaptation and retinal gain controls. Prog Retinal Res 3:263-346.
Shapley RM, Victor JD (1978) The effect of contrast on the transfer properties of cat retinal ganglion cells. J Physiol (Lond) 285:275-298.
Shapley RM, Victor JD (1981) How the contrast gain control modifies the frequency responses of cat retinal ganglion cells. J Physiol (Lond) 318:161-179.
So YT, Shaplcy R (1981) Spatial tuning of cells in and around lateral geniculate nucleus of the cat: X and Y relay cells and perigeniculate interneurons. J Neurophysiol 45: 107-120.
Sutter E (1987) A practical non-stochastic approach to nonlinear timc- domain analysis. In: Advanced methods of physiological systems mod- eling, Vol 1. Los Angeles: University of Southern California.