efficient computer interfaces using continuous gestures, language
TRANSCRIPT

Technical ReportNumber 627
Computer Laboratory
UCAM-CL-TR-627ISSN 1476-2986
Efficient computer interfacesusing continuous gestures,
language models, and speech
Keith Vertanen
March 2005
15 JJ Thomson Avenue
Cambridge CB3 0FD
United Kingdom
phone +44 1223 763500
http://www.cl.cam.ac.uk/

c© 2005 Keith Vertanen
This technical report is based on a dissertation submitted July2004 by the author for the degree of Master of Philosophy(Computer Speech, Text and Internet Technology) to theUniversity of Cambridge, Darwin College.
Technical reports published by the University of CambridgeComputer Laboratory are freely available via the Internet:
http://www.cl.cam.ac.uk/TechReports/
ISSN 1476-2986

- 3 -
Abstract
Despite advances in speech recognition technology, users of dictation systems still face a significant amount of work to correct errors made by the recognizer. The goal of this work is to investigate the use of a continuous gesture-based data entry interface to provide an efficient and fun way for users to correct recognition errors. Towards this goal, techniques are investigated which expand a recognizer’s results to help cover recognition errors. Additionally, models are developed which utilize a speech recognizer’s n-best list to build letter-based language models.

- 4 -
Acknowledgements
First and foremost, I would like to thank my supervisors David MacKay and Steve Young for their advice and encouragement during this work. I am indebted to Matthew Stuttle for his help with acoustic word confusions and for providing scripts and phone confusion matrices. Thanks to the Inference Group members past and present who have contributed to the Dasher project, especially Chris Ball and Phil Cowans for their help during this project.
Revision notes
This document was revised in December of 2004 to correct the cross entropy results presented in sections 6.4 and 6.5. These corrections were necessitated by the discovery of several bugs in the original implementation of the string and lattice-based probability models. These bugs caused the string-based model to have an unduly high cross entropy and the lattice-based model to have an unduly low cross entropy.

- 5 -
1. Introduction Widespread adoption of voice dictation products has been hampered by two main factors: poor recognition accuracy and the lack of efficient correction mechanisms. In recent years, significant progress has been made in improving the accuracy of speech recognition, but little has been done to address the slow and often frustrating process of correction. This project aims to investigate whether a continuous gesture-based interface can provide a more efficient and less frustrating correction mechanism than traditional voice or keyboard/mouse correction. An additional goal is to provide a correction interface that works without a keyboard, allowing use on mobile devices and by people with disabilities that prevent the use of a keyboard.
1.1. Dasher This project builds upon the gesture-based input software Dasher [16]. Dasher is an open source project whose aim is to provide efficient text entry without a keyboard. Users control Dasher using a pointing device, an eye tracker, or a breath control device. Users enter text by zooming in on letters appearing on the display. Letters and sequences of letters appear in size proportional to their probability in an underlying language model. After about an hour of practice, users of Dasher can write at about 25 words per minute [15].
Figure 1: Using conventional Dasher interface to enter “objection”
1.2. Speech Dasher Voice correction of voice dictation has been shown to be an inefficient and often frustrating correction mechanism. During voice correction, misrecognitions can occur causing cascading errors which are time consuming and difficult to correct. Experienced users of voice dictation products usually abandon voice correction in favor of other input modalities such as keyboard or mouse [6]. By adding automated speech recognition (ASR) to Dasher, it is hoped that an interface can be produced which is more efficient than either speech or gestures alone. By speaking a sentence before data entry begins, a user of the speech-enabled version of Dasher (henceforth Speech Dasher) can quickly and naturally provide a wealth of information to Dasher’s language model. The language model can then adjust itself to help the user write some variant of what was spoken. Using Dasher’s existing gesture-based navigation interface, the user can correct any recognition errors made.

- 6 -
It is important that Speech Dasher users still be able to write whatever they want. This allows both for gross recognition errors and for users to rephrase their sentence mid-correction. To meet this requirement, Speech Dasher uses its speech-based model in conjunction with a default language model. This ensures all letters are reachable, even if it takes some effort to reach improbable letters. My first prototype of Speech Dasher requires the user to navigate through their entire dictated sentence. This integrates the proofreading and correction of the sentence into one unified user experience. It is hoped that for regions of the sentence which were recognized correctly, the language model will provide highly probable predictions allowing very quick navigation. In these situations, it should be as simple as seeing the correct sequence of words and steering Dasher towards it. When the user is faced with a recognition error, Speech Dasher will allow the correction to be efficiently spelled out before fluidly returning to the proofreading of the remainder of the sentence. Often when the most probable recognition result contains errors, the correct words will appear elsewhere in the recognition results, allowing correction using only a small amount of Dasher navigation.
1.3. Research objectives Two main avenues of investigation are discussed in this work. The first is to investigate whether correction could be made more efficient if Speech Dasher’s search space is expanded to cover likely mistakes made by the recognizer. This is done by first building a word lattice from the recognizer’s n-best list. This word lattice is then expanded based on acoustic, morphological and language model information. The second research objective is to develop speech-based models which provide the letter probabilities required by Dasher. Models are developed which use the n-best results directly via string matching and indirectly via a recovered word lattice. The development of the lattice-based model also allows evaluation of the effectiveness of the lattice expansion techniques.
1.4. Overview This paper is organized as follows: Section 2 presents the design and initial finding using a prototype version of Speech Dasher. Section 3 discusses the construction of lattices from n-best lists and describes the techniques used to expand them. Section 4 discusses the details of the string and lattice-based probability models. Section 5 provides details of the corpora, software, and procedures used in the experiments. Section 6 presents the experimental results for the lattice expansion techniques and probability models. Section 7 summarizes the findings and discusses possible future work.

- 7 -
2. Speech Dasher Prototype To investigate implementation and user interface issues related to adding speech to Dasher, a prototype was developed. The design and evaluation of this prototype is discussed to motivate the research directions taken in the remainder of this work.
2.1. Design considerations The following requirements were outlined for Speech Dasher:
• Require only a ranked n-best list from the ASR engine. • Widespread availability and easy deployment of the ASR engine by the end user. • Interface with the ASR engine in a vendor independent manner. • Graceful fallback to normal Dasher text entry in the face of recognition errors. • Work well with a variety of pointing devices such as mice, eye trackers and pen
input. • Interface should provide feedback to the user regarding the progress and quality of
speech recognition. • Usable in noisy environments using low quality microphones.
These requirements led to the choice the Microsoft speech recognizer and the speech application programming interface (SAPI). While research recognizers like HTK [18] could provide Speech Dasher with more detailed recognition data and better control of the engine, it was felt that a useful interface could be built using a simpler and easier to deploy engine.
2.2. User interface description Figure 2 shows a screenshot of the Speech Dasher prototype. The icon in the lower-left shows whether the recognizer is currently listening or not. The user starts by clicking this icon, changing its status from off to on. While recognition is taking place, the bottom text pane is periodically updated with the best guess from the recognizer. This display provides the user with feedback about both the progress of the recognition and an idea of the amount of correction required. After the user finishes speaking, the icon changes automatically to the off state. The main Dasher window containing the letter hierarchy is then updated to reflect the new probability distribution based on the utterance. The probability distribution in a given context is obtained by searching for matching strings within the engine’s n-best list (details in Section 4). From this point, the user navigates by zooming in on the correct letter sequence with confirmed letters appearing in the top text box. In order for recognition to take place, the engine must receive audio from a microphone. The microphone input can typically be disabled in several places in the operating system and on the microphone device itself. To provide immediate visual feedback on whether audio is successfully reaching Speech Dasher, a microphone level meter was created. Unfortunately, no way was found to obtain microphone level information using SAPI and in the prototype version the meter is non-functional. Videos of the Speech Dasher prototype are available at http://www.inference.phy.cam.ac.uk/kv227/speechdasher/.

- 8 -
Figure 2: Screenshot of Speech Dasher prototype after user said “Jill studied very hard”.
The bottom text box shows the speech engine’s best guess, the upper text box contains the corrected text.
2.3. Initial impressions and problems Initial testing of the prototype version by the author revealed a number of issues:
• Navigation proceeded very quickly along any portion of a sentence that got correctly recognized by some part of the n-best list. But words or phrases not appearing in the recognition results were hard to enter as they had probabilities well below traditional Dasher levels. Ideally the language model should know when the user has digressed from the n-best list and back-off more fully to Dasher’s original language model.
• Pauses of more than a few seconds cause the engine to return separate recognition events. As a result, only one set of recognition results is used to build the probability model. Support is needed to gracefully handle multiple recognition results from the same sentence and integrate these results into a single coherent correction step.
• While testing the prototype version with an eye tracking device, it was realized that “clicking” the small icon was a difficult way to start recognition. A voice command or a large “start recognition” region in the main navigation window would be a better idea.
• Sometimes the engine correctly recognizes the entire sentence. In this case, it is frustrating to be forced to navigate through the whole sentence. A possible solution would be to provide a voice or gesture-based command which bypasses normal Dasher navigation and accepts the recognizer’s top hypothesis.
While some of these problems are interface issues that are easy to solve, the most serious problem is the degradation of performance in the face of words not predicted by the engine. It is this problem that we focus on in the remainder of this work.

- 9 -
3. Word lattice construction and expansion It was conjectured that the ASR results could be used to best effect by explicitly modeling the n-best list as a word lattice. Furthermore, it was thought that expanding the coverage of the lattice might yield improvements in the efficiency of data entry. It is believed that when using Dasher, a more expansive search space that includes the user’s correct sentence is better than a more compact search space which misses parts of the correct sentence. In this section, I describe the ideas and theory behind the construction and expansion of word lattices based on an n-best list.
3.1. Constructing lattices Word lattices are useful for compactly representing multiple recognition hypotheses. Lattices are directed acyclic graphs with the word labels placed on the nodes (Figure 3). As words can appear multiple times in the lattice, each word is given a unique numbered suffix. Each lattice has a unique start and end node. In this work, all paths are assumed to have equal probability and thus the probability of each hypothesis is not represented in the lattice structure.
Figure 3: Example word lattice representing five possible hypotheses.
Many speech recognizers internally use a word lattice structure. Unfortunately, these lattices are typically not exposed in the application programming interfaces (APIs) of commercial ASR engines. A ranked n-best list is a typical lowest common denominator supported by the engines. We will require that the word lattice be constructed using just an n-best list. The simplest method of construction creates a naïve lattice in which each hypothesis appears in parallel (Figure 4). While not very compact, the naïve lattice is very easy to construct and is guaranteed to have only paths licensed by the n-best list. This latter property is taken as a requirement- the initially constructed lattice must have a path for every hypothesis in the n-best list and should have no paths not in the list. While it would be interesting to investigate the effects of construction algorithms which allow variants not strictly in the n-best list, this was not investigated here.
Figure 4: Naïve lattice covering six hypotheses.

- 10 -
A desirable property of a lattice is how compactly it represents the n-best list. A compact lattice requires less space and less repeated work when expanded to cover additional hypotheses. For example, adding in acoustically confusable words for “hard” to the lattice in Figure 4 requires roughly four times as much work as would be required to add these words to the lattice in Figure 3.
3.1.1. Iterative lattice construction An iterative algorithm was developed to produce approximately compact lattices from n-best lists. This algorithm adds each hypothesis from the n-best list in a locally optimal way. Each new hypothesis is added to the existing lattice such that the resulting lattice has the fewest possible nodes. A new hypothesis is added by considering all possible paths between the sets of existing lattice nodes matching the word sequence of the new hypothesis. To handle the introduction of words not already appearing in the lattice and for cases where the existing nodes cannot be connected such that the lattice only produces the n-best list, new tentative nodes are also considered in the path search (Figure 5).
Figure 5: Possible paths for addition of "Jack studied very much" to Figure 3. Shaded nodes are new tentative nodes, solid arcs show the optimal path found.
Each possible path is evaluated to determine whether its addition allows only strings licensed by the n-best list. The first path using the minimum number of tentative nodes is selected for addition. The minimum number of tentative nodes required is found by calculating the number of new vocabulary words introduced by the hypothesis being added. The number of paths to be searched can become exponential as the size of the lattice grows. To ensure the algorithm completes in a reasonable time, an absolute limit on the number of possible paths searched is enforced. Once the algorithm reaches this limit, any non-optimal solution is used. If no solution has been found, it may be the case that the lattice has become too densely connected to allow simple additions to be found. In this case, a new sublattice is created and all subsequent hypotheses are added to this sublattice. After all hypotheses have been added, the sublattices are placed in parallel in a single result lattice.
3.1.2. DFA lattice construction We can also construct the lattice by first adding all hypotheses in an easy manner which does not guarantee compactness. This incompact lattice can then be minimized to produce a more compact form. This optimization is very similar to the well-studied problem of minimizing the number of states in a deterministic finite automata (DFA) while preserving the language the DFA accepts [5]. The lattice format discussed earlier can be converted to a DFA by moving the word labels from the lattice nodes to the node’s outgoing arcs. In addition, a new initial state, final state, and sink state are introduced. The sink state is necessary as the DFA minimization algorithm requires each state have transitions for every symbol in the alphabet. All states except for the

- 11 -
final state have transitions to the sink state for any symbols (i.e. words) in the DFA’s alphabet which do not correspond to a symbol sequence in the n-best list. The sink state is a non-final state with a self-arc on any symbol (Figure 6).
Figure 6: DFA form of the lattice containing "Jack studied hard" and "Jill studied hard".
Dotted arcs transition on any word not appearing on a solid outgoing arc.
Once converted to a DFA, minimization to an optimally sized DFA can be done using the algorithm developed by Hopcroft [4]. This algorithm is )nlogn(O ⋅⋅⋅⋅ where n is the number of nodes in DFA. For the experiments to be detailed later, naïvely constructed lattices averaged 3300 nodes. A smarter initial construction routine could reduce n , for example by reusing initial portions of the lattice until a word was encountered which was not consistent with the reused path. The DFA approach to lattice construction was not implemented as the iterative algorithm was sufficiently fast and produced reasonably compact lattices. The results for the lattice expansion experiments would not change using optimally compact lattices. Impacts on the results of the probability model experiments will be discussed in Section 6.5.4.
3.1.3. Multiple recognition results As discovered in the prototype, a single sentence may be returned as multiple recognition events, each with a separate n-best list. In the case of these multiple events, we construct a lattice for each separate event and merge the lattices. Two lattices are merged by connecting all nodes connected to the first lattice’s end node with all nodes connected to the second lattice’s start node. Using a single merged lattice allows further processing steps to ignore the number of events involved in a sentence’s recognition.
3.2. Insertion error expansion The easiest type of engine error to repair is an insertion error. To cover all one word insertion errors, every node has additional arcs added between itself and any node that can be reached from it by going through one intermediate node. For example in Figure 7, the node jack_0 gets expansion arcs to hard_0 and very_0 since both these nodes are reachable via the intermediate node studied_0. Similarly, insertion errors of two or more words can be

- 12 -
covered by increasing the number of intermediate nodes allowed between the original node and the node at the endpoint of the expansion arc.
Figure 7: Lattice expansion covering one word insertion errors (dashed arcs added during expansion).
3.3. Substitution and deletion expansion Substitution and deletion errors are much more difficult to correct as they require new words to be added to cover things missed by the recognizer. I attempted to cover single word substitution and deletion errors by including words with similar acoustics or morphology to words already in the lattice. In addition, I used n-gram language models to propose alternate words based on surrounding context in the lattice. With access only to the recognizer’s n-best list, these repairs must be carried out using a word’s orthographic representation.
3.3.1. Finite state machine framework Following the work of [2], finite state machines can be used as a framework to generate acoustically confusable words based on a word’s orthography. The set W of words acoustically confusable with a word W can be expressed by the composition: PCPWW 1
���−−−−==== (1)
where W is a finite state automata (FSA) representing a word’s orthographic form, 1P −−−− is a finite state transducer (FST) taking orthographic forms as input and outputting a sequence of phone symbols, C is a weighted FST taking phones as input and outputting phones, and P is a FST taking phone sequences as input and outputting orthographic forms.
Figure 8: Example finite state machines in PCPW 1���
−−−− using a 3 word dictionary and 4 phones.

- 13 -
The phone confusion FST C contains transitions from each of 46 phones (including silence) to every other phone. In addition, it can contain a transition that takes a phone as an input symbol and outputs nothing. This can be used to allow phones to be deleted from the original pronunciation. Similarly, transitions also could be included which take the empty string as input and output one of the 46 phones. This allows insertion of phones into the original pronunciation. A pronunciation dictionary used to construct P might include multiple pronunciations for a given word. P might also include return transitions from the final states to the initial state. These return transitions allow acoustic confusions where a single word is judged to be confusable with one or more other words. A language model L can also be added to composition: LPCPWW 1
����−−−−==== (2)
The language model is useful for biasing the resulting confusable words towards those that are more common in a language. After the addition of the language model, the new probabilities of the confusable words are the language model probability from L combined with the acoustic probability from C using a scaling factor.
3.3.2. Single word acoustic confusions Using the finite machine framework, a lookup table can be constructed which gives the acoustically confusable words for any given word in the dictionary. Using this table, a lattice can be expanded to include potentially confusable words which may help cover some of the substitution errors made by the recognizer (Figure 9).
Figure 9: Expansion of "Jack studied hard" using up to 4 acoustically confusable words.
3.3.3. Multiple word acoustic confusions One possible source of deletion errors is the recognition of multiple distinct words as a single word. Using return transitions in P would allow these multiple word confusions to be found. With the inclusion of these returns, a single word can map to any number of confusable words. Restricting the number of resulting words is also possible by constructing P such that it contains a fixed number of repeated instances of the pronunciation FST (Figure 10). Once generated, the set of multiple word confusions is spliced into the lattice (Figure 11).

- 14 -
Figure 10: Pronunciation FST which only produces two word confusions.
Figure 11: Expansion of "Jack studied hard" using acoustically confusable two words pairs.
3.3.4. Morphology-based confusions Sometimes when the recognizer fails to come up with the exact word spoken, it generates a morphological variant of the spoken word. Such confusions are likely since morphological variants of a word often share similar acoustics. Given a word’s orthography, a variety of stemming algorithms are available which can generate the word’s root form. By generating sets of words that share the same root form, a lookup table can be constructed to expand a word to its morphological variants (Figure 12).
Figure 12: Expansion of "Jack studied hard" using morphology-based confusions.
3.3.5. Language model confusions N-gram language models can be used to predict the probability of word sequences in a language based on observed occurrences of those sequences in a training corpus. An n-gram language model can be used to find the most probable alternatives for a given node of the lattice by looking at its previous context within the lattice.

- 15 -
In the case of bigram expansion, the context of a node Z is the set of unique orthographic representations of all nodes Y where there exists an arc from Y to Z . In a trigram expansion, the context of Z is the orthographic representations of nodes X and Y where there exists an arc from X to Y and from Y to Z .
Figure 13: Forward language model bigram expansion of "Jack studied hard".
Figure 14: Forward language model trigram expansion of "Jack studied hard".
For every item in the context of a node, the most probable n-grams found in the language model can be used to add additional nodes to the lattice. For example, the two most probable bigrams beginning with “jack” might be “jack straw” and “jack nicholson”, resulting in “straw” and “nicholson” being added to the lattice as possible alternates to “jack studied” (Figure 13). Since the full recognition results are known at the time of lattice expansion, the words following a given node might also be used to predict alternate words. A backwards language model can be trained on the same corpus as a forward language model by simply reversing all the words in each training sentence. This backward language model can then generate alternates for a node by looking at the words which follow it (Figure 15).
Figure 15: Backward language model bigram expansion of "Jack studied hard".
3.3.6. Controlling language model expansion A given node’s context may contain multiple n-grams which are each used to expand the lattice. Different n-grams in a node’s context may predict overlapping sets of words. To

- 16 -
avoid these redundant additions, new nodes are only created for an item if the word has not previously been added by another n-gram in the node’s context. In addition, redundancy can result from different nodes in the lattice expanding to similar sets of alternate words. This is likely to occur when nodes share the same previous and next nodes in the lattice. To remove this redundancy, expansion candidate nodes are compared against previously added nodes. If the candidate node has an identical set of previous nodes to a node that was already added, then the candidate only needs to be added if it has unique nodes following it. In the case of Figure 16, expanding the node studied_0 results in the addition of the nodes straw_0 and nicholson_0. Subsequently, the expansion of drank_0 proposes the addition of the nodes straw_1 and nicholson_1. These nodes are not added as they are redundant with the previous addition of straw_0 and nicholson_0.
Figure 16: Example of possible redundancy during language model expansion
of studied_0 and drank_0 nodes.
- 17 -
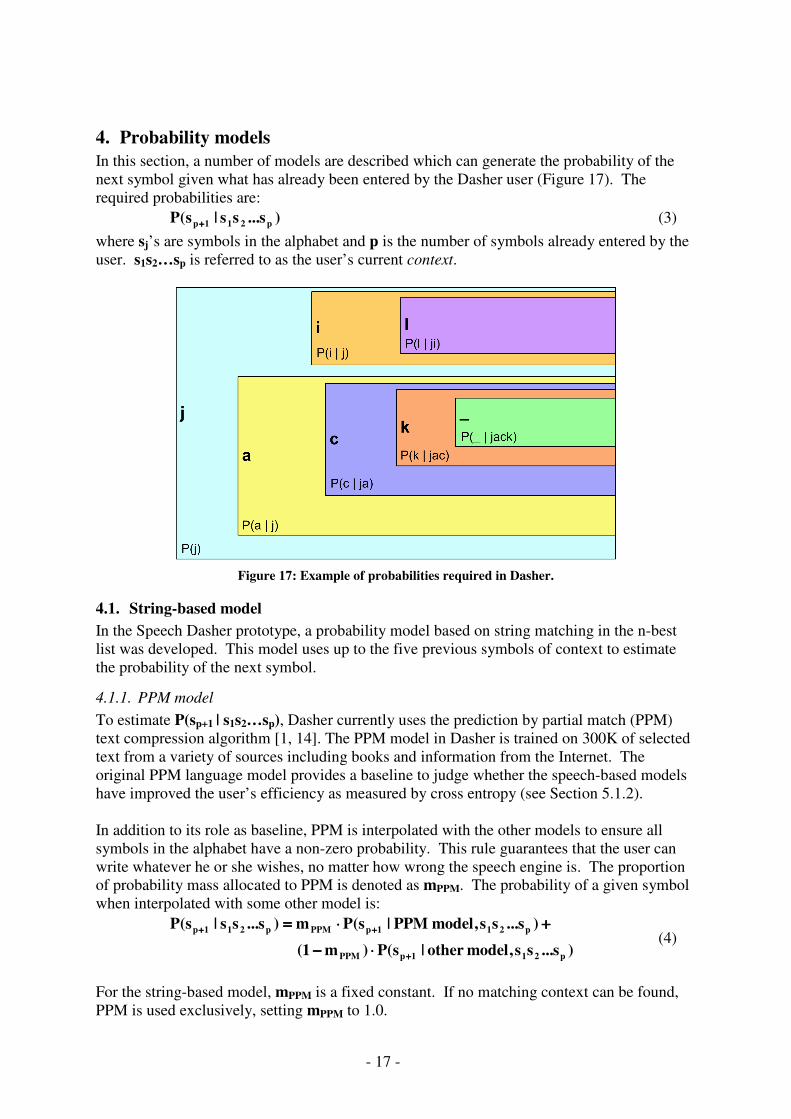
4. Probability models In this section, a number of models are described which can generate the probability of the next symbol given what has already been entered by the Dasher user (Figure 17). The required probabilities are: )s...ss|s(P p211p++++ (3) where sj’s are symbols in the alphabet and p is the number of symbols already entered by the user. s1s2…sp is referred to as the user’s current context.
Figure 17: Example of probabilities required in Dasher.
4.1. String-based model In the Speech Dasher prototype, a probability model based on string matching in the n-best list was developed. This model uses up to the five previous symbols of context to estimate the probability of the next symbol.
4.1.1. PPM model To estimate P(sp+1 | s1s2…sp), Dasher currently uses the prediction by partial match (PPM) text compression algorithm [1, 14]. The PPM model in Dasher is trained on 300K of selected text from a variety of sources including books and information from the Internet. The original PPM language model provides a baseline to judge whether the speech-based models have improved the user’s efficiency as measured by cross entropy (see Section 5.1.2). In addition to its role as baseline, PPM is interpolated with the other models to ensure all symbols in the alphabet have a non-zero probability. This rule guarantees that the user can write whatever he or she wishes, no matter how wrong the speech engine is. The proportion of probability mass allocated to PPM is denoted as mPPM. The probability of a given symbol when interpolated with some other model is:
)s...ss,model other|s(P)m1(
)s...ss,model PPM|s(Pm)s...ss|s(P
p211pPPM
p211pPPMp211p
++++
++++++++
⋅⋅⋅⋅−−−−
++++⋅⋅⋅⋅==== (4)
For the string-based model, mPPM is a fixed constant. If no matching context can be found, PPM is used exclusively, setting mPPM to 1.0.

- 18 -
4.1.2. Using context and position This method relies on matching the current symbol context to substrings in the n-best list. Finding the context in a hypothesis suggests that the symbol following this context is likely to occur next. The longest possible context is searched for first. If no matches are found, the context is progressively shortened until at least one match is found. If no matches of any length are found, the model backs off to using PPM exclusively. The particular hypothesis in which a match occurs can be used to associate a probability with that match. While most ASR engines provide a ranked n-best list ordered from most likely to least likely, they typically do not provide a probability for the different hypotheses. As an alternate to engine supplied probabilities, a probability distribution based on the hypotheses’ rank can be used. This distribution should give hypotheses a probability inversely proportional to their rank while still allowing high rank hypotheses to retain enough probability for meaningful participation in the model. The inverse log function fits these needs and a probability distribution was created by normalizing by the sum of the function’s value at each rank. For an n-best list with K hypotheses, the probability of the ith hypothesis can be estimated as:
����==== ++++
++++======== K
1j e
e
)1j(log
1
)1i(log1
)irank(P (5)
Each successful match in the n-best list can also be weighted according to a probability distribution which is a function of the current number of symbols entered by the user (Figure 18). The simplest positional distribution is one that is uniform across the entire range (i.e. the current number of symbols entered has no bearing on the prediction). The probability of a match m in the ith hypothesis when the user has entered p symbols is: )irank(P1)uniform,i,p|m(P ====⋅⋅⋅⋅==== (6)
j a c k _ s t u d i e d _ h a r d j a c k _ s t u d i e d _ v e r y _ h a r d j i l l _ s t u d i e d _ h a r d j i l l _ s t u d i e d _ v e r y _ h a r d j i l l _ s t u d i e d _ l i t t l e
Figure 18: Example of distributions used in string-based model.
The peak distribution forces all matches that are not exactly preceding the current position to be given zero probability. This distribution provides good estimates when the symbol
Uniform:
Peak:
Gaussian:

- 19 -
sequence entered by the user corresponds exactly with the beginning of one or more of the hypotheses. In this case, the model predicts the next symbols in those matching hypotheses. If the last symbol of match m is at position q of the ith hypothesis, the probability is:
������������ ========⋅⋅⋅⋅
==== otherwise 0
qp if )irank(P1)peak,i,q,p|m(P (7)
A softer decision can be made by using a Gaussian centered at the current position. Matches further away from the current position (i.e. the Gaussian’s mean) are less probable than those which are closer. Two variants of this approach were tested, one in which the variance is fixed and another where the variance increases as the position increases. The latter reflects the increasing uncertainty about the actual location within the n-best list as text entry progresses. This uncertainty about position results from the addition or subtraction of symbols as recognition errors are corrected by the user. Using the probability calculated from (5), if Li is the length of the ith hypothesis, the weighted average length is:
����====
⋅⋅⋅⋅========K
1iiavg L)irank(PL (8)
This weighted average length is multiplied by a constant to calculate the sigma value for the fixed variance Gaussian model: avgfixedfixed L⋅⋅⋅⋅αααα====σσσσ (9) If the last symbol of match m is at position q of the ith hypothesis, the probability using the fixed variance model is: )irank(P),p,q(N)Gaussian fixed,,i,q,p|m(P 2
fixedfixed ====⋅⋅⋅⋅σσσσ====σσσσ (10) The increasing variance model used a sigma value for the ith hypothesis of:
i
minmaxmini,inc Lp)( ⋅⋅⋅⋅αααα−−−−αααα++++αααα====σσσσ (11)
The probability of a match m ending on symbol q of the ith hypothesis of the increasing variance model is: )irank(P),p,q(N)Gaussian increasing,,i,q,p|m(P 2
i,inci,inc ====⋅⋅⋅⋅σσσσ====σσσσ (12) Finally, if M is the set of all matches, and
1psM++++
is the subset of matches with following
symbol 1ps ++++ , the probability estimate using the string model is:
����
����
∈∈∈∈
∈∈∈∈
++++++++====
p
1p
sMm
sMm
p211p )m(P
)m(P
)s...ss,string|s(P (13)
where )m(P depends on the model variant (equation 6, 7, 10, or 12).
4.2. Lattice-based model A weakness of the string-based model is that it only crudely represent the user’s position within the n-best hypotheses. It may be better if a model explicitly tracked the user’s

- 20 -
progress through the hypotheses. This would allow the model to better know when the user is correcting an error, allowing back-off to a more general language model.
4.2.1. Partial paths The lattice-based model operates by tracking the user’s data entry using a set of possible partial paths through the lattice. Let us first consider the simple case where the lattice contains the symbol sequence the user is entering. Each partial path specifies a route to a particular node in the lattice. In addition, each partial path either points to a particular symbol within that node’s word or points past the end of the word. The symbol pointed to by a path is the symbol that this path requires next from the user. If the path is past the end of the word, it expects the end of word (EOW) symbol. Each partial path also has an associated probability which initially is set to 1.0. For example in the lattice in Figure 19, after the user has entered “the cat”, there are partial paths to letter “s” in the node cats_0 and past the end of the word in node cat_0.
Figure 19: Partial paths in lattice-based model after entry of “the_cat”.
The algorithm proceeds by tracking the birth and death of paths as the user enters symbols. Paths die when the user enters a symbol inconsistent with the next symbol expected by a path. When a path completes a word and encounters an EOW symbol, before the original path dies, it gives birth to new paths pointing to the first symbol in each node reachable from the original path’s last node. Using our previous example, if the user now enters the EOW symbol (denoted by an underscore), the path to cats_0 dies and the path to cat_0 gives birth to two new paths, one to sat_0 and the other to ran_0 (Figure 20).
Figure 20: Partial paths after entry of "the_cat_"
4.2.2. Symbol probability estimate The frequency of different symbols occurring at the location pointed to by all partial paths can be used to estimate the probability of the next symbol. Formally, if
psPP is the set of all
partial paths consistent with the symbol sequence s1s2…sp, then:

- 21 -
����
����
∈∈∈∈
∈∈∈∈
++++++++====
ps
1ps
PPi
PPi
p211p )i(P
)i(P
)s...ss model, lattice|s(P (14)
where )i(P is the probability of partial path i .
4.2.3. Error recovery Until this point, we have assumed that the lattice contains a path corresponding to the sequence of symbols entered by the user. If this is not the case, then at some point all partial paths die. For example in Figure 19, if the user is attempting to write “the cattle sat”, entering the second “t” in “cattle” causes both paths to die. In the lattice-based model, the death of all paths indicates that the user is currently entering a word that the recognizer got wrong. During this error, as will be discussed shortly, something besides (14) must be used to estimate symbol probabilities. In addition, the model must decide where to carry on after the error, hopefully guiding entry back to a correctly recognized portion of the lattice. Recovery after an error is done by allowing paths to make one or more word errors during their journey through the lattice. These errors allow a path to give birth to children before dying due to a non-matching word. The first child is created pointing to the first symbol in the node in which the parent died. This child covers the possibility of an engine deletion error, allowing entry to continue from the present lattice position after the word error. This child’s path probability is assessed a penalty of �del. Additional children are created for every node reachable from the dead path’s last node. These children cover the possibility of an engine substitution error, skipping over the erroneous word in the lattice. Each child’s path probability is assessed a penalty of �sub. The reinstatement of paths is done after completion of the erroneous word is signaled by entry of the EOW symbol. The reinstatement of paths can be done in two ways. In the first method, the error recovery is applied from the position where partial paths were in the lattice when all paths died. These dead paths are allowed to produce children as appropriate and these children handle future symbols. Alternatively, paths can be rebuilt from the start node, reparsing the symbol sequence but allowing for one more error than the previous failed paths. This method has the advantage that new paths may be explored which on earlier passes were not reachable. This helps prevent the starting portion of the symbol sequence leading us permanently into a section of the lattice which is a poor match given more of the sequence.
4.2.4. Use of expanded lattice The techniques described in Section 3 can cause a large increase in the number of nodes and arcs in the word lattice. These expanded nodes are less likely to be correct than the original nodes licensed by the n-best list. As such, partial paths are assessed a penalty of �exp whenever they utilize an arc that was created by expanding the original lattice. By varying �exp, the relative degree of trust in the expanded lattice can be adjusted.
4.2.5. Pruning of paths For every word error encountered in a sentence, the number of partial paths doubles. For recognitions with a high number of errors, this can lead to an exponential number of partial
- 22 -
paths. To restrict the number of paths, after every extension of paths by a symbol, only the top �prune paths are retained.
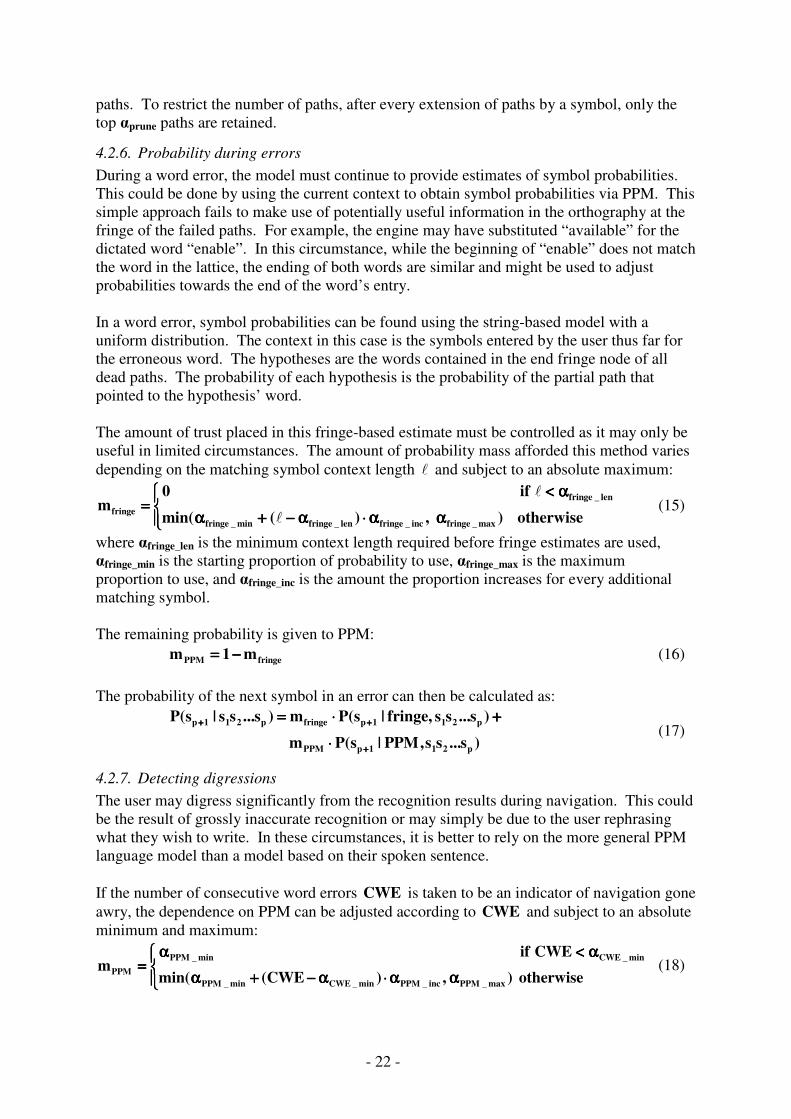
4.2.6. Probability during errors During a word error, the model must continue to provide estimates of symbol probabilities. This could be done by using the current context to obtain symbol probabilities via PPM. This simple approach fails to make use of potentially useful information in the orthography at the fringe of the failed paths. For example, the engine may have substituted “available” for the dictated word “enable”. In this circumstance, while the beginning of “enable” does not match the word in the lattice, the ending of both words are similar and might be used to adjust probabilities towards the end of the word’s entry. In a word error, symbol probabilities can be found using the string-based model with a uniform distribution. The context in this case is the symbols entered by the user thus far for the erroneous word. The hypotheses are the words contained in the end fringe node of all dead paths. The probability of each hypothesis is the probability of the partial path that pointed to the hypothesis’ word. The amount of trust placed in this fringe-based estimate must be controlled as it may only be useful in limited circumstances. The amount of probability mass afforded this method varies depending on the matching symbol context length � and subject to an absolute maximum:
��������
������������
αααααααα⋅⋅⋅⋅αααα−−−−++++αααα
αααα<<<<====
otherwise ) ,)(min(
if 0m
max_fringeinc_fringelen_fringemin_fringe
len_fringefringe
�
�
(15)
where �fringe_len is the minimum context length required before fringe estimates are used, �fringe_min is the starting proportion of probability to use, �fringe_max is the maximum proportion to use, and �fringe_inc is the amount the proportion increases for every additional matching symbol. The remaining probability is given to PPM: fringePPM m1m −−−−==== (16) The probability of the next symbol in an error can then be calculated as:
)s...ss,PPM|s(Pm
)s...ss fringe,|s(Pm)s...ss|s(P
p211pPPM
p211pfringep211p
++++
++++++++
⋅⋅⋅⋅
++++⋅⋅⋅⋅==== (17)
4.2.7. Detecting digressions The user may digress significantly from the recognition results during navigation. This could be the result of grossly inaccurate recognition or may simply be due to the user rephrasing what they wish to write. In these circumstances, it is better to rely on the more general PPM language model than a model based on their spoken sentence. If the number of consecutive word errors CWE is taken to be an indicator of navigation gone awry, the dependence on PPM can be adjusted according to CWE and subject to an absolute minimum and maximum:
��������
������������
αααααααα⋅⋅⋅⋅αααα−−−−++++αααα
αααα<<<<αααα====
otherwise ) ,)CWE(min(
CWE if m
max_PPMinc_PPMmin_CWEmin_PPM
min_CWEmin_PPMPPM (18)

- 23 -
where �CWE_min is the minimum consecutive errors required before digression detection is used, �PPM_min is the starting proportion of probability to use, �PPM_max is the maximum proportion to use, and �PPM_inc is the amount the proportion increases for every additional consecutive error.

- 24 -
5. Experimental setup A range of experiments were conducted to validate the ideas presented earlier. In this section, I describe the measurements, corpora, speech recognizer, text normalization, and software developed for this project.
5.1. Measurements
5.1.1. Accuracy measure Performance of a speech recognizer is often measured by percent accuracy as given by:
%100N
ISDNaccuracyPercent ⋅⋅⋅⋅−−−−−−−−−−−−==== (19)
where N is the total number of labels in the correct string, D is the number of deleted labels, S is the number of substituted labels, and I is the number of inserted labels. Accuracy can be given for the top hypothesis or for the maximum accuracy out of all possible hypotheses. The maximum accuracy out of all hypotheses, also known as the oracle accuracy, is used in this paper. Oracle accuracy is measured using both word-level labels and character-level labels. Character-level labels provide a closer correspondence to the task of correctly entering an utterance letter-by-letter using Dasher. Character accuracy rewards techniques which incorporate alternates close to, but not identical to the correct word. The alignment yielding the maximum accuracy can be found using a dynamic programming algorithm. In the work here, the lattice-tool program from the SRI language modeling toolkit [12] was used to calculate word and character oracle accuracy.
5.1.2. Cross entropy measure The oracle accuracy measure has the defect that it is maximized by the lattice that includes all possible sentences. So the performance of the probability models is measured using cross entropy, the average information content required by a hypothetical user entering the transcriptions and making no mistakes. For a transcription T consisting of symbols s1s2…st, the cross entropy (in bits) is:
����−−−−
====++++⋅⋅⋅⋅−−−−====
1t
0ii211i2 )s...ss|s(Plog
t1 entropy(T) Cross (20)
5.2. Corpora used
5.2.1. Speech corpus The intended use of Speech Dasher is for the task of correcting dictation. While it is not currently known what text genres users will want to dictate, it will likely be written correspondence such as business documents, academic papers and email messages. As such, the chosen speech corpus should consist of dictated written English as opposed to conversational English. In addition, the corpus should simulate both use in a quiet environment using a headset microphone and use in noisy mobile environment using a microphone of poor quality. The Speech Dasher user is expected to be a novice to the dictation task. The Wall Street Journal (WSJ1) continuous speech corpus [10] was chosen as it best matched the above requirements. WSJ1 consists of a large number of speakers dictating sentences

- 25 -
from the Wall Street Journal. Three subsets of the available audio were used for the experiments in this paper (Table 1, Table 2, and Table 3). The first two development sets, Ch1Dev and Ch2Dev, use five sentences from each of 200 non-journalist speakers. The five sentences were the first non-block adaptation recordings in each speaker’s set and thus were unique from the other speaker’s sentences. Ch1Dev was designed to simulate desktop dictation and used the high quality channel 1 recordings. Ch2Dev simulates mobile device dictation and uses the low quality channel 2 recordings. Note that while Ch2Dev uses a variety of low quality microphones, it still involves a quiet recording environment and thus recognition is easier than in a true mobile environment. The Hub1 subset of WSJ1 serves as a held out test set for evaluating techniques tuned on Ch1Dev. The WSJ1 NIST sphere audio files were converted to RIFF WAVE using VoxStudio v3.0.65. The audio level was normalized during conversion to 25% RMS. Ch1Dev Corpus WSJ1 Speaker type Non-journalist Microphone Sennheiser HMD-414 (head-mounted, noise canceling) Number speakers 200 Sentences per speaker 5 Total sentences 1000 Recognitions per sentence 1.10 Hypotheses per utterance 185.4
Table 1: Overview of Ch1Dev development set.
Ch2Dev Corpus WSJ1 Speaker type Non-journalist Microphone Various secondary microphones Number speakers 200 Sentences per speaker 5 Total sentences 1000 Recognitions per sentence 1.17 Hypotheses per utterance 233.4
Table 2: Overview of Ch2Dev development set.
Hub1 Corpus WSJ1 Speaker type Non-journalist Microphone Sennheiser HMD-414 (head-mounted, noise canceling) Number speakers 10 Sentences per speaker ~50 Total sentences 503 Recognitions per sentence 1.18 Hypotheses per utterance 239.2
Table 3: Overview of Hub1 test set.

- 26 -
5.2.2. Language modeling corpus For various experiments in this paper, n-gram language models were required. These models were built using the HTK language modeling toolkit [18]. LDC’s English Gigaword text corpus was used to provide the training material (Table 4). Gigaword is similar in text genre to the WSJ dictation task, a fact that could influence the generalization of techniques relying on the language models built from Gigaword. The raw text was conditioned using the LDC conditioning tools provided for the August 1994 release of the CSR Standard Language Model. These scripts were slightly modified to allow use with the different file format of the Gigaword corpus. News source Words (in millions) Agence France Press English Service 170 Associated Press Worldstream English Service 539 The New York Times Newswire Service 914 The Xinhua News Agency English Service 131
Table 4: Overview of English Gigaword corpus.
5.3. Speech recognizer For Speech Dasher to be easily and widely deployable, it needs to run against a variety of ASR engines on a number of different platforms (such as Windows, linux, and Windows CE). The exact interface supported by the engine varies, but most can return a ranked n-best list. Microsoft’s speech recognizer v5.11 provides this capability and is freely available as part of Microsoft Speech SDK 5.1 [8]. The engine was used via Microsoft’s Speech API (SAPI). SAPI has the advantage of being supported by other engine vendors such as IBM and ScanSoft, a fact which may allow easier integration with other engines. Microsoft’s engine supports both supervised and unsupervised adaptation of its acoustic models. For the experiments here, no supervised training was performed and background adaptation was turned off. All experiments were conducted on a newly initialized speech profile. All results presented here were done using the recognizer’s highest accuracy setting. Despite turning off background adaptation, running recognition repeatedly on the same recorded wave form resulted in slightly different recognition results. To address this issue, recognition was performed only once for each utterance in Ch1Dev and Ch2Dev. Results were output to an XML file and only these static files were used in experiments. Baseline Ch1Dev accuracy numbers using five accuracy settings are given in Table 5. Timing is on a Pentium III 700Mhz system with 256MB of memory. Accuracy given is without any adjustments to address mismatches in text normalization (see Section 5.4). Accuracy setting: 1 (low) 2 3 4 5 (high) Latency (seconds) 3.89 5.15 6.83 9.10 12.80 Oracle accuracy 65.27% 69.16% 71.99% 73.85% 74.42% Hypotheses per utterance 105.88 124.57 153.42 168.33 185.42
Table 5: Average recognition latency and accuracy on Ch1Dev using different accuracy settings.

- 27 -
5.4. Transcript and recognition conditioning The transcriptions provided in WSJ1 use special tokens for verbalized punctuation such as “,COMMA” and “/SLASH”. Spoken numbers, monetary amounts, dates, etc. are transcribed in their full orthographic form. Abbreviations are typically transcribed with a period after each letter and a space such as “c. b. s.”. Microsoft’s recognition results can be obtained in normalized or unnormalized form. For all experiments here, the unnormalized results were used. This allowed entities such as numbers and dates to match between the recognition results and the WSJ1 transcriptions. Microsoft’s engine was not consistent in whether it returned an orthographic or a symbolic representation of punctuation. Abbreviations are often returned as a string of contiguous letters with no intervening periods or spaces. The mismatch in treatment of punctuation and abbreviations can unduly lower accuracy measures. For example, a recognition result of “cat,” would cause both a substitution and deletion error against the transcription “cat ,COMMA”. While a full treatment of this issue is beyond the scope of this work, a simple text mapping was used to allow some mismatches to be handled. This mapping took WSJ1 verbalized punctuation tokens and their corresponding symbolic characters and converted them to a shared orthographic representation, for example “:COLON” and “:” both map to “colon”. A set of 28 symbols (26 letters, apostrophe, and space) was used in the conditioned recognition results and transcriptions. This set was also used as the alphabet for the probability models. WSJ1 transcription Microsoft ASR Mismatch types THE OPERATING RATE IS "QUOTE STILL KIND OF LOW BUT IT'S COMING BACK "UNQUOTE SAID PRISCILLA LUCE SENIOR ECONOMIST AT WHARTON ECONOMETRIC FORECASTING ASSOCIATES IN PHILADELPHIA
THE OPERATING RATE IS "STILL, GLOBE IS COMING BACK" SAID PRISCILLA LUCE SENIOR ECONOMIST AND WHARTON ECONOMETRIC FORECASTING ASSOCIATES IN PHILADELPHIA
Quote symbols
BANK AID :COLON OKLAHOMA SENATOR BOREN AND OTHER LAWMAKERS FROM STATES HARD HIT BY BANK CLOSINGS MULL WAYS TO EASE THE FALLOUT
BANK AID: OKLAHOMA SENATOR BOREN AND ENTER LAWMAKERS FROM STATE'S HARD HIT BY BANK CLOSINGS MALL WAYS TO EASE THE FALL,
Colon symbol Comma symbol
CAPITAL CITIES SLASH A. B. C. DECLINED TO COMMENT ON THE TALKS
CAPITAL CITIES/ABC DECLINED TO COMMENT ON THE TALKS
Slash symbol Abbreviation
Table 6: Examples of mismatches between transcriptions and “unnormalized” ASR results.
5.5. Software infrastructure The prototype discussed in Section 2 was based on the existing Dasher code base. Code was added and existing code modified to create the Speech Dasher prototype. All other experiments were conducted using RALM (Recognition and Lattice Munger). RALM is a command line program developed specifically for this project. Features of RALM include:
• Recognition against stored WAVE audio files using SAPI. • Lattice construction and expansion.

- 28 -
• Models for estimating symbol probabilities. • Measurement of accuracy and other lattice statistics. • Measurement of cross entropy of probability models. • XML serialization and de-serialization of recognition results and lattices. • Output of dot [3] format files for lattice visualization. • Conditioning of recognition results and WSJ transcripts. • Operates in Windows and Unix (with the exceptions that recognition only works
on Windows and measurement of lattice accuracy only works on Unix). Numerous PERL scripts were also developed during the course of this project. These scripts were used to produce the various text files used by RALM such as the acoustic confusion lookup table. Scripts were also used for language model training and to process results.

- 29 -
6. Results In this section, experimental results are presented for the lattice expansion techniques and probability models discussed previously (Section 3 and 4).
6.1. Insertion error repair Experiments were conducted to measure the word and character oracle accuracy rates of lattices with arcs added to cover insertion errors. Arc additions were tested to cover one word (denoted Insertion 1), one and two word (Insertion 1-2), and one through three word (Insertion 1-3) insertion errors. An upper bound for techniques which do not add additional unique words to a lattice (i.e. they merely add arcs or duplicates of existing nodes), is the accuracy of a lattice which has all unique words available at every position in the target transcription (Figure 21). While this upper bound can vary slightly depending on the exact recognition results, it was around 89% oracle word accuracy for Ch1Dev and 68% for Ch2Dev.
Figure 21: Example of lattice used to compute upper bound.
For a given node, determining the endpoints of the expansion arcs requires enumerating all subpaths from that node which use a limited number of arcs (two arcs for Insertion 1, three for Insertion 1-2, and four for Insertion 1-3). As discussed previously, the manner in which lattices are constructed from multiple recognition events causes an explosion in the number of possible paths in the lattice. This explosion in the lattice paths also causes an explosion in the number of subpaths explored by the insertion expansion algorithm. To reduce computational expense, the Insertion 1-3 experiment was run without lattices which had over a million paths prior to expansion (eliminating 7 lattices from Ch1Dev and 21 from Ch2Dev). For both Ch1Dev and Ch2Dev, it was found that adding arcs to cover one word insertion errors gave a nice improvement in absolute word accuracy, 1.7% and 3.1% respectively (Figure 22). Addition of further arcs yielded little or no improvement. Character accuracy followed a similar trend, making gains for the Insertion 1 experiment, but showing no further improvement on Insertion 1-2 or Insertion 1-3. While the upper bound indicates there is still improvement available, the addition of substantial numbers of arcs in Insertion 1-2 and Insertion 1-3 resulted in no additional gains. This indicates that just adding arcs is not sufficient and some nodes need to be duplicated and reconnected in other parts of the lattice. While it would be interesting if ways could be found to choose good candidates for duplication, this was not investigated here.
- 30 -
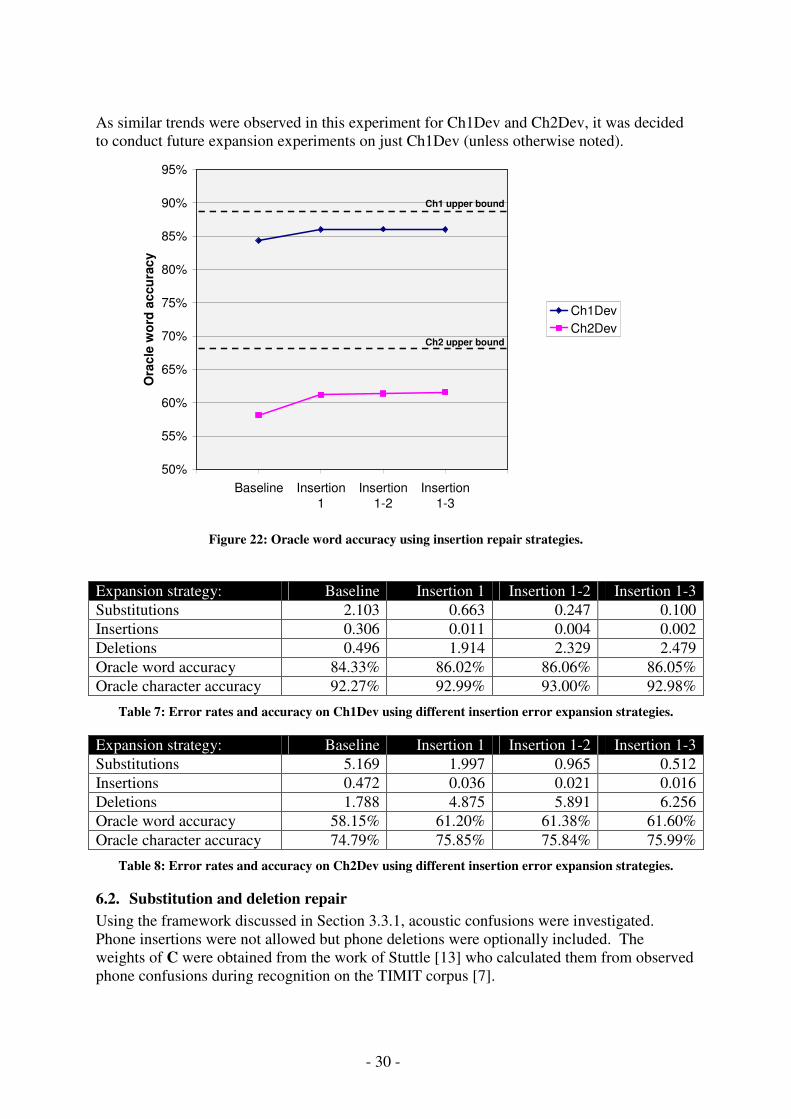
As similar trends were observed in this experiment for Ch1Dev and Ch2Dev, it was decided to conduct future expansion experiments on just Ch1Dev (unless otherwise noted).
50%
55%
60%
65%
70%
75%
80%
85%
90%
95%
Baseline Insertion1
Insertion1-2
Insertion1-3
Ora
cle
wor
d ac
cura
cy
Ch1DevCh2Dev
Ch1 upper bound
Ch2 upper bound
Figure 22: Oracle word accuracy using insertion repair strategies.
Expansion strategy: Baseline Insertion 1 Insertion 1-2 Insertion 1-3 Substitutions 2.103 0.663 0.247 0.100 Insertions 0.306 0.011 0.004 0.002 Deletions 0.496 1.914 2.329 2.479 Oracle word accuracy 84.33% 86.02% 86.06% 86.05% Oracle character accuracy 92.27% 92.99% 93.00% 92.98%
Table 7: Error rates and accuracy on Ch1Dev using different insertion error expansion strategies.
Expansion strategy: Baseline Insertion 1 Insertion 1-2 Insertion 1-3 Substitutions 5.169 1.997 0.965 0.512 Insertions 0.472 0.036 0.021 0.016 Deletions 1.788 4.875 5.891 6.256 Oracle word accuracy 58.15% 61.20% 61.38% 61.60% Oracle character accuracy 74.79% 75.85% 75.84% 75.99%
Table 8: Error rates and accuracy on Ch2Dev using different insertion error expansion strategies.
6.2. Substitution and deletion repair Using the framework discussed in Section 3.3.1, acoustic confusions were investigated. Phone insertions were not allowed but phone deletions were optionally included. The weights of C were obtained from the work of Stuttle [13] who calculated them from observed phone confusions during recognition on the TIMIT corpus [7].

- 31 -
A pronunciation dictionary of 27K words and containing multiple pronunciations for words was used to construct the FST P. As return transitions can cause an explosion in network size, they were not used in these experiments. The AT&T FSM toolkit [9] was used to perform the inversion and composition of the finite state machines. The final machine was output to a text file and parsed to generate a list of confusable words for each dictionary word. Each confusable word also had an associated log probability based on the transitions used from C. An upper bound for accuracy was created for techniques based on generating confusions from a fixed dictionary. This bound is taken to be the accuracy of a lattice which has all unique words (from the recognition and from the dictionary) available at every position in the target transcription (similar to Figure 21 but with the addition of nodes for all dictionary words). While this upper bound can vary slightly depending on the exact recognition results, it was typically around 97% oracle word accuracy.
6.2.1. Single word acoustic confusions In this experiment, each word is replaced by a set of acoustically confusable single words. Adding in the top four confusable words for each word in the lattice yielded a 0.64% absolute increase in oracle word accuracy. Furthermore, it was found that allowing phone deletion provided a further benefit of 0.31% absolute (Figure 23). While the word confusions generated by this method may be acoustically reasonable, the confusable words predicted may be very uncommon English words. Testing was also done using a unigram language model trained on the Gigaword corpus. Experiments found that combining the acoustic and language model probabilities with a scale factor of 1.0 yielded the best results. Application of a unigram model with a scale factor of 1.0 resulted in a 1.1% absolute increase in word accuracy over using no language model. In the case of single word confusions, it was possible to use an unpruned version of the phone confusion FST. This resulted in a very large number of alternates per word which were subsequently pruned in two different ways. The first pruning method kept an absolute number of the top alternative words. The second method kept alternates within a certain log probability distance of the top alternate. For expansions yielding similarly sized lattices, it was found that the absolute form of pruning yielded better results, giving an increase of 0.82% absolute compared to log probability based pruning. Using the previous best method of absolute pruning and a unigram language model with a scale factor of 1.0, experiments were conducted measuring accuracy as the pruning limit was increased. An exponential increase in the number of alternates per word was shown to result in a linear increase in accuracy (Figure 24).

- 32 -
80%
82%
84%
86%
88%
90%
92%
94%
96%
98%
Baseli
ne
Top 4,
no de
letion
Top 4
Top 4,
unigr
am
With
in log
8, un
igram
Ora
cle
accu
racy
Word accuracyCharacter accuracy
Word upper bound
Figure 23: Accuracy using acoustically confusable single words.
78%
80%
82%
84%
86%
88%
90%
92%
94%
96%
98%
1 2 4 8 16 32
Maximum alternates
Ora
cle
wor
d ac
cura
cy
0
1000
2000
3000
4000
5000
Word accuracyNumber nodes
Word upper bound
Baseline
Figure 24: Accuracy as number of alternates per word is increased.
6.2.2. Two word acoustic confusions As discussed earlier, while adding return transitions to the pronunciation FST would allow production of multiple acoustically confusable words, it also causes an explosion in computational expense. A compromise was made by creating a pronunciation FST consisting of two words chains from the dictionary. To further reduce expense, the confusion FST was

- 33 -
pruned to contain only transitions with log probability less than negative five. A bigram language model trained on Gigaword was used to constrain the word confusions to reasonably probable two word combinations. The acoustic probabilities and the bigram probabilities were combined with a scale factor of 1.0. Expanding single words to acoustically confusable pairs of words resulted in fairly poor performance. Even using up to 32 replacements for each word, only a 0.73% absolute improvement was gained. While the technique does not appear to significantly reduce word errors, it does appear to put more correct letters into the lattice. The character accuracy improved faster than the word accuracy, with a reduction of the remaining error by 13% at a pruning of 32 as opposed to the word accuracy reduction of 4.7%. Even after application of the bigram language model, the two word confusions tended to be very short and uncommon words (Figure 11). This is probably due to the expansion being forced to create two word confusions even for words consisting of only a few phones. While multiple word confusions could be limited to words with longer phone sequences, this would do nothing to improve the performance of the technique.
84%
86%
88%
90%
92%
94%
1 2 4 8 16 32
Maximum alternates
Ora
cle
accu
racy
WordCharacter
Word baseline
Character baseline
Figure 25: Accuracy as number of two word alternates per word is increased.
6.2.3. Morphology-based confusions An experiment into expansion based on a word’s morphology was conducted using the simple and popular Porter stemmer [11]. The Porter stemmer was used to generate base forms of all the words in a 27K dictionary. Words that mapped to the same base form were placed in a set. The lattice was then expanded by using these sets of words as alternates for nodes in the lattice (Figure 12). No pruning was performed on the set size, all words with equivalent base forms were added to the lattice. Morphology-based expansion using the 27K dictionary resulted in a small increase in oracle word accuracy of 0.68% absolute. Using the larger 100K CMU dictionary provided little

- 34 -
added benefit, yielding a gain of 0.79% absolute over baseline. Expansion using the 27K dictionary resulted in an increase in the average number of lattice nodes of 2.3 times, while the 100K dictionary resulted in an increase of 3.1 times.
6.2.4. Forward language model Bigram and trigram n-gram language models were used to expand the baseline lattices. The expansion was pruned to an absolute number of alternatives between 1 and 32. The bigram model proved to be more effective than the trigram model, yielding greater accuracy gains at all pruning levels (Figure 26). Using both the bigram and trigram models (with each model allowed to use up to the maximum number of alternates), improved accuracy slightly over the bigram model alone.
84.0%
84.5%
85.0%
85.5%
86.0%
86.5%
87.0%
87.5%
88.0%
1 2 4 8 16 32
Maximum alternates
Ora
cle
wor
d ac
cura
cy
BigramTrigramBigram & trigram
Word baseline
Figure 26: Accuracy using expansion based on n-gram language models.
6.2.5. Backward language model Performance of the backward bigram model was slightly better than the forward model, 1.5% absolute versus 1.3%, using a pruning value of four. The backwards trigram was also slightly better than the forward model, with an increase of 1.3% absolute versus 1.0%. The performance difference between the forward and backward language model could be because Microsoft’s recognizer uses only a forward language model to generate its recognition results. This means the alternates proposed by the forward language model expansion are more likely to already appear in the lattice than the alternates proposed by the backwards language model.

- 35 -
84.0%
84.5%
85.0%
85.5%
86.0%
86.5%
87.0%
87.5%
88.0%
1 2 4 8 16 32
Maximum alternates
Ora
cle
wor
d ac
cura
cy
BigramTrigramBigram & trigram
Word baseline
Figure 27: Accuracy using expansion based on backwards n-gram language models.
6.3. Combining techniques Each of the techniques described above yielded an increase in accuracy when used on the baseline lattices. Experiments were conducted to discover how additive the technique’s gains were. The specific expansions chosen were based on their observed utility in isolation balanced against the need to keep the resulting lattice relatively small. Each expansion used the original form of the baseline lattice and performed its expansion independent of modifications made by any of the other techniques. The set and order of expansions tested were:
• One word insertion errors. • One word acoustically confusable words allowing deleted phones with a unigram
language model and scale factor of 1.0. Pruned to the top four alternatives. • Morphology-based expansion using 27K dictionary. • Forward language model bigram expansion, pruned to the top four alternatives. • Forward language model trigram expansion, pruned to the top four alternatives. • Backward language model bigram expansion, pruned to the top four alternatives. • Backward language model trigram expansion, pruned to the top four alternatives.
Each expansion provided improved accuracy, though at a level below what would be seen if techniques were completely additive (Figure 28). Overall, the combination of techniques yield a 5.3% absolute improvement on Ch1Dev, covering 34% of the recognizer’s errors. A similar trend is seen on Ch2Dev (Figure 29) with an overall improvement of 11.9% absolute, covering 29% of the errors. One possible explanation of the non-fully additive nature of the techniques is that each technique prunes its alternatives independent of what is already in the lattice and independent of what has been proposed by other techniques. So for example, if the morphology

- 36 -
expansion and acoustic confusion expansion both propose the same word, the second technique to be applied wastes one of its limited alternates for a word that cannot further improve accuracy. Note that even if techniques had been allowed to propose unique words for all alternates, it is still likely that subsequent techniques would perform below the fully-additive level as earlier techniques may have already taken the most likely alternatives. This would be especially true for related techniques such as bigram and trigram language model expansion.
84.0%
86.0%
88.0%
90.0%
92.0%
94.0%
96.0%
98.0%
Baseli
ne
Inser
tion
Acous
tic
Morph
ology
Bigram
Trigra
m
Backw
ard b
igram
Backw
ard t
rigra
m
Ora
cle
wor
d ac
cura
cy
ObservedFully additive
Upper bound
Figure 28: Ch1Dev accuracy as techniques are combined.

- 37 -
55.0%
60.0%
65.0%
70.0%
75.0%
80.0%
85.0%
90.0%
95.0%
100.0%
Baseli
ne
Inser
tion
Acous
tic
Morph
ology
Bigram
Trigra
m
Backw
ard b
igram
Backw
ard t
rigra
m
Ora
cle
wor
d ac
cura
cy
Observed
Upper bound
Figure 29: Ch2Dev accuracy as techniques are combined.
6.4. String-based model The string-based probability model requires computation over all possible recognition hypotheses. For sentences in which multiple recognition events were returned, a large number of hypotheses are created by the cross product of result sets. To reduce computation expense, these experiments use subsets of Ch1Dev and Ch2Dev consisting of sentences with only a single recognition event (916 and 863 sentences respectively). For all experiments here, the fixed variance Gaussian model’s scale factor �fixed was set to 0.05 (i.e. 95% of the probability mass was allocated to strings matching within a number of symbol less than 10% of the average length of the hypotheses). The increasing variance Gaussian model’s minimum scale factor �min was set to 0.02 and its maximum �max was set to 0.10. � values were found by trial and error using the Speech Dasher prototype. The PPM baseline, which made no use of the ASR results, required on average 2.44 bits from the user for every symbol that was entered (Table 9). This agrees closely with the upper bound of 2.39 bits found previously using PPM with a context length of five [17]. On Ch1Dev, the uniform and Gaussian based variants all improve performance. The best model was found to be the increasing variance version which reduced the cross entropy to 0.73 bits. The standard deviation of the string model was significantly higher than PPM. This indicates that while on average the string model improves efficiency, the user’s experience may be more variable when compared to using only PPM. On Ch2Dev, the best string-based model was unable to improve much on PPM and all variants of the model exhibited a very high degree of variance. This suggests that a string-based model is unlikely to work well on a low quality microphone typical of a mobile device.

- 38 -
The peak model performed poorly and with a very high variance. The model is probably only effective when the user enters text that appears somewhere in the n-best list. In the face of errors in all the hypotheses, the model falls off the recognition results and degrades to mostly PPM. There was little difference using the Gaussian increasing variance model with the fitted n-best probability (5) versus using a uniform distribution over hypotheses. This is perhaps because (5) is a poor estimate of the real probability or it could be that the probabilities do not contribute significantly to the task of finding the correct next symbol. Model type: Ch1Dev Ch2Dev PPM 2.44 ± 0.35 2.44 ± 0.35 Uniform 0.79 ± 0.74 1.99 ± 1.39 Peak 2.19 ± 2.17 3.60 ± 1.92 Gaussian fixed variance 0.75 ± 0.80 2.05 ± 1.51 Gaussian increasing variance 0.73 ± 0.80 2.03 ± 1.51 Gaussian increasing variance, uniform rank probability 0.74 ± 0.80 2.04 ± 1.51
Table 9: Cross entropy and standard deviation of string-based model variants (see also Figure 30).
0.50
1.00
1.50
2.00
2.50
3.00
3.50
4.00
PPM
Unifor
m
Unifor
m Pea
k
Gauss
ian
Guass
ianInc
Var
Guass
ianInc
Var no
rank
Cro
ss e
ntro
py (b
its)
Ch1DevCh2Dev
Figure 30: Cross entropy of string-based model variants on Ch1Dev and Ch2Dev.
6.5. Lattice-based model With appropriate pruning, the lattice-based model is able to handle lattices with a very large numbers of paths. But in order to remain comparable with the results of string-based methods, the same subset of single utterance sentences was used in these experiments. The various constant values given below were found by limited tuning experiments on Ch1Dev.

- 39 -
6.5.1. Initial experiments Initial experiments used lattices constructed with the iterative algorithm and an expansion arc penalty �exp of 0.50. On the death of all paths, new children were extended from the location of the failed paths. The maximum number of paths to retain �prune was set to 256. The deletion and substitution penalties were set proportional to the observed error frequencies in Table 7 with �del set to 0.0625 and �sub set to 0.25. It was found that expanding the lattices to cover one word insertion errors significantly lowered the cross entropy from 1.06 bits to 0.820 bits. This was further improved by setting the expansion arc penalty to a value of 0.04, resulting in a cross entropy of 0.736 bits. Further improvement was obtained by rebuilding failed paths from the start node rather than extending from the failure point, giving a cross entropy of 0.660 bits.
6.5.2. Probability during errors The previous experiments used PPM exclusively to estimate probabilities during word errors. As described in Section 4.2.6, the words at the fringe of dead paths can also be used to estimate probabilities during errors. The minimum length �fringe_len required before the use of fringe estimates was set to 2. The fringe estimate was given a starting proportion of the probability �fringe_min of 0.35 and a maximum proportion �fringe_max of 0.95. The increase per additional matching symbol �fringe_inc was set to 0.05. Using the previous best model settings, the addition of the fringe probability estimates resulted in a slight reduction of cross entropy from 0.660 bits to 0.654 bits.
6.5.3. Detecting digressions As described in Section 4.2.7, the dependence on PPM can be increased as the number of consecutive word errors increases. The minimum consecutive errors �CWE_min before increasing the proportion for PPM was set to 2. The starting proportion of probability given to PPM �PPM_min was 0.05 with a maximum proportion �PPM_max of 0.85. Each additional consecutive error caused an increase �PPM_inc of 0.15. Enabling digression detection resulted in a very small decrease in cross entropy from 0.654 bits to 0.653 bits.

- 40 -
0.60
0.70
0.80
0.90
1.00
1.10
Initia
l
Inser
tion
Expan
sion p
enalt
y
Rebuil
d path
s
Fringe
estim
ate
Digres
sion d
etecti
on
Cro
ss e
ntro
py (b
its)
Figure 31: Cross entropy on Ch1Dev as various techniques are applied.
6.5.4. Varying lattice size The cross entropy calculated using the lattice-based model depends on the specific instantiation of the lattice built from an n-best list. For example, in the compact lattice shown in Figure 32 there is only one live path for “the cat”. But in the less compact form of the lattice in Figure 33, there are two live paths. This results in different probability estimates for the letters in a given sentence.
Figure 32: One partial path for "the_cat" in a compact lattice.
Figure 33: Two partial paths for "the_cat" in a less compact lattice.

- 41 -
To investigate the impact of lattice compactness on cross entropy, measurements were made on both naïve lattices and approximately compact lattice produced by the iterative algorithm. In addition, the number of n-best results used in lattice construction was also varied. As shown in Figure 34, when using an n-best result set smaller than 64, naïve lattices outperformed approximately compact lattices. The best performance was achieved using a naïve lattice built from the top 22 best hypotheses, reducing the cross entropy on Ch1Dev to 0.645 bits. As the number of hypotheses increased, the approximately compact lattices outperformed naïve ones with a cross entropy that continued to decrease as more and more hypotheses were added. The lattice model’s dependency on lattice compactness could be eliminated by inclusion of hypothesis probabilities into the constructed lattice. The probability of a partial path shared among a set of hypotheses could incorporate the probability of each of the hypotheses used. This would result in the same symbol probability estimates regardless of whether the construction algorithm grouped the set of hypotheses together or whether it split them up into different paths within the lattice.
0.63
0.64
0.65
0.66
0.67
0.68
0.69
0.70
0.71
0.72
10 20 30 40 50 60 70 80 90 100
N-best used
Cro
ss e
ntro
py (b
its)
NaiveIterative
Figure 34: Cross entropy on Ch1Dev with varying number of n-best results
and using different lattice construction algorithms.
6.5.5. Performance on Ch2Dev The lattice model with the best settings found on Ch1Dev was also tested on Ch2Dev using the iterative construction algorithm and a varying number of hypotheses (Figure 35). As in the case of Ch1Dev, using more hypotheses resulted in lower cross entropy. The best cross entropy of 1.60 bits was obtained on lattices constructed from the top 100 hypotheses.

- 42 -
1.60
1.61
1.62
1.63
1.64
1.65
1.66
1.67
1.68
1.69
1.70
10 20 30 40 50 60 70 80 90 100
N-best used
Cro
ss e
ntro
py (b
its)
Figure 35: Cross entropy on Ch2Dev using iterative construction and varying number of n-best results.
6.5.6. Additional expansion techniques Experiments were conducted expanding lattices progressively using the techniques in Section 6.3. These experiments used the best settings found thus far on Ch1Dev, with the exception that the iterative construction algorithm was used on the entire n-best result set. The insertion error expansion was the only technique to yield a significant reduction in cross entropy. Other techniques caused a slight increase or decrease in cross entropy depending on which development set was used (see Table 10 and Figure 36). More conservative use of the expanded lattice might allow further reductions in cross entropy. One possibility is to use less reliable portions of the expanded lattice only when the user has entered several symbols confirming that those expanded portions are reasonable matches to the user’s input. The degree to which human performance and satisfaction on this task correlates with cross entropy is also not currently known. Expansion technique Ch1Dev Ch2Dev Baseline 0.861 ± 0.855 1.767 ± 1.143 One word insertion errors 0.653 ± 0.598 1.600 ± 1.065 Acoustic confusions 0.651 ± 0.578 1.570 ± 1.042 Morphological variants 0.660 ± 0.578 1.574 ± 1.042 Bigram language model 0.676 ± 0.563 1.550 ± 0.999 Trigram language model 0.684 ± 0.554 1.551 ± 0.994 Backward bigram language model 0.700 ± 0.549 1.538 ± 0.973 Backward trigram language model 0.705 ± 0.544 1.537 ± 0.965
Table 10: Cross entropy and standard deviation as lattices are progressively expanded (see also Figure 36).

- 43 -
0.5
0.7
0.9
1.1
1.3
1.5
1.7
1.9
Baseli
ne
Inser
tion
Acous
tic
Morph
ology
Bigram
Trigra
m
Backw
ard b
igram
Backw
ard t
rigra
m
Cro
ss e
ntro
py (b
its)
Ch1DevCh2Dev
Figure 36: Cross entropy as additional expansion techniques are applied.
6.5.7. Hub1 results As various parameters were tuned to Ch1Dev, the Hub1 set was used to test generalization to an unseen data set. Similar to what was done in previous experiments, the subset of Hub1 sentences consisting of only a single recognition events were used (437 out of 503 sentences). Using the best performing settings and techniques found in Section 6.5.6 for Ch1Dev, the cross entropy of Hub1 was reduced from a PPM baseline of 2.44 bits to 0.794 bits. This result is somewhat higher than the 0.651 bits achieved on Ch1Dev, perhaps indicating parameters have become over-tuned to the Ch1Dev data.

- 44 -
7. Conclusion In this project, an interface allowing correction of speech dictation using continuous gestures was designed and a prototype built. The Speech Dasher interface operates using only a ranked n-best list from the speech recognizer. Informal testing by the author showed that Speech Dasher was an effective correction solution so long as the spoken words appeared somewhere in the engine’s n-best list. To investigate improving correction speed in the face of errors, an algorithm producing an approximately compact lattice from n-best lists was developed. Lattice expansion techniques based on acoustic, morphological and language model information were shown to be capable of covering over one-third of the errors made by the speech recognizer. A probabilistic model based on the n-best result strings was described. On audio from high quality microphones, these models were shown to reduce the average information required from a user. Increasingly sophisticated model variants were shown to progressively decrease the average information required. This reduction in cross entropy agrees with the author’s anecdotal experience of the efficiency of the string-based model variants. The original Dasher language model required the user to decide between 5.5 symbols on average. The best string-based model using recognition from high quality microphones required a decision between only 2.2 symbols. Notably however, the string-based model proved ineffective when used on speech from low quality microphones. A lattice-based probability model was developed which utilized the word lattices built from a recognizer’s n-best list. By explicitly monitoring a user’s progress through the lattice, the model was able to detect when the user had encountered a recognition error. A back-off model for use during these errors was described. A further feature was developed allowing increased efficiency when a user writes something not strictly in their spoken sentence. The lattice-based model was shown to reduce the information demands on the user even further than the string-based model using both high and low quality microphones. The insertion error expansion technique was shown to be a useful addition to the lattice-based model, while other techniques proved to increase the information required from the user. It was shown that it may be more efficient for the user if only a set of the top engine hypotheses was used by the model. On unseen data in the Hub1 test set, the original Dasher language model required the user to decide between 5.4 symbols on average while Speech Dasher’s lattice-based model required a decision between only 1.5 symbols. To the author’s knowledge, this is the first work in which a letter-based language model based on speech recognition results has been developed. It is hoped that the results presented here will provide the groundwork for a speech dictation interface that is both more efficient and more fun than existing solutions.
7.1. Future work There are numerous avenues of research which could follow from this work. Some possibilities include:
• Incorporating a lattice-based model into Speech Dasher. The effectiveness of the lattice-based model should be validated by incorporating it into the Speech Dasher prototype.

- 45 -
• Using hypothesis probabilities in word lattices. Currently the rank of a hypothesis in the n-best list is not used in the lattice-based model. The inclusion of probabilities in the lattice might allow improved performance. In addition, probabilities would eliminate the dependence of the model’s probability estimates on the compactness of the lattice.
• Validation of model performance with user trials. The performance of the models developed were measured using the cross entropy against the sentences’ transcriptions. The degree to which this measure correlates with user task efficiency and satisfaction needs to be validated by conducting user trials.
• Using longer span language models for acoustic confusions. The acoustic word confusion expansion might benefit by looking at the surroundings of the word to be replaced. This might allow more relevant confusable words to be selected than is possible using just the unigram statistics of the confusable words.
• Constructing optimally compact lattices. The DFA-based algorithm could be used to construct an optimally compact lattice from n-best lists. This should reduce the computation expense for the construction, expansion and use of lattices. Results also indicate that more compact lattices may require less information from the user when used with the lattice-based probability model.
• Optimizing of constant values. The constants used in the string and lattice-based models were tuned by trial-and-error. A more extensive search using an automated optimization technique might discover better values.

- 46 -
8. References [1] Cleary, J., Witten, I. (1984). Data compression using adaptive coding and partial string
matching. IEEE Transactions on Communications, 32:396-402.
[2] Fosler-Lussier, E., Amdal, I., Jeff Kuo, H. (2002). On the Road to Improved Lexical Confusability Metrics, Pronunciation Modeling and Lexicon Adaptation for Spoken Language Technology, Estes Park, Colorado, 2002.
[3] Gansnet, E., Koutsofios, E., North, S. (1993). Drawing graphs with dot, AT&T Bell Laboratories, Murray Hill, New Jersey.
[4] Hopcroft, J. (1971). An algorithm for minimizing the states in a finite automaton. The theory of machines and computations, Academic Press, New York, pp. 189-196.
[5] Hopcroft, J., Ullman, J. (1979). Introduction to Automata Theory, Languages, and Comptation. Addison-Wesley Publishing, pp.68-71.
[6] Karat, J., Horn, D., Halverson, C., Karat, C. (2000). Overcoming Unusability: Developing efficient strategies in speech recognition systems. Conference on Human Factors in Computing Systems, The Hague, Amsterdam, April 2000.
[7] Lamel, L., Kassel, R., Seneff, S. (1986). Speech Database Development: Design and Analysis of the Acoustic-Phonetic Corpus. Proceeding of the DARPA Speech Recognition Workshop, pp. 110-110.
[8] Microsoft Speech – Speech SDK 5.1 for Windows applications. http://www.microsoft.com/speech/download/sdk51/
[9] Mohri, M., Pereira, F., Riley, M. AT&T FSM Library - Finite-State Machine Library. http://www.research.att.com/sw/tools/fsm.
[10] Paul, D., Baker, J. (1992). The Design for the Wall Street Journal-based CSR Corpus. Proceedings DARPA Speech and Natural Language Workshop, February 1992.
[11] Porter, M. (1980). An Algorithm for Suffix Stripping. Program, Vol. 14(3), pp. 130-137, 1980.
[12] Stolcke, A. (2002). SRILM - An Extensible Language Modeling Toolkit. Proceedings of the International Conference on Spoken Language Processing, Denver, Colorado, September 2002.
[13] Stuttle, M. (2004). Researcher at University of Cambridge Department of Engineering. Conversation with author, June 2004.
[14] Ward, D., (2001). Adaptive Computer Interfaces. PhD thesis, University of Cambridge.
[15] Ward, D., MacKay D. (2002). Fast Hands-free Writing by Gaze Direction. Nature, April 2002.
[16] Ward, D., Blackwell, A., MacKay D. (2000). Dasher – a Data Entry Interface Using Continuous Gestures and Language Models. In Proceedings UIST 2000.
[17] Witten, I., Moffat, A., Bell, T. (1999). Managing Gigabytes: Compressing and indexing documents and images. Morgan Kaufmann, San Francisco, CA, second edition.
[18] Young, S.J., Odell, J.J., Ollason D.G., Valtchev, V., Woodland, P.C. (2002). The HTK Book. Entropic Cambridge Research Laboratory.