efft on lnt cnt vrt aftr rbd cntrl f spttd knpd s
TRANSCRIPT

S potted knapweed and otherinvasive noxious weeds canpose a serious threat to pas-
tures, rangelands, and native wild-lands. To manage these undesirableplants and protect our natural re-sources requires an integrated sys-tems approach. Integrated manage-ment systems may use a combina-tion of biological, cultural, physi-cal, and chemical control optionsto manage noxious weeds.
Since herbicides may be oneintegrated option, it is legitimate toask what the effect of herbicides
might be on non-target plant spe-cies. Will native forbs be eliminatedand grass "monocultures" be createdby herbicide treatments? What is theresponse of natural bunchgrass andforest plant communities followingherbicide control of spotted knap-weed infestations?
Peter Rice, Donald Bedunah —both at the University of Montana,and Clinton Carlson —USFS, recentlycompleted an intensive study to an-swer this question. This issue is adetailed summary of their study andits conclusions.
An example of one of the grassland sites which wasoriginally grazed by cattle in the 1950s, but now isonly used by wildlife.
•Trademark of DowElancoTordon 22K is a Restricted Use Pesticide
Information for Noxious Weed Control Professionals
June, 1993
Effects On Plant Community DiversityAfter Herbicide Control of
Spotted Knapweedby Mary Halstvedt
DowElanco, Technical Sales &Development
Adapted from a study completed byPeter Rice, Donald Bedunah (both atUniversity of Montana), and ClintonCarlson, USFS, published by the USFSIntermountain Research Station.
Introduction
* 34 potted knapweed causesreduced vigor of nativeplant poplulations, lessplant diversity on infested
sites, and economic losses becauseof reduced livestock production.Spotted knapweed reduces forageproduction, thus it canimpact wildlife popula-tions. Spotted knapweedalso can expand slowlyinto natural grasslandsites that are undis-turbed by human or live-stock activites, cause de-clines in plant commu-nity diversity (Forcellaand Harvey 1983; Tyserand Key 1988). It caninvade forested sites dis-turbed by timber har-vesting, thinning, andlivestock grazing. Spot-
knapweed has ag-ssively invaded ex-
tensive areas of range-lands and forest sites
with open overstories atlow to mid-elevations inthe Northern Rockies(Losensky 1987). The weedhad infested more than 7million acres in Montanaand adjoining states andprovinces by 1988 (Lacey,C. 1989). As knapweed in-creases, cover of more de-sirable - but less competi-tive - grasses and forbs issignificantly reduced,sometimes as much as 60%to 90% (Baker and others1979; Bucher 1984; Harrisand Cranston 1979).
continued on page 2
DowElanco - 1001 S. 24th St. West, Suite 115 — Billings, Montana 59102 — (800) 345-6582

Sites 3 & 4 are forest land sites, located side-by-side, in aclearcut that was logged and dozer-piled in the mid 1960s.The area was grazed by cattle but for the study they werefenced out in 1988. Deer and elk grazing on the sites islight.
2 TECHLINE
Continued from page 1
Spotted knapweed is suscep-tible to low rates of certain herbi-cides. Tordon* 22K (picloram),Transline (clopyralid), Curtail*(clopyralid and 2,4-D), and 2,4-D
have high efficacy when appliedproperly. But biologists and landmanagers are concerned about theeffect of herbicides on non-targetplant species.❑ Will native forbs be eliminated
and grass "monocultures" becreated by herbicide treat-ments?
❑ What is the response of natu-ral bunchgrass and seral forestcommunities following herbi-cide control of spotted knap-weed infestations?
This study addresses these practi-cal questions. Preliminary resultssuggest that herbicides are a fea-sible vegetation management op-tion for land managers concernedabout noxious weed invasions andbiological diversity.*Trademark of DowElancoTordon 22K is a Restricted Use Pesticide
Research SummaryHerbicides were applied to rep-
licated treatment plots at four sitesin west-central Montana with lightto moderate spotted knapweedinfestations. Plant community di-versity was determined for two
seasons before the herbicide treat-ments and diversity measure-ments have been completed fortwo years after herbicide applica-tion.o Although knapweed suppres-
sion was high, the com-munitites were not con-verted to grass monoculturesby using herbicides.
❑ No large declines in diversitywere caused by these herbi-cide treatments. Three yearsafter the spray treatments,community response data col-lected from a limited set ofpilot study plots suggested thatthe herbicide treatments hadincreased diversity.
❑ Depressions in plant commu-nity diversity measurementsdue to herbicide treatmentwere small and temporary.
❑ Transline had the least effecton plant diversity.
❑ Plots treated with Tordon andplots treated with Curtailshowed a small one year pakspray decline in plant diveWsity. Diversity increased dur-ing the second post spraygrowing season.
❑ Soil samples found smallamounts of herbicide below10 inches. Herbicide residualsin the soil at the 10 to 20 inchdepth increment were gener-ally undetectable and did notexceed 26 parts per billion at30 days, trace after one year,and none were detected aftertwo years.
MethodsIn Missoula County in west-
central Montana, researchers con-ducted a pilot study to estimatespecies diversity changes at twosites where herbicides had beenapplied in 1985 to control spottedkanpweed. In 1988 the pilot di-versity data were collected-3 yepost spray. Those data were theused to plan an indepth formalcommunity response study at fournew sites in the same county.
Pilot Diversity StudyThe 1988 measurements from
the two pilot study sites showedmoderate knapweed cover valuesof 27% and 30%. The Fort Missoulasite—a bluebunch wheatgrass se-ries habitat type—had low overallplant diversity. The site was alsodominated by knapweed – the re-sult of long and severe disturbanceby livestock and human activi-ties. The Lolo site was dominatedby spotted knapweed, but theplant community was much morediverse and representative of arough fescue potential naturalcommunity.
Herbicides had beento replicated test plots in the sprig.of 1985. Tordon 22K at 1 pint/acreand Transline at a rate of 2/3 pint/acre were used at both sites, and a
mixture of Tordon 22K (1/2 pint/acre) and Transline (1/3 pint/acre)was applied at the Lolo site. Herbi-cide treatments and check plots
ere replicated three times at thelo site and twice at Fort
Missoula. Livestock grazing wasexcluded, but not wildlife access.Community response was mea-sured in the 1988 cool season (Mayand June) using a cover microplotmethod (Hann and Jensen 1987)adapted from Daubenmire 1959.
Formal CommunityResponse Study
The formal community diver-sity study used four sites with lowto moderate spotted knapweedinfestations and diverse plantcommunties. The average spottedknapweed absolute cover for the1988 warm season was:
Site 1– 21%Site2– 7%Site3– 10%Site 4 - 3%Disturbed sites with 60% to
11/P% spotted knapeed cover aret uncommon in western Mon-
tana. During the 1988 growingseason, below-average soil mois-ture and precipitation also lim-ited plant growth . Two of the sitesare grassland habitat types withgravelly-loam textures. Two areforest habitat types with silt-loamtextures.
Site 1 is a rough fescue/bluebunch wheatgrass habitattype (h.t.) (Mueggler and Stewart1980) at 3,200 ft. elevation with anorthwest aspect. It was used ascattle pasture through the 1950s,but since then has been grazedonly by wildlife.
Site 2 is Idaho fescue/bluebunch wheatgrass h.t.-west-em needlegrass phase. At 4,200 ft.the aspect is south to southwest.Site 2 was grazed by cattle throughthe 1970s but now is grazed onlyby wildlife, with significant elkuse in winter and spring.
Sites 3 and 4 are adjacentlylocated in a clearcut that waslogged and dozer-piled in the mid-1960s. The habitat type (Pfisterand others 1977) is Douglas fir/snowberry. At 4,050 ft elevation,
TECHLINE 3
the aspect of site 3 is south tosouthwest, while site 4 is almostflat. The logging returned sites 3and 4 to an earlier stage of devel-opment, with Richardson'sneedlegrass and rough fescue be-ing the most abundant grasses.The location was being grazed bycattle and wildlife. A fence waserected in the summer of 1988 toexclude cattle but not deer or elkfrom sites 3 and 4. Deer and elkuse on these sites is relatively light.
Canopy cover and frequencyof occurrence by species were de-termined by cover microplotmethod. Each replicated treatmentplot (1/20-acre) had five randomtransects; each transect had fivepermanently marked microplotlocations (10- by 20-inch Dau-benmire frames). The cover valueof every species was determinedfor each microplot. Pretreatmentplant community data were col-lected for the 1988 warm season(July-September) and the 1989cool season (May-June).
TreatmentHerbicides were applied with
a carbon dioxide pressure-regu-lated backpack research sprayer in1989 starting after the cool seasonpretreatment readings for eachsite. "Early" herbicide treatmentswere made when spotted knap-weed was in the rosette to earlybolt stage. "Late" treatments weremade when knapweed was in theearly to mid-flower stage. Herbi-cides were Tordon 22K at 1 pint/acre, Transline at 1 pint/acre, and2 qt./acre of Curtail. Each of thefour sites contained six treatmentsand an untreated check plot withthree randomized blocks or repli-cations.
Postspray data collection be-gan one year after the 1989 herbi-cide applications. Each microplotwas re-read twice a year—duringthe cool season (May-June) andagain in the warm season (July-August). The 1990 and 1991 read-
continued on page 4
Table 1 - Community Status 3 Years Post Spray on Pilot Plots
Average % Canopy Cover Diversity Measurements
Treatment SpottedKnapweed
Otherforbs Grasses
AverageNo.
Species
TotalNo.
Species
S-WIndex"
Average
Fort Missoula
CheckPlots 27 7 8 16.0 22 0.76
Tordon 3 6 28 16.0 22 0.94
Lolo
CheckPlots 30 20 27 35.3 57 1.13
Tordon 3 17 46 34.3 58 1.26
Tordon +Stinger 4 16 47 37.7 59 1.29
'Stinger 16 22 37 37.0 58 1.27
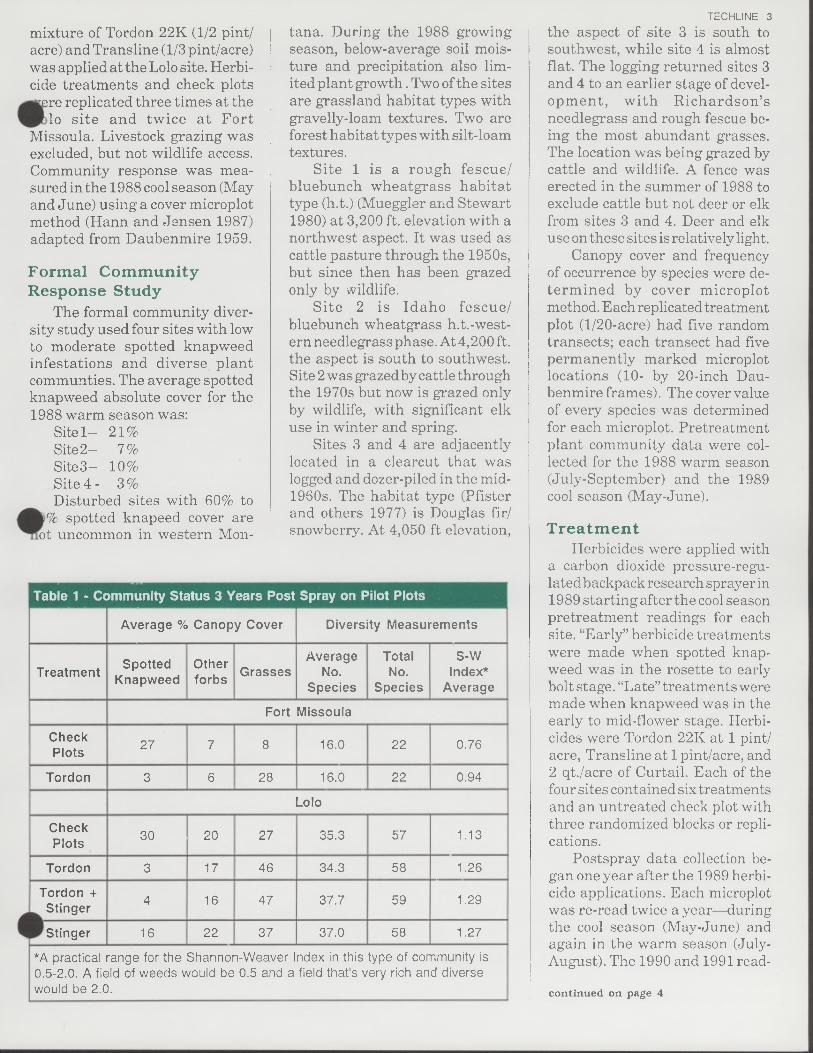
*A practical range for the Shannon-Weaver Index in this type of community is0.5-2.0. A field of weeds would be 0.5 and a field that's very rich and diversewould be 2.0.
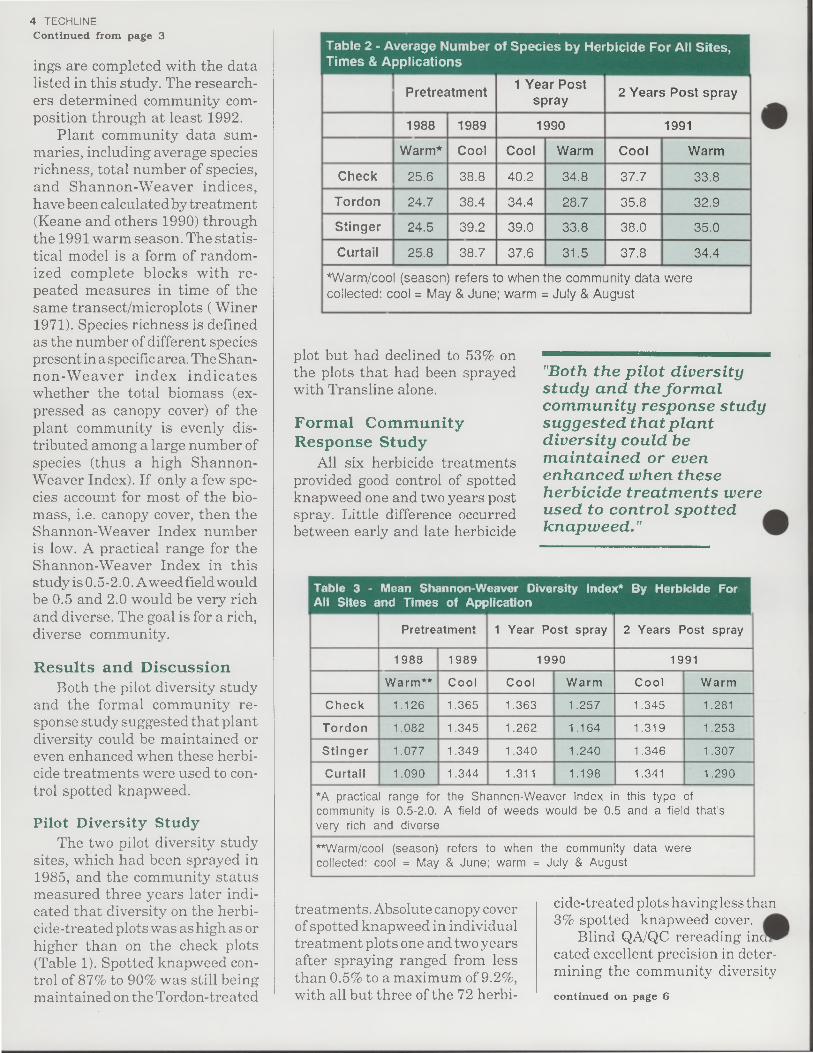
Table 2 - AverageTimes & Applications
Number
Pretreatment
of Species by Herbicide
1 Y ear Postspray
For All Sites,
2 Years Post spray
1988 1989 1990 1991
Warm* Cool Cool Warm Cool Warm
Check 25.6 38.8 40.2 34.8 37.7 33.8
Tordon 24.7 38.4 34.4 28.7 35.8 32.9
Stinger 24.5 39.2 39.0 33.8 38.0 35.0
Curtail 25.8 38.7 37.6 31.5 37.8 34.4
*Warm/coo (season refers to when the community data werecollected: cool = May & June; warm = July & August
•4 TECHLINEContinued from page 3
ings are completed with the datalisted in this study. The research-ers determined community com-position through at least 1992.
Plant community data sum-maries, including average speciesrichness, total number of species,and Shannon-Weaver indices,have been calculated by treatment(Keane and others 1990) throughthe 1991 warm season. The statis-tical model is a form of random-ized complete blocks with re-peated measures in time of thesame transect/microplots ( Winer1971). Species richness is definedas the number of different speciespresent in a specific area. The Shan-non-Weaver index indicateswhether the total biomass (ex-pressed as canopy cover) of theplant community is evenly dis-tributed among a large number ofspecies (thus a high Shannon-Weaver Index). If only a few spe-cies account for most of the bio-mass, i.e. canopy cover, then theShannon-Weaver Index numberis low. A practical range for theShannon-Weaver Index in thisstudy is 0.5-2.0. Aweed field wouldbe 0.5 and 2.0 would be very richand diverse. The goal is for a rich,diverse community.
Results and DiscussionBoth the pilot diversity study
and the formal community re-sponse study suggested that plantdiversity could be maintained oreven enhanced when these herbi-cide treatments were used to con-trol spotted knapweed.
Pilot Diversity StudyThe two pilot diversity study
sites, which had been sprayed in1985, and the community statusmeasured three years later indi-cated that diversity on the herbi-cide-treated plots was as high as orhigher than on the check plots(Table 1). Spotted knapweed con-trol of 87% to 90% was still beingmaintained on the Tordon-treated
plot but had declined to 53% onthe plots that had been sprayedwith Transline alone.
Formal CommunityResponse Study
All six herbicide treatmentsprovided good control of spottedknapweed one and two years postspray. Little difference occurredbetween early and late herbicide
treatments. Absolute canopy coverof spotted knapweed in individualtreatment plots one and two yearsafter spraying ranged from lessthan 0.5% to a maximum of 9.2%,with all but three of the 72 herbi-
"Both the pilot diversitystudy and the formalcommunity response studysuggested that plantdiversity could bemaintained or evenenhanced when theseherbicide treatments wereused to control spotted •knapweed."
cide-treated plots having less than3% spotted knapweed cover.
Blind QA/QC rereading in!)cated excellent precision in deter-mining the community diversity
continued on page 6
Table 3 - Mean Shannon-Weaver Diversity index* By Herbicide For-All Sites and Times of Application
Pretreatment 1 Year Post spray 2 Years Post spray
1988 1989 1990 1991
Warm** Cool Cool Warm Cool Warm
Check 1.126 1.365 1.363 1.257 1.345 1.281
Tordon 1.082 1.345 1.262 1.164 1.319 1.253
Stinger 1.077 1.349 1.340 1.240 1.346 1.307
Curtail 1.090 1.344 1.311 1.198 1.341 1.290
*A practica range for the Shannon-Weaver Index in this type ofcommunity is 0.5-2.0. A field of weeds would be 0.5 and a field that'svery rich and diverse
**Warm/cool (season) refers to when the community data werecollected: cool = May & June; warm = July & August
r
•••
A
TECHLINE 5
Herbicide Residue
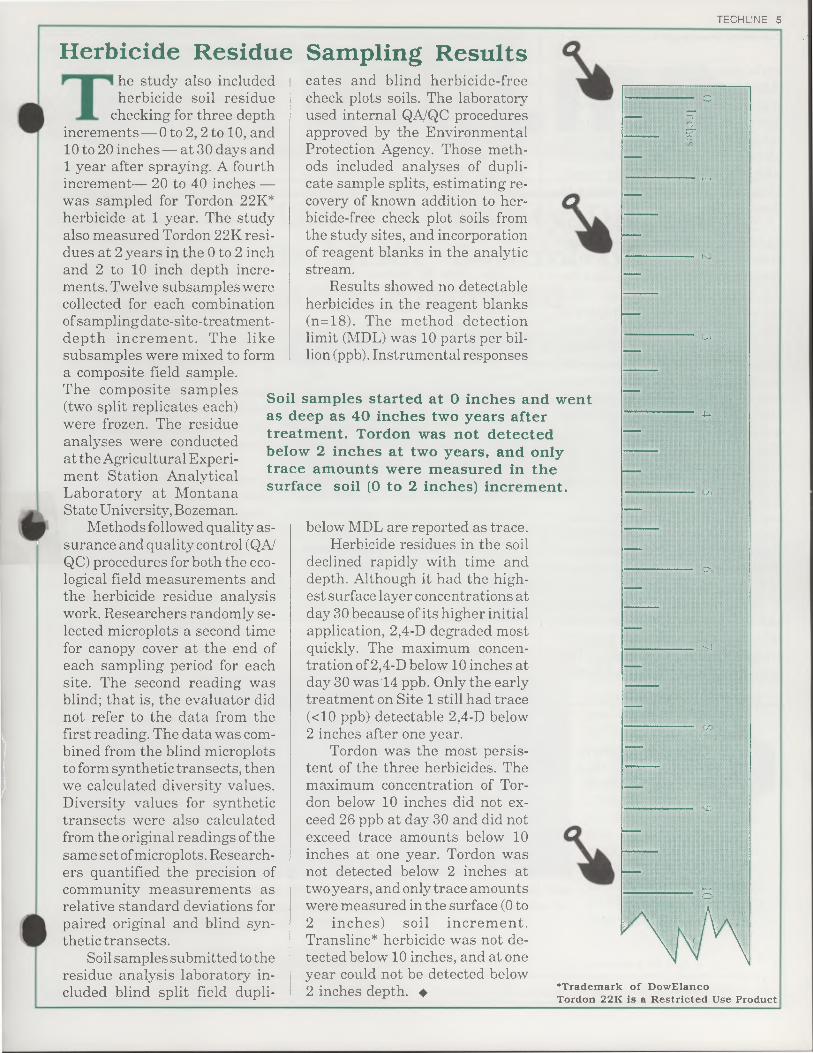
T he study also includedherbicide soil residue
checking for three depthincrements — 0 to 2, 2 to 10, and10 to 20 inches — at 30 days and1 year after spraying. A fourthincrement— 20 to 40 inches —was sampled for Tordon 22K*herbicide at 1 year. The studyalso measured Tordon 22K resi-dues at 2 years in the 0 to 2 inchand 2 to 10 inch depth incre-ments. Twelve subsamples werecollected for each combinationof sampling date-site-treatment-depth increment. The likesubsamples were mixed to forma composite field sample.The composite samples(two split replicates each)were frozen. The residueanalyses were conductedat the Agricultural Experi-ment Station AnalyticalLaboratory at MontanaState University, Bozeman.
Methods followed quality as-surance and quality control (QA/QC) procedures for both the eco-logical field measurements andthe herbicide residue analysiswork. Researchers randomly se-lected microplots a second timefor canopy cover at the end ofeach sampling period for eachsite. The second reading wasblind; that is, the evaluator didnot refer to the data from thefirst reading. The data was com-bined from the blind microplotsto form synthetic transects, thenwe calculated diversity values.Diversity values for synthetictransects were also calculatedfrom the original readings of thesame set ofmicroplots. Research-ers quantified the precision ofcommunity measurements asrelative standard deviations forpaired original and blind syn-thetic transects.
Soil samples submitted to theresidue analysis laboratory in-cluded blind split field dupli-
Sampling Resultscates and blind herbicide-freecheck plots soils. The laboratoryused internal QA/QC proceduresapproved by the EnvironmentalProtection Agency. Those meth-ods included analyses of dupli-cate sample splits, estimating re-covery of known addition to her-bicide-free check plot soils fromthe study sites, and incorporationof reagent blanks in the analyticstream.
Results showed no detectableherbicides in the reagent blanks(n=18). The method detectionlimit (MDL) was 10 parts per bil-lion (ppb). Instrumental responses
below MDL are reported as trace.Herbicide residues in the soil
declined rapidly with time anddepth. Although it had the high-est surface layer concentrations atday 30 because of its higher initialapplication, 2,4-D degraded mostquickly. The maximum concen-tration of 2,4-D below 10 inches atday 30 was 14 ppb. Only the earlytreatment on Site 1 still had trace(<10 ppb) detectable 2,4-D below2 inches after one year.
Tordon was the most persis-tent of the three herbicides. Themaximum concentration of Tor-don below 10 inches did not ex-ceed 26 ppb at day 30 and did notexceed trace amounts below 10inches at one year. Tordon wasnot detected below 2 inches attwo years, and only trace amountswere measured in the surface (0 to2 inches) soil increment.Transline* herbicide was not de-tected below 10 inches, and at oneyear could not be detected below2 inches depth. • *Trademark of DowElanco
Tordon 22K is a Restricted Use Product
Soil samples started at 0 inches and wentas deep as 40 inches two years aftertreatment. Tordon was not detectedbelow 2 inches at two years, and onlytrace amounts were measured in thesurface soil (0 to 2 inches) increment.
6 TECHLINE
Continued from page 4
variables. The average relativestandard deviation was 5.8% forspecies richness and 5.6% for theShannon-Weaver index (n=22rereadings). The variance amongplots receiving the same treatmentwithin a site was usually small,although some outliers occur inthe data base.
The check plot sets generallyhad the highest average pre-spraydiversity values (Table 2 & 3). Agraphic inspection of the data forthe period 1988 through 1991shows that, overall, the impact ofthe herbicides on diversity wassmall and temporary. Tordon-treated plots had the lowest aver-age diversity one and two yearspost spray, Curtail was intermedi-ately lower, and Transline plotswere similar to the check plots.The one-year post spray differ-ences between treatments de-creased in the second year postspray. The measured average num-ber of species and the Shannon-Weaver index were higher for theTransline and Curtail plots thanfor the untreated plots by the sec-ond year post spray.
Suppression of competitiveand dominant spotted knapweedreleases resources to supportgrowth of other plant species. Thegrasses and some forbs and shrubs
that are inherently tolerant or notexposed to this group of herbi-cides are able to respond duringthe year of spraying. Herbicide-susceptible forbs and shrubs re-spond to the limiting resourcerelease in subsequent growing sea-sons as the herbicide residualsdecline. Resistant individuals ex-pand and new plants, includingspotted knapweed, establish fromvarious propagules.
ReferencesRice, Peter, M.; Bedunah, Donald J.;
Carlson, Clinton E., 1992. Plant communictydiversity after herbicide control of spotted knap-weed. Res. Paper INT-460. Ogden, UT: USDA,Forest Serv., Intermountain Res. Station. pp. 6.
Baker, L.0; Fay, P.; Jackson, M.J. 1979.Spotted knapweed and control.Coop. Ext. Serv.Folder 206. Bozeman, MT: Montana State Univ.pp. 2
Bucher, R.F. 1984.The potential cost ofspotted knapweed to Montana range users.Coop. Ext. Serv. Bull. 1316. Bozeman, MT:Montana State Univ. pp. 18
Daubenmire, R. 1959. Canopy coveragemethod of vegetation analysis. Northwest Sci.V. 33, pp. 43-66.
Forcella, F.; Harvey, S.J. 1983. Eurasianweed infestation in western Montana in rela-tion to vegetation and disturbance. Madrono.30: 102-109.
Hann, W.J.; Jensen, M.E. 1987. Ecodatasampling methods. In: Tripp, J., ed. Ecosystemclassification handbook. [Missoula, MT]: U.S.Dept. of Ag, Forest Serv., Northern RegionalOffice: Chapt. 4, FSH 12/87 R-1 SUPP 1.
Harris, P.; Cranston, R. 1979. An economicevaluation of control methods for diffuse andspotted knapweed in western Canada. Cana-dian Journal of Plant Sciences. 59: 375-382.
0Keane, R.E.; Jensen, M.E.; Hann,W.J. 1990.ECODATA and ECOPAC: analytic tools for in.tegrated resource management. The Compiler.8(3): 24-37.
Lacey, C. 1989. Knapweed management: adecade of change. In: Fay, P.K.; Lacey, J.R., eds.Proceedings of the 1989 knapweed symposium;1989 April 4-5; Bozeman, MT. Ext. Bull. 45.Bozeman, MT: Montana State Univ., Plant andSoil Dept. and Ext. Serv.: 1-6.
Losensky, B.J. 1987. An evaluation of nox-ious weeds on the Lolo, Bitterroot, and FlatheadForests with recommendations for implement-ing a weed control program. Missoula, MT: U.S.Dept. of Ag, Forest Serv., Lobo Natl. Forest. pp.64.
Mueggler,W.F.; Stewart, W.L. 1980. Grass-land and shrubland habitat types of westernMontana. Gen. Tech. Rep. INT-66. Ogden, UT:U.S. Dept. of Ag, Forest Serv., IntermountainForest and Range Experiment Station. pp. 154.
Pfister, R.D.; Kovalchik, B.L.; Arno, S.F.;Presby, R.C. 1977.Forest Habitat types of Mon-tana. Gen. Tech. Rep. INT-34. Ogden, UT: U.S.Dept. of Ag, Forest Serv., Intermountain Forest,and Range Experiment Station. pp. 174
Tyser, R.W.; Key, C.W. 1988. Spotted knap-weed in natural area fescue grasslands: an eco-logical assessment. Northwest Science. 62(4):151-160.
Winer, B.J. 1971. Statistical principles inexperimental design. 2d ed. New York: McGraw-Hill Pub. pp. 907. •
ev DowElancoBlOil0;in1Sg.s24mthTS5L9W10e2st, Suite 115
BULK RATEU.S. POSTAGE
PAIDFORT COLLINS, CO
PERMIT NO. 178
11111TecLn/2/93