egads: enriching geometry and algebra through data
TRANSCRIPT

EGADs: Enriching Geometry and Algebra
through Data
Tim Erickson Draft, May 2014
This is a draft. You may cite it as
Erickson, Tim. 2013. EGADs: Enriching Geometry and Algebra through Data. Draft manuscript. Oakland, CA: eeps media.
Copyright © 2013 by eeps media. All rights reserved.
eeps media 5269 Miles Avenue Oakland, CA 94618-1044 866.341.3377 866.879.7797 toll-free fax http://www.eeps.com email the author: [email protected]
Before July 1, 2015, you may copy any of these pages for classroom or workshop use. For any other purposes, contact us and ask.
MEDIA
TM
This material is based upon work supported by the National Science Foundation under Award number DMI-0216656. Any opinions, findings, and conclusions or recommenda-tions expressed in this publication are those of the author(s) and do not necessarily reflect the views of the National Science Foundation.
3
EGADs: Enriching Geometry and Algebra through Data DRAFT • eeps media © 2014
Even though many schools teach geometry and alge-bra in different courses, there are many situations in which they connect, largely through formulas that are about some sort of spatial phenomenon. For example, in a math book, you might see:
A 5-meter ladder is leaning against a wall. The base of the ladder is 1 meter from the base of the wall. How high is the top of the ladder?
The point of this problem is to get you to use the Pythagorean Theorem. It demands that you combine geometry and algebra: geometry to recognize a right triangle and recall the appropriate formula, and algebra to solve that formula for the relevant side.
The activities in this booklet will give you practice making these connections. And they will do it in a special way: through data. You won’t calculate the height of the ladder, you’ll measure it. Here’s the basic idea:
1. We present you with a situation with some geometry in it.
2. You take some measurements, record them in a data table, and plot them on a graph.
3. You figure out a mathematical function that has the same pattern as the data (this is a mathematical model of your data).
This last step is the critical one, of course. As you will see, there are two ways this can work:
ˬˬ You use your understanding of the geometry and the situation to come up with your model.
ˬˬ You use the model you find to help you under-stand the geometry of the situation.
In this booklet, instead of a ladder, you’ll lean a chair against a wall, and measure the distance from the wall to the bottom of the chair, and from the floor to the top. Then you’ll graph them and try to find the function that relates those two quantities. In a way, this is the reverse of the traditional ladder problem. Instead of going from the formula to a specific number, you’ll go from numbers to the formula.
That means that the point is not a particular answer, but rather a relationship.
We hope the formulas and the geometry will make more sense because they’re about something real.
Real data is messy and confusing. Still, learning to handle real data is important—and it can be fun. This is partly because we will use computer software to do a lot of the graphing in this book, and that will take the drudgery out of the process.
What will be hard in this book is not the algebra, or the geometry, or even the data analysis. The hardest part will probably be connecting up the situations to all the math. This will often require common sense and learning to think mathematically about the situations.
Book PagesThe activities are numbered. Each activity has a student page followed by one or more teacher pages. Teacher pages include “answers,” or at least a sample graph. Some activities also have templates, or other pages suitable for copying.
You could just project the student page, and have students work in notebooks if you wish.
MaterialsYou will always need rulers and grid paper. Some activities need protractors. Activities about circles may need a variety of round objects, e.g., jar lids, bicycle wheels, etc. Other activities need simple objects such as books or cups.
Introduction
4
EGADs: Enriching Geometry and Algebra through Data DRAFT • eeps media © 2014
PrinciplesWorking with data is emerging as an important skill. There are important “habits of mind” to adopt that may never have been part of your math curriculum. Here is a partial list:
ˬˬ Limiting Cases. It often helps to measure and reason about special cases, especially ones at the edges of possibility. The model you create must work properly at these special cases—and it’s easy to check that out.
So if you’re doing that Pythagorean ladder problem, your formula had better work when the ladder is flat up against the wall, and when the ladder is flat on the ground.
ˬˬ Residuals. When you create a mathematical model to fit data, look at the residuals. If the model is good, there will be no pattern in the residuals—they will look random—and they will be centered around zero.
ˬˬ Enter only the data. Whenever possible, enter actual measurements, and let technology do all the calculations.
PredictionThe student pages of this book often ask them to predict. As of March 2014, we usually ask something like, “what will the relationship look like?” In this (linear) booklet, that means,
Before you take any measurements, think about the situation and sketch the graph you think you will get when you actually plot measurements.
This turns out to be a difficult step for students and teachers alike. One strategy is to collect the predic-tions the day before you spend class time on the measurement.
These predictions serve several purposes:
ˬˬ They help students think about the situation beforehand.
ˬˬ They give students a chance to be surprised.
ˬˬ They give you, the teacher, a chance to make sure students understand what’s being asked.
Student predictions often start out being terrible, but they improve with practice. Help students say what makes a good prediction. This can start with something as simple as having labeled axes or real-istic values. As students get more experienced, they get better at following the graphing rules, estimating distances, and inferring the shape of relationships. Once they get there, they can even start predicting equations for their models.
You can help make prediction meaningful and effective.
ˬˬ At the end, always ask students to compare their predictions to reality. If you do reflective writing, this is a good topic.
ˬˬ Be sure to ask students what was right about their predictions. Only then ask how they could have made better ones. Finally, ask about surprises: where did the graph turn out way differently than they thought?

5
EGADs: Enriching Geometry and Algebra through Data DRAFT • eeps media © 2014
Spiral 45 46
Spiral 20 48
Triangle Spiral 51
Spiral Decay 53
Tinkertoy Stick Lengths 55
Tilting Chairs 57
Vegetable Matter 59
Triangle Folding 61
Maximum Box 63
Toilet Paper Roll 65
Making a Cone 67
Arctangent 70
Sines of the Times 73
Vertex Angles 75
Law of Cosines 78
Small-Angle Approximation 82
Jupiter Size 84
Contents
Hypotenuse 6
Stack of Books 10
Stack of Cups 12
Opposite Sides of the Ruler 14
Rolling Rolling Rolling 16
Circumference 18
Triangle Ladder 20
Isosceles Angles 22
Pick’s Theorem 24
Cornbread Are Square 27
Cardboard Squares 29
Cardboard Circles 31
Paragraphs (Same Font Size) 33
Paragraphs (Different Font Size) 36
Chord Star 39
Chord Star 2 41
Filling a Cone 44
6
EGADs: Enriching Geometry and Algebra through Data DRAFT • eeps media © 2014
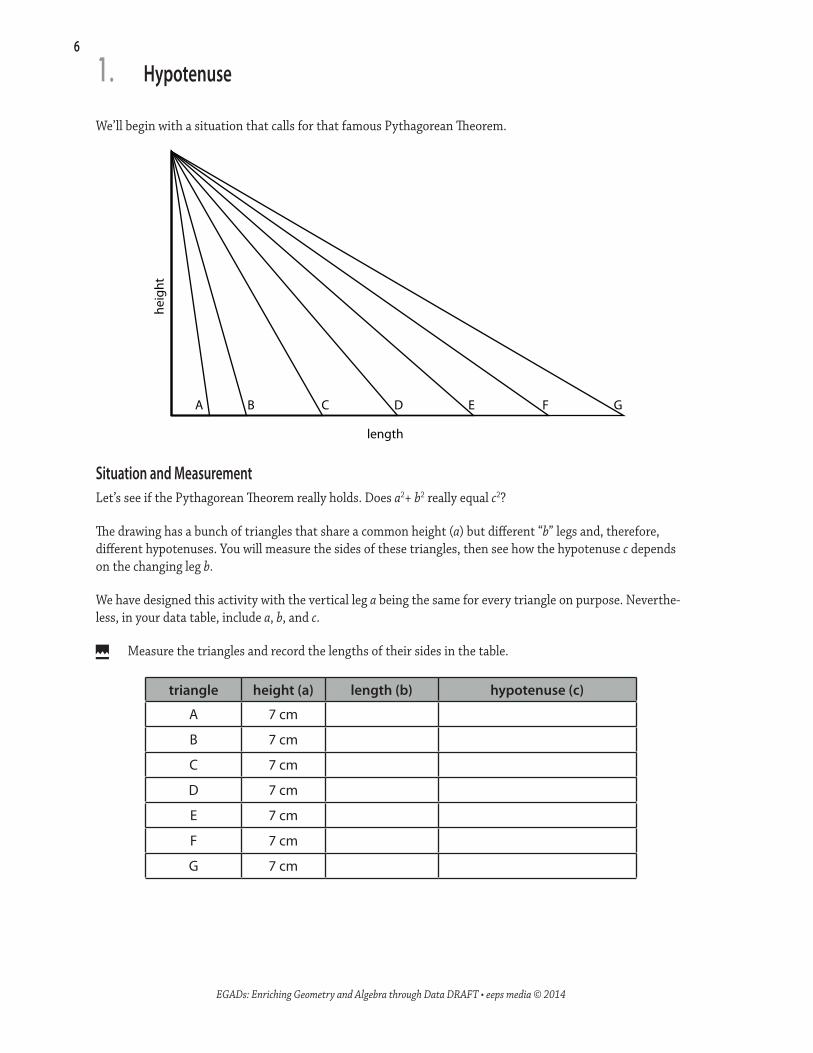
We’ll begin with a situation that calls for that famous Pythagorean Theorem.
height
A B C D E F G
length
Situation and MeasurementLet’s see if the Pythagorean Theorem really holds. Does a2+ b2 really equal c2?
The drawing has a bunch of triangles that share a common height (a) but different “b” legs and, therefore, different hypotenuses. You will measure the sides of these triangles, then see how the hypotenuse c depends on the changing leg b.
We have designed this activity with the vertical leg a being the same for every triangle on purpose. Neverthe-less, in your data table, include a, b, and c.
ˬˮ Measure the triangles and record the lengths of their sides in the table.
triangle height (a) length (b) hypotenuse (c)
A 7 cm
B 7 cm
C 7 cm
D 7 cm
E 7 cm
F 7 cm
G 7 cm
1. Hypotenuse
7
EGADs: Enriching Geometry and Algebra through Data DRAFT • eeps media © 2014
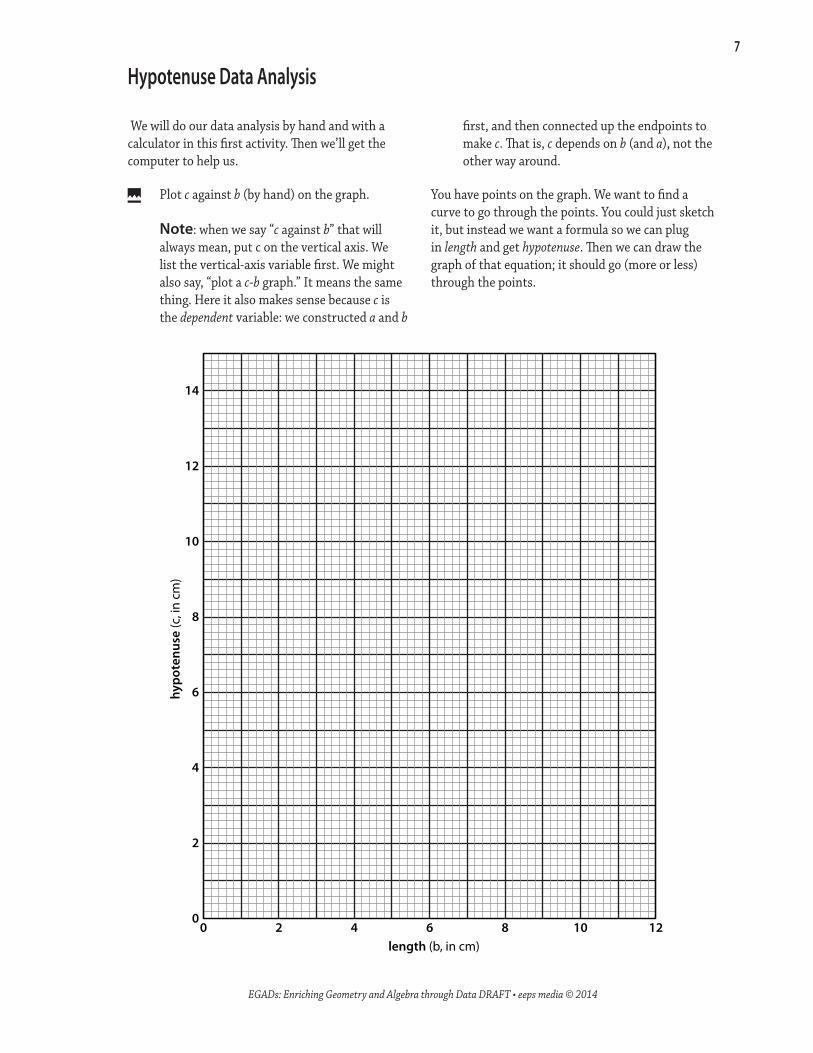
We will do our data analysis by hand and with a calculator in this first activity. Then we’ll get the computer to help us.
ˬˮ Plot c against b (by hand) on the graph.
Note: when we say “c against b” that will always mean, put c on the vertical axis. We list the vertical-axis variable first. We might also say, “plot a c-b graph.” It means the same thing. Here it also makes sense because c is the dependent variable: we constructed a and b
hypo
tenu
se (c
, in
cm)
length (b, in cm)0
0
2
4
6
8
10
12
14
2 4 6 8 10 12
first, and then connected up the endpoints to make c. That is, c depends on b (and a), not the other way around.
You have points on the graph. We want to find a curve to go through the points. You could just sketch it, but instead we want a formula so we can plug in length and get hypotenuse. Then we can draw the graph of that equation; it should go (more or less) through the points.
Hypotenuse Data Analysis
8
EGADs: Enriching Geometry and Algebra through Data DRAFT • eeps media © 2014
In this case, we know something about the relation-ship between these numbers. They are, after all, sides of a right triangle. That means we can use the Pythagorean Theorem,
a2 +b2 = c2 .
It may not be obvious how to use this, so we’ll go over it carefully right now; later on you’ll need to do this on your own. Note: this is one of the big ideas in this booklet, so it’s worth understanding well.
1. Figure out which quantity you want to be able to predict. In this case, it’s the hypotenuse. Why? Because in the drawing, we set up the length first, and then connected up the hypotenuse. Notice that the thing we want to predict is on the vertical (y) axis.
2. Figure out, in the equation you have, which variable corresponds to that variable. In this case, the formula is a2 +b2 = c2 , and the hypotenuse variable is c.
3. Use algebra! Solve the question for the variable. In this case, it’s easy: take the square root of both sides: c =
√a2 +b2 .
4. Plot that curve on your graph. In this case, you need a value of c for every value of b. You might think that there is a problem here because we have another variable: a. But we set this up so that a is the same for every triangle: 7 cm. So if we measure everything in centimeters, a2 = 49, and the equation becomes c =
√b2 +49 .
Where are x and y? If this looks confus-ing, you can rewrite the formula with x and y. Which variable is on the y-axis? It’s c. Similarly, b is on the x-axis. So substitute to get y =
√x2 +49 .
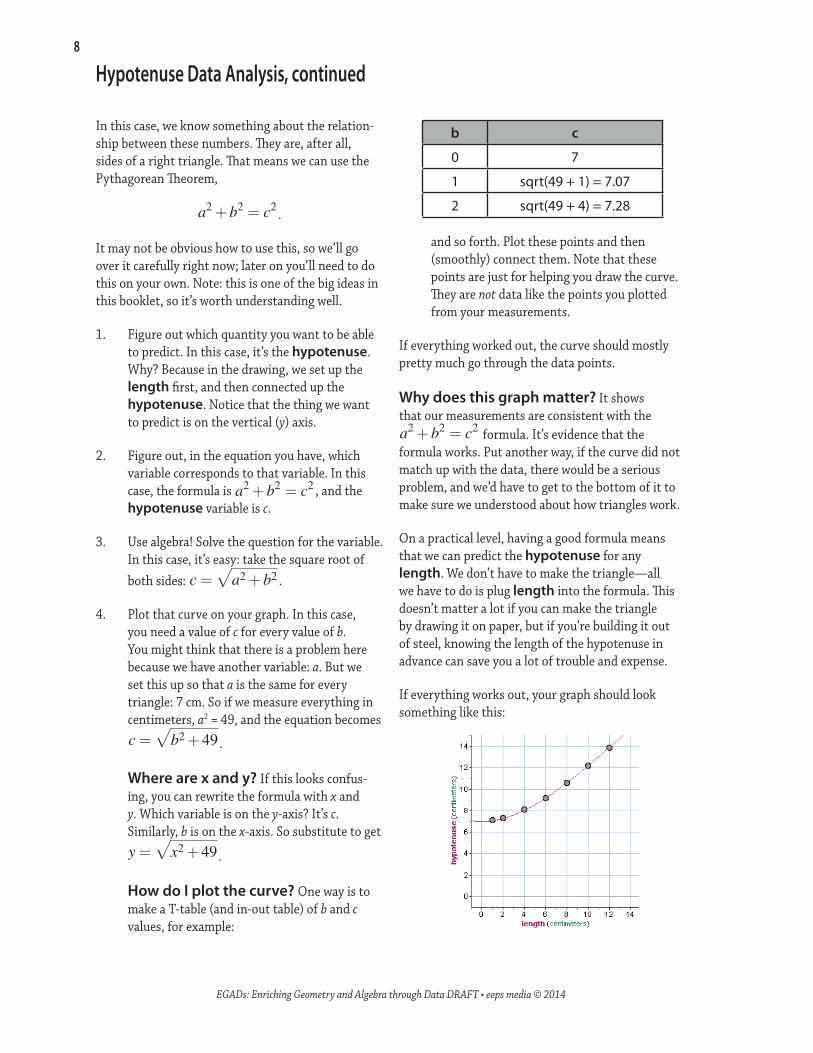
How do I plot the curve? One way is to make a T-table (and in-out table) of b and c values, for example:
b c
0 7
1 sqrt(49 + 1) = 7.07
2 sqrt(49 + 4) = 7.28
and so forth. Plot these points and then (smoothly) connect them. Note that these points are just for helping you draw the curve. They are not data like the points you plotted from your measurements.
If everything worked out, the curve should mostly pretty much go through the data points.
Why does this graph matter? It shows that our measurements are consistent with the a2 +b2 = c2 formula. It’s evidence that the formula works. Put another way, if the curve did not match up with the data, there would be a serious problem, and we’d have to get to the bottom of it to make sure we understood about how triangles work.
On a practical level, having a good formula means that we can predict the hypotenuse for any length. We don’t have to make the triangle—all we have to do is plug length into the formula. This doesn’t matter a lot if you can make the triangle by drawing it on paper, but if you’re building it out of steel, knowing the length of the hypotenuse in advance can save you a lot of trouble and expense.
If everything works out, your graph should look something like this:
Hypotenuse Data Analysis, continued

9
EGADs: Enriching Geometry and Algebra through Data DRAFT • eeps media © 2014
You will be making a lot of graphs and plotting a lot of curves. Once you know how to do it by hand, you should get a computer to help you. Here are instruc-tions for using Fathom to make your graph:
ˬˮ Open up a new document in Fathom.
ˬˮ Make a table by dragging one off the shelf.
ˬˮ Make column headings in your table by clicking where it says <new>. At a minimum, you’ll need columns for length and hypotenuse. You may want columns for triangle and height as well.
ˬˮ Enter your data. Your table will look something like this:
triangles
units
triangle height length hypotenuse <new>
centimeters centimeters centimeters
1
2
3
4
5
6
7
A cm7 cm1 cm7.1
B cm7 cm2 cm7.3
C cm7 cm4 cm8.1
D cm7 cm6 cm9.2
E cm7 cm8 cm10.6
F cm7 cm10 cm12.2
G cm7 cm12 cm13.9
Note: In Fathom, enter units with your data.
ˬˮ Making a graph. Drag a new graph off the shelf. It will be empty. Label your axes by dragging length to the horizontal axis and hypotenuse to the vertical axis. You’ll see this:
7
8
9
10
11
12
13
14
length (centimeters)0 2 4 6 8 10 12 14
triangles Scatter Plot
ˬˮ Plotting a curve. Right-click on the graph (use control-click if you have a one-button mouse) and choose Plot Function from the context menu that pops up (it’s way down at the bottom). The formula editor appears.
ˬˮ Enter the formula you want in the formula editor. Notice that hypotenuse = is already there. Use the keypad to get the square root symbol, and use the key (or shift-6) for exponents. Your formula will look like this:
ˬˮ Press OK to make the function plot on the graph. It may say #Units incompatible#. We’ll fix that later.
ˬˮ Rescaling axes. You might have noticed that the vertical axis starts around 7. If you want to see the origin and the length axis, grab the number 7 by the axis and drag up.
A Gotcha: Where Did Height Go? In our formula, you might wonder why we used 49 instead of height2. Of course 49 is 72, and the height of all the triangles is 7 cm. But why did we put in the number instead of the expression?
Ordinarily, it’s best to leave as many things as pos-sible “in letters,” that is, written using variables. But here, because we’re plotting a function, there has to be only one variable on the right-hand side of the formula.
Why? To draw the curve, the computer has to calcu-late a hypotenuse for any length. Not just lengths in the table, but any length at all. If we wrote
hypotenuse length height= +2 2
it couldn’t calculate hypotenuse for length = 3 cm (which is not in the table) without knowing height. Since the height would be 7 cm—because of the way we set it up—we put in 49.
Hypotenuse Data Analysis: Getting the Computer to Help

10
EGADs: Enriching Geometry and Algebra through Data DRAFT • eeps media © 2014
2. Stack of Books
What to DoIn this activity, you will make stacks of different numbers of books. How does the height of the stack depend on the number of books?
number height
What to DoMake a stack of books. Measure the height of the stack (as in the illustration) and count the books (in this case, 15). Record the number and the height for at least five different stacks.
How will height be related to number?
ˬˮ Predict: What do you think the relationship will look like?
ˬˮ Record measurements of height and number, for stacks with different numbers of books.
ˬˮ Plot height against number.
ˬˮ Find a line that fits the points. Find its equation. Be sure you can explain the meaning of the slope and the intercept.
ˬˮ Be sure you can explain why it makes sense that it’s a line that fits the points.

11
EGADs: Enriching Geometry and Algebra through Data DRAFT • eeps media © 2014
This is a linear situation, in fact, a direct proportion. It’s suitable for students with little experience in this sort of thing, or as a quick introduction to this type of activity for more experienced students.
Here is sample data and a graph with a good line superimposed.
<Sample data>
As you might expect, the slope is the thickness of a single book, and the intercept should be zero. Do not be surprised if students who have already studied slope and intercept do not immediately understand this. Students may have had little experience apply-ing what they know from algebra in a situation with measurement. There are several confusing aspects:
ˬˬ The variables are not named x and y.
ˬˬ The points will not lie perfectly on the line.
ˬˬ The numbers will be messy decimals.
You can help students using several strategies:
ˬˬ Have them substitute x and y briefly for the real variable names so they can figure out what corresponds to what in their “y = mx + b” pattern.
ˬˬ Work to help them find the meaning of m, the slope. They will say things like “it’s rise over run.” Push them to tell you what that means in the context of the problem. Once they say, “if you increase the number of books by one, the height will increase by 2.15 cm,” you’re getting close but not there—you really want them to interpret that true statement in context, namely, “each book is 2.15 cm thick.”
ˬˬ For the intercept, again have them think about the situation: “If there were zero books in your stack, how tall would it be?” If it helps, have them enter that point. In Fathom, it is appro-priate to set Lock Intercept at Zero in the graph’s context menu.
Stack of Books Instructor Notes
Contexts And MaterialsYou don’t have to use books, of course. It might be good for students to have several different experi-ences with analogous situations. For beginning students, however, it is important that the books (or whatever) be as close to the same size as possible, e.g., copies of the same book.
Other ideas: stacks of blocks or coins; beans in a graduated cylinder vs. volume; pages of a thick book (note intercept!); distance traveled vs. number of steps; distance vs. number of tiles on a wall or floor; etc.

12
EGADs: Enriching Geometry and Algebra through Data DRAFT • eeps media © 2014
In this activity, you will make stacks of different numbers of cups. The cups “nest” inside each other. How does the height of the stack depend on the number of cups?
height
number height
What to DoMake a stack of cups, all nested together. Measure the height of the stack (as in the illustration) and count the cups (in this case, six). Record the number and the height for at least five different stacks.
How will height be related to number?
ˬˮ Predict: What do you think the relationship will look like?
ˬˮ Record measurements of height and number, for stacks with different numbers of cups.
ˬˮ Plot height against number.
ˬˮ Find a line that fits the points. Find its equation. Be sure you can explain the meaning of the slope and the intercept.
ˬˮ Be sure you can explain why it makes sense that it’s a line that fits the points.
3. Stack of Cups

13
EGADs: Enriching Geometry and Algebra through Data DRAFT • eeps media © 2014
We put this early in the book because it’s linear, so it takes less mathematical baggage to approach. You don’t need to have mastered algebra to understand this context and figure out the formula.
But it’s not perfectly simple either. Even though you can use the geometry of the situation to understand the data, the meanings of the slope and intercept are subtle. Here is a sample graph with a good line superimposed.
A traditional “meaning of slope” is “the height you add to a stack with each additional cup.” This is correct but disconnected from the context. The intercept, however, is worse: “the height of a stack of zero cups.” How could that be?
A key question is, based on your formula, how tall is one cup? Curiously, it’s the slope plus the intercept. There are at least two ways to see why this is true:
ˬˬ If you plug number = 1 into your formula, you get slope plus intercept. This is a purely algebraic approach—efficient, but not showing understanding of the situation.
ˬˬ If you make a diagram showing the size of slope and intercept, you can see that the size of a whole cup is their sum. This shows a good connection to the context, but is inefficient (or fragile) because “seeing” the intercept is so strange and hard.
The upshot is that we want students to have both understandings and be able to relate them.
slope
intercep
t
What is really happening here is that the situation (unlike stacking without nesting) really doesn’t fit cleanly with the slope-intercept form. Whereas we would ordinarily plug in zero for number to test our predictions—it is usually good to test limiting cases—this time zero gives us a bogus answer. Does that mean algebra is bad? No. But it does mean you can’t use it without thinking.
<Point-slope alternative?><Limits of domain>
Context NoteThis classic situation appears frequently in math problems. Another context you will see is nested shopping carts: how does the length of a train of shopping carts depend on the number of carts in he train? Data on actual nested shopping carts appears in the eeps Data Zoo. (http://www.eeps.com/zoo/index.html)
Stack of Cups Instructor Notes

14
EGADs: Enriching Geometry and Algebra through Data DRAFT • eeps media © 2014
In this activity, you will relate the numbers on the opposite sides of your ruler to one another.
What to DoTake a traditional U.S. student ruler—the kind with inches on one side and centimeters on the other. For at least seven spots on the ruler, record what numbers are opposite each other.
How will inches be related to centimeters?
ˬˮ Predict: What do you think the relationship will look like?
ˬˮ Record at least seven measurements of centimeters and inches. For each measurement, pick a spot on the ruler and record the numbers from the two sides of the ruler.
inches centimeters
ˬˮ Plot centimeters (on the vertical axis) against inches.
ˬˮ Find and explain a mathematical function that fits the points. Be sure you can explain the meaning of any parameters.
ˬˮ Be sure you can explain why the form of your function makes sense.
4. Opposite Sides of the Ruler
15
EGADs: Enriching Geometry and Algebra through Data DRAFT • eeps media © 2014
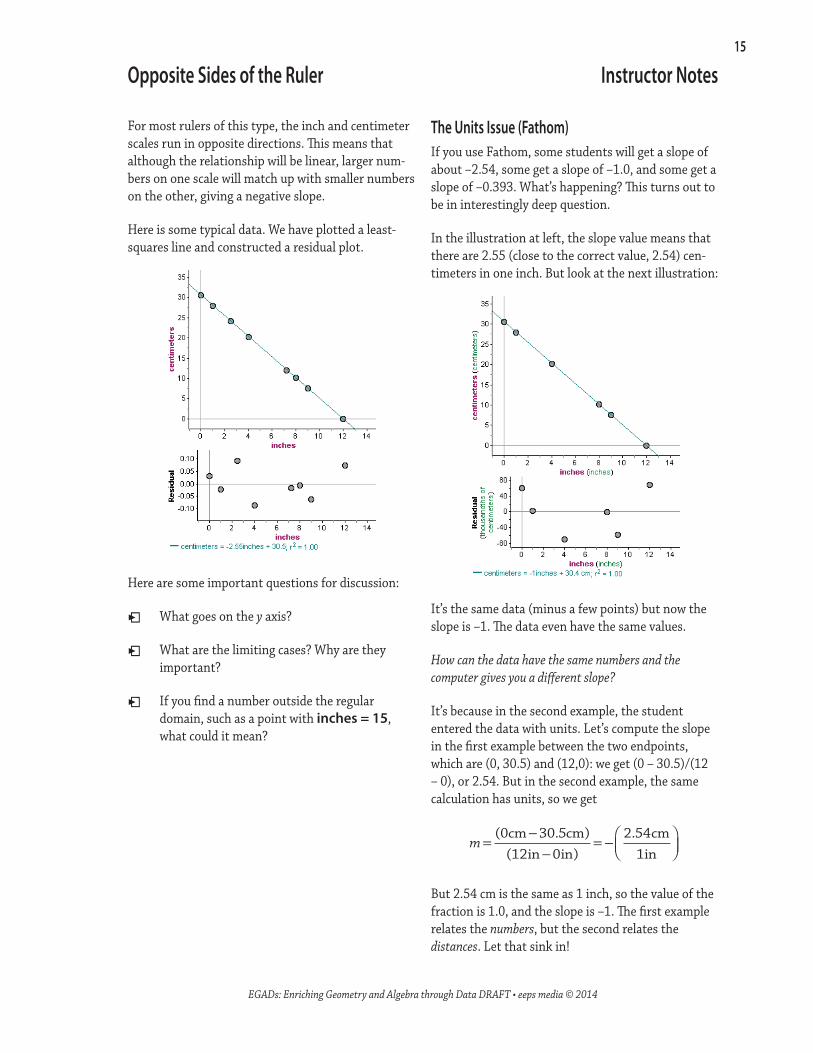
For most rulers of this type, the inch and centimeter scales run in opposite directions. This means that although the relationship will be linear, larger num-bers on one scale will match up with smaller numbers on the other, giving a negative slope.
Here is some typical data. We have plotted a least-squares line and constructed a residual plot.
Here are some important questions for discussion:
ˬˬ What goes on the y axis?
ˬˬ What are the limiting cases? Why are they important?
ˬˬ If you find a number outside the regular domain, such as a point with inches = 15, what could it mean?
Opposite Sides of the Ruler Instructor Notes
The Units Issue (Fathom)If you use Fathom, some students will get a slope of about –2.54, some get a slope of –1.0, and some get a slope of –0.393. What’s happening? This turns out to be in interestingly deep question.
In the illustration at left, the slope value means that there are 2.55 (close to the correct value, 2.54) cen-timeters in one inch. But look at the next illustration:
It’s the same data (minus a few points) but now the slope is –1. The data even have the same values.
How can the data have the same numbers and the computer gives you a different slope?
It’s because in the second example, the student entered the data with units. Let’s compute the slope in the first example between the two endpoints, which are (0, 30.5) and (12,0): we get (0 – 30.5)/(12 – 0), or 2.54. But in the second example, the same calculation has units, so we get
m=−−
= −
( . )( )
.0 30 512 0
2 54cm cmin in
cm1in
But 2.54 cm is the same as 1 inch, so the value of the fraction is 1.0, and the slope is –1. The first example relates the numbers, but the second relates the distances. Let that sink in!
16
EGADs: Enriching Geometry and Algebra through Data DRAFT • eeps media © 2014
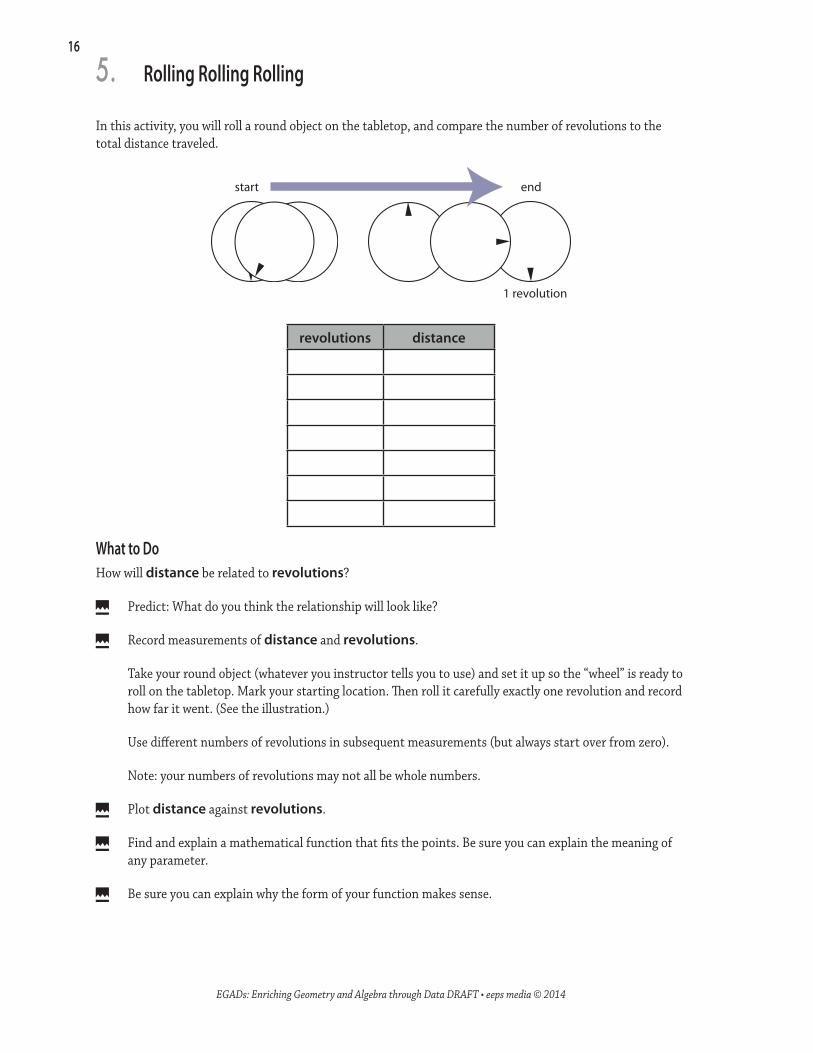
In this activity, you will roll a round object on the tabletop, and compare the number of revolutions to the total distance traveled.
start end
1 revolution
revolutions distance
What to DoHow will distance be related to revolutions?
ˬˮ Predict: What do you think the relationship will look like?
ˬˮ Record measurements of distance and revolutions.
Take your round object (whatever you instructor tells you to use) and set it up so the “wheel” is ready to roll on the tabletop. Mark your starting location. Then roll it carefully exactly one revolution and record how far it went. (See the illustration.)
Use different numbers of revolutions in subsequent measurements (but always start over from zero).
Note: your numbers of revolutions may not all be whole numbers.
ˬˮ Plot distance against revolutions.
ˬˮ Find and explain a mathematical function that fits the points. Be sure you can explain the meaning of any parameter.
ˬˮ Be sure you can explain why the form of your function makes sense.
5. Rolling Rolling Rolling
17
EGADs: Enriching Geometry and Algebra through Data DRAFT • eeps media © 2014
MaterialsYou need round things and rulers or tape measures.
Coins can be hard to roll without slipping. Jar lids are much easier, though they need to be marked. If you can mark the wheels, toy cars work, too. Whole cans or jars are easier than jar lids.
For a larger-scale experience, a bicycle is terrific. Set it up with the valve stem straight down and roll the bike forward until it’s down again. Then you know you have gone one revolution. Measuring distance can be a challenge because it is so far, but be creative: you could use nonstandard measures such as floor tiles or sidewalk cracks or yards on the football field.
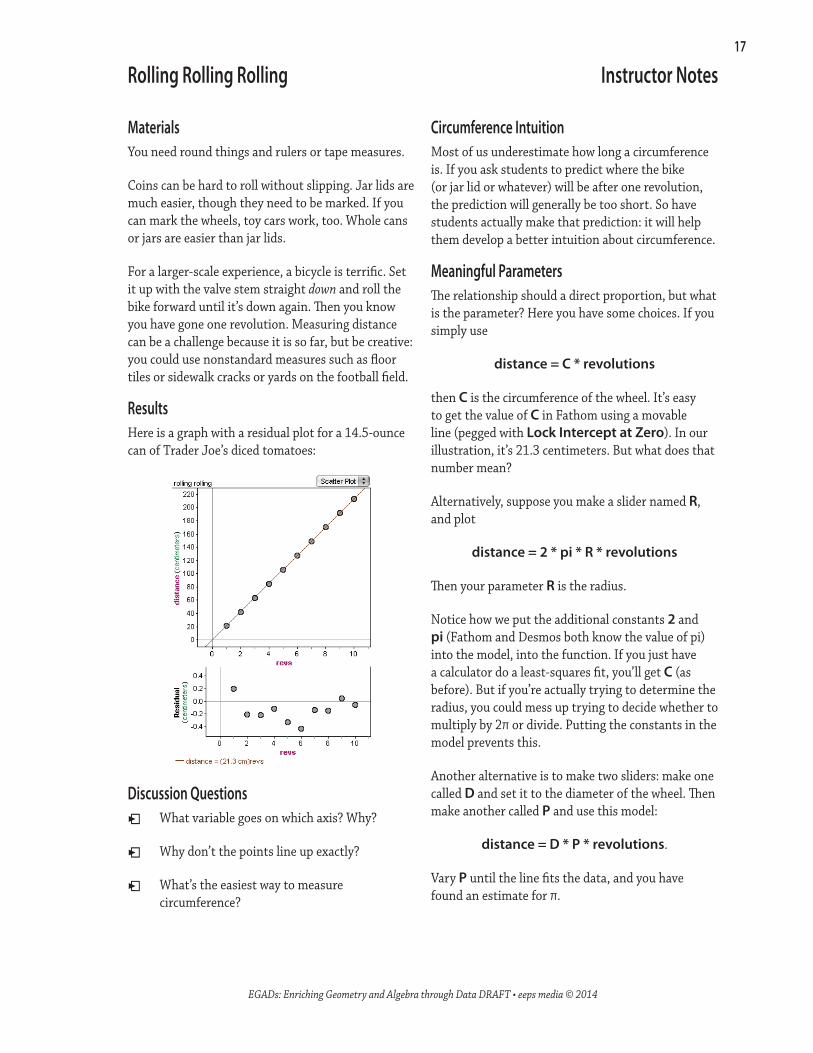
ResultsHere is a graph with a residual plot for a 14.5-ounce can of Trader Joe’s diced tomatoes:
Discussion Questionsˬˬ What variable goes on which axis? Why?
ˬˬ Why don’t the points line up exactly?
ˬˬ What’s the easiest way to measure circumference?
Rolling Rolling Rolling Instructor Notes
Circumference IntuitionMost of us underestimate how long a circumference is. If you ask students to predict where the bike (or jar lid or whatever) will be after one revolution, the prediction will generally be too short. So have students actually make that prediction: it will help them develop a better intuition about circumference.
Meaningful ParametersThe relationship should a direct proportion, but what is the parameter? Here you have some choices. If you simply use
distance = C * revolutions
then C is the circumference of the wheel. It’s easy to get the value of C in Fathom using a movable line (pegged with Lock Intercept at Zero). In our illustration, it’s 21.3 centimeters. But what does that number mean?
Alternatively, suppose you make a slider named R, and plot
distance = 2 * pi * R * revolutions
Then your parameter R is the radius.
Notice how we put the additional constants 2 and pi (Fathom and Desmos both know the value of pi) into the model, into the function. If you just have a calculator do a least-squares fit, you’ll get C (as before). But if you’re actually trying to determine the radius, you could mess up trying to decide whether to multiply by 2π or divide. Putting the constants in the model prevents this.
Another alternative is to make two sliders: make one called D and set it to the diameter of the wheel. Then make another called P and use this model:
distance = D * P * revolutions.
Vary P until the line fits the data, and you have found an estimate for π.

18
EGADs: Enriching Geometry and Algebra through Data DRAFT • eeps media © 2014
In this activity, you will explore the circumferences and diameters of round objects.
What to DoFor as many different round objects as you can, measure the circumference and diameter. Try to get a wide range of sizes.
How will circumference be related to diameter?
ˬˮ Predict: What do you think the relationship will look like? If you can, be precise and quantitative.
ˬˮ Record measurements of circumference and diameter for as
ˬˮ Plot circumference against diameter.
ˬˮ Find and explain a mathematical function that fits the points. Be sure you can explain the meaning of any parameter.
ˬˮ Be sure you can explain why the form of your function makes sense.
6. Circumference
19
EGADs: Enriching Geometry and Algebra through Data DRAFT • eeps media © 2014
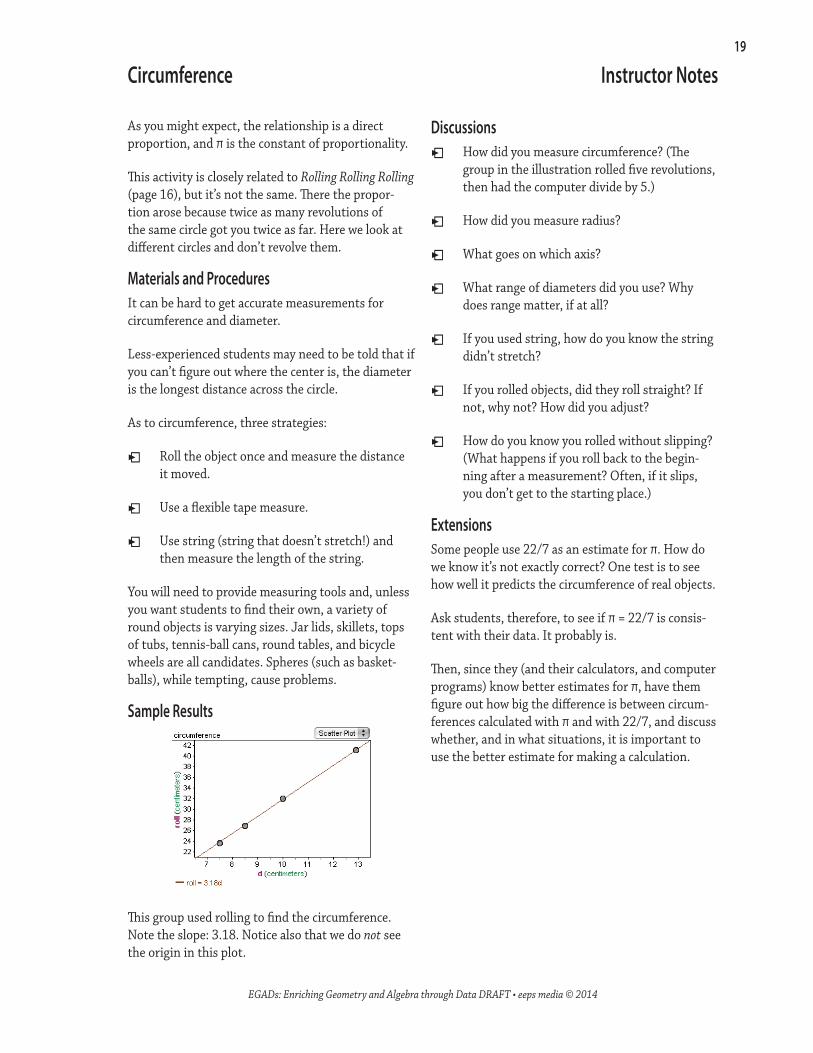
As you might expect, the relationship is a direct proportion, and π is the constant of proportionality.
This activity is closely related to Rolling Rolling Rolling (page 16), but it’s not the same. There the propor-tion arose because twice as many revolutions of the same circle got you twice as far. Here we look at different circles and don’t revolve them.
Materials and ProceduresIt can be hard to get accurate measurements for circumference and diameter.
Less-experienced students may need to be told that if you can’t figure out where the center is, the diameter is the longest distance across the circle.
As to circumference, three strategies:
ˬˬ Roll the object once and measure the distance it moved.
ˬˬ Use a flexible tape measure.
ˬˬ Use string (string that doesn’t stretch!) and then measure the length of the string.
You will need to provide measuring tools and, unless you want students to find their own, a variety of round objects is varying sizes. Jar lids, skillets, tops of tubs, tennis-ball cans, round tables, and bicycle wheels are all candidates. Spheres (such as basket-balls), while tempting, cause problems.
Sample Results
This group used rolling to find the circumference. Note the slope: 3.18. Notice also that we do not see the origin in this plot.
Circumference Instructor Notes
Discussionsˬˬ How did you measure circumference? (The
group in the illustration rolled five revolutions, then had the computer divide by 5.)
ˬˬ How did you measure radius?
ˬˬ What goes on which axis?
ˬˬ What range of diameters did you use? Why does range matter, if at all?
ˬˬ If you used string, how do you know the string didn’t stretch?
ˬˬ If you rolled objects, did they roll straight? If not, why not? How did you adjust?
ˬˬ How do you know you rolled without slipping? (What happens if you roll back to the begin-ning after a measurement? Often, if it slips, you don’t get to the starting place.)
ExtensionsSome people use 22/7 as an estimate for π. How do we know it’s not exactly correct? One test is to see how well it predicts the circumference of real objects.
Ask students, therefore, to see if π = 22/7 is consis-tent with their data. It probably is.
Then, since they (and their calculators, and computer programs) know better estimates for π, have them figure out how big the difference is between circum-ferences calculated with π and with 22/7, and discuss whether, and in what situations, it is important to use the better estimate for making a calculation.

20
EGADs: Enriching Geometry and Algebra through Data DRAFT • eeps media © 2014
7. Triangle Ladder
In this activity, you’ll study the lengths of the “rungs” of a “triangle ladder.”
What to DoMake a triangle ladder!
ˬˮ Sketch a triangle, a pretty big one, an a sheet of paper. Don’t use a ruler, but make it fairly carefully. Label the vertices P, Q, and R. It doesn’t have to be a special triangle (e.g., isosceles).
ˬˮ Make at least five segments parallel to PQ that extend from PR to QR . These are the “rungs.”
ˬˮ Measure and mark down the lengths of all the rungs.
The length of that rung will depend somehow on a measurement along the side of the triangle (that is, along PR or QR ).
ˬˮ Decide what to use for your side distance. Write down, briefly but clearly, how to measure side.
How will rung be related to side?
ˬˮ Predict: What do you think the relationship will look like?
ˬˮ Record measurements of rung and side, and plot rung against side.
ˬˮ Find and explain a mathematical function that fits the points. Be sure you can explain the meaning of any parameter.
ˬˮ Explain why the form of your function makes sense. If you’ve studied geometry, you should be able to explain it using geometrical vocabulary.
ˬˮ Fine someone who had a different definition of side, and compare your two functions. Figure out how they’re related to each other.
Explore: how much did it matter that you drew the diagram freehand, without a ruler?
21
EGADs: Enriching Geometry and Algebra through Data DRAFT • eeps media © 2014
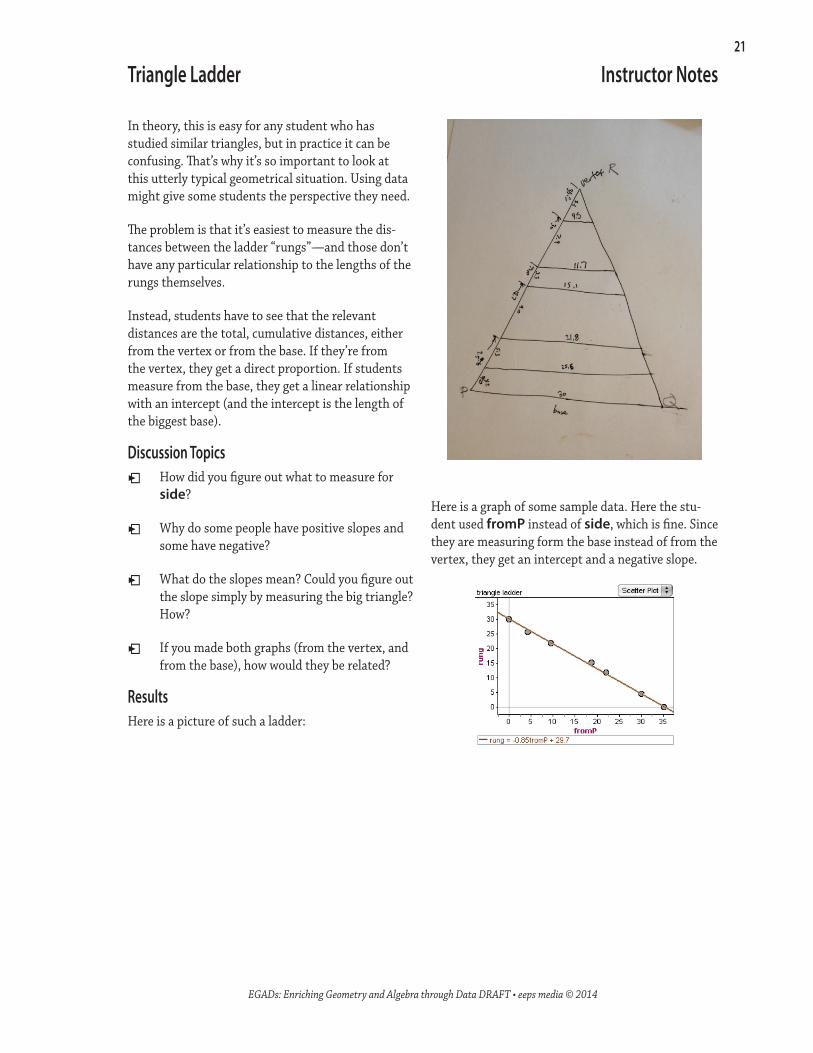
Here is a graph of some sample data. Here the stu-dent used fromP instead of side, which is fine. Since they are measuring form the base instead of from the vertex, they get an intercept and a negative slope.
In theory, this is easy for any student who has studied similar triangles, but in practice it can be confusing. That’s why it’s so important to look at this utterly typical geometrical situation. Using data might give some students the perspective they need.
The problem is that it’s easiest to measure the dis-tances between the ladder “rungs”—and those don’t have any particular relationship to the lengths of the rungs themselves.
Instead, students have to see that the relevant distances are the total, cumulative distances, either from the vertex or from the base. If they’re from the vertex, they get a direct proportion. If students measure from the base, they get a linear relationship with an intercept (and the intercept is the length of the biggest base).
Discussion Topicsˬˬ How did you figure out what to measure for
side?
ˬˬ Why do some people have positive slopes and some have negative?
ˬˬ What do the slopes mean? Could you figure out the slope simply by measuring the big triangle? How?
ˬˬ If you made both graphs (from the vertex, and from the base), how would they be related?
ResultsHere is a picture of such a ladder:
Triangle Ladder Instructor Notes

22
EGADs: Enriching Geometry and Algebra through Data DRAFT • eeps media © 2014
In this activity, you’ll study the angle in an isosceles triangle.
What to DoMake some isosceles triangles. Your instructor will tell you what tools to use. But if you’re doing this on your own, you could just draw the triangles freehand, as accurately as you can “by eye.”
You will need a protractor to measure the angles.
ˬˮ Sketch some isosceles triangles, as large as is practical given your paper. Sketch a variety—some with small (acute) vertex angles, and others with large (obtuse) vertex angles. You need at least five triangles.
ˬˮ Label each triangle with a number, and label the vertices A, B, and C, where A is the vertex—the point where the two like sides come together. So we’ll call the vertex of triangle 4 A4, and so forth.
ˬˮ Measure all the angles. Write their values in the angles, and record them in a table. The column head-ings should be number, A, B, and C. (The number of the triangle is number.)
How will A, B, and C be related?
ˬˮ Predict: What do you think the relationship will look like? Since you have three variables instead of two, give some thought to the best ways to express your prediction. It may be that you have more than one graph.
ˬˮ Find and explain mathematical functions that fit the points. Be sure you can explain the meanings of any parameters. For example, if your equations have any coefficients, why do they have to have the values they do?
ˬˮ Test your predictions: how good were they? How well do the data support what you claimed?
Explore: if you drew your figures freehand, without a ruler, what difference would it have made if you had been able to make your triangles perfect?
8. Isosceles Angles

23
EGADs: Enriching Geometry and Algebra through Data DRAFT • eeps media © 2014
Notice two things about the graphs we get:
First, the formula for the line is much more under-standable with A on the vertical axis: it follows directly and easily from A + B + C = 180°. The other one is just as true, though.
The graphs do not immediately “look” like the relationship—at least not the way we might usually think of it.
Simplifying the TaskIf all this open-endedness is too much for less-experienced students, you could simplify the task in two ways:
ˬˬ Have students ignore angle A and study the relationship between B and C, that is, have them “discover” that the base angles of isosce-les triangles are equal; or
ˬˬ have students relate A to either B or C. Then they will find that A = 180 –2B (or some equivalent expression).
You could also make students’ lives easier (but a little less fulfilling) by giving them a template to start with. See the “Vertex Angles Diagram” on page 77
Isosceles Angles Instructor Notes
Many students probably know that A + B + C = 180°, and that B = C. For those students, this is a perfect opportunity to make really good predictions.
The extra, open-ended challenge in this task is to deal with three variables. If you make a graph, what do you put on the axes? One good strategy is to make two graphs: B against C and A against B or C.
Some students may try to make a single graph that relates all three variables. This is an interest-ing challenge; if a students or a group seems to be getting bogged down, however, consider suggesting that they do something less ambitions (i.e., use two “normal” scatterplots). See if they want to pursue the 3-variable graph elsewhere—maybe as extra credit.
Some students may give up on graphs entirely and rely instead on formulas for their predictions. Their challenge will be to evaluate their predictions without a graph: how can they tell of their guess even has the right shape? It’s not impossible; for example, they might predict that the sum of the angles is 180°, and test the idea by adding the three angles and comparing. This is fine, but in the debriefing, ask the class what you get out of a graph (or a set of graphs) that you don’t get out of calculation.
Measuring AnglesMeasuring angles well seems to be a challenge even for otherwise accomplished students. If your classroom is like many, you have a motley collection of protractors, and students are inexperienced. This activity gives them some needed practice.
The biggest danger is angles slightly larger than 90°; if students record a 95° angle as 85°, it can mess up their data. (This can be a good thing if students see that there is something wrong with the point that doesn’t fit in the graph; then they can re-measure and fix the problem.)
ResultsIn this example, the group has put A on the hori-zontal axis and plotted both B and C. They have not, however, looked at limiting cases.
24
EGADs: Enriching Geometry and Algebra through Data DRAFT • eeps media © 2014
9. Pick’s Theorem
In elementary school, you may have played with cool manipulatives called geoboards. There was probably a grid of plastic poles, and you would stretch rubber bands around them to make shapes. These shapes are polygons, by the way: they have straight edges.
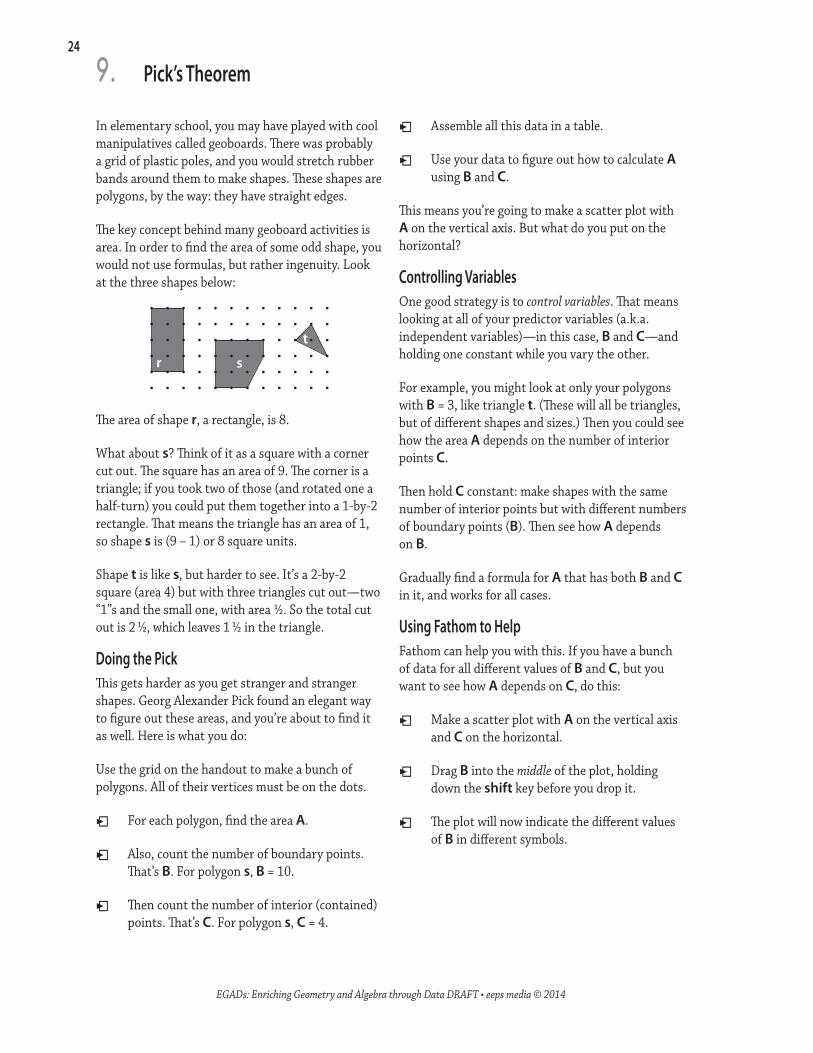
The key concept behind many geoboard activities is area. In order to find the area of some odd shape, you would not use formulas, but rather ingenuity. Look at the three shapes below:
r s
t
The area of shape r, a rectangle, is 8.
What about s? Think of it as a square with a corner cut out. The square has an area of 9. The corner is a triangle; if you took two of those (and rotated one a half-turn) you could put them together into a 1-by-2 rectangle. That means the triangle has an area of 1, so shape s is (9 – 1) or 8 square units.
Shape t is like s, but harder to see. It’s a 2-by-2 square (area 4) but with three triangles cut out—two “1”s and the small one, with area 1/2. So the total cut out is 2 1/2, which leaves 1 1/2 in the triangle.
Doing the PickThis gets harder as you get stranger and stranger shapes. Georg Alexander Pick found an elegant way to figure out these areas, and you’re about to find it as well. Here is what you do:
Use the grid on the handout to make a bunch of polygons. All of their vertices must be on the dots.
ˬˬ For each polygon, find the area A.
ˬˬ Also, count the number of boundary points. That’s B. For polygon s, B = 10.
ˬˬ Then count the number of interior (contained) points. That’s C. For polygon s, C = 4.
ˬˬ Assemble all this data in a table.
ˬˬ Use your data to figure out how to calculate A using B and C.
This means you’re going to make a scatter plot with A on the vertical axis. But what do you put on the horizontal?
Controlling VariablesOne good strategy is to control variables. That means looking at all of your predictor variables (a.k.a. independent variables)—in this case, B and C—and holding one constant while you vary the other.
For example, you might look at only your polygons with B = 3, like triangle t. (These will all be triangles, but of different shapes and sizes.) Then you could see how the area A depends on the number of interior points C.
Then hold C constant: make shapes with the same number of interior points but with different numbers of boundary points (B). Then see how A depends on B.
Gradually find a formula for A that has both B and C in it, and works for all cases.
Using Fathom to HelpFathom can help you with this. If you have a bunch of data for all different values of B and C, but you want to see how A depends on C, do this:
ˬˬ Make a scatter plot with A on the vertical axis and C on the horizontal.
ˬˬ Drag B into the middle of the plot, holding down the shift key before you drop it.
ˬˬ The plot will now indicate the different values of B in different symbols.
25
EGADs: Enriching Geometry and Algebra through Data DRAFT • eeps media © 2014
Pick’s Theorem
26
EGADs: Enriching Geometry and Algebra through Data DRAFT • eeps media © 2014
Pick’s Theorem Instructor Notes
This is for mathematically more mature students.
As written, the activity gives students very little scaffolding. This is intentional. It would take a lot of paper to write a comprehensive set of instructions for how to control variables—and who would read it? This is the sort of thing you have to experience, and wrestle with, to understand.
Then the idea of putting the general formula together is probably different from the sort of thing that students have done before.
Nevertheless, using data and graphing, we think that this experience is more accessible to more students than before.
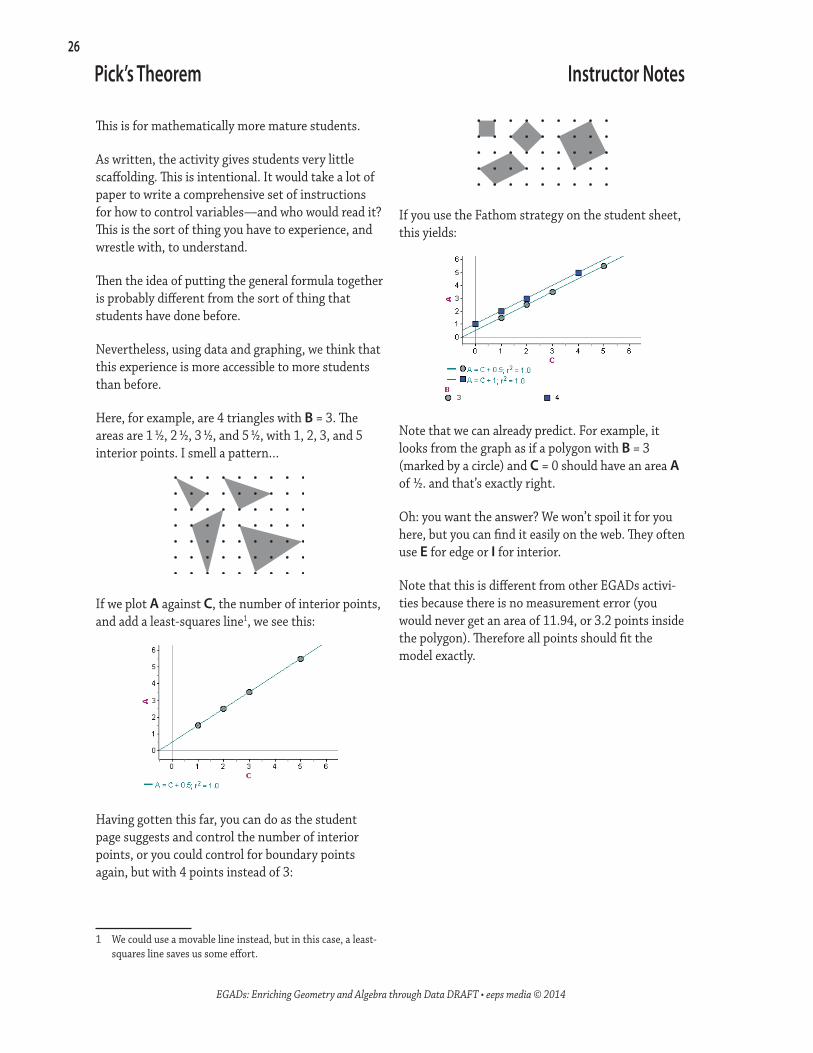
Here, for example, are 4 triangles with B = 3. The areas are 1 1/2, 2 1/2, 3 1/2, and 5 1/2, with 1, 2, 3, and 5 interior points. I smell a pattern…
If we plot A against C, the number of interior points, and add a least-squares line1, we see this:
Having gotten this far, you can do as the student page suggests and control the number of interior points, or you could control for boundary points again, but with 4 points instead of 3:
1 We could use a movable line instead, but in this case, a least-squares line saves us some effort.
If you use the Fathom strategy on the student sheet, this yields:
Note that we can already predict. For example, it looks from the graph as if a polygon with B = 3 (marked by a circle) and C = 0 should have an area A of 1/2. and that’s exactly right.
Oh: you want the answer? We won’t spoil it for you here, but you can find it easily on the web. They often use E for edge or I for interior.
Note that this is different from other EGADs activi-ties because there is no measurement error (you would never get an area of 11.94, or 3.2 points inside the polygon). Therefore all points should fit the model exactly.

27
EGADs: Enriching Geometry and Algebra through Data DRAFT • eeps media © 2014
10. Cornbread Are Square
“Pie are round; cornbread are square”—Anonymous
In this activity, you will explore the areas of circles.
What to DoCount the squares in each of the circles below (or you could make your own using graph paper). Count the area in the partial squares as well, estimating how many whole squares they make up together.
You will measure area and radius in the units of the grid.
How will area be related to radius?
ˬˮ Predict: What do you think the relationship will look like? If you can, be precise and quantitative.
ˬˮ Record measurements of area and radius for as many circles as you can.
ˬˮ Plot area against radius.
ˬˮ Find and explain a mathematical function that fits the points. Be sure you can explain the meaning of any parameter.
ˬˮ Be sure you can explain why the form of your function makes sense.

28
EGADs: Enriching Geometry and Algebra through Data DRAFT • eeps media © 2014
for another, the numbers get more accurate with larger radii; if we simply averaged the πs, we would get a skewed result.
Note: you could plot the area against the square of the radius; then you should get a straight line that (limiting cases) passes through zero, and has a slope about π.
Alternative ApproachInstead of counting up partial squares, you could have students “bracket” π by doing an upper/lower limit dance:
ˬˮ Count the squares that are entirely within the circle. This “area” is the minimum area.
ˬˮ Next, count the squares that contain any part of the interior of the circle. (That is, the interior squares pus all squares the circle goes through.) This is the maximum area.
ˬˮ Make one graph of the minima, one of the maxima, and find the parameter that corre-sponds to each one.
(You can also put both on the same graph; be sure to drop the second variable onto the plus-sign as shown on page 52.)
ˬˮ Notice how the larger the circle, the closer the minimum parameters is to the maximum.
“Pie are round; cornbread are square”—Anonymous
Even if students can recite the formula A =πr2 in their sleep, the data approach is interesting, because
ˬˬ They may not have thought about what area actually means in a while;
ˬˬ They may never have had this formula con-firmed for themselves; and
ˬˬ Students may not even think of this formula in this context.
We expect students to count the squares to get the area. They could count a quarter of the squares in each circle, then multiply by 4. That’s fine.
The most common way to count the partial squares is to estimate which partials go together to make up whole squares, and shade them in as you count.
Here is some pretty good data. The residual plot is helpful and illuminating; students will see that the larger circles have more leverage in the residual plot.
Why Use Functions?You could just calculate “pi” for each circle, taking the area and dividing by the square of the radius. Why go to the trouble of plotting the function?
For one thing, it shows us the relationship, not just the number.
Cornbread Are Square Instructor Notes

29
EGADs: Enriching Geometry and Algebra through Data DRAFT • eeps media © 2014
In this activity, we make rough squares out of cardboard and weigh them. How does the mass of these squares depend on their size?
What to DoCut squares of different sizes out of cardboard. Do not measure ahead of time. Just try to make them square. Make the squares of different sizes, as wide a range as you can with your materials. For each square, weigh the cardboard square (to get mass) and measure the length of a side (call it side). Because the squares are not perfect, some sides will be longer than others. Just pick one.
How will side related to mass?
ˬˮ Predict: What do you think the relationship will look like?
ˬˮ Cut out cardboard squares ranging from small (about 1 cm) to as large as possible. You must have at least 6 squares.
ˬˮ Record measurements of side and mass for each of your squares.
ˬˮ Plot mass against side.
ˬˮ Find and explain a mathematical function that fits the points. Be sure you can explain the meaning of any parameter.
ˬˮ Be sure you can explain why the form of your function makes sense.
11. Cardboard Squares
30
EGADs: Enriching Geometry and Algebra through Data DRAFT • eeps media © 2014
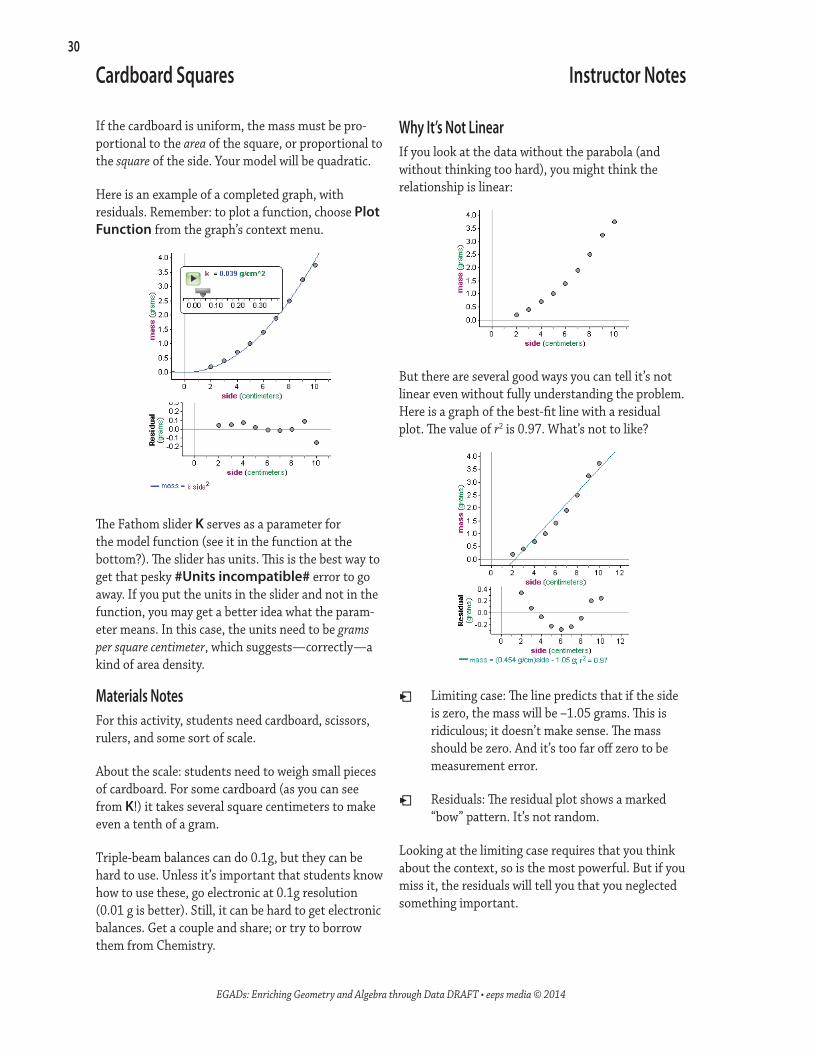
If the cardboard is uniform, the mass must be pro-portional to the area of the square, or proportional to the square of the side. Your model will be quadratic.
Here is an example of a completed graph, with residuals. Remember: to plot a function, choose Plot Function from the graph’s context menu.
The Fathom slider K serves as a parameter for the model function (see it in the function at the bottom?). The slider has units. This is the best way to get that pesky #Units incompatible# error to go away. If you put the units in the slider and not in the function, you may get a better idea what the param-eter means. In this case, the units need to be grams per square centimeter, which suggests—correctly—a kind of area density.
Materials NotesFor this activity, students need cardboard, scissors, rulers, and some sort of scale.
About the scale: students need to weigh small pieces of cardboard. For some cardboard (as you can see from K!) it takes several square centimeters to make even a tenth of a gram.
Triple-beam balances can do 0.1g, but they can be hard to use. Unless it’s important that students know how to use these, go electronic at 0.1g resolution (0.01 g is better). Still, it can be hard to get electronic balances. Get a couple and share; or try to borrow them from Chemistry.
Cardboard Squares Instructor Notes
Why It’s Not LinearIf you look at the data without the parabola (and without thinking too hard), you might think the relationship is linear:
But there are several good ways you can tell it’s not linear even without fully understanding the problem. Here is a graph of the best-fit line with a residual plot. The value of r2 is 0.97. What’s not to like?
ˬˬ Limiting case: The line predicts that if the side is zero, the mass will be –1.05 grams. This is ridiculous; it doesn’t make sense. The mass should be zero. And it’s too far off zero to be measurement error.
ˬˬ Residuals: The residual plot shows a marked “bow” pattern. It’s not random.
Looking at the limiting case requires that you think about the context, so is the most powerful. But if you miss it, the residuals will tell you that you neglected something important.

31
EGADs: Enriching Geometry and Algebra through Data DRAFT • eeps media © 2014
In this activity, we cut circles out of cardboard and weigh them. How does the mass of these squares depend on their size?
What to Do<What you actually do and measure> (See the illustration.)
How will mass be related to diameter (or radius)?
ˬˮ Predict: What do you think the relationship will look like?
ˬˮ Cut out at least six different-sizes circles from cardboard. The cardboard should all be of the same type.
ˬˮ Record measurements of mass and diameter for circles of different sizes.
Find the mass of each cardboard circle (an electronic scale is perfect for this).
Measure each circle’s diameter.
Calculate each radius.
ˬˮ Plot mass against radius.
ˬˮ Find and explain a mathematical function that fits the points. Be sure you can explain the meaning of any parameter.
ˬˮ Be sure you can explain why the form of your function makes sense.
12. Cardboard Circles

32
EGADs: Enriching Geometry and Algebra through Data DRAFT • eeps media © 2014
Here is a set of pretty good data:
This activity is closely related to the cardboard squares activity immediately preceding this one. It’s quadratic for the same reason; if the mass is propor-tional to area, we can express it as
m = Kπr2 .
A successful fit may be simply m = Kr2, of course, but it’s easier to understand the meaning of the param-eter K if you have the π in the formula.
It is worth discussing whether one version of the model is better than another. Students can see that, technically, the fit is just as good either way, but that the π makes the meaning easier to understand.
Notice that if you fix the #units incompatible# problem, the units are the same for each K—grams per square centimeter. But it only means “the mass of one square centimeter” if the π is present.
Radius or Diameter?It’s probably easier to measure diameter and com-pute radius.
In Fathom, make two columns, diameter and radius. Enter the measurements into diameter.
To make radius a calculated column, right-click on the column heading, diameter, and choose Edit For-mula from the context menu. Enter diameter/2 into the formula editor and click OK.
Cardboard Circles Instructor Notes
Materials and ProcedureStudents need cardboard, rulers, scissors, and a scale for weighing the circles. You need at least 0.1 grams resolution.
Students need a way to make the circles. To make fairly circular circles, students can use compasses; round objects they trace (jar lids, containers, etc.); or string attached to pencils. They can also just draw circles by eye, although that creates more variation.
Connecting to the Squares: “Goes Like”If you have time to do both activities—the cardboard squares and this one, with circles—students will get a chance to cement their understanding of quadratic relationships while using very similar data analysis techniques.
Eventually, years down the road, we want students to get to the point where they recognize that these are area situations, and area situations are quadratic. Very experienced students (e.g., graduate students in physics) look at this and say, “goes like r squared.”
Turning it Inside Out: Finding PiIf you have done the squares activity, there is a way to look again at these data from the circles.
If you take the density of the cardboard (sayρ = 0.05g/cm2 ) from the squares activity, and you say, “the mass is proportional to area,” and you see from the data that area is proportional to r2, you could write
m = ρBr2
and vary B until you get a good fit. When you do that, you find the constant that relates area of a circle to the area of the square radius, namely, pi.
(In Fathom, it’s good to make rho a slider.)

33
EGADs: Enriching Geometry and Algebra through Data DRAFT • eeps media © 2014
This activity is about the heights and widths of paragraphs. All of the paragraphs have the same text and the same font size, but they have different widths.
What to DoThe central question: How will height be related to width?
ˬˮ Predict: What do you think the relationship will look like? Actually sketch your prediction for the graph!
ˬˮ Measure the paragraphs with a ruler and record measurements of height and width.
ˬˮ Plot height against width. (Which one belongs on the vertical axis?)
ˬˮ Find and explain a mathematical function that fits the points. Be sure you can explain the meaning of any parameter.
ˬˮ Be sure you can explain why the form of your function makes sense.
13. Paragraphs (Same Font Size)
34
EGADs: Enriching Geometry and Algebra through Data DRAFT • eeps media © 2014
Paragraphs (Same Font Size)
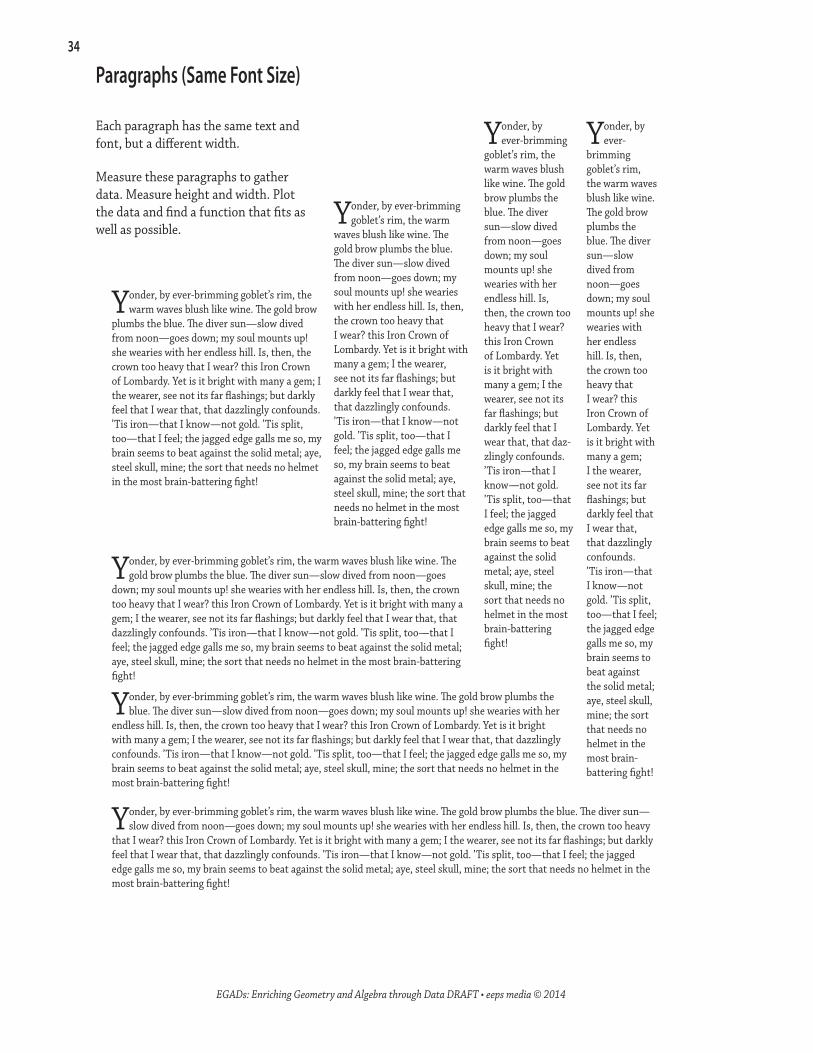
Each paragraph has the same text and font, but a different width.
Measure these paragraphs to gather data. Measure height and width. Plot the data and find a function that fits as well as possible.
Yonder, by ever-brimming goblet’s rim, the warm
waves blush like wine. The gold brow plumbs the blue. The diver sun—slow dived from noon—goes down; my soul mounts up! she wearies with her endless hill. Is, then, the crown too heavy that I wear? this Iron Crown of Lombardy. Yet is it bright with many a gem; I the wearer, see not its far flashings; but darkly feel that I wear that, that dazzlingly confounds. ’Tis iron—that I know—not gold. ’Tis split, too—that I feel; the jagged edge galls me so, my brain seems to beat against the solid metal; aye, steel skull, mine; the sort that needs no helmet in the most brain-battering fight!
Yonder, by ever-
brimming goblet’s rim, the warm waves blush like wine. The gold brow plumbs the blue. The diver sun—slow dived from noon—goes down; my soul mounts up! she wearies with her endless hill. Is, then, the crown too heavy that I wear? this Iron Crown of Lombardy. Yet is it bright with many a gem; I the wearer, see not its far flashings; but darkly feel that I wear that, that dazzlingly confounds. ’Tis iron—that I know—not gold. ’Tis split, too—that I feel; the jagged edge galls me so, my brain seems to beat against the solid metal; aye, steel skull, mine; the sort that needs no helmet in the most brain-battering fight!
Yonder, by ever-brimming goblet’s rim, the warm waves blush like wine. The gold brow plumbs the blue. The diver sun—slow dived from noon—goes down; my soul mounts up! she wearies with her endless hill. Is, then, the crown too heavy
that I wear? this Iron Crown of Lombardy. Yet is it bright with many a gem; I the wearer, see not its far flashings; but darkly feel that I wear that, that dazzlingly confounds. ’Tis iron—that I know—not gold. ’Tis split, too—that I feel; the jagged edge galls me so, my brain seems to beat against the solid metal; aye, steel skull, mine; the sort that needs no helmet in the most brain-battering fight!
Yonder, by ever-brimming
goblet’s rim, the warm waves blush like wine. The gold brow plumbs the blue. The diver sun—slow dived from noon—goes down; my soul mounts up! she wearies with her endless hill. Is, then, the crown too heavy that I wear? this Iron Crown of Lombardy. Yet is it bright with many a gem; I the wearer, see not its far flashings; but darkly feel that I wear that, that daz-zlingly confounds. ’Tis iron—that I know—not gold. ’Tis split, too—that I feel; the jagged edge galls me so, my brain seems to beat against the solid metal; aye, steel skull, mine; the sort that needs no helmet in the most brain-battering fight!
Yonder, by ever-brimming goblet’s rim, the warm waves blush like wine. The gold brow plumbs the blue. The diver sun—slow dived from noon—goes down; my soul mounts up! she wearies with her
endless hill. Is, then, the crown too heavy that I wear? this Iron Crown of Lombardy. Yet is it bright with many a gem; I the wearer, see not its far flashings; but darkly feel that I wear that, that dazzlingly confounds. ’Tis iron—that I know—not gold. ’Tis split, too—that I feel; the jagged edge galls me so, my brain seems to beat against the solid metal; aye, steel skull, mine; the sort that needs no helmet in the most brain-battering fight!
Yonder, by ever-brimming goblet’s rim, the warm waves blush like wine. The gold brow plumbs the blue. The diver sun—slow dived from noon—goes
down; my soul mounts up! she wearies with her endless hill. Is, then, the crown too heavy that I wear? this Iron Crown of Lombardy. Yet is it bright with many a gem; I the wearer, see not its far flashings; but darkly feel that I wear that, that dazzlingly confounds. ’Tis iron—that I know—not gold. ’Tis split, too—that I feel; the jagged edge galls me so, my brain seems to beat against the solid metal; aye, steel skull, mine; the sort that needs no helmet in the most brain-battering fight!
Yonder, by ever-brimming goblet’s rim, the warm waves blush like wine. The gold brow
plumbs the blue. The diver sun—slow dived from noon—goes down; my soul mounts up! she wearies with her endless hill. Is, then, the crown too heavy that I wear? this Iron Crown of Lombardy. Yet is it bright with many a gem; I the wearer, see not its far flashings; but darkly feel that I wear that, that dazzlingly confounds. ’Tis iron—that I know—not gold. ’Tis split, too—that I feel; the jagged edge galls me so, my brain seems to beat against the solid metal; aye, steel skull, mine; the sort that needs no helmet in the most brain-battering fight!
35
EGADs: Enriching Geometry and Algebra through Data DRAFT • eeps media © 2014
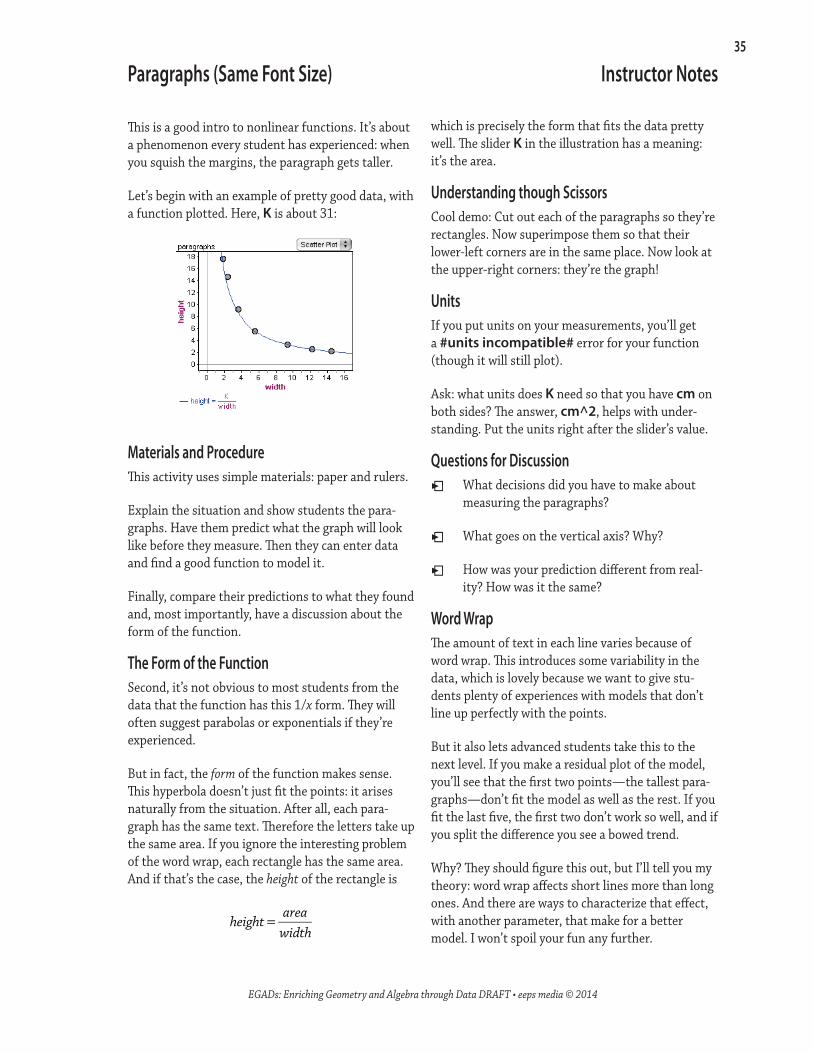
which is precisely the form that fits the data pretty well. The slider K in the illustration has a meaning: it’s the area.
Understanding though ScissorsCool demo: Cut out each of the paragraphs so they’re rectangles. Now superimpose them so that their lower-left corners are in the same place. Now look at the upper-right corners: they’re the graph!
UnitsIf you put units on your measurements, you’ll get a #units incompatible# error for your function (though it will still plot).
Ask: what units does K need so that you have cm on both sides? The answer, cm^2, helps with under-standing. Put the units right after the slider’s value.
Questions for Discussionˬˬ What decisions did you have to make about
measuring the paragraphs?
ˬˬ What goes on the vertical axis? Why?
ˬˬ How was your prediction different from real-ity? How was it the same?
Word WrapThe amount of text in each line varies because of word wrap. This introduces some variability in the data, which is lovely because we want to give stu-dents plenty of experiences with models that don’t line up perfectly with the points.
But it also lets advanced students take this to the next level. If you make a residual plot of the model, you’ll see that the first two points—the tallest para-graphs—don’t fit the model as well as the rest. If you fit the last five, the first two don’t work so well, and if you split the difference you see a bowed trend.
Why? They should figure this out, but I’ll tell you my theory: word wrap affects short lines more than long ones. And there are ways to characterize that effect, with another parameter, that make for a better model. I won’t spoil your fun any further.
Paragraphs (Same Font Size) Instructor Notes
This is a good intro to nonlinear functions. It’s about a phenomenon every student has experienced: when you squish the margins, the paragraph gets taller.
Let’s begin with an example of pretty good data, with a function plotted. Here, K is about 31:
Materials and ProcedureThis activity uses simple materials: paper and rulers.
Explain the situation and show students the para-graphs. Have them predict what the graph will look like before they measure. Then they can enter data and find a good function to model it.
Finally, compare their predictions to what they found and, most importantly, have a discussion about the form of the function.
The Form of the FunctionSecond, it’s not obvious to most students from the data that the function has this 1/x form. They will often suggest parabolas or exponentials if they’re experienced.
But in fact, the form of the function makes sense. This hyperbola doesn’t just fit the points: it arises naturally from the situation. After all, each para-graph has the same text. Therefore the letters take up the same area. If you ignore the interesting problem of the word wrap, each rectangle has the same area. And if that’s the case, the height of the rectangle is
height = areawidth

36
EGADs: Enriching Geometry and Algebra through Data DRAFT • eeps media © 2014
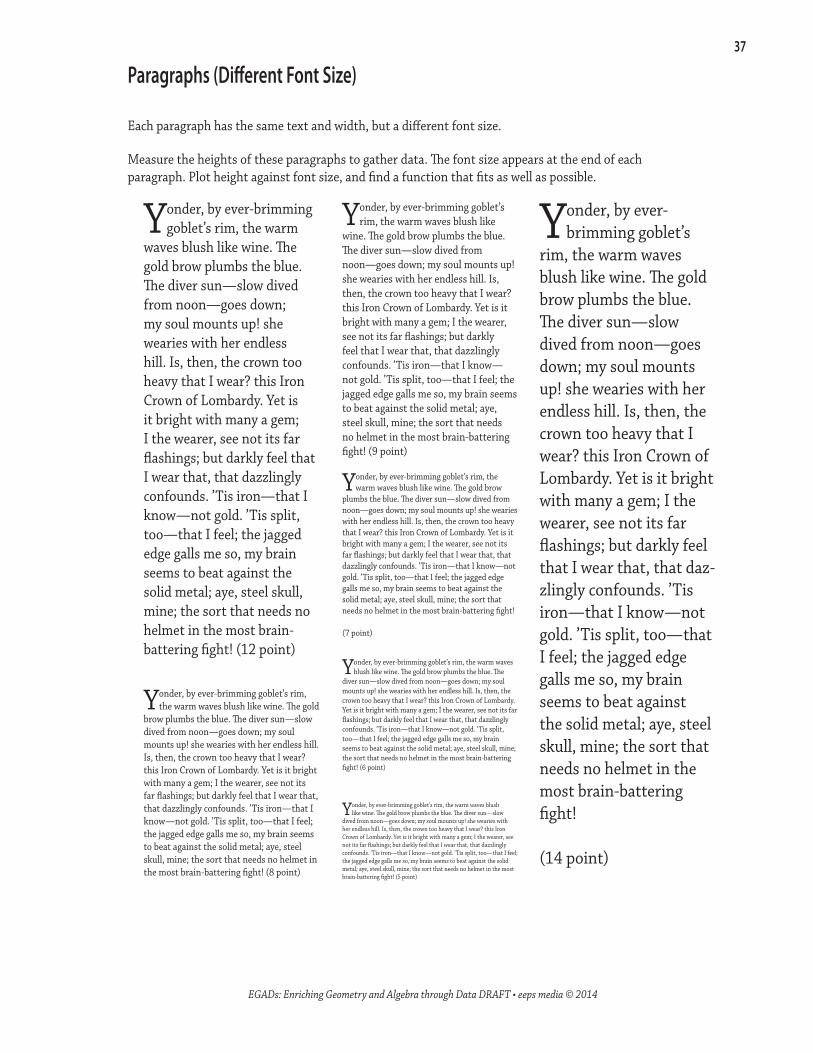
This activity is about the heights and widths of paragraphs. All of the paragraphs have the same text and the same width, but they have different font sizes.
What to DoHow will height be related to fontSize?
ˬˮ Predict: What do you think the relationship will look like? Sketch the graph you think you’ll get as accurately as possible:
ˬˮ Record measurements of height and fontSize.
ˬˮ Plot height against fontSize. (Which one belongs on the vertical axis?)
ˬˮ Find and explain a mathematical function that fits the points. Be sure you can explain the meaning of any parameter.
ˬˮ Be sure you can explain why the form of your function makes sense.
14. Paragraphs (Different Font Size)
37
EGADs: Enriching Geometry and Algebra through Data DRAFT • eeps media © 2014
Paragraphs (Different Font Size)
Each paragraph has the same text and width, but a different font size.
Measure the heights of these paragraphs to gather data. The font size appears at the end of each paragraph. Plot height against font size, and find a function that fits as well as possible.
Yonder, by ever-brimming goblet’s rim, the warm waves blush like
wine. The gold brow plumbs the blue. The diver sun—slow dived from noon—goes down; my soul mounts up! she wearies with her endless hill. Is, then, the crown too heavy that I wear? this Iron Crown of Lombardy. Yet is it bright with many a gem; I the wearer, see not its far flashings; but darkly feel that I wear that, that dazzlingly confounds. ’Tis iron—that I know—not gold. ’Tis split, too—that I feel; the jagged edge galls me so, my brain seems to beat against the solid metal; aye, steel skull, mine; the sort that needs no helmet in the most brain-battering fight! (9 point)
Yonder, by ever-brimming goblet’s rim, the warm
waves blush like wine. The gold brow plumbs the blue. The diver sun—slow dived from noon—goes down; my soul mounts up! she wearies with her endless hill. Is, then, the crown too heavy that I wear? this Iron Crown of Lombardy. Yet is it bright with many a gem; I the wearer, see not its far flashings; but darkly feel that I wear that, that dazzlingly confounds. ’Tis iron—that I know—not gold. ’Tis split, too—that I feel; the jagged edge galls me so, my brain seems to beat against the solid metal; aye, steel skull, mine; the sort that needs no helmet in the most brain-battering fight! (12 point)
Yonder, by ever-brimming goblet’s
rim, the warm waves blush like wine. The gold brow plumbs the blue. The diver sun—slow dived from noon—goes down; my soul mounts up! she wearies with her endless hill. Is, then, the crown too heavy that I wear? this Iron Crown of Lombardy. Yet is it bright with many a gem; I the wearer, see not its far flashings; but darkly feel that I wear that, that daz-zlingly confounds. ’Tis iron—that I know—not gold. ’Tis split, too—that I feel; the jagged edge galls me so, my brain seems to beat against the solid metal; aye, steel skull, mine; the sort that needs no helmet in the most brain-battering fight! (14 point)
Yonder, by ever-brimming goblet’s rim, the warm waves blush like wine. The gold
brow plumbs the blue. The diver sun—slow dived from noon—goes down; my soul mounts up! she wearies with her endless hill. Is, then, the crown too heavy that I wear? this Iron Crown of Lombardy. Yet is it bright with many a gem; I the wearer, see not its far flashings; but darkly feel that I wear that, that dazzlingly confounds. ’Tis iron—that I know—not gold. ’Tis split, too—that I feel; the jagged edge galls me so, my brain seems to beat against the solid metal; aye, steel skull, mine; the sort that needs no helmet in the most brain-battering fight! (8 point)
Yonder, by ever-brimming goblet’s rim, the warm waves blush like wine. The gold brow
plumbs the blue. The diver sun—slow dived from noon—goes down; my soul mounts up! she wearies with her endless hill. Is, then, the crown too heavy that I wear? this Iron Crown of Lombardy. Yet is it bright with many a gem; I the wearer, see not its far flashings; but darkly feel that I wear that, that dazzlingly confounds. ’Tis iron—that I know—not gold. ’Tis split, too—that I feel; the jagged edge galls me so, my brain seems to beat against the solid metal; aye, steel skull, mine; the sort that needs no helmet in the most brain-battering fight! (7 point)
Yonder, by ever-brimming goblet’s rim, the warm waves blush like wine. The gold brow plumbs the blue. The
diver sun—slow dived from noon—goes down; my soul mounts up! she wearies with her endless hill. Is, then, the crown too heavy that I wear? this Iron Crown of Lombardy. Yet is it bright with many a gem; I the wearer, see not its far flashings; but darkly feel that I wear that, that dazzlingly confounds. ’Tis iron—that I know—not gold. ’Tis split, too—that I feel; the jagged edge galls me so, my brain seems to beat against the solid metal; aye, steel skull, mine; the sort that needs no helmet in the most brain-battering fight! (6 point)
Yonder, by ever-brimming goblet’s rim, the warm waves blush like wine. The gold brow plumbs the blue. The diver sun—slow
dived from noon—goes down; my soul mounts up! she wearies with her endless hill. Is, then, the crown too heavy that I wear? this Iron Crown of Lombardy. Yet is it bright with many a gem; I the wearer, see not its far flashings; but darkly feel that I wear that, that dazzlingly confounds. ’Tis iron—that I know—not gold. ’Tis split, too—that I feel; the jagged edge galls me so, my brain seems to beat against the solid metal; aye, steel skull, mine; the sort that needs no helmet in the most brain-battering fight! (5 point)

38
EGADs: Enriching Geometry and Algebra through Data DRAFT • eeps media © 2014
Sample Data and ModelHere is an example of pretty good data and a pretty good model. Heights are in centimeters. The value of K is 0.082.
Questions for Discussionˬˬ How was your prediction different from real-
ity? How was it the same?
ˬˬ In our analysis, we forgot all about width. But isn’t area still height times width? Where does width fit in here?
ˬˬ Explain clearly why it makes sense for this model to be quadratic.
ˬˬ What does the parameter mean here? (This is not at all clear! Units analysis will help some.)
ExtensionYou can turn these font-size problems into mini-proj-ects. Here’s one idea: suppose you do these activities in different fonts. You’ll get different values for the parameters. What do the different values mean?
Paragraphs (Different Font Size) Instructor Notes
This is a good follow-up activity to “13. Paragraphs (Same Font Size)” on page 33. It works exactly the same way except that we’re looking at paragraphs of the same width but different font sizes.
Can we apply the reasoning from that activity here? Can we think first and then choose a functional form? Here is some reasoning we hope students can make on their own:
Last time, we reasoned that the area was the same for every paragraph. But that’s not the case here, because the font size changes. 14-point characters are bigger than 7-point characters, so the 14-point paragraph will have a greater area.
How much greater? A 14-point “M” is twice as high as a 7-point “M.” So should the 14-point paragraph be twice as tall? But look! It’s taller than that.
That’s because that M is twice as tall—and twice as wide. Which means that the characters in the 14 take up four times the area as the ones in the 7.
So when you double the font, you quadruple the area. And that quadruples the height here. So the height should be like the font size squared.
This is much more sophisticated than the same-font-size activity, even though the function will be more familiar to most students. It’s good reasoning experi-ence; we want students to develop the “goes-like” intuition that will help them generalize the specific example of 7- and 14-point text to the quadratic function.
Many students will not fully get the reasoning even if they successfully guessed the quadratic form. That’s OK. This is a step along the way.
39
EGADs: Enriching Geometry and Algebra through Data DRAFT • eeps media © 2014
15. Chord Star
This activity is about the length of segments that make up chords. A chord is a line segment that connects two points on a circle.
What You Will DrawWhen you’re ready, make a pretty big circle and place a point in it. The point should not be near the center, but it should also not be too close to the edge.
Then draw a chord through that point. The point divides the chord into two segments. You’ll measure both lengths. We’ll call these L1 and L2.
Then make another chord through the same point and measure its segment lengths. They’ll be the next L1 and L2.
Continue until you have at least six chords.
What to DoHow will L1 be related to L2?
ˬˮ Before you start drawing and measuring carefully, sketch a circle and a point, draw some chords, and predict: What do you think the relationship between L1 and L2 will look like? Sketch the graph you think you’ll get:
ˬˮ Do the actual drawing (described above) and record measurements of L1 and L2.
ˬˮ Plot L1 against L2. (Which one belongs on the vertical axis?)
ˬˮ Find and explain a mathematical function that fits the points. Be sure you can explain the meaning of any parameter.
ˬˮ Use algebra on your function in order to get L1 and L2 on the same side of the equals sign. Explain how it can be that this relationship is true for all of the chords.

40
EGADs: Enriching Geometry and Algebra through Data DRAFT • eeps media © 2014
A ProofIt’s all similar triangles. The illustration shows two chords, AZ and BY, intersecting at P.
We construct rays BA! "!
and ZY! "!!
. Now we can see that the two angles, ABY and AZY, both intercept arc AY!—so the two angles have the same measure (This proof hinges on that fact). Vertical angles at P give us a second congruent angle, so we have shown that △APB is similar to △YPZ. That means that
ab= yz
or az = by. Since this doesn’t depend on the choice of chords, The product is the same for any chords passing through point P. If you overlay graphs from different points—but the same size circle, you get hyperbolas with different constants.
That is, what the product is depends on the posi-tion of point P. And that is the subject of the next investigation.
Chord Star (Instructor Notes)
In this activity, the data and the model are straight-forward. If you choose a point not too close to the center (as suggested), a clear inverse proportion leaps out of the data.
But unless students have studied geometry—and remember this theorem—they probably won’t pre-dict it. It will probably come as a surprise. Even when your data suggest that L1L2 is a constant, it’s hard to believe, just looking at the circle.
Unlike in “Paragraphs (Same Font Size)” on page 33—which is also inverse proportion because the two values are height and width of a rectangle—there’s no obvious geometrical reason that the two lengths that make up of a chord should have the same product no matter which chord you draw. And, interestingly, it’s not easy to get insight by looking at extreme values. The illustration shows two chords, AZ and BY, intersecting at P.
What Can Go WrongIf you pick a point too close to the center, the partial-chords will all be about one radius long, and you won’t get much variability. If you pick one too close to the circle, the short segments get hard to measure accurately.
Sample Data and ModelHere is a Fathom graph of a pretty good set of data. Notice the scale in the residual plot.

41
EGADs: Enriching Geometry and Algebra through Data DRAFT • eeps media © 2014
This activity requires familiarity with “Chord Star” on page 39—or at least the amazing fact behind it. Here’s the fact: imagine a circle with a point inside it. Call that point P. Now draw a chord through that point. The point divides the chord into two lengths, L1 and L2. The miracle is that the product of those two numbers, L1L2, is the same no matter which chord you draw.
The actual value of that product, however, depends on the circle and where you put the point.
What You Will Draw
You have to figure that out. Your goal is to figure out the relationship between the product and the dis-tance of the point from the center of the circle. This assumes that you keep the size of the circle constant!
What to DoRemember:
ˬˬ product is the value of L1L2, the product of the lengths of the parts of the chord split by your point.
ˬˬ distance is the distance of the point from the center of the circle.
How will product be related to distance?
ˬˮ Make a prediction! Sketch a circle, draw some chords, and predict: What do you think the relationship between product and distance will look like? Sketch the graph you think you’ll get. (Hint: even without measuring, you can figure out the value of product for some special distances.)
ˬˮ Find values for the product for at least six values of distance. Record your data.
ˬˮ Plot product against distance. (Which one belongs on the vertical axis?)
ˬˮ Find and explain a mathematical function that fits the points. Be sure you can explain the meaning of any parameter.
ˬˮ Compare your results to your prediction. How did you do? What was right about your prediction? What could you have known? Any surprises?
16. Chord Star 2
42
EGADs: Enriching Geometry and Algebra through Data DRAFT • eeps media © 2014
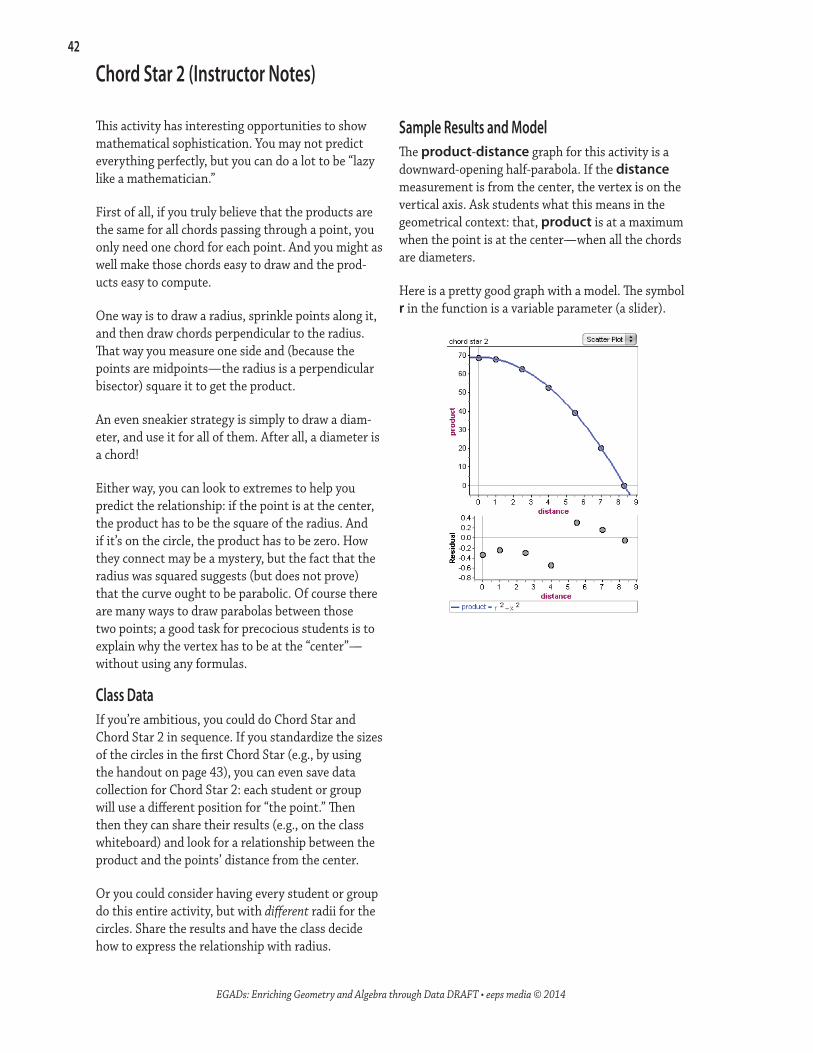
Sample Results and ModelThe product-distance graph for this activity is a downward-opening half-parabola. If the distance measurement is from the center, the vertex is on the vertical axis. Ask students what this means in the geometrical context: that, product is at a maximum when the point is at the center—when all the chords are diameters.
Here is a pretty good graph with a model. The symbol r in the function is a variable parameter (a slider).
This activity has interesting opportunities to show mathematical sophistication. You may not predict everything perfectly, but you can do a lot to be “lazy like a mathematician.”
First of all, if you truly believe that the products are the same for all chords passing through a point, you only need one chord for each point. And you might as well make those chords easy to draw and the prod-ucts easy to compute.
One way is to draw a radius, sprinkle points along it, and then draw chords perpendicular to the radius. That way you measure one side and (because the points are midpoints—the radius is a perpendicular bisector) square it to get the product.
An even sneakier strategy is simply to draw a diam-eter, and use it for all of them. After all, a diameter is a chord!
Either way, you can look to extremes to help you predict the relationship: if the point is at the center, the product has to be the square of the radius. And if it’s on the circle, the product has to be zero. How they connect may be a mystery, but the fact that the radius was squared suggests (but does not prove) that the curve ought to be parabolic. Of course there are many ways to draw parabolas between those two points; a good task for precocious students is to explain why the vertex has to be at the “center”—without using any formulas.
Class DataIf you’re ambitious, you could do Chord Star and Chord Star 2 in sequence. If you standardize the sizes of the circles in the first Chord Star (e.g., by using the handout on page 43), you can even save data collection for Chord Star 2: each student or group will use a different position for “the point.” Then then they can share their results (e.g., on the class whiteboard) and look for a relationship between the product and the points’ distance from the center.
Or you could consider having every student or group do this entire activity, but with different radii for the circles. Share the results and have the class decide how to express the relationship with radius.
Chord Star 2 (Instructor Notes)
43
EGADs: Enriching Geometry and Algebra through Data DRAFT • eeps media © 2014
Circle for Chord Star
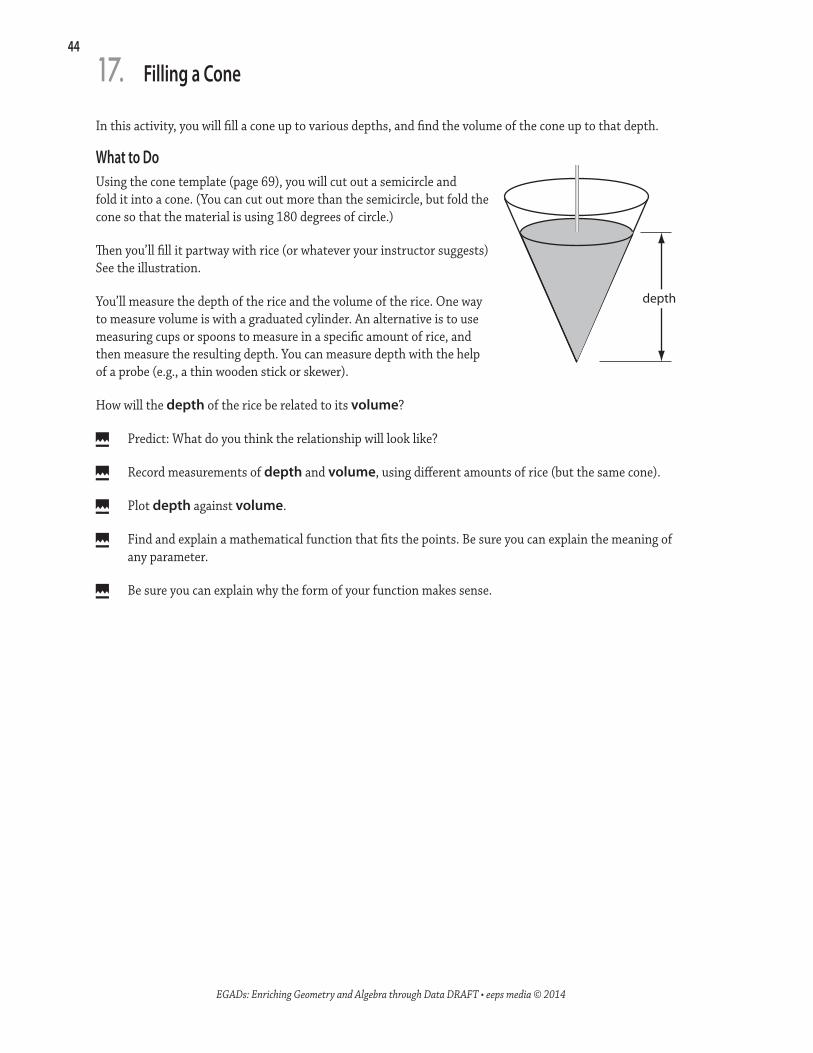
44
EGADs: Enriching Geometry and Algebra through Data DRAFT • eeps media © 2014
In this activity, you will fill a cone up to various depths, and find the volume of the cone up to that depth.
What to DoUsing the cone template (page 69), you will cut out a semicircle and fold it into a cone. (You can cut out more than the semicircle, but fold the cone so that the material is using 180 degrees of circle.)
Then you’ll fill it partway with rice (or whatever your instructor suggests) See the illustration.
You’ll measure the depth of the rice and the volume of the rice. One way to measure volume is with a graduated cylinder. An alternative is to use measuring cups or spoons to measure in a specific amount of rice, and then measure the resulting depth. You can measure depth with the help of a probe (e.g., a thin wooden stick or skewer).
How will the depth of the rice be related to its volume?
ˬˮ Predict: What do you think the relationship will look like?
ˬˮ Record measurements of depth and volume, using different amounts of rice (but the same cone).
ˬˮ Plot depth against volume.
ˬˮ Find and explain a mathematical function that fits the points. Be sure you can explain the meaning of any parameter.
ˬˮ Be sure you can explain why the form of your function makes sense.
depth
17. Filling a Cone

45
EGADs: Enriching Geometry and Algebra through Data DRAFT • eeps media © 2014
<under what circumstances would you plot this the other way round? xxx <model may not work for small cones. Why not? Which direction?>
Extensions and AlternativesIn this activity, as written, you find the depth for different volumes, holding the shape of the cone (the angle of the sector from which it was made—180°)constant. But you could hold the volume constant and use different “degrees” of cone. Just make differ-ent cones using the cone template.
It is possible to get commercial measuring cups that are more or less cone shaped. Therefore the depth-volume relationship will be similar. How will it be different? Predict, then measure.
Filling a Cone Instructor Notes
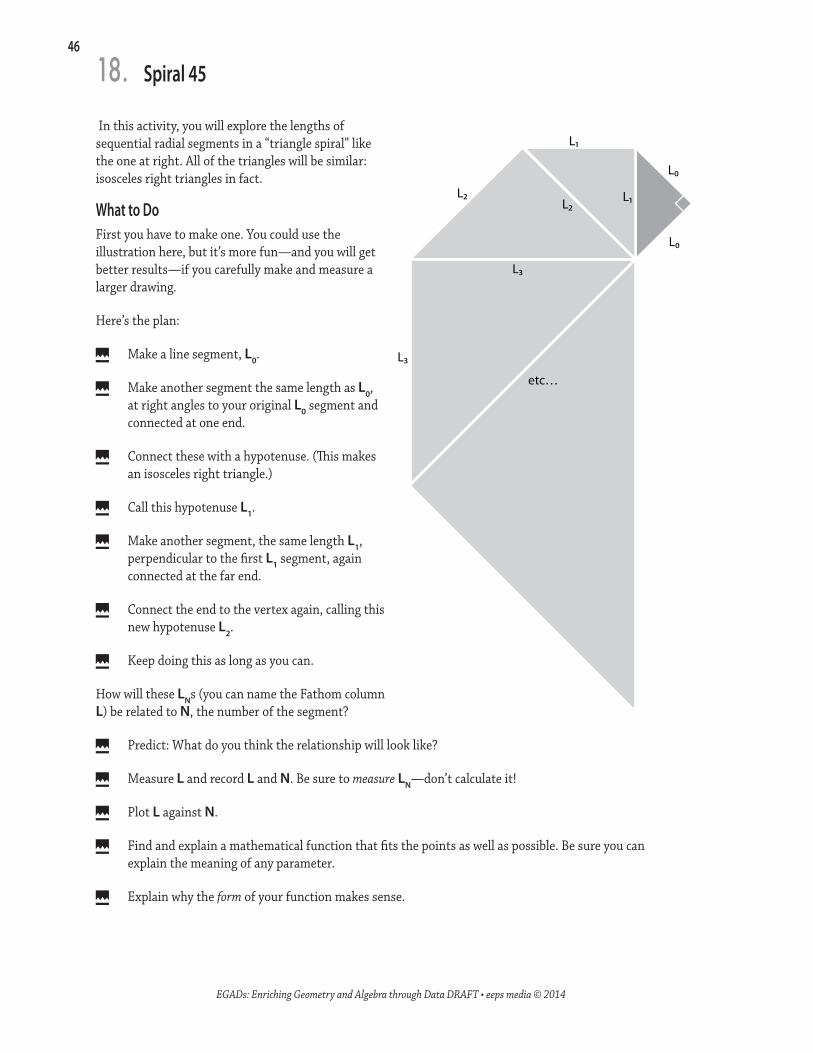
46
EGADs: Enriching Geometry and Algebra through Data DRAFT • eeps media © 2014
In this activity, you will explore the lengths of sequential radial segments in a “triangle spiral” like the one at right. All of the triangles will be similar: isosceles right triangles in fact.
What to DoFirst you have to make one. You could use the illustration here, but it’s more fun—and you will get better results—if you carefully make and measure a larger drawing.
Here’s the plan:
ˬˮ Make a line segment, L0.
ˬˮ Make another segment the same length as L0, at right angles to your original L0 segment and connected at one end.
ˬˮ Connect these with a hypotenuse. (This makes an isosceles right triangle.)
ˬˮ Call this hypotenuse L1.
ˬˮ Make another segment, the same length L1, perpendicular to the first L1 segment, again connected at the far end.
ˬˮ Connect the end to the vertex again, calling this new hypotenuse L2.
ˬˮ Keep doing this as long as you can.
How will these LNs (you can name the Fathom column L) be related to N, the number of the segment?
ˬˮ Predict: What do you think the relationship will look like?
ˬˮ Measure L and record L and N. Be sure to measure LN—don’t calculate it!
ˬˮ Plot L against N.
ˬˮ Find and explain a mathematical function that fits the points as well as possible. Be sure you can explain the meaning of any parameter.
ˬˮ Explain why the form of your function makes sense.
L0
L0
L1
L1
L2L2
L3
L3
etc…
18. Spiral 45
47
EGADs: Enriching Geometry and Algebra through Data DRAFT • eeps media © 2014
If students have a lot of experience with 45-45-90 triangles, they may naturally recognize that the hypotenuse is always 2 times the base, so the lengths of these segments will be
L Ln
n= ( )0 2 ,
which is correct.
Of course, most students won’t have that epiphany quite so fast. What are other routes to understanding?
First, students may notice that if you skip a triangle, the numbers roughly double, that is, L3 is about twice L1, L4 is about twice L2, and so forth. And for some students, this may be enough.
If they have any experience with exponential functions, however, you can take that observation and help them find, for example, a formula for the even-numbered lengths.
If students think it just looks exponential, they could use a standard formula such as
L Arnn=
and use sliders to figure out A and r.
With a little more experience, you can help students reason that since the triangles are similar, the ratio of hypotenuse-to-leg cascades upwards around the spiral. If we call that ratio r, we see that L1 = H0 = rL0; L2 = H1 = rL1 = r2L0, and so forth.
If students do not see that r must be 2, they can model the data with Fathom, making r a slider. When they get r ~ 1.41, you can now ask what the signifi-cance of that number is.
Spiral 45 Instructor Notes
Should the Initial Leg be a Slider?You might think that since the length of the initial leg (L0) is really a constant, you should just type in the number instead of making it into a slider parameter.
It turns out to be better to make it a parameter just like the ratio r. Like so much of our data, it’s a measurement, and you can never measure it per-fectly. You might even be able to get a better estimate for that length looking at the whole relationship between L and N than you can by simply measuring.
An alternative is to use the first measurement as that parameter instead of typing in the number or making a slider. To do that, use the Fathom formula first(L), that is,
L = first(L) * sqrt(2)^N
should be a pretty good model—but then you don’t get to tweak any parameters if it doesn’t fit!
Why Start at Zero?That is, why s our first leg L0 instead of L1?
This is a good question for experienced students. The answer is, it’s for convenience, so that when n is in the exponent, the power term is “1” the first time through. In contrast, if you started at 1, the obvious answer would have to be
L Ln
n= ( ) −
1
12 ,
which is a less elegant and makes you wonder where the –1 came from in the exponent.
48
EGADs: Enriching Geometry and Algebra through Data DRAFT • eeps media © 2014
In this activity, you will explore the lengths of sequential radial segments in a “triangle spiral” like the one in the previous set (Spiral 45) but with a different angle.
What to DoFirst you have to complete your spiral. It’s started on page ppp.
See how it’s constructed? First, there is a fan of evenly-spaced rays radiating from the center.
The first triangle is done for you, D0. It’s a right triangle with a long leg L0 and short leg S0. They meet at a right angle at point P0. The hypotenuse is L1, which is also the long leg of the next triangle.
Then we constructed a perpendicular to L1 at P1. That intersected the next ray at P2. The distance P1P2 is S1, the length of the short leg of triangle D1.
ˬˮ Make the rest of the figure by constructing perpendiculars, finding the next vertices, and making the short legs.
ˬˮ Label the L’s and the S’s.
ˬˮ Prepare a table with headings N (the number of the triangle), L, and S.
How will L, N, and S be related?
ˬˮ Predict: What do you think the relationships will look like?
ˬˮ Measure L and S and record L, S, and N. Be sure to measure LN and SN—don’t calculate them!
ˬˮ Plot L against S (do this one first!), L against N, and S against N.
ˬˮ For L against N, the data look linear, but they are not. How can you tell?
ˬˮ For each graph, find and explain a mathematical function that fits the points as well as possible.
ˬˮ Be sure you can explain the meaning of any parameter.
Hint: It helps to make a slider for L0, the long leg in the first triangle. This is in addition to sliders for any parameters.
ˬˮ Explain why the form of your functions makes sense.
ˬˮ Why do you suppose we started at zero instead of one?
ˬˮ Explain why the points do not lie exactly on your functions.
19. Spiral 20

49
EGADs: Enriching Geometry and Algebra through Data DRAFT • eeps media © 2014
90°90°
L0
S0
L1
S1
L2
P0P1
P2
∆0

50
EGADs: Enriching Geometry and Algebra through Data DRAFT • eeps media © 2014
If Spiral 45 is too easy for your students, try this one. The comments for that activity apply here, except that instead of the square root of 2, the relevant exponential factor is the secant of 20°, the repeated small angle at the center of the figure.
That value is about 1.064.
Sample ResultHere is a graph showing L (the long leg) as a func-tion of N. The slider values are L0 = 8.241 cm and R = 1.0627.
6789
101112131415
N0 2 4 6 8 10
L = L0R N
-0.10
0.00
0.10
0 2 4 6 8 10N
Spiral20 Scatter Plot
Notice several things:
ˬˬ We did not record the data for every segment. Does that matter? No.
ˬˬ The best slider value is not the same at the theoretical value, and that’s OK too. It’s close enough.
ˬˬ The residual plot shows that all of our measure-ments are within 1 mm of the model, which is about the best we can ask.
Spiral 20 Instructor Notes

51
EGADs: Enriching Geometry and Algebra through Data DRAFT • eeps media © 2014
In this activity, you will explore the lengths of sequential radial segments in a “triangle spiral” like the one at right. This is kind of like Spiral 45 (page 46) except that this time the triangles are not similar.
What to DoMake your own spiral. Again, you could use the illustra-tion here, but you will get better results with a bigger drawing.
Here’s the plan:
ˬˮ Make a line segment, L1.
ˬˮ Make segment K, the same length as L1, at right angles to L1 and connected at one end.
ˬˮ Connect these with a hypotenuse. (This makes an isosceles right triangle.)
ˬˮ Call this hypotenuse L2.
ˬˮ Make another segment perpendicular to L2 at the “far” end. Make its length K, the same as in the first triangle (not L2).
ˬˮ Connect the end to the vertex again, calling this new hypotenuse L3.
ˬˮ Keep doing this as long as you can.
How will the length LN be related to the number of the segment N?
ˬˮ Predict: What do you think the relationship will look like?
ˬˮ Measure the various L’s and record L and N in two columns.
ˬˮ Plot L against N.
ˬˮ Find and explain a mathematical model that fits the points. Be sure you can explain the meaning of any parameter.
ˬˮ Be sure you can explain why the form of your function makes sense.
L₁
L₂
L₃L₄
KK
K
K
(etc.)
20. Triangle Spiral
Note: you may want to create a recursive formula for a predicted value for L (Lpred, say) instead of an analytic formula. Plot it on the same graph as L. If you want residuals, calculate them yourself.
A recursive formula for Lpred will use the previ-ous value of Lpred in the formula instead of N. In Fathom, you can use the function prev(Lpred) to get the previous value.
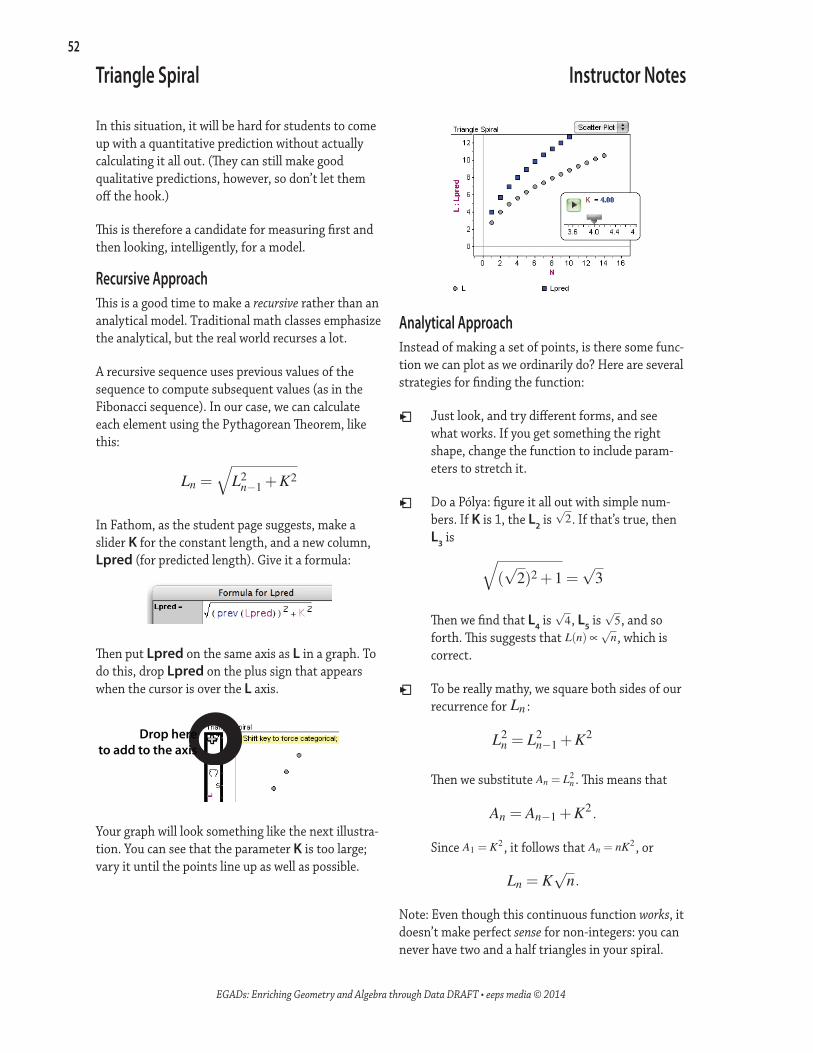
52
EGADs: Enriching Geometry and Algebra through Data DRAFT • eeps media © 2014
In this situation, it will be hard for students to come up with a quantitative prediction without actually calculating it all out. (They can still make good qualitative predictions, however, so don’t let them off the hook.)
This is therefore a candidate for measuring first and then looking, intelligently, for a model.
Recursive ApproachThis is a good time to make a recursive rather than an analytical model. Traditional math classes emphasize the analytical, but the real world recurses a lot.
A recursive sequence uses previous values of the sequence to compute subsequent values (as in the Fibonacci sequence). In our case, we can calculate each element using the Pythagorean Theorem, like this:
Ln =√
L2n−1 +K2
In Fathom, as the student page suggests, make a slider K for the constant length, and a new column, Lpred (for predicted length). Give it a formula:
Then put Lpred on the same axis as L in a graph. To do this, drop Lpred on the plus sign that appears when the cursor is over the L axis.
Drop hereto add to the axis
Your graph will look something like the next illustra-tion. You can see that the parameter K is too large; vary it until the points line up as well as possible.
Triangle Spiral Instructor Notes
Analytical ApproachInstead of making a set of points, is there some func-tion we can plot as we ordinarily do? Here are several strategies for finding the function:
ˬˬ Just look, and try different forms, and see what works. If you get something the right shape, change the function to include param-eters to stretch it.
ˬˬ Do a Pólya: figure it all out with simple num-bers. If K is 1, the L2 is
√2. If that’s true, then
L3 is √
(√
2)2 +1 =√
3
Then we find that L4 is √
4, L5 is √
5, and so forth. This suggests that L(n) ∝
√n, which is
correct.
ˬˬ To be really mathy, we square both sides of our recurrence for Ln :
L2n = L2
n−1 +K2
Then we substitute An = L2n . This means that
An = An−1 +K2 .
Since A1 = K2 , it follows that An = nK2 , or
Ln = K√
n .
Note: Even though this continuous function works, it doesn’t make perfect sense for non-integers: you can never have two and a half triangles in your spiral.

53
EGADs: Enriching Geometry and Algebra through Data DRAFT • eeps media © 2014
This activity is closely related to Triangle Spiral (page 51) except that it goes backwards. This presents chal-lenges both in construction and data analysis.
What to Do<what you actually do and measure> (See the illustration.)
How will yyy be related to xxx?
ˬˮ Predict: What do you think the relationship will look like?
ˬˮ Record measurements of yyy and xxx, <tilting the chair different amounts between measurements.>
ˬˮ Plot yyy against xxx.
ˬˮ Find and explain a mathematical function that fits the points. Be sure you can explain the meaning of any parameter.
ˬˮ Be sure you can explain why the form of your function makes sense.
21. Spiral Decay

54
EGADs: Enriching Geometry and Algebra through Data DRAFT • eeps media © 2014
Spiral Decay Instructor Notes

55
EGADs: Enriching Geometry and Algebra through Data DRAFT • eeps media © 2014
Have you played with Tinkertoys®? If you have, you may have noticed that the colors of the sticks always correspond to length. Orange is shortest, then yellow, blue, red, green, and finally purple, the longest.
What is the relationship of the lengths of one color to the next?
What to Doˬˮ Get some Tinkertoy sticks and measure them.
ˬˮ Record color and length. It’s good to have multiple measurements (for example, if you have several blue sticks—they might not all be exactly the same length.
ˬˮ Invent a numerical code for color (e.g., orange = 0, yellow = 1, etc.). Call it colorCode, and enter those values as well. Your code should be in order, of course!
How will length be related to colorCode?
ˬˮ Predict: What do you think the relationship will look like?
ˬˮ Plot length against colorCode.
ˬˮ Find and explain a mathematical function that fits the points as well as possible. Be sure you can explain the meaning of any parameter.
ˬˮ Be sure you can explain why the form of your function makes sense.
ˬˮ If there were a longer stick than purple, how long would it be?
ˬˮ If there were a shorter stick than orange, how short would it be?
Big Huge HintMake triangles out of Tinkertoys.
22. Tinkertoy Stick Lengths
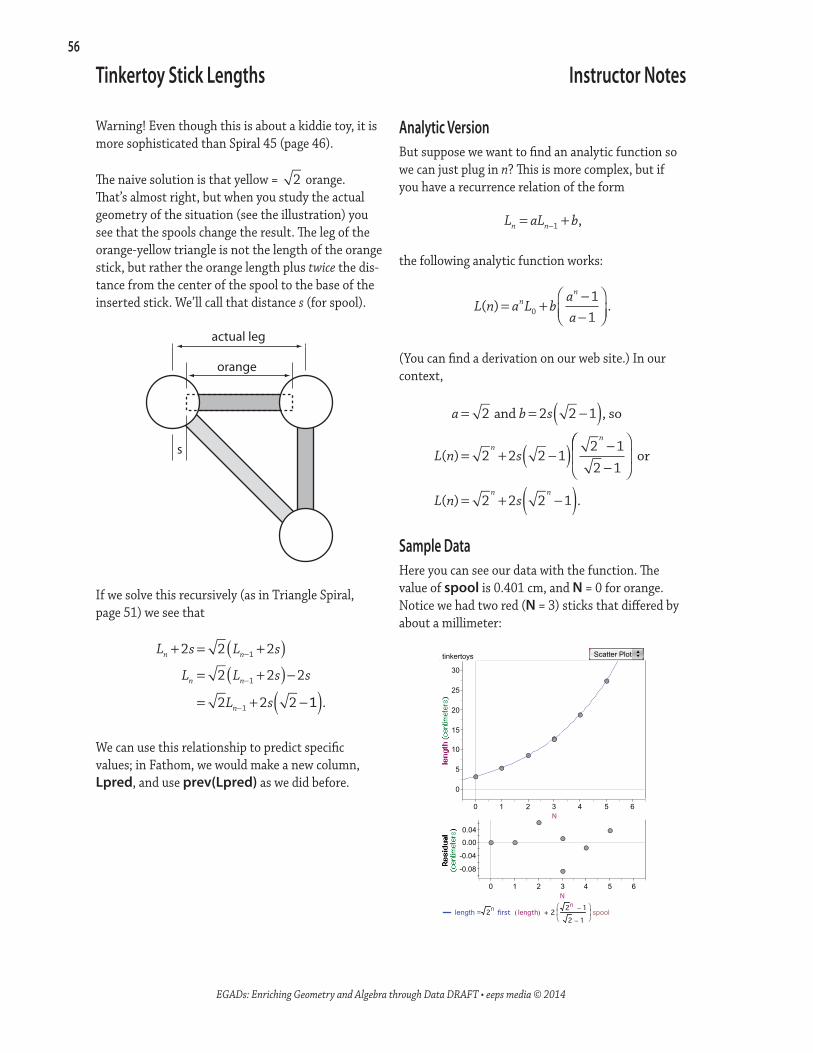
56
EGADs: Enriching Geometry and Algebra through Data DRAFT • eeps media © 2014
Warning! Even though this is about a kiddie toy, it is more sophisticated than Spiral 45 (page 46).
The naive solution is that yellow = 2 orange. That’s almost right, but when you study the actual geometry of the situation (see the illustration) you see that the spools change the result. The leg of the orange-yellow triangle is not the length of the orange stick, but rather the orange length plus twice the dis-tance from the center of the spool to the base of the inserted stick. We’ll call that distance s (for spool).
actual leg
orange
s
If we solve this recursively (as in Triangle Spiral, page 51) we see that
L s L s
L L s s
L s
n n
n n
n
+ = +( )= +( )−= + −
−
−
−
2 2 2
2 2 2
2 2 2
1
1
1 11( ).
We can use this relationship to predict specific values; in Fathom, we would make a new column, Lpred, and use prev(Lpred) as we did before.
Tinkertoy Stick Lengths Instructor Notes
Analytic VersionBut suppose we want to find an analytic function so we can just plug in n? This is more complex, but if you have a recurrence relation of the form
L aL bn n= +−1 ,
the following analytic function works:
L n a L baa
nn
( ) .= +−−
0
11
(You can find a derivation on our web site.) In our context,
a b s
L n sn
n
= = −( )= + −( ) −
−
2 2 2 1
2 2 2 12 1
2 1
and , so
( )
= + −( )or
L n sn n
( ) .2 2 2 1
Sample DataHere you can see our data with the function. The value of spool is 0.401 cm, and N = 0 for orange. Notice we had two red (N = 3) sticks that differed by about a millimeter:
-0.08
-0.04
0.00
0.04
0 1 2 3 4 5 6N
0
5
10
15
20
25
30
0 1 2 3 4 5 6N
length = 2n length( )first 2 2n 1−
2 1−
spool+
tinkertoys Scatter Plot

57
EGADs: Enriching Geometry and Algebra through Data DRAFT • eeps media © 2014
In this activity, we tilt a chair against a wall and see how the distances vary.
What to DoTilt a chair against a wall. The chair will touch the wall at some particular point. Measure the distance from that point to the floor (call it height) and the distance from the wall to the legs of the chair (base). (See the illustration.)
How will base be related to height?
ˬˮ Predict: What do you think the relationship will look like?
ˬˮ Record measurements of base and height, tilting the chair different amounts between measurements.
ˬˮ Plot height against base.
ˬˮ Find and explain a mathematical function that fits the points. Be sure you can explain the meaning of any parameter.
ˬˮ Be sure you can explain why the form of your function makes sense.
23. Tilting Chairs
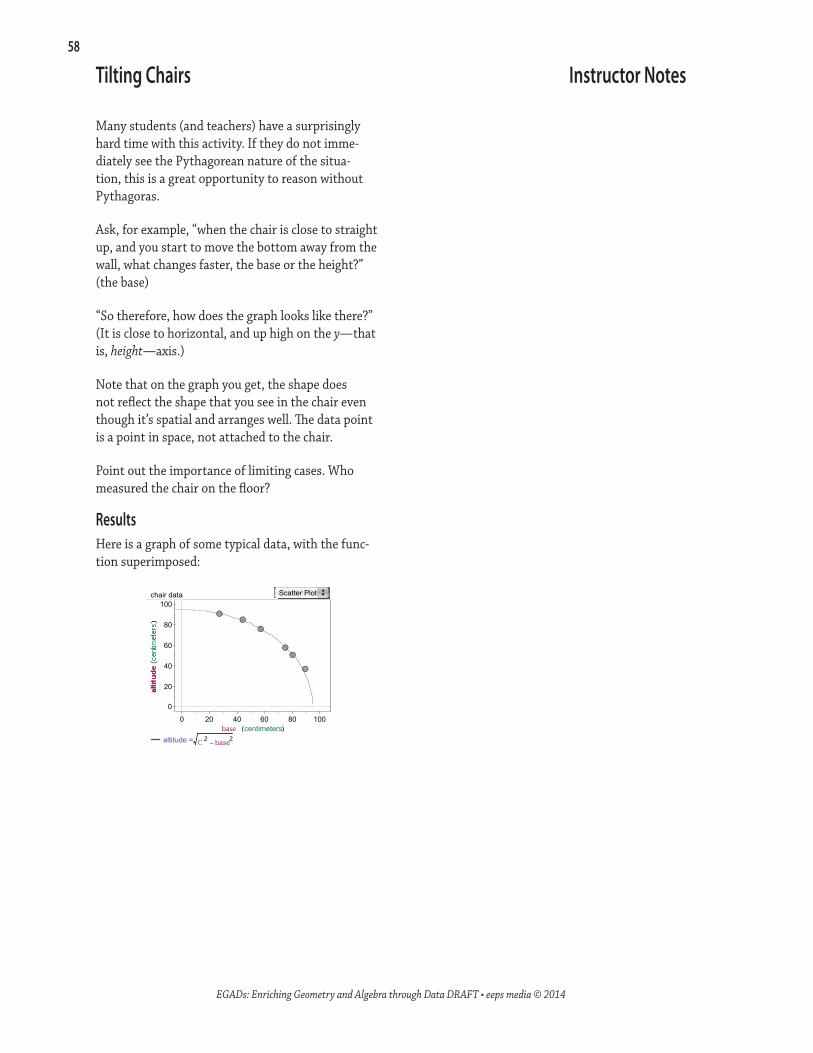
58
EGADs: Enriching Geometry and Algebra through Data DRAFT • eeps media © 2014
Many students (and teachers) have a surprisingly hard time with this activity. If they do not imme-diately see the Pythagorean nature of the situa-tion, this is a great opportunity to reason without Pythagoras.
Ask, for example, “when the chair is close to straight up, and you start to move the bottom away from the wall, what changes faster, the base or the height?” (the base)
“So therefore, how does the graph looks like there?” (It is close to horizontal, and up high on the y—that is, height—axis.)
Note that on the graph you get, the shape does not reflect the shape that you see in the chair even though it’s spatial and arranges well. The data point is a point in space, not attached to the chair.
Point out the importance of limiting cases. Who measured the chair on the floor?
ResultsHere is a graph of some typical data, with the func-tion superimposed:
0
20
40
60
80
100
0 20 40 60 80 100base (centimeters)
altitude = C 2 base2−
chair data Scatter Plot
Tilting Chairs Instructor Notes
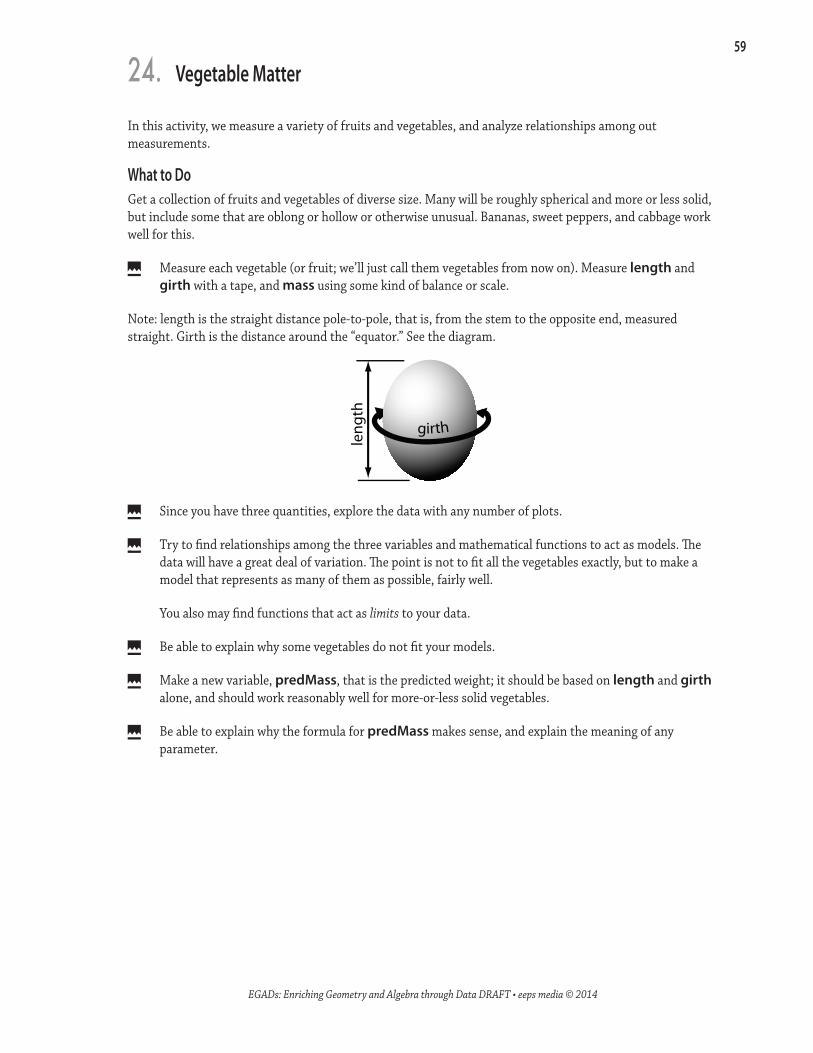
59
EGADs: Enriching Geometry and Algebra through Data DRAFT • eeps media © 2014
In this activity, we measure a variety of fruits and vegetables, and analyze relationships among out measurements.
What to DoGet a collection of fruits and vegetables of diverse size. Many will be roughly spherical and more or less solid, but include some that are oblong or hollow or otherwise unusual. Bananas, sweet peppers, and cabbage work well for this.
ˬˮ Measure each vegetable (or fruit; we’ll just call them vegetables from now on). Measure length and girth with a tape, and mass using some kind of balance or scale.
Note: length is the straight distance pole-to-pole, that is, from the stem to the opposite end, measured straight. Girth is the distance around the “equator.” See the diagram.
leng
th
girth
ˬˮ Since you have three quantities, explore the data with any number of plots.
ˬˮ Try to find relationships among the three variables and mathematical functions to act as models. The data will have a great deal of variation. The point is not to fit all the vegetables exactly, but to make a model that represents as many of them as possible, fairly well.
You also may find functions that act as limits to your data.
ˬˮ Be able to explain why some vegetables do not fit your models.
ˬˮ Make a new variable, predMass, that is the predicted weight; it should be based on length and girth alone, and should work reasonably well for more-or-less solid vegetables.
ˬˮ Be able to explain why the formula for predMass makes sense, and explain the meaning of any parameter.
24. Vegetable Matter
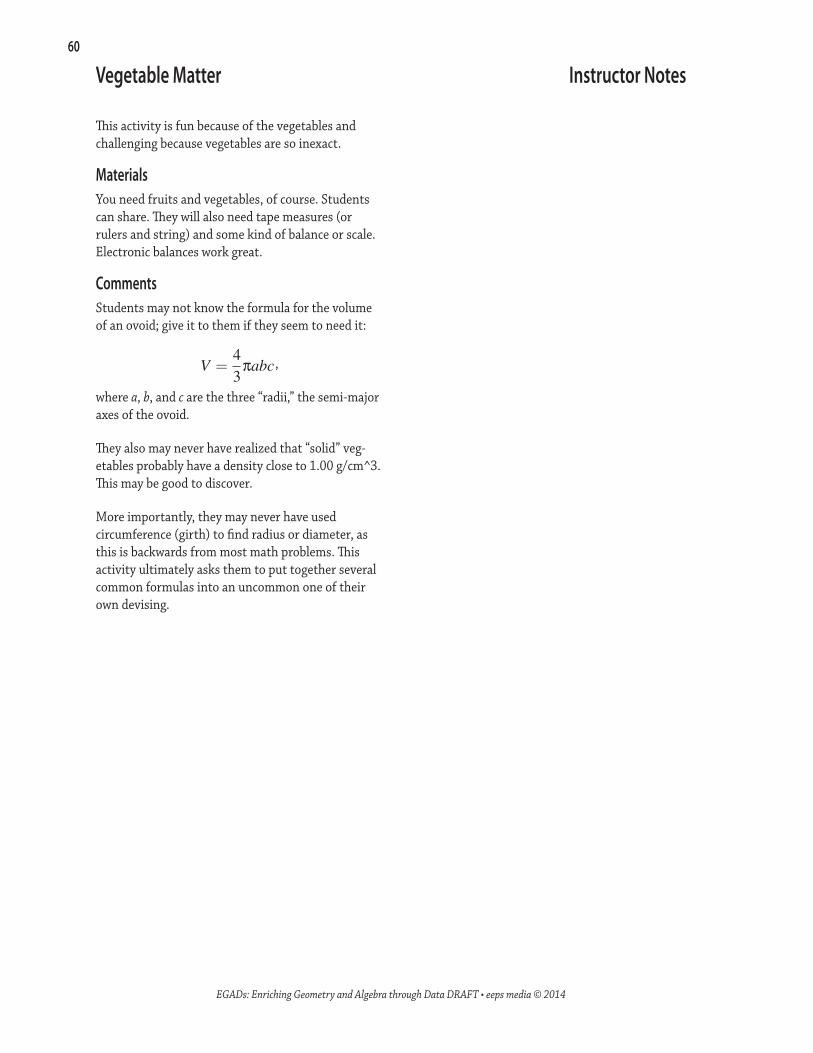
60
EGADs: Enriching Geometry and Algebra through Data DRAFT • eeps media © 2014
This activity is fun because of the vegetables and challenging because vegetables are so inexact.
MaterialsYou need fruits and vegetables, of course. Students can share. They will also need tape measures (or rulers and string) and some kind of balance or scale. Electronic balances work great.
CommentsStudents may not know the formula for the volume of an ovoid; give it to them if they seem to need it:
V =43
πabc ,
where a, b, and c are the three “radii,” the semi-major axes of the ovoid.
They also may never have realized that “solid” veg-etables probably have a density close to 1.00 g/cm^3. This may be good to discover.
More importantly, they may never have used circumference (girth) to find radius or diameter, as this is backwards from most math problems. This activity ultimately asks them to put together several common formulas into an uncommon one of their own devising.
Vegetable Matter Instructor Notes

61
EGADs: Enriching Geometry and Algebra through Data DRAFT • eeps media © 2014
In this activity, you will make triangles by folding a piece of paper, and then relate the area of the triangle to other measurements.
What to DoTake a piece of paper and orient it sideways.
Take the upper-left corner and fold it down to some point on the bottom edge of the rectangle. You have now made a triangle (See the illustration).
Measure base, the “bottom” side of the triangle.
Measure height, the “left” side of the triangle.
Calculate the area of the triangle.
How will area be related to base?
ˬˮ Predict: What do you think the relationship will look like?
ˬˮ Record measurements of height and base, folding the paper to different points.
ˬˮ Calculate area for each triangle. Don’t do this by hand! Have the computer do it:
Make a <new> column called area.
Right-click on the heading, area, and choose Edit Formula (use control-click if you have a one-button mouse)
In the formula editor, enter the formula you want.
ˬˮ Plot area against base.
ˬˮ Where do you fold the paper to get maximum area for the triangle?
ˬˮ How do you know there has to be a maximum?
ˬˮ Find and explain a mathematical function that fits the points. Be sure you can explain the meaning of any parameter.
ˬˮ Be sure you can explain why the form of your function makes sense.
base
height
25. Triangle Folding
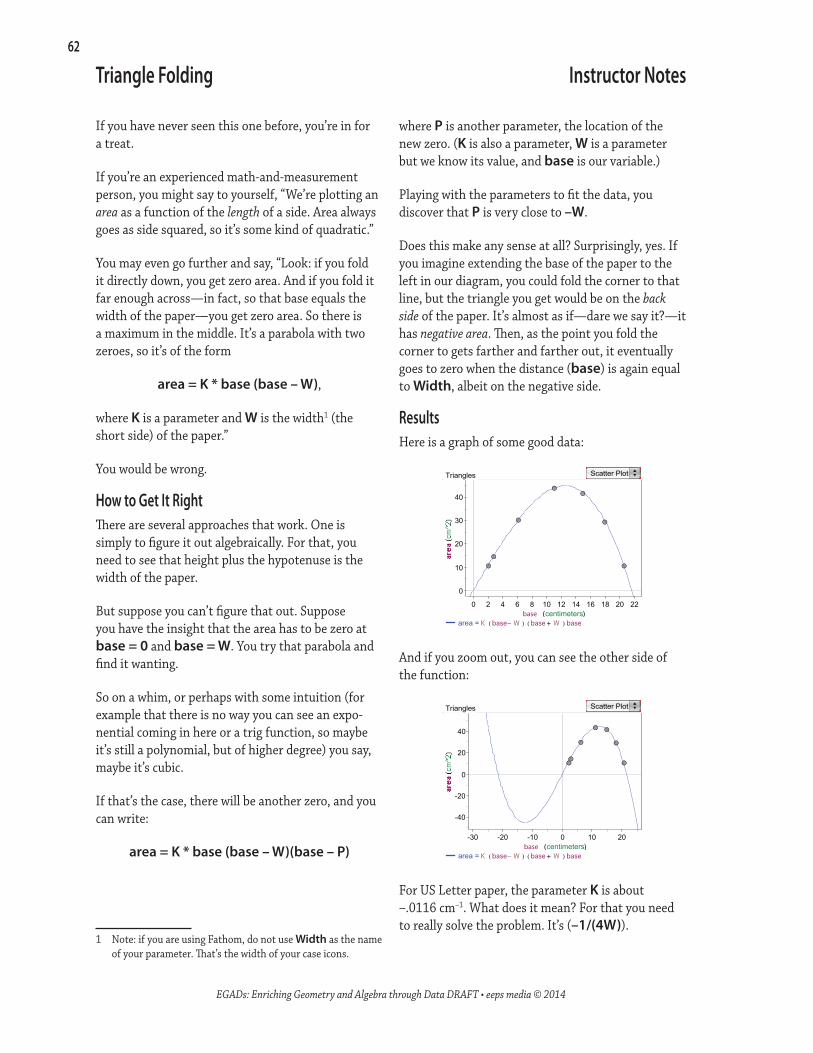
62
EGADs: Enriching Geometry and Algebra through Data DRAFT • eeps media © 2014
If you have never seen this one before, you’re in for a treat.
If you’re an experienced math-and-measurement person, you might say to yourself, “We’re plotting an area as a function of the length of a side. Area always goes as side squared, so it’s some kind of quadratic.”
You may even go further and say, “Look: if you fold it directly down, you get zero area. And if you fold it far enough across—in fact, so that base equals the width of the paper—you get zero area. So there is a maximum in the middle. It’s a parabola with two zeroes, so it’s of the form
area = K * base (base – W),
where K is a parameter and W is the width1 (the short side) of the paper.”
You would be wrong.
How to Get It RightThere are several approaches that work. One is simply to figure it out algebraically. For that, you need to see that height plus the hypotenuse is the width of the paper.
But suppose you can’t figure that out. Suppose you have the insight that the area has to be zero at base = 0 and base = W. You try that parabola and find it wanting.
So on a whim, or perhaps with some intuition (for example that there is no way you can see an expo-nential coming in here or a trig function, so maybe it’s still a polynomial, but of higher degree) you say, maybe it’s cubic.
If that’s the case, there will be another zero, and you can write:
area = K * base (base – W)(base – P)
1 Note: if you are using Fathom, do not use Width as the name of your parameter. That’s the width of your case icons.
Triangle Folding Instructor Notes
where P is another parameter, the location of the new zero. (K is also a parameter, W is a parameter but we know its value, and base is our variable.)
Playing with the parameters to fit the data, you discover that P is very close to –W.
Does this make any sense at all? Surprisingly, yes. If you imagine extending the base of the paper to the left in our diagram, you could fold the corner to that line, but the triangle you get would be on the back side of the paper. It’s almost as if—dare we say it?—it has negative area. Then, as the point you fold the corner to gets farther and farther out, it eventually goes to zero when the distance (base) is again equal to Width, albeit on the negative side.
ResultsHere is a graph of some good data:
0
10
20
30
40
base (centimeters)0 2 4 6 8 10 12 14 16 18 20 22
area = K base W−( ) base W+( ) base
Triangles Scatter Plot
And if you zoom out, you can see the other side of the function:
-40
-20
0
20
40
base (centimeters)-30 -20 -10 0 10 20
area = K base W−( ) base W+( ) base
Triangles Scatter Plot
For US Letter paper, the parameter K is about –.0116 cm–1. What does it mean? For that you need to really solve the problem. It’s (–1/(4W)).

63
EGADs: Enriching Geometry and Algebra through Data DRAFT • eeps media © 2014
<Overall description and illus>
What to Do<What you actually do and measure> (See the illustration.)
How will yyy be related to xxx?
ˬˬ Predict: What do you think the relationship will look like?
ˬˬ Record measurements of yyy and xxx, <tilting the chair different amounts between measurements.>
ˬˬ Plot yyy against xxx.
ˬˬ Find and explain a mathematical function that fits the points. Be sure you can explain the meaning of any parameter.
ˬˬ Be sure you can explain why the form of your function makes sense.
26. Maximum Box

64
EGADs: Enriching Geometry and Algebra through Data DRAFT • eeps media © 2014
xxx
Maximum Box Instructor Notes

65
EGADs: Enriching Geometry and Algebra through Data DRAFT • eeps media © 2014
How can you tell how much paper is on a toilet paper roll without unrolling it? The overall plan in this activity is to figure out the relationship between the diameter of a roll and how much paper is left on it. Then we could figure out the length of the roll just by measuring its diameter.
What to DoGet a roll of paper. Toilet paper is fun, but adding-machine tape actually works better because it isn’t as squishy.
You will unroll it gradually, measuring the diameter and the amount you have unrolled several times.
<What you actually do and measure> (See the illustration.)
How will diameter be related to unrolled?
ˬˮ Predict: What do you think the relationship will look like?
ˬˮ Before you start unrolling, measure the full diameter. At this point, unrolled is 0 cm, of course.
ˬˮ Also, measure and record the diameter of the core. You might make a slider of that value.
This measurement is important because when diameter gets down to core, unrolled will be equal to the full length of the paper roll. Be sure you understand this idea!
ˬˮ Record measurements of diameter and unrolled, unrolling more paper between measurements.
ˬˮ Plot diameter against unrolled. (Or should you plot it the other way around? You decide and justify your decision.)
ˬˮ Before you have unrolled the whole roll, find and explain a mathematical function that fits the points. Be sure you can explain the meaning of any parameter.
Note: your data might look linear, but they’re not. Still, it is interesting to try a line and predict the total length of the roll using the liner model. See how different the result is from the one when you use an appropriate nonlinear model.
ˬˮ Be sure you can explain why the form of your function makes sense.
ˬˮ Use your data to predict the total length of the paper roll.
ˬˮ Unroll it and see how you did!
27. Toilet Paper Roll

66
EGADs: Enriching Geometry and Algebra through Data DRAFT • eeps media © 2014
xxx
Toilet Paper Roll Instructor Notes

67
EGADs: Enriching Geometry and Algebra through Data DRAFT • eeps media © 2014
In this activity, you will construct and measure cones, and relate various measurements to one another.
What to DoSee the cone template on page 69. You can make a cone by shaping and connecting any sector of a circle. The template will help you make many different cones, all from a circle of the same radius.
Once you have a cone, you will know the angle of the circle it was made from—the central angle of its sector. It could be greater than 180°. You can measure different quantities such as the cone’s height.
How will height be related to angle?
ˬˮ Predict: What do you think the relationship will look like?
ˬˮ Record measurements of height and angle, using cones cut from circle sectors with the same radius.
ˬˮ Plot height against angle.
ˬˮ Find and explain a mathematical function that fits the points. Be sure you can explain the meaning of any parameter.
ˬˮ Be sure you can explain why the form of your function makes sense.
28. Making a Cone
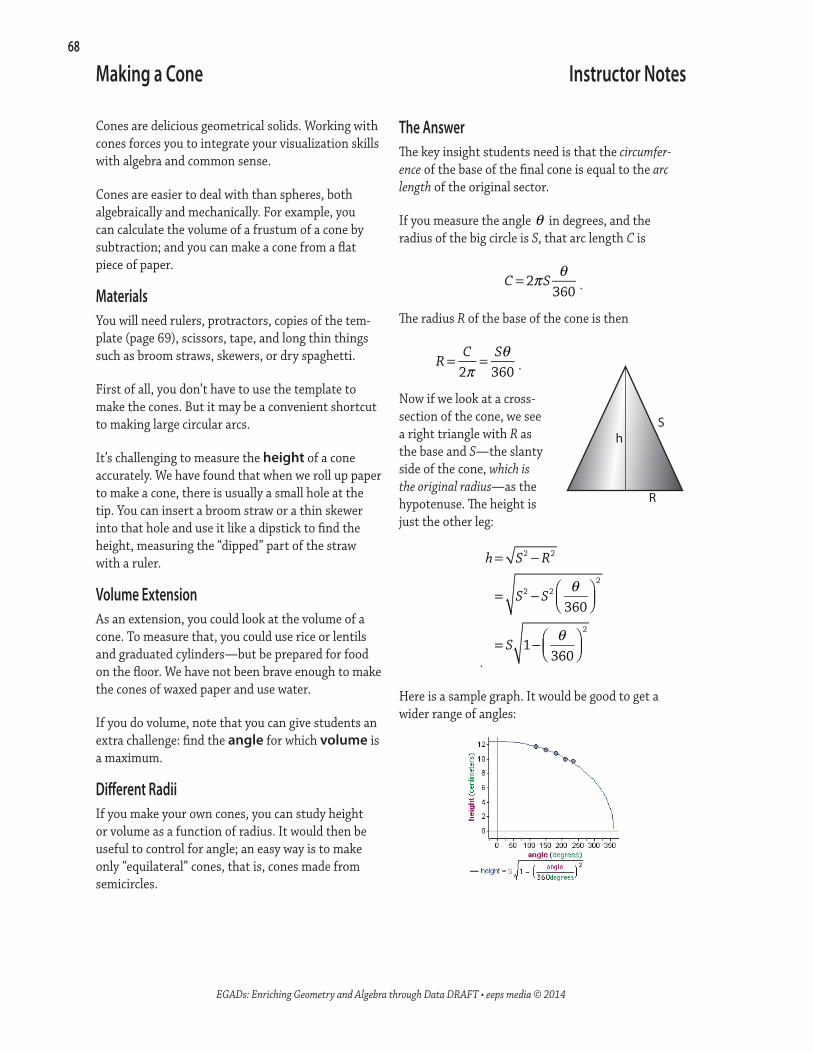
68
EGADs: Enriching Geometry and Algebra through Data DRAFT • eeps media © 2014
Cones are delicious geometrical solids. Working with cones forces you to integrate your visualization skills with algebra and common sense.
Cones are easier to deal with than spheres, both algebraically and mechanically. For example, you can calculate the volume of a frustum of a cone by subtraction; and you can make a cone from a flat piece of paper.
MaterialsYou will need rulers, protractors, copies of the tem-plate (page 69), scissors, tape, and long thin things such as broom straws, skewers, or dry spaghetti.
First of all, you don’t have to use the template to make the cones. But it may be a convenient shortcut to making large circular arcs.
It’s challenging to measure the height of a cone accurately. We have found that when we roll up paper to make a cone, there is usually a small hole at the tip. You can insert a broom straw or a thin skewer into that hole and use it like a dipstick to find the height, measuring the “dipped” part of the straw with a ruler.
Volume ExtensionAs an extension, you could look at the volume of a cone. To measure that, you could use rice or lentils and graduated cylinders—but be prepared for food on the floor. We have not been brave enough to make the cones of waxed paper and use water.
If you do volume, note that you can give students an extra challenge: find the angle for which volume is a maximum.
Different RadiiIf you make your own cones, you can study height or volume as a function of radius. It would then be useful to control for angle; an easy way is to make only “equilateral” cones, that is, cones made from semicircles.
The AnswerThe key insight students need is that the circumfer-ence of the base of the final cone is equal to the arc length of the original sector.
If you measure the angle θ ˬin degrees, and the radius of the big circle is S, that arc length C is
C = 2πS θ360 .
The radius R of the base of the cone is then
R = C2π
= Sθ360 .
Now if we look at a cross-section of the cone, we see a right triangle with R as the base and S—the slanty side of the cone, which is the original radius—as the hypotenuse. The height is just the other leg:
.
h= S2 −R2
= S2 − S2 θ360
⎛⎝⎜
⎞⎠⎟2
= S 1− θ360
⎛⎝⎜
⎞⎠⎟2
Here is a sample graph. It would be good to get a wider range of angles:
S
R
h
Making a Cone Instructor Notes
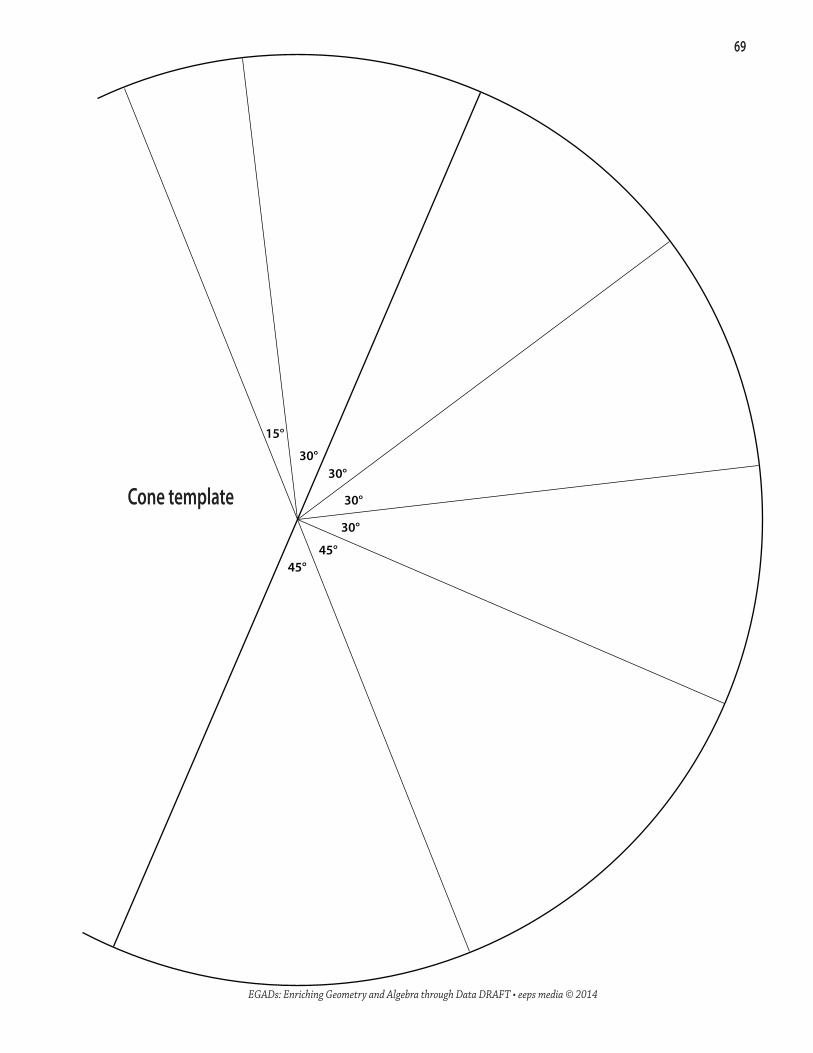
69
EGADs: Enriching Geometry and Algebra through Data DRAFT • eeps media © 2014
45°45°
30°
30°
30°30°
15°
Cone template

70
EGADs: Enriching Geometry and Algebra through Data DRAFT • eeps media © 2014
In this activity, you will construct and measure a bunch of right triangles with a common base. Then you will compare the angle to the length of the changing leg. You need paper, a ruler, and a protractor.
What to DoDraw a number of triangles that share a 5-centimeter base. (See the illustration.) Measure the angle at the base of the triangle and the length of the opposite side.
How will angle be related to opposite?
ˬˮ Predict: What do you think the relationship will look like?
ˬˮ Record your measurements of opposite and angle. Use a protractor to measure angle in degrees.
The angle is the one between the base and the hypotenuse
Measure the length of the opposite side.
Be sure you make your triangles so that angle ranges as widely as possible.
ˬˮ Plot angle against opposite. (So opposite goes on the horizon-tal axis.)
ˬˮ Find and explain a mathematical function that fits the points. Be sure you can explain the meaning of any parameter.
ˬˮ Be sure you can explain why the form of your function makes sense.
29. Arctangent
5 cm
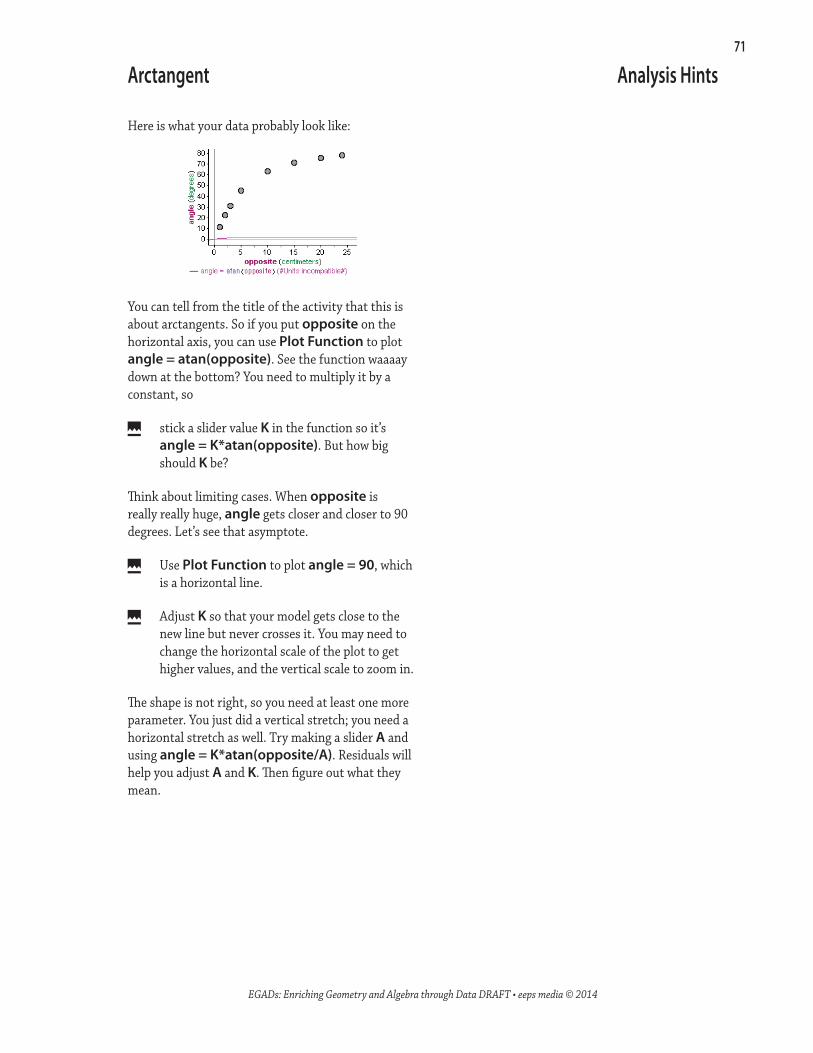
71
EGADs: Enriching Geometry and Algebra through Data DRAFT • eeps media © 2014
Here is what your data probably look like:
You can tell from the title of the activity that this is about arctangents. So if you put opposite on the horizontal axis, you can use Plot Function to plot angle = atan(opposite). See the function waaaay down at the bottom? You need to multiply it by a constant, so
ˬˮ stick a slider value K in the function so it’s angle = K*atan(opposite). But how big should K be?
Think about limiting cases. When opposite is really really huge, angle gets closer and closer to 90 degrees. Let’s see that asymptote.
ˬˮ Use Plot Function to plot angle = 90, which is a horizontal line.
ˬˮ Adjust K so that your model gets close to the new line but never crosses it. You may need to change the horizontal scale of the plot to get higher values, and the vertical scale to zoom in.
The shape is not right, so you need at least one more parameter. You just did a vertical stretch; you need a horizontal stretch as well. Try making a slider A and using angle = K*atan(opposite/A). Residuals will help you adjust A and K. Then figure out what they mean.
Arctangent Analysis Hints

72
EGADs: Enriching Geometry and Algebra through Data DRAFT • eeps media © 2014
Arctangent Instructor Notes
If you switch the axes, you get the tangent function. It’s an interesting question why it is or is not OK to do that.
Note that can do secant with the same setup by measuring the hypotenuse.
If you use two parameters—one for the vertical stretch, and one for the horizontal stretch—it’s interesting to see how the residuals move differ-ently. Contrast this with using two parameters for a parabola or a line, where you discover that they are redundant. Here they aren’t; the way the shape changes is different stretching horizontally than vertically.
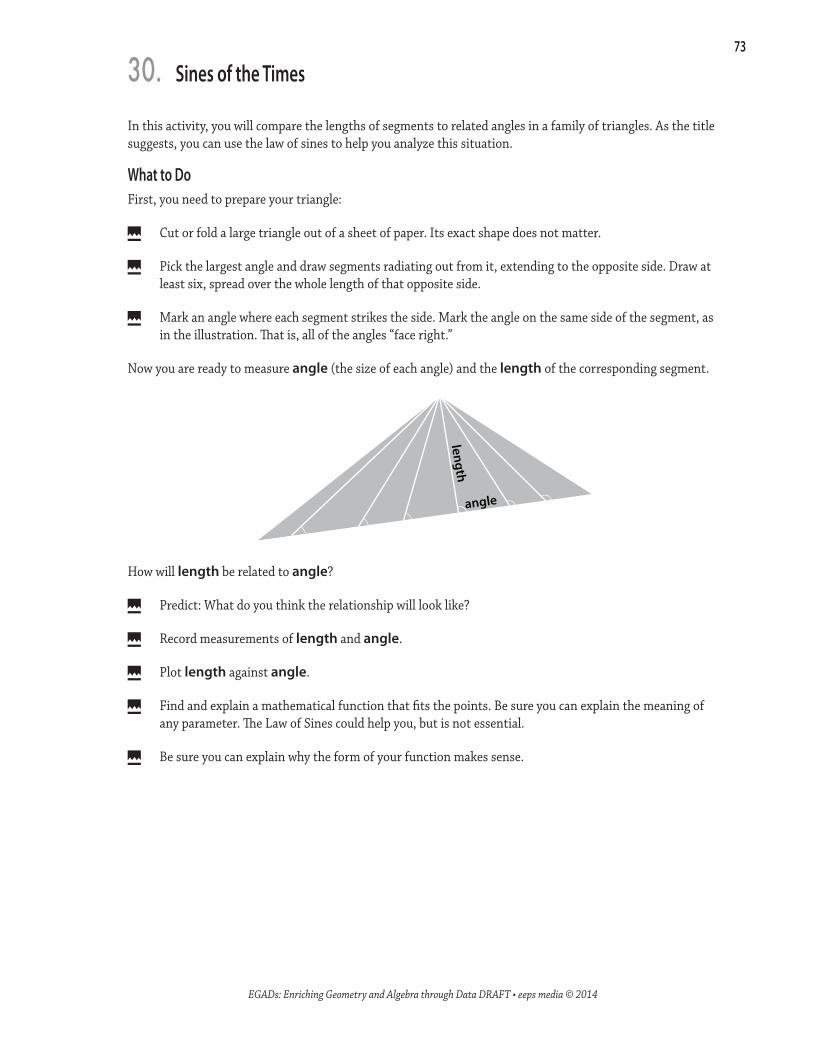
73
EGADs: Enriching Geometry and Algebra through Data DRAFT • eeps media © 2014
30. Sines of the Times
In this activity, you will compare the lengths of segments to related angles in a family of triangles. As the title suggests, you can use the law of sines to help you analyze this situation.
What to DoFirst, you need to prepare your triangle:
ˬˮ Cut or fold a large triangle out of a sheet of paper. Its exact shape does not matter.
ˬˮ Pick the largest angle and draw segments radiating out from it, extending to the opposite side. Draw at least six, spread over the whole length of that opposite side.
ˬˮ Mark an angle where each segment strikes the side. Mark the angle on the same side of the segment, as in the illustration. That is, all of the angles “face right.”
Now you are ready to measure angle (the size of each angle) and the length of the corresponding segment.
angle
length
How will length be related to angle?
ˬˮ Predict: What do you think the relationship will look like?
ˬˮ Record measurements of length and angle.
ˬˮ Plot length against angle.
ˬˮ Find and explain a mathematical function that fits the points. Be sure you can explain the meaning of any parameter. The Law of Sines could help you, but is not essential.
ˬˮ Be sure you can explain why the form of your function makes sense.

74
EGADs: Enriching Geometry and Algebra through Data DRAFT • eeps media © 2014
Sines of the Times Instructor Notes
Students will need rulers and protractors.
The AnswerThere are several good approaches. One elegant strategy is to drop a perpendicular from the busy vertex of your diagram to the opposite side. Call that length h. If B is the length of one of the segments, then h= Bsinα . Solve for B to get:
B= hsinα , or, in our notation,
length =
Ksin(angle)
,
where K is a free parameter. From our derivation, we also know its meaning: it’s the length of the perpen-dicular, the shortest distance from the vertex to the opposite side.
You could also use the Law of Sines. In the diagram, notice that the angle b and the side A are the same for all of the triangles.
α
A
βB
Our length is side B, our angle is angle θ. Using the law of sines,
sinαA
= sinβB
, we get B=Asinβsinα .
This is equivalent to the other result, since Asinβ is also the length of that vertical.
Which Axis?In many of these activities, you could put either variable on the vertical axis depending on how you constructed whatever it is you are measuring. But here, the length of the segment depends on the angle, not the other way around. If you know the angle, you can figure out the length, but if you know the length, there might be two possible angles. The inverse is not a function.
This can be confusing because we pick a point on the base of the triangle, then draw the segment, then measure both the length and the angle. So really both depend on the position of the point.
ResultsHere is an example of a good result:
CommentsIf you don’t analyze the situation, and just look at the graph, it’s reasonable to wonder if it’s quadratic. In fact, a quadratic function does a pretty good job of modeling the points near the vertex.
It’s instructive to look at residuals from both a quadratic and from this “cosecant” relationship. The quadratic gets worse and worse the farther you get from the vertex. In fact, as you look at extreme cases—such as an angle greater than 180°—you can tell that a quadratic doesn’t make sense.
You could linearize the situation by making a new column and calculating (1/sin(angle)). Plotting that against length should give a straight line.
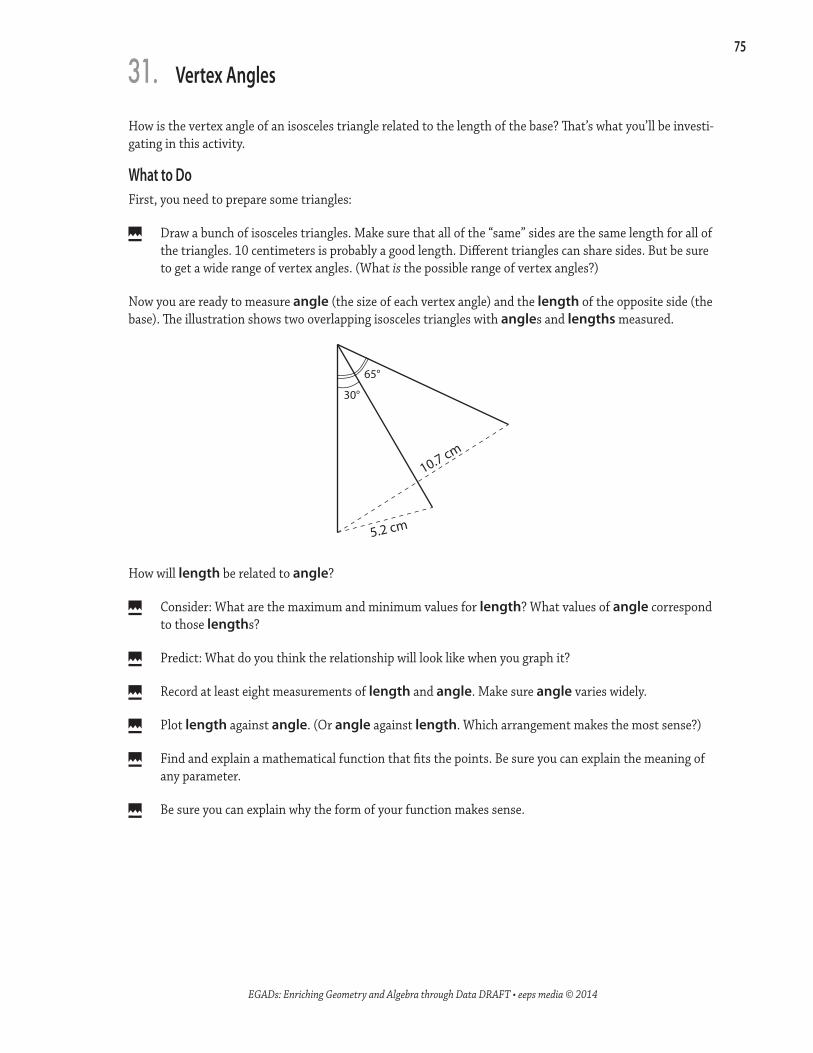
75
EGADs: Enriching Geometry and Algebra through Data DRAFT • eeps media © 2014
31. Vertex Angles
How is the vertex angle of an isosceles triangle related to the length of the base? That’s what you’ll be investi-gating in this activity.
What to DoFirst, you need to prepare some triangles:
ˬˮ Draw a bunch of isosceles triangles. Make sure that all of the “same” sides are the same length for all of the triangles. 10 centimeters is probably a good length. Different triangles can share sides. But be sure to get a wide range of vertex angles. (What is the possible range of vertex angles?)
Now you are ready to measure angle (the size of each vertex angle) and the length of the opposite side (the base). The illustration shows two overlapping isosceles triangles with angles and lengths measured.
30°
65°
5.2 cm
10.7 cm
How will length be related to angle?
ˬˮ Consider: What are the maximum and minimum values for length? What values of angle correspond to those lengths?
ˬˮ Predict: What do you think the relationship will look like when you graph it?
ˬˮ Record at least eight measurements of length and angle. Make sure angle varies widely.
ˬˮ Plot length against angle. (Or angle against length. Which arrangement makes the most sense?)
ˬˮ Find and explain a mathematical function that fits the points. Be sure you can explain the meaning of any parameter.
ˬˮ Be sure you can explain why the form of your function makes sense.

76
EGADs: Enriching Geometry and Algebra through Data DRAFT • eeps media © 2014
Now you can use trig to find the length of the base. In the illustration, the side lengths are a, and the vertex angle is theta:
a
a
θ/2
a sin(θ/2)
This activity is unusual in this book: you can get a good answer without using variable parameters. The amplitude of the sine is just twice the length of the side (in our case, 20 cm).
Half-Angle MagicThere is another approach. If students have seen the Law of Cosines, challenge them to use that for-mula—and then explain why the two functions are really the same. One explanation:
If we use the Law of Cosines, the relationship is
c2 = 2a2 −2a2 cosθ= 2a2(1− cosθ )
where a is the length of the leg and c is the length of the side we want. But we also know that c = 2asin(θ /2) . Squaring that and setting it equal to the expression above, we get
4a2 sin2 θ2= 2a2 1− cosθ( )
sin2 θ2= 1− cosθ
2
sinθ2= ± 1− cosθ
2
which is a half-angle formula.
Vertex Angles Instructor Notes
Students will need centimeter rulers. If they con-struct their own triangles and do not use the diagram on page 77, they will also need protractors.
ResultsHere are some good results, shown with a function and a residual plot:
If students do not see that the data look like a sine curve, but stretched out so that you get from 0 to 1 as the angle increases from 0 to 180 instead of from 0 to 90, suggest that they fill in the rest of the circle. That is, suppose you had a vertex angle of greater than 180°—what would the length be? The length for 210°, for example, would be the same as the one for 150°.
If students fill in the graph from 180° to 360°, it may look more obviously like half a sine wave.
Explaining the RelationshipThe function arises naturally using soh-cah-toa trig.
Draw the altitude of the isosceles triangle from its vertex to the base. This bisects the vertex angle, and splits the isosceles triangle into two right triangles whose hypotenuse is the length of the isosceles sides.
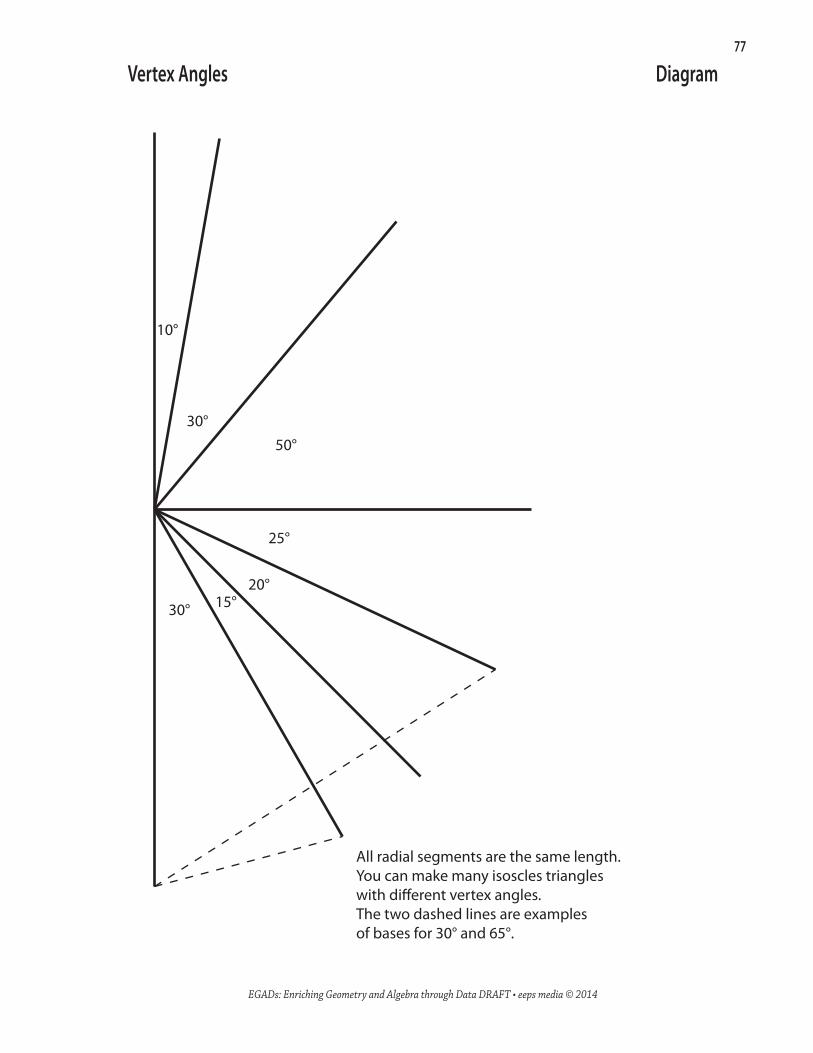
77
EGADs: Enriching Geometry and Algebra through Data DRAFT • eeps media © 2014
Vertex Angles Diagram
30°
30°
15°20°
25°
All radial segments are the same length.You can make many isoscles triangleswith di�erent vertex angles.The two dashed lines are examples of bases for 30° and 65°.
10°
50°
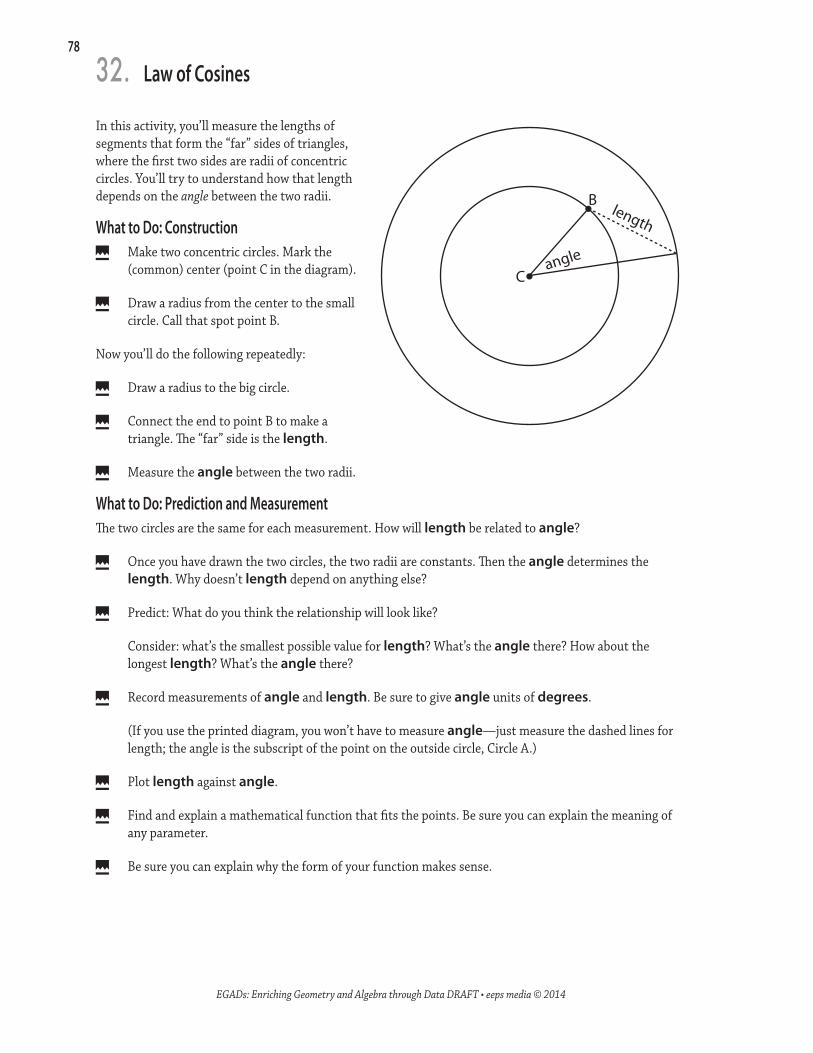
78
EGADs: Enriching Geometry and Algebra through Data DRAFT • eeps media © 2014
In this activity, you’ll measure the lengths of segments that form the “far” sides of triangles, where the first two sides are radii of concentric circles. You’ll try to understand how that length depends on the angle between the two radii.
What to Do: Constructionˬˮ Make two concentric circles. Mark the
(common) center (point C in the diagram).
ˬˮ Draw a radius from the center to the small circle. Call that spot point B.
Now you’ll do the following repeatedly:
ˬˮ Draw a radius to the big circle.
ˬˮ Connect the end to point B to make a triangle. The “far” side is the length.
ˬˮ Measure the angle between the two radii.
What to Do: Prediction and MeasurementThe two circles are the same for each measurement. How will length be related to angle?
ˬˮ Once you have drawn the two circles, the two radii are constants. Then the angle determines the length. Why doesn’t length depend on anything else?
ˬˮ Predict: What do you think the relationship will look like?
Consider: what’s the smallest possible value for length? What’s the angle there? How about the longest length? What’s the angle there?
ˬˮ Record measurements of angle and length. Be sure to give angle units of degrees.
(If you use the printed diagram, you won’t have to measure angle—just measure the dashed lines for length; the angle is the subscript of the point on the outside circle, Circle A.)
ˬˮ Plot length against angle.
ˬˮ Find and explain a mathematical function that fits the points. Be sure you can explain the meaning of any parameter.
ˬˮ Be sure you can explain why the form of your function makes sense.
32. Law of Cosines
angle
lengthB
C

79
EGADs: Enriching Geometry and Algebra through Data DRAFT • eeps media © 2014
What’s the right answer? The Law of Cosines says
c2 = a2 + b2 −2abcosθ .
In our case, a and b are the two radii, and length is c. So indeed it’s a constant minus a constant times the cosine, but we should plot the square root of that if we’re trying to get c:
In that formula, the parameter C (its value in the illustration is about 205) is a2 + b2 and A (about 175) is 2ab .
Students will need centimeter rulers. If they draw their own figures, they will also need protractors and compasses.
Be sure to check students’ predictions to see that they make sense. The smallest length is the differ-ence between the radii, at angle = 0°. The longest is the sum, at angle = 180°.
When students plot the results, they should be able to reason qualitatively why length increases with angle, and why it seems to increase fastest around angle = 90°.
A caveat: in other activities, we might hope that students find good functions and get insight from them. That’s a tall order here. Students can get close, but to find the real function, chances are they’ll need to know and apply the Law of Cosines.
ResultsHere are some pretty good data:
It looks like some sort of trig function, but what? One answer that shows good insight (but is still wrong) is that it’s a negative cosine plus some constant.
Let students run with this, and practice transforming the trig function to try to match the data. In this case, you can do pretty well, but the cosine function never quite fits the data satisfactorily. A pretty good fit of that function, with a residual plot, shows a strong pattern in the residuals—so it’s the wrong function!
Law of Cosines Instructor Notes

80
EGADs: Enriching Geometry and Algebra through Data DRAFT • eeps media © 2014
This is a great lesson in how to linearize a function. You “chunk” the equation so that it turns into slope-intercept form. In the original,
c2 = a2 + b2 −2abcosθ ,
the “opposite” side, c, is our y-variable. And the x-variable is the angle theta. But if we group things together, like this:
c2 = a2+b2 2ab− cosθ
we can see that if the y-variable were c2 and the x-variable were cosθ , we’d have a line:
c2 = a2+b2 2ab− cosθ
Y = B M X−
Looking at the linear graph above, notice how the coefficients (205 and –175) match what we got earlier.
And notice how the slope is negative. Have students explain that.
You can turn this around for an additional exercise: give students parameter values and ask them to find the radii of the two circles.
Another extension would be to explore how this activity is a generalization of “Vertex Angles” on page 75. Have students figure out what happens when the two radii a and b are the same.
The Road to LinearizationThe square root is nasty. You can’t easily tell from the “missed” function that taking the square root will help. Can we avoid the square root issue altogether?
One way is to make a new column for the square of the length (e.g., len_sq) and essentially plot c2 on the vertical axis. A good fit looks like this:
Look at formula: len_sq = C1 – A1 cos(angle). See how it’s really still the Law of Cosines? And no square root.
Let’s go a step further. Let’s plot cos(angle) on the x axis:
Law of Cosines Instructor Notes, continued

81
EGADs: Enriching Geometry and Algebra through Data DRAFT • eeps media © 2014
A0
A20
A40
A60
A80
A90
A100
A120
A135
A150
A180
B0
Circle B
Circle A
Law of Cosines diagram

82
EGADs: Enriching Geometry and Algebra through Data DRAFT • eeps media © 2014
<Overall description and illus>
What to Do<What you actually do and measure> (See the illustration.)
How will yyy be related to xxx?
ˬˬ Predict: What do you think the relationship will look like?
ˬˬ Record measurements of yyy and xxx, <tilting the chair different amounts between measurements.>
ˬˬ Plot yyy against xxx.
ˬˬ Find and explain a mathematical function that fits the points. Be sure you can explain the meaning of any parameter.
ˬˬ Be sure you can explain why the form of your function makes sense.
33. Small-Angle Approximation

83
EGADs: Enriching Geometry and Algebra through Data DRAFT • eeps media © 2014
xxx
Small-Angle Approximation Instructor Notes

84
EGADs: Enriching Geometry and Algebra through Data DRAFT • eeps media © 2014
<Overall description and illus>
What to Do<What you actually do and measure> (See the illustration.)
How will yyy be related to xxx?
ˬˬ Predict: What do you think the relationship will look like?
ˬˬ Record measurements of yyy and xxx, <tilting the chair different amounts between measurements.>
ˬˬ Plot yyy against xxx.
ˬˬ Find and explain a mathematical function that fits the points. Be sure you can explain the meaning of any parameter.
ˬˬ Be sure you can explain why the form of your function makes sense.
34. Jupiter Size

85
EGADs: Enriching Geometry and Algebra through Data DRAFT • eeps media © 2014
xxx
Jupiter Size Instructor Notes