egypt: growth potential and business opportunities growth potential and business opportunities april...
TRANSCRIPT

Egypt: Growth Potential and Business Opportunities
April 2008

Egypt: Growth Potential and Business Opportunities April 2008
1
Summary 3
Current Economic Cycle and Long-term Growth Trends 6 1. Introduction 6 2. The current economic cycle 6 3. Macro policies 10 4. Long-term growth of the Egyptian economy 14 5. Rating and financial market performance 21
International Trade and FDI Flows 23 1. Introduction 23 2. Egyptian international trade 23 3. Italy as one of Egypt’s most important trading partner 26 4. Natural resources 29 5. Foreign Direct Investment Flows 31
Industrial Structure Development 35 1. Introduction 35 2. Industrial specialisation 35 3. Local investment attractiveness 42 4. Infrastructural programmes 45
The Egyptian Banking System: in the Middle of Reform 51 1. Introduction 51 2. One of the largest banking systems in North Africa 51 3. Retail and SMEs expected to become main drivers of future growth 58 4. The Egyptian stock market 60

Egypt: Growth Potential and Business Opportunities April 2008
2

Egypt: Growth Potential and Business Opportunities April 2008
3
Summary Egypt’s GDP growth accelerated in four years from 4% in 2004/2005 to 7% estimated in 2006/2007, with a parallel increase in GDP per capita from around 2% to almost 5% over the same period. It is widely acknowledged that this remarkable performance has been supported by three crucial factors: a favourable external environment, prudent domestic economic policies, and last but not least, a sustained pace of structural reform.
This Study – carried out within the International Network of Intesa Sanpaolo Economists - looks at Egypt from two complementary perspectives. In the first paragraph - Current Economic Cycle and Long-term Growth Trends, by G. Frigoli and A. Pesce - it discusses the current performance of the economy at the macro level, as well as the long-run determinants of growth. In the other three paragraphs – International Trade and FDI Flows by W. Vergi, Industrial Structure Development by E. Eskander, H. EL-Masry, S. Khaled, S. Oraby and M. Rabiee and The Egyptian Banking System: in the Middle of Reform by D. Zucchelli - it analyses the most relevant changes affecting the micro structure of the economy. Particular focus was placed on three dimensions of the reform process: progressive opening to international trade and foreign direct investments, recent industrial policy developments and attractiveness of local investments, and banking sector advances. Developments in these areas were ultimately found to be responsible for the more sustained economic growth and the wider range of business opportunities now available in Egypt.
On the external front, the last few years have seen remarkable growths rate in all the major emerging economies. The global growth rate averaged around 5%, while emerging economies achieved faster rates of 7%-8%. In this context, Egypt turned out to be one of the most dynamic economies. The positive global cycle encouraged exports, particularly in the manufacturing sector, which gained new momentum, boosted tourism, Suez Canal revenues, and remittances from emigrant workers. It also supported – via strong FDI inflows – gross capital formation, with investments as a percentage of GDP increasing to 21% in 2007 from 17% in 2004. Owing to the expected global slowdown (affecting in particular Egypt’s major trading partners, such as the US and Italy) and to a deteriorating international financial environment due to the subprime mortgage crisis in the US, Egypt’s growth rate is forecast to decelerate in this year, but will remain above the average world growth rate.
Reform in the economic governance system helped improve the macroeconomic outlook and stabilize investor expectations in terms of the future path of inflation and public finances. On the inflation side, despite recent pressures stemming from global energy and food price increases, the consumer price index, which surged above 10% on February, is expected to moderate again by the end of the year. A gradual shift to an inflation-targeting regime (and a parallel relaxation of the Egyptian Pound’s de facto pegging to the US dollar) is expected to allow greater flexibility to monetary policy (and to the exchange rate), which will help keep inflation under control. On the front of public finances, the Government’s plan to cut the budget deficit from 7.5% of GDP at present to 3% in 2010, and to place public debt on a declining path from the current 80% of GDP, is to all effects challenging, both from an economic and a social point of view. It entails, among other measures, a sharp reduction in subsidies, which currently absorb up to 10% of GDP.
The analysis of long-term-growth-trend determinants shows that the acceleration in GDP per capita over the past few years has been mainly tied to a significant increase in output per worker (around 3% p.a.). In turn, this is found to depend on the positive effects of capital accumulation (around 1/3) and, not surprisingly in a

Egypt: Growth Potential and Business Opportunities April 2008
4
context characterised by profound structural reforms, of Total Factor Productivity (around 2/3).
Moving on to the first dimension of the structural reforms – the progressive opening up of the economy to international trade and FDI inflows discussed in the second paragraph – in the past few years Egypt has entered into a growing number of bilateral and multilateral agreements, especially with its main trading partners (the EU, the US and MENA region countries). In 1995 Egypt joined the WTO. Furthermore, in 2001 and 2004 it respectively signed and brought into force the Association Agreement between the EU and Southern Mediterranean Countries, which provided for the gradual abolishment of tariffs on trade in industrial goods. In 2007 the EU-Egypt Association Council adopted the EU-Egypt Action Plan within the context of the European Neighbourhood Policy, setting out priorities for cooperation in a wide range of sectors. Egypt also closed several agreements within the MENA region (e.g. Agadir and GAFTA Agreements) geared to increasing trade and intensifying cooperation at the regional level.
A common measure of trade openness, given by the sum of imports and exports over GDP, reveals that in the 2004-2007 period Egypt increased its degree of openness by 50%. The rise of FDI inflows has also been impressive. In the 1996-2004 period, their average level was around USD 0.7 bn, with a share of around 4% of Gross fixed investments, and less than 1% of GDP (vs. 2.5% on average among developing countries). Also as a result of a number of recent major privatisations, FDIs surged in 2005/2006, jumping to over USD 10bn dollars in 2006/2007. The destination of flows broken down by sector has also changed, with around 60% of FDIs allocated to the non-hydrocarbon sector in 2007, against 30% in 2004.
Attractiveness of local industry, the second dimension of structural reform discussed in the third paragraph, has been enhanced by means of: a) a new industrial policy design, with the establishment of the Ministry of Investment, the reorganisation of the General Authority for Investment and Free Zones (GAFI), the promotion of new investment programmes (e.g. Industrial Modernisation Programme, Thousand Factories Programme), and financing of major infrastructural projects; b) several business and regulatory policy reforms, aimed in particular at reducing obstacles to doing business; c) liberalisation of foreign equity participation in specific service sectors (mainly telecommunications and financial services). In July 2007, Egypt adhered to the OECD Declaration on International Investment and Multinational Enterprises, under which Governments “commit to improving their investment climate, ensuring equal treatment for foreign and domestic investors and encouraging the positive contribution that multinational companies can bring to economic and social progress” (OECD Investment Policy Reviews. Egypt, 2007). In this context, Egypt was the first country to undertake a formal and thorough review of its international investment policies within the OECD Policy Framework for Investments.
According to a worldwide ranking of countries compiled by the World Bank, Egypt still ranks very low in all areas of “current business environment”, with particularly severe problems in “contract enforcement” and “dealing with licences”. However, it scores 59h (with 100 reflecting the country with the most business-friendly practices, and 50 as the world average) in terms of “reform progress”. In addition Egypt emerged as Top Reformer in the World Bank’s 2008 “Doing Business” ranking, mirroring the particularly strenuous efforts the Country is making to implement reforms at the micro level. Particularly strong progress was recorded on the front of “starting a business”.
The third important dimension of structural reform has been the restructuring of the financial and banking sector. The crucial role played by the financial sector in

Egypt: Growth Potential and Business Opportunities April 2008
5
supporting long-term growth is widely acknowledged in economic literature. Poor local financial market development is found to limit on one hand the access of firms, and SMEs in particular, to credit, and on the other the economy’s ability to take advantage of potential FDI spillovers. In a recent study by A. Dobronogov and F. Iqbal (2005), Economic Growth in Egypt: Constraints and Determinants, MENA WP Series, World Bank, the authors reported that in 2004 only 17.4% of private firms (and 13% of SMEs) in Egypt held an outstanding loan from a financial institution. Indeed, in the area of Retail and SME lending, the analysis carried out in the last paragraph reveals the presence of potential for growth.
A progressive transformation of the Egyptian financial/banking sector has been under way since the launch of the Government’s 2004 financial sector reform programme. A joint IMF-World Bank mission in May 2007 – aimed at updating the 2002 Financial Sector Assessment Programme – found that most of the 2002 recommendations had been implemented, although several challenges were yet to be met. The mission acknowledged the introduction of a new banking law, exit from the market of several weak banks, large scale financial restructuring and privatisation of one major bank, revitalisation of bank lending to the household and corporate sectors, and establishment of a new Credit Bureau system to enhancing banking information (see IMF, Arab Republic of Egypt: 2007 Article IV Consultation).
Gianluca Salsecci

Egypt: Growth Potential and Business Opportunities April 2008
6
Current Economic Cycle and Long-term Growth Trends
1. Introduction
Over the last ten years, Egypt’s economic growth rate has exceeded that of the world’s most advanced economies and of MENA group of countries. According to the latest IMF data, Egypt’s share of world GDP based on purchasing power parity rose to 0.627 in 2007 from 0.549 in 1997. During this period, Egypt’s economic development experienced different phases. Growth was particularly strong between 1997 and 1999, averaging more than 5%, and then slowed temporarily between 2001 and 2003, when GDP growth hovered around 3% following a number of shocks which hit the world economy and Egypt.
In 2004, GDP growth accelerated back, and the Egyptian economy has since performed at its best in years. The most recent boost to economic expansion was provided by the implementation of a set of reforms, which increased market liberalisation, promoted stronger integration with the world economy, and made it easier to set up new businesses. The more favourable business environment has attracted large capital flows, particularly foreign direct investment. FDI flows, which represent an important vehicle for technology and knowledge transfers, have heightened the country’s long-term economic growth prospects.
Reforms were compounded by a better management of the economy. The transition to a controlled floating regime has enhanced monetary policy flexibility, now more effective in fighting inflation. However, the inflation rate is still the highest among all MENA group emerging economies (average inflation rate of 10.9% in 2007). Egypt has also made headway in fiscal stabilisation, implementing tax reforms that have widened the fiscal base, and promoting revenue-enhancing privatisation. Nevertheless additional measures need to be implemented to reduce the budget deficit (7.5% of GDP in the last fiscal year, mostly due to high current expenditure, on items such as energy and food subsidies). Public debt amounts to over 80% of GDP, much more than in peer economies, although only a small share (15%) is denominated in foreign currency.
Notwithstanding these weaknesses, market-friendly reforms have positioned the Egyptian economy well for a period of sustained, investment-led growth. Egypt is not immune, however, from the development of the world economic cycle. The inflow of foreign capitals has funded the construction boom and investments in other activities. Remittances from expatriate workers, most of whom work in oil-rich countries, have sustained consumption. Suez Canal royalties, dependent on world trade, are an important item of the Budget and, with remittances and tourist receipts, of the invisible current account balance. A significant slowdown in the world economy could weaken Egypt’s balance of payments outlook, and negatively impact consumption and investment demand.
2. The current economic cycle
2.1 Growth: one of the Middle East’s fastest-growing economies
The Egyptian economy has grown at a strong pace in the past four years. Real GDP grew by 7.1% in the fiscal year ending last June, at the highest rate in over twenty years, accelerating from 6.8% in the previous fiscal year. The economy is expected to grow at a rate of around 7% also in the current fiscal year, only

Egypt: Growth Potential and Business Opportunities April 2008
7
marginally affected by the global slowdown, as indicated by the first data releases referred to 2008.
Domestic components of demand have provided the main boost to the current uptrend, replacing net trade.
Investment demand has been the main driver of growth in the current phase of expansion. Investments surged in real terms by almost 24% in the last fiscal year, and by over 42% in the first half of the current, and their weight on total GDP has risen by 2.5% points in three years to 21% in fiscal 2007.
Investments have been financed in part by stronger foreign capital inflows, attracted by market-friendly reforms. Direct foreign investments amounted to over USD 13bn in the past fiscal year.
Private consumption, which accounts for almost 72% of GDP, was also an important driver, growing by over 6% in real terms over the last two years, boosted by increasing disposable income, a swelling labour force, and higher household incomes thanks to the remittance of expatriate workers. Net trade subtracted to growth, as surging demand for imports outpaced real export growth.
Table 1 - Macro indicators
2004 2005 2006 2007 2008EReal GDP % chg. y/y 4.1 4.5 6.8 7.1 7.0Private Consumption % chg. y/y 2.1 4.8 6.4 6.9 7.5Public Consumption % chg. y/y 2.0 2.8 3.1 0.2 1.8Investments % chg. y/y 6.3 10.3 13.3 23.8 42.4(*)Exports % chg. y/y 25.3 20.2 21.3 23.3 20.0Imports % chg. y/y 17.2 23.8 21.8 28.8 25.0Avg. CPI % chg. y/y 12.9 8.8 4.2 10.9 7.8C/A balance/GDP 4.3 3.3 1.6 2.1 -0.8Budget deficit/GDP 9.5 9.6 8.2 7.5 7.0
Source: Egypt Ministry of Economic Development, IMF, IIF Note: Fiscal year ending June 30. 2008E IMF World Outlook October 2007. (*) Actual investment growth in the first half of the current fiscal year
In terms of individual business areas, the construction and building sector was particularly strong, increasing in real terms by 15.8% in the last fiscal year, and by over 16% in the first half of the current fiscal year. Tourism development, residential and commercial properties, all contributed to the construction boom. Hefty construction activity has had a positive impact on communications, transport and financial services, all of which grew sharply. In the service sectors, restaurants and hotels revenues, and royalties from the Suez Canal, also posted double-digit growth rates. Manufacturing, which represents the main source of economic growth (19% of GDP) grew by 7.3% in fiscal 2007, as exports of textiles experienced second wind, after the downturn which followed the abolition of the Multi-Fiber Agreement in 2005, helped by the Qualifying Industrial Zone agreement with the US, that grants textile exports duty-free access to the US.
Agriculture, penalized by weather conditions, and oil & gas, restrained by the drop in crude oil output (-0.7%), not entirely offset by a rise in gas output (+7.5%), lagged the other sectors, both last year and in the first part of the current fiscal year.

Egypt: Growth Potential and Business Opportunities April 2008
8
Table 2 - GDP at factor cost by economic activity (2007 at constant prices)
Share of GDP (%) % chg y/yManufacturing 19 7.3Agriculture 15 3.7Wholesale and Retail Trade 12 8.3General government 9 3.4Primary industry 9 3.9Financial services 6 7.1Transportation 5 8.0Construction 5 15.8Suez Canal 4 14.9Restaurant 3 13.2Real Estate 3 4.3Education and Healthcare 3 6.8Communications 2 14.1Others 5 6.6
Source: Central Bank of Egypt, Monthly Statistical Bulletin, March 2008
Investments in tourist infrastructures, residential constructions, transport and communication, are expected to remain the main growth drivers one again this year. Consumption growth should also accelerate, fuelled by a further rise in disposable income. The strength of the domestic components of demand is expected to offset the significant drag of net trade, mostly caused by higher imports of capital and consumer durable goods, and real GDP growth should level off at around 7%.
2.2 Inflation: strong upward pressures, unlikely to ease soon
Inflation in Egypt was relatively mild from 1998 to 2003, averaging just over 3%, compared to an average inflation rate of just below 6% for the MENA group in the period. This was the result of generous subsidies on food and energy products, sold well below market prices, and of the dollar peg. The devaluation of 2003 triggered a sharp acceleration of inflation, which jumped to over 11% at the end of 2004. The phasing-out of the devaluation effect led to a significant slowdown of inflation, which plunged to close to 3% in early 2006. Inflation accelerated back in 2006 and early 2007, reaching a high rate of 12.9% in March 2007, lifted by a combination of demand and supply pressures.
Strong domestic demand and ample liquidity sustained price increases in the housing, consumer durables (furnishing) and semi-durables (clothing & footwear) categories. Supply-side shocks such as higher raw material prices, led by oil, and the bird flu effect, boosted food and energy prices. Via a tightly managed float, the slide of the USD added to import price pressures. In the second half of 2007, the inflation rate fell to reach 6.9% in December as a result of the government's continuous efforts to curb inflation, the economic performance improvement during 2006/2007, the stability of monetary and exchange rate policies and the appreciation of the Egyptian pound. In January 2008, inflation increased again to reach 10.5% which can be attributed to the great increase in the prices of food and beverages. The Central bank is increasingly concerned that high food and energy prices at the international level may seep into core categories. Moreover, it has observed that other sectors, in addition to manufacturing and construction, have started to report higher growth rates that may well fuel new inflationary pressures. The Central Bank decided to raise the overnight deposit and lending rates by 25bp in February to reach 9% and 11% respectively and by 50 bps in March to reach 9.5% and 11.5%.

Egypt: Growth Potential and Business Opportunities April 2008
9
Chart 1 - Main CPI categories (% chg. y/y Dec 2007)
8.6
5.1
2.4
6
1.80.5 0
3.1 2.5
37.8
02468
1012
Food
&be
vera
ges
Clo
thin
g
Utili
ty s
ervi
ces
Hou
sefu
rnis
hing
&m
iant
enan
ce
Hea
lth
Tran
spor
t
Com
mun
icat
ion
Rec
reat
ion
Res
taur
ants
Educ
atio
n
Source: Egyptian Central Bank, Monthly Statistical Bulletin, March 2008
Average inflation should slow to around 8% in 2008, helped by a favourable base effect vs. the first months of last year, when prices increased sharply, led by a stronger currency. However, the planned partial removal of subsidies on fuel products is likely to add to inflation pressures over the coming months. Moreover, the new surge in commodity prices should mitigate the favourable base effect.
Box 1: A comparison with MENA countries
In terms of Nominal Gross Domestic Product, Egypt is the fourth largest economy in the MENA group of countries, behind Saudi Arabia, Iran, and Pakistan.
Per capita income in Egypt, estimated at just above five thousand PPP USD in 2007, is lower than in many other MENA countries, which include scarcely populated, high-income oil economies. Limiting the comparison to emerging economies in the MENA group, per-capita PPP adjusted income in Egypt is just below that of Jordan (USD 5.9k) and Morocco (USD 5.4k), and considerably lower than in Tunisia (USD 9k) and Lebanon (USD 8k). The strong contribution of non-oil sectors to GDP helped Egypt outpace the MENA group in terms of real GDP growth in recent years. However, Egypt is burdened with a large budget deficit and debt, whereas foreign debt is contained. Thanks to large capital inflows, mostly FDI from abroad, Egypt has built up substantial reserves in assets, almost entirely covering foreign debt.
Egypt and MENA Group
Egypt MENA*Nominal GDP USD Bn (2007) 129 1598Real GDP growth % (2007) 7.1 5.5Real GDP growth % (avg. '98- '07) 5 4.8CPI (avg. 2007) 10.9 9.1CPI (avg. '98 - 07) 5.4 5.9Budget balance/GDP (2007) -7.5 4.7Public debt/GDP (2007) 89.1 35Current account balance/GDP (2007) 2.1 10.5Reserve assets (end 2007, USD Bn) 31.7 780Foreign debt/GDP (2007E) 23.1 24.8
Source: World Bank Regional Economic Outlook. Middle East and Central Asia 2007 * Note: The MENA group includes Middle East Oil Exporters, Mashareq, Maghreb , Yemen, Sudan and Mauritania
Egypt: Growth Potential and Business Opportunities April 2008
10
3. Macro policies
3.1 Monetary policy: towards inflation targeting
Monetary policy is in a transitional phase. The regulatory capacity and supervisory apparatuses of the Central Bank of Egypt (CBE) have been strengthened. The Monetary Policy Committee (MPC) has been established to decide on appropriate actions regarding key policy rates, which are communicated to the market through a monetary policy statement .The MPC monitors all inflation-related local and international developments and is moving towards an "inflation targeting" regime instead of an "exchange rate focused" policy. The slide of the USD, which has added to inflationary pressures, has encouraged this process. For most of 2007, the central bank bought excess liquidity generated by balance of payment flows to prevent a revaluation of the currency. Later in the year, it allowed the Egyptian pound to strengthen, dampening inflationary pressures and marking the start of a new monetary policy phase. However, the move to an inflation-targeting regime still requires a few additional steps.
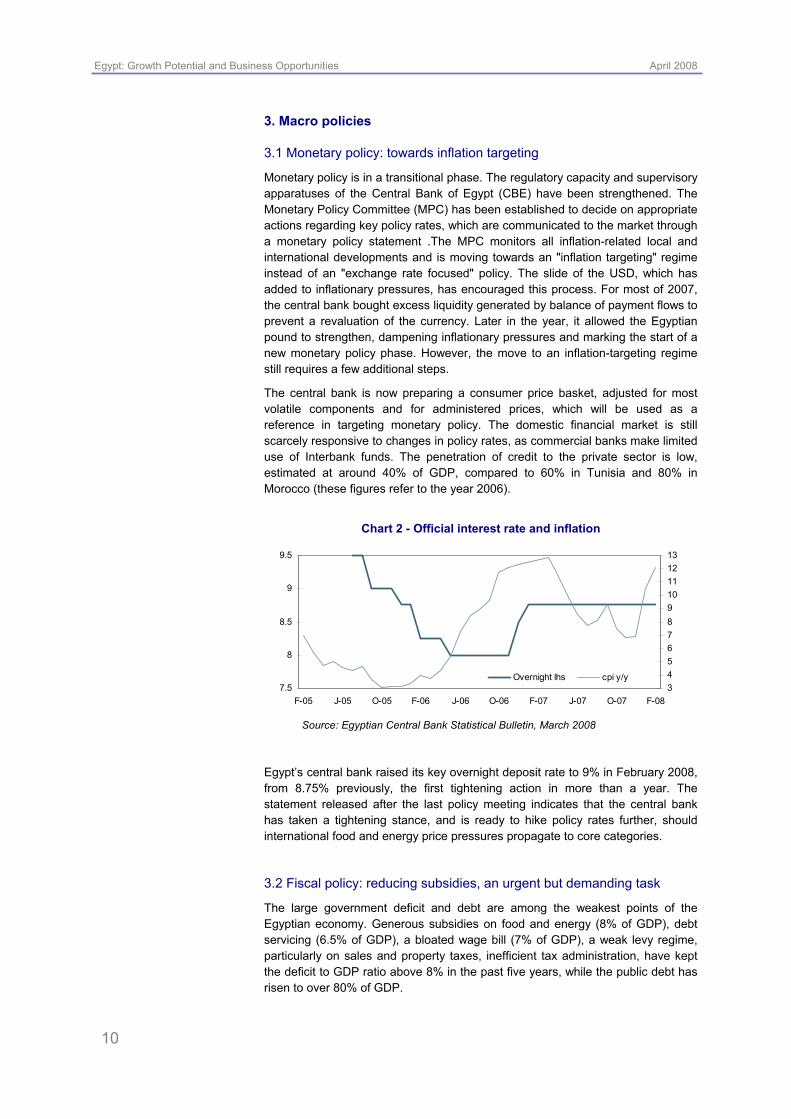
The central bank is now preparing a consumer price basket, adjusted for most volatile components and for administered prices, which will be used as a reference in targeting monetary policy. The domestic financial market is still scarcely responsive to changes in policy rates, as commercial banks make limited use of Interbank funds. The penetration of credit to the private sector is low, estimated at around 40% of GDP, compared to 60% in Tunisia and 80% in Morocco (these figures refer to the year 2006).
Chart 2 - Official interest rate and inflation
7.5
8
8.5
9
9.5
F-05 J-05 O-05 F-06 J-06 O-06 F-07 J-07 O-07 F-08345678910111213
Overnight lhs cpi y/y
Source: Egyptian Central Bank Statistical Bulletin, March 2008
Egypt’s central bank raised its key overnight deposit rate to 9% in February 2008, from 8.75% previously, the first tightening action in more than a year. The statement released after the last policy meeting indicates that the central bank has taken a tightening stance, and is ready to hike policy rates further, should international food and energy price pressures propagate to core categories.
3.2 Fiscal policy: reducing subsidies, an urgent but demanding task
The large government deficit and debt are among the weakest points of the Egyptian economy. Generous subsidies on food and energy (8% of GDP), debt servicing (6.5% of GDP), a bloated wage bill (7% of GDP), a weak levy regime, particularly on sales and property taxes, inefficient tax administration, have kept the deficit to GDP ratio above 8% in the past five years, while the public debt has risen to over 80% of GDP.
Egypt: Growth Potential and Business Opportunities April 2008
11
Table 3 - Budget indicators
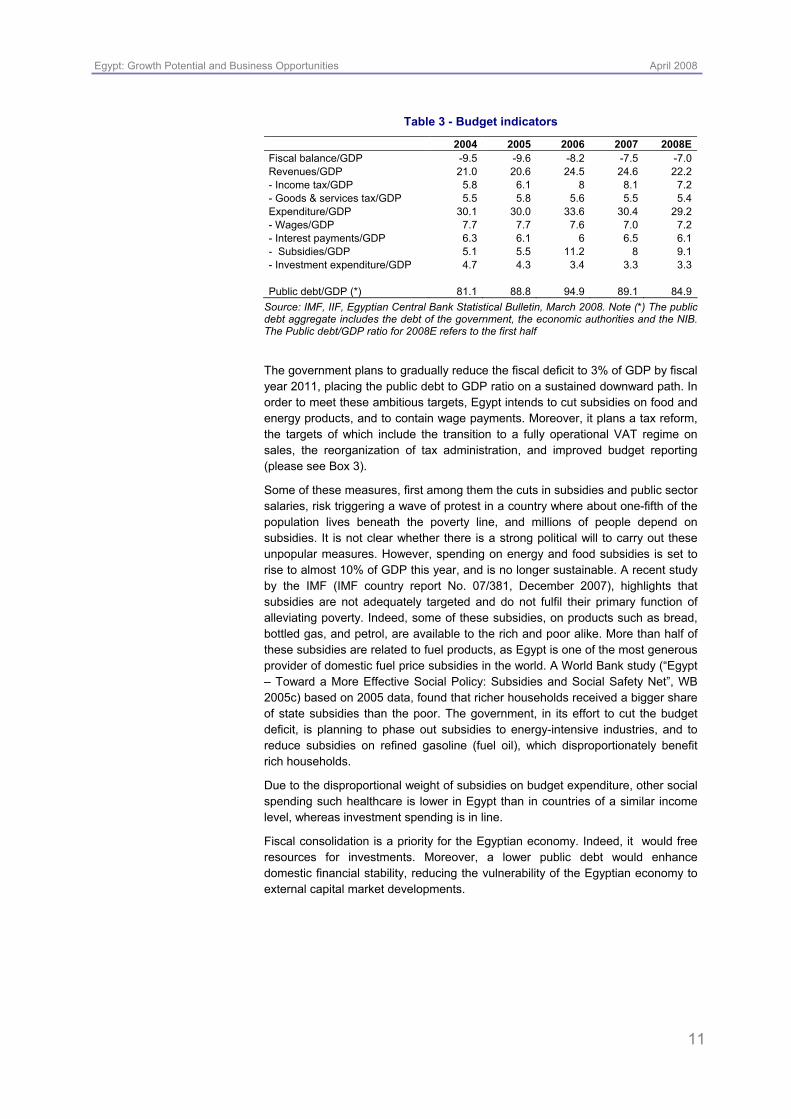
2004 2005 2006 2007 2008EFiscal balance/GDP -9.5 -9.6 -8.2 -7.5 -7.0Revenues/GDP 21.0 20.6 24.5 24.6 22.2- Income tax/GDP 5.8 6.1 8 8.1 7.2- Goods & services tax/GDP 5.5 5.8 5.6 5.5 5.4Expenditure/GDP 30.1 30.0 33.6 30.4 29.2- Wages/GDP 7.7 7.7 7.6 7.0 7.2- Interest payments/GDP 6.3 6.1 6 6.5 6.1- Subsidies/GDP 5.1 5.5 11.2 8 9.1- Investment expenditure/GDP 4.7 4.3 3.4 3.3 3.3 Public debt/GDP (*) 81.1 88.8 94.9 89.1 84.9
Source: IMF, IIF, Egyptian Central Bank Statistical Bulletin, March 2008. Note (*) The public debt aggregate includes the debt of the government, the economic authorities and the NIB. The Public debt/GDP ratio for 2008E refers to the first half
The government plans to gradually reduce the fiscal deficit to 3% of GDP by fiscal year 2011, placing the public debt to GDP ratio on a sustained downward path. In order to meet these ambitious targets, Egypt intends to cut subsidies on food and energy products, and to contain wage payments. Moreover, it plans a tax reform, the targets of which include the transition to a fully operational VAT regime on sales, the reorganization of tax administration, and improved budget reporting (please see Box 3).
Some of these measures, first among them the cuts in subsidies and public sector salaries, risk triggering a wave of protest in a country where about one-fifth of the population lives beneath the poverty line, and millions of people depend on subsidies. It is not clear whether there is a strong political will to carry out these unpopular measures. However, spending on energy and food subsidies is set to rise to almost 10% of GDP this year, and is no longer sustainable. A recent study by the IMF (IMF country report No. 07/381, December 2007), highlights that subsidies are not adequately targeted and do not fulfil their primary function of alleviating poverty. Indeed, some of these subsidies, on products such as bread, bottled gas, and petrol, are available to the rich and poor alike. More than half of these subsidies are related to fuel products, as Egypt is one of the most generous provider of domestic fuel price subsidies in the world. A World Bank study (“Egypt – Toward a More Effective Social Policy: Subsidies and Social Safety Net”, WB 2005c) based on 2005 data, found that richer households received a bigger share of state subsidies than the poor. The government, in its effort to cut the budget deficit, is planning to phase out subsidies to energy-intensive industries, and to reduce subsidies on refined gasoline (fuel oil), which disproportionately benefit rich households.
Due to the disproportional weight of subsidies on budget expenditure, other social spending such healthcare is lower in Egypt than in countries of a similar income level, whereas investment spending is in line.
Fiscal consolidation is a priority for the Egyptian economy. Indeed, it would free resources for investments. Moreover, a lower public debt would enhance domestic financial stability, reducing the vulnerability of the Egyptian economy to external capital market developments.

Egypt: Growth Potential and Business Opportunities April 2008
12
3.3 The External Sector: a waning current account surplus; large FDI
Egypt recorded a large trade deficit of 12.4% of GDP in fiscal year 2007. Despite the trade shortfall, a current account surplus of 2.1% of GDP was recorded in the last fiscal year, although it likely to swing into a small shortfall this year (around 1% of GDP). Royalties from the Suez Canal, tourism receipts and remittances from expatriate Egyptian workers shored up the current account position. Moreover, the income account, which books receipts from foreign assets held by residents and interest payments on external debt, registered a small surplus.
The financial account swung into a surplus (1% of GDP last year) beginning in 2005, mostly following a rise in foreign direct investments in Egypt, which amounted to over USD 13Bn, or 10% of GDP last year. FDI mostly originated in the US (USD 4.6Bn), the EU (USD 4Bn), and Arab countries (USD 3.3Bn), and were primarily directed to the oil, construction, pharmaceutical, communication, and banking sectors. Net portfolio investments were negative in the last fiscal year, despite the fact that foreign investors, while taking profit on their equity investments, bought a significant amount of Egyptian government securities (Treasury bills held by foreigners increased to USD 4.7Bn, or 3.7% of GDP) Indeed, Egyptian residents, mainly banks, used ample available liquidity to purchase large quantities of foreign bonds.
The trends mentioned above were confirmed by data releases in July/December 2007. Over this period, the Balance of Payments ran an overall surplus of USD 3.1Bn, reflecting a net inflow at the capital and financial account levels, and a small current account deficit. More in detail, the trade deficit widened by USD 2.4Bn, swelling to USD 13.1Bn, and foreign direct investments increased by 0.6Bn to USD 7.8Bn.
Chart 3 - Foreign debt/GDP (%)
0
5
10
15
20
25
30
35
2005 2006 2007 2008 2009
Peers Egitto
Source: EIU February 2008
With the Central Bank actively buying Balance of Payment inflows to prevent a currency appreciation, Egypt has accumulated large foreign currency reserves, amounting to USD 31.7Bn at the end of December 2007. Reserve assets almost entirely cover foreign debt (see table below), which rose to USD 31.9Bn in the first quarter of the current fiscal year. Based on data provided by the Egyptian central bank, the State and local governments issued about 65% of this debt, while foreign exposure of the banking system accounts for less than 10% of the total. The comfortable level of reserves, and the fact that only a small portion of the rise in capital inflows seen in recent years is due to volatile portfolio investments, as opposed to a more stable FDI trend, suggest that vulnerability to external shocks is low.

Egypt: Growth Potential and Business Opportunities April 2008
13
However, the trade deficit is likely to widen further, rising to over 15% of GDP in the current fiscal year. The higher deficit reflects the surging prices of imported oil, which transits in Egypt from the Middle East before being re-exported, food, and a strong demand for equipment and consumer durables. The large surplus of the invisible component of the current account (tourism, royalties and remittances), makes a large trade shortfall, typical of underdeveloped emerging economies, sustainable in the medium term.
Table 4 - Balance of Payments
USD Bn 2004 2005 2006 2007Trade balance -7.8 -10.4 -12.0 -15.8Current account balance 3.4 2.9 1.7 2.7Financial account balance -5.0 3.3 3.5 1.1- FDI 0.4 4.1 9.1 13.1 Foreign reserves 14.8 19.3 23.0 28.5External debt value 29.8 28.9 29.5 29.8 Trade balance/GDP -10 -11.6 -11.2 -12.4Current balance/GDP 4.3 3.3 1.6 2.1External debt/GDP 37.7 32.3 27.5 23.1
Source: Egyptian Central Bank Bulletin, March 2008
Box 2: Exchange rate. Is a stronger pound sustainable?
In early 2003, Egypt removed its currency from the US dollar peg and adopted a floating regime, with no pre-announced path for the exchange rate. Despite de jure free floating, the authorities have been managing the exchange rate in a way that ensures the stability of the USD/LE exchange rate. In particular, between 2003 and the first half of 2004, the central bank intervened to prevent excessive devaluation of the Egyptian currency. As of the second half of 2004, the scenario for the pound changed. Current account surpluses and increasing capital inflows exercised upward pressures on the Egyptian currency, and the authorities had to step in to stem the revaluation of the pound.
Egyptian pound vs. USD and Euro
5.45.55.65.75.85.96.06.16.26.3
m-03 s-03 m-04 s-04 m-05 s-05 m-06 s-06 m-07 s-07 m-086
6.5
7
7.5
8
8.5
usd/le eur/le (rhs)
Source: Datastream
However, with the USD on a sliding trend, maintaining a stable USD/LE exchange rate has become increasingly costly in term of sterilization costs, and, more seriously, it has added to inflationary pressures, complicating the management of monetary policy. Therefore, since mid-2007, the exchange rate has been managed more flexibly, in a manner more akin to a managed float regime. This policy led to a small appreciation of the pound against the USD (3% last year; 1% in the first quarter of this year). However, in trade-weighted terms, the Egyptian pound has continued to depreciate and is now over 15% lower than in early 2003, when the dollar peg was officially abandoned. Due to higher relative inflation,

Egypt: Growth Potential and Business Opportunities April 2008
14
nonetheless, the real effective exchange rate has appreciated, and is now in line with its equilibrium level, calculated by the IMF using a model that takes into account productivity and balance of payment position. Based on this model, Egypt has now lost the competitive advantage created by the devaluation of 2000–2003, which anticipated the removal of the dollar peg. However, other models, such as those based on the long-term Real Effective Exchange Rate, indicate that the pound still has further room to rise before entering the overvaluation area, providing that domestic inflation slows significantly.
In the short/medium term, financial inflows, high interest rates, and high oil prices, should continue to support the currency, and the Egyptian pound is likely to appreciate further against the USD, with the central bank probably intervening to control the rise. However, in the long term the Egyptian currency remains vulnerable to deteriorating current account positions, and/or to a sudden change in the assessment of risk about investing in an emerging economy. Indeed, past history points to cyclical currency crises, although the foreign position looks strong now.
Egyptian pound effective exchange rate
60
65
70
75
80
85
M-03 J-04 S-04 M-05 J-06 S-06 M-07 J-08
REER REER 15y avg.
Source: Bloomberg
4. Long-term growth of the Egyptian economy*
This parachart investigates the main drivers of economic growth in Egypt over the past decade. The theoretical framework for the analysis is provided by the growth-accounting approach, suggested by a wide strand of literature on the topic.
In the past ten years, GDP growth rates in Egypt (5.0% on average) have been considerably higher than for the EU15 aggregate over the same period (2.3% on average – see Chart 4). The persistently higher growth rates recorded in Egypt in the last decade have contributed to narrowing the GDP per capita gap (in percentage terms), separating Egypt and the EU15. This gap has narrowed most markedly since 2005, and is currently at around 84% (Chart 5).
Table 5 shows the relative contribution to GDP per capita growth rate made by the two underlying variables, i.e. the Employment Utilisation rate (Employment over Population) and Labour Productivity (GDP per Worker)1. Data inspection
* Part of this paragraph refers to a previous paper by G. Salsecci and A. Pesce (Long-term Growth Perspectives and Economic Convergence of CEE and SEE Countries) in Long-term Growth Perspectives and Financial Market Development in CEE and SEE Countries (January 2008), Intesa Sanpaolo Occasional Studies.
1 The growth rate of per capita GDP may be easily approximated by the sum of Employment Utilisation (Share of Working Population) growth and GDP Per Worker (Labour Productivity) Growth, i.e. g[GDP/N] ≈ g[L/N] + g[GDP/L] where g stands for percentage change, N for population, L for Labour (Workers) and square brackets include the variables with respect to which growth is calculated.

Egypt: Growth Potential and Business Opportunities April 2008
15
suggests that in the long run (average over twelve years, 1996–2007) Labour Productivity growth is the major variable responsible for GDP per capita growth, contributing 2.2 percentage points per year, with the Employment Utilisation rate playing a minor role2, with a contribution of 0.8% per year.
Chart 4 – Real GDP % Growth
0
1
2
3
4
5
6
7
8
1996 1997 1998 1999 2000 2001 2002 2003 2004 2005 2006 2007EGYPT EU15 (AGG.)
Source: EIU
Chart 5 – Egyptian Real GDP per Capita (% UE 15)
13.0
13.5
14.0
14.5
15.0
15.5
16.0
16.5
1996 1997 1998 1999 2000 2001 2002 2003 2004 2005 2006 2007
Source: EIU, Own calculations based on EIU data
Within the framework of a simple Growth Accounting Model, the contribution of Labour Productivity to growth may be explained – through the estimation of a widely used production function3 – by the separate effects of capital accumulation
2 The main change in labour utilisation was tied to employment rate changes, as the age structure of population changed only marginally. See on this point O. Arratibel et al. (2007).
3 The functional form underlying our analysis is a simple Cobb-Douglas Production Function with α =0.35, in line with most empirical work on growth. In this context, g[GDP/L] = α·g [(K/L)] + g[TFP] where g stands for percentage change, K/L is the Capital/Labour ratio and square brackets include the variables with respect to which growth is calculated.
TFP is estimated as residual, and therefore includes the effects of factors other than combined efficiency of capital and labour, such as external shocks, changes in Government Policies, and institutional factors, which are thought to be relevant in the context of transition economies. Also, accounting decomposition is not intended to determine the causes of growth, but simply, as Bosworth and Collins (2003 The

Egypt: Growth Potential and Business Opportunities April 2008
16
(as measured by Capital/Labour changes), and Total Factor Productivity, that is the combined result on production efficiency of both capital and labour. Total Factor Productivity is identified as the most relevant determinant for long-term growth (see Table 5), with a contribution to Labour productivity growth of 2.1% per year, while the capital accumulation contribution is very small (0.1% per year).
It should be noted that in the past few years (2005–2007), the contribution of TFP, as well as the contribution of capital accumulation, were bigger than the long-term average contributions. As a result, the Labour Productivity dynamic was almost one percent point higher than the long-term average. This clear change in the dynamics of Labour Productivity may be partly explained by the efforts made to restructure the production system over the past decade, as well as by the structural surge of Inward Direct Investments (FDI) that almost tripled as a percentage of GDP in 2005–2007 vs. the long-term average (see Table 5).
The progressive opening up of the economy to external trade and international capital flows, in a context characterised by deep structural reforms, lifted FDI flows significantly, promoting production and managerial efficiency, and consequently (and not surprisingly) affecting the TFP performance trend on one side, and capital accumulation on the other.
Over the last few years, Egypt has made progress in moving forward its structural reform program. Structural reform in Egypt is being implemented primarily in three distinct areas4: trade and outward orientation, business and regulatory reform, and governance, broadly corresponding to the key areas of change to create a more open, private-sector-driven, and diversified economy.
Significant trade liberalisation was introduced by Egypt’s broad-based trade reform in 2004, resulting in a reduction in the number of tariff bands, and a reduction of custom duties on over 700 import items. In this area, according to the World Bank, Egypt has made the most significant progress, on average, ranking in the 100th percentile worldwide (see Table 6). In the area of business and regulatory reform, Egyptian reform has centred on a few key areas. One is improving bankruptcy laws, aimed at easing business-unwinding procedures. Another key area was reducing the time and numbers associated with starting a business, and a relative improvement in contract enforcement. The overall state of the business environment in Egypt is still developing. Its improvement has been stronger than the regional average (see Table 6).
In recent years, Egypt has also made significant efforts to reform public administration, both to improve efficiency in the delivery of quality public services, and to lower the large public deficit. The advancement of Egyptian reform in this area was evaluated by the World Bank across two broad spheres of governance: governance related to the quality of public administration, and governance related to public sector accountability5 (see Table 6). The gap between Egypt and the rest of the world in terms of both quality of administration and public sector accountability is large. However, Egypt has taken important steps toward reducing the governance gap. Between 2000 and 2006, Egypt ranked in the 91st percentile with regards to improving quality of administration, and ranked in the 73d percentile in improving government accountability.
Empirics of Growth: An Update, Brooking Papers on Economic Activity suggest), “provide a framework for examining the proximate sources of growth” (p. 116).
4 See 2007 Economic Developments and Prospects by The World Bank. 5 Public sector accountability in 2006 was evaluated by the World Bank on information in
a variety of key accountability areas, including political rights, civil liberties, freedom of the press, and various measures of executive recruitment and participation processes.

Egypt: Growth Potential and Business Opportunities April 2008
17
Chart 6 – FDI and international trade openness
0
2
4
6
8
10
12
14
16
0 50 100 150 200FD
I/GD
P%
(ave
rage
200
3-20
07)
International Trade Openness Index* (average 2003-2007)* Sum of Export (G&S) and Import (G&S) in % of GDP
EGYPT
Source: EIU, Own calculations based on EIU data Note: the chart plots data of 52 countries of different areas (MENA, CEE, SEE, CIS, Latin America and Asia)
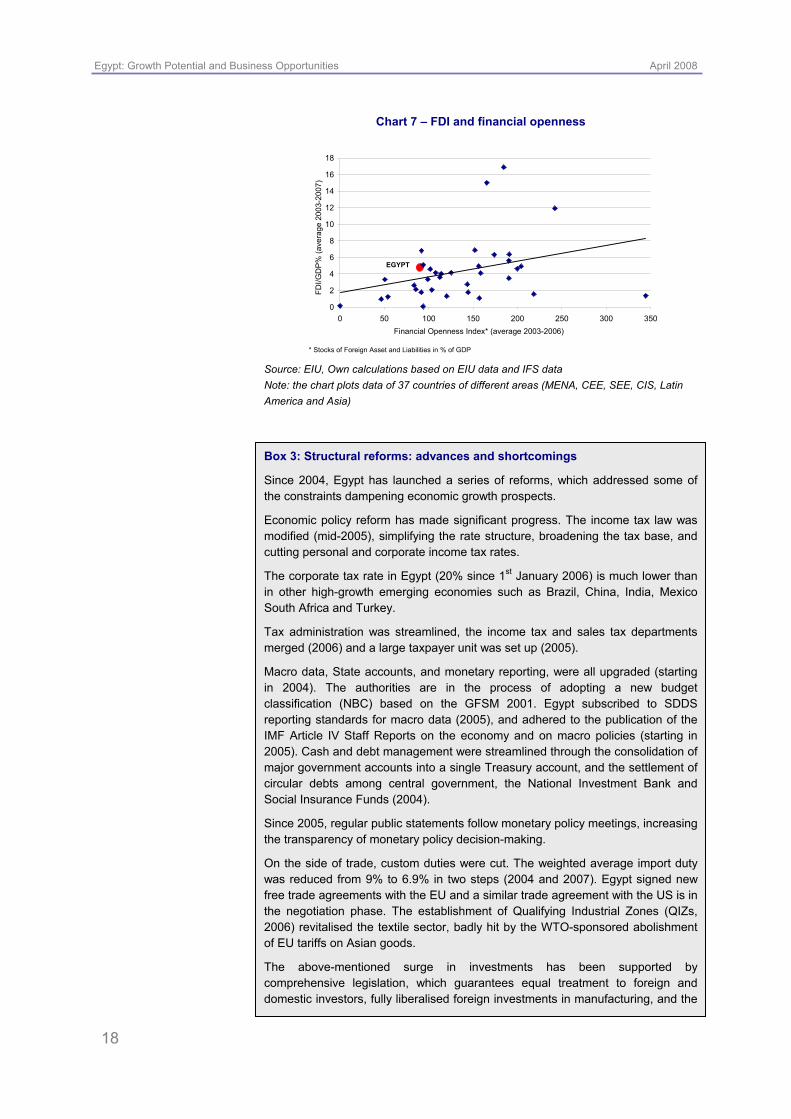
In a context of a deep reform process, FDI flows surged6, with positive effects on productivity and growth. This seems to be supported by the results illustrated in Charts 6 and 7. Chart 6 plots, for a group of emerging economies, the correlation between the average FDI/GDP ratio in 2003-2007, and a traditional measure of International Trade Openness, while Chart 7 shows the link between the same FDI/GDP ratio, and a traditional measure of International Financial Integration7. The scatters, that consider several countries of different areas (such as MENA, CEE, SEE, CIS, Latin America and Asia) indicate a positive correlation in both cases.
Lastly, FDI flows may be viewed as the main channel through which the TFP profile and capital accumulation have been influenced. As acknowledged by a vast body of literature on the topic8, FDIs represent an important vehicle for technology, innovation and knowledge transfers, stimulating competition, providing financial sources to local enterprises, and boosting domestic investments as a result.
6 The OECD Investment Policy Reviews (2007) highlight that Egypt has created a more favourable environment for investment in the past few years.
7 The measure of International Financial Openness used herein is given by the sum of Gross Stocks of Foreign Assets and Liabilities, as suggested by P. Lane, P. Milesi, G. Ferretti 2006 The External Wealth of Nations Mark II: Revised and Extended Estimates of Foreign Assets and Liabilities, 1970-2004, IMF Working paper 06/69.
8 See, among others, M. Neuhaus (2006) The impact of FDI on economic growth. Physica-Verlag, a Springer Company.
Egypt: Growth Potential and Business Opportunities April 2008
18
Chart 7 – FDI and financial openness
0
2
4
6
8
10
12
14
16
18
0 50 100 150 200 250 300 350
EGYPT
Financial Openness Index* (average 2003-2006)
FDI/G
DP
% (a
vera
ge 2
003-
2007
)
* Stocks of Foreign Asset and Liabilities in % of GDP
Source: EIU, Own calculations based on EIU data and IFS data Note: the chart plots data of 37 countries of different areas (MENA, CEE, SEE, CIS, Latin America and Asia)
Box 3: Structural reforms: advances and shortcomings
Since 2004, Egypt has launched a series of reforms, which addressed some of the constraints dampening economic growth prospects.
Economic policy reform has made significant progress. The income tax law was modified (mid-2005), simplifying the rate structure, broadening the tax base, and cutting personal and corporate income tax rates.
The corporate tax rate in Egypt (20% since 1st January 2006) is much lower than in other high-growth emerging economies such as Brazil, China, India, Mexico South Africa and Turkey.
Tax administration was streamlined, the income tax and sales tax departments merged (2006) and a large taxpayer unit was set up (2005).
Macro data, State accounts, and monetary reporting, were all upgraded (starting in 2004). The authorities are in the process of adopting a new budget classification (NBC) based on the GFSM 2001. Egypt subscribed to SDDS reporting standards for macro data (2005), and adhered to the publication of the IMF Article IV Staff Reports on the economy and on macro policies (starting in 2005). Cash and debt management were streamlined through the consolidation of major government accounts into a single Treasury account, and the settlement of circular debts among central government, the National Investment Bank and Social Insurance Funds (2004).
Since 2005, regular public statements follow monetary policy meetings, increasing the transparency of monetary policy decision-making.
On the side of trade, custom duties were cut. The weighted average import duty was reduced from 9% to 6.9% in two steps (2004 and 2007). Egypt signed new free trade agreements with the EU and a similar trade agreement with the US is in the negotiation phase. The establishment of Qualifying Industrial Zones (QIZs, 2006) revitalised the textile sector, badly hit by the WTO-sponsored abolishment of EU tariffs on Asian goods.
The above-mentioned surge in investments has been supported by comprehensive legislation, which guarantees equal treatment to foreign and domestic investors, fully liberalised foreign investments in manufacturing, and the

Egypt: Growth Potential and Business Opportunities April 2008
19
removal of all limits on foreign investments in financial services and telecom companies.
The financial system has recently been the main focus of the reform process. A comprehensive new banking law was introduced in June 2003. The financial sector restructuring program (launched in 2004) covers: bank mergers, sales of stakes in joint-venture banks, which have generated capital funds, privatisation (between mid-2004 and mid-2006), upgrading of supervision, including the overhaul of credit risk management processes, and the introduction of instruments and institutions aimed at facilitating the management of non-performing loans.
Moreover, the authorities have encouraged the development of the mortgage market, set up an Interbank market allowing banks to freely trade foreign currencies (2004), and given the Cairo and Alexandria Stock Exchange (CASE), which is regulated by the Capital Market Authorities, a transparent regulatory framework (2002). In October 2007, CASE’s new market for medium and small enterprises (NILEX) was launched, becoming the first mid and small cap market in the MENA region.
Egypt has been praised by the World Bank for a series of micro reforms, implemented between 2006 and 2007, which have facilitated the establishment of new businesses. The regulatory framework to set-up a new business was streamlined and simplified. Necessary procedures were drastically cut in number, and homogenized throughout the country. The costs of registering a property, dealing with licenses. and minimum capital requirements, have been slashed. And the time needed for imports and exports to clear customs has been reduced.
Doing business in Egypt has become easier and cheaper, although from an international perspective, Egypt continues to lag particularly in the area of contract enforcement, the time needed for winding up a business, and the efficiency of central and local government bureaucracy. In addition, the country’s ranking in terms of global competitiveness, education and training is still low although Egypt is closing the gap with other MENA countries.
Business climate ranking
Global Competitiveness Index Higher education and training
0102030405060708090
100
Qat
arKu
wai
tTu
nisi
aS
Arab
iaU
AEO
man
Bahr
ain
Jord
anM
oroc
coEg
ypt
Syria
Alge
riaLi
bya
3.03.23.43.63.84.04.24.44.64.8
rank lhs score
0
20
40
60
80
100
120
Tuni
sia
Qat
arJo
rdan
Kuw
ait
UAE
Bahr
ain
Om
anS
Arab
iaLi
bya
Egyp
tM
oroc
coAl
geria
Syria
3.03.23.43.63.84.04.24.44.64.85.0
rank lhs score
Source: World Economic Forum 2007

Egypt: Growth Potential and Business Opportunities April 2008
20
Table 5 – GDP Growth and Drivers
FDI/GDP (%)
FDI/Gross fixed
investment (%)
Real GDP
growth (%)
Population change
(%)
Real GDP growth
per head(%)
Employment /Population
growth (%)
Labour productivity
growth (%)
Real stock of capital/
Employment growth (%)
Total factor productivity
growth (%)
(1) (2) (3) (4) (5) 1996 0.9 5.9 5.0 1.9 3.1 -1.2 4.3 0.4 3.9 1997 1.2 5.2 5.5 1.9 3.6 0.2 3.4 -0.1 3.5 1998 1.3 6.0 4.9 1.9 3.0 1.4 1.6 0.2 1.4 1999 1.2 5.7 6.3 1.9 4.3 3.7 0.6 -0.4 1.0 2000 1.3 6.7 5.1 1.9 3.2 -1.3 4.5 -0.3 4.8 2001 0.6 3.2 3.5 1.8 1.6 0.5 1.1 0.2 0.9 2002 0.8 4.3 3.0 1.8 1.1 2.2 -1.1 0.1 -1.2 2003 0.3 2.0 3.2 1.8 1.3 -0.8 2.1 -0.1 2.2 2004 2.7 16.7 4.1 1.8 2.2 1.4 0.8 -0.6 1.4 2005 5.8 32.2 4.5 1.8 2.6 -0.2 2.8 0.4 2.4 2006 9.3 49.7 6.8 1.8 4.9 1.9 3.0 0.1 2.9 2007 10.1 46.7 7.1 1.8 5.3 2.0 3.3 0.8 2.5
Average 1996-2007 2.9 15.3 4.9 1.8 3.0 0.8 2.2 0.1 2.1 Average 1996–2004 1.1 6.2 4.5 1.9 2.6 0.7 1.9 -0.1 2.0 Average 2005–2007 8.4 42.9 6.1 1.8 4.3 1.2 3.0 0.4 2.6 Source: UNCTAD, EIU, our calculations on EIU database and IIF estimate of 2007 FDI Note that (1)≈(2)+(3) and (3)≈(4)+(5); population growth is assumed constant at 1.8% in 2007
Table 6 - Structural Indicators
Trade-policy reform progress, 2000–06
Business and regulatory reform
Quality of public administration
in 2006 and administration reform 2000–06
Public sector accountability, 2006, and
public sector accountability reform 2000–06
Country/region Current*
trade policy 2006
Trade-policy reform** progress 2000–06
Current* business
environment 2006
Reform** progress 2003–06
Quality of administration
index current* status
Quality of administration
reform** index
Public sector accountability
index: current* status
Public sector accountability
reform** index
Egypt 60 100 2 59 34 91 23 73 Regional averages (unweighted) MENA 49 62 44 40 49 57 20 63 East Asia and the Pacific 53 40 64 46 45 45 41 44
Europe and Central Asia 50 64 55 59 50 56 52 56
Latin America and the Caribbean 64 57 47 54 44 43 57 42
High-income OECD 84 61 84 49 89 47 91 47 South Asia 28 41 40 24 33 56 37 31 Sub-Saharan Africa 26 22 27 51 33 51 36 52 World 50 50 50 50 50 50 50 50 Source: World Bank (2007 Economic Developments and Prospects) * Current status reflects country’s current position in a worldwide ranking of countries, with “100” reflecting the country (countries) with the
best status and “0” reflecting the country (countries) with the worst status. See 2007 Economic Developments and Prospects (by The World Bank) for details.
** Reform progress reflects the improvement in a country’s position between 2000 and 2006 in a worldwide ranking of countries, with 100 reflecting the country (countries) that exhibited the greatest improvement in position, and 0 reflecting the country (countries) that exhibited the greatest deterioration in ranking. See 2007 Economic Developments and Prospects (by The World Bank) for details.

Egypt: Growth Potential and Business Opportunities April 2008
21
5. Rating and financial market performance
Foreign investors, namely Gulf Arab funds and US and European investors, poured large sums into the Egyptian stock market and they now account for over 30% of this market’s total turnover. The CASE stock market index surged almost sevenfold from mid-2004 to March 2008. Over the same period, the MSCI emerging market index rose by 127%.
Chart 8 - Stock Market: Egypt and MSCI emerging markets
15000
20000
25000
30000
35000
40000
45000
50000
55000
Jun-04 Mar-05 Nov-05 Jul-06 Mar-07 Dec-071000
3000
5000
7000
9000
11000
13000
MSCI emerging lhs CASE 30
Source: Datastream
The main rating agencies have praised the reform push and the improved growth prospects of Egypt. They have also highlighted that the external position of the country is strong, due to high oil income, tourism receipts, and revenues from the Suez Canal. Moreover, they appreciated the decline in foreign debt and the rise in foreign reserve assets. S&P and Fitch upped the outlook on Egypt’s BB+ foreign currency sovereign credit rating, respectively from Negative to Stable in March 2005, and from Stable to Positive in July 2007. Moody’s recently confirmed its Ba1 rating. However, the same agencies have hitherto refrained from upgrading Egypt’s foreign currency government bond to investment grade, highlighting the risks tied to the large budget deficit, within the context of structurally and stubbornly high current expenditure, rising inflation, and still weak monetary policy management. Moreover, the agency showed concern for political developments, with particular regards to the Mubarak succession, persisting terrorist threats, and the instability of the Middle East region as a whole. Probably as a result of these concerns, the EMBI+ spread of Egypt’s sovereign bond issues has underperformed the EMBI+ composite in recent years, widening to a five-year high during the recent world financial market turmoil.
Chart 9 - EMBI + Spread: Egypt and composite
0
100
200
300
400
500
Jun-04 Mar-05 Nov-05 Jul-06 Mar-07 Dec-07
EMBI+ Egypt EMBI+ composite
Source: Datastream

Egypt: Growth Potential and Business Opportunities April 2008
22
Box 4: Domestic political setting and international relations
The Arab Republic of Egypt has a presidential institutional arrangement. The President is directly elected, and is currently Hosni Mubarak, elected for a fifth six-year term in September 2005.
The Parliament is bicameral: the Majlis al-Shaab (People's Assembly, or lower house) has 444 directly elected members and ten nominated by the President, who may dissolve the Assembly at any time. MPs serve a five-year term. The Majlis al-Shura (Consultative Council, or upper house) was established in 1980 and has 264 members: 176 are directly elected and 88 appointed. The next elections are due in 2011 (presidential) and November 2010 (legislative).
The Council of Ministers is headed by the prime minister. The President is responsible for appointing and dismissing ministers. The People's Assembly may force ministers to resign by passing motions of no confidence in them. Following a change to the constitution in March 2007, parliament may also pass a no-confidence motion against the prime minister.
Egypt's foreign policy operates along moderate lines. Historically, Egypt has entertained good relations with the US and the EU, and has exercised considerable political influence in Africa and the Middle East. In the Arab-Israeli conflict, Egypt has traditionally played the role of regional mediator. It was the first Arab country to sign a peace treaty and to establish diplomatic relations with Israel.
EU relations with Egypt are based on the Euro-Mediterranean Partnership, launched at the 1995 Barcelona Conference between the European Union and its Mediterranean Partners, which were originally 12: Algeria, Cyprus, Egypt, Israel, Jordan, Lebanon, Malta, Morocco, Syria, Tunisia, Turkey, and the Palestinian Authority. Libya currently has observer status at certain meetings. Since enlargement, in May 2004 and January 2007, cooperation has extended to embrace 35 countries, the EU 27, including Cyprus and Malta, and the 10 Mediterranean Partners. Egypt has been one of the leading recipients among the Mediterranean partners in terms of total funds received from the MEDA programme, the principal financial instrument of the European Union for the implementation of the Euro-Mediterranean Partnership. The EU is Egypt’s biggest trading partner. Last year, the EU and Egypt agreed on a Plan of Action, which set the agenda for EU-Egypt cooperation over the following 3-5 years. Under this plan, the UE will support the partner country’s own reform agenda in the economic, social and political areas, with financial assistance (EUR 558 Mln direct, plus up to EUR 300 Mln in lending over the 2007-2010 period), funded with the European Neighbourhood and Partnership Instrument (ENPI).
Military cooperation between the US and Egypt is probably the strongest aspect of their strategic partnership. Egypt is the second-largest recipient of US military aid after Israel.
The Arab League headquarters is in Cairo, and the Secretary General of the League is traditionally an Egyptian. Former Egyptian Foreign Minister Amr Moussa is the present Secretary General of the Arab League. Egyptian Deputy Prime Minister Boutros Boutros-Ghali served as Secretary General of the United Nations from 1991 to 1996.
Egypt is a long-standing member of all major international organisations, including the UN, IMF, EBRD, World Bank, WTO, WHO, and IAEA.
Giancarlo Frigoli and Antonio Pesce

Egypt: Growth Potential and Business Opportunities April 2008
23
International Trade and FDI Flows
1. Introduction
In the past fifteen years, Egypt’s position in terms of international trade and FDI flows has changed significantly, on the back of a string of reforms and agreements signed with numerous countries, not only of the Mediterranean rim, but also representing the main world economies. Changes in the legislation governing industrial and commercial activities have also contributed to increasingly opening up foreign trade and attracting financial flows to the country’s productive activities.
This section will first examine issues tied to the main trade agreements signed in recent years, and data on the country’s trade balance will be provided.
Particular focus will be placed on trade with Italy, and on the specific role of individual districts, for which Egypt is often both an important target market and a partner in delocalising part of the production process and in widening the offer of products.
Egypt’s industrial set up and its peculiar characteristics will be analysed, devoting particular attention to the privatisation plan being implemented by the Government and the changes the sector is experiencing. A chapter will be also dedicated to natural resources, which form the backbone of the Egyptian economy.
Lastly, FDI flows are also analysed, with reference not only to the sectors of destination and countries of origin, but also to opportunities for future growth, through a review of government and private programmes. With regards to investments, international assessments of the country’s appeal will be discussed.
2. Egyptian international trade
2.1 Trade agreements
In recent years, the process of expanding the free-trade area formed by Mediterranean rim countries has accelerated, thanks to Association Agreements and to the commitments made within the WTO, which have allowed the reviewing of customs duties on a large number of products. Egypt entered the GATT (General Agreement on Tariffs and Trade) in 1970, and became a WTO member in June 1995. The opening up of Egyptian trade and economy, which began in 1995 with the Barcelona Process and the establishment of the Euro-Med partnership, has led to widespread collaboration between Mediterranean rim countries and European countries in a variety of fields, embracing social, cultural and security aspects, as well as productive activities, and encouraging greater integration. The Association Agreement between Egypt and the EU, signed in 2001 and effective in 2004, has led to the progressive abolishment of customs duties on both imports and exports, as well as to the cancellation of quotas reserved to foreign markets. In the past few years, Egypt has also become a hub of trade between the Arab world and the EU, thanks to regional agreements including the Agadir Agreement signed in 2004 with Morocco, Tunisia and Jordan, GAFTA (Greater Arab Free Trade Area), and COMESA (Common Market of East and South Africa). In January 2005, an agreement between Israel, the US and Egypt was ratified for the establishment of QIZ (Qualified Industrial Zones), areas in which the production or processing of products in collaboration with Israeli companies, and addressed to the US market, is not subject to customs duties.

Egypt: Growth Potential and Business Opportunities April 2008
24
Also in 2004, the Egypt-EFTA agreement was signed, which came into force last August allowing free trade with Iceland, Lichtenstein, Norway, and Sweden.
Box 1: QIZ – Qualifying Industrial Zones
Qualifying Industrial Zones are special designated areas for the production or the transformation of goods destined to the US market.
They offer:
- Duty-free access to the US Market;
- Simple requirements to benefit from free access: the rules state that 35% of the commodity's value must be manufactured in an Egyptian QIZ, of which a minimum of 11.7% of Israeli input;
- All products benefit from free access: tariff exemption applies to all products, whether produced by the public or private sector, by small, medium or large enterprises;
- Flexible application of requirements: the protocol establishes flexible rules. For instance, Israeli content is not revised for every single shipment of exports to the USA, provided that a factory's cumulative exports every quarter satisfy the agreed ratio;
- No quotas on exported products: free access of products is not restricted by quotas on quantities or seasonal limitations.
There are four Qualifying Industrial Zones:
1) Greater Cairo: Giza, Shubra Al Kheima, Nasr City, 10th Ramadan City, 15th May City, Badr City, 6th October City, Obour City, Kalyoub City and the industrial Area in Gesr El Suez;
2) Alexandria;
3) The Suez Canal Area includes Port Said, Ismaillia, Suez;
4) Middle Delta includes the Gharbia, Dakahlya, Monofia, and Dommiata governorates.
Source: www.Qizegypt.gov.eg
2.2 Trade Flows
Strong economic growth, in a context characterised by Egypt’s high degree of openness to foreign trade, achieved by means of multiple trade agreements with important countries, has driven the country’s trade balance in recent years. Imports have been fuelled by a rapid rise in domestic demand, with exports benefiting from the increased number of target markets. The balance of trade has proven almost consistently negative. In the first nine months of 2007, the trade deficit amounted to almost USD 8Bn (Source: Ministry of Foreign Trade). No trend reversal is forecast in either 2008 of 2009: the trade deficit is expected to increase marginally (IIF and EIU estimates).
Egypt’s main trade partners in 2006 were the United States, Saudi Arabia, and Cina in terms of imports, whereas the main target markets for its exports were India, Italy and the USA. Recent data provided by the Egyptian Ministry of Foreign Trade and Industry on the first nine months of 2007 confirmed this picture.

Egypt: Growth Potential and Business Opportunities April 2008
25
Table 1 - Trade balance
USD M 2002 2003 2004 2005 2006 2007 (Jan./Nov) Exports 4678 6161 7676 10652 13720 14526Imports 12496 10878 12833 19815 20614 24337Trade Balance -7818 -4717 -5157 -9163 -6894 -9811Source: www.CAPMAS.gov.eg
Chart 1 - Trade openness
10.0%15.0%20.0%25.0%30.0%35.0%40.0%45.0%50.0%55.0%
1996
1997
1998
1999
2000
2001
2002
2003
2004
2005
2006
2007
Source: Own calculations on EIU data (2007 EIU estimates)9
Table 2 – Trade balance by product category
USD M Jan/Nov 2007 Exports 14526 Domestic exports 12014 Petroleum exports 7033 Crude Oil 929 Other 6105 Non-petroleum exports 4981 Raw cotton 134 Raw materials 661 Semi-industrial commodities 1478 Industrial commodities 2707 Free-zone exports 2512Imports 24337 Petroleum imports 2451 Non-petroleum imports 18174 Raw materials 4137 Intermediate commodities 8564 Investment commodities 2241 Consumption commodities 3233 Free-zone imports 3712Source: www.CAPMAS.gov.eg
9 (Export + Import)/GDP.

Egypt: Growth Potential and Business Opportunities April 2008
26
Table 3 - Trade balance by geographical destination
USD M Imports Exports 2006 % of total 2006 % of total EU 4592 22.3 4603 33.5 Italy 849 Italy 1266 Germany 1083 Spain 1036 France 622 France 799 EASTERN EUROPE 1568 7.6 148 1.1 Russia 53 Russia 778 Romania 39 Ukraine 499 Ukraine 23 Romania 160 NAFTA 1727 8.4 1225 8.9 USA 1604 USA 1189 LATAM 984 4.8 51 0.4 Brazil 768 Brazil 38 ASIA 3971 19.3 2547 18.6 China 1196 India 1392 Japan 547 Turkey 363 India 355 South Korea 228 AFRICA 98 0.5 144 1.1 Malawi 18 Kenya 46 South Africa 14 Nigeria 8 Zambia 24 South Africa 9 ARAB COUNTRIES 3950 19.2 2212 16.1 Saudi Arabia 1425 Saudi Arabia 319 Kuwait 1094 UAE 303 Algeria 602 Syria 256 AUSTRALIA 332 1.6 6 0.0 Australia 285 Australia 5 Others 3391 16.5 2782 20.3TOTAL 20614 100.0 13720 100.0Source: Ministry of Trade and Industry
3. Italy as one of Egypt’s most important trading partner
3.1 Trade flows with Italy
Italy, historically the country’s most important target market, overtaken only in 2006 by India, which has significantly stepped up its quota, is one of the main purchasers of Egyptian products. Italy mostly acquires petroleum products (around 45% of the total), but the weight of steel products, non-ferrous metals and basic chemicals is also increasing. According to ICE (Istituto per il Commercio Estero Italiano - Italian Institute for Foreign Trade), in 2006 particularly strong trends were recorded by clothing, textiles and marble, although imports of these products were still marginal in absolute terms (EUR 10-20M).
Table 4 - Imports and exports between Italy and Egypt
EUR M 2004 2005 2006 2007EItalian exports to Egypt 1352 1387 1539 2146Italian imports from Egypt 1280 1279 2170 1825Source: www.ISTAT.it

Egypt: Growth Potential and Business Opportunities April 2008
27
Table 5 – Italy/Egypt imports and exports by product category in 2006/2007
EUR M 2006 % on Tot 2007 % on Tot Imports Total 2170.0 1825.0 Food and live animals 92.0 4.2% 97.5 5.3%Beverages and tobacco 0.2 0.0% 0.3 0.0%Raw materials 87.1 4.0% 76.7 4.2%(excl. food and fuels) Fuels 1250.9 57.2% 802.2 44.0%Fats and waxes 1.1 0.1% 1.5 0.1%Chemicals products 124.5 5.7% 141.3 7.7%Final products 591.8 27.1% 678.9 37.2%Machinery and transport materials 22.6 1.0% 27.0 1.5%Others 0.4 0.0% 0.2 0.0% Exports Total 1539 2146 Food and live animals 18.6 1.2% 19.9 0.9%Beverages and tobacco 8.8 0.6% 12.6 0.6%Raw materials 25.86 1.7% 22.68 1.1%(excl. food and fuels) Fuels 116.83 7.6% 165.67 7.7%Fats and waxes 0.6 0.0% 0.45 0.0%Chemicals products 262.33 17.0% 320 14.9%Final products 414.02 26.9% 531.86 24.8%Machinery and transport materials 691.8 45.0% 1072.3 50.0%Others 0.5 0.0% 0.87 0.0%
Source: www.ISTAT.it
As a supplier, in 2006 Italy ranked fourth in the world, and government statistics pointed to a similar position in September 2007. Asian markets, and China first among them, are taking on increasing weight also on Egyptian imports. Machinery accounts for the largest single item of Egypt’s imports from Italy (around 40% of the total). In 2006, the sharpest increases were recorded by machinery for special productions, for the production and exploitation of mechanical energy, tooling machinery, metal products, pharmaceuticals and chemicals, household appliances, and refined petroleum products. Imports of consumer goods are still rather limited (around 3% of the total), although the recent reduction of customs duties and the simplification of import procedures could encourage growth also in this segment. At present, according to ICE, Italy’s priority is to safeguard its market share in all the segments of the mechanical sector, facing up to competition from Emerging Economies, the Asian first among them. On the other hand, intermediate goods, namely metals and chemicals, have a good margin for growth. Companies active in these sectors may also opt to enter an existing productive system, through joint ventures or investments in production.
3.2 Exports of Italian industrial districts to Egypt
Italian small and medium-sized enterprises entertain special relations with their Egyptian counterparts, thanks to a number of sector-specific agreements signed as of 1998. The Italian industrial districts involved in this initiative are of manufacturing vocation, ranging from the mechanical to the textile sector, from the transformation of agricultural products to the wood industry and the furniture segment in particular, from shoes to leather processing at large, and goldsmithery. The general aim of the cooperation between the two Mediterranean countries, according to ICE, is to enhance collaboration among companies by encouraging the exchange of information on the various production activities, and

Egypt: Growth Potential and Business Opportunities April 2008
28
the implementation of technological know-how geared to optimising and updating industrial processes, in order to take on the international markets and compete with other Emerging Economies.
Table 6 – Exports of Italian industrial districts to Egypt (by product area)
EUR M % of total sector exports
% of total district exports to Egypt
Average annual change (in %) Sectors
2000 2006 2000 2006 2000 2006 '01-'05 2006 I-III 2007Total, of which: 169.6 168.9 0.3 0.3 100.0 100.0 -3.5 19.0 21.6 Instrumental mechanics 59.5 75.5 0.9 1.0 35.1 44.7 2.3 13.2 7.0Fashion: consumer goods 28.0 20.3 0.1 0.1 16.5 12.0 -10.4 24.9 17.3Fashion: intermediate goods 8.6 16.5 0.1 0.3 5.1 9.8 5.5 46.5 -8.5Wooden furniture and appliances 18.3 11.6 0.2 0.1 10.8 6.9 -13.3 29.3 21.2Construction industry goods 27.1 9.3 0.5 0.1 16.0 5.5 -27.6 73.3 120.5Miscellaneous mechanics 5.5 7.8 0.6 0.6 3.3 4.6 20.1 -43.8 1.7Metal intermediate goods 6.6 6.9 0.7 0.6 3.9 4.1 -1.7 13.0 61.8Household goods 6.9 6.6 0.3 0.2 4.1 3.9 -7.6 40.6 75.2Source: Intesa Sanpaolo on ISTAT data
Table 7 – Exports of Italian industrial districts to Egypt
EUR M Average annual change (in %) % of tot. district exports Name of district
2000 2006 '01-'05 2006 I-III 2007 2000 2006Total, of which: 169.6 168.9 -3.5 19.0 21.6 0.3 0.3Packaging machinery, Bologna 19.6 20.2 7.9 -29.3 8.2 1.8 1.3Instrumental mechanics, Val Seriana 6.3 14.3 -7.4 231.8 -76.9 1.0 1.8Instrumental mechanics, Vicenza 7.9 12.6 4.8 26.4 47.3 0.8 1.2Instrumental mechanics, Varese 11.8 11.8 -14.4 118.0 58.2 1.3 1.3Locksmithery, Brescia and Brescia Valleys 8.0 10.2 -5.5 68.7 65.3 0.6 0.4Instrumental mechanics, Brescia area 5.1 10.1 6.5 44.8 -42.6 0.7 1.2Textile clothing, Schio-Thiene-Valdagno 1.5 8.5 24.7 93.6 9.0 0.1 0.6Taps and kitchenware, Lumezzane 17.2 6.1 -25.3 51.3 142.6 1.4 0.2Aspirator hoods and appliances, Fabriano 3.7 5.9 -0.6 66.1 36.0 0.3 0.3Taps and Fittings, Cusio-Valsesia 9.2 4.5 -25.2 110.8 44.0 0.9 0.3Eyeware, Belluno 2.8 4.4 7.4 10.9 26.8 0.4 0.3Locksmithery, Low Mantua area 5.0 4.3 20.1 -65.8 -19.6 0.8 0.6Thermo-machinery, Verona area 1.9 3.8 -0.1 98.1 54.1 0.3 0.4Biomedical, Mirandola 2.8 3.2 -3.9 41.1 -9.1 1.1 1.0Metal products, Lecco-Premana area 0.9 3.0 30.4 -15.3 15.0 0.2 0.3Food industry machinery, Parma 2.6 2.8 7.8 -25.2 274.8 0.9 1.0Appliances, Inox valley 7.4 2.6 -21.7 20.7 -28.7 0.6 0.2Textiles and clothing, Treviso 0.3 2.5 43.0 49.5 -20.2 0.0 0.2Paper, Capannori 0.1 2.5 31.4 460.3 34.1 0.0 0.5Textiles, Prato 2.9 2.3 -3.7 -3.7 -10.9 0.1 0.1Clothing, Naples area 1.7 2.1 -2.3 39.8 -13.2 0.8 0.8Textiles and clothing, Val Seriana 3.9 2.0 -10.7 -11.4 0.7 0.4 0.2Textiles, Biella 0.6 1.8 22.0 10.2 -52.9 0.1 0.2Silk textiles, Como 2.8 1.7 -16.5 45.6 -25.5 0.2 0.1Shoes, Fermo 2.0 1.5 -10.6 31.6 58.5 0.1 0.1Wooden furniture, Brianza area 3.4 1.5 -13.2 -10.4 18.5 0.2 0.1Rubber and plastics, Varese 2.5 1.4 -9.9 -6.2 32.2 0.5 0.2Leather tanning machines, Vigevano 3.0 1.3 8.8 -72.3 -2.1 1.2 0.6Textiles and clothing, Gallarate area 0.8 1.2 1.7 52.4 53.1 0.1 0.2Source: Intesa Sanpaolo on ISTAT data

Egypt: Growth Potential and Business Opportunities April 2008
29
A noteworthy collaboration is that between Egypt and the Parma Food Valley, not only strictly in the food sector, but also in the processing, preservation and transformation of agricultural products, packaging, the related mechanical industry, and the machinery used in the sector as a whole. The Egyptian and Italian Ministries of Agriculture signed an agreement in 2002 to establish a “green corridor”, aimed at strengthening and rationalising collaboration between the two states, and therefore effectively opening up the European market to Egyptian agricultural products. The introduction of traceability has allowed the African country’s agricultural products to reach the European markets, via Italy’s mediation. The tables below detail the trends of each sector and district in the past five years, the weight of exports to Egypt on the total, and its development over time.
4. Natural resources
A variety of natural resources are available, and Egypt’s mineral resource development is coordinated by the Egyptian Geological Mining and Survey Authority (EGMSA).
Table 8 – Energy resources
Electricity Oil Natural Gas Production 102.5 Bn KWh Production 0.688 M b/d Production 40.76 Bn m3 Consumption 84.5 Bn KWh Consumption 0.635 M b/d Consumption 32.81 Bn m3 Export 0.95 Bn KWh Export 0.153 M b/d Export 8.0 Bn m3 Import 0.17 Bn KWh Import 0.070 M b/d Import 0 Bn m3
Source: CIA - update to 2005
4.1 Oil
The most important energy resource is still petroleum, and the main oil fields are located along the coasts of the Suez Gulf, where around 50% of the total is extracted, El-Alamein, and in the Sinai peninsula. The leading oil company is Gupco (Gulf of Suez Petroleum Company), born from an agreement between BP and Egyptian General Petroleum Corporation (Egpc). Another important name in the extraction sector is Petrobel, a joint venture between Egpc and ENI, mostly active in the Suez Gulf. Other major names also see the participation of foreign companies, which allow the development and exploration of new extraction fields, especially in desert regions. According to EIA (Energy International Agency), overall reserves add up to around 3.7 Mln barrels, or around 0.3% of the world total. In 2005 production came close to 580,000 b/d, i.e. less than 1% of the world total. The oil processing and refining industry is relevant, with nine companies currently processing around 760,000 b/d in total. There are plans to step up production capacity, also with the support of foreign capital, with the construction of two important new plants. The first will be built near the Suez Canal, and have a capacity of 500,000 b/d, entirely reserved to exports, and will be the result of a joint venture between Egypt, Saudi Arabia and Kuwait. The second will be built on the Red Sea, in Ain Sukhna, and have a refining capacity of 130,000 b/d. Both will be completed by the end of 2009.
4.2 Natural gas
Natural gas plays an increasingly important role in the Egyptian economy, and production has increased in the past fifteen years thanks to the presence of

Egypt: Growth Potential and Business Opportunities April 2008
30
foreign multinationals. Following the recent discovery of new fields, the natural gas sector could provide considerable impulse to the growth of this important African economy. According to EIA estimates, Egypt accounts for around 1% of the total world reserves, or around 1,650Bn m3, and in 2006 production amounted to around 34.8Bn m3. The most important extraction fields are located in the Nile delta and in the Western desert, and make Egypt one of the largest producers in the world. The leading Egyptian company is state-controlled Egas, an Egpc spin-off; numerous mixed-capital companies are active in the country, which see the participation of foreign groups such as ENI. Exports of natural gas are mostly directed to Israel, the main purchaser, whereas oil exports are mostly addressed to the Mediterranean rim, where it is transported via the Suez Canal and by means of the SuMed (Suez-Mediterranean) pipeline. Both this pipeline and the port on the canal allow production in the entire Persian Gulf to reach the Mediterranean markets. The pipeline is managed by a company born from a joint venture among the main world producers of Middle Eastern oil (Saudi Arabia, Kuwait, UAE, Qatar).
Chart 2 – Natural Gas production
86 82
64
27 2110
0
20
40
60
80
100
Iran Algeria SA Egypt Nigeria Kuwait
Source: GAFI
4.3 Other mineral resources
Phosphates are found in the eastern desert regions, as well as manganese, titanium and iron, of wide use in the chemical and metal-processing industries. Exploitation of the uranium reserves found in the Assuan region only began in the 1990’s.
4.4 Electricity
Important hydroelectric power plants are installed in the Assuan region, and together with the Nasser power stations, provide the country’s supply of electricity. However, most of the country’s energy is produced by gas-fuelled power plants (85%), and the use of hydroelectric facilities remains limited. The electric power sector is currently in the hands of seven state-owned companies, controlled by the Egyptian Electricity Authority. Privatisation in the sector is still limited, but may accelerate sharply in the coming ahead.

Egypt: Growth Potential and Business Opportunities April 2008
31
5. Foreign Direct Investment Flows
Foreign investments have increased considerably in the past five years, rising from just over USD 0.5Bn in 2001 to more than USD 10Bn in 2006. Last year, preliminary estimates set FDI at over USD 11Bn (USD 9 Bn in the first three quarters). Investments in the oil sector accounted for around 30% of the total in 2005/06, with the remainder addressed to other industrial sectors. Of these, more than half (54.78%) were used for capital increases and the establishment of new companies. (Source: OECD – Central Bank of Egypt)
The rules governing foreign investments in Egypt have changed in the past few years, although the regulatory framework is still the one established in 1995 by the Investment Code, and amended by the important reform of 2004. Since promulgation of the first law in this area in 1981 (The Company Law n. 159/1981), others have been introduced, establishing among other things the six EZSN free zones (See: the Law of Economic Zones of a Special Nature n. 83 and 94/2002), to which others were added where specific tax breaks are applied. The laws mentioned above set rules on which types of companies may operate in Egypt, liberalising investment possibilities in all manufacturing sectors, conceding custom duty exemptions and tax breaks. More recently, rules have been laid out for investments in the energy, transport and construction sectors, where, however, restrictions on acquisitions with foreign capitals are still in place. Corporate taxation was also reformed in the same year, and the corporate tax rate unified at 20%. Nonetheless, despite the efforts being made, there are still technical deficiencies effectively limiting FDI flows, tied to an excess of bureaucracy in administrative procedures, long waiting times to solve any legal disputes, and to restrictions imposed by anti-monopoly laws.
Table 9 – Egypt: FDI Stock and Flows
USD Bn (at current prices) FDI Stock 2000 2001 2002 2003 2004 2005 2006World 5802.9 6212.1 6815.8 8220.3 9544.9 10129.7 11998.8Developing economies: Africa 151.0 148.8 163.7 200.4 237.4 264.5 315.1Northern Africa 43.9 48.8 55.9 65.7 74.2 85.3 115.8Egypt 18.25 18.76 21.11 21.35 23.51 28.88 38.93USD M (at current prices) FDI Flows 2000 2001 2002 2003 2004 2005 2006World 1409.6 832.2 617.7 557.9 710.8 916.3 1305.9Developing economies: Africa 9.6 19.9 13.0 18.5 17.2 30.7 35.5Northern Africa 3.5 5.4 3.9 5.4 5.9 12.7 23.3Egypt 1.24 0.51 0.65 0.24 2.16 5.38 10.04
Source: Unctad
The trend of FDI flows to Egypt has benefited from the privatisation process which began in 2003/2004 and continued over the following years.
Broken down by destination, foreign capital inflows have slowed in the oil sector in the past three years, as opposed to stronger flows directed to non-oil productive segments.

Egypt: Growth Potential and Business Opportunities April 2008
32
Chart 3 – FDI Stocks as a percentage of GDP
0 5 10 15 20 25 30 35 40
Egypt
North Africa
Africa
Developing economies
World
2006 2005 2000 1990
Source: UNCTAD – World investment report 2007
Table 10 – FDI Flows to Egypt by geographical origin and by industrial destination
FDI Flows to Egypt, by geographical origin July 2006/March 2007 (USD M) FDI Flows to Egypt (Net) 9045.3 Inflows 10447.3 USA 3054.7 EU Countries 3477.9
- UK 1681.3 - Italy 1628.3
Arab Countries 3095 - UAE 2880.6
Other Countries 819.7 - Switzerland 45
Capital Repatriation 1402 FDI Flows to Egypt, by industry 2001/04 (EGP M) 2001 2004 Total 1215 2869 Primary 167 161
- Agriculture, hunting, forestry and fishing 63 131 - Mining, quarrying and petroleum 104 30
Secondary 624 1493 - Food, beverage and tobacco 142 534 - Textiles, clothing and leather 15 225 - Wood and wood products 5 2 - Chemicals and chemicals products 462 732
Tertiary 424 1215 - Finance 424 1215
Source: Central Bank of Egypt
Italy invested most in the oil, gas and cement sectors, although it was also present in all the other productive activities, and chiefly agricultural products, construction, tourism, banking, and hygiene and environmental protection services. In recent years, Italy’s position has strengthened mostly on the back of the acquisitions made by Italcementi and Intesa Sanpaolo, which added themselves to the initiatives taken by ENI, present in Egypt ever since the 1950’s, Pirelli Pneumatici, and a number of textile sector companies.

Egypt: Growth Potential and Business Opportunities April 2008
33
The leading groups with investments in the country are: Alitalia, Ansaldo, Castagnetti, Danieli, Nuovo Pignone, Gavazzi, Italcementi, Pirelli pneumatici, Alcatel, Iveco, Impregilo, ENI, Enichem, Saipem, Edison, Grimaldi, Costa Containers, Alpitour, Turisanda, Valtur, Ventaglio, Intesa Sanpaolo, Monte dei Paschi di Siena, Piaggio, Zanussi, Iveco, Benetton, Caffè Gavazza, Caffè Segafredo, and Caffè Illy.
Chart 4 – FDI in the oil and non-oil sectors
0%
25%
50%
75%
100%
2005 2006 2007
FDI
Oil sector Sale of assets to non-residentsNew establishments and expansions
Source: Central Bank of Egypt
5.1 The privatisation programme
The privatisation process, which has accelerated as of 2004 thanks to Egyptian government’s new focus on economic growth10, is involving all the country’s main industrial sectors. On the whole, disposals of state-owned companies have generated around EUR 4.5Bn (EGP 33,951Bn) for the State, whereas between June 2006 and June ’07, privatisations generated around EUR 2Bn (EGP 13.6Bn) with a total of 53 transactions being completed. Major operations included the sale of Bank of Alexandria to Intesa Sanpaolo, and the acquisition of Telekom Egypt by Etisalat (UAE). The Ministry of Investments has compiled a list of 70 investment opportunities in different sectors, ranging from agriculture to energy, from the manufacturing industry to environmental services.
The increased interest of international investors was evident not only in their participation in the privatisation programme, but also in their role in the establishment of new Egyptian companies and in the expansion of exiting enterprises. Klaus E. Meyer and Saul Estrin11 consider the growing interest in le local companies, and in green-fields, as indicative of an already dynamic industrial setup, which is allowing the development of the country’s production framework with the integration of new resources in terms of both technology and capitals. This process is of crucial importance for the transformation of companies in sectors undergoing liberalisation, or where privatisation has begun.
10 The Asset Management Programm (APM). 11 Klaus E. Meyer and Saul Estrin, Investment Strategies in Emerging Markets: An
Introduction to the Research Project, 2004, EE Editions.

Egypt: Growth Potential and Business Opportunities April 2008
34
5.2 International Indexes
Unctad compiles a ranking of 141 countries based on Inward FDI Performance Index12. In this ranking, Egypt has gained numerous positions over the past few years, thanks to reforms and new legislation geared to attracting more foreign capitals, as of 2004/2005 in particular.
Table 11 – Inward FDI performance Index
2005 2006Moldova, Republic of 34 28Congo 17 29Chile 27 30Latvia 48 31Czech Republic 31 32Egypt 68 33United Kingdom 47 34Trinidad and Tobago 22 35Croatia 40 36Ukraine 35 37Hungary 42 38
Source: UNCTAD
The improving business climate seen in recent years thanks to institutional and legislative advancements is confirmed by the Doing Business survey, carried out every years by the World Bank. In the WB ranking of 172 countries, Egypt scored the best progress in absolute terms last year, moving up from position 152 to 126. Marked improvements were observed in terms of administrative procedures, recourse to credit and in trade with foreign countries.
Table 12 – World Bank Report Doing business 2007
2008 2007 Chg.Doing Business 126 152 -26Starting a Business 55 126 -71Dealing with Licenses 163 165 -2Employing Workers 108 106 2Registering Property 101 147 -46Getting Credit 115 156 -41Protecting Investors 83 105 -22Paying Taxes 150 152 -2Trading Across Borders 26 86 -60Enforcing Contracts 145 146 -1Closing a Business 125 124 1
Source: WorldBank - Doing Business 2007
Wilma Vergi
12 The Inward FDI Performance Index ranks countries by the FDI they receive relative to their economic size. It is the ratio of a country’s share of global FDI inflows to its share of global GDP. The index highlights how FDI is influenced by factors other than market size, such as business climate, economic and political stability, presence of natural resources, infrastructure, skills and technologies, opportunities offered by privatisation, and the effectiveness of FDI promotion. Countries are ranked from 141 to 1: the lower the number, the better the country’s position. The formula is: INDi= (FDIi/FDIw)/(GDPi/GDPw) Where: INDi is the country’s Inward FDI Performance Index FDIi is the country’s FDI inflow FDIw are worldwide FDI inflows GDPi is the country’s GDP GDPw is global GDP.

Egypt: Growth Potential and Business Opportunities April 2008
35
Industrial Structure Development
1. Introduction
The industrial sector is a major growth driver in the Egyptian economy as it has strong backward and forward linkages with both the agriculture and services sectors. The industrial sector is expected to play an instrumental role in increasing growth rates, generating employment opportunities, and fostering Egypt's integration into the global economy.
The Industrial sector today is home to a rapidly growing number of companies in fields including chemicals, food processing, spinning and weaving, ready-made garments, construction materials, and engineering.
Egypt has available production factors such as capital, raw materials, and cheap and abundant labour. The Government has made strenuous efforts to encourage investors to invest in Egypt, by granting numerous facilitations and creating a suitable investment climate.
Egypt possesses a communications network that facilitates the transportation of goods and products to the local and world markets. In addition, it can boast three independent mobile phone networks, covering nearly 100% of the country’s inhabited territory. More than 8% of the world’s total shipping transits the Suez Canal each year. Wireline broadband is readily available in urban centres. The country’s 14 ports serve the nation’s exporters and importers alike, while an expanding and improving airport network caters to both passenger and cargo traffic.
Industrial, free, and special economic zones are distinctive investment areas in Egypt. Their establishment represents an important industrial policy instrument for the Government to attract investments, increase exports and foster domestic production. Deep structural reforms undertaken by the Egyptian Government have played a key role in improving the outlook for domestic and foreign investment in Egypt. To this regard, Egypt was named Top Reformer by the World Bank, based on its "Doing Business" index for 2008.
In light of Egypt’s competitive advantages in sectors like manufacturing, subject to ongoing reform, solid domestic growth, and favourable external conditions, global economists agree that the Outlook for 2008 and beyond is very promising. By the year 2025, Egypt is expected to be a leading industrialising nation of the MENA region in terms of industrial performance, as well as a leading export hub for medium-technology-content manufactured products.
2. Industrial specialisation
The Government’s industrial policy is continuously geared to fostering Egyptian industries and improving their product quality, enabling them to compete on the world markets. As a result, Egyptian industry has engaged in new fields such as electronic programming and advanced technology. The backbone of the Egyptian industrial structure is formed by a number of important business areas, such as textiles, pharmaceuticals, food, cement, steel, and the automotive industry.
2.1 Industrial sector development
Industrial development in Egypt is characterised by two main trends. The first is the establishment of new technologically competitive industries, and the second is the expansion and renovation of existing industries to increase their productivity.

Egypt: Growth Potential and Business Opportunities April 2008
36
Egypt’s proposed Industrial Development Strategy is centred on three major goals13: • Achieving stronger industrial production development by aggressively
pursuing export growth and attracting FDI, both effective vehicles in supporting Egypt’s drive towards regional and global integration;
• Achieving leapfrog industrial productivity growth by means of a carefully-designed set of policies and programs aimed at leveraging industrial competitiveness.
• Achieving a gradual shift in the industrial structure, from resource-based and low-tech activities, to medium and high-tech industries.
The manufacturing sector recorded increasing growth rates over the period (2002/2003–2006/2007) reaching 7.3% in 2006/200714.
Chart 1 - Development of Annual Real Growth Rates of Industrial Products
2.3
3.6
5.1
5.8
7.3
0
1
2
3
4
5
6
7
8
2002-'03 2003-'04 2004-'05 2005-'06 2006-'07
%
Source: Ministry of Economic Development
The value of industrial production (at current prices) amounted to EGP 86Bn in 2006/07, i.e. around 18% of GDP, whereas the industrial sector’s contribution to GDP growth was 15% in the 2002/2003–2006/2007 period.
As for sub-sector performances, textiles accounted for 31% of total industrial production at year-end 2006/07, versus 26% for chemicals, 16% for engineering, 15% for food processing, and 12% for basic metals.
Authorities are targeting a 10% growth in manufacturing by 2011, absorbing 2.5 million workers, boosting investments, raising exports to USD 8Bn, introducing technology, and improving quality standards. The Government is planning to directly support 16 sectors, while developing infrastructure and creating an environment conducive to manufacturing expansion. A program to establish 19 industrial zones by 2011 is already underway, with six of these due to be completed in 200815.
13 Source: - Industrial Modernisation centre – www.imc-egypt.org/en/studies - United Nations Industrial Development Organisation (UNIDO) – www.unido.org.
14 Source: State Information Service (SIS), (Year Book 2007).
15 Source: Ministry of Economic Development, the Sixth 5–Year Plan 2007/2012.

Egypt: Growth Potential and Business Opportunities April 2008
37
Chart 2 - Development of Non-Petroleum Industrial Exports
5.0
6.5
8.5 8.2
11.9
0
2
4
6
8
10
12
14
2002-'03 2003-'04 2004-'05 2005-'06 2006-'07
$ Bi
llion
Source: Ministry of Economic Development
Non-petroleum industrial exports rose in 2006/2007 by 45%. Hence, authorities are further focusing on non-oil industries, aiming to turn this sector into a leading economic driver. This approach confirms that economic development is on the right track. Expanding non-oil industries will reduce dependence on exhaustible resources and vulnerability to international oil price fluctuations, while at the same time developing productive capacity in industries capable of creating more jobs in relative terms.
2.2 Industrial sector competitive advantages, as reported by the Ministry of Investment:16
Activation of the industrial modernisation initiatives to improve the competitiveness of Egyptian industries;
Availability of raw materials and production inputs at competitive prices; Good transportation networks; Availability of skilled labour force at competitive costs; Existence of a huge consumption market for Egyptian products (local and
international); Existence of industrial zones/clusters throughout the country; Foreign trade agreements in place with major economic blocs; Access to main export markets.
2.3. Incentive-based zones
The investment law 8/1997 has created two types of investment in Egypt: A- Free Zone Investment; B- Inland Investment.
16 Source: Ministry of Investment, General Authority for Investment & Free Zones, Sep. 2007.

Egypt: Growth Potential and Business Opportunities April 2008
38
2.3.A Free Zone Investment
The Free Zone is a part of the national territory of Egypt, but it has a special treatment in terms of customs duties. This allows much greater freedom in transactions and exchanges, aimed at increasing economic growth and attracting foreign direct investment.
Objectives Initially, Free Zones were established to achieve the following objectives: • Improve the nation’s exports; • Attract foreign capital; • Introduce advanced technology to the industrial sector of the nation; • Provide labour opportunities.
Advantages • Freedom of transferring abroad the invested capital and profits tied to the
project; • Freedom of choosing the investment field and the legal formula of the
projects; • Freedom of pricing the products and setting profit margins; • No maximum or minimum limits on invested capital; • No limitations on capital nationality, so that any investor may invest or
participate with a percentage in the investment; • Freedom to work for and with others in order to exploit the full capacity of
projects; • Simplified procedures for importing from the local market; • Local exports to Free Zones treated in the same was as exports from
abroad.
Guarantees • No legal action against the projects for breaches of customs, finance, and
tax laws, may be taken without a reference to the authority; • No nationalisation or confiscation of the projects and establishments is
possible; • Projects may be placed under judicial management and the assets thereof
be sequestrated, confiscated or frozen only by a legal, and not administrative, order.
Exemptions • Exemption of all capital assets and production requisites necessary for
implementing the project (except for vehicles) from any customs, duties or taxes on sales, or any other kind of tax, during project activity, even if the nature of the activity necessitates their temporary existence outside the Free Zone;
• Exemption of imports and exports tied to the project to and from the country from any sales taxes or other kinds of taxes or duties applied in the country;
• Non-subjection of the project and its profits to any taxes or customs laws applied in the country during project activity;
• Non-subjection of imports and exports tied to the project to normal customs procedures or export rules applied in the country;
• Exemption from sales taxes of the project’s imports from the local market. • Exemption of specifically–directed transit goods from any duties
chargeable on entering and exiting goods;

Egypt: Growth Potential and Business Opportunities April 2008
39
• Exemption of all local components of the products produced within the context of Free Zone projects from any customs duties upon their sale to the local market (inside the country);
• Exemption of the registration of contracts and loans from tax stamp for five years;
• Exemption of the registration of private land in the Free Zone from tax stamp.
Types of Free Zones
Type1 : Private Free Zones • Private Free Zones are created by virtue of decrees issued by the
General Authority for Investment and Free Zones; • Private zone location should comply with its economic surroundings
e.g. being close to raw material sources or being established in an appropriate location for the nature of its activity (navigation & maritime transport projects, insurance companies, cement silos… etc);
• They should contribute to the establishment of new communities; • Plots of land requested should not be available in public Free Zones; • The project must observe all environmental protection regulations. Projects may be transformed into private Free Zones on condition that: • They are already in operation; • They are committed to exporting no less than 50% of their output; • They operate in accordance with set specifications.
Type 2: Public Free Zones The State has established 10 Free Zones equipped with facilities and infrastructures. For each zone, there is a board of directors which provides land plots, together with all the relevant facilities and services, of different sizes according to the project's needs.
Public Free Zones in Egypt are divided into:
Fully equipped with infrastructures: 1. Alexandria (El-Amreya). Alexandria is the biggest Free Zone in Egypt, and projects are implemented there in the following sectors: chemicals, oil refining, petrochemicals, spinning and weaving, ready made garments, vegetable oils and derivatives, assembling industries. 2. Damietta 3. Ismailia 4. Media Production City 5. Nasr City 6. Port Said 7. Port Tawfik and Adabbia (Suez).
Operating and undergoing further development: 1. East of Port Said 2. Shibin El-koum 3. Keft.
New activities in Egyptian Free Zones: • Providing infrastructure and facilities for Free Zones; • Management, operating, development and marketing of Free Zones; • Development and management of seaports and airports;

Egypt: Growth Potential and Business Opportunities April 2008
40
• Liquefying natural gas; • Cultivation of reclaimed land.
2.3.B Inland Investment17 • In Egypt “Inland” projects are defined as those located anywhere within an
industrial park. Egypt is embarking on an intensive regional development program, setting up 41 industrial parks throughout the country, in accordance with Investment Law No. 8/1997. These parks aim to create clusters of similar industries and to provide facilities for joint ventures and small to medium-sized enterprises (SMEs);
• Industrial parks are located in 19 governorates covering a total land mass of nearly 162 million square metres;
• More than 2,210 projects exist in the 41 industrial parks, 930 of which have already started production.
Incentives Land prices: • In Upper Egypt (south of Cairo) land is allocated to projects free of charge
once production has started. This is applicable to the industrial parks in the governorates of EL Minya, Assiut, Suhag, Qena Valley and Aswan;
• Land is available for industrial production at a price of EGP 25-450 per square metre in the other governorates.
Main industrial zone activities • Menofiya & Assiut: Pharmaceuticals and Medical products. • Suhag: Paint products and farming tractors; • El-Menia: Animal fodder and concentrates, organic fertilisers and concrete
pipes; • Beni Suef: Cement plants, vegetable and fruit preservation and dehydration; • El-Fayoum: Ceramics and sanitary ware – Dehydration of field crops; • Alexandria: Petrochemicals and tyres; • Menofiya: Household electrical appliances and paper products; • Port Said: Chemical products, Reinforced steel and Spinning Weaving; • Kafr El-Shiekh : Liquid gases cylinder filling.
2.4 Special Economic Zones18
Law 83/2002, concerning Special Economic Zones (SEZs), seeks to establish economic zones that benefit from considerable autonomy and a bureaucracy-free environment. Exporters based in SEZs are granted Egyptian certificates of origin usable under international trade agreements. The law provides for a 10% tax rate and a 5% labour tax, as well as exemption from sale taxes and custom duties. The tax rate applicable on all activities within the special economic zones is 10%. Investors in the SEZs benefit from flexible administrative and labour regimes, and exemption from taxes and fees on all imported materials and equipment.
17 Sources: - Law No. 8 of 1997 on Investment Guarantees and Incentives. - Ministry of Investment, Egyptian Investment Portal : www.investment.gov.eg.
18 Sources: - Law No, 83 of 2002 on Economic Zones of A Special Nature. - Ministry of Investment, Egyptian Investment Portal : www.investment.gov.eg.

Egypt: Growth Potential and Business Opportunities April 2008
41
Each zone is self governed by an independent authority, with much ample freedom of action granted to the Board of Directors of each SEZ. One zone has been designated as SEZ (The North-West Gulf of Suez). The North-West Suez special economic zone is the first zone created under the above-mentioned law. It will serve as a model for future development of other SEZs in Egypt.
The Government has created a new authority to manage the development and the operation of the Suez Special Economic Zones. Many companies have stated production operations, in business areas such as fertilisers, iron and steel, pharmaceuticals, building materials and petrochemicals.
2.5 Industrial Modernisation Programme19
In 2002/03, Egypt started the Industrial Modernisation Programme (IMP). The European Union contributed to this programme with a grant covering 59% of total costs. This programme aims at raising the domestic product growth rate, promoting competitiveness of Egyptian products, creating further job opportunities, increasing income, and integrating with the world economy.
The Egyptian Industrial Modernisation Centre offers all means of technical support for the establishments that work in the architectural, chemical, programming, food, textile, clothing, and furniture industries. It has also followed up on the implementation of the Industrial Modernisation Programme since 2005/06.
2.6 Thousand Factories Programme20
The Thousand Factories Programme will be implemented in the 2006-2022 period. This programme aims to encourage partnerships between the private and banking sectors, to build 1,000 factories in full respect of international standards, or expand existing ones.
Table 1 - Factories(New&Expanded) Established - Since the Beginning of the Program till May 2007
Item Factories in Operation
Expansion of Existing Factories Total
(one Thousand Factory) Program - Large (EGP 15 million or more)
124 95 219
(Business Market ) Program – Medium (EGP5-15 million)
66 62 128
(Business Market ) Program - Small (EGP 5-0.5 million)
252 408 660
Total No. of factories 442 565 1007 Total Investment (EGP Billion) 6.77 5.58 12.36 Job Opportunities (Thousand) 45.7 43.6 89.3
Source: Ministry of Economic Development, A follow-up Report for the year ( 2006/2007)
19 Source: State Information Service (sis), ( year Book 2007).
20 Source: State Information Service (SIS), (Year Book 2007).

Egypt: Growth Potential and Business Opportunities April 2008
42
3. Local investment attractiveness
The business environment in Egypt has continued to improve, and both domestic and foreign investment have gained momentum. Net FDI Inflows increased from USD 6.1Bn in FY2005/06 to USD 11.1Bn in FY2007. This surge in investment has been underpinned by significant reforms over the past five years.
3.1 Improving investment climate
The Egyptian Government has put in place various positive measures geared to improving the investment climate, greatly appreciated by international economic institutions. According to the World Investment Report published in 2007 by the United Nations Conference on Trade and Development (UNCTAD), Egypt has emerged as the leading FDI recipient country in the African Continent.
The measures include the following:21
A. Establishment of the Ministry of Investment and reorganisation of the General Authority for Investment and Free Zones (GAFI), both of which succeeded in recruiting professionals with extensive private-sector experience into key positions, responsible for making the most important and sensitive decisions;
B. For the sake of simplifying investment-related procedures, an “Investor Relations Unit” at GAFI was launched to link investors to the different departments of GAFI and other related entities. Simultaneously, affiliated Investment Service Bureaus at various governorates were established. GAFI'S establishment of a One Stop Shop in Cairo with branches in three other governorates has been at the centre of its institutional reform. This has now made it possible to establish a new company in no more than three days, as opposed to three months only two years ago;
C. Micro reforms have also proceeded at a brisk pace. Egypt ranked as “Top Reformer” in the World Bank’s “Doing Business” indices for 2008 (reflecting 2007 reforms);
D. Egypt has established the Institute of Directors with the aim of strengthening corporate governance practices, to provide research and technical advisory services, and promote awareness of the benefits of corporate governance;
E. Cutting minimum capital requirements to start a business, from EGP 50,000 to only EGP 1,000, also helped push Egypt up the rankings based on this criterion;
F. Foreign investment in manufacturing has been fully liberalised and there is now no limit on foreign equity participation in financial services and privately owned telecommunications services;
G. Investment programmes have been promoted in different governorates. In this respect, the Upper Egypt Investment Company was established to exploit investment opportunities in Upper Egypt and generate significant economic benefits. In the same direction, the Egyptian Government has also financed several infrastructure projects in governorates as a driving factor in helping to attract investors;
21 Sources: - Ministry of investment: www.investment.gov.eg/moi-portal - Egypt state Information service : www.sis.gov.eg/en/pub/magazine/issue 44 - Ministry of foreign Affairs: www.mfa.gov.eg/foreignp olicy/internations - The World Bank group, doing business, Reform 2007: www.doingbusiness.org - The Institute of International Finance, country report-Egypt, February 11, 2008.

Egypt: Growth Potential and Business Opportunities April 2008
43
H. As regards legislative reform, an antitrust law has been introduced promulgated. Furthermore, a new tax law was promulgated and applied in mid-2005, implementing a 50% cut in both income and corporate tax rates, as well as raising the qualifying income level for each tax bracket;
I. Many elements of the Investment Guarantees and Incentives Law have now been incorporated into the more diffusely applicable Corporate Law, marking progress towards a fully unified investment regime;
J. The Government has also taken measures to deal with the issue of access to financing. The Banking Law has been amended, allowing non-banking financial institutions to access client creditworthiness information, and authorizing the Central Bank of Egypt (CBE) to license and regulate private Credit Bureaux;
K. There has also been a marked improvement in access to credit for businesses, mainly relating to the recent establishment of a Credit Bureau;
L. Additionally, customs procedures have been upgraded and the related payment systems made more transparent;
M. Tariff rates have been reduced, with the largest cuts taking place on primary industrial materials, fuel and crude oil. Accordingly, the number of tariff bands was reduced to only six;
N. Egypt has eased the bureaucracy that builders face in obtaining construction permits;
O. Egypt’s ranking for registering property has also improved following a sharp reduction in registration fees;
P. The establishment of a one-stop shop for investors has cut the number and lengthiness of procedures dramatically. The total number of procedures is now only seven, which take a total of nine days on average to complete;
Q. Another area in which Egypt has made strong progress concerns the terms of cross-border trade, fore which Egypt now ranks 26th in the world. Progress in the ranking was helped by the establishment of one-stop shops at ports, and by further tariffs reductions;
R. Export tax has also been eliminated, and all administrative fees/surcharges have been removed;
S. Within the framework of promoting investment opportunities, a professional communications company was hired to carry out a comprehensive program for advertising and marketing Egypt as an attractive investment destination;
T. However, reform of the Investment Authority has not been taken on isolation from other, broader steps taken by the Government, such as reactivation of the Public Asset Management Programme;
U. On a similar note, the Government is working on introducing a law for the establishment of specialised economic courts.

Egypt: Growth Potential and Business Opportunities April 2008
44
Box 1: Ministry of Investment Establishment
In the framework of the state's great interest in attracting foreign investments and providing a favourable climate for investment in Egypt, the first Ministry for investment in Egypt was established in 2004 by Presidential Decree 231/2004. The decree defines the Ministry’s objectives, tasks and affiliates.
Objectives
Developing and encouraging investment in Egypt by : • Eliminating investment impediments, encouraging and increasing the
opportunities for local and foreign investment, whether direct or indirect through affiliated organisations and agencies, and in cooperation with the other concerned ministries and entities;
• Expanding the ownership base of public enterprise companies by implementing the privatisation program and improving company performances in accordance with the general policy of the state;
• Providing investment incentives to encourage and attract the private sector to engage in the various fields of economic activities, in addition to encouraging the local and foreign private sectors to finance economic and developmental projects in Egypt through the use of non-banking financial instruments, and the application of private-public partnership techniques.
Responsibilities • Increasing Arab and foreign investments by enhancing investment awareness
and promotion, to attract more investments for the financing of various projects;
• Restructuring public enterprise companies via self-financing; • Supervising the implementation of programmes geared to transferring
ownership to the private sector, improving sales techniques, restructuring subsidiary companies and labour force, and proposing uses to which to put sales proceeds;
• Monitoring enforcement of the Investment Guarantees and Incentives Law, simplifying its procedures and unifying the entities with which the investor deals;
• Implementing the electronic Government strategy to provide investment services to investors via an integrated database.
Source: Presidential Decree Number 231 of 2004, Organizing the Ministry of Investment
Box 2: Investment Opportunities(*)
The following are (151) investment opportunities by sector, available on the Egyptian Ministry of Investment website:
Sector No. of
Investment Opportunities
Sector No. of
Investment Opportunities
Industry 70 Trade 5 Environment 20 Agriculture 3 Tourism & Recreation 14 Banking 3 Energy 13 Information & Technology 1 Services 12 Insurance 1 Contracting 8 Transportation 1
For more details on these opportunities, please refer to the ministry website as follow: www.investment.gov.eg/MOI Portal/en-GB/Investment/Investment Opportunities. (*) Investment opportunities are drawn from the Egyptian Ministry of Investment website
and should not be intended as suggestions by BA.

Egypt: Growth Potential and Business Opportunities April 2008
45
4. Infrastructural programmes
The Egyptian Government and private sector have been making strong investments in different forms of infrastructure projects, as these are the corner stone of the economic development process.
Investments in the fields of electricity, water, transportation, storage, and communication, amounted to LE 135,074.4M between June 2003 and September 2007, of which LE 42,759M in the private sector.
Table 2 - Implemented Investments in Infrastructure Projects (LE M)
Private Sector Total Private Sector Total During
2004/2005 2003/2004
_ 9551.2 200 8689 Electricity & Water
6503 18860.4 5200 17508.2 Transportations & Communications and storage
2006/2007 2005/2006 _ 10073.8 _ 9008.1 Electricity & Water
12625.2 28685.6 12685.9 22814 Transportations & Communications and storage
2007/08 July/ September _ 2185.3 Electricity & Water
5545.7 7698.8 Transportations & Communications and storage
Source: Central Bank of Egypt, Monthly Statistical Bulletin, Vo. 112, July 2006, Vo. 115, October 2006, Vo. 130, January 2008
Egypt has an ambitious plan to increase private sector participation in infrastructure projects, as it enjoys remarkable comparative advantages in this field. The Ministry of Investment has selected several priorities among possible investment projects22, listed below.
4.1 CIT Sector23
Egypt’s communications infrastructure is reported to be among the best–developed and most competitive in the Middle East and Africa, partly due to deregulation and enhanced competition. Egypt’s ICT sector is growing at a rate of more than 20% annually, attracting USD 1Bn in FDI each year.
Investors have cheered TE’s performance, rewarding the company by making its Initial Public Offering (IPO) on the Cairo and Alexandria Stock Exchange (CASE) one of the Largest and most successful ever in the Arab world when the state sold a 20% stake in TE in late 2005.
Significant investment opportunities in the telecom sector are reported to be on the horizon.
The CIT sector is one of the major sectors contributing to the development process, either through direct investments within the sector, or as an
22 Fur more details please refer to the ministry website: www.investment.gov.eg/NR/rdonlyers/pdf.
23 Source: Ministry of Investment, investment in Egypt, March 2008.

Egypt: Growth Potential and Business Opportunities April 2008
46
infrastructure supporting other sectors, aiming to attract FDIs and creating new job opportunities. Egyptian ITC offers the following strengths: 24 • Strategic location at the crossroads of optical fibre connections across the
Middle East. • Leadership in the field of electronic components. • Availability of highly qualified labour. • Availability of highly advanced technological infrastructures at competitive
costs. • One of the fastest-growing markets in the region. • Policies geared to encouraging FDI and liberalising the CIT sector.
The Ministry of Communications & Information Technology (MCIT) aims at increasing exports to USD 1.1Bn by 2010, while creating 50,000 new job opportunities, by encouraging private sector engagement. More in detail, the 2010 Plan intends to: 25 • Attract investment in Call centres and encourage BPOs. • Develop and operate infrastructures and provide integrated communication
services. • Encourage the establishment of international CIT projects providing value-
added services. • Stimulate data-transfer projects, and software development. • Seek a strategic investor for Telecom Egypt so as to implement the main
communication network (for three years), with an investment of USD 1Bn. • Help the TE attract investors to diffuse fixed telecommunication rings all over
the country.
4.2 Electricity26
Egypt is one of the MENA region’s top exporters of electricity, with some 107.5 billion kilowatt hours generated in 2005/06, a 240% increase over 1991/92. More than 37,900 kilometres of transmission and distribution wires cross the nation, delivering power to industrial, commercial, and residential users alike.
Moreover, Egypt continues to invest millions of dollars each year in the country’s electricity grid, to shore up high-demand areas in urban centres. As it moves to expand generation capacity in the years ahead, the Egyptian Government is now welcoming public-private partnerships in the field.
Five year plan 2007-201227 • Allocating EGP 21Bn to electricity-generation projects. • Annual requirements: 1200 megawatts.
After 2012 • Investors are invited to build power plants and sell directly to consumers.
24 Source: General Authority for Investment & Free Zones, investment opportunities in Egypt, September 2007.
25 Source: General Authority for Investment & Free Zones, investment opportunities in Egypt, September 2007.
26 Source: Ministry of Investment, investment in Egypt, March 2008.
27 Source: General Authority for Investment & Free Zones, investment opportunities in Egypt, September 2007.

Egypt: Growth Potential and Business Opportunities April 2008
47
• Increasing private sector involvement in establishing electrical power plants, to provide their own industrial projects with the electricity needed.
4.3 Utilities28
Egypt needs to step up investments in utilities to meet the future demand for utilities services, given the gap between current and planned capacity.
4.3.1 Usage of enhanced drainage systems – 2002 • Drainage system capacity 2006/2007 = 14.9M m3/day. • Planned in the next year = 15.5M m3/day. • Planned at the end of the National plan 2011/2012 = 24.8M m3/day.
4.3.2 Usage of enhanced water networks – 2002 • Potable water capacity 2006/2007 = 21.9M m3/day. • Planned in the next year = 22.5M m3/day. • Planned at the end of the National plan 2011/2012 = 27.8M m3/day.
Table 3
Project Location Investment Cost
Sewage Treatment Facilities
First Project South East new Cairo city at five phases EGP 2.5Bn
Second Project Cubic feet 1,250,000 daily EGP 1.6Bn
Potable Water Treatment Facilities
First Project New Cairo city, Nasr city& surrounding areas EGP 3Bn
Second Project New Aswan City EGP 150Bn
Source: Ministry of Investment, General Authority for Investment & Free Zones, Investment Opportunities in Egypt, Sep.2007.
4.3.3 Promoting the PPP system29
Egypt has allowed the private sector to deepen its participation in the economic reform process through a public–private partnership (PPP) strategy that aims to enhance the quality of services available in the country, while simultaneously reducing the financial burden weighing on the Government.
In 2006, the Ministry of Investment initiated a comprehensive PPP promotion strategy, which included the creation of a legislative and institutional framework to facilitate the execution of major PPP infrastructure projects, and encourage more local and foreign investors to enter in partnerships with the Government in priority sectors, including water, transportation, health and education.
On the legislative front, the Ministry of Finance is currently drafting new PPP legislation to govern the relationship between the Government and the private sector, detailing the responsibilities of each side. The law is expected to be passed later this year.
28 Source: General Authority for Investment & Free Zones, investment opportunities in Egypt, September 2007.
29 Source: Ministry of Investment, investment in Egypt, March 2008.

Egypt: Growth Potential and Business Opportunities April 2008
48
On the institutional and capacity-building fronts, a joint PPP Unit has been established by the Ministries of Investment and Finance. Sector-specific regulatory agencies have also been established to directly supervise various projects already in the works.
The Egyptian Government targets to cover 100% of rural areas by 2022. GOE targets to cover 100% of Egypt within two years.30
Egypt encourages investments in the field of infrastructure via the PPP approach, and has promoted new projects with private participation in four infrastructure sectors: telecom, transport, water, and waste water management.
Table 4 - Available Projects under PPP system
Covernorates Projects Capacity (000m3/ day)
Investment Cost
(EGP M) Potable water station-3 phases 1500 2000
New Cairo City Sewage station- 3 phases 1250 3000
6th of October City Extension of potable water station 400 400 El Obour City Extension of potable water station 500 500 Damietta Ras El-Bar water station 68 100 Dakahlya Nebroh water station 34 50 Sharkeya Awlad Sakr Water station 51 100 Monofeya Monof water station 51 90 Behera Kom Hamada water station 34 50
Tanan water station 51 90 Shabana water station 51 80 Kalyobia Kafr shokr water station 34 50
Giza Hawamdeya water station 51 80 Assiut Walideya water station 34 50 Sohag Sakalta water station 51 80
Luxor water station 34 50 Farshout water station 51 80 Qena Nakada water station 51 80
Source: Ministry of Investment, General Authority for Investment & Free Zones, Investment Opportunities in Egypt, Sep.2007
4.4 Maritime sector 31
As one of the world’s commercial and maritime transportation hubs, Egypt is home to more than 14 commercial ports that handled more than 97.5M tons of cargo in 2005/2006. More than 8% of the world’s total maritime traffic passes through the Suez Canal each year, including crude-oil supertankers. Meanwhile, the Government is exploring how to increase cargo traffic on the River Nile as an environment-friendly way of easing traffic on the nation’s roadways.
Maritime Transportation is considered by GAFI a supportive sector for the development process, and the target is to reach international rates by the year 2020; especially in the domains of:32
30 Source: General Authority for Investment & Free Zones, investment opportunities in Egypt, September 2007.
31 Source: Ministry of Investment, investment in Egypt, March 2008.
32 Source: General Authority for Investment & Free Zones, investment opportunities in Egypt, September 2007.

Egypt: Growth Potential and Business Opportunities April 2008
49
East Port Said Port Sokhna Port Alexandria Port Damietta Port
4.5 River transportation sector33
According to GAFI, Egypt is trying to develop this sector to achieve the following main targets: • Develop river transportation; • Improve services offered to tourism-related transportation; • Encourage cargo transfers on the Nile River; • Develop the adjacent areas.
According to GAFI plans, this will be achieved by: • Establishing and operating river fleets, and related service companies; • Developing existing ports; • Operating river transportation companies that connect Egypt & Sudan; • Total cargo transported through river network = 2,590 million tons/km; • Average passenger capacity of river-crossing boats = 30,000 passengers/day.
4.6 Transportation34
Rail has a long history in Egypt, which was the second country in the world to build a national railway. Today, some 9,525 Kilometres of rail lines link the major urban centres and industrial clusters to other and to the nation’s port system, ensuring the timely and efficient shipping of goods and transportation of passengers across the country. The next challenge is now underway as the Egyptian Government welcomes proposals under the public–private partnership framework to build new cargo and rail lines in the decade ahead.
Egypt continues to build highways and bridges as part of its overall infrastructure plan, with a comprehensive national roadway linking it to several of its neighbouring countries. Recent infrastructure projects of note include the Ahmed Helmy Tunnel and the ElSalalm Bridge, which connects the Asian and African sides of the Suez Canal.
Today, Egypt has well over 46.500 kilometres of roadways, a figure that will grow in the years ahead as the Government contracts new highways under the public–private partnership scheme. The Egyptian Government invites private sector investors to build new railways to connect cities.
Among the initiatives set forth by GAFI, the following are highlighted:35 • Development, management, and operation of a number of railway stations (12
stations in Lower Egypt and 12 stations in Upper Egypt); • Laying of a fibre optic line along the railway tracks; • Egyptian Railways Co. has offered a set of excess land plots for use in
different fields (commercial, housing, etc.) under concession, or in partnership with the company.
33 Source: General Authority for Investment & Free Zones, investment opportunities in Egypt, September 2007.
34 Source: Ministry of Investment, investment in Egypt, March 2008.
35 Source: General Authority for Investment & Free Zones, investment opportunities in Egypt, September 2007.

Egypt: Growth Potential and Business Opportunities April 2008
50
Governorate Site Area (m2) Cairo Vacant land on El-Sabteia st. 1,048 Land plot in front of the Hikestep station 1,000
Alexandria Goods Station Land – Old Nozha 23,735
A current PPP opportunity in this field is the Cairo/Alexandria Free Road36 • Length: 231 kilometres; • Required investment: USD 600M; • Transaction advisor: IFC; • Status: Technical drafting.
Emil Eskander, Hemmat EL-Masry, Sahar Khaled, Salah Oraby and Mona Rabiee
36 Source: Ministry of Investment, investment in Egypt, March 2008.

Egypt: Growth Potential and Business Opportunities April 2008
51
The Egyptian Banking System: in the Middle of Reform
1. Introduction
The banking system in the Arab Republic of Egypt is benefiting from the ambitious reform program started a few years ago37. The Central Bank of Egypt (CBE) has taken many steps in helping the system move to sounder fundamentals amidst good economic prospects, but also to meet challenging competitive pressures.
This chapter provides an overview of the country’s financial development, and in particular of the role played by the banking system and the stock exchange in the economy. Egypt’s economic growth prospects are still positive for the next few years, and the overall banking system is expected to take advantage from this supportive environment38. However, competition is set to intensify following recent government disposals to foreign players and the first wave of mergers. The retail and SME segments, in particular, are expected to grow rapidly. Loans to the private sector are in fact accelerating. Intensifying credit activity may be supported by a solid funding structure, thanks to access to a large base of customer deposits. Finally, the efforts made to improve the stock market will help attract new foreign investors to the market.
2. One of the largest banking systems in North Africa
Egyptian banks still enjoy a strong franchise, reflecting the size of the country and the significant level of financial intermediation in the economy, compared with that of other emerging markets.
Economic liberalisation is at the forefront of the policymakers’ agenda. Since 2004, economic reforms have been broad-based and have covered four major fronts: the banking sector, fiscal policy, monetary policy, and renewed commitment to privatisation. As far as the banking system is concerned, particular emphasis has been placed on reducing the number of banks, strengthening their financial profile and corporate governance, addressing the problem of state-owned banks’ NPLs, restructuring public sector banks, and upgrading the CBE’s banking supervision to adopt a risk-based approach. Economic reforms are creating a more supportive business environment for the banking sector.
The Egyptian banking system is one of the largest in North Africa, with total assets of EGP 1041Bn (EGP 937.9Bn as at June 2007). It included 41 banks as at September 2007, down from 61 at fiscal year-end 2004, as a result of the reform process initiated in 2004. Of the banks, 31 are commercial banks (including the three large public sector banks); seven are branches of foreign banks, and three are specialised banks (see Chart 1).
37 The new banking law (Law n.88-2003 of 15 June 2003) has unified all Egyptian banking regulations. It was enacted in accordance with the international prudential standards of the Basel II agreements and contributes to strengthening the Egyptian banking structure by improving prudential ratios and governance rules. The new law catalysed mergers and acquisitions, as it forced banks to meet new minimum capital requirements by July 2005. Moreover, the new law abolished the distinction between commercial, business, and specialised banks.
38 According to a recent Moody's Report – issued in August 2007 - the outlook for Egypt's banking system is Stable, with positive medium – term prospects, reflecting continued progress with the reform programme together with an improving operating environment.

Egypt: Growth Potential and Business Opportunities April 2008
52
Banks serve a population of about 72.7M through a branch network of 3,116 branches39 (3000 in December 2006), which works out to one of the lowest branch densities in the Arab world (about 25,000 customers per branch).
The largest branch networks belong to state-owned banks: Banque Misr, Banque du Caire, and National Banque of Egypt (NBE) dominate the system with 825 branches as a whole. Upgrading branch networks, IT systems, as well as risk-monitoring capabilities, are the main challenges facing public sector banks. The best performing private sector banks, on the other hand, can count on better infrastructures. The system also includes three specialised banks dedicated to the financing of specific economic sectors: the Egypt Arab Land Bank finances the construction and real estate sector; the Industrial Development Bank of Egypt provides long-term lending at preferential rates to small private sector companies; and the Principal Bank for Development and Agricultural Credit issues loans to farmers in rural areas.
Chart 1 – Number of banks and branches (units)
0
10
20
30
40
50
60
70
2004 2005 2006 20072.600
2.700
2.800
2.900
3.000
3.100
3.200No. Banks No. Branches
Source: CBE
With their large networks the three remaining state-owned banks have a nationwide reach.
Branch networks are generally concentrated in the region around Cairo, which affords state-owned banks a dominant position in the retail market, with a strong ability to mobilise deposits. The largest private banks have followed niche strategies, mainly focusing on top-tier companies and, to a lesser extent, on the better-performing public sector companies. Deposit mobilisation is generally restricted to high-net-worth and affluent individuals, as well as large cash-rich corporate borrowers, as state-owned banks are more entrenched in the middle-to-lower income segments as well as in SMEs and state companies. Private sector banks have built up a dominant market share in the more profitable customer segments.
Egypt’s economy is improving, mainly thanks to a reinvigorated economic and structural reform programme, started in 2004. Obvious results are the acceleration in GDP growth, increasing investments, and declining unemployment. Banking sector penetration remains relatively low: bank credit on
39 It should be noted that 1,036 are village branches.
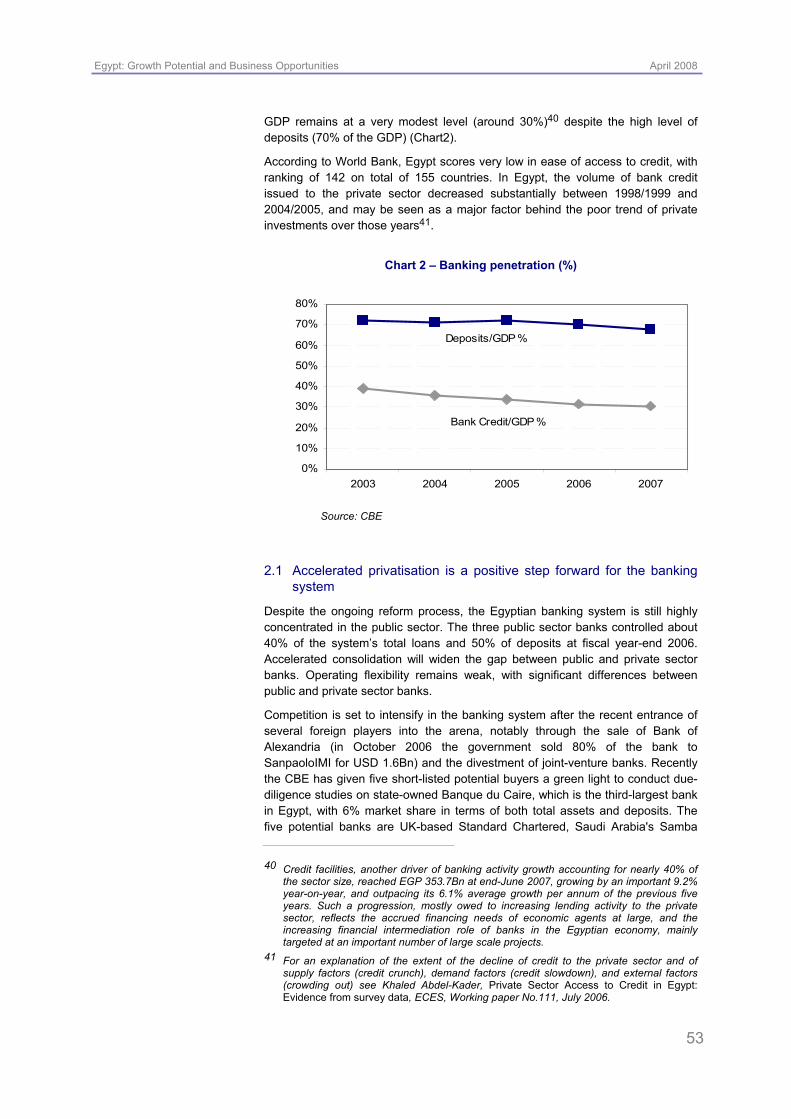
Egypt: Growth Potential and Business Opportunities April 2008
53
GDP remains at a very modest level (around 30%)40 despite the high level of deposits (70% of the GDP) (Chart2).
According to World Bank, Egypt scores very low in ease of access to credit, with ranking of 142 on total of 155 countries. In Egypt, the volume of bank credit issued to the private sector decreased substantially between 1998/1999 and 2004/2005, and may be seen as a major factor behind the poor trend of private investments over those years41.
Chart 2 – Banking penetration (%)
0%
10%
20%
30%
40%
50%
60%
70%
80%
2003 2004 2005 2006 2007
Bank Credit/GDP %
Deposits/GDP %
Source: CBE
2.1 Accelerated privatisation is a positive step forward for the banking system
Despite the ongoing reform process, the Egyptian banking system is still highly concentrated in the public sector. The three public sector banks controlled about 40% of the system’s total loans and 50% of deposits at fiscal year-end 2006. Accelerated consolidation will widen the gap between public and private sector banks. Operating flexibility remains weak, with significant differences between public and private sector banks.
Competition is set to intensify in the banking system after the recent entrance of several foreign players into the arena, notably through the sale of Bank of Alexandria (in October 2006 the government sold 80% of the bank to SanpaoloIMI for USD 1.6Bn) and the divestment of joint-venture banks. Recently the CBE has given five short-listed potential buyers a green light to conduct due-diligence studies on state-owned Banque du Caire, which is the third-largest bank in Egypt, with 6% market share in terms of both total assets and deposits. The five potential banks are UK-based Standard Chartered, Saudi Arabia's Samba
40 Credit facilities, another driver of banking activity growth accounting for nearly 40% of the sector size, reached EGP 353.7Bn at end-June 2007, growing by an important 9.2% year-on-year, and outpacing its 6.1% average growth per annum of the previous five years. Such a progression, mostly owed to increasing lending activity to the private sector, reflects the accrued financing needs of economic agents at large, and the increasing financial intermediation role of banks in the Egyptian economy, mainly targeted at an important number of large scale projects.
41 For an explanation of the extent of the decline of credit to the private sector and of supply factors (credit crunch), demand factors (credit slowdown), and external factors (crowding out) see Khaled Abdel-Kader, Private Sector Access to Credit in Egypt: Evidence from survey data, ECES, Working paper No.111, July 2006.

Egypt: Growth Potential and Business Opportunities April 2008
54
Financial Group, National Bank of Greece S.A., Dubai's Mashreqbank, and a consortium formed by Jordan-based Arab Bank Group, and Saudi Arabia's Arab National Bank42.
The change in ownership structures will enhance the overall managerial capabilities of Egyptian banks, and boost their financial performance. The two remaining largest public sector banks, BM and NBE, however, will not be privatised, according to a recent announcement made by the government.
Table 1 - Foreign majority shareholders of North African banks
Egypt Algeria Tunisia Arab Bank PLC 100% ownership of Arab Bank Egypt 100% ownership of Arab
Bank Algeria 64.2% ownership of Arab Tunisian Bank
Albaraka Banking Group 73.7% ownership of Egyptian Saudi Finance Bank
55.9% ownership of Banque Albaraka d’Algerie
78.4% ownership of Beit Ettamouil Saudi Tounsi
Ahli United Bank 49.8% ownership of Delta International Bank, renamed Ahli United Bank-Egypt, with the intention to grow to 100%
None None
Union National Bank 94.8% ownership of Alexandria Commercial and Maritime Bank
None None
Bank Audi 100% ownership of Bank Audi SAE None None
Blom Bank 99% ownership of Blom Bank Egypt None None
Banque Marocaine du Commerce Exterieur
None None 50% ownership of Axis Capital
Attijariwafa Bank (and Banco Santander CH)
None None 53.5% ownership Attijaribank (former Banque du Sud)
Piraeus bank 95.3% ownership of Piraeus Bank Egypt SAE (Egyptian Commercial Bank)
None None
Intesa Sanpaolo 80% ownership of Bank of Alexandria None None
Natexis None 91.3% ownership of Natexis Algerie
None
Société Générale 77.1% ownership of National Société Générale Bank, which itself bought 90.7% Misr Int. Bank; 70.8% ownership of Sogelease Egypt.
100% ownership of Société Générale Algerie
52.3% ownership of Union International de Banques
BNP Paribas 95.1% ownership of BnP Paribas Le Caire
100% ownership of BnP paribas Al Djazair
50% ownership of Union Bancaire pour le Commerce et l’Ind.
Credit Agricole 59.1% in Credit Agricole Egypt None None
Arab Banking Corp 98% in Arab Banking Corp. Egypt 70% of ABC Algeria 100% of ABC Tunisie
Barclays Bank PLC 100% in Barclays Bank Egypt SAE None None
Source: S&P. Including subsidiaries only; excluding foreign bank branches. Data as at 30 June, 2006
42 Egypt is planning to sell up to 67% of Banque du Caire in a public auction, with an additional 28% offered in an IPO on the Egyptian stock exchange after the stake sale. The remaining 5% of shares will go to the bank's employees. Banque du Caire was initially slated to merge with Banque Misr.

Egypt: Growth Potential and Business Opportunities April 2008
55
Banks in emerging markets have been attractive targets over the past few years, not only for major global banking groups, but also for leading regional or midsize banks in other emerging markets that are naturally inclined to diversify geographically. The North African banking market is set to become more alluring in the years to come, driven not only by excess liquidity in the Gulf due to high oil prices, but also by the dearth of opportunities and stiffer competition in more mature emerging markets. Egypt has attracted a lot of interest following the CBE’s reform of the sector and the disposal of several small joint-venture public sector banks (see Table 1). Egyptian banks have attracted not only some of the leading European banking groups, but also new entrants from other parts of the Middle East, such as the Gulf region and the Levant, the eastern Mediterranean seaboard.
2.2 Total banking assets are growing rapidly, but banking penetration remains low
Chart 3 shows the positive correlation between GDP per capita and financial depth. Countries with a higher GDP per capita also show a higher credit to GDP ratio. Egypt, with a low GDP per capita, still has a modest credit to GDP ratio.
Chart 3 – Credit to private sector to GDP and GDP per capita (2007)
Algeria CzechRep
EgyptHungaryUkraine
SaudiArabiaRussia
Romania Poland
Italy
0%
20%
40%
60%
80%
100%
120%
0 5.000 10.000 15.000 20.000 25.000 30.000 35.000
GDP per capita at PPP (USD)
Cre
dit t
o pr
ivat
e se
ctor
/GD
P (%
)
Source: EIU
The position of Egyptian banks in financial intermediation in a cross-country comparison is highlighted in Table 2: the ratio of total bank assets to GDP is in line with the average, whereas the Deposits/GDP ratio (67.9%) is higher than average (46.7%).
Domestic credit extended by Egyptian banks to all sectors expanded by EGP 21.8Bn, or 4%, in the June 2006-June 2007 period, and by EGP 37Bn, or 7%, in 2H2007, to reach EGP 568.6Bn in December 200743 (Chart 4). The private sector (private businesses and households) recorded 12% growth in June 2007 y/y (+5.5% in 2H2007), accounting for 62% of the total in June 2007 (57.4% in June 2006). Credit to the public business sector retreated by 26%, setting the balance at EGP 24.4Bn at end of June 2007.
43 See CBE, Annual Report 2005/2006 and Monthly Bulletin.

Egypt: Growth Potential and Business Opportunities April 2008
56
Table 2 – Banking intermediation
Bank assets/GDP Deposits/GDP ALGERIA 29.8% 9.2% BULGARIA 97.1% 76.7% CZECH REPUBLIC 116.7% 74.4% EGYPT 80.7% 67.9% HUNGARY 101.6% 42.9% POLAND 78.4% 45.0% ROMANIA 58.3% 30.9% RUSSIA 65.3% 25.1% SAUDI ARABIA 67.9% 49.6% SLOVAKIA 96.7% 59.6% TURKEY 90.0% 54.7% UKRAINE 43.9% 24.0% average 77.2% 46.7%
Source: EIU
Chart 4 – Domestic credit trend (by sector) (EGP Mln)
0
100000
200000
300000
400000
500000
600000
June 2004 June 2005 June 2006 June 2007 Dec 2007
Householdsector
PrivatebusinesssectorPublicbusinesssectorGovernment(net)
Source: CBE, Monthly Bulletin, February 2008
Bank lending increased by EGP 30Bn, or 9.2%, in FY 2006/2007, vs. EGP 15.8Bn in the previous year, to EGP 353.7Bn, or 37.7% of total bank assets (42.5% at end of June 2006, and 37.3% as at December 2007), and 54.4% of total deposits at end of June 2007 (57% at end of June 2006)44 (Chart 5). The structure of EGP loans indicates that the private business sector accounted for the bulk of these loans, i.e. 65% of the total as at December 2007, followed by the household sector (18%), the public business sector (7%), and the government sector (8%). A breakdown of EGP loan balances by economic activity shows that the manufacturing sector received 31.5% of the total, followed by the services sector (26.8%), the trade sector (13.9%) and the agriculture sector (2.2%). Households accounted for the remaining 26%.
44 Islamic Finance remains underdeveloped in Egypt compared to the Gulf States and some Asian countries. For an interesting analysis on the role of Islamic banks in financial stability, see Martin Cihak and Heiko Hesse, Islamic Banks and Financial Stability: An Empirical Analysis, IMF, WP/08/16. These analyses suggests that: 1. small Islamic banks tend to be financially stronger than small commercial banks; 2. large commercial banks tend to be financially stronger than large Islamic banks, and 3. small Islamic banks tend to be financially stronger than large Islamic banks.

Egypt: Growth Potential and Business Opportunities April 2008
57
Chart 5 – Bank loans and deposits (% change Jun/Jun)
0%
3%
6%
9%
12%
15%
18%
21%
June 2003 June 2004 June 2005 June 2006 June 20070%
20%
40%
60%
80%
Bank Deposits
Bank Loans
Loans/Deposits (%)
Source: CBE, Monthly Bulletin, February 2008
2.3 Asset quality remains a key challenge, but is being actively addressed
The Egyptian banking system’s asset quality remains weak by international standards, and varies widely among Egyptian banks, with several private sector banks displaying far stronger asset quality indicators than the system average45.
The ratio of NPLs to total gross loans of the overall banking sector was close to 25% at fiscal year-end 2006. In addition, the NPL ratio of public sector entities was in excess of 35% at the same date, with the bulk of these loans initially granted by the four public sector banks (before the BA privatisation).
On a positive note, the government and the CBE are addressing this issue more actively46 In December 2006, NBE, BM and BdC received EGP 2.28Bn, EGP 5.55Bn, and EGP1.28Bn respectively in cash, totalling EGP 9.1Bn, as partial settlement of public enterprise NPLs.
Risk management systems and the regulatory environment are still weak, but improving. The authorities are undertaking an overhaul of credit risk management processes. Credit procedures are being centralized to review and approve loan requests, and new credit-scoring systems introduced. The main reasons behind the accumulation of asset quality problems in the past were: 1. the weak regulatory framework for the protection of creditors, foreclosure, and realisation of guarantees; 2. the weak credit culture and risk-management systems of public sector banks. CBE has prepared a detailed restructuring plan for NBE, BM and BdC, to be finalised by year-end 2008. For NBE and BM in particular, well-reputed foreign partners are providing support in key areas, including risk management,
45 Asset quality of banks has improved thanks to increased banking supervision and privatization, which used to write-off some of the non-performing loans, which have significantly decreased.
46 In 2005 the CBE mandated local banks to set up a credit bureau in order to promote the sharing of credit quality information among banks, and to avoid asset quality problems resulting from anti selection. The credit bureau is specialised in retail and SME financing, and banks are required to report their exposures to individuals (any amount) and SMEs (up to a limit of EGP 1Mln), and to track the payment habits of customers. The bureau is owned by 27 banks (with a 3.5% stake per bank) and the Social Development Fund, and is co-financed by the United States Agency for International Development and the International Finance Corporation (IFC).

Egypt: Growth Potential and Business Opportunities April 2008
58
human resources, and technology. 3. the CBE has mandated international auditors to conduct an independent full financial review in accordance with IFRS.
These actions are undoubtedly positive, but some difficulties remain: the legal system remains unsympathetic to creditors, and legal proceedings for the collection of bad loans may drag on for years.
3. Retail and SMEs expected to become main drivers of future growth
Loans to the Household sector accounted for about 18% of total loans as at Dec. 2007, up from 12,7% at fiscal year-end 2001. Growth in this segment accelerated considerably during fiscal year 2006, to around 30% from less than 12% in fiscal year 2005. The retail segment, and especially mortgages, is set to keep growing rapidly, given the huge housing needs of the Egyptian population.
Indeed, Egypt has one of the largest populations in the Arab world, but GDP per capita remains among the weakest, at about USD 1,829 at June 2007. In developing their retail businesses, banks are targeting a limited portion of the bankable population, mainly the medium-to high-income portion. Therefore, the 41 banks active in the system only serve a bankable population of less than 6 million.
The SME segment could also turn out to be an attractive alternative for banks to channel part of their sizable liquidity, thanks to the expected acceleration in SME creation, and to international aid granted to Egyptian banks in order to support SME financing.
Egyptian banks enjoy a solid funding structure thanks to their access to a large base of customer deposits. Over-reliance on deposits is particularly striking for public sector commercial banks. Therefore, the system’s overall funding mix is undiversified, with retail deposits accounting for more than 2/3 of total deposits as at December 2007 (see Chart 6).
Chart 6 – Customer deposits by economic sector (Dec 2007, %)
Household sector60%
Non-resident1%
Private business
sector22%
Public business
sector 5%
Government Deposits
12%
Source: CBE, Monthly Bulletin, February 2008
Strong franchises and wide branch networks allow public sector banks to capture the bulk of mass-market deposits, which have proven to be fairly stable in the past, but could become more volatile as other players expand their deposit-raising capabilities. Remittances of Egyptians working abroad are increasing (+26% y/y,

Egypt: Growth Potential and Business Opportunities April 2008
59
worth USD 6,321M fiscal year 2006/2007, of which only USD 42M from Italy), but shares on total deposits and GDP remain lower than in other Maghreb and North African countries47.
While on the asset side of bank balance sheets maturities are lengthening – a trend that is not likely to slow, as mortgage lending is expected to expand – mismatches are likely to increase in the future.
This risk is mitigated by the fact that more than 30% of retail deposits have maturities in excess of three years, and that the domestic and international bond markets have been virtually untapped so far, leaving banks with further funding flexibility going forward.
The liquidity position of Egyptian banks is strong, due to their large portfolios of government securities and Interbank deposits48. The securities and investment portfolios of banks comprised about 18% of total assets as at December 2007 (down from 25% at the end of June 2006) and were dominated by government paper (mostly Treasury bills). This situation creates a significant link with the government’s creditworthiness.
Egyptian banks have a low degree of operating flexibility, with significant differences between public and private sector banks. The former suffer from low automation levels and overstaffing, while some of the latter benefit from more modern banking technology, leaner staffing, and more advanced management tools, in part imported from their foreign shareholders. Despite overstaffing, the low cost of labour in Egypt enables public sector banks to maintain low cost-to-income ratios by international standards. This is expected to change in the medium term as a result of the above-mentioned ongoing reform process involving public sector banks49.
The capitalization of the Egyptian banks is still modest: the system’s average capital ratio (Total Equity as a proportion of Total Assets) was 4.9% as at December 2007 (down from 5.6% at fiscal year-end 2006) (see Chart 7).
Public sector banks are insufficiently capitalised, particularly given their weak asset quality indicators, whereas the best-performing private sector banks are adequately capitalised50.
In January 2007, the government announced that the financial positions of the public banks would be bolstered by EGP 6Bn in capital increases. EGP 2Bn would be allocated to NBE and the rest to the remaining public banks, primarily BM.
47 As a percentage of GDP, remittances are 3% in Egypt, 1% in Turkey, 5% in Tunisia, and 9% in Morocco. Remittances may boost economic growth in some sectors, such as real estate.
48 Reserves with the CBE are equivalent to 14% of the banks’ deposits in local currency and 10% of their deposits in foreign currency. The former are non-interest bearing, while the latter receive LIBOR-equivalent interest.
49 Fitch highlights: ”In an increasingly competitive environment the challenges faced by the remaining public sector banks are substantial. If they don’t become more dynamic, their franchise will increasingly be eroded”, in Egyptian Banking Sector: Annual Review and Outlook”, October 2006.
50 As per CBE regulations, the minimum capital adequacy ratio is 10%. In FY 2007 capital adequacy ratio at banks as a whole reached 14.6% (which consists of 10% of core capital and 4.6% supplementary capital). 13 banks show a capital adequacy ratio between 10% - 16%, while banks with more than 15% are 20; only one bank has less than 10%.

Egypt: Growth Potential and Business Opportunities April 2008
60
Chart 7 – Equity on total assets (annual growth y/y %)
0%2%
4%6%8%
10%12%
14%16%
June 2002 June 2003 June 2004 June 2005 June 2006 June 2007
Net Profit/Equity
Equity/TA
Source: CBE, Monthly Bulletin, February 2008
Chart 8 – Earnings (%)
0.0
0.5
1.0
1.5
2.0
2.5
June 2004 June 2005 June 2006 June 2007
Net Interest Income/TA
Non-Interest Income/TA
Net Profit/TA
Source: CBE, Monthly Bulletin, February 2008
4. The Egyptian stock market
Despite their rapid development, stock markets in Africa remain thin and illiquid51. Market capitalisation as a percentage of GDP has grown to over 100%, but Egypt is recording a significant contraction in the number of firms listed (see Chart 9). These dropped from more than 700 in Jan 2006 to 430 in Jan 2008. This has been attributed to the delisting of companies that failed to meet listing requirements.
51 Africa, and Sub-Saharan Africa in particular, has experienced a rapid growth in the number of stock exchanges and a stock market capitalization boom over the last fifteen years. There are now around 20 stock exchanges operating in Africa. Two decades ago, there were only 5 in Sub-Saharan countries and 3 in North Africa. Phenomenal growth was recorded especially in Sub-Saharan Africa, excluding the older markets in South Africa and Egypt. For a detailed analysis of stock markets in Africa (the economic rationale for stock market development, the current state and functional efficiency, the role of the stock markets in privatisation processes), see Lemma Senbet, Isaac Otchere, African Stock Markets, Paper presented at the seminar organized by the IMF, Tunisia, March 4-5, 2008.

Egypt: Growth Potential and Business Opportunities April 2008
61
Chart 9 – Market cap and number of listed companies (EGP M, Units)
0100.000200.000300.000400.000500.000600.000700.000800.000900.000
Jan-06 Apr-06 Jul-06 Oct-06 Jan-07 Apr-07 Jul-07 Oct-070100200300400500600700800
Market Cap No.of companies
Source: CASE
In the past few years, the legislative, regulatory and institutional environment has improved. New rules prohibiting price manipulation and insider trading for companies working in the field of securities have been included in the Executive Regulations of the Capital Market Law. The CASE became the first Arab member of the World Federation of Exchanges in November 2005.
Chart 10 – CASE 30 Index and MSCI EM Index
A M J J A S O N D J F M A M J J A S O N D J F60
80
100
120
140
160
180
200
EGYPT CASE 30 - PRICE INDEXMSCI EM - PRICE INDEX
Source: Datastream
The efforts made to improve the stock market, along with the recent financial and banking reform measures, have helped attract new Arab and foreign investors to the market, driving its indices. In 2007, as was the case in many other Emerging Markets, the Cairo & Alexandria Stock Exchange achieved a positive performance despite worldwide financial turmoil: the CASE30 Index levelled off at 10470 points at the end of the year (+50% y/y), and the MSCI EM Index at 51535 points52.
52 Billmeier Andrea and Isabella Massa (in Go Long or Short in Pyramids? News from the Egyptian Stock Market, IMF Working Paper, WP/07/179) investigate the nexus between stock market prices and underlying fundamentals in the CASE, and also whether it is integrated with other stock markets.

Egypt: Growth Potential and Business Opportunities April 2008
62
Share trading indicators reveals that the total value in million US dollars soared by 520% y/y in Jan 2008, the highest rate in the world according to the WFE53, reaching USD 19,504M. As for the primary market, the CMA approved new issues in 2007 worth EGP 18Bn (EGP 15.6Bn in FY2006), including EGP 4.8Bn in shares of new corporations54 (0.1Bn in FY2006) and EGP 13Bn in shares of for capital increases.
Chart 11 – Investment flows (EGP Mln)
0
1.000
2.000
3.000
4.000
5.000
6.000
7.000
8.000
Jan-06 Apr-06 Jul-06 Oct-06 Jan-07 Apr-07 Jul-07 Oct-07
IPO Secondary Offerings
Source: WFE
Likewise, market capitalisation increased by 65% y/y in January 2008, reaching EGP 833Bn and accounting for more than 100% of GDP as at December 200755. Growth was reinforced by foreign investors.
Distribution of market capitalisation by sector shows that the finance, insurance, and real estate sectors attracted most investments during the period. As such, the relative importance of these sectors grew to 34.5% at the end of December 2007, from 31.2% at the end of June 2006. On the other hand, the relative importance of the manufacturing sector decreased to 16.1% from 27.8%.
Over the past few years, many state-owned enterprises used the stock markets as vehicles for privatisation. Table 3 presents a list of privatisations carried out in Egypt, including share-issue privatisations56. Share-issue privatisation programs contributed directly to the depth of the stock market by means of increased supply of listed companies.
Regional cooperation, and integration among disparate and thin markets, would represent an important mechanism in overcoming the barrier to global integration. A growing number of initiatives are being taken along these lines. Regional stock
53 See World Federation of Exchanges, Monthly Bullettin, February 2008. 54 Last November, the IPO of Egyptian real estate firm Talaat Mustafa Group was 41.4
times oversubscribed, with total offers amounting to EGP 29.6Bn (USD 5.4Bn). 55 As regards the role of the stock market in promoting economic growth, according to an
interesting IMF study – one of the very few studies on Africa – market capitalisation and the value of shares traded relative to the size of the economy are the channels through which African stock markets concretely influence economic growth. The stock markets contribute to the financing of corporate investments, hence the growth of listed firms in Africa. Senbet, Otcheere (2008).
56 For a detailed list of various privatisation programmes see ANIMA, Privatisation Programmes in the MEDA Countries, Paper n.19, Jan 2005.

Egypt: Growth Potential and Business Opportunities April 2008
63
exchanges are being contemplated along linguistic lines: the Francophone countries of West Africa formed the first regional stock exchange, BVRM, in 1998, and the Anglophone countries of West Africa are contemplating forming a regional stock exchange under the umbrella of the ECOWAS. CASE has been putting in place a new trading platform built by Nordic bourse OMX AB in order to increase trading capacity and offer derivative financial products by the middle of 2009.
Table 3 – List of privatised firms
Year Company name Sector Transaction value (USD M)
2006 CIB Banking 2224.70 2006 Bank of Alexandria Banking 1610.0 2006 Egyptian American Bank Banking 169.80 2006 Sidi Abdel Rahman Hotel and Land Services 173.10 2006 Etisalat Misr (third GSM license) Telecommunications 2900.0 2005 Telecom Egypt Telecommunications 892.0 2005 Alexandria Mineral Oils Energy 156.0 2005 Sidi Kreir Petrochemicals Energy 153.0 2005 National Ferlizer Company Manufacturing 341.0 2005 Suez Cement Manufacturing 339.0 1999 Alexandria Portland Cement Manufacturing 178.0 1999 Beni Suef Cement Manufacturing 150.0 1999 Assiout Cement Company Manufacturing 414.50 1996 Helwan Portland Cement Manufacturing 144.48 1996 Cairo Sheraton Tourism 146.69 1995 Eastern Tobacco Agriculture 163.70
Source: Reuters
* The Egyptian government plans to offer its 15 percent stake in Bank of Alexandria on the Egyptian stock market in 2008.
Davidia Zucchelli

Egypt: Growth Potential and Business Opportunities April 2008
64

Egypt: Growth Potential and Business Opportunities April 2008
65
The International Network of Intesa Sanpaolo Economists Authors of this study: Gianluca Salsecci (Coordinator), Hemmat EL-Masry, Emil Eskander, Giancarlo Frigoli, Sahar Khaled, Salah Oraby, Antonio Pesce, Mona Rabiee, Wilma Vergi, Davidia Zucchelli
Editing Sonia Papandrea, Raffaella Caravaggi, Cristina Baiardi, Monica Bosi
Disclaimer This publication has been produced by Intesa Sanpaolo. Information and opinions have been obtained from sources believed by Intesa Sanpaolo to be reliable, but they are not necessarily complete and no representation of warranty is made as to their accuracy or correctness. This report has been prepared solely for information purposes and is not intended as an offer or solicitation with respect to the purchase or sale of any financial products. This document may only be reproduced in whole or in part citing the name Intesa Sanpaolo.