egyptian food observatory - world food...
TRANSCRIPT

Egyptian Food Observatory Food Monitoring and Evaluation System
Food Monitoring and Evaluation System

Egyptian Food Observatory Food Monitoring and Evaluation System
2
Publication Objectives
Table of Contents Highlights 3 Section 1: Trends and Impact of Food Commodity Price Changes 4
1.1 Food Basket Price Changes 4 1.2 Inflation Rates 4 1.3 Regional Variations in Commodity Prices 5 1.4 Global Food Commodity Price Trends 6
Section 2: Vulnerable Households’ Food Security 7 2.1 Characteristics of Vulnerable Households 7 2.2 Changes in Income and Expenditure of Vulnerable
Households 8
2.3 Vulnerable Households Use of Ration Cards for Subsidized Foods 10
2.4 Vulnerable Households’ Food Consumption 11 2.5 Vulnerable Households Perception of Food Prices 12
Special Report: Cost of Hunger in Egypt 13 3. 1 Conceptual Framework of the Study 13 3. 2 The Cost of Hunger in Egypt 13 3. 3 Recommendations and proposed interventions to fight hunger 14
Annex: Survey and Composite Index Methodology 15 Map of Targeted Governorates2 16
This food security monitoring publication, which is jointly published by the Egyptian Cabinet’s Information and Decision Support Center (IDSC) and WFP, systematically tracks trends in the production, consumption and prices of key food commodities and their impact on the food security1 situation of the vulnerable households in urban and rural areas across Egypt. It identifies emerging local and global issues and monitors trends that can affect food security in Egypt. Aimed at policy makers and development partners, this publication seeks to provide updates and analysis of Egypt’s food security situation to assist its audience in policy decision-making.
Initially released monthly, the publication is now being produced quarterly to better highlight longer-term changes in the food security situation of the country and provide more comprehensive analysis to decision makers.
1 “Food security exists when all people, at all times, have physical, social and economic access to sufficient, safe and nutritious food to meet their dietary needs and food preferences for an active and healthy life”, FAO (1996), Declaration of the World Food Summit. The food security encompasses food availability, access, utilization and stability. 2 Due to political turmoil and consequent emergency state called in different governorates frontier governorates were excluded from current round of the survey.
Editorial Board Dr. Eng. Sherif M. Badr
IDSC Chairman
Principal Investigator Dr. Nisreen Lahham International Cooperation
Department, Technical Expert, IDSC
Research Team Ms. Neveen El-Helw
Ms. Heba Adel
Mr. Mostafa Rabee
Ms. Heba Youssef
Ms. Heba Ismail
World Food Programme Team
Mr. Abraham Abatneh
Ms. Noura Abdelwahab
Ms. Alaa Zohery

Egyptian Food Observatory Food Monitoring and Evaluation System
3
Highlights
Special Report: Cost of Hunger in Egypt
Inflation, as measured by the Consumer Price Index, increased by 11.1% between September 2012 and September 2013, during the same period ‘food and beverages price index’ saw a sizeable increase of 14%. (Page 4)
With 66.6% of the vulnerable1 households’ (HHs) expenditure going to food, this makes them particularly vulnerable to higher food prices and highlights that food security remains an issue of economic access. (Page 4)
The cost of the average food basket2, as measured by the Monthly Price Burden, saw an increase of 2.8% between June and September 2013 compared to an increase of 4.4% in the last quarter (March to June 2013). (Page 4)
Prices rose across all regions, with Upper Egypt seeing the steepest increase of 4.4% between June and September 2013, followed by Frontier (3.6%), Urban governorates (2.1%) and Lower Egypt (1.1%). (Page 4)
Some 17.3% of vulnerable HHs surveyed do not hold a ration card. (Page 10)
Shortage in commodities (81.1%) at ration grocers was the main reason cited in preventing HHs from purchasing rationed commodities, followed by poor quality of commodities (10.8%). (Page 10)
Only 6.2% of vulnerable HHs knew that rationed oil is fortified with vitamin (A) and vitamin (D), suggesting the need for awareness raising of the fortification and its benefits. (Page 10)
All HHs consumed oil/ ghee/ butter and sugar (6.7 days a week) and vegetables (6.5 days a week) on a daily basis. There is low consumption of animal proteins by vulnerable HHs, with meat (beef and lamb), and fish (tilapia and catfish) consumed less than once a week. Eggs form the main source of animal protein consumed by 92.7% of HHs 2.6 days a week. (Page 11)
The percentage of working children that belong to vulnerable HHs (6 – 18 years) “child labor” has amounted to 6.3%, about three quarters of these children (73.3%) belong to the age group (15 – 18 years). (Page 7)
In Q3 of 2013 some 89.7% of vulnerable HHs surveyed reported their income to be insufficient to cover total monthly needs up from 82.7% in Q2 of 2013. (Page 9)
HHs whose income was insufficient to meet their monthly needs used coping strategies including borrowing food or money/ depending on assistance from family members/ friends’, which in Q3 of 2013 represented 35.3% of coping strategies, Consuming cheaper food items (25.7%), reducing food intake (18.0%) and buying on credit (10.8%). (Page 9)
1 See Annex (p. 14) for the criteria of vulnerable household selection. 2 See Annex (p. 14) for full list of items in the food basket.
The Cost of Hunger in Africa (COHA) is a project led by the African Union Commission and supported by the Economic Commission for Africa (ECA) and the World Food Programme (WFP). The study was initiated in four pilot countries (Egypt, Ethiopia, Swaziland and Uganda). In Egypt the study was led by the Cabinet’s Information, Decision and Support Center (IDSC) in collaboration with WFP Country Office.
The study for Egypt shows that an estimated 20.3 billion Egyptian pounds (US$ 3.7 billion) were lost in 2009 as a result of child undernutrition. This was equivalent to 1.9% of the country’s Gross Domestic Product (GDP).
According to the study, up to one in every five cases of child undernutrition, largely related to stunting (low height for a person’s age), go untreated.
The study highlights that today, there are more stunted children in Egypt than 10 years ago. Child mortality that is associated with undernutrition has reduced Egypt’s workforce by 1%. Stunted children
achieve up to 0.2 fewer years in education, which affects their chances of income earning potential later in life. The study shows that undernutrition is not just a health issue, but an economic one as well. It reinforces the critical
need to prioritize malnutrition in the national development agenda.
Egyptian Food Observatory Food Monitoring and Evaluation System
Figure (2) The monthly price burden by region
Source: Field Monitoring Network, Cabinet-Information and Decision Support Center.
L.E.
Food Basket Price Changes 1.1
4
Inflation Rates 1.2
1. Trends and Impact of Food Commodity Price Changes
Figure (3) Monthly inflation rate for consumer prices1
(%)
1Reference month (January 2010=100%). Source: Central Agency for Public Mobilization and Statistics, CAPMAS.
Figure (4) Food and Beverages Price Index1
(point)
1Reference month (January 2010=100 points). Source: Central Agency for Public Mobilization and Statistics, CAPMAS.
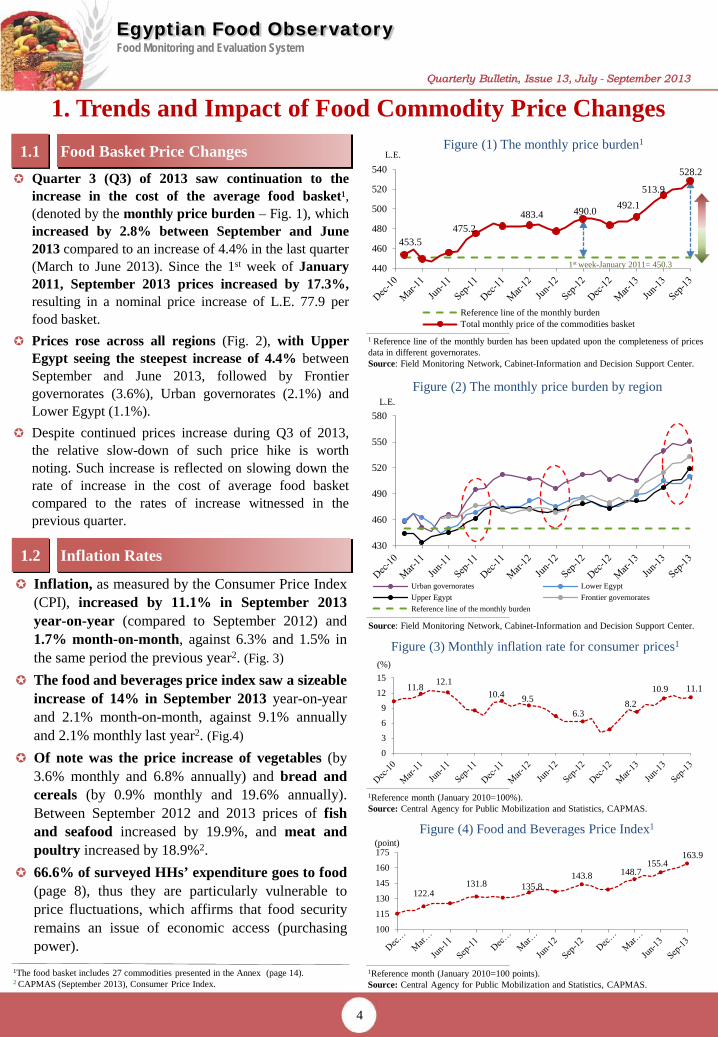
Figure (1) The monthly price burden1 L.E.
1The food basket includes 27 commodities presented in the Annex (page 14). 2 CAPMAS (September 2013), Consumer Price Index.
1 Reference line of the monthly burden has been updated upon the completeness of prices data in different governorates. Source: Field Monitoring Network, Cabinet-Information and Decision Support Center.
Quarter 3 (Q3) of 2013 saw continuation to the increase in the cost of the average food basket¹, (denoted by the monthly price burden – Fig. 1), which increased by 2.8% between September and June 2013 compared to an increase of 4.4% in the last quarter (March to June 2013). Since the 1st week of January 2011, September 2013 prices increased by 17.3%, resulting in a nominal price increase of L.E. 77.9 per food basket.
Prices rose across all regions (Fig. 2), with Upper Egypt seeing the steepest increase of 4.4% between September and June 2013, followed by Frontier governorates (3.6%), Urban governorates (2.1%) and Lower Egypt (1.1%).
Despite continued prices increase during Q3 of 2013, the relative slow-down of such price hike is worth noting. Such increase is reflected on slowing down the rate of increase in the cost of average food basket compared to the rates of increase witnessed in the previous quarter.
Inflation, as measured by the Consumer Price Index (CPI), increased by 11.1% in September 2013 year-on-year (compared to September 2012) and 1.7% month-on-month, against 6.3% and 1.5% in the same period the previous year2. (Fig. 3)
The food and beverages price index saw a sizeable increase of 14% in September 2013 year-on-year and 2.1% month-on-month, against 9.1% annually and 2.1% monthly last year2. (Fig.4)
Of note was the price increase of vegetables (by 3.6% monthly and 6.8% annually) and bread and cereals (by 0.9% monthly and 19.6% annually). Between September 2012 and 2013 prices of fish and seafood increased by 19.9%, and meat and poultry increased by 18.9%2.
66.6% of surveyed HHs’ expenditure goes to food (page 8), thus they are particularly vulnerable to price fluctuations, which affirms that food security remains an issue of economic access (purchasing power).
11.8 12.1 10.4 9.5
6.3 8.2
10.9 11.1
0369
1215
122.4 131.8 135.8
143.8 148.7 155.4
163.9
100
115
130
145
160
175
453.5 475.2
483.4 490.0 492.1 513.9
528.2
440
460
480
500
520
540
Reference line of the monthly burdenTotal monthly price of the commodities basket
1st week-January 2011= 450.3
430
460
490
520
550
580
Urban governorates Lower EgyptUpper Egypt Frontier governoratesReference line of the monthly burden

Egyptian Food Observatory Food Monitoring and Evaluation System
Regional Variations in Commodity Prices 1.3
1 Poultry prices are defined as average local, and white live and frozen poultry. 2 Unpacked bean 3 Packed 4 Include packed and bulk 5 Ordinary Packed 6 Packed by private sector 7 L.E./ liter
Source: Field Monitoring Network, Cabinet-Information and Decision Support Center.
5
Table (1) September 2013 prices and the rate of change compared to June 2013 prices of some food commodities
Table 1 below shows an increase in the number of commodities that recorded price decrease in Q3 of 2013, in line with relative slow-down in price increases noted in Section 1.1.
On contrary to Q2, Q3 of 2013 has witnessed price decrease of Tomato across all regions following July harvest1.
Potatoes prices continued to increase in Q3 of 2013. Such increase is expected to continue in October since it is sowing/ planting season1. Onion prices has also increased, contrary to previous quarter, because Comparison of the price per Kg by amount and as %* Goods
oGiza and El-Behera: urban < rural by L.E. 4.0 and 3.0 respectively (66.7% and 42.9%, respectively).
Local beans
oEl-Sharqia: urban > rural by L.E. 2.3 (20.6%). oAssuit: urban < rural by L.E. 2.0 (25.0%).
Yellow lentils
o Ismailia: urban > rural by L.E. 4.3 (32.1%). oDamietta and Assuit: urban < rural by L.E. 3.8 and 3.0
respectively (50.0% and 42.9%, respectively).
Black lentils
oDamietta : urban < rural by L.E. 2.0 (32.4%). Potatoes
oAswan: urban < rural by L.E. 2.0 (72.7%). Onion
oEl-Behera, Aswan and El-Sharqia: urban < rural by L.E. 5.5, 5.0 and 2.8 respectively (68.8%, 33.3% and 26.6%, respectively).
Garlic
oEl-Behera and Damietta: urban < rural by L.E. 3.5 and 2.0 respectively (50.0% and 32.0%, respectively).
Milk
oGiza, Damietta and El-Behera: urban > rural by L.E. 4.8, 4.4 and 4.0 respectively (25.9%, 23.2% and 20.7%, respectively).
Poultry
oQena and Aswan: urban > rural by L.E. 7.5 and 7.0 respectively (34.1% and 35.0%, respectively). Tilapia fish
oAssuit: urban > rural by L.E. 6.0 (37.5%). Catfish
oGiza and El-Sharqia: urban > rural by L.E. 17.5 and 15.3 respectively (25.0% and 23.5%, respectively).
oAswan and Qena: urban < rural by L.E. 22.0 and 15.0 respectively (66.7% and 30.0%, respectively).
Beef
oEl-Behera and Damietta: urban > rural by L.E. 16.7 and 15.0 respectively (25.0% and 21.4%, respectively).
Lamb
Table (2) Comparison of food commodities prices between urban and rural areas
September is sowing/ harvesting period1.
Urban and rural commodity prices were monitored in September 2013 in Damietta, El-Sharqia, El-Behira, Ismailia, Giza, Assuit, Qena and Aswan governorates (see Table 2).
It is worth noting that 54.5% of urban prices were higher than rural prices; whereas 5.1% of rural prices compared were identical with urban prices.
*Percentages were calculated by dividing the difference between urban and rural prices by the urban price.
L.E. Kg (%)
Frontier Upper Lower Urban Goods
62.0 (1.8)
56.7 (5.0)
60.8 (- 0.7)
65.7 (- 1.0) Beef
20.8 (1.1)
19.5 (- 2.6)
18.8 (-1.7)
19.6 (- 4.0) Poultry1
16.4 (4.9)
16.2 (- 1.6)
13.5 (- 1.8)
13.3 (- 3.9) Tilapia fish
3.4 (- 2.3)
2.7 (- 3.7)
3.0 (- 7.0)
3.3 (6.7) Eggplant
5.6 (54.5)
5.9 (66.6)
6.0 (83.8)
6.1 (74.8) Potatoes
4.0 (12.8)
3.7 (21.0)
3.3 (21.8)
3.3 (15.8) Onions
2.9 (- 7.7)
2.0 (- 26.4)
2.1 (- 23.0)
1.8 (- 34.3) Tomatoes
8.7 (1.1)
7.8 (- 1.1)
8.2 (- 1.1)
8.8 (2.9) Local beans2
9.8 (7.2)
9.6 (2.2)
10.3 (6.9)
9.5 (- 1.8) Yellow lentils3
4.7 (4.4)
4.4 (- 0.5)
5.1 (1.0)
4.8 (7.5) Flour3
4.5 (3.9)
4.5 (- 2.5)
4.4 (4.6)
4.6 (4.9) Rice4
4.9 (1.0)
5.2 (3.0)
4.9 (0.9)
6.0 (5.9) Macaroni5
5.5 (0.3)
5.4 (0.6)
5.6 (- 1.1)
5.9 (7.7) Sugar6
14.1 (0.2)
14.6 (0.5)
13.8 (0.8)
15.3 (2.0) Corn oil7
1 http://www.fao.org/agriculture/seed/cropcalendar/cropcalendar.do

Egyptian Food Observatory Food Monitoring and Evaluation System
Figure (6) Development of the Egyptian Pound exchange rate versus the US Dollar
Figure (5) Global price developments of selected food commodities
Source: The Central Bank of Egypt
L.E./ USD
Global Food Commodity Prices 1.4
1 Stock Exchange of Kansas City Council of Commerce. 2 Stock Exchange of Chicago Council of Commerce. 3 New York Stock Exchange.
Self-sufficiency ratio (2012)
6
Wheat1 Corn/ Maize2 69.1%5 51.5%5 70.0%5 47.7% 5
1.4.2 Egyptian Pound-US Dollar Exchange Rate and Net International Reserves
USD/ Kg USD/ Kg USD/ Kg USD/ Kg Sugar (#5)3 Beef4,6,7
4 International Monetary Fund, http://www.imf.org. 5 Ministry of Agriculture and Land Reclamation. 6 U.S.A Department of Agriculture, http://www.ams.usda.gov 7 Values of September aren’t published yet.
compared to the below average levels of 2012/13 2. Ministry of Supply and Internal Trade agreed with
one of the largest international companies operating in retail food commodities to participate in the discounts initiative set up by the ministry to provide commodities for citizens with discounts ranging from 10 to 25%, including sugar, oil, rice, meat and poultry3.
Global prices of potatoes, garlic, rice and corn decreased by 23.6%, 48.0%, 2.5% and 29.2%, respectively, between Q2 and Q3 of 2013.
‘World yields basket’ was the name of ancient Egypt due to the abundance of wheat production. Thus achieving sufficiency to Egypt and many countries worldwide. Currently however, due to the deterioration of the agricultural system and the increase in population, Egypt has to import 50% of its wheat demands from abroad1.
1.4.1 Global prices of key food commodities In 2013/14, coarse grains and wheat imports is
forecasted to increased by 21% and 14% respectively,
5.92 5.95 6.02 6.08 6.15
6.76
6.98 6.89
5.75
6.00
6.25
6.50
6.75
7.00
7.25
0.0
0.1
0.2
0.3
0.4
0.5
0.0
0.1
0.2
0.3
0.4
0.5
0.0
1.0
2.0
3.0
4.0
5.0
0.0
1.0
2.0
3.0
4.0
5.0
For the first time since December 2010, the value of the Egyptian pound against the dollar increased by 1.3% between June and September 2013. (Fig 6)
Net foreign reserves reached to USD 18.7 bn at the end of September 2013 4. It is expected that foreign reserves will see more stability and growth to nearly USD 20 bn by moving sources of foreign exchange for the first time since January 2011 revolution, and the return of pumping revenue into the banking sector5. Development of improved foreign reserves provide about 30 bn pounds in the state budget due to lower borrowing costs6.
Trade balance deficit has reduced in June 2013 amounting to L.E 19.89 bn compared to L.E. 22.51 bn in June 2012 (i.e. decreasing by 11.6%)7.
Balance of payments improved notably in 2012/ 2013 and achieved a total surplus of about USD 237 million, compared to a deficit of USD 11.3 bn during the previous year8.
1 Ahram, 2 Oct, 2013, the Agriculture of wheat is not enough only 50% of our needs. 2Crop Prospects and Food Situation, October 2013.
3 El masaaia, 4 Sep 2013, the share of rice amounted to 150 thousand tons, sugar enough and flooding.
4 http://www.cbe.org.eg/Arabic/ 5 Ahram, 2 Oct, 2013, the reserve is approaching USD 20 bn, and the economy is
recovering. 6 El Shorouk, 8 Oct 2013, http://shorouknews.com/news/view.aspx?cdate=08102013&id=c4a8f4e9-a38f-4173-9d35-ec84f7f45acb.
7 CAPMAS, Monthly Summary for foreign trade data, June 2013. 8 Ministry of Finance, the financial report, September 2013.

Egyptian Food Observatory Food Monitoring and Evaluation System
(%)
1 Enrollment rates had been calculated for individuals who are 6+. 2 Drop out rates had been calculated for individuals who are 6+ and stopped education whereby did not complete preparatory schooling. Source: Assessment Survey of the Vulnerable Households, Egyptian Food Observatory, September 2013.
Drop out Rate2 Enrollment Rate1 Age Distribution Age Group
1.3 96.9 26.1 10-
18.7 95.3 22.3 (11-20)
31.5 86.8 15.9 (21-30)
48.8 73.3 12.5 (31-40)
58.6 57.9 10.4 (41-50)
80.1 44.1 6.8 (51-60)
82.2 32.1 4.1 (61-70)
85.0 14.0 1.9 71+
30.6 77.2 100.0 Total
(%)
Table (4) Breakdown of employed household heads by occupation and gender1
Table (3) Breakdown of the sample, enrollment and drop out rates by age groups
The number of HHs sampled in this survey was 1,680 (7,653 household members) equally distributed across 10 governorates. (see map on p.16)
Female headed HHs constituted 20.1% of total HHs surveyed. Total HH heads’ participation in the labor force across Egypt amounted to 68.8%, constituting about 81.7% among male and 17.2% among female HH heads.
About two thirds of the sample (64.3%) are aged 30 years or under.
The rate of enrollment in education among those sampled group (6+ years old) amounted to 77.2%.
Enrollment rates increased amongst those aged 30 years or under, where it ranged between 86.8% – 96.9%. These rates decreased in the 31 – 70 age group, where enrollment rates did not exceed 73.3%.
Around 30.6% of the total sample (aged 6+ years) who had been enrolled in school, had dropped out of basic education (before preparatory level). Drop-out rates increased amongst the sampled groups with elder age. In this regard, drop-out rates was 1.3% among the 6 – 10 age group compared with 18.7% in the 11– 20 age group.
Table 4 highlights that the vulnerable groups are engaged in casual labor, with 70.2% of employed male HH heads working as carrier/ office boy, worker, seller, farmers or driver; whereas 43.1% of employed female HH heads work as sellers.
Unemployment rate1 among the vulnerable at working age (15 – 64 age group) has decreased by 4.9% in Q3 of 2013 compared to Q2 of 2013 and amounted to 18.9% constituting 12.9% among males and 43.1% among females. This is against the national unemployment rate of 13.3% in Q2 of 2013; 9.8% and 25.1% among males and females, respectively2. This points that unemployment in Egypt continues to be a youth issue and it affects both vulnerable and non-vulnerable.
2. Vulnerable Households’ Food Security 2. 1 Characteristics of Vulnerable Households
Total Female Male Occupation
16.7 11.8 16.9 Carrier or office boy
15.9 3.8 16.4 Worker
13.7 43.1 12.3 Seller
13.3 11.8 13.4 Farmer (not holding property)
10.6 0.0 11.2 Driver
5.9 0.0 6.1 Carpenter
3.8 0.0 4.0 Building construction
2.7 0.0 2.8 Security guard
2.4 2.0 2.5 Waiter
15.0 27.5 14.4 Other
100.0 100.0 100.0 Total 1 Based on investigation of the employment status of household heads in the week preceding the survey; unemployed persons are excluded before calculating the proportional breakdown. 2 Includes; peddler, street vendor, and seller in shop, Source: Assessment Survey of the Vulnerable Households, Egyptian Food Observatory, September 2013.
1 Includes those who don’t work, but are seeking a job (i.e. excluding those who are economically inactive such as housewives, school or university students, army recruits, etc.). 2 CAPMAS, Labor Force Survey Bulletin (April – June 2013), http://www.capmas.gov.eg/default.aspx
About 58.3% of the employed HH heads suffer from unstable employment.
7
The percentage of working children (6 – 18 years) “child labor” has amounted to 6.3%, about three quarters of these children (73.3%) belong to the age group (15 – 18 years).

Egyptian Food Observatory Food Monitoring and Evaluation System
(%) ]Households[
Figure (8) Breakdown of the sources of vulnerable households' additional income apart from the main job
Source: Assessment Survey of the Vulnerable Households, Egyptian Food Observatory, June 2013, September 2013.
1 Percentages are calculated based on recall question “During the past year has your family been exposed to any crisis/ problem that affected your financial situation?”. Source: Assessment Survey of the Vulnerable Households, Egyptian Food Observatory, September 2013.
Average spending on food and non-alcoholic beverages amongst vulnerable HHs constituted some 66.6% of total HH spending this quarter, up from 64.7% in the previous quarter, and against 40.6% by the average HH in Egypt1.
Average monthly expenditure of vulnerable HHs surveyed this quarter, amounted to L.E. 749.5 (or daily per capita expenditure of around L.E. 5.8), down from L.E. 761.3 in Q2 of 2013.
2. 2 Changes in Income and Expenditure of Vulnerable Households
HH incomes continued to remain largely static. Based on a recall question for the previous month (September to August 2013), some 90.1% of HHs surveyed reported that their monthly income remained unchanged, compared to 95.4% in Q2 of 2013. About 8.2% of HHs in Q3 of 2013 reported an income reduction by an average of L.E. 213.9. Whereas 1.7% of the surveyed HHs reported an income increase amounting to L.E. 102.0 on average. (Fig. 7)
About 41.0% of the surveyed HHs reported exposure to some form of crisis/ problem which affected their financial situation over the past year. This is up from 36.2% in Q2 of 2013. About 29.9% of these HHs identified increased health expenditures as a major crisis, followed by job loss (21.2%).
About 47.2% of the surveyed HHs reported obtaining additional sources of income to supplement that from their main job. This is against 41.9% in Q2 of 2013.
Governmental assistance/ social solidarity pension constituted the most significant supplementary income source; it brought about 38.8% of additional income, slightly up from 35.0% in Q2 of 2013.
Retirement/ insurance pension constituted, on average, 29.2% of additional income sources, while charitable assistance constituted about 25.5%, either in the form of family assistance (14.3%), philanthropic community assistance (7.2%), or assistance from non-governmental organizations (4.0%).
Figure (7) Vulnerable households income change compared to the month preceding the survey and exposure to financial
crises during the previous year1
2.2.1 Vulnerable Household Expenditure
2.2.2 Vulnerable Household Income
1 Central Agency for Public Mobilization and Statistics (2011) Household Income, Expenditure and Consumption Survey.
)%(
Figure 7) a) Breakdown of households according to income change compared to
the month preceding the survey
Figure 7) b)Breakdown of households according to Exposure to financial crises
over the previous year
8
Did not change (90.1%)
[1513 HH]
Decreased (8.2%)
[137 HH] Increased
(1.7%) [30 HH]
Exposed (41%)
[688 HH] Not exposed (59%)
[992 HH]
38.8
29.2
14.3
7.2
4.5
4.0
2.0
35.0
36.6
11.5
4.1
7.0
4.0
1.8
0 10 20 30 40 50
Governmental Assistance/ SocialSolidarity Pension
Retirement/ Insurance Pension
Familiy Assistance
Philanthropy Community Assistance
Military Salary
Assistance from non-governmentalorganizations
Others
2nd quarter of 2013
3rd quarter of 2013

Egyptian Food Observatory Food Monitoring and Evaluation System
In Q3 of 2013, 89.7% of vulnerable HHs surveyed reported their income to be insufficient to cover total monthly needs (including food, clothes, shelter etc.), up from 82.7% in Q2 of 2013 (Fig. 9). Of those 89.7%, some 80.6% reported insufficient income to cover monthly food needs in Q3 of 2013.
In current sample which covers 10 governorates, the percentage of HHs whose income was insufficient to meet their total monthly needs recorded its highest value in Ismailia (98.8%), followed by Damietta and Aswan (92.9%).
The highest percentage of HHs stating that their income was insufficient to meet their monthly food needs was recorded in Aswan (97.4%), followed by Qena (94.8%) and El-Behera (92.9%).
(%)
Figure (10) Coping strategies used by vulnerable households whose income is insufficient to meet monthly needs
Other include; a family member engaging in casual work, taking child out of school, and selling part of the household property. Source: Assessment Survey of the Vulnerable Households, Egyptian Food Observatory, June 2013, September 2013.
(% ) [Households]
Figure (9) Vulnerable household income sufficiency
Source: Assessment Survey of the Vulnerable Households, Egyptian Food Observatory, September 2013.
Figure 9) a) Breakdown of households according to income sufficiency to meet
total monthly needs
HHs whose income was insufficient to meet their monthly needs resorted to employing a number of coping strategies. The most prevalent in September 2013 was ‘Borrowing food or money/ depending on assistance from family members/ friends’ (Fig. 10) representing 35.3% of coping strategies, down from 38.4% in Q2 of 2013. This is against the established pattern from September 2011, where consuming cheaper food items used to top the coping strategies that has been reverted in Q2 of 2013. Q3 sustained such change in the overall trend.
Borrowing and consuming cheaper food items are the most prevalent coping strategies that vulnerable HHs used to cover their needs, suggesting that vulnerable HHs are adopting more severe coping mechanisms where incomes do not suffice. Consuming cheaper food items by families whose income was insufficient to meet their monthly needs represented 25.7% of coping strategies in Q3 of 2013 compared to 19.7% in Q2 of 2013.
Other coping strategies adopted included; buying on credit (10.8% down from 17.6% in Q2 of 2013), and reducing food intake (18.0%), which continued its increase since Q1 of 2013, as did rationalizing adult food consumption for the sake of children (3.2%, compared to 2.2% in Q2 of 2013 and 1.4% in Q1 of 2013). These are negative trends that make recovery more difficult for vulnerable HHs.
2.2.3 Coping Strategies
Figure 9) b) Breakdown of households whose income
does not suffice their monthly needs according to income sufficiency to food needs
9
Sufficient (10.3%)
[173 HH]
Insufficient (89.7%)
[1507 HH]
Sufficient (19.4%)
[293 HH]
Insufficient (80.6%)
[1214 HH]
35.3
25.7
18.0
10.8
3.8
3.2
1.7
1.5
38.4
19.7
16.1
17.6
2.4
2.2
1.5
2.1
0 10 20 30 40 50
Borrow food or money/depending on assistance from
family members/ friends (food/non-food)
Consuming cheaper food items
Reducing food portions/ numberof meals
Buy on credit/ installment
Assistance from the philanthropycommunity (food or non-food)
Rationalizing adult foodconsumption for the sake of
children
Second job (household head orwife or children)
Other
2 nd quarter of 2013
3rd quarter of 2013
Egyptian Food Observatory Food Monitoring and Evaluation System
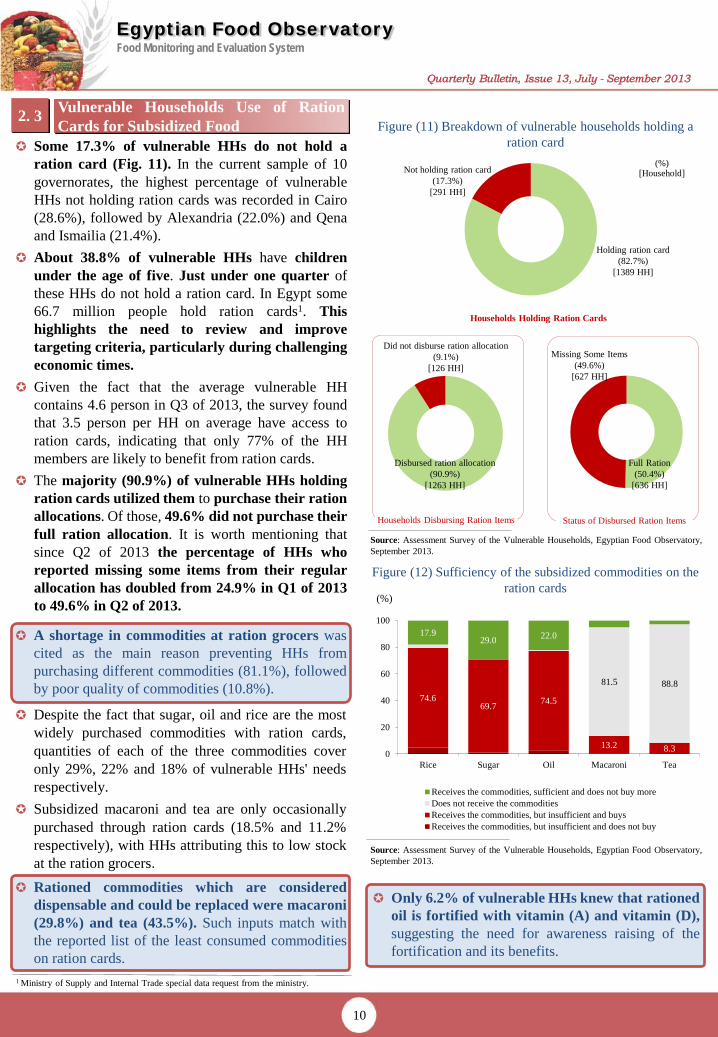
Figure (11) Breakdown of vulnerable households holding a ration card
Figure (12) Sufficiency of the subsidized commodities on the ration cards
Source: Assessment Survey of the Vulnerable Households, Egyptian Food Observatory, September 2013.
2. 3 Vulnerable Households Use of Ration Cards for Subsidized Food
(%)
Source: Assessment Survey of the Vulnerable Households, Egyptian Food Observatory, September 2013.
(%) [Household]
Status of Disbursed Ration Items Households Disbursing Ration Items
Households Holding Ration Cards
Despite the fact that sugar, oil and rice are the most widely purchased commodities with ration cards, quantities of each of the three commodities cover only 29%, 22% and 18% of vulnerable HHs' needs respectively.
Subsidized macaroni and tea are only occasionally purchased through ration cards (18.5% and 11.2% respectively), with HHs attributing this to low stock at the ration grocers.
Rationed commodities which are considered dispensable and could be replaced were macaroni (29.8%) and tea (43.5%). Such inputs match with the reported list of the least consumed commodities on ration cards.
Only 6.2% of vulnerable HHs knew that rationed oil is fortified with vitamin (A) and vitamin (D), suggesting the need for awareness raising of the fortification and its benefits.
1 Ministry of Supply and Internal Trade special data request from the ministry.
A shortage in commodities at ration grocers was cited as the main reason preventing HHs from purchasing different commodities (81.1%), followed by poor quality of commodities (10.8%).
Some 17.3% of vulnerable HHs do not hold a ration card (Fig. 11). In the current sample of 10 governorates, the highest percentage of vulnerable HHs not holding ration cards was recorded in Cairo (28.6%), followed by Alexandria (22.0%) and Qena and Ismailia (21.4%).
About 38.8% of vulnerable HHs have children under the age of five. Just under one quarter of these HHs do not hold a ration card. In Egypt some 66.7 million people hold ration cards1. This highlights the need to review and improve targeting criteria, particularly during challenging economic times.
Given the fact that the average vulnerable HH contains 4.6 person in Q3 of 2013, the survey found that 3.5 person per HH on average have access to ration cards, indicating that only 77% of the HH members are likely to benefit from ration cards.
The majority (90.9%) of vulnerable HHs holding ration cards utilized them to purchase their ration allocations. Of those, 49.6% did not purchase their full ration allocation. It is worth mentioning that since Q2 of 2013 the percentage of HHs who reported missing some items from their regular allocation has doubled from 24.9% in Q1 of 2013 to 49.6% in Q2 of 2013.
10
Not holding ration card (17.3%)
[291 HH]
Holding ration card (82.7%)
[1389 HH]
Did not disburse ration allocation (9.1%)
[126 HH]
Disbursed ration allocation (90.9%)
[1263 HH]
Full Ration (50.4%)
[636 HH]
Missing Some Items (49.6%)
[627 HH]
74.6 69.7 74.5
13.2 8.3
81.5 88.8
17.9 29.0 22.0
0
20
40
60
80
100
Rice Sugar Oil Macaroni Tea
Receives the commodities, sufficient and does not buy moreDoes not receive the commoditiesReceives the commodities, but insufficient and buysReceives the commodities, but insufficient and does not buy

Egyptian Food Observatory Food Monitoring and Evaluation System
Animal proteins1 Legumes Vegetables & Fruit2
Figure (13) Breakdown of vulnerable households’ consumption by commodity type (from the food basket), frequency of consumption (number of days a week)
1 Proteins including meat, poultry, rabbits, fish and eggs. 2 Vegetables including leafy and non-leafy vegetables. 3 Butter/ghee including natural and manufactured. 4 Dairy Products except for butter. Source: Assessment Survey of the Vulnerable Households, Egyptian Food Observatory, September 2013.
Average number of days of consumption per week Do not Consume No Longer Consume Consume
Grain, Flour & Bread Oils, Ghee, Butter3 & Sugar Cheese & Dairy Products4
0.8 0.4 0.02 0.1 0.6 2.6 1.5 (%) 2.5 0.5 4.6 3.0 5.7 6.5 (%) (%)
(%)
6.0 1.2
6.9 1.3 6.2 3.2 1.2 3.0 1.6 2.8 3.6 4.4 7.0 1.1 6.9. 6.7 2.8 6.4
Vulnerable households’ (HHs) food consumption patterns have remained largely constant since the launching of the EFO in September 2011, showing a continued over-reliance on subsidized cereals and bread, oil and sugar and a poor dietary diversity.
As Figure 13 below indicates, cereals and carbohydrates (bread/ grains/ roots) are the main food group that all HHs surveyed consume on a daily basis (noted at 6.9 days a week). Of these items, subsidized bread was the most frequently consumed item (6.2 days a week) by the majority of HHs (88.0% of HHs).
All HHs consumed oil/ ghee/ butter and sugar on a daily basis (6.7 days a week).
HHs surveyed show a lower consumption of fruits as 86.1% consume it only 1.2 days a week.
All HH consumed vegetables on an average of 6.5 days/week.
There is low consumption of animal proteins by vulnerable HHs, with meat (beef and lamb), and fish (tilapia and catfish) consumed less than once a week. About 83.7% of HHs eat poultry approximately once a week. Eggs form the main source of animal protein consumed by 92.7% of HHs 2.6 days a week.
Consumption patterns are driven largely by prices, as well as the composition of subsidized rations and poor nutritional awareness.
About 41.3% of the vulnerable HHs have complained about the availability of subsidized baladi bread through Q3 of 2013.
Given high and rising food prices that have placed certain items beyond the vulnerable’s purchasing power, more than one third of the surveyed HHs (34.9%) ceased to consume beef in the last five months on average.
One fifth of the surveyed HHs (18.3%) ceased to consume milk in the last 4.0 months on average.
2. 4
Consumption Rate (days/ week) for Aggregate Commodities
(No. days/ week)
(No. days/ week)
(%) (%)
5.7 0.9 0.3 0.5 0.4
Vulnerable Households’ Food Consumption
11
8.3
41.5 63.2
7.9 15.5
34.9
39.3 15.5
19.2 5.7 6.1
83.7
56.8
19.2 21.3
72.9 92.7 93.8
0
20
40
60
80
100
23.6
30.6
12.9
94.6
45.8
99.9 98.0 100 100 86.1
0
20
40
60
80
100
39.3 19.0 22.1 12.7
15.1
21.7 17.2
97.8 82.6
45.6 59.3 60.7
99.5
0
20
40
60
80
100
62.1
9.8 26.4 8.9
5.5
5.5
73.1 99.9
85.4
32.3
88.0 91.9 100
0
20
40
60
80
100
9.6 31.8
17.7 99.9
84.0 100 99.9
50.4
99.9
0
20
40
60
80
100
12.2
18.3
69.5 93.4 94.8
0
20
40
60
80
100

Egyptian Food Observatory Food Monitoring and Evaluation System
Meat, Poultry and Fish1 Legumes Vegetables & Fruits2
Figure (14) Breakdown of vulnerable households’ perception of the price of different food commodities
1 Proteins including meat, poultry, rabbits, fish and eggs. 2 Vegetables including leafy and non-leafy vegetables . 3 Butter/ghee including natural and manufactured. 4 Dairy products except for butter. Source: Assessment Survey of the Vulnerable Households, Egyptian Food Observatory, September 2013.
Expensive Adequate
Grain, Flour & Bread Oils, Ghee, Butter3 & Sugar Eggs, Cheese & Dairy Products4
(%) (%) (%)
(%)
2. 5
(%) (%)
As part of the vulnerability survey conducted, HHs were asked about their perception of food commodity prices, by classifying each commodity either as expensive, adequate or cheap.
Figure 14 shows that animal proteins were the main food group reported by the majority of HHs surveyed as beyond their purchasing power. This was followed by fruits & vegetables, legumes (except for local beans), and oil, ghee & butter (except mixed oil).
About 94% of the vulnerable HHs find the price of subsidized baladi bread to be reasonable and within their purchasing power.
Price perceptions match the consumption patterns of vulnerable HHs as detailed in section 2.4. and are largely in line with inflation trends. About half of HHs (48.8%) reported an increase in the price of vegetables, more than half reported an increase in the price of animal proteins (54.1%), almost one third in the price of diary products (40.1%) and 36.0% in the price of legumes.
Cheap
Vulnerable Households Perception of Food Prices
12
8.4 10.7 9.5
95.0 99.8 100 91.6 89.3 90.5 95.0
0
20
40
60
80
100
16.5 12.5
64.3
14.3 6.2
83.5 95.8 87.2 95.3
33.0
85.2 93.8
0
20
40
60
80
100
48.1
17.0 19.6 6.9 10.3 18.7
50.9
83.0 80.4 93.1 89.7 81.3
0
20
40
60
80
100
39.2 37.2 11.8
94.0
35.0 31.9
99.1
60.5 62.3 87.7
65.0 68.1
0
20
40
60
80
100
38.6 12.7 24.0
46.2 43.8 38.7
61.4 87.3 76.0
53.8 56.2 61.3
0
20
40
60
80
100
7.4 21.9 14.1
92.6 78.1 85.9
0
20
40
60
80
100

Egyptian Food Observatory Food Monitoring and Evaluation System
3. Special report: Cost of Hunger in Egypt1
1 IDSC, Cost of Hunger in Egypt, May 2013. 2 Hunger refers to inadequacy of food that causes some diseases such as reduced weight for age, or stunting (height for age), or wasting (weight for height). Two different types of malnutrition can be identified: protein and energy malnutrition which refers to inadequacy of protein intake, and micronutrients deficiency. 3 Fatma El-Zanaty, Egyptian Demographic and Health Survey, 2005, 2008.
Conceptual Framework of the Study 3. 1 The study highlights that Hunger/ undernutrition has
direct negative consequences on the livelihood of people as it affects their health and educational status. This is in turn affect the socio-economic status of households. (Fig 15)
Children exposed to undernutrition in the early life
stages (undernourished mothers)
Increased morbidity
Higher repetition potential
Higher drop-out
probability
Labor force Reduction
Figure (15) The effects of hunger/ undernutrition
Source: IDSC, Cost of Hunger in Egypt, May 2013.
Stunting of undernourished
individuals
Increased mortality
Reduced productivity
Deterioration of cognitive and
physical ability
Reduced productivity
Reduced income potential
Lower educational attainment
Productivity cost of Undernutrition
Health cost of Undernutrition
Education cost of Undernutrition
13
The Cost of Hunger in Egypt1 3. 2
Overall results in Egypt show that an estimated 20.3 billion Egyptian pounds (US$3.7 billion) was lost in 2009 as a result of child undernutrition.
Child mortality associated with undernutrition has reduced Egypt’s workforce by 1%. The average schooling achievement for a person who was stunted as a child is 0.2 years lower than for a person who was never undernourished. This disadvantage in the labor market is estimated to have generated private costs of 2.7 billion EGP in potential productivity for a single year.
Child undernutrition was estimated to generate health costs equivalent 1.1 billion EGP (US$213 million) due to episodes directly associated with the incremental quantity and intensity of illnesses that affect underweight children. According to the data estimated, only 1 out of every 5 of these episodes received proper health attention.
Undernutrition was associated with 11% of all child mortalities, which represents over 6 thousand child deaths in 2009 and over 28 thousand period from 2004 to 2009.
Despite the significant improvement in indicators of nutritional status of children achieved in Egypt during 1995 – 2005 1, there is an obvious decline in these indicators during 2005 – 2008, stunting became more prevalent among children under 5, where the percentage increased from 17.6% to 28.9%3. Child stunting during the first five years of age is related to low birth weight1, which remained almost constant (11.1% in 2008, compared to 11.8% in 2005). Wasting also became more prevalent among under 5 years children (7.2% in 2008, compared to 3.9% in 2005)3.
dropouts, and reduced physical productivity that can be directly associated with those suffering undernutrition before the age of five and the associated economic losses incurred by the economy in terms of health, education, and potential productivity in a single year.
The Cost of Hunger in Africa (COHA) was undertaken in Egypt by the Cabinet’s Information and Decision Support Center (IDSC) in collaboration with WFP, the African Union Commission and the United Nations Economic Commission for Africa (UNECA). Data vital to the development of the study was provided by the Central Agency for Public Mobilization and Statistics (CAPMAS), the Ministry of Health, and the Ministry of Education in Egypt.
This study highlights the significant economic losses a country could incur due to child undernutrition. It estimates the additional cases of illness, death, school

Egyptian Food Observatory Food Monitoring and Evaluation System
14
Stunted children have a higher grade repetition rate, at 7.4% than non-stunted children, at 5.4%. This incremental rate generated 79 thousand additional cases of grade repetition in 2009, in which the education system and families incurred a cost of 271 million EGP.
Moreover, those children in Egypt are also more likely to drop out of school or repeat grades. Based on information from the 2009 CAPMAS Labor survey, the model estimated that the average schooling achievement for a person who was stunted as a child is 0.2 years lower than for a person who was never undernourished.
40% of adults in Egypt are stunted. This represented more than 20 million people of working age that are not able to achieve their potential, as a consequence of child undernutrition.
An estimated 857 million working hours were lost in 2009 due to people who were absent from the workforce as a result of nutrition-related mortalities. This represents 5.4 billion EGP which is equivalent to 0.5% of the country’s GDP.
Cost of Hunger in Egypt (cont’) 3. 2
20.3 billion Cost of Hunger in Egypt
Figure (16) Summary of Cost of Hunger in Egypt in 2009
Source: IDSC, Cost of Hunger in Egypt, May 2013.
2 18827 million
2 1170 million
2 271
million
Recommendations and proposed interventions to fight hunger 3. 3
Draft a social, economic and health national plan by ensuring full participation of concerned ministries and stakeholders.
Revise the agriculture policies to ensure a focus on producing varieties of food commodities that is consumed by children (Ministry of Agriculture).
Revamp the national school feeding program, and implement periodic checkup programs for school students where students’ health can be generally evaluated, as well as apply early diagnosis of Anemia cases (Ministry of Education).
Provide targeted ration cards for pregnant women and children. This should be accompanied by a revision of the current composition of subsidized ration cards commodities to ensure the nutrient food commodities (Ministry of Supply and Internal Trade).
Target girls’ schools with proper nutrition and health awareness campaign.
Enhance the government monitoring and evaluation system by shortening the period for child nutrition evaluation to two years instead of currently 3 – 5 years (all entities within the government nutrition system).
Benefit from third countries experiences that have successfully tackled malnutrition namely Scaling Up of Nutrition Initiative.
Leverage the resources of the private sector who are eager to actively participate to reducing under nutrition.
To access the full report kindly visit http://www.wfp.org/content/egypt-cost-hunger-implications-child-
undernutrition-social-economic-development-june-2013
Egyptian Food Observatory Food Monitoring and Evaluation System
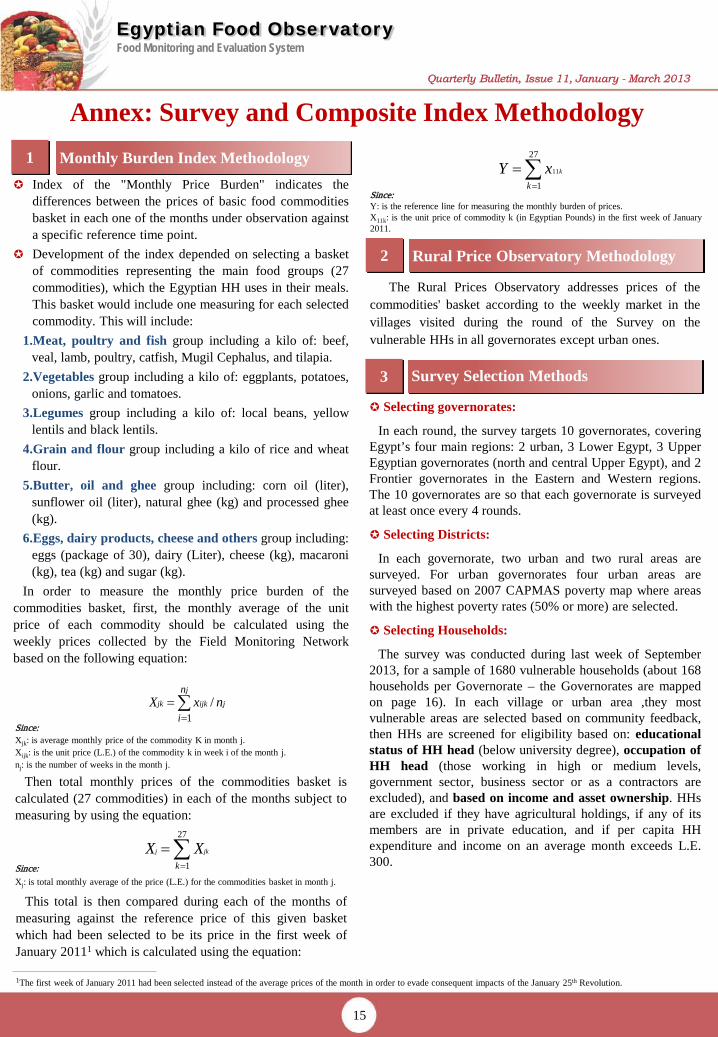
Selecting governorates:
In each round, the survey targets 10 governorates, covering Egypt’s four main regions: 2 urban, 3 Lower Egypt, 3 Upper Egyptian governorates (north and central Upper Egypt), and 2 Frontier governorates in the Eastern and Western regions. The 10 governorates are so that each governorate is surveyed at least once every 4 rounds.
Selecting Districts:
In each governorate, two urban and two rural areas are surveyed. For urban governorates four urban areas are surveyed based on 2007 CAPMAS poverty map where areas with the highest poverty rates (50% or more) are selected.
Selecting Households:
The survey was conducted during last week of September 2013, for a sample of 1680 vulnerable households (about 168 households per Governorate – the Governorates are mapped on page 16). In each village or urban area ,they most vulnerable areas are selected based on community feedback, then HHs are screened for eligibility based on: educational status of HH head (below university degree), occupation of HH head (those working in high or medium levels, government sector, business sector or as a contractors are excluded), and based on income and asset ownership. HHs are excluded if they have agricultural holdings, if any of its members are in private education, and if per capita HH expenditure and income on an average month exceeds L.E. 300.
The Rural Prices Observatory addresses prices of the commodities' basket according to the weekly market in the villages visited during the round of the Survey on the vulnerable HHs in all governorates except urban ones.
Annex: Survey and Composite Index Methodology
j
j
ijkjk nxXn
i/
1∑=
=
Since: Xjk: is average monthly price of the commodity K in month j. Xijk: is the unit price (L.E.) of the commodity k in week i of the month j. nj: is the number of weeks in the month j.
Then total monthly prices of the commodities basket is calculated (27 commodities) in each of the months subject to measuring by using the equation:
∑=
=27
1kjkj XX
∑=
=27
111
kkxY
Since: Y: is the reference line for measuring the monthly burden of prices. X11k: is the unit price of commodity k (in Egyptian Pounds) in the first week of January 2011.
1The first week of January 2011 had been selected instead of the average prices of the month in order to evade consequent impacts of the January 25th Revolution.
Index of the "Monthly Price Burden" indicates the differences between the prices of basic food commodities basket in each one of the months under observation against a specific reference time point.
Development of the index depended on selecting a basket of commodities representing the main food groups (27 commodities), which the Egyptian HH uses in their meals. This basket would include one measuring for each selected commodity. This will include:
1.Meat, poultry and fish group including a kilo of: beef, veal, lamb, poultry, catfish, Mugil Cephalus, and tilapia.
2.Vegetables group including a kilo of: eggplants, potatoes, onions, garlic and tomatoes.
3.Legumes group including a kilo of: local beans, yellow lentils and black lentils.
4.Grain and flour group including a kilo of rice and wheat flour.
5.Butter, oil and ghee group including: corn oil (liter), sunflower oil (liter), natural ghee (kg) and processed ghee (kg).
6.Eggs, dairy products, cheese and others group including: eggs (package of 30), dairy (Liter), cheese (kg), macaroni (kg), tea (kg) and sugar (kg).
In order to measure the monthly price burden of the commodities basket, first, the monthly average of the unit price of each commodity should be calculated using the weekly prices collected by the Field Monitoring Network based on the following equation:
3 Survey Selection Methods
2 Rural Price Observatory Methodology
1 Monthly Burden Index Methodology
Since: Xj: is total monthly average of the price (L.E.) for the commodities basket in month j.
This total is then compared during each of the months of measuring against the reference price of this given basket which had been selected to be its price in the first week of January 20111 which is calculated using the equation:
15
Egyptian Food Observatory Food Monitoring and Evaluation System
For online editions see: http://www.eip.gov.eg/ and http://www.wfp.org/content/egypt-food-observatory-2013
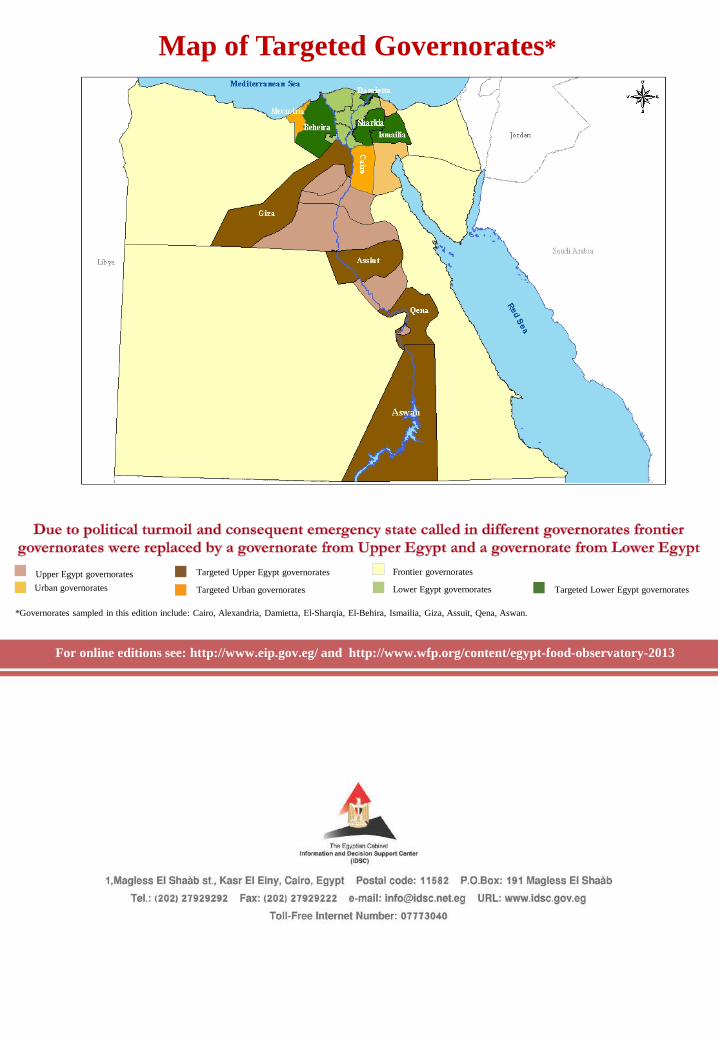
Map of Targeted Governorates*
Lower Egypt governorates Urban governorates Targeted Lower Egypt governorates
Targeted Upper Egypt governorates
Targeted Urban governorates
Upper Egypt governorates
*Governorates sampled in this edition include: Cairo, Alexandria, Damietta, El-Sharqia, El-Behira, Ismailia, Giza, Assuit, Qena, Aswan.
Frontier governorates