eia-914 monthly gas production report methodology
TRANSCRIPT

EIA-914 Monthly Gas Production Report Methodology
Current as of April 20101
Much of the methodology described below was implemented in April 2010, and it was applied historically to all of 2009 as well as to the current months. Fundamentally, there are two parts to the process: the sampling and the estimation. Both represent changes to previous methodologies, and each is described separately below.
Sampling Methodology The EIA-914 survey collects natural gas production volume information on a monthly basis from a sample of well operators (companies). Production volumes are requested specifically for Texas, Louisiana, Oklahoma, Wyoming, New Mexico, Federal Offshore Gulf of Mexico and all Other States (except Alaska). Sampling occurs every month via a monthly refresh of the sample. The latest available DrillingInfo (DI) monthly data are used to select companies to add to the sample group (DI is a commercial vendor of production data). The sample group of companies changes by 1 or 2 every month. This keeps the sample current and avoids a major change in the sample caused by less frequent updating. A cutoff sample based on company production rates is used. Data Preparation The DI database is used for both the sampling and the estimation processes. DI acquires well or lease level data from State agencies, places it in their own database format, and sells it. A new DI database is acquired every month. DI data for five of the smaller producing States is missing or inadequate. For Illinois, Indiana, Kentucky, Pennsylvania, and Tennessee, annual production data from the EIA-23 survey (Annual Survey of Domestic Oil and Gas Reserves) are used to supplement the DI database. Hereafter, references to DI data include supplemental data from the EIA-23 survey for these 5 States. The monthly production data are split into two parts: the group of companies that comprise last month’s sample and the group of non-sampled companies. The non-sampled group is sorted largest to smallest based on production from the Lower 48 States. A second sorting for Oklahoma only is also done (more on this below). DI data for the most recent months are usually significantly incomplete. A 6-month average natural gas production level is calculated by company for the most current 6-month period where data are or are nearly complete. The non-sampled companies are sorted by this 6-month average.
1Updates were made in 2013 to reflect the discontinuation of Form EIA-895 and the change in sources from HPDI to DrillingInfo (DI).

Cutoff Sample The sampling process uses a cutoff criterion of 20 MMcf/d by company for Lower 48 production. For the State of Oklahoma a cutoff of 10 MMcf/d is used to increase the coverage in Oklahoma (Oklahoma has an abundance of small companies, so a lower cut off helps keep the percent coverage up in Oklahoma). Adding and Dropping Companies Each month, companies whose surveyed production rate falls below the sample cutoff point are reviewed to determine whether they should remain in the sample. If a company is below the cutoff (20 MMcf/d in the Lower 48 or 10 MMcf/d in Oklahoma) for 6 consecutive months it is contacted and asked why. If the decline in production is not reversible or repairable in the near future, the company is dropped from the survey. When adding a company, the sorted non-sampled data are used. The highest production level in the non-sampled group of companies is about 20 MMcf/d. Data for the largest companies in the non-sampled group can be reviewed quickly and any company in the non-sampled group that produces more than 20 MMcf/d for 4 consecutive months (previous to the last few months of incomplete data) is a candidate to be added to the sample. Production is double checked and confirmed for these identified companies. Once identified, a selected company is informed with a phone call, and a survey information packet is sent. The same process is applied to Oklahoma production data with a 10 MMcf/d cutoff. Other Ways Companies are Added or Dropped Mergers and acquisitions, or buying and selling properties can cause a company’s production level to move above or below the sample cutoff value. An attempt is made to accommodate the larger events in the sample as soon as possible after they occur. These larger events usually appear in news reports, newsletters, press releases, industry trade journals, etc. Minor events involving small companies or small volumes of production are ignored if they involve only companies in the non-sampled group. Most smaller mergers and property sales are unknown. Potential Sources of Errors Unknown, deficient reporting of, or improperly handled mergers and property sales are likely the largest cause of sample errors. These events are continuous and make the sample calibration data (DI data) a very dynamic data set. The company production in the historical DI data set must be merged to match the reported sample data every month. The unknown or missed events are usually small and probably do not contribute large errors, but it is still possible to miss a larger event. The historical sample data used to make estimates can be missing production or have too much production and therefore adversely affect the production estimates because of name changes, multiple name spellings, companies that report under multiple names in the DI data set, the lag between the time of a merger and the time of its appearance in the DI data set, past multiple
mergers, and the potential to improperly assign EIA operator codes. It is extremely difficult to account for all of the mergers and property sales.
Estimation Methodology The Simple Ratio Method (SR) is used for all the individual States in the Monthly Gross Natural Gas Production Report. The SR method allows the use of the most current historical data available to determine a straightforward ratio. The short lag times mean that any changes in the sample over the shorter lag will be as small as possible and can normally be neglected. For the Other States, the ratio of state reported data to the EIA-914 survey reported data annual volumes in the previous calendar year is applied to the current monthly EIA-914 volumes to calculate the estimate. This is the same process used previously for the Other States group (state production data is collected directly from the states, the EIA-895 survey is no longer used to collect the state production data). Simple Ratio Method The SR method uses a ratio of the total production to the current sample’s production at some point in history. This ratio is then applied to the current reported sample volume to estimate the current total production volume. The ratio is a 6-month average ratio calculated at some lag time that varies by State. The time frame for the 6-month average ratio calculation is moved ahead one month every month so that the lag time is a constant over time. Lag times vary from 6 to 18 months for the different States. Lags are necessary because the DI data are incomplete in current months. Some States require a longer lag than others to get back to a time when the data are complete to calculate the 6-month average ratio. Currently a 6-month lag is used for Wyoming, New Mexico, and Louisiana, 172
months for Texas, 12 months for the Federal Gulf of Mexico, and 18 months for Oklahoma. At these lag times the reported production in DI should be less than 0.5% different than the final reported production. Recent changes in DI’s data collection in Oklahoma may allow a shorter lag time in the future. The equations are as follows:
∑=
−−
−
− 6
5
i
iLi
LiLi
SPTP
SRAvg
Liii SRAvgSTPest −∗=
where: 2Beginning with the December 2013 monthly report and thereafter, the Texas lag was changed from 9 months to 17 months after a review of the historical data indicated the lag had changed.

Avg SR = Simple Ratio, 6-month average TP = Total Production, from DI SP = Sample Production, current sampled group of companies historical
production, from DI L = Lag time in months TPesti = Total Production estimate for the current month Si = Sampled production for the current month i = Current or estimation month. Potential Sources of Errors This method is a significant improvement over previous methods in making use of information that is as current as possible. Even so, the historical data still have some lag and so some potential for error remains. For example, the rapid development of the Haynesville shale in Louisiana caused a change in the State production trend that, in turn, may cause the simple ratio method to over estimate. Also, a sample affected by improperly handled mergers or property sales, as described above, can adversely affect the production estimates. EIA continues to look for better ways to handle the mergers and property sales.
Supporting Documents A brief comparison with the previous method is contained in Attachment 1. A full description of the previous methodology used prior to April 2010 can be found in Attachment 2. The Review Results contains additional information on the comprehensive EIA-914 survey methodology review and the alternative approaches tested. A separate document describes the 2009 Revisions resulting from the change to the new methodology. And finally, ICF International
explains the results of their independent review in a paper given to the American Statistical Association Committee on Energy Statistics.

Attachment 1
Brief Comparison with the Previous Methodology The fundamental change in the new process concerns timing; both the currency of the historical data used and the frequency of updating are improved in the new methodology for both the sampling and estimation processes. The previous estimation methodology had 2 main deficiencies also related to timing:
• It depended on historical data that were too far in the past to adequately represent the current situation. Because the previous methods were anchored to data far in the past, they performed poorly when the industry changed rapidly.
• Annual updating in January could cause a disconnect between December and January. Sometimes the reported change in the production estimate from December to January was caused by the change in the process rather than an actual change in the data.
The Simple Ratio method and the monthly refreshing of the sample addressed these 2 deficiencies. Where the previous estimation method depended on data that were 2 to 7 years old, the new SR method now uses historical data that are only 6 to 18 months old and is updated monthly instead of annually. The monthly refreshing of the sample with monthly data that are as current as possible is an improvement over annual updating with data that are 2 years old. Rather than a change in the sample of 25 operators in January (roughly 10 percent), monthly updating yields a change of 1 or 2 operators each month and keeps the sample up to date. A full description of the previous methodology follows in Attachment 2.
Attachment 2
Methodology Used Prior to April 2010 Form EIA-914
Monthly Natural Gas Production Report
Background and Methodology September 2005
Contents Background
Introduction, Purpose of Survey, Description of Survey, Sampling Frame, Form and Instructions, Response Rates
Methodology Gross Production Estimation for the Six Areas, Gross Production Estimation for “Other States,” Imputation, Editing and Data Review, Revision Policy, Analysis Plan
Background
Starting with the January 2005 report month, EIA began collecting monthly natural gas production information from well operators using a new survey, Form EIA-914, “Monthly Natural Gas Production Report.” This report describes the background, purpose, technical methodology and initial results of the survey. Although data from this survey are being collected and posted on the EIA Website, the new data series has not replaced natural gas production data series currently being published by EIA (in the
Introduction
Natural Gas Monthly, the Natural Gas Navigator, the Monthly Energy Review and other EIA publications). When monthly natural gas production volumes based on the EIA-914 data are considered reliable, they will replace the current data series and become the official EIA natural gas monthly production data series. This is expected to occur by the end of the 2005 report year (March 2006). Currently EIA publishes estimates of natural gas production based on data supplied by or collected from individual State agencies and the Minerals Management Service. Because these production estimates were not considered sufficiently timely or accurate to meet customer needs (to understand and resolve natural gas supply issues) EIA obtained approval from the Office of Management and Budget (OMB) to implement the new survey, EIA-914, “Monthly Natural Gas Production Report,” which collects production data directly from well operators.
The purpose of the EIA-914 survey is to collect more reliable and timely monthly natural gas production information for the Lower 48 States and six States or regions (Texas, Oklahoma, Louisiana, Wyoming, New Mexico and the Federal Offshore Gulf of
Purpose of Survey
Mexico). The goal is to provide accurate information not more than 60 days after the close of a report month. Current EIA monthly natural gas production estimates generally aren’t available until about 120 days after the close of a report month, and even these estimates do not always accurately depict the levels of production or directions of month-to-month changes. These estimates are generated using a variety of different data sources and procedures, which are described in How EIA Estimates Natural Gas Production.
The EIA-914 survey collects natural gas production volume information on a monthly basis from a sample of well operators. Production volumes are requested specifically for Texas, Louisiana, Oklahoma, Wyoming, New Mexico, Federal Offshore Gulf of Mexico and all Other States (except Alaska). Two volumes are requested from respondents:
Description of Survey
(1) “gross withdrawals (wet),” which is full-bore well stream gas minus lease condensate, oil, and water; and
(2) “natural gas lease production,” (sometimes referred to as “sales production” or “gas available for sales,”) which indicates the net amount of produced gas that leaves the lease to go to natural gas processing plants or directly to end-users.3
The two volumes reported on the EIA-914 are illustrated in the diagram in Figure 1.
3 Natural gas lease production does not include gas used as fuel on the lease, but the quantity “marketed production” currently being published by EIA does.
Gross Withdrawals (Wet)
Natural Gas Lease Production
Figure 1. Natural Gas Production Stream
1
Lease Separators
Full Wellstreams
2
Lease Facilities Excluding Natural Gas
Plants
Wells (Gas, Oil, Coalbed
Methane)
Crude Oil
Lease Condensate
Repressuring and Reinjection
Vented and Flared
Fuel Used on Lease
Nonhydrocarbons Removed on Lease
Water
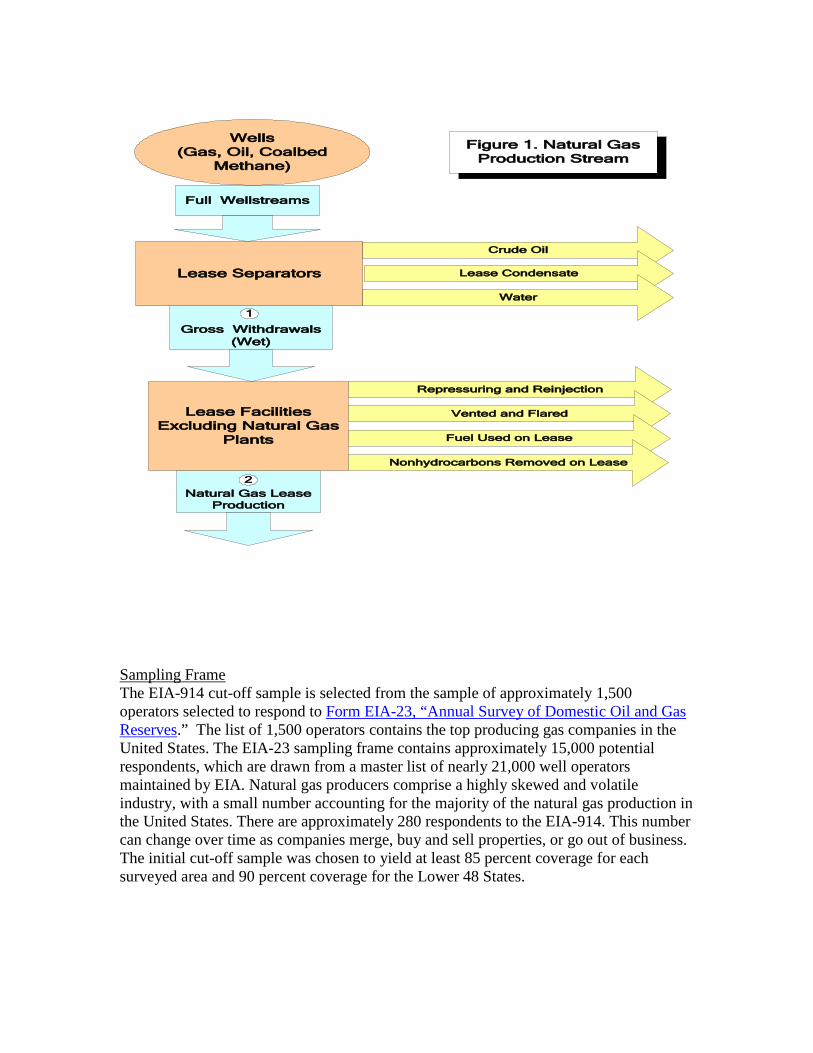
The EIA-914 cut-off sample is selected from the sample of approximately 1,500 operators selected to respond to
Sampling Frame
Form EIA-23, “Annual Survey of Domestic Oil and Gas Reserves.” The list of 1,500 operators contains the top producing gas companies in the United States. The EIA-23 sampling frame contains approximately 15,000 potential respondents, which are drawn from a master list of nearly 21,000 well operators maintained by EIA. Natural gas producers comprise a highly skewed and volatile industry, with a small number accounting for the majority of the natural gas production in the United States. There are approximately 280 respondents to the EIA-914. This number can change over time as companies merge, buy and sell properties, or go out of business. The initial cut-off sample was chosen to yield at least 85 percent coverage for each surveyed area and 90 percent coverage for the Lower 48 States.
The Form and Instructions
EIA-914 survey form is one page with three pages of instructions. It is similar in format to other Oil and Gas surveys. The form was designed based on direct input from potential respondents during pre-survey design visits and the quality and usability of the survey instrument were tested during cognitive testing visits conducted by survey methodologists in EIA’s Statistics and Methods Group. Based on results from these tests, the form includes some imbedded instructions, intended to help respondents complete the form without the need to refer to instructions located elsewhere. The form and instructions are e-mailed to respondents (formats include PDF and XLS) and they are also available on EIA’s Website. The respondents can return forms by fax, e-mail, secure file transfer or conventional mail. For the months of January through March of 2005, respondents were expected to report within 60 days after the close of the reporting month. Beginning with the April 2005 report month, respondents are expected to provide EIA with their data 40 days after the close of the report month. Respondents are encouraged to provide reasonable estimates if necessary to meet the deadline and to report zeros when there is no production to report. This reduction in turnaround time is necessary to produce more timely estimates of natural gas production for EIA customers.
Response rates for the EIA-914 survey have been excellent. The production weighted response rate for each month’s estimate (January through June 2005) is 100% for all areas except Oklahoma, which has been 99.8% every month since January. This has resulted in a response rate of 99.9% for the Lower 48 States each month. Figure 2 shows the response rates for March, April, and May. March was the last month the respondents were given 60 days to respond. At the 60 day due date for March data, the production weighted response rate was 56.9 percent. However, just three days later the response rate rose to 98.5 percent. April was the first month respondents were given 40 days to respond, and the production weighted response rate was 15.9 percent at the 40 day due date for April data. However, the response rate for May data at the 40 day due date was 85.8 percent, and high response rates have been the rule ever since.
Response Rates
EIA has encouraged respondents to submit their best estimates in order to meet due dates, believing that a respondent’s estimate of their production level is more reliable than EIA’s imputed value for their production level. Respondents are required to submit data revisions if the revised data and the data originally provided differ by more than four percent. However, revisions are encouraged for differences less than four percent.
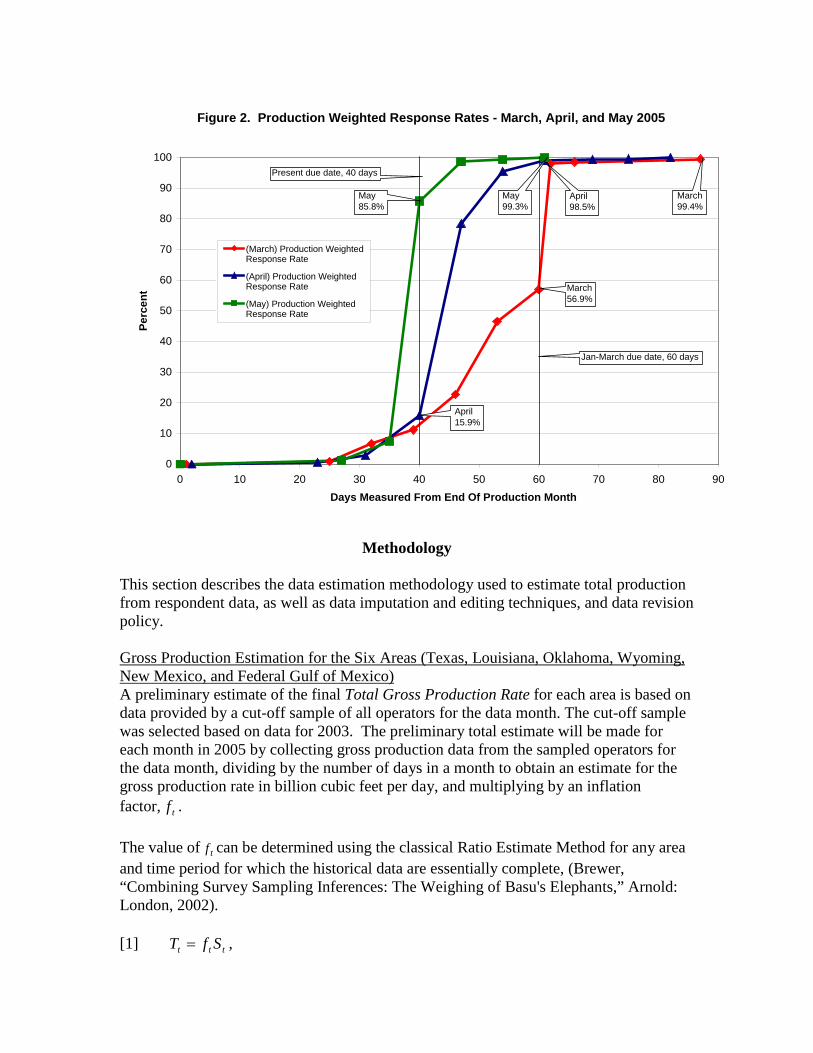
Figure 2. Production Weighted Response Rates - March, April, and May 2005
0
10
20
30
40
50
60
70
80
90
100
0 10 20 30 40 50 60 70 80 90Days Measured From End Of Production Month
Perc
ent
(March) Production WeightedResponse Rate
(April) Production WeightedResponse Rate
(May) Production WeightedResponse Rate
April 15.9%
Present due date, 40 days
Jan-March due date, 60 days
March 99.4%
April 98.5%
May 99.3%
May 85.8%
March56.9%
Methodology This section describes the data estimation methodology used to estimate total production from respondent data, as well as data imputation and editing techniques, and data revision policy.
A preliminary estimate of the final Total Gross Production Rate for each area is based on data provided by a cut-off sample of all operators for the data month. The cut-off sample was selected based on data for 2003. The preliminary total estimate will be made for each month in 2005 by collecting gross production data from the sampled operators for the data month, dividing by the number of days in a month to obtain an estimate for the gross production rate in billion cubic feet per day, and multiplying by an inflation factor,
Gross Production Estimation for the Six Areas (Texas, Louisiana, Oklahoma, Wyoming, New Mexico, and Federal Gulf of Mexico)
tf . The value of tf can be determined using the classical Ratio Estimate Method for any area and time period for which the historical data are essentially complete, (Brewer, “Combining Survey Sampling Inferences: The Weighing of Basu's Elephants,” Arnold: London, 2002). [1] ttt SfT = ,
where,
tT = Total Gross Production Rate (bcf/day) in data month at time t (middle of a month in 2005),
tS = Gross Production Rate (bcf/day) reported by sampled operators in data month at time t (middle of a month in 2005), and
tf = Inflation Factor used to estimate Total Gross Natural Gas Production Rate at time t . From [1], the inflation factor is
[2] t
tt S
Tf =
The ratio estimator, typically used for estimation with a cut-off sample, assumes that the sample coverage remains constant over time.
[3] txxtxx
xxt
R SfSST
T =
=ˆ ,
where
tRT̂ = Standard Ratio Estimator for Total Gross Natural Gas Production Rate (bcf/day)
at time t xxT = Total Gross Production Rate (bcf/day) in calibration year xx
xxS = Aggregate Gross Production Rate (bcf/day) reported by sampled operators during calibration year xx . The sample is selected to achieve a specified coverage rate during year xx .
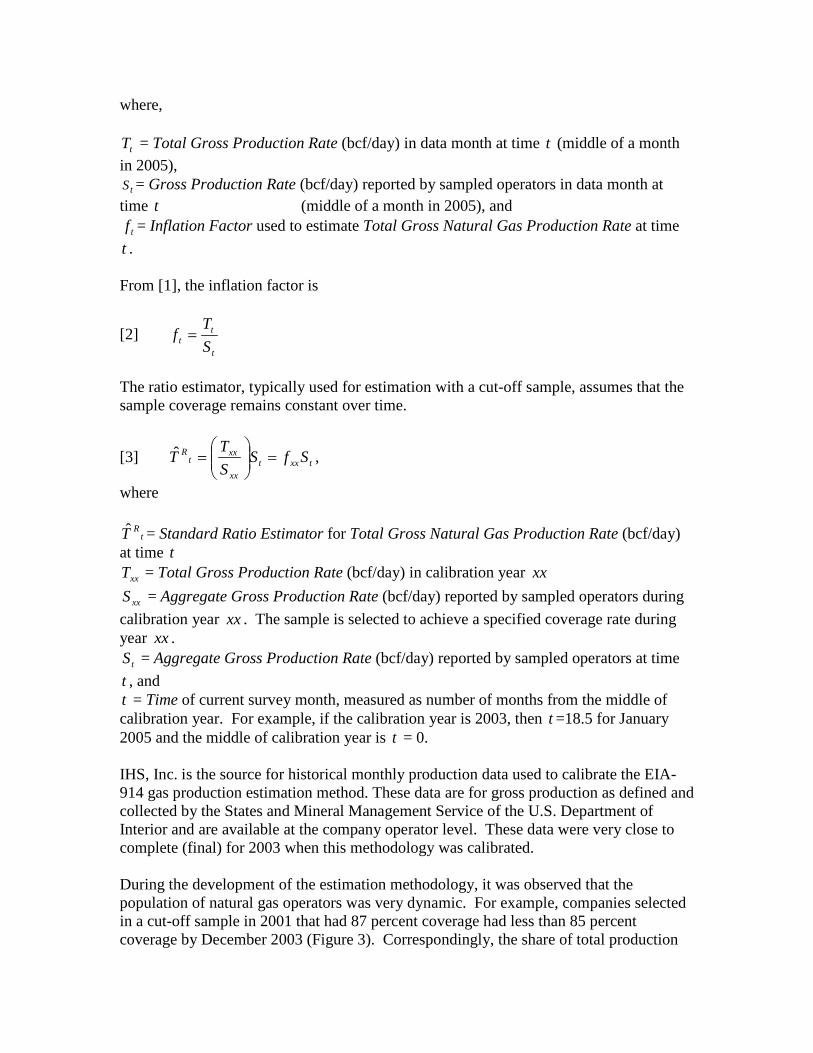
tS = Aggregate Gross Production Rate (bcf/day) reported by sampled operators at time t , and t = Time of current survey month, measured as number of months from the middle of calibration year. For example, if the calibration year is 2003, then t =18.5 for January 2005 and the middle of calibration year is t = 0. IHS, Inc. is the source for historical monthly production data used to calibrate the EIA-914 gas production estimation method. These data are for gross production as defined and collected by the States and Mineral Management Service of the U.S. Department of Interior and are available at the company operator level. These data were very close to complete (final) for 2003 when this methodology was calibrated. During the development of the estimation methodology, it was observed that the population of natural gas operators was very dynamic. For example, companies selected in a cut-off sample in 2001 that had 87 percent coverage had less than 85 percent coverage by December 2003 (Figure 3). Correspondingly, the share of total production
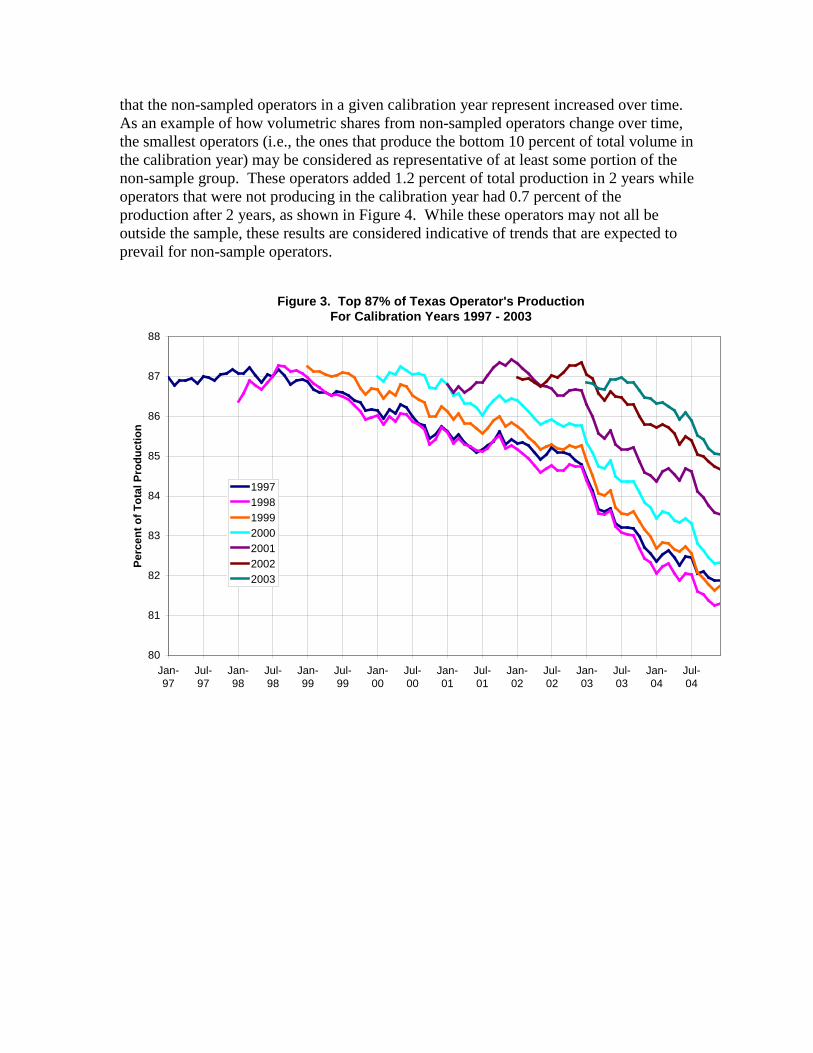
that the non-sampled operators in a given calibration year represent increased over time. As an example of how volumetric shares from non-sampled operators change over time, the smallest operators (i.e., the ones that produce the bottom 10 percent of total volume in the calibration year) may be considered as representative of at least some portion of the non-sample group. These operators added 1.2 percent of total production in 2 years while operators that were not producing in the calibration year had 0.7 percent of the production after 2 years, as shown in Figure 4. While these operators may not all be outside the sample, these results are considered indicative of trends that are expected to prevail for non-sample operators.
Figure 3. Top 87% of Texas Operator's ProductionFor Calibration Years 1997 - 2003
80
81
82
83
84
85
86
87
88
Jan-97
Jul-97
Jan-98
Jul-98
Jan-99
Jul-99
Jan-00
Jul-00
Jan-01
Jul-01
Jan-02
Jul-02
Jan-03
Jul-03
Jan-04
Jul-04
Perc
ent o
f Tot
al P
rodu
ctio
n
1997199819992000200120022003
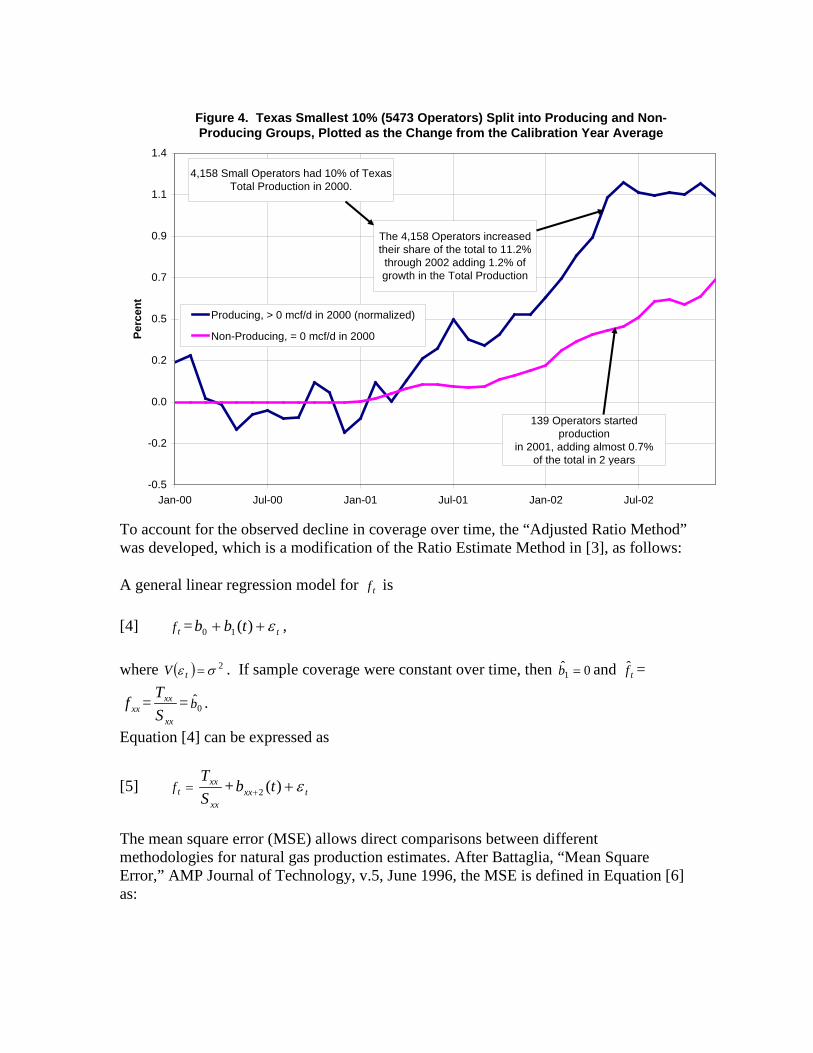
Figure 4. Texas Smallest 10% (5473 Operators) Split into Producing and Non-Producing Groups, Plotted as the Change from the Calibration Year Average
-0.5
-0.2
0.0
0.2
0.5
0.7
0.9
1.1
1.4
Jan-00 Jul-00 Jan-01 Jul-01 Jan-02 Jul-02
Perc
ent
Producing, > 0 mcf/d in 2000 (normalized)
Non-Producing, = 0 mcf/d in 2000
The 4,158 Operators increasedtheir share of the total to 11.2%through 2002 adding 1.2% ofgrowth in the Total Production
139 Operators started production
in 2001, adding almost 0.7%of the total in 2 years
4,158 Small Operators had 10% of Texas Total Production in 2000.
To account for the observed decline in coverage over time, the “Adjusted Ratio Method” was developed, which is a modification of the Ratio Estimate Method in [3], as follows: A general linear regression model for tf is [4] tf = ttbb ε++ )(10 , where ( ) 2σε =tV . If sample coverage were constant over time, then 01̂ =b and tf̂ =
xxf =xx
xx
ST
= 0b̂ .
Equation [4] can be expressed as
[5] =tfxx
xx
ST
+ txx tb ε++ )(2
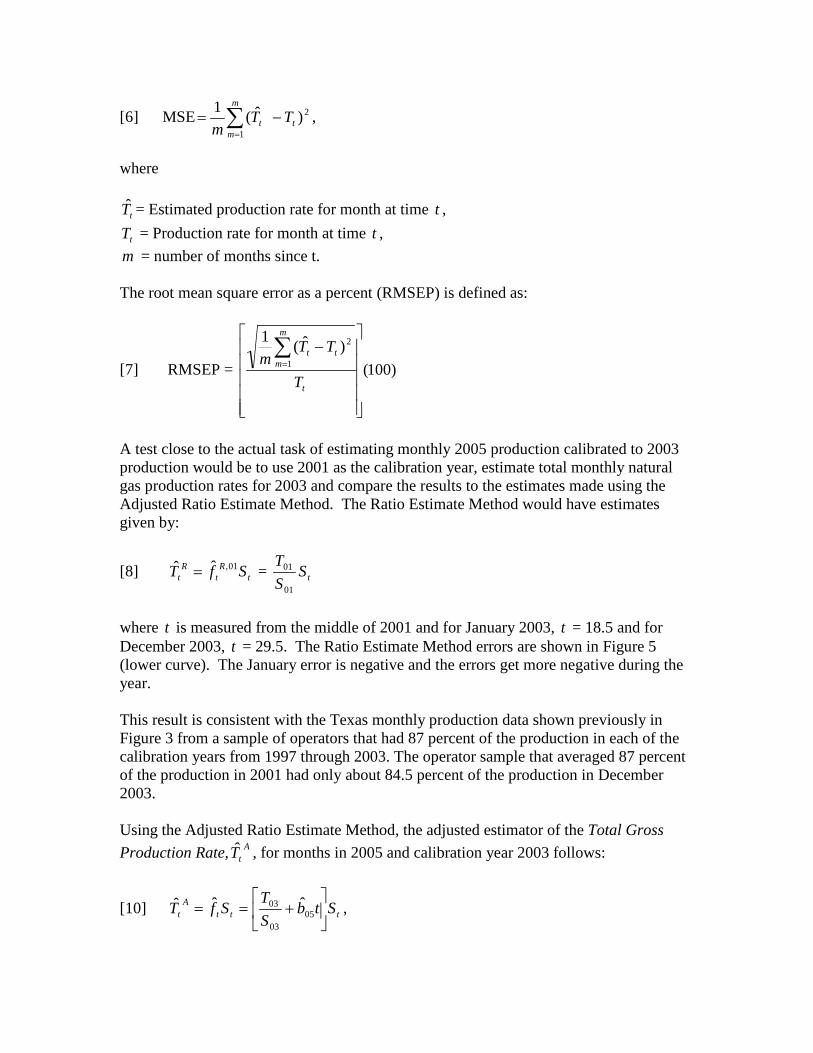
The mean square error (MSE) allows direct comparisons between different methodologies for natural gas production estimates. After Battaglia, “Mean Square Error,” AMP Journal of Technology, v.5, June 1996, the MSE is defined in Equation [6] as:
[6] MSE 2
1)ˆ(1
t
m
mt TT
m−= ∑
=
,
where
tT̂ = Estimated production rate for month at time t ,
tT = Production rate for month at time t , m = number of months since t. The root mean square error as a percent (RMSEP) is defined as:
[7] RMSEP = )100()ˆ(1 2
1
−∑
=
t
t
m
mt
T
TTm
A test close to the actual task of estimating monthly 2005 production calibrated to 2003 production would be to use 2001 as the calibration year, estimate total monthly natural gas production rates for 2003 and compare the results to the estimates made using the Adjusted Ratio Estimate Method. The Ratio Estimate Method would have estimates given by:
[8] tR
tR
t SfT 01,ˆˆ = = tSST
01
01
where t is measured from the middle of 2001 and for January 2003, t = 18.5 and for December 2003, t = 29.5. The Ratio Estimate Method errors are shown in Figure 5 (lower curve). The January error is negative and the errors get more negative during the year. This result is consistent with the Texas monthly production data shown previously in Figure 3 from a sample of operators that had 87 percent of the production in each of the calibration years from 1997 through 2003. The operator sample that averaged 87 percent of the production in 2001 had only about 84.5 percent of the production in December 2003. Using the Adjusted Ratio Estimate Method, the adjusted estimator of the Total Gross Production Rate, A
tT̂ , for months in 2005 and calibration year 2003 follows:
[10] tttA
t StbST
SfT
+== 05
03
03 ˆˆˆ ,
where
tAtT̂ = Adjusted Ratio Estimator for Total Gross Natural Gas Production Rate (bcf/day) at
time, t which accounts for declining coverage of sample.
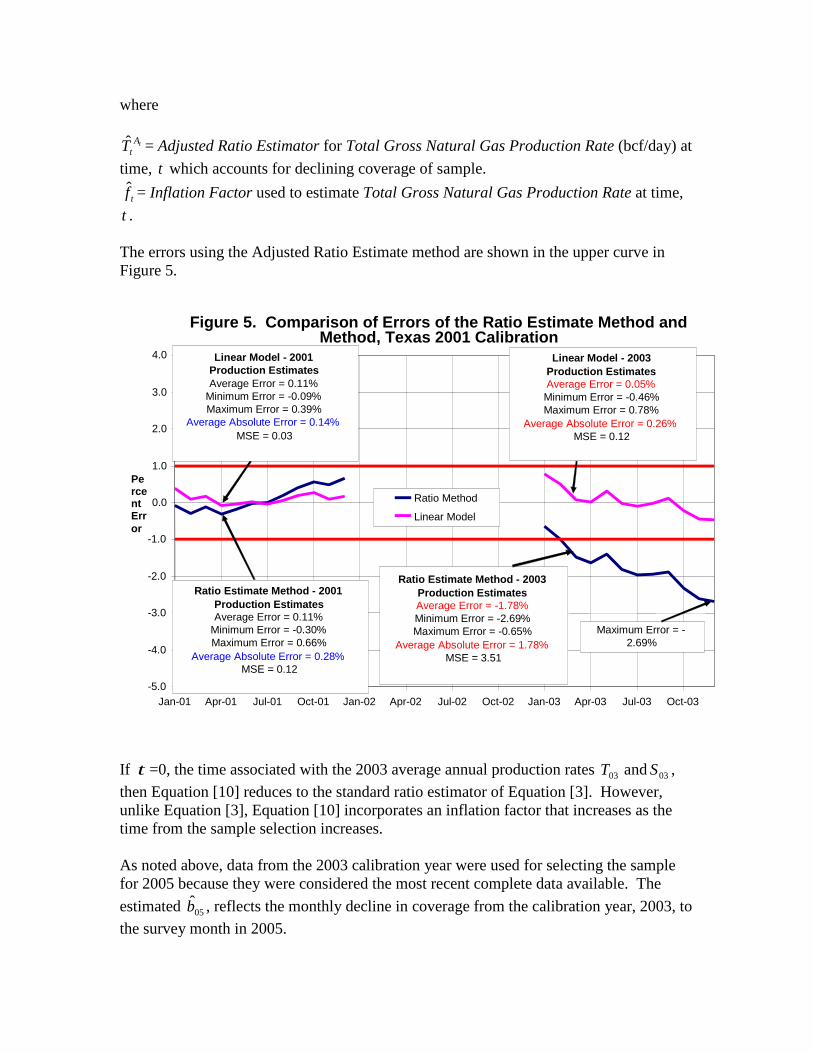
tf̂ = Inflation Factor used to estimate Total Gross Natural Gas Production Rate at time, t . The errors using the Adjusted Ratio Estimate method are shown in the upper curve in Figure 5.
Figure 5. Comparison of Errors of the Ratio Estimate Method and Method, Texas 2001 Calibration
-5.0
-4.0
-3.0
-2.0
-1.0
0.0
1.0
2.0
3.0
4.0
Jan-01 Apr-01 Jul-01 Oct-01 Jan-02 Apr-02 Jul-02 Oct-02 Jan-03 Apr-03 Jul-03 Oct-03
Percent Error
Ratio Method Linear Model
Ratio Estimate Method - 2001 Production Estimates Average Error = 0.11%
Minimum Error = -0.30% Maximum Error = 0.66%
Average Absolute Error = 0.28% MSE = 0.12
Linear Model - 2001 Production Estimates Average Error = 0.11%
Minimum Error = -0.09% Maximum Error = 0.39%
Average Absolute Error = 0.14% MSE = 0.03
Linear Model - 2003 Production Estimates Average Error = 0.05% Minimum Error = -0.46% Maximum Error = 0.78%
Average Absolute Error = 0.26% MSE = 0.12
Ratio Estimate Method - 2003 Production Estimates Average Error = -1.78% Minimum Error = -2.69% Maximum Error = -0.65%
Average Absolute Error = 1.78% MSE = 3.51
Maximum Error = - 2.69%
If t =0, the time associated with the 2003 average annual production rates 03T and 03S , then Equation [10] reduces to the standard ratio estimator of Equation [3]. However, unlike Equation [3], Equation [10] incorporates an inflation factor that increases as the time from the sample selection increases. As noted above, data from the 2003 calibration year were used for selecting the sample for 2005 because they were considered the most recent complete data available. The estimated 05b̂ , reflects the monthly decline in coverage from the calibration year, 2003, to the survey month in 2005.
The linear model of Equation [5] was used in the least squares estimating procedure with
the ratios,99
99
ST
, 00
00
ST
, and 01
01
ST
for calibration years, 1999, 2000, and 2001, and the
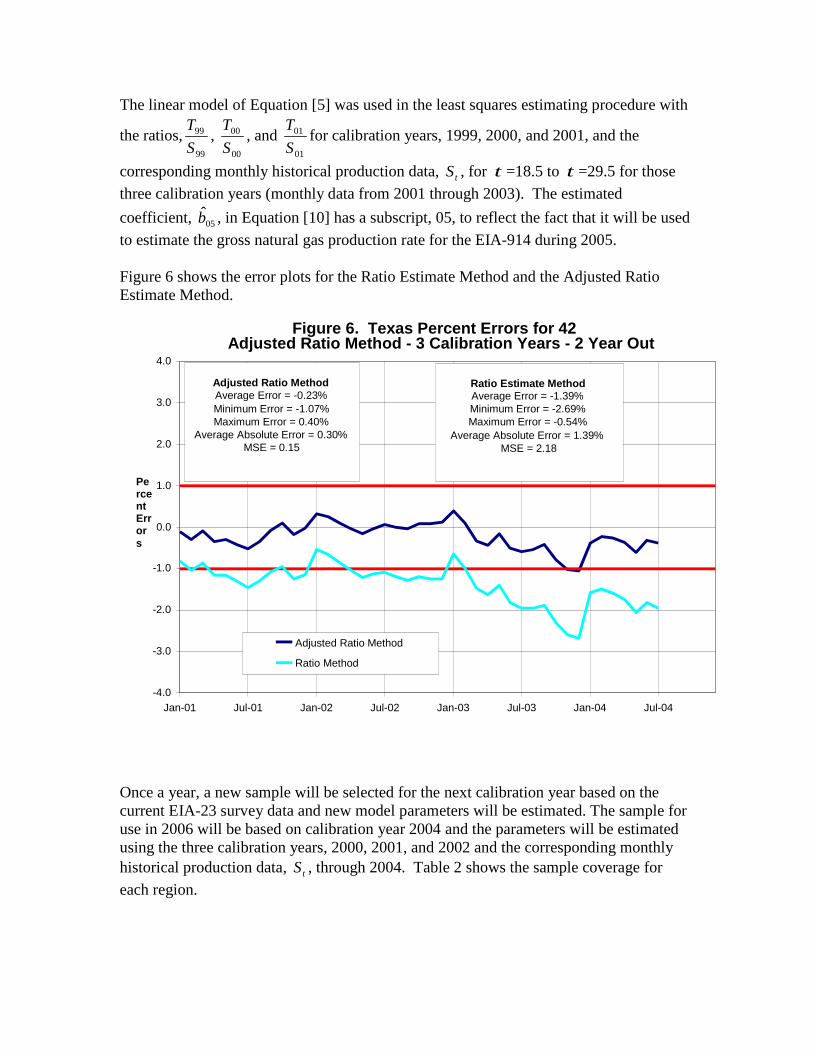
corresponding monthly historical production data, tS , for t =18.5 to t =29.5 for those three calibration years (monthly data from 2001 through 2003). The estimated coefficient, 05b̂ , in Equation [10] has a subscript, 05, to reflect the fact that it will be used to estimate the gross natural gas production rate for the EIA-914 during 2005. Figure 6 shows the error plots for the Ratio Estimate Method and the Adjusted Ratio Estimate Method.
Figure 6. Texas Percent Errors for 42 Adjusted Ratio Method - 3 Calibration Years - 2 Year Out
-4.0
-3.0
-2.0
-1.0
0.0
1.0
2.0
3.0
4.0
Jan-01 Jul-01 Jan-02 Jul-02 Jan-03 Jul-03 Jan-04 Jul-04
Percent Errors
Adjusted Ratio Method Ratio Method
Adjusted Ratio Method Average Error = -0.23% Minimum Error = -1.07% Maximum Error = 0.40%
Average Absolute Error = 0.30% MSE = 0.15
Ratio Estimate Method Average Error = -1.39% Minimum Error = -2.69% Maximum Error = -0.54%
Average Absolute Error = 1.39% MSE = 2.18
Once a year, a new sample will be selected for the next calibration year based on the current EIA-23 survey data and new model parameters will be estimated. The sample for use in 2006 will be based on calibration year 2004 and the parameters will be estimated using the three calibration years, 2000, 2001, and 2002 and the corresponding monthly historical production data, tS , through 2004. Table 2 shows the sample coverage for each region.
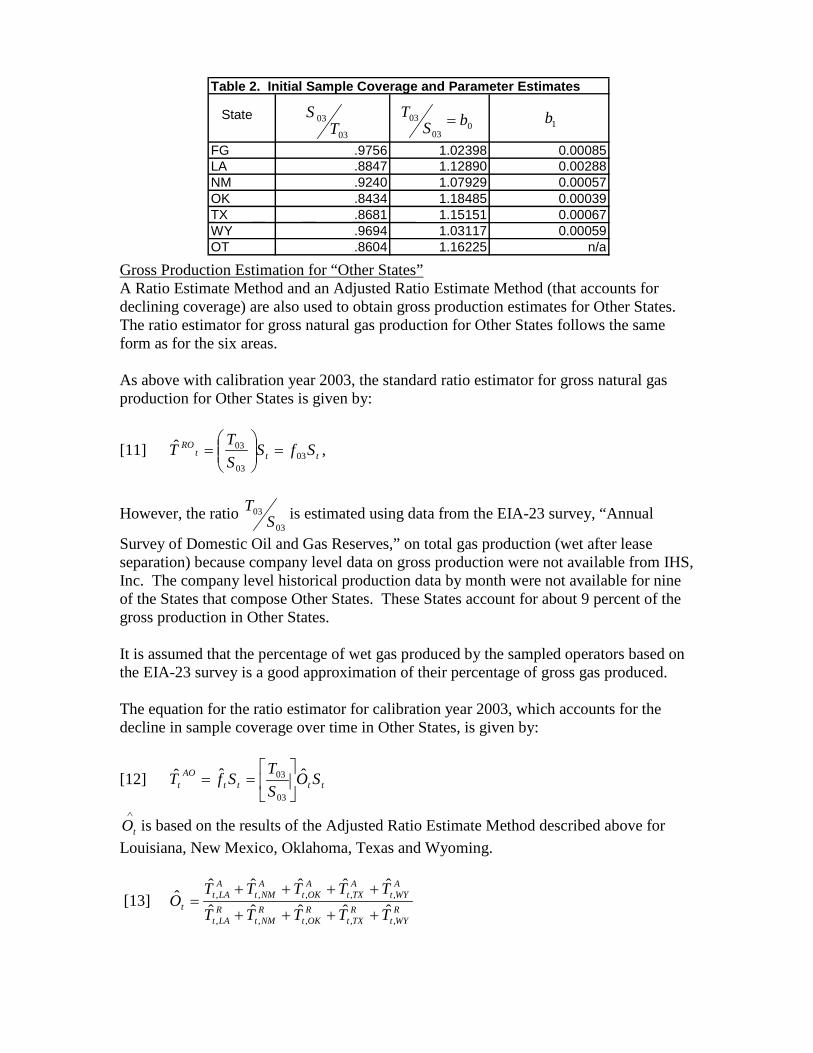
A Ratio Estimate Method and an Adjusted Ratio Estimate Method (that accounts for declining coverage) are also used to obtain gross production estimates for Other States. The ratio estimator for gross natural gas production for Other States follows the same form as for the six areas.
Gross Production Estimation for “Other States”
As above with calibration year 2003, the standard ratio estimator for gross natural gas production for Other States is given by:
[11] tttRO SfS
ST
T 0303
03ˆ =
= ,
However, the ratio 03
03S
T is estimated using data from the EIA-23 survey, “Annual
Survey of Domestic Oil and Gas Reserves,” on total gas production (wet after lease separation) because company level data on gross production were not available from IHS, Inc. The company level historical production data by month were not available for nine of the States that compose Other States. These States account for about 9 percent of the gross production in Other States. It is assumed that the percentage of wet gas produced by the sampled operators based on the EIA-23 survey is a good approximation of their percentage of gross gas produced. The equation for the ratio estimator for calibration year 2003, which accounts for the decline in sample coverage over time in Other States, is given by:
[12] ttttAO
t SOST
SfT ˆˆˆ03
03
==
∧
tO is based on the results of the Adjusted Ratio Estimate Method described above for Louisiana, New Mexico, Oklahoma, Texas and Wyoming.
[13] RWYt
RTXt
ROKt
RNMt
RLAt
AWYt
ATXt
AOKt
ANMt
ALAt
t TTTTTTTTTT
O,,,,,
,,,,,
ˆˆˆˆˆˆˆˆˆˆ
ˆ++++
++++=
Table 2. Initial Sample Coverage and Parameter Estimates
State 03
03T
S 003
03 bST = 1b
FG .9756 1.02398 0.00085 LA .8847 1.12890 0.00288 NM .9240 1.07929 0.00057 OK .8434 1.18485 0.00039 TX .8681 1.15151 0.00067 WY .9694 1.03117 0.00059 OT .8604 1.16225 n/a
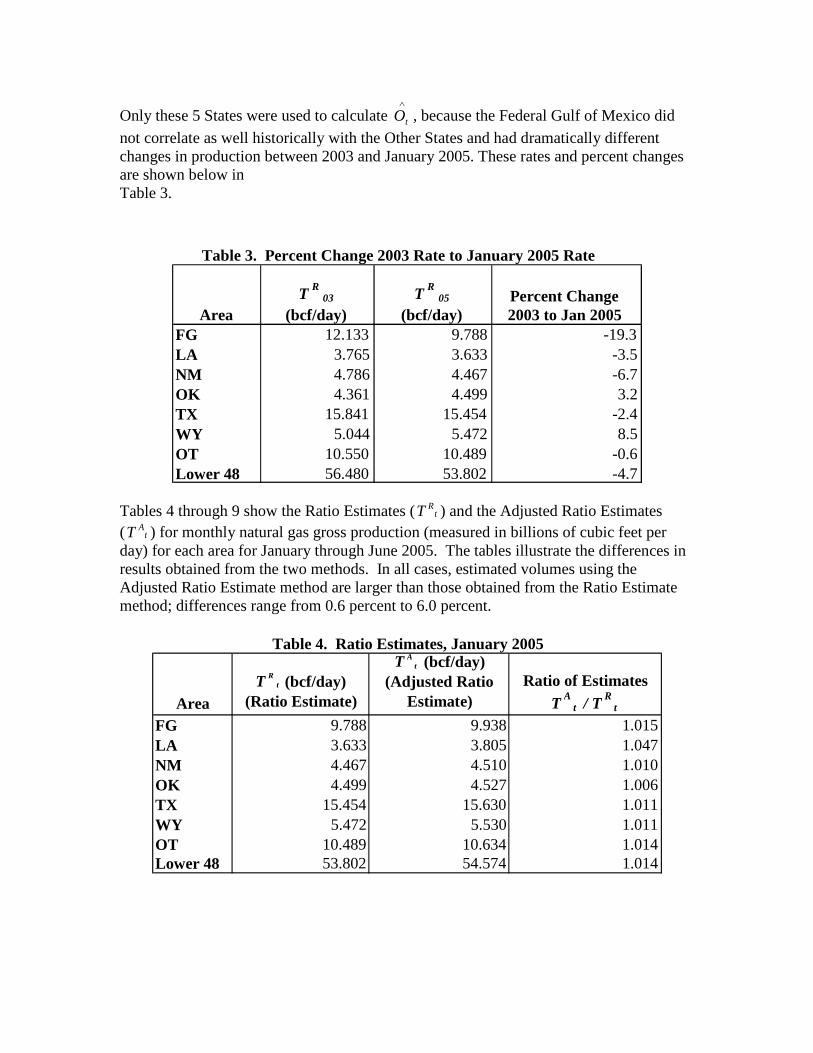
Only these 5 States were used to calculate ∧
tO , because the Federal Gulf of Mexico did not correlate as well historically with the Other States and had dramatically different changes in production between 2003 and January 2005. These rates and percent changes are shown below in Table 3.
Area T R
03 (bcf/day)
T R 05
(bcf/day) Percent Change 2003 to Jan 2005
FG 12.133 9.788 -19.3 LA 3.765 3.633 -3.5 NM 4.786 4.467 -6.7 OK 4.361 4.499 3.2 TX 15.841 15.454 -2.4 WY 5.044 5.472 8.5 OT 10.550 10.489 -0.6 Lower 48 56.480 53.802 -4.7
Table 3. Percent Change 2003 Rate to January 2005 Rate
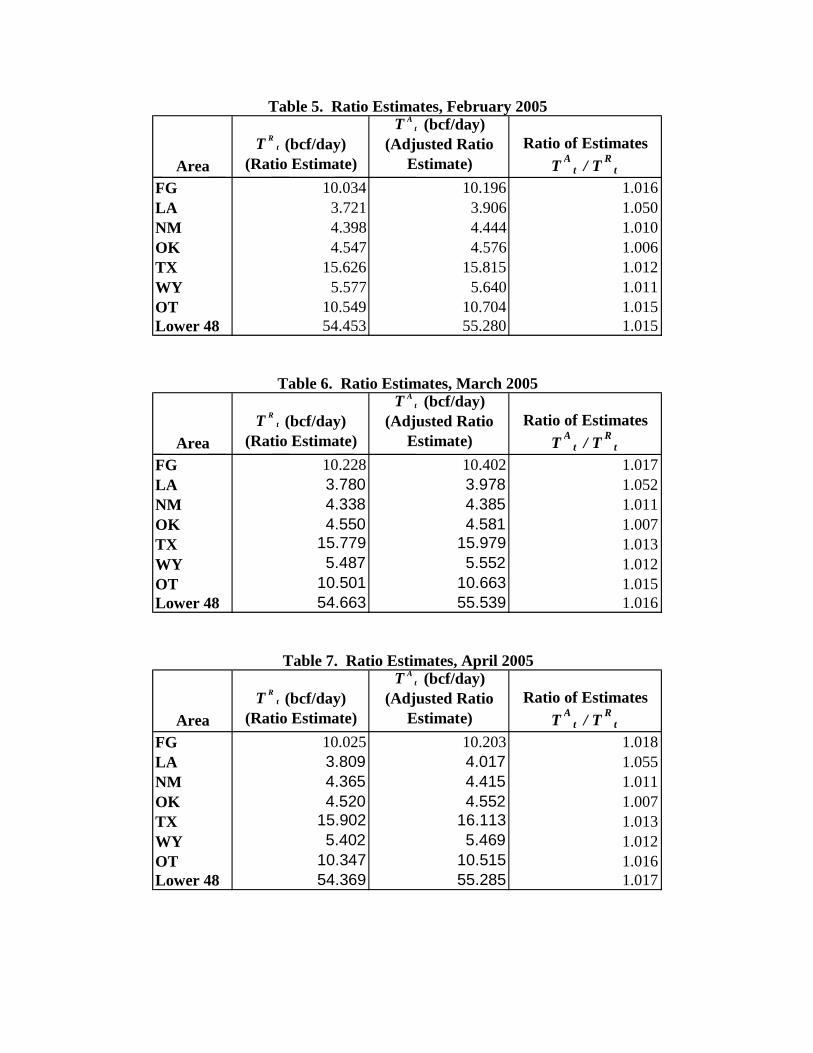
Tables 4 through 9 show the Ratio Estimates ( tRT ) and the Adjusted Ratio Estimates
( tAT ) for monthly natural gas gross production (measured in billions of cubic feet per
day) for each area for January through June 2005. The tables illustrate the differences in results obtained from the two methods. In all cases, estimated volumes using the Adjusted Ratio Estimate method are larger than those obtained from the Ratio Estimate method; differences range from 0.6 percent to 6.0 percent.
Area T R t (bcf/day)
(Ratio Estimate)
T A t (bcf/day) (Adjusted Ratio
Estimate) Ratio of Estimates
T A t / T R
t FG 9.788 9.938 1.015 LA 3.633 3.805 1.047 NM 4.467 4.510 1.010 OK 4.499 4.527 1.006 TX 15.454 15.630 1.011 WY 5.472 5.530 1.011 OT 10.489 10.634 1.014 Lower 48 53.802 54.574 1.014
Table 4. Ratio Estimates, January 2005
Area T R t (bcf/day)
(Ratio Estimate)
T A t (bcf/day) (Adjusted Ratio
Estimate) Ratio of Estimates
T A t / T R
t FG 10.034 10.196 1.016 LA 3.721 3.906 1.050 NM 4.398 4.444 1.010 OK 4.547 4.576 1.006 TX 15.626 15.815 1.012 WY 5.577 5.640 1.011 OT 10.549 10.704 1.015 Lower 48 54.453 55.280 1.015
Table 5. Ratio Estimates, February 2005
Area T R t (bcf/day)
(Ratio Estimate)
T A t (bcf/day) (Adjusted Ratio
Estimate) Ratio of Estimates
T A t / T R
t FG 10.228 10.402 1.017 LA 3.780 3.978 1.052 NM 4.338 4.385 1.011 OK 4.550 4.581 1.007 TX 15.779 15.979 1.013 WY 5.487 5.552 1.012 OT 10.501 10.663 1.015 Lower 48 54.663 55.539 1.016
Table 6. Ratio Estimates, March 2005
Area T R t (bcf/day)
(Ratio Estimate)
T A t (bcf/day) (Adjusted Ratio
Estimate) Ratio of Estimates
T A t / T R
t FG 10.025 10.203 1.018 LA 3.809 4.017 1.055 NM 4.365 4.415 1.011 OK 4.520 4.552 1.007 TX 15.902 16.113 1.013 WY 5.402 5.469 1.012 OT 10.347 10.515 1.016 Lower 48 54.369 55.285 1.017
Table 7. Ratio Estimates, April 2005

Area T R t (bcf/day)
(Ratio Estimate)
T A t (bcf/day) (Adjusted Ratio
Estimate) Ratio of Estimates
T A t / T R
t FG 9.997 10.183 1.019 LA 3.810 4.028 1.057 NM 4.397 4.450 1.012 OK 4.480 4.513 1.007 TX 15.833 16.054 1.014 WY 5.470 5.541 1.013 OT 10.512 10.691 1.017 Lower 48 54.499 55.459 1.018
Table 8. Ratio Estimates, May 2005
Area T R t (bcf/day)
(Ratio Estimate)
T A t (bcf/day) (Adjusted Ratio
Estimate) Ratio of Estimates
T A t / T R
t FG 9.867 10.059 1.019 LA 3.794 4.022 1.060 NM 4.351 4.406 1.013 OK 4.559 4.594 1.008 TX 15.923 16.153 1.014 WY 5.543 5.618 1.014 OT 10.571 10.758 1.018 Lower 48 54.607 55.609 1.018
Table 9. Ratio Estimates, June 2005
When production data are missing for a given data month because of non-response or if the response is judged to be in error, an imputed value is calculated. Eventually, this imputed value would be the projected value of a linear fit of the last six months of survey data for that operator in that area. Tests run on 7 years of monthly historical data showed that this method causes errors of less than 0.1 percent at the State level when a random sample of 10 percent of the operators were treated as non-responding each month. For a test month, the prior 6 months of production data were linearly fit and the linear projection for the next month was used as the imputed value for operators treated as nonrespondents.
Imputation
Before six months of survey data were accumulated, only the available data months were used in the linear fit. For example, in the case of March 2005, only 2 months were available for the linear fit, January and February. For July, there were 6 months available, January through June 2005. Fortunately, production weighted response rates are over 99 percent. Hence, there should be very little error associated with imputation for
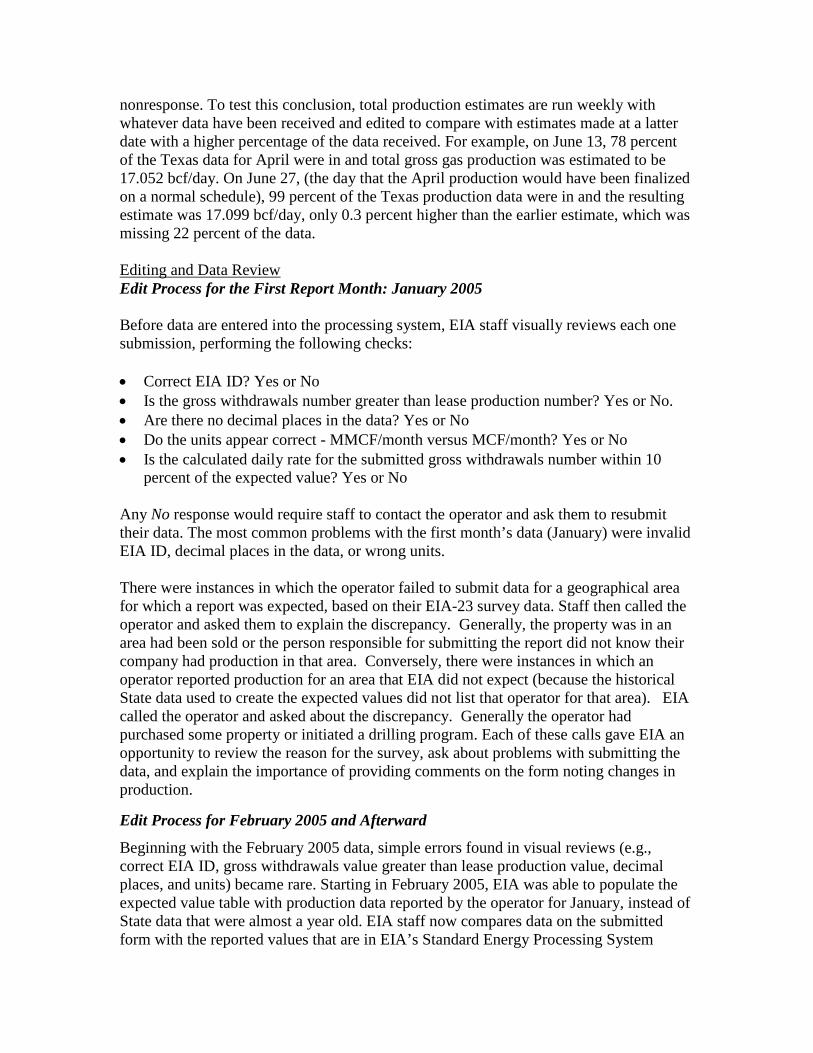
nonresponse. To test this conclusion, total production estimates are run weekly with whatever data have been received and edited to compare with estimates made at a latter date with a higher percentage of the data received. For example, on June 13, 78 percent of the Texas data for April were in and total gross gas production was estimated to be 17.052 bcf/day. On June 27, (the day that the April production would have been finalized on a normal schedule), 99 percent of the Texas production data were in and the resulting estimate was 17.099 bcf/day, only 0.3 percent higher than the earlier estimate, which was missing 22 percent of the data.
Edit Process for the First Report Month: January 2005 Editing and Data Review
Before data are entered into the processing system, EIA staff visually reviews each one submission, performing the following checks: • Correct EIA ID? Yes or No • Is the gross withdrawals number greater than lease production number? Yes or No. • Are there no decimal places in the data? Yes or No • Do the units appear correct - MMCF/month versus MCF/month? Yes or No • Is the calculated daily rate for the submitted gross withdrawals number within 10
percent of the expected value? Yes or No Any No response would require staff to contact the operator and ask them to resubmit their data. The most common problems with the first month’s data (January) were invalid EIA ID, decimal places in the data, or wrong units. There were instances in which the operator failed to submit data for a geographical area for which a report was expected, based on their EIA-23 survey data. Staff then called the operator and asked them to explain the discrepancy. Generally, the property was in an area had been sold or the person responsible for submitting the report did not know their company had production in that area. Conversely, there were instances in which an operator reported production for an area that EIA did not expect (because the historical State data used to create the expected values did not list that operator for that area). EIA called the operator and asked about the discrepancy. Generally the operator had purchased some property or initiated a drilling program. Each of these calls gave EIA an opportunity to review the reason for the survey, ask about problems with submitting the data, and explain the importance of providing comments on the form noting changes in production. Edit Process for February 2005 and Afterward
Beginning with the February 2005 data, simple errors found in visual reviews (e.g., correct EIA ID, gross withdrawals value greater than lease production value, decimal places, and units) became rare. Starting in February 2005, EIA was able to populate the expected value table with production data reported by the operator for January, instead of State data that were almost a year old. EIA staff now compares data on the submitted form with the reported values that are in EIA’s Standard Energy Processing System
(STEPS) to determine if the calculated daily rate for the submitted gross withdrawals number is within 10 percent of the expected value. If the difference is more than 10 percent and there is no note in the comments section explaining the difference, EIA staff contacts the operator and discusses the production difference. This discussion has increased EIA’s understanding of the operator’s production. On occasion, the questions have led the operator to review previously submitted data and resubmit them. Visually reviewed data are loaded into STEPS, which has built-in functionality that (1) checks the calculated gross daily rate against the expected daily rate, (2) checks the calculated gross daily rate for the target month against the calculated gross daily rate of the previous month, and (3) checks that the gross withdrawals number is not less than the lease production number. Edit flags occur if the calculated gross daily rate is 10 percent greater than or 20 percent less than the expected value or the calculated gross daily rate for the target month is not within 10 percent of the calculated gross daily rate for the previous month. (The lower edit range is larger than the upper edit range because production is expected to decline over time, rather than increase.) These edits in STEPS identify potential problems that might not have been identified when the numbers were reviewed initially.
Each month, when the production estimate for the latest data month is released, the prior month’s production estimate will be revised. If errors of sufficient size are found for any month, those data will be revised again with the next data release. Monthly estimates will be revised again when final natural gas production estimates for the year are released in the Natural Gas Annual. EIA will give notice on the EIA-914 Webpage when any prior estimates are revised.
Revision Policy
EIA plans to compare EIA-914 data with data obtained from the previous methods used (as described in
Analysis Plan
How EIA Estimates Natural Gas Production), and for both estimation methodologies. Significant differences will be investigated and resolved. In addition, EIA will track month-to-month changes in State-level and Lower-48 production data obtained from the EIA-914 survey compared to month-to-month changes obtained from the previous methods. Significant discrepancies will be investigated further. The goal is to complete the analysis - including selection of the best estimation methodology - and replace current data series with EIA-914 data by the end of the 2005 data year (March 2006).