eigen value based approach for avoiding torsional...
TRANSCRIPT

Columbia International Publishing Journal of Vibration Analysis Measurement and Control (2016) Vol. 4 No. 1 pp. 56-68 doi:10.7726/jvamc.2016.1005
Research Article
______________________________________________________________________________________________________________________________ *Corresponding e-mail: [email protected] 1. M. Tech Student, Walchand College of Engineering, Sangli. 2. Faculty, Mechanical Department, Walchand College of Engineering, Sangli.
56
Eigen Value Based Approach for Avoiding Torsional Resonance in Engine – Dynamometer Driveline: Theory
and Experimental Validation
Ramnath Prabhu Bam1 and Arvind Kale2
Received: 11 March2015; Published online: 25 June 2016
© The author(s). Published with open access at www.uscip.us
Abstract IC engines, are connected to a loading device called as dynamometer during the testing. The engine is coupled to the dynamometer by means of a driveshaft. In such applications, torsional resonance is a frequently encountered problem. It produces disastrous effects on the driveline, at times leading to the breakage of the shaft. This paper presents analytical approach for selection of the optimum driveline from the point of view of avoiding the torsional resonance. First the methodology to build an effective torsional mass elastic model (TMEM) and the approaches to solve it are explained. Based on the results obtained, criteria for selection of the torsional coupling is explained. Finally, the theoretical study is verified through experimental measurements. Construction of the TMEM is done with the help of Creo 2.0 and Ansys 14 Workbench and the solution is obtained with the help of Matlab Programing. Keywords: Engine order of resonance; Torsional Mass Elastic Model; Driveline; Crank Throw; Inertia and Stiffness; Eigen Value
1. Introduction
In recent times, there has been a remarkable progress in the development of the IC engines and due to ever increasing competition, it has become necessary to pay attention to each and every parameter of the engine. Thus it becomes necessary to conduct tests on the engine and determine the measures to be taken to improve the engines performance. To do this, the engine is connected to the dynamometer which is a loading device.This results in a complete driveline from engine to dynamometer which involves number of rotating components. Fig. 1 shows various components that form a part of driveline which are very important from torsional vibration perspective.

Ramnath Prabhu Bam and Arvind Kale / Journal of Vibration Analysis Measurement and Control
(2016) Vol. 4 No. 2 pp. 56-68
57
Fig. 1. Engine – Dynamometer driveline components
The coupling between the engine and dynamometer has to be properly selected. A faulty selection could give rise to issues such as torsional vibrations, vibration of engine and dynamometer, whirling of the shaft, damage to the bearing etc. The major problem faced is that of torsional resonance which leads to breakage of the the driveshaft (if coupling is not used). In order to avoid torsional resonance, the natural frequency of the system must be shifted outside the operating range of the engine. This can be done by choosing the driveshaft of correct stiffness. However, due to wide operating range of the engines, mostly it is not possible to shift the natural frequency outside the operating speeds of the engine based on the shaft stiffness alone. In such cases, the best option is to go for a torsionally soft coupling which have a very low stiffness. The selection of this coupling and driveshaft should be done very carefully to avoid aforementioned problems. Fig. 2 and fig. 3 show cases of driveline failure. In fig. 2, the torsional coupling has failed whereas in the fig. 3 the driveshaft bolts have got sheared off.
Fig. 2. Failure of a torsional coupling Fig. 3. Driveshaft bolt failure
Meirelles et al. (2007) presented a paper on mathematical modelling for studying torsional vibrations in internal combustion engines. In this paper the authors explained about modelling of the inertias for various components of the internal combustion engine. British Internal Combustion Engine Research Association (BICERA) and Ker Wilson have given analytical formulas to calculate the torsional stiffness of the crankshaft. Feese et al. (2002) have presented a paper in which the authors have given guidelines for the prevention of the torsional vibration problems in reciprocating machinery. Jayabalan (2012) has presented a paper on design of coupling shafts between engine and the dynamometer in which the author has used the two mass model for selecting the coupling shaft. The author also explained the procedure for calculating the stiffness of thee driveshaft. Teja et al. (2012) have presented a paper on computation of natural frequencies of
Rubber failure
Bolt
failure

Ramnath Prabhu Bam and Arvind Kale / Journal of Vibration Analysis Measurement and Control
(2016) Vol. 4 No. 2 pp. 56-68
58
multi degree of freedom system. In this paper the authors have programmed Holzer method in Matlab. The literature review was helpful in getting an insight to the torsional vibration problems in IC engines and application of concepts of vibration to the engine dynamometer driveline.
2. Mathematical Modelling
In dealing with the torsional vibration problems, estimation of the natural frequencies is the first and the most important step. For this, entire system needs to be converted in to an equivalent mathematical model. The entire system is represented as discrete elements with inertias and connected to other elements with some stiffness. Each element is called as a ‘Mass Station’. Fig. 4 shows a model of the engine dynamometer driveline.
Fig. 4. Conceptual Model of Engine - Dynamometer driveline
The equation of motion in case of torsional vibration is of the form [Rao, 2010],
J Ӫ (t) + C �̇�(t) + K θ (t) = T (t) (1)
In the above equation, J refers to the inertia matrix, C refers to the damping matrix, K refers to the stiffness matrix and the term T (t) is the excitation vector. For the free response,
J Ӫ (t) + C �̇�(t) + K θ (t) = 0 (2)
Also, damping can be neglected in the study of free torsional vibrations. Thus the governing equation becomes,
J Ӫ (t) + K θ (t) = 0 (3)
Thus it is required to calculate inertia and stiffness of all the mass stations.
2.1 Inertia Modelling
In each engine there are number of cylinders which are connected through a connecting rod to the crankshaft. The crankshaft is having a rotary motion and the pistons in the cylinders are having reciprocating motion. The moment of inertia of each crank is normally called as “crank throw inertia”. From dynamically equivalent system concept, in which the connecting rod mass is

Ramnath Prabhu Bam and Arvind Kale / Journal of Vibration Analysis Measurement and Control
(2016) Vol. 4 No. 2 pp. 56-68
59
distributed at crank pin and the piston [Khurmi et.al.], Mconrecip = M* l2/ (L) & Mconrot = M* l1/ (L) (4)
Where, M = mass of the connecting rod, Mconrecip = mass of the connecting rod at the piston, Mconrot = mass of the connecting rod at the crankpin, L = l1 + l2 = length of the connecting rod. The equivalent crank throw inertia is determined from,
Ieqv = Icrank + Mrotating* R2 + ½ * Mconrecip * R2 (5)
Where, R = crank radius, Mrotating = Mass of the Piston (Mp) + Mconrot and Icrank = inertia of the crank portion. The inertia of the crank portion (Fig. 5), Icrank is determined from the CAD model using Creo 2.0 software.
Fig. 5. Crank Portion Fig. 6. Gear train model
Inertia of the gear train is determined by adding the reduced moment of inertia of all the gears in the train. The reduced moment of inertia is obtained as follows [Meirelles et.al., 2008], referring to Fig. 6,
Ired = I (n2/n1)2 (6)
Where, I = actual inertia of the respective gear with speed n2 and n1 = speed of crankshaft gear.
The inertia of the flywheel, driveshaft and the dynamometer in this study were obtained from the manufacturers drawings.
2.2 Stiffness modelling Torsional stiffness of the crankshaft portion were determined using the Ansys 14 Workbench software and also using the Carter’s and Ker Wilson’s formulae [Feese et.al., 2002; BICERA].
a) Carter’s formula: b) Ker Wilson’s Formula:

Ramnath Prabhu Bam and Arvind Kale / Journal of Vibration Analysis Measurement and Control
(2016) Vol. 4 No. 2 pp. 56-68
60
Where, Kt = Torsional Stiffness,and the rest of the dimensions are clear from Fig 7. In the formula, W = maximum width of the crank web. Due to the complex geometry of the crank web, it is difficult to straight away determine this value.
There are various methods being used to determine the crank web width. In this present study, W is determined by drawing a line from the points of intersection of the crankpin and the journal circles till it meets the web boundary. The length of this line = W.
Fig.7. Crank Web Fig. 8. FEA of crank web
Using Ansys, the stiffness can be determined by slicing out crank shaft portions between individual crank throws and meshing the same. The boundary conditions applied by fixing one end and applying a moment of 1 N-m at the other end. The FEA result is shown in Fig. 8.
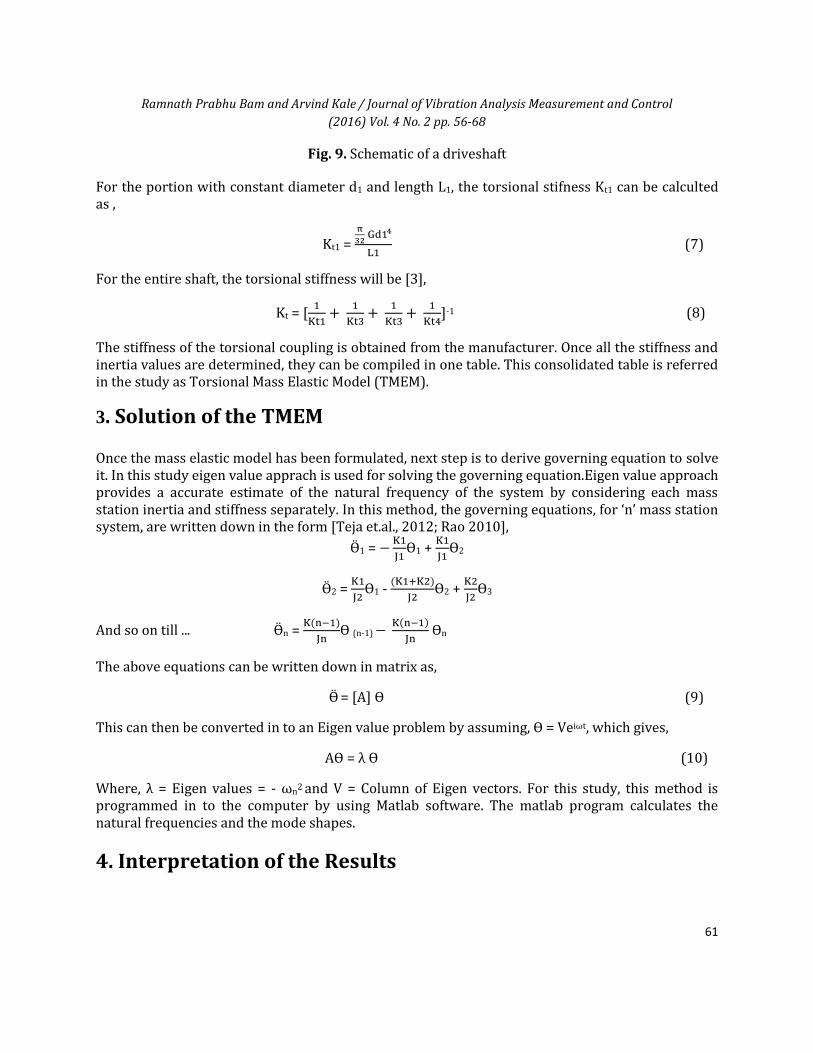
The driveshaft has a splined joint for axial movement and two universal joint on both ends for misallignment. The stiffness of the driveshaft can be calculated by considering it to be made of two pieces with varying diameter. The stiffness for the portions of constant diameter can be determined and added to get the shaft stiffness as given below [Jayabalan, 2012], refering to Fig. 9.
Ramnath Prabhu Bam and Arvind Kale / Journal of Vibration Analysis Measurement and Control
(2016) Vol. 4 No. 2 pp. 56-68
61
Fig. 9. Schematic of a driveshaft
For the portion with constant diameter d1 and length L1, the torsional stifness Kt1 can be calculted as ,
Kt1 = π
32 Gd14
L1 (7)
For the entire shaft, the torsional stiffness will be [3],
Kt = [1
Kt1+
1
Kt3+
1
Kt3+
1
Kt4]-1 (8)
The stiffness of the torsional coupling is obtained from the manufacturer. Once all the stiffness and inertia values are determined, they can be compiled in one table. This consolidated table is referred in the study as Torsional Mass Elastic Model (TMEM).
3. Solution of the TMEM
Once the mass elastic model has been formulated, next step is to derive governing equation to solve it. In this study eigen value apprach is used for solving the governing equation.Eigen value approach provides a accurate estimate of the natural frequency of the system by considering each mass station inertia and stiffness separately. In this method, the governing equations, for ‘n’ mass station system, are written down in the form [Teja et.al., 2012; Rao 2010],
Ӫ1 = −K1
J1Ө1 +
K1
J1Ө2
Ӫ2 = K1
J2Ө1 -
(K1+K2)
J2Ө2 +
K2
J2Ө3
And so on till ... Ӫn = K(n−1)
JnӨ (n-1) −
K(n−1)
Jn Өn
The above equations can be written down in matrix as,
Ӫ = [A] Ө (9)
This can then be converted in to an Eigen value problem by assuming, Ө = Veiωt, which gives,
AӨ = λ Ө (10)
Where, λ = Eigen values = - ωn2 and V = Column of Eigen vectors. For this study, this method is programmed in to the computer by using Matlab software. The matlab program calculates the natural frequencies and the mode shapes.
4. Interpretation of the Results

Ramnath Prabhu Bam and Arvind Kale / Journal of Vibration Analysis Measurement and Control
(2016) Vol. 4 No. 2 pp. 56-68
62
Once the natural frequencies are obtained from the above explained approaches, it is necessary to interpret the result and determine whether the driveline is safe from torsional resonance point of view. To avoid the torsional resonance, we must have a natural frequency of the system such that it shifts the resonance condition outside the engine operating speed. Once the natural frequencies are obtained from the above explained approaches, it is necessary to interpret the result and determine whether the driveline is safe from torsional resonance point of view. This decision is arrived at based on following: 4.1 Orders of resonance The engine excitation curve can be divided in to number of sinusoidal curves of different frequencies. These frequencies are multiples or submultiples of the engine speed. These multiples and submultiples define the order of the engine. A major order is the one which causes the largest excitation and the torsional oscillations can be induced at this order. In case of the engine, the major order is mostly the firing order which is obtained from following formulae [Martyr et.al, 2007],
N0= (Number of cylinders)/2, for a four stroke engine.
N0= Number of cylinders, for a two stroke engine.
And, for a Vee engine, it is of the order,
N0= (Number of cylinders)/4, for a four stroke engine.
It has been proved in the research that, the major order resonance is of highest importance as compared to other orders.
4.2 Campbell Diagram This is a graphical tool used to effectively identify what is the primary resonance speed of the engine. This is a 2-D plot of speed (X-axis) v/s frequency (Y-axis). The various engine orders are plotted on this along with the natural frequency. The point of intersection of the primary resonance order and the natural frequency curves gives the primary resonance speed of the engine. X-axis contains the operating range speed of the engine. 4.3 Vibration transmissibility The graph (Fig.10) shows variation of the transmissibility, Tr, (Y-axis) w.r.t ‘r’, the ratio of excitation to natural frequency (X-axis). The peak on the graph, obviously depicting resonance condition, occurs at ω = ωn. All the transmissibility curves start at ω/ωn= 0 and at ω/ωn= sqrt (2), all curves pass through Tr =1.

Ramnath Prabhu Bam and Arvind Kale / Journal of Vibration Analysis Measurement and Control
(2016) Vol. 4 No. 2 pp. 56-68
63
Fig. 10. Vibration transmissibility graph
Beyond ω/ωn= sqrt (2), all curves approach Tr =0. Thus resonance condition is 1/sqrt (2) times away on the left hand side of the graph. In this study, the point ω/ωn= sqrt (2) represents the low idle speed of the engine. At this point, whatever vibrations are generated by the engine will be transmitted without magnification to the driveshaft and dynamometer. If this is the case and if we want the resonance condition to occur below low idle than we should have resonance speed to be 1/sqrt(2) times the low idle speed of the engine or lesser.
For example, if the low idle speed is 700 rpm (This is the average value of low idle speed), the resonance speed should be <= 700/sqrt (2) rpm. Thus, the driveline can be considered safe if it satisfies the vibration transmissibility condition for major order of resonance.
In the following article, the results of the Matlab code for two driveline combinations are shown.
4.4 Case I The TMEM for the driveline combination with a 4 – cylinder engine is shown in Fig 11.
Fig. 11. Torsional Mass Elastic Model
The mode shapes and Campbell diagrams for this driveline are shown in Fig. 12 and Fig.13
respectively.

Ramnath Prabhu Bam and Arvind Kale / Journal of Vibration Analysis Measurement and Control
(2016) Vol. 4 No. 2 pp. 56-68
64
Fig. 12. Mode Shapes Fig. 13. Campbell Plot
The first natural frequency is 27.2 Hz (1632 rpm). It produces a second order resonance at 1632/2 = 816 rpm. Second order is a major order since this is a four cylinder engine. The low idle speed of this engine is 700 rpm and hence this driveline is not safe from torsional resonance point of view. However, the engines which are used for power generation application are always run at 1500 rpm during the test and hence this coupling shaft combination can be used for the power gen engines as 816*sqrt (2) < 1500. However this does not work for industrial engines which are tested from low idle to high idle speed. 4.5 Case II The TMEM for the driveline combination with a 4 – cylinder engine is shown in Fig. 14.
Fig. 14. Torsional Mass Elastic Model
Also, for the same driveline, the mode shape plot and the Campbell plot are shown in Fig. 15 and Fig. 16 respectively. The first natural frequency is 381.23 Hz (22873.8 rpm). It produces a second order resonance at 22873.8/2 = 11436.9 rpm. Second order is a major order since this is a four cylinder engine. The low idle speed of this engine is 700 rpm and the high idle is 3400 rpm. Since the resonance condition is outside the engine operating range, this driveline is safe from torsional resonance point of view.

Ramnath Prabhu Bam and Arvind Kale / Journal of Vibration Analysis Measurement and Control
(2016) Vol. 4 No. 2 pp. 56-68
65
Fig. 15. Mode Shapes Fig. 16. Campbell Plot
5. Experimental Validation
The experimental measurements in this study are carried out using laser vibrometer. In this article, the experimental measurements are presented for the two driveline case studies mentioned above. The layout of the connections for measurements is shown in Fig.17. Also some photographs taken during set up stage that shows the positioning of the laser vibrometer are shown. Fig. 18 shows laser beam pointing on the crank pulley. Fig. 19 shows the tripod stand on which the laser vibrometer rests. Fig. 20 shows the knobs that used for fine adjustment of the laser beam on the pulley. Fig shows the tachometer pointing on the dynamometer flange to recordd the dynamometer RPM.
Fig. 17. Experimental Measurement set up layout

Ramnath Prabhu Bam and Arvind Kale / Journal of Vibration Analysis Measurement and Control
(2016) Vol. 4 No. 2 pp. 56-68
66
Fig. 18. Laser beam Fig. 19. Tripod stand Fig. 20. Adjustment knobs
Below the experimental results of the two drivelines discussed above are presented.
5.1 Case I The waterfall plot for full load sweep down from 1580 rpm to 1250 rpm and for no load sweep down from 1580 rpm to 1190 rpm are shwon in Fig 21 and Fig. 22. It can be seen from the graphs that the secon order is dominant.
Fig. 21. Waterfall plot (1580 – 1250) Fig. 22. Waterfall plot (1580 -1190)
The Fig. 23 shows start – stop cycle plot, in which it can be seen that the first natural frequency is 27.41 Hz ( Theoretical value = 27.2 Hz).

Ramnath Prabhu Bam and Arvind Kale / Journal of Vibration Analysis Measurement and Control
(2016) Vol. 4 No. 2 pp. 56-68
67
Fig. 23. Start – Stop cycle plot
5.2 Case II
The results of the full load sweep down from rated speed 2600 rpm to 1000 rpm and no load sweep down from high idle speed 2900 to low idle speed 700 rpm are shown in Fig. 24 and Fig. 25 respectively. From both these figures, it can be seen that the natural frequency is 382 Hz (Theoretical value = 381.23 Hz).
Fig. 24. Full load sweep Fig. 25. No load sweep
6. Conclusion In this paper, the author have developed an Eigen value based approach for avoiding the torsional resonance problem in the Engine - Dynamometer driveline. Criteria’s have been mentioned to determine whether a driveline is safe from torsional resonance point of view. Two case studies have been presented in the paper. Finally, the Torsional Mass Elastic model and the Eigen value approach have been experimentally validated for the same two cases and the results are found to be in accordance with the theoretical values.

Ramnath Prabhu Bam and Arvind Kale / Journal of Vibration Analysis Measurement and Control
(2016) Vol. 4 No. 2 pp. 56-68
68
References Anthony Martyr and Michael Alexander Plint, “Engine Testing: Theory and Practice”, Butterworth-
Heinemann, 2007 - Technology & Engineering . British Internal Combustion Engines Research Association, “A Handbook on Torsional Vibration”. Nptel, “Modelling of Reciprocating Machine Systems”,
http://nptel.ac.in/courses/112103024/module6/lec6/2.html P S Meirelles, A S. Mendes, and D E Zampieri (2008), “Analysis of torsional vibration in internal combustion
engines: Modelling and experimental validation”, Proceedings of the Institution of Mechanical Engineers, Part K: Journal of Multi-body Dynamics 2008 222: 155.
R.S.Khurmi, J.K.Gupta, “Theory of Machines”, 14th Rev Edition, S.Chand. Robert L. Norton, “Machine Design – An Integrated Approach”, Second edition, Pearson. Singiresu S. Rao, “Mechanical Vibrations”, 5th Edition, September 17, 2010. S. Jayabalan, “Study and Design of the Coupling Shaft between engine and dynamometer” Delphi TVS System
Limited, SAE Technical publications, 2012. Troy Feese, P.E. and Charles Hill (2002), “Guidelines for preventing torsional vibration problems in
reciprocating machinery”, Engineering Dynamics Incorporated, 16117 University Oak, San Antonio, Texas 78249, (210) 492 – 9100.
T. Ravi Teja, et al., “Computation of Natural Frequencies of Multi Degree Of Freedom System” International Journal of Engineering Research & Technology (IJERT), Vol. 1 Issue 10, December- 2012.