eight total maximum loads for indicator bacteria in
TRANSCRIPT

Adopted February 8, 2012Approved by EPA June 6, 2012
Eight Total Maximum Daily Loads for Indicator Bacteria in Dickinson Bayou and Three Tidal Tributaries Segments 1103, 1103A, 1103B, 1103C, 1104
Assessment Units: 1103_02, 1103_03, 1103_04, 1103A_01, 1103B_01, 1103C_01, 1104_01, and 1104_02
W a t e r Q u a l i t y P l a n n i n g D i v i s i o n , O f f i c e o f W a t e r
TEXAS COMMISSION ON ENVIRONMENTAL QUALITY


Eight Total Maximum Daily Loads for Indicator Bacteria in Dickinson Bayou and Three Tidal Tributaries
Texas Commission on Environmental Quality ii Adopted February 8, 2012
Distributed by the Total Maximum Daily Load Team
Texas Commission on Environmental Quality MC-203
P.O. Box 13087 Austin, Texas 78711-3087
E-mail: [email protected] TMDL project reports are available on the TCEQ Web site at:
<www.tceq.state.tx.us/implementation/water/tmdl/>
The preparation of this report was financed in part through grants from the U.S. Environmental Protection Agency.
This TMDL report is based in large part on the report titled Technical Support Document:
Bacteria Total Maximum Daily Loads for Dickinson Bayou, August 2010 prepared by University of Houston and CDM

Eight Total Maximum Daily Loads for Indicator Bacteria in Dickinson Bayou and Three Tidal Tributaries
Texas Commission on Environmental Quality iii Adopted February 8, 2012
Contents Executive Summary ............................................................................................................................. 1 Introduction ........................................................................................................................................ 2 Problem Definition .............................................................................................................................. 3
Ambient Concentrations of Indicator Bacteria ............................................................................ 5 Watershed Overview ..................................................................................................................... 9 Summary of TMDL Monitoring .................................................................................................. 11
Endpoint Identification...................................................................................................................... 14 Source Analysis .................................................................................................................................. 14
Permitted Sources ........................................................................................................................ 15 Wastewater Treatment Facilities .......................................................................................... 16 Sanitary Sewer Overflows ...................................................................................................... 16 TPDES-Regulated Stormwater ............................................................................................. 16 Illicit Discharges .................................................................................................................... 19
Unregulated Sources ................................................................................................................... 20 On-Site Sewage Facilities ..................................................................................................... 20 Livestock Contributions ....................................................................................................... 22 Wildlife and Exotic Animal Contributions .......................................................................... 26 Domestic Pets ....................................................................................................................... 29
Linkage Analysis ................................................................................................................................ 29 Load Duration Curve Analysis .................................................................................................... 29 Load Duration Curve Analysis Results........................................................................................ 31
Assessment Unit 1104_01 ..................................................................................................... 31 Assessment Unit 1104_02 .................................................................................................... 32 Mass Balance Analysis – Tidal Prism Model ....................................................................... 34
Margin of Safety ................................................................................................................................ 36 Pollutant Load Allocation ..................................................................................................................37
Wasteload Allocation ...................................................................................................................37 Load Allocation ............................................................................................................................ 41 Allowance for Future Growth ..................................................................................................... 42 TMDL Calculations ..................................................................................................................... 42
Seasonal Variation ............................................................................................................................ 44 Public Participation ........................................................................................................................... 44 Implementation and Reasonable Assurance ................................................................................... 45
Key Elements of an I-Plan .......................................................................................................... 46 References ......................................................................................................................................... 48 Appendix A. Load Duration Curve Approach .................................................................................. 52
Flow Duration Curves ................................................................................................................. 53 Load Duration Curve Analysis .....................................................................................................55 Load Duration Curve Analysis Results....................................................................................... 56
Appendix B. Tidal Prism Model Approach ....................................................................................... 58

Eight Total Maximum Daily Loads for Indicator Bacteria in Dickinson Bayou and Three Tidal Tributaries
Texas Commission on Environmental Quality iv Adopted February 8, 2012
Hydrological Simulation Program–Fortran .............................................................................. 59 Tidal Prism Modeling ................................................................................................................. 64
Appendix C. Future Growth Analysis ............................................................................................... 69 Methodology ............................................................................................................................... 70 Municipal Wastewater Projections ............................................................................................ 70 Industrial Wastewater Projections .............................................................................................. 71
Appendix D. Method for Calculating TMDL Allocations for Revised Contact Recreation Standards ............................................................................................................73
Assessment Unit 1104_01 ........................................................................................................... 74 Assessment Unit 1104_02 ........................................................................................................... 75
Figures Figure 1. Dickinson Bayou Watershed Assessment Units ........................................................................... 4 Figure 2. Water Quality Monitoring Station Locations ................................................................................ 6 Figure 3. Land Use Map, Dickinson Bayou (2008 H-GAC Land Use) ..................................................... 12 Figure 4. TPDES-Permitted Facilities in the Dickinson Bayou Watershed ............................................... 17 Figure 5. Sanitary Sewer Overflows in Dickinson Bayou Watershed ....................................................... 18 Figure 6. MS4 Permitted Regions in Dickinson Bayou Watershed ........................................................... 19 Figure 7. On-Site Sewage Facilities in Dickinson Bayou Watershed ........................................................ 21 Figure 8. Load Duration Curve for E. coli in Assessment Unit 1104_01 .................................................. 32 Figure 9. Load Duration Curve for E. coli in Assessment Unit 1104_02 .................................................. 33 Figure 10. Conceptual Model for Enterococci in Tidal Segments ............................................................... 34 Figure 11. Longitudinal Profile of the Tidal Prism Model Enterococci Calibration in the
Tidal Segment of Dickinson Bayou (1999-2001) ....................................................................... 35 Figure A-1. Flow Duration Curve for Assessment Unit 1104_01 .................................................................. 54 Figure A-2. Flow Duration Curve for Assessment Unit 1104_02 .................................................................. 54 Figure B-1. HSPF Subwatersheds ................................................................................................................... 60 Figure B-2. Rain Gauge Assignment for Dickinson Bayou Model Subwatersheds ...................................... 61 Figure B-3. Chocolate Bayou Drainage Area Location .................................................................................. 62 Figure B-4. Synthetic Flow Data for Reach 11 ............................................................................................... 62 Figure B-5. Flow Comparison for 2004 .......................................................................................................... 63 Figure B-6. Flow Duration Curve for Synthetic and Modeled Flows, Reach 11 ........................................... 63 Figure B-7. Bacteria Calibration Plot at station 11467 ................................................................................... 64 Figure B-8. Tidal Prism Box Model Conceptual Model ................................................................................ 65 Figure B-9. Tidal Prism Box Model Segmentation ........................................................................................ 65 Figure B-10. Longitudinal Profile of Simulated and Observed Salinity in Dickinson Bayou ........................ 67
Tables Table 1. Summary of Bacteria Standards by Assessment Unit ................................................................... 5 Table 2. Summary of Criteria and Assessment Data – E. coli .................................................................... 7 Table 3. Summary of Criteria and Assessment Data – Enterococci ........................................................... 8 Table 4. County Population and Density ..................................................................................................... 9 Table 5. Dickinson Bayou Watershed Population Increases by City, 2000 to 2050 ................................ 10

Eight Total Maximum Daily Loads for Indicator Bacteria in Dickinson Bayou and Three Tidal Tributaries
Texas Commission on Environmental Quality v Adopted February 8, 2012
Table 6. Land Use Summary ...................................................................................................................... 11 Table 7. TMDL Wet Weather Monitoring Data for Bayou Wildlife Park ............................................... 13 Table 8. TMDL-Collected Monitoring Data for WWTFs ......................................................................... 14 Table 9. Permitted Wastewater Discharges in the Dickinson Bayou Watershed ..................................... 15 Table 10. Summary of Sanitary Sewer Discharges in the Dickinson Bayou Watershed ........................... 17 Table 11. Stormwater Permittees in Dickinson Bayou Watershed ............................................................. 18 Table 12. Estimated Number of Failing OSSFs by Assessment Unit ......................................................... 22 Table 13a. Livestock Population Estimates by Assessment Unit ................................................................. 23 Table 13b. Livestock Animal Equivalents by Assessment Unit ................................................................... 24 Table 13c. Livestock Bacteria by Assessment Unit ...................................................................................... 25 Table 13d. Wildlife, Invasive and Exotic Animal Populations by Assessment Unit ................................... 27 Table 13e. Wildlife, Invasive and Exotic Animal Bacteria Production by Assessment Unit ...................... 28 Table 14a. Domestic Pet Daily E. coli Production by Assessment Unit ...................................................... 28 Table 14b. Domestic Pet Populations by Assessment Unit ........................................................................... 29 Table 15. LDC and Observed Loads for Assessment Unit 1104_01 .......................................................... 32 Table 16. LDC and Observed Loads for Assessment Unit 1104_02 .......................................................... 33 Table 17. TMDL Loads: Estimated and Actual Loads for the Impaired Assessment Units
in Segment 1103 ........................................................................................................................... 36 Table 18. Wasteload Allocation for WWTFs in Dickinson Bayou Watershed .......................................... 39 Table 19. Percentages of Each Assessment Unit Designated as an Urbanized Area ................................. 40 Table 20. TMDL Allocation for Dickinson Bayou Watershed (in MPN/day) .......................................... 44 Table A-1. Load duration curve calculations for Segment 1104_01............................................................. 56 Table A-2. Load duration curve calculations for Segment 1104_02............................................................. 57 Table B-1. Summary of WWTF and Sanitary Sewer Overflow Discharges in the Tidal Prism Model ...... 66 Table C-1 . Summary of Population Estimates for Dickinson Bayou Watershed ......................................... 70 Table C-2. Summary of Permitted Flows by City ......................................................................................... 71 Table C-3. Per Capita Flow by City ............................................................................................................... 71 Table C-4. Summary of Future Permitted Flows by WWTF ........................................................................ 72 Table C-5. Summary of Future Industrial Water Demands for Dickinson Bayou Watershed ..................... 72 Table C-6. Summary of Permitted Industrial WWTF Discharges in 2050 ................................................... 72
Abbreviations AFO animal feeding operation AU assessment unit BMP best management practice CAFO concentrated animal feeding operation CFR Code of Federal Regulations CFU colony-forming units CFS cubic feet per second dL deciliter DO dissolved oxygen DMR Discharge Monitoring Report EC Escherichia coli FC fecal coliform

Eight Total Maximum Daily Loads for Indicator Bacteria in Dickinson Bayou and Three Tidal Tributaries
Texas Commission on Environmental Quality vi Adopted February 8, 2012
FDC flow duration curve FFA Future Farmers of America FWSD Fresh Water Supply District GIS Geographic Information System HCFCD Harris County Flood Control District HCOEM Harris County Office of Homeland Security and Emergency Management H-GAC Houston-Galveston Area Council I-Plan implementation plan LA load allocation LDC load duration curve m3 cubic meters mL milliliter MGD million gallons per day MOS margin of safety MPN most probable number MS4 municipal separate storm sewer system MUD municipal utility district NOAA National Oceanic and Atmospheric Administration NPDES National Pollutant Discharge Elimination System NPS nonpoint source NRCS USDA Natural Resources Conservation Service NWSO National Weather Service Office OSSF onsite sewage facility SSO sanitary sewer overflow STATSGO State Soil Geographic Database TCEQ Texas Commission on Environmental Quality TAC Texas Administrative Code TMDL total maximum daily load TPDES Texas Pollutant Discharge Elimination System TSSWCB Texas State Soil and Water Conservation Board TWDB Texas Water Development Board EPA United States Environmental Protection Agency USGS United States Geological Survey WCID Water Control and Improvement District WBAN Weather Bureau Army Navy WLA wasteload allocation WQMP Water Quality Management Plan WWTF wastewater treatment facility

Texas Commission on Environmental Quality 1 Adopted February 8, 2012
Eight Total Maximum Daily Loads for Indicator Bacteria
in Dickinson Bayou and its Tributaries Executive Summary This document describes total maximum daily loads (TMDLs) for Dickinson Bayou and its tributaries where concentrations of indicator bacteria exceeded the criteria used to evaluate attainment of contact recreational use for the 2008 Texas Water Quality Inven-tory and 303(d) List. This impairment was first identified in the 1996 Inventory and List for the main stem of Dickinson Bayou, and was expanded in 2002 to include its tributar-ies. Dickinson Bayou is comprised of both tidal and non-tidal waters that drain to Dick-inson Bay and to Galveston Bay.
The Dickinson Bayou watershed encompasses approximately 106 square miles in Galves-ton and Brazoria counties. It includes portions of the cities of Alvin, Dickinson, Manvel, Friendswood, Texas City, and Santa Fe. Almost 40 percent of the watershed was devel-oped as of 2010. Between 2002 and 2008, the amount of developed land has more than doubled due to increased urbanization and increases in population within the water-shed.
As described in the Texas Commission on Environmental Quality’s (TCEQ’s) “2008 Guid-ance for Assessing Texas Surface and Finished Drinking Water Quality Data” (TCEQ 2008b), the TCEQ requires a minimum of 10 samples to assess support of the contact rec-reation use. The preferred indicator bacteria for assessing the use are Escherichia coli (E. coli) in freshwater and Enterococci in tidal water. For this project, E. coli data were used for analysis and modeling to support TMDL development for the segments of Dickinson Bayou above tidal influence. Enterococci data were used for the Dickinson Bayou Tidal segment, Bensons Bayou, Bordons Gully, and Geislers Bayou.
Using the E. coli criteria, when the minimum sample requirement is met, the contact rec-reation use is not supported if:
§ the geometric mean of all E. coli samples exceeds 126 colony forming units (cfu) or most probable number (MPN) per 100 mL (1 dL); and/or
§ individual samples exceed 394 cfu or MPN per dL more than 25 percent of the time.
For the Enterococci criteria, when the minimum sample requirement is met, the contact recreation use is not supported if:
§ the geometric mean of all Enterococci samples exceeds 35 cfu or MPN per dL; and/or
§ individual samples exceed 89 cfu or MPN per dL more than 25 percent of the time.

Eight Total Maximum Daily Loads for Indicator Bacteria in Dickinson Bayou and Three Tidal Tributaries
Texas Commission on Environmental Quality 2 Adopted February 8, 2012
In Dickinson Bayou and its tributaries, elevated levels of bacteria have been observed fre-quently through routine monitoring of the bayou, so that enough information was availa-ble to characterize both wet and dry conditions. More than 760 E. coli samples were col-lected, and the results demonstrate exceedances of the single sample standard 33% of the time. For Enterococci, almost 650 samples were collected; the single sample criterion was exceeded 40% of the time. Geometric means of E. coli ranged from 7 MPN/dL to 711 MPN/dL. Enterococci means ranged from 11 MPN/dL to 321 MPN/dL.
The most probable sources of the bacteria are non-compliant discharges from wastewater treatment facilities, stormwater runoff from permitted storm sewer sources, sanitary sew-er overflows, failing on-site sewage facilities, broken sewer lines, and stormwater runoff from unregulated areas.
For freshwater streams, the allowable pollutant loads were quantified using load duration curve analysis. A mass-balance, tidal-prism model was used for tidal segments. The allo-cations are discussed in the section “TMDL Calculations” and are presented in Table 20.
The wasteload allocation was established as the permitted flow for each wastewater treatment facility times one-half the geometric mean criterion (63 MPN/dL for E. coli and 17.5 MPN/dL for Enterococci). Future growth from existing or new permitted facilities is not limited by these TMDLs as long as the sources do not exceed these concentration lim-its. The assimilative capacity of streams increases as the amount of wastewater flow in-creases. Consequently, increases in wastewater flow allow for increased indicator bacteria loadings at discharge concentrations at or below the permitted limits.
The TMDL calculations in this report will guide determination of the assimilative capacity of the streams under changing conditions, including future growth. Wastewater discharg-es from new or expanded facilities will be evaluated case by case.
Introduction Section 303(d) of the federal Clean Water Act requires all states to identify waters that do not meet, or are not expected to meet, applicable water quality standards. States must de-velop a TMDL for each pollutant that contributes to the impairment of a listed water body. The TCEQ is responsible for ensuring that TMDLs are developed for impaired sur-face waters in Texas.
A TMDL is like a budget—it determines the amount of a particular pollutant that a water body can receive and still meet its applicable water quality standards. Thus, TMDLs are the best possible estimates of the assimilative capacity of the water body for a pollutant under consideration. A TMDL is commonly expressed as a load with units of mass per pe-riod of time, but may be expressed in other ways. TMDLs also estimate how much the pol-lutant load must be reduced in order to achieve water quality standards.
The TMDL Program is a major component of Texas’ overall process for managing the quality of its surface waters. The program addresses impaired or threatened streams, res-ervoirs, lakes, bays, and estuaries (water bodies) in, or bordering on, the state of Texas. The primary objective of the TMDL Program is to restore and maintain the beneficial us-

Eight Total Maximum Daily Loads for Indicator Bacteria in Dickinson Bayou and Three Tidal Tributaries
Texas Commission on Environmental Quality 3 Adopted February 8, 2012
es—such as drinking water supply, recreation, support of aquatic life, or fishing—of im-paired or threatened water bodies.
This TMDL addresses impairments to the contact recreation use due to exceedances of the indicator bacteria criteria in Dickinson Bayou Tidal, Dickinson Bayou Above Tidal, Bensons Bayou, Bordens Bayou, and Giesler Bayou as they appear in the 2008 Texas 303(d) List.
Section 303(d) of the Clean Water Act and the implementing regulations of the U.S. Envi-ronmental Protection Agency (EPA) in Title 40 of the Code of Federal Regulations, Part 130 (40 CFR 130) describe the statutory and regulatory requirements for acceptable TMDLs. The EPA provides further direction in its Guidance for Water Quality-Based De-cisions: The TMDL Process (EPA 1991). This TMDL document has been prepared in ac-cordance with those regulations and guidelines. The segments and assessment units cov-ered by this document were included in the 2008 303(d) List.
The TCEQ must consider certain elements in developing a TMDL. They are described in the following sections of this report:
§ Problem Definition § Endpoint Identification § Source Analysis § Linkage Analysis § Seasonal Variation § Margin of Safety § Pollutant Load Allocation § Public Participation § Implementation and Reasonable Assurance
Upon EPA approval, these TMDLs will become an update to the state’s Water Quality Management Plan (WQMP).
Problem Definition The TCEQ first identified the impairment to the contact recreation use for Dickinson Bay-ou in the 1996 Texas Water Quality Inventory and 303(d) List (1996 Inventory and List). This impairment was expanded in 2002 to include four major tributaries of Dickinson Bayou (i.e., Bensons Bayou, Bordens Gully, Giesler Bayou, and Gum Bayou). These water bodies remained on the 2008 Texas 303(d) List, with the exception of Gum Bayou, which was removed from the 303(d) List in 2006 because more recent data indicated the contact recreation use was supported.
The State of Texas evaluates water bodies at the level of both segments and assessment units. For Dickinson Bayou, two segments are defined: the tidal portion, Segment 1103, and the above-tidal portion, Segment 1104. These segments are further delineated into smaller areas called assessment units. The assessment units for Dickinson Bayou were re-numbered in 2010 to make them consistent with the segment numbering conventions used by the TCEQ (i.e., increasing ordinal rank in an upstream direction). Consequently,

Eight Total Maximum Daily Loads for Indicator Bacteria in Dickinson Bayou and Three Tidal Tributaries
Texas Commission on Environmental Quality 4 Adopted February 8, 2012
the assessment units in Dickinson Bayou Tidal (Segment 1103) in the 2008 Texas Water Quality Inventory and 303(d) List were reported with revised numbers in the Draft 2010 Texas Integrated Report for Clean Water Act Sections 305(b) and 303(d) (formerly the Inventory and List). The assessment units as of 2010 are shown in Figure 1 and summa-rized in Table 1. There are four assessment units within Segment 1103 and two within Segment 1104. Three additional assessment units of tidal tributaries were included in this TMDL project.
Safety of contact recreation is determined using indicator bacteria. For Dickinson Bayou, both E. coli and Enterococci are used. These organisms are fecal bacteria that originate in the intestines of warm-blooded species. While these bacteria do not always cause illness in humans, the EPA has determined that their presence indicates a heightened risk of pathogens (EPA, 1986). Table 1 shows the bacteria criteria assigned to each assessment unit studied during this project. As shown in the table, E. coli are the indicators preferred by the TCEQ for freshwater and Enterococci are used as indicator bacteria for tidal streams.
Figure 1. Dickinson Bayou Watershed Assessment Units

Eight Total Maximum Daily Loads for Indicator Bacteria in Dickinson Bayou and Three Tidal Tributaries
Texas Commission on Environmental Quality 5 Adopted February 8, 2012
Table 1. Summary of Bacteria Standards by Assessment Unit
Description Segment
First Year on 303(d)
List Assessment
Unit Indicator Bacteria
Geometric Mean
Criterion
Single Sample
Maximum Criterion
Dickinson Bayou Tidal 1103 1996 1103_02 Enterococci 35 89
1103 1996 1103_03 Enterococci 35 89
1103 1996 1103_04 Enterococci 35 89
Bensons Bayou 1103A 2002 1103A_01 Enterococci 35 89
Bordens Gully 1103B 2002 1103B_01 Enterococci 35 89
Geisler Bayou 1103C 2002 1103C_01 Enterococci 35 89
Dickinson Bayou Above Tidal 1104 1996 1104_01 E. coli 126 394
1104 1996 1104_02 E. coli 126 394
Prior to 2010, the TCEQ used a binomial method to specify the number of exceedances of the single sample criterion required to determine nonsupport of the contact recreation use. In 2010, the TCEQ revised the Texas Surface Water Quality Standards, eliminating the single sample criterion, thereby limiting assessment of the contact recreation use to the geometric mean criterion. However, as of the date this document was prepared, the 2010 Texas Surface Water Quality Standards had not yet been approved by the EPA. For this reason, both criteria—single sample maximum and geometric mean—have been in-cluded in this TMDL document.
Ambient Concentrations of Indicator Bacteria The locations of the Water Quality Monitoring Stations monitored for bacteria in Dickin-son Bayou are shown in Figure 2. Samples for bacteria have been collected and analyzed in the Dickinson Bayou watershed since the early 1970’s, although until 1999 these data were collected as fecal coliform. E. coli and Enterococci data were collected starting in 1999. Most recent sampling efforts have focused on Enterococci sampling in Segment 1103, where the parameter is the regulatory standard for tidal waters. A summary of the locations and dates when the bacteria data were collected and analyzed through 2008 (which was the most current data available when this TMDL document was prepared) is shown in Tables 2 and 3, for E. coli and Enterococci respectively.
Although an extensive data set of E. coli samples has been collected in Dickinson Bayou, of the 16 stations presented in Table 2, only 11 have been sampled, on a routine basis, since 2003. Station 11466 was sampled in 2008 as part of a special source investigation associated with this TMDL. Only two stations in the watershed had E. coli samples be-yond 2004 at the time of TMDL preparation—11467 and 11434 (Table 2). Geometric mean concentrations ranged from 7 MPN/dL at station 11472, where only two samples have been collected, to 711 MPN/dL at station 16469. It is important to note that, per TCEQ guidance, a minimum of 10 samples are necessary to calculate a geometric mean for as-

Eight Total Maximum Daily Loads for Indicator Bacteria in Dickinson Bayou and Three Tidal Tributaries
Texas Commission on Environmental Quality 6 Adopted February 8, 2012
sessment purposes. Thus, stations in Table 2 with less than 10 samples are included for illustrative purposes only.
Minimum concentrations of E. coli were typically below the detection limit, with the max-imum concentrations reaching 24,192/dL at station 11467. Exceedances of the single sample criterion were observed 69% of the time at station 16469, which was also the high-est percent exceedance of all stations.
Enterococci were sampled at 15 stations in the watershed. A summary of Enterococci data is presented in Table 3. Minimum Enterococci concentrations were below one MPN/dL, while maximum concentrations were reported up to 25,200 MPN/dL at station 11462. The geometric means in the watershed range from 11 MPN/dL at station 11455 to 321 MPN/dL at station 11465. Single-sample criterion exceedances were as high as 92% at sta-tion 11467.
Figure 2. Water Quality Monitoring Station Locations

Table 2. Summary of Criteria and Water Quality Data – E. coli
Station ID Description
Assessment Unit
No. of Samples
Percent > 394
MPN/dL Date Range2 Min.
(MPN/ dL) Max.
(MPN/ dL)
Geometric3 Mean
(MPN/dL)
11455 Dickinson Bayou Tidal at SH146 1103_011 43 12% 3/9/99 - 12/13/02 <10 5,000 45
11460 Dickinson Bayou at SH3 1103_021 110 27% 3/9/99 - 2/5/03 <5 16,000 188
11461 Dickinson Bayou Tidal at Benson Bayou Confluence 1103_021 44 34% 7/10/00 - 5/17/01 <20 16,000 252
11462 Dickinson Bayou Tidal at IH45 1103_021 88 27% 3/9/99 - 4/10/03 <5 16,000 200
16679 Dickinson Bayou Tidal at Mariners Mooring 1103_021 43 23% 3/9/99 - 2/5/03 <5 16,000 122
16979 Dickinson Bayou Near Gum Bayou 1103_021 42 33% 7/10/00 - 5/17/01 <20 16,000 144
11434 Cedar Creek at FM517 1103_041 26 19% 12/10/01 - 8/21/06 <5 1,300 123
11464 Dickinson Bayou Tidal Near Arcadia 1103_041 92 22% 3/9/99 - 12/14/04 <5 16,000 189
16471 Bensons Bayou on Wagon Rd 1103A_011 45 51% 3/9/99 - 4/10/03 <5 24,000 440
16469 Bordens Gulley at FM517 1103B_011 48 69% 3/9/99 - 6/12/03 <5 24,000 711
16470 Geisler Bayou at FM517 Bridge 1103C_011 46 57% 3/9/99 - 4/10/03 <10 24,000 542
11436 Gum Bayou at FM517 1103D_011 44 34% 3/9/99 - 12/13/02 <5 24,000 252
11467 Dickinson Bayou at FM517 1104_02 73 34% 3/9/99 - 3/20/07 <5 24,192 272
11466 Dickinson Bayou at Happy Hollow 1104_02 104 70% 7/9/08 - 11/13/08 250 120,000 4,563
11472 Dickinson Bayou at FM528 1104_01 23 0% 6/12/03 - 8/18/03 <5 10 7
11465 Dickinson Bayou at Jack Beaver 1104_01 19 26% 7/10/00 - 5/17/01 40 9,000 271
1 E. coli samples collected in tidally-influenced segments (1103x_xx) are not used by the TCEQ to assess the contact recreation use (Enterococci are used instead); the tidal E. coli data are included in Table 2 for illustrative purposes.
2 TMDLs determined in February 2010; data are the most current available at that time. 3 Per TCEQ guidance, a minimum of 10 samples are necessary to calculate a geometric mean for assessment purposes. 4Special study data collected at high flow conditions Abbreviations: MPN – most probable number; dL – deciliter

Table 3. Summary of Criteria and Water Quality Data – Enterococci
Station ID Description
Assessment Unit
No. of Samples
Percent > 89
MPN/dL
Date Range2 Min.
(MPN/ dL) Max.
(MPN/ dL)
Geometric Mean3
(MPN/dL)
11455 Dickinson Bayou Tidal at SH146 1103_01 42 10% 3/9/99 - 8/22/06 <1 12,900 11
11460 Dickinson Bayou at SH 3 1103_02 121 28% 3/9/99 - 3/20/07 <1 18,300 40
11461 Dickinson Bayou Tidal at Benson Bayou Confluence 1103_02 44 52% 7/10/00 - 5/17/01 <1 18,600 110
11462 Dickinson Bayou Tidal at IH45 1103_02 82 29% 3/9/99 - 8/21/06 <1 25,200 60
16679 Dickinson Bayou Tidal at Mariners Mooring 1103_02 26 15% 3/9/99 - 8/18/03 <2 8,000 12
16979 Dickinson Bayou near Gum Bayou 1103_02 43 30% 7/10/00 - 5/17/01 <2 6,720 31
11434 Cedar Creek at FM 517 1103_04 12,3 0% 11/3/04 - 11/3/04 <1 1 n/a
11464 Dickinson Bayou Tidal near Arcadia 1103_04 85 61% 3/9/99 - 3/20/07 6 12,100 130
16471 Bensons Bayou on Wagon Rd 1103A_01 40 30% 3/9/99 - 8/22/06 <1 10,400 53
16469 Bordens Gulley at FM517 1103B_01 38 74% 3/9/99 - 8/22/06 <10 12,800 240
16470 Geisler Bayou at FM517 Bridge 1103C_01 38 42% 3/9/99 - 8/22/06 6 10,100 86
11436 Gum Bayou at FM 517 1103D_01 41 17% 3/9/99 - 8/22/06 <2 11,000 33
11467 Dickinson Bayou at FM 517 1104_021 26 92% 3/9/99 - 11/3/04 <1 8,200 310
11466 Dickinson Bayou at Happy Hollow 1104_021 104 100% 7/9/08 - 11/13/08 94 92,000 6,634
11465 Dickinson Bayou at Jack Beaver 1104_011 22 86% 7/10/00 - 5/17/01 <2 9,500 321
1 Enterococci samples collected in fresh water segments (1104_xx) are not used by the TCEQ to assess the contact recreation use (E. coli are used instead); they are included in Table 3 for illustrative purpose.
2 TMDLs determined in February 2010; data were the most current available at that time. 3 Per TCEQ guidance, a minimum of 10 samples are necessary to calculate a geometric mean for assessment purposes. 4Special study data collected at high flow conditions Abbreviations: MPN – most probable number; dL – deciliter

Eight Total Maximum Daily Loads for Indicator Bacteria in Dickinson Bayou and Three Tidal Tributaries
Texas Commission on Environmental Quality 9 Adopted February 8, 2012
Watershed Overview Dickinson Bayou is comprised of tidal and non-tidal waters that drain to Dickinson Bay, and, subsequently to Galveston Bay. The bayou is divided into two classified segments by the TCEQ: the above-tidal segment, 1104, and the tidal segment, 1103. Segment 1104 is approximately 14.8 miles long and Segment 1103 is 6.9 miles long. Three main tributaries of interest drain into the bayou:
§ Bensons Bayou, approximately 2.5 miles long and comprises Assessment Unit 1103A_01;
§ Bordens Bayou (or Gully), approximately 2.4 miles long and comprises Assessment Unit 1103B_01; and
§ Giesler Bayou, approximately 1.9 miles long and comprises Assessment Unit 1103C_01.
Gum Bayou is also a tributary of Dickinson Bayou but was not listed as impaired on the 2008 303(d) List. Gum Bayou descriptions are included in this report for completeness.
The Dickinson Bayou watershed spans over 100 square miles and includes several differ-ent political boundaries. About a third of the upper segment lies in Brazoria County; its subwatershed comprises approximately one percent of the total county area. The remain-ing portion of Dickinson Bayou is in Galveston County and its subwatershed encom-passes approximately 11 percent of the total county area.
County population and population density estimates from the Texas State Demographer’s Office (2008) are shown in Table 4. Although the counties have comparable populations, the population density of Galveston County is more than three times greater than that of Brazoria County. The populations of both counties are expected to continue increasing.
Table 4. County Population and Density
County Name 2000
U. S. Census
2000 Population Density (per square mile)
2008 Texas State Demo-graphic Projections
2008 Population Density (per square mile)
Brazoria 241,767 174 296,691 214
Galveston 250,158 627 288,239 722
Several cities have their jurisdictions at least partially within the watershed. These cities include Manvel, League City, Alvin, Friendswood, Dickinson, Texas City, and Santa Fe. These cities are projected to grow by an average of 28% between 2000 and 2050, accord-ing to the Texas Water Development Board (TWDB, 2006), as shown in Table 5. The City of Dickinson and League City are projected to have the largest growth, with an increase of 46% and 49% respectively. No growth, or only limited growth, is expected for Manvel.

Eight Total Maximum Daily Loads for Indicator Bacteria in Dickinson Bayou and Three Tidal Tributaries
Texas Commission on Environmental Quality 10 Adopted February 8, 2012
Table 5. Dickinson Bayou Watershed Population Increases by City, 2000 to 2050
City 2000
U. S. Census 2010
Population Estimate 2050
Population Estimate Percent Increase
(2000-2050)
Alvin 21,413 23,231 30,375 42%
Dickinson 17,093 19,955 24,921 46%
Friendswood 29,037 32,353 38,107 31%
League City 45,444 53,546 67,613 49%
Manvel 3,046 3,046 3,046 0%
Santa Fe 9,548 10,141 11,170 17%
Texas City 41,521 41,891 42,534 2%
Although extensively urbanized in certain areas, the Dickinson Bayou watershed has a large amount of undeveloped land. It is undergoing rapid development, like many coastal areas. In 2002 and 2008, the Houston-Galveston Area Council (H-GAC) performed land use/land cover studies across the watershed area (H-GAC 2002, 2008). These data were used to characterize land use in the project area as shown in Table 6 and Figure 3.
Based on the most recent data from 2008, a major portion of the watershed is developed land, which comprises approximately 39% of the area. Low intensity development is the most prevalent. Cultivated land accounts for approximately 26% of the area, while grass-land/shrub comprises 16%. Woody wetland accounts for 8%, and forest, herbaceous wet-land, bare/transitional land, and open water collectively total less than 11%.
The most prevalent land uses in 2002, grassland/shrub and forest, have seen sharp de-clines during the six year period of 2002-2008. Only about one-third of the grass-land/shrub area remains, and only 10% of the forest land. Between 2002 and 2008, the amount of developed land had more than doubled due to increased urbanization and ris-ing population within the watershed. High intensity development decreased from 2002 to 2008. A significant increase in cultivated land is also seen, rising to nearly 26% of the wa-tershed from only 6% in 2002.
Between 2002 and 2008, the land use categories used by the H-GAC were slightly altered, and “Open Space Developed” was added as a tenth category. This new categorization could cause a change in land classification, resulting in a shift of some categories rather than demonstrating noteworthy changes in classifications.
The climate of the Dickinson Bayou watershed is humid subtropical, with typical average temperatures ranging from 52.9○F in January to 83.3○F in August (NCDC, 2002). There is one rainfall gage associated with the National Weather Service that is located in the cen-tral portion of the watershed. Between 1999 and 2006, typical annual rainfall totals for this gage ranged from 37.5 to 77.1 inches, with an average rainfall total of 59.5 inches. Pre-cipitation patterns in Dickinson Bayou are typical of a East Texas coastal watershed, with rainfall more frequent in the spring and summer and less in the fall and winter seasons.

Eight Total Maximum Daily Loads for Indicator Bacteria in Dickinson Bayou and Three Tidal Tributaries
Texas Commission on Environmental Quality 11 Adopted February 8, 2012
Like most subtropical coastal areas around the world, the Dickinson Bayou watershed is prone to the effects of hurricanes, which occasionally make landfall in and around Galves-ton Bay. In addition to the physical devastation caused by high winds and heavy rainfall, hurricanes can have lasting effects on water quality, as environmental infrastructure can be damaged and sanitation services disrupted for long periods after these severe weather events occur.
Table 6. Land Use Summary
Land Description 2008 Area
(Square meters) 2008 Percent of
Watershed 2002 Area
(Square meters) 2002 Percent of
Watershed
High Intensity Developed 11,834,969 4.54 17,146,162 6.58
Low Intensity Developed 58,757,752 22.54 22,102,118 8.48
Open Space Developed 32,011,765 12.28 Category Not Used Category Not Used
Cultivated Land 67,542,739 25.91 16,557,521 6.35
Grassland/Shrub 42,543,323 16.32 120,113,565 46.08
Forest 6,517,053 2.50 67,655,898 25.95
Woody wetland 20,776,366 7.97 1,862,587 0.71
Herbaceous Wetland 8,550,374 3.28 5,657,231 2.17
Bare/Transitional Land 5,865,348 2.25 1,909,996 0.73
Open Water 6,282,439 2.41 7,677,050 2.94
Total 260,682,128 100 260,682,128 100
Summary of TMDL Monitoring The TMDL project team collected additional data under an approved Quality Assurance Project Plan to supplement TCEQ monitoring data. A portion of the monitoring effort fo-cused on characterizing the impacts of wastewater treatment facilities (WWTFs) in the watershed, as well as those of a wildlife park (Bayou Wildlife Park), during runoff condi-tions.
The data collected upstream and downstream of Bayou Wildlife Park during two wet weather events are presented in Table 7. As the table demonstrates, the downstream geo-metric mean of the first flush samples is higher than the means observed upstream of the park. Note that because of the high variability in the bacteria data set, the statistical signif-icance of the differences could not be determined.

Figure 3. Land Use Map, Dickinson Bayou (2008 H-GAC Land Use)

Eight Total Maximum Daily Loads for Indicator Bacteria in Dickinson Bayou and Three Tidal Tributaries
Texas Commission on Environmental Quality 13 Adopted February 8, 2012
Table 7. TMDL Wet Weather Monitoring Data for Bayou Wildlife Park
Event Date Site Enterococci (MPN/ dL) E. coli (MPN/ dL)
Event 1 10/7/2008 11467-1* 24,000 2,481
11466-1* 77,010 120,330
11467-2 38,730 17,329
11466-2 18,600 1,553
Event 2 11/10/2008 11467-1* NA 2,419
11466-1* 16,070 19,863
11/11/2008 11467-2 NA 17,329
11466-2 12,997 17,329
11467-3 NA 15,531
11466-3 92,080 12,997
11/12/2008 11466-4 23,100 10,462
11467-4 NA 6,131
11/13/2008 11467-5 NA 1,553
11466-5 5,172 1,553
Geometric Mean - First Flush
10/7/2008 - 11/13/2008
11467 upstream of park
4,221 2,450
10/7/2008 - 11/13/2008
11466 downstream of park
13,662 45,664
* First flush sample
Data from monitoring at the WWTFs are shown in Table 8. The WWTF monitoring fo-cused on collecting samples during dry weather at the facility outfall, to minimize effects of infiltration and inflow on facility treatment capabilities. In addition, WWTF effluent for accessible facilities in the watershed was monitored, as were bacteria levels upstream and downstream of the effluent discharge location (when flow was present).
As shown in Table 8, E. coli levels downstream of the facilities ranged from 74 MPN/dL (at the Galveston County Water Control and Improvement District No.1 facility) to 866 MPN/dL (at the Pine Colony facility). Enterococci concentrations were noted to be 30 MPN/dL downstream of the Galveston County WCID No.1 facility. Effluent concentra-tions ranged from 155,310 MPN/dl measured at Pine Colony to greater than 241,920 MPN/dL at Meadowlands, demonstrating that these facilities were not adequately disin-fecting effluent at the time of sample collection.
The Pine Colony facility was monitored again one month later. During the second visit, high levels of bacteria were still noted in the effluent and levels downstream of the efflu-ent discharge point were measured at 866 MPN/dL. These data suggest that some

Eight Total Maximum Daily Loads for Indicator Bacteria in Dickinson Bayou and Three Tidal Tributaries
Texas Commission on Environmental Quality 14 Adopted February 8, 2012
WWTFs can contribute significant bacteria loading to Dickinson Bayou; however, this is not true for all WWTFs in the watershed (e.g., Galveston County WCID No. 1). A list of WWTFs in the Dickinson Bayou watershed is provided in Table 9.
Both the Pine Colony and Meadowland Utilities facilities were assessed penalties in 2009 and 2010 by the TCEQ for effluent violations and other non-compliance issues. Addition-ally, the TCEQ’s Small Business and Local Government Assistance Section and Texas AgriLife are working closely with the owners of these facilities to develop a plan for long-term compliance with their respective permit effluent limits.
Table 8. TMDL-Collected Monitoring Data for WWTFs
Date Assess-
ment Unit Facility Name Location Enterococci
(MPN/ 100ml) E. coli
(MPN/ 100ml)
7/21/2008 1103_02 Galveston County WCID No. 1a Upstream 30 34
Downstream 30 74
7/21/2008 1104_02 Pine Colony b Effluent 141,360 241,920
8/27/2008 1104_02 Meadowland b Effluent NA d >241,920
8/27/2008 1104_02 Pine Colony c Effluent NA d 155,310
Downstream NA d 866
a Effluent pipe submerged b no upstream or downstream flow present c no upstream flow present d Enterococci data were not collected on this date
Endpoint Identification TMDLs must identify a quantifiable water quality target that indicates the desired condi-tion and provides a measurable goal for the TMDL. The TMDL endpoint also serves to fo-cus the technical work and as a criterion against which to evaluate future conditions.
The endpoint for the two freshwater assessment units of Dickinson Bayou covered in this report is concentrations of E. coli below the geometric mean criterion of 126 MPN/100mL. The endpoint for the three tidal tributaries and the three tidal assessment units of Dickinson Bayou is concentrations of Enterococci below the geometric mean cri-terion of 35 MPN/100 mL.
Source Analysis Pollutants may come from several sources, both point and nonpoint. “Point source” pollu-tion comes from a single definable point, such as a pipe, and is regulated by permit under the Texas Pollutant Discharge Elimination System (TPDES). Wastewater and stormwater discharges from industries, construction, and the separate storm sewer systems of cities are considered point sources of pollution. Nonpoint source (NPS) pollution originates

Eight Total Maximum Daily Loads for Indicator Bacteria in Dickinson Bayou and Three Tidal Tributaries
Texas Commission on Environmental Quality 15 Adopted February 8, 2012
from multiple locations, usually washed into surface waters by rainfall runoff. It is not regulated by permit unless it emanates from an urbanized area.
Table 9. Permitted Wastewater Discharges in the Dickinson Bayou Watershed
Segment Name Assess-
ment Unit TPDES Number
NPDES Number Facility Name
Discharge Type
Permitted Flow (MGD)
Dickinson Bay-ou Above Tidal
1104_01 03416-000 TX0119458 Waste Management of Texas
Groundwater n/a1
1104_02
12935-001 TX0095770 Pine Colony Domestic Wastewater
0.05
13632-001 TX0109886 Meadowland Utility Domestic Wastewater
0.0234
14440-001 TX0125873 Brazoria County MUD No. 24
Domestic Wastewater
0.953
Dickinson Bay-ou Tidal
1103_012 04086-000
TX0117757 Duratherm, Inc. Process Wastewater
n/a2
03749-000 TX0112861 Hillman Shrimp & Oyster Co.
Process Wastewater
0.07
14326-001 TX01247614 Via Bayou RV Park Domestic Wastewater
0.02
03479-000 TX0108367 Sea Lion Technology, Inc.
Stormwater Comingled
with Process Water
n/a1, 3
1103_02 00377-000 TX0003727 Penreco Process Wastewater, Stormwater
0.075
10173-001 TX0023655 Galveston County WCID No. 1
Domestic Wastewater
4.8
1103D_012 14570-001 TX0127248 Marlin Atlantis White, Ltd.
Domestic Wastewater
0.5
1 Permitted for intermittent flow 2 Facilities discharge to segment that is not on the 2008 Texas 303(d) list 3 Located outside the Dickinson Bayou watershed, but discharge goes to Dickinson Bayou Tidal (Segment 1103) Abbreviations: MGD – million gallons per day; MUD – municipal utility district; WCID – water control and im-
provement district
Permitted Sources Point source dischargers in the Dickinson Bayou watershed include domestic and indus-trial WWTFs, municipal solid waste facilities, and regulated stormwater discharges.

Eight Total Maximum Daily Loads for Indicator Bacteria in Dickinson Bayou and Three Tidal Tributaries
Texas Commission on Environmental Quality 16 Adopted February 8, 2012
Wastewater Treatment Facilities As of January 2011, 11 TPDES-permitted WWTFs had the potential to discharge to Dick-inson Bayou. Their permits are described in Table 9 and shown in Figure 4. Of these per-mitted facilities, six are domestic treatment facilities, four treat industrial wastewater or industrial stormwater, and one treats groundwater extracted from a landfill. Only one fa-cility, Galveston County WCID No.1 (TPDES ID 10173-001), has a permitted flow greater than 1 MGD and thus is considered a major facility.
Sanitary Sewer Overflows Sanitary sewer overflows (SSOs) are releases of untreated wastewater, including domestic, commercial, and industrial wastewater and are permit violations that must be addressed by the responsible TPDES permittee. These releases usually occur as the result of a break, stoppage, or exceedance of capacity in the sanitary sewer conveyance system. If not di-rectly discharged into the bayou, the overflows typically drain to the stormwater convey-ance system and are transported to the bayou.
SSOs were reported to the TCEQ only by one permitted entity in the Dickinson Water-shed, Galveston County WCID No.1. The SSO data are summarized by assessment unit in Table 10. SSO locations are presented in Figure 5. There were 28 SSOs reported during the period between May 17, 2002 and September 16, 2008 within the Dickinson Bayou watershed. Flows associated with these SSOs range from 200 gallons to 96,580 gallons. Typical causes for the SSOs included heavy rainfall, infiltration and inflow (I/I), and lift station (LS) malfunction or failure.
To better evaluate the SSOs, the individual events were classified as “wet” or “dry” based on the prior 3-day rainfall in the area. If the 3-day antecedent rainfall was greater than 0.1 inches, the SSO was considered associated with a rainfall event; otherwise, the SSO was considered a dry weather SSO. Two SSOs occurred because of Hurricane Ike in September 2008. These were classified as wet weather SSOs, even though antecedent rainfall condi-tions were consistent with dry weather, because the precipitating cause of the SSO was power failure associated with Hurricane Ike.
Based on the weather classification, the majority of the SSOs reported by Galveston Coun-ty are those associated with wet weather conditions. However, dry weather SSOs may also affect bayou water quality, especially during “base flow” situations. For the impaired as-sessment units addressed in this TMDL document, SSOs were only reported in Assess-ment Units 1103_02, 1103C_01 and 1103A_01.
TPDES-Regulated Stormwater Phase II of the National Pollutant Discharge Elimination System (NPDES) stormwater program was implemented in 1999. This program requires regulated small Municipal Separate Storm Sewer System (MS4) discharges in urbanized areas, as well as small MS4s outside the urbanized areas that are designated by the permitting authority, to obtain NPDES coverage for their stormwater discharges. A small MS4 is considered any MS4 not already covered by the Phase I stormwater program. Phase I of the stormwater program addressed urbanized areas with a population greater than 100,000.

Eight Total Maximum Daily Loads for Indicator Bacteria in Dickinson Bayou and Three Tidal Tributaries
Texas Commission on Environmental Quality 17 Adopted February 8, 2012
In the Dickinson Bayou watershed, eight Phase II MS4 permittees are covered under the TPDES general permit. These are shown in Table 11 and the permitted regions associated with them are shown in Figure 6. The permittees include three cities, one county, and four drainage districts. Note that only certain portions of the Dickinson Bayou watershed are covered by urbanized areas (UA) as designated by the EPA. Only the areas of the water-shed designated as UAs are subject to MS4 stormwater permits.
Figure 4. TPDES-Permitted Facilities in the Dickinson Bayou Watershed
Table 10. Summary of Sanitary Sewer Discharges in the Dickinson Bayou Watershed
Assess-ment Unit
Wet Weather
Overflows
Dry Weather
Overflows Date of
Minimum Date of
Maximum
Min. Amount (gallons)
Max. Amount (gallons)
Total Gallons
1103_02 16 5 5/17/02 9/16/08 200 96,580 362,200
1103A_01 2 4 10/30/02 3/14/07 500 9,000 24,200
1103C_01 0 1 9/24/06 9/24/06 500 500 500

Eight Total Maximum Daily Loads for Indicator Bacteria in Dickinson Bayou and Three Tidal Tributaries
Texas Commission on Environmental Quality 18 Adopted February 8, 2012
Figure 5. Sanitary Sewer Overflows in Dickinson Bayou Watershed Table 11. Stormwater Permittees in Dickinson Bayou Watershed
Permit Num-ber Permittee Area (acres)
TXR040148 Brazoria County Conservation and Reclamation No. 3 9,462
TXR040271 City of Dickinson 4,158
TXR040249 City of League City 14,435
TXR040024 City of Texas City 4,631
TXR040364 Galveston County 5,494
TXR040067 Galveston County Consolidated Drainage District 6,022
TXR040203 Galveston County Drainage District No. 1 18,547
TXR040203 Galveston Country Drainage District No. 2 5,448

Eight Total Maximum Daily Loads for Indicator Bacteria in Dickinson Bayou and Three Tidal Tributaries
Texas Commission on Environmental Quality 19 Adopted February 8, 2012
Figure 6. MS4 Permitted Regions in Dickinson Bayou Watershed
Illicit Discharges Bacteria loads from stormwater can enter streams from permitted outfalls and illicit dis-charges under both dry and wet weather conditions. The term “illicit discharge” is defined in EPA’s Phase II stormwater regulations as “any discharge to a municipal separate storm sewer that is not composed entirely of stormwater, except discharges pursuant to an NPDES permit and discharges resulting from fire-fighting activities” (NEIWPCC 2003).
Dry weather discharges might include allowable discharges such as runoff from lawn wa-tering in addition to illicit discharges. Illicit discharges are categorized as either direct or indirect contributions. Examples identified in the Illicit Discharge Detection and Elimi-nation Manual: A Handbook for Municipalities (NEIWPCC 2003) include:
Direct illicit discharges:
§ sanitary wastewater piping that is directly connected from a home to the storm sewer;
§ materials (e.g., used motor oil) that have been dumped illegally into a storm drain catch basin;

Eight Total Maximum Daily Loads for Indicator Bacteria in Dickinson Bayou and Three Tidal Tributaries
Texas Commission on Environmental Quality 20 Adopted February 8, 2012
§ a shop floor drain that is connected to the storm sewer; and § a cross-connection between the municipal sewer and storm sewer systems.
Indirect illicit discharges:
§ an old and damaged sanitary sewer line that is leaking fluids into a cracked storm sewer line; and
§ a failing septic system that is leaking into a cracked storm sewer line or causing surface discharge into the storm sewer.
As part of this TMDL project, stormwater outfall locations were inspected during dry weather conditions to identify illicit discharges. Eleven outfalls were noted for illicit dis-charges during the reconnaissance survey. Eight of these were submerged or partially submerged, preventing an assessment of dry weather discharges. The remaining three outfalls did not exhibit dry weather discharges on the day of the survey. Investigation of illicit discharges to Dickinson Bayou continues under the requirements of the Phase II TPDES Stormwater Management Program for each individual permit holder.
Unregulated Sources Nonpoint source (NPS) loading enters waterways through distributed, nonspecific loca-tions, and is not regulated. Nonpoint sources may include urban runoff not covered by a permit as well as failing on-site sewage facilities (OSSFs), unregulated agricultural activi-ties, wildlife and domesticated animals.
On-Site Sewage Facilities Failing OSSFs can be a source of fecal pathogens and indicator bacteria loading to streams and rivers. Indicator bacteria loading from failing OSSFs can be transported to streams in a variety of ways, including runoff from surface discharge or from transport by storm-water runoff. While most septic systems are located outside city and drainage district boundaries, there are several older neighborhoods in the Dickinson Bayou watershed that remain on septic systems. It is important to note that malfunctioning septic systems are unauthorized discharges—not unregulated sources.
The number of OSSFs in the sub-watersheds associated with each assessment unit was determined based on the following information: (1) a survey of OSSF permits in the great-er Houston-Galveston area conducted by H-GAC in 2008-2009, (2) OSSF estimates de-rived from 1990 Census data, and permitted septic systems reported in the On-line Activi-ty Reporting System (OARS) reported between 1991 and 2008. The H-GAC dataset was supplemented with data from the 1990 census and OARS to reflect the estimated total number of OSSFs installed and permitted in the watershed between 1990 and 2010. These OSSFs are shown in Figure 7 and summarized in Table 12. A failure rate of 25% was ap-plied to OSSFs newer than the year 2000 and 35% was applied for OSSFs older than 2000. Based on these calculations, a total of 1,546 failing OSSFs were estimated for the entire Dickinson Bayou watershed as of 2010.

Figure 7. On-Site Sewage Facilities in Dickinson Bayou Watershed

Eight Total Maximum Daily Loads for Indicator Bacteria in Dickinson Bayou and Three Tidal Tributaries
Texas Commission on Environmental Quality 22 Adopted February 8, 2012
Table 12. Estimated Number of Failing OSSFs by Assessment Unit
Assessment Unit Number of OSSFs
Estimated Number of
Failing OSSFs
1103_01 155 49
1103_02 973 310
1103_03 13 4
1103_04 1,495 476
1103A_01 48 15
1103B_01 51 16
1103C_01 44 14
1104_01 754 240
1104_02 1,324 422
Livestock Contributions Livestock can be a source of bacteria to surface water bodies. The United States Depart-ment of Agriculture (USDA) conducts a county-level Census of Agriculture every 5 years and these data provided the basis of the livestock population estimates used in this TMDL study (USDA, 2002). Using 2005 land use maps from the Multi-Resolution Land Charac-teristics Consortium (MRLC), the total area of pastureland was calculated in the water-shed, as well as for Brazoria and Galveston County. The number of animals per unit area of pasture and grassland for Brazoria and Galveston Counties was determined and ap-plied to the area of the pastureland and grassland in the watershed within the respective counties. This produced the livestock population estimates used for the study area.
Livestock population estimates are listed in Table 13a. As the table shows, a direct com-parison of per capita numbers indicates the largest livestock animal type is poultry, specif-ically those kept for egg laying (i.e., layers). Cattle and calves, followed by horses and po-nies, make up the next largest per capita animal types. However, a per capita comparison of animal types has limited utility. It is more useful to convert per capita numbers into an-imal units using animal unit equivalents, which are simply the animal population num-bers multiplied by the ratio of the mean animal weights for each animal type to the mean weight of cattle (Animal Equivalents = Animal Population * Mean Animal Weight / Mean Weight of Cattle).
Using this method, cattle make up about 63% of animal units in the watershed with hors-es another 26% of animal units; all 7 poultry types combined only make up less than 1% of animal units in the watershed. The subwatershed for Assessment Unit 1104_02 was esti-mated to have the highest number of livestock (per capita and in animal units), with the dominant per capita animal being layers (i.e., chickens) and the dominant type by animal units being cattle. The animal equivalent estimates are included in Table 13b.

Eight Total Maximum Daily Loads for Indicator Bacteria in Dickinson Bayou and Three Tidal Tributaries
Texas Commission on Environmental Quality 23 Adopted February 8, 2012
While the overall largest per capita livestock animal type is poultry layers, it is important to note that TCEQ concentrated animal feeding operation (CAFO) permit records and Texas State Soil and Water Conservation Board (TSSWCB) Water Quality Management Plan records do not show there are any poultry animal feeding operations, (AFOs)/CAFOs in Galveston or Brazoria Counties. As such, it is reasonable to conclude that all of the poultry identified in Table 13a (7 different types) are associated with “backyard” poultry and egg producing operations. These types of operations fill niche markets not serviced by the large-scale commercial poultry industry and include efforts by hobby/pet enthusiasts, 4-H and FFA programs, farmers markets and small organic free-range producers, heir-loom/heritage breeders, and producers that sell to cultural/ethnic markets.
Fecal coliform loadings from livestock were calculated based on estimates from literature sources, including EPA (2000), American Society of Agricultural Engineers (1998, 2003), Zeckoski et al. (2005), and Benham et al. (2005). The resulting fecal coliform values were converted to E. coli values using a conversion factor based on the criteria found in the Texas Surface Water Quality Standards (126 MPN/dL to 200 cfu/dL). Table 13c shows the estimated number of fecal coliform (cfu) generated per day per animal type.
The precision of these bacteria estimates is dependent on the accuracy of the information available, which is often collected at the county level, and on the assumptions necessary to derive estimates at the watershed level. The information, nevertheless demonstrates that livestock is a potential source of bacteria in the Dickinson Bayou watershed.
Table 13a. Livestock Population Estimates by Assessment Unit
Type of Animal 1103_02 1103_03 1103_04 1103A_01 1103B_01 1103C_01 1104_01 1104_02
Total Animals
Cattle and Calves
350 15 394 35 22 78 283 788 1,965
Layers 596 25 671 60 37 132 482 1,343 3,346
Horses and Ponies
143 6 161 14 9 32 115 322 802
Goats 104 4 117 11 7 23 84 235 585
Hogs and Pigs
37 2 41 4 2 8 30 83 207
Sheep and Lambs
14 1 16 1 1 3 12 32 80
Pullets 52 2 58 5 3 11 42 116 289
Broilers 10 0 11 1 1 2 8 22 55
Turkeys 12 1 14 1 1 3 10 27 69
Ducks 17 1 19 2 1 4 14 38 96
Geese 6 0 7 1 0 1 5 13 33
Other Poultry
57 2 64 6 4 13 46 128 320
Bison 4 0 4 0 0 1 3 9 21

Eight Total Maximum Daily Loads for Indicator Bacteria in Dickinson Bayou and Three Tidal Tributaries
Texas Commission on Environmental Quality 24 Adopted February 8, 2012
Type of Animal 1103_02 1103_03 1103_04 1103A_01 1103B_01 1103C_01 1104_01 1104_02
Total Animals
Captive Deer
7 0 7 1 0 1 5 15 36
Donkey 12 1 13 1 1 3 10 27 68
Rabbits 17 1 19 2 1 4 14 38 96
Total Animals 1,438 61 1,616 145 90 319 1,163 3,236 8,068
Table 13b. Livestock Animal Equivalents by Assessment Unit
Type of Animal 1103_02 1103_03 1103_04
1103A_ 01
1103B_ 01
1103C_ 01 1104_01 1104_02
Conver-sion
Factor
Total Animal Equiva-
lents
Cattle and Calves
350 15 394 35 22 78 283 788 1.000 1,965
Layers 2.4 0.1 2.7 0.2 0.1 0.5 1.9 5.3 0.004 13
Horses and Ponies
142 5.9 160 14 9 32 114 319 0.991 795
Goats 15 0.6 16 1.6 1.0 3.2 12 33 0.141 82
Hogs and Pigs
26 1.4 29 2.8 1.4 5.6 21 58 0.698 145
Sheep and Lambs
1 0.1 1 0.1 0.1 0.2 0.7 1.9 0.059 4.8
Pullets 0.4 0 0.4 0.0 0.0 0.1 0.3 0.8 0.007 2.0
Broilers 0.0 0 0 0.0 0.0 0.0 0.0 0.0 0.002 0.1
Turkeys 0.2 0 0.2 0.0 0.0 0.0 0.1 0.4 0.015 1.0
Ducks 0.1 0 0.1 0.0 0.0 0.0 0.0 0.1 0.003 0.3
Geese 0.2 0 0.2 0.0 0.0 0.0 0.1 0.4 0.030 1.0
Other Poultry
0.3 0 0.4 0.0 0.0 0.1 0.3 0.7 0.006 1.8
Bison 8.8 0 8.8 0.0 0.0 2.2 6.6 20 2.203 46
Captive Deer 1.9 0 1.9 0.3 0.0 0.3 1.3 4.0 0.264 10
Donkey 6.9 0.6 7.4 0.6 0.6 1.7 5.7 15 0.573 39
Rabbits 0.1 0 0.1 0.0 0.0 0.0 0.1 0.2 0.004 0.4
Total Animal Equivalent
554 24 621 55 34 124 447 1246 - 3,105

Table 13c. Livestock Bacteria by Assessment Unit (Fecal coliform production counts/animal/day)
Type of Animal 1103_02 1103_03 1103_04 1103A_01 1103B_01 1103C_01 1104_01 1104_02
Fecal Coliform
Production E. Coli
Production
Total EC* Produced (MPN/ day)
Cattle and Calves 4.38E+13 1.88E+12 4.93E+13 4.38E+12 2.75E+12 9.75E+12 3.54E+13 9.85E+13 1.25E+11 7.88E+10 1.55E+14
Layers 8.34E+10 3.50E+09 9.39E+10 8.40E+09 5.18E+09 1.85E+10 6.75E+10 1.88E+11 1.40E+08 8.82E+07 2.95E+11
Horses and Ponies 6.01E+10 2.52E+09 6.76E+10 5.88E+09 3.78E+09 1.34E+10 4.83E+10 1.35E+11 4.20E+08 2.65E+08 2.12E+11
Goats 1.25E+12 4.80E+10 1.40E+12 1.32E+11 8.40E+10 2.76E+11 1.01E+12 2.82E+12 1.20E+10 7.56E+09 4.42E+12
Hogs and Pigs 4.00E+11 2.16E+10 4.43E+11 4.32E+10 2.16E+10 8.64E+10 3.24E+11 8.96E+11 1.08E+10 6.80E+09 1.41E+12
Sheep and Lambs 1.68E+11 1.20E+10 1.92E+11 1.20E+10 1.20E+10 3.60E+10 1.44E+11 3.84E+11 1.20E+10 7.56E+09 6.05E+11
Pullets 1.35E+10 5.19E+08 1.50E+10 1.30E+09 7.78E+08 2.85E+09 1.09E+10 3.01E+10 2.59E+08 1.63E+08 4.72E+10
Broilers 8.90E+08 0.00E+00 9.79E+08 8.90E+07 8.90E+07 1.78E+08 7.12E+08 1.96E+09 8.90E+07 5.61E+07 3.08E+09
Turkeys 1.12E+09 9.30E+07 1.30E+09 9.30E+07 9.30E+07 2.79E+08 9.30E+08 2.51E+09 9.30E+07 5.86E+07 4.04E+09
Ducks 4.13E+10 2.43E+09 4.62E+10 4.86E+09 2.43E+09 9.72E+09 3.40E+10 9.23E+10 2.43E+09 1.53E+09 1.47E+11
Geese 2.94E+11 0.00E+00 3.43E+11 4.90E+10 0.00E+00 4.90E+10 2.45E+11 6.37E+11 4.90E+10 3.09E+10 1.02E+12
Other Poultry 7.75E+09 2.72E+08 8.70E+09 8.16E+08 5.44E+08 1.77E+09 6.26E+09 1.74E+10 1.36E+08 8.57E+07 2.74E+10
Bison 5.00E+11 0.00E+00 5.00E+11 0.00E+00 0.00E+00 1.25E+11 3.75E+11 1.13E+12 1.25E+11 7.88E+10 1.65E+12
Captive Deer 3.50E+09 0.00E+00 3.50E+09 5.00E+08 0.00E+00 5.00E+08 2.50E+09 7.50E+09 5.00E+08 3.15E+08 1.13E+10
Donkey 5.04E+09 4.20E+08 5.46E+09 4.20E+08 4.20E+08 1.26E+09 4.20E+09 1.13E+10 4.20E+08 2.65E+08 1.80E+10
Rabbits 4.13E+10 2.43E+09 4.62E+10 4.86E+09 2.43E+09 9.72E+09 3.40E+10 9.23E+10 2.43E+09 1.53E+09 1.47E+11
Total 4.66E+13 1.97E+12 5.24E+13 4.64E+12 2.88E+12 1.04E+13 3.77E+13 1.05E+14 1.25E+11 7.88E+10 1.65E+14
* EC = E. coli
Eight Total Maximum Daily Loads for Indicator Bacteria in Dickinson Bayou and Three Tidal Tributaries
Texas Commission on Environmental Quality 26 Adopted February 8, 2012
Wildlife and Exotic Animal Contributions Wildlife census figures were not available for the Dickinson Bayou watershed (e.g., from Texas Parks and Wildlife Department). However, an analysis of land use patterns in the watershed suggests wildlife is a probable source of fecal bacteria to Dickinson Bayou, es-pecially in the far western and southeastern portions of the watershed.
The Texas coast serves as a primary breeding ground for myriad species of colonial birds. An aquatic habitat is essential for a complete life cycle of these birds. These species may be a source of bacteria loading to the Dickinson Bayou watershed. Population estimates of colonial water birds in the Dickinson watershed were derived from the Texas Coastal In-teractive Mapping application (National Biological Information Infrastructure, 2011) and include eight species for the Dickinson Bayou watershed.
Wild deer (Odocoileus virginianus texana) are the most numerous big game animal in Texas and the United States (Cook, 1992). The State of Texas has more wild deer than any other state, with state-wide populations ranging from three to four million. Based on the Quality Deer Management Association’s deer density map (2011), Dickinson Bayou water-shed deer populations are estimated to range from less than 15 deer /square mile to 30-45 deer/square mile. These densities are consistent with those reported in the bacteria TMDLs for the Adams Bayou and Cow Bayou Watersheds, which reported 20 to 50 deer per square mile in that TMDL study area.
Invasive and exotic animals have also been identified in the Dickinson Bayou watershed. The following discusses several of the key invasive and exotic species in the watershed. Feral hogs (Sus scrofa) are a nuisance species with populations of more than 2 million across Texas, about 50 percent of all feral hogs in the United States. Feral hog populations have expanded dramatically because of their adaptability and high reproductive rate (Mapston, 2004).
The Texas Agrilife Extension Service has an ongoing Feral Hog Abatement Program that aims to reduce the population of feral hogs primarily through trapping programs. Feral hog population estimates are available for Brazoria and Galveston Counties from the USDA’s National Agricultural Statistics Service for the year 2002. For this TMDL study, the total population of feral hogs was divided by the area of the counties to yield a density of 1.49 per square mile. Estimates for Dickinson Bayou watershed were estimated by mul-tiplying the feral hog density by the subwatershed area of each assessment unit.
Nutria (Myocastor coypus) are large South American rodents that were imported in 1899 for fur production. Nutria are known to reside in coastal areas from Texas to Delaware and can be observed in the forested riparian zones upstream and downstream of urban-ized areas in the Dickinson Bayou watershed. A TMDL study for fecal coliform bacteria conducted in Terrebonne Basin, Louisiana identified nutria as a significant source of fecal coliform to Bayou Pointe au Chien (subsegment 120605) and Lost Lake/Four League Bay (subsegment 120708) (EPA 2007), however no estimates on nutria population or their fecal coliform production are available for the Dickinson Bayou watershed.

Eight Total Maximum Daily Loads for Indicator Bacteria in Dickinson Bayou and Three Tidal Tributaries
Texas Commission on Environmental Quality 27 Adopted February 8, 2012
Capybara (Hydrochoerus hydrochaeris) is a large South American rodent and is primari-ly a grazer with a digestive capacity similar to that of a sheep. These rodents are believed to have once escaped from a local petting zoo located in the watershed, but have since been recaptured. The presence of capybara in the Dickinson watershed has been reported periodically in the past; however, there is no reliable quantitative source of information about their population, which if existent, is thought to be low. Hence, the contribution of fecal bacteria from capybara was considered negligible in Dickinson Bayou.
Finally, a number of exotic animals are present at the Bayou Wildlife Park, an 81-acre, privately-owned, animal wildlife park located approximately 2.5 miles upstream of the tidal boundary. The preserve receives over 35,000 visitors annually, who tour the facility via specially built trams that drive around the park. The park houses approximately 400 exotic animals, including ostrich, emu, camels, rhinoceros, giraffe, buffalo, zebra, water buffalo, and wildebeest. Exotic animal estimates used in the TMDL analysis were based on animal totals reported during a site visit to the wildlife preserve.
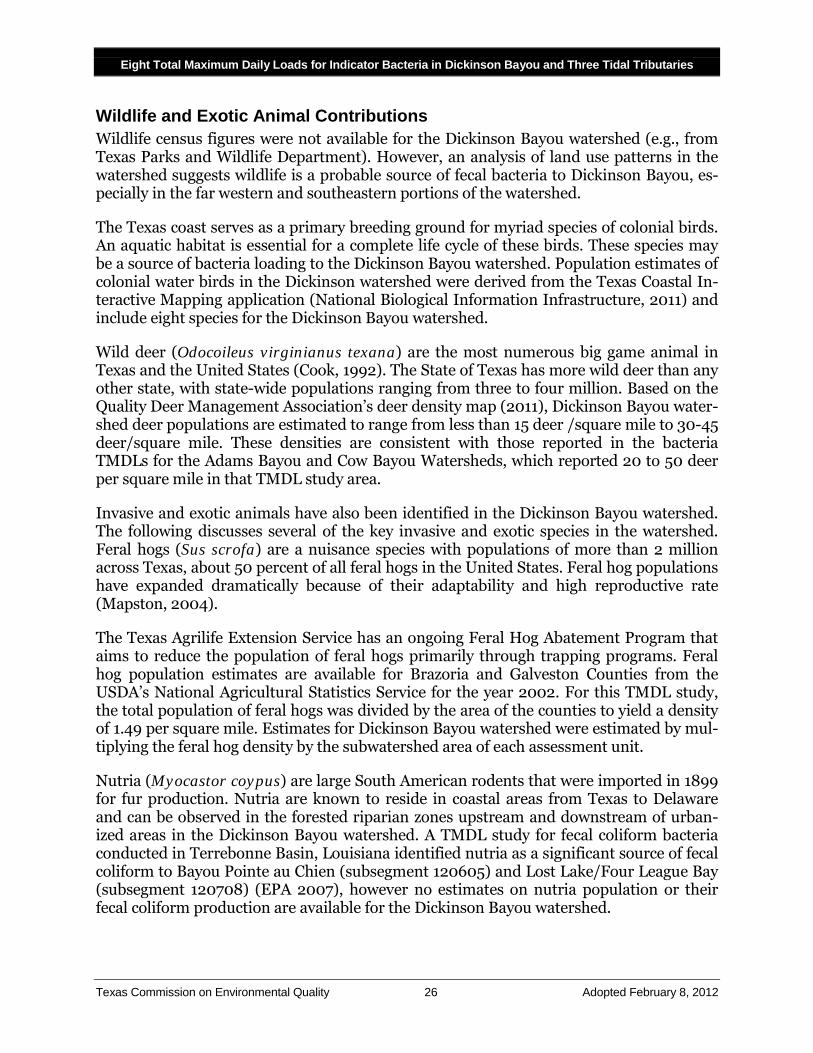
Table 13d shows the estimated number of colonial birds, feral hogs, wild deer, and exotic animals in the subwatersheds associated with each assessment unit. Table 13e shows the amount of E. coli (MPN) generated per day by animal type for each assessment Unit.
Table 13d. Wildlife, Invasive and Exotic Animal Populations by Assessment Unit
Type of Animal 1103_02 1103_03 1103_04 1103A_
01 1103B_
01 1103C_
01 1104_01 1104_02 Total
Animals
Snowy Egret 10 1 12 3 1 2 6 10 45
Tricolored Heron
9 1 12 2 1 2 6 9 42
White Ibis 72 6 89 19 7 13 42 72 320
White-faced Ibis
1 0 1 0 0 0 0 1 3
Brown Pelican 4 0 5 1 0 1 2 4 17
Least Tern 4 0 5 1 0 1 2 4 17
Royal Tern 75 6 92 20 8 13 43 74 331
Sandwich Tern 13 1 16 3 1 2 8 13 57
Wild Deer 392 35 490 122 47 81 290 709 2,166
Feral Hog 31 2 38 8 3 5 18 30 135
Other exotic species
0 0 0 0 0 0 400 0 400
Total Animals 219 17 270 57 21 39 527 217 1,367
Table 13e. Wildlife, Invasive and Exotic Animal Bacteria Production by Assessment Unit
Type of Animal 1103_02 1103_03 1103_04 1103A_01 1103B_01 1103C_01 1104_01 1104_02
FC* Produc-tion (count/ animal/day)
EC* Produc-tion (count/ animal/day)
Total EC* Produced (MPN/ day)
Snowy Egret 1.29E+11 1.00E+10 1.59E+11 3.38E+10 1.31E+10 2.26E+10 7.51E+10 1.28E+11 1.29E+10 8.14E+09 3.59E+11
Tricolored Heron
1.22E+11 9.54E+09 1.51E+11 3.22E+10 1.25E+10 2.15E+10 7.14E+10 1.21E+11 1.29E+10 8.14E+09 3.42E+11
White Ibis 9.33E+11 7.27E+10 1.15E+12 2.45E+11 9.52E+10 1.64E+11 5.44E+11 9.25E+11 1.29E+10 8.14E+09 2.60E+12
White-faced Ibis 6.69E+09 5.21E+08 8.26E+09 1.76E+09 6.83E+08 1.17E+09 3.90E+09 6.63E+09 1.29E+10 8.14E+09 1.87E+10
Brown Pelican 5.25E+10 4.09E+09 6.48E+10 1.38E+10 5.35E+09 9.21E+09 3.06E+10 5.20E+10 1.29E+10 8.14E+09 1.46E+11
Least Tern 5.46E+10 4.26E+09 6.75E+10 1.44E+10 5.57E+09 9.59E+09 3.19E+10 5.41E+10 1.29E+10 8.14E+09 1.52E+11
Royal Tern 9.63E+11 7.50E+10 1.19E+12 2.53E+11 9.82E+10 1.69E+11 5.61E+11 9.54E+11 1.29E+10 8.14E+09 2.68E+12
Sandwich Tern 1.68E+11 1.31E+10 2.08E+11 4.42E+10 1.72E+10 2.95E+10 9.81E+10 1.67E+11 1.29E+10 8.14E+09 4.69E+11
Wild Deer 5.06E+12 4.48E+11 6.33E+12 1.57E+12 6.11E+11 1.05E+12 3.75E+12 9.15E+12 5.00E+08 8.14E+09 1.76E+13
Feral Hog 3.96E+11 3.08E+10 4.89E+11 1.04E+11 4.04E+10 6.95E+10 2.31E+11 3.92E+11 1.08E+10 6.80E+09 1.10E+12
Bayou Wildlife Park
0.00E+00 0.00E+00 0.00E+00 0.00E+00 0.00E+00 0.00E+00 5.17E+12 0.00E+00 1.20E+10 7.56E+09 3.25E+12
Total 2.82E+12 2.20E+11 3.49E+12 7.42E+11 2.88E+11 4.96E+11 6.81E+12 2.80E+12 - - 1.11E+13
* EC = E. coli FC = Fecal Coliform
Table 14a. Domestic Pet Daily E. coli Production by Assessment Unit
Type of Animal AU 1103_02 AU 1103_03 AU 1103_04 1103A_01 1103B_01 1103C_01 1104_01 1104_02
FC* Produc-tion (count/ animal/day)
EC* Produc-tion (count/ animal/day)
Total EC* Produced (MPN/ day)
Dogs 1.21E+12 9.79E+12 1.41E+13 6.18E+12 1.08E+12 2.92E+12 4.58E+12 7.71E+12 3.30E+09 2.08E+09 3.00E+13
Cats 2.24E+11 1.81E+12 2.60E+12 1.14E+12 2.00E+11 5.38E+11 8.46E+11 1.42E+12 5.40E+08 3.40E+08 5.53E+12
Total Pets 1.44E+12 1.16E+13 1.67E+13 7.32E+12 1.28E+12 3.46E+12 5.43E+12 9.14E+12 - - 3.55E+13
* EC = E. coli FC = Fecal Coliform

Eight Total Maximum Daily Loads for Indicator Bacteria in Dickinson Bayou and Three Tidal Tributaries
Texas Commission on Environmental Quality 29 Adopted February 8, 2012
Domestic Pets Domesticated animals and pets, namely dogs and cats, are potential sources of indicator bacteria to Dickinson Bayou. The number of dogs and cats in the study area was estimated by assuming a density of dogs and cats per household, with 0.632 dogs per household and 0.713 cats per household (American Veterinary Medical Association, 2007).
Table 14a shows the amount of E. coli (MPN) generated per day by animal type for each assessment unit. The number of households in the watershed was determined from the US Census housing projections for 2000 at the tract level (US Census, 2000). As shown in Table 14b, the estimated number of dogs ranges from 328 in Assessment Unit 1103B_01 to 4,262 in Assessment Unit 1103_03. For cats, the estimated totals range from 371 in As-sessment Unit 1103B_01 to 4,809 in Assessment Unit 1103_03.
Table 14b. Domestic Pet Populations by Assessment Unit
Type of Animal 1103_02 1103_03 1103_04
1103A_01
1103B_01
1103C_01 1104_01 1104_02
Total Animals
Dogs 368 2,966 4,262 1,872 328 884 1,389 2,337 14,406
Cats 415 3,347 4,809 2,112 371 997 1,567 2,637 16,255
Total Pets 783 6,312 9.071 3.984 699 1,881 2,956 4,974 30,661
Linkage Analysis Establishing the relationship between instream water quality and the sources of pollutant loadings is an important component in developing a TMDL. This component allows for the evaluation of management options that will achieve the desired endpoint. The rela-tionship may be established through a variety of techniques.
In the case of Dickinson Bayou, two methods were used for establishing the relationship between instream water quality and pollutant source loadings. Load duration curve (LDC) analyses were used to specify loading in Segment 1104 (Dickinson Bayou Above Tidal) while a tidal mass balance model was used in Segments 1103 (Dickinson Bayou Tidal), 1103A (Bensons Bayou), 1103B (Bordens Gully), and 1103C (Giesler Bayou).
Load Duration Curve Analysis LDCs are graphs of the frequency distribution of loads of pollutants in a stream. In the case of these TMDLs, the loads shown are of E. coli bacteria in MPN/day. LDCs are de-rived from Flow Duration Curves (FDC). A detailed discussion of FDCs and LDCs is in-cluded in Appendix A of this document. The LDCs shown in the following figures repre-sent the maximum acceptable load in the stream that will result in the achievement of the TMDL water quality target.
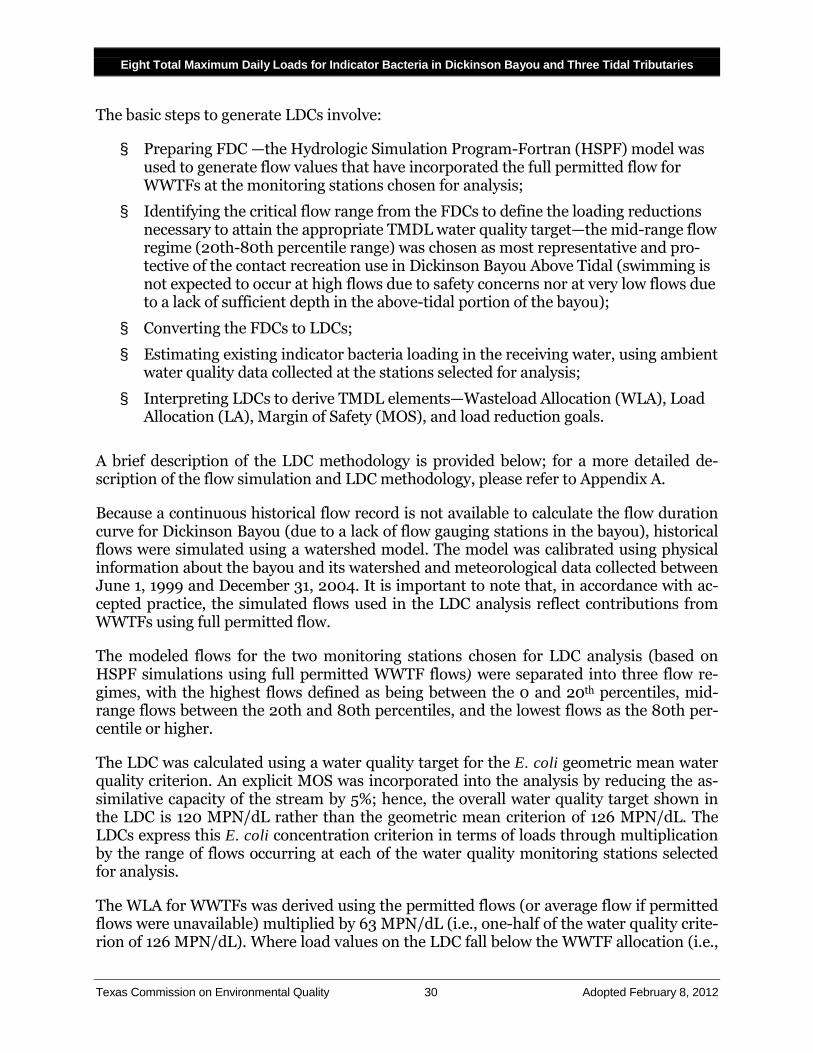
Eight Total Maximum Daily Loads for Indicator Bacteria in Dickinson Bayou and Three Tidal Tributaries
Texas Commission on Environmental Quality 30 Adopted February 8, 2012
The basic steps to generate LDCs involve:
§ Preparing FDC —the Hydrologic Simulation Program-Fortran (HSPF) model was used to generate flow values that have incorporated the full permitted flow for WWTFs at the monitoring stations chosen for analysis;
§ Identifying the critical flow range from the FDCs to define the loading reductions necessary to attain the appropriate TMDL water quality target—the mid-range flow regime (20th-80th percentile range) was chosen as most representative and pro-tective of the contact recreation use in Dickinson Bayou Above Tidal (swimming is not expected to occur at high flows due to safety concerns nor at very low flows due to a lack of sufficient depth in the above-tidal portion of the bayou);
§ Converting the FDCs to LDCs;
§ Estimating existing indicator bacteria loading in the receiving water, using ambient water quality data collected at the stations selected for analysis;
§ Interpreting LDCs to derive TMDL elements—Wasteload Allocation (WLA), Load Allocation (LA), Margin of Safety (MOS), and load reduction goals.
A brief description of the LDC methodology is provided below; for a more detailed de-scription of the flow simulation and LDC methodology, please refer to Appendix A.
Because a continuous historical flow record is not available to calculate the flow duration curve for Dickinson Bayou (due to a lack of flow gauging stations in the bayou), historical flows were simulated using a watershed model. The model was calibrated using physical information about the bayou and its watershed and meteorological data collected between June 1, 1999 and December 31, 2004. It is important to note that, in accordance with ac-cepted practice, the simulated flows used in the LDC analysis reflect contributions from WWTFs using full permitted flow.
The modeled flows for the two monitoring stations chosen for LDC analysis (based on HSPF simulations using full permitted WWTF flows) were separated into three flow re-gimes, with the highest flows defined as being between the 0 and 20th percentiles, mid-range flows between the 20th and 80th percentiles, and the lowest flows as the 80th per-centile or higher.
The LDC was calculated using a water quality target for the E. coli geometric mean water quality criterion. An explicit MOS was incorporated into the analysis by reducing the as-similative capacity of the stream by 5%; hence, the overall water quality target shown in the LDC is 120 MPN/dL rather than the geometric mean criterion of 126 MPN/dL. The LDCs express this E. coli concentration criterion in terms of loads through multiplication by the range of flows occurring at each of the water quality monitoring stations selected for analysis.
The WLA for WWTFs was derived using the permitted flows (or average flow if permitted flows were unavailable) multiplied by 63 MPN/dL (i.e., one-half of the water quality crite-rion of 126 MPN/dL). Where load values on the LDC fall below the WWTF allocation (i.e.,

Eight Total Maximum Daily Loads for Indicator Bacteria in Dickinson Bayou and Three Tidal Tributaries
Texas Commission on Environmental Quality 31 Adopted February 8, 2012
the stream is effluent dominated), the WWTF load is plotted in place of the lower LDC load. Under these conditions, it is assumed that the WWTFs are compliant with permit requirements and, therefore, their discharges will not result in exceedances of the contact recreation use criteria.
Also included on the LDC are observed bacteria loads. To calculate these loads, historical observations of indicator bacteria concentrations (obtained from the TCEQ’s SWQMIS database) were paired with the simulated flow occurring in the stream at the same loca-tion and day the sample was collected. The observed indicator bacteria load is calculated by multiplying the observed indicator bacteria concentration (in MPN/dL) by the simu-lated flow (in cubic feet per second) on the day of sample collection and plotting this value on the LDC with appropriate volumetric and time unit conversions.
Indicator bacteria loads that exceed water quality criteria fall above the LDC line. The medians of the observed loads were calculated for each of the three flow regimes and plot-ted on the LDCs as a dotted red line.
Load Duration Curve Analysis Results The following section provides a summary of LDC analysis results for the two fresh water assessment units in Dickinson Bayou, 1104_01 and 1104_02.
Assessment Unit 1104_01 Shown in Figure 8 is the LDC developed for Assessment Unit 1104_01. The indicator bac-teria data plotted in Figure 8 were obtained from the TCEQ monitoring station located nearest to the outlet of Assessment Unit 1104_01, station 11465 (Dickinson Bayou at Jack Beaver Rd.), using data collected by the TCEQ during routine monitoring from July 10, 2000 through May 17, 2001. More recent data are not available for this station; the TCEQ will resume water quality monitoring at this location in 2011.
One permitted WWTF, TPDES permit number 03416-000 (Waste Management of Tex-as), is included in this segment. Thus, a wasteload allocation (WLA) was included for this facility, which is located near a tributary contributing to the Above Tidal segment of Dick-inson Bayou. Since this facility is permitted to discharge intermittently, with no specific flow limit, the WLA was derived using the average discharge flow multiplied by 63 MPN/dL (i.e., one-half of the water quality criterion of 126 MPN/dL).
The LDC indicates that E. coli concentrations typically exceed the geometric mean water quality criterion in this assessment unit in the high-flow range.
The estimated load reductions, based on a comparison of the observed load and calculated LDC, are presented in Table 15 and range from 0.00+00 under the lowest flow conditions to 1.47E+13 MPN/day under the highest flow condition. These results are in keeping with the most recent assessment of water quality for this assessment unit of Dickinson Bayou, which was delisted for bacteria in the 2010 Texas 303(d) List (TCEQ 2010).

Eight Total Maximum Daily Loads for Indicator Bacteria in Dickinson Bayou and Three Tidal Tributaries
Texas Commission on Environmental Quality 32 Adopted February 8, 2012
Figure 8. Load Duration Curve for E. coli in Assessment Unit 1104_01
Table 15. LDC and Observed Loads for Assessment Unit 1104_01
Flow Condition Median Flow
(cfs) LDC (MPN/day) Observed (MPN/day)
Reduction Required (MPN/day)
>80 Lowest Flow 3.74 1.10E+10 1.01E+10 0.00E+00
20-80 Mid-Range Flows 11.83 3.46E+10 3.90E+10 4.37E+09
<20 Highest Flows 109.49 3.21E+11 1.50E+13 1.47E+13
Assessment Unit 1104_02 The LDC for Assessment Unit 1104_02 is presented in Figure 9. The indicator bacteria data plotted in Figure 9 were obtained from the TCEQ monitoring station located nearest to the outlet of Assessment Unit 1104_02, station 11467 (Dickinson Bayou at FM 517), and includes both data collected by the TCEQ during routine monitoring during the period where simulated flows were available as well as monitoring data collected in support of this TMDL project to encompass monitoring data from June 16, 2001 through December 2, 2008. Three permitted WWTFs, TPDES permit numbers 12935-001, 13632-001 and 14440-001, are included in this assessment unit. Thus, a WLA was included for these fa-cilities in the TMDL for this assessment unit. The WLA was derived using the permitted
1E+06
1E+07
1E+08
1E+09
1E+10
1E+11
1E+12
1E+13
1E+14
1E+15
1E+16
0 20 40 60 80 100
E. co
li Lo
ad (M
PN/d
ay)
Percent of Days Load Exceeded
Observed Data
LDC - 120 MPN/dL
LDC - 375 MPN/dL
WLA-WWTF
Median of Observed Load
1104_01
Highest Flows
Mid-Range Flows Lowest Flows

Eight Total Maximum Daily Loads for Indicator Bacteria in Dickinson Bayou and Three Tidal Tributaries
Texas Commission on Environmental Quality 33 Adopted February 8, 2012
discharge flow multiplied by 63 MPN/dL (i.e., one-half of the water quality criterion of 126 MPN/dL).
Figure 9 indicates that observed E. coli loads are primarily distributed above the LDC in the mid-range and highest flow regimes, indicating that frequent exceedances of the con-tact recreation criterion occur in the mid and high flow conditions.
The estimated load reductions, based on a comparison of the observed load and calculated LDC, are presented in Table 16 and range from 0.00E+00 MPN/day under the lowest flow condition to 4.85E+11MPN/day under the highest flow condition. The mid-range flow was used to calculate the TMDL, as it represents the average conditions in the water-shed and the conditions most likely to support contact recreation.
Figure 9. Load Duration Curve for E. coli in Assessment Unit 1104_02 Table 16. LDC and Observed Loads for Assessment Unit 1104_02
Flow Condition Median Flow
(cfs) LDC
(MPN/day) Observed (MPN/day)
Reduction Required (MPN/day)
>80 Lowest Flow 0.24 2.44E+09 1.95E+09 0.00E+00
20-80 Mid-Range Flows 2.67 7.81E+09 1.42E+10 6.37E+09
<20 Highest Flows 43.35 1.27E+11 6.12E+11 4.85E+11
1E+06
1E+07
1E+08
1E+09
1E+10
1E+11
1E+12
1E+13
1E+14
1E+15
1E+16
0 20 40 60 80 100
E. co
li Lo
ad (M
PN/d
ay)
Percent of Days Load Exceeded
Observed (Station 11467)LDC-120 MPN/dLLDC - 375 MPN/dLWLA-WWTFMedian of Observed Load
1104_02
Highest Flows
Mid-Range Flows Lowest Flows

Eight Total Maximum Daily Loads for Indicator Bacteria in Dickinson Bayou and Three Tidal Tributaries
Texas Commission on Environmental Quality 34 Adopted February 8, 2012
Mass Balance Analysis – Tidal Prism Model Tidal prism models, or box models, are one-dimensional steady-state receiving water models that utilize the concept of “tidal flushing” to simulate the physical transport of pol-lutants in a tidal basin over time. The theory of tidal flushing was originally developed by Ketchum (1951). Several tidal prism models have been developed and refined to apply the concept towards water quality modeling of a variety of constituents, including bacteria (Kuo et al, 1988; Shen et al., 2005; Kuo et al., 2005). Tidal prism models, in conjunction with a watershed model, have also been successfully used for bacteria and nutrient TMDLs for coastal embayments in Virginia and North Carolina (Kuo et al, 1988; Shen et al., 2005; Kuo et al., 2005; Wang et al., 2005).
To simulate Enterococci in the tidal portion of the watershed, a time-variable tidal prism box model was developed using Microsoft Excel. The period of June 1, 1999 through No-vember 5, 2001 was used for the TMDL calculations presented in this document. A con-ceptual model of the tidal prism box model is shown in Figure 10. In general, the mass balance for a bayou segment can be defined as the difference between: 1) the storage with-in the bayou segment, along with any additional flow and load contributed from upstream segments, and 2) the load that results from flow and tidal exchange with downstream segments. The mass balance also accounts for inputs of bacteria and flow from watershed runoff, WWTFs and SSOs. Die-off and tidal exchange represent the two potential sinks of Enterococci in the tidal prism model.
Figure 10. Conceptual Model for Enterococci in Tidal Segments
A watershed model developed using the Hydrologic Simulation Program in Fortran (HSPF) was used to simulate the watershed build-up/wash-off process for the tidal seg-ments and to provide loading to the upstream portion of the tidal watershed. The runoff simulation focused on first estimating the magnitude of different types of bacteria sources in the watershed (i.e., the number of animals, leaking septic systems, etc.) and their asso-ciated bacteria loading rates from literature values. The loading estimates were then ad-

Eight Total Maximum Daily Loads for Indicator Bacteria in Dickinson Bayou and Three Tidal Tributaries
Texas Commission on Environmental Quality 35 Adopted February 8, 2012
justed within the range of values reported in the literature to match the edge-of-field run-off concentrations for each land use type or bacteria source (Baird et al., 1996, Pitt et al., 2004, McCarthy et al., 2006, Stormwater Joint Task Force, 2002).
The tidal prism model was tested against observed Enterococci concentrations at TCEQ monitoring stations for the period June 1, 1999 through November 5, 2001. To match modeled concentrations to observations, the bacteria decay rates were adjusted between 0.25 and 2.0 per day, which is within typical literature values (Bowie et al., 1985; Beaudeau et al., 2001; Liu et al., 2006). Although SSOs were not available for this time period, SSO loading was also included in one segment where frequent SSOs were ob-served between 2002 and 2008 to match instream loading at that reach. A detailed de-scription of the tidal prism method is included in Appendix B.
The results of the tidal prism model were compared against observed Enterococci at all locations where TCEQ monitoring data were available along the main stem of the bayou as well as at tributary outlets. A longitudinal plot of the calibrated model and observed concentrations was prepared using the geometric means and is presented in Figure 11. The plot demonstrates that there is generally very good agreement throughout most of the watershed between the modeled and observed values.
Figure 11. Longitudinal Profile of the Tidal Prism Model Enterococci Calibration in the Tidal Segment of
Dickinson Bayou (1999-2001) (Labels indicate TCEQ station numbers.)
1
10
100
1000
0 5,000 10,000 15,000 20,000 25,000
Ente
roco
cci G
eom
etri
c M
ean
(MPN
/dL)
Distance from Bayou Mouth (m)
Model
Observed
16979
16679
11460
11461
11462 11464

Eight Total Maximum Daily Loads for Indicator Bacteria in Dickinson Bayou and Three Tidal Tributaries
Texas Commission on Environmental Quality 36 Adopted February 8, 2012
To meet the TMDL in the tidal segments, reductions in source loadings are required. The required reductions for the tidal segments are presented in Table 17 and range from 0.00E+00 in 1103_02 to 1.14E+12 in 1103_04. The median load for each segment was used to specify the TMDLs.
Table 17. TMDL Loads: Estimated and Actual Loads for the Impaired Assessment Units
in Segment 1103
Stream Name Assessment Unit TMDL (MPN/day) Observed Load
(MPN/day) Reduction Re-
quired(MPN/day)
Dickinson Bayou Tidal 1103_04 6.74E+10 1.21E+12 1.14E+12
1103_03 9.41E+10 1.31E+11 3.72E+10
1103_02 2.41E+11 1.11E+11 0.00E+00
Bensons Bayou 1103A_01 9.26E+09 1.54E+10 6.14E+09
Bordens Gully 1103B_01 1.65E+09 2.14E+09 4.95E+08
Geisler Bayou 1103C_01 4.14E+09 6.00E+09 1.85E+09
Margin of Safety To account for uncertainty in the analysis an MOS was used to develop the TMDL and thus provide a higher level of assurance that the goals of the TMDL will be met. According to EPA guidance (EPA 1991), the MOS can be incorporated into the TMDL using two methods:
§ Implicitly incorporating the MOS using conservative model assumptions to devel-op allocations; or
§ Explicitly specifying a portion of the TMDL as the MOS and using the remainder for allocations.
The MOS is designed to account for any uncertainty that may arise in specifying water quality control strategies for the complex environmental processes that affect water quali-ty. Compensating for this uncertainty, to the extent possible, is the basis for assigning a MOS.
In this TMDL, an explicit MOS has been incorporated into both the LDCs and tidal prism modeling efforts. The TMDL for the freshwater segment used a 5% MOS because of the limited amount of data for some sampling locations as well as the lack of measured flow data within the watershed. For contact recreation, this equates to a geometric mean con-centration of 120 MPN/dL for E. coli. For the tidal streams, the MOS was based on the allowable loading for the segment, meaning that 5% of the TMDL was assigned as the MOS for the tidal segment.

Eight Total Maximum Daily Loads for Indicator Bacteria in Dickinson Bayou and Three Tidal Tributaries
Texas Commission on Environmental Quality 37 Adopted February 8, 2012
Pollutant Load Allocation The TMDL represents the maximum amount of a pollutant that the stream can receive in a single day without exceeding the water quality standard. The load allocations for this TMDL were calculated using the following equation:
Equation 1 TMDL = WLA + LA + MOS
Where:
WLA = wasteload allocation (point source contributions)
LA = load allocation (nonpoint source contributions)
MOS = margin of safety
Typically, several possible allocation strategies will achieve the TMDL endpoint and water quality standards. Available control options depend on the number, location, and charac-ter of pollutant sources. For the Dickinson Bayou watershed, two methodologies were used to quantify the assimilative capacity of the bayou, define overall reduction goals, and specify TMDL allocations for point and nonpoint sources:
1) The LDC method for Dickinson Bayou Above Tidal. 2) The mass balance method using a tidal prism/box model for Dickinson Bayou Tid-
al, Bensons Bayou, Bordens Gully, and Giesler Bayou.
Bacteria sources in the Dickinson Bayou watershed are diverse and can occur in combina-tion; as such, bacteria can be discharged at different flow rates during different time peri-ods, resulting in varied critical conditions. The LDC approach calculates the maximum allowable load over the complete range of flow conditions for each assessment unit. Thus, this approach can account for both low flow conditions where point sources would be ex-pected to dominate, high flow conditions where nonpoint and stormwater sources are the primary loading source, as well as the mid-range flows where point and nonpoint sources could exert influence.
In the tidal prism/box model approach, the dynamic, continuous simulation model con-siders an approximately 2.5 year period between June 1, 1999 and November 11, 2001 to establish the TMDL. This multiple year period was chosen because it exhibited the most observed water quality to represent critical conditions likely to occur, such as wet and dry periods and a multiple-year period to account for meteorological and source variation. Thus, both approaches consider critical conditions for the TMDL.
Wasteload Allocation Wasteload allocations (WLA) were established for point sources, such as WWTFs using Equation 2. As shown in the equation, the WLA for dischargers in the non-tidal portion of the watershed was calculated using one-half of the E. coli concentration of 126 MPN/dL (i.e., 63 MPN/dL) multiplied by the permitted flow. For the tidal portion of the watershed,

Eight Total Maximum Daily Loads for Indicator Bacteria in Dickinson Bayou and Three Tidal Tributaries
Texas Commission on Environmental Quality 38 Adopted February 8, 2012
one-half the Enterococci concentration of 35 MPN/dL (i.e., 17 MPN/dL) was used to cal-culate the WLA. For WWTFs without permitted flow data (i.e., 03416-000 and 03479-000), the average reported flow for the WWTFs was used to calculate and assign a WLA.
Equation 2 WLAWWTF = ½*swqs * flow * unit conversion factor
where:
swqs (surface water quality standard) = 126 MPN/100mL E. coli or 35 MPN/100 mL Enterococci;
flow (106 gal/day) = permitted flow; and
unit conversion factor = 37,854,120 100mL/106gal.
Table 18 presents a summary of the WWTFs in the Dickinson Bayou watershed as well as their flow characteristics and bacteria allocations. Consideration of future growth and its impacts on the WLA are discussed in a later section.
Stormwater discharges from MS4 areas are considered permitted point sources. There-fore, the WLA calculations must also include an allocation for permitted stormwater dis-charges. The stormwater component of the WLAs, also known as WLAStormwater, is calcu-lated using the percentage of each assessment unit’s sub-watershed that is designated an urbanized area by the EPA (see Figure 6).
Table 19 summarizes the percentage of each assessment unit’s subwatershed that is des-ignated as an urbanized area. The proportions of the assessment unit subwatershed areas included in urbanized areas range from 2% to 48%.
The percentages shown in Table 19 are used to derive the WLAStormwater values as shown in Equation 3.
Equation 3 WLA stormwater= (TMDL - ΣWLAWWTF - MOS - FG) * PctMS4
where:
WLA stormwater (MPN/day) = permitted stormwater WLA;
TMDL (MPN/day) = maximum allowable load (MPN/day);
ΣWLAWWTF (MPN/day) = permitted WWTF WLA;
FG (MPN/day) = WWTF future growth WLA;
PctMS4 (%) = Percentage of the assessment unit permitted for MS4 Stormwater;
MOS (MPN/day) = 5% margin of safety.

Eight Total Maximum Daily Loads for Indicator Bacteria in Dickinson Bayou and Three Tidal Tributaries
Texas Commission on Environmental Quality 39 Adopted February 8, 2012
Table 18. Wasteload Allocation for WWTFs in Dickinson Bayou Watershed
Assess-ment Unit TPDES ID Facility name
Permitted Flow (MGD)
Average Self-
Reported Flow (MGD)
E. coli Load (MPN/day)
Enterococci Load
(MPN/day)
1104_01 03416-000 Waste Management Of Texas n/a1 0.8291 1.97E+09 n/a2
1104_02 13632-001 Meadowland Utility 0.023 0.009 5.48E+07 n/a2
1104_02 14440-001 Brazoria County MUD No. 24 0.95 n/a 4 2.26E+09 n/a2
1104_02 12935-001 Pine Colony 0.05 0.026 1.19E+08 n/a2
1103_02 00377-000 Penreco 0.075 0.057 n/a2 4.96E+07
1103_02 10173-001 Galveston County WCID No. 1 4.8 2.759 n/a2 3.18E+09
1103D_01 14570-001 Marlin Atlantis White, Ltd. 0.5 n/a 4 n/a2 3.31E+08
1103_01 03749-001 Hillman Shrimp & Oyster Co. 0.07 0.005 n/a2 4.63E+07
1103_01 04086-001 Duratherm Inc. n/a3 0.091 n/a3 n/a3
1103_01 14326-001 Via Bayou RV Park 0.02 0.002 n/a2 1.32E+07
1103_01 03479-000 Sea Lion Technology, Inc. n/a3 0.058 n/a3 n/a3
1 No permitted flow specified; average daily flow from monthly self-reports was used to calculate WLA; average flow reported between November 1999 and February 2007
2 Load calculated only for E. coli (in Segment 1104) or Enterococci (in Segment 1103) 3 The industrial process associated with facilities is not considered a source of indicator bacteria warranting a WLA 4 Flows not reported in period that was evaluated for averaging Abbreviations: MGD – million gallons per day; MPN – most probable number; MUD – municipal utility district;
TPDES – Texas Pollutant Discharge Elimination System; WCID – water control and improvement district
The TCEQ intends to implement the individual WLAs through the permitting process as monitoring requirements and/or effluent limitations as required by the amendment of 30 Texas Administrative Code (TAC), Chapter 319 which became effective November 26, 2009. WWTFs discharging to the TMDL segment assessment units will be assigned an effluent limit based on the TMDL. Monitoring requirements are based on permitted flow rates and are listed in 30 TAC §319.9. The permit requirements will be implemented dur-ing the routine permit renewal process. However, there may be a more economical or technically feasible means of achieving the goal of improved water quality and circum-stances may warrant changes in individual WLAs after this TMDL is adopted. Therefore, the individual WLAs, as well as the WLAs for stormwater, are non-binding until imple-mented via a separate TPDES permitting action, which may involve preparation of an up-date to the state’s WQMP. Regardless, all permitting actions will demonstrate compliance with the TMDL.
The executive director or commission may establish interim effluent limits and/or moni-toring-only requirements during a permit amendment or permit renewal. These interim limits will allow a permittee time to modify effluent quality in order to attain the final ef-

Eight Total Maximum Daily Loads for Indicator Bacteria in Dickinson Bayou and Three Tidal Tributaries
Texas Commission on Environmental Quality 40 Adopted February 8, 2012
fluent limits necessary to meet the TCEQ and EPA-approved TMDL allocations. The dura-tion of any interim effluent limits may not be any longer than three years from the date of permit re-issuance. New permits will not contain interim effluent limits because compli-ance schedules are not allowed for new permits.
Table 19. Percentages of Each Assessment Unit Designated as an Urbanized Area
Assessment Unit Area under MS4 (acres)
Total sub-watershed area (acres)
Percentage of Assessment Unit Permitted for Stormwater
1104_01 485 7,689 6%
1104_02 5,378 13,065 41%
1103_04 5,232 16,295 32%
1103_03 26 986 27%
1103_02 4,524 13,192 34%
1103_01 181 9,806 2%
1103A_01 1,675 3,466 48%
1103B_01 484 1,346 36%
1103C_01 613 2,315 26%
Total 18,837 68,160 28%
Where a TMDL has been approved, domestic WWTF TPDES permits will require condi-tions consistent with the requirements and assumptions of the WLAs. For NPDES/ TPDES-regulated municipal, construction stormwater discharges, and industrial storm-water discharges, water quality-based effluent limits that implement the WLA for storm-water may be expressed as best management practices (BMPs) or other similar require-ments, rather than as numeric effluent limits (November 12, 2010, memorandum from EPA relating to establishing WLAs for stormwater sources). The EPA memo states that:
“The CWA provides that stormwater permits for MS4 discharges shall contain controls to reduce the discharge of pollutants to the "maximum extent practica-ble" and such other provisions as the Administrator or the State determines ap-propriate for the control of such pollutants [CWA section 402(p)(3)(8)(iii )]. Un-der this provision, the NPDES permitting authority has the discretion to include requirements for reducing pollutants in stormwater discharges as necessary for compliance with water quality standards [Defenders of Wildlife v. Browner, 191 F.3d 1159, 1166 (9th Cir. 1999)].
The permitting authority’s decision about how to express the water quality-based effluent limitations (WQBELs)—either as numeric effluent limitations or BMPs, including BMPs accompanied by numeric benchmarks—should be based on an analysis of the facts and circumstances surrounding the permit, and/or the un-

Eight Total Maximum Daily Loads for Indicator Bacteria in Dickinson Bayou and Three Tidal Tributaries
Texas Commission on Environmental Quality 41 Adopted February 8, 2012
derlying WLA. The decision should include factors such as the nature of the stormwater discharge, available data, modeling results or other relevant infor-mation. As discussed in the 2002 memorandum, the permit's administrative rec-ord needs to provide an adequate demonstration that, where a BMP-based ap-proach to permit limitations is selected, the BMPs required by the permit will be sufficient to implement applicable WLAs. Improved knowledge of BMP effective-ness gained since 2002 should be reflected in the demonstration and supporting rationale that implementation of the BMPs will attain water quality standards and WLAs.”
The November 22, 2002, memorandum from EPA relating to establishing WLAs for stormwater sources states that:
“...the Interim Permitting Approach Policy recognizes the need for an iterative approach to control pollutants in stormwater discharges...[s]pecifically, the policy anticipates that a suite of BMPs will be used in the initial rounds of permits and that these BMPs will be tailored in subsequent rounds.”
Using this iterative adaptive approach, to the maximum extent practicable, is appropriate to address the stormwater component of this TMDL.
This TMDL is, by definition, the total of the sum of the WLA, the sum of the LA, and the MOS. Changes to individual WLAs may be necessary in the future in order to accommo-date changing conditions within the watershed. These changes to individual WLAs do not ordinarily require a revision of the TMDL document; instead, changes will be made through updates to the TCEQ’s WQMP. Any future changes to effluent limitations will be addressed through the permitting process and by updating the WQMP.
Load Allocation The Load Allocation (LA) is the sum of loading from all nonpoint sources. The LAs for each stream segment are calculated as the difference between the TMDL, MOS, WLA for WWTFs, and WLA for stormwater. It is calculated as shown in Equation 4.
Equation 4 LA = TMDL - ΣWLAWWTF - ΣWLAstormwater - MOS
where:
LA (MPN/day) = load allocation;
TMDL (MPN/day) = maximum allowable daily load;
ΣWLAWWTF (MPN/day) = permitted WWTF WLA;
ΣWLA stormwater (MPN/day) = permitted stormwater WLA;
MOS (MPN/day) = 5% margin of safety.

Eight Total Maximum Daily Loads for Indicator Bacteria in Dickinson Bayou and Three Tidal Tributaries
Texas Commission on Environmental Quality 42 Adopted February 8, 2012
Allowance for Future Growth Compliance with these TMDLs is based on keeping the bacteria concentrations in the im-paired assessment units below the limits that were set as criteria for the individual seg-ments. Future growth of existing or new point sources is not limited by these TMDLs as long as the sources do not cause bacteria levels to exceed the limits. The assimilative ca-pacity of streams increases as the amount of flow volume increases. Consequently, in-creases in flow allow for increased loadings. The LDC and tables in this TMDL will guide determination of the assimilative capacity of the stream under changing conditions, in-cluding future growth.
Future growth for this TMDL was determined based on 2050 population estimates from the Texas Water Development Board (TWDB, 2002). A summary of the future growth methodology is presented in Appendix C. The allowance for future growth is defined as the difference between future permitted WWTF flows and currently permitted WWTF flows. For the above-tidal segments of Dickinson Bayou, the allowance for future growth in WWTF permitted flows was added to the flows used to calculate the flow duration curve. This accounts for the increase in permitted flow over all flow conditions. For the tidally influenced segments, the future growth allowance for each facility was incorpo-rated into the tidal prism/box model. Allocations for future growth were calculated only for assessment units currently receiving wastewater from permitted outfalls.
Future growth also affects nonpoint sources as land use in the watershed changes. As fu-ture growth occurs, development and the regulated MS4 areas will expand. The expansion of MS4s redistributes the pollutant load allocation, shifting from current LA to future WLAstormwater. However, increases in urban development and re-development can lead to increased impervious cover and commensurate increases in NPS pollutant loads. Storm-water BMPs can be used to mitigate NPS pollutant load increases attributed to develop-ment, redevelopment and increased impervious cover,
Additional stormwater dischargers represent additional flow that is not accounted for in the current allocations. Changes in MS4 jurisdiction or additional development associated with population increases in the watershed can be accommodated by shifting allotments between the WLA and the LA. This can be done without the need to reserve future capaci-ty. In non-urbanized areas, growth can be accommodated by shifting loads between the LA and the WLAstormwater.
The three-tiered antidegradation policy in the Texas Surface Water Quality Standards prohibits an increase in loading that would cause or contribute to degradation of an exist-ing use. The antidegradation policy applies to both point and nonpoint source pollutant discharges. In general, antidegradation procedures establish a process for reviewing indi-vidual proposed actions to determine if the activity will degrade water quality. The TMDLs in this document will result in protection of existing beneficial uses and conform to Texas’s antidegradation policy.
TMDL Calculations A bacteria TMDL represents the capacity of a water body to assimilate indicator bacteria. The TMDL equation, modified to accommodate additional factors, is expressed as shown

Eight Total Maximum Daily Loads for Indicator Bacteria in Dickinson Bayou and Three Tidal Tributaries
Texas Commission on Environmental Quality 43 Adopted February 8, 2012
in Equation 5. The TMDL, ΣWLAWWTF, FG, and MOS allocations are set by flow, the con-tact recreation criterion, permitted wastewater flow, estimates of future wastewater flow and an explicit MOS allocation (5%) to account for uncertainty in the analysis. The load that remains after subtracting ΣWLAWWTF, MOS, and FG is allocated to the ΣWLAStormwater and LA. Permitted stormwater sources (ΣWLAStormwater) are allocated according to the proportion of the assessment unit’s subwatershed designated as an urbanized area, as previously described, and the remaining load is allocated to the LA.
Equation 5 TMDL = ΣWLAWWTF + ΣWLAstormwater + LA + MOS + FG
where:
ΣWLAWWTF = wasteload allocation (permitted WWTF);
ΣWLAstormwater = wasteload allocation (permitted stormwater);
LA = load allocation (unregulated nonpoint source contributions);
MOS = margin of safety; and
FG = future growth.
TMDL calculations for E. coli in the non-tidal segments of Dickinson Bayou, and Entero-cocci in the tidal segments of Dickinson Bayou, are presented in Table 20 segregated by assessment unit.
As shown in Table 20, for the assessment units of the above-tidal portion of Dickinson Bayou (1104_01 and 1104_02), the calculated E. coli TMDL ranged from 1.04E+10 MPN/day to 3.70E+10 MPN/day. The WLA ranged from 1.97E+09 to 2.44E+09 MPN/day for WWTFs and 2.06E+09 to 2.21E+09 MPN/day for permitted stormwater. The LAs for sub-watersheds associated with Assessment Units 1104_01 and 1104_02 ranged from 3.16E+09 to 3.06E+10 MPN/day.
For the tidal assessment units, which include 1103A_01, 1103B_01, 1103C_01, 1103_02, 1103_03, and 1103_04, the Enterococci TMDL ranged from 1.65E+09 to 2.41E+11 MPN/day; WLAs for. WLAs for assessment units in the tidal segment and tidal tributaries were established at 3.22E+ 09MPN/day. However, tidal assessment units without contri-butions from WWTFs were assigned a WLA of 0.00E+00. Permitted stormwater WLAs for assessment units in the tidal segment and in tidal tributaries ranged from 5.64E+08 to 3.06E+10 MPN/day and LAs for these assessment units ranged from 1.00E+09 to 2.21E+11 MPN/day.
In 2010, the TCEQ conducted a recreational use attainability analysis (RUAA) of Dickin-son Bayou Above Tidal. This RUAA could result in a change in the criterion used to assess recreational uses in this portion of the bayou. Appendix D presents a method that can be used to calculate revised TMDL allocations for the freshwater segments and includes graphs showing the relationship between the revised freshwater criterion, the TMDL alloca-tions, and the equations that can be used to calculate the revised TMDL allocations.

Eight Total Maximum Daily Loads for Indicator Bacteria in Dickinson Bayou and Three Tidal Tributaries
Texas Commission on Environmental Quality 44 Adopted February 8, 2012
Table 20. TMDL Allocation for Dickinson Bayou Watershed (in MPN/day)
Stream Name
Assess-ment Unit
Indicator Bacteria TMDL1 WLAWWTF
2 WLAStormw
ater3 LA4 MOS5
Future Growth (FG)6
Dickinson Bayou Above Tidal
1104_01 E. coli 3.70E+10 1.97E+09 2.06E+09 3.06E+10 1.82E+09 5.28E+08
1104_02 E. coli 1.04E+10 2.44E+09 2.21E+09 3.16E+09 4.11E+08 2.19E+09
Bensons Bayou
1103A_01 Enterococci 9.26E+09 0.00E+00 4.25E+09 4.55E+09 4.63E+08 0.00E+00
Bordens Gully
1103B_01 Enterococci 1.65E+09 0.00E+00 5.64E+08 1.00E+09 8.25E+07 0.00E+00
Geislers Bayou
1103C_01 Enterococci 4.14E+09 0.00E+00 1.04E+09 2.89E+09 2.07E+08 0.00E+00
Dickinson Bayou Tid-al7
1103_02 Enterococci 2.41E+11 3.22E+09 4.17E+09 2.21E+11 1.21E+10 8.03E+08
1103_03 Enterococci 9.41E+10 0.00E+00 3.06E+10 5.87E+10 4.70E+09 0.00E+00
1103_04 Enterococci 6.74E+10 0.00E+00 1.72E+10 4.68E+10 3.37E+09 0.00E+00
1 TMDL calculated as sum of WLAWWTF, WLAStormwater, LA, MOS and future growth (includes full permitted flow and no margin of safety); for above tidal segments, the TMDL was calculated by summing the median value of the LDC from the mid-range flow (between 20-80th percentile), MOS and future growth.
2 WLAWWTF is sum of permitted loads discharging to impaired assessment units 3 WLAStormwater is TMDL minus the sum of WLAWWTF, MOS and future growth multiplied by the percentage of the
assessment unit watershed covered by MS4 permits 4 LA is TMDL minus the sum of WLAWWTF, WLAStormwater, MOS, and future growth 5 MOS is a 5% margin of safety which is applied to the TMDL 6 Future growth accounts for population growth through 2050 in permitted WWTF discharges 7 Because it is not included on the 2008 Texas 303(d) List, a TMDL is not specified for AU 1103_01
Seasonal Variation Federal regulations in volume 40 of the Code of Federal Regulations (CFR), Section 130.7(c)(1) require that TMDLs account for seasonal variation in watershed conditions and pollutant loading. An analysis of all E. coli data showed no significant seasonal varia-tions. However, seasonal variation was accounted for in these TMDLs as follows. For the load duration curve analysis, the seasonal variation was accounted for by using all availa-ble water quality data and by using nine years of modeled flows to develop flow exceedance percentiles. For the mass balance analysis, the seasonal variation was ac-counted for by use of a continuous simulation model over a 2.5-year period that accounts for a range of seasonal and flow conditions.
Public Participation The TCEQ maintains an inclusive public participation process. From the inception of the TMDL study, the TCEQ project team sought to ensure that stakeholders were informed

Eight Total Maximum Daily Loads for Indicator Bacteria in Dickinson Bayou and Three Tidal Tributaries
Texas Commission on Environmental Quality 45 Adopted February 8, 2012
and involved. Communication and comments from the stakeholders in the watershed strengthen TMDL projects and their implementation.
Over the course of the Dickinson Bayou TMDL study, public participation has been an important component of the project. Members of the project stakeholder group represent government, permitted facilities, agriculture, businesses, environmental interests, and community interests in the Dickinson Bayou watershed. The TCEQ and the Dickinson Bayou Watershed Partnership held a series of meetings with stakeholders to solicit their advice on elements of the project and to keep stakeholders informed of progress. Notices of meetings were posted on the project web page, the Dickinson Bayou Watershed Part-nership web page, and the TCEQ’s TMDL program online calendar.
Additionally, websites hosted by the TCEQ <www.tceq.state.tx.us/implementation/ water/tmdl/80-dickinsonbayoubacteria.html> and the Texas AgriLife Extension’s Texas Coastal Watershed Program <www.urban-nature.org> or <www.dickinsonbayou.org> provided access to meeting summaries, presentations, ground rules, and the list of stake-holder group members. The websites were frequently updated to ensure that all stake-holders and the public were informed of meetings and findings.
Three meetings were held in December 2007, April 2008, and October 2009, to present project status reports from the TCEQ as well as updates on the technical aspects of the project. A fourth public meeting was held in March 2010 and stakeholders were provided an update on the Bacteria TMDL. Finally, a fifth public meeting was held in February 2011 to initiate the Implementation Plan process. The meetings were held at project milestones and were used to solicit input and feedback from the stakeholders. Stakeholder input was invaluable as it provided local insight to the TMDL project staff.
Implementation and Reasonable Assurance The issuance of permits consistent with TMDLs through the TPDES provides reasonable assurance that the WLAs in this TMDL report will be achieved. Consistent with federal requirements, each adopted TMDL is a plan element of an update to the TCEQ’s WQMP.
The TCEQ’s WQMP coordinates and directs the state’s efforts to manage water quality and maintain or restore designated uses of water bodies throughout Texas. The WQMP is continually updated with new, more specifically focused plan elements, as identified in federal regulations (40 CFR 130.6(c)). Commission adoption of a TMDL is the state’s cer-tification of the associated WQMP update.
Because the TMDL does not reflect or direct specific implementation by any single pollu-tant discharger, the TCEQ certifies additional elements to the WQMP after the Implemen-tation Plan (I-Plan) is approved by the commission. Based on the TMDL and I-Plan, the TCEQ will propose and certify WQMP updates to establish required water-quality-based effluent limitations necessary for specific TPDES wastewater discharge permits.
For MS4 permits, the TCEQ will normally establish BMPs. BMPs are a substitute for ef-fluent limitations, as allowed by federal rules, where numeric effluent limitations are in-feasible. When such practices are established in an MS4 permit, the TCEQ will not identi-

Eight Total Maximum Daily Loads for Indicator Bacteria in Dickinson Bayou and Three Tidal Tributaries
Texas Commission on Environmental Quality 46 Adopted February 8, 2012
fy specific implementation requirements applicable to a specific TPDES stormwater per-mit through an effluent limitation update. Rather, the TCEQ might revise a stormwater permit, require a revised Stormwater Management Program or Pollution Prevention Plan, or implement other specific revisions affecting stormwater dischargers in accordance with an adopted I-Plan.
Strategies for achieving pollutant loads in TMDLs from both point and nonpoint sources are reasonably assured by the state’s use of an I-Plan. The TCEQ is committed to support-ing implementation of all TMDLs adopted by the commission.
I-Plans for Texas TMDLs use an adaptive management approach that allows for refine-ment or addition of methods to achieve environmental goals. This adaptive approach rea-sonably assures that the necessary regulatory and voluntary activities to achieve pollutant reductions will be implemented. Periodic, repeated evaluations of the effectiveness of im-plementation methods ascertain whether progress is occurring, and may show that the original distribution of loading among sources should be modified to increase efficiency. I-Plans will be adapted as necessary to reflect needs identified in evaluations of progress.
Key Elements of an I-Plan An I-Plan includes a detailed description and schedule of the regulatory and voluntary management measures to implement the WLAs and LAs of particular TMDLs within a reasonable time. I-Plans also identify the organizations responsible for carrying out load reductions and management measures, and a plan for periodic evaluation of the progress achieved. The EPA is not required, and is not authorized, to approve or disapprove I-plans for TMDLs.
Strategies to optimize compliance and oversight are identified in an I-Plan when neces-sary. Such strategies may include additional monitoring and reporting of effluent dis-charge quality to evaluate and verify loading trends, adjustment of an inspection frequen-cy or a response protocol to public complaints, and escalation of an enforcement remedy to require corrective action of a regulated entity contributing to an impairment.
The TCEQ works with stakeholders and interested governmental agencies to develop and support I-Plans and track their progress. Work on the I-Plan begins during development of TMDLs. The cooperation required to develop an I-Plan for approval by the commission becomes a cornerstone for the shared responsibility necessary for carrying out the plan.
Ultimately, the I-Plan will identify the commitments and requirements to be implemented through specific permit actions and other means. For these reasons, the I-Plan that is ap-proved may not approximate the predicted loadings identified category-by-category in the TMDL and its underlying assessment. The I-Plan is adaptive for this very reason; it allows for continuous update and improvement.
In most cases, it is not practical or feasible to approach all TMDL implementation as a one-time, short-term restoration effort. This is particularly true when a challenging wasteload reduction or load reduction is required by the TMDL, there is high uncertainty with the TMDL analysis, there is a need to reconsider or revise the established water qual-

Eight Total Maximum Daily Loads for Indicator Bacteria in Dickinson Bayou and Three Tidal Tributaries
Texas Commission on Environmental Quality 47 Adopted February 8, 2012
ity standard, or the pollutant load reduction would require costly infrastructure and capi-tal improvements.

Eight Total Maximum Daily Loads for Indicator Bacteria in Dickinson Bayou and Three Tidal Tributaries
Texas Commission on Environmental Quality 48 Adopted February 8, 2012
References American Society of Agricultural Engineers. ASAE 1998. Manure production and charac-
teristics. D384.1.
American Society of Agricultural Engineers. ASAE 2003. Manure production and charac-teristics. D384.1.
American Veterinary Medical Association, 2007. Market Research Statistics: U.S. Pet Ownership – 2007. http://www.avma.org/reference/marketstats/ownership.asp. Accessed June 2009.
Baird, C., M. Jennings, D. Ockerman, T. Dybala. 1996. “Characterization of Nonpoint Sources and Loadings to Corpus Christi Bay National Estuary Program Study Area.” CCBNEP-05. Corpus Christi Bay National Estuary Program, Corpus Christi.
Beaudeau, P., Toussett, N., Bruchon, F., Lefevre, A., and Taylor, H.D. (2001) “In Situ Measurement and Statistical Modeling of Escherichia coli Decay in Small Rivers.” Water Research, 35(13), 3168-3178.
Benham, B. L., K. M. Brannan, et al. 2005. "Development of Bacteria and Benthic Total Maximum Daily Loads: A Case Study, Linville Creek, Virginia." Journal of Envi-ronmental Quality 34(5): 1860-1872.
Bowie, George L, William B. Mills, Donald B. Procella, Carrie L. Campbell, James R. Pagenkopf, Gretchen L. Rupp, Kay M. Johnson, Peter W.H. Chan, Steven A. Gherini. 1985. Rates, Constants, and Kinetics Formulations in Surface Water Quality Model-ing. EPA 660/3-85-040. EPA. Athens, GA.
Cook, Robert L. 1992. Learn About Whitetails. <www.tpwd.state.tx.us/publications/ pwdpubs/media/pwd_lf_w7000_0007.pdf>. Accessed April 2011.
EPA. 1986. “Ambient Water Quality Criteria for Bacteria.” EPA 440/4-84-002. US EPA, Washington, D.C.
EPA. 1991. Guidance for Water Quality-Based Decisions: The TMDL Process. <www.epa.gov/OWOW/tmdl/decisions/>.
EPA. 2000. Bacterial Indicator Tool User's Guide. Washington, D.C., US EPA: 18.
EPA. 2006. Memorandum: Clarification Regarding “Phased” Total Maximum Daily Loads. August 2, 2006 (Benita Best-Wong to Water Division Directors).
EPA. 2007. TMDLs for Fecal Coliform Bacteria, Chlorides, Sulfates, Total Dissolved Solids (TDS), Sediment, Total Suspended Solids (TSS), and Turbidity for Selected Subsegments in the Terrebonne Basin, Louisiana
EPA. 2002. Memorandum: Establishing Total Maximum Daily Load (TMDL) Wasteload Allocations (WLAs) for Stormwater Sources and NPDES Permit Requirements Based on Those WLAs. November 22, 2002 (Robert H. Wayland, III to Water Divi-sion Directors).
EPA. 2004. Report to Congress: Impacts and Control of CSOs and SSOs. August 2004. EPA 833-R-04-001.

Eight Total Maximum Daily Loads for Indicator Bacteria in Dickinson Bayou and Three Tidal Tributaries
Texas Commission on Environmental Quality 49 Adopted February 8, 2012
Galveston County Health District (GCHD). 1998. Voluntary Inspection and Information Assistance Program to Reduce Bacterial Pollution Caused by Malfunctioning Septic Systems in Dickinson Bayou. Report to the Texas Natural Resource Conservation Commission. Financed through grants from the U.S. Environmental Protection Agency.
H-GAC. 2002. 2002 Land Cover Data Set. <www.h-gac.com/rds/land_use/default.aspx>. Accessed June 2009.
H-GAC. 2008. 2008 Land Cover Data Set. <www.h-gac.com/rds/land_use/ de-fault.aspx>. Accessed June 2009.
Ketchum, B.H. 1988. The exchanges of fresh and salt water in tidal estuaries. Journal of Marine Research. 10:18-38.
Kuo, A.Y., and B.J. Neilson. 1988. A Modified Tidal Prism Model for Water Quality in Small Coastal Embayments. Wat. Sci. Tech., Vol 20, pp. 133-142.
Kuo, A.T., K. Park, S.-C. Kim, and J. Lin. 2005. A Tidal Prism Water Quality Model for Small Coastal Basins. Coastal Management, Vol. 33, pp. 101-117.
Liu, L., M. S. Pharnikumar, S. L. Molloy, R.L. Whitman, D.A. Shively, M.B. Nevers, D.J. Schwab, J.B. Rose. 2006. Modeling the transport and inactivation of E. coli and En-terococci in the near-shore region of Lake Michigan. Environmental Science and Technology. 40(16): 5022-5028.
Mapston, Mark. 2004. “Feral Hogs in Texas.” Texas Cooperative Extension Service B-6149. <http://icwdm.org/publications/pdf/feralpig/txferalhogs.pdf> Accessed March 21, 2011.
McCarthy, D.T., V.G. Mitchell, A. Deletic, C. Diaper. 2006. “Escherichia coli Levels in Ur-ban Stormwater.” 7th WSUD & 4th UDM Conference Proceedings, Melbourne Aus-tralia.
National Biological Information Infrastructure. 2005. Texas Coastal Interactive Mapping Application. <http://maps.harc.edu/waterbirds> Accessed on March 21, 2011.
NCDC. 2002. Climatography of the United States No. 85: Divisional Normal and Stand-ard Deviations of Temperature, Precipitation, and Heating and Cooling Degree Days 1971-2000 (and previous normal periods). National Climatic Data Cen-ter/NESDIS/NOAA, Asheville, North Carolina.
New England Interstate Water Pollution Control Commission (NEIWPCC). 2003. Illicit Discharge Detection and Elimination Manual. January 2003.
Quality Deer Management Association. 2011. Whitetail Map Guide. <www.i-maps.com/Qdma/frame/default1024_ie.asp?C=48449&LinkID=0&NID=0&cmd=map&TL=100000&GL=010100&MF=11000>. Accessed April 2011.
Pitt, R., A. Maestre, R. Morquecho. 2004. “National Stormwater Database (version 1.1).” University of Alabama, Tuscaloosa, AL.
Shen, J., S. Sun, and T. Wang. 2005. Development of the Fecal Coliform Total Maximum Daily Load Using Simulation Program C++ and Tidal Prism Model in Estuarine

Eight Total Maximum Daily Loads for Indicator Bacteria in Dickinson Bayou and Three Tidal Tributaries
Texas Commission on Environmental Quality 50 Adopted February 8, 2012
Shellfish Growing Areas: A Case Study in the Nassawadox Coastal Embayment, Vir-ginia. Journal of Environmental Science and Health, Vol. 40, pp. 1791-1807.
Stormwater Management Joint Task Force. 2002. “Annual Report for the National Pollu-tant Discharge Elimination System.” City of Houston, Harris County Flood Control District, Texas Department of Transportation.
TCEQ. 2010. Draft 2010 Texas Integrated Report for Clean Water Act Sections 305(b) and 303(d) http://www.tceq.texas.gov/compliance/monitoring/water/quality/data/10twqi/10twqi
TCEQ. 2008a. Guidance for Assessing Texas Surface and Finished Drinking Water Quali-ty Data. <www.tceq.state.tx.us/assets/public/compliance/monops/water/ 04twqi/04_guidance.pdf>.
TCEQ. 2008b. Eighteen Total Maximum Daily Loads for Bacteria in Buffalo and Whiteoak Bayous and Tributaries.
TCEQ. 1996. Texas Water Quality Inventory and 303(d) List. <www.tceq.state. tx.us/compliance/monitoring/water/quality/data/wqm/305_303.html>.
TCEQ. 2002. Texas Water Quality Inventory and 303(d) List. <www.tceq.state. tx.us/compliance/monitoring/water/quality/data/wqm/305_303.html>.
TCEQ. 2000. Texas Surface Water Quality Standards, 2000 update, 30 TAC 307. <www.tceq.state.tx.us/permitting/water_quality/wq_assessment/standards/ WQ_standards_2000.html>.
Texas State Demographers Office. 2008. Estimates of the Total Populations of Counties and Places in Texas for July 1, 2007 and January 1, 2008. <http://txsdc.utsa.edu/ download/pdf/estimates/2007_txpopest_county.pdf>. Accessed June 2009 and February 2010.
TWDB. 2006. Population and Water Demand Projections: 2006 Regional Water Plan & 2007 State Water Plan Projections Data. <www.twdb.state.tx.us/wrpi/data/ data.htm>. Accessed June 2009 and February 2010.
Unknown. 1998. “The Capybara Page.” <www.rebsig.com/capybara/capyfacts.htm>. Accessed on March 21, 2011.
United States Department of Agriculture National Agricultural Statistics Service. USDA (2002). Census of Agriculture. <www.agcensus.usda.gov/Publications/2002 index.asp>. Accessed March 11, 2011.
US Census Bureau. 2000. <censusforecast.h-gac.com/Forecast.aspx>. Accessed June 2009.
USDA. 2007. Agriculture Census. <www.agcensus.usda.gov/Publications/2007/ Full_Report/Census_by_State/Texas.index.asp>. Accessed June 2009.
Wang, T., J. Shen, S. Sun, and H.V. Wang. 2005. Fecal Coliform Modeling in Small Coastal Waters Using a Linked Watershed and Tidal Prism Water Quality Model: A Preliminary Study in Jarrett Bay, North Carolina. Prepared for Proceedings of the

Eight Total Maximum Daily Loads for Indicator Bacteria in Dickinson Bayou and Three Tidal Tributaries
Texas Commission on Environmental Quality 51 Adopted February 8, 2012
Conference on Watershed Management to Meet Water Quality Standards and Emerging TMDL. ASAE Publication Number 701P0105, ed. P.W. Gassman.
Zeckoski, R. W., B. L. Benham, et al. (2005). "BSLC: A Tool for Bacteria Source Character-ization for Watershed Management." Applied Engineering in Agriculture 21(5): 879-889.

Eight Total Maximum Daily Loads for Indicator Bacteria in Dickinson Bayou and Three Tidal Tributaries
Texas Commission on Environmental Quality 52 Adopted February 8, 2012
Appendix A. Load Duration Curve Approach

Eight Total Maximum Daily Loads for Indicator Bacteria in Dickinson Bayou and Three Tidal Tributaries
Texas Commission on Environmental Quality 53 Adopted February 8, 2012
This Appendix provides background on:
§ Flow and load duration curves; § Load duration curve analysis; and § Results of load duration curve analysis for Assessment Units 1104_01 and
1104_02. Flow Duration Curves A continuous historical flow record is not available for Dickinson Bayou due to a lack of flow gaging stations in the bayou. Hence, historical flows were simulated using a water-shed model, the Hydrologic Simulation Program – Fortran (HSPF). The model was cali-brated using physical information about the bayou and its watershed and meteorological data collected between June 1, 1999 and December 31, 2004. The calibration process for the HSPF model, as it is normally understood, was not possible for Dickinson Bayou as flow gage data were not available; therefore, a synthetic flow time series based on flow from a nearby stream (Chocolate Bayou) was substituted and used for model calibration. The HSPF model of the Dickinson Bayou watershed was also used to support the tidal prism/mass balance model discussed in more detail in Appendix B.
It is important to note that, in accordance with accepted practice, the simulated flows for the LDC analysis reflect contributions from WWTFs. In the Above Tidal portion of Dick-inson Bayou, there are a total of three WWTFs and one industrial facility as shown in Ta-ble 9. The flows simulated in the model for 1104_02 include full permitted flow from three WWTFs. Simulated flows for 1104_01, on the other hand, include a single WWTF (TPDES permit number 03416-000) that is permitted to discharge intermittently and therefore does not have a permitted flow limit. As such, the model flows account for the average flow from the facility instead.
The simulated hourly flows from the model were converted to daily values to calculate a Flow Duration Curve (FDC) at the outlet of each assessment unit. FDCs are graphs of the frequency distribution of flow in streams. The flow exceedance frequency (x-value of each point) is obtained by determining the percent of flow that equals or exceeds the measured or estimated flow associated with a specific location in a stream. The generated FDCs are shown in Figures A-1 and A-2. The historical flow was separated into three flow regimes:
§ 0 to 20th percentile: Highest flows § 20th to 80th percentile: Mid-range flows § 80th to 100th percentile: Lowest flows
For this analysis, the mid-range flow regime was chosen as the critical range for calcula-tion of the TMDLs. It is the most representative and protective of the contact recreation use in Dickinson Bayou Above Tidal, since the average water depth in this part of the bay-ou is less than half of a meter during low flows (80th-100th percentile range). Contact recreation is not advisable due to safety concerns at the highest flow (0-20th percentile flow regime).

Eight Total Maximum Daily Loads for Indicator Bacteria in Dickinson Bayou and Three Tidal Tributaries
Texas Commission on Environmental Quality 54 Adopted February 8, 2012
Figure A-1. Flow Duration Curve for Assessment Unit 1104_01
Figure A-2. Flow Duration Curve for Assessment Unit 1104_02
1E - 02
1E - 01
1E+00
1E+01
1E+02
1E+03
1E+04
0 20 40 60 80 100
Flow (cfs)
Percent of Days Flow Exceeded
1104_01
Highest Flows
Mid - Range Flows Lowest Flows
Flow
(cfs
)
1E - 02
1E - 01
1E+00
1E+01
1E+02
1E+03
1E+04
0 20 40 60 80 100
Flow (cfs)
Percent of Days Flow Exceeded
1104_02
Highest Flows
Mid - Range Flows Lowest Flows
Flow
(cfs
)

Eight Total Maximum Daily Loads for Indicator Bacteria in Dickinson Bayou and Three Tidal Tributaries
Texas Commission on Environmental Quality 55 Adopted February 8, 2012
Once the FDCs were prepared, the next step in the TMDL process was to develop LDCs.
Load Duration Curve Analysis LDCs are similar in appearance to FDCs; however, instead of flows, values on the curve are expressed in terms of an indicator bacteria load in MPN/day. The flow for each per-centile between 0 and 100 (at 1 percentile intervals) was multiplied by the water quality standard, as shown in Equation A-1, to derive the LDC. As previously described, flow val-ues used in the LDC analysis are based on HSPF simulations that incorporate the full permitted flow for WWTFs in the segment. For these LDCs, the water quality target was set at the E. coli geometric mean water quality criterion. An explicit MOS was incorpo-rated into the analysis by reducing the assimilative capacity of the stream by 5%, hence the overall water quality target shown in the LDC is 120 MPN/dL rather than the geomet-ric mean criterion of 126 MPN/dL. The calculated LDC is then used to specify the TMDL at any given flow condition.
Equation A-1 LDC = swqs * (1-MOS) * flow * unit conversion factor
where:
swqs (surface water quality standard) = 126 MPN/100mL E. coli
flow (cfs) = flow at each percentile
MOS = 0.05; and
unit conversion factor = 24,465,758 100mL/106gal.
Observed loads for bacteria were calculated and plotted on Figures 8 and 9 in the main body of this document. These loads were based on measured data from the two sampling locations in the watershed closest to the terminus of each of the assessment units, TCEQ station 11465 for 1104_01 and station TCEQ 11467 for 1104_02. E. coli monitoring at sta-tion 11467 occurred 92 times between March 9, 1999 and December 2, 2008. For station 11465, a total of 19 E. coli samples were collected between July 10, 2000 and May 17, 2001.
No additional data were available for this station beyond 2001 in the TCEQ Surface Water Quality Monitoring Information System (SWQMIS). However, routine monitoring is scheduled to resume in 2011.
The measured E. coli values were paired with the instream flow value for the time of sam-ple collection (derived using the HSPF model with full permitted WWTF flow) to calculate an instantaneous bacteria load (E. coli concentration * instantaneous flow). The instanta-neous bacteria loads were then plotted on the LDC.
The permitted flows for each WWTF were used to calculate the WLAs for WWTFs in the non-tidal assessment units. The WLAs for these facilities were calculated using Equation A-2.

Eight Total Maximum Daily Loads for Indicator Bacteria in Dickinson Bayou and Three Tidal Tributaries
Texas Commission on Environmental Quality 56 Adopted February 8, 2012
Equation A-2 WLAWWTF = ½ * swqs * flow * unit conversion factor
where:
swqs (surface water quality standard) = 126 MPN/100mL E. coli
flow (106 gal/day) = permitted WWTF flow; and
unit conversion factor = 37,854,120 100mL/106gal.
The WLAWWTF does not include wastewater loads associated with anticipated future growth. The future growth WWTF loads are calculated separately (as described in the main body of the TMDL document) and are added to the LDC load to derive the TMDL.
In the lower percentile flow range, Assessment Unit 1104_02 can become effluent domi-nated. When this happens, the maximum LDC load falls below the WLAWWTF (see Figure 9). In these situations, the WWTF load is plotted in place of the lower LDC load. It is as-sumed that the WWTFs are compliant with permit requirements, and therefore, their dis-charges will not result in exceedances of the contact recreation standard.
Load Duration Curve Analysis Results The following section provides additional information regarding the LDC results for the two freshwater assessment units in Dickinson Bayou, 1104_01 and 1104_02, in tabular format.
Assessment Unit 1104_01 Table A-1 is a summary of flow, existing loads, LDC, and MOS for Assessment Unit 1104_01 for all three flow conditions. The existing E. coli loads in the bayou ranged from 1.01E+10, under the lowest flow regime, to 1.50E+13 MPN/day, under the highest flow regime. The calculated LDC ranged from 1.10E+10 MPN/day to 3.21E+11 MPN/day.
Table A-1. Load duration curve calculations for Assessment Unit 1104_01
Condition 0-20% 20-80% 80-100%
Median Flow (cfs) 109.49 11.83 3.74
Target Concentration (MPN/dL)1 119.7 119.7 119.7
Existing Load, Median (MPN/day) 1.50E+13 3.90E+10 1.01E+10
LDC, Median (MPN/day) 3.21E+11 3.46E+10 1.10E+10
Margin of Safety Load, Median (MPN/day) 1.69E+10 1.82E+09 5.76E+08
1 Reflects a 5% margin of safety on the 126 MPN/dL contact recreation standard

Eight Total Maximum Daily Loads for Indicator Bacteria in Dickinson Bayou and Three Tidal Tributaries
Texas Commission on Environmental Quality 57 Adopted February 8, 2012
Assessment Unit 1104_02 Table A-2 is a summary of flow, existing loads, LDC, and MOS for Assessment Unit 1104_02 for all three flow conditions. The existing E. coli loads in the bayou ranged from 1.95E+09, under the lowest flow regime, to 6.12E+11, under the highest flow regime. The calculated LDC ranged from 2.44E+09 MPN/day to 1.27E+11 MPN/day. Because 1104_02 is effluent dominated in the lowest flow regime (80-100%), the median LDC val-ue reflects the previously described methodology that was applied for effluent dominated flow conditions. Thus, the median load for that flow regime reflects the WLAWWTF and the flow reported for that regime cannot be used to directly calculate the LDC or margin of safety using Equation A-1.
Table A-2. Load duration curve calculations for Assessment Unit 1104_02
Condition 0-20% 20-80% 80-100%
Median Flow (cfs) 43.35 2.67 0.24
Target Concentration (MPN/dL)1 119.7 119.7 119.7
Existing Load, Median (MPN/day) 6.12E+11 1.42E+10 1.95E+09
LDC, Median (MPN/day) 1.27E+11 7.81E+09 2.44E+092
Margin of Safety, Median (MPN/day) 6.68E+09 4.11E+08 3.64E+07
1 Reflects a 5% margin of safety on the 126 MPN/dL contact recreation standard 2 effluent dominated condition and therefore, equation A-1 cannot be used to calculate LDC directly from
presented median flow

Eight Total Maximum Daily Loads for Indicator Bacteria in Dickinson Bayou and Three Tidal Tributaries
Texas Commission on Environmental Quality 58 Adopted February 8, 2012
Appendix B. Tidal Prism Model Approach

Eight Total Maximum Daily Loads for Indicator Bacteria in Dickinson Bayou and Three Tidal Tributaries
Texas Commission on Environmental Quality 59 Adopted February 8, 2012
One essential component of a TMDL is to establish a linkage, or relationship, between pollutant sources and the water quality standard. Using this linkage, it is possible to de-termine the capacity of the water body to assimilate bacteria loadings while still support-ing its designated uses. Historically a wide range of modeling approaches and tools have been implemented to assess TMDL endpoints and required wasteload and load allocation reductions.
Most models have similar capabilities but are suited to evaluating different types of water-sheds, depending upon the water quality parameters to be evaluated, time, and spatial scales of interest, extent of available data and other site-specific conditions. In addition, model applications vary significantly in terms of the economic expense and technical complexity required to adequately determine a scientifically defensible TMDL.
Among the tools selected for use in this TMDL project was a coupled watershed/receiving water modeling strategy using HSPF combined with a tidal prism model for the tidal seg-ments. The tidal prism model was used in the EPA-approved Clear Creek TMDL for the tidal portion of Clear Creek.
Hydrological Simulation Program–Fortran Hydrological Simulation Program–Fortran (HSPF) is a highly regarded and widely used watershed model. First developed in the 1970s, it is now in its twelfth version (Bicknell et al., 2001). HSPF offers deterministic, continuous modeling of runoff and pollutant mobi-lization using a large array of lumped parameters such as land use, subwatershed area, rainfall, stream geometry and capacity, bacteria loading, and bacteria die-off rates. HSPF is designed as a spatially and temporally variable model with results generated on time-steps specified by the user, generally on an hourly or daily basis. HSPF also offers a simple one-dimensional receiving water model to simulate instream processes such as sediment resuspension and die-off.
The HSPF model developed for these TMDLs serves two purposes:
1) It supplies instream flows for the non-tidal portion of Dickinson Bayou, which supports development of LDCs for Assessment Unit 1104_01 and 1104_02 and
2) It provides runoff loads and upstream boundary conditions for flow and water quality from tidal subwatersheds, for use in the tidal prism box model.
The HSPF model requires a significant amount of input data and also requires infor-mation that describes the Dickinson Bayou watershed, including:
§ Delineation of subwatersheds § Meteorological and watershed data § Hydrologic characteristics § Bacteria loading for various sources within the watershed
A plot of the subwatersheds used in the TMDL study is presented in Figure B-1. As shown in the figure, twelve sub-basins were simulated in HSPF. Sub-basin 12 and a portion of Sub-basin 11, correspond to the non-tidal portion of Dickinson Bayou (Segment 1104).

Eight Total Maximum Daily Loads for Indicator Bacteria in Dickinson Bayou and Three Tidal Tributaries
Texas Commission on Environmental Quality 60 Adopted February 8, 2012
The remaining sub-basins were used to provide input into the tidal model described later in this Appendix.
Figure B-1. HSPF Subwatersheds HSPF requires a large number of meteorological inputs in order to execute accurate simu-lations, including precipitation, potential evapotranspiration, air temperature, dew point, solar radiation, cloud cover, and wind speed. Three meteorological stations were used for these data, including Houston National Weather Service Office (Houston NWSO – Coop-erative Station #414333), Houston Clover Field (Weather Bureau Army-Navy [WBAN] #12975, and Galveston Scholes Field (Cooperative #413430). The simulation period of the HSPF model is from June 1, 1999 through December 31, 2008. A map of the rain gage coverage for the watershed is shown in Figure B-2. The map demonstrates that only one subwatershed, Sub-basin 12, relies on Houston Clover Field for rainfall data. All other sub-basins use the Houston NWSO gage.
Other watershed information that was used in the setup of the HSPF model included soil type and land use. Land use data, presented in Table 6 of this TMDL document, provide the basis for nonpoint source loading information included in the model.
Hydrologic setup and calibration for HSPF relies on a large amount of data to specify stream characteristics as well as on the matching of the water balance simulated in the model with measurements observed in the stream. Much of the hydrology and hydraulics
TCEQ Station 11467
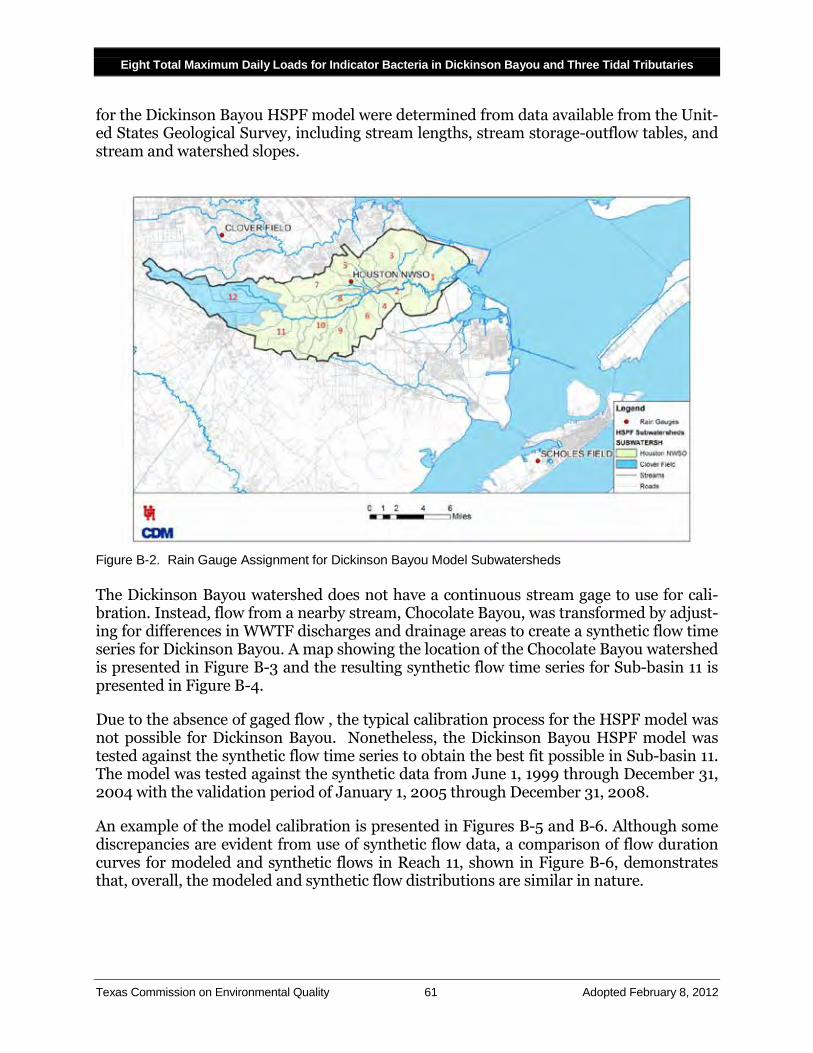
Eight Total Maximum Daily Loads for Indicator Bacteria in Dickinson Bayou and Three Tidal Tributaries
Texas Commission on Environmental Quality 61 Adopted February 8, 2012
for the Dickinson Bayou HSPF model were determined from data available from the Unit-ed States Geological Survey, including stream lengths, stream storage-outflow tables, and stream and watershed slopes.
Figure B-2. Rain Gauge Assignment for Dickinson Bayou Model Subwatersheds The Dickinson Bayou watershed does not have a continuous stream gage to use for cali-bration. Instead, flow from a nearby stream, Chocolate Bayou, was transformed by adjust-ing for differences in WWTF discharges and drainage areas to create a synthetic flow time series for Dickinson Bayou. A map showing the location of the Chocolate Bayou watershed is presented in Figure B-3 and the resulting synthetic flow time series for Sub-basin 11 is presented in Figure B-4.
Due to the absence of gaged flow , the typical calibration process for the HSPF model was not possible for Dickinson Bayou. Nonetheless, the Dickinson Bayou HSPF model was tested against the synthetic flow time series to obtain the best fit possible in Sub-basin 11. The model was tested against the synthetic data from June 1, 1999 through December 31, 2004 with the validation period of January 1, 2005 through December 31, 2008.
An example of the model calibration is presented in Figures B-5 and B-6. Although some discrepancies are evident from use of synthetic flow data, a comparison of flow duration curves for modeled and synthetic flows in Reach 11, shown in Figure B-6, demonstrates that, overall, the modeled and synthetic flow distributions are similar in nature.

Eight Total Maximum Daily Loads for Indicator Bacteria in Dickinson Bayou and Three Tidal Tributaries
Texas Commission on Environmental Quality 62 Adopted February 8, 2012
Figure B-3. Chocolate Bayou Drainage Area Location
Figure B-4. Synthetic Flow Data for Reach 11
0
500
1000
1500
2000
2500
3000
1999 2000 2001 2002 2003 2004 2005 2006 2007 2008
Flow
(cfs
)

Eight Total Maximum Daily Loads for Indicator Bacteria in Dickinson Bayou and Three Tidal Tributaries
Texas Commission on Environmental Quality 63 Adopted February 8, 2012
Figure B-5. Flow Comparison for 2004
Figure B-6. Flow Duration Curve for Synthetic and Modeled Flows, Reach 11
The simulation of water quality, specifically bacteria concentrations, was included in the HPSF model to provide runoff loads to the tidal prism model. A key calibration parameter was accumulation (build-up) and wash-off from the watershed. These surface loadings were calibrated to event mean concentrations (EMCs) from local sources and literature values.
Another key calibration process focused on matching instream bacteria concentrations at TCEQ monitoring station 11467, located at the outlet of Reach 12 and shown on Figure B-1. The resulting instream calibration is shown in Figure B-7. Limited data were available for calibration at TCEQ monitoring station 11467; only 48 data points were available be-tween December 2001 and November 2008. Because of this limited data availability, cali-bration focused on the entire period of record at Station 11467. The HSPF model repro-

Eight Total Maximum Daily Loads for Indicator Bacteria in Dickinson Bayou and Three Tidal Tributaries
Texas Commission on Environmental Quality 64 Adopted February 8, 2012
duces the range of bacteria concentrations observed during the period of record at the sta-tion. It is important to note that although the HSPF model was tested and adjusted using observed instream bacteria concentrations, the TMDL and TMDL load allocations are de-termined using the LDC method and tidal prism model.
Figure B-7. Bacteria Calibration Plot at station 11467
Tidal Prism Modeling To simulate Enterococci in the tidal portion of the watershed, a time-variable tidal prism box model was developed using Microsoft Excel for the same simulation period as the HSPF model, June 1, 1999 through December 31, 2008. The period of June 1, 1999 through November 5, 2001 was used for the calculations presented in this report because the land use, bathymetry, and boundary condition data are representative of that same period.
The tidal prism box model was developed to simulate instream loading in the tidal portion of Dickinson Bayou by taking into account the volume of water that is carried upstream by the tidal fluctuations. A conceptual model of the tidal prism box model is shown in Figure B-8.
The model segmentation in the tidal prism box model was determined based on three cri-teria:
1) The presence of a TCEQ monitoring station; 2) The presence of an assessment unit boundary; or 3) The presence of a reach boundary in HSPF.
Maintaining similar lengths of the segment was also a consideration but did not supersede the three criteria previously mentioned. The model segmentation is presented in Figure
1
10
100
1,000
10,000
100,000
1,000,000
1/1/2005 4/11/2005 7/20/2005 10/28/2005 2/5/2006 5/16/2006 8/24/2006 12/2/2006
Mod
eled
E. c
oli (
MPN
/dL)
Observed

Eight Total Maximum Daily Loads for Indicator Bacteria in Dickinson Bayou and Three Tidal Tributaries
Texas Commission on Environmental Quality 65 Adopted February 8, 2012
B-9. As shown in the figure, there are 18 model segments in the tidal prism box model, with five segments associated with tributaries.
Figure B-8. Tidal Prism Box Model Conceptual Model
Figure B-9. Tidal Prism Box Model Segmentation
The changes in volume associated with changes in water level due to tidal fluctuations are a critical component that must be accounted for in the tidal prism box model. Data used
1

Eight Total Maximum Daily Loads for Indicator Bacteria in Dickinson Bayou and Three Tidal Tributaries
Texas Commission on Environmental Quality 66 Adopted February 8, 2012
to specify the changes in water levels include stream cross-sections, tidal boundary condi-tions at Eagle Point (NOAA station 8771013), as well as inputs of WWTPs, SSOs, and the upstream boundary condition from the non-tidal portion of the watershed (from the HSPF model). Watershed runoff from tidal subwatersheds, simulated using the HSPF model was also an important component of the tidal prism box model.
The Enterococci concentration assigned to each facility was 8.3 MPN/dL, which is a value derived from E. coli sampling conducted at the Galveston County WCID No. 1 Plant. The E. coli value was transformed using the ratio of the E. coli recreational use geometric mean criteria to the Enterococci recreational use geometric mean criteria. Similarly, the SSO discharges were assigned typical Enterococci concentrations associated with SSOs of 3.1x10⁵ MPN/dL (TCEQ, 2008) reduced by 72% to reflect a delivery ratio as specified in the EPA Report on Combined and Sanitary Sewer Overflows (2004). A summary of WWTP and SSO discharges for baseline/calibrated conditions is provided in Table B-1.
Table B-1. Summary of WWTF and Sanitary Sewer Overflow Discharges in the Tidal Prism Model
Model Segment Source
Self-Reported Average
WWTF Flow (MGD)2
SSO Flow (m3/hr)
Assigned Concentra-
tion (MPN/dL) Average Load
(MPN/day)
1 Duratherm Asset Acquisition Corp 0.091 - 8.3 3.01E+08
Hillman Shrimp & Oyster Co. 0.005 - 8.3 6.28E+05
2 Via Bayou RV Park 0.002 - 8.3 6.28E+05
4 Sanitary sewer overflows (SSOs) - 3.01E-05 310,840 2.24E+06
5 SSOs - 7.22E-04 310,840 0.00E+00
6 Galveston County WCID #1 2.759 - 8.3 1.74E+09
Penreco - Dickinson TX Plant 0.057 - 8.3 1.79E+07
SSOs - 7.47E-04 310,840 5.57E+07
7 SSOs - 3.04E-03 310,840 2.27E+08
11 SSOs - 3.04E-03 310,840 2.27E+08
20 Sea Lion Technology 0.058 - 8.3 1.82E+07
30 Marlin Atlantis White n/a1 - n/a1 n/a1
SSOs 13.1 310,840 9.77E+11
40 SSOs 6.86E-02 310,840 1.02E+09
50 SSOs 7.74E-03 310,840 2.89E+08
1 The EPA PCS database does not report flow for this WWTP 2 average flow reported between November 1999 and February 2007;
The tidal prism box model was tested using salinity values, which act as a conservative tracer to confirm the adequacy of the model hydraulics as well as the simulated freshwater

Eight Total Maximum Daily Loads for Indicator Bacteria in Dickinson Bayou and Three Tidal Tributaries
Texas Commission on Environmental Quality 67 Adopted February 8, 2012
inflows and tidal exchange. Salinity data from TCEQ monitoring stations collected be-tween June 16, 1999 and October 13, 2008 were used for the calibration effort.
A plot of the average salinity concentrations longitudinally along the bayou are presented in Figure B-10. The overall average error between observed and modeled salinities at all locations over the simulation period was 17%. Based on the salinity model runs, the model hydraulics are considered sufficient to simulate the hydrodynamics of the tidal segment of Dickinson Bayou with a satisfactory level of accuracy.
Figure B-10. Longitudinal Profile of Simulated and Observed Salinity in Dickinson Bayou
To simulate bacteria, the tidal prism box model must account for several sources of bacte-ria as detailed in the conceptual model. These Enterococci sources and sinks include WWTPs, SSOs, and HSPF inflows, as well as upstream boundary conditions, downstream boundary conditions and bacteria reductions due to die-off.
Boundary conditions are an important consideration in the tidal prism box model. The downstream boundary condition in the tidal prism box model was specified using ob-served data from TCEQ monitoring station 15219. This station is close to the outlet of Dickinson Bayou and generally has concentrations near the detection limit with an aver-age concentration between 10 and 13 MPN/dL during the period it was monitored be-tween May 8, 1997 and July 27, 2005.
0
2
4
6
8
10
12
0 5000 10000 15000 20000 25000
Salin
ity
(ppt
)
Distance from Mouth of Bayou (m)
Modeled Geomean Overall Modeled Geomean Model - Average Observed - Average
Eight Total Maximum Daily Loads for Indicator Bacteria in Dickinson Bayou and Three Tidal Tributaries
Texas Commission on Environmental Quality 68 Adopted February 8, 2012
The upstream boundary condition used for the tidal prism box model was defined using E. coli concentrations simulated by HSPF simulated flows entering the tidal portion of the Dickinson Bayou watershed; these E. coli concentrations were transformed into Entero-cocci concentrations using a ratio of the geometric mean criteria for contact recreation (35/126). Like the upstream boundary condition, all E. coli runoff concentrations simu-lated in the HSPF model were also transformed into Enterococci concentrations using this ratio. The transformed bacteria concentrations were input into the tidal prism box model as point sources for each model segment. The TMDL was calculated based on median flows for each assessment unit simulated in the tidal prism model for the period from June 1, 1999 through November 5, 2001.
Eight Total Maximum Daily Loads for Indicator Bacteria in Dickinson Bayou and Three Tidal Tributaries
Texas Commission on Environmental Quality 69 Adopted February 8, 2012
Appendix C. Future Growth Analysis

Eight Total Maximum Daily Loads for Indicator Bacteria in Dickinson Bayou and Three Tidal Tributaries
Texas Commission on Environmental Quality 70 Adopted February 8, 2012
Methodology The methodology used to predict future growth to 2050 is based on the approach used in the Clear Creek TMDL effort. This appendix describes the procedure used for the future growth prediction.
Municipal Wastewater Projections Municipal wastewater flow projections are based on the population difference between the 2010 population estimate and the 2050 population estimates obtained from the Texas Water Development Board (TWDB). If a WWTF was located within a city, the population growth for that city was used to project future WWTF flows; otherwise, county population projections were used. Table C-1 presents the population estimates for 2010 and 2050 for cities and counties in the Dickinson Bayou watershed.
Next, the per capita permitted flow for each city in the watershed was determined for 2010. To do this, permitted flows were obtained for all WWTFs within the cities. A sum-mary of the WWTFs used to calculate the total flow by city is shown in Table C-2 and a summary of the per capita flow by city is shown in Table C-3. The future permitted flow for 2050 was projected using the calculated per capita flow, and is included in Table C-3.
For WWTFs within city limits, the amount of the city’s wastewater flow made up by the facility was determined and is shown in Table C-4. For example, at Galveston County WCID No.1, the permitted flow is 4.8 MGD in 2010. As shown in Table C-3, the total per-mitted flow in the City of Dickinson is 4.8 MGD and thus the facility comprises 100% of the City of Dickinson’s permitted flow. Then, to arrive at the 2050 permitted flow for the facility, the estimated future permitted flow for the city was multiplied by the percentage of the city’s wastewater flow handled by the WWTF.
Table C-1 . Summary of Population Estimates for Dickinson Bayou Watershed
City/County
2000 U.S. Census Population
2010 Population Estimate
2050 Population Estimate
Percent Increase
(2000-2050)
Alvin 21,413 23,231 30,375 42%
Dickinson 17,093 19,955 24,921 46%
Friendswood 29,037 32,353 38,107 31%
League City 45,444 53,546 67,613 49%
Manvel 3,046 3,046 3,046 0%
Santa Fe 9,548 10,141 11,170 17%
Texas City 41,521 41,891 42,534 2%
Galveston County 250,158 268,714 300,915 20%
Brazoria County 241,767 285,850 459,078 90%

Eight Total Maximum Daily Loads for Indicator Bacteria in Dickinson Bayou and Three Tidal Tributaries
Texas Commission on Environmental Quality 71 Adopted February 8, 2012
For WWTFs not located within a city, a slightly different approach was taken. In this case, the growth expected between 2010 and 2050 for the county was used to estimate the pro-jected wastewater flows for the facility. For example, the Meadowland WWTF (TPDES ID 13632-001) is located in Brazoria County, which is expected to grow by 90% between 2010 and 2050. Therefore, the 2010 permitted flow was increased by 90% to reflect this growth, estimated to be 0.095 MGD.
Table C-2. Summary of Permitted Flows by City
City or County
TCEQ Permit ID NPDES ID Permittee
Assessment Unit
Permitted Flow (MGD)
Dickinson 14570-001 TX0127248 Marlin Atlantis White Ltd 1103_02 0.5
Dickinson 10173-001 TX0023655 Galveston County WCID 1 1103_02 4.8
Texas City 14326-001 TX0124761 Via Bayou RV Park 1103_02 0.02
Texas City 10375-001 TX0023949 City of Texas City 1103_04 12.4
Santa Fe 10174-001 TX0023671 Galveston County WCID No. 8 n/a 1.5
League City 10568-003 TX0071447 City of League City n/a 0.66
League City 10568-005 TX0071447 City of League City n/a 7.5
Santa Fe 10174-001 TX0023671 Galveston County WCID No. 8 n/a 1.5
Bacliff 10627-001 TX0021369 Bacliff MUD 1103_02 1.03
Table C-3. Per Capita Flow by City
City
Per capita Gallons Per
Day
Total permitted flow (MGD) -
2010
Total permitted flow (MGD) -
2050
Dickinson 2.41E-04 4.80 5.99
League City 1.52E-04 8.16 10.30
Texas City 3.19E-04 13.37 13.58
Santa Fe 1.48E-04 1.50 1.65
Industrial Wastewater Projections For industrial facilities, the expected increase in industrial water demand calculated by the TWDB between 2010 and 2050 was used to estimate future WWTF discharges. A summary of the water demands is presented in Table C-5 for Dickinson Bayou watershed. As shown in the table, increases of 27% to 36% are expected in the watershed.
Next, to determine the 2050 permitted flow, the permitted flow for each industrial facility was multiplied by the growth in industrial water demand expected for the county in which it is located; the values were obtained from TWDB. A summary of projected permitted

Eight Total Maximum Daily Loads for Indicator Bacteria in Dickinson Bayou and Three Tidal Tributaries
Texas Commission on Environmental Quality 72 Adopted February 8, 2012
flows is presented in Table C-6. Permitted flows from industrial facilities are expected to range between 0.025 MGD to 1.051 MGD in 2050.
Table C-4. Summary of Future Permitted Flows by WWTF
TCEQ Permit Permittee
City/Location of Outfall
2010 Per-mitted Flow
(MGD) Percent of city flow
Percent growth in
county
2050 Per-mitted Flow
- All
10173-001 GALVESTON COUNTY WCID No.1 -WWTP
Dickinson 4.800 100% n/a3 5.995
14570-001 MARLIN ATLANTIS WHITE
Dickinson 0.52 33% n/a3 1.998
14326-001 VIA BAYOU RV PARK Texas City 0.020 0.15% n/a3 0.020
14440-001 BRAZORIA COUNTY MUD NO. 24
Brazoria Co. 0.95 n/a1 90% 1.804
12935-001 PINE COLONY WWTF Brazoria Co. 0.050 n/a1 90% 0.095
13632-001 MEADOWLAND UTILITY WWTF
Brazoria Co. 0.023 n/a1 90% 0.044
1 Facility not located within city limits 2 Facility not yet in operation 3 City flow used to predict population growth
Table C-5. Summary of Future Industrial Water Demands for Dickinson Bayou Watershed
County 2010 Water
Demand (acre-ft) 2050 Water Demand
(acre-ft) Percent increase in industrial water use
Galveston 41,005 51,967 27%
Brazoria 260,239 354093 36%
Table C-6. Summary of Permitted Industrial WWTF Discharges in 2050
TCEQ ID Facility name County Permitted
Flow (MGD)
2050 Permitted
Flow (MGD)
03416-000 WASTE MANAGEMENT OF TEXAS INC Galveston 0.8291 1.051
03479-000 SEA LION TECHNOLOGY Galveston 0.020 0.025
04086-001 DURATHERM ASSET ACQUISITION CORP Galveston 0.0911 0.115
00377-000 PENRECO - DICKINSON TX PLANT Galveston 0.075 0.095
03749-001 HILLMAN SHRIMP & OYSTER CO. Galveston 0.070 0.089
Intermittent flow, average reported flow used instead Permitted flow not available

Eight Total Maximum Daily Loads for Indicator Bacteria in Dickinson Bayou and Three Tidal Tributaries
Texas Commission on Environmental Quality 73 Adopted February 8, 2012
Appendix D. Method for Calculating TMDL Allocations for
Revised Contact Recreation Standards

Eight Total Maximum Daily Loads for Indicator Bacteria in Dickinson Bayou and Three Tidal Tributaries
Texas Commission on Environmental Quality 74 Adopted February 8, 2012
The method described below details the equations and procedure that will be used for re-vising the TMDLs and associated wasteload allocations detailed in this document for the assessment units in the Above-tidal Segment of Dickinson Bayou (Segment 1104) should the water quality standards change in the future. Provisions for revising TMDL and TMDL allocations to reflect changes in criteria in the assessments units of Dickinson Bay-ou Tidal (1103) have not been developed at this time, as there are currently no contact rec-reation standard revisions under consideration for tidal segments in Texas.
Assessment Unit 1104_01
Equations for Calculating New TMDL and Allocations TMDL = 0.2849 * Std+ 2.17
LA = 0.2536* Std + 0.19
WLAStormwater = 0.0171* Std- 0.01
WLAWWTF = 1.97
where:
WLAWWTF = wasteload allocation (permitted WWTF);
WLA stormwater = wasteload allocation (permitted stormwater);
126 630 1200 20602.0
37
185
352
605
31
153
291
500
20 34
-50
50
150
250
350
450
550
650
0 500 1,000 1,500 2,000 2,500
Load
(109 o
rg/d
ay)
Criterion (org/100mL)
WLAwwtf WLAstorm water LA TMDL

Eight Total Maximum Daily Loads for Indicator Bacteria in Dickinson Bayou and Three Tidal Tributaries
Texas Commission on Environmental Quality 75 Adopted February 8, 2012
LA = load allocation (unregulated source contributions);
Std = Revised Contact Recreation criteria.
Assessment Unit 1104_02
Equations for Calculating New TMDL and Allocations TMDL = 0.643 * Std + 0.49
LA = 0.0359 * Std - 1.14
WLAStormwater = 0.0251 * Std - 0.80
WLAWWTF = 2.44
where:
WLAWWTF = wasteload allocation (permitted WWTF);
WLAStormwater = wasteload allocation (permitted stormwater);
LA = load allocation (unregulated source contributions);
Std = Revised Contact Recreation criteria
126 630 1200 2060
2.4
10
43
80
135
3
22
42
73
30
51
-20
0
20
40
60
80
100
120
140
160
0 500 1,000 1,500 2,000 2,500
Load
(109 o
rg/d
ay)
Criterion (org/100mL)
WLAwwtf WLAstorm water LA TMDL