eindhoven university of technology master …density, porosity, thermal conductivity and drying...
TRANSCRIPT

Eindhoven University of Technology
MASTER
Application of alternative materials in autoclaved aerated concrete
Segers, S.
Award date:2016
Link to publication
DisclaimerThis document contains a student thesis (bachelor's or master's), as authored by a student at Eindhoven University of Technology. Studenttheses are made available in the TU/e repository upon obtaining the required degree. The grade received is not published on the documentas presented in the repository. The required complexity or quality of research of student theses may vary by program, and the requiredminimum study period may vary in duration.
General rightsCopyright and moral rights for the publications made accessible in the public portal are retained by the authors and/or other copyright ownersand it is a condition of accessing publications that users recognise and abide by the legal requirements associated with these rights.
• Users may download and print one copy of any publication from the public portal for the purpose of private study or research. • You may not further distribute the material or use it for any profit-making activity or commercial gain

Application of alternative materials in autoclaved
aerated concrete 7SS37 Graduation project
Student: S. Segers (Sven) Supervisors:
ID no. 0927813 Dipl.-Min C. Straub (Chris)
Academic year: 2015-2016 Dr. Dipl. Ing. M.V.A. Florea (Miruna)
7SS37 Graduation project Prof. Dr. Ir. H.J.H. Brouwers (Jos)

2
Abstract
The research project focused on the application of several alternative materials in autoclaved
aerated concrete or AAC. AAC is an inorganic, porous and lightweight building material. Within this
research, it is produced from quartz powder, Portland cement, lime, anhydrite, portlandite,
aluminium powder (as aerating agent) and water. Autoclaving (hydrothermal curing) is then applied
in order to greatly improve the strength. The main binding phase of the AAC matrix is tobermorite
which is formed during the autoclaving. The final AAC material is a low-energy material which
provides excellent lightweight, structural, insulating and durability properties.
The investigated alternative materials are tuff ash, trass, basalt, copper slag and granite. Tuff ash is
non-solidified volcanic ash and often contains other materials such as pumice and clay. On the other
hand, trass is a solidified volcanic tuff rock which is finely milled and used for the production of trass-
cement. Basalt is a commonly available volcanic rock material (consolidated basaltic lava). It is a very
fine-grained silicate rock rich in magnesium and iron. Copper slag or Cu slag is a by-product of the
pyro-metallurgical production of copper from copper ores. Finally, granite is a hard, coarse-grained,
crystalline, volcanic rock essentially composed of quartz, feldspar and mica, which is commonly
available all over the world.
The utilisation of alternative materials has four major advantages. Firstly, production costs can be
reduced because alternative materials are less expensive. Secondly, the environmental impact of the
alternative material itself (e.g. no landfilling) and/or AAC material (e.g. replacing cement) can be
reduced. Thirdly, the range of selection of raw materials can be expanded, and as last, the
performance of AAC can be improved by the incorporation of alternative materials.
As first, a characterisation of all the raw materials was conducted. Before the actual study of the
alternative material, a small preliminary study was performed first during which mainly the influence
on the workability was investigated. Next, reference samples and AAC samples incorporating the
alternative material with various replacement levels were produced and autoclaved following an
extensive production process. Tuff ash, basalt, copper slag and granite are applied as substitution
material for quartz powder, whereas trass is applied as replacement material for Portland cement.
During the production process, the green body properties (before autoclaving) are determined: the
slump flow, the rising and setting development, the temperature development and the green body
strength. After autoclaving, the final AAC samples are tested on several final properties: strength,
density, porosity, thermal conductivity and drying shrinkage. The experimental results indicated that
the water content plays a crucial role in the properties of AAC. The performance and the engineering
applications of the AAC samples were assessed, and the application of the alternative material in AAC
was evaluated.
Ground tuff ash (mining residue, unused material) is successfully applied in AAC replacing quartz
which makes up two thirds of the total amount of raw materials. Moreover, the complete
replacement of quartz by GTA is achieved with the material still exhibiting relatively good properties.
Substitution levels up to 40% are even beneficial for the performance of AAC. In conclusion, a
possible useful application is provided for the tuff ash. Furthermore, the partial replacement of
cement by trass is successfully achieved for substitution levels up to 75%. The optimum level is 50%
which is beneficial for the AAC performance. Thus, the cement content can be lowered which leads
to a reduced environmental impact and costs of the final AAC product.

3
The basalt has a lower water demand compared to the quartz powder and therefore influences the
workability. The quartz in AAC can be completely replaced by basalt, although the resulting AAC
material performs poorly. A certain amount of quartz is required because basalt is supposed to be an
inert filler material. Substitution levels up to 80% are successful, while 60% is the optimal level as this
provides the most enhanced performance, especially greatly improved strength and drying
shrinkage.
Only two samples with copper slag (industrial by-product) at substitution levels 20 and 40% were
produced due to the limited availability of the material. The Cu slag partially replaces the quartz and
serves both partially as an inert filler and partially reacts within the AAC matrix. The material affects
the workability because it has a lower water demand. The copper slag samples exhibited great
strength while the other properties are less affected. In addition, the drying shrinkage also improves.
Although this study was limited, the conclusion is that the slag is a very promising alternative
material to be applied in AAC.
The commonly available granite is applied as substitution material for quartz. The granite has a lower
water demand which required reductions in the water content of the mix designs. Within the AAC
matrix, the granite grains (same as basalt and copper slag) partially act as strong inert fillers, while
the quartz present in the granite reacts. Moreover, the behaviour of the granite, basalt and Cu slag in
AAC is relatively similar. The granite can completely replace the quartz powder, and the resulting
AAC still exhibits good properties which are similar as the reference properties. Substitution levels up
to 80% result in an enhanced performance. In fact, AAC with 80% granite and 20% quartz is the best
performing sample of the entire research. Unfortunately, the drying shrinkage could not be
determined due to lack of time, but it is expected that the drying shrinkage also significantly
improves, similar as observed for the basalt and copper slag. In conclusion, granite is the most
promising alternative material to be applied as raw material in the production of AAC.

4
Table of contents
List of figures and tables .................................................................................................................... 7
List of figures ........................................................................................................................... 7
List of tables........................................................................................................................... 10
List of symbols and abbreviations ................................................................................................. 12
List of cement notations ................................................................................................................... 13
List of minerals .................................................................................................................................. 13
1. Introduction................................................................................................................................ 14
1.1. Background ............................................................................................................................ 14
1.2. Problem statement ................................................................................................................ 14
1.3. Outline of the research – experimental work ....................................................................... 17
2. Production process ................................................................................................................... 19
2.1. Raw materials ........................................................................................................................ 19
2.1.1. Alternative materials ..................................................................................................... 20
2.2. Recipes................................................................................................................................... 25
2.3. Production process ................................................................................................................ 26
2.3.1. Raw materials preparation ............................................................................................ 26
2.3.2. Mixing ............................................................................................................................ 26
2.3.3. Casting ........................................................................................................................... 26
2.3.4. Rising and setting .......................................................................................................... 27
2.3.5. Autoclaving .................................................................................................................... 27
2.3.6. Cutting ........................................................................................................................... 27
3. Testing methodologies ............................................................................................................. 29
3.1. Drying - moisture content ..................................................................................................... 29
3.2. Slump flow ............................................................................................................................. 29
3.3. Initial setting time: Vicat test ................................................................................................ 30
3.4. Green body properties .......................................................................................................... 31
3.5. Density – porosity .................................................................................................................. 32
3.6. Strength ................................................................................................................................. 33
3.7. Thermal conductivity ............................................................................................................. 34
3.8. Drying shrinkage .................................................................................................................... 34
4. Results ......................................................................................................................................... 36
4.1. Reference samples ................................................................................................................ 36

5
4.1.1. Green body properties .................................................................................................. 36
4.1.2. Final product properties ................................................................................................ 38
4.2. Preliminary study: trass and tuff ash in AAC ......................................................................... 40
4.2.1. Slump flow ..................................................................................................................... 40
4.2.2. Initial setting time (Vicat test) ....................................................................................... 42
4.3. Application of trass and tuff in AAC ...................................................................................... 42
4.3.1. Mix designs .................................................................................................................... 42
4.3.2. General observations during production process ......................................................... 43
4.3.3. Green body properties .................................................................................................. 45
4.3.4. Final product properties ................................................................................................ 52
4.4. Preliminary study: basalt in AAC ........................................................................................... 62
4.4.1. Slump flow ..................................................................................................................... 62
4.4.2. Initial setting time .......................................................................................................... 63
4.5. Application of basalt in AAC .................................................................................................. 64
4.5.1. Mix designs .................................................................................................................... 64
4.5.2. General observations during production process ......................................................... 65
4.5.3. Green body properties .................................................................................................. 65
4.5.4. Final product properties ................................................................................................ 67
4.6. Application of copper slag in AAC ......................................................................................... 70
4.6.1. Mix designs .................................................................................................................... 70
4.6.2. General observations during production process ......................................................... 70
4.6.3. Green body properties .................................................................................................. 71
4.6.4. Final product properties ................................................................................................ 72
4.7. Application of granite in AAC ................................................................................................ 74
4.7.1. Preliminary study: slump flow ....................................................................................... 74
4.7.2. Mix designs .................................................................................................................... 75
4.7.3. General observations during production process ......................................................... 76
4.7.4. Green body properties .................................................................................................. 76
4.7.5. Final product properties ................................................................................................ 78
5. Discussion ................................................................................................................................... 81
5.1. Discussion of the reference samples ..................................................................................... 81
5.2. Preliminary study trass & tuff in AAC .................................................................................... 83
5.2.1. Influence on slump flow ................................................................................................ 83
5.2.2. Influence on setting ....................................................................................................... 84

6
5.2.3. Further research ............................................................................................................ 85
5.3. Application of trass & tuff ash in AAC ................................................................................... 86
5.3.1. Natural tuff ash .............................................................................................................. 86
5.3.2. Ground tuff ash ............................................................................................................. 90
5.3.3. Trass substituting Portland cement............................................................................... 97
5.3.4. Trass substituting quartz ............................................................................................. 103
5.4. Preliminary study basalt in AAC .......................................................................................... 105
5.4.1. Influence on slump flow .............................................................................................. 105
5.4.2. Influence on setting ..................................................................................................... 105
5.5. Application of basalt in AAC ................................................................................................ 107
5.5.1. Green body properties ................................................................................................ 107
5.5.2. Final properties ............................................................................................................ 109
5.5.3. General ........................................................................................................................ 114
5.6. Application of copper slag in AAC ....................................................................................... 117
5.6.1. Green body properties ................................................................................................ 117
5.6.2. Final properties ............................................................................................................ 118
5.6.3. General ........................................................................................................................ 121
5.7. Application of granite in AAC .............................................................................................. 122
5.7.1. Preliminary study ......................................................................................................... 122
5.7.2. Green body properties ................................................................................................ 123
5.7.3. Final properties ............................................................................................................ 125
5.7.4. General ........................................................................................................................ 128
6. Conclusions ............................................................................................................................... 132
References......................................................................................................................................... 135
Appendix 1: Recipes ........................................................................................................................ 136

7
List of figures and tables
List of figures
Figure 1: Flow chart of the investigation process of the suitability of an alternative material in AAC. 16
Figure 2: Particle size distribution of the raw materials. 20
Figure 3: Particle size distribution of the alternative materials. 21
Figure 4: Ground tuff ash (left), natural tuff ash (middle) and trass (right). 22
Figure 5: Natural tuff ash placed in water. Different types of coarse particles can be observed. 22
Figure 6: Microscopy pictures of basalt powder. 23
Figure 7: Microscopy pictures of copper slag powder. 24
Figure 8: Microscopy pictures of the granite powder. 24
Figure 9: The mixer and mould. 26
Figure 10: The autoclave. 27
Figure 11: Test cubes with dimensions 10x10x10 cm³ are cut for raw density and compressive
strength measurements (left), and test prisms with dimensions 4x4x16 cm³ are cut for
drying shrinkage measurements (right). 28
Figure 12: Cone to determine the slump flow, developed by HESS AAC Systems B.V. 29
Figure 13: Cone to measure the penetration depth (cone height 10 cm), developed by HESS AAC
Systems B.V. 32
Figure 14: Penetration tool to measure the green strength, developed by HESS AAC Systems B.V. 32
Figure 16: Polishing machine. 33
Figure 15: Compressive strength testing equipment. 33
Figure 17: Thermal conductivity measurement. 34
Figure 18: Length measurement instrument (height sample is 16 cm). 35
Figure 19: Penetration depth in function of time for several reference samples. 36
Figure 20: Temperature development of the reference green bodies. 37
Figure 21: Rising development of the reference green bodies. 37
Figure 22: Comparison of the strength of the different reference samples. 38
Figure 23: Comparison of the raw (left) and specific (right) density values of the different reference
samples. 39
Figure 24: Comparison of the porosities of the different reference samples (left) and thermal
conductivity plot of several reference samples (right). 39
Figure 25: Relationship between the substitution level and the slump flow of AAC mixtures
incorporating trass or tuff ash. 41
Figure 26: Graphical representation of the initial setting times. 42
Figure 27: Left: Colour differences of the GTA samples (from top to bottom: 100%, 80%, 60%, 40%
and 20% GTA). Right: Colour differences of the trass for cement samples (from top to
bottom: 75%, 60%, 50%, 40% and 25% trass). Length of a sample is 16 cm. 43
Figure 28: Surface of the NTA1 sample (30 cm wide). 44
Figure 29: Microscopy pictures of several larger particles: a) dark-coloured aggregate. b) very big
particle in NTA1 sample – interaction with AAC structure. c) pumice. 44
Figure 30: Microscopy pictures of several cut big particles: a) cut pumice aggregate. b) cut dark-
coloured aggregate. c) detail of the dark-coloured aggregate and the AAC structure. 44
Figure 31: Crack in autoclaved aerated concrete sample (length 8 cm). 45

8
Figure 32: The large pores of the NTA 3 sample (top: NTA3, bottom: Reference 6). 45
Figure 33: Temperature development of the NTA samples. 46
Figure 34: Rising development of the NTA samples. 46
Figure 35: Penetration depth in function of time for NTA samples. 47
Figure 36: Temperature development of the GTA samples. 48
Figure 37: Rising development of the GTA samples. 48
Figure 38: Plot of the penetration depth in function of time for the GTA samples. 48
Figure 39: Plot of the green strength. 49
Figure 40: Temperature development of the trass substituting cement samples. 50
Figure 41: Rising development of the trass substituting cement samples. 50
Figure 42: Graph of the penetration depth in function of time for the trass substituting cement
samples. 50
Figure 43: Temperature development of the trass substituting quartz sample (left). 51
Figure 44: Rising development of the trass substituting quartz sample (right). 51
Figure 45: Plot of penetration depth in function of time for the trass substituting quartz sample. 51
Figure 46: Plot of the strength of the NTA samples. 53
Figure 47: Plot of the density of the NTA samples. 53
Figure 48: Plot of the porosity of the NTA samples, on the left. 54
Figure 49: Plot of the thermal conductivity of the NTA samples, on the right. 54
Figure 50: Total length change in function of the substitution level (left) and relative length change in
function of the moisture content (right) for the NTA samples. 54
Figure 51: Graphical representation of relationship between the GTA content and the strength. 55
Figure 52: Plot of the CaO to SiO2 ratio versus the A-value of the GTA samples. 56
Figure 53: Graphical representation of relationship between the GTA content and the density (raw +
specific). 56
Figure 54: Graphical representation of relationship between the GTA content and the porosity. 57
Figure 55: Graphical representation of relationship between the GTA content and the thermal
conductivity. 57
Figure 56: Graphical representation of relationship between the GTA content and the total length
change. 57
Figure 57: Plot of the relative length change against the moisture content for the GTA samples. 58
Figure 58: Plot of the strength in function of the trass content (replacement of cement). 59
Figure 59: Plot of the CaO to SiO2 ratio versus the A-value of the trass replacing cement samples. 59
Figure 60: Plot of the density in function of the trass content (replacement of cement). 60
Figure 61: Plot of the porosity in function of the trass content (replacement of cement). 60
Figure 62: Plot of thermal conductivity in function of the trass content (replacement of cement). 61
Figure 63: Plot of the total length change in function of the trass content (replacement of cement). 61
Figure 64: Plot of the relative length change in function of the moisture content (trass replacing
cement) 61
Figure 65: Relationship between the substitution level and the slump flow for different W/S ratios
(pre-study basalt). 63
Figure 66: Graphical representation of initial setting time of basalt samples (preliminary study). 64
Figure 67: Picture of the basalt samples (length sample 16 cm). From bottom to top: increasing basalt
content, starting from reference. 65
Figure 68: Temperature development of the green bodies of the basalt samples. 66

9
Figure 69: Rising development of the green bodies of the basalt samples. 66
Figure 70: Setting development (penetration depth) of the green bodies of the basalt samples. 67
Figure 71: Plot of the strength values of the basalt samples. 68
Figure 72: Plot of the density values of the basalt samples. 68
Figure 73: Plot of the porosity values of the basalt samples. 69
Figure 74: Plot of the thermal conductivity values of the basalt samples. 69
Figure 75: Total length change of the basalt samples against their substitution level. 69
Figure 76: Relative length change of the basalt samples against their moisture content. 70
Figure 78: Temperature development of the copper slag samples. 71
Figure 77: Picture of the copper slag samples including reference (width sample 16 cm). Bottom:
reference, middle: 20% Cu slag sample and top: 40% Cu slag sample. 71
Figure 79: Rising development of the copper slag samples. 72
Figure 80: The setting development (penetration depth) of the copper slag samples. 72
Figure 81: Relationship between the strength and the copper slag content. 73
Figure 82: Relationship between the density and the copper slag content. 73
Figure 83: Relationship between the porosity and the copper slag content, on the left side. 74
Figure 84: Relationship between the thermal conductivity and the copper slag content, on the right
side. 74
Figure 85: On the left side, the total length change against the substitution level. On the right side,
relative length change against the moisture content. 74
Figure 86: Slump flow values of AAC mixtures with granite in function of the substitution level
(preliminary study). 75
Figure 87: The granite samples (length sample 16 cm), from bottom to top: reference to granite 7.
The colour differences are clearly visible. 76
Figure 88: Temperature development of the AAC samples with granite, including reference. 77
Figure 89: Rising development of the AAC samples with granite, including reference. 78
Figure 90: Penetration depth development in time of the AAC samples with granite, including
reference. 78
Figure 91: Strength values of the AAC samples with granite in function of the substitution level. 79
Figure 92: Density values of the AAC samples with granite in function of the substitution level. 80
Figure 93: Porosity values of the AAC samples with granite in function of the substitution level. 80
Figure 94: Thermal conductivity values of the AAC samples with granite in function of the substitution
level. 80
Figure 95: Raw density versus compressive strength (ground tuff ash). 93
Figure 96: Plot of the A-value (left) and thermal conductivity (right) against the porosity. 96
Figure 97: Plot of the A-value against the thermal conductivity. 96
Figure 98: Raw density versus compressive strength (trass replacing cement). 99
Figure 99: Thermal conductivity versus raw density (trass replacing cement). 101
Figure 100: Correlation between the A-value (left) and the thermal conductivity (right) with the
porosity. 103
Figure 101: Correlation of the A-value with the thermal conductivity. 103
Figure 102: Raw density versus compressive strength (basalt). 110
Figure 103: Thermal conductivity versus porosity (basalt). 112
Figure 104: The raw density versus the porosity on the left side, the thermal conductivity versus the
porosity on the right side. 115

10
Figure 105: The A-value versus the raw density (left side) and the porosity (right side). 115
Figure 106: The A-value versus the thermal conductivity. 116
Figure 107: Raw density versus compressive strength (granite). 126
Figure 108: Thermal conductivity versus porosity (granite samples). 128
Figure 109: The raw density (left side) and the thermal conductivity (right side) plotted against the
porosity. 130
Figure 110: The A-value plotted against the raw density (left side) and the porosity (right side). 131
Figure 111: The A-value plotted against the thermal conductivity. 131
List of tables
Table 1: Physical parameters of the raw materials. 19
Table 2: Chemical composition of the raw materials by means of XRF analysis. 20
Table 3: Chemical composition (main elements) of trass and tuff ash. 22
Table 4: Chemical composition of basalt by means of XRF analysis. 23
Table 5: Chemical composition of copper slag. 24
Table 6: Chemical composition of granite. 25
Table 7: Reference mix design. 25
Table 8: Green body properties of reference samples. 36
Table 9: Final AAC product properties of reference samples. 38
Table 10: Influence of moisture content on compressive strength, and verification standard. 40
Table 11: Influence of moisture content on thermal conductivity of reference sample. 40
Table 12: Slump flow values of reference mixture and AAC mixtures incorporating trass or tuff ash. 41
Table 13: Slump flow values of AAC mixtures containing natural tuff ash or ground tuff ash with
modified W/S ratio. 41
Table 14: Initial setting time of reference mix and AAC mixes incorporating trass and tuff ash. 42
Table 15: Values for several green body properties of the NTA samples. 46
Table 16: Green body properties of the GTA samples. 47
Table 17: Green body properties of the trass substituting cement samples. 49
Table 18: Green strength of the trass substituting cement samples. 49
Table 19: Several green body properties of the trass substituting quartz sample. 51
Table 20: Final properties of the AAC samples incorporating natural tuff ash. 52
Table 21: Final AAC properties of the GTA samples. 54
Table 22: The final product properties of the AAC samples with trass as replacement of cement. 58
Table 23: Final properties of the TrQ1 sample (trass substituting quartz), as well as the reference
properties. 62
Table 24: Slump flow of basalt mixtures (preliminary study). 63
Table 25: Initial setting time of basalt samples (preliminary study). 64
Table 26: Mix designs of the AAC samples with basalt. 64
Table 27: Green body properties of the basalt samples. 65
Table 28: Final material properties of the basalt samples. 67
Table 29: The green body properties of the copper slag samples. 71
Table 30: Final AAC properties of the two copper slag samples. 72
Table 31: Slump flow values of AAC mixtures with granite (preliminary study). 75
Table 32: Mix design parameters of the granite AAC samples. 76

11
Table 33: The green body properties of the AAC samples with granite. 77
Table 34: The final product properties of the AAC samples with granite. 79
Table 35: Change in A-value expressed in percentage in function of the GTA content. 92
Table 36: Concluding performance evaluation. 134
Table 37: Reference recipe, provided by HESS AAC Systems B.V. 136
Table 38: Recipes natural tuff ash samples. 137
Table 39: Recipes ground tuff ash samples. 138
Table 40: Recipe trass substituting quartz sample. 139
Table 41: Recipes trass substituting cement samples. 140
Table 42: Recipes basalt samples. 141
Table 43: Recipes copper slag samples. 142
Table 44: Recipes granite samples. 143

12
List of symbols and abbreviations
AAC Autoclaved aerated concrete BAS Basalt CEM Cement CS Compressive strength CuS Cu-slag cp Volumetric heat capacity C/S Calcium to silica ratio GRA Granite GTA Ground tuff ash heff Effective height hrise Rising height IST Initial setting time LOI Loss on ignition LVDT Linear variable differential transformer mdry Dry mass mraw Raw mass (wet) mc Moisture content min Minute MS Micro-silica NS Nano-silica NTA Natural tuff ash pH Degree of acidity or alkalinity PSD Particle size distribution q Specific heat flow Q Specific cumulative heat R² Correlation coefficient REF Reference SF Slump flow Tmax Maximum temperature To Outlet temperature Tw Water temperature Tr Trass TS Total of solids WG Waste glass W/S Water to solid ratio XRF X-ray fluorescence λ Thermal conductivity ρapp Apparent density ρspecific Specific density σc Compressive strength σgreen Green strength φ Porosity

13
List of cement notations
Cement notation Chemical formula Chemical name Alternative name
A Al2O3 Aluminium oxide Alumina C CaO Calcium oxide Quicklime CO2 Carbon di-oxide - F Fe2O3 Iron oxide - H H2O Water - N Na2O Sodium oxide - S SiO2 Silicon dioxide Silica
SO3 Sulphur trioxide -
C3S 3 CaO ∙ SiO2 Tri-calcium silicate Alite C2S 2 CaO ∙ SiO2 Di-calcium silicate Belite C3A 3 CaO ∙ Al2O3 Tri-calcium aluminate - C4AF 4 CaO ∙ Al2O3 ∙ Fe2O3 Tetra-calcium alumina
ferrite -
CH Ca(OH)2 Calcium hydroxide Slaked lime C CaSO4 Calcium sulphate -
C H2 CaSO4∙2H2O Calcium sulphate di-hydrate
-
C-S-H CaO ∙ SiO2 ∙ H2O Calcium silicate hydrate CSH C-A-S-H CaO ∙ Al2O3 ∙ SiO2 ∙ H2O Calcium aluminate
silicate hydrate CASH
C3A 3H30-32 3 CaO ∙ Al2O3 ∙ 3 SO3 ∙ 30 H2O Calcium aluminium tri-sulphate hydrate
Tri-sulphate (AFt phase)*
C4A H12 3CaO∙Al2O3∙CaSO4∙12H2O Calcium aluminium mono-sulphate hydrate
Mono-sulphate (AFm phase)*
C4A H11 3CaO∙Al2O3∙CaCO3∙11H2O Mono-carbonate (AFm phase)*
*AFt (tri) and AFm (mono) represent a group of calcium aluminium (sulphate, carbonate) hydrates.
List of minerals
Chemical formula Cement notation Mineral name
SiO2 S Quartz Al2O3 A Corundum Fe2O3 F Hematite CaO C Lime Ca(OH)2 CH Portlandite CaSO4 C Anhydrite CaSO4∙2H2O C H2 Gypsum Ca6Al2(SO4)3(OH)12∙26H2O C3A 3H30-32 Ettringite* Ca3Al2(SiO4)3-x(OH)4x C3AH6 Katoite** Ca5(SiO4)1.5(SO4)1.5(OH) C5S1.5 1.5H0.5 Hydroxyl-ellestadite Ca4Si6O17(H2O)2·(Ca∙3H2O) C5S6H5 Tobermorite (11Å) Ca6Si6O17(OH)2 C6S6H Xonotlite *Ettringite is the most common mineral of the AFt group.
**Katoite (1.5<x<3.0) is member of the hydrogarnet family which is a large group of minerals (general
formula: A3B2(SiO4)3-x(OH)4x).

14
1. Introduction
1.1. Background
Autoclaved aerated concrete or AAC (cellenbeton in Dutch) is defined as an inorganic porous building
material. It is produced from a silica-rich material (usually quartz sand or pulverised fuel ash), lime,
cement and aluminium powder as aerating agent, together with a high amount of water. The
aluminium powder reacts with calcium hydroxide to form hydrogen gas, which lifts the material.
Autoclaving, also called hydrothermal curing (high pressure steam curing) is then applied in order to
greatly improve the strength of the material. Under the high pressure and temperature, the formed
C-S-H gel is converted into tobermorite crystals, which is the main binding phase [2].
AAC is a lightweight and low-energy building material, providing good structural, insulating (both
thermal and acoustical), workability, fire- and mould-resisting properties. In cement and concrete,
application of many different replacement materials have found their way and a lot of research
regarding this topic has been conducted. On the contrary, few researches are dedicated to
investigate the feasibility and application possibilities of alternative materials in autoclaved aerated
concrete, although this topic has gained attention during the recent years. Moreover, only limited
changes in the composition of AAC are applicable without huge research effort. Alternative materials
have the advantage that they are likely less expensive than primary raw materials and that they may
reduce the environmental impact of the final product (for example substituting Portland cement).
Furthermore, an useful application can be provided for these often unused or landfilled materials
(waste materials, industrial by-products). The range of selection of raw materials expands as possible
new raw materials are found. Moreover, it is possible that the performance of AAC can be improved
by the utilisation of alternative materials [2].
1.2. Problem statement
The present research project focuses on incorporating several alternative materials in autoclaved
aerated concrete. The alternative materials can substitute different primary raw materials in the mix
design, such as the Portland cement or the silica source material. The partial or complete
replacement by the alternative materials will be investigated and experimentally tested.
Requirements for these materials are availability, chemical and phase composition, other possible
applications, costs and environmental footprint. Suitable replacement materials are recycled waste
materials, landfill materials, several natural and artificial ashes and already mined natural rocks
(mining residues). The alternative materials, which were already pre-selected by C. Straub [4], to
investigate are:
Trass
Tuff ash
Basalt
Copper slag
Granite
Quartz powder or the silica source in general is the main component in the mix design as its quantity
is the largest. The dissolved quartz together with the calcium component serves as binder material,
whereas the residual quartz grains serve as filler. The presence of silica can be obtained from an

15
extended range of alternative materials. Thus, there is the potential to process a significant quantity
of waste materials or by-products in mass. Additionally, alternative silica sources (other than quartz
sand and pulverised fuel ash) will be available which will extend the selection range.
Portland cement is characterised by a high CO2 footprint and environmental impact, and is a quite
expensive raw material. Substituting part of the cement will result in a reduced cost and
environmental impact of the final AAC product.
The investigation of the feasibility and application possibilities of an alternative material in AAC
includes an extensive process, starting from the characteristics and properties of the alternative
material itself to the final product properties. To give an overview of this process, a flow chart is
created which is presented in Figure 1. During the research, not only the influence of the
replacement materials on the final product shall be explored, but also the influence on the green
body properties shall be identified. The experimental study aims to develop a sustainable and
cheaper AAC product incorporating alternative materials.
For the final AAC product, standardised tests are defined and applied to determine the
characteristics and properties. On the contrary, no standardised tests are defined for identifying the
characteristics and properties of the fresh mixture and green body. Consequently, self-developed
tests or modified tests derived from the cement industry are applied to investigate the fresh state
properties. This is currently an important issue in the AAC industry.
The industrial partner for this research project is HESS AAC Systems B.V, located in Enschede, The
Netherlands. The research is based on a special AAC-recipe, specifically developed for laboratory-
scale approaches provided by HESS AAC systems B.V. Furthermore, this research project is situated
within the PhD research of C. Straub.

16
Figure 1: Flow chart of the investigation process of the suitability of an alternative material in AAC.

17
1.3. Outline of the research – experimental work
The experimental work and the corresponding report is divided into several parts. As first, the
production process and the testing methodologies are described (Chapter 2 and Chapter 3). The
research is divided as follows:
Investigation reference sample
Firstly, the reference AAC sample is studied of which the mix design is provided by HESS AAC Systems
B.V. In total, 9 reference samples are produced and tested:
The first four were produced and tested by C. Straub in his PhD research.
The second and fourth reference sample was produced and its compressive strength and raw
density were determined by C. Straub. The specific density and thermal conductivity
measurements are performed within this actual research project.
The fifth, sixth, seventh and eighth sample is produced and tested within this research
project.
A ninth sample was also produced and tested, but the results are not used in this report
(with one exception as will be seen later on).
Both the green body properties and the final product properties are identified, which will serve as
basis for further comparisons.
Preliminary study trass & tuff ash in AAC
Firstly, a preliminary study is performed to gain first insights regarding the effects of the application
of trass & tuff in AAC. The influence of substituting a raw material by trass or tuff ash with various
levels in AAC on several green body properties is identified. The investigated properties are the
slump flow of the fresh mixtures and the initial setting time of the green body. However, the initial
setting time is determined under different conditions relative to the concerning standard and is
therefore only an indication.
Application of trass & tuff ash in AAC
The actual application of trass and tuff ash in autoclaved aerated concrete is investigated. The tuff
ash is investigated in two different forms, i.e. the natural occurring tuff ash (as a kind of pre-study)
and ground tuff ash. Tuff ash will be applied as quartz replacement material, while trass will be
applied as quartz replacement and also as cement replacement material. During the production
process, the green body properties will be measured and determined. The final autoclaved product
will be investigated at several aspects. Several final product properties will be determined, which are
the compressive strength, thermal conductivity, drying shrinkage, and the density and porosity. The
main objective is to identify in which quantities the primary raw materials can be substituted by trass
and tuff ash, and the influence of this on the characteristics and properties of the AAC product.
Preliminary study basalt in AAC
A preliminary study regarding the application of basalt in AAC is performed in order to gain first
insights concerning the effects of basalt on the properties of AAC, similar to the pre-study of tuff ash

18
and trass. The influence of the substitution of quartz by basalt is investigated by means of
determining the influence of basalt on the slump flow and the setting development of the green
body. Mixtures with various substitution levels are produced, for which the slump flow and (an
indication of) initial setting time is determined. The obtained knowledge during the preliminary study
will be useful during the actual research of the application of basalt in AAC.
Application of basalt in AAC
The actual application of basalt in AAC is studied, where basalt is used as silica source material
replacing the quartz powder. AAC samples are produced on a lab-scale with various substitution
levels, and during the production process the green body properties are monitored. Several
properties of the final AAC product are also determined, including the compressive strength, the
drying shrinkage, the thermal conductivity, the raw and specific density, and the porosity. The
objective is to study the application possibilities (e.g. replacement amounts) of basalt in AAC.
Application of copper slag in AAC
The performance of AAC produced with copper slag will be evaluated. Copper slag is used as
substitution material for quartz powder in AAC. Due to the limited availability of the slag, only a
couple of samples could be prepared. Nevertheless, several test samples with various replacement
levels are prepared, during which the green body properties are established. The final properties of
the samples are determined, presented and discussed.
Application of granite in AAC
The influence of granite powder on the properties and characteristics of AAC is identified, and the
performance of the AAC samples are assessed. Granite powder is applied as substitution material for
quartz powder. As first, a small preliminary study is conducted, i.e. the influence of granite on the
slump flow of fresh AAC mixtures is determined. The obtained information will be useful during the
designing of the AAC mixes (selecting W/S ratio). Afterwards, test samples are produced with various
replacement levels. During the production process, the green body properties are monitored. After
autoclaving, the AAC samples are subjected to a series of tests to determine their final properties.
Side activities (not reported)
As an introduction to the research project, several final product properties of AAC samples produced
with waste glass and AAC samples with micro-silica or silica fume were identified. The determined
properties were the specific density, porosity and thermal conductivity. Furthermore, a calorimetry
experiment concerning AAC samples produced with waste glass washing water was conducted.
However, these results will not be reported in this work.
In addition, some trial experiments were performed, such as the application of leather fibres in AAC,
investigating the influence of changes in binder content (quartz, lime and cement content) on drying
shrinkage of AAC, application of foamglass in AAC and incorporation of an alkali activated system in
AAC. However, these results will as well not be reported in this work.
The produced samples are also subjected to a micro-structural analysis by means of XRD and SEM
analysis by C. Straub, but this will be no part of the scope of this work. This thesis only focused on the
engineering applications.

19
2. Production process
2.1. Raw materials
The raw materials as follow are used to produce autoclaved aerated concrete at a lab-scale approach
during this research project:
Quartz powder Portlandite Water
Lime Anhydrite Alternative materials
Cement Aluminium powder
The quartz powder has a purity of more than 98% and contains quartz as single mineral phase. The
cement, type CEM I 42.5 R, fulfils the requirements of the standard EN 197-1 in terms of chemical
composition and phase content. The used lime consists of 96% CaO (chemical composition, XRF
analysis) with less than 10% Ca(OH)2 (mineralogical composition, XRD analysis), while the MgO
content is less than 0.6%. The portlandite or calcium hydroxide is added to elevate the pH value, and
to simulate recycled AAC waste (hydrated lime) in the samples during the industrial process (e.g.
leftovers from cutting). Anhydrite powder originates from a natural anhydrite rock and contains also
dolomite and gypsum in minor quantities. It is used to retard the reaction of the free lime and to
partially accelerate the hydration reaction of Portland cement, so that both reaction occurs at
roughly equal times. Industrial aluminium powder is used as foaming/aerating agent and normal tap
water is used as mixing water. The aluminium powder particles are protected with a coating to cover
it from the air in order to prevent oxidation at the surface, and to a lesser extent, prevent
spontaneous combustion from occurring [5] [6] [8].
The experimental work is based on a reference recipe provided by HESS AAC Systems B.V. designed
for lab-scale approaches. All the raw materials used are technical grade and match the
recommended requirements for the production of AAC or originate from AAC production suppliers.
The physical and chemical parameters of all the raw materials are listed in Table 1 and Table 2
respectively [6]. The particle size distribution (PSD) of the raw materials is given graphically in Figure
2 [4]. As can be seen from Figure 2, the PSD of all the raw materials are very close to each other,
except for the aluminium powder which is slightly coarser in the finer fractions.
For AAC, 90% of the particles of the raw materials must have a particle size below 90 m in total.
Moreover, all the raw materials fulfil the condition that d90 < 90 m, within a range of 12 m (quartz)
≤ d50 ≤ 15.7 m (cement), except for the aluminium (d50 is 22.9 m) [5] [6] [8].
Table 1: Physical parameters of the raw materials.
Raw material
Particle size distribution
Density [g/cm³] d10 [m] d50 [m] d90 [m]
Quartz 3.3 12.6 33.3 2.65
Lime 3.2 13.4 54.3 3.24
Cement 2.3 15.7 41.9 3.12
Portlandite 3.6 14.3 50.8 2.30
Anhydrite 3.2 13.6 41.1 2.95
Aluminium 8.3 22.9 51.0 2.69

20
Table 2: Chemical composition of the raw materials by means of XRF analysis.
Component
Mass% (XRF analysis)
Quartz Anhydrite Cement Portlandite Lime
Na2O + K2O 0.05 0.37 1.08 0.11 0.27
MgO - 1.20 0.96 0.33 0.58
Al2O3 0.85 0.65 4.88 0.13 0.40
SiO2 98.6 1.55 15.7 0.30 0.67
SO3 - 53.7 3.98 0.05 0.03
CaO 0.01 38.9 66.5 70.1 95.9
Fe2O3 0.03 0.19 2.48 0.17 0.26
LOI 0.26 3.08 2.38 27.4 1.81
Figure 2: Particle size distribution of the raw materials.
2.1.1. Alternative materials
Primary raw materials are substituted by the alternative materials always in mass proportion in this
research. The percentage indicates the mass proportion that is applied in the mix design.
The particle size distribution of all the alternative materials is also determined. The results are shown
in Figure 3 [4]. The PSD of the quartz powder and Portland cement is as well plotted for comparison
reasons. Furthermore, the PSD of ground tuff ash is not displayed, but it is similar to that of the trass.

21
Figure 3: Particle size distribution of the alternative materials.
Some general observations can be made from Figure 3. The PSD of trass and tuff ash clearly indicates
that large particles can be found in the materials, especially for the natural tuff ash (up to 1 cm and
larger). Furthermore, the trass and ground tuff ash exhibit a similar PSD compared to Portland
cement and quartz powder respectively with only some minor differences occurring. The natural tuff
ash is a bit coarser than quartz powder. Regarding the other alternative materials, the PSD of basalt,
copper slag and granite are all slight coarser in general compared to that of the quartz powder,
especially for the bigger particle sizes. Nevertheless, the particle size distribution of all the alternative
materials can be approved.
Trass & tuff ash
The trass and tuff ash batches are supplied by Meurin. The investigated trass is the same as directly
used in the cement and concrete industry. The tuff ash is investigated in two different forms: the
natural found tuff ash and milled tuff ash. Figure 4 shows several microscopy photographs of the 3
materials. The moisture content of the investigated trass is 2.97%, for tuff ash 13.60% and the
ground tuff ash has a moisture content of 0.21%. Both natural volcanic materials are characterised by
the chemical compositions (XRF analysis) listed in Table 3, which only shows the main elements [4].
As can be seen, both materials exhibit rather similar chemical compositions, characterised by a high
content of silica (51% and 58%). There is also a significant amount of aluminium oxide present (
18%), and a low calcium oxide content ( 3%). Furthermore, they contain considerable amounts of
alkalis and iron oxide, and there is (almost) no sulphur present.

22
Table 3: Chemical composition (main elements) of trass and tuff ash.
Tuff ash [%]
Trass [%]
LOI 3.06
LOI 8.56
Na2O 5.49
Na2O 2.66
MgO 1.06
MgO 1.71
Al2O3 17.8
Al2O3 19.0
SiO2 57.9
SiO2 50.8
SO3 0.06
SO3 0.10
K2O 5.25
K2O 5.38
CaO 2.42
CaO 4.07
Fe2O3 5.41
Fe2O3 5.98
Figure 4: Ground tuff ash (left), natural tuff ash (middle) and trass (right). Width of each figure: 12 mm.
The density of trass and tuff ash are almost equal to each other and similar to the value of the quartz
powder (2.65 g/cm³). Furthermore, the density of the trass is significantly lower than that of the
cement (3.12 g/cm³) [4]:
Trass: 2.57 g/cm³
Tuff ash: 2.55 g/cm³
Observing the batches of trass and tuff ash, some big particles can be detected, which also can be
seen from the particle size distribution (Figure 3). This is especially observed for the natural occurring
tuff ash, but also some relatively large particles can be found in the ground tuff ash and trass batches
while both materials are milled. Figure 5 shows some a small quantity of natural tuff ash (particles >
2 mm, no fine fraction, dry sieved) placed in a large quantity of
water. The dust present sediments to the bottom and consequently,
the water becomes clear. It can be seen that some large particles
swim and float on top of the water surface, while the major part
consists of large and heavy particles lying on the bottom. In general,
three types of heavy particles can be distinguished:
Figure 5: Natural tuff ash placed in water. Different types of coarse particles can be observed.
Pumice: a porous volcanic rock material which is very light and can swim and float in water.
Shale (particles resting at the bottom).
Black volcanic rock material (confirmed by a quick XRD analysis), which are the dark-coloured
particles at the bottom.

23
Basalt powder
The basalt is supplied by Neudorff which use basalt powder as a soil enhancement additive. The
material originates from the Eifel region in Germany. Basalt arises when basaltic lava (ejected on the
Earth surface) rapidly cools down and consolidates into a volcanic rock material. Figure 6 shows
several microscopy pictures of basalt powder, each with a different magnification. The supplied
basalt is considered as a dry powder: its moisture content is neglected. The chemical composition of
basalt by means of XRF analysis is presented in Table 4, which only shows the main oxides. As can be
seen, basalt has a rather high silica content (46%), high contents of magnesium oxide, aluminium
oxide and iron oxide (7.7%, 14.9% and 14.0% respectively). Furthermore, there is a moderate alkali
and lime content present . The basalt is a rather dense powder, its density is 2.96 g/cm³ (denser
compared to quartz powder) [4].
Table 4: Chemical composition of basalt by means of XRF analysis.
Basalt [%]
LOI 1.64
Na2O 3.62
MgO 7.74
Al2O3 14.9
SiO2 46.0
P2O5 0.47
K2O 1.85
CaO 8.40
Fe2O3 14.0
Figure 6: Microscopy pictures of basalt powder. Figure width: left 12 mm, middle 3 mm, right 1 mm.
Copper slag powder
Copper slag is the residue from the metallurgical production of copper from concentrated copper
ores. The material originates from the slag deposit in Helbra, a small town in the central-East of
Germany. Some microscopy pictures of Cu slag powder are shown in Figure 7. The copper slag is
finely milled and is assumed to be dry, so its moisture content is 0%. The oxide composition of the
slag is determined by XRF analysis, which is presented in Table 5 (only major components listed). As
already highlighted in the literature study [2], copper slag is rich in silica, alumina and magnesium
oxide. Contrary to literature values, the calcium oxide content is high while the iron oxide content is
very low. Furthermore, the copper oxide content is low, below 1% (as stated in literature). The
copper slag has a relatively high density, i.e. 2.85 g/cm³ (higher value compared to quartz) [4].

24
Figure 7: Microscopy pictures of copper slag powder. Figure width: left 12 mm, middle 2 mm, right 1 mm.
Table 5: Chemical composition of copper slag.
Copper slag [%]
LOI 0.58
Na2O 0.45
MgO 6.87
Al2O3 13.1
SiO2 44.1
SO3 0.89
K2O 4.08
CaO 20.9
TiO2 0.91
Fe2O3 5.93
CuO 0.61
Granite powder
The granite supplied by Graniet Import BV, is milled to a fine powder, but cutting wastes are also
available. Several pictures of the granite powder under the microscope are shown in Figure 8. The
moisture content of the granite powder is neglected. The chemical composition of the granite is
established through XRF analysis, and the results are displayed in Table 6. As can be seen, the major
components of granite are silica and alumina. The material contains low amounts of calcium oxide,
magnesium oxide and iron oxide. Furthermore, granite contains no sulphur and has a considerable
amount of alkalis. The density of granite powder is 2.68 g/cm³, which is similar as that of the quartz
powder (2.65 g/cm³) [4].
Figure 8: Microscopy pictures of the granite powder. Figure width: left 11 mm, middle 5,5 mm, right 3 mm.

25
Table 6: Chemical composition of granite.
Granite [%]
LOI 1.38
Na2O 4.68
MgO 0.91
Al2O3 16.2
SiO2 65.7
K2O 4.39
CaO 2.92
Fe2O3 2.87
2.2. Recipes
The reference recipe provided by HESS AAC Systems B.V. is shown in Table 7, which is specifically
designed for lab-scale approaches. The reference water to solid (W/S) ratio is 0.625 and aluminium
powder is added as 0.0833 mass% relative to the total amount of solids (TS). One AAC sample is
produced from a total amount of solids of 12 kg, 7.5 kg water and 10 g aluminium powder.
Table 7: Reference mix design.
Material Proportion [Mass%] Mass sample [kg]
Quartz 66.7 8.0 Lime 8.3 1.0
Cement 20.0 2.4 Portlandite 2.5 0.3 Anhydrite 2.5 0.3
Several parameters influence the characteristics and properties of AAC. The two main design
parameters of the recipes influencing the reaction rate and the AAC matrix are the aluminium
powder content and the water content, as previously studied by Straub [6]. For instance, a too low
water content results in smaller, not homogeneously distributed pores, whereas a too high water
content poses the risk of failure during autoclaving.
The following substitutions of primary raw materials by alternative materials are performed:
Natural tuff ash as replacement of quartz Basalt as replacement of quartz
Ground tuff ash as replacement of quartz Copper slag as replacement of quartz
Trass as replacement of quartz Granite as replacement of quartz
Trass as replacement of cement
Each recipe (per studied substitution) is provided in Appendix 1: Recipes.

26
2.3. Production process
2.3.1. Raw materials preparation
As first, the raw materials have to be prepared and weighted. The raw materials are stored in buckets
to prevent contact with air (infiltration of moisture and CO2). One batch is based on a total amount of
solids quantity of 12 kg, for which the corresponding aluminium powder content is 10.0 g and the
reference water amount 7.5 kg. A certain sequence of weighing is employed in order to minimise air
contact for certain materials. As first, the required quantity of quartz powder and other silica source
materials (alternative material) is weighted and put together, followed by the weighing of
portlandite. Next, the appropriate amount of lime is weighted, and then the required amount of
cement and anhydrite is weighted and put together. Finally, the needed quantity of (warm) water is
prepared and as last, the aluminium powder is weighted.
2.3.2. Mixing
When the raw materials are prepared, the mixing can start. The mixing procedure includes several
steps. The speed of the mixer is gradually increased during the mixing process when more and more
solid materials are added. The mixer and mould are displayed in Figure 9.
The specific water amount is pre-heated to 45°C, in order to achieve a faster reaction. Some
soap water is added to the water and aluminium powder so that the mixture is easier to
process. The soap water destroys the surface tension, which makes it easier to mix powders.
The quartz powder and other silica source materials are added, then the portlandite is added
and the whole is mixed until a smooth mixture is obtained (mixing speed increased
gradually).
The lime is then added. Simultaneously at this time which is defined as the zero time, the
data logger and time measurement (chronometer) is started.
After thirty seconds, the cement and anhydrite is added, and the speed of the
mixer is again increased gradually.
The aluminium powder is pre-dispersed in water (from the specific water
amount, 100 ml). After 2 minutes of mixing, the pre-dispersed aluminium powder is
added. The mixing is continued for a bit of time so that the aluminium is nicely mixed
in. The mixer is then stopped and the mixture is ready to be moulded and tested on
its slump flow.
2.3.3. Casting
A small amount of fresh mixture is taken from the mixing bucket for the slump flow measurement.
The mould is made out of insulation material covered with plastic foil and reinforced with straps. The
inner dimensions are 30x30 cm² as ground surface and a height of 34 cm. Basically, AAC cubes are
produced with dimensions 30x30x30 cm³, but depends on the rising height of the green body. The
mould is rapidly filled with the fresh mixture and closed with the lids. The rising height measurement
plate connected to a LVDT (floating device) is placed on top of the mixture surface while closing the
lid, and the thermocouple is inserted through the lid into the mixture for temperature
measurements. The casting time and the outlet temperature of the mixture are noted.
Figure 9: The mixer and mould.

27
2.3.4. Rising and setting
The green body rises and stiffens in the mould. It is important that the green body stiffens after the
green body is finished with rising. During the rising and setting stage, the green strength is
determined after certain time intervals (usually 2.5 and 3 hours). The penetration measurements as
indication of setting are also performed during this stage, usually starting after 45 minutes and a
measurement interval of 5 minutes is employed. The temperature and the rising height are as well
monitored every 30 seconds by a data-logger.
2.3.5. Autoclaving
The next day after the preparation of the sample
(24 hours), the green body is demoulded and
placed in the autoclave (shown in Figure 10). Two
green bodies can be simultaneously placed in the
autoclave. Firstly, a vacuum (-0.8 bar) is applied.
Next the desired temperature and pressure is
gradually built up within the autoclave (1.5
hours). The green bodies are then autoclaved for
5.0 hours at a pressure of 11 bars and a
temperature of 187°C. Finally, the temperature
and pressure is linearly decreased (1.5 hours) in
the autoclave in order to prevent the built up of internal pressures. The
total autoclaving time is than roughly 8.5 hours.
2.3.6. Cutting
The produced AAC samples have to be cut to testing cubes with dimensions 10x10x10 cm³ which will
be used to determine the raw density and the compressive strength, and to testing prisms with
dimensions 4x4x16 cm³ which will be used for drying shrinkage measurements. For this purpose, four
test cubes and four test prisms are prepared. The cutting is conducted with a band saw. As first, the
AAC sample is cut in half. One half is used to cut the four testing prisms from, while the other half is
used to generate four test cubes. Approximately 5 cm of each side of the sample is cut away, in order
to obtain an undisturbed pore structure as the mould affects the pore structure referred to as the
‘mould-effect’. These side slabs will be used for thermal conductivity measurements and specific
density measurements. The test cubes are cut and marked, and it is indicated if the test cube was
part of the bottom or part of the top of the AAC sample. This is necessary as it can be that the
material characteristics and properties differ in the rising height direction (for instance due to
collapsing of pores).
The other half of the AAC sample is used to generate the test prisms. Here as well, the sides are cut
away to obtain an undisturbed pore structure. The longitudinal axis of the sample shall be
perpendicular to the rising direction. The test prisms are labelled if they were part of the bottom,
middle or top of the AAC sample. Figure 11 shows the test cubes for raw density and compressive
strength measurements, as well as the test prisms for drying shrinkage measurements.
Figure 10: The autoclave.

28
Some AAC surfaces may exhibit an expending crack structure. These cracks have a preferred
orientation, i.e. they lie perpendicular to the rising direction (horizontal), and interconnect large
macro-pores. The expansion crack structure can be responsible for anisotropy in strength [3].
Figure 11: Test cubes with dimensions 10x10x10 cm³ are cut for raw density and compressive strength measurements (left), and test prisms with dimensions 4x4x16 cm³ are cut for drying shrinkage measurements (right).

29
3. Testing methodologies
3.1. Drying - moisture content
When drying of materials is required or the moisture content of materials has to be determined, an
oven with forced ventilation is used. The employed oven is the UF 160 from Memmert. The
temperature is usually 60 or 105°C, depends on what has to be dried. The samples or materials are
weighted before placing them in the oven. The samples are dried until constant mass is reached,
indicating that the material is dry. The moisture content can then be calculated with formula 1.
Usually, the moisture content is calculated as average of multiple measurements.
(1)
3.2. Slump flow
The flowability or workability (related to the viscosity) of the mixture is determined by means of the
slump flow. This is important, because the slump flow affects the pore formation. The slump flow is
identified using a special cone developed by HESS AAC Systems B.V., shown in Figure 12. The cone is
a cylindrical cone with a diameter of 7.0 cm and a height of 6.0 cm, providing a
volume of 244 cm³. Once the mixing process is completed, the cone is completely
filled with the mixture, then levelled at the top and possible left-overs are
removed. Next, the cone is quickly lifted vertically allowing the mixture to
spread. The diameter of the spread (defined as the slump flow) is measured in
several directions, and the final average value is rounded to the nearest 0.5 cm.
Figure 12: Cone to determine the slump flow, developed by HESS AAC Systems B.V.
The optimal slump flow of a mixture is in between 23 cm and 28 cm. When the slump flow is not
within this optimal range, the water to solid ratio of the mixture can be adjusted in order to ensure
that the slump flow is within the optimal range. However, it is recommended to keep the water to
solid ratio constant as long as possible, because it is the easiest way to compare results (constant
design parameters).
Preliminary test
For the preliminary study of an alternative material, the recipes are first designed. The aerating agent
(aluminium powder) is not added in order to elongate the opening time of the mixture, as the
reaction of the aluminium powder already starts during the mixing and is very time sensitive.
Normally, the water has a temperature of 45°C before adding it to the mixture in order to achieve a
faster reaction. However, in this case, the temperature of the water is held constant at 23 °C. The
raw materials are also at a temperature of 23°C. The mixing procedure is as follows (mixed by hand):
The appropriate quantities of raw materials and water are weighted.
The raw materials are mixed for two minutes.
The water is added and the mixture is mixed intensively for another minute.
The slump flow is then determined with the above described testing procedure. The slump flow is
measured in two perpendicular directions, and the final slump flow is defined as the average of these

30
two values. The slump flow of the reference mixture is measured several times during the
preliminary study, in order to gain insight regarding the spread of the measured values with this
testing methodology. If necessary, the W/S ratio is adjusted during the pre-studies.
3.3. Initial setting time: Vicat test
To determine the beginning of the setting, referred to as the initial setting time (IST), the Vicat test is
applied. Determining the initial setting time is normally conducted according to the European
standard EN 196-3 [1], but the test procedure is somewhat adjusted during this research. Therefore,
only an indication of the IST is obtained. The investigated paste has a resistance against the
penetration of the Vicat needle. The setting time is defined as the time interval where the needle is
penetrated at a certain depth in the mixture. During the preliminary study, the aluminium powder is
not included in the mix designs in order to avoid pore formation and rising of the mix.
Pre-study
As first, the water to solid ratio of the test mixture was 0.625 (reference value) and the water inlet
temperature was 23°C. The reference sample was firstly tested, however after 7 hours the setting
still did not started. To lower the initial setting time, the W/S ratio was reduced to 0.500 which will
lead to an accelerated setting. After 7 hours in this case, some indications of the start of setting could
be observed, however the IST still could not be determined within an appropriate time interval.
Therefore, the water to solid ratio was again set to 0.500 and the water inlet temperature was raised
to 45°C in order to accelerate the reaction process. With these adjustments, the initial setting time
could be determined within an acceptable time interval.
Final test methodology
During this preliminary study, almost the same mixture preparation procedure as used for the slump
flow determination is applied for this experiment. The temperature of the water is held constant at
45°C and the raw materials are at a temperature of 23°C. The W/S ratio of the mix designs is 0.500.
The mixing procedure is as follows (mixing by hand):
The appropriate quantities of raw materials and water are weighted.
The raw materials are mixed for 90 seconds.
The water is added and the mixture is mixed intensively for another 90 seconds.
The zero time is defined as the time when the water is added to the powder mix. The Vicat ring is
placed on a glass plate. The ring is completely filled with the fresh mixture without compacting the
paste and levelled at the top. Air bubbles in the mixture are removed by gently knocking the ring
with the palm of the hand. Contrary to the European standard, the Vicat ring is not placed under
water in a testing container. The scale of the equipment is modified and set. The Vicat needle is held
at the surface of the paste for 1 to 2 seconds before letting it fall down and penetrating into the
paste. The penetration depth is then read from the scale. The initial setting time is defined as the
time interval between the zero time and the time for which the distance between the needle and the
glass plate is 6 mm. The initial setting time of the reference mixture is determined 4 times, in order
to gain insight regarding the spread of the experimental values determined with this testing
methodology.

31
It can be that a measurement indicates that the mixture is already setting. However, when another
measurement is conducted at another place, it turns out that the mixture is not yet setting.
Moreover, this measured depth is neglected and the measurements are continued. When the setting
in general starts, the penetration depth can be measured at multiple places. The corresponding time
moment is then defined as the indication of the IST. However, this indicates the relatively large
inaccuracy of the measurement.
3.4. Green body properties
There exist no standardised procedures yet to determine the green body properties of autoclaved
aerated concrete. The obtained values for the green body properties are only an indication and are
only used for comparison between the different samples.
Slump flow
When the mixing process is finished, the slump flow is immediately determined according to the
testing methodology described in Chapter 3.2.
Temperature development
The temperature development of the green body provides indications regarding the reaction
kinetics. Moreover, the temperature cannot raise too much, else the water starts to boil. A
thermocouple is placed through the lid into the green body in order to measure the temperature,
which is monitored by a data logger. The temperature is measured every half a minute. In this way,
the temperature development of the green body can be recorded. The outlet temperature is defined
as the temperature of the mixture when it is just casted into the mould.
Rising development
When the lid is placed on the moulds, the rising height measurement plate is placed on top of the
mixture’s surface. The plate, which is connected to a LVDT, goes up during the rising of the mixture
due to the reaction of the aluminium powder. The LVDT measures the linear displacement of the
plate which is recorded by a data logger. Consequently, the rising development of the green body
can be monitored. However, the plate cannot reach the top of the mixture due to its thickness and
attributes, and presses against the lid. Therefore, after demoulding, the effective height is measured
which is defined as the height of the sample where the plate was placed to measure the rising height.
This is used to calibrate the measured rising height development. In addition, the maximum rising
height is also measured.
Setting development: penetration depth
By measuring the penetration depth in function of time, information regarding the setting or
stiffening of the green body is obtained. The penetration depth is measured at certain times
intervals: it usually starts after 45 minutes with a time interval of 5 minutes. A cone specially
developed by HESS AAC Systems B.V. with a height of 10 cm, displayed in Figure 13, is used to
measure the penetration depth. The cone is held at the surface of the mixture and is then let fall
down vertically into the mixture. The penetration depth is defined as the distance between the cone
point and the surface of the mixture.

32
Figure 13: Cone to measure the penetration depth (cone height 10 cm), developed by HESS AAC Systems B.V.
Green strength
The green strength is measured at certain time moments, usually after 2.5 and 3 hours. The property
is measured with a specific tool designed and developed by HESS AAC Systems B.V., shown in Figure
14. The measurement tool consists out of concrete penetrometer equipped with a cone at the top.
The cone is pressed into the green body until the cone bottom levels the surface of the sample. The
strength value is read from the scale of the penetrometer. The scale of the concrete penetrometer
itself (without cone) is in psi, while the strength measured with the tool in total is expressed in ‘units’
(no standardised units for the self-developed tool). HESS AAC Systems B.V. defines that a green body
is ready for handling (demoulding and cutting) when the green strength is equal to or larger than 400
units.
Figure 14: Penetration tool to measure the green strength, developed by HESS AAC Systems B.V (total length 20 cm).
3.5. Density – porosity
Autoclaved aerated concrete is known for its low weight and high porosity. There are two different
densities, i.e. the raw density and specific density. The raw density is the material density including
voids and pores, whereas the specific density is the material density excluding voids and pores, thus
only representing the solid phase. Before the density measurements, the AAC samples are
completely dried. For this purpose, the samples are dried in the oven at 60°C with forced ventilation
until constant mass is reached.
As first, the raw or apparent density is measured from the test cubes. The cutting dust is completely
removed from the cubes before the drying process. The cubes are then dried in the oven as
described above. Next, all the sides of the cube are polished in a polishing machine (shown in Figure
16) at Hess AAC Systems. After the polishing, the dimensions of the cube are exactly 10 by 10 by 10
cm (the test cubes were slightly larger cut than 10 cm). The dust is once again removed from the
cube and the sample is then ready to be weighted. The raw density is calculated by dividing the mass
of the sample by its apparent volume (1000 cm³). The raw density is determined four times (four
different cubes). This test procedure is not exactly according to standard, which states that the cubes
must have a moisture content of 6% 2%.
The specific density of the sample is determined by measuring its true volume. The true volume is
determined with a gas (helium) pycnometer, employing the gas displacement method to measure
the volume accurately. The used equipment is the AccuPyc II 1340 Gas Pycnometer of Micrometrics.
The helium molecules rapidly fill the pores whereas only the solid phase displaces the gas, thus the
solid phase volume is measured. By weighting the sample, the specific density can be computed. The

33
true volume is measured 10 times, and the final value is the average value (10 measurement cycles
at the same sample material). However, the mass is only measured once.
When analysing the results, it may be observed that the specific density decreases after each
measurement cycle. This indicates that the material was not completely dry and is additionally dried
during the measurement process due to the purging of the pycnometer. The values exhibiting this
trend are deleted from the measurement results, or in case all points are showing this trend, the
measurement of the specific density is repeated.
From the apparent and specific density, the porosity can be calculated. The porosity, expressed in
percentage, is calculated with formula 2:
(2)
3.6. Strength
After the raw density measurement of the cube, the compressive strength is determined. The
compressive strength measurements are performed at HESS AAC Systems. The cubes are first visually
inspected for cracks which may influence the strength. Then the cube is placed in the testing
equipment (Figure 15). The testing speed is 0.05 N/mm² per second. Four cubes of each mix design
are tested, and the presented value is the average value. However, this testing procedure is not
exactly according to standard, which states that the AAC cubes must have a moisture content of 0%
(dried at 105°C).
Figure 16: Polishing machine.
During the literature study [2] it is observed that the compressive strength of AAC is closely related
to the raw density. Consequently, the strength of the material cannot be evaluated by means of the
compressive strength as it depends strongly on the density. Therefore, the A-value of each sample is
computed. The A-value presents the compressive strength of the product independent of its raw
density. The formula to calculate the A-value is given below (formula 3), where the compressive
strength is expressed in N/mm², while the raw density is expressed in g/cm³ [10]. The strength of
AAC will be assessed by means of the A-value.
Figure 15: Compressive strength testing equipment.

34
(3)
3.7. Thermal conductivity
Autoclaved aerated concrete is also known for its good thermal insulation. The thermal conductivity
λ, expressed in W/m∙K, is determined with a heat transfer analyser. This a possible measurement
technique, but again not the standardised approach. The employed equipment is the Isomet model
2104 together with a surface probe. As first, the AAC sample must be completely dried as moisture
has a significant influence on the thermal conductivity. The sample is dried in an oven with forced
ventilation at 60°C, until constant mass is reached. The samples are then cooled down to room
temperature in a sealed bucket. The measurements are performed in a room at 20°C, equipment and
material are in thermal equilibrium with the room. The thermal conductivity is measured four times,
each time on a different place (variating with the rising direction). The final value is the average value
of the four measurements. The thermal conductivity seems
independent of the rising direction or the place within the
sample where it is measured. A thermal conductivity
measurement is shown in Figure 17.
Figure 17: Thermal conductivity measurement.
3.8. Drying shrinkage
The length change during moisture movement under extreme conditions by water saturation of
prismatic samples of AAC is determined. The drying shrinkage is defined as the change in length
during drying. The test samples were first cut to the desired dimensions (40x40x160 mm³). The
longitudinal axis of the sample is perpendicular to the rising direction. The rising direction and the
place within the total sample (low, middle low, middle up and up relative to the rising direction) are
indicated. Thus, four test prisms are generated per mix design. After cutting, the dust is removed
from the samples. Next, the measurement heads or gauge plugs made from stainless steel
(corrosion-resistant) are fixed to both ends of the test sample exactly in the middle with wax. The
samples are weighed beforehand and afterwards in order to know the exact mass of the gauge plugs
and wax. The test samples are then ready to be tested.
The measurement of the drying shrinkage is based on several standards: RILEM LC4-1 ‘Determination
of drying shrinkage of autoclaved aerated concrete’, ASTM C1693 – 09 ‘Standard specification for
autoclaved aerated concrete’, RILEM AAC 5.2 ‘Determination of length change during moisture
movement in AAC’ and EN 680:2005 ‘Determination of the drying shrinkage of autoclaved aerated
concrete’.
To start-up, the test samples are completely saturated in water. This is done by placing the samples
vertically in a box which is gradually filled with demineralised water while keeping the water level
approximately 1 cm below the wet front in the material sample. Once the samples are completely
under water, weight is placed on top of them in order to prevent upwards floating of the samples.
The test samples are kept in this state for roughly two days. Once this process is completed, the
samples are taken out of the water, external water is removed with a moisty sponge and the
measurement heads are dried. Each test sample is immediately weighted for the first time, as well as

35
the length is immediately measured. These measurements are referred to as the initial
measurement. Next, the samples are stored on a grid in a humidity cabinet where the temperature is
controlled at 20°2°C and the relative humidity at 45%5%, in correspondence with the (European)
standard(s). The relative humidity corresponds with the equilibrium condition over a saturated
solution of potassium carbonate (potash) in water. The trays containing the saturated solution
contain sufficient solid salt and are stirred thoroughly at least every seven days in order to prevent
the formation of lumps or crust. The potassium carbonate is re-filled regularly. Fans placed in front of
the trays ensure a homogeneously distributed relative humidity. However, it should be remarked
that samples in line with a fan dry faster, but in the end all samples achieve the same state. Samples
placed further away from a fan dry more gradually.
The sample’s mass and length shall be determined at regular intervals
(logarithmic time scale) during two months. The samples are weighted to
the nearest 0.01 g and the length is measured to the nearest 0.001 mm.
The mass of the gauge plugs and wax is subtracted from the sample’s
mass. The length measurement instrument is provided by Testing Bluhm &
Feuerherdt GmbH, equipped with a digital calliper (Mitutoyo 543-690
Absolute LCD Digimatic Indicator ID-S). This instrument is in accordance
with EN680, and is shown in Figure 18. The accuracy of the instrument is
more than enough according to the different standards. The sample is
placed in the measurement device with its measurement heads. The
sample is turned in the device, and the minimum and maximum length is
recorded. The final length is the average of the minimum and the
maximum length.
Once the measurements are completed, the gauge plugs are removed and the samples are placed in
the ventilated oven (temperature of 105°C) where they are dried until constant mass is reached. The
dry mass is then determined and the dimensions of the test sample are measured, so that the
moisture contents and the relative length changes can be computed. The relative change in length
between readings is defined in formula 4, while the moisture content at each reading is calculated
with formula 5. Next, the total length change and the total moisture lost during the entire time
period is calculated (maximum value minus minimum value).
(4)
(5)
The relative length change is plotted against the moisture content (as described in standards).
Furthermore, the length change as well as the moisture content is plotted against the time. As last,
the total length change is presented graphically in function of the substitution level. This enables the
evaluation of the drying shrinkage development. ASTM defines the amount of drying shrinkage (s) as
the difference in the relative length change between a moisture content of 30% and 6%. This drying
shrinkage should not exceed 0.02% or 0.2 mm/m. According to the RILEM recommendations, the
total length change must not exceed 0.35 mm/m. Finally, the European standard finally does not
states a maximum value regarding drying shrinkage.
Figure 18: Length measurement instrument (height sample is 16 cm).

36
4. Results
The obtained results will be presented in the following parts. A detailed discussion will be given in
the next chapter.
4.1. Reference samples
The reference recipe is designed and provided by HESS AAC Systems B.V. Both the green body
properties and the final AAC product properties are determined according to the testing
methodologies described in Chapter 3. Several reference samples are prepared and studied. The
results will be presented in the following paragraphs.
4.1.1. Green body properties
During this research project, four reference samples are produced and their green body properties
are identified. The green body properties of these reference samples are listed in Table 8.
Table 8: Green body properties of reference samples.
Property Unit REF 5 REF 6 REF 7 REF 8 Reference
Slump flow cm 26.0 24.0 27.0 25.0 25.5
Rising height cm 29.5 29.0 30.0 28.9 29.4
Maximum temperature (time)
°C (min)
78.3 (248-293)
79.6 (247-273)
79.6 (244-265)
79.7 (249-264)
79.3 (247-274)
Green strength
(2.5 – 3 hours) units 380 – 530 390 – 590 460 – 680 450 – 620 420 – 610
The penetration depth in function of time is also determined, in order to gain insight regarding the
setting or stiffening development of the green body. The results are plotted in Figure 19. Reference 6
is chosen as reference curve in the setting development plots to follow.
Figure 19: Penetration depth in function of time for several reference samples.
Average
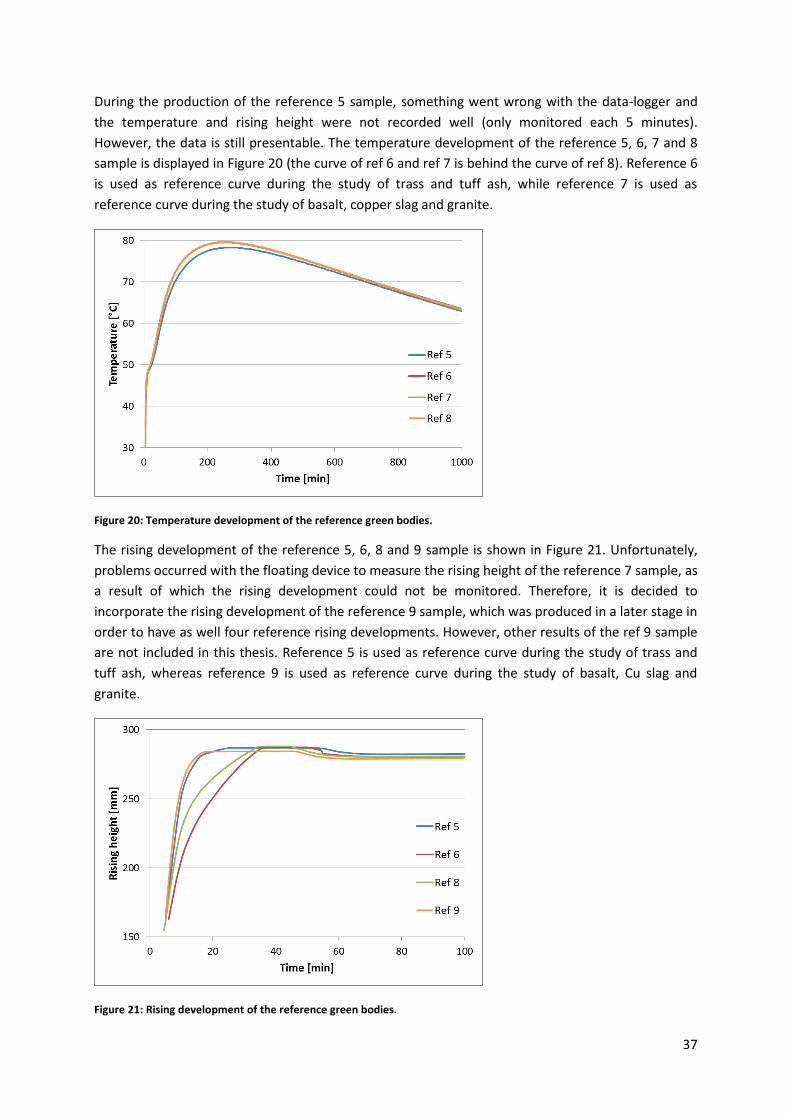
37
During the production of the reference 5 sample, something went wrong with the data-logger and
the temperature and rising height were not recorded well (only monitored each 5 minutes).
However, the data is still presentable. The temperature development of the reference 5, 6, 7 and 8
sample is displayed in Figure 20 (the curve of ref 6 and ref 7 is behind the curve of ref 8). Reference 6
is used as reference curve during the study of trass and tuff ash, while reference 7 is used as
reference curve during the study of basalt, copper slag and granite.
Figure 20: Temperature development of the reference green bodies.
The rising development of the reference 5, 6, 8 and 9 sample is shown in Figure 21. Unfortunately,
problems occurred with the floating device to measure the rising height of the reference 7 sample, as
a result of which the rising development could not be monitored. Therefore, it is decided to
incorporate the rising development of the reference 9 sample, which was produced in a later stage in
order to have as well four reference rising developments. However, other results of the ref 9 sample
are not included in this thesis. Reference 5 is used as reference curve during the study of trass and
tuff ash, whereas reference 9 is used as reference curve during the study of basalt, Cu slag and
granite.
Figure 21: Rising development of the reference green bodies.

38
4.1.2. Final product properties
The final AAC product properties of the reference samples are presented in Table 9.
Table 9: Final AAC product properties of reference samples.
Property Unit REF 2 REF 4 REF 6 REF 7 REF 8 Reference
Compressive strength MPa 3.21* 3.17* 3.02 2.39*** 3.33 3.18
A-value - 950.9 943.2 859.9** 739.4*** 986.5 960.2 Raw density kg/m³ 460* 459* 469 450 460 459
Specific density g/cm³ 2.501 2.554 2.564 2.525 2.520 2.533
Porosity % 81.63 82.05 81.73 82.20 81.76 81.87
Thermal conductivity W/m∙K 0.0884 0.0852 0.0827 0.0787 0.0800 0.0830
Volume heat capacity MJ/m³∙K 0.39 0.37 0.34 0.33 0.35 0.36 Total length change mm/m - - 0.74 0.72 0.75 0.74 *Determined by C. Straub [4].
** Left out of the average value because it deviates too much [4]. The compressive strength of the sample is
slightly lower while the raw density is slightly higher. Therefore, the A-value is significantly lower.
*** The strength of the reference 7 sample is left out from the average value. Something is wrong with this
sample, characterised by a high standard deviation of the compressive strength value (0.65).
The compressive strength with corresponding A-value, the raw and specific density, the porosity and
the thermal conductivity of the different reference samples and their standard deviation as error bar
are presented graphically in Figure 22, Figure 23, Figure 24 and Fout! Verwijzingsbron niet
gevonden. respectively. The total amount of moist lost during the drying shrinkage measurements of
the reference 6 sample is 75.6%, for the other reference samples this could not be determined (will
be seen in the discussions).
Figure 22: Comparison of the strength of the different reference samples.
Average

39
Figure 23: Comparison of the raw (left) and specific (right) density values of the different reference samples.
Figure 24: Comparison of the porosities of the different reference samples (left) and thermal conductivity plot of several reference samples (right).
The reference 5 sample is used for several purposes, but mainly to investigate the influence of the
moisture content on the compressive strength, as well as to verify the European standard. The
standard states that the compressive strength is 20% lower when the moisture content of the AAC
sample is 6% compared to the compressive strength of a (almost) complete dry AAC sample.
Therefore, in total 8 test cubes were prepared: four cubes are tested at a moisture content of 6%,
while the four other cubes are completely dried at 105°C and tested afterwards on their raw density
and compressive strength. The comparison is made in Table 10. The second column shows the
compressive strength values of the AAC cubes with a moisture content of 6%. In the third column,
these strength values are increased with 20% in order to be able to make comparisons with the
reference strength. The average reference compressive strength (Table 9) is 3.18 N/mm², for which
the samples were dried at 60°C. The effective compressive strength mentioned in Table 10 is valid for
the reference 5 AAC samples which were dried at 105°C (fourth column). The raw density of these
samples was determined beforehand (last column).

40
Table 10: Influence of moisture content on compressive strength, and verification standard.
mc: 6% mc: 0% mc: 0% (dried at 105°C) mc: 0% (dried at 105°C)
Sample CS [N/mm²] CS + 20% [N/mm²] Effective CS [N/mm²] Raw density [kg/m³]
Top 1 2.65 3.18 - -
Top 2 2.74 3.29 3.43 450
Bottom 1 2.69 3.23 3.45 452
Bottom 2 2.60 3.12 3.60 454
Average 2.67 3.21 3.49 452
The reference 2 sample was stored in a climatised room and was in equilibrium with its surroundings.
Consequently, the sample contains some moisture. Before drying the sample and determining the
actual thermal conductivity, the thermal conductivity of the sample containing moisture is
determined (measured 3 times at different places). In this way, insight is gained regarding the
influence of moisture on the thermal insulation of AAC. After drying, the moisture content of the
sample is calculated. The results are displayed in Table 11.
Table 11: Influence of moisture content on thermal conductivity of reference sample.
Moisture content [%] cp [MJ/m³∙K] λ [W/m∙K]
1.27% 0.42 0.0897 Difference: 1.45%
0% - Dry 0.39 0.0884
4.2. Preliminary study: trass and tuff ash in AAC
Tuff ash is investigated in two different forms: natural found tuff ash and ground tuff ash. As
substituting raw material in AAC, trass has the potential to replace both Portland cement as quartz
powder, whereas tuff ash only has the potential to replace quartz. The reason for this is that the trass
is characterised by its pozzolanic activity, whereas the tuff ash not. To give an overview, the
substitutions as follow are performed (with various levels):
Natural tuff ash (NTA) as replacement of quartz Trass as replacement of quartz
Ground tuff ash (GTA) as replacement of quartz Trass as replacement of cement
The influence of replacing quartz by tuff ash or trass, and cement by trass with various quantities on
several green body properties is investigated. The studied properties are the slump flow and the
initial setting time. Both natural materials contain a certain amount of moisture, thus the moisture
content has to be determined. When the moisture content is determined, the amount of water in
the trass and tuff ash is re-calculated back into the mix designs.
4.2.1. Slump flow
The slump flow of several mixtures containing trass or tuff ash with various contents is determined.
The selected substitution levels are 5%, 10%, 20%, 40% and 60% in mass proportion. Additionally, the
slump flow of the reference mixture is determined several times, allowing to make comparisons. The
optimal slump flow of a mixture (determined with the HESS cone) is in between 23 cm and 28 cm.
When the slump flow of a certain mixture is not within this optimal range, the water to solid ratio is
adjusted in order to ensure that the slump flow is within the optimal range, i.e. if the slump flow is

41
too high, the W/S ratio is lowered and vice-versa. It is advisable to keep the water to solid ratio
constant (equal to reference value, i.e. 0.625) as long as possible.
The slump flow measurement results are listed in Table 12. The W/S ratio for all mixtures listed in
Table 12 is equal to 0.625 which is the reference value. However, the W/S ratio of the samples
containing 20% and 40% tuff ash, and 40% and 60% ground tuff ash are lowered as the slump flow
value is too high. The results of these modifications are given in Table 13. Testing an AAC mixture
with 60% natural tuff ash provides no added value, because the slump flow would be far too high and
the W/S ratio should be lowered to dramatically. The relationship between the replacement level for
trass/tuff ash and the slump flow of the mixtures is presented graphically in Figure 25. The slump
flow of the reference mixture is the average of 5 measurements (error bar in Figure 25 represents
the standard deviation), while the other values are the result of only 1 measurement.
Table 12: Slump flow values of reference mixture and AAC mixtures incorporating trass or tuff ash.
Substitution level [%]
Slump flow [cm]
Tuff ash Ground tuff ash Trass (quartz) Trass (cement)
0 24.1 24.1 24.1 24.1
5 24.1 25.0 24.6 24.6
10 25.1 25.7 25.0 25.2
20 27.4 26.4 25.9 24.4
40 30.3 27.7 25.6 23.9
60 - - 25.9 23.0
Table 13: Slump flow values of AAC mixtures containing natural tuff ash or ground tuff ash with modified W/S ratio.
Mixture W/S ratio Slump flow [cm] Suggested W/S ratio
Tuff ash 20% 0.600 26.4 0.600 Tuff ash 40% 0.550 24.2 0.550
Ground tuff ash 40% 0.575 22.4 0.600 Ground tuff ash 60% 0.550 21.2 0.575
Figure 25: Relationship between the substitution level and the slump flow of AAC mixtures incorporating trass or tuff ash.

42
4.2.2. Initial setting time (Vicat test)
The initial setting time of some selected mixtures incorporating trass or tuff are determined, for
which the selection is based on the slump flow measurement results. The initial setting time is
determined with the Vicat test based on the standard DIN EN 196-3. The objective is to determine if
the setting is delayed or accelerated by the addition of trass or tuff ash.
The selected mix designs which will be further investigated are listed below:
Reference Ground tuff ash 20% Trass (cement) 25%
Natural tuff ash 15% Ground tuff ash 40% Trass (cement) 50%
Natural tuff ash 30% Trass (quartz) 50%
The initial setting times of selected mixtures are listed in Table 14 and presented graphically in Figure
26. The initial setting time is determined 5 times for the reference mix (error bar in Figure 26
represents standard deviation), and the presented value is the average value. The other determined
times are the result of only one measurement. The standard deviation of the reference (11 min) is
smaller than the measurement time interval (15 min), which is positive for the accuracy. However,
the absolute values have a maximum difference of 25 min (355 min the smallest reference value, 380
min the largest reference value).
Table 14: Initial setting time of reference mix and AAC mixes incorporating trass and tuff ash.
Sample IST [min]
Reference 375
Natural tuff ash 15% 395
Natural tuff ash 30% 370
Ground tuff ash 20% 405
Ground tuff ash 40% 400
Trass - Quartz 50% 310
Trass - Cement 25% 400
Trass -Cement 50% ≥450
An important remark is that some bleeding is observed from the
Vicat ring. Between the ring and the glass plate, some bleeding
occurs. The bled substance mainly appeared to be clear liquid.
4.3. Application of trass and tuff in AAC
4.3.1. Mix designs
Several samples with natural tuff ash, ground tuff ash and trass are produced. The produced samples
and their parameters are described below. All mix designs follow the same standard recipe, and each
mix design has the same reference water to solid ratio (0.625) and aluminium powder content
(0.083%). The moisture content of the trass & tuff ash is taken into account in the mix design.
Figure 26: Graphical representation of the initial setting times.

43
Natural tuff ash – NTA Trass for cement – TrC
NTA 1: 20%, not sieved TrC 1: 25%
NTA 2: 20%, sieved TrC 2: 40%
NTA 3: 60%, sieved TrC 3: 50% TrC 4: 60% Ground tuff ash – GTA TrC 5: 75%
GTA 1: 20%
GTA 2: 40% Trass for quartz - TrQ
GTA 3: 60% TrQ 1: 20%
GTA 4: 80%
GTA 5: 100%
GTA 6: 10%
GTA 7: 20%
For the investigation of the substitution of quartz by trass, only one sample is produced. As first, the
application possibilities of tuff ash in AAC were studied, because this material does not have yet an
useful application, as well as the replacement of cement by trass was first studied. Because at first
insights the application of tuff ash and trass replacing cement in AAC seems successful (later more),
there is no need to study the replacement of quartz by trass as this raw material already has useful
applications. Therefore, this type of raw material replacement is not studied further for now.
4.3.2. General observations during production process
Some general observations made during the production process, which may be of importance, are
listed below.
Tuff ash and trass are both quite dark-coloured materials (brownish), especially compared to the
white-coloured quartz powder. Therefore, the AAC product loses its typical white colour, and the
colour darkens more as more and more trass or tuff ash is incorporated. The colour of the fresh
slurry, the green body and the final product gets more darker due to the incorporation of trass or tuff
ash. The colour differences are highlighted in Figure 27.
Figure 27: Left: Colour differences of the GTA samples (from top to bottom: 100%, 80%, 60%, 40% and 20% GTA). Right: Colour differences of the trass for cement samples (from top to bottom: 75%, 60%, 50%, 40% and 25% trass). Length of a sample is 16 cm.

44
Some really big particles can be observed in the NTA1 sample (20% not sieved NTA), even sizes over 1
cm are found. An example of this observation can be seen in Figure 28, which shows the surface of
the NTA1 sample. Figure 29 shows several microscopy pictures of larger particles detected in the
samples. However, these larger particles were also found in ground tuff ash and trass samples (but
not as big as found in the NTA1 sample), but were only the black hard ones (see Figure 5).
Figure 28: Surface of the NTA1 sample (30 cm wide).
Figure 29: Microscopy pictures of several larger particles: a) dark-coloured aggregate. b) very big particle in NTA1 sample – interaction with AAC structure. c) pumice. Width of each figure is 12 mm.
These big particles can severely damage the mixer rod and the band saw (or thin cutting wires during
production processes in factories). Figure 30 shows some of these big particles which were cut during
the production process.
Figure 30: Microscopy pictures of several cut big particles: a) cut pumice aggregate. b) cut dark-coloured aggregate. c) detail of the dark-coloured aggregate and the AAC structure. Width of figures a and b is 12 mm, for figure c 1 mm.
For this reason, the natural tuff ash is completely sieved and dried until constant mass is reached.
The used sieve diameter is 2 mm. This sieved material is used in the NTA2 and NTA3 sample.
a b c
a b c

45
When observing the large particles in the produced trass & tuff AAC samples, it can be seen that no
cracking occurs around the large particles. Moreover, when these large particles are tried to be
removed, usually some of the AAC material sticks to the aggregates. Thus, this indicates that there is
a good binding present between the material matrix and the coarse particles.
By visually inspecting the cubes or prisms, sometimes cracks or other irregularities can be detected in
the material (Figure 31). Quite often these cracks are cracks perpendicular to the rising height. Cracks
or other irregularities can affect the final properties of the AAC product such as the compressive
strength. These cracks can occur in every sample, from reference to AAC produced with a certain
alternative material.
Figure 31: Crack in autoclaved aerated concrete sample (length 8 cm).
The NTA3 sample exhibits large pores, which are bigger compared to reference and other samples, as
highlighted in Figure 32. The colour difference between both samples is as well noticeable. As will be
seen later, the sample also exhibited a large slump flow, which is the cause of this phenomenon. The
larger pore sizes are the result of a decreased viscosity of the fresh mixture, causing the formation of
bigger pores.
Figure 32: The large pores of the NTA 3 sample (top: NTA3, bottom: Reference 6), length of sample is 16 cm.
4.3.3. Green body properties
The green body properties of each sample are determined, and the results will be given and
described as follow. The determined properties are the slump flow, the temperature development
and maximum temperature (plus time), the rising development and maximum rising height, the
penetration depth (setting development) and the green strength.
Natural tuff ash
Values for the green body properties of the NTA samples are listed in Table 15 below.

46
Table 15: Values for several green body properties of the NTA samples.
Property Symbol Unit NTA1: 20%* NTA2: 20% NTA3: 60%
Slump flow SF cm 27.0 27.5 32.0
Rising height hrise cm 30.5 30.2 31.2
Maximum temperature Tmax °C 79.0
(275-285 min) 79.2
(239-269 min) 81.0
(274-329 min)
Green strength σgreen Units 2.5h 3h 2.5h 3h 2.5h 3h
-** -** 400 570 390 550
* Not sieved NTA.
** Not able to determine (lack of time).
The temperature development of the NTA samples is plotted in Figure 33, while the rising
development is shown in Figure 34. As last, the penetration depth in function of time is plotted in
Figure 35, as indication for the setting development of the green body.
Figure 33: Temperature development of the NTA samples.
Figure 34: Rising development of the NTA samples.

47
Figure 35: Penetration depth in function of time for NTA samples.
Ground tuff ash
The slump flow, the maximum rising height, the maximum temperature and corresponding time, and
the green strength of the GTA samples are collected in Table 16. The GTA 6 (10%) and GTA 7 (20%)
sample are produced with a new ground tuff ash batch.
Table 16: Green body properties of the GTA samples.
Property Symbol Unit GTA1: 20% GTA2: 40% GTA3: 60%
Slump flow SF cm 26.5 26.5 27.5
Rising height hrise cm 30.1 30.4 30.1
Maximum temperature Tmax °C 79.4
(297-300 min) 80.4
(280 min) 80.8
(281-326 min)
Green strength σgreen Units 2.5h 3h 2.5h 3h 2.5h 3h
380 690 470 550 420 640
Property Unit GTA4: 80% GTA5: 100% GTA6: 10% GTA7: 20%
Slump flow cm 26.0 26.0 27.0 26.0
Rising height cm 29.6 29.1 29.2 29.0
Maximum temperature
°C 82.4
(270-301 min) 83.2
(366-415 min) 80.4
(238-294 min) 81.5
(263 – 300 min)
Green strength Units 2.5h 3h 2.5h 3h 2.5h 3h 2.5h 3h
400* >700** 600 >700*** - 610 520 680
* Measured after 2 hours and 40 minutes.
** Maximum value which can be measured is 700 units.
*** Green strength is measured with penetrometer without cone (standard concrete penetrometer): 50 psi.
The temperature development and rising development are plotted in Figure 36 and Figure 37
respectively. The penetration depth is presented graphically in function of time in Figure 38, which
provides information regarding the setting development of the green body.

48
Figure 36: Temperature development of the GTA samples.
Figure 37: Rising development of the GTA samples.
Figure 38: Plot of the penetration depth in function of time for the GTA samples.

49
Trass substituting cement
The green body properties of the trass partially replacing quartz samples are listed in Table 17.
Table 17: Green body properties of the trass substituting cement samples.
Property Unit TrC1: 25% TrC2: 40% TrC3: 50% TrC4: 60% TrC5: 75%
Slump flow cm 24.0 24.5 23.5 23.0 22.5
Rising height cm 29.5 29.4 29.4 29.4 29.6
Maximum temperature °C (min)
76.5 (233-241)
74.0 (220-248)
72.9 (223-243)
71.4 (209-250)
69.7 (181-231) (Time)
The green strength, which is one of the most important parameters for this kind of substitution, is
determined after 2.5 hours, 3 hours and 3.5 hours. The results are displayed in Table 18, and as well
plotted in Figure 39. The green dashed line represents the assumed development of the curve,
because the reference green strength after 3.5 hours is not known. Most likely, this value is at least
700 units.
Table 18: Green strength of the trass substituting cement samples.
Green strength [units] TrC1: 25% TrC2: 40% TrC3: 50% TrC4: 60% TrC5: 75%
After 2.5 hours 220* 320 300 240 200
After 3 hours -* 470 400 440 350
After 3.5 hours -* 540 620 570 440
* Green strength determined after 2 hours, no further measurements due to lack of time.
Figure 39: Plot of the green strength.
Figure 40 and Figure 41 show the temperature development and the rising development for the trass
replacing cement samples. Finally, Figure 42 displays the penetration depth in function of time which
provides information regarding the setting development, which is a key parameter for this type of
substitution of raw materials.

50
Figure 40: Temperature development of the trass substituting cement samples.
Figure 41: Rising development of the trass substituting cement samples.
Figure 42: Graph of the penetration depth in function of time for the trass substituting cement samples.

51
Trass substituting quartz
Only one sample of this type of substitution is produced, because of the reason mentioned in
Chapter 4.5.1. ‘Mix designs’. Nevertheless, the green body properties of this sample are given below.
Table 19 provides the slump flow, the rising height, the maximum temperature (and time) and the
green strength of the trass for quartz sample.
Table 19: Several green body properties of the trass substituting quartz sample.
Property Symbol Unit TrQ1: 20%
Slump flow SF cm 25.0
Rising height hrise cm 30.2
Maximum temperature Tmax °C 79.8 (242 -283 min)
Green strength σgreen Units 2.5h 3h
540 -*
* Not able to measure due to lack of time.
The temperature development of the TrQ1 sample is shown in Figure 43, while Figure 44 shows the
plot of the rising development. As last, the plot of the penetration depth in function of time is
presented in Figure 45.
Figure 43: Temperature development of the trass substituting quartz sample (left).
Figure 44: Rising development of the trass substituting quartz sample (right).
Figure 45: Plot of the penetration depth in function of time for the trass substituting quartz sample.

52
4.3.4. Final product properties
The final product properties of each sample are determined, and the results will be presented and
described in the following parts, with the main goal being to identify the influence of the alternative
material on the final properties. The determined properties are the compressive strength and A-
value, the raw density, the specific density, the porosity, the thermal conductivity (and additionally
the volumetric heat capacity) and the drying shrinkage. The final properties of the reference stated in
the following parts are the average of the final value of the reference 2, reference 4 and reference 6
sample, and the error bars for the values represent the standard deviation of these three samples.
Natural tuff ash
The final properties of the AAC samples incorporating natural tuff ash are listed in Table 20.
Table 20: Final properties of the AAC samples incorporating natural tuff ash.
Final property Unit NTA1: 20%* NTA2: 20% NTA3: 60%
Compressive strength MPa 3.40 3.31 2.91
A-value - 1043.2 1033.8 930.2
Apparent density kg/m³ 450 447 442
Specific density g/cm³ 2.464 2.495 2.392
Porosity % 81.73 82.09 81.52
Thermal conductivity W/m∙K 0.0801 0.0804 0.0788
Volumetric heat capacity MJ/m³∙K 0.30 0.33 0.31
Total length change mm/m - 0.65 0.53
* Not sieved natural tuff ash.
The strength of the NTA samples is presented graphically in Figure 46, while Figure 47 shows the plot
for the apparent density and the specific density, for which the error bars represent the standard
deviation. The relationship between the NTA content and the porosity is plotted in Figure 48, and for
the thermal conductivity in Figure 49 (error bars are standard deviation). Regarding the drying
shrinkage, the total length change in function of the substitution level (left side) and the relative
length change in function of the moisture content (right side) are plotted in Figure 50. The total
amount of moisture lost during the measurements is 72.9 and 73.0% for the NTA 2 and NTA 3 sample
respectively.

53
Figure 46: Plot of the strength of the NTA samples.
Figure 47: Plot of the density of the NTA samples.

54
Figure 48: Plot of the porosity of the NTA samples, on the left.
Figure 49: Plot of the thermal conductivity of the NTA samples, on the right.
Figure 50: Total length change in function of the substitution level (left) and relative length change in function of the moisture content (right) for the NTA samples.
Ground tuff ash
The final product properties of the GTA samples are presented in Table 21. The GTA 6 and GTA 7
samples are produced with a new ground tuff ash batch.
Table 21: Final AAC properties of the GTA samples.
Final property Unit GTA1: 20% GTA2: 40% GTA3: 60%
Compressive strength MPa 3.61 3.31 2.84
A-value - 1089.1 1020.1 879.7
Apparent density kg/m³ 455 451 449
Specific density g/cm³ 2.477 2.474 2.427
Porosity % 81.63 81.79 81.50
Thermal conductivity W/m∙K 0.0828 0.0801 0.0799
Volumetric heat capacity MJ/m³∙K 0.36 0.36 0.35
Total length change mm/m 0.64 0.62 0.59

55
Final property Unit GTA4: 80% GTA5: 100% GTA6: 10% GTA7: 20%
Compressive strength MPa 2.67 2.60 3.59 3.68
A-value - 806.3 769.6 1041.4 1052.4
Apparent density kg/m³ 455 460 464 468
Specific density g/cm³ 2.509 2.509 2.46 2.41
Porosity % 81.88 81.69 81.16 80.59
Thermal conductivity W/m∙K 0.0797 0.0802 0.0830 0.0834
Volumetric heat capacity MJ/m³∙K 0.34 0.33 0.34 0.35
Total length change mm/m 0.63 0.72 1.02 1.04
The relationship between the GTA content and the different final AAC properties is also presented
graphically to gain a better overview. Figure 51 shows this for the compressive strength, Figure 53 for
the apparent and raw density, Figure 54 for the porosity and finally Figure 55 for the thermal
conductivity. Furthermore, the CaO to SiO2 ratio of the mix design is plotted against the A-value of
the GTA samples in Figure 52. Finally, Figure 56 shows the total length change plotted against the
substitution level and Figure 57 the relative length change plotted against the moisture content. For
the GTA 1 to 5 sample, the total amount of moisture lost during the shrinkage measurements is 72.5,
71.2, 73.2, 70.7 and 71.6% respectively. This amount could not be determined for the GTA 6 and 7
sample, which will be explained during the discussions. The displayed error bars in all plots represent
the standard deviation of the value.
Figure 51: Graphical representation of relationship between the GTA content and the strength.

56
Figure 52: Plot of the CaO to SiO2 ratio versus the A-value of the GTA samples.
Figure 53: Graphical representation of relationship between the GTA content and the density (raw + specific).

57
Figure 54: Graphical representation of relationship between the GTA content and the porosity.
Figure 55: Graphical representation of relationship between the GTA content and the thermal conductivity.
Figure 56: Graphical representation of relationship between the GTA content and the total length change.

58
Figure 57: Plot of the relative length change against the moisture content for the GTA samples.
Trass substituting cement
Table 22 contains the final product properties of the AAC samples incorporating trass as replacement
of Portland cement.
Table 22: The final product properties of the AAC samples with trass as replacement of cement.
Final property Unit TrC1: 25% TrC2: 40% TrC3: 50%
Compressive strength MPa 3.50 3.40 3.39
A-value - 1062.1 1041.1 1031.0
Apparent density kg/m³ 454 452 454
Specific density g/cm³ 2.555 2.572 2.560
Porosity % 82.25 82.43 82.29
Thermal conductivity W/m∙K 0.0824 0.0834 0.0831
Volumetric heat capacity MJ/m³∙K 0.35 0.34 0.36
Total length change mm/m 0.62 0.61 0.58
Final property Unit TrC4: 60% TrC5: 75%
Compressive strength MPa 3.16 2.79
A-value - 970.2 864.2
Apparent density kg/m³ 451 449
Specific density g/cm³ 2.567 2.563
Porosity % 82.43 82.48
Thermal conductivity W/m∙K 0.0817 0.0807
Volumetric heat capacity MJ/m³∙K 0.35 0.36
Total length change mm/m 0.56 0.52

59
Plots of the relationships between the trass content and the strength, apparent and raw density,
porosity and thermal conductivity can be seen in Figure 58, Figure 60, Figure 61 and Figure 62
respectively. Furthermore, the CaO to SiO2 ratio of the mix designs is plotted against the A-value of
the trass replacing cement samples in Figure 59. Concerning the drying shrinkage, the relationship
between the total length change and substitution level is plotted in Figure 63, while Figure 64 shows
the relationship between the moisture content and the relative length change. The first to fifth
sample lost respectively 74.7, 77.5, 77.9, 78.1 and 79.4% moisture during the measurements. The
error bars in the figures represent the standard deviation of each determined value.
Figure 58: Plot of the strength in function of the trass content (replacement of cement).
Figure 59: Plot of the CaO to SiO2 ratio versus the A-value of the trass replacing cement samples.

60
Figure 60: Plot of the density in function of the trass content (replacement of cement).
Figure 61: Plot of the porosity in function of the trass content (replacement of cement).

61
Figure 62: Plot of the thermal conductivity in function of the trass content (replacement of cement).
Figure 63: Plot of the total length change in function of the trass content (replacement of cement).
Figure 64: Plot of the relative length change in function of the moisture content (trass replacing cement)

62
Trass substituting quartz
There is only one sample produced for the experimental study of the replacement of quartz powder
by trass (see 4.5.1. Mix designs). The final properties of this sample are listed in Table 23, as well as
the reference properties allowing to make immediate comparisons as it is useless to show plots for
only one sample. The reference properties are the average of the final value of the reference 2,4 and
6 samples, as previously mentioned, except for the drying shrinkage value which is only the value of
reference 6. The total amount of moisture loss of the trass sample is 73.3%.
Table 23: Final properties of the TrQ1 sample (trass substituting quartz), as well as the reference properties.
Final property Unit Reference TrQ1: 20%
Compressive strength MPa 3.14 3.73
A-value - 918.0 1112.1
Apparent density kg/m³ 462 458
Specific density g/cm³ 2.540 2.526
Porosity % 81.80 81.87
Thermal conductivity W/m∙K 0.0854 0.0832
Volumetric heat capacity MJ/m³∙K 0.37 0.36
Total length change mm/m 0.74 0.59
4.4. Preliminary study: basalt in AAC
As first, a preliminary study regarding the application possibilities of basalt in AAC is conducted.
Basalt is used as silica source material replacing quartz powder. Various substitution levels are
considered during this study. The influence of replacing a certain amount of quartz by basalt on the
slump flow and setting development (green body properties) is identified. The moisture content of
the basalt powder is negligible in the mix designs.
4.4.1. Slump flow
The slump flow of several fresh mixtures containing basalt replacing quartz with various levels is
determined. The selected substitution levels are 10%, 20%, 40% and 60% in mass proportion.
Additionally, the slump flow of the reference mixture is determined three times, allowing to make
comparisons as well as to obtain insight regarding the spread of the observed values. The reference
SF is again determined multiple times, as the first determined value differed quite significantly from
the values obtained during the preliminary study of trass & tuff ash in AAC (can be seen below). The
slump flow of a mixture (determined with the HESS cone) should be in between 23 cm and 28 cm.
When the slump flow of a certain mixture is not within this range, the water to solid ratio is adjusted
in order to ensure that the slump flow is within this range, i.e. if the slump flow is too high, the W/S
ratio is lowered and vice-versa. It is advisable to keep the water to solid ratio constant (equal to
reference value, i.e. 0.625) as long as possible, which makes it more easier to make comparisons.
The slump flow measurement results are listed in Table 24. The W/S ratio of the mixtures
incorporating 20%, 40% and 60% basalt required a reduction as the slump flow value is too high
(above limit of 28 cm). The reduced W/S ratio (0.550) is applied on all three mixtures, in order to get

63
an overall relationship. The results of these adjustments are also given in Table 24. The relationship
between the replacement level and the slump flow is presented graphically in Figure 65, for both a
W/S ratio of 0.625 and 0.550. The slump flow of the reference mixture is the average of 3
measurements, while the other values are the result of only 1 measurement. The determined
reference values are 25.6, 25.7 and 25.4 cm, providing a standard deviation of 0.18 cm for the
reference value.
Table 24: Slump flow of basalt mixtures (preliminary study).
Substitution level [%]
Slump flow d [cm]
Reference W/S ratio 0.625 Reduced W/S ratio 0.550
0 25.5 -
10 27.0 -
20 29.4 22.1
40 33.0 25.5
60 37.0 30.7
Figure 65: Relationship between the substitution level and the slump flow for different W/S ratios (pre-study basalt).
4.4.2. Initial setting time
The initial setting time (IST) of several selected samples incorporating basalt is determined, for which
the selection is based on the slump flow results. The IST is determined with the Vicat test based on
the standard EN 196-3. The main goal is to identify if the beginning of the setting is delayed or
accelerated by the incorporation of basalt. The selected mix designs are listed below:
Reference (determined several times) Basalt 20%
Basalt 10% Basalt 40%
The measurement results of the IST are listed in Table 25 and presented graphically in Figure 66. The
IST is determined only 1 time for the reference sample, because the obtained value corresponds to
the values measured during the preliminary study of trass & tuff. Therefore, the values from that
study are again used in this study. So, the reference value is the average value of 6 measurements,
and the error bar in Figure 66 represents the standard deviation. The other values (basalt samples)
are the result of only one measurement. The standard deviation of the reference sample (12 min) is

64
smaller than the measurement time interval (15 min). However, the absolute values have a
maximum difference of 35 min (355 min the smallest reference value, 390 min the largest reference
value). An important remark is that some bleeding is observed, which occurs between the ring and
the glass plate. The bled substance mainly appeared to be clear liquid.
Table 25: Initial setting time of basalt samples (preliminary study).
Sample IST [min]
Reference 375
Basalt 10% 405
Basalt 20% 420
Basalt 40% 450
Figure 66: Graphical representation of initial setting time of basalt samples (preliminary study).
4.5. Application of basalt in AAC
4.5.1. Mix designs
Several AAC samples incorporating basalt replacing quartz with various substitution levels are
produced. The produced samples and their parameters are described below in Table 26. All mix
designs follow the standard recipe, and each mix design has the same aluminium powder content,
i.e. 0.083% relative to the total amount of solids. However, the W/S ratio differs per mix design from
the reference value (0.625). The moisture content of the basalt is neglected.
Table 26: Mix designs of the AAC samples with basalt.
Sample name Substitution level [%] W/S ratio [-]
Reference 0 0.625 Basalt 1 10 0.625 Basalt 2 20 0.625 Basalt 3 40 0.600 Basalt 4 40 0.550 Basalt 5 60 0.500 Basalt 6 80 0.475 Basalt 7 97.5 0.450
The aim of the basalt version 7 sample was to completely replace the quartz powder by basalt.
However, only 3.9 kg of basalt was left at the time. Therefore, it was decided to use only half the
amount of the raw materials (total solids: 6 kg instead of 12 kg) due to the limited availability of the
basalt, which requires 4 kg of basalt for complete replacement. Thus, the substitution level of this
sample is 3.9 kg divided by 4 kg, or 97.5%. As a consequence, four test cubes could be produced but
they are all bottom cubes as the produced material sample has only roughly half the height of the
normal sample.

65
4.5.2. General observations during production process
During the production process of the samples, some general observations are made, which are
described as follows. Basalt is an inert material and does not exhibit pozzolanic reactivity. Therefore,
the material will act as an inert filler in the mix design. It is expected that the complete replacement
of quartz by basalt will provide poor compressive strength, and consequently, a certain amount of
quartz powder is required in order to allow the formation of tobermorite and to achieve an
acceptable strength. There is also a possibility that basalt acts as a nucleation agent in the mixture
[4]. Nucleation is the process where a new mineral is formed around an initiating particle that acts as
a nucleus or nucleation agent.
Basalt is a dark-coloured (greyish to black) powder, and thus will
affect the white colour of AAC. The more the (white) quartz powder is
replaced by the dark coloured basalt, the darker the colour of the final
AAC product becomes (see Figure 67).
As known from the preliminary study, basalt significantly affects the
water demand of the mix design, i.e. significantly reduces the required
water amount. Therefore, when the substitution level is gradually
raised, the W/S ratio should be gradually reduced. The measured
slump flows of the fresh mixtures during the production process
corresponded relatively well to the measured slump flow values
during the preliminary study.
4.5.3. Green body properties
The green body properties of each sample are determined, and the results are presented in Table 27.
Table 27: Green body properties of the basalt samples.
Property Unit BAS1: 10% BAS2: 20% BAS3: 40% BAS4: 40%
Slump flow cm 28.0 28.5 31.0 25.5
Rising height cm 30.2 30.8 30.6 27.8
Maximum temperature °C 79.2
(235-288 min) 79.3
(246-272 min) 80.4
(228-278 min) 82.2
(219-251 min)
Green strength Units 2.5h 3h 2.5h 3h 2.5h 3h 2.5h 3h
400 520 320 440 330 450 - 660
Property Unit BAS5: 60% BAS6: 80% BAS7: 97.5%
Slump flow cm 23.5 23.5 27.0
Rising height cm 27.2 26.9 -**
Maximum temperature °C 83.4
(188-212 min) 84.6
(189-203 min) -**
Green strength Units 2.5h 3h 2.5h 3h 2.5h 3h
500 >700* 500 680 520 610
Figure 67: Picture of the basalt samples (length sample 16 cm). From bottom to top: increasing basalt content, starting from reference.

66
*Maximum value which can be measured is 700 units. The green strength is measured with the penetrometer
without the cone (standard concrete penetrometer): 60 psi after 3 hours.
** Not able to measure (half sample).
Figure 68 presents the temperature development of the basalt samples, whereas Figure 69 shows
the rising development. The penetration depth is plotted in Figure 70 in function of the time, which
gives information concerning the setting development of the green body.
Figure 68: Temperature development of the green bodies of the basalt samples.
Figure 69: Rising development of the green bodies of the basalt samples.

67
Figure 70: Setting development (penetration depth) of the green bodies of the basalt samples.
4.5.4. Final product properties
The final material properties of the basalt samples are listed in Table 28.
Table 28: Final material properties of the basalt samples.
Final property Unit BAS1: 10% BAS2: 20% BAS3: 40% BAS4: 40%
Compressive strength MPa 3.07 3.28 3.56 3.86
A-value - 969.7 1052.5 1093.1 1076.9
Apparent density kg/m³ 445 442 451 473
Specific density g/cm³ 2.552 2.526 2.518 2.552
Porosity % 82.57 82.52 82.09 81.46
Thermal conductivity W/m∙K 0.0796 0.0785 0.0811 0.0850
Volumetric heat capacity MJ/m³∙K 0.33 0.33 0.33 0.34
Total length change mm/m 0.65 0.59 0.41 0.39
Final property Unit BAS5: 60% BAS6: 80% BAS7: 97.5%
Compressive strength MPa 4.79 3.69 2.31
A-value - 1195.1 926.8 490.6
Apparent density kg/m³ 501 499 542
Specific density g/cm³ 2.536 2.559 2.670
Porosity % 80.26 80.52 79.92
Thermal conductivity W/m∙K 0.0908 0.0875 0.0861
Volumetric heat capacity MJ/m³∙K 0.38 0.38 0.38
Total length change mm/m 0.36 0.36 0.43

68
The final properties are plotted in a graph in function of the substitution level (basalt content). Figure
71 shows the plot for the strength, Figure 72 for the density, Figure 73 presents the plot for the
porosity and finally Figure 74 for the thermal conductivity. Regarding the drying shrinkage, the total
length change of the samples is plotted against the substitution level in Figure 75. Furthermore,
Figure 76 presents the relative length change versus the moisture content of the basalt samples.
Unfortunately, the total lost amount of moisture of the basalt samples could not be determined,
because of a deviating start-up of the experiment. This will be explained in more detail during the
discussions.
Figure 71: Plot of the strength values of the basalt samples.
Figure 72: Plot of the density values of the basalt samples.

69
Figure 73: Plot of the porosity values of the basalt samples.
Figure 74: Plot of the thermal conductivity values of the basalt samples.
Figure 75: Total length change of the basalt samples against their substitution level.

70
Figure 76: Relative length change of the basalt samples against their moisture content.
4.6. Application of copper slag in AAC
4.6.1. Mix designs
Copper slag is applied as substitution material for quartz powder. Only two full-scale AAC samples
with copper slag partially replacing quartz powder are produced, due to the limited availability of
copper slag for this research. Both mix designs follow the standard recipe, and have the same
aluminium powder content, i.e. 0.083% relative to the total amount of solids. The water content
differs from the reference value (0.625) for the second mix design. In the W/S ratio, the moisture
content of the copper slag is neglected (assumed to be dry). The mix design parameters are listed
below:
Copper slag version 1: substitution level is 20%, reference W/S ratio.
Copper slag version 2: substitution level is 40%, W/S ratio is 0.575.
With the remaining copper slag after the production of the two full-scale samples, three small test
samples with substitution levels 60%, 80% and 100% are prepared in self-made small moulds. These
produced samples will only be used for micro-structural analysis and for specific density
measurements, which require only a small amount of test material. The W/S ratio of the samples is
0.625. The reference W/S ratio is chosen for these sample, because this parameter has a minor
influence on the specific density and microstructure. Furthermore, the dimensions of the samples are
roughly 15 by 8 by 10 cm³.
4.6.2. General observations during production process
Some general or remarkable observations are made during the production process of the AAC
samples with Cu slag. Copper slag is a hard and inert material that does not exhibit pozzolanic
reactivity [2]. Therefore, the material will most likely serve as an inert filler in the AAC matrix (at least
within the green body). Consequently, the complete replacement of quartz powder by Cu slag will

71
probably imply poor strength. Moreover, a certain amount of quartz powder must be present in the
mix so that the formation of tobermorite will take place.
Copper slag is known for its black-coloured grains which
will change the white appearance of AAC. The magnitude
of the colour change depends on the substitution level,
i.e. the more slag is incorporated, the more the final
material turns greyish (see Figure 77).
4.6.3. Green body properties
The different green body properties of the two Cu slag samples are listed in Table 29.
Table 29: The green body properties of the copper slag samples.
Property Unit CuS1: 20% CuS2: 40%
Slump flow cm 27.0 26.0
Rising height cm 29.8 28.0
Maximum temperature °C 79.8
(239-253 min) 82.7
(270-296 min)
Green strength Units 2.5h 3h 2.5h 3h
340 500 400 580
The temperature development, the rising development and the setting development or the
penetration depth in function of time, including the references, are presented graphically in Figure
78, Figure 79 and Figure 80 respectively.
Figure 78: Temperature development of the copper slag samples.
Figure 77: Picture of the copper slag samples including reference (width sample 16 cm). Bottom: reference, middle: 20% Cu slag sample and top: 40% Cu slag sample.

72
Figure 79: Rising development of the copper slag samples.
Figure 80: The setting development (penetration depth) of the copper slag samples.
4.6.4. Final product properties
The different final AAC properties of the copper slag samples are summed up in Table 30.
Table 30: Final AAC properties of the two copper slag samples.
Final property Unit CuS1: 20% CuS2: 40%
Compressive strength MPa 3.77 4.43
A-value - 1152.5 1186.8
Apparent density kg/m³ 452 483
Specific density g/cm³ 2.450 2.423
Porosity % 81.92 80.06
Thermal conductivity W/m∙K 0.0830 0.0834
Volumetric heat capacity MJ/m³∙K 0.34 0.37
Total length change mm/m 0.73 0.52

73
The specific density of the small 60%, 80% and 100% Cu slag AAC sample is 2.323 g/cm³, 2.247 g/cm³
and 2.247 g/cm³ respectively.
The determined final properties are as well plotted in graphs. Figure 81 presents the relationship
between the substitution level and the strength, Figure 82 for the density, Figure 83 for the porosity
and finally Figure 84 for the thermal conductivity. Furthermore, Figure 85 shows the total length
change in function of the substitution level on the left side, and on the right side the relative length
change against the moisture content. Unfortunately, the total amount of moisture lost from both
copper slag prisms could not be determined exactly (same as for basalt prisms), which will be
discussed in Chapter 5.6.2.
Figure 81: Relationship between the strength and the copper slag content.
Figure 82: Relationship between the density and the copper slag content.

74
Figure 83: Relationship between the porosity and the copper slag content, on the left side.
Figure 84: Relationship between the thermal conductivity and the copper slag content, on the right side.
Figure 85: On the left side, the total length change against the substitution level. On the right side, relative length change against the moisture content.
4.7. Application of granite in AAC
The next alternative material which is investigated regarding its application possibilities in AAC is
granite powder. Granite powder is as well applied as replacement material for quartz powder.
4.7.1. Preliminary study: slump flow
As first, a preliminary study is performed, but only the influence of granite on the slump flow of fresh
AAC mixtures is identified. This provides the most important information which is needed during the
production process. Information concerning the setting time is less important and therefore, it is not
determined here.
Thus, the slump flow of several fresh AAC mixtures incorporating granite partially replacing the
quartz powder is measured. The selected substitution levels are 10%, 20%, 40% and 60%. The
moisture content of the granite powder is neglected in the mix designs. In addition, the slump flow of
the reference mixture is again determined one more time, and the value is compared with the
previously determined values (preliminary study basalt). This value corresponded well to the
previously measured values. Therefore, the reference slump flow is the average of the three values
measured during the preliminary study of basalt and the value measured during this study. As
already mentioned, the SF should be in between 23 cm and 28 cm in order to have an acceptable

75
workability. When the SF is not within this range, the water to solid ratio is adjusted in order to
ensure that the slump flow is within this range.
The SF measurement results are summed up in Table 31. The reference SF is the average of 4
measurements, while the other values are the result of only 1 measurement. The W/S ratio of the
mixtures containing 20%, 40% and 60% granite required a reduction in water content as the SF value
is too high. The reduced W/S ratio is chosen as 0.575. This reduced ratio is applied on the three
mixtures, and the SF measurement is repeated. The results of these modifications are also given in
Table 31. The SF values are also plotted in function of the substitution level in Figure 86, for both
selected W/S ratios. The determined reference values are 25.3 (this study), 25.4, 25.6 and 25.7 cm,
providing a standard deviation of 0.20 cm for the reference value.
Table 31: Slump flow values of AAC mixtures with granite (preliminary study).
Substitution level [%]
Slump flow d [cm]
Reference W/S ratio 0.625 Reduced W/S ratio 0.575
0 25.5 -
10 27.3 -
20 28.0 23.5
40 30.4 26.2
60 31.7 28.3
Figure 86: Slump flow values of AAC mixtures with granite in function of the substitution level (preliminary study).
4.7.2. Mix designs
Several AAC samples with granite powder replacing quartz are produced, each with a different
substitution level. The designed mixes follow the standard recipe and the aluminium powder content
is equal for each mix. However, as known from the preliminary study, the granite affects the
workability of the fresh mixtures. Consequently, the W/S ratio is adjusted in some cases. The
moisture content of the granite powder is zero. The mix design parameters are given below in Table
32.

76
Table 32: Mix design parameters of the granite AAC samples.
Sample name Substitution level [%] W/S ratio [-]
Granite 1 10 0.625 Granite 2 20 0.625 Granite 3 40 0.625 Granite 4 40 0.575 Granite 5 60 0.550 Granite 6 80 0.525 Granite 7 100 0.516
During the production of the granite version 7 sample, the water content was adjusted in situ by
adding a known amount of water in order to obtain a mixture with an acceptable workability. The
W/S ratio was originally selected to be 0.500, but this value appeared to be too low.
4.7.3. General observations during production process
As first, some general remarks are given about the production of
AAC incorporating granite powder. Granite does not exhibit any
(pozzolanic) reactivity and consequently, is an inert material.
Granite is a strong, solid and hard rock material. The granite grains
will most likely serve as (inert) fillers within the AAC matrix. On the
other hand, a certain amount of reactive quartz is probably
required in order to enable the generation of tobermorite crystals.
However, only micro-structural analysis can provide a conclusive
answer regarding the role of granite in the matrix.
Granite powder has not the same white colour as quartz and is
more brownish to greyish. Consequently, the granite will affect the
white appearance of AAC. For higher substitution levels, the colour
turns more greyish, as can be seen in Figure 87. However, this
colour-changing effect is not as significant compared to the effect
of the basalt and copper slag.
The last remark is that the granite powder has a lower water demand than the quartz powder. Thus,
the more quartz is replaced by granite, the more the flowability of the mixture increases. In turn, the
water content of the mix designs should be reduced for higher substitution levels, similar as during
the study of basalt and copper slag. As will be seen in the next chapter (4.7.4.), the slump flow values
measured during the production of the different samples are in accordance with the values
measured during the pre-study.
4.7.4. Green body properties
The AAC samples produced with granite exhibited the green body properties presented in Table 33.
Figure 87: The granite samples (length sample 16 cm), from bottom to top: reference to granite 7. The colour differences are clearly visible.

77
Table 33: The green body properties of the AAC samples with granite.
Property Unit Gra1: 10% Gra2: 20% Gra3: 40% Gra4: 40%
Slump flow cm 27.0 28.0 29.5 26.0
Rising height cm 29.0 30.0 29.8 28.6
Maximum temperature °C 79.8
(246-266 min) 79.8
(252-261 min) 79.8
(243-269 min) 81.6
(212-245 min)
Green strength Units 2.5h 3h 2.5h 3h 2.5h 3h 2.5h 3h
440 540 420 600 400 540 560 690*
Property Unit Gra5: 60% Gra6: 80% Gra7: 100%
Slump flow cm 25.5 25.0 23.0**
Rising height cm 27.5 27.2 26.2
Maximum temperature °C 82.9
(201-246 min) 84.2
(200-212 min) 83.4
(191-209 min)
Green strength Units 2.5h 3h 2.5h 3h 2.5h 3h
680 >700* 640 >700* 590 >700*
* The maximum value able to measure is 700 units. The green strength is measured with the penetrometer
without the cone (standard concrete penetrometer): 40 psi after 3 hours for the granite 4 sample as well the
granite 5 sample, and 50 psi after 3 hours for the granite 6 sample as well as the granite 7 sample.
** The SF value of 23.0 is measured for a W/S ratio of 0.500. However, a known amount of water was added in
situ during the production process in order to enhance the workability. Therefore, the slump flow is slightly
higher than 23.0 in reality.
Figure 88, Figure 89 and Figure 90 show the temperature development, the rising development and
the penetration depth development respectively in time of the AAC samples with granite including
reference samples.
Figure 88: Temperature development of the AAC samples with granite, including reference.

78
Figure 89: Rising development of the AAC samples with granite, including reference.
Figure 90: Penetration depth development in time of the AAC samples with granite, including reference.
4.7.5. Final product properties
The AAC samples produced with granite exhibited the final product properties listed in Table 34.
Unfortunately, the drying shrinkage of the granite samples could not be determined due to a lack of
time during the research.

79
Table 34: The final product properties of the AAC samples with granite.
Final property Unit Gra1: 10% Gra2: 20% Gra3: 40% Gra4: 40%
Compressive strength MPa 3.26 3.27 3.43 3.92
A-value - 951.8 1010.0 1061.8 1131.4
Apparent density kg/m³ 463 450 449 466
Specific density g/cm³ 2.547 2.485 2.463 2.466
Porosity % 81.84 81.91 81.76 81.12
Thermal conductivity W/m∙K 0.0814 0.0808 0.0827 0.0867
Volumetric heat capacity MJ/m³∙K 0.34 0.32 0.33 0.35
Final property Unit Gra5: 60% Gra6: 80% Gra7: 100%
Compressive strength MPa 4.60 5.07 4.19
A-value - 1213.4 1280.9 1028.9
Apparent density kg/m³ 487 498 505
Specific density g/cm³ 2.423 2.419 2.448
Porosity % 79.92 79.43 79.39
Thermal conductivity W/m∙K 0.0936 0.0950 0.0947
Volumetric heat capacity MJ/m³∙K 0.37 0.40 0.39
Figure 91 presents the plot of the strength values, Figure 92 the density values, Figure 93 the
porosity values and finally Figure 94 the thermal conductivity values, all in function of the
substitution level.
Figure 91: Strength values of the AAC samples with granite in function of the substitution level.

80
Figure 92: Density values of the AAC samples with granite in function of the substitution level.
Figure 93: Porosity values of the AAC samples with granite in function of the substitution level.
Figure 94: Thermal conductivity values of the AAC samples with granite in function of the substitution level.

81
5. Discussion
5.1. Discussion of the reference samples
Four reference samples were produced and tested during the project (5, 6, 7 and 8). In addition, two
other reference samples (2 and 4), previously produced by C. Straub, were tested on the final
properties. In a later stage, a reference 9 was also produced but its results are not included in the
report except for the rising development. Thus, sufficient reference samples are produced during
which all the green body parameters are monitored, and all the final AAC properties are determined.
The overall average is made for each property which will serve as a strong basis for further analysis.
Regarding the green body properties, the different reference samples correspond quite well to each
other. The reference slump flow ranges from 24.0 to 27.0 cm, with the average (25.5 cm) nicely in
the middle of the defined limits, i.e. 23 and 28 cm. The final rising height is roughly the same for each
reference, while some differences occur in the rising development (Figure 21). The reference 6 and 8
green bodies appeared to rise slower compared to reference 5 and 9 green bodies. The delayed
rising can be caused by several factors, for instance problems with the measurement device. The
temperature development and the maximum temperature with corresponding time of occurring are
all in correspondence with each other (Figure 20), which as well applies for the setting or stiffening
development of the different reference green bodies (Figure 19). However, the developed
temperature within the green body of ref 5 is slightly lower compared to the other three reference
samples which exhibited the same temperature development. Both the 2.5 and 3 hours green
strength of the reference 5 and 6 sample are lower compared to that of the reference 7 and 8
sample, but the differences are rather small and the green strength is only an indication.
When comparing the time where the maximum in rising height occurs followed the steady horizontal
curve (rising development plot) with the time where the setting starts (penetration depth
measurement plot), it can be seen that both parameters take place within roughly the same time
range. This is a very important fact, as the sample or green body would fail/collapse during the
production (rising and setting stage) when this is not the case. Sudden drops in the rising
development plots (around 50-100 minutes) are caused by the settling of the green body, a so-called
sinking effect. It can be seen that a slight delayed setting development (ref 5 and 6) results as well in
a slight delayed sinking effect, and vice versa.
Furthermore, there appear to be two shoulders in the temperature development: an initial, very
strong shoulder within the first 20 minutes, and a second, less strong shoulder until roughly 300
minutes. The first shoulder is mainly attributed to the reaction of the aluminium powder, whereas
the second shoulder is mainly attributed to the main hydration reactions, i.e. hydration reaction of
lime and Portland cement. These general findings are as well important and applicable for the AAC
samples to come, i.e. AAC samples produced with alternative materials.
Regarding the final AAC properties, the raw density of the reference samples are all in between 450
and 469 kg/m³, so close to each other with the average being 459 kg/m³. The compressive strength
values are all close to each other, ranging from 3.02 to 3.33 N/mm² with as average 3.18 N/mm²,
except for the reference 7 sample which exhibited a very low strength accompanied by a very high
standard deviation. It is clear that the strength of ref 7 is negatively influenced by a certain factor.
Micro-structural analysis can provide an explanation for this question. Nevertheless, as already

82
explained, the compressive strength can hardly be evaluated as the value depends strongly on the
apparent density. Therefore, the A-value was calculated which presents the strength independent of
the apparent density of the material. The A-values of the reference 2, 4 and 8 sample are almost
equal to each other, whereas the A-value of the reference 6 is lower due to its slightly lower
compressive strength and slightly higher raw density. Therefore, the A-value of ref 6 is left out of the
average value. Furthermore, the A-value of the reference 7 sample is very low due to its poor
compressive strength. Therefore, it was decided to leave out the ref 7 strength (both compressive
strength and A-value) from the average reference strength.
The specific density values are all close to each other, within the range of 2.50 and 2.56 g/cm³. The
specific density is roughly five times bigger than the raw density so the porosity is roughly 80%.
Looking at the actual porosity values, it can be seen that all the values are almost equal as the values
are within a range of 81.63 and 82.20%. Furthermore, the thermal conductivity values have a slight
bigger spread, ranging from 0.079 to 0.088 W/m∙K. However, all the values have the same order of
magnitude. As last the drying shrinkage is assessed. The first thing that can be noticed is that the
values are high, actually too high according to the standards: the total length change is two times too
large. This problem is discussed in the last paragraph of this part. On the other hand, all three values
are almost equal to each other and the reference total length change is 0.74 mm/m on average. Plots
of the relative length change against the moisture content indicate that the ASTM requirement is
also not fulfilled. The problem with ref 7 and 8 will be discussed together with the basalt samples.
The reference 5 sample was only used to investigate the influence of the moisture content on the
strength and to validate the current European standard. As can be seen from Table 10 when
comparing the average CS + 20% of 3.21 N/mm² (calculated) with the average reference CS of 3.18
N/mm², the experimental results are in accordance with the standard, i.e. the difference in strength
is approximately 20% for a difference in moisture content of 6% (dry sample relative to a moisture
content of 6%). In this way, the recommendations of the standard can be validated and verified.
Furthermore, there appears to be a difference in compressive strength when the samples are dried
at 105°C instead of 60°C. The strength is slightly higher: 3.49 N/mm² compared to 3.18 N/mm². This
is caused by an extra loss of moist due to the elevated temperature of drying. Moreover, the raw
density is slightly lower when the samples are dried at 105°C instead of 60°C (452 kg/m³ compared to
459 kg/m³) as well due to the additional loss of moist because of the elevated temperature of drying.
Additionally, the influence of moisture on the thermal insulating performance of a reference sample
(no. 2) was investigated. As commonly known, moisture increases the thermal conductivity which
could also be observed in Table 11. However, the difference is not significant, but on the other hand,
the moisture content of the sample is also very low.
A last remark, but also an important remark is that the reference sample could be further optimised
as the used (commercial) quartz powder is actually one fraction too small. The dissolution rate of the
fine quartz is very high. By using quartz powder that is one fraction bigger (available nowadays on
the market), the (final) properties, such as strength and drying shrinkage, could be improved.
Table 9 shows that the drying shrinkage of the reference samples are too high, and above the limit
implied by the standards (both ASTM and RILEM). Possible causes of this problem are the too fine
particle sizes of the quartz powder and the unsuitable design of the binder content (quartz, lime and
cement content). Therefore, it was decided to play with the binder content and identifying the
effects on the drying shrinkage. The lime and/or cement content is increased while the quartz
content is substantially lowered. However, these results will not be incorporated in this thesis.

83
5.2. Preliminary study trass & tuff in AAC
First insights regarding the application of trass and tuff ash in AAC are gained by means of studying
the influence of these alternative materials on the slump flow and initial setting time.
Trass is a commonly used raw material in the cement and concrete industry. Therefore, the material
is already optimised in several aspects. The used trass is the same as used in the cement industry. On
the contrary, tuff ash is only mined to be able to mine trass and does not have a useful application.
Consequently, the material as received is not yet optimised and is used in the form as found in
nature. For example, even a cigarette butt was found in the tuff ash batch.
Tuff ash is investigated in two forms: natural tuff ash and ground tuff ash. The natural tuff ash has
various particle sizes, ranging from very small to some very large sizes, i.e. from 1 m to even about 2
cm. Tuff ash is applied as substitution of quartz, whereas trass is applied as replacement of both
quartz or cement. The main function of cement in AAC is to provide strength to the green body so
that it does not collapse under its own weight. Consequently, when cement is partly replaced by
trass, the influence of this substitution on the green body properties and especially the green
strength and setting is a very important aspect. The objective of this pre-study is to get an idea of the
substitution levels which are possible to apply in later research, especially the influence on the
workability is important to know.
5.2.1. Influence on slump flow
The slump flow of the reference mixture is determined 5 times, in order to get an idea of the spread
of the measured values. The measured values are 23.8, 24.4, 24.5, 23.9 and 24.0 cm, giving an
average value of 24.1 cm. As can be derived from these values, the absolute spread is approximately
0.7 cm and the calculated standard deviation is 0.31 cm.
The incorporation of tuff ash (both natural as ground form) affects the slump flow of the fresh
mixture. The slump flow increases with increasing content of both natural and ground tuff ash, and
seems to follow a linear trend in both cases. The application of natural tuff ash seems to have more
significant influence on the slump flow compared to ground tuff ash. As already seen, the NTA has
larger particle sizes compared to the GTA, but for the rest both materials are the same. These large
particles can be seen again in Figure 5. Smaller particles have a higher water demand compared to
larger particles, which may explain the lower slump flow values for GTA relative to the values for
NTA.
The relationship between the natural tuff ash content and the slump flow follows a linear trend. It
can be seen from the experimental results that natural tuff ash can be successfully applied up to 20%
without the need to adjust the W/S ratio. Incorporating higher contents of natural tuff ash requires
reducing the W/S ratio to achieve an acceptable slump flow. Reducing the W/S ratio from 0.625 to
0.600 for the 20% NTA sample results in a slump flow reduction from 27.4 to 26.4 cm, whereas
reducing the W/S ratio from 0.625 to 0.550 for the 40% NTA sample leads to a slump flow reduction
from 30.3 to 24.2 cm. Therefore, the suggested W/S ratio for AAC samples with 40% natural tuff ash
is 0.550. If the W/S ratio of the 20% NTA sample needs to be adjusted, the suggested value is 0.600.
The relationship between the ground tuff ash content and the slump flow seems also to follow a
linear trend. Based on the slump flow values, it can be observed that ground tuff ash can be

84
successfully applied up to 40% without needing to adjust the W/S ratio. Adding higher contents of
ground tuff ash requires to lower the W/S ratio to achieve an acceptable slump flow. Reducing the
W/S ratio from 0.625 to 0.575 for the 40% GTA sample results in a slump flow reduction from 27.7 to
22.4 cm, whereas the 60% GTA sample with a W/S ratio of 0.550 exhibits a slump flow of 21.2 cm.
Therefore, the suggested W/S ratio for AAC samples with 60% ground tuff ash is 0.575. If the W/S
ratio of the 40% GTA sample needs to be adjusted, the suggested value is 0.600.
Trass can be applied as substitution of both quartz powder or Portland cement. Trass as replacement
of quartz seems to lead to an increasing slump flow for substitution levels up to 20%. The slump flow
increases from 24.1 cm (reference) to 25.9 cm (20% trass). However, for higher replacement levels
than 20%, the slump flow seems to remain constant at a value of approximately 25.9 cm for levels up
to 60%. The further incorporation of trass has no influence anymore on the slump flow. No
adjustments of the W/S ratio are required for the mix designs. This indicates that the trass has no
influence on the workability of the fresh mixture.
Trass substituting cement seems to have only little effect on the slump flow, perhaps a slight
decreasing effect in general. For substitution levels 5% and 10%, the slump flow increases slightly
from 24.1 cm (reference) to 25.2 cm (10% trass). On the other hand, when the replacement level is
higher than 10%, the slump flow decreases with increasing trass content. The value gradually
decreases from 25.2 cm (10% trass) to 23.0 cm (60% trass). However, all values are close to each
other, and the error range of the trass values is not known. One important fact has to be kept in
mind, i.e. the quartz makes up two thirds of the total amount of raw materials, while the cement
only one fifth of the total amount of raw materials.
The slump flow gives only an indication and provides not the most accurate values because it
depends on many factors (e.g. speed of the mixing by hand). This can also be seen from the spread of
the reference values. The slump flow values of the trass & tuff samples are only determined once, so
the error range of each value is not known. However, it could be that knowing the spread of the
reference, the slump flow values of the trass samples are within the error range as the values are
relatively close to each other so that there is no distinct influence noticeable.
5.2.2. Influence on setting
The initial setting of the reference mixture was determined 5 times. In this way, insight is gained
regarding the spread of the experimental values. These values are: 355, 370, 380, 380 and 380
minutes. The average value is 373 minutes, characterised by a standard deviation of 11 minutes. The
absolute spread is roughly 25 minutes.
The initial setting time of the reference mixture is 375 minutes, as the accuracy is 15 minutes (time
interval between measurements). All the other time values are the result of only one measurement.
By incorporating 15% natural tuff ash, the initial setting time is slightly postponed to 395 minutes,
whereas the IST of the 30% NTA mixture is 370 minutes (back to reference). Thus, the incorporation
of relatively small amounts of natural tuff ash seems to have little to no influence on the setting of
the mixture as the differences are really small and the values are within the same error range. The
incorporation of ground tuff ash seems to slightly delay the setting, as the 20% and 40% GTA samples
exhibit an initial setting time of 405 and 400 minutes respectively, but the values are also very close
to reference. Therefore, the observed effect has to be neglected.

85
The incorporation of 50% trass as replacement of quartz seems to accelerate the setting of the
mixture, as the IST decreases from 375 to 310 minutes. A possible explanation is that trass possesses
some pozzolanic properties, as a result of which the setting may be accelerated. On the other hand,
the replacement of cement by trass leads to a delayed setting. This indicates that Portland cement
provides a better setting development compared to trass. When 25% cement is replaced by trass, the
IST is delayed half an hour, which is not much of great significance. However, when the substitution
level is 50%, the IST could not be determined within the accepted time interval and the IST is higher
than or equal to 450 minutes. Consequently, it seems that 50% cement replacement by trass is not
feasible.
An important remark is that the addition of aluminium powder is not performed during the
determination of the initial setting time, as well as an elevated temperature is not maintained within
the sample. These two aspects differ from the actual research process. As a result, the setting is
significantly slower compared to the setting of the green body during the actual production process.
5.2.3. Further research
Based on the slump flow results and the determined initial setting times, the influence of the
substitution levels for trass and tuff ash is identified. Ground tuff ash seems to have more potential
to be applied in AAC compared to natural tuff ash, or in other words, a larger quantity of ground tuff
ash could be incorporated compared to natural tuff ash. The large particles of the natural tuff ash
may cause some problems. The preliminary study also shows that trass is a promising material for
the production of AAC, both as replacement of Portland cement and quartz powder. Trass
substituting quartz seems to be a very promising variable and potentially high replacement levels can
be aimed. However, the more critical replacement to study is the replacement of Portland cement by
trass, which shall be given the main focus.

86
5.3. Application of trass & tuff ash in AAC
The influence of the incorporation of trass and tuff ash with various substitution levels in AAC on
both the green body properties and the final AAC properties were studied experimentally, and the
obtained results will be discussed in the parts as follow. The investigated green body properties are
the slump flow, the temperature development (maximum temperature at which time), the rising
development (maximum rising height), the penetration depth as indication of the setting
development and the green strength. The investigated final AAC properties are the compressive
strength, A-value, the apparent and specific density, the porosity, the thermal conductivity and the
drying shrinkage.
5.3.1. Natural tuff ash
Natural tuff ash (as found in the soil) is applied as substitution material for quartz powder, i.e. as
siliceous source material. The raw material is characterised by a very wide range in particle sizes and
contains some big particles. The first produced AAC sample with NTA included 20% (non-sieved) NTA
and thus the sample contained large particles. These particles can damage the mixing rod and the
band saw (or cutting wires) and therefore, it was decided to sieve the material in order to obtain a
material with a maximum particle size of 2 mm. Looking at the PSD of natural tuff ash in Figure 3, one
can see that there is a gap in particle size in between roughly 400 m and 4 mm (horizontal line). So
the large particles (small fraction) are bigger than 4 mm. In order to remove this fraction, the sieve
diameter is selected as 2 mm. This sieved material is applied in the other NTA samples. The only
difference between the NTA1 and NTA2 sample (both contain 20% NTA) is that the NTA2 sample
does not contain the big particles (>2 mm) anymore.
It was known beforehand that the application of natural tuff ash in autoclaved aerated concrete is
not feasible from a technical point of view due to its big particles. Nevertheless, the application of
NTA in AAC is investigated as a pre-study before the study of the application of ground tuff ash.
Green body properties
The reference green body properties are the average of the green body properties of the reference 5
and 6. From the discussions below, it can be said that the big particles have no influence on the
green body properties, as they hardly affect the slump flow, the temperature development, the rising
height and the setting. However, there occurs a segregation problem: some heavy particles sink
down in the green body, while some lightweight particles move towards the surface (see Figure 5).
For all green bodies, the end of the rising phase followed by the sinking effect takes place together
with the stiffening phase, which is a major requirement. All the green body properties were checked
and approved, so that the green bodies could be autoclaved afterwards.
Slump flow
The slump flow increases relatively strongly with increasing NTA content (Table 15), which was also
observed during the preliminary study. The slump flow increases from 25.0 cm as reference (average
of two reference samples) to 27.0 cm for the AAC mixture with 20% non-sieved NTA, and to 27.5 cm
for the AAC mixture with 20% sieved NTA. The AAC mixture containing 60% NTA exhibited a very high
slump flow, i.e. 31.2 cm which is above the accepted upper limit of the slump flow (28 cm).
Moreover, the high flowability of the fresh mixture caused the final pores to be larger compared to

87
all the other samples due to the lowered viscosity, as already mentioned in 4.5.2. ‘General
observations’ (Figure 32). The NTA 3 sample actually required an adjustment in its water content.
Temperature development
The reference maximum temperature is 79.0 °C around 250 to 280 minutes (average of two). Both
20% NTA samples (sieved and non-sieved) show roughly the same maximum temperature occurring
at roughly the same time moments. The temperature development of the reference and the NTA1
and NTA2 sample plotted in Figure 33 indeed follow the same trend. On the other hand, the NTA3
sample (60%) exhibits a higher maximum temperature at a later time moment, i.e. 81.0 °C at around
300 minutes. Consequently, the temperature development differs also slightly, and the plot seems a
bit shifted to higher temperatures and later times. This increment in temperature and the postponed
moment of taking place may be attributed to the additional pozzolanic activity of the natural tuff ash,
although it was accepted that the material does not possesses pozzolanic activity.
Rising development
The addition of NTA in AAC tends to increase the rising height with increasing NTA contents, probably
due to the lower viscosity of the fresh mixture which is also reflected in the larger pore sizes of the
final product. The reference rising height (average of two) is 29.3 cm. Due to the incorporation of
20% NTA, the green body rises towards a height of 30.5 or 30.2 cm (not sieved and sieved NTA
respectively). The rising height increases further to 31.2 cm for a NTA content of 60%. Looking at the
rising development plot (Figure 34), no clear differences or irregularities can be observed.
Setting development
The penetration depth in function of time is plotted in Figure 35, and provides information regarding
the setting of the green body. The incorporation of NTA tends to not affect the setting development
of the green body. As can be seen, the plots of the NTA1, NTA2 and NTA3 sample all are very close to
the reference plot, and no clear effect can be distinguished regarding the influence of NTA on the
setting. These findings are in accordance with the results from the preliminary study.
Green strength
The reference green body has a green strength of 385 units after 2.5 hours and 560 units after 3
hours, on average of two. The green strength of the NTA1 sample could not be determined due to
lack of time on that day. As can be seen from Table 15, the incorporation of 20% sieved NTA does not
influence the green strength, nor the incorporation of 60% sieved NTA. These two green bodies
exhibit a green strength of 400 and 390 units afters 2.5 hours respectively, and 570 and 550 units
after 3 hours respectively. Thus, the application of natural tuff ash in AAC does not affect the green
strength.
Final AAC properties
The influence of the application of natural tuff ash on the final AAC properties will be discussed in
this part (Table 20). From the discussions below, it can be observed that the big particles (> 2mm) in
the non-sieved tuff ash have little to no influence on the final AAC properties. The reference final
AAC properties are the average of the properties of the reference 2, 4 and 6 sample.

88
Strength
The reference compressive strength is 3.14 MPa, on average of three samples. The incorporation of
20% NTA seems to slightly increase the strength of AAC as the strength of the NTA1 sample (non-
sieved NTA) and NTA2 sample (sieved NTA) is 3.40 and 3.31 MPa respectively, although this trend is
not conclusive. Moreover, there is no influence of the big particles on the strength. The NTA3 sample
with 60% NTA has a compressive strength of 2.91 MPa. Thus, the compressive strength slightly
decreases compared to reference and substitution level of 20%, which is observed in Figure 46.
However, the evaluation of strength can only be conducted by means of the A-value, as the
compressive strength of AAC depends strongly on the density.
The A-value of both the NTA 1 and NTA 2 sample (20% substitution level) is higher than reference,
increasing from approximately 920 to 1050 and 1100. This increase in A-value is caused by slightly
higher compressive strengths and slightly lower apparent densities of the 20% NTA samples. The
change in the CaO to SiO2 ratio of the matrix and the pozzolanic reactivity of tuff ash are likely to be
important parameters, as will be seen later on. This indicates that the incorporation of tuff ash in
AAC may be beneficial for its properties. Furthermore, the NTA 3 sample shows a similar A-value
compared to reference due to its lower compressive strength but also lower apparent density. These
results are very promising for the application of ground tuff ash in AAC.
Density – porosity
The addition of NTA tends to result in a small decreasing apparent density with increasing
substitution levels (Figure 47). The apparent density decreases gradually from 462 kg/m³ (reference
as average of three) to 450 and 447 kg/m³ for the 20% non-sieved NTA sample and 20% sieved NTA
sample respectively. Moreover, the big particles (>2 mm) do not affect the apparent density. The
60% NTA sample has a raw density of 442 kg/m³, and thus again a lowered density compared to the
previous samples. However, the differences are relatively small.
The specific density of the NTA samples decreases with increasing NTA content (Figure 47). The
reference specific density is 2.54 g/cm³ on average of three samples. The value decreases to 2.46,
2.50 and 2.39 g/cm³ for the 20% non-sieved, 20% sieved and 60% sieved NTA sample. The decrease
in specific density with increasing NTA content seems to follow a smooth linear trend. Again, the big
particles do not have any influence. The density of tuff ash is similar to the value of quartz powder,
but still slightly lower, which may imply the decreasing specific density. Another possible reason is
that the formed reaction products through tuff ash are a bit lighter than the conventional reaction
products through quartz powder.
The porosity remains roughly the same for each sample as can be seen in Figure 48, because the raw
and specific density both decrease with increasing NTA content (roughly the same slope). The
reference porosity is 81.80% (average of three), and the porosity of the 20% non-sieved, 20% sieved
and 60% sieved NTA sample is 81.73%, 82.09% and 81.52% respectively. Thus, the values are all very
close to reference. Therefore, it can be identified that the incorporation of NTA in AAC does not
affect the porosity.

89
Thermal conductivity
The thermal conductivity decreases with increasing NTA content in general as can be seen from
Figure 49. The value decreases from 0.0854 W/m∙K to 0.0801 and 0.0803 W/m∙K for the 20% non-
sieved and 20% sieved NTA sample respectively. Moreover, the big particles in the tuff ash do not
influence the thermal properties. The value decreases a bit further to 0.0788 W/m∙K for the 60% NTA
sample. The decrements have not a significant magnitude but nevertheless, the addition of NTA
results in a drop in thermal conductivity which is beneficial for the performance of AAC.
Furthermore, the incorporation of NTA results in a drop in volumetric heat capacity, but the
decrement seems to be independent of the NTA content (Table 20), i.e. from 0.37 (reference) to
0.30, 0.33 and 0.31 MJ/m³∙K for the 20% non-sieved, 20% sieved and 60% sieved NTA samples.
Drying shrinkage
The drying shrinkage of the NTA samples is assessed according to the RILEM recommendations and
the ASTM standard. Therefore, the total length change is plotted in function of the substitution level
and the relative length change against the moisture content in Figure 50. RILEM recommends that
the total length change should be below 0.35 mm/m. As already mentioned, the reference samples
changed their length far too much (0.74 mm/m for reference 6), even twice too much. The drying
shrinkage clearly improves by the incorporation of NTA: the total length change decreases from 0.74
to 0.65 and 0.53 mm/m by the incorporation of 20 and 60% NTA respectively. These values tend to
follow a linear trend. However, the values are still too large and above the defined limit.
Furthermore, both sample lost an equal amount of moist during the measurements, which is as well
similar to the amount lost by the reference sample. Consequently, the differences in total length
change are not caused by differences in the total amount of moisture loss.
The ASTM standard states that the relative length change between a moisture content of 30 and 6%
should be below 0.02%. It was already known that the reference samples do not meet this
requirement. Figure 50 indicates that both NTA samples also do not fulfil the requirement. On the
other hand, the value clearly decreases with increasing substitution level which is very beneficial.
One last remark, the mass of the plugs and wax is not known. This mass is not subtracted from the
masses observed during the measurements. Therefore, the moisture content is actually lower than it
is shown in Figure 50. Consequently, the curves should be shifted a bit to the left in theory which in
turn implies that the actual concerning relative length change is larger in reality. Nevertheless, both
evaluations clearly show that the drying shrinkages improved due to the addition of NTA.
General
The application of NTA in AAC is investigated as a pre-study before the study of GTA. The substitution
of quartz by NTA influences the properties of AAC. First of all, the big particles of the NTA (>2 mm) do
not influence the properties of AAC. Furthermore, the slump flow is increased with increasing NTA
contents, which in turn causes the formation of bigger pores and leads to increased rising heights.
The temperature development of the green body indicates that the NTA perhaps exhibits little
pozzolanic reactivity, although it was first accepted that the NTA did not possess it. Furthermore, the
NTA does not affect the setting and strength development of the green body.

90
The substitution of 20% quartz by NTA may be beneficial for the strength of AAC, while at 60% the
AAC still exhibits sufficient strength (A-value). Thus, 60% replacement of quartz powder by a material
simply dug up from the Earth without any processing steps still results in the same strength as
reference by means of the A-value. The raw density decreases gradually but slowly with increasing
NTA content. The specific density also decreases slightly with increasing NTA content. Therefore, the
porosity is not affected. Finally, the incorporation of NTA results in a slight decreasing thermal
conductivity. The differences in density and thermal conductivity are small (not more than 8%
relative to reference). Furthermore, the incorporation of NTA significantly improves the drying
shrinkage although the defined requirements are still not fulfilled.
Looking at the microscopy pictures in Figure 29 and Figure 30, it can be seen that binding between
the particles and the AAC matrix is very good and strong. Even when the samples were cut, or in
other words when a force is applied on the particle embedded in the matrix, the binding still survived
and maintained. This indicates that the natural tuff ash behaves actually quite well in the AAC matrix,
which is promising for the application of ground tuff ash in AAC.
5.3.2. Ground tuff ash
The tuff ash is studied in a more suitable form, i.e. the natural tuff ash ground to a fine powder. The
ground tuff ash is applied as substitution material for quartz powder (siliceous material). However,
there are still larger particles (sizes are couple of millimetres) found in the material. These particles
can still be damaging to the mixing rod and especially to the band saw or cutting wires. Problems
may sometimes be encountered while cutting these kind of samples.
The application of GTA with various substitution levels in AAC and its influence on the green body
properties and the final AAC properties were investigated, and the obtained results will be discussed
in the parts as follow. During the research, the production of samples with very high substitution
levels, even up to 100% (complete replacement of quartz by GTA), was successful. New GTA samples
with low substitution levels (10 and 20%) were produced with a new GTA batch in order to verify the
observed effects at low substitution levels.
Green body properties
The reference green body properties are the average of the green body properties of ref 5 and 6. The
end of the rising stage followed by the sinking effect takes place together with the stiffening phase
for all green bodies with GTA, which is a major requirement upon the success of the green body. All
the green body properties were evaluated and approved. Thus, the green bodies could all be
autoclaved, which was in every case successful.
Slump flow
The slump flow is perhaps slightly increased by the addition of GTA (negligible), but remains roughly
equal independent of the GTA content and below the upper limit of the accepted slump flow range
(28 cm), as can be seen from Table 16. The reference slump flow of 25.0 cm changes to 26.5, 26.5,
27.5, 26.0 and 26.0 cm for the 20%, 40%, 60%, 80% and 100% GTA sample respectively. Additionally,
the new 10% and 20% sample showed a slump flow of 27.0 and 26.0 cm respectively, thus as well in
the same range. Moreover, the differences between the samples are small and the error range of the
slump flow is relatively large. Therefore, the workability is hardly affected by the GTA. The outcome

91
of this study differs from the outcome of the pre-study regarding the influence of GTA on the slump
flow, because the results of the pre-study indicated that the slump flow increased with increasing
GTA content following approximately a linear trend. However, during the pre-study the maximum
studied replacement level was 40%.
Temperature development
As can be seen from Table 16, the maximum temperature increases with increasing GTA content,
indicating that the (ground) tuff ash exhibits some pozzolanic reactivity. Moreover, the tuff ash in its
ground form exhibits more pozzolanic reactivity compared to the tuff ash in its natural form, which is
already known from the literature study [2]. A material has more pozzolanic reactivity in a finer
divided form compared to a coarser form. The maximum temperature is raised from 79.0 °C as
reference to 79.4, 80.4, 80.8, 82.4 and 83.2°C by the addition of 20%, 40%, 60%, 80% and 100% GTA.
The maximum temperatures of the samples produced with the new GTA batch (10 and 20%) confirm
this observation. Not only the maximum temperature increases, but also the time moment when the
maximum temperature occurs is postponed, especially for the 100% GTA sample (roughly an hour).
For the 20, 40, 60 and 80 GTA sample, the maximum is only slightly delayed (roughly 20 to 30 min),
as well confirmed by the GTA 6 and 7 green bodies (new GTA batch). The temperature development
plot (Figure 36) shows how the maximum temperature gradually increases with increasing GTA
content, as well as how the maximum temperature is slightly shifted to the right, so later time
moments. It is immediately clear that the temperature plot of the 100% GTA sample is significantly
postponed to later time moments.
Rising development
The rising height is basically not affected by the incorporation of GTA, deriving from Table 16 as the
rising heights are approximately equal to the reference rising height. The reference rising height is
equal to 29.3 cm. The 20, 40 and 60% GTA sample exhibited a rising height of 30.1, 30.4 and 30.1 cm
respectively (slightly higher), but the 10% and 20% GTA sample (new batch) had a rising height of
29.2 and 29.0 cm respectively. On the other hand, the 80% and 100% GTA sample show a rising
height of 29.6 and 29.1 cm respectively, which is again roughly equal to reference. There are no
irregularities detected in the rising development plot (Figure 37) and the maximum is not delayed
nor accelerated. As can be seen, the plots of the rising developments are randomly distributed
among each other in the plot of Figure 37.
Setting development
The plot of the penetration depth in function of time (Figure 38) provides information regarding the
setting of the green body. The incorporation of GTA leads to an accelerated setting development,
and the effect becomes more significant for higher GTA contents. With increasing GTA contents, the
curve is more and more shifted towards the origin which indicates an accelerated setting of the
green body, probably due to the pozzolanic reactivity of the GTA. However, during the pre-study of
trass & tuff, the accelerated stiffening was not observed.
Green strength
The green strength values in Table 16 are compared to each other. The reference green strength is
385 units after 2.5 hours and 560 units after 3 hours. The 20% GTA sample has the same green

92
strength as reference after 2.5 hours, but after 3 hours its green strength is higher (690 units).
Remarkable is that the green strength of the 40% GTA samples has the highest green strength after
2.5 hours (470 units) and the lowest green strength after 3 hours (550 units), compared to the other
samples. The 60% GTA sample exhibits a green strength of 420 and 640 units after 2.5 and 3 hours
respectively, both values are higher than reference values but roughly the same as the values for the
20% GTA sample. Furthermore, the 80% GTA sample has a green strength similar to reference after
2.5 hours, but after 3 hours the green strength is significantly higher, over 700 units (maximum value
which can be measured is 700 units). Finally, the 100% GTA sample has a significant higher green
strength compared to the other samples, i.e. already 600 units after 2.5 hours and over 700 units
after 3 hours. Therefore, the green strength is measured again after 3 hours, but this time with the
standard concrete penetrometer (without cone). The measured strength is 50 psi or 0.34 MPa. In
conclusion, the green strength seems not to be affected by the substitution, except that the green
strength of the 80% and especially the 100% sample is significantly improved.
Final AAC properties
The final properties of the AAC samples produced with GTA will be discussed below. The reference
final AAC properties are the average of the reference 2, 4 and 6 sample.
Strength
The reference compressive strength is 3.14 MPa. Leaving out the reference value, the compressive
strength decreases gradually with increasing GTA content, which can be seen in Figure 51. The 20%
GTA sample has a higher strength than reference (also observed for 20% NTA), i.e. 3.61 MPa. From
this point, the strength decreases with increasing GTA content. The 40%, 60%, 80% and 100% GTA
sample exhibits a compressive strength of 3.31, 2.84, 2.67 and 2.60 MPa. Moreover, the strength
decrement for a GTA content between 60% and 100% is less significant than the strength decrement
for a GTA content between 20% and 60%. The 40% GTA sample still exhibits a compressive strength
slightly higher than the reference.
The main purpose of the GTA 6 and GTA 7 sample (10% and 20% respectively) was to verify that the
compressive strength for low substitution levels (20%) improves relative to reference. Indeed, the
compressive strength is 3.59 and 3.68 MPa respectively, which is higher than reference and in
correspondence with the GTA 1 20% sample.
Table 35: Change in A-value expressed in percentage in function of the GTA content.
GTA content [%] 10 20* 40 60 80 100
Strength change [%] +13.4 +16.6 +11.1 -4.2 -12.2 -16.2
* Average of the two 20% samples
However, the strength of AAC is strongly correlated with the density as can be seen in Figure 95,
even though the differences are relatively small. Therefore, the A-value must be used to assess the
strength. The A-value increases strongly for substitution levels 10% and 20% (both samples) up to a
value of roughly 1100, which is very beneficial for the performance of AAC. The A-value of the 40%
sample is lower than the previous GTA samples, but still higher than reference. Therefore,
substitution levels up to 40% are resulting in an enhanced performance of AAC. The A-value
decreases further for substitution levels 60, 80 and 100%, and from 60% on the A-value is already

93
lower than reference up to a value of 770. But the decrease in A-value (even for 100%) is not that big,
and AAC without quartz and only GTA still exhibits relatively good strength. The relationship between
the GTA content and the strength change can be expressed in percentages relative to the reference
strength, as shown in Table 35.
The incorporation of tuff ash clearly affects the strength. The CaO to SiO2 ratio or C/S ratio of the AAC
matrix is an important parameter and changes in this ratio are a major cause for the changes in
strength. The relationship between the C/S ratio and the A-value is plotted in Figure 52. The C/S ratio
of the system increases with increasing substitution level. The increased strength range corresponds
to a C/S ratio in between roughly 0.35 and 0.50. Higher C/S ratios result in lower strengths. The
optimum C/S ratio seems to be 0.40 in this case. Between substitution levels 0 and 20%, the strength
increases with increasing ratio, whereas the strength decreases with increasing ratio for higher
substitution levels (>20%). Furthermore, the improved strength is probably also partially attributed
to the pozzolanic reactivity of the tuff ash. More answers and explanations can be provided by micro-
structural analysis by means of XRD and SEM analysis.
Figure 95: Raw density versus compressive strength (ground tuff ash).
Density – porosity
The raw density first decreases gradually for GTA contents up to 60%, and then again increases
gradually up to a GTA content of 100%, for which the raw density for a GTA content of 100% is
approximately equal to the reference raw density. This can be seen in Figure 53, and the turning
point for the raw density is at a GTA content of 60% (lowest raw density). The raw density decreases
from 462 kg/m³ (reference) to 455, 451 and 449 kg/m³ for GTA contents of 20%, 40% and 60%
respectively. At this point, the raw density starts to increase again to 455 and 460 kg/m³ for GTA
contents of 80% and 100% respectively. However, the differences are really small (maximum 10
kg/m³ or 2.2%), as also can be seen in Figure 53 that the error ranges are close to each other. On the
other hand, the density values of the GTA samples produced with the new GTA batch (10 and 20%)
contradict the previous observed trend as they are higher than reference, opposite to the GTA 1
sample. Because the differences in density are that small, it can be said that the incorporation of GTA
has hardly an influence on the apparent density.

94
The specific density (Figure 53) is for every sample slightly lower than reference and shows roughly
the same trend as the raw density values (and similar as NTA). The value decreases from 2.54 g/cm³
(reference) to 2.48, 2.47, 2.43, 2.51 and 2.51 g/cm³ for GTA contents of 20, 40, 60, 80 and 100%
respectively. The specific density of the samples with the new GTA batch are also lower than
reference, 2.46 and 2.41 for 10 and 20% respectively. However, it must be remarked that the
differences are again small (maximum 5.5%), and the values derive from only one sample. Thus,
there is only an minor influence on the specific density. Possible reasons are already stated in the
NTA discussion.
Because the raw and specific density follow similar (decreasing) trends, the porosity remains equal
which is confirmed by Figure 54. The porosity values of all the GTA samples including the reference
are in between 81.5% and 82.0%. The porosity of the 20%, 40%, 60%, 80% and 100% GTA sample is
81.63, 81.79, 81.50, 81.88 and 81.69% respectively, compared to the reference porosity of 81.80%.
The porosity of the GTA 6 and 7 sample is somewhat lower compared to the other values (81.2 and
80.6% respectively) because of its slight higher raw density and slight lower specific density, but still
close to reference. Thus, the incorporation of ground tuff ash in AAC does not influence the porosity
of the material.
Thermal conductivity
The application of GTA leads to a lower thermal conductivity compared to reference in general as can
be seen in Figure 55. The thermal conductivity decreases for increasing GTA contents up to 40%, but
for higher GTA contents (>40%) the thermal conductivity remains equal. The value decreases from
0.0854 W/m∙K (reference) to 0.0828 and 0.0801 W/m∙K for a GTA content of 20% and 40%
respectively. The values of the GTA 6 and GTA 7 sample confirm this trend. For GTA contents in
between 40% and 100%, the thermal conductivity remains the same (0.0800 W/m∙K). The thermal
conductivity is equal to 0.0799, 0.0797 and 0.0802 W/m∙K for GTA contents of 60%, 80% and 100%
respectively. However the decrement in thermal conductivity (gain in thermal insulating
performance) is rather small, i.e. maximum 6.7%, but still beneficial for the performance of AAC.
Furthermore, the incorporation of GTA seems to result in a slightly decreasing volumetric heat
capacity as the value decreases slowly with increasing GTA content. As final remark, no clear
correlation with the density or porosity could be observed, probably because the differences in
values are too small.
Drying shrinkage
The total length change of the tuff ash prisms is calculated and the relative length change between a
moisture content of 6 and 30% is analysed. First, the total length change is evaluated by means of the
RILEM recommendations. The measured value should be below 0.35 mm/m. As already described in
Chapter 5.1., the reference value is twice to too high. The values of the GTA samples show a
parabolic development (aimed downwards) with substitution level 60% as focus (Figure 56). For
substitution levels up to 60%, the total length change decreases from 0.74 mm/m as reference to
0.64, 0.62 and 0.59 mm/m for substitution levels 20, 40 and 60% respectively. These values are still
far too high according to RILEM, but the drying shrinkage improves relative to reference due to the
replacement of quartz by GTA (up to 60%). Level 60% is the turning point after which the total length
change increases again for higher replacement levels. The value increases towards 0.63 and 0.72
mm/m for 80% and 100% GTA respectively. The value at 100% is again roughly equal to the reference

95
value. Furthermore, the two GTA samples produced with the new GTA batch (10 and 20%) exhibited
an extreme high total length change (1.02 and 1.04 mm/m). However, the used GTA differs from the
previously used GTA (GTA 1 to 5 sample), as it is likely mined from a different place and has a
different particle size distribution. Both GTA batches are not the same material. Consequently, this
observation is not representative and is neglected. Furthermore, all GTA samples lost a similar
amount of moisture during the measurements as the reference sample. As a result, this parameter is
not responsible for the differences in length change.
Next, the relative length change between moisture contents 6 and 30% of the GTA samples is
analysed (Figure 57). ASTM recommends that this value should not exceed 0.02%. The reference 6
sample does not meet this limit as already described. Figure 57 indicates that the concerning relative
length change decreases with increasing substitution levels up to 60% as the curves shift more and
more to the right relative to reference and the slope becomes smaller and smaller. Thus, an
improved drying shrinkage is observed. However, the observed values are definitely still higher than
the defined limit. On the contrary, the relative length change between 6% and 30% becomes again
higher and higher for substitution levels 80 and 100%. The curve of the GTA 4 and GTA 5 sample is
shifted to the left relative to the other GTA curves towards the reference curve, indicating an
increased length change value. This same trend is observed for the total length change, both are in
accordance to each other.
It should be reported that the mass of the plugs and wax of the GTA samples is not known.
Consequently, this mass is not subtracted from the masses observed during the measurements. The
moisture content is thus lower than it actually is. The curves in Figure 57 should be shifted a little bit
to the left in theory, which implies that the actual relative length change between 6 and 30% is larger
in reality compared to the current observation.
In conclusion, the incorporation of GTA can improve the drying shrinkage of AAC indicated by both
analyses. The reason behind the observed effects can only be found through micro-structural
analysis. For example, C-S-H gel swells and shrinks more compared to tobermorite crystals.
General
The substitution of quartz by ground tuff ash in AAC can be considered as successful, even the
complete replacement of quartz could be successfully realised, although of course the properties of
AAC are influenced. The slump flow is slightly increased, but remains approximately equal
independent of the GTA content (negligible). The GTA exhibits pozzolanic reactivity, indicated by a
gradual increasing maximum temperature with increasing GTA content. Moreover, the tuff ash in its
ground form exhibits more pozzolanic reactivity compared to the tuff ash in its natural form. The
rising height is slightly increased, but only for GTA content up to 60%, for higher GTA contents the
rising height is about equal to reference (again negligible). The incorporation of GTA results in an
accelerated setting development of the green body, as well as in an increased green strength which
becomes more significant at later times and higher GTA contents.
The compressive strength increases by the addition of 10 and 20% GTA compared to reference, but
decreases for higher GTA contents compared to the strength at a GTA content of 20% (from 3.61 to
2.60 MPa for 100% GTA). However, the A-value provides more reliable information regarding
strength. The A-values of the 10, 20 and 40% are higher than reference, which means an enhanced
performance. On the other hand, higher substitution levels results in a decreased strength, but still a

96
relatively good strength even for the complete replacement. The raises and drops in strength
compared to reference are collected in Table 35. The raw density is hardly influenced, all values are
around 450 kg/m³. In addition, there is also little influence on the specific density (approximately
2.50 g/cm³). Moreover, the application of GTA does as well not influence the porosity of the material.
Finally, the thermal conductivity decreases with increasing GTA content up to 40%, but then remains
equal for GTA contents up to 100% (around 0.0800 W/m∙K). However, the differences in thermal
conductivity are rather small, but still the AAC performance is improved. Finally, the drying shrinkage
of AAC improved for replacement levels up to 60%, but the defined requirements are still not
fulfilled.
Finally, one can look for correlations between the different final properties. The following figures
(Figure 96 and Figure 97) show different final properties plotted against other final properties. The
thermal conductivity and porosity are not affected by the incorporation of tuff ash, resulting roughly
in a point plot as can be seen in Figure 96 on the right. On the other hand, the strength is definitely
influenced by the tuff ash, which can be seen on the left side of Figure 96. As known, the strength
decreases with increasing substitution level. The upper points correspond to low replacement levels,
while the lower points correspond to high replacement levels. Finally, because the thermal
conductivity is not influenced whereas the strength is by the tuff ash, the plot between both
properties is again roughly a vertical line (Figure 97). The observed differences are easily explainable,
because they are only caused by the tuff ash, as there is no other variable parameter.
Figure 96: Plot of the A-value (left) and thermal conductivity (right) against the porosity.
Figure 97: Plot of the A-value against the thermal conductivity.

97
5.3.3. Trass substituting Portland cement
Trass is already extensively used in the cement and concrete industry where it is blended with
Portland cement to get trass-cement. Therefore, the trass is mined in great amounts. During this
research, the partial replacement of Portland cement by trass is experimentally studied. The major
role of Portland cement in the AAC design is to provide sufficient green strength during the rising and
setting stage and the autoclaving so that the green body does not collapse. Although the material is
commonly used in the cement and concrete industry, there are still some larger particles (maximum
size of a couple of millimetres) found in the material batch, which may form a risk towards the mixer
and cutting device.
The application of trass as partial replacement of cement with various replacement levels in AAC is
investigated. The obtained results will be discussed in the parts below. It must already be noticed
that the production of AAC samples where 75% cement is substituted by trass was successful, i.e. the
green body did not fail and the final samples were successful.
Green body properties
The average of the green body properties of reference 5 and 6 are the reference green body
properties stated in this part. Furthermore, the end of the rising development followed by the
sinking effect takes place together with the setting phase for all green bodies when analysing Figure
41 together with Figure 42. This is an important fact because this indicates that the trass together
with Portland cement provides sufficient green strength upon success or survival of the green body.
This will be seen in more detail in discussions below. Nevertheless, all green body properties were
assessed and approved before the samples were autoclaved.
Slump flow
The partial replacement of cement by trass results in a slight reduced slump flow, and the reduction
becomes more significant as the trass content increases. The reference slump flow is 25.0 cm, and
the value decreases to 24.0, 24.5, 23.5, 23.0 and 22.5 cm as the trass content increases to 25%, 40%,
50%, 60% and 75% respectively. The accepted lower limit for the slump flow is 23.0 cm, and the
slump of the 75% trass sample is just below this limit. However, it must be remarked that the error
range of the slump flow is not known for the sample and the limits are purely an indication.
Therefore, the value is still accepted and the water content of the mix design is not adjusted.
Furthermore, the observations during the production are in line with the findings of the pre-study.
The pre-study of trass & tuff also indicated that the slump flow decreases slowly when more and
more cement is substituted by trass.
Temperature development
The maximum temperature decreases quite strongly with increasing trass content, as can be seen
from Figure 40 and Table 17. The maximum temperature decreases gradually from 79.0 °C
(reference) to 76.5, 74.0, 72.9, 71.4 and 69.7°C for increasing trass contents of 25%, 40%, 50%, 60%
and 75%. Figure 40 indeed shows that with increasing trass contents, the maximum of the
temperature curves is shifted downwards. This indicates that ‘less reaction’ takes place within the
green body. Moreover, the hydration reaction of Portland cement is stronger than the pozzolanic
reactivity of the trass. Therefore, the reactions in the TrC green bodies are less intensive which

98
results in reduced strength. Furthermore, the maximum temperature occurs at earlier times
especially for the 75% trass sample (roughly an hour), which is also visible by the slight shift of the
maximum of the temperature development curves to the left in Figure 40.
Rising development
The rising height is not influenced by the partial substitution of cement by trass. The reference rising
height is 29.3 cm, and the rising height of the 25%, 40%, 50%, 60% and 75% trass sample is 29.5,
29.4, 29.4, 29.4 and 29.6 cm. The values are all very close to the reference value and it can be
concluded that the trass replacing cement does not influence the rising height at all. Moreover, no
irregularities are observed in the rising height plot (Figure 41) and all the TrC curves follow the same
trend as the reference curves from every aspect, except for the first sample. This green body shows a
lower maximum rising height in Figure 41, but this is merely an coincidence (for example due to a
problem with the measurement device).
Setting development
The substitution of cement by trass does hardly affect the setting development of the green body.
Figure 42 shows that all the penetration depth curves are close to the reference curves, although it
was expected that the setting would be somewhat delayed. When taking a closer look at the TrC
samples mutually, it seems that the increasing incorporation of trass leads to a slight delayed setting
of the green body, but the differences are really small and negligible. These findings deviate from the
observations made during the pre-study, where it was concluded that the substitution of cement for
higher levels (especially at a level of 50%) induced a significant delayed setting of the green body.
Some conditions and parameters during both studies differ, which is likely to be the cause of the
difference between them. Nevertheless, the outcome of this measurement is very positive.
Green strength
The values are displayed in Table 18 and Figure 39. For this investigation, the green strength was also
determined a third time, after 3.5 hours. The green strength is more and more reduced when more
and more cement is replaced by trass. Thus, Portland cement provides more green strength
compared to trass, which could be expected. Unfortunately, the green strength of the TrC1 sample
(25%) could only be measured after two hours due to lack of time, and the value was 220 units. The
green strength after 2.5 hours decreases from 385 units (reference) to 320, 300, 240 and 200 units
for trass contents of 40%, 50%, 60% and 75% respectively. The 3 hours green strength decreases
from 560 units to 470, 400, 440 and 350 units with increasing trass contents from 40%, 50%, 60% to
75%. Finally, the 40%, 50%, 60% and 75% TrC samples exhibit a 3.5 hours green strength of 540, 620,
570 and 440 units. The green dotted line indicates the expected trend starting from the reference as
the reference green strength at 3.5 hours is not known.
HESS AAC Systems B.V. defines a green body ready to be autoclaved when the green strength
reaches 400 units. After 2.5 hours, none of the samples including the reference samples can be
autoclaved. After 3 hours, all the samples, except the 75% TrC sample can be autoclaved and after
3.5 every sample is ready to be autoclaved which is still acceptable. So, the partial replacement of
cement by trass results in a reduced green strength, which becomes more significant at higher
substitution levels. The strength reductions range from 16% to 48% relative to the reference green

99
strength. However, these reduction are still acceptable, which means that the results are still good
and high substitution levels can be maintained.
Final AAC properties
The reference final AAC properties are the average of the reference 2, 4 and 6. The final properties of
the AAC samples produced with trass replacing cement will be discussed below.
Strength
The relationship between the compressive strength and the trass content is shown in Figure 58. The
reference compressive strength is 3.14 MPa. The strength increases by the replacement of 25, 40 and
50% cement by trass to 3.50, 3.40 and 3.39 MPa. This may be attributed to the additional pozzolanic
reaction of the trass. For 60%, the strength (3.16 MPa) is roughly the same as reference, while the
strength (2.79 MPa) is a bit lower as reference at 75%. All these compressive strength results can be
approved. However, the strength is evaluated by means of the A-value in the end, because the
compressive strength of AAC depends strongly on the raw density as can be seen in Figure 98: the
raw density and compressive strength values follow the same decreasing trend.
Figure 98: Raw density versus compressive strength (trass replacing cement).
The A-value follows the same trend as the compressive strength, as can be seen in Figure 58. The 25,
40 and 50% samples exhibit a higher A-value compared to reference and all three values are almost
equal to each other. The reference A-value of 918 improves to 1062, 1041 and 1030 due to the
incorporation of 25, 40 and 50% trass respectively. The 60% sample shows a slight higher value (970)
in the some order of magnitude as reference, as well as the 75% sample (slight lower value, 864).
Thus, substitution levels up to 50% are beneficial for the performance, while substitution levels up to
75% hardly pose a negative effect on the strength.
The replacement of cement by trass which only makes up a limited amount in the total mix design
(20%) compared to the quartz content (66.67%), affects the strength of AAC but not to a great
extent. The A-value is related to the CaO to SiO2 ratio or C/S ratio of the AAC matrix, plotted in Figure
59. In this case, opposite to the GTA samples, the C/S ratio of the matrix decreases (linearly) with
increasing substitution level. Moreover, the increased strength corresponds to a decreased C/S ratio,
contrary to as observed during the study of GTA. The increased strength corresponds to a C/S ratio in

100
between 0.25 and 0.31. Lower ratios up to 0.20 correspond to similar a strength as reference. The A-
value shows a similar decreasing trend as the C/S ratio with increasing substitution level (except
reference). Exact causes and explanations can be provided through micro-structural analysis by
means of XRD and SEM analysis.
Density – porosity
From Figure 60 it can be seen that the raw density is hardly affected by the incorporation of trass,
apart from a slight decreasing trend which is neglected as the values are all within the error range.
The values are 462, 454, 452, 454, 451 and 449 kg/m³ for reference, 25, 40, 50, 60 and 75% trass
respectively. Thus, the replacement of cement by trass does hardly/not influence the raw density.
The partial substitution of cement by trass appears to lead to a slight increased specific density, but
the increments are very small and are within the error range of the reference (Figure 60). This is
neglected and therefore, there is no effect on the specific density. The specific density changes from
2.540 g/cm³ (reference) to 2.555, 2.572, 2.560, 2.567 and 2.563 g/cm³ for trass contents of 25%,
40%, 50%, 60% and 75% respectively. The density of trass is significantly lower than the density of
cement.
The porosity values show the same trend as the specific density values and the same but opposite
trend as the raw density values. As the raw density is slightly lower and the specific density slightly
higher, the porosity is indeed slightly higher. The values seem to be slightly increased, but again the
changes are really small and within the error range. Therefore, the differences are neglected and it is
concluded that there is no influence on the porosity. The porosity is slightly increased by the addition
of trass, i.e. from 81.80% to 82.25, 82.43, 82.29, 82.43 and 82.48% for increasing substitution levels
(Figure 61).
Thermal conductivity
The thermal conductivity is also closely related to the raw density, same as the compressive strength.
This clearly can be seen in Figure 99, as both properties show exactly the same decreasing trend.
Thus, the thermal conductivity slightly decreases with increasing trass content, as can be seen in
Figure 62. The reference sample exhibits a thermal conductivity of 0.085 W/m∙K, while the 25, 40, 50,
60 and 75% TrC samples exhibit a value of 0.082, 0.083, 0.083, 0.082 and 0.081 W/m∙K respectively.
Thus, all the values are lower than the reference value and the maximum decrement is 5.5% relative
to reference. Except for the 25% sample, the thermal conductivity values follow approximately a
linear trend, i.e. a gradual decreasing thermal conductivity with increasing trass content. This is of
course beneficial for the AAC performance. It seems that the partial replacement of cement by trass
has little influence on the volumetric heat capacity, as all the values are close to each other but
generally the values are slightly reduced compared to reference (0.34-0.36 MJ/m³∙K compared to
0.37 MJ/m³∙K).

101
Drying shrinkage
The drying shrinkage is again assessed in two different ways: the total length change is evaluated
according to the RILEM recommendations and the relative length change according to the ASTM
standard. As first, the total length change is calculated and plotted against the substitution level in
Figure 63. The total length change decreases with increasing substitution level, which means that the
trass as replacement of cement has an improving effect on the drying shrinkage of AAC. The value
decreases from 0.74 mm/m for reference 6 to 0.62, 0.61, 0.58, 0.56 and 0.52 mm/m for a
replacement level of 25, 40, 50, 60 and 75%. These values (except the value at 25%) appear to follow
a linear trend. However, the trass samples do not meet the requirement of RILEM as the defined
maximum value is 0.35 mm/m. Nevertheless, the drying shrinkage significantly improves relative to
reference: at level 75%, the shrinkage is reduced with 30%. The total amount of moist loss of all trass
samples during the measurement is very similar to each other and to the amount of the reference
sample. Thus, this parameter is not a possible cause for the differences in length change.
The relative length change and moisture content is computed for every measurement and both
parameters are plotted against each other in Figure 64. It is clear that none of the samples fulfil the
requirement that the relative length change between a moisture content of 6 and 30% should be
below 0.02%. Although an improving drying shrinkage with increasing substitution level is observed
during the evaluation of the total length change, the same is not observed during the evaluation of
the relative length change. The drying shrinkage of all samples indeed improves relative to the
reference, but no differences (improvements) can be observed when comparing the samples
mutually. Same as the NTA and GTA samples, the prisms increased in length somewhere between
roughly a moisture content of 10 and 20%. It is observed that this length increment increases with
increasing substitution level from reference to 75%, i.e. the curves shift downwards with increasing
substitution level. It is impossible to say why both observations differ from each other. Nevertheless,
the relative length change between 30 and 6% decreases relative to references for the trass samples.
Same as the NTA and GTA, the mass of the wax and plugs is not known and is not taken into account
in the moisture content values. Consequently, the shown moisture content values in Figure 64 are
actually too high. The plotted curves should all be shifted slightly towards the left in reality which
induces that the actual relative length change between 6 and 30% is even larger compared in reality
to the current observation. One last but important remark has to be mentioned. Why the drying
Figure 99: Thermal conductivity versus raw density (trass replacing cement).

102
shrinkage improves due to the replacement of cement by trass can only be explained through micro-
structural analysis.
General
Green bodies for which 75% Portland cement was replaced by trass did not collapse due to sufficient
stiffening and green strength, and could be successfully autoclaved. Portland cement is characterised
by a significant environmental impact and high CO2 emissions. By partially replacing the material by
trass, a natural material which can be easily extracted from the Earth and needs only to be milled,
the environmental impact of the final AAC product can be reduced. In addition, the performance of
AAC can be improved for substitution levels up to 50%, while AAC with 75% trass still exhibits similar
properties as the reference samples. Even higher substitution levels could possibly be aimed.
The slump flow decreases gradually and slowly when more and more cement is replaced by trass,
which was also observed during the preliminary study. The maximum temperature in the green body
decreases with increasing trass contents and occurs at earlier times, indicating that less reaction
takes place in the green bodies which results in a reduced green strength. The green strength
decreases with increasing trass content and the absolute maximum reduction in strength is roughly
50% for 75% replacement of cement by trass. However, the reductions in strength are still acceptable
taking the very high substitution level into account. Furthermore, the partial replacement of cement
by trass does not influence the rising height and hardly affects the setting development of the green
body.
Regarding the final strength, substitution levels up to 50% result in an enhanced strength, while
substitution levels up to 75% result in similar strengths as reference. The incorporation of trass does
not affect both the raw and specific density, as well no influence on the porosity is observed. In
general, the thermal conductivity slightly decreases with increasing trass content (maximum
decrease of 5.5% for 75% trass incorporation) which is again beneficial for the performance. Finally,
the drying shrinkage significantly improves with increasing substitution level which is a very positive
outcome.
As last, the correlations between the different final properties are investigated. Figure 100 shows the
correlation of the strength and thermal conductivity with the porosity, while Figure 101 presents the
correlation between the strength and thermal conductivity. The correlations between the properties
are very like the correlations between the properties for tuff ash. By replacing cement by trass, only
the strength is affected to a bigger extent as already observed, which is also observed through the
plots below. The porosity is not affected, while the strength decreases slowly with increasing trass
content, resulting in a vertical line in the plot of both properties (Figure 100, left). So the porosity is
not affected while the strength is, which indicates that the something has changed within the matrix
due to the incorporation of trass. Furthermore, the thermal conductivity is as well not influenced,
clearly visible in Figure 100 on the right because it is a point plot. Finally, it seems that the thermal
conductivity slightly increases with increasing A-value, although the differences in thermal
conductivity are very small. Therefore, this trend can be neglected as the differences are too small.
Because the replacement level is the only variable parameter in this study, it is the only parameter
responsible for the observed differences.

103
Figure 100: Correlation between the A-value (left) and the thermal conductivity (right) with the porosity.
Figure 101: Correlation of the A-value with the thermal conductivity.
5.3.4. Trass substituting quartz
Trass can also be applied as replacement material for quartz, as siliceous source material. There is
only one AAC sample produced where quartz is partially substituted by trass (20%), because the
replacement of quartz by tuff ash and the replacement of cement by trass were successful and these
were the most critical raw material replacements to study. Therefore, this study was not elaborated
any further. Nevertheless, the influence of replacing 20% quartz by trass on the green body and final
AAC properties is identified, and will be discussed in the next two parts below.
Green body properties
The green body properties are presented in Table 19.
The slump flow is not affected by the addition of 20% trass replacing quartz, as the slump
flow is equal to the reference slump flow (25.0 cm), which fits perfectly with the preliminary
study.
The green body exhibited a higher maximum temperature compared to reference (79.8 °C
and 79.0 °C), probably due to the pozzolanic reactivity of the trass. The maximum
temperature occurs within the same time range as the reference samples, as can be seen in
Figure 43.

104
The rising height is higher compared to the reference rising height, i.e. 30.2 cm compared to
29.3 cm. No irregularities are observed in the rising development plot (Figure 44). The ending
of the rising and the following settling nicely takes place together with the stiffening.
The setting development is strongly accelerated by the incorporation of 20% trass, as can be
seen in Figure 45. The curve of is shifted towards the origin, indicating a faster setting, which
started earlier and ended earlier compared to reference. This observation was also found
during the preliminary study of trass & tuff ash.
The green strength after 2.5 hours (540 units) is significantly larger compared to the
reference green strength (385 units). Unfortunately, the green strength could not be
measured after 3 hours due to lack of time on that day, but probably would also be a lot
higher than reference.
Final AAC properties
The final properties of the trass replacing quartz sample are listed in Table 23.
The addition of 20% trass substituting partially quartz leads to a significant increment in
compressive strength, as the value increases from 3.14 MPa (reference) to 3.73 MPa, or
expressed in percentage, an increment of 16.9% relative to reference. The A-value also
greatly improves, from 918 as reference to 1112 (improvement of 21%). The strength
probably will increase further with increasing replacement level.
The raw density is not influenced by the addition of 20% quartz, as the value is 458 kg/m³
compared to 462 kg/m³ as reference. The specific density is also not influenced as both value
are almost the same (2.54 and 2.53 g/cm³). Consequently, the porosity of the 20% trass
sample (81.87%) is also as good as equal to the reference porosity of 81.80%.
The incorporation of 20% trass as replacement of quartz leads to a small decrement in
thermal conductivity from 0.0854 W/m∙K (reference) to 0.0832 W/m∙K or 2.6% (beneficial).
The drying shrinkage also significantly improves relative to reference. The total length
change decreases from 0.74 (reference) to 0.59 mm/m (20% trass). The total loss of moist is
similar to reference. However, both the limits of the ASTM and RILEM standard are not
fulfilled.
The substitution of 20% quartz by trass is beneficial for the final properties of AAC, as the strength
and drying shrinkage relatively strongly improve (high A-value). The density and porosity are not
affected and the thermal conductivity is slightly reduced (also beneficial). The preliminary study also
concluded that this is a promising raw material replacement.

105
5.4. Preliminary study basalt in AAC
Firsts insights regarding the application possibilities are obtained through a preliminary study where
the influence of basalt on the slump flow or workability and the setting development is identified.
Basalt powder is applied as substitution material for quartz powder and will serve as an inert filler in
the AAC matrix. Basalt is formed by the rapid cooling down of ejected basaltic lava which
consolidates into a volcanic rock material. This rock material is then milled to a fine powder. The
material was characterised by a series of experiments beforehand, see Chapter 2.1.1. The main
objective of this pre-study is to get an idea of the influence of basalt on the workability of AAC
mixtures. This information will be needed during the actual study of the application of basalt in order
to know if the water content must be adjusted and if so, to what extent.
5.4.1. Influence on slump flow
The slump flow of the reference mixture was determined 3 times in order to get an idea of the
spread of the measured values. The newly determined values deviated from the reference slump
flows measured during the pre-study of trass and tuff ash. Therefore, the reference SF was again
measured multiple times. The measured values are 25.7, 25.4 and 25.6 cm providing an average
value of 25.5 cm. As can be derived from these values, the absolute spread is approximately 0.4 cm
and the calculated standard deviation is 0.18 cm. It should be remarked that this average slump flow
of 25.5 cm is the same value as the average slump flow of all the actual reference samples (Table 8).
The incorporation of basalt affects the slump flow, as can be seen in Figure 65. The slump flow
increases with increasing substitution level and seems to follow a linear trend. The value increases
from 25.5 cm to 27.0, 29.4, 33.0 and 37.0 cm for 10, 20, 40 and 60% respectively. This means that the
basalt has a lower water demand compared to quartz powder. Figure 3 shows that the basalt is
slightly coarser than the quartz powder. Coarser particles have a lower water demand compared to
finer particles. Consequently, the slump flow increases with increasing basalt content. However, the
SF of the basalt mixtures were only determined once, so the error range of each value is not known.
The increment in workability due to the addition of basalt is quite significant. Moreover, the 20%
mixture already exceeds the upper limit of 28 cm. Therefore, applying substitution levels above 20%
requires an adjustment of the water content of the mix design. The newly selected W/S ratio is
0.550, and the SF of the 20, 40 and 60% mixture is determined once again. The measured values are
22.1, 25.5 and 30.7 cm respectively. These three values follow as well a linear trend. Comparing the
new values (W/S 0.550) with the old values (W/S 0.625), it can be observed that every value
decreases with approximately 7 cm. Moreover, Figure 65 shows that the red curve (W/S 0.550) is
parallel to the blue curve (reference W/S), which indicates the linear behaviour. This information will
be useful during the production of the AAC samples with basalt.
5.4.2. Influence on setting
The initial setting time or IST of the reference mixture was determined once, and the value (390
minutes) corresponded well to the previously measured times (five values) during the pre-study of
trass and tuff ash. Therefore, the reference IST is taken as the average of the six measured values,
being 375 minutes with a standard deviation of 12 minutes. The absolute spread is roughly 35
minutes.

106
All the other time values of the basalt mixtures are the result of only one measurement. By
incorporating basalt, the initial setting time appears to be delayed. The IST is postponed to 405, 420
and 450 minutes due to the incorporation of 10, 20 and 40% basalt respectively. Thus, basalt delays
the setting development of the green body. Moreover, with each 10% increase in substitution level,
the IST is delayed with 15 minutes. However, it should be remarked that this measurement is not
that accurate and reproducible. During the actual study of the behaviour of basalt in AAC, it will turn
out if basalt indeed really delays the setting development of the green body or not.

107
5.5. Application of basalt in AAC
The behaviour of basalt in AAC is studied. Various substitution levels are applied and the green body
properties and the final AAC properties are determined. The obtained results will be discussed in the
chapters below. The investigated green body properties are the slump flow, the temperature
development, the rising development, the setting development and the green strength. The
investigated final AAC properties are the compressive strength, A-value, the apparent and specific
density, the porosity, the thermal conductivity and the drying shrinkage.
First of all, basalt is dark coloured material and affects the white appearance of AAC, i.e. the colour
turns more and more greyish as can be seen in Figure 67. Seven samples in total were produced with
substitution levels 10, 20, 40 (from here on reduced W/S ratio), 40, 60, 80 and 97.5% (Table 26). The
first three samples (10, 20 and 40%) have a similar W/S ratio (0.600 versus 0.625), so they can be
compared mutually. The complete replacement was aimed with the last sample, but due to the
limited amount of basalt left, only half a sample (half of total amount of solids) with substitution level
97.5% could be produced. The first thing that can be noticed is that AAC samples with very high
substitution levels could be successfully produced.
5.5.1. Green body properties
The reference green body properties stated in this discussion are the average values mentioned in
Table 8, so the average of the reference 5, 6, 7 and 8 sample. First the question if the end of the
rising development followed by the sinking effect takes place in the same time range as the setting
development should be answered. Figure 69 and Figure 70 indicate that this requirement is fulfilled
for all basalt samples. Both the rising and setting development of the basalt 1, 2 and 3 sample are
similar to that of the reference. The time range of both are matching each other. The total rising
development of the basalt 4, 5 and 6 sample are deviating from reference, but the setting
development of those samples is accelerated so that their time range as well roughly correspond to
each other. The accelerated setting and changed rising development is due to the reduced water
content. Thus, all green bodies were successful (all properties checked) and they all survived the
autoclaving process.
Slump flow
During the preliminary study, it was already observed that the basalt significantly affects the
workability and slump flow of AAC. As well in the actual study, the slump flow increases with
increasing substitution level (Table 27). The value raises from 25.5 cm as reference to 31.0 cm at a
substitution level of 40% (already slight lowered W/S ratio). The 10 and 20% sample did not require
an modification of the W/S ratio, whereas the 40% sample did as its SF is above the upper limit of 28
cm. In order to select an appropriate reduced W/S ratio, the information obtained through the pre-
study is taken into account. Based on those results, the new W/S ratio is chosen as 0.550 for the 40%
sample, and the resulting new SF is 25.5 cm which is the same as reference. Now for higher
substitution levels, the water content needs to be more and more reduced (known from pre-study).
Consequently, the W/S ratio of the 60, 80 and 97.5% sample is than 0.500, 0.475 and 0.450
respectively. The fresh mixtures exhibited a SF of 23.5, 23.5 and 27.0 cm, so all within the defined
limits. So the observed results are in accordance with the results of the pre-study. The influence of
these reduced water contents on the other properties will become clear in the discussions to follow.

108
Finally, the reduced W/S ratio means a reduced water amount which is beneficial (less water
required).
Temperature development
The temperature developments are shown in Figure 68. It can be seen that the temperature
developments of the 10, 20 and 40% basalt samples (all similar W/S ratio) are very similar to the
reference temperature development. The maximum temperature and the corresponding time range
are as well very like the reference, see Table 27. However, the 40% basalt sample with reduced water
amount suddenly shows an elevated temperature development. The maximum temperature
increases from 79.3°C to 82.2°C, as well the time range shifts towards earlier times. This is attributed
to the reduced water amount, not to the incorporation of basalt. Furthermore, the 60 and 80% basalt
green body exhibited even higher maximum temperatures, respectively 83.4 and 84.6°C. The W/S
ratio of the 60% sample is lower than that of the 40% sample, and that of the 80% sample is even
more lower which explains the gradual increasing maximum temperature. The maximum
temperature also occurs at earlier times with reducing water content (and thus increasing basalt
content). This can be easily observed from Figure 68. Unfortunately, the temperature development
of the basalt 7 sample could not be recorded, because the thermocouple could not be inserted into
the green body (half sample).
Rising development
The rising developments are plotted in Figure 69. The rising developments of the first three basalt
samples (10, 20 and 40% with similar W/S ratio) are almost equal to that of the reference, which is
also reflected in the maximum rising height. The reference maximum rising height is 29.4 cm, while
the maximum rising height of the 10, 20 and 40% sample is 30.2, 30.8 and 30.6 cm. These values are
a little bit higher than reference due to the higher slump flow of the samples (reduced viscosity). The
basalt 4 until 7 samples show deviating rising developments due to their lower water contents, as
well as lower maximum rising heights. With decreasing W/S ratio (and increasing basalt content), the
maximum rising height decreases, the maximum rising height is reached later and the sinking effects
occur sooner. The maximum rising height decreases from 29.4 cm as reference to 27.8, 27.2 and 26.9
cm for the 40, 60 and 80% basalt sample with decreasing W/S ratio respectively. The decrease in
maximum rising can also be observed in Figure 69. The rising development plot also shows that the
maximum height is reached later and later with decreasing W/S ratio. The plateau of the maximum
rising height (characterising for the rising development) even disappears completely for the basalt 5
and 6 green body, so that the sinking effect occurs immediately once the maximum rising height is
reached. This is attributed to both the delayed reaching of the maximum height and the accelerated
occurring of the sinking effect. These changes in rising development are only caused by the reduced
water content, not by the incorporation of basalt.
Setting development
Figure 70 immediately indicates that the basalt 1, 2 and 3 sample have similar setting developments
as reference. In other words, basalt does not affect the setting development of the green body. This
contradicts the findings of the preliminary study, perhaps due to inaccurate measurements during
the pre-study but probably due to different conditions during both measurements (most likely the
temperature differences). However when the water content of the 40% sample is reduced, the

109
setting significantly accelerates as the curve of the basalt 4 sample shifts towards the origin relative
to the curve of the basalt 3 sample. When the water content is lowered further and further (and the
basalt content increases to 60 and 80%), the setting accelerates more and more (20 minutes). The
setting development of the basalt 7 sample (lowest W/S ratio) is approximately equal to that of the
basalt 4 sample, thus delayed relative to the basalt 5 and 6 sample where it was expected to
accelerate even further instead. This is likely caused by the basalt somehow. In conclusion, reducing
the water content results in accelerating setting developments, while the incorporation of basalt
does not affect the setting development.
Green strength
The green strength values are listed in Table 27. It seems that the basalt incorporation leads to a
slight decreasing green strength. The reference green strength is 420 after 2.5 hours and 610 after 3
hours. The 10, 20 and 40% green body exhibited a strength of respectively 400, 320 and 330 after 2.5
hours and 520, 440 and 450 after 3 hours respectively. These values are all lower than the reference
values, although the spread on the strength value can be quite large looking at the different
reference values in Table 8. However, this observation means that the basalt has a (slight) negative
effect on the green strength. Unfortunately, the 2.5 hours green strength of the basalt 4 sample
(40%) was not measured. Reducing the water content of the 40% sample resulted in a significant
increase in green strength, from 450 to 660 after 3 hours (basalt 3 and 4 sample). The basalt 5
sample (60%, lower W/S) exhibits even higher green strength, i.e. 500 and at least 700 after 2.5 and 3
hours respectively. The maximum value which can be measured is 700. Therefore, the 3 hours green
strength is measured again but now with the concrete penetrometer itself (without the cone at the
top). The measured value is 60 psi or 0.41 MPa. Thus, reducing the water content results in an
increasing strength. However, the basalt 6 sample shows the same strength after 2.5 hours relative
to the basalt 5 sample, but a lower strength after 3 hours. This is probably caused by the basalt which
has a negative influence on the strength as already mentioned. The negative influence of basalt on
the strength overtakes the positive influence of reducing the water content. This becomes even more
clear when looking at the basalt 7 sample: again same strength after 2.5 hours but lower strength
after 3 hours.
5.5.2. Final properties
The reference final AAC properties are listed in Table 9. The final properties of the AAC samples
produced with basalt (Table 28) will be discussed below.
Strength
The reference compressive strength is 3.18 MPa. The compressive strength of the 10 and 20%
sample is approximately equal to this value, i.e. 3.07 and 3.28 MPa respectively. So low amounts of
basalt do not affect the compressive strength. However, at a substitution level of 40%, an
improvement in strength is clearly visible (Figure 71). Firstly, the incorporation of 40% (W/S 0.600)
leads to an increased compressive strength of 3.56 MPa. Secondly, reducing the water content of the
40% sample (W/S from 0.600 to 0.550) leads to an additional improvement of the compressive
strength towards 3.86 MPa. Thus, both parameters lead to an increment of strength of roughly 0.3
MPa each. The compressive strength of the 60% sample with a W/S ratio of 0.500 is very high, i.e.
4.79 MPa, which is an increase of 50% relative to the reference strength. The enhanced strength is

110
due to the reduced water content but mainly due to the incorporation of basalt. However, at a
substitution level of 80% (W/S 0.475), the compressive strength is significantly reduced to 3.69 MPa.
This is still a good strength value compared to the reference value, but this also tells that very high
basalt contents and very low quartz contents strongly negatively influence the compressive strength.
Indeed, the 97.5% sample exhibited poor strength (2.31 MPa). This indicates that something has
changed within the AAC matrix for very high replacement levels.
Figure 102: Raw density versus compressive strength (basalt).
Comparing the compressive strength values with the raw density values in Figure 102, it can be seen
that they are somehow linked to each other: a higher raw density results in a higher compressive
strength (up to a certain extent). Therefore, the strength of AAC can hardly be evaluated based on
the compressive strength due to its strong correlation with the raw density. In order to assess the
strength independent of the density, the A-value is calculated and plotted as well in Figure 71. There
are two trends noticeable. Firstly, the A-value or strength increases gradually from reference to a
substitution level of 60% following an approximate linear trend. The A-value increases from 960 as
reference to 970, 1053, 1077, 1093 and 1195 for the 10, 20, 40, 40 (W/S 0.550) and 60% (W/S 0.500)
sample respectively. The 10 and 20% sample showed a similar compressive strength as the reference,
but their raw density is lower which results in an increasing A-value. Furthermore, reducing the water
content has no influence on the A-value looking at the two 40% samples. Although the compressive
strength increases, the raw density also increases substantially. Therefore, the A-value does not
increase due to a lower water content. The 60% sample exhibits an excellent A-value of almost 1200,
which means an improvement in strength of 28% relative to reference. Secondly, the A-value or
strength decreases very strongly from substitution level 60% to the complete replacement. The 80%
sample shows a strength of 927 which is roughly equal to the reference value though still acceptable.
On the other hand, the 97.5% sample exhibits a very poor A-value (491). Thus, 60% is the optimum
substitution level based on strength results, while substitution levels up to 80% are feasible.
The strength at a substitution level of 60% is very high. This probably indicates that the remaining
40% quartz powder is mainly dissolved and is used for the formation of tobermorite which is the
main binding phase of AAC. The 60% basalt is mainly used as an inert filler, and a basalt grain is
probably a stronger filler compared to a quartz grain within the AAC matrix. The reduced water
demand of basalt leads as well to an additional improvement of the strength. Another possible and

111
additional explanation is that the basalt serves as a nucleation agent. In this way, the basalt enables
the formation of new phases which may provide an additional strength to the AAC matrix. Now at a
substitution level of 80%, a strong reduced strength is observed. Probably the amount of the
remaining quartz (20%) is too low in order to ensure the formation of sufficient tobermorite crystals.
Too few tobermorite crystals are formed which provide less strength, as basalt is an inert material
and does not contribute to the formation of tobermorite. Moreover, the strength at substitution
level 97.5% is very poor. There is almost no quartz powder left for the formation of tobermorite and
consequently, a very low strength is provided. Nevertheless, the above made assumptions must be
confirmed by micro-structural analysis (SEM and XRD).
Density – porosity
Deriving from Figure 72, the raw density seems to be hardly influenced by the incorporation of
basalt, but so significantly by reducing the water content. The raw density of the 10, 20 and 40%
sample (reference W/S first two, W/S 0.600 third)) is 445, 441 and 451 kg/m³ compared to 459 kg/m³
as reference, so a bit lower than reference but the differences are relatively small. At substitution
level 40%, there is a sudden jump in the raw density which is attributed to the reduction in water
content of the second 40% sample. The raw density increases from 451 to 473 kg/m³. The 60% and
80% sample with a W/S ratio of 0.500 and 0.475 respectively, exhibit similar values (501 and 499
kg/m³) that are significantly higher than the previous values. Furthermore, the 100% sample (W/S
0.450) shows even a raw density of 542 kg/m³. So the increases in raw density at high substitution
levels are most likely caused by the reduced water contents in the mix designs, not by the
incorporation of high amounts of basalt.
The specific density is not affected by the incorporation of basalt nor by reducing the water content.
The reference value is 2.53 g/cm³ characterised by a standard deviation of 0.026 g/cm³. The values
for the 10, 20, 40, 40 (reduced W/S from here on), 60 and 80% samples are 2.55, 2.53, 2.52, 2.55,
2.54 and 2.56 g/cm³. So, all the values are within the error range of the value. Therefore, no
influence of the basalt nor the reduced water content can be identified. However, the 97.5% sample
exhibits a significant elevated specific density, i.e. 2.70 g/cm³. This indicates that something has
changed within this material, which was already indicated by a very poor strength. Micro-structural
analysis can explain what changed/is different in this sample. The last remark is that the basalt
powder is denser than the quartz powder.
Because the raw density increases with reducing water content (not affected by the basalt) while the
specific density is not influenced by both the basalt and reduced water contents, the porosity will
decrease with decreasing water contents and therefore increasing basalt contents. The porosity of
the 10 and 20% sample is slightly higher than reference due to its slightly lower raw density and
slightly higher specific density for the 10% sample and only slightly lower raw density for the 20%
sample. However, the differences between the two basalt samples and the reference are small:
82.57% and 82.52% compared to 81.87%. The porosity of the 40% sample with reference W/S ratio is
82.09% and is within the error range of the reference value. These observations indicate that the
porosity is hardly affected by the basalt. On the other hand, the porosity of the 40% sample
decreases from 82.09% to 81.46% due to the decreasing W/S ratio. The porosity decreases further to
80.26 and 80.52% for the 60 and 80% sample respectively due to their even lower W/S ratios. Finally,

112
the 97.5% sample is as special case because both its raw and specific increased significantly. Its
porosity is 79.92%, the lowest of all basalt samples.
Thermal conductivity
The thermal conductivity is hardly affected by the incorporation of basalt. The reference thermal
conductivity is 0.083. The thermal conductivity values of the 10, 20 and both 40% samples are within
the error range of the reference value. Furthermore, reducing the water content leads to a small
increase in thermal conductivity, i.e. from 0.081 to 0.085 W/m∙K for the 40% sample. The values of
the 60, 80 and 97.5% sample (lower W/S ratios) are slightly higher than reference, respectively 0.091,
0.087 and 0.086 W/m∙K. These values are still in the same order of magnitude as the reference value.
It is interesting to see that the thermal conductivity values show exactly the same but opposite trend
compared to the porosity values. As already known, the thermal conductivity is closely related to the
density and porosity, which can be seen in Figure 103. The small differences in porosity are the cause
of the small differences in thermal conductivity. The small changes in porosity are caused by the
reduced water amount which in turn lead to small changes in the thermal conductivity. Though, the
application of basalt hardly influence the thermal insulating performance of AAC.
Figure 103: Thermal conductivity versus porosity (basalt).
Drying shrinkage
The total length change of the basalt prisms is plotted in Figure 75 in function of their substitution
level. RILEM recommends that this value should not exceed 0.35 mm/m. The reference is far away
from this limit (0.74 mm/m) as already described. The incorporation of basalt results in a strong
decreasing total length change, i.e. the drying shrinkage significantly improves. Between reference
and a replacement level of 40%, the value drops strongly: from 0.74 mm/m to 0.41 mm/m. When
comparing both 40% samples (different W/S ratio), it is observed that reducing the water content in
the mix has no influence on the drying shrinkage. Both values are almost equal to each other (0.41
and 0.39 mm/m) and are within the error range of each other. For higher substitution levels (>40%),
the value decreases slightly but is each time within the error range of the previous/next value. Thus,
substitution levels of 40% and higher do not affect the total length change anymore and the value
remains roughly constant. Moreover, the 60% and 80% sample showed both a total length change of
0.36 mm/m. This value is just above the defined limit, though their error bar reaches below the limit.
With a bit of tolerance it can be said that the 60 and 80% basalt sample fulfils the RILEM
requirement. However, the 97.5% sample changed its length again more (0.43 mm/m) and showed

113
as well a different behaviour (as will be seen in the next paragraph). During the evaluations of the
other properties, a different behaviour could also be observed for this sample.
An important remark has to be made: a different (wrong) start-up was applied for the basalt samples
and reference 7 inclusive 8 samples. Before the actual measurements, the samples were placed in
water and the water level was then gradually increased to ensure a gradual uptake of water within
the samples (takes one day), as prescribed. However, to accelerate the uptake in the following days
once the samples are completely under water (normally takes 2 days as prescribed), the samples
were placed in the autoclave and a vacuum was applied on them. Due to the vacuum, the samples
rapidly became saturated with water. The problem is that the vacuum resulted in over-saturation of
the samples. As a result, the moisture content of the test prisms was roughly 150% when the
measurements started. This is the reason why the total loss of moisture during the measurements
could not be determined exactly. After a few days when the moisture content was decreased
enough, the length changes started to take place (similar to the trass and tuff ash samples). This fact
also explains why the shape of the curves in Figure 76 differs from the shape of the curves in Figure
50, Figure 57 and Figure 64 (trass and tuff ash). Nevertheless, this mistake has no influence on the
calculation of the total length change and relative length change between a moisture content of 6
and 30%. If the right part of the plots in Figure 77 (moisture content > 50%) are left out, the shape of
the curves are very like the shape of the curves in Figure 50, Figure 57 and Figure 64. However, in this
case the mass of the wax and plugs is included in the mass of the sample during the measurements.
Therefore, the plots in Figure 76 are accurate.
Now the drying shrinkage can also be evaluated according to the ASTM standard by means of the
relative length change. This change in length between 30 and 6% should not exceed 0.02%. Figure 76
indicates that the reference (ref 7), basalt 1 (10%) and basalt 2 (20%) samples clearly do not meet the
ASTM requirement: their relative length change is definitely higher than 0.02%. However, starting
from the basalt 3 sample, it becomes difficult to see whether the relative length change between 6
and 30% is higher than 0.02% or not. Therefore, the relative length change is plotted against the
moisture content within the range of 6 and 30%. In this way, it is easy to determine the length
change and to evaluate it. In addition, this evaluation is performed per test prism, so for each low,
middle-low, middle-up and up sample of one sample in total. The first 40% sample (W/S ratio 0.625)
showed a relative length in between 0.026 and 0.031%, while the second 40% sample (W/S ratio
0.575) exhibited a relative length change in between 0.025 and 0.037%. Thus, both samples do not
meet the limit and reducing the water content has hardly an influence on the drying shrinkage
(already observed previously). Next, the 60% sample had a relative length change in between 0.020
and 0.025%, so just above the limit (only the middle-low sample meets the limit). Finally, the 80%
sample fulfils the requirement as all samples changed their length below 0.02% (in between 0.05 and
0.013%). The 97.5% sample is again a special case. This sample meets the requirement as it had a
relative length change in between 0.009 and 0.015%. However, this sample behaved differently:
instead of shrinking like all the other samples, this sample increased in length in between a moisture
content of 6 and 30%.
In conclusion, the drying shrinkage definitely improves due to the application of basalt and the
requirements of both standards could even be fulfilled. The changes in drying shrinkage due to the
incorporation of basalt can only be explained by micro-structural analysis.

114
5.5.3. General
Basalt is a commonly available volcanic rock material and seems suitable to be applied as raw
material in AAC. It is used as substitution material for quartz powder and will serve as an inert filler in
the AAC matrix. AAC where quartz is completely replaced by basalt could be produced successfully,
although the final material fails due to poor strength and high density. Thus, a certain amount of
quartz powder is required in order to ensure the formation of sufficient tobermorite crystals.
Substitution levels up to 80% are successful, for which 60% as optimum substitution level provides a
strong enhanced material.
Basalt powder has a lower water demand compared to quartz powder. Therefore, the W/S ratio is
more and more lowered for higher and higher substitution levels. Consequently during this study,
there are two variable parameters: the W/S ratio and the substitution level. The temperature
development within the green body is not affected by the basalt, while the maximum temperature
gradually increases with decreasing water content and occurs at earlier time moments. Furthermore,
basalt does not influence the rising and setting development, whereas the reduced water contents
do. The maximum rising height is reached later and decreases, while the setting is accelerated.
Finally, basalt causes the green strength to decrease while the reduced water content improves the
green strength.
Strength results indicate that a certain amount of quartz is required in order to enable the formation
of (enough) tobermorite crystals to provide sufficient strength. Substitution levels up to 60% provide
improving strengths, and for 80% still sufficient strength is achieved. Basalt has only little influence
on the raw density, although the reduced water contents lead to increments in the density. On the
other hand, the specific density is not affected. Moreover, the porosity slightly decreases with
increasing substitution levels due to the accompanied decreasing water contents. As the porosity
slightly decreases, the thermal conductivity slightly increases but the differences are small. Finally,
the drying shrinkage improves very strongly (up to two times better) and the requirements of the
concerning standards could even be fulfilled (at substitution level 60%).
Once again, the correlations between the different final properties are identified. Contrary to the
study of tuff ash and trass, there are two variable parameters in this study: the replacement level and
the water to solids ratio. This fact makes that the evaluation of the correlations between the
different properties is more complex. The raw density increases with increasing substitution level
due to the decreasing water content, mainly due to the lowered water content (and not due to the
basalt). Because the raw density increases (and the specific density is not affected), the porosity
decreases. This is clearly visible in Figure 104 on the left side. In general, the thermal conductivity
decreases with increasing porosity for porous (building) materials. The observed results from this
study follow this trend, as can be seen in Figure 104 on the right side. This also means that the
thermal conductivity decreases with decreasing raw density, as observed during the literature study
[2].
It is known that the raw density and the compressive strength gradually increase with decreasing
water content, while the porosity decreases. In other words, because the raw density decreases and
porosity increases due to a lower water content, the compressive strength increases. In Figure 105,
the A-value (strength independent of raw density) is plotted against the raw density and porosity. In
general, the A-value should remain roughly constant with increasing raw density, because the

115
compressive strength also increases (see Formula 3). It should be kept in mind that the changes in
raw density are mainly caused by the changing water contents. Therefore, when the A-value
increases or decreases with increasing raw density, this can be probably mainly attributed to the
replacement level and the incorporation of the alternative material (larger changes in compressive
strength).
On first insights, the plots of Figure 105 can give a misunderstanding idea due to the two low A-
values belonging to the replacement levels 80 and 97.5%. Leaving out these two points, it can be
identified that the A-value generally increases with increasing raw density and decreases with
increasing porosity. This probably indicates that the basalt powder has a positive influence on the
strength of AAC (for substitution levels up to 60%). The two (very) low A-values at replacement levels
80 and 97.5% are caused by a strong negative effect of the large amounts of basalt on the strength.
Therefore, basalt powder can be incorporated in AAC up to certain amount (approximately 60%).
As last, the A-value is also plotted against the thermal conductivity in Figure 106. It seems that A-
value increases gradually with increasing thermal conductivity, if the values at replacement levels 80
and 97.5% are left out the evaluation (low A-values). The higher strength is accompanied by a higher
raw density and lower porosity, which in turn results in an increasing thermal conductivity. The
correlation at replacement levels 80 and 97.5% is not assessed due to a failed strength.
Figure 104: The raw density versus the porosity on the left side, the thermal conductivity versus the porosity on the right side.
Figure 105: The A-value versus the raw density (left side) and the porosity (right side).

116
Figure 106: The A-value versus the thermal conductivity.

117
5.6. Application of copper slag in AAC
Copper slag is a residue of the metallurgical production of copper. The application of copper slag in
AAC is investigated, where it is used as replacement material for quartz powder. Unfortunately, there
is only a limited amount of copper slag available. Because of that, only two full-scale samples could
be produced: substitution levels 20% and 40% (with W/S 0.575). Thus, only two samples with low
substitution levels can be evaluated. With the remaining copper slag, three small samples were made
which are used for specific density measurements and micro-structural analysis (not included in this
research). These three samples have substitution levels 60, 80 and 100% and all have the reference
W/S ratio. The obtained results will be discussed in the following parts. Prisms of the two basalt
samples are shown in Figure 77.
5.6.1. Green body properties
The reference green body properties are mentioned in Table 8. For both Cu slag samples, the end of
the rising stage accompanied by the settling effect at the end correspond in time with the setting
development. Thus, this requirement is fulfilled. All the green body properties were evaluated and
approved (Table 29), so that the green bodies could be autoclaved. Both samples were autoclaved
without any problems.
Slump flow
The slump flow is affected by the incorporation of copper slag because the slag has a lower water
demand compared to quartz powder. Figure 3 shows that the slag is slightly coarser than the quartz,
explaining the reduced water demand. Therefore, the slump flow will increase with increasing Cu slag
contents. The value increases from 25.5 (reference) cm to 27.0 cm for 20% Cu slag. Based on the
experience obtained through the study of basalt, it was expected that the slump flow of the 40%
sample with reference W/S ratio probably would exceed the upper limit of 28 cm. Therefore, the
W/S ratio should be lowered, but no preliminary study could be conducted. As no copper slag could
be wasted due to its limited availability, the 40% sample had to have a correct slump flow during the
first trial. Based on obtained knowledge and own experience, the W/S ratio was selected as 0.575
and during the production process of the sample, the workability could be adjusted in situ by adding
a known amount of water. Nevertheless, the selected W/S ratio turned out to fit perfectly, as the SF
was 26.0 cm.
Temperature development
The temperature development is shown in Figure 78. As can be seen, the temperature is not
influenced by the copper slag as the temperature within the 20% green body reached roughly the
same value as reference. The maximum temperature in the reference green body is 79.3°C, while this
is 79.8°C for the 20% sample. However, reducing the water content results in an increased
temperature: from 79.3°C to 82.7°C for the 40% sample with a W/S ratio of 0.575. The moment when
the maximum temperature is reached is postponed with roughly 20 minutes. Thus, the temperature
is only affected by the change in water content and not by the copper slag.

118
Rising development
The incorporation of 20% copper slag does have some effects on the setting development as can be
seen in Figure 79. Firstly it seems that the moment when the maximum rising height is reached, is
slightly delayed (10 minutes). However, when looking at the ref 6 and 8 curves in Figure 21, no
differences can be observed between these two and the 20% slag sample. Secondly, for the 20%
sample there occurs no clear settling or sinking effect. This can be coincidence, but can also be
caused by the Cu slag. However, the measured maximum rising height is 29.8 cm, while for reference
this is 29.4 cm, so there is no effect on the final rising height. In general, it can be assumed that the
copper slag only has little influence on the rising development of the green body. On the other hand,
the rising development of the 40% sample is more significantly affected, mainly due to the reduction
of the water content. The moment when the maximum rising height is reached, is even more
postponed (18 minutes relative to reference). Furthermore, there is an sinking effect but it is takes
places faster (8 minutes relative to reference). The plateau between the moment when the
maximum is reached and the moment when the sinking effect takes place, is almost completely
disappeared.
Setting development
The incorporation of 20% Cu slag does not influence the setting development as the curve of the first
sample is very similar to the reference curve in Figure 80. The setting development of the second
sample is accelerated with roughly 15 minutes. This is attributed to the reduced water content, not
to the copper slag. The same observation was made during the study of basalt. Thus, it can be said
that the slag does not affect the stiffening, whereas reducing the water content does (acceleration).
Green strength
When evaluating the values in Table 29, two effects can be observed. As first, the addition of copper
slag leads to a reduction in green strength. The green strength decreases from 420 to 340 after 2.5
hours and from 610 to 500 after 3 hours due to the incorporation of 20% copper slag. As second,
reducing the water content results in an improved green strength, as already observed during the
study of basalt. The 40% sample with a lower water content exhibits a green strength of 400 after 2.5
hours and 580 after 3 hours. These values are similar to those of the reference. Probably the
increment in strength due to the reduced water content is partially eliminated by the decrement in
strength due to the Cu slag. Or in other words, the negative effect of the copper slag is completely
erased by the positive effect of reducing the water content. In this way, no problems occur with the
green strength, which may become too low due to the slag.
5.6.2. Final properties
The reference final properties are stated in Table 9. The final properties of the copper slag samples
(Table 30) are assessed in this chapter.
Strength
The partial substitution of quartz by copper slag significantly improves the compressive strength
(Figure 81). The increase in strength with increase in substitution level seems to follow a linear trend.
The reference compressive strength of 3.18 MPa significantly improves to 3.77 and 4.43 MPa for the

119
20 and 40% sample respectively. The increment in compressive strength at 40% is also partially due
to the reduced water content but is still mainly attributed to the Cu slag. It is possible that even
higher compressive strengths can be achieved with higher substitution levels.
The A-value of both Cu slag samples is significantly improved compared to reference (Figure 81). The
value increases from 960 for reference to 1153 and 1187 for the 20 and 40% sample respectively.
Especially the improvement of strength at 20% is remarkable: an increment of 23% relative to
reference due to the replacement of 20% quartz by copper slag. The increase in strength from 20% to
40% is rather small. The 40% sample has a reduced water content which results in an elevated raw
density. Therefore, the increase in A-value is not great relative to the 20% sample.
The strength of both copper slag samples is very good. The quartz powder present enables the
formation of tobermorite, while the copper slag grains act as filler within the AAC matrix. Copper slag
is known as a hard and strong material. The slag grains are probably stronger and/or interact better
with the matrix compared to quartz grains. The enhanced strength relative to reference is probably
due to this fact. The reduced water demand of basalt leads as well to an additional improvement of
the strength, although this increase is far less significant than the increase due to the incorporation
of copper slag. It also possible that the Cu slag acts as a nucleation agent, allowing the formation of
new minerals which provide an additional strength to the AAC matrix. However, micro-structural
analysis must be performed in order to understand why the strength is improved.
Density – porosity
The incorporation of 20% copper slag does not influence the raw density. The value decreases slightly
from 459 to 452 kg/m³, but they are in each other’s error range (Figure 82). Furthermore, the raw
density of the 40% sample (483 kg/m³) is higher than the previous values. This is caused by the
reduced W/S ratio of the mix design, not by the copper slag. The copper slag has probably little to no
influence on the raw density of AAC.
As already mentioned, three additional small samples with substitution levels 60, 80 and 100% and
with reference W/S ratio were produced. From these samples, the specific density could be
determined because only a small amount of material is required for the measurement and no
homogenous pore structure is necessary. As observed throughout the research, reducing the water
content has no influence on the specific density (therefore the reference W/S ratio is chosen). From
Figure 82 it can be seen that the specific density decreases with increasing substitution levels up to
80% following roughly a linear trend. The value decreases from 2.53 g/cm³ (reference) to 2.50, 2.42,
2.32 and 2.25 g/cm³ for 20, 40, 60 and 80% copper slag. It should be remarked that the decrements
are rather significant. However, the 100% sample exhibits a sudden high value again, i.e. 2.50 g/cm³.
The sudden increased density at 100% is very similar to the observation made at 100% during the
study of basalt. There the 100% (actually 97.5%) sample as well showed a sudden elevated value.
This basalt sample performed poorly and basically failed. Therefore, a 100% copper slag sample
probably would also fail or perform badly. This would in turn imply that a certain amount of quartz
powder is required in order to obtain sufficient strength because copper slag is an inert material.
The porosity of the 20% sample is equal to the reference porosity, both 81.9%, because both the raw
and specific density of the sample simultaneously decreased slightly. The porosity of the 40% sample
is 80.1%, thus lower than the previous values. The sample exhibited a higher raw density due to the

120
reduced W/S ratio, while the specific density was lower due to the copper slag. Consequently, the
porosity decreases. Most likely, the incorporation of copper slag results in a decreasing porosity,
especially at higher substitution levels. The porosity will likely decrease further with increasing
substitution level due to the decreasing specific density and probably increasing raw density caused
by the decreasing W/S ratio required for higher substitution levels.
Thermal conductivity
The thermal conductivity is closely related to the density and especially the porosity. Indeed, the
thermal conductivity values (Figure 84) show the same but opposite trend compared to the porosity
values. This correlation explains the changes in thermal insulating performance of the copper slag
samples. The value of the 20% sample is equal to the reference value, both 0.083 W/m∙K.
Furthermore, the value of the 40% sample (0.088 W/m∙K) is slightly higher than reference due to its
decreased porosity. It should be remarked that the increase is fairly limited. Probably the
incorporation of copper slag (accompanied by the decreasing W/S ratio) will lead to an increasing
thermal conductivity due to the decreasing porosity, especially at higher substitution levels.
Drying shrinkage
Finally, the drying shrinkage of both copper slag samples is assessed relative to reference by means
of the total length change and the relative length change. Firstly the total length change of the Cu
slag prisms is checked to the limit defined by the RILEM recommendations (maximum 0.35 mm/m).
As already mentioned a couple of times, the reference value (0.74 mm/m) is far away from the limit,
i.e. twice too large. The total length change of AAC during moisture movements is not affected by the
replacement of 20% quartz by the slag, because the 20% sample exhibited a total change of 0.73
mm/m. However, the 40% sample showed a significantly lower value: 0.52 mm/m. It is impossible to
say whether this is due to the copper slag or due to the reduced water content because of the
limited amount of information. During the study of basalt it was concluded that a lowered water
content did not affect the drying shrinkage. Therefore, the improved drying shrinkage is likely due to
the copper slag. Unfortunately, the RILEM limit is not reached by the 40% slag sample.
Same as the ref 7, ref 8 and basalt samples, a different/wrong start-up was used before the drying
shrinkage measurements were started. This is already extensively described during the discussion of
the drying shrinkage of the basalt samples. This discussion will not be repeated here, and more
information can be found in the concerning chapter of the basalt study. Although the total amount of
moisture loss cannot be calculated, the wrong start-up has no influence on the final results.
Furthermore, the mass of the plugs and wax are taken into account in the masses. Therefore, the
moisture content values are accurate.
Secondly, the relative length change of the copper slag samples between a moisture content of 6 and
30% is evaluated by means of the ASTM standard. The measured value should not exceed 0.02%. The
relative length change is plotted against the moisture content in Figure 85. As can be seen in this
plot, the 20% sample behaved very similar to the reference 7 sample and both samples exhibited
similar values for the relative length change between 30 and 6%. Now the 40% sample showed a
different behaviour: it shrunk less during the moisture movements. Therefore, the relative length
change between 30 and 6% is smaller compared to the reference and 20% sample, although the
ASTM limit is definitely not reached.

121
Both evaluations (total against relative length change) correspond very well to each other. The same
conclusions are drawn for both. Thus, the drying shrinkage is enhanced by the incorporation of
copper slag. The changing drying shrinkage at replacement level 40% can only be explained by a
micro-structural analysis.
5.6.3. General
Copper slag is applied as a replacement material for quartz powder. It is a hard and strong material,
and will serve as an inert filler in the AAC matrix. From the above discussions, it can be said that the
copper slag behaves similar as basalt in AAC. Unfortunately, there could only be two samples
produced, so the evaluation of the behaviour of Cu slag in AAC is rather limited. However, at low
substitution levels, the copper slag behaves very well in AAC and provides great strength and
improved drying shrinkage while other properties are less affected. Probably an even more enhanced
performance of AAC can be achieved with higher substitution levels.
Copper slag has a lower water demand compared to quartz powder, so the slump flow increases with
increasing slag content. The 40% sample required an adjustment in its water content, whereas the
20% sample not. As a result, there are two variable parameters in the study: the substitution level
and the W/S ratio. The temperature development is not affected by the copper slag, whereas a
reduced water content leads to an increased temperature within the green body. The slag appears to
have some minor effects on the rising development, although this is not conclusive. Reducing the
water content has definitely an effect on the rising of the green body. Furthermore, the setting
development is accelerated by the reduced W/S ratio, whereas the copper slag does not affect it.
Finally, the Cu slag leads to a decreasing green strength, while a lowered water content to an
increasing strength.
The strength of the AAC increases with increasing Cu slag content, and both samples exhibited great
strength values. The raw density is hardly influenced by the copper slag, whereas the reduced water
amount leads to an increased density. The specific density decreases with increasing substitution
level. However, a 100% sample suddenly exhibits a strong elevated value, which likely indicates that
the complete replacement of quartz by Cu slag is not feasible and the resulting AAC material will fail
or perform poorly. The porosity is not affected by the incorporation of 20% slag, while it decreases
for 40%. The porosity will probably decrease further with increasing substitution levels. The thermal
conductivity, closely correlated to the porosity, is not influenced by 20% copper slag but increases by
40% copper slag although the difference is small. The thermal conductivity will possibly increase with
increasing substitution level. Finally, the drying shrinkage is not affected by the incorporation of 20%
copper slag, whereas the drying shrinkage significantly improved by the incorporation of 40% slag.

122
5.7. Application of granite in AAC
Granite is a commonly available rock material which is milled to a fine powder. This granite powder
seems suitable to be applied as a raw material in the production of AAC. Granite is also used as
substitution material for quartz powder. In this study, the behaviour of granite in AAC is investigated,
both for the green body and the final material. AAC samples containing granite with various
substitution levels are produced. All the properties are determined and will be evaluated in the
discussions below.
In total, seven samples are produced with substitution levels 10, 20, 40, 40, 60, 80 and 100%, and
with reference W/S ratio for the first three samples (Table 32). The second 40% sample has a W/S
ratio of 0.575, while the 60, 80 and 100% sample has a W/S ratio of 0.550, 0.525 and 0.516. The
changes in W/S ratio will be explained in more detail during the discussion of the slump flow. The
first remark which is immediately clear, is that AAC samples with very high substitution levels (even
complete replacement) were successfully produced. Furthermore, granite influences the white
appearance of AAC because the white quartz powder is replaced: the colour turns greyish at high
substitution levels (Figure 87).
5.7.1. Preliminary study
The preliminary slump flow results for granite are listed in Table 31 and presented in Figure 86.
Figure 86 looks very like Figure 65 which shows the preliminary results for basalt regarding slump
flow. This indicates that the granite has a similar influence on the workability as the basalt. However,
the scale of the y-axis is bigger for the basalt results compared to the granite results, which indicates
that the influence of granite on the slump flow is smaller than that of basalt.
The slump flow of the reference mixture was determined one more time in order to check if the
value corresponds to the three measured values during the preliminary study of basalt. The new
determined value was 25.3 cm compared to 25.4, 25.6 and 25.7 cm measured during the pre-study
of basalt. It is clear that the value matches the other values and therefore, the reference slump flow
is taken as the average of the four values. This provides an average value of 25.5 cm with a standard
deviation of 0.20 cm. An interesting side remark is that this reference SF is the same value as the
average SF of all the actual reference samples (see Table 8).
Figure 86 clearly shows that the granite influences the workability of the fresh mixture. The slump
flow increases gradually with increasing substitution level following roughly a linear trend. This
means that the granite powder has a lower water demand compared to quartz powder. Figure 3
shows that the quartz is slightly finer than the granite. Finer particles have a higher water demand
compared to coarser particles. This explains why the SF increases with increasing granite content.
Table 31 tells that the SF value increases from 25.5 cm to 27.3, 28.0, 30.4 and 31.7 cm for 10, 20, 40
and 60% respectively. However, it should be remarked that the SF was only determined once
although the differences between the values are clear.
The increment in SF due to the addition of granite is fairly significant. The values of the 10 and 20%
mixtures are below the pre-defined upper limit of 28 cm. However, from substitution levels of 40%
on, the SF exceeds the upper limit. Therefore, substitution levels of 40% and higher require an
adjustment in the water content of the mix design. For this pre-study, the new selected W/S ratio is

123
0.575 and the SF of the 20, 40 and 60% mixture is again determined. The measured values are 23.5,
26.2 and 28.3 cm respectively. Thus, all three values are within the limits (tolerating the third value).
It can be observed that every value decreases with approximately 4 cm when comparing the new
values with the old values. The three new values follow as well a linear trend. Moreover, Figure 86
indicates that the red curve (W/S 0.575) is parallel to the blue curve (reference W/S), again indicating
the linear relation. The obtained insights during this pre-study will be necessary during the
production of the AAC samples with granite.
5.7.2. Green body properties
Table 8 presents the reference green body properties. First the slump flow of the fresh mixture is
checked, and if necessary the W/S ratio of the mix design is adjusted. When the samples are
produced and the green body properties are collected, the rising and setting development are
analysed as first. More specific, it is first checked if they both take place in the same order of time.
For all green bodies containing granite, this requirement was fulfilled, thus no green body collapsed
or failed. The analysis of the rising and setting development will be described detailed later on. Once
all the green body properties were evaluated and approved, the green bodies are autoclaved.
Moreover, all granite samples did not fail during the autoclaving process.
Slump flow
The slump flows of the granite samples are listed in Table 33 and the reference slump flow is 25.5
cm. It was already observed during the preliminary study that the granite leads to an increased
workability, which is also observed here. The slump flow increases from 25.5 cm to 27.0, 28.0 and
29.5 cm for 10, 20 and 40% granite. The SF of the 10 and 20% sample are within the limits, whereas
the 40% sample requires a modification of the W/S ratio. The information obtained through the pre-
study is used in order to select an appropriate lower W/S ratio. The new W/S ratio for the 40%
sample is chosen as 0.575 for the 40% sample. The 40% mixture with a W/S ratio of 0.575 exhibited a
SF of 26.0 cm (roughly the same as reference). The water content needs to be further reduced for
higher substitution levels, as known from the pre-study. Therefore, the W/S ratio of the 60, 80 and
100% sample was chosen as 0.550, 0.525 and 0.500 respectively. However during the production
process of the 100% sample, the W/S ratio needed to be adjusted in situ. The workability needed to
be slightly increased which was done by adding a known amount of water. This amount of water is
re-calculated back into the W/S ratio: the actual W/S ratio of the mixture is 0.516. The 60, 80 and
100% fresh mixtures exhibited a SF of 25.5, 25.0 and 23.0 cm, so all within the defined limits. One
remark, the SF value of 23.0 cm for the 100% sample is valid for a W/S ratio of 0.500. Thus, in reality
the slump flow is a little bit higher because the actual W/S ratio is 0.516. The SF values and the
observed effects match the observations made during the preliminary study. The effects of the
lowered water contents on the other properties will become clear in the following discussions.
Finally, a reduced water amount is beneficial as less water is required.
Temperature development
Figure 88 presents the temperature developments of the granite green bodies. The incorporation of
10, 20 and 40% granite does not affect the temperature within the green body as all the curves are as
good as equal to the reference curve. This trend can also be observed when looking at the maximum
temperature listed in Table 33: 79.8°C for all three samples compared to 79.3°C as reference, as well

124
occurring at the same time. Now the 40% granite sample with reduced water content suddenly
exhibits an elevated temperature. The maximum temperature increases from 79.3°C (reference) or
79.8°C (10, 20 and 40% granite) to 81.6°C, as well the maximum temperature occurs faster (30
minutes). This is not attributed to the incorporation of granite, but to the lowered W/S ratio. The 60
and 80% green body showed even higher maximum temperatures of 82.9 and 84.2°C respectively.
The temperature increases with increasing substitution levels up to 80%, but this is due to the
decreasing water content with increasing substitution level. The maximum temperature also takes
place faster with reducing water content (and thus increasing substitution level). However, the
maximum temperature of the 100% green body occurs the fastest, but the maximum (83.4°C) is in
between the values of the 60 and 80% sample. This possibly indicates that something has changed in
the 100% sample relative to all the other samples.
Rising development
The measured maximum rising height is not influenced by the incorporation of granite. The reference
value is 29.4 cm, while the value for the 10, 20 and 40% sample (reference W/S) is 29.0, 30.0 and
29.8 cm respectively. Figure 89 presents the rising developments of the granite green bodies. The
curve of the first sample differs significantly from the reference curve. However, the granite 1 curve
is very similar to the curves of reference 6 and reference 8 in Figure 21. Probably something went
wrong with the floating device which measures the rising height during these measurements.
Moreover, the deviating measured rising development is most likely not caused by the granite.
Furthermore, the green bodies with 20% and 40% (both W/S 0.625 and W/S 0.575) granite develop
their rising in a roughly similar way as reference. The sinking effect occurs at approximately the same
time for the reference and granite 1 until 4 sample. However, the granite seems to delay the
moment when the maximum rising is reached, which becomes more significant with increasing
substitution level.
The granite 5, 6 and 7 samples (60, 80 and 100%) with reduced water contents (W/S 0.550, 0.525 and
0.516) exhibited deviating rising developments and decreasing maximum rising heights compared to
reference, mainly caused by the reduced water amount. For these three samples, the sinking effect
takes place at the same time but faster compared to the other samples (roughly 15 minutes). On the
other hand, the maximum rising height is reached later for these samples and is immediately
followed by the sinking effect. The plateau between the maximum rising height and sinking effect
completely disappears. Furthermore, the maximum rising height decreases from 29.4 cm (reference)
to 27.5, 27.2 and 26.2 cm. The 40% sample with a reduced water content (W/S 0.575) also showed a
lower value (28.6 cm) compared to reference. Thus, the maximum rising height decreases with
decreasing water content (and in turn increasing granite content), which is also noticeable in Figure
89. As already mentioned, the observed differences are mainly caused by the lowered W/S ratio. The
granite probably plays only a minor role.
Setting development
The setting development is not affected by the application of granite. Figure 90 shows that the
incorporation of 10, 20 and 40% does not influence the setting of the green body as the curves of the
samples are very close to the reference curve. Lowering the W/S ratio of the 40% sample from 0.625
to 0.575 results in an accelerated setting (roughly 10 minutes). By further reducing the W/S ratio
(and increasing the substitution level), the setting is more and more accelerated. The curves of the

125
granite 5, granite 6 and granite 7 samples shift more and more towards the origin. The setting of
100% sample (W/S 0.516) is approximately equal to that of the 80% sample (W/S 0.525) because
their water content is almost the same. Their setting takes place roughly 20 minutes faster compared
to reference and the first three granite samples. In conclusion, the setting of the green body
accelerates by reducing the water content, while the granite does not influence it.
Green strength
The reference green strength is 420 after 2.5 hours and 610 after 3 hours. The strengths of the
granite green bodies are listed in Table 33. The measured values indicate that the granite does not
affect the strength development of the green body because the strength does not change with
increasing substitution level. The green strength values of the first three samples are approximately
the same as the reference values: 440, 420 and 400 (2.5 hours strength) for the 10, 20 and 40%
sample compared to 420 as reference, and 540, 600 and 540 (3 hours strength) for 10, 20 and 40%
compared to 610 as reference. However, when the water content is reduced, the green strength
improves. This can easily be observed by comparing the two 40% samples for which the only
difference is the water content. The green strength after 2.5 and 3 hours improves from 400 to 560
and from 540 to 690 respectively. The 3 hours strength could even be measured with the concrete
penetrometer itself (without the cone): 40 psi or 0.28 MPa. The green strength increases further with
increasing substitution level due to the decreasing W/S ratio. However the differences are not that
remarkable. The 60, 80 and 100% green body exhibited a strength of respectively 680, 640 and 590
after 2.5 hours, which is perhaps a slight decreasing trend but hard to tell because the differences
are small. The 3 hours strength for each sample was a least 700 which is the maximum value that can
be measured. Therefore, the strength is again measured with the concrete penetrometer without
the cone: 40 psi (0.28 MPa) for the 60% sample and 50 psi (0.34 MPa) for the 80 and 100% sample.
Thus, in general the lowered water content results in an enhanced green strength, while the granite
does not have any effects on the strength development of the green body.
5.7.3. Final properties
The reference final properties are listed in Table 9 and the final product properties of the AAC
samples with granite are listed in Table 34. Unfortunately, the drying shrinkage of the granite
samples could not be determined due to the limited time of this research project, and the shrinkage
measurements take more than two months. However, it is expected that drying shrinkage behaviour
of the granite samples is similar to the behaviour of the basalt samples. From the discussions below,
it can be observed that the influence of granite on the final properties is very like the influence of
basalt. Both materials have thus a similar behaviour in AAC. Therefore, it is assumed that the drying
shrinkage probably will improve due to the incorporation of granite.
Strength
The average reference compressive strength is 3.18 MPa. The compressive strength is hardly affected
by the incorporation of 10, 20 and even 40% granite, see Figure 91. A slight increasing trend could
possibly be observed, although this is not conclusive because the values are too close to each other
and each time within the error range. The strength increases slowly from reference to 3.26, 3.27 and
3.43 MPa for 10, 20 and 40% respectively. However, a significant increment in compressive strength
can be observed when comparing both 40% samples: reducing the water content results definitely in

126
an improved strength. The strength increases from 3.43 to 3.92 MPa by lowering the W/S ratio from
0.625 to 0.575. The compressive strength increases more and more with increasing substitution level
up to 80% (and thus decreasing W/S ratio) towards 4.60 MPa at 60% and 5.07 MPa at 80%. These
increments are great and this is the first time that a compressive strength of over 5 MPa is achieved
with the AAC samples. An increase of 60% relative to reference is observed. However, when the
quartz is completely replaced by granite, the strength significantly reduces relative to the 80%
sample: from 5.07 to 4.19 MPa which is still a great strength value, especially for a complete
replacement level. But is obvious that something has changed within this sample due to the lack of
quartz powder. One last remark, the standard deviation (as error range) is rather large for the 60, 80
and 100% strength value (up to 0.49 MPa), see Figure 107 below.
Figure 107: Raw density versus compressive strength (granite).
Comparing the compressive strength with the raw density (Figure 107) indicates that the
compressive strength is closely correlated with raw density. Therefore, the A-value was again
calculated and plotted in Figure 91. As can be seen, the A-value increases gradually but also
significantly with increasing substitution levels up to 80%, but then decreases very strongly for the
100% sample. The strength increases from 960 as reference to 952, 1010, 1062, 1131, 1213 and 1281
for substitution level 10, 20, 40, 40 (reduced W/S ratio), 60 and 80% respectively. This indicates that
the granite also leads to an enhanced strength as the A-value increases by the incorporation of 10, 20
and 40% granite with the same W/S ratio for each sample. Furthermore, reducing the water content
of the 40% sample also results in an increment in A-value. There are two variable parameters: the
substitution level and the W/S ratio. It seems that both parameters have an improving effect on the
strength. It is impossible to tell which one leads to the most significant increment. Moreover, it
seems even that the magnitude of the effect is equally for both. The 80% sample exhibits the highest
strength (both compressive strength and A-value) of all samples considered during this research.
Replacing 80% quartz by the commonly available granite results in an excellent performing AAC
material. However, the A-value of the 100% sample is decreased strongly relative to that of the 80%
sample: from 1281 to 1029. This decrease is caused by the absence of the reactive quartz powder,
but there is still quite an amount of (reactive) quartz present in granite. Nevertheless, the strength is
still good and still higher as reference (due to the quartz in the granite), especially keeping in mind
that this is for a complete replacement.

127
A conclusive explanation for the strength changes can only be provided by micro-structural analysis.
Therefore, the discussion below is only based on assumptions and expectations. It was already
observed multiple times that decreasing the water content in the mixes results in increments in
compressive strength. Additionally, the strength also increases with increasing substitution levels for
which the granite has a positive influence on the strength. The strength increases for replacement
levels up to 80%. During this study, it is observed that reducing the water content results in an
improved A-value, while during the study of basalt it was observed that the A-value appeared to be
independent of the W/S ratio.
The quartz powder present and the quartz present in granite is mainly dissolved and is then used in
the formation of tobermorite. These crystals provide strength to the AAC matrix. On the other hand,
the left granite grains act as inert fillers. Probably a granite grain is somewhat stronger than a quartz
grain, and therefore likely behaves better within the AAC matrix. It could also be that the granite
particles serve as a nucleation agent. In this way, granite enables the formation of new phases which
may provide additional strength to the matrix. However, a strong reduced strength is observed for
the complete replacement. There is no quartz powder anymore and granite does not contribute to
the formation of tobermorite. Probably no tobermorite crystals are formed anymore which results in
less strength because tobermorite is the main binding phase. Thus, the granite behaves similar as the
basalt and copper slag in AAC.
Density – porosity
The raw density values are plotted in Figure 92. The incorporation of granite hardly affects the raw
density, or at least for substitution levels up to 40%. The reference value is 459 kg/m³, while this is
463, 450 and 449 kg/m³ for the 10, 20 and 40% sample. Furthermore, the lowered water content of
the second 40% sample results in an increased raw density: from 449 to 466 kg/m³. From here on,
the raw density increases with increasing substitution level due to the simultaneous decreasing W/S
ratio. The raw density raises to 487, 498 and 505 kg/m³. The increments in raw density are a lot
smaller than the increments in compressive strength, which explains the increasing A-value. Thus,
the raw density is only affected by the changes in water content of the mix design, while the granite
has little to no influence on the value.
The specific density values are as well plotted in Figure 92. The replacement of 10% quartz by granite
does not affect the specific density (2.55 compared to 2.53 g/cm³ as reference). However, an
decreasing trend is observed between substitution levels 10% and 60%, while the specific density at
80% remains the same as at 60%. Furthermore, lowering the water content does not have any effect
on the value as already known. Therefore, the observed trends are only caused by the incorporation
of granite. However, granite has a similar density compared to quartz powder. Therefore, probably
the formed reaction products are slightly lighter. The value decreases from 2.55 g/cm³ (10%) to 2.48,
2.46 and 2.42 g/cm³ for 20, 40 and 60% respectively. The 80% sample as well showed a specific
density of 2.42 g/cm³. Finally, the 100% sample exhibits a slight increased value (2.45 g/cm³) relative
to the previous value. The same trend is also observed for the basalt and copper slag: the 97.5%
basalt and 100% slag sample showed a sudden elevated specific density although the increment for
100% granite is far less significant. To summarise, the application of granite leads to a reduced
specific density in general.

128
The porosity values are presented graphically in Figure 93. The incorporation of up to 40% granite
does not influence the porosity. The reference value is 81.9% and the value is 81.8, 81.9 and 81.8%
for the 10, 20 and 40% sample, so no differences can be observed (both the raw and specific density
decrease slightly). This indicates that the granite has little to no influence on the porosity. On the
contrary, lowering the W/S ratio (at higher replacement levels) results in an increasing raw density of
the material while the specific density decreases due to the granite. Therefore, the porosity will
decrease, which can easily be observed when comparing both 40% samples. This explains the
reduced porosities of the 60, 80 and 100%. samples. Thus, the porosity decreases gradually with
decreasing water content which is directly related to the increasing replacement level.
Thermal conductivity
Again the thermal conductivity values show exactly the same but opposite trend relative to the
porosity values (see Figure 108). This immediately explains the observed trends for the thermal
conductivity of AAC samples with granite. The addition of 10, 20 and 40% granite (with reference
W/S ratio) does not affect the thermal conductivity and no differences can be observed. The
reference value is 0.083 W/m∙K compared to a value of 0.081, 0.081 and 0.083 W/m∙K at 10, 20 and
40% respectively. Reducing the water content of the mix designs results in an increasing thermal
conductivity due to the decreasing porosity. The value increases from 0.083 W/m∙K to 0.087, 0.094,
0.095 and 0.095 W/m∙K for a W/S ratio of 0.575, 0.550, 0.525 and 0.516. In turn, the thermal
conductivity increases with increasing substitution level (for high substitution levels) due to the
decreasing water amount, but not due to the incorporation of granite.
Figure 108: Thermal conductivity versus porosity (granite samples).
5.7.4. General
Granite, a commonly available rock material, is applied as a substitution material for quartz powder.
Some part acts as an inert filler in the AAC matrix, whereas the quartz present (in the granite) reacts.
It was observed that the granite behaves similar as basalt and copper slag in AAC. The granite
samples are very successful and performed very well. Moreover, the AAC sample with 80% granite is
the best performing AAC sample as observed through the entire research project. From all the
experimental results, it even seems that granite is the most promising alternative material to be
applied as raw material in the production of AAC.
129
The granite has a lower water demand relative to the quartz. Therefore, the SF increases with
increasing substitution level as observed during the pre-study. Substitution levels of 40% and higher
require an adjustment in the W/S ratio of the mix design. The granite has no effects on the
temperature development, whereas a reduced water content leads to an elevated temperature
within the green body. The granite seems to have little influence on the rising development (perhaps
slightly delaying it) and has no influence on the setting of the green body. On the contrary, lowering
the water content significantly affects the rising and setting of the green body. Finally, the green
strength is only affected (improved) by the lowered W/S ratio, not by the granite.
The strength of AAC increases with increasing substitution level and decreasing W/S ratio. Both
design parameters thus have a positive effect which leads to an significantly improved strength. The
granite has little influence on the raw density and has a small decreasing effect on the specific
density. On the other hand, lowering the water content has an increasing effect on the raw density
and no influence on the specific density. Furthermore, the porosity is not affected by the application
of granite, whereas reducing the W/S ratio results in a decreasing porosity. Finally, the thermal
conductivity is only affected (slightly increases) by the changes in W/S ratio, whereas not by the
granite. Nevertheless, the decreasing W/S ratio (from 40% on) is directly related to the replacement
level.
As last part, the correlations between the different final properties are determined. Contrary to the
study of tuff ash and trass, and similar to the study of basalt, there are two variable parameters in
this study, i.e. replacement level and W/S ratio. Therefore, the explanations behind the observed
correlations are more complex. First of all, it was observed that the raw density increases gradually
with decreasing water content (accompanied by an increasing replacement level). On the other hand,
the specific density decreases gradually due to the incorporation of granite powder. Because the raw
density increases while the specific density decreases, the porosity decreases in turn. The plot on the
left side of Figure 109 clearly shows this: the porosity decreases with increasing raw density (as
observed also during the study of basalt). From the literature study [2] it is known that the thermal
conductivity decreases with increasing porosity (general rule for porous building materials). The plot
of the thermal conductivity versus the porosity (Figure 109, right side) clearly proves this. In turn, this
also means that the thermal conductivity decreases with decreasing raw density, as observed also
during the literature study [2].
The correlations and the explanations behind it, is very similar to the scenario of the basalt. During
the study of granite it was observed that the compressive strength and the raw density
simultaneously increase with decreasing water content, whereas the porosity decreases. This means
that the A-value roughly remains constant with increasing raw density and decreasing porosity,
because the compressive strength increases at the same time. The A-value is plotted against the raw
density and the porosity in Figure 110. As concluded from the study of granite, the changes in raw
density and porosity are mainly caused by reducing the water content and not by the granite.
Because the A-value should remain approximately constant with increasing raw density and
decreasing porosity, the changes (increments or decrements) in A-value with increasing raw density
and decreasing porosity can be mainly attributed to the incorporation of granite and the
replacement level. This can be related to an additional increment or decrement in compressive
strength due to the granite.

130
The plot on the left side of Figure 110 clearly shows that the A-value increases with increasing raw
density. This means that the granite powder has an additional (strong) improving effect on the
compressive strength and in turn on the A-value. Thus, granite leads to a strong enhancement of the
strength of AAC, which explains the observed correlation between both properties. However, there
are two points that do not fit in the correlation. The first point is the plot point with the lowest A-
value: this point corresponds to a replacement level of 10%. It is not clear why this point does not fit
the correlation. A possible reason is that the influence of the granite is not prominent because of its
low content in the mix design. The second point is the point in the right corner which belongs to a
replacement level of 100%. It was already said that the strength decreases dramatically at a
substitution level of 100% (certain amount of quartz powder is required). Therefore, this point should
be left out of the correlation.
The plot on the right side of Figure 110 clearly indicates that the A-value decreases with increasing
porosity. It is generally known that the strength decreases with increasing porosity [2], so the results
are in line with the literature. Again, the same two points do not fit the correlation. The reason
behind this is already described. So the strength increases with increasing density and decreasing
porosity, which is related to the incorporation of granite. Another reasonable argument for the
strong increment in strength due to the granite is that the A-value increases more by the
incorporation of granite than by the incorporation of basalt, while the water content is more reduced
in case of the basalt compared to the granite.
Finally, the A-value is also plotted relative to the thermal conductivity in Figure 111, and a correlation
clearly appears. With increasing thermal conductivity the A-value also increases. In the literature
study [2] it was seen that the thermal conductivity increases with increasing raw density and
decreasing porosity which happens in this case. Therefore, this correlation is visible and the points
seem to follow an approximate linear trend, except for again the same two points (10% and 100%).
Again, the explanation is the same and is already given.
Figure 109: The raw density (left side) and the thermal conductivity (right side) plotted against the porosity.

131
Figure 110: The A-value plotted against the raw density (left side) and the porosity (right side).
Figure 111: The A-value plotted against the thermal conductivity.

132
6. Conclusions
The research focused on the application of alternative materials in AAC from an engineering point of
view. The investigated materials are tuff ash, trass, basalt, copper slag and granite. The conclusions
are drawn per study of the application of the alternative material in AAC. Each alternative material
can be successfully applied as a secondary raw material in AAC. Moreover, the research provided
several promising results. The objective of producing autoclaved aerated concrete incorporating
alternative materials and still exhibiting excellent properties is achieved. In this way, the overall
environmental impact is reduced, the economic costs are lowered, possible new raw materials are
provided and the performance of AAC could be improved.
First of all, it is clear that the water content plays a crucial role in the properties of autoclaved
aerated concrete. For the green body, reducing the water content leads to higher temperatures
within the green body, changes in the rising development, accelerated setting development and
increased strength of the green body. Furthermore for the final AAC material, reducing the water
content generally results in higher strengths, higher raw densities, lower porosities and higher
thermal conductivity values. Changing this parameter has no influence on the specific density and
drying shrinkage.
Application of trass & tuff ash in AAC
The application of natural tuff ash (as found in nature) in AAC, although technically not feasible due
to the large particles, is studied as pre-study which already provided promising results. Therefore,
the application possibilities of ground tuff ash is studied extensively. The complete replacement of
quartz powder by GTA could be achieved without any problems, with the final AAC material still
exhibiting relatively good strength. Moreover, the density (both raw and specific), porosity and
thermal conductivity are not or hardly affected, i.e. the maximum differences are below 10%. The
drying shrinkage is even improved by the GTA, although the requirement is not met. Thus, replacing
quartz powder by a material which can simply be mined from the Earth and with a milling process as
only processing step, still provides a good performing material. Furthermore, substitution levels up to
40% are even beneficial for the performance (especially enhanced strength and drying shrinkage) of
AAC.
Trass is applied as substitution material for Portland cement. Replacement of cement by trass up to
75% was successfully achieved. Substitution levels up to 50% result in improved performance of AAC
(especially enhanced strength and drying shrinkage), while AAC with a substitution level of 75%
exhibits similar properties as the reference samples. The raw and specific density as well as the
porosity is not affected, while the thermal conductivity is slightly lowered (beneficial). Furthermore,
the drying shrinkage is significantly improved with increasing replacement level, but the requirement
is not fulfilled. In conclusion, Portland cement which is expensive and characterised by a high
environmental impact, can be replaced by a natural material which only needs to be excavated and
milled. The final AAC materials are evaluated and all perform very well. This finally results in a final
product with reduced costs and a reduced environmental impact.
In further research, the hybrid application of trass & tuff ash could be investigated: ground tuff ash as
replacement material for quartz and trass as cement replacement material, both simultaneously
incorporated in autoclaved aerated concrete.

133
Application of basalt in AAC
Basalt, a commonly available volcanic rock material, is used as a substitution material (powder form)
for quartz powder. Within the AAC matrix, basalt serves as an inert filler. The basalt has a lower
water demand compared to the quartz powder. AAC where the quartz is completely replaced by
basalt can be successfully produced, although the final material does not perform well (especially
poor strength and too high density). Substitution levels up to 80% can be regarded as successful, for
which 60% is the optimal substitution level. This substitution level provides enhanced performance
of AAC, especially greatly improved strength and drying shrinkage while the raw density only
increased moderately. Furthermore, the specific density, the porosity and the thermal conductivity
are hardly affected by the basalt. On the other hand, the raw density is increased due to the reduced
water contents in the mix designs. As last, the drying shrinkage is greatly improved by the
incorporation of basalt (up to two times better), even so that the requirements could be met (at
replacement levels 60 and 80%).
Application of copper slag in AAC
Copper slag partially replaces the quartz powder in AAC, where it serves as an inert filler. Although
the evaluation of the application of Cu slag in AAC could only be performed limitedly (only two
samples), it is concluded that the slag behaves similar as the basalt in AAC. The copper slag samples
exhibited great strength while the other properties are less affected. The raw density increases due
to reduced water content, while the specific density decreases due to the copper slag. Therefore,
probably the porosity will decrease and the thermal conductivity will increase with increasing
substitution levels. However, the differences are rather small compared to the improvements in
strength. Finally, the incorporation of Cu slag results in a significant improved drying shrinkage, but
the requirements could not be fulfilled. Although this study was limited, it seems that copper slag is a
very promising alternative material to be applied in AAC.
Application of granite in AAC
Granite is a well-known, commonly available rock material milled to a fine powder. The powder is
applied as a replacement material for quartz powder. Within the AAC matrix, part of the granite
grains serve as inert but strong fillers, while the quartz present reacts. Therefore, the granite shows
similar behaviour as basalt and copper slag in AAC. First of all, the granite has a lower water demand
compared to the quartz. The quartz can be completely replaced by granite and the resulting AAC
material exhibits still good properties which are similar to those of reference. Moreover, AAC
produced with a substitution level of 80% is the best performing material as observed through the
entire research. This material roughly showed a raw density of 500 kg/m³, compressive strength of 5
MPa, a porosity of 80% and a thermal conductivity of 0.10 W/m∙K. Unfortunately, the drying
shrinkage of the granite samples could not be determined due to a lack of time for this project
because one measurement takes more than two months. However, it is expected that the drying
shrinkage as well significantly improves, as observed for the basalt and Cu slag because their
behaviour is very similar. Therefore, granite appears to be the most promising material of all the
alternative materials to be applied as raw material in the production of AAC.

134
Performance evaluation
Table 36 presents the optimum substitution level with the corresponding final AAC properties per
alternative material compared to the reference. This table provides an overview of the achieved
improved performances of AAC produced with the alternative materials. For tuff ash and trass, these
are not the best performances, but the major issue is that as much as possible quartz powder is
replaced by the mining residue tuff ash and as much as possible expensive and environmental
unfriendly Portland cement is replaced by trass. The optimum substitution level based on best
performance is 20% for tuff ash and 25% for trass. It should be kept in mind that the study of copper
slag is limited.
Table 36: Concluding performance evaluation.
Material
Optimum level
Reference
0%
Tuff ash
40%
Trass
50%
Basalt
60%
Cu-slag
40%
Granite
80%
Raw density [kg/m³] 459 451 454 501 483 498
Compressive
strength [N/mm²] 3.18 3.31 3.39 4.79 4.43 5.07
A-value [-] 960 1020 1031 1195 1187 1281
Specific density
[g/cm³] 2.53 2.47 2.56 2.54 2.42 2.42
Porosity [%] 81.87 81.79 82.29 80.26 80.06 79.43
Thermal conductivity
[W/m∙K] 0.083 0.080 0.083 0.091 0.083 0.095
Drying shrinkage
[mm/m] 0.74 0.62 0.58 0.36 0.52 -
135
References
[1] Deutsches Institut für Normung (DIN). (2005). Prüfverfahren für Zement – Teil 3: Bestimmung
der Erstarrungszeiten under der Raumbeständigkeit (DIN EN 196-3:2005+A1:2008).
[2] Segers, S. (2016). Literature study: Application of alternative materials in autoclaved aerated
concrete. Eindhoven University of Technology.
[3] Schober, G.(2011). Porosity in autoclaved aerated concrete (AAC): A review on pore structure,
types of porosity, measurement methods and effects of porosity on properties. 5th
International Conference on Autoclaved Aerated concrete, Bydgoszcz, Poland.
[4] Straub, C. (2015). Private communication. Eindhoven University of Technology.
[5] Straub, C., Florea, M.V.A., Brouwers, H.J.H. (2014). Investigation of the spread flow of
autoclaved aerated concrete (AAC) slurries. Conference Paper: GDCh-Tagung Bauchemie, 6-8
October 2014, Kassel, Germany, pp. 220-224.
[6] Straub, C., Florea, M.V.A., Brouwers, H.J.H. (2015). Autoclaved Aerated Concrete – Mix
parameters and their influence on final properties. In H.-M. Ludwig & H.-B. Fischer (Eds.),
Conference Paper: 19. Inernationale Baustofftagung ibausil, no. 19, pp. 2822-2829. Weimar,
Germany: F.A. Finger-Institut für Baustoffkunde.
[7] Straub, C., Florea, M.V.A., Brouwers, H.J.H. (2015). The application of recycling glass by-
products in AAC. Oral: Jahrestagung 2015 “Aufbereitung und Recycling”, Freiburg, Germany:
Gesellschaft für Verfahrenstechnik UVR-FIA e.V.
[8] Straub, C., Quercia Bianchi, G., Florea, M.V.A., Brouwers, H.J.H. (2014). Slump flow of
autoclaved aerated concrete slurries. Proceedings of the 5th International Conference Non-
Traditional Cement and Concrete (NTCC2014), June 16-19 2014, Bmo, Czech Republic, pp. 273-
241.
[9] Strickler, M. (n.d.). Calorimetry. AP Chemistry Lab, retrieved from:
http://www.lexington.k12.oh.us/hs/strickler/concrete/index.php/download_file/view/280/85.
[10] Zürn, S.G. (1997). Einfluss der Sandminerale auf die Bildung von Calciumsilikathydraten (CSH-
Phasen), das Gefüge und die mechanischen Eigenschaften von Porenbetonprodukten. Berlin:
Logos-Verlag.

136
Appendix 1: Recipes
All the recipes are listed below.
Reference sample
Table 37: Reference recipe, provided by HESS AAC Systems B.V.
Name Compound Mass [kg]
Lime CaO 1.0
Cement CEM 2.4
Portlandite Ca(OH)2 0.3
Quartz SiO2 8.0
Additive Add 1 -
Additive Add 2 -
Anhydrite CaSO4 0.3
Total Solids TS 12.0
Aluminium powder Al 0.010
Water H2O 7.5
Water solid ratio W/S 0.625

137
Natural tuff ash samples
Table 38: Recipes natural tuff ash samples.
Name Compound Unit NTA1: 20% NTA2: 20% NTA3: 60%
Lime CaO kg 1.0 1.0 1.0
Cement CEM kg 2.4 2.4 2.4
Portlandite Ca(OH)2 kg 0.3 0.3 0.3
Quartz SiO2 kg 6.4 6.4 3.2
Natural tuff ash NTA kg 1.852 1.6 4.8
Anhydrite CaSO4 kg 0.3 0.3 0.3
Total Solids TS kg 12.0 12.0 12.0
Aluminium powder Al g 10.0 10.0 10.0
Water solid ratio W/S - 0.625 0.625 0.625
Water H2O kg 7.248 7.5 7.5
Each recipe differs and the recipes are characterised by the following parameters:
NTA1: NTA content 20%, moisture content of NTA included in mix design (13.6%).
NTA2: NTA content 20%, material is sieved with sieve diameter 2 mm and completely dried.
NTA3: NTA content 60%, material is sieved with sieve diameter 2 mm and completely dried.

138
Ground tuff ash samples
Table 39: Recipes ground tuff ash samples.
Name Compound Unit GTA1: 20% GTA2: 40% GTA3: 60% GTA4: 80% GTA5: 100% GTA6: 10%* GTA7: 20%*
Lime CaO kg 1.0 1.0 1.0 1.0 1.0 1.0 1.0
Cement CEM kg 2.4 2.4 2.4 2.4 2.4 2.4 2.4
Portlandite Ca(OH)2 kg 0.3 0.3 0.3 0.3 0.3 0.3 0.3
Quartz SiO2 kg 6.4 4.8 3.2 1.6 0 7.2 6.4
Ground tuff ash GTA kg 1.6 3.2 4.8 6.4 8.0 0.8 1.6
Anhydrite CaSO4 kg 0.3 0.3 0.3 0.3 0.3 0.3 0.3
Total Solids TS kg 12.0 12.0 12.0 12.0 12.0 12.0 12.0
Aluminium powder Al g 10.0 10.0 10.0 10.0 10.0 10.0 10.0
Water solid ratio W/S - 0.625 0.625 0.625 0.625 0.625 0.625 0.625
Water H2O kg 7.5 7.5 7.5 7.5 7.5 7.5 7.5
The moisture content of the ground tuff ash is neglected, as the value is very small (i.e. 0.21%). Each recipe differs and the recipes are characterised by the
following parameters:
GTA1: GTA content 20%.
GTA2: GTA content 40%.
GTA3: GTA content 60%.
GTA4: GTA content 80%.
GTA5: GTA content 100%.
GTA6: GTA content 10%. This sample is prepared with a new GTA batch.
GTA7: GTA content 20%. This sample is prepared with a new GTA batch.
The GTA6 and GTA7 sample are both produced with a new GTA batch after the production of the first five samples, in order to verify the observed effects
during the evaluation of the first five samples.

139
Trass substituting quartz sample
Table 40: Recipe trass substituting quartz sample.
Name Compound Unit TrQ1: 20%
Lime CaO kg 1.0
Cement CEM kg 2.4
Portlandite Ca(OH)2 kg 0.3
Quartz SiO2 kg 6.4
Trass Tr kg 1.65
Anhydrite CaSO4 kg 0.3
Total Solids TS kg 12.0
Aluminium powder Al g 10.0
Water solid ratio W/S - 0.625
Water H2O kg 7.45
The moisture content of the trass is included in the mix design, which is 3.0%.

140
Trass substituting cement samples
Table 41: Recipes trass substituting cement samples.
Name Compound Unit TrC1: 25% TrC2: 40% TrC3: 50% TrC4: 60% TrC5: 75%
Lime CaO kg 1.0 1.0 1.0 1.0 1.0
Cement CEM kg 1.8 1.44 1.2 0.96 0.6
Trass Tr kg 0.618 0.99 1.235 1.48 1.855
Portlandite Ca(OH)2 kg 0.3 0.3 0.3 0.3 0.3
Quartz SiO2 kg 8.0 8.0 8.0 8.0 8.0
Anhydrite CaSO4 kg 0.3 0.3 0.3 0.3 0.3
Total Solids TS kg 12.0 12.0 12.0 12.0 12.0
Aluminium powder Al g 10.0 10.0 10.0 10.0 10.0
Water solid ratio W/S - 0.625 0.625 0.625 0.625 0.625
Water H2O kg 7.481 7.470 7.465 7.460 7.445
The moisture content of the trass is included in the mix design, which is 3.0%. Each recipe differs and the recipes are characterised by the following
parameters:
TrC1: Trass content 25% replacing cement.
TrC2: Trass content 40% replacing cement.
TrC3: Trass content 50% replacing cement.
TrC4: Trass content 60% replacing cement.
TrC5: Trass content 75% replacing cement.

141
Basalt samples
Table 42: Recipes basalt samples.
Name Compound Unit Basalt1: 10% Basalt2: 20% Basalt3: 40% Basalt4: 40% Basalt5: 60% Basalt6: 80% Basalt7: 97.5%*
Lime CaO kg 1.0 1.0 1.0 1.0 1.0 1.0 0.5
Cement CEM kg 2.4 2.4 2.4 2.4 2.4 2.4 1.2
Basalt Bas kg 0.8 1.6 3.2 3.2 4.8 6.4 3.9
Portlandite Ca(OH)2 kg 0.3 0.3 0.3 0.3 0.3 0.3 0.15
Quartz SiO2 kg 7.2 6.4 4.8 4.8 3.2 1.6 0.1
Anhydrite CaSO4 kg 0.3 0.3 0.3 0.3 0.3 0.3 0.15
Total Solids TS kg 12.0 12.0 12.0 12.0 12.0 12.0 6.0
Aluminium powder Al g 10.0 10.0 10.0 10.0 10.0 10.0 5.0
Water solid ratio W/S - 0.625 0.625 0.600 0.550 0.500 0.475 0.450
Water H2O kg 7.5 7.5 7.2 6.6 6.0 5.7 2.7
The moisture content of the basalt is neglected. Each recipe is characterised by a different substitution level (quartz-basalt) and a different water to solid
ratio (basalt has a lower water demand):
Basalt 1: Basalt content 10%, reference W/S ratio.
Basalt 2: Basalt content 20%, reference W/S ratio.
Basalt 3: Basalt content 40%, W/S ratio 0.600.
Basalt 4: Basalt content 40%, W/S ratio 0.550.
Basalt 5: Basalt content 60%, W/S ratio 0.500.
Basalt 6: Basalt content 80%, W/S ratio 0.475.
Basalt 7: Basalt content 97.5%, W/S ratio 0.450.
*The aim of the basalt version 7 sample was to completely replace the quartz powder by basalt. However, only 3.9 kg of basalt was left at the time.
Therefore, it was decided to use only half the amount of the raw materials (total solids: 6 kg instead of 12 kg) due to the limited availability of the basalt,
which requires 4 kg of basalt for complete replacement. Thus, the substitution level of this sample is 3.9 kg divided by 4 kg, or 97.5%.

142
Copper slag samples
Table 43: Recipes copper slag samples.
Name Compound Unit CuS 1: 20% CuS 2: 40% CuS 3: 60%* CuS 4: 80%* CuS 5: 100%*
Lime CaO kg 1.0 1.0
-
Cement CEM kg 2.4 2.4
Copper slag CuS kg 1.6 3.2
Portlandite Ca(OH)2 kg 0.3 0.3
Quartz SiO2 kg 6.4 4.8
Anhydrite CaSO4 kg 0.3 0.3
Total Solids TS kg 12.0 12.0 -
Aluminium powder Al g 10.0 10.0
Water solid ratio W/S - 0.625 0.575 0.625 0.625 0.625
Water H2O kg 7.5 6.9 -
The milled copper slag is assumed to be dry, so the moisture content of the material has not to be taken into account. The mix designs are characterised by
the following parameters:
Copper slag 1: Cu slag content 20%, reference W/S ratio.
Copper slag 2: Cu slag content 40%, W/S ratio 0.575.
Due to the limited availability of the slag, only two full-scale samples could be produced. With the remaining copper slag, three small test samples with
substitution levels 60%, 80% and 100% are prepared in self-made small moulds. These samples have the reference W/S ratio of 0.625. The dimensions of the
samples are roughly 15 by 8 by 10 cm³. The produced samples are only used for micro-structural analysis, as well as for specific density measurements, as
these measurements require a small amount of material. The reference W/S ratio is chosen for these sample, because this parameter has a minor influence
on the specific density and microstructure.

143
Granite samples
Table 44: Recipes granite samples.
Name Compound Unit Gra1: 10% Gra2: 20% Gra3: 40% Gra4: 40% Gra5: 60% Gra6: 80% Gra7: 100%
Lime CaO kg 1.0 1.0 1.0 1.0 1.0 1.0 1.0
Cement CEM kg 2.4 2.4 2.4 2.4 2.4 2.4 2.4
Granite Gra kg 0.8 1.6 3.2 3.2 4.8 6.4 8.0
Portlandite Ca(OH)2 kg 0.3 0.3 0.3 0.3 0.3 0.3 0.3
Quartz SiO2 kg 7.2 6.4 4.8 4.8 3.2 1.6 0
Anhydrite CaSO4 kg 0.3 0.3 0.3 0.3 0.3 0.3 0.3
Total Solids TS kg 12.0 12.0 12.0 12.0 12.0 12.0 12.0
Aluminium powder Al g 10.0 10.0 10.0 10.0 10.0 10.0 10.0
Water solid ratio W/S - 0.625 0.625 0.625 0.575 0.550 0.525 0.500 0.516
Water H2O kg 7.5 7.5 7.5 6.9 6.6 6.3 6.0 + 0.196
The moisture content of the granite is zero. Each recipe is characterised by a different W/S ratio and a different substitution level:
Granite 1: Granite content 10%, reference W/S ratio.
Granite 2: Granite content 20%, reference W/S ratio.
Granite 3: Granite content 40%, reference W/S ratio.
Granite 4: Granite content 40%, W/S ratio 0.575.
Granite 5: Granite content 60%, W/S ratio 0.550.
Granite 6: Granite content 80%, W/S ratio 0.525.
Granite 7: Granite content 100%, W/S ratio 0.516 (originally 0.500). During the production of the AAC sample, the water content is adjusted in situ
by adding a known amount of water in order to obtain a mixture with an acceptable workability and corresponding slump flow.

Literature study
Application of alternative raw materials in autoclaved
aerated concrete 7SS37 Graduation project
Student: S. Segers (Sven) Supervisors:
ID no. 0927813 Dipl.-Min. C. Straub (Chris)
Academic year: 2015-2016 dr. Dipl. Ing. M.V.A. Florea (Miruna)
7SS37 Graduation project Prof. Dr. Ir. H.J.H. Brouwers (Jos)

2
Table of contents
List of figures ........................................................................................................................................ 4
List of tables .......................................................................................................................................... 4
List of symbols and abbreviations ................................................................................................... 6
List of chemical compounds .............................................................................................................. 7
List of cement notations ..................................................................................................................... 7
1. Introduction.................................................................................................................................. 8
1.1. Background .............................................................................................................................. 8
1.2. Outline of the research............................................................................................................ 9
1.3. Problem statement ................................................................................................................ 10
1.4. Coordination .......................................................................................................................... 13
2. Autoclaved aerated concrete................................................................................................... 14
2.1. Introduction ........................................................................................................................... 14
2.2. Production process ................................................................................................................ 14
2.2.1. Raw material preparation ............................................................................................. 16
2.2.2. Mixing ............................................................................................................................ 16
2.2.3. Casting and rising/setting .............................................................................................. 17
2.2.4. Cutting ........................................................................................................................... 17
2.2.5. Autoclaving .................................................................................................................... 18
2.3. Reaction processes ................................................................................................................ 18
2.3.1. Reaction processes green body ..................................................................................... 18
2.3.2. Reaction processes and phase formations during autoclaving ..................................... 19
2.4. Structure ................................................................................................................................ 21
2.5. Properties .............................................................................................................................. 25
2.5.1. Physical properties: density........................................................................................... 25
2.5.2. Mechanical properties: strength ................................................................................... 26
2.5.3. Functional properties: thermal conductivity and drying shrinkage .............................. 27
2.5.4. Other properties ............................................................................................................ 29
2.5.5. Environmental aspects .................................................................................................. 29
3. Applying alternative raw materials in AAC .......................................................................... 31
3.1. Previous research at the TUE ................................................................................................ 31
3.1.1. Boesten – Influence of alternative raw materials on AAC ............................................ 31
3.1.2. Straub – Development of eco AAC ................................................................................ 32

3
3.2. Cement substitution .............................................................................................................. 33
3.3. Replacement materials in AAC .............................................................................................. 36
3.3.1. Introduction ................................................................................................................... 36
3.3.2. Characterisation framework for alternative raw materials .......................................... 37
3.3.3. Alternative raw materials .............................................................................................. 38
4. Studied alternative raw materials ......................................................................................... 52
4.1. Introduction ........................................................................................................................... 52
4.1.1. Volcanic materials ......................................................................................................... 52
4.1.2. Natural pozzolans .......................................................................................................... 53
4.2. Trass & tuff ash ...................................................................................................................... 54
4.3. Basalt ..................................................................................................................................... 56
4.3.1. Applications of basalt .................................................................................................... 56
4.4. Copper slag ............................................................................................................................ 59
4.5. Granite ................................................................................................................................... 62
References........................................................................................................................................... 65

4
List of figures
Figure 1: Mining profile for the trass & tuff [20]. 11
Figure 2: Picture of the soil showing several layers including trass & tuff, near the Laacher See in the
Eiffel region [55]. 11
Figure 3: Mining of trass [55]. 12
Figure 4: Autoclaved aerated concrete [46]. 14
Figure 5: Production process steps for autoclaved aerated concrete. 15
Figure 6: The production process [30]. 15
Figure 7: Simplified overview of the production process. 15
Figure 8: The cutting wires [24]. 17
Figure 9: The autoclave [24]. 18
Figure 10: Time dependence of peak intensities for the major phases during autoclaving, determined
by an in situ x-ray diffraction for the hydrothermal reactions [29]. 21
Figure 11: Schematic representation of the layered structure in tobermorite. 22
Figure 12: Structure model of tobermorite. 22
Figure 13: Simplified visualisation of the tobermorite structure. 22
Figure 14: Tobermorite structures: a) Needle-like form (high C/S ratio), b) and c) Plate-like form
(moderate C/S ratio), d) Crumbled/foiled tobermorite (moderate C/S ratio) and e) Grass-like
structure of CSH gel (low C/S ratio). 23
Figure 15: The micro-pores and macro-pores within the AAC structure. 24
Figure 16: Volume fractions in AAC of the pore types and solids in function of the apparent density
[46]. 24
Figure 17: Compressive strength, expressed in percentages, in function of the moisture content [22].
26
Figure 18: Plot of the relationship between the apparent density and the compressive strength [38].
26
Figure 19: Principle of transmission of forces in normal concrete (left) and autoclaved aerated
concrete (middle/right). 27
Figure 20: Correlation between apparent density (dry density) and thermal conductivity [62]. 28
Figure 21: Overview of raw materials for manufacturing process of autoclaved aerated concrete. 37
Figure 22: Location of the Eifel in Germany. 53
Figure 23: Possible classification of natural pozzolans. 54
Figure 24: Production process of stone wool using basalt. 59
List of tables
Table 1: Raw material costs according to [54]. 16
Table 2: ρ -classes (density) of autoclaved aerated concrete according to the European standards. 25
Table 3: f-classes (compressive strength) of autoclaved aerated concrete according to the European
standards. 27
Table 4: Quality classes of AAC blocks according to the European standards. 27
Table 5: Quality classes of AAC reinforced elements according to the European standards. 27
Table 6: Thermal conductivity of AAC, in function of the density. 28
Table 7: Water absorption in function of the apparent density. 29

5
Table 8: Characterisation framework for alternative raw materials. 38
Table 9: Operational envelope for pulverised fuel ash. 42
Table 10: Approximate oxide composition for trass and tuff ash according to different sources. 55

6
List of symbols and abbreviations
AAC Autoclaved aerated concrete ACC Autoclaved cellular concrete ALC Autoclaved lightweight concrete BA Bottom ash BFS Blast furnace slag CBA Coal bottom ash CFBC Circulating fluidised bed combustion CKD Cement kiln dust FA Fly ash GGBFS Ground granulated blast furnace slag HE Hydroxyl-ellestadite HVAC Heating, ventilation and air-conditioning ISSA Incinerated sewage sludge ash KA Katoite MD Marble dust MK Metakaolin MS Mono-sulphate MSWI Municipal solid waste incineration MSWIFA Municipal solid waste incineration fly ash NOx Nitrogen oxides OPC Ordinary Portland cement PC Portland cement PCC Pulverised coal combustion PFA Pulverised fuel ash PSA Paper sludge ash PSD Particle size distribution PVC Polyvinyl chloride RCF Recycled concrete fines RHA Rice husk ash PSFA Paper-sludge fly ash SEM Scanning electron microscope SF Silica fume TG/DTA Thermogravimetric/Differential thermal analysis WA Wood ash W/S Water to solid ratio XRD X-ray diffraction XRF X-ray fluorescence

7
List of chemical compounds
Component Chemical name Mineral name
Al2O3 Aluminium oxide Alumina CaO Calcium oxide Lime Ca(OH)2 Calcium hydroxide Portlandite, slaked lime Ca4Si6O17(H2O)2·(Ca∙3H2O) Calcium silicate hydrate Tobermorite CaSO4 Calcium sulphate Anhydrite CaSO4∙2H2O Calcium sulphate di-hydrate Gypsum C2H2 Acetylene - Fe2O3 Iron oxide Hematite SiO2 Silicon dioxide Silica, quartz SO3 Sulphur trioxide -
List of cement notations
Cement notation Actual formula Name
A Al2O3 Aluminium oxide or alumina C CaO Calcium oxide or lime F Fe2O3 Iron oxide or hematite H H2O Water S SiO2 Silicon dioxide or silica
�� SO3 Sulphur trioxide
C3S 3 CaO ∙ SiO2 Tri-calcium silicate or alite C2S 2 CaO ∙ SiO2 Di-calcium silicate or belite C3A 3 CaO ∙ Al2O3 Tri-calcium aluminate or aluminate C4AF 4 CaO ∙ Al2O3 ∙ Fe2O3 Tetra-calcium alumina ferrite or ferrite
C-A-S-H CaO ∙ Al2O3 ∙ SiO2 ∙ H2O Calcium aluminate silicate hydrate CH Ca(OH)2 Calcium hydroxide, portlandite or slaked lime C-S-H x CaO ∙ SiO2 ∙ y H2O Calcium silicate hydrate C5S6H5 Ca4Si6O17(H2O)2·(Ca∙3H2O) Tobermorite AFt or C3A��3H30-32 3 CaO ∙ Al2O3 ∙ 3 SO3 ∙ 30 H2O Calcium tri-sulphoaluminate hydrate or ettringite C3AH6 3 CaO ∙ Al2O3 ∙ 6 H2O Calcium aluminate hydrate or hydrogarnet

8
1. Introduction
1.1. Background
Autoclaved aerated concrete (AAC) is an inorganic porous building material which floats in water.
Autoclaving is used in order to greatly improve the strength of the material. The main binding phase
of the material is tobermorite (calcium silicate hydrate). AAC is a lightweight and low-energy
material, providing good structural, insulating, workability, fire- and mould-resisting properties. In
cement and concrete, application of many different secondary or replacement materials have found
their way, and a lot of research regarding this topic has been conducted. On the contrary, few
researches are dedicated to investigate the feasibility and application possibilities of alternative raw
materials in autoclaved aerated concrete. Moreover, only limited changes in the composition of AAC
are applicable without huge research effort. Secondary raw materials have the advantage that they
are likely less expensive than primary raw materials and that they may reduce the environmental
impact (CO2 footprint) of the final product, and/or that an useful application is provided for these
often unused or landfilled materials (waste materials, industrial by-products).
The production of Portland cement is characterised by a high environmental impact and large CO2-
emission, indicated by a high embodied energy. In addition, the manufacturing of cement consumes
a considerable amount of raw materials. Approximately 0.8 tonnes of CO2 is launched into the
atmosphere with the production of one tonne of cement. The cement industry accounts for 5 to 8%
of the worldwide CO2 emission. Not only the CO2 emission is a serious issue, but also the release of
SO3 and NOx which can cause the greenhouse effect and acid rain. Thus, the cement manufacturing
industry is one of the most energy intensive activities of the world. However, cement is also the basis
of most modern constructions through its use in concrete [60].
The cement and concrete industry needs to improve the energy efficiency and find appropriate
quantities of raw materials for the manufacturing of cement. Improvements in energy efficiency have
done much to reduce the environmental impact of cement production. However, supplies of raw
materials, i.e. lime, sand and aggregates are limited. In order to reduce the environmental impact of
the cement and concrete industries, which is incurred particularly through the production of Portland
cement, cementitious materials can be applied to substitute partly or completely the cement [60].
Substituting part of or completely the Portland cement in AAC would lead to a strong reduced
environmental impact of the final product, although the material already is considered as a green
building material.
On the other hand, several waste materials, natural residual materials and industrial by-products do
not serve a purpose or have little to no possible applications. Consequently, they are disposed or
landfilled, which implies high costs and damage to the environment. It is essential that new
applications possibilities for these materials are investigated and will be found, in order to recycle/re-
use these alternative materials. These materials are usually available in large quantities. Secondary
raw materials have an additional advantage that they are less expensive than primary raw materials.
Furthermore, several of these materials can also contain hazardous components, which can be
immobilised in the autoclaved aerated concrete. The silica source material (usually quartz powder) is
the main component in the mix design, as its quantity is the largest. The dissolved quartz together
with the calcium component serves as binder material, while the residual quartz grains serve as filler.
The presence of silica can be obtained from an extended range of alternative materials. Thus, there is

9
the potential to process a significant quantity of waste materials or by-products in mass. Moreover,
this indicates the importance of researches like this towards sustainable development.
1.2. Outline of the research
The research project focuses on incorporating different alternative raw materials (waste materials or
industrial by-products) in autoclaved aerated concrete. Requirements for these materials are
availability, chemical and phase composition, other possible applications, costs and environmental
footprint. Suitable replacement materials are recycled waste materials, landfill materials, several
natural and artificial ashes and already mined natural rocks as mining residues. These alternative
materials can substitute different raw materials in the mixture, such as the Portland cement or the
silica source material.
During the project, the partly or complete replacement by several secondary materials will be
investigated and tested. Not only the influence of the replacement materials on the final product
(properties and characteristics) shall be explored, but also the influence on the green body properties
shall be identified. The experimental study aims to develop a sustainable and cheaper AAC product
incorporating secondary raw materials, providing an application possibility for unused waste
materials.
In this present research, the main focus is on several natural (volcanic) materials and industrial by-
products:
Trass: volcanic tuff from the Eiffel region, Germany
Tuff: consolidated rock material from volcanic ash, also originating from the Eiffel region
Basalt: volcanic rock material deriving from basaltic lava, basalt in this project originates from
the Eiffel region
Copper slag: by-product (slag) of copper production
Granite: granite rocks grinded to a fine powder
The volcanic materials trass and basalt are well-known, since the Romans already used it in their
buildings as Roman cement (Roman tuff) and building stones respectively. Granite is as well a famous
rock material, while copper slag is a well-known industrial by-product. More background information
regarding these materials and the attributed problem will be provided in the next part. The materials
already have been characterised by a series of experiments, such as the chemical composition and
density. The tuff ash is investigated in two different forms: in its natural form and its ground form.
As first, a literature study concerning several topics will be conducted. These topics include:
Information regarding the material autoclaved aerated concrete, its production process, the
involved chemical reactions, its structure and its properties is given in the first part.
The second part focuses on applying alternative raw materials in AAC. First, a short
introduction about previous performed research at the TU/e is given. Secondly, an overview
of cementitious substitution materials is provided, which possibly can be extended to
autoclaved aerated concrete. As last, an overview of conducted research regarding the
application of replacement materials in AAC is given.

10
The third and last part concentrates on the different alternative raw materials, as these
materials have the main attention during this research project. Background information such
as their origin and properties is presented, as well as their actual applications.
1.3. Problem statement
Trass & tuff
In general, tuff is defined as a consolidated rock material consisting out of volcanic ash. The ash is
ejected from a vent during a volcanic eruption, which then is deposed and compacted into a solid
rock material. Furthermore, pumice is a volcanic glassy rock material which has a very vesicular
texture, and is usually light coloured [26].
Trass and tuff ash are two natural volcanic materials, mined in the Eiffel region in Germany. Trass is a
finely mild tuff rock, which was formed 13 000 years ago during powerful volcano eruptions in the
Vordereifel, Germany. Moreover, trass is classified as a pozzolan and its main components are silica
and alumina, but contains as well a considerable amount of alkalis. Tuff ash can basically be regarded
as unconsolidated trass. The tuff ash layer and the trass layer are separated by the ground water
table [64].
Trass already has several applications possibilities and is usually used for production of trass-cement,
i.e. trass is blended with cement as a pozzolanic additive. Trass has the advantage of enhancing the
properties of mortar, such as increasing the resistance of binders against chemical attacks and
decreasing the water permeability. Therefore, the material was being used over 2000 years ago in
binder materials by the Romans [64]. On the contrary, there is not yet an useful application for tuff
ash.
However, the problem is that to mine the trass, the tuff ash must be first mined as the trass lies
deeper within the earth with the tuff ash layer on top of it. Figure 1 presents the mining profile for
the trass & tuff near the Laacher See in the Eiffel region, Germany. In Figure 1, Mutterboden stands
for the soil or upper layer, Bims means pumice rocks, Römer tuff-Stein is the Roman tuff, Tuffashe
represents the tuff ash, Tuffstein or trass (grounded rocks), and as last, Grundwasserspiegel is the
ground water layer. The depths and heights of each layer are indicated in the profile. As can be seen,
the tuff ash layer is on top of the trass layer. As the tuff ash does not have a major application and is
not used, a problem obviously occur.

11
Figure 1: Mining profile for the trass & tuff [26].
Figure 2 shows a real time picture of the trass & tuff layers, similar to the mining profile in Figure 1.
As last, the mining and grinding of the trass is shown in Figure 3 [71].
Figure 2: Picture of the soil showing several layers including trass & tuff, near the Laacher See in the Eiffel region [71].
Tuff ash
Trass
Upper layer, soil,
pumice
Roman tuff layer
Tuff ash layer
Similar to ground water
level: trass layer

12
Figure 3: Mining of trass [71].
Basalt
Basalt is a volcanic rock material, which arises when basaltic lava (ejected on the Earth surface)
rapidly cools down and consolidates into a volcanic rock material [7]. The basalt used in this research
originates from the Eiffel region in Germany. More information regarding basalt will be provided in
Chapter 4. Basalt is a commonly available material, which may be suitable for being utilised in AAC. In
order to be able to enlarge the availability of raw materials for the production of AAC, basalt is
investigated as possible raw material for AAC. In this way, a possible new raw material for the
production of AAC can be found.
Basalt was mostly used in groundwork (e.g. tiles, pavements), statues, dikes and quay walls.
However, nowadays basalt is less and less used for these applications and is replaced by other
construction materials. Basalt is today mainly used for the production of stone wool (commercial
name: Rockwool). Additionally, basalt in a fibrous form can be used as fibres in construction
materials such as concrete and autoclaved aerated concrete. The supplier of the basalt for this
project uses finely milled basalt as ground additive. More information regarding the applications of
basalt will be described in Chapter 4.
Copper slag
Copper slag or Cu-slag is a by-product of the pyro-metallurgical production of copper from copper
ores. Copper ore found in Germany (for this research), but as well is Belgium and Poland, is mined
and used for the production of copper. Copper is retrieved from the ore, leaving behind the copper
slag. The residual slag is a hard and inert material characterized by its intrinsic properties, and the
large copper slag stones are stockpiled and landfilled. The common management options for copper
slag are recovery of metals and the production of value-added products such as abrasive tools,
roofing granules, cutting tools, tiles, glass, road-base construction, railroad ballast, asphalt
pavements, dikes and beach groynes. The application of the material in cement and concrete is
already extensively investigated, and the slag is used in the cement clinker production, as substitute
material for cement and as fine and coarse aggregates [61]. Cu-slag can possibly serve as an inert
filler partially replacing quartz.

13
Figure 4: Copper slag stone.
Granite
Granite is a hard, light-coloured, coarse-grained, crystalline, intrusive igneous (solidified magma/lava)
rock essentially composed of quartz, alkali feldspar and mica. Granite can be formed through several
processes: partial melting of old continental crust, in situ replacement of continental crust on a local
scale (granitisation), fractional crystallisation of basalt magma, or a combination of these processes.
Granite is a well-known rock material, the ancient Egyptians and the Romans already used granite in
their time. In modern times, since the development of industrialised cutting and polishing methods,
granite is mainly used for ashlar works such as funerary monuments in cemeteries [7].
The granite processing industry (cutting and polishing) produces vast amounts of granite rock waste
(coarse grains) and granite dust (fine powder), which in many cases are disposed in landfills [21].
1.4. Coordination
The supervisors for this graduation project are Dipl.-Min. C. Straub (PhD candidate), Dr. Dipl. Ing.
M.V.A. Florea and Prof. Dr. Ir. H.J.H. Brouwers, from the University of Technology Eindhoven. The
industrial partner for this project is HESS AAC Systems B.V, located in Enschede, the Netherlands.
This company produces equipment and machinery for the production of autoclaved aerated
concrete, even complete production lines are designed and developed. Besides this, the company
also has its own laboratory facilities, where research concerning AAC is performed. The research is
based on a special AAC-recipe, specifically developed for laboratory-scale approaches, provided by
HESS AAC systems B.V.

14
2. Autoclaved aerated concrete
2.1. Introduction
Autoclaved aerated concrete (Figure 5), also called Aircrete, autoclaved cellular concrete (ACC),
autoclaved lightweight concrete (ALC), Hebel Block and Ytong, was first produced in Sweden in 1924
by Johan Axel Eriksson. AAC is known as an inorganic porous building material with a light weight.
Nowadays, the material is produced by mixing a source of finely divided reactive silica (usually quartz
powder or pulverised fuel ash) and water with a binder, which is generally lime and cement, and then
adding an aeration agent, usually aluminium powder. The raw materials are thoroughly mixed at high
speed and poured into a mould. The reaction of the aluminium powder (see 2.3.1. Chemical
reactions green body) produces hydrogen gas, which forms bubbles that leave the material and leave
behind air-entrained pores, which also cause the mix in the mould to rise. At the same time, the
binder causes a ‘green’ set to occur. The mixture is then held at an appropriate temperature until the
green set is strong enough for the ‘cake’ to be de-moulded. Next, the cake is cut to the desired shape
using wire saws. Finally, the cake is placed in an autoclave at steam pressures above 11 atmospheres
for about 8 hours, in order to greatly improve the strength of the material [53]. Under the high
pressure and temperature, the C-S-H gel is converted into tobermorite which is the main binding
phase of the material. The complete production process is explained in more detail in Paragraph 2.2.
Figure 5: Autoclaved aerated concrete [59].
Thus, autoclaved aerated concrete mainly consists of air,
characterising the material and its properties. AAC is a
lightweight and low-energy building material, providing good
structural, insulating, workability, fire- and mould-resisting
properties, and is used to make blocks, panels and reinforced
products. The material exhibits excellent properties, which is
explained in more detail in Paragraph 2.3.
Autoclaved aerated concrete requires little amounts of raw materials for its production due to the
large amount of entrapped air and therefore attributes to the preservation of natural resources.
Furthermore, the production process requires little energy: 200 to 300 kW/h is sufficient to produce
1 m³ of AAC, which is 10 times less compared to the production of bricks. During the production, no
toxic gasses are released and no water is contaminated. In conclusion, autoclaved aerated concrete is
regarded as an environmental friendly and green building material [24].
2.2. Production process
The production process of autoclaved aerated concrete consists of several stages, and generally five
different steps can be distinguished, which are listed below in Figure 6. Figure 7 provides an overview
of the production process. However, there are many variations in the process. Nevertheless, the
general principles are common [31][53].

15
Figure 6: Production process steps for autoclaved aerated concrete.
Figure 7: The production process [37].
The following scheme (Figure 8) shows an simplified overview of the production process of AAC. The
moulded mix (fresh state) is called the green cake or green body, i.e. the material before autoclaving.
Mixing Rising
Setting Cutting
Autoclaving
Raw materials Green body Autoclaved aerated
concrete
Figure 8: Simplified overview of the production process.
As previously mentioned, the manufacturing process has many degrees of freedom, including [53]:
The mix design: the quantities of the different raw materials
The reactivity of cement, lime, silica source and aluminium
The times and sequences of additions
The different temperatures (e.g. water inlet)
Autoclaving conditions
These parameters can influence different aspects of autoclaved aerated concrete [53]:
The rheology of the mix The cutting window
The rising and setting The structure of the green cake
The generation of internal pressures Final properties (e.g. strength and density)
The final characteristics and properties of AAC depend on the recipe, the chemical composition, the
particle size distribution (PSD) and the physical properties of the raw materials. The chemical
composition of each raw material is essential for the reaction during the curing period or hydration
Raw material
preparation Mixing
Casting, rising, setting
Cutting Autoclaving

16
phase. Furthermore, the methodology of preparing, pulverising and mixing of the raw materials, the
method of pore-formation, the curing and the autoclaving of the products play an important role [1].
2.2.1. Raw material preparation
The typical raw materials are quartz powder (grounded quartz sand), binder (lime and cement),
water and an aerating agent (aluminium powder). Pulverised fuel ash (PFA, fly ash) can also be used
to replace the quartz sand, as siliceous source material. The binder materials are a source of calcium
oxide or lime. Ground synthetic anhydrite (CaSO4) or gypsum (CaSO4∙2H2O) may also be added to
retard the slaking or reaction of the lime. Calcium oxide and silica can also be obtained from waste
materials or alternative raw materials [1][24][53].
The silica source can either be quartz sand or pulverised fuel ash. The choice influences the
rheological properties of the mix. The binder usually consists of both cement and quicklime. The
aerating agent is usually an aqueous suspensions of finely flaked aluminium powder. In addition,
green off-cuts and returns from the cutting step are recycled and re-used in new mixes, in order to
prevent and reduce the waste stream, and to produce a better product [1][53].
The material costs are also an important aspect in the production process. The costs of the raw
materials are listed in Table 1 [70].
Table 1: Raw material costs according to [70].
Material Mix proportion [%] Unit price [€/ton] Costs [€] Cost ratio [%]
Cement 20.0 114 0.27 50.5 Silica source 66.7 10 0.08 15.0 Lime 8.3 60 0.06 11.2 Anhydrite/gypsum 2.5 15 0.005 0.9 Return material 2.5 250 0.08 15.0 Aluminium powder 0.0833 3900 0.04 7.5
0.535 100
2.2.2. Mixing
The mix design depends on the selected raw materials and on the required/desired characteristics
and properties of the final product. All the components are accurately weighted and are released in a
pre-defined order into the mixer. A control system constantly monitors the production process,
checking the recipe and the temperature [31][53].
A mill wet-grinds the quartz sand with most of the water to a sand slurry. Water at a controlled
temperature is added to the mixing vessel, which is agitated vigorously by a high speed stirrer. The
sand slurry and any recycled off-cuts (also as a premixed slurry) are then added. Next, the binder
materials (lime, cement and anhydrite), which are stored in silos, are added to the mixer and
dispersed, starting with the cement and afterwards the lime. It is also possible to mill the anhydrite
together with the quartz sand. The aluminium powder or paste is prepared and dispersed in water,
after which the suspension is added to the mix. The mix is then poured into a mould where the cake
pre-cures [31][53].
Some of the lime will hydrate inevitably in the mixer, resulting in an increase in temperature and
some thickening of the mixture. If too much hydration at this stage occurs, the viscosity becomes

17
excessive and difficulties with pouring the mixture into the mould occur. Possible corrective actions
are the addition of extra water (which can negatively influence the green set and the strength),
lowering the temperatures, utilisation of a less reactive quicklime and substituting part of the
quicklime with cement [53].
2.2.3. Casting and rising/setting
The mould consists of four fixed sides and one detachable platform. The inner mould surfaces are
covered with de-moulding release oil before casting. When the mixture is poured in the mould, the
cake pre-cures for 2 to 3 hours in the rising area where it rises and sets, after which it is ready for
cutting [31].
During the rising and setting stage, the dissolved calcium hydroxide reacts with the aluminium
producing hydrogen gas, which forms bubbles that in turn cause the mixture to rise. The extent of
the rise determines the density of the final product. The primary control over the rise is the amount
of added aluminium, although secondary parameters such as the amount of water, the temperature
and the rheology of the mix are also important. A lower water to solid ratio results in insufficient
aeration, whereas a higher ratio leads to rupture of the voids, both resulting in an increase in density
[52]. At the same time, the ongoing slaking of the quicklime and the formation of C-S-H gel cause the
mix to thicken and set [53].
The setting time should correspond closely with the end of the reaction to form hydrogen. If the
setting is delayed, too many of the hydrogen bubbles migrate to the surface causing the green cake
to lower and even collapse is possible. On the other hand, when the setting occurs too early, the
ongoing evolution of hydrogen causes internal pressures which can cause cracks within the cake and
a consequent loss of strength [53].
The required rising and setting characteristics are achieved by matching the reaction rates of the
quicklime and aluminium, as well as by modifying the temperatures and the amount of water.
Furthermore, the rate of hydration of the lime is determined by its reactivity.
After the mix has set, the hydration of the less reactive fractions of the lime continues, as well as the
slower hydration of cement. Both processes result in a progressive stiffening and progressive
increase in temperature of the green cake. The temperature increment leads to an increasing water
vapour pressure within the hydrogen bubbles. When that pressure exceeds a critical level, it causes
cracking within the cake and resulting loss of strength [53].
2.2.4. Cutting
When the green cake is sufficiently set and has the
required consistency, the mould is removed and the
cake is ready to be cut. The cake is cut by high precision
cutting machines, which is performed by oscillating or
vibrating cutting wires (Figure 9). Surplus of materials,
i.e. off-cuts and returns, are recycled back to the mixer,
as previously mentioned. However, if the cutting is
delayed, the mix may become too hard to be cut and
Figure 9: The cutting wires [31].

18
must be scrapped. The use of lime as part of the binder leads to an increased period during which the
mix can be cut [53].
2.2.5. Autoclaving
The green body is placed in the autoclave (Figure 10), where it is heated by steam. The pressure, the
temperature and the curing time differs per manufacturer. Typically, the saturated steam pressure is
about 12 atmospheres or bars, the temperature around 190°C and the curing time is around 8 hours
[31][53].
Initially, any residual calcium oxide hydrates together with the magnesium oxide from the lime, as
well as the cement hydrates completely. The calcium and magnesium oxides that hydrate after
cutting, cause expansions of the green bodies in the autoclave. Excessive expansion causes the
material to exceed its specified dimensions and can reduce the strength through cracking of the mass
or micro-cracking of the sides between the voids, while a small expansion can be tolerated.
Therefore, it is of great importance to limit the amount of over-burned calcium and magnesium oxide
in the lime. Next, the hydrated lime reacts with the reactive silica (and alumina) to generate hydrated
calcium silicates (and aluminates) [53].
Figure 10: The autoclave [31].
An automatic autoclave control system ensures a safe and optimal autoclaving process, as well as to
achieve energy re-utilisation and steam transfer. The loading and unloading of the autoclave should
be performed in the shortest time possible, in order to optimise the autoclaving capacity. The final
autoclaved product combines a controlled low density with adequate structural properties to fulfil
many building applications [31][53].
2.3. Reaction processes
2.3.1. Reaction processes green body
A system of lime, aluminium, cement, gypsum and water is a model that represents the initial
hydration processes in the green body, the silica source material does not attribute [38]. Cement and
lime are the binder materials, while water serves as both reaction medium and reaction partner
(binder). The reactions in the green body are highly exothermic processes taking place at
atmospheric pressure during the mixing and curing phase. The two main exothermal reactions are
the hydration of the lime and the oxidation-reduction processes of the dispersed aluminium. The
exothermic reactions of quicklime (Equation 1) and aluminium (Equation 3) with water immediately

19
take place, which results in a significant temperature increase. The reaction of aluminium with water
produces the hydrogen responsible for the rising of the cake. This reaction occurs simultaneously
with the reaction of aluminium with portlandite and water to form tri-calcium aluminate (Equation 3)
[1][24]. The sulphate source material (gypsum or anhydrite) inhibits the temperature growth of the
green body, and therefore delays the initial reactions (hydration of lime), i.e. as a regulator of the
lime hydration kinetics. An addition role of the gypsum is to synthesise predominantly Fm-phases in
the form of solid solutions which are involved in the structure formation [38]. The hydration reaction
of quicklime with water is as follows [29]:
CaO + H2O → Ca(OH)2 + 15.6kcal
mol (65.5
kJ
mol)
Quicklime + Water → Portlandite + heat
Equation 1: The hydration reaction of lime with water.
In the mix, which is an aqueous solution, the formed calcium hydroxide (strong alkaline) dissolves
nearly completely in water into ions [29]:
Ca(OH)2 → 𝐶𝑎2+ + 2 𝑂𝐻−
Equation 2: Dissolution of calcium hydroxide in the aqueous solution.
Under alkaline conditions, the aluminium powder reacts as [29]:
2 Al + 3 Ca(OH)2 + 6 H2O → 3 CaO ∙ Al2O3 ∙ 6H2O + 3 H2 ↗ or
2 Al + Ca(OH)2 + 6 H2O → Ca[Al(OH)4]2 + 3 H2 ↗
Aluminium + Portlandite + Water → Tricalcium aluminate hydrate + Hydrogen
Equation 3: The reaction of aluminium with portlandite and water.
The pores or cells are created by the produced hydrogen. During the setting of the mix, the hydrogen
escapes and the cells are being filled with air.
The Portland cement consist of four main phases, i.e. tri-calcium silicate (C3S), di-calcium silicate
(C2S), tri-calcium aluminate (C3A) and tetra-calcium alumino ferrite (C4AF). The cement hydrates
relatively fast forming mainly reactive intermediate C-S-H gel, as well as other possible hydration
products such as calcium hydroxide (portlandite), ettringite, AFm & AFt phases and/or mono-
sulphate. The hydration reaction of Portland cement provides strength to the green body, so that it
does not collapse under its own weight [14] [29]. Under normal conditions, the hydration reaction of
the C3S phase leads to the formation of Ca(OH)2 and C-S-H (II). The hydration of C2S results in the
formation of C3SH2, while the hydration of C3A leads to the formation of C3A∙6H2O and C3A∙12H2O
[29].
2.3.2. Reaction processes and phase formations during autoclaving
The components in the product will react in the autoclave under the high pressure, high temperature
and high moisture content (saturated water steam). During the autoclaving, the fine siliceous
material (quartz) reacts with the calcareous material (lime) to form calcium-silicate-hydrate or C-S-H
gel which will transform into tobermorite in a later stage. In addition, cement contains both CaO as
well as SiO2. The inclusion of gypsum (or anhydrite) accelerates and enhances the formation of

20
tobermorite. In general, the reaction sequence for the formation of tobermorite is as follows: C-S-H
(I) Tobermorite [29].
The main reactions taking place during the autoclaving can be described as follows, in a simplified
way. Firstly, the cement hydration products progressively disappear and the silica source material
becomes reactive. Next, C-S-H (I) is formed, partly from the silica originating from the siliceous
material and the cement. As more silica reacts, the calcium hydroxide from the lime hydration and
cement hydration is gradually used up by the ongoing formation of C-S-H (I) gel. The calcium
hydroxide should be completely disappeared in the final product. At a later stage, tobermorite starts
to crystallise from the C-S-H gel. Moreover, the total amount of C-S-H (and quartz) decreases
gradually whereas that of tobermorite gradually increases [79]. The intermediate phase C-S-H is
poorly crystallised. Because the C-S-H phases have a very fine micro-crystal structure, they are often
regarded as gel. C-S-H (I) can generally be expressed as C0.8-1.5SH1-2. The minerals of C-S-H form fibres
and a few fine thin plates [29].
Tobermorite is a hydrated calcium silicate and is denoted as C5S6H5 in cement notation [24]. The
official chemical formula for tobermorite is Ca4Si6O17(H2O)2∙(Ca∙3H2O). Tobermorite has a C/S ratio of
0.83. There exist different types of tobermorite, but the type making up AAC is 11 A tobermorite or
1.1 nm tobermorite. There also exists 14 A (1.4 nm) tobermorite, which is denoted as C5S6H9, that
forms at room temperature but decomposes at 60°C to 1.1 nm tobermorite, as well as 9 A (0.9 nm)
tobermorite which is denoted as C5S6H0-2. For temperatures above 300°C, the 11 A tobermorite is
converted into 9 A tobermorite due to the loss of water. A lot of autoclaved building materials have
11 A tobermorite as major component. In these materials, the tobermorite exhibits a needle or plate
shape. 11 A tobermorite is a well crystallised product [29].
Besides tobermorite, small amounts of other hydrated phases will also be present in the final AAC
product, such as residual C-S-H (I) gel, anhydrite and possible hydrogarnet. Xonotlite (C6S6H) may also
appear, but is only formed in case of longer autoclave times and/or higher temperatures [79].
During the hydrothermal formation reaction of tobermorite, hydrated phases will form as
intermediate reaction products, mainly C-S-H (I) gel which has a C/S ratio in between 0.8 and 1.5. In
general, the observed intermediate phases are non-crystalline C-S-H, hydroxyl-ellestadite and
katoite. Thus, there are multiple reaction pathways for tobermorite formation: via C-S-H, via katoite
(KA) and via hydroxyl-ellestadite (HE). KA is a kind of hydrogarnet which is formed through the Al2O3
in the starting raw materials, and its chemical formula is Ca3Al2(SiO4)(OH)8, the Al ions probably
originate from mono-sulphate. HE (Ca10(SiO4)3(SO4)3(OH)2) is an intermediate phase formed with
sulphur released from mono-sulphate, and serves as calcium source. Calcium aluminate mono-
sulphate or MS is denoted as 3CaO∙Al2O3∙CaSO4∙14H2O, and derives from the reaction of lime with
gypsum/anhydrite and aluminate minerals. HE reacts with dissolved silica to form tobermorite and
anhydrite [36] [46]. The intermediate and final phases occurring during the hydrothermal formation
of AAC and its mutual relationships are indicated in Figure 11, which shows the time dependence of
the peak intensities of the major phases as a result of an in situ x-ray diffraction of the hydrothermal
reactions of AAC [36].

21
Figure 11: Time dependence of peak intensities for the major phases during autoclaving, determined by an in situ x-ray diffraction for the hydrothermal reactions [36].
The reaction speed of the cement hydration is increased under the hydrothermal conditions. The
condition which is reached after 28 days under normal conditions, is already reached after several
hours during the autoclaving. Significant differences occur in the structure of the hydrated cement
paste. While the new phases in normal hydrated cement mainly occur as gel, the phases in
hydrothermal cured cement are present as a crystalline structure, as well as the dimensions are
significantly smaller. The Portland cement consists out of 4 major phases, which react different under
hydrothermal conditions compared to normal conditions. The formed phases during the cement
hydration under hydrothermal conditions are [29]:
C3S: Ca(OH)2, C3SH2 and α-C2SH. However, due to the presence of quartz powder, changes in
the phase formation during the hydration of C3S can occur depending on the quartz content.
For higher SiO2 contents, C-S-H (I) is formed, whereas the phase C3SH2 is not formed
anymore.
C2S: α-C2SH (175°C) or γ-C2SH (200°C). In the presence of quartz powder, C-S-H (I) is formed
instead of the previous mentioned phases.
C3A: C3A∙6H2O and C3A∙12H2O (same as under normal conditions). These phases can react
with the formed calcium silicate hydrates which results in the formation of hydrogarnets.
C4AF: CFHn and C3AH6.
2.4. Structure
During the autoclaving, the siliceous material reacts with the calcareous materials, forming a
microcrystalline structure with a low specific surface. The main reaction product of AAC belongs to
the tobermorite group of calcium silicate hydrates, and is a mixture of crystalline, semi-crystalline
and near-amorphous tobermorite, i.e. a material with varying degree of crystallinity. The crystallinity
of AAC is defined as the ratio of tobermorites to amorphous calcium silicate hydrates. The only
hydrate phase present in the structure is calcium silicate. The quantity and quality of the formed
tobermorite significantly affects the strength of AAC. The tobermorites may show anomalous
behaviour, they do not show any change with age (no lattice shrinking). The tobermorite structure is
a very stable structure, and hence it is durable [8] [52]. The main minerals in AAC are tobermorite,

22
anhydrite, augite, quartz, calcite and dolomite [40]. Undissolved or partial dissolved quartz particles
serve as filler within the matrix.
The micro-capillaries in AAC are ideally plate-shaped crystals of tobermorite with a double-chain
silicate structure [8] [52]. According to Ungkoon et al., the crystal structure of tobermorite consists of
layered sheets with water molecules between the layers. It coexists within tetrahedral silicate layers
and octahedral calcium layers. The structure model consists of Ca2+ ions that are entrapped in the
protonated silicate ions, as can be seen in Figure 13 [80]. According to Gundlach, the crystal structure
of tobermorite consist of a layered grid. Each layer consists of a double layer of calcium and oxygen
ions, of which both sides are occupied by parallel rows of silicon-oxygen chains in a dreierformation.
In between the Ca-Si-O layers, water molecules and more calcium ions are built in. A simplified
schematic representation of this structure is shown in Figure 12. The distance between the layers can
be increased by the entry of water, or decreased due to the outlet of water. The official chemical
formula for tobermorite is Ca4Si6O17(H2O)2∙(Ca∙3H2O), for which the left part of the dot represents the
Ca-Si-O layers, and the right part the intermediary layers. A simplified visualisation of the
tobermorite structure is presented in Figure 14. 11 A tobermorite can contain up to 1% Al2O3. The
Al3+ ion takes the place of a Si4+ ion in the grid structure of tobermorite. In the formation of well
crystallised tobermorite, the Al2O3 serves as mineralisation agent [29].
Figure 13: Structure model of tobermorite.
Figure 14: Simplified visualisation of the tobermorite structure.
The binding phase of AAC thus consists of tobermorite and/or C-S-H phases. The tobermorite crystals
are found on the pore walls of the macro-pores. The growth rate of tobermorite during autoclaving is
Figure 12: Schematic representation of the layered structure in tobermorite.

23
partially controlled by the dissolution of silica from quartz powder (quality of the silica source), as
well as depends on the C/S ratio of the complete system (bulk composition).
Moreover, the Ca/Si ratio plays a crucial role in the formation of tobermorite. For high C/S ratios (>1),
the tobermorite appears in a needle form. For decreasing C/S ratios, the structure shifts first towards
a plate shape and later to a crumbled/foiled form. However, at low C/S ratios (<1), the formation of
tobermorite is inhibited, while at very low C/S ratios (<0.8), CSH with a grass-like structure is formed.
The typical optimum C/S ratio for the formation of tobermorite is in between 0.8 and 1.0, because
the C/S ratio of tobermorite itself is 0.83. The different appearances of tobermorite structures are
displayed in Figure 15 by means of SEM pictures [40].
Figure 15: Tobermorite structures: a) Needle-like form (high C/S ratio), b) and c) Plate-like form (moderate C/S ratio), d) Crumbled/foiled tobermorite (moderate C/S ratio) and e) Grass-like structure of CSH gel (low C/S ratio).
In general, the overall structure of autoclaved aerated concrete is determined by the presence of a
large number of very little cells. In fact, roughly 80% of the total volume consists out of these cells.
Two different types of cells are distinguished in the material structure, i.e. macro-cells and micro-
cells. The macro-cells are formed during the expansion of the mass caused by aeration, and have a
diameter in between 0.5 and 2 mm. The micro-cells with capillary dimensions are generated during
the rising of the mass spread over the solid part and appear in the walls between the macro-cells.
The macro-pores and micro-pores are highlighted in Figure 16 [41].

24
Figure 16: The micro-pores and macro-pores within the AAC structure.
The micro-pores in the matrix include several types of pores. As first, there are the spaces which
were originally filled with water and partly has become occupied by reaction products. Secondly,
there is some volume that first was occupied by quartz grains which is partly or completely turned
into pore volume due to the dissolution of quartz particles. Thirdly, all the reaction products (mainly
tobermorite) create new pore volume between the newly formed crystals. These inter particle pores
match in their sizes to the sizes of the formed crystals. As last, there is the pore volume between the
formed tobermorite crystals and the C-S-H phases. However, the major part of the matrix is
composed of tobermorite and C-S-H crystals and the corresponding pore sizes are in the range of
nanometres [59].
Thus, the structure of AAC is characterised by a solid micro-cellular matrix and macro-cells. For AAC
with a density of 500 kg/m³, the cellular distribution in volume proportion is roughly 50% of macro-
cells and 30% of capillary micro-cells. Thus, the solid mass only accounts for 20% in volume
proportion, which indicates the savings of raw materials [24][52]. These volume fractions in function
of the apparent density are shown in Figure 17 [59]. The proportion of micro-pores increases with
increasing apparent density [8].
Figure 17: Volume fractions in AAC of the pore types and solids in function of the apparent density [59].
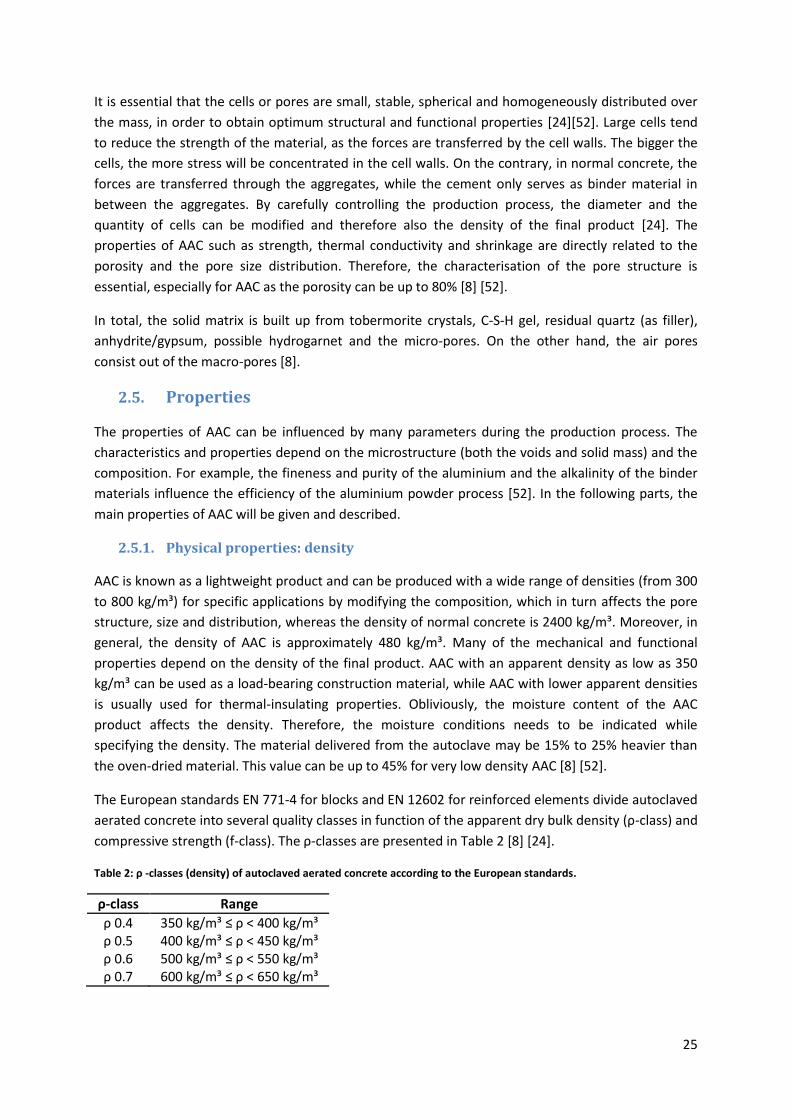
25
It is essential that the cells or pores are small, stable, spherical and homogeneously distributed over
the mass, in order to obtain optimum structural and functional properties [24][52]. Large cells tend
to reduce the strength of the material, as the forces are transferred by the cell walls. The bigger the
cells, the more stress will be concentrated in the cell walls. On the contrary, in normal concrete, the
forces are transferred through the aggregates, while the cement only serves as binder material in
between the aggregates. By carefully controlling the production process, the diameter and the
quantity of cells can be modified and therefore also the density of the final product [24]. The
properties of AAC such as strength, thermal conductivity and shrinkage are directly related to the
porosity and the pore size distribution. Therefore, the characterisation of the pore structure is
essential, especially for AAC as the porosity can be up to 80% [8] [52].
In total, the solid matrix is built up from tobermorite crystals, C-S-H gel, residual quartz (as filler),
anhydrite/gypsum, possible hydrogarnet and the micro-pores. On the other hand, the air pores
consist out of the macro-pores [8].
2.5. Properties
The properties of AAC can be influenced by many parameters during the production process. The
characteristics and properties depend on the microstructure (both the voids and solid mass) and the
composition. For example, the fineness and purity of the aluminium and the alkalinity of the binder
materials influence the efficiency of the aluminium powder process [52]. In the following parts, the
main properties of AAC will be given and described.
2.5.1. Physical properties: density
AAC is known as a lightweight product and can be produced with a wide range of densities (from 300
to 800 kg/m³) for specific applications by modifying the composition, which in turn affects the pore
structure, size and distribution, whereas the density of normal concrete is 2400 kg/m³. Moreover, in
general, the density of AAC is approximately 480 kg/m³. Many of the mechanical and functional
properties depend on the density of the final product. AAC with an apparent density as low as 350
kg/m³ can be used as a load-bearing construction material, while AAC with lower apparent densities
is usually used for thermal-insulating properties. Obliviously, the moisture content of the AAC
product affects the density. Therefore, the moisture conditions needs to be indicated while
specifying the density. The material delivered from the autoclave may be 15% to 25% heavier than
the oven-dried material. This value can be up to 45% for very low density AAC [8] [52].
The European standards EN 771-4 for blocks and EN 12602 for reinforced elements divide autoclaved
aerated concrete into several quality classes in function of the apparent dry bulk density (ρ-class) and
compressive strength (f-class). The ρ-classes are presented in Table 2 [8] [24].
Table 2: ρ -classes (density) of autoclaved aerated concrete according to the European standards.
ρ-class Range
ρ 0.4 350 kg/m³ ≤ ρ < 400 kg/m³ ρ 0.5 400 kg/m³ ≤ ρ < 450 kg/m³ ρ 0.6 500 kg/m³ ≤ ρ < 550 kg/m³ ρ 0.7 600 kg/m³ ≤ ρ < 650 kg/m³

26
2.5.2. Mechanical properties: strength
Autoclaving leads to a significant increase in compressive strength compared to non-autoclaved
products, as the high pressure and temperature results in the formation of tobermorite. The final
strength depends on the pressure and duration of the autoclaving. Besides material characteristics
(pore size distribution and microstructure), also external factors influence the mechanical strength,
such as the sample size and shape, the direction of loading and the age, as well as its moisture
content. The strength decreases with increasing moisture content, as can be seen in Figure 18.
Furthermore, the mechanical strength of AAC slightly varies depending on the direction of loading
relative to the rising direction. As the green body rises, fission occurs in the walls of the pores
resulting in tiny horizontal cracks perpendicular to the rising direction, leading to an anisotropy in
strength (and other properties). Porosity has a significant impact on the compressive strength of
building materials and also AAC. Therefore, several strength prediction relations are developed based
on the porosity. Obliviously, the strength of autoclaved aerated concrete increases as the density
increases, which can also be seen in Figure 19 [8] [52].
Figure 18: Compressive strength, expressed in percentages, in function of the moisture content [29].
Figure 19: Plot of the relationship between the apparent density and the compressive strength [47].
Autoclaved aerated concrete has significantly higher resistance against compressive forces compared
to tensile and bending forces, similar to normal concrete. As an indication, the tensile strength of

27
AAC is 12% of its compressive strength and its bending strength is 22% of the compressive strength.
Figure 20 shows the principle of transmission of forces in normal concrete (on the left side) and in
autoclave aerated concrete (middle and right side). However, it should be remarked that the
aggregates in the normal concrete normally should be touching each other. The cell walls are
responsible for the transmission of forces in AAC [8] [24].
Figure 20: Principle of transmission of forces in normal concrete (left) and autoclaved aerated concrete (middle/right).
As previously mentioned, the f-classes present the compressive strength of AAC, shown in Table 3
[24]. As can be seen, AAC is a fairly strong material, keeping in mind it mainly consists out of air.
Table 3: f-classes (compressive strength) of autoclaved aerated concrete according to the European standards.
f-class Range
f2 fc 2 N/mm² f3 fc 3 N/mm² f4 fc 4 N/mm² f5 fc 5 N/mm²
The main classes of AAC which combine the ρ-classes and the f-classes are indicated with C for blocks
and CC for reinforced elements, followed by the indication of the compressive strength and bulk
density. These quality classes are displayed in Table 4 for blocks and Table 5 for reinforced elements
[24].
Table 4: Quality classes of AAC blocks according to the European standards.
Class f-class ρ-class
C2/400 f2 ρ 0.4 C3/450 f3 ρ 0.5 C4/550 f4 ρ 0.6 C5/650 f5 ρ 0.7
Table 5: Quality classes of AAC reinforced elements according to the European standards.
Class f-class ρ-class
CC3/500 f3 400 kg/m³ ≤ ρ < 500 kg/m³ CC4/600 f4 500 kg/m³ ≤ ρ < 600 kg/m³
2.5.3. Functional properties: thermal conductivity and drying shrinkage
Thermal conductivity

28
Autoclaved aerated concrete has excellent thermal properties, both thermal insulation and thermal
inertia, providing an energy-efficient and environmental-friendly building material. The enclosed air
is responsible for the good thermal insulation of AAC. The thermal conductivity of AAC depends on
the density (Figure 21), the moisture content and the material composition. Moreover, the property
is mainly a function of the density. Furthermore, the amount of pores and their distribution also have
a significant influence on the thermal insulation, i.e. the finer the pores, the better the thermal
insulation [8] [52]. The thermal conductivity or lambda value of AAC increases as the density
increases, as can be seen in Table 6 [24].
Table 6: Thermal conductivity of AAC, in function of the density.
Density [kg/m³] Thermal conductivity [W/m∙K]
400 0.11 500 0.13 600 0.16
AAC provides good energy and thermal efficiency. AAC (wall) structures are a solid construction with
integrated thermal insulation, and the entire wall coverage prevents thermal bridges. Furthermore,
the solid AAC construction creates a closed building envelope, which reduces uncontrolled air
changes while maintaining the desired indoor temperatures and increasing the HVAC efficiency. AAC
structures have a relatively high thermal mass and low thermal conductivity, as already mentioned
[58].
Figure 21: Correlation between apparent density (dry density) and thermal conductivity [78].
Drying shrinkage
The volume of AAC changes depending on its moisture content. These changes in volume can cause
internal stresses which can result in a reduction of the load bearing capacity and can lead to crack
formation. Not the entire pore volume is accessible for water or moisture. Table 7 presents the
maximum water absorption (volume%) in function of the apparent density [29].
The volume changes related to the moisture content are due to boundary plane stresses within the
finest capillary pores, as well as the capability of certain calcium silicate hydrates to build in water in
the intermediate layers of the matrix. This also implies that the mix design has its influence on these

29
changes in volume [29]. The capillary tension theory of porous building materials for drying shrinkage
indicates that the water in the pores is in tension which results in an attractive force between the
pore walls [52].
Table 7: Water absorption in function of the apparent density.
Density [kg/m³] 400 500 600 700 800 900 1000 1100 1200
Water absorption [Vol%] 63-70 58-65 50-60 50-53 45-50 40-45 35-40 33-35 25-30
Significant loss of absorbed water in AAC leads to drying shrinkage, which is significant for AAC due
to its large porosity and high specific surface area of pores. Moreover, the drying shrinkage is
strongly related to the porosity. Higher porosities and lower pore sizes lead to increments in drying
shrinkage [8] [52]. In addition, the larger the material is (physical dimensions), the more significant
the drying shrinkage is. The autoclaving conditions, the characteristics and properties of raw
materials (especially silica source) and the mix design influence the drying shrinkage of AAC. The
drying shrinkage of AAC depends on the physical material structure rather than on its composition
[52].
The drying shrinkage is expressed as the relative length change, i.e. difference in length between two
moisture contents relative to the length of the dry material. According to the European standards,
the maximum drying shrinkage is defined as 0.5 mm/m or 0.09%. According to ASTM International,
the average drying shrinkage should not exceed 0.02%.
2.5.4. Other properties
Autoclaved aerated concrete provides good acoustical insulation and absorption qualities, besides
the good thermal insulation. The material can reduce and absorb noise, due to the large amount of
independent air cells which dampen the sound transmission [52] [58].
Autoclaved aerated concrete consists of tobermorite, a stable reaction product which provides a
durable material structure. However, its high porosity allows penetration by liquids and gasses which
can lead to damage to the matrix. Sulphate attack may be of significance as well as frost
deteriorations, and carbonation may lead to increments in density but it is not of great significance
unless exposure to CO2 is too severe. Moreover, carbonation is one of the man factors of the ageing
deterioration of AAC [8]. On the other hand, the material is termite- and mould-resistant. AAC has
also excellent fire properties, as it is fireproof and non-combustible. An important reason for the
good fire behaviour is that the material is relatively homogeneous and has a high number of solid-air
interfaces which reduces the heat transfer. Because the material is completely inert, it does not emit
toxic gasses when exposed to fire. So, the product has a good durability [8] [52] [58].
2.5.5. Environmental aspects
The influence of building materials on the environment and quality of life is an important aspect. The
ability of a product to reduce (raw) material use, to incorporate recycled products and to avoid toxic
emissions are key criteria in determining whether a product qualifies as a sustainable building
material. In general, autoclaved aerated concrete is regarded as an environmental friendly and
sustainable material, because of several reasons [24][58].

30
For the production of AAC, the following basic raw materials are used: quartz sand, lime, cement and
a very small amount of aluminium powder (±0.05%). All these raw materials are sufficiently available
and even abundant in most geographic regions, and they are used sparingly as most of the final
product consists out of air (80%). Approximately 500 kg of raw materials is sufficient to produce 1
m³ of AAC, which is roughly one thirds of the quantity required to produce other comparable building
materials. The finished product is up to 5 times the volume of the raw materials. Moreover, many of
the raw materials can be substituted by recycled materials and by-products. Thus, AAC consumes a
relatively small quantity of raw materials relative to the quantity of the final product. In this way,
natural resources are more preserved due to less required amount of raw materials [24][58].
Furthermore, the production process of AAC requires little energy: 200 to 300 kW/h is sufficient to
produce 1 m³ of AAC. About 90% of the water vapour generated during the autoclaving is being
recovered and re-used. These aspects indicate that a little amount of energy is consumed compared
to other building materials. Moreover, during the production, no toxic gasses are released and no
water is being contaminated [24].
During the production process, the surplus of materials, i.e. off-cuts and returns, from the cutting
stage are re-used as raw material in the mixing stage. AAC is being cut precisely and therefore, the
amount of waste AAC is limited. After autoclaving, a little amount of residues is grinded and re-used
in other applications. The final product is completely recyclable, i.e. surplus of AAC can be recycled
and reworked to new materials [24].

31
3. Applying alternative raw materials in AAC
A lot of researchers focused on substituting cement and aggregates in normal concrete by waste
materials, industrial by-products and natural alternative materials. On the contrary, few researches
aimed to investigate the potential of replacing the raw materials of autoclaved aerated concrete with
alternative raw materials. This chapter will give an overview of previous performed research within
the field of incorporating alternative raw materials in autoclaved aerated concrete, as well as cement
substitution. Obliviously, the main focus is on the replacement of the raw materials of AAC.
3.1. Previous research at the TUE
This research project continues to build on previous research conducted at the Eindhoven University
of Technology. There are two previously performed researches, one of which is ongoing:
Boesten, E.P.M. (2012). Influence of alternative raw materials on autoclaved aerated
concrete. Master Thesis, Eindhoven University of Technology. [14]
Straub, C. (2013-2017). Development of eco autoclaved aerated concrete. PhD Research,
Eindhoven University of Technology. (Ongoing PhD-research [72][73][74][75][76][77])
3.1.1. Boesten – Influence of alternative raw materials on AAC
The subject of the research project [14] was to investigate the possibility of the partly replacement of
the raw materials quartz and Portland cement in autoclaved aerated concrete. In this study, waste
products of other industrial processes in The Netherlands were used as additives. The used waste
materials are:
Wood ash (WA) Incinerated sewage sludge ash (ISSA) MSWI fly ash
Paper sludge ash (PSA) MSWI bottom ash (BA) Indian coal fly ash
Wood ash (WA) is a bio ash resulting from burning wood in a power plant, while paper sludge ash
(PSA) is the residue from the incineration of paper sludge coming from the paper industry.
Furthermore, incinerated sewage sludge ash (ISSA) is a reddish bio ash resulting from the
incineration of waste water sludge. MSWI stands for municipal solid waste incineration. MSWI
bottom ash (BA) is generated during the incineration of municipal solid waste to produce energy.
Moreover, the Dutch MSWI fly ash is also produced during the burning of municipal solid waste and
waste wood. As last, Indian coal fly ash is a by-product of the incineration of pulverised coal in
thermal power plants. In addition to the five Dutch waste materials, Indian coal fly ash which already
has been used in the production of AAC, was applied.
The research included the performance of tests on the mixture, during the curing (green body) and
after autoclaving (final product). The conducted tests define the composition, performance of curing
and the physical and chemical properties of the final product. To obtain the desired product, it is
crucial that the rising and setting development during the curing period are within pre-defined limits.
A well-balanced mixture is required to achieve the needed reaction rate which is controlled and
modified by changing the aluminium powder and water to solid (W/S) ratio. The experiments were
conducted with different replacement ratios for the waste materials.

32
The research indicates that an optimal mixture composition and optimal reaction rate are essential
for producing AAC with a potentially high compressive strength, when incorporating the waste
materials. Based on scanning electron microscopy, the research concludes that the influence of the
pore diameter and the homogeneity of the macro-pores formation play a key role in the
characteristics and properties of AAC. It is shown that all the waste materials resulted in a different
crystal grow at the surface of the pores.
The results indicated that paper sludge ash used as replacement material leads to the best
performance because of the highest compressive strength, low porosity and high homogeneity of the
pore distribution. The waste material can replace Portland cement up to 50% yielding similar
compressive strength with slightly higher density compared to normal AAC. MSWI bottom ash
substitution leads to a relatively moderate compressive strength, whereas wood ash substitution
results in a low compressive strength and the highest porosity. All the other used waste materials
(ISSA, MSWI fly ash and Indian fly ash) provided poor compressive strength due to the not an optimal
mix design and reaction conditions during the curing and autoclaving. ISSA substitution leads to a
specific problem, i.e. phosphates are formed during the reaction process. The colour of all the final
products with replacement materials was similar to the reference colour, except for the ISSA and
MSWI BA substitution samples (less white appearance, more reddish and greyish respectively).
In general, it could be seen that the waste material influences the quality and performance of the
AAC (strength, porosity), while it is of main importance to have a constant chemical and phase
composition and particle size distribution. The research project concludes that more substantial
research is required to optimise the mix design and processing conditions during curing and
autoclaving. The replacement of quartz by waste materials seems only relevant with respect to
sustainability. However, all the alternative raw materials have the potential to substitute quartz. The
removal of phosphate from ISSA is required prior to incorporating the material in AAC. As last, the
research recommends to use paper sludge ash at a low concentration as substitute of Portland
cement in the production of AAC, while more research is needed to optimise wood ash as a
replacement material for quartz.
3.1.2. Straub – Development of eco AAC
In the present research project, different replacement materials will be investigated that are either
everywhere and commonly available or industrial by-products with an undiscovered potential. The
research study of Boesten [14] shall be continued during this present research. Up to now, the
prediction of the influence of a new raw material is not possible. The research will not only explore
the influence of the alternative raw material on the final product, but also the influence and relation
to the fresh properties will be investigated. Scientific information about the reactions and the
material behaviour before the autoclaving is rarely available. Finally, optimisations and
developments from other field of building materials, such as improved particle packing and mix
design, will be identified and implemented [72].
The research is based on a special AAC-recipe specifically developed for lab-scale approaches. During
the research, the partly of fully replacement of raw materials by several natural materials and
industrial by-products shall be tested. The requirements for these materials are the availability,
chemical and phase composition, other (industrial) applications, costs and environmental footprint.

33
Suitable materials are recycling wastes, landfill materials, diverse natural and artificial ashes and
already mined natural rocks [72].
The first part of the research project focuses on the selection of suitable materials and their
characterisation. The influence of the selected materials on the fresh property behaviour (slurry and
green body) shall be studied, which will lead to first insights. As far as known, there are no standard
tests or requirements for the AAC slurry and green body available. Commonly used tests for cement
and gypsum slurries shall be adapted to study the relationship between the various parameters. The
most promisising compositions will be tested in a lab-scale autoclave, which is specifically designed
for AAC production under industrial-near conditions. The materials (from raw materials to the final
product) will be characterised by several techniques, e.g. XRD, XRF, PSD, SEM, TG/DTA, strength
tests, density tests, specific surface area determination, pore size distribution and others, depending
on specific questions [72].
3.2. Cement substitution
Many phases of the cement and concrete industry can affect the sustainability. Carbon dioxide (CO2)
emissions form a serious issue in the world due to the greenhouse effect. The cement and concrete
industry is responsible for the production of 7% of the total worldwide CO2 emission. The production
of Portland cement consumes a significant amount of energy, which is represented by a quite high
embodied energy. However, cement can also be replaced in part by supplementary cementing
materials. The use of alternative raw materials to substitute the cement and the design of concrete
mixes with optimum cement content are the main solution towards sustainability in the cement and
concrete industry. Research focusing on supplementary cementing materials has continuously
proven the benefits of incorporating what is often a waste product from industries into the concrete
mix design [56].
Several alternative materials are successfully used to substitute (partly) the cement. These secondary
raw materials have an influence on the characteristics and properties of the cement-based product.
Different replacement materials can also be combined to partly substitute the Portland cement.
These materials are listed below, together with a short description. This list is not complete, and only
presents the common used waste materials and industrial by-products. Waste materials such as
waste catalysts from petrochemical industries or tailings/mine waste are not included.
Coal combustion fly ash (FA) or pulverised fuel ash [56][62][63]
Fly ash (FA) is a by-product of the combustion process of pulverised coal in thermal power plants.
The dust-collection system removes the fly ash as a fine particle residue from the combustion gases
before they are released into the atmosphere.
Ground granulated blast furnace slag (GGBFS) [56][62][63]
The metallurgical industry produces many types of slag as by-product. Iron blast furnace slag (BFS) is
the main non-metallic product consisting of silicates and aluminosilicates of calcium. The material is
formed either in glassy texture used as cementitious material or in crystalline form used as
aggregate. Iron ore and coke are used in a blast furnace to produce pig iron which gathers at the
bottom of the furnace, whereas molten slag is separated on top of the molten iron. The molten slag
usually consists of silica and alumina which combine with lime and magnesia from the added

34
limestone. Ground granulated blast furnace slag (GGBFS) is obtained by quenching the molten iron
slag in water or steam to produce a glassy, granular product which is then dried and ground into a
fine powder.
Other slags such as copper slag have pozzolan properties and therefore react with lime. Steel slags
(e.g. ladle furnace slag) are usually produced as a crystalline form and are used as base materials for
road construction or as aggregate in special concrete productions. Lead slag is a waste product from
battery smelting using calcium carbonate as flux. Steel slag such as ladle furnace slag and lead slag
can also be used to replace a small part of Portland cement. The other applications of slags are in the
production of slag wool for thermal insulation and as lightweight aggregate for the manufacturing of
lightweight concrete [56].
Natural pozzolans (e.g. Trass) [56][62]
A detailed description of natural pozzolans and volcanic ashes is given in Chapter 4.
Silica fume (SF) [56][63]
Silica fume (SF) or micro-silica is produced in electric arc furnaces as a by-product of the production
of elemental silicon or alloys containing silicon, and is a very fine non-crystalline silica.
Metakaolin (MK) [56][62][63]
Metakaolin (MK) differs from the other replacement materials, as it is not a by-product of an
industrial process. Metakaolin is produced by heating kaolin, which is one of the most abundant
natural clay minerals, to a temperature of between 650 and 900 °C. Thus, it is manufactured for a
specific purpose under carefully controlled conditions, which allows to optimise the production
process in order to ensure a consistent pozzolanic material. MK is an amorphous material containing
high contents of SiO2 and Al2O3, and is highly reactive.
Rice husk ash (RHA) [56][62][63]
Rice-husk is an agricultural by-product constituting about 20% of the weight of rice. The material
contains approximately 50% cellulose, 25 to 30% lignin and 15 to 20% silica. Rice-husk ash (RHA) is
generated by burning rice-husk, during which the cellulose and lignin are removed leaving behind
silica ash. RHA is an amorphous material with a very high surface area, making the material reactive.
Limestone [56]
Finely milled limestone or calcium carbonate (CaCO3) can be blended with Portland cement as a
constituent, serving as a nucleation agent. Most Portland cement specifications allow up to 5%
limestone. Beyond that, Portland-limestone cements are categorised based on the percentage of
added limestone.
Recycled concrete fines (RCF) [25]
Concrete can be recycled and re-used by crushing it. The concrete waste is crushed to a very fine
fraction or fines, called recycled concrete fines (RCF). The crushing process separates the initial
aggregates from the hydrated cement fines. In this way, a large part of the cement paste can be

35
recovered, and the obtained aggregates are cleaned of the attached mortar which can be re-used in
concrete. Also recycled concrete sand can be obtained and re-used in concrete. The RCF can be
blended with cement and used as replacement material, serving as nucleation agent.
Municipal solid waste incineration fly ash and bottom ash (MSWI FA & BA) [25][62]
Municipal solid waste incineration (MSWI) plants incinerate municipal solid waste in order to
generate electricity and energy, whereby several residual materials are generated. The main residues
of MSWI are bottom ash and fly ash, among others. Bottom ash consists of large and heavy particles
which are removed from the bed of the incinerator, whereas fly ash consists of very fine particles
entrained in exhaust gases. Furthermore, the fly ash is more consistent in composition. Both fly ash
and bottom ash contain significant amounts of hazardous elements. MSWI fly ash and bottom ash or
MSWI FA & BA can be used as partial replacement for cement as a supplementary cementitious
material as it contains some quantities of typical cement minerals.
Paper-sludge ash (PSA) [25]
Paper sludge is a residue or waste material from the paper recycling process, mainly consisting of
50% water, 25% short fibres and 25% other minerals such as calcium oxide and clay. By incinerating
the paper sludge, minerals are activated and fly ashes with good pozzolanic properties and without
any hazardous contaminants are generated, called paper-sludge ash (PSA).
Wood ash (WA) [25] [62]
Biomass can replace coal in power plants as renewable energy source. Bio-power plants use waste
wood as fuel to produce heat in order to generate electricity. During this process, fly ashes are
produced which differ from coal combustion fly ash, referred to as wood ash (WA). WA is the
inorganic and organic residue remaining after the combustion of wood or unbleached wood fibres.
The physical and chemical properties of WA depend upon the species of wood and the incineration
method including incineration temperature, efficiency of the boiler and used supplementary fuels.
Wood ash can be used as binder, partly substituting cement due to its particle size distribution and
pozzolanic properties.
Cement kiln dust (CKD) [62]
Cement kiln dust or CKD is a by-product of cement manufacturing. It is a fine powder similar in
appearance to Portland cement. CKD consists of micro-sized particles collect from electrostatic
precipitators during the manufacturing of cement clinker. The chemical composition of CKD depends
on both the used raw materials for the production of cement clinker and the type and source of
carbon-based fuel to heat the material in the rotary kiln. Due to its cement-like properties, CKD can
be used as replacement material for Portland cement.
Incinerated sewage sludge ash (ISSA) [1][19]
Incinerated sewage sludge ash or ISSA is an inorganic ash generated during the incineration of the
residual stream of fine organic and inorganic solids (sewage sludge). This arises from municipal
waste-water treatment works. The incineration process thermally destroys the organic matter. In
functional terms, ISSA produced by a fluidised bed incinerator is a free-flowing silt/sand. It possesses

36
pozzolanic properties which make it potentially a replacement material for cement. However, the
major problem arising with ISSA is that it contains considerable amounts of phosphates and heavy
metals.
Marble dust (MD) [1]
Marble dust (MD) is a residual material generated during the cutting and polishing of large pieces of
marble rocks. From mineralogical point of view, MS is considered as limestone powder. The residue
consists for 98% out of calcium carbonate. Although MD is not a contaminant residue, the
uncontrolled dumping causes problems at local scale as it can cause environmental damages. MD can
be applied as supplementary cementitious material.
3.3. Replacement materials in AAC
3.3.1. Introduction
The replacement materials differ in chemical and physical characteristics/properties compared to the
primary raw materials, i.e. the oxide composition, density and particle size distribution is different.
The incorporation of replacement materials can affect the balance of the mix design and the reaction
rate (rising and setting). The mixture can either rise too quick or too slow, and the mixture can also
either set too fast or too slow, caused by the application of replacement materials. The two key
parameters to control the rising and setting or reaction rate are the aluminium powder content and
the water to solid ratio. Increasing the foaming agent content leads to more rising of the green body,
while reducing the water content results in an increasing hydration temperature which in turn leads
to an accelerated stiffening development. It is essential to ensure that the macro-pores formation
caused by the hydrogen generation (rising) is completed at approximately the same time as the
setting of the green body starts. Therefore, the appropriate aluminium powder content and W/S
ratio should ensure homogeneously distributed macro-pores with proper sizes [14].
Important aspects of the production process of AAC are the autoclaving time and temperature, for
which improvements are possible. If these parameters can lowered, productions costs can be
reduced. Improvements in the final properties, such as strength, of the AAC product are also
possible and desirable [14]. However, the final properties are linked to the autoclaving time and
temperature.
The research efforts of the AAC industry mainly focus on the silica source (quartz sand or pulverised
fuel ash). Cement, lime and aluminium powder are all minor AAC components in terms of mix design
quantity, for which alternative raw materials would only offer limited benefits in relation to the
perceived risk due to the small contents. An overview of the raw materials for the manufacturing
process of AAC is shown in Figure 22 [20].

37
Silica source (quartz sand or pulverised fuel ash)
Aluminium powder
Lime
Alternative raw materials
Autoclaved aerated
concrete Mix design
Portland cement
Final product
Figure 22: Overview of raw materials for manufacturing process of autoclaved aerated concrete.
It is possible to obtain silica from industrial by-products such as foundry sand or residues of glass
grinding (waste glass), instead of quartz sand. However, these secondary materials can only be used
if the levels of alkali or other impurities are not too high [31]. Commonly known alternative raw
materials in the cement and concrete industry are fly ash, blast furnace slag and metakaolin. Fly ash
and metakaolin have a comparable specific surface relative to cement. The specific surface of GGBFS
is higher compared to cement. Based on their composition and properties, these materials also have
the potential to be applied as alternative raw materials in AAC [14].
Furthermore, AAC manufacturers can incorporate a limited quantity of their own production waste
into the AAC product. The incorporation limit is about 10% in mass proportion relative to the total
aggregate content due to a loss in compressive strength associated with an increased water demand
of the mixture [20].
3.3.2. Characterisation framework for alternative raw materials
The assessment of a waste material or industrial by-product for possible application in AAC involves a
step-by-step approach. As first, initial screening of the considered material takes place. Once the
material information is completely collected, the promising materials are selected which will be
subjected to pilot scale trials [20].
Important parameters influencing the formation of C-S-H gel and tobermorite are the chemical
composition, the particle size distribution, the specific surface area and the water absorbance ability
of the raw materials. Furthermore, the reaction rate is mainly influenced by the nature and
distribution of the raw materials and the processing temperature. Thus, the substitution of primary
raw material by secondary raw materials can have an influence on the microstructural properties and
phase compositions, which needs to be investigated in research [14].
A characterisation framework will typically include the characteristics as listed in Table 8 below.
38
Table 8: Characterisation framework for alternative raw materials.
Physical condition – appearance – colour Density
Mineralogy Water absorption
Oxide composition – chemical analysis Moisture content
Particle size distribution Sulphate content
Loss on ignition Material costs
Reliability supply Availability
Contrary to bricks, colour appearance is not essential, although very dark coloured materials may not
be acceptable [20].
Obviously, for alternative silica sources, high levels of SiO2 are desirable to react with the binder
materials for strength development [20]. On the contrary, high contents of Al2O3 are not desirable, as
they can significantly reduce the strength. The introduction of Al in the form of Al2O3 significantly
influences the tobermorite formation via C-S-H and katoite pathways, but not the dissolution rate of
quartz [20] [30] [40]. Furthermore, the reactivity of the silica source and the presence of alkali
compounds strongly affect the formation of tobermorite [40].
3.3.3. Alternative raw materials
The waste materials or industrial by-products which have been reported to been incorporated in
autoclaved aerated concrete are listed below, accompanied by a brief description. These materials
can substitute either the siliceous source or the calcareous source, i.e. lime - cement or quartz sand,
depending on the chemical composition, particle size distribution, physical properties and colour.
Some researchers even investigated alternative raw materials to replace aluminium powder as
aerating agent.
Alkali activated fly ash or blast furnace slag [14] [28] [32]
Fly ash (as silica source material) can be alkali activated in the mix design. Sodium hydroxide (NaOH)
can be used to supply the needed alkali, as well as a molar equivalent Ca(OH)2 slurry. The alkali
activation reaction takes place instead of the conventional pozzolanic reaction. However, there occur
difficulties when aerating alkali containing mixtures by means of aluminium powder. A possible
solution suggested by one research is to apply cenospheres derived from fly ash to achieve a
decreased density, resulting in the production of AAC-like material without aerating agent [28].
Another research also focused on the alkali activation of fly ash as basis for an AAC-like material.
Alkali activation of fly ash together with aluminium powder as aerating agent leads to the synthesis
of an inorganic fly ash based foam, an AAC-like material without Portland cement. In comparison to
conventional AAC, the fly ash based foam retains exceptionally good fire resistance and high
chemical durability, exhibits a rather closed pore structure and requires temperatures below 80°C for
curing without the need for autoclaving. The samples exhibit bulk densities within the range of 400
to 800 kg/m³. The selected optimal mix design and its produced sample exhibited a density of 671
kg/m³, a compressive strength of 6.0 MPa and a thermal conductivity of 0.145 W/m∙K [32].
The same principles and processes can also be applied on ground granulated blast furnace slag.
Carbide slag [22]

39
The massive use of acetylene (C2H2), especially in the PVC industry, has led to the production of a
huge amount of waste carbide slag which pollutes the environment seriously. Carbide slag consists
mainly of slaked lime (Ca(OH)2) which is a by-product of the production of gaseous acetylene. Lime is
the main raw material in AAC production to provide CaO in the hydrothermal reaction. However,
large amounts of energy are required for the production of lime, during which a significant amount of
CO2 is released. Carbide slag can be used as calcareous material in AAC, thus replacing the calcium
oxide or lime [22].
The study focused on the synthesis of AAC with carbide slag addition, which completely replaces lime
in the mix design. AAC samples with carbide slag could be produced with a compressive strength of
about 2 MPa and density below 600 kg/m³. Analysis confirmed that tobermorite (thin plate-like) and
C-S-H gel were formed. The autoclaving time influences the morphology of the produced phases, as
after 18 hours the tobermorite appears in a fibrous form, whereas after 10 hours the tobermorite is
plate-shaped which provides a better strength development. The autoclaving temperature has also
an influence, it seems that higher curing temperatures favour the formation of tobermorite and C-S-
H, which also resulted in significant increase in strength development. Regarding the macro- and
micro-structure, the spherical pores were uniformly distributed in the matrix in which residual grains
of quartz serves as the framework of the matrix. The formed C-S-H gel filled the interface of the
matrix and the tobermorite appeared to grow in the internal-surfaces of the pores. The formed
tobermorite and/or C-S-H gel provides a well densified matrix [22].
Cellulose fly ash [30]
Fly ash from the cellulose industry is a fine-grained, lime- and sulphate-containing waste material.
Two types of cellulose can be identified, i.e. lime-sulphate ashes which mainly consist of free lime
and anhydrite, and Al-containing ashes containing less lime and anhydrite but considerable amounts
of low reactive calcium silicates and highly reactive calcium aluminates. Cellulose fly ash contains
considerable amounts of sulphate and free lime. Therefore, they can potentially replace the
anhydrite and lime in the production process of AAC. The research investigated AAC in which
sulphate and lime are completely replaced by cellulose fly ash. The study observed that the cellulose
fly ash as substitute for lime and anhydrite substantially influences the phase formation in AAC. For
instance, the hydrothermal reaction sequence and phase formation is retarded caused by the poorly
reactive CaCO3 and elevated alkali and sulphate contents, and increasing proportions of semi-
crystalline C-S-H are not converted into well-crystallised tobermorite. The highly reactive calcium
aluminates in Al-containing ash produce considerable amounts of hydrogarnet products (C-A-S-H).
However, at higher bulk C/S ratios, Al-bearing tobermorite occurs instead of hydrogarnet.
Furthermore, scawtite is formed at high bulk C/S ratios where poorly crystallised CaCO3 is present in
the fly ash. However, samples with higher compressive strengths could be achieved with the
application of the lime-sulphate ash compared to the reference sample. The highest compressive
strengths are obtained with lime-sulphate ash at bulk C/S ratios between 0.7 and 0.8, which is the
C/S ratio of tobermorite. At higher proportions of cellulose fly ash (high C/S), the presence of
unreacted portlandite and newly formed scawtite results in a decrement in strength and an
increment in shrinkage. By applying Al-containing fly ash with a lower amount of free lime in AAC, the
strength is significantly reduced.
Coal bottom ash [41] [85]

40
Coal bottom ash is the residue produced during the combustion of coal in thermo-electric power
plants which remains at the bottom due to its heavier solid particles. CBA has received less attention
compared to coal fly ash due to its relatively higher unburned carbon content and different structural
properties. CBA can potentially be applied as source of silica in autoclaved aerated concrete, but also
as (partial) replacement material for Portland cement [41] [85].
One study examined the application of coal bottom ash as an aggregate to produce aerated
concrete. The CBA is used as an silica source to partially replace quartz in AAC, and various
replacement levels are considered, i.e. 0, 25, 50, 75 and 100%. The objective of the study was to
determine the effect of CBA incorporation on the final product properties by performing chemical,
physical, mechanical and micro-structural analysis. It was observed that CBA has a higher water
demand compared to quartz due to its porous structure. The obtained results showed that applying
CBA in AAC caused a decrease in unit weight for all considered CBA substitution levels. However, the
study also observed that AAC containing 25% and 50% CBA had the beneficial effect of an increased
strength. The increased performance could be attributed to the enhanced pozzolanic reaction
between the reactive silica in CBA and lime leading to an increased tobermorite formation.
Furthermore, the thermal conductivity decreased with increasing CBA levels. The optimum
replacement ratio of CBA was found to be 50% based on the physical and mechanical tests [41].
Another research investigated the compressive strength, microstructure and thermal conductivity of
AAC produced with coal bottom ash (CBA) and silica fume (SF). CBA was used to replace part of
Portland cement (10-20-30%) and SF was used as an additional material relative to the total solids
(2.5-5%). The study reports that the compressive strength of CBA AAC increases when silica fume is
added. The highest compressive strength is achieved when CBA is used at a substitution level of 20%
and 5% silica fume is added, and the value is significantly higher compared to reference. The volume
of permeable voids decreases and the unit weight increases with increasing SF content in the CBA
AAC samples. The pozzolanic reaction of CBA causes an increasing formation of C-S-H. Moreover, the
filling effect and pozzolanic reaction of SF also contributes to an enhanced formation of C-S-H phases,
as well as its fine particle size and high specific surface area. However, also the thermal conductivity
slightly increased relative to the reference sample. Microstructural analysis showed that the
observed plate-shaped tobermorite in AAC containing CBA and SF provides a denser microstructure
than the fibrous-like C-S-H phases observed in the reference sample [85].
Copper tailings and blast furnace slag [34]
Copper tailings are stockpiled during the history of copper production, posing a severe threat to the
environment. Skarn-type copper tailing is one type of copper tailings which is hard to reuse in
building materials due to its nature of very fine grain sizes and high CaO and MgO content. The
application of skarn-type copper tailings to prepare autoclaved aerated concrete is investigated in
one study. The goal was to develop a potential product with reduced CO2 emissions during the AAC
production process. Lime is completely replaced by skarn-type copper tailings and blast furnace slag
(water-quenched) as both materials contain a high content of CaO and MgO. Besides, the SiO2
content in BFS is considered as alternative silica source for partial replacement of quartz. AAC
samples were produced on lab scale with a raw density of 610 kg/m³ and a compressive strength of
4.0 MPa. The raw material mix design was 30% skarn-type copper tailings, 35% blast furnace slag,
20% quartz, 10% cement and 5% gypsum [34].

41
The objective of the study was to investigate the micro-structural properties and phase compositions
of AAC with copper tailings, and its reaction mechanisms. Chemical analysis techniques showed that
the main minerals in the developed AAC product are plate-shaped tobermorite, anhydrite, augite,
quartz, calcite and dolomite, together with small quantities of other minerals deriving from the
copper tailings. In the tobermorite structure, Ca atoms may be substituted by Mg atoms which were
provided by the blast furnace slag and skarn-type copper tailings. Moreover, Al atoms are
significantly substituted by Si atoms in the chain sites as well as chain bridge sites of tobermorite. The
research suggested that most of the minerals in the copper tailings participated in the hydration
reaction of the green body, and that the chemical components in copper tailings were incorporated
into the structure of the plate-shaped tobermorite during the autoclaving process. The conclusion is
that copper tailings and blast furnace slag can be successfully used as substitution of lime by
providing CaO and MgO [34].
Efflorescence sand and phosphorous slag [10]
Efflorescence is the migration of a salt to the surface of a porous material where it forms a coating.
The internally-held salt is dissolved in water or another solvent, after which the water migrates to the
surface where it evaporates leaving a coating of the salt. Phosphorous slag is the slag discarded after
phosphate ore is melted. The study indicates that with using efflorescence sand as the main siliceous
material and phosphorous slag as a part of the calcareous material, a qualified autoclaved aerated
concrete product under the low dosage of cement could be developed [10].
Fly ash (pulverised coal combustion boiler) or pulverised fuel ash
Pulverised fuel ash is widely accepted and already extensively used as raw material in the AAC
production serving as silica source. The main benefit is that the material is widely available [20]. The
CaO-to-SiO2 or C/S ratio is an important parameter in achieving satisfactory properties of AAC.
Pulverised fuel ash is being used extensively in AAC, and its commonly used C/S ratio is 0.75-0.80, as
this is the C/S ratio of tobermorite [69]. The produced fly ashes differ per plant in their composition
and properties. Aspects such as the water demand, loss on ignition, fineness, PSD, density and
specific surface area of the fly ash influence the properties of the AAC material [42].
AAC produced with fly ash exhibits differences in microstructure compared to AAC produced with
quartz sand. Whereas AAC with quartz sand show well-defined tobermorite crystals and hexagonal
Ca(OH)2 crystals, the structure of AAC with fly ash has not complete crystallinity. There are still some
unreacted fly ash particles left and the reacted particles are farther apart than those formed with
quartz sand, which reduces the interlocking and consequently also the strength while the drying
shrinkage increases [8].
The operational envelope for pulverised fuel ash is listed in Table 9. A general inverse strength
relationship between the SiO2 and Al2O3 contents can be observed, i.e. reducing the Al2O3 content
and increasing the SiO2 content leads to an increasing strength. Pulverised fuel ash with high CaO
content can undergo undesirable expansion during the autoclaving process. High CaO contents can
also disturb the C/S ratio of the mix design, resulting in a decrement in strength. In addition, this can
also lead to thicker AAC slurries which in turn increases the water demand and causes loss of
strength. High quantities of MgO cause expansion of the body during autoclaving which may result in
a decreasing strength, while high quantities of SO42- may lead to thickening of the slurries resulting in
higher water demands and lower strengths. It is advantageous when PFA has a low 45 micron residue

42
and consist of spherical particles (cenospheres) which can undergo reaction with the binder
materials. On the contrary, if the particles are not present as reactive cenospheres, a coarser PFA can
be beneficial by reducing the water demand. A high loss on ignition or carbon content may indicate
that the water demand of the mix design is undesirably high [20].
Table 9: Operational envelope for pulverised fuel ash.
PFA characteristic Desirable content [%] Usable content [%] Unusable content [%]
SiO2 > 55 45 – 55 < 45 Al2O3 15 - 20 20 – 30 > 30 CaO < 5 5 – 10 > 10 MgO < 1 1 – 2 > 2 SO4
2- 0.5 - 0.55 0.55 - 0.65 > 2.5 45 micron residue 12.5 - 15 15 – 30 > 30 Loss on ignition 3 - 6 6 - 8.5 > 8.5 Moisture content 10 - 12 12 – 15 > 15
Previous and similar research conducted at the TU/e focused on the replacement of quartz by fly ash
for low contents up to 15%, for both green body as final properties. The application of fly ash
resulted in a decreasing slump flow with increasing fly ash content. It seems also that the reaction is
enhanced, as more reaction takes place indicated by an increased temperature development due to
the addition of fly ash (green body). Furthermore, the setting development of the green body is
slightly accelerated by the incorporation of fly ash. Finally, the rising height is slightly raised with
increasing fly ash contents [14].
The partial substitution of quartz by fly ash or PFA affects the final properties. Incorporation of 5% fly
ash has little influence on the apparent density (slightly lower), porosity (slightly higher) and thermal
conductivity, whereas the compressive strength decreases relatively strongly. The apparent density
decreases gradually with increasing fly ash contents, whereas the porosity increases with increasing
fly ash contents. Furthermore, the thermal conductivity increases for 10% fly ash, but decreases for
15% fly ash. As last, the compressive strength decreases significantly with increasing fly ash content,
probably due to its less pozzolanic reactivity compared to quartz sand. Looking at the microstructure,
the 5% fly ash sample exhibited a less dense crystal formation in the matrix, but thin and dense
crystal layers are growing from the matrix. On the other hand, the 10% sample shows large, well
defined homogeneous crystal growth in the macro-pores. The 15% fly ash sample exhibited grass-like
and needle-like crystal in the macro-pores [14].
Fly ash (Circulating fluidised bed combustion) [43] [69]
The fly ash from a circulating fluidised bed combustion (CFBC) boiler differs from the fly ash from a
pulverised coal combustion (PCC) boiler or pulverised fuel ash in physical properties and chemical
composition. CFBC fly ash contains more CaO, SO3 and unburnt carbon, less SiO2 and has higher
pozzolanic activity compared to pulverised fly ash. Theoretically, the material can be applied in AAC.
Important is that the autoclaving can effectively control the destructive expansion of a CFBC fly ash
cementitious system. Studies report that CFBC fly ash can be successfully used in autoclaved aerated
concrete. The maximum bulk density and compressive strength of AAC incorporating CFBC fly ash are
higher compared to AAC incorporating PCC fly ash. Furthermore, the volume stability of AAC
containing CFBC fly ash is superior to that of AAC containing PCC fly ash. Finally, the crystal size of the

43
tobermorite in AAC with PCC fly ash is nearly twice as large compared to that for AAC containing
CFBC fly ash [69].
CFBC fly ash contains no glassy phases (no aluminosilicate) compared to PFA, but it contains a
considerable amount of amorphous phases in the form of dehydrated silty minerals and also
crystalline phases in the form of quartz, free CaO, CaCO3 and CaSO42∙H2O. The incorporation of this
type of fly ash causes changes in the phase composition, microstructure and structure of AAC
(compared to PFA). CFBC fly ash has a higher water demand and exhibits more pozzolanic reactivity
compared to PFA. The research observed that CFBC fly ash can be used to produce AAC for contents
up to 40% relative to the PFA content, as the strength increases significantly with increasing CFBC fly
ash content. Micro-structural analysis showed that the main phase is hydrated calcium
aluminosilicate of the type katoite and C-S-H (crystalline hydrogarnet), but also tobermorite is found.
Furthermore, also small amount of scawtite, unreacted anhydrite and CaCO3 are observed. An
additional advantage of the application of this fly ash is that is possible to reduce the lime and the
sulphate source material content in the mix design [43].
Foundry sand [19] [20] [31]
Foundry sand is currently being studied and used as an alternative raw material for the production of
AAC and can potentially serve as alternative silica source. An important benefit is the flexibility in
sourcing the material. However, several handling problems are associated with the material. For
instance, its dark colour affects the white appearance of AAC. Furthermore, odours are released from
the material during the production process, and there are some health and safety concerns.
Nevertheless, foundry sand is already being used as raw material by AAC producers (UK) for the
production of AAC blocks. Alkaline phenolic and resin bonded shell sand supplied from ferrous
foundries appeared to be the most suitable for AAC productions. In practice, up to 50% foundry sand
is incorporated in the mix designs [20].
Gasification residues [33]
The gasification process was designed to dispose bio- and recycled fuels that are difficult to burn with
conventional techniques due to harmful compounds. During the gasification process, the residues in
the product gas are collected with a cyclone and filters. The collected residues from the gasification
of waste pellets made of paper and plastic contain a substantial proportion of metallic aluminium, as
well as an abundant amount of chlorine which can be filtered. The research focused on two residues,
i.e. the cyclone dust and the filter dust [33].
The application possibilities of these fine-grained gasification residues in AAC are investigated. Both
considered gasification residues contain large amounts of metallic aluminium. Therefore, they have
the potential to substitute aluminium powder in AAC as aerating agent. The study wanted to
investigate if the extra addition of aluminium powder was still necessary when the gasification
residues are used in AAC. An important remark is that the residue aluminium reacts slower than the
conventional aluminium powder, probably due to its coarser grain size. Simultaneously, the residues
replaced a small part of the silica source. The objective of the study was to determine how much
residue can be incorporated, and determining several properties of a selected mix design with and
without the extra addition of Al powder.

44
The best lab results were found at the addition level of 10% by weight replacement of aggregate. At
this level, there were no harmful effects on workability, strength and density compared to reference.
Higher levels are not recommended as they require adjustments in the mix design. The residue alters
the sample colour and slightly darkened the AAC sample. The addition of these residues (without Al
powder) leads to significant higher densities, probably due to a reduced amount of air entrained
voids. Consequently, the strength is also higher. Furthermore, AAC containing the residues have
much smaller pores, and without the addition of Al-powder, the pore structure is non-uniform.
Therefore, it can be said that the addition of aluminium powder is still required [33].
AAC with residue addition at low levels (1% and 3%) exhibited satisfying results which were within
the pre-defined specifications. Higher amounts of gasification residues (i.e. 7%) resulted in a
significant increase in density and strength, and will require likely changes in the mix design. The
application of 10% residues resulted in a strong increase in rising height due to the delayed reaction
which caused the collapsing of the green body. It is necessary to control the reaction rate and the
duration of aluminium reactions to ensure that the gas bubble formation is completed at
approximately the same time as the initial stiffening. Otherwise, the green body risks excess air void
formation and consequent structural collapse. The final conclusion of the study is that the
gasification residues offer a promising resource for economic production of AAC without detrimental
effects to the final product properties and characteristics [33].
Ground bricks [4] [20]
Fine crushed brick powder is considered as a pozzolanic siliceous material. Brick wastes are crushed
and ground to the desired particle size (one study: <75m). The particles are semi-oval shaped and
have a semi-smooth surface. Several researchers focused on examining the effect of using crushed
clay bricks as an alternative aggregate in AAC. Quartz sand can potentially be replaced by ground
bricks. The physio-mechanical properties and the micro-structure of AAC with crushed bricks were
determined and analysed during the study. The selected replacement levels are 0, 25, 50, 75 and
100%. The experimental results revealed that the unit weight, thermal conductivity and sound
attenuation coefficient were significantly reduced due to the application of crushed bricks (higher
crushed brick content, more reduction), whereas the porosity increased with increased brick powder
content. Improvements in compressive strength of AAC were observed at substitution levels of 25%
and especially 50%. The pozzolanic characteristics of crushed brick powder may be responsible for
the enhancement in strength, while the porous structure of brick powder may explain the decreasing
unit weight and increasing porosity. Micro-structural analysis indicated that the incorporation of
brick powder does not influence the qualitative hydration products, and XRD analysis showed that no
harmful compounds are present [4].
Ground waste glass [19] [20] [82]
The material is still being investigated for possible application as raw material in AAC (trial works).
Ground glass can potentially be applied as an alternative silica source, and has been considered for
this purpose for the last 20 years. The main benefit linked to the material is the flexibility in its
sourcing. On the other hand, there are three main disadvantages associated to this waste material.
Firstly, there occur some handling problems as the fineness is insufficient for grinding. Secondly, the
material costs are higher compared to the costs of primary raw materials. Thirdly, the supplied
material is variable and not constant in properties and characteristics [20].

45
Several researchers aimed to design an AAC product with different types of glass wastes as an
alternative fine silica source. The different types of glass waste are sub grain packaging glass cullet,
cathode ray tube panel glass waste and calsi glass, which are applied as quartz replacement in AAC
production. Some of the sub grain packaging cullet does not meet the strict criteria for packaging
glass and thus is sent to landfill, while cathode ray tube panel glass waste is classified as hazardous
and is hard to recycle. Furthermore, calsi glass as a processed blast furnace slag is not used in
packaging production. The study focused on different amounts of glass waste (only up to 10% by
mass) and its influence on the characteristics and properties of AAC. The addition of aluminium
powder is not performed, as the investigations are regarded as model investigations. The
experimental results indicated that samples containing cathode ray tube panel glass waste exhibit
similar compressive strengths compared to the reference sample. The addition of 1% glass waste
cullet resulted in a slight increase in strength, while the incorporation of 3, 5, 7 and 10% leaded to a
slight decrease in strength. The strength of AAC samples with calsi glass decreased significantly with
increasing calsi glass content. Micro-structural analysis (SEM) showed that the micro-capillaries in the
reference sample consisted out of plate-shaped tobermorite crystals with a double-chain silicate
structure, whereas the samples with different types of glass waste exhibited fibrous-like tobermorite
crystals and some well crystallised C-S-H gel was observed on the surfaces of the glass grains. The
study successfully demonstrated that AAC with small amounts of ground glass waste could be
produced without any significant influences on the product characteristics and properties [82].
Ground granulated blast furnace slag [14] [34]
Blast furnace slag is a by-product of steel production. The slag produced needs to be cooled down,
which can be performed in two different ways: water-cooled slag and air-cooled slag. Blast furnace
slag can be applied as replacement material for quartz sand and lime in AAC [50].
One study showed that blast furnace slag can be applied as a valuable raw material in AAC. Slag
substitutions for quartz and lime up to 50% improve the compressive strength of AAC, especially at
short autoclaving times. The optimum strength is achieved with 30% slag substitution for samples
with high lime content (25% CaO), whereas with 50% slag substitution for samples with low lime
content (10% CaO) [50].
The introduction of slag to the C-S-H system of AAC has two effects. Slag exhibits higher reactivity
than quartz, which increases at higher temperatures. This mainly causes the increase in strength. The
incorporation of slag modifies the equilibrium in the C-S-H system, as aluminium is introduced and
the C/S ratio increases. The partial replacement of quartz by slag accelerates the formation of
tobermorite, if the reactive C/S ratio is adjusted [50].
Incinerated sewage sludge ash [14] [19]
Incinerated sewage sludge ash (ISSA) produced from a fluidised bed incinerator is a free-flowing
silt/sand. The material possesses pozzolanic (reactive silica) properties, and can potentially be used
as aggregate in autoclaved aerated concrete. Material characterisation data shows that the silica
content can be as low as 25%, calcium oxide content can be as high as 33% and phosphate can be
present up to 20%. ISSA can be applied as partial replacement of the silica source (quartz). Trial
experiments indicated that ISSA can be incorporated in AAC with some success and could be suitable
as alternative raw material. However, the material has a variable water demand which is also higher

46
than that of quartz or pulverised fuel ash, and the high phosphate content in ISSA implies also
problems [19].
Boesten [14] found that the temperature development within the green body with 10% quartz
replaced by ISSA is significantly reduced, while the slump flow is not affected by ISSA incorporation
with low levels. It was also observed that the stiffening development of the green body is delayed by
the addition of ISSA, which becomes more significant for higher substitution levels, whereas the
rising height development is affected in minor. The presence of phosphates in ISSA leads to a
decreased viscosity of the mixture. The final product properties are also affected by the addition of
ISSA. The incorporation of 5% ISSA has little influence on the apparent density, whereas it leads to a
slight decreased compressive strength and slight increased porosity and thermal conductivity. On the
other hand, the application of 10% ISSA results in relatively lower apparent density and relatively
significant raise in porosity. The compressive strength is very significantly reduced, while the thermal
conductivity is only slightly reduced. The low compressive strength is probably caused by the
phosphates present in the ISSA. The XRD analysis indicates that the phosphates from the ISSA
consumes water, resulting in a high anhydrite concentration within the AAC sample. SEM analysis
showed that the 5% ISSA sample exhibited a less dense crystal formation in the matrix, and the
tobermorite has needle-like shape, resulting in a lower compressive strength (low homogeneity of
the macro-pores distribution). There are also thin and dense crystal layers growing from the matrix,
contributing to the strength. The phosphates should be removed from ISSA before incorporating it
into the mix design of AAC.
Iron ore (low silicon) tailings [87]
Lead-zinc tailings [23]
Metakaolin [14] [39]
Highly-reactive metakaolin is a suitable pozzolanic material for the production of AAC, and can be
applied as both silica source material or as partial replacement of Portland cement. Metakaolin
contains a significant amount of alumina, which causes the formation of hydrogarnet during
autoclaving. The increasing addition of metakaolin retards the lime-quartz reaction, while enhancing
the initial C-S-H formation [39].
Metakaolin can also be found in paper sludge ash. Metakaolin reacts with the binder (Portland
cement and lime) in the green body and consumes Portlandite. Because metakaolin consumes
portlandite, the alkali environment disappears and the general reaction does not occur. The reaction
of metakaolin produces C-S-H or C-S-A-H phases. Moreover, metakaolin (finer particle size) produces
a seeding of the cement reaction and therefore accelerates the reaction [14].
Municipal solid waste incineration bottom ash [14] [70] [86]
80% of the incineration residues consists of bottom ashes. Bottom ash contains leachable heavy
metals and highly toxic organic substances, which depends on the incinerated materials and the
process. The chloride content in BA is less than that in MSWI fly ash. Furthermore, MSWI BA is rich in
calcium oxide, silicon oxide and aluminium oxide. Moreover, BA contains a noticeable amount of
metallic aluminium due to the increasing growth of incinerating household waste [70].

47
One study suggested that bottom ash can be applied for partially substituting Portland cement. The
selected substitution levels for the experimental study are 10%, 20% and 30%. The results showed
that the compressive strength, flexural strength and thermal conductivity increased with increasing
BA content, mainly due to the enhanced formation of tobermorite. Approximately 22% improvement
in both compressive (up to 11.61 MPa) and flexural (up to 3.16 MPa) strength is achieved with the
incorporation of 30% BA, while the thermal conductivity just increases only with 7%. Chemical
analysis indicated the formation of C-S-H and confirmed tobermorite formation in AAC with BA. The
research concludes that BA can be successfully used as partial cement replacement material, with
the benefit in enhancing the strength of AAC while the thermal insulation performance is only slightly
degraded [86].
Researchers proposed to use municipal solid waste incineration bottom ash (MSWI BA) as aerating
agent in AAC to substitute the costly aluminium powder, instead of pre-treating the material in order
to remove or immobilise metallic aluminium. In addition, MSWI BA is also applied as silica source to
partly replace quartz powder or fly ash. The research reported that AAC with MSWI BA as both
aerating agent and partially silica source could be successfully produced, and showed that AAC
incorporating MSWI BA has a density ranging from 600 to 800 kg/m³. For a given density, the
compressive strength of MSWI BA AAC is higher compared to that of standard AAC, because of the
formation of a more uniform pore structure with smaller pore sizes. The free drying shrinkage, the
strength and stiffness of AAC containing MSWI BA decreases with increasing BA content, whereas the
porosity of MSWI BA AAC increases with increasing BA content. Consequently, the moisture loss due
to drying is faster and the resistance to volume changes is reduced in MSWI BA AAC with higher BA
contents [70]. However, it must be remarked that one has to look critical on this research and article.
For instance, pictures of the pore structure of the produced samples look not that good. It seems
that the used bottom ash is obtained by selecting materials to incinerate under selected conditions.
Another study (conducted at the University) focused on the replacement of quartz by bottom ash for
low levels (up to 15%). The slump flow of the fresh mixture decreases quite significantly with
increasing BA content. The temperature within the green body is also slightly raised, indicating that a
bit more reaction takes place. Furthermore, the setting is accelerated and the effect becomes more
significant for higher BA contents, whereas the rising height development is hardly affected [14].
In addition, the research focused also on the partial substitution of quartz by municipal solid waste
fly ash (low contents, up to 10%). However, this substitution seems to hardly influence the green
body properties (slump flow, temperature and rising height development, setting) [14].
The apparent density of the final product is hardly affected by the substitution of 5% quartz by BA,
whereas the porosity is increased. On the other hand, the compressive strength and the thermal
conductivity decreased relative to reference (rather small differences). Further incorporation of BA as
replacement of quartz (10%, 15%) results in a slight decreasing apparent density, compressive
strength and thermal conductivity, while the porosity slightly increases. The 5% BA sample exhibited
a high density crystal structure (matrix) with no crystal growth in the macro-pores. On the other
hand, the 10% sample showed large differences in local crystal morphology in the macro-pores, as
well as for the crystals growing from the matrix. The 15% BA sample exhibited grass-like and needle-
like crystal in the macro-pores [14].
The substitution of quartz by the MSWI fly ash also influences the final properties. Whereas the
apparent density is hardly affected by the incorporation of the fly ash, the compressive strength

48
reduces strongly with increasing fly ash content. The porosity is also hardly affected, while the
thermal conductivity is slightly increased. Furthermore, the crystal structure in the matrix is less
dense [14].
Paper sludge ash [14]
The study investigated the partial replacement of quartz by paper sludge ash (low contents, up to
15%), as well as the partial substitution of Portland cement by paper sludge ash (higher contents, up
to 50%).
As first, the replacement of quartz by paper sludge ash (PSA) influence the properties of AAC. The
incorporation of PSA results in a strongly decreasing slump flow and a strongly accelerated setting
development of the green body with increasing PSA contents. PSA has a higher water demand
compared to quartz powder. Furthermore, the maximum temperature within the green body is also
relatively significantly increased indicating that more reaction takes place. Finally, the rising height
development is hardly affected, while the maximum rising height slightly decreases with increasing
PSA content.
The apparent density is quite extensively increased by the incorporation of PSA, as well the
compressive strength is increased, especially at a substitution level of 5%. The porosity decreases
with increasing PSA content (especially at 5%), whereas the thermal conductivity increases. For
higher substitution levels, the W/S ratio needs to be adjusted (increased) in order to enhance the
reaction rate. The high quicklime, portlandite and metakaolin contents in paper sludge ash may lead
to an increased binder content and consequently lead to an enhanced compressive strength. The
samples with paper sludge ash exhibited a small macro-pore size distribution (with a high
homogeneity), resulting in a higher compressive strength (high impact). Furthermore, the 5% PSA
sample showed a dense crystal formation in the matrix with no crystal growth in the macro-pores,
and thin densely formed crystal layers growing from the matrix, both contributing to the strength.
The 10% sample has not a dense crystal structure due to needle-shaped tobermorite crystals in the
macro-pores, whereas the 15% sample had more plate-like tobermorite crystals [14].
The partial substitution of Portland cement by paper sludge ash is also investigated, for replacement
levels up to 50%. The slump flow decreases with increasing PSA content, while the setting
development is more and more accelerated with increasing PSA content. Little influence on the
temperature development can be observed, whereas the maximum in rising height development as
well as maximum temperature takes place at earlier time moments. The final rising height decreases
for higher substitution levels. Regarding the final AAC properties, the compressive strength, apparent
density and thermal conductivity increases due to the substitution of cement by PSA, especially at
higher substitution levels, while the porosity is hardly affected. However, all the differences are
rather small. The 10% and 20% PSA samples exhibited similar final properties compared to reference.
SEM analysis showed that all PSA samples exhibited homogeneous and small macro-pores. In
general, several types of tobermorite crystals are formed (i.e. needle-like, grass-like and plate-like) in
the PSA samples.
Rice husk ash [40]
Rice husk is an agricultural by-product obtained from the milling of paddy. Although rice husk ashes
contain approximately 90% silica by mass, the reactivity of the silica present is relatively poor, and

49
the colour of the ashes varies strongly from white to black. One study examines the effects of rice
husk ash (RHA) on the physical, mechanical and micro-structural properties of AAC. The RHA is
applied as a silica source at various replacement ratios (25-50-75-100%) substituting quartz sand. The
experimental results demonstrated that RHA as replacement of quartz leads to a reduction of
compressive strength and unit weight. The decrease in unit weight is caused by the lower density of
RHA (compared to quartz) and its enhanced pore structure, while there are several reasons
explaining the decreasing strength. The main factor is that RHA has a higher water demand, which
results in a reduction of strength. Furthermore, the thermal conductivity of AAC with RHA decreases
as the RHA content increases. In terms of micro-structure, the highly reactive silica in RHA strongly
affects the tobermorite transformation. After 8 hours of autoclaving, the plate-shaped tobermorite
formed in AAC containing up to 50% RHA, was replaced by a glass-like, silica-rich C-S-H structure at
increased temperature ratios. However, extended autoclaving had little effect on these properties,
which indicates that the partial replacement of quartz by RHA has a tendency to reduce the required
autoclaving temperature or time [40].
Silica fume [11] [85]
Silica fume is a by-product of the ferro-silicon alloys and silicon metal industries. In the process, SiO2
vapours are produced which oxidise and condense in the form of very tiny spheres of non-crystalline
silica. The material contains a high quantity of amorphous silica (over 80%) and has spherical
particles with the particle size within the nano range (100 nm). Therefore, SF exhibits high pozzolanic
reaction. Silica fume can be used as an additional material to the silica source [85].
One research used silica fume to improve the AAC composition including fly ash. The results showed
that silica fume addition resulted in an increase in compressive strength. The addition of 5% silica
fume seems to have little influence on the micro-structure, which consists of well-developed
tobermorite platelets. However, incorporation levels over 5% for silica fume leaded to a decreased
workability. The study also concluded that silica fume addition was useful for the prevention of
ettringite phases in the AAC product during the early hydration. Ettringite phase is believed to be
useful for early strength development, but it may cause cracks and decreases the durability later.
Furthermore, the incorporation of silica fume enhanced the hydrothermal conditions during the
autoclaving of the green bodies. In conclusion, silica fume can be applied as a functional additive to
AAC [11].
Another study [85] focused on the micro-structure and properties of AAC produced with coal bottom
ash and silica fume. The findings of the study are already described under the section of coal bottom
ash.
Wheat straw ash [20] [40]
When wheat straw, which is rich in SiO2, is incinerated, it leaves an ash also very rich in SiO2 that
exhibits pozzolanic activity if the straw is well-burnt and well-ground. The silica content of the ash
can be up to 70% [1]. The ash can potentially be used as siliceous source material [20] [40].
Wood ash [14]
Wood ash (WA) can be used as silica source material in AAC, thus as an alternative raw material
partially replacing quartz powder. One research dealt with studying the partial substitution of quartz

50
by wood ash (low contents, up to 10%). The addition of 10% WA results in a slight increased slump
flow and maximum rising height. Furthermore, the rising height development is affected by the
incorporation of 10% WA, but not for 5% WA. The setting development of the green body is more
and more delayed with increasing WA content. Finally, the application of WA has little influence on
the temperature development of the green body [14].
The substitution of quartz by wood ash also influences the final properties. The apparent density is
significantly reduced with increasing WA content, accompanied by also significant reductions in
compressive strength. Higher porosities and lower thermal conductivities were observed, also
strongly changing with increasing WA contents. AAC with 10% WA exhibited a large macro-pore
distribution, which has a significant influence on the strength, i.e. low strength as consequence.
However, the 5% WA sample showed a dense crystal formation in the matrix, whereas the 10%
sample has not a dense crystal structure in the macro-pores and shows needle-shape tobermorite
crystals. XRD results indicated that the WA AAC contained a substantial amount of non-reacted
calcite and anhydrite [14].
Zeolite [1] [35]
Zeolite is a crystalline aluminosilicate mineral with uniform pores, channels and cavities,
characterised by a large surface area, catalytic activity, ion exchange and molecular sieves. During
history, about 40 natural zeolites have been distinguished. The zeolite surface can be activated to
have a high energy after calcination at temperatures higher than 400°C, which generates a large
amount of air and heat when immersed in water due to adsorption [35]. One study focused on
investigating the effect of zeolite on the properties of AAC, which is applied as siliceous raw material
replacing quartz (complete replacement). AAC samples containing zeolite were prepared with bulk
densities ranging from 270 to 500 kg/m³. It was observed that zeolite containing AAC is composed of
tobermorite, quartz, unreacted anhydrite and clinoptilolite phases. In addition, XRD analysis
indicated that wollastonite, gehlenite and orthoclase are the newly formed phases. The application
of zeolite in AAC resulted in a significant reduction of the thermal conductivity compared to
reference (values between 0.055 and 0.015 W/m∙K), while providing compressive strengths ranging
from 1.22 to 3.34 MPa for the given range of bulk density. The compressive strength and the thermal
conductivity decrease with decreasing bulk density, which is controlled by the aluminium powder
dosage. The research concludes that zeolite can be applied as raw material in AAC partially
substituting quartz providing similar properties as conventional AAC [1].
Another study used natural zeolite (clinoptilolite) as both an aggregate replacing the silica source and
as aerating agent replacing aluminium powder in AAC production. The crushed and grinded zeolite is
divided into two different particle sizes, i.e. fine zeolite (100 m) and coarse zeolite (0.5-1.0 mm).
The first part of the study focused on the application of zeolite as siliceous raw material. The effects
of the particle size, replacement level and curing time on the AAC characteristics and properties were
identified. The selected substitution levels are 25, 50, 75 and 100% relative to quartz. The
experimental results indicated that the usage of natural zeolite, especially with a coarser particle
size, had beneficial effect on the physical and mechanical properties of AAC compared to reference.
Furthermore, fine zeolite has a higher water demand compared to coarse zeolite due to its higher
specific surface area, which negatively affects the strength. The optimum substitution level was
found to be 50% (coarse size), for which the AAC sample exhibited a compressive strength of 3.25

51
MPa, unit weight of 553 kg/m³ and thermal conductivity of 0.1913 W/m∙K. Denser C-S-H structures
were obtained up to a substitution level of 50%. The replacement of quartz by zeolite causes the unit
weight to decrease, and consequently, the thermal conductivity also decreases with increasing
zeolite content. Autoclaving time strongly influences the final AAC properties, as after 18 hours more
crystalline tobermorite phases were formed compared to a time of 8 hours, which also resulted in
higher compressive strengths. The useable substitution levels of natural zeolite for quartz was
established at 50% for fine zeolite and 75% for coarse zeolite.
The second part of the study concentrated on the usage of calcined zeolite as both siliceous material
and aerating agent. Therefore, aluminium powder is not used in the mix design. The test results
confirmed that calcined zeolite can act as both an aerating agent and aggregate. AAC with a
compressive strength of 4.60 MPa and a density of 930 kg/m³ was developed without the addition of
aluminium powder. Denser and stronger AAC samples are produced in this way, because of the lower
aeration capacity of zeolite compared to aluminium powder [35].

52
4. Studied alternative raw materials
4.1. Introduction
4.1.1. Volcanic materials
Several alternative raw materials studied within this research are natural volcanic materials. A
volcano is a rupture in the crust of the Earth that allows hot lava, volcanic ash and gases to escape
from a magma chamber below the surface. Magma is a mixture of molten or semi-molten rocks,
volatiles and solids which is situated in the interior of the Earth. Magma possibly contains also
suspended crystals and dissolved gases. The heat is provided by the Earth, i.e. geothermal energy.
Lava is the molten rock formed inside the earth which is ejected/extruded by a volcano during a
volcano eruption. When a lava flow has stopped moving on the surface, lava solidifies to form
igneous rocks. An igneous rock is defined as the rock material formed through the cooling and
solidification of magma or lava, and can occur with or without crystallisation. Igneous rocks can
either be formed below the Earth surface as intrusive rocks, or on the Earth surface as
extrusive/volcanic rocks [84].
During explosive volcano eruptions, dissolved gases in magma expand and consequently escape into
the atmosphere. The force of the escaping gas shatters the magma and propels it into the
atmosphere where it solidifies into fragments of volcanic rock and glass, resulting in the formation of
volcanic ash. Thus, volcanic ash consists of fragments of pulverized rock, minerals and volcanic glass.
The particles have a diameter smaller than 2 mm. Once the volcanic ash is in the air, the material is
transported by the wind up to thousands of kilometres away. As last, tuff is defined as the rock
material formed by the consolidation of deposited volcanic ash [84]. These explosive volcanic
eruptions ejecting particles of melted magma into the atmosphere result in the formation of
pyroclastic rocks. Due to the gas releases, usually a micro-porous structure is observed in these rocks.
Pyroclastic rocks have a glassy structure, because of the rapid cooling process during formation [56].
Zeolites are micro-porous aluminosilicate minerals, which occur naturally but are also produced
industrially. Natural zeolites are formed by the reaction between volcanic rocks/ashes and alkaline
groundwater. These minerals are seldom pure as they are often contaminated by other minerals,
metals, quartz or other zeolites with varying degrees. They have a porous structure that can
incorporate several cations, such as Na+, K+, Ca2+ and Mg2+. These positive ions can be easily
exchanged for others in a contact solution [55].
The alternative raw materials considered during this research project are all mined in the Eifel region
in Germany. The Eifel region is located in western Germany against the Belgian border, as highlighted
in Figure 23. It lays North of the Moselle and West of the Rhine. The Eifel is a low mountain range
and is part of the Rhenish Massif. During the Tertiary (66 – 2.58 million years ago), there was a lot of
volcanic activity in the Eifel. There are several circle-shaped craters in this area which are filled with
groundwater , which were formed due to explosions of volcanic gases in that time, called a maar. The
last volcanic explosions/eruptions took place 10 000 years ago in the Laacher See site, producing a
huge amount of volcanic ashes. The volcanic activity of the Eifel is probably caused by the Eifel
hotspot, which is a volcanic hotspot [83].

53
Figure 23: Location of the Eifel in Germany.
4.1.2. Natural pozzolans
A pozzolan is defined as a siliceous or siliceous-aluminous material, which in itself possesses little or
none cementitious value. However, in finely divided form and in the presence of water, it will
chemically react with calcium hydroxide at normal temperatures to form compounds possessing
cementitious properties. A natural pozzolan is a raw or calcined natural material that exhibits
pozzolanic properties. Examples of natural pozzolans are volcanic ash or pumicite, tuffs,
diatomaceous earths, shales and opaline cherts. Pozzolanic activity is defined as the reaction rate
between a pozzolan and Ca2+ (originating from Ca(OH)2) in the presence of water. The pozzolanic
reaction is defined as the reaction between lime and the active phases of the pozzolan. Two
thousand years ago, the Greeks and Romans already used mixtures of lime and natural pozzolans as
binding material for many structures, such as aqueducts, bridges, sewers and water tanks [56].
Several parameters influence the pozzolanic activity of natural pozzolans. The amount and nature of
the active phases in the material, the fineness and surface area of the particles, the mix design and
the curing conditions are the most important factors determining the pozzolanic reactivity. The
glasses of different pozzolans exhibit different potential in reacting with lime. The zeolithic pozzolans
are usually more reactive than the glassy pozzolans. Moreover, the reactivity of natural pozzolans
usually/mainly depends on the amount of amorphous material which determines the strength. On
the other hand, the specific surface area of the pozzolan determines to a great extent the water
demand of the mixture [56].
There exist several classifications for pozzolans and naturals pozzolans. The establishment of a
detailed classification of natural pozzolans is very difficult because this common name includes
materials which are very different regarding chemical composition, mineralogical nature and
geological origin. Their property in common is their ability to react with lime and water, leading to
hardening in time. One of the proposed classifications is presented in Figure 24, which is based on
the origin of the natural pozzolan [56].
Rhenish trass (Eifel region) is known as a natural pozzolan of volcanic origin. Volcanic pozzolans are
usually deposited in compact layers known as tuffs, which originate from cementation and
weathering of loose particles by diagenetic or other natural processes, as previously mentioned.
Weathering can cause the formation into zeolites, i.e. the glassy structure of the pozzolan is

54
converted into zeolithic minerals, which improves the properties of the pozzolan. The degree of
conversion depends on the intensity of the diagenetic processes as well as on their duration.
Argillation is the process by which the weathering of aluminium silicates forms clay minerals, which
in turn usually reduces the pozzolanic activity [56].
Hydrothermal treatment of natural pozzolans can change their pozzolanic reactivity, i.e. chemical
and mineralogical changes in the material, as for instance some natural pozzolans convert into
zeolithic minerals. This means that the volcanic glass has transformed into zeolithic minerals, while
their chemical composition has not changed. The rate of conversion and the type of formed zeolites
depend on the hydrothermal conditions, even in some cases the glassy phases are completely
transformed into zeolites. Furthermore, some pozzolans loose water in their glassy or zeolithic
phases and the destruction of the crystal structure occurs during hydrothermal conditions, which
enhances the pozzolanic reactivity. The high temperature and duration of heating may decrease the
specific surface area and can cause recrystallization, resulting in a reduced pozzolanic activity of the
pozzolan [56].
Figure 24: Possible classification of natural pozzolans.
The main reaction products of natural pozzolans in a saturated lime solution are calcium silicate
hydrates and calcium aluminate hydrates. Zeolithic compounds generate as well similar reaction
products. The addition of gypsum and more water accelerates the reaction of the pozzolan with lime.
Besides the previously mentioned main reaction products, the long term reaction of natural
pozzolans may also produce hydrogarnet, gehlenite, carbo-aluminate and ettringite (only formed in
the presence of gypsum) [56].
4.2. Trass & tuff ash
The volcanic ash material is ejected during an explosive volcano eruption. Wind and water transport
the melted lava and ashes from the volcano, and the materials consolidate and form sediments or
deposits, referred to as tuff. Tuff in general mainly consists of the same material as the
Natural pozzolans
Pyroclastic rocks
Incoherent rocks
Coherent rocks (altered)
Non-active materials
Zeolitised materials
Clastic rocks
Trass
Yellow tuff
Canary tuff
Italian pozzolans
Tuff ash
Santorin earth
Vitreous rhyolites

55
corresponding lava material, only its crystals are crushed. The tuff often consists out of blends of
various materials, such as pumice, clay and sand rocks, as well the particles of tuff have various sizes
[29].
The mineralogical composition of tuffs in general is rather complex as the glass or the original
pozzolan is converted into zeolithic components by an outometamorphic process. The zeolitasation
and transformation of volcanic pozzolans (incoherent and mostly glassy) into compacted tuffs has
been observed in many deposits. The tuffs may also contain variable amounts of clay minerals [56].
Little to no research has been dedicated regarding the application of natural volcanic materials (e.g.
tuff) and zeolites in autoclaved aerated concrete, while the application of tuff materials in normal
concrete is already more widely investigated. Tuff is usually abundantly found in nature. The addition
of natural pozzolans may enhance the properties of concrete. One study focused on the use of
calcareous tuff from Algeria in normal concrete as replacement of sand [15]. Another study
investigated the potential use of zeolithic tuffs from Sandikli, Turkey as concrete aggregate [16]. Abali
et al. evaluated the use of blends of several materials, including volcanic tuff from Turkey, as a
cement additive [1]. Other researchers studied the application of neapolitan yellow tuff (zeolitised
volcanoclastic) from Italy for the production of lightweight expanded aggregates which are used in
the production of lightweight structural concrete [18]. Another study examined the potential use of
tuff, which occurs naturally in large quantities in north-eastern Jordan, as aggregate in the
production of high strength lightweight concrete [68]. Finally, Yilmaz et al. investigated the
properties of mortars produced by blending Portland cement with a zeolite-like tuff (mineral called
clinoptilolite) [88].
Tuff ash is the tuff layer found in the Eifel region, Germany. The layer consists out of blends of
several materials, which are already mentioned. An approximate oxide composition for the (Rhine)
tuff ash is shown in Table 10 [56].
Trass is a finely grounded volcanic tuff rock (see Paragraph 1.3). In Germany, trass deposits are
mainly found in the area of the Laacher-See volcanic area (Eiffel region). The nearest large city
relative to the Laacher-See is Koblenz. The colour of trass is usually ranging from yellowish to greyish,
and its density is approximately 2.3 g/cm³. Trass possesses hydraulic properties, which already were
discovered and made use of by the Romans. Trass is processed by blending it with lime or cement in
order to produce a hydraulic binder material. Applying trass blends enhances several properties of
concrete, such as improving the workability, decreasing water permeability and increasing elasticity
and resistance. The approximate oxide composition of trass is presented in Table 10 [29]. The main
mineral components of trass are glass (active phase, 55-65%), quartz (inert phase, 9%) and feldspar
(inert phase, 15%). The chemical composition of the layers in the Rhine trass deposit is very similar,
but the microscopic structures vary significantly [56].
Table 10: Approximate oxide composition for trass and tuff ash according to different sources.
Oxide Trass [mass%] [29] Trass [mass%] [56] Tuff ash [mass%] [56]
SiO2 55-60 52 59 Al2O3 16-18 18 20 Na2O 8-9 1-2 6 K2O 5 5 CaO 2-3 5 2-3
Fe2O3 2-4 6 3

56
MgO 0-2 1 1 H2O 5-11 - - LOI - 11 2
Trass is suitable as hydraulic additive for the production of cement. Cement clinker mild together
with trass provides a decent hydraulic binder material, especially suitable for hydraulic engineering
purposes, called trass-cement [29].
In finely grounded form, trass develops hydraulic properties by the influence of lime under normal
conditions. Under hydrothermal conditions (autoclaving), this process is accelerated. Thus, trass is a
pozzolan and will be suitable for the production of AAC, providing the ability to generate
tobermorite. In addition, the significant amount of alumina in trass will also react under the
hydrothermal conditions. The Al2O3 will also react with the portlandite, generating calcium aluminate
hydrates with different compositions. There likely will also occur the formation of gehlenite-hydrate
and hydrogarnet [29].
4.3. Basalt
Basalt is a common volcanic consolidated rock material deriving from basaltic lava. It arises when hot
magma from inside the Earth extrudes onto the Earth surface as basaltic lava (extrusive). The basaltic
lava rapidly cools down and solidifies at or very near the surface (igneous), forming volcanic rocks.
Therefore, basalt is defined as an extrusive (formation at the Earth surface) and igneous (formation
through cooling and solidifying of lava) rock material. The volcanic rock material basalt is formed
during flood basalts. Flood basalt refers to the basalt lava flows that covers large stretches of land or
bottom of the ocean due to a giant volcanic eruption or series of eruptions. Basalt is defined as a
mafic material, i.e. basalt is a silicate rock rich in magnesium and iron. Due to the high iron content,
basalt is typically dark-coloured. Basalt is a very fine-grained rock material, and has a glassy structure.
Due to the rapid cooling, no large crystals are formed [7]. Basalt is an inert material, i.e. it possesses
no pozzolanic reactivity.
In general, basalt has a composition of 45-55% SiO2, 2-6% alkalis (K2O and Na2O), 0.5-2.0% TiO2, 5-
14% FeO and 14% or more Al2O3 by mass proportion. Contents of CaO and MgO can be up to 10%
and in the range of 5% to 12% in mass proportion respectively. Basalt contains its SiO2 in the form of
plagioclase feldspar, pyroxene and olivine, which are the main minerals making up the material [7].
Several researchers have focused on the application of basalt fibres in normal concrete and ultra-
high performance concrete, as well as in autoclaved and non-autoclaved aerated concrete, although
the application of basalt as raw material in AAC is not yet studied.
4.3.1. Applications of basalt
Basalt was already used by the Romans, i.e. the material was used in its natural form as building
stones and pavements. Basalt can also be found in certain monuments and statues. In earlier times,
basalt was mainly used in the construction of dikes (covering), quay walls, breakwaters and jetties (in
the Netherlands). Nowadays, concrete is often used instead of basalt for these applications, although
the material is still used as covering for dikes. Basalt was and is still used for the production of tiles
and pavements. Besides these previously mentioned applications, there are two other and important
applications of basalt: application of basalt fibres in building materials and production of stone wool

57
with basalt. Several researches already focused on the application of basalt fibres in autoclaved
aerated concrete, although carbon fibres seems to be mainly utilised as reinforcing material in AAC.
These two major applications of basalt are described in more detail below.
Application of basalt fibres
Basalt wool can be used as reinforcing fibres in AAC. The fibres are obtained by crushing basalt wool
(Rockwool), followed by fibering and dispersing crushed basalt wool. The basalt wool is crushed into
pieces with sizes 3-6 mm. Desirably, the waste of basalt wool production is used. The basalt fibres are
included in the mix design within the range of 0.1% to 0.8% in mass proportion.
In more detail, the basalt wool production waste is cut into pieces with sizes of 3 to 6 mm. Next,
these pieces are fibered by grating them on a sieve together with sand grains, which separate the
filaments one from another, in order to let them fall into a container with an aqueous solution
containing a small amount of solved surface active material. To avoid cohesion between the
filaments in water, they are dispersed. Next, the solution is mixed with a mechanical propeller mixer.
The surface active material coats the surface of the filaments and separates them one from another.
After fibering and dispersion, the length of the filaments is decreased to 0.1 to 6 mm. In this way, the
basalt fibres are produced [66].
In the actual production of AAC, the basalt fibres are evenly distributed in the mixture through
proper mixing. The alkaline medium generated during autoclaving destroys the surface of the basalt
fibres, causing its corrosion. In the hydrothermal conditions, the dissolved lime reacts with silica and
alumina present in the basalt fibres which results in the formation of calcium- and alumina silicate
hydrates. These reaction products closely accrete with the general reaction products in AAC. In this
way, the qualitative links of basalt fibres with the AAC structure is achieved [66].
Several researchers have investigated the application of basalt fibres in AAC. Laukaitis et al. studied
the influence of non-hydrophilised and hydrophilised basalt, carbon, polypropylene and kaolin fibres
on the green body properties and the final properties of AAC. Basalt fibres (length: 5 mm, diameter:
4.60 m) affect the fluidity, rising and plastic strength of the green body, i.e. the fluidity and rising
decrease with increasing basalt fibres content while the plastic strength improves. In addition, both
the final compressive and flexural strength increases due to the addition of basalt fibres, for which
the increase in flexural strength is more significant compared to the increase in compressive
strength. Moreover, the hydrophilised fibres increase the strength more than the respective non-
hydrophilised fibres. The study concludes that the optimal content of basalt fibres is 0.3% relative to
the total amount of dry materials based on the strength results (highest strength). The reinforcing
properties of fibres depend mainly on the nature and geometric parameters of the fibres. By capacity
to enhance the strength, the studied types of fibre can be lined up as follow: carbon > polypropylene
> basalt > kaolin fibres [44].
Li discussed this scientific article and presented an interesting remark regarding the addition of basalt
fibres in AAC. Basalt fibres exhibit a high tensile strength (estimated 2.50 GPa [44]), a low thermal
conductivity, a low moisture absorption and can withstand high temperatures (up to 700°C).
Although basalt is appropriate for reinforcing concrete, it is not suitable for reinforcing AAC
regardless of the previous mentioned beneficial properties, due to the fact that basalt is not resistant
against alkalis. AAC possesses a strong alkaline environment as the aluminium powder reacts with
the water in the alkaline solution to generate hydrogen gas. Consequently, basalt fibres have no

58
long-term stability in AAC although they can reinforce AAC in short-term [45]. On the other hand, yet
another study confirms that basalt fibres are not resistant against alkaline conditions and as a result
they will corrode. However in the AAC matrix, basalt fibres are coated with calcium silica hydrate
crystals which protect the fibres against degradation from the alkaline environment. In this way, the
basalt fibres reinforce the matrix and improve the strength properties [67].
Another study focused on the impact of a complex additive consisting of continuous basalt fibres and
SiO2 micro-dust on the strength characteristics of AAC. To improve the strength of AAC, various finely
dispersed pozzolanic and fibrous additives can be utilised, in this case SiO2 dust and basalt fibres
respectively. The basalt fibre content was 0.3% relative to the total mass of solids, while the silica
micro-dust content was 1.0% as replacement of sand. Results indicated that the complex additive
indeed resulted in an enhanced strength [67].
Pehlivanli et al. investigated the effect of fibre type and fibre dimensions on the compressive
strength, flexural strength and thermal conductivity of AAC. The investigated fibre types are
polypropylene, basalt, carbon and glass fibres. Adding fibres to AAC results in an increased flexural
strength and ensures that the material exhibits ductile behaviour. Studies have been conducted on
reducing the cracking due to shrinkage by increasing the flexural strength by means of the addition of
fibres. Therefore, several researchers try to identify the effects of fibres on AAC. In this particular
article, quartz is substituted in volume by basalt fibres with a length of 8 mm for 0.304%. The study
confirms that fibres improved the compressive and flexural strength. Carbon fibre reinforced AAC
provided the best compressive and flexural strength, while basalt fibre reinforced AAC exhibited the
second best compressive and third best flexural strength compared to the other fibre types [54].
Application of basalt in Rockwool
Basalt is the volcanic rock material which is used for the production of stone wool. The basalt,
supplied as a crushed material, is stored in silos. At a temperature of 1500°C, basalt, blast furnace
slags and recycled stone wool are melted together in an oven to one liquid bulk. These three
materials are proportioned according to a defined mix design. It is of major importance that the
temperature in the oven is above 1500°C, because basalt starts to solidify again for temperatures
below 1500°C. Next, the liquid bulk falls down on rapidly rotating wheels and is thrown away. This
spinning process generates the fibres making up stone wool. While this liquid rock bulk cools down
and fibres are spun, a binder in the form of an organic resin and a small amount of oil is added, which
leads to the hardening of the layers of fibres in a later stage and providing water-repellent properties
respectively. The fibres are sucked with a lot of air against a vertically rotating perforated steel band,
in order to generate a membrane. This membrane is folded repeatedly, and is eventually the basis of
stone wool. The synthesised wool material is placed in an oven where it hardens, while the thermo-
hardening resin stabilises. As a result, the fibres connect to each other and plates of stone wool are
produced. The saw left-overs are immediately recycled in the production process. The production
process is illustrated in Figure 25 [57].

59
Figure 25: Production process of stone wool using basalt.
4.4. Copper slag
Slags are the glassy materials left over when metals are extracted from ores and have been
considered as waste materials. Copper slag or Cu slag is the industrial by-product generated during
the matte smelting and converting steps of the pyro-metallurgical production of copper from mined
copper ores. During the matte smelting, two separate liquid phases are formed: copper-rich matte
(sulphides) and slag (oxides). The copper settles down in the smelter as it has a higher density, so
that the impurities remain in the top layer. The top layer is removed and is cooled down afterwards
for solidification. The end product is a solid, hard material which is processed by means of crushing.
Cu slag grains are black and glassy. For every ton of metal production, about 2.2 ton of Cu slag is
produced. Each year, approximately 24.6 million ton of slag is produced during the worldwide copper
production. Slags containing less than 0.8% copper are either disposed as waste material or sold as
products with properties similar to those of basalt (crystalline) or obsidian (amorphous) [6] [27] [51].
Extraction of copper from the ores at a high temperature takes place by a smelting process followed
by a conversion process. The main components of a smelting charge are sulphides and oxides of iron
and copper. The charge also contains oxides such as Al2O3, CaO, MgO and principally SiO2 which is
either present in the original ore or added as flux. All these components (oxygen, oxides and
sulphides) mainly control the chemistry and physical composition of the smelting system. In addition,
the oxidation/reduction potential of the gases which are used to heat and melt the charge play an
important role. The smelting ensures the sulphidisation of all copper present in the charge (Cu2S) so
that the copper enters the matte phase [27] [61].
During the production of copper from copper ores, the oxides and sulphides combine covalently to
form Cu-Fe-O-S phases in the absence of silica. During the smelting, silica is added and it combines
with the oxides to form strongly bonded silicate anions which group together to form the slag phase.

60
The sulphides show no tendency to form these anions and thus, they remain a distinct covalent
matte phase. Silica is directly added for the most complete isolation of copper in the matte which
takes place at near saturation concentration with SiO2. A certain amount of lime and alumina is
added to stabilise the slag structure [27] [61]. The molten slag is removed from the furnace (at 1000-
1300°C). After this step, there are two possibilities [27] [51] [61]:
The liquid slag is cooled down slowly (air-cooled), leading to the formation of a dense, hard,
crystalline product. Air-cooled slag has a black colour and a glassy appearance.
The liquid slag is poured into water, resulting in a quick solidification and the formation of an
amorphous, granulated slag. Granulated copper slag is more porous and thus, has a lower
specific gravity and higher absorption capacity compared to air-cooled slag. Furthermore, the
granulated slag is composed of regularly shaped angular particles.
In most cases, the generated slag is an impure, iron silicate glass with small inclusions of copper and
copper sulphide. The chemical composition of the slag varies depending on the process and type of
furnace, as well as on the composition of the ore. The slag contains various components including
silica, iron, alumina and calcium oxide. The typical chemical composition of slag is as follows: Fe2O3:
35-60%, SiO2: 25-40%, Al2O3: 3-15%, CaO: ≤10%, MgO: 0.7-3.5%, CuO: 0.3-2.1%. As can be seen, the
copper content is limited to 0.5-2%. Oxide compositions of copper slag from different origins are
listed in Table 11. In its mineralogical composition, the presence of fayalite and magnetite among
other minerals is common. The specific gravity of copper slag ranges from 2.8 to 3.8 (typically around
3.4 à 3.6) which mainly depends on the iron content, while the bulk density ranges from 2300 kg/m³
to 2600 kg/m³. The unit weight of the slag is higher compared to that of conventional aggregates [27]
[51] [61].
Table 11: Chemical compositions of copper slag from different origins, 1-10: [27], 11: [51], 12-18: [61].
Oxide SiO2 Al2O3 CaO Fe2O3 MgO SO3 CuO
1 41.0 3.8 5.2 44.8 1.2 1.1 - 2 31.9 2.4 4.0 39.7 2.8 - 1.0 3 37.1 - - 41.5 - 0.1 0.8 4 29.9 - - 47.8 - - 0.7 5 30.3 - 2.8 46.2 - 0.6 0.7 6 - - - 47.1 - 1.5 0.7 7 28.0 - - 44.0 - - 0.6 8 26.1 6.8 0.7 47.8 1.0 1.5 0.8 9 24.7 15.6 10.9 44.8 1.7 0.3 2.1 10 27.2 14.7 17.4 34.6 3.5 0.3 1.6 11 32.0 2.0 1.5 43.0 0.8 0.1 0.6 12 34.5 6.6 2.2 49.5 1.5 1.2 0.4 13 36.0 3.5 9.3 45.3 3.2 0.5 0.3 14 26.0 - 2.5 62.0 3.7 - 1.4 15 35.5 5.9 2.1 52.0 1.1 0.1 0.9 16 30.1 4.0 0.6 60.0 0.8 0.3 0.8 17 34.3 3.8 7.9 53.7 0.9 3.0 - 18 31.0 6.0 4.0 36.0 - - 0.6
Several attempts have been made by the copper producing industry and researchers all over the
world to explore the possible useful applications of copper slag. Other application possibilities apart

61
from recovering the valuable metals by various extractive metallurgical methods must be identified.
For recovery of the metals from the slag, several extraction processes exist: pyro-metallurgical,
hydro-metallurgical method or a combination of the two. When the metals are extracted, the slag is
left over and is often disposed in landfills which occupy large areas of land, despite the increasing
rate of reusing the slags. Disposal, landfilling or stockpiling of such large quantities of slag cause
environmental and space problems and require high costs [27].
Processed air-cooled and granulated copper slag exhibit certain favourable mechanical properties for
utilisation as aggregates, including excellent soundness characteristics, good abrasion resistance and
great stability. Instead of landfilling, the slag can be applied in construction materials and other
applications taking full advantage of its physical-mechanical properties. Therefore, several
application possibilities were explored by a number of researchers [27]. The utilisation of copper slag
in building materials (aggregates, cement replacement) has three major advantages: eliminating the
costs of disposal, reducing the costs of the building material and minimising the pollution of the
environment [6]. Thus, the use of Cu slag in building materials provides potential economic as well as
environmental benefits for all related industries, particularly in areas where a considerable amount
of slag is produced [51] [61].
Current management options for copper slag are recovering of valuable metals, production of value
added products (e.g. application in concrete) and disposal in landfills or stockpiles [27]. Murari et al.
divided the utilisation of Cu slag into three major application categories: copper slag as an abrasive
medium, use of copper slag in the pavement industry and the use of copper slag in building materials
[51]. These slags have been used in cement and concrete (cement replacement, aggregates), and as
filler material, granular base, embankment material, aggregates substitutes in hot mix asphalt, mine
backfill material, ballast (e.g. railway), pavements, roadbeds, abrasive material, cutting tool, roofing
granules material, glass and tiles [27] [51] [61]. The term ‘abrasive’ refers to a wide range of
materials (blasting media) applied to establish a certain profile on clean steel and remove unwanted
coatings or impurities from the steel’s surface or other substrates [51]. Copper slag applied as an
abrasive medium is used to eliminate rust, timeworn coating and other impurities [48].
The application of copper slag in cement clinker, normal concrete, (ultra) high performance concrete,
alkali activated systems and glass ceramic foams is already investigated extensively, whereas its use
as alternative raw material in AAC not yet. Many researchers have studied the application of Cu slag
in the production of cement, mortar and concrete as raw materials for clinker, cement replacement
and both fine and coarse aggregates. Reports of the Portland Cement Association mention that
copper slag already has been used in full-scale cement manufacturing in different plants. When Cu
slag is used as raw material for cement clinker production, it can serve as both iron adjusting and
mineralising compound. Furthermore, the slag also improves the grindability of the clinker [61].
One research investigated the effect of utilising Cu slag as a replacement of sand on the properties of
high performance concrete. The study concluded that 40% slag (in weight percentage) incorporation
should be applied in order to achieve high performance concrete with good strength and durability
properties [6].
Al-Jabri et al. conducted an experimental research regarding the effect of using copper slag as a fine
aggregate on the properties of cement mortars and concrete. For this, several mortar and concrete
mixtures were prepared with different slag contents, ranging from 0% to 100% as fine aggregates

62
replacement (partial and/or full replacement). The investigators conclude that up to 40% à 50%
copper slag is feasible as fine aggregates substitution by weight in order to achieve a concrete with
good strength and durability properties [5].
Another study focused on the utilisation of copper slag as fine aggregates in alkali activated slag
concrete. The performance of alkali activated slag concrete incorporating Cu slag as fine aggregate is
compared to conventional concrete with Portland cement. The experimental results indicate the
complete replacement of sand by slag by volume does not result in significant strength losses [48].
One project prepared glass ceramics foams using iron-rich copper slag. Two different mix designs
were selected for preparation of glass from slag with different amounts of Fe2O3 based on
conventional soda lime glass containing Fe2O3 as additive. Glass with 47% slag (24% Fe2O3) and 32%
slag (16% Fe2O3) in mass proportion were prepared. The prepared samples are subjected to micro-
structural analysis. Glass ceramic foam with 47% slag was impossible to obtain in practice, while glass
ceramic foam with 32% slag was prepared successful, exhibiting a relatively high compressive
strength [49].
4.5. Granite
Granite is defined as a light-coloured (grey or dark red), coarse-grained, hard, crystalline, igneous
rock mainly consisting of quartz (at least 20%), alkali feldspar and mica (biotite and/or muscovite).
Hypersolvus granites are characterised by one type of alkali feldspar (usually microperthite), whereas
subsolvus granites are characterised by two types of alkali feldspar (microperthite and albite). There
are several processes through which granite can be formed: partial melting of old continental crust,
on a local scale by in situ replacement of continental crust called granitisation, fractional
crystallisation of basalt magma, or a combination of these processes. As granite is formed far below
the surface, the minerals have had enough time to form crystals due to the slow cooling [7]. Granite
differs from basalt, i.e. granite is an intrusive igneous rock which means that the rocks are formed
subterranean, whereas basalt is an extrusive igneous rock formed at the Erath’s surface.
Granite has a specific gravity ranging from 2.40 to 2.65 g/cm³ [13] [17] [21] [65] [81]. The chemical
composition of granite is typically 70-77% SiO2, 11-15% Al2O3, 1% CaO, 2-3% Fe2O3, <1% MgO, 3-5%
K2O, 3-5% Na2O [12]. Chemical compositions of granite listed in several scientific articles are
presented in Table 12. Granite powder will probably serve as an inert filler.
Table 12: Chemical compositions of granite listed in various articles.
Oxide | Source [13] Aggregates [21] Powder [65] Powder
SiO2 53.2 85.5 72.6 Al2O3 14.1 2.1 15.6 CaO 9.1 4.9 - Fe2O3 12.3 0.4 - MgO 8.3 2.5 0.83 Na2O 1.2 - 4.2 K2O - - 6.8 LOI 1.4 1.1 -
Granite was already used by the ancient Egyptians (e.g. construction of obelisks), as well as by the
Romans (e.g. for shafts of columns). The rocks are capable of enduring a high polish. Since the

63
development of industrialised methods for cutting and polishing granite stones (19th century), granite
is mainly used for ashlar works and as a dimension stone, such as: funerary monuments and
gravestones, decorative pavements, interior applications (kitchen countertops), but as well granite is
used as industrial machinery parts (surface plates).
Granite is a quite common building material being widely used all over the world. During the
preparation, cutting and polishing processes of granite in industry, vast amounts of granite grains
and granite powder/dust is generated, which are considered as industrial by-products or waste
materials. During these handling processes, granite mass is lost by approximately 15%-30% in the
form of fine dust and grains, which is a quite large quantity meaning millions of tons of granite waste
per year. In different parts of the world, granite waste is disposed in landfills and accumulated,
possibly posing a detrimental effect on the environment. Researchers must aim to find a sustainable
way to get rid of granite waste, as the industry is forced to find options for reusing the waste. These
materials can be suitable for use in construction materials such as conventional concrete, which is a
possible way for managing these waste materials. The waste materials possibly could be efficiently
utilised in the production of construction materials rather than managing it as a waste material which
leads to pollution and high economic costs. Granite waste (fine powder) does not require any
processing before it is applied in concrete production, and is easily available [65] [81].
The application of granite granulates, granite powder and granite dust in normal concrete is already
investigated by several researchers, whereas application possibilities in autoclaved aerated concrete
are not studied yet. Granite is used as coarse or fine aggregates in different types of concrete, as well
as a cement replacement material (granite powder). Furthermore, the application of granite
(powder) in alkali activated systems is as well under research [60].
One study focused on the durability of concrete made with granite and marble as recycled coarse
aggregates, while river sand and BFS served as fine aggregates. Waste granite and marble was
collected and crushed resulting in a maximum nominal size of 19 mm, serving as the only coarse
aggregates. The influence of these coarse aggregates on various properties of concrete were
identified [13].
Another research study investigated experimentally the physical, mechanical properties and
corrosion resistance of concrete modified with granite dust (waste material). The granite dust
partially replaced cement with substitution levels 5%, 7.5%, 10% and 15% [21].
Singh et al. used granite cutting waste (powder) as partial replacement of natural fine aggregates
(river sand) in conventional concrete. The applied substitution levels are 10%, 20%, 30% and 50%.
Unfortunately, granite cannot be used as complete replacement of sand, and some optimum level
occurs. The strength and durability performance are examined, as well as micro-structural analysis is
performed. The experimental test results indicate that the optimum replacement level is 30% for
which the performance of the concrete is significantly improved. The researchers conclude that
granite waste can be used as partial fine aggregate material which reduces the costs of concrete
production and the detrimental effect on the environment (less waste disposal) [65].
One research study investigated the influence of crushed granite fine aggregates on the rheological
and mechanical properties of concrete. The granite aggregates were collected in a granite crushing
plant which produces granite coarse aggregates. These fine aggregates are the undersized material

64
from the crushers, which have been used as roadway material. Concretes were produced with 10%,
30% and 50% granite aggregates in volume fraction relative to fine aggregates (sand) [17].
Yet another research focused as well on the experimental study of the suitability of waste granite
powder as a replacement material for fine aggregates in concrete. The experimental parameter is the
substitution level, i.e. concrete was prepared with 0%, 5%, 10%, 15%, 20% and 25% granite as
replacement of the fine aggregates [81].

65
References
[1] Abali, Y., Bayca, S.U., Targan, S. (2006). Evaluation of blends tincal waste, volcanic tuff,
bentonite and fly ash for use as a cement admixture. Journal of Hazardous Materials, no. 131,
pp. 126-130.
[2] Al-Akhras, N.M., Abu-Alfoul, B.A. (2002). Effect of wheat straw ash on mechanical properties of
autoclaved mortar. Cement and Concrete Research, no. 32, pp. 859-863.
[3] Albayrak, M., Yörükoglu, A., Karahan, S., Athhan, S., Aruntas, H.Y, Girgin, I. (2007). Influence of
zeolite additive on properties of autoclaved aerated concrete. Building and Environment, no.
42, pp. 3161-3165.
[4] Aliabdo, A.A., Abd-Elmoaty, A.E.M., Hassan, H.H. (2014). Utilisation of crushed clay brick in
cellular concrete production. Alexandria Engineering Journal, no. 53, pp. 119-130.
[5] Al-Jabri, K.S., Al-Saidy, A.H., Tahe, R. (2011). Effect of copper slag as fine aggregate on the
properties of cement mortars and concrete. Construction and Building Materials, no. 25, pp.
933-938.
[6] Al-Jabri, K.S., Hisada, M., Al-Oraimi, S.K., Al-Saidy, A.H. (2009). Copper slag as sand
replacement for high performance concrete. Cement & Concrete Composites, no. 31, pp. 483-
488.
[7] Allaby, M. (2008). A dictionary of Earth sciences. Oxford University Press, Oxford, United
kingdom.
[8] Andolsun, S. (2006). A study on material properties of autoclaved aerated concrete (AAC) and
its complementary wall elements: Their compatibility in contemporary and historical wall
section. Graduation thesis, Natural and Applied Sciences, Department of Architecture, Middle
East Technical University, Ankara, Turkey.
[9] Baeza, F., Payá, J., Galao, O., Saval, J.M., Garcés, P. (2014). Blending of industrial waste from
different sources as partial substitution of Portland cement in pastes and mortars. Construction
and Building Materials, no. 66, pp. 645-653.
[10] Bao-guo, M., Zheng, X. (1999). Study on a new kind of aerated concrete containing
efflorescence sand – phosphorus slag – lime. Journal of Building Materials, no. 2, pp. 223-228.
[11] Baspinar, M.S., Demir, I., Kahraman, E., Gorhan, G. (2014). Utilisation potential of fly ash
together with silica fume in autoclaved aerated concrete production. KSCE Journal of Civil
Engineering, no. 18, pp. 47-52.
[12] Berkeley Univeristy of California, College of Natural Resources. (n.d.). Granite. Retrieved April
14, 2016, from http://nature.berkeley.edu/classes/eps2/wisc/granite.html.
[13] Binici, H., Shah, T., Aksogan, O., Kaplan, H. (2008). Durability of concrete made with granite and
marble as recycle aggregates. Journal of Materials Processing Technology, no. 208, pp. 299-
308.
[14] Boesten, E.P.M. (2012). Influence of alternative raw materials on autoclaved aerated concrete.
Master Thesis, Eindhoven University of Technology.
[15] Cherrak, M., Bali, A., Silhadi, K. (2013). Concrete mix design containing calcareous tuffs as a
partial sand substitution. Construction and Building Materials, no. 47, pp. 318-323.
[16] Cobanoglu, I., Özpinar, Y., Özbek, A. (2003). Engineering properties of tuffs in the Sandikli
region (Afyon – Turkey) and their possible use as concrete aggregates. Bulletin of Engineering
Geology and the Environment, no. 62, pp. 369-378.

66
[17] Cordeiro, G.C., de Alvarenga, L.M.S.C., Rocha, C.A.A. (2016). Rheological and mechanical
properties of concrete containing crushed granite fine aggregate. Construction and Building
Materials, no. 111, pp. 766-773.
[18] de Gennaro, R., Cappelletti, P., Cerri, G., de’Gennaro, M., Dondi, M., Langella, A. (2005).
Neapolitan yellow tuff as raw material for lightweight aggregates in lightweight structural
concrete production. Applied Clay Science, no. 28, pp. 309-319.
[19] Dunster, A.M. (2007). Incinerated sewage sludge ash (ISSA) in autoclaved aerated concrete
(AAC). BRE, Characterisation of Mineral Wastes, Resources and Processing technologies –
Integrated waste management for the production of construction material.
[20] Dunster, A.M. (2007). Industrial sector study on the utilisation of alternative materials in the
manufacture of manufactured concrete products. BRE, Characterisation of Mineral Wastes,
Resources and Processing technologies – Integrated waste management for the production of
construction material.
[21] Elmoaty, A.E.M.A. (2013). Mechanical properties and corrosion resistance of concrete modified
with granite dust. Construction and Building Materials, no. 47, pp. 743-752.
[22] Fan, J., Cao, D., Jing, Z., Zhang, Y., Pu, L., Jing, Y. (2014). Synthesis and microstructure analysis
of autoclaved aerated concrete with carbide slag addition. Journal of Wuhan University of
Technology-Materials Science, no. 29, pp. 1005-1010.
[23] Fang-xian, L., You-zhi, C., Shi-zong, L. (2008). Experimental investigation on aerated concrete
with addition of lead-zinc tailings. Journal of Southwest Jiaotong University, no. 43, pp. 810-
815.
[24] Federatie Belgisch Cellenbeton (FeBeCel). (2007). Cellenbeton – Bouwsteen van de toekomst.
Brussel: Jacques Sizaire.
[25] Florea, M.V.A. (2014). Secondary materials applied in cement-based products: treatment,
modelling and environmental interaction. PhD Thesis, Eindhoven University of Technology.
[26] Geisweid, J. (2008). Geologie der Eifel. Trasswerke Meurin, Kretz, Germany.
[27] Gorai, B., Jana, R.K., Premchand. (2003). Characteristics and utilization of copper slag – a
review. Resources, Conservation and Recycling, no. 39, pp. 299-313.
[28] Grutzeck, M.W., Kwan, S., DiCola, M. (n.d.). Alkali activated autoclaved aerated concrete made
with fly ash derived cenospheres: effect of fly ash and pre-curing temperature. Materials
Research Institute, MRL Building, The Pennsylvania State Unive rsity, National Science
Foundation.
[29] Gundlach, H. (1973). Dampfgehärtete Baustoffe. Bauverlag GmbH, Wiesbaden und Berlin,
Germany.
[30] Hauser, A., Eggenberger, U., Mumenthaler, T. (1999). Fly ash from cellulose industry as
secondary raw material in autoclaved aerated concrete. Cement and Concrete Research, no.
29, pp. 297-302.
[31] HESS AAC Systems. (n.d.). Autoclaved aerated concrete. Retrieved September 14, 2015, from
http://www.topwerk.com/en/hess-aac-systems/aac/.
[32] Hlavacek, P., Smilauer, V., Skvara, F., Kopecky, L., Sulc, R. (2015). Inorganic foams made from
alkali-activated fly ash: mechanical, chemical and physical properties. Journal of the European
Ceramics Society, No. 35., pp. 703-706.
[33] Holt, E., Raivio, P. (2005). Use of gasification residues in aerated autoclaved concrete. Cement
and Concrete Research, no. 35, pp. 796-802.

67
[34] Huang, X.Y., Ni, W., Cui, W.H., Wang, Z.J., Zhu, L.P. (2012). Preparation of autoclaved aerated
concrete using copper tailings and blast furnace slag. Construction and Building Materials, no.
27, pp. 1-5.
[35] Karakurt, C., Kurama, H., Topçu, I.B. (2010). Utilisation of natural zeolite in aerated concrete
production. Cement & Concrete Composites, no. 32, pp. 1-8.
[36] Kikuma, J., Tsunashima, M., Ishikawa, T., Matsuno, S., Ogawa, A., Matsui, K. (2011).
Development of an in situ x-ray diffraction system for hydrothermal reactions and its
application to autoclaved aerated concrete formation. Denver X-ray Conference, International
Centre for Diffraction Data, Denver, United States.
[37] Klingner, R.E. (2008). Autoclaved aerated concrete. Retrieved September 14, 2015, from
http://www.masonrymagazine.com/using-autoclaved-aerated-concrete-correctly.
[38] Kolomatskaya, S., Lesovik, V., Kolomatskiy, A. (2011). Hydration processes during autoclaved
aerated concrete structure formation. 5th International Conference on Autoclaved Aerated
concrete, Bydgoszcz, Poland.
[39] Koutny, O., Opravil, T., Porizka, J. (2014). Application of metakaolin in autoclaved aerated
concrete technology. Advanced Materials Research, no. 1000, pp. 174-177.
[40] Kunchariyakun, K., Asavapisit, S., Sombatsompop, K. (2015). Properties of autoclaved aerated
concrete incorporating rice husk ash as partial replacement for fine aggregate. Cement and
Concrete Composites, no. 55, pp. 11-16.
[41] Kurama, H., Topçu, I.B., Karakurt, C. (2009). Properties of the autoclaved aerated concrete
produced from coal bottom ash. Journal of Materials Processing Technology, no. 209, pp. 767-
773.
[42] Lagosz, A., Szymanski, P., Walczak, P. (2011). Influence of the fly ash properties on properties of
autoclaved aerated concrete. 5th International Conference on Autoclaved Aerated concrete,
Bydgoszcz, Poland.
[43] Laskawiec, K., Gebarowski, P., Zapotoczna-Sytek, G., Malolepszy, J. (2011). Fly ashes of new
generation as a raw material to the production of autoclaved aerated concrete (AAC). 5th
International Conference on Autoclaved Aerated concrete, Bydgoszcz, Poland.
[44] Laukaitis, A., Keriene, J., Mikulskis, D., Sinica, M., Sezemanas, G. (2009). Influence of fibrous
additives on properties of aerated autoclaved concrete forming mixtures and strength
characteristics of products. Construction and Building Materials, no. 23, pp. 3034-3042.
[45] Li, M. (2011). A discussion of ‘Influence of fibrous additives on properties of aerated concrete
forming mixtures and strength characteristics of products. Construction and Building Materials,
no. 25, pp. 2169-2170.
[46] Matsui, K., Ogawa, A., Kikuma, J., Tsunashima, M., Ishikawa, T., Matsuno, S. (2011). Influence
of addition of Al compound and gypsum on tobermorite formation in autoclaved aerated
concrete studied by in situ x-ray diffraction. 5th International Conference on Autoclaved
Aerated concrete, Bydgoszcz, Poland.
[47] Miccoli, L., Fontana, P., Silva, N., Klinge, A., Cederqvist, C., Kreft, O., Qvaeschning, D., Sjöström,
C. (2015). Composite UHPC-AAC/CLC façade elements with modified interior plaster for new
buildings and refurbishment. Materials and production technology. Journal of Façade Design
and Engineering, no. 3, pp. 91-102.
[48] Mithun, B.M., Narasimhan, M.C. (2016). Performance of alkali activated slag concrete mixes
incorporating copper slag as fine aggregate. Journal of Cleaner Production, no. 112, pp. 837-
844.

68
[49] Mohamed, E., Shahsavari, P., Eftekhari-Yekta, B., Marghussian, V.K. (2015). Preparation and
characterization of glass ceramic foams produced from copper slag.Transactions of the Indian
Ceramic Society, no. 74, pp. 1-5.
[50] Mostafa, N.Y. (2005). Influence of air-cooled slag on physicochemical properties of autoclaved
aerated concrete. Cement and Concrete Research, no. 35, pp. 1349-1357.
[51] Murari, K., Siddique, R., Jain, K.K. (2015). Use of waste copper slag, a sustainable material.
Journal of Material Cycles and Waste Management, no. 17, pp. 13-26.
[52] Narayanan, N., Ramamurthy, K. (2000). Structure and properties of aerated concrete: a review.
Cement & Concrete Composites, no. 22, pp. 321-329.
[53] Oates, J.A.H. (1998). Lime and limestone: Chemistry and technology, production and uses.
Weinheim: Wiley-VCH.
[54] Pehlivanli, Z.O., Uzun, I., Demir, I. (2015). Mechanical and microstructural features of
autoclaved aerated concrete reinforced with autoclaved polypropylene, carbon, basalt and
glass fiber. Construction and Building Materials, no. 96, pp. 428-433.
[55] Rakovan, J. (2004). Word to the wise: Zeolite. Rock & Minerals, no. 79, pp. 271-273.
[56] Ramezanianpour, A.A. (2014). Cement replacement materials: properties, durability,
sustainability. Berlin: Springer-Verlag.
[57] Rockwool. (n.d.). Productieproces rotswol isolatie: hoe het werkt. Retrieved February 2, 2016,
from http://www.nl.rockwool.be/over+rockwool/de+organisatie/productieproces.
[58] Schnitzler, S. (2006). Autoclaved aerated concrete as a green building material. Applied
Research Paper, University of California, Davis, Sustainability and the Built Environment.
[59] Schober, G.(2011). Porosity in autoclaved aerated concrete (AAC): A review on pore structure,
types of porosity, measurement methods and effects of porosity on properties. 5th International
Conference on Autoclaved Aerated concrete, Bydgoszcz, Poland.
[60] Segers, S. (2015). Applying AEC waste and granite powder in alkali activated slag.
Masterproject 2, Department of the Built Environment, University of Technology Eindhoven.
[61] Shi, C., Meyer, C., Behnood, A. (2008). Utilization of copper slag in cement and concrete.
Resources, Conservation and Recycling, no. 52, pp. 1115-1120.
[62] Siddique, R. (2008). Waste materials and by-products in concrete. Berlin: Springer-Verlag.
[63] Siddique, R., Khan, M.I. (2011). Supplementary cementing materials. Berlin: Springer-Verlag.
[64] Simon, W., Schmitt, K. (2006). Bauen mit Tubag Trass. Tubag Tras, Kruft, Germany.
[65] Singh, S., Khan, S., Khandelwal, R., Chugh, A., Nagar, R. (2016). Performance of sustainable
concrete containing granite cutting waste. Journal of Cleaner Production, no. 119, pp. 86-98.
[66] Sinica, M., Sezeman, G., Cesnauskas, V., Mikulskis, D., Kligys, M. (2013). Method for
manufacturing of products from autoclaved aerated concrete and composition of autoclaved
aerated concrete. European Patent Application, EP2602234 A1, Vilnius Gediminas Technical
University, Vilnius, Lithuania.
[67] Sinica, M., Sezeman, G.A., Mikulskis, D., Kligys, M., Cesnauskas, V. (2014). Impact of complex
additive consisting of continuous basalt fibres and SiO2 microdust on strength and heat
resistance properties of autoclaved aerated concrete. Construction and Building Materials, no.
50, pp. 718-726.
[68] Smadi, M., Migdady, E. (1991). Properties of high strength tuff lightweight aggregate concrete.
Cement & Composites, no. 13, pp. 129-135.

69
[69] Song, Y., Guo, C., Qian, J., Ding, T. (2015). Effect of the Ca-to-Si ratio on the properties of
autoclaved aerated concrete containing coal fly ash from circulating fluidised bed combustion
boiler. Construction and Building Materials, no. 83, pp. 136-142.
[70] Song, Y., Li, B., Yang, E.H., Liu, Y., Ding, T. (2015). Feasibility study on utilisation of municipal
solid waste incineration bottom ash as aerating agent for the production of autoclaved aerated
concrete. Cement and Concrete Composites, no. 56, pp. 51-58.
[71] Straub, C. (2016). Private communication. Eindhoven University of Technology.
[72] Straub, C., Brouwers, H.J.H. ( 2013). Development of eco autoclaved aerated concrete. 1st
International Conference on the Chemistry of Construction Materials, Berlin, 7-9 October
2013, Monograph, no. 46, pp. 441-443, Ed. GDCh-Division of Chemistry of Construction
Materials, Franktfurt am Main, Germany.
[73] Straub, C., Florea, M.V.A., Brouwers, H.J.H. (2014). Investigation of the spread flow of
autoclaved aerated concrete (AAC) slurries. Conference Paper: GDCh-Tagung Bauchemie, 6-8
October 2014, Kassel, Germany, pp. 220-224.
[74] Straub, C., Florea, M.V.A., Brouwers, H.J.H. (2014). A newly developed stoichiometric model for
autoclaved aerated concrete. Conference Paper: GDCh-Tagung Bauchemie, 6-8 October 2014,
Kassel, Germany, pp. 53-56.
[75] Straub, C., Florea, M.V.A., Brouwers, H.J.H. (2015). Autoclaved Aerated Concrete – Mix
parameters and their influence on final properties. In H.-M. Ludwig & H.-B. Fischer (Eds.),
Conference Paper: 19. Inernationale Baustofftagung ibausil, no. 19, pp. 2822-2829. Weimar,
Germany: F.A. Finger-Institut für Baustoffkunde.
[76] Straub, C., Florea, M.V.A., Brouwers, H.J.H. (2015). The application of recycling glass by-
products in AAC. Oral: Jahrestagung 2015 “Aufbereitung und Recycling”, Freiburg, Germany:
Gesellschaft für Verfahrenstechnik UVR-FIA e.V.
[77] Straub, C., Quercia Bianchi, G., Florea, M.V.A., Brouwers, H.J.H. (2014). Slump flow of
autoclaved aerated concrete slurries. Proceedings of the 5th International Conference Non-
Traditional Cement and Concrete (NTCC2014), June 16-19 2014, Bmo, Czech Republic, pp. 273-
241.
[78] Straube, B., Walther, H. (2011). AAC with low thermal conductivity. 5th International
Conference on Autoclaved Aerated concrete, Bydgoszcz, Poland.
[79] Understanding cement, WHD Microanalysis Consultants Ltd. (n.d.). Autoclaved aerated
concrete (AAC, Aircrete). Retrieved January 27, 2016, from http://www.understanding-
cement.com/autoclaved-aerated-concrete.html.
[80] Ungkoon, Y., Sittipunt, C., Namprakai, P., Jetipattaranat, W., Kim, K., Charinpanitkul, T. (2007).
Analysis of microstructure and properties of autoclaved aerated concrete wall construction
materials. Journal of Industrial and Engineering Chemistry, no. 13, pp. 1103-1108.
[81] Vijayalakshima, M., Sekar, A.S.S., Ganesh prabhu, G. (2013). Strength and durability properties
of concrete made with granite industry waste. Construction and Building Materials, no. 46, pp.
1-7.
[82] Walczak, P., Malolepszy, J., Reben, M., Szymanski, P., Rzepa, K. (2015). Utilisation of waste
glass in autoclaved aerated concrete. Procedia Engineering, no. 122, pp. 302-309.
[83] Wikipedia. (n.d.). Eifel. Retrieved February 3, 2016, from https://en.wikipedia.org/wiki/Eifel.
[84] Wikipedia. (n.d.). Volcano. Retrieved February 3, 2016, from
https://en.wikipedia.org/wiki/Volcano.

70
[85] Wongkeo, W., Chaipanich, A. (2010). Compressive strength, microstructure and thermal
analysis of autoclaved and air cured structural lightweight concrete made with coal bottom ash
and silica fume. Materials Science and Engineering, no. 527, pp. 3676-3684.
[86] Wongkeo, W., Thongsanitgarn, P., Pimraksa, K., Chaipanich, A. (2012). Compressive strength,
flexural strength and thermal conductivity of autoclaved concrete block made using bottom ash
as cement replacement materials. Materials and Design, no. 35, pp. 434-439.
[87] Yan, W., Jie, Y., Ji-chun, C., Chang-qi, P. (2000). Aerocrete made with low silicon tailings of
Cheng Chao iron ore mine. Material Science, no. 15, pp. 58-62.
[88] Yilmaz, B., Uçar, A., Öteyaka, B., Uz, V. (2007). Properties of zeolitic tuff (clinoptilolite) blended
portland cement. Building and Environment, no. 42, pp. 3808-3815.