eindhoven university of technology master small scale ... · small scale cement production in...
TRANSCRIPT
Eindhoven University of Technology
MASTER
Small scale cement production in Tanzania?
Jongsma, I.L.A.
Award date:1996
DisclaimerThis document contains a student thesis (bachelor's or master's), as authored by a student at Eindhoven University of Technology. Studenttheses are made available in the TU/e repository upon obtaining the required degree. The grade received is not published on the documentas presented in the repository. The required complexity or quality of research of student theses may vary by program, and the requiredminimum study period may vary in duration.
General rightsCopyright and moral rights for the publications made accessible in the public portal are retained by the authors and/or other copyright ownersand it is a condition of accessing publications that users recognise and abide by the legal requirements associated with these rights.
• Users may download and print one copy of any publication from the public portal for the purpose of private study or research. • You may not further distribute the material or use it for any profit-making activity or commercial gain
Take down policyIf you believe that this document breaches copyright please contact us providing details, and we will remove access to the work immediatelyand investigate your claim.
Download date: 29. Jun. 2018

FACULTY OF TECHNOLOGY MANAGEMENT
section International Technological Development Sciences
Small scale cement production in Tanzania ?
part 1: Main text
Ivo Jongsma
MSc. thesis Eindhoven University of Technology
Contents Preface
Executive summary
Abbreviations and units
1. Research questions and design l. lRelevance of study 1.2 Propositions and hypothesis 1.3 Problem definition and research goal 1.4 Elaboration on problem definition 1.5 Research methodology
2. Demand for OPC and occurence of limestone deposits 2.1 Demand for OPC 2.2 Limestone deposits 2.3 Suitable locations
3. Commercial analyses 3.1 Studied equipment packages 3 .2 Approach 3.3 Commercial and sensitivity analyses 3.4 Comparison of the different plants 3.5 Generalization of the results
4. Macro-economic evaluation 4.1 Introduction 4.2 Costs 4.3 Benefits 4.4 Summary of results and conclusions
5. Ecological sustainability 5 .1 Introduction 5.2 Ecological sustainability: RK vs VSK OPC production 5.3 Ecological sustainability of OPC vs an other binder 5.4 Overall conclusion
6. Conclusions and recommendations 6.1 Limitations 602 Summarf of findings 6.3 Main conclusions 6.4 Recommendations and further research
7. Sources of information
lll
v
VI
7 11
16 16 26 29
31 31 32 33 37 41
46 146 47 53 59
61 61 61 66 69
70 70 71 72 72
77
i

ii
Preface
This report contains the findings of my MSc-research into the possible use of small scale cement production in Tanzania. This research is the final part of the MSc-course "International Technology Development Sciences" at the faculty of Technology Management at the Eindhoven University of Technology.
In order to gather data visits were paid to England, Austria, Germany and Kenya, but the main data were gathered during a six-month stay in Tanzania, Africa.
The report consists of two parts~ the first part contains the main text: the analyses, evaluation and interpretation of the data. The second part contains the Appendices which mainly contain the data and elaborate on how certain data were arrived at.
For the final establishment of this report I would like to give thanks to a lot of people who made their contribution to this work, and without whose aid it would have been impossible to come to this result. First of all I would like to give thanks to everybody at the TPCC factory and Tanzania Saruji Corporation headquarters in Dar es Salaam and the BPCC factory in Mombasa for their patience and time in answering questions of an un-invited guest. Special thanks goes out to Mr. Malleko, the deputy operations manager at TPCC who introduced me to many people in the TPCC factory, and to Mr. Francis Barrow, the works director at BPCC for allowing me to wander about at the factory in Mombasa.
I would also like to thank Claude Carrier at the UNIDO office in Vienna for helping me to get into contact with Indian suppliers of small scale cement production equipment, and Mr. Horst Klatt in Germany for helping me in answering questions on the technical aspects of small scale cement production.
Furthermore I would like to thank my local supervisor, Mr. Mamiro from the NCC for his help and the straight-to-the-point consultations, and of course also my supervisors at the EUT, Emilia van Egmond, Peter Erkelens and Lex Lemmens for their guidance in helping me finding the right track in this research.
Last but not least, I would like to thank my parents for their continuous stream of lettres, optimism, criticism and any other support in finalizing this research.
!vo Jongsma february 1996
iii

iv
Executive summary Ordinary Portland Cement (OPC) is an indispensable building material in the development of any country, mainly because of its application in concrete and the excellent qualities of this material. In spite of the fact that Tanzania accomodates three cement factories it still appears to suffer a shortage of cement. The three cement factories in Tanzania can be characterised as very capital-intensive and large-scale plants.
In this study it is argued that there is an alternative to the presently employed technology for cement production, which is more appropriate in Tanzania, and .should hence be used to expand the production capacity to meet the demand for cement in Tanzania. This concerns small scale cement production technology, which is based on vertical shaft kilns. This technology has become very succesfull in India, which also is the only country were commercial suppliers of this technology can be found. This study is an evaluation of four )\ different small scale Indian cement plants of different scales of production on their I\ suitability for application in Tanzania. The suitability is defined in terms of commercial,
1
macro-economic and ecological aspects. ·· ·· '1
First of all the demand for cement in Tanzania was studied and projections of this demand were made in order to get an insight into the actual need for an expansion of the cement industry. It appeared that the present demand was below the installed production capacity, but above the present output of the existing factories, and that the demand would probably outgrow the installed production capacity within the next 15 years, necessitating an expansion of the cement industry.
Secondly the Indian cement production equipment packages were studied on their microeconomic viability. It appeared that as a consequence of economies of scale effects and the high inflation in Tanzania only the larger scales of production are likely to tum out profitable. The largest of the studied scales of production might even tum out a lucrative investment opportunity.
Concerning the macro-economic effects it appeared that the small scale technology indeed has better characteristics than the application of large scale technology, and that within the studied small scales of production the largest scale (200 ton per day output capacity) has the best macro-economic characteristics. This concerns aspects as the capital requirement, contribution to the GDP and future economic development and employment creation.
Furthermore it turned out that the most important resource exploitation effects and noxious emissions of small scale cement production do not differ much from large scale cement prnduction. If, on the other hand, the material cement (Ordinary Portland Cement) is compared to an alternative binder it appears that the application of OPC in construction is preferable when it comes to ecological aspects because of the smaller (direct and indirect) emissions and resource exploitation effects.
Based on these findings it is concluded that especially the largest scale of production of the (Indian) small scale cement production technology is indeed suitable for application in Tanzania.
v
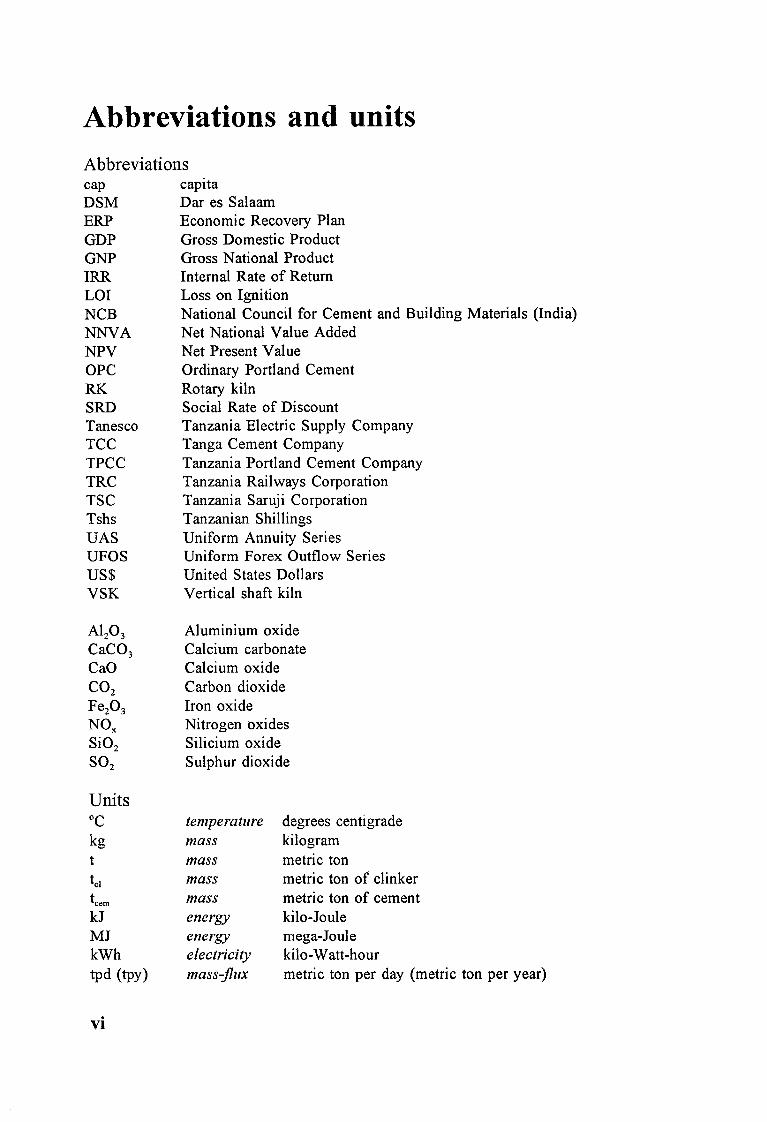
Abbreviations and units Abbreviations cap DSM ERP GDP GNP IRR LOI NCB NNVA NPV OPC RK SRD Tanesco TCC TPCC TRC TSC Tshs UAS UFOS US$ VSK
Al20 3
CaC03
Cao C02
Fe20 3
NOX Si02
S02
Units oc kg t
teem
kJ MJ kWh tpd (tpy)
vi
capita Dar es Salaam Economic Recovery Plan Gross Domestic Product Gross National Product Internal Rate of Return Loss on Ignition National Council for Cement and Building Materials (India) Net National Value Added Net Present Value Ordinary Portland Cement Rotary kiln Social Rate of Discount Tanzania Electric Supply Company Tanga Cement Company Tanzania Portland Cement Company Tanzania Railways Corporation Tanzania Saruji Corporation Tanzanian Shillings Uniform Annuity Series Uniform Forex Outflow Series United States Dollars Vertical shaft kiln
Aluminium oxide Calcium carbonate Calcium oxide Carbon dioxide Iron oxide Nitrogen oxides Silicium oxide Sulphur dioxide
temperature mass mass mass mass energy energy electricity mass-flux
degrees centigrade kilogram metric ton metric ton of clinker metric ton of cement kilo-Joule mega-Joule kilo-Watt-hour metric ton per day (metric ton per year)

1. Research questions and design
1.1 Relevance of the study
1.1.1 Introduction Based on preliminary desk-research it appeared that there is a shortage of cement in Tanzania. This shortage of cement is especially severe in outlying regions, far from the cement factories, because of the large distances, bad infrastructure and limited transport system. This is an undesirable situation, because of the consequences for the construction sector and the general relevance of cement for the development of a country.
Figure 1.1: The cement factories of Tanzania
• Nairobi
KENYA
• Sliinysngs
• [):)do ma
TANZANIA
•1ringa
r.beys • 1z Mbeya cement Corrpany
• Major city
1 *Cement factory
1
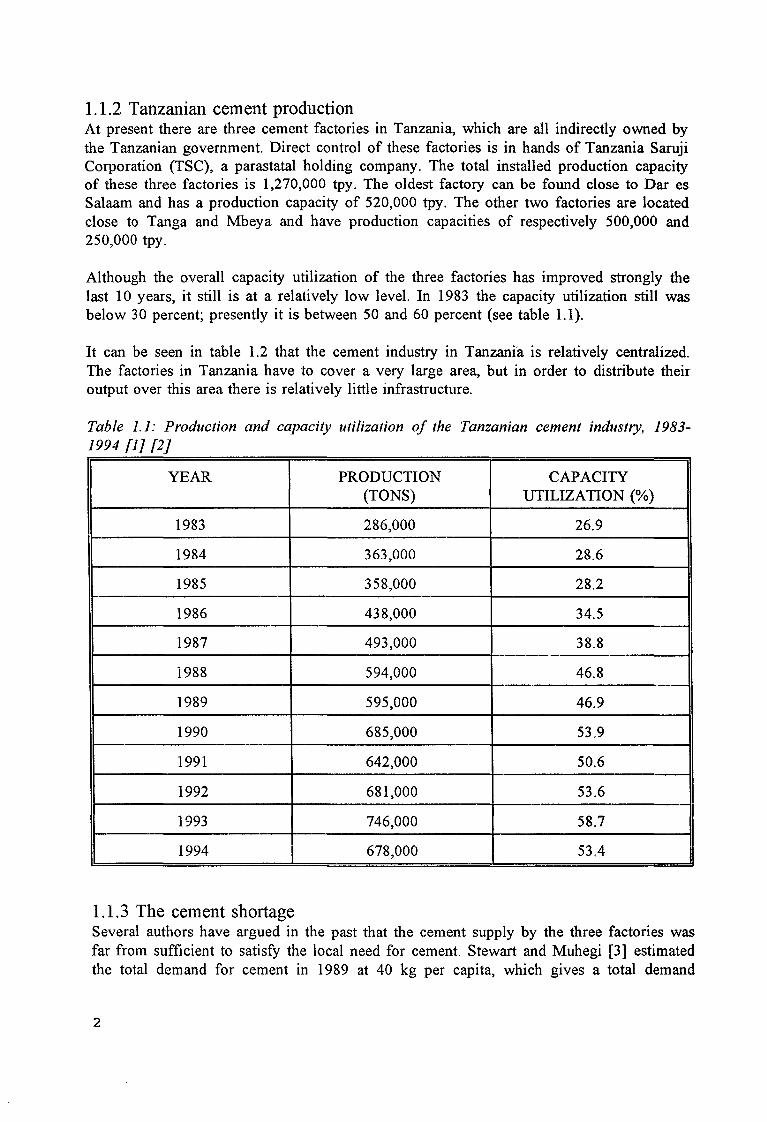
1.1.2 Tanzanian cement production At present there are three cement factories in Tanzania, which are all indirectly owned by the Tanzanian government. Direct control of these factories is in hands of Tanzania Saruji Corporation (TSC), a parastatal holding company. The total installed production capacity of these three factories is 1,270,000 tpy. The oldest factory can be found close to Dar es Salaam and has a production capacity of 520,000 tpy. The other two factories are located close to Tanga and Mbeya and have production capacities of respectively 500,000 and 250,000 tpy.
Although the overall capacity utilization of the three factories has improved strongly the last 10 years, it still is at a relatively low level. In 1983 the capacity utilization still was below 30 percent; presently it is between 50 and 60 percent (see table 1.1).
It can be seen in table 1.2 that the cement industry in Tanzanfa is relatively centralized. The factories in Tanzania have to cover a very large area, but in order to distribute their output over this area there is relatively little infrastructure.
Table 1.1: Production and capacity utilization of the Tanzanian cement industry, 1983-1994 [1] [2}
YEAR PRODUCTION CAPACITY (TONS) UTILIZATION(%)
1983 286,000 26.9
1984 363,000 28.6
1985 358,000 28.2
1986 438,000 34.5
1987 493,000 38.8
1988 594,000 46.8
1989 595,000 46.9
1990 685,000 53.9
1991 642,000 50.6
1992 681,000 53.6
1993 746,000 58.7
I 1994 I 678,000 I 53.4 I
1.1.3 The cement shortage Several authors have argued in the past that the cement supply by the three factories was far from sufficient to satisfy the local need for cement. Stewart and Muhegi [3] estimated the total demand for cement in 1989 at 40 kg per capita, which gives a total demand
2
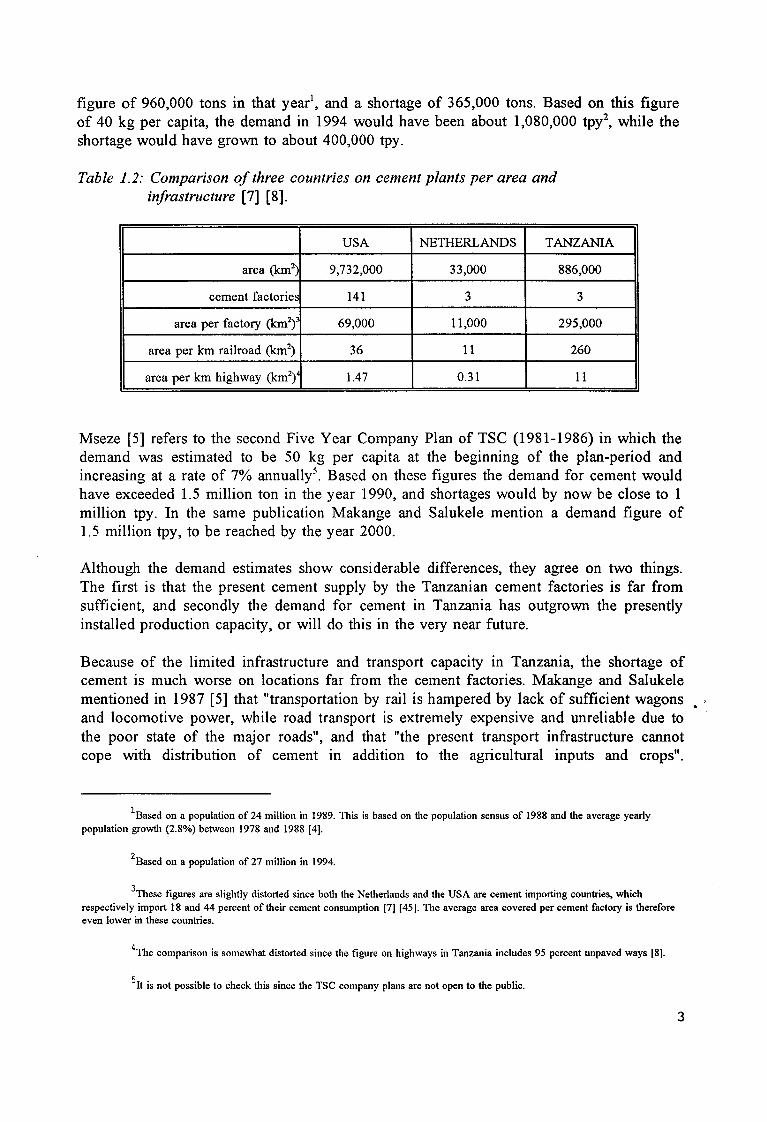
figure of 960,000 tons in that year1, and a shortage of 365,000 tons. Based on this figure of 40 kg per capita, the demand in 1994 would have been about 1,080,000 tpy2
, while the shortage would have grown to about 400,000 tpy.
Table 1.2: Comparison of three countries on cement plants per area and infrastructure [7] [8].
USA NETHERLANDS TANZANIA
area (km2) 9,732,000 33,000 886,000
cement factories 141 3 3
area per factory (km2)' 69,000 11,000 295,000
area per km railroad (km2) 36 11 260
area per km highway (km2)
4 1.47 0.31 11
Mseze [5] refers to the second Five Year Company Plan of TSC (1981-1986) in which the demand was estimated to be 50 kg per capita at the beginning of the plan-period and increasing at a rate of 7% annually5
. Based on these figures the demand for cement would have exceeded 1.5 million ton in the year 1990, and shortages would by now be close to 1 million tpy. In the same publication Makange and Salukele mention a demand figure of 1.5 million tpy, to be reached by the year 2000.
Although the demand estimates show considerable differences, they agree on two things. The first is that the present cement supply by the Tanzanian cement factories is far from sufficient, and secondly the demand for cement in Tanzania has outgrown the presently installed production capacity, or will do this in the very near future.
Because of the limited infrastructure and transport capacity in Tanzania, the shortage of cement is much worse on locations far from the cement factories. Makange and Salukele mentioned in 1987 [5] that "transportation by rail is hampered by lack of sufficient wagons • and locomotive power, while road transport is extremely expensive and unreliable due to the poor state of the major roads", and that "the present transport infrastructure cannot cope with distribution of cement in addition to the agricultural inputs and crops".
1Based on a population of 24 million in 1989. TI1is is based on the population sensus of 1988 and the average yearly population growth (2.8%) between 1978 and 1988 [4].
2 Based on a population of 27 million in 1994.
3Tuese figures are slightly distorted since both the Netherlands and the USA are cement importing countries, which respectively import 18 and 44 percent of their cement consumption [7] [45]. The average area covered per cement factory is therefore even lower in these countries.
4TI1e comparison is somewhat distorted since the figure on highways in Tanzania includes 95 percent unpaved ways [8].
5It is not possible to check this since the TSC company plans are not open to the public.
3
According to Stewart and Muhegi [3] the price of cement can have trippled once it reaches an up-country location like Kigoma. Schilderman and Muhegi [2] mention that cement is a luxury material in outlying regions because of the high price.
1.1.4 Consequences: relevance of cement The cement-shortage has several negative consequences for the construction industry. A survey executed by the National Construction Council in Tanzania in 1992 mentioned that "generally shortage of building materials, particulary cement and steel, continues to paralyze the construction industry, leading to shortages, delayed projects and consequent increase in costs" [ 6].
Besides these direct negative effects on the construction industry, the shortage of cement is also undesirable because of the general relevance of cement in the development of a country. This aspect is elaborated upon in Appendix A.1, in which it is concluded that the per capita cement consumption is strongly related to the economic development of a country and that the availability of cement and concrete are prerequisites for economic growth.
1.2 Propositions and hypothesis
1.2.1 The cement shortage in Tanzania The shortage of cement in Tanzania and its negative consequences which was discussed in the previous paragraph is also the first proposition for the hypothesis of this study, to be outlined in paragraph 1.2.4.
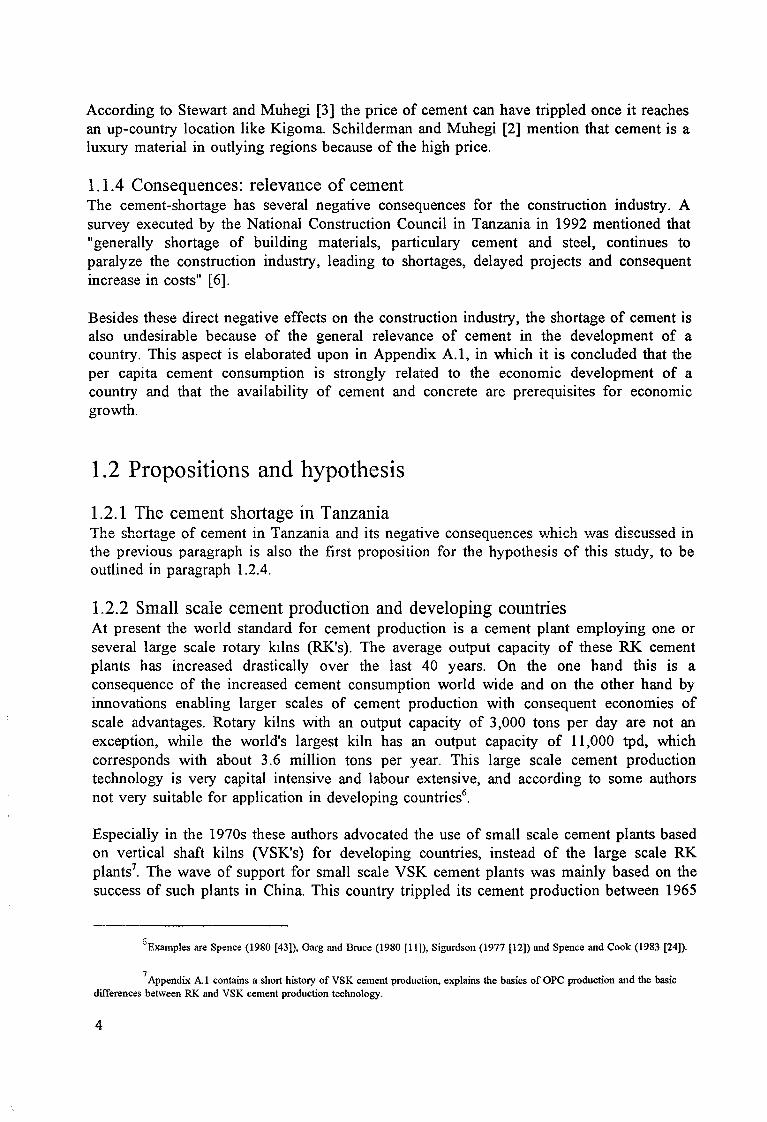
1.2.2 Small scale cement production and developing countries At present the world standard for cement production is a cement plant employing one or several large scale rotary kilns (RK's). The average output capacity of these RK cement plants has increased drastically over the last 40 years. On the one hand this is a consequence of the increased cement consumption world wide and on the other hand by innovations enabling larger scales of cement production with consequent economies of scale advantages. Rotary kilns with an output capacity of 3,000 tons per day are not an exception, while the world's largest kiln has an output capacity of 11,000 tpd, which corresponds with about 3.6 million tons per year. This large scale cement production technology is very capital intensive and labour extensive, and according to some authors not very suitable for application in developing countries6
.
Especially in the 1970s these authors advocated the use of small scale cement plants based on vertical shaft kilns (VSK's) for developing countries, instead of the large scale RK plants7
. The wave of support for small scale VSK cement plants was mainly based on the success of such plants in China. This country trippled its cement production between 1965
6Examples are Spence (1980 [43]), Garg and Brnce (1980 [11]), Sigurdson (1977 [12]) and Spence and Cook (1983 (24]).
7 Appendix A.1 contains a short history of VSK cement production, explains the basics of OPC production and the basic
differences between RK and VSK cement production technology.
4
and 1975, which was largely effected by the set-up of small-scale cement plants usmg VSK's [12].
The following advantages of small scale VSK cement production were mentioned to underline the suitability of this technology for developing countries [11]:
A smaller production per plant and hence a smaller area covered which leads to lower prices on average because of the shorter average transport distance. This also leads to less dependence or burden on infrastructure and transport facilities.
Small scale plants demand relatively little capital investment, which is scarce in developing countries, i.e. they are less capital intensive.
Small plants create more employment per unit of capital invested.
Small plants can be erected relatively quickly if compared with the period which is required to erect a large-scale plant.
Simpler machinery allows quicker spread of know-how among less skilled workers.
Greater flexibility in rate of production to meet fluctuating demand, due to lower costs of shutting down and starting up and possibility of operating several kilns in parallel.
Small plants can exploit resource deposits which are too small for the set-up of a large plant.
A network of small scale plants will provide wider spread economic growth if compared with a centralised large scale cement industry.
1.2.3 The rise of small scale VSK cement production in India India presently is the only country in the world where small scale cement production has become a success on a commercial basis8
• During the 50s, 60s and 70s there were several organisations and individuals in India who did R&D work on down-scaling the 'old' European VSK-cement production technology. Whereas the VSK cement plants formerly used in Europe were batteries of several kilns with each a capacity of about 200 tpd, the Indians tried to develop commercially viable plants with capacities as low as 25 tpd. All these organisations pursued the development of small-scale VSK technology for their own purposes, which finally also resulted in different types of small-scale VSK cement plants, with scales of production varying from 20 to 200 tpd. Commercial production of such plants started in the early 1980s, and has become quite succesfull. Especially two producers of equipment for small-scale cement plants have been able to set-up quite a large number of plants. Saboo Engineers is a company from Jodhpur which has erected
8The success of small scale cement plants in China was not on a commercial basis.
5
over 100 plants since the early 1980's [14].
The other succesfull organisation is the National Council for Cement and Building Materials. This institute, which was formerly known as the Cement Research Institute of India, has developed own designs. The NCB licenses machinery manufacturers to use the NCB designs. Also this organisation has put up about 100 plants [14], of which the largest part has been set up by a company called Movers [10]. The latter company has been so succesfull that it is now starting with the export of its plants to other developing countries; plants are currently being set up in Bhutan, Nigeria, Ghana and Kenya [17].
The plants in India produce standard OPC and did not get any substantial government support. These plants have to compete on the Indian market with the existing large-scale industry. An analysis of Sinha of the small-scale cement industry in India in 1985 revealed that the small-scale plants were indeed more profitable than the large-scale plants in India [10].
It can be concluded that the Indian small scale VSK cement production has turned out to be quite succesfull in India, which also is a developing country.
1.2.4 Hypothesis Resuming, there are the following three propositions:
Proposition 1: Tanzania faces an absolute national shortage as well as regional shortages of cement.
Proposition 2: Small scale VSK cement production is especially suitable for developing countries.
Proposition 3: Indian small scale VSK cement production technology has turned out quite succesfull in India, which also is a developing country.
This leads to the following hypothesis:
Hypothesis: Indian small scale VSK cement production technology is suitable to reduce or resolve the cement shortage in Tanzania.
1.3 Problem definition and research goal
1.3.1 Problem definition The hypothesis of a research is the statement which is tested on its plausibility. Therefore the research problem or issue of this study is to test this hypothesis. The research question would then become whether Indian small scale cement production technology is suitable to reduce or resolve the cement shortage in Tanzania. However, the answer to this question will probably be hard to interpretate, since it does not tell anything on the suitability of
6
small scale cement production in comparison with the alternative which is available for for cement production: large-scale RK cement production. Therefore the following research problem is formulated:
Research problem: The suitability of Indian small scale VSK cement production technology to reduce or resolve the cement shortage in Tanzania (in general and versus modern large scale cement plants).
1.3.2 Research goal The studying of the research problem as formulated in paragraph 1.3 .1 is of course not a goal in itself. As could be seen in paragraph 1.1, presently there is a cement shortage and an expansion of the cement industry in Tanzania is desirable within shortly. This study evaluates the suitability of small scale cement production to effect this expansion. The goal of this evaluation is to supply information that will support policy makers and private investors in taking decisions on how to expand the cement industry in Tanzania, and especially on the possible role of small scale VSK cement plants in such an expansion.
1.4 Elaboration on problem definition
1.4.1 Theoretical framework and definitions As could be seen in the previous paragraph, the issue of this study is the suitability of a certain technology to meet certain needs in Tanzania. Figure 1.2 shows the theoretical framework of this study.
This framework is limited in scope since it only considers the aspects which are considered to be the most important ones in the discussed technology choice.
The core of this framework are the terms of reference, or in other words the criteria which are used to determine the suitability of the discussed technology. It is assumed that the terms of reference mainly have three origins from which the criteria for the suitability evolve. These are the needs as they are felt in the country in question, which is Tanzania. These can be material as well as non-material needs. The fulfillment of these needs is limited by the means that are available to or in the country that are required to fulfill the specific needs. Both needs and means also influence the government policy9
• This influence and the type of government policy again has its influence on the terms of reference.
The eventual terms of reference are used to evaluate the studied technologies on their suitability. In this particular study it is assumed that only foreign OPC10 production
9It is assumed that a government (at least partly) aims at fulfilling certain needs which are felt in the country. The way in which needs are addressed can vary according to the political system in the country from creating favourable conditions which will let 'the market' solve the issues to addressing the needs more directly, for example by setting up government enterprises.
10Tue terms 'OPC' and 'cement' are used as equivalents in this report.
7

technologies can be employed, since there is no indigenous capacity to produce such
Figure 1.2: Theoretical framework
limited
means
OPC
production ,..___ __ __.
technologies
government
policy
~
~ ~
~ (I terms of reference
for OPC production
technology
choice
~ specific OPC
production
process
national environment
OPCand
other needs
technologies and it would be too time-consuming and costly to develop such technologies. The eventual choice for a technology should lead to the set-up of one or more specific production processes, which uses or employs the available means and satisfies the needs.
Some of the terms that are used in the framework will be discussed in more detail below.
government policy For this study the most important aspect of the present-day Tanzanian government policy is that it can be characterised as a liberal economic policy, in which private investors are considered to be the main source of investments [18]. This means that the profitability is a first prerequisite for a project. If a project is not profitable, its chances of materialization are minimal. The OPC production technology should thus be commercially profitable. As a consequence of the pressing need for cement the Tanzanian government has marked out the cement industry as a priority investment area and investors can count on a five year tax remission [49], which will have a positive influence on the commercial profitability.
OPC and othe1· needs Economic activities like production processes do not only generate their specific output but also generate other outputs which can help solving needs of a country. Therefore not only the need for OPC is considered here, but also a few of the most important other needs that are (or can) also be affected by the set-up and operation of new production
8
processes.
First of all the need for OPC is considered, which originates from other, more primary needs like shelter, infrastructure and economic development11
• Other needs that are considered are income and economic development in general and employment (especially for unskilled labour). Also the latter needs originate from more primary needs which can be addressed if income is available. Furthermore the need for a clean and healthy environment is considered; the new technology should have a minimal effect on this aspect. This originates from the need for good living conditions and health for present but also future generations.
limited means There is a large number of means required for the set-up and operation of OPC production processes of which none are available unlimited. One of the most important aspects is the limited availability of the required raw materials. Secondly the financial means in Tanzania are strongly limited; investment capital as well as foreign exchange are scarce and this scarcity causes other (economic) problems. Furthermore there is a strong limitation in skilled to highly skilled personnel in Tanzania. Also the (world wide) limitation in energy sources is considered.
terms of reference The criteria which evolve from the previously discussed aspects are the terms of reference within which the new OPC production technology has to operate; these criteria determine the suitability of the studied technologies and more or less correspond with the concept of 'sustainable developmenti12
• This can be defined as development which meets the needs of the present generation without compromising the ability of the future generations to meet their needs. The elaboration of this definition has three components: production growth (economic development), righteous distribution of wealth (poverty alleviation) and environmental space (ecological sustainability) [ 46].
Based on the previously discussed aspects the OPC production technologies are evaluated on the: -micro-economic profitability
-macro-economic profitability -limited use of scarce resources -ecological sustainability
OPC production technologies There roughly are two technologies which are employed world wide for the production of OPC. This concerns on the one hand small scale VSK cement production, which is the production of OPC in which one or more vertical shaft kilns are employed for burning and ranging in production capacity from 1 to 300 tons per day.
On the other hand there is large scale RK cement production in which one or more rotary
11This was elaborated upon in paragraph l. l and appendix A. l.
12This also is the basic criterium in the selection of projects that are to be executed as a part of Dutch Government
development aid [46].
9

kilns are employed for burning and the production capacity is 800 ton per day or more13•
Since the former technology is the subject of this study it is studied in more detail than the latter technology; this one is only studied as reference for the former technology.
specific OPC production process The evaluation in this study of the considered production technologies against the terms of reference will lead to an advice on which specific OPC production process is the most suitable. The detail in, and the aspects on which this production process can be described depends on which aspects of the studied technologies have been imparted as a variable. In this study only scale and type of OPC technology (RK or VSK) are imparted as a variable and therefore the advice only concerns scale and type of process.
1.4.2 Sub-questions Before the evaluation on the suitability can start, some aspects of the terms of reference have to be complemented. Especially a more detailed determination of the demand for cement in Tanzania is required. It is known that there is a shortage, but not how big this shortage is, how it is spread geographically and how it will develop in the future. This is mainly determined by the demand for OPC and its development in the near future. It is necessary to know this in order to have an insight into the present need for an expansion of the cement industry and how this will develop in the near future.
Sub-question 1: What is the present demand for OPC in Tanzania, how is it spread geographically and how will it develop in the near future?
Furthermore it is important to know if Tanzania has enough limestone deposits of good quality and sufficient size to sustain cement plants of the studied technologies.
Sub-question 2: What is the size and quality of the Tanzanian limestone deposits and do these deposits allow for expansions of the cement industry with the studied technology?
The remaining sub-question concern the actual evaluation of the studied technologies on their suitability to effect the expansion of the Tanzanian cement industry.
Sub-question 3a: Do Indian small-scale cement plants offer a profitable investment opportunity in the Tanzanian context?
There are, however, quite large variations within the spectrum of Indian VSK small-scale cement plants. For example a 25 tpd Saboo plant, is distinctively different from a 200 tpd Movers plant. These variations mainly concern the aspect of the scale of production with
13Tue two technologies leave an 'open space' of scales of production (roughly 300 to 800 tpd) which presently are barely
employed or set up. Cement plants of these scales which are in operation mainly are old (wet process) RK plants.
10

which other aspects like sophistication and technical service life seem to correlate: the higher the output capacity, the higher the sophistication, the longer the technical service life. But both plants will probably also not have the same profitability, and therefore, in order to give a complete answer to sub-question I a, the profitability of a range of different plants should be studied. It was decided to study a range of scales since other characteristics correlate with the scale and it would be too time-consuming to study all possible variations of different characteristics.
Sub-question 3b: Which scales of production are profitable and which is the most profitable one?
Sub-question 4a: What are the costs and benefits of the set-up of Indian small-scale cement plants to the Tanzanian economy?
Also in this part of the evaluation the different scales of production are studied on their respective effects. These effects are not only compared with each other but also with figures on typical large-scale plants, in order to determine whether the small-scale plants are more suitable than large-scale plants.
Sub-question 4b: Which scale of production is the most suitable one for Tanzania in the light of its economic problems?
Old technologies, which are not used anymore, often are not acceptable anymore for present-day standards of pollution etc. This stems from the fact that when these technologies were developed there was little conscience yet concerning environmental problems or depletion of certain resources, and hence also no regulations or legislation concerning these aspects existed yet. Therefore the risk exists that certain old technologies are inherently not suitable for present-day application in the light of the world-wide ecological problems. In other words: a production process should preferably be ecologically sustainable, and not charge future generations with problems that can be avoided.
Sub-question 5: Is small-scale VSK cement production technology ecologically sustainable?
1.5 Research methodology
1. 5 .1 The instrument The translation of the probiem definition into sub-questions largeiy aiready determines the methodology that will be used to answer the research question. This study mainly is an evaluation on commercial, macro-economic and ecological criteria of a certain technology in a certain context, and in which the scale of production is a variable. These are aspects which can be addressed by a feasibility study. In a feasibility study an assessment is made
11
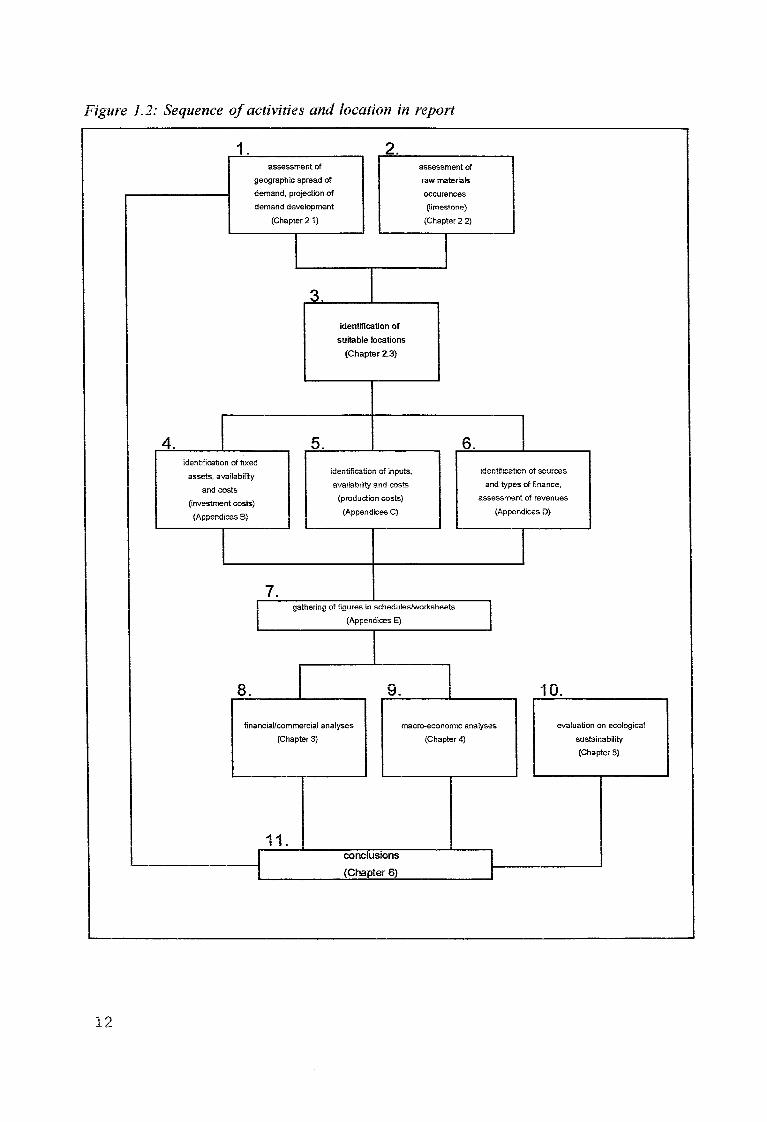
Figure 1.2: Sequence of activities and location in report
4.
12
1 2 assessment of
geographic spread oi
demand, projection of
demand development
I identification of fixed
assets, availability
and costs
(investment costs)
(Appendices B)
I
(Chapter 2 1)
3.
5.
7.
identification of
suitable locations
(Chapter 2.3)
identification of in puts,
avai!abi!ity and costs
(production costs)
(Appendices C)
assessment of
raw materia Is
occurences
(limestone)
(Chapter 2 2)
6.
I gathering of figures in schedules/worksheets
(Appendices E)
8. 9.
I identification of sources
and types of finance;
assessment of revenues
(Appendices D)
1
I
10.
financiaUcommercial analyses
(Chapter3)
macro-economic analyses
(Chapter4)
evaluation on ecological
sustainability
(Chapter5)
11. I conclusions I I (Chapter 6) r

of relevant technological options in order to come to an economical viable project which is in line with macro-economic and national or international development goals [47].
However, a feasibility study has the major aim of arriving at an investment decision [47], which is not the direct aim of this study. The aim is to come to a conclusion on the general suitability of the studied technology in Tanzania, and not to provide the basis for particular investment decisions. Considering the complexity of the set up and operation of a cement plant it is, within the limits of this study, not possible to make an analysis which is accurate enough to justify a particular investment decision. Therefore it was decided to execute a down-scaled feasibility study: a pre-feasibility study. It addresses the same issues, but in less detail.
The concept of a feasibility study as introduced and described by the UNIDO [ 48] has become a world standard since its first introduction in 1978 [ 4 7]. The UNIDO method has been employed in this study because it eventually automatically leads to a fairly complete financial analysis of studied projects. If the required data are collected these can be filled in in schedules which eventually leads to an overview of the financial development of the project on different aspects and calculations of some important indicators of commercial viability. Furthermore, since the schedules can be translated to worksheets in a spreadsheet computer programme, it is easy to elaborate the analysis and to analyse alternatives.
Still, in this study the guideline or sequence of aspects as described by the UNIDO [ 48] has not been employed entirely unaltered. Firstly, since this concerns a pre-feasibility study a shortcut has been made through the sequence of aspects as described by the UNIDO. Secondly, a macro-economic evaluation has been added. Such an evaluation requires for a large part the same figures as used in the financial analysis and can hence easily be added. Furthermore a so-called support study concerning the ecological sustainability has been added. This is not present in the UNIDO method and employs completely different data and can hence not be integrated in the previous economic analyses.
The sequence of activities that has been used can be seen in figure 1.2. Of these activities only those that concern the analysis of data and interpretation of analyses are included in the main text of this report. The other activities, or the outcome of these activities have been included in the Appendices.
Part 1 is a separate study in itself, of which the method and the way in which the data were acquired and analyzed will be described in Chapter 2.
Parts 4, 5 and 6 of figure 1.2 consist of the collecting of data, which is further described in 1.5.2. Part 7 consists of the gathering of the coiiected data in worksheets which automatically leads to part 8, the financial/commercial analyses.
1.5.2 Data collection Data were collected using several methods, although the main method was 'monitoring': acquiring data by studying literature or otherwise documented facts. Since there is very little literature or otherwise documented facts on small scale cement production improvisation was often necessary, and a lot of data could not be acquired
13

directly but had to be derived from other figures (mainly from figures on or from the large scale cement plants in Tanzania and Kenya). A combination of general knowledge of cement production and plain 'common sense' was also sometimes enough to fill in . £ . 14 m ormat1on gaps .
In order to acquire the necessary data for parts 4 and 5, the following methods were used: -literature study -structured and non-structured interviews with experts in and on the cement industry in Tanzania, Kenya and Germany.
-studying administration figures of cement plants in Tanzania and Kenya -applying for (proforma) invoices from suppliers of quarry, power connection and cement production equipment in India, Tanzania and the Netherlands.
-employing cost index figures to calculate construction costs
For part 6 interviews were done with key-persons in the financial sector in Tanzania; consulted organisations were the Investment Promotion Centre, Tanzania Development Finance Ltd, Tanzania Investment Bank and Standard Chartered Bank Tanzania. Furthermore monitoring was done on regional price differences of cement and the influence of transport on price, most information was obtained at the NCC.
The data which are used for parts 1, 2 and I 0 are almost completely acquired by literature study.
1.5.3 Data analyses Chapter 2 consists of an assessment of the present demand for cement and its expected future growth and an assessment of the known limestone deposits in Tanzania. The demand estimation is based on scores of the different regions of Tanzania on variables which are assumed to be indicators for the demand for OPC in these regions. The basic assumption is that all regions are not well supplied with cement (have a shortage) besides those regions which accomodate a cement factory. The regions without cement factory are compared with those with a cement factory on the discussed indicators to get an indication of the regional demands. These regional demand estimates are added up to come to a national demand estimate.
Chapter 3 contains the evaluation of the Indian small scale VSK cement production technology on its commercial viability. The analyses mainly consist of the calculation of indicators for the profitability and the comparison of the different scales of production which are analysed on their respective scores on these indicators. Furthermore the respective investment and production costs are analysed to identify causes for differences in the scores on the profitability indicators.
Chapter 4 contains the evaluation of the small scale VSK cement production technology, and as far as the data allows also of the large scale RK technology on the macro-economic aspects. Also in this chapter the analyses mainly consist of calculating indicators for the
14For example by checking if all required process activities are 'covered' (by equipment as well as personnel), if all transport activities are covered, if all materials get to the right place in the right condition, etc.
14

macro-economic effects of the different scales of production and technologies, and the comparison of the respective scores on these indicators.
Chapter 5 contains an evaluation of the building material OPC on some of its major ecological effects. This consists on the one hand of resource sustainability (the use of scarce resources) and on the other hand of the pollution effects (noxious emissions). OPC is compared on these aspects with an alternative for OPC. Furthermore the small scale VSK technology is compared on these aspects with large scale RK technology. In both cases indicators of the to-be-expected indirect and direct energy consumption, resource exploitation and pollution effects are calculated and compared (OPC vs an alternative and VSK technology vs RK technology).
15
2. Demand for OPC and occurence of limestone deposits
2.1 Demand for OPC
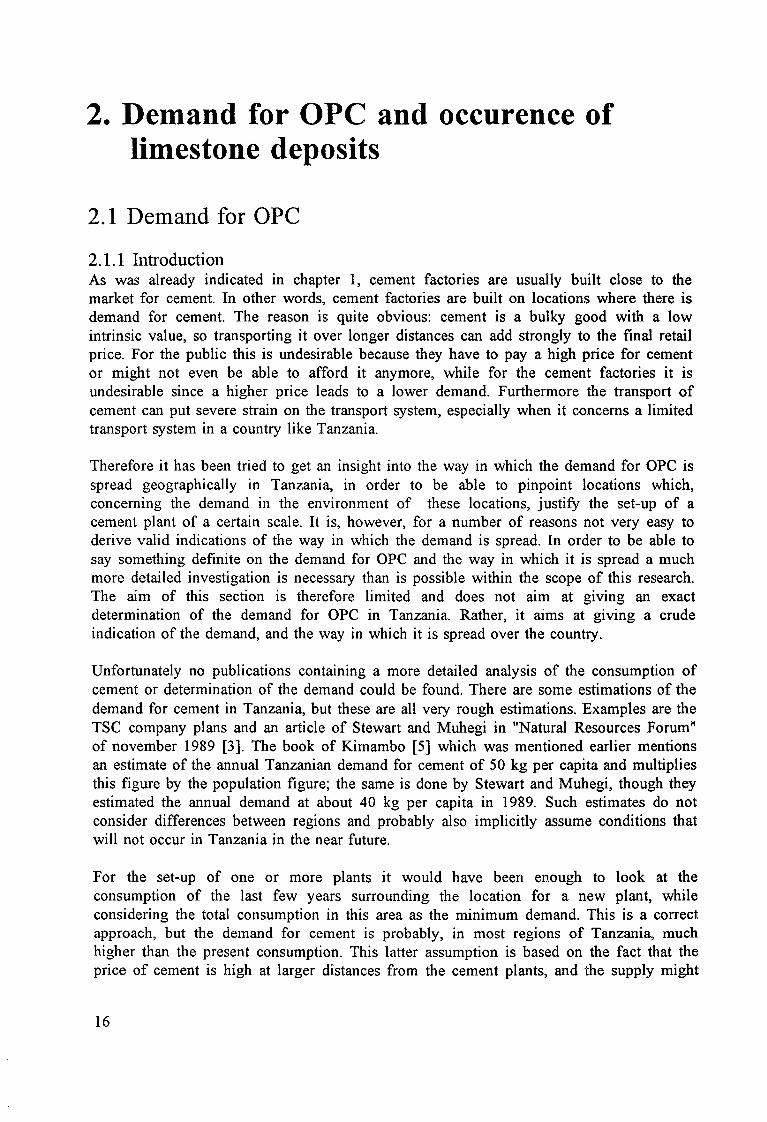
2.1.1 Introduction As was already indicated in chapter 1, cement factories are usually built close to the market for cement. In other words, cement factories are built on locations where there is demand for cement. The reason is quite obvious: cement is a bulky good with a low intrinsic value, so transporting it over longer distances can add strongly to the final retail price. For the public this is undesirable because they have to pay a high price for cement or might not even be able to afford it anymore, while for the cement factories it is undesirable since a higher price leads to a lower demand. Furthermore the transport of cement can put severe strain on the transport system, especially when it concerns a limited transport system in a country like Tanzania.
Therefore it has been tried to get an insight into the way in which the demand for OPC is spread geographically in Tanzania, in order to be able to pinpoint locations which, concerning the demand in the environment of these locations, justify the set-up of a cement plant of a certain scale. It is, however, for a number of reasons not very easy to derive valid indications of the way in which the demand is spread. In order to be able to say something definite on the demand for OPC and the way in which it is spread a much more detailed investigation is necessary than is possible within the scope of this research. The aim of this section is therefore limited and does not aim at giving an exact determination of the demand for OPC in Tanzania. Rather, it aims at giving a crude indication of the demand, and the way in which it is spread over the country.
Unfortunately no publications containing a more detailed analysis of the consumption of cement or determination of the demand could be found. There are some estimations of the demand for cement in Tanzania, but these are all very rough estimations. Examples are the TSC company plans and an article of Stewart and Muhegi in "Natural Resources Forum" of november 1989 [3]. The book of Kimambo [5] which was mentioned earlier mentions an estimate of the annual Tanzanian demand for cement of 50 kg per capita and multiplies this figure by the population figure; the same is done by Stewart and Muhegi, though they estimated the annual demand at about 40 kg per capita in 1989. Such estimates do not consider differences between regions and probably also implicitly assume conditions that will not occur in Tanzania in the near future.
For the set-up of one or more plants it would have been enough to look at the consumption of the last few years surrounding the location for a new plant, while considering the total consumption in this area as the minimum demand. This is a correct approach, but the demand for cement is probably, in most regions of Tanzania, much higher than the present consumption. This latter assumption is based on the fact that the price of cement is high at larger distances from the cement plants, and the supply might
16
well not be enough to satisfy even the demand at that price, due to bottlenecks in the transport system.
The basic assumption underlying the theoretical estimation of the demand in this section is that there is no shortage of cement in the regions where there already is a cement factory. Indicators are identified which are assumed to be of influence on the regional demand of cement, after which the regions in which there is a shortage of cement (those without a cement plant) are compared on these indicators with the regions with a cement plant. Based on this comparison the demand for cement (the amount of cement which would be consumed if there would also be a cement plant in these regions) is estimated per region. The origin of the data used in this paragraph is explained in Appendix A.4 and A.5.
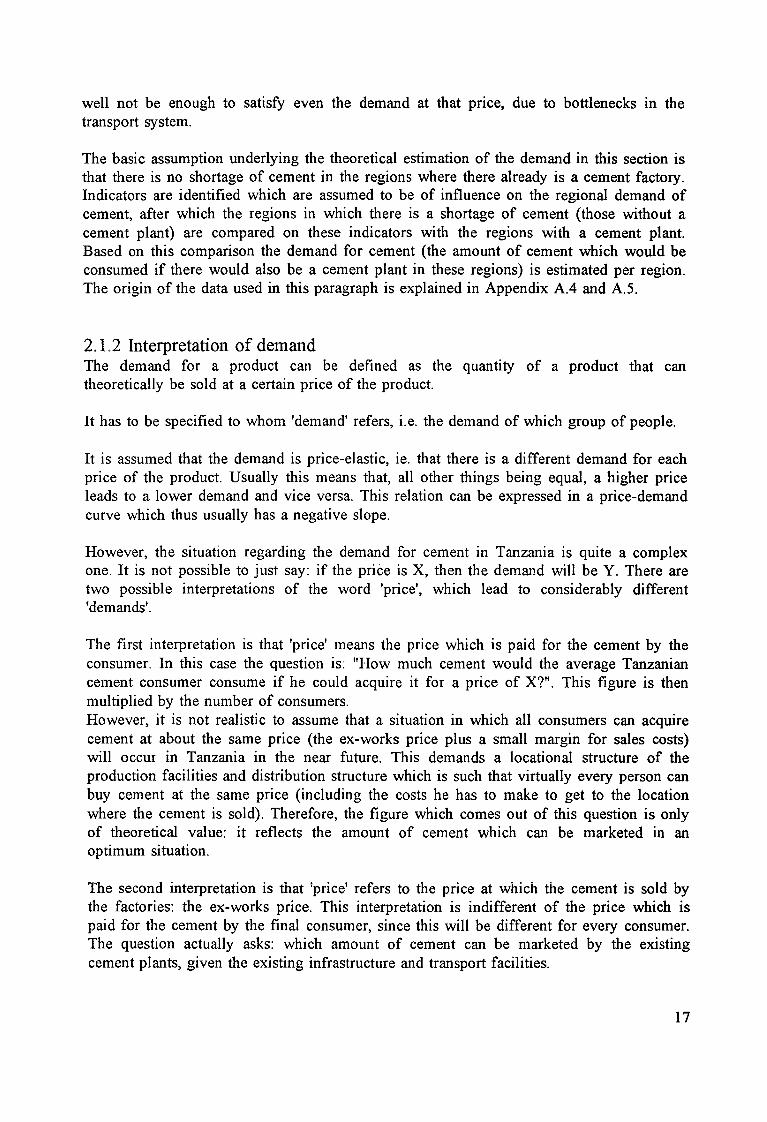
2.1.2 Interpretation of demand The demand for a product can be defined as the quantity of a product that can theoretically be sold at a certain price of the product.
It has to be specified to whom 'demand' refers, i.e. the demand of which group of people.
It is assumed that the demand is price-elastic, ie. that there is a different demand for each price of the product. Usually this means that, all other things being equal, a higher price leads to a lower demand and vice versa. This relation can be expressed in a price-demand curve which thus usually has a negative slope.
However, the situation regarding the demand for cement in Tanzania is quite a complex one. It is not possible to just say: if the price is X, then the demand will be Y. There are two possible interpretations of the word 'price', which lead to considerably different 'demands'.
The first interpretation is that 'price' means the price which is paid for the cement by the consumer. In this case the question is: "How much cement would the average Tanzanian cement consumer consume if he could acquire it for a price of X?". This figure is then multiplied by the number of consumers. However, it is not realistic to assume that a situation in which all consumers can acquire cement at about the same price (the ex-works price plus a small margin for sales costs) will occur in Tanzania in the near future. This demands a locational structure of the production facilities and distribution structure which is such that virtually every person can buy cement at the same price (including the costs he has to make to get to the location where the cement is sold). Therefore, the figure which comes out of this question is only of theoretical value: it reflects the amount of cement which can be marketed in an optimum situation.
The second interpretation is that 'price' refers to the price at which the cement is sold by the factories: the ex-works price. This interpretation is indifferent of the price which is paid for the cement by the final consumer, since this will be different for every consumer. The question actually asks: which amount of cement can be marketed by the existing cement plants, given the existing infrastructure and transport facilities.
17

It can be seen that both interpretations of the word price have their own underlying assumptions: a perfect locational structure of the production facilities and distributional structure, or the existing locational structure of the cement plants and distributional structure. The first can be estimated by a crude per capita figure, like it is done in the book of Kimambo [5], although it will not be possible to market the consequent total 'demand' for cement. The second can be estimated by looking at the present sales figures.
The figure which is used in the book of Kimambo (1987) is a demand of about 50 kg per capita. With the present population and population growth rate, this would mean an annual demand of over 1.5 million tons in the year 2000. Stewart and Muhegi (1989) estimated a demand of 40 kg per capita in 1989, which leads to a total present annual demand of about 1.1 million tons.
The second interpretation of demand can be estimated by looking at the present sales figures, assuming that this is the maximum amount that can be marketed given the constraints caused by the infrastructure and availibilty of transport facilities. For the last 6 years the local sales of OPC have been between 500,000 and 600,000 tons per year [2].
The figures which are mentioned above can be used to conclude that an improvement in the locational structure of the cement plants and/or in the distribution system (infrastructure and transport facilities) will lead to a 'demand' of somewhere between 500,000 and 1.5 million tons.
2.1.3 Selection of indicators for the demand The topic of this essay is the possible implementation of new cement plants, which means an improvement of the existing locational structure of the production facilities; the total demand after such an implementation would therefore probably be somewhere between the two figures which were mentioned earlier. Since the margin between the two different 'demand' estimates is very big, it would be usefull to also determine a demand figure based on assumptions which can theoretically be achieved by implementing new plants.
A possible situation would be a situation in which all major cities (the capitals of the regions) would be consistently supplied with cement at a price which is little higher than the ex-works price (assuming an equal ex-works price for all plants). This would be the case in a situation in which there is a cement plant close to all regional capitals.
This is already the case in three regions: Dar es Salaam, Tanga and Mbeya region. All factories produce cement at (about) the same ex-works price, while it is available in the cities for a slightly higher price than the ex-works price (about 10 percent [1]). The consumption figures of these regions can be used as an indicator of the possible demand in the other regions in case a cement plant would be set up in the vicinity of the capitals of these regions.
The cement consumption of the regions with, and of the regions without cement plant have been listed, just as a number of indicators for all regions which are considered to be relevant for the cement consumption. The regions are compared on their cement
18
consumption and on these indicators, in order to arrive at an estimate of the demand for cement under the conditions as mentioned above.
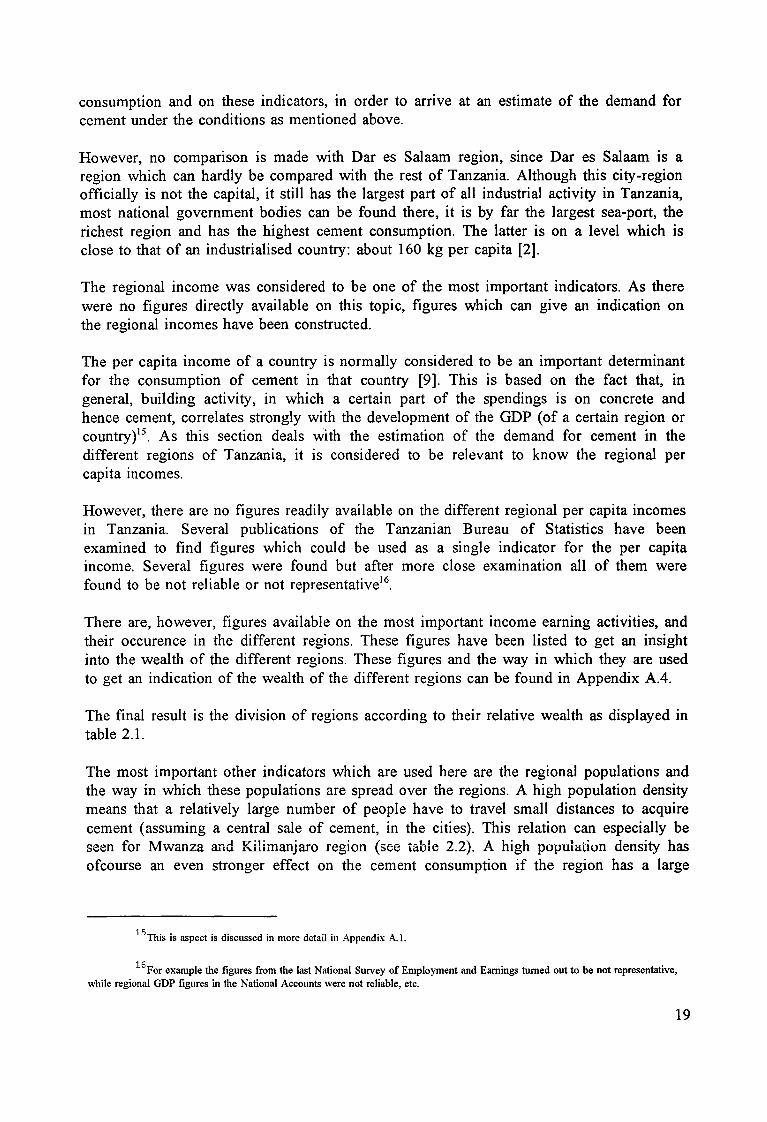
However, no comparison is made with Dar es Salaam region, since Dar es Salaam is a region which can hardly be compared with the rest of Tanzania. Although this city-region officially is not the capital, it still has the largest part of all industrial activity in Tanzania, most national government bodies can be found there, it is by far the largest sea-port, the richest region and has the highest cement consumption. The latter is on a level which is close to that of an industrialised country: about 160 kg per capita [2].
The regional income was considered to be one of the most important indicators. As there were no figures directly available on this topic, figures which can give an indication on the regional incomes have been constructed.
The per capita income of a country is normally considered to be an important determinant for the consumption of cement in that country [9]. This is based on the fact that, in general, building activity, in which a certain part of the spendings is on concrete and hence cement, correlates strongly with the development of the GDP (of a certain region or country)15
. As this section deals with the estimation of the demand for cement in the different regions of Tanzania, it is considered to be relevant to know the regional per capita incomes.
However, there are no figures readily available on the different regional per capita incomes in Tanzania. Several publications of the Tanzanian Bureau of Statistics have been examined to find figures which could be used as a single indicator for the per capita income. Several figures were found but after more close examination all of them were found to be not reliable or not representative16
.
There are, however, figures available on the most important income earning activities, and their occurence in the different regions. These figures have been listed to get an insight into the wealth of the different regions. These figures and the way in which they are used to get an indication of the wealth of the different regions can be found in Appendix A.4.
The final result is the division of regions according to their relative wealth as displayed in table 2.1.
The most important other indicators which are used here are the regional populations and the way in which these populations are spread over the regions. A high population density means that a relatively large number of people have to travel small distances to acquire cement (assuming a central sale of cement, in the cities). This relation can especially be seen for Mwanza a.1d Kilimanjaro region (see table 2.2). A high population density has ofcourse an even stronger effect on the cement consumption if the region has a large
15Tuis is aspect is discussed in more detail in Appendix A. I.
16For example the figures from the last National Survey of Employment and Earnings turned out to be not representative, while regional GDP figures in the National Accounts were not reliable, etc.
19

population.
Table 2.1: Division of Tanzanian regions according to their relative wealth based on indicators of industrial and commercial agricultural production
rich ...................................................................................................... > poor
Dar es Salaam Morogoro Kagera Tabora Dodoma Tanga Mwanza Coast Kigoma Arusha Shinyanga Mtwara Lindi
Kilimanjaro Ruvuma Mara Mbeya Rukwa Iringa Singida
Of even more importance seems to be the size of the major city of a region. Especially the regions with major cities of over 100,000 inhabitants seem to consume more cement than the other regions. Arusha, Morogoro and Kilimanjaro regions do not have a cement plant but still consume relatively much cement. All three have relatively large capitals: Arusha, Morogoro and Moshi, which are respectively the 5th, 6th and 7th largest cities of Tanzania mainland. Even Mwanza, with the 2nd largest city, at about 1200 kilometers by rail from the closest cement factory, still consumes relatively much cement, in spite of the price increase due to transport and limited transport capacity of TRC. The consumption of cement is considered to be much higher in cities because everybody in the city can acquire cement relatively easy, and there are usually different building standards in cities.
The last variable in the estimation of the regional demand for cement is the availability of alternatives for cement which are socially accepted and of which the skills which are necessary for application are also known in that region. In some regions there are building materials which can be used as an alternative for cement in a lot of applications.
Mbeya region has a lot of volcanic earth which is used to make sun-dried mud bricks which are water resistant and very strong. Kilimanjaro region has a lot of natural stone which is used to cut rock-bricks. Tanga region has a relatively large lime production, while Iringa region has a large indigenous production and knowledge of burnt bricks [26].
2.1.4 Estimation of regional demands17
Arusha region is more or less comparable to Tanga region, though it might even be richer than Tanga. It also has a high commercial agricultural production, and a high industrial activity, both slightly higher than that of Tanga. Arusha town is only slighty smaller than Tanga town; the population density in Arusha is however considerably much lower than in Tanga. Arusha does, unlike Tanga, not have an alternative building material which can be
1 7 The comparisons that are made in this paragraph are based on the figures in table 2.2.
20

used in stead of cement.
Table 2.2: Cement consumption and some important indicators for demand determination, per region (source for population and cement consumption figures: see Appendix A.5, source for industry and agriculture figures: see Appendix A. 4)
REG- 88-93 88-93 90-94 88-93 88-93 1988 1995 1993 1990 1990 ION min. max. aver- min. max. pop. pop. est. reg. total total
cons. cons. age reg. reg. reg. dens. of main pop. est. wages value per cap. per cap. cons. cons. cons. (per- city (OOO) and of
(kg) (kg) (OOO (OOO (OOO sons per (OOO) salaries cash mT) mT) mT) Sq. in crops
km) manu- prod. fact. (mill. ind. Tshs)
(million Tshs)
Arusha 10 22 27 14 44 16 169 1,567 630 706
Coast 2 28 6 1 19 20 . 691 - 245
Dodom 5 47 23 7 61 30 125 1,357 - . a
Iringa 7 13 14 8 17 21 119 1,341 400 1025
Kagera 1 7 4 1 JO 47 40 1,511 150 1039
Kigoma 3 5 4 3 5 23 108 958 - . Kil i. 30 38 39 34 45 83 136 1,201 510 1260
Lin di 1 7 3 1 5 10 59 698 . . Mara 3 10 6 2 11 50 90 1,086 - -
Moro go 7 17 17 9 25 17 166 1,400 900 -
Mtwara 6 13 6 5 12 53 108 937 - 545
Mwanz 9 13 22 10 32 86 257 2,076 320 294 a
Rukwa 4 7 4 3 6 10 67 894 . -Ruvum 4 7 4 3 6 12 77 822 - 1125
a
Shiny. 3 5 8 5 JO 35 89 1,982 120 447
Singida 1 2 l l 2 16 56 872 - .
Tabora 4 7 5 4 8 J4 132 1,136 . 585
Zanz/P 49 50 36 26 37 260 222 743 ? ?
I DSM 155 J65 243 208 270 977 1,737 1,642 3100 -Mbeya 16 24 35 27 42 25 191 1,664 230 1381
Tanga 40 44 50 33 61 48 194 1,419 620 558
I
21
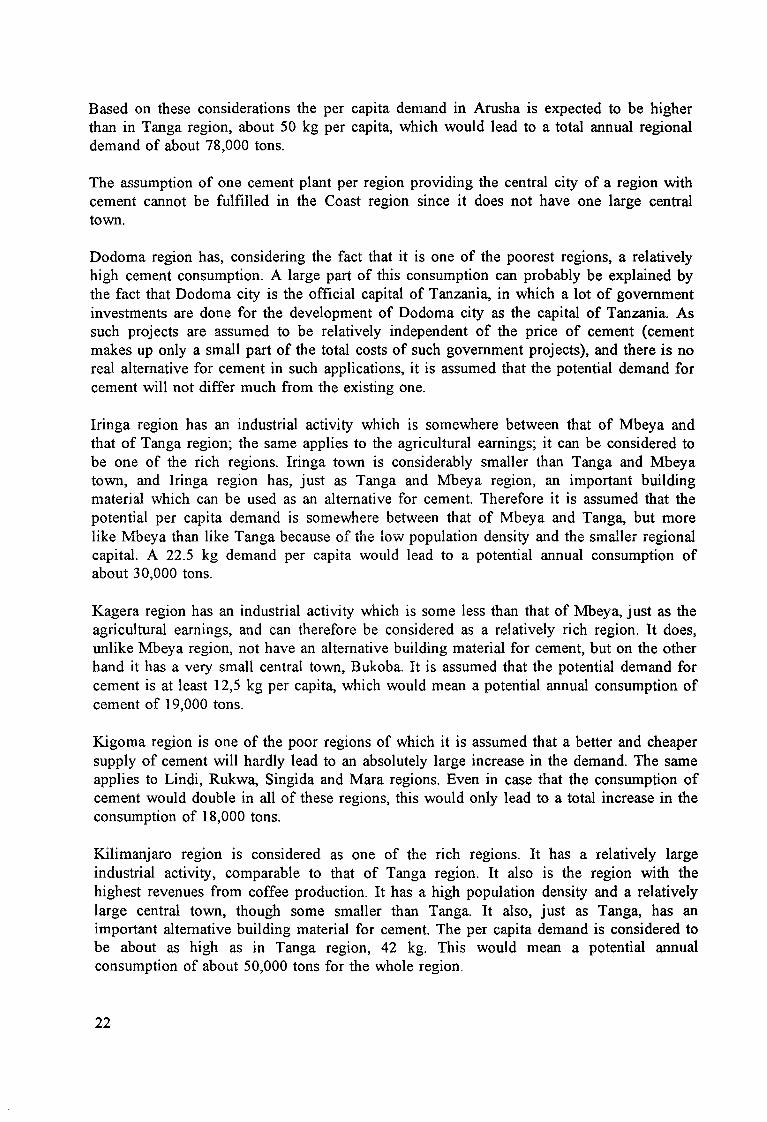
Based on these considerations the per capita demand in Arusha is expected to be higher than in Tanga region, about 50 kg per capita, which would lead to a total annual regional demand of about 78,000 tons.
The assumption of one cement plant per region providing the central city of a region with cement cannot be fulfilled in the Coast region since it does not have one large central town.
Dodoma region has, considering the fact that it is one of the poorest regions, a relatively high cement consumption. A large part of this consumption can probably be explained by the fact that Dodoma city is the official capital of Tanzania, in which a lot of government investments are done for the development of Dodoma city as the capital of Tanzania. As such projects are assumed to be relatively independent of the price of cement (cement makes up only a small part of the total costs of such government projects), and there is no real alternative for cement in such applications, it is assumed that the potential demand for cement will not differ much from the existing one.
Iringa region has an industrial activity which is somewhere between that of Mbeya and that of Tanga region; the same applies to the agricultural earnings; it can be considered to be one of the rich regions. Iringa town is considerably smaller than Tanga and Mbeya town, and Iringa region has, just as Tanga and Mbeya region, an important building material which can be used as an alternative for cement. Therefore it is assumed that the potential per capita demand is somewhere between that of Mbeya and Tanga, but more like Mbeya than like Tanga because of the low population density and the smaller regional capital. A 22.5 kg demand per capita would lead to a potential annual consumption of about 30,000 tons.
Kagera region has an industrial activity which is some less than that of Mbeya, just as the agricultural earnings, and can therefore be considered as a relatively rich region. It does, unlike Mbeya region, not have an alternative building material for cement, but on the other hand it has a very small central town, Bukoba. It is assumed that the potential demand for cement is at least 12,5 kg per capita, which would mean a potential annual consumption of cement of 19,000 tons.
Kigoma region is one of the poor regions of which it is assumed that a better and cheaper supply of cement will hardly lead to an absolutely large increase in the demand. The same applies to Lindi, Rukwa, Singida and Mara regions. Even in case that the consumption of cement would double in all of these regions, this would only lead to a total increase in the consumption of 18,000 tons.
Kilimanjaro region is considered as one of the rich regions. It has a relatively large industrial activity, comparable to that of Tanga region. It also is the region with the highest revenues from coffee production. It has a high population density and a relatively large central town, though some smaller than Tanga. It also, just as Tanga, has an important alternative building material for cement. The per capita demand is considered to be about as high as in Tanga region, 42 kg. This would mean a potential annual consumption of about 50,000 tons for the whole region.
22

Morogoro is the second industrial region of Tanzania, and has a quite large central city, comparable to Tanga or Mbeya. Based on the high industrial activity and the fact that there is no indigenous alternative for cement, the demand for cement is estimated to be some higher than in Tanga region: about 50 kg per capita. This would mean a potential annual consumption of about 70,000 tons for the whole region.
Mtwara town is the third seaport of Tanzania [4] with a population of slightly more than 100,000 inhabitants. It barely has any industrial activity, but earns some income from agricultural production. The demand is assumed to be at least 10 kg per capita, which would mean a potential annual consumption of about 10,000 tons for the whole region.
Mwanza has the second largest town of Tanzania with about a quarter of a million inhabitants. Mwanza region is also a region with a high population density. The industrial activity in this region is considerably higher than in Mbeya region, its commercial agricultural production much lower. It does, unlike Mbeya and Tanga not have an accepted alternative for cement. Based on the population and industrial activity figures, the per capita demand is assumed to be higher than in Mbeya region, though not as high as in Tanga region. Based on a 30 kg per capita demand, the annual potential consumption would be about 62,000 tons per year.
Ruvuma region has almost no industrial activity, a very low population density and a relatively small central town. It does however have a quite large commercial agricultural production, especially of tobacco and coffee. Based on a quite low per capita demand of 10 kg per capita, the region as a whole would have a potential annual consumption of 8,000 tons.
Shinyanga has, just like Kagera region, some industrial activity, but its agricultural earnings are much smaller. On the other hand the central town is twice the size of that of Kagera. If compared with Mbeya, both industrial and commercial agricultural output are about half of that of Mbeya. Based on a 10 kg per capita demand, the total potential consumption in Shinyanga region would be about 20,000 tons per year.
Tabora region is like Mtwara region, though it has a somewhat larger central town. It also has little to no industrial activity but quite a considerable commercial agricultural output. Based on a 10 kg per capita demand, the total annual consumption would be 11,000 tons.
Zanzibar and Pemba have been left out of the demand estimations, because not enough data on these islands was available.
") 1 5 °o"'"'1"s~~ ... s "-· .l. • \..,.,- H\.llU lVll
The demand estimates m this section are based on theoretical assumptions and are therefore not a strong basis for drawing conciusions. However, one conciusion can be drawn, and that is that, using more realistic assumptions, the present demand is by far not as high as 1.5 million tons per year.
If all the regional extra annual consumptions are added up, this leads to a total extra
23

annual consumption or demand of 229,000 tons compared to the average annual consumption (90-94) of 593,000 tons, giving a total present demand of roughly 825,000 tons for the whole of Tanzania (or about 875,000 if Zanzibar and Pemba are included). This figure is ofcourse not to be considered as an exact determination of the demand under the conditions which are mentioned earlier. This would require a more in-depth market study. Rather, as said before, it gives an indication of the demand for cement that might presently exist under conditions that are realistic.
Table 2.3: Estimated regional annual extra and total demand18
REGION EXTRA DEMAND TOT AL DEMAND ('OOO tons) ('OOO tons)
Arusha 51 78
Coast - 6
Dodoma - 23
Iring a 16 30
Kagera 15 19
Kigoma 4 8
Kilimanjaro 11 50
Lindi 3 6
Mara 5 10
Morogoro 53 70
Mtwara 4 10
Mwanza 40 62
Rukwa 4 8
Ruvuma 4 8
Shinyanga 12 20
Singida 1 2
Tabora 6 11
TOTAL EXTRA DEMAND 229
TOT AL DEMAND (including 875 DSM, Tanga, Mbeya, Zanzibar
and Pemba)
It also has to be mentioned that these figures only apply to the present economic situation. If, for example, Tanzania would pass through a phase of very strong economic growth in
18Tue total demand is the sum of the 1990-1994 average regional consumption and the extra demand.
24

the near future, then this could lead to cement consumption figures which are even higher than 1. 5 million tons per year.
Based on these estimates it could be concluded that there are 3 regions with a very large 'unsatisfied demand'. These are Arusha, Morogoro, and Mwanza regions. Furthermore there are a number of regions which also have quite a large unsatisfied demand, though to a much lesser extent than the three regions mentioned before. These regions are Iringa, Kagera, Kilimanjaro and Shinyanga.
The most frequently used scales of small scale VSK cement production fall in the range from 20 tpd to about 200 tpd plants. This corresponds with an annual production of 6,600 to 66,000 metric tons. Looking at table 2.3, it can be seen that the potential demand seems to be enough in virtually every region to sustain a mini cement plant, with the single exception of Singida region.
The regions of Mwanza, Morogoro and Arusha seem to have such a demand that each of these regions could sustain a relatively large small scale cement plant with a 200 tpd capacity.
If the demand of the whole Lake region is considered, then there seems to be even enough demand to sustain 2 of such plants: Kagera, Mwanza, Mara and Shinyanga region together have a potential demand of about 110,000 tons.
It might, however, tum out not to be possible to put up and operate small cement plants succesfully in all of these regions. There are two major constraining factors on the implementation of this technology.
The first is that the 'space' for new cement plants to enter the cement market is quite small: according to the model used in this section the extra demand on top of the present production is little less than a quarter of a million tons annually. This demand could easily be met by the existing cement plants since these are all operating far below full capacity utilization. The total installed production capacity of the three existing cement plants in Tanzania is about 1,270,000 tons per annum, while the present annual production is about 650,000 to 700,000 tons of which 550,000 to 600,000 are consumed locally, the rest is exported [ 1].
The second constraining factor is the on-going liberalization of the Tanzanian economy and the competition that will probably evolve from this. As a consequence of the 1986 Economic Recovery Plan (ERP) all existing cement factories in Tanzania are being privatized. The plants are most likely to be sold to large cement producing conglomorates. The pla.'1ts vvill no longer be subsidiaries of the same parastatal but become competitors on the Tanzanian cement market. The connection to these conglomorntes will probably lead to ai.1 increase in the efficiency of the cement plants which are presently still largely state-owned and known for their inefficiency. Measures which are most likely to be taken are efforts to increase the energyefficiency of the plants, which refers to the power consumption as well as to the consumption of fuel oil, and possibly a switch from fuel oil to cheaper and locally produced fuel like gas or coal. Emphasis will probably also be on increasing the capacity
25
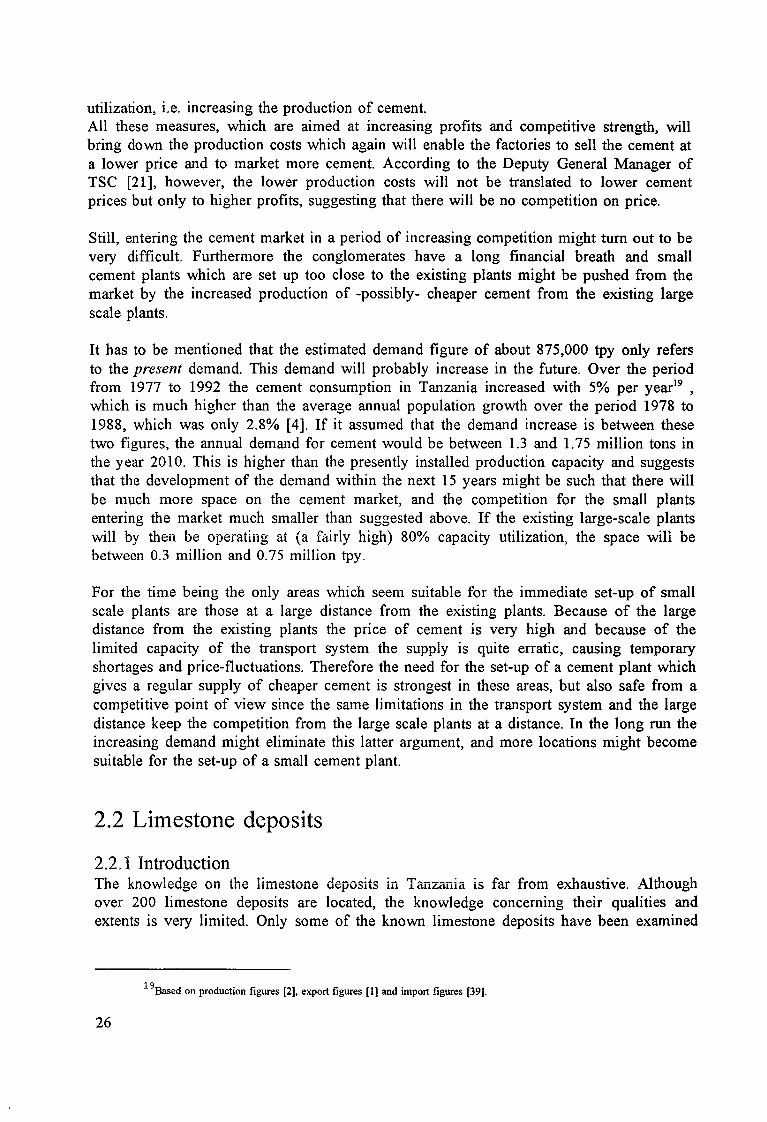
utilization, i.e. increasing the production of cement. All these measures, which are aimed at increasing profits and competitive strength, will bring down the production costs which again will enable the factories to sell the cement at a lower price and to market more cement. According to the Deputy General Manager of TSC [21], however, the lower production costs will not be translated to lower cement prices but only to higher profits, suggesting that there will be no competition on price.
Still, entering the cement market in a period of increasing competition might turn out to be very difficult. Furthermore the conglomerates have a long financial breath and small cement plants which are set up too close to the existing plants might be pushed from the market by the increased production of -possibly- cheaper cement from the existing large scale plants.
It has to be mentioned that the estimated demand figure of about 875,000 tpy only refers to the present demand. This demand will probably increase in the future. Over the period from 1977 to 1992 the cement consumption in Tanzania increased with 5% per year19
,
which is much higher than the average annual population growth over the period 1978 to 1988, which was only 2.8% [4]. If it assumed that the demand increase is between these two figures, the annual demand for cement would be between 1.3 and 1. 75 million tons in the year 2010. This is higher than the presently installed production capacity and suggests that the development of the demand within the next 15 years might be such that there will be much more space on the cement market, and the competition for the small plants entering the market much smaller than suggested above. If the existing large-scale plants will by then be operating at (a fairly high) 80% capacity utilization, the space will be between 0.3 million and 0.75 million tpy.
For the time being the only areas which seem suitable for the immediate set-up of small scale plants are those at a large distance from the existing plants. Because of the large distance from the existing plants the price of cement is very high and because of the limited capacity of the transport system the supply is quite erratic, causing temporary shortages and price-fluctuations. Therefore the need for the set-up of a cement plant which gives a regular supply of cheaper cement is strongest in these areas, but also safe from a competitive point of view since the same limitations in the transport system and the large distance keep the competition from the large scale plants at a distance. In the long run the increasing demand might eliminate this latter argument, and more locations might become suitable for the set-up of a small cement plant.
2.2 Limestone deposits
2.2.1 Introduction The knowledge on the limestone deposits in Tar1zania is far from exhaustive. Although over 200 limestone deposits are located, the knowledge concerning their qualities and extents is very limited. Only some of the known limestone deposits have been examined
19Based on production figures [2], export figures [l] and import figures [39].
26

more closely to get an indication of quality and quantity, and only very few have been investigated thoroughly. Besides, the list of over 200 limestone deposits which are known might very well not be exhaustive, the actual number of deposits might well be much higher.
In "The development of the non-metallic minerals and the silicate industry in Tanzania, volume 2" (editor: Kimambo, 1987 [5]) all knowledge on the limestone deposits in Tanzania is gathered and summarized. The Appendix in that book, which lists the known limestone deposits and the available information on them, can be regarded as the "state-ofthe art" concerning the knowledge on limestone deposits. The author of the Appendix collected all available sources which mention anything on Tanzanian limestone deposits. Since this book was published very little to no research has been done into limestone deposits in Tanzania, according to the author2°. The latter fact was verified at the Mineral Resources Division of the Ministry of Energy, Water and Minerals, where virtually all files on limestone date from before 1985.
The limestone deposits which are mentioned in the previously mentioned publication can be divided according to their suitability for the set-up of a small cement plant and according to the knowledge which is available. This will be done in paragraph 2.2.2 and onwards.
Before looking into the list of known limestone deposits in Tanzania some general statements can be made on the quality and quantity of limestone in Tanzania.
The marine limestone deposits are the most extensive ones in Tanzania. They can be found all along the Indian Ocean, extending several kilometers inland. The fossiliferous limestones (like for example coral, molluscan or foraminifera limestones) of Jurassic, Tertiary and Quaternary age, which make up the largest part of the Tanzanian marine limestone deposits, are usually of very good quality, which means that they have a very high calcium-carbonate content and little impurities. Therefore, it will not be very difficult to find good quality and extensive limestone deposits along the coast. The limestone deposits up-country are of various ages and origins. Generally speaking the travertine and porcellanous limestones are of good quality. These deposits can be found at the north end of Lake Nyasa, which is also where a number of extensive and good quality marble limestone deposits can be found.
Good limestone deposits are much rarer up-country than along the coast, and only a limited number of deposits up-country which might potentially be suitable for the set-up of a OPC plant are known.
2.2.2 List of limestone deposits The iist of deposits which is mentioned in the publication of Kimambo has been divided according to the potential quality of these deposits for the set-up of cement plants. This
2 0Tue author is Mr. Ilangali, nowadays Principal Research Officer at TSC, but fonnerly Senior Geologist at Tanzania Saruji
Corporation.
27
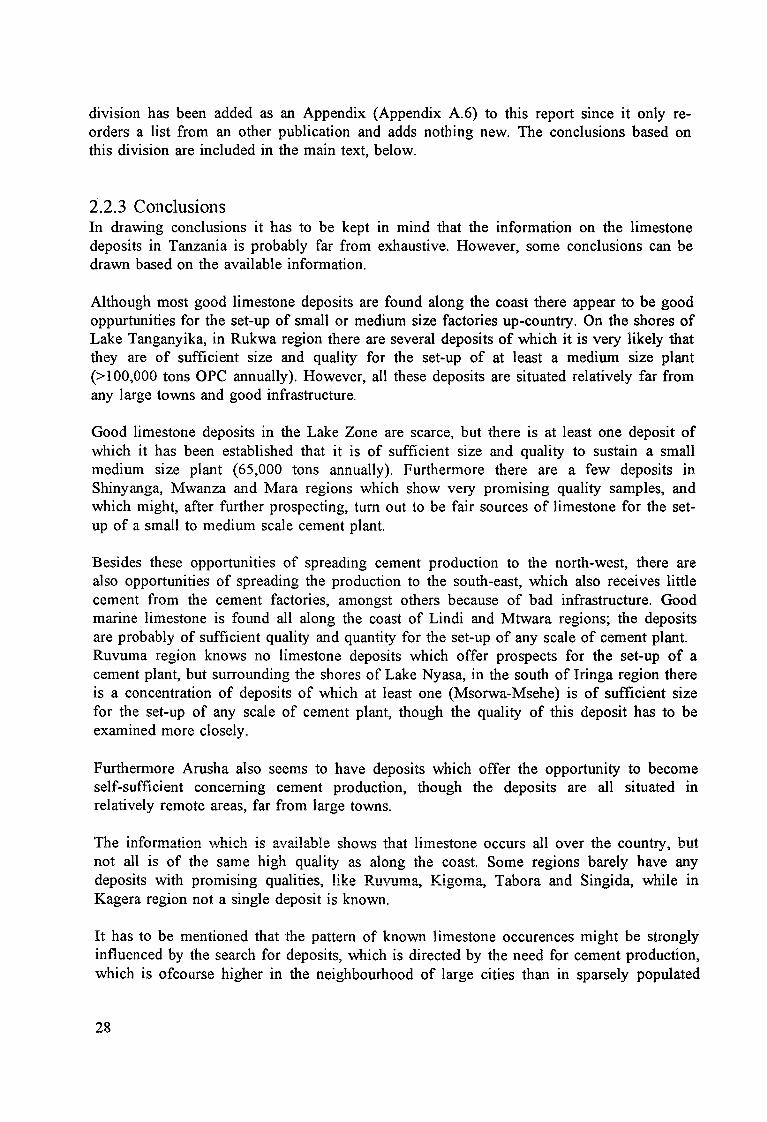
division has been added as an Appendix (Appendix A.6) to this report since it only reorders a list from an other publication and adds nothing new. The conclusions based on this division are included in the main text, below.
2.2.3 Conclusions In drawing conclusions it has to be kept in mind that the information on the limestone deposits in Tanzania is probably far from exhaustive. However, some conclusions can be drawn based on the available information.
Although most good limestone deposits are found along the coast there appear to be good oppurtunities for the set-up of small or medium size factories up-country. On the shores of Lake Tanganyika, in Rukwa region there are several deposits of which it is very likely that they are of sufficient size and quality for the set-up of at least a medium size plant (>I 00,000 tons OPC annually). However, all these deposits are situated relatively far from any large towns and good infrastructure.
Good limestone deposits in the Lake Zone are scarce, but there is at least one deposit of which it has been established that it is of sufficient size and quality to sustain a small medium size plant (65,000 tons annually). Furthermore there are a few deposits in Shinyanga, Mwanza and Mara regions which show very promising quality samples, and which might, after further prospecting, tum out to be fair sources of limestone for the setup of a small to medium scale cement plant.
Besides these opportunities of spreading cement production to the north-west, there are also opportunities of spreading the production to the south-east, which also receives little cement from the cement factories, amongst others because of bad infrastructure. Good marine limestone is found all along the coast of Lindi and Mtwara regions; the deposits are probably of sufficient quality and quantity for the set-up of any scale of cement plant. Ruvuma region knows no limestone deposits which offer prospects for the set-up of a cement plant, but surrounding the shores of Lake Nyasa, in the south of Iringa region there is a concentration of deposits of which at least one (Msorwa-Msehe) is of sufficient size for the set-up of any scale of cement plant, though the quality of this deposit has to be examined more closely.
Furthermore Arusha also seems to have deposits which off er the opportunity to become self-sufficient concerning cement production, though the deposits are all situated in relatively remote areas, far from large towns.
The information which is available shows that limestone occurs all over the country, but not all is of the same high quality as along the coast. Some regions barely have any deposits with promising qualities, like Ruvuma, Kigoma, Tabora and Singida, while in Kagera region not a single deposit is known.
It has to be mentioned that the pattern of known limestone occurences might be strongly influenced by the search for deposits, which is directed by the need for cement production, which is ofcourse higher in the neighbourhood of large cities than in sparsely populated
28
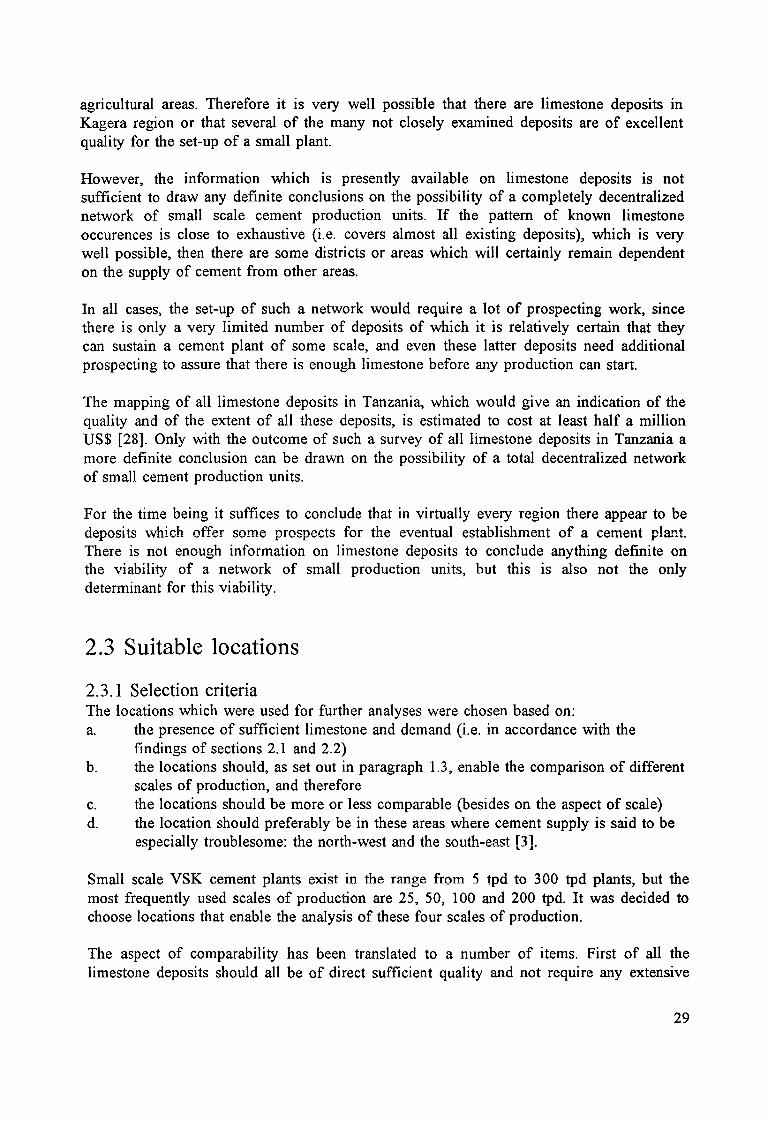
agricultural areas. Therefore it is very well possible that there are limestone deposits in Kagera region or that several of the many not closely examined deposits are of excellent quality for the set-up of a small plant.
However, the information which is presently available on limestone deposits is not sufficient to draw any definite conclusions on the possibility of a completely decentralized network of small scale cement production units. If the pattern of known limestone occurences is close to exhaustive (i.e. covers almost all existing deposits), which is very well possible, then there are some districts or areas which will certainly remain dependent on the supply of cement from other areas.
In all cases, the set-up of such a network would require a lot of prospecting work, since there is only a very limited number of deposits of which it is relatively certain that they can sustain a cement plant of some scale, and even these latter deposits need additional prospecting to assure that there is enough limestone before any production can start.
The mapping of all limestone deposits in Tanzania, which would give an indication of the quality and of the extent of all these deposits, is estimated to cost at least half a million US$ [28]. Only with the outcome of such a survey of all limestone deposits in Tanzania a more definite conclusion can be drawn on the possibility of a total decentralized network of small cement production units.
For the time being it suffices to conclude that in virtually every region there appear to be deposits which offer some prospects for the eventual establishment of a cement plant. There is not enough information on limestone deposits to conclude anything definite on the viability of a network of small production units, but this is also not the only determinant for this viability.
2.3 Suitable locations
2.3.1 Selection criteria The locations which were used for further analyses were chosen based on: a. the presence of sufficient limestone and demand (i.e. in accordance with the
findings of sections 2.1 and 2.2) b. the locations should, as set out in paragraph 1.3, enable the comparison of different
scales of production, and therefore c. the locations should be more or less comparable (besides on the aspect of scale) d. the location should preferably be in these areas where cement supply is said to be
especially troublesome: the north-west and the south-east [3].
Small scale VSK cement plants exist in the range from 5 tpd to 300 tpd plants, but the most frequently used scales of production are 25, 50, 100 and 200 tpd. It was decided to choose locations that enable the analysis of these four scales of production.
The aspect of comparability has been translated to a number of items. First of all the limestone deposits should all be of direct sufficient quality and not require any extensive
29

up-grading process. This would demand extra investments and extra production costs and hamper the comparisons. Furthermore the locations should preferably all be close to existing roads and power supply connections since especially these two aspects can add strongly to the fixed investments and hamper the comparisons of scale.
2.3 .2 Locations The north-west part of Tanzania mainly consists of the Lake Zone. The Lake Zone consists of the regions around Lake Victoria (Kagera, Mwanza and Mara) and Shinyanga region. According to the model in paragraph 2.1 the total demand for cement in the Lake Zone is about 110,000 tpy, and about 80,000 tpy in Shinyanga and Mwanza regions alone. This amply justifies the set-up of a 100 tpd or 200 tpd cement factory (33,000 tpy or 66,000 tpy). The limestone deposits with good or promising features in the Lake Zone are mostly located in Mara and Shinyanga regions. Those in Mara have the disadvantage that they are located in game reserves and far from infrastructure. In Shinyanga there is only one deposit which has been investigated thoroughly enough to conclude that it is suitable for the set-up of a cement factory21
• The limestone in this deposit does, however, require intensive up-grading and has therefore not been used. Instead, an other deposit, of which it is only known that a limited number of chemical analyses indicated good quality and that the deposit is 'extensive', has been chosen. This concerns the Lukalanga deposit, located close to Mwadui in Shinyanga region. Although it is not possible to conclude anything definite on the suitability of this deposit, it does meet all the other criteria.
Mtwara and Lindi regions are both located in the south-east of the country. According to the model used in paragraph 2.1 the demand for cement in these two regions together is about 16,000 tpy. Possible scales of production are 25 tpd and 50 tpd (8,250 tpy and 16,500 tpy). Both regions have a large number of fossil limestone deposits along the coast. None of these deposits has been investigated thoroughly, but the limestone is of the same type and ages as the limestone used for cement production in Dar es Salaam and Tanga. The analyses of the 25 tpd and 50 tpd plant are based on a limestone deposit just north of Lindi town, deposit number 5 in the list of probably suitable limestone deposits in Appendix A.6. The deposit is of very high purity and can be assumed to be extensive enough to sustain even a large-scale plant.
Resuming, the Lukalanga limestone deposit near Mwadui in Shinyanga region is used as the basis for the analyses of a 100 tpd and a 200 tpd plant. The limestone deposit which is located just north of Lindi is used as the basis for the analyses of the 25 tpd and 50 tpd plant. In the following chapters the theoretical set-up of cement plants of these scales at these deposits is studied.
21Tuis concerns the Old Shinyanga area marly limestone deposit, which is deposit number 7 in the list of suitable limestone
deposits in Appendix A.6.
30
3. Commercial analyses
3 .1 Studied equipment packages In order to be able to study the theoretical application of small scale VSK technology quite detailed information had to be obtained from the manufacturers. This does not only include prices, but also a detailed description of the supplied equipment, supply conditions, etc. Based on such information it can be determined which additional equipment has to be purchased elsewhere, what kind of constructions or civil works have to be erected on the plant site, how much labour will be necessary to operate the plant, etc.
Information on small scale cement plants which is detailed enough to make analyses was obtained from two manufacturers: Saboo Engineers Ltd. from Jodhpur and Movers Pvt. Ltd from Bangalore. These two are also the two largest and most succesfull producers of small scale cement plants in India yet [10]. From both companies quotations/offers for the supply of several scales of cement plants were obtained.
The plants which are supplied by Movers are, within the spectrum of Indian small scale VSK cement plants, quite sophistated plants [I O]. There is little manual handling in the Movers plants and quite sophisticated instrumentation. According to Sinha [I O] the equipment in the Movers plants is "heavy duty equipment of excellent quality". In his analyses Sinha puts the plant life of plants based on NCB designs in general on 15 years22
•
Movers claims a plant life of 25 to 30 years for its plants [17]. Movers focusses on the supply of cement plants of I 00 tpd and larger. According to Movers smaller scales of production are "not viable" [17]; this corresponds with the outcome of the analyses of Sinha who concludes that the minimum economic scale of the Movers plants is 100 tpd. Therefore the larger scales of production which are studied here are based on Movers plants; the analyses of the I 00 tpd and the 200 tpd plants concern plants as supplied by Movers.
The plants which are supplied by Saboo Engineers are on the less sophisticated side of the spectrum. There is quite some manual materials handling and controls are said to be rudimentary [10]. The Saboo plants are cheaper than for example the Movers plants; Saboo also claims that its plants have a much lower power consumption. According to Sinha the Saboo equipment is "significantly less durable than that offered by the NCB". In his analyses Sinha puts the plant life of Saboo plants on 7 years which seems very short. However, in a recent publication of a Saboo-employee [31] a depreciation on the plant equipment of 10 percent is mentioned. This suggests that Saboo Engineers put the plant life of their plants at 10 years, which is also relatively short. Saboo focusses on the supply of smaii single kiln production units of 25 and 50 tpd. Sinha concluded from his research that the minimum economic scale of the Saboo technology is 50 tpd. Unfortunately he oniy studied NCB and Saboo equipment and does not mention any manufacturer that can
22 As could already be seen in chapter 1, the Movers plants are based on designs from the National Council for Cement and Building Materials from India. The NCB only supplies licenses for the production of plants based on their designs; Movers is one of the NCB licensees.
31

supply equipment with a lower minimum economic scale. Therefore the smaller scales of production which are studied here, 25 and 50 tpd, are based on Saboo plants.
3.2 Approach
3.2.1 Calculated profitability indicators The first part of the commercial analyses was to calculate a number of profitabilityindicators for all four projects. These indicators, which are discussed below, only consist of single figures which can be compared with the same indicators of other projects. Since these indicators are standard indicators which are calculated in the same way for all projects and can hence be compared, they allow for investment decisions.
Three important indicators of the commercial viability have been calculated. The first one is the Net Present Value (NPV). The NPV takes the present value of all (future) costs and revenues and sums them up. The present value of a cost or revenue is found by discounting that cost or value against the bank rate on personal savings. The present value values future costs or revenues with the bank rate in mind: money which is earned earlier is valued higher since it can be put on the bank to accrue. The same is valid for costs: costs which have to be made earlier are valued higher, since money can be put on the bank to accrue to the amount of money needed later. The value of the future costs and revenues of this project have been discounted against the (NBC) bank rate on personal savings, which at present is 29 %. The disadvantage of the NPV in this study is the fact that projects with different lifetimes and different initial investments are compared. The NPV of a project does not tell anything about when the money will be earned. Therefore also two other indicators have been calculated.
The second indicator is the Internal Rate of Return (IRR). The IRR reflects the return that can be expected on the invested money, and can be compared with the bank rates on for example personal savings. If the IRR is lower than the bank rate, it is better to put the money on the bank since it will then accrue without risk. However, if the IRR of the project is higher, the return made on money put into the project is higher than if the money would be put on the bank. Two IRR's have been calculated. The first is the general IRR of the whole project which compares the costs and the revenues of the project. The second is the IRR on the equity capital which is invested by the entrepreneur which compares the cost and revenues for the entrepreneur. These two IRR's can in some cases be strongly different; therefore both have been calculated in order to be able to draw more definite conclusions on the profitability of the projects for the entreprenems. The IRR itself has the disadvantage that it does not tell anything about the absolute size of the profits, but only gives a relative figure. This objection against the use of the IRR is overcome by also calculating the NPV. Although the NPV does not reflect the absolute size of the profits, it does give an absolute valuation of the profitability of a project.
The third indicator is the pay-back period. This indicator shows the time it takes to earn back the initial investment. Certainly in the context of a developing country this is an
32
important additional indicator. If the money is eamt back fast, this reduces the risk involved. If it takes long to earn back the invested money, the chances are higher that high inflation or other interferences occur which affect the profitability of the project, and the invested money is not eamt back.
3.2.2 Investments and cost structures Though the indicators that are discussed in 3.2.1 are sufficient to compare the different projects on their profitability, they do not tell anything about the structural differences in the projects that cause the differences in profitability. In other words: the question "why is project A more profitable than project B ?" is not answered. In order to get an insight into this matter the different components of the production costs and the investments involved in the different projects are compared. If the cost structures and investments are known, it is possible to point out the most pressing cost components and the reasons for the differences.
3 .3 Commercial and sensitivity analyses23
3 .3 .1 Introduction For each of the four plants the above mentioned indicators have been calculated. These calculations are based on conditions that are assumed to be the ones that are most likely to occur in reality. It is, however, very well possible that certain elements in the analyses will tum out different in reality which can strongly influence the eventual viability of the projects. There are two elements which are considered to be very important determinants for the commercial viability. These are the total initial investment and the production capacity utilization. They both are relatively uncertain elements in this study, and small variations in each of these two elements can have a strong influence on the outcome of the commercial analyses.
The initial investment determines the financial costs, which have to be paid back by the earnings of the production process. This can be a heavy burden on a project, certainly if the interest rate is high. Furthermore the commercial viability of a project is usually determined by, in some way, comparing the amount of money that has to be put into a project (the investment) to the earnings that are generated by the project. All other things being equal, a project with a lower investment is of course more profitable, since less investments are required to generate the same earnings.
Also the capacity utilization is very important. Certainly in the first years of production this is a very important item since loans have to be repaid and the financial obligations have to be fulfilled. ·while the financial pressme is strnng in these first years capacity utilization is probably low since it concerns a new production process in which learning
23For each of the plants that is investigated a series of spreadsheets has been made which are the basis for the detem1ination of the commerial viability. The print-outs of these sheets have been gathered and can be found in part two of this report. All findings in the rest of chapter 3 are based on these spreadsheets. Figures on the performance of the plants without further reference can be found in these sheets.
33

quick as possible, especially in order to be able to meet the financial obligations.
Since these elements are relatively uncertain but can have a strong influence on the outcome of the analyses, three scenarios have been used in the calculations, in which the initial investments and the capacity utilization vary. Only these two elements have been varied, since the other elements are more certain and/or have a much smaller potential effect on the outcome of the analyses.
First of all there is a 'normal' scenario. This is the scenario of which it is assumed that it is the one that is most likely to occur. The print-outs of the worksheets and the notes on these worksheets as collected in the Appendices E all refer to this scenario. Appendix A.4 explains how the capacity utilization figures of this scenario were arrived at and which assumptions were made.
Then there is the minimal or 'worst case' scenario24• In this scenario the investments tum
out to be 10% higher than expected in the normal scenario (on top of the 10% unforeseen which is already included). The capacity utilization starts low and it takes longer to reach optimum levels of capacity utilization. It starts off at only 40% and it takes four years to reach a maximum level of 75%. This limited capacity utilization can be caused by a variety of reasons, like a lack of maintenance, spare parts, stocks, fuel, etc. These are all deficiencies that can occur and result in the same drop in capacity utilization.
The third scenario is the maximal scenario. In this case the investments tum out 10% lower than in the normal scenario, which means that the 10% unforeseen investment costs are omitted. Also the capacity utilization develops more positively: it starts off higher and reaches optimum levels quicker. The first year a capacity utilization of 65% is reached, while all plants reach their maximum level in year 2, which is 90 or 95% (depending on the type of power connection of the plants: national grit or local supply).
A last element which has to be addressed before looking at the sensitivity analyses is the sales-price of cement. The potential influence of variations in the sales-price on the outcome of the analyes is of the same magnitude as that of the initial investment and the capacity utilization since the sales of the product are the only source of income. However, based on knowledge of the present sales-price of cement throughout Tanzania and the prices of transport, the sales price of OPC for the plants at both locations has been set at Tshs 4,000 per bag of 50 kg. This is a relatively certain price which leaves some space for competition. The construction of this price is elaborated upon in Appendix D.3.
3.3.2 The Saboo Engineers 25 tpd plant at Lindi This 25 tpd plant is a very small and relatively simple plant with only one kiln. In the normal scenario the capacity utilization is assumed to be 50% in the first year, and 90% in
2 4 The term 'worst case' refers to the worst realistic scenario and not the worst possible one.
34
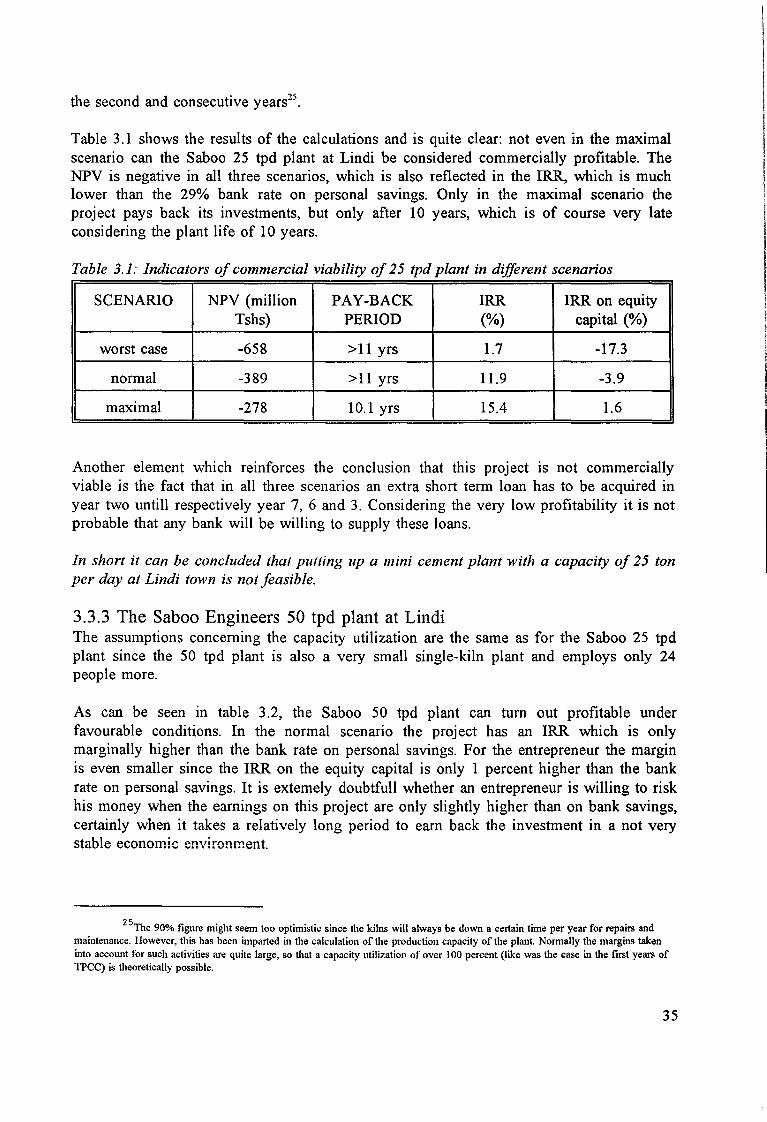
the second and consecutive years25.
Table 3 .1 shows the results of the calculations and is quite clear: not even in the maximal scenario can the Saboo 25 tpd plant at Lindi be considered commercially profitable. The NPV is negative in all three scenarios, which is also reflected in the IRR, which is much lower than the 29% bank rate on personal savings. Only in the maximal scenario the project pays back its investments, but only after 10 years, which is of course very late considering the plant life of 10 years.
Table 3.1: Indicators of commercial viability of 25 tpd plant in different scenarios
SCENARIO NPV (million PAY-BACK IRR IRR on equity Tshs) PERIOD (%) capital(%)
worst case -658 >11 yrs 1.7 -17.3
normal -389 >11 yrs 11.9 -3.9
maximal -278 10.1 yrs 15.4 1.6
Another element which reinforces the conclusion that this project is not commercially viable is the fact that in all three scenarios an extra short term loan has to be acquired in year two untill respectively year 7, 6 and 3. Considering the very low profitability it is not probable that any bank will be willing to supply these loans.
In short it can be concluded that putting up a mini cement plant with a capacity of 25 ton per day at Lindi town is not feasible.
3.3.3 The Saboo Engineers 50 tpd plant at Lindi The assumptions concerning the capacity utilization are the same as for the Saboo 25 tpd plant since the 50 tpd plant is also a very small single-kiln plant and employs only 24 people more.
As can be seen in table 3.2, the Saboo 50 tpd plant can tum out profitable under favourable conditions. In the normal scenario the project has an IRR which is only marginally higher than the bank rate on personal savings. For the entrepreneur the margin is even smaller since the IRR on the equity capital is only 1 percent higher than the bank rate on personal savings. It is extemely doubtfull whether an entrepreneur is willing to risk his money when the earnings on this project are only slightly higher than on bank savings, certainly when it takes a relatively long period to earn back the investment in a not very stable economic environment.
2 5The 90% figure might seem too optimistic since the kilns will always be down a certain time per year for repairs and
maintenance. However, this has been imparted in the calculation of the production capacity of the plant. Normally the margins taken into account for such activities are quite large, so that a capacity utilization of over l 00 percent (like was the case in the first years of TPCC) is theoretically possible.
35
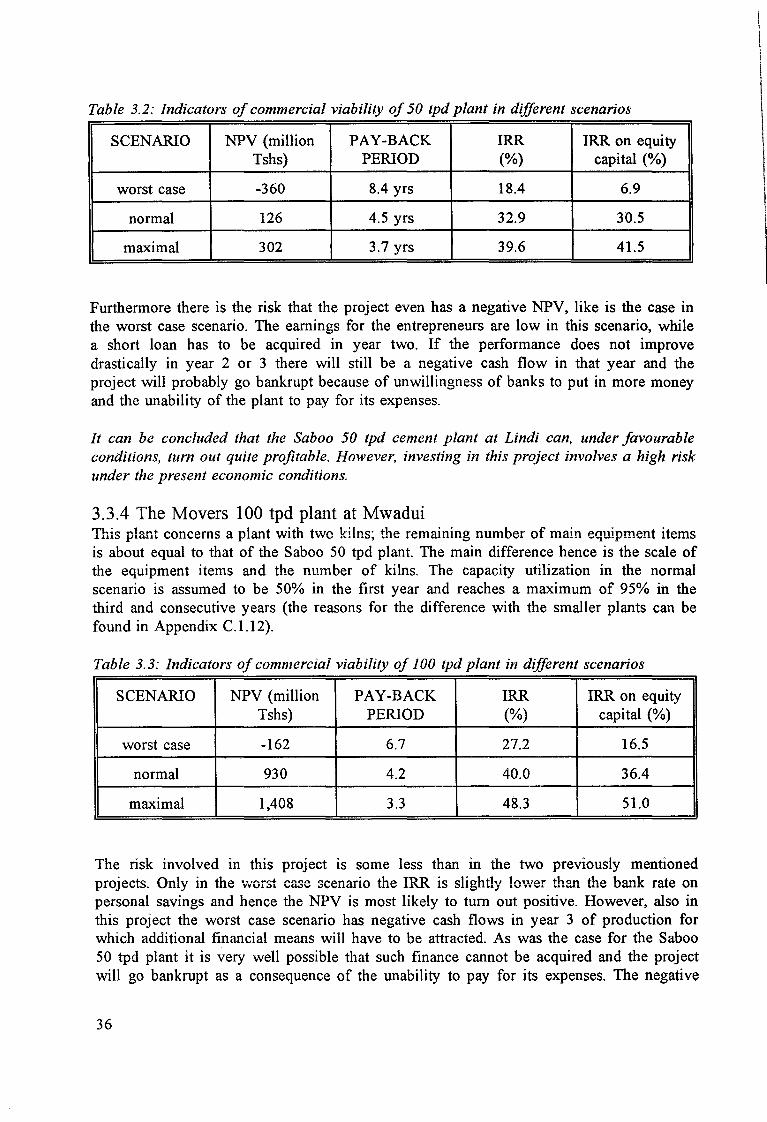
Table 3.2: Indicators of commercial viability of 50 tpd plant in different scenarios
SCENARIO NPV (million PAY-BACK IRR IRR on equity Tshs) PERIOD (%) capital(%)
worst case -360 8.4 yrs 18.4 6.9
normal 126 4.5 yrs 32.9 30.5
maximal 302 3.7 yrs 39.6 41.5
Furthermore there is the risk that the project even has a negative NPV, like is the case in the worst case scenario. The earnings for the entrepreneurs are low in this scenario, while a short loan has to be acquired in year two. If the performance does not improve drastically in year 2 or 3 there will still be a negative cash flow in that year and the project will probably go bankrupt because of unwillingness of banks to put in more money and the unability of the plant to pay for its expenses.
It can be concluded that the Saboo 50 tpd cement plant at Lindi can, under favourable conditions, turn out quite profitable. However, investing in this project involves a high risk under the present economic conditions.
3.3.4 The Movers 100 tpd plant at Mwadui This plant concerns a plant with two kilns; the remaining number of main equipment items is about equal to that of the Saboo 50 tpd plant. The main difference hence is the scale of the equipment items and the number of kilns. The capacity utilization in the normal scenario is assumed to be 50% in the first year and reaches a maximum of 95% in the third and consecutive years (the reasons for the difference with the smaller plants can be found in Appendix C.1.12).
Table 3.3: Indicators of commercial viability of 100 tpd plant in different scenarios
SCENARIO NPV (million PAY-BACK IRR IRR on equity Tshs) PERIOD (%) capital (%)
worst case -162 6.7 27.2 16.5
normal 930 4.2 40.0 36.4
maximal 1,408 3.3 48.3 51.0
The risk involved in this project is some less than in the two previously mentioned piojects. Only in the worst case scenario the IP~ is slightly lo\ver than the ba...11k rate on personal savings and hence the NPV is most likely to tum out positive. However, also in this project the worst case scenario has negative cash flows in year 3 of production for which additional financial means will have to be attracted. As was the case for the Saboo 50 tpd plant it is very well possible that such finance cannot be acquired and the project will go bankrupt as a consequence of the unability to pay for its expenses. The negative
36

cash flow in year 3 is, however, also only relatively small and can be avoided by increasing the capacity utilization in the first production years with a few percent.
An other drawback of the worst case scenario of this project is the fact that the earnings for the entrepreneur are low; while the general IRR of the project is only slightly lower than the bank rate on personal savings, the IRR on equity capital is much lower.
Even under nonnal conditions the 100 tpd Movers plant at Mwadui is likely to turn out quite profitable. This project does, however, also have some risk of negative cash flows which might lead to the failure of the project.
3.3.5 The Movers 200 tpd plant at Mwadui This plant concerns a four kiln plant with auxiliary equipment which is largely the same as of the other three plants, but larger in scale. The assumptions concerning the capacity utilization are the same as those of the 100 tpd plant.
Table 3.4: Indicators of commercial viability of 200 tpd plant in different scenarios
SCENARIO NPV (million PAY-BACK IRR IRR on equity Tshs) PERIOD (%) capital (%)
worst case 882 5.1 34.8 27.9
normal 3,007 3.3 49.7 52.9
maximal 3,910 2.6 60.4 74.1
It can be concluded from the figures in table 3.4 that this project involves the least risk of all four projects. Even in the worst case scenario the general IRR is higher than the bank rate on personal savings, while in the more positive scenarios the project can even be described as quite lucrative: for the entrepreneur the earnings can be over two and a half times as high as the bank rate on personal savings. This project also has the shortest payback periods, though the differences with the 50 tpd and 100 tpd plant are not very big.
In short it can be concluded that the Movers 200 tpd cement plant at Mwadui, Shinyanga is a profitable investment opportunity which involves relatively little risk.
3.4 Comparison of the different plants
3.4. l Introduction The results of paragraph 3.3 are displayed graphically in graph 3.1. The graph, which displays the IRR's of the different piants under the described scenarios, cieariy shows that
37

the relative26 profitability increases with the scale of production. This means that the capital which is invested in the larger plants gives a higher return than the capital which is invested in the smaller scale plants. The absolute profitability, expressed in the ~"'PV, also
Graph 3.1: IRR's of the different plants under different scenarios
IRR's of small scale cement plants for different scenarios
60 ............................................................................................................................................................................................................................... ...
50
40 ......................................................................................................................... ::::::::::::::.,.+"'"::::::::::::· a: ........... .. a: ......
..................... 30 .............................................................. ;.,,,,...,,:: .. .
+'"·""
20
...................................... + ..........................
scenario (worst case, normal, maximal)
--Movers 200 tpd ·-.... +·-..
Movers 100 tpd
----*-Saboo 50tpd -E!-
Saboo 25 tpd
increases with the scale of production, but this is less surprising since the larger projects involve more investments27
• Graph 3.1 is a clear demonstration of the economies of scale rule: as the scale of production increases the profitability increases. This economies of scale effect has two parts. The first is the relative height of the investments, and the second is the production costs, which are partly determined by the investments.
3.4.2 Investments per ton of output capacity Table 3.5 shows the total initial investments per ton of annual output capacity for all four plants. The investments of the Saboo 25 tpd plant are relatively much higher than the
2 6Tue IRR reflects the relative profitability since it gives an indication of the earnings that are to be expected on a tmit of invested capital. The !\1PV reflects the absolute profitability since it gives an indication of the total earnings that can be eiq>ected from a project.
21Even if the IRR's of the four different projects would be equal, the NPV would still be highest for the project with the highest investment, since the tmits of capital invested in this largest project would generate the same earnings as the tmits of capital invested in the smaller projects. Consequently more tmits of capital invested lead to higher earnings.
38
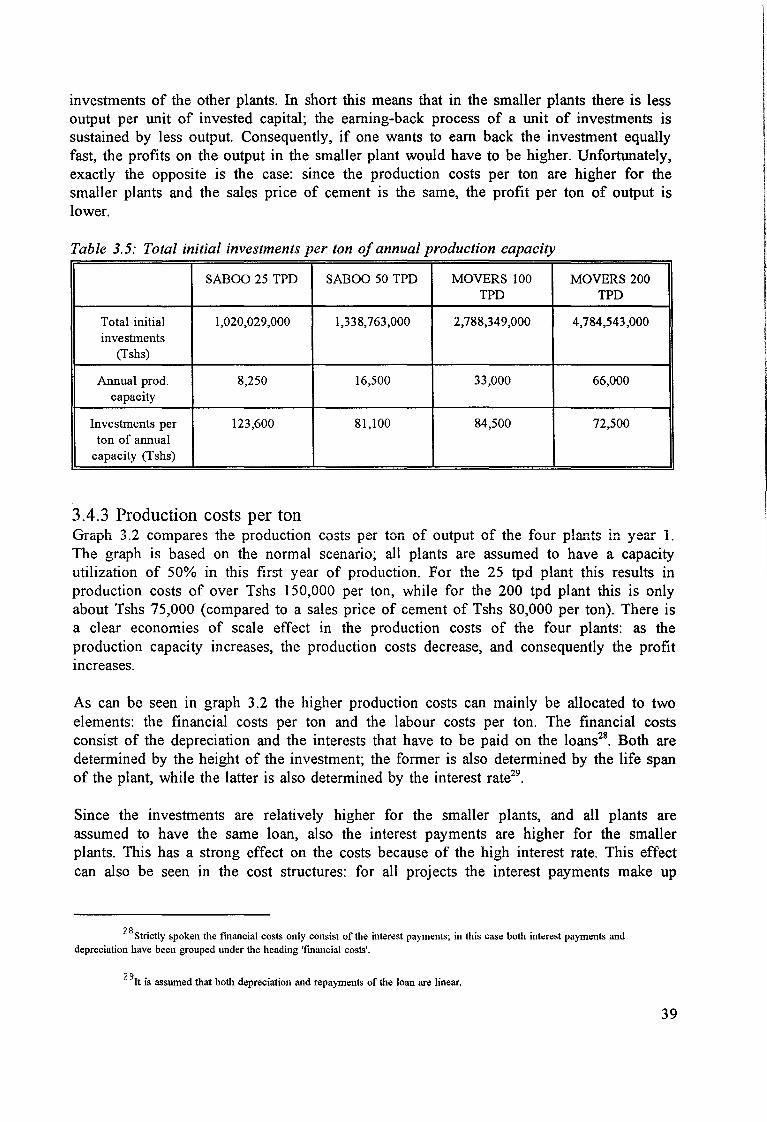
investments of the other plants. In short this means that in the smaller plants there is less output per unit of invested capital; the earning-back process of a unit of investments is sustained by less output. Consequently, if one wants to earn back the investment equally fast, the profits on the output in the smaller plant would have to be higher. Unfortunately, exactly the opposite is the case: since the production costs per ton are higher for the smaller plants and the sales price of cement is the same, the profit per ton of output is lower.
Table 3.5: Total initial investments per ton of annual production capacity
SABOO 25 TPD SABOO 50 TPD MOVERS 100 MOVERS 200 TPD TPD
Total initial 1,020,029,000 1,338,763,000 2,788,349,000 4,784,543,000 investments
(Tshs)
Annual prod. 8,250 16,500 33,000 66,000 capacity
Investments per 123,600 81,100 84,500 72,500 ton of annual
capacity (Tshs)
3.4.3 Production costs per ton Graph 3 .2 compares the production costs per ton of output of the four plants in year 1. The graph is based on the normal scenario; all plants are assumed to have a capacity utilization of 50% in this first year of production. For the 25 tpd plant this results in production costs of over Tshs 150,000 per ton, while for the 200 tpd plant this is only about Tshs 75,000 (compared to a sales price of cement of Tshs 80,000 per ton). There is a clear economies of scale effect in the production costs of the four plants: as the production capacity increases, the production costs decrease, and consequently the profit increases.
As can be seen in graph 3 .2 the higher production costs can mainly be allocated to two elements: the financial costs per ton and the labour costs per ton. The financial costs consist of the depreciation and the interests that have to be paid on the loans28
• Both are determined by the height of the investment; the former is also determined by the life span of the plant, while the latter is also determined by the interest rate29
•
Since the investments are relatively higher for the smaller plants, and all plants are assumed to have the same loan, also the interest payments are higher for the smaller plants. This has a strong effect on the costs because of the high interest rate. This effect can also be seen in the cost structures: for all projects the interest payments make up
2 8 Strictly spoken the financial costs only consist of the interest payments; in this case both interest payments and depreciation have been grouped under the heading 'financial costs'.
2 9It is assumed that both depreciation and repayments of the loan are linear.
39

about one third of all costs in year one. This is the largest single cost for all projects and hence the cost component which puts the strongest pressure on the profitability and viability in the first years30
•
Graph 3.2: Production costs per ton of the different plants in year 1 of production (capacity utilization 50% for all plants)
Production costs/ton in year 1 for different scales of production
160 ffiH§
140 others
~ 120 fuels and power
.......... c .......... 0 CJ) 100 -- "O (/) c .r::. ~ (/) CJ) 80 t:., ::J
0 (/) ..c - I- 60 (/)
0 ..........
CJ labour
i!B financial costs
u
40
20
0
scales (25, 50, 100 and 200 tpd)
The fact that the investments are relatively higher for the smaller plants also has the effect that the depreciation is relatively higher for the smaller plants. This is reinforced by the fact that the plant life of the smaller Saboo plants is only half of that of the larger Movers plants (see 3 .1 ). The depreciation therefore has to take place in a shorter period, which consequently leads to higher financial costs for the smaller plants.
Also the labour costs add strongly to the differences in the production costs per ton. This is partly caused by an economies of scale effect31
, but also by the fact that the Saboo plants are more rudimentary and require more personnel because of manual handling of
3 0 Only in the first years, since the interest payments decrease untill they reach zero in year 8 of production as a consequence
of the loan repayments.
31For example: in all plants there is only one cement mill; only the output capacities of the mills vary. The number of
people necessary to operate a cement mill does barely vary with scale. The same applies to the operation of the laboratory, the raw mill, etc.
40
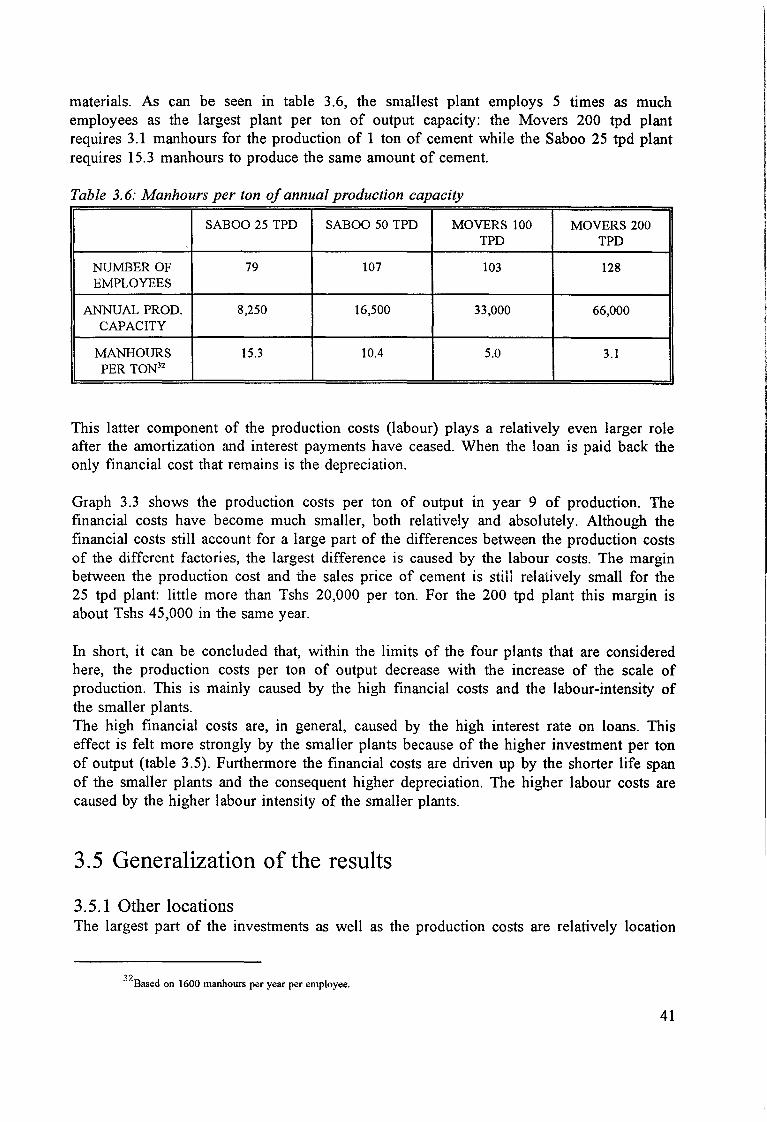
materials. As can be seen in table 3.6, the smallest plant employs 5 times as much employees as the largest plant per ton of output capacity: the Movers 200 tpd plant requires 3.1 manhours for the production of 1 ton of cement while the Saboo 25 tpd plant requires 15.3 manhours to produce the same amount of cement.
Table 3. 6: Manhours per ton of annual production capacity
SABOO 25 TPD SABOO 50 TPD MOVERS 100 MOVERS 200 TPD TPD
NUMBER OF 79 107 103 128 EMPLOYEES
ANNUAL PROD. 8,250 16,500 33,000 66,000 CAPACITY
MANHOURS 15.3 10.4 5.0 3.1 PER TON32
This latter component of the production costs (labour) plays a relatively even larger role after the amortization and interest payments have ceased. When the loan is paid back the only financial cost that remains is the depreciation.
Graph 3 .3 shows the production costs per ton of output in year 9 of production. The financial costs have become much smaller, both relatively and absolutely. Although the financial costs still account for a large part of the differences between the production costs of the different factories, the largest difference is caused by the labour costs. The margin between the production cost and the saies price of cement is stiil relatively small for the 25 tpd plant: little more than Tshs 20,000 per ton. For the 200 tpd plant this margin is about Tshs 45,000 in the same year.
In short, it can be concluded that, within the limits of the four plants that are considered here, the production costs per ton of output decrease with the increase of the scale of production. This is mainly caused by the high financial costs and the labour-intensity of the smaller plants. The high financial costs are, in general, caused by the high interest rate on loans. This effect is felt more strongly by the smaller plants because of the higher investment per ton of output (table 3.5). Furthermore the financial costs are driven up by the shorter life span of the smaller plants and the consequent higher depreciation. The higher labour costs are caused by the higher labour intensity of the smaller plants.
3.5 Generalization of the results
3.5.1 Other locations The largest part of the investments as well as the production costs are relatively location
32Based on 1600 manhours per year per employee.
41
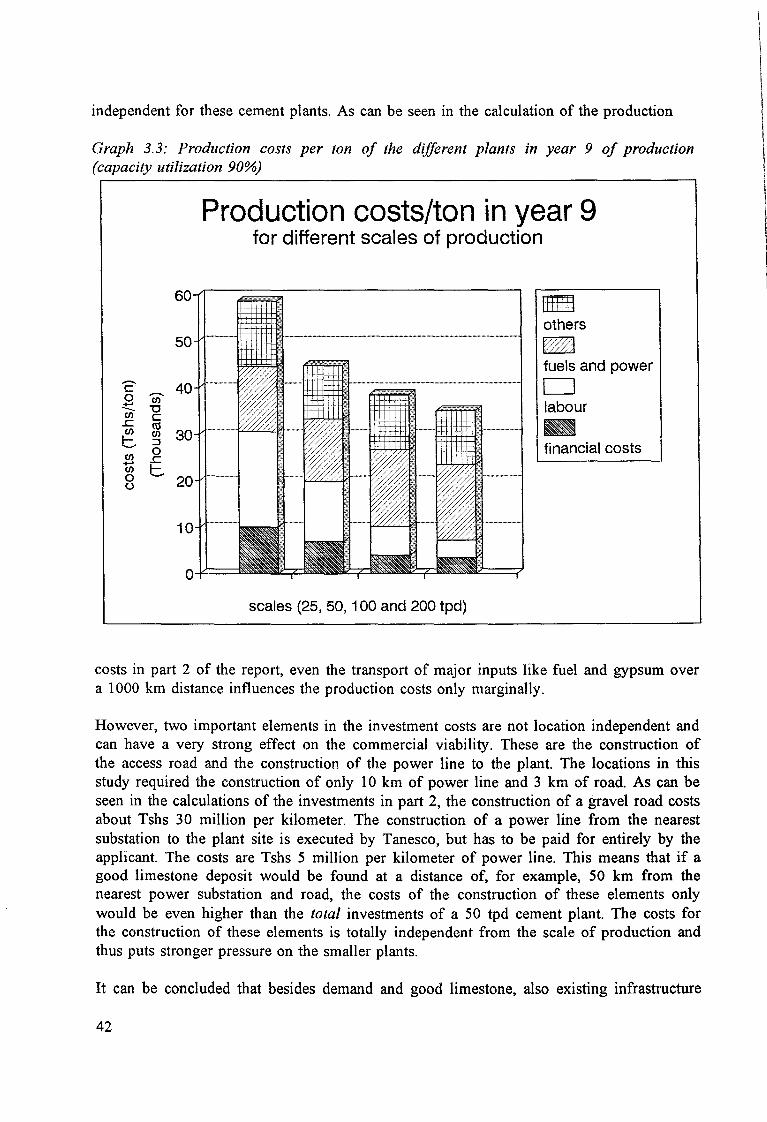
independent for these cement plants. As can be seen in the calculation of the production
Graph 3.3: Production costs per ton of the different plants in year 9 of production (capacity utilization 90%)
Production costs/ton in year 9 for different scales of production
60 mm others
50 w~ fuels and power - 40 c -. 0 en +-' - ""O en c ..c ctl en en 30 c. :J
en 0 +-' ..c en I-
c:J labour
~ financial costs
0 - 20 ()
10
0
scales (25, 50, 100 and 200 tpd)
costs in part 2 of the report, even the transport of major inputs like fuel and gypsum over a 1000 km distance influences the production costs only marginally.
However, two important elements in the investment costs are not location independent and can have a very strong effect on the commercial viability. These are the construction of the access road and the construction of the power line to the plant. The locations in this study required the construction of only 10 km of power line and 3 km of road. As can be seen in the calculations of the investments in part 2, the construction of a gravel road costs about Tshs 30 million per kilometer. The construction of a power line from the nearest substation to the plant site is executed by Tanesco, but has to be paid for entirely by the applicant. The costs are Tshs 5 million per kilometer of power line. This means that if a good limestone deposit would be found at a distance of, for example, 50 km from the nearest power substation and road, the costs of the construction of these elements only would be even higher than the total investments of a 50 tpd cement plant. The costs for the construction of these elements is totally independent from the scale of production and thus puts stronger pressure on the smaller plants.
It can be concluded that besides demand and good limestone, also existing infrastructure
42

has to be close to the plant site of a small cement plant. Especially the smaller plants are susceptible for the extra costs of infrastructure since these costs are scale-independent. This of course strongly limits the opportunities for the application of this technology. Using this technology to spread cement production to remote rural areas, for which it is often promoted, is only possible if these areas have high voltage power supply or if the plant would have an own power generation facility. The former is not very probably, while the latter is likely to cost too much for the small plants.
Within the limits of the four major conditions the results of the analyses can be generalized to the whole of Tanzania. As long as the plants are built close to a limestone deposit of sufficient quality and quantity and there is enough demand for cement, and infrastructure is in the vicinity of the plant site, the commercial viability of the plants will be about the same as on the locations which are used as plant locations in this report.
Under the present economic circumstances33, small scale cement plants with a production
capacity of JOO or 200 tpd, based on Movers cement production equipment, are profitable to very profitable investment opportunities in Tanzania, if set up close to the market, limestone deposit and existing infrastructure. Also a 50 tpd plant based on Saboo Engineers cement production equipment can, if the calculated investments are not exceeded and the projected capacity utilizations are achieved, be a quite profitable investment opportunity, though the risk of investing in this project is much higher than for the larger projects.
3.5.2 Other projects Although it has not been mentioned explicitly in the preceding paragraphs, the inflation in Tanzania probably is the most thwarting factor on the commercial viability of not only the studied cement plants, but also of any other industrial project. This is caused by the influence of the inflation on the bank rates and indirectly on the cut-off criteria for indicators of commercial viability.
The interest rate on commercial loans is based on the inflation. The rate has to be at least the same as the inflation in order to make sure that when the money is repaid no effective purchasing power is lost. On top of this rate a margin is added to make an effective profit: a gain in purchasing power.
Also the bank rates on personal savings are determined in this way. The rate has to be at least as high as the inflation, otherwise nobody would put any money on the bank, since it would result in a loss of purchasing power. Therefore also the bank rate is a few percent higher than the inflation (unless there is a policy to discourage saving).
In the evaluation of an investment project, the IRR which has been calculated is compared with the bank rate on personal savings. The IRR of the project has to be at least a few percents higher than the rate on personal savings, since the investment in the project involves much more risk, and the entrepreneur of course wants a 'reward' for taking this
3 3Tuis mainly refers to the inflation, which will be discussed in paragraph 3.5.2.
43

risk: a higher profit than the safe opportunity of putting money on the bank. The project thus has to have an IRR which is at least as high as the inflation plus two margins: the margin between inflation and bank rate on personal savings and the reward margin for the entrepreneur.
Graph 3.4: IRR's of the different small scale cement plants (normal scenario)
60
50
40 .--. cl< .......... a: 30 a:
20
10
IRR's of small scale cement plants different scales of production
.............................................................................................................
o---25tpd 50 tpd 1 00 tpd 200tpd
scale of production
If there is a high inflation, as is the case in Tanzania, this of course strongly limits the number of projects which can be earmarked as profitable. This can be demonstrated by looking at graph 3.4. The inflation in Tanzania presently is about 30%. Based on graph 3.4 all projects which are a few percent above the 30% line can be seen as profitable. The 100 and 200 tpd plant are profitable, the 50 tpd plant's profitability is doubtfull, while the 25 tpd plant is not profitable.
The effect of the inflation on the viability of project is reinforced by the fact that it also determines the interest rate on commercial loans. The high inflation causes high interest rates which causes high financial costs. As could be seen in paragraph 3.4.3, the interest payments make up about one third of the production costs in the first year of production in all discussed plants. These costs of course put severe pressure on the performance of these plants.
The lower the inflation, the more projects will become profitable and worthwile investing
44
I I

in. In this specific case (small cement plants in Tanzania), at an inflation of 40% only the 200 tpd plant would be profitable, at 3 5 % the 100 tpd and the 200 tpd plants, while at 5% all discussed plants would be commercially interesting investment opportunities. At such a low inflation rate the chances of the occurence of negative cash flows leading to a project's failure are much less because of the strong reduction of the financial costs.
It can be concluded that the high inflation in Tanzania creates an unhealthy investment climate, which does not stimulate investments. This is not in line with the general Tanzanian policy which tries to promote especially private sector investments.
4§

4. Macro-economic evaluation
4.1 Introduction
4.1.1 Introduction In chapter I it was stated that the commercial viability of an industrial project in Tanzania is a prerequisite for its materialization. In the previous chapter four small scale cement plants have been evaluated on their commercial viability. It turned out that at least one of these plants, the 25 tpd plant, is under the present economic circumstances not a viable investment opportunity. The chances of materialization of a mini cement plant of this size are therefore minimal. The other three plants appeared to be marginally to very profitable investment opportunities and might therefore materialize in the future.
In this chapter the three potentially profitable cement plants are evaluated on their costs and benefits to the Tanzanian society. It is studied which scale of production is the most suitable one in the light of Tanzania's problems. Tanzania is a developing country and it has a number of problems which are quite specific to developing countries. These problems can be characterised as mainly macro-economic problems with consequences for the whole population in economic as well as other areas. The evaluation in this chapter therefore is largely a macro-economic evaluation. On the one hand it looks at the costs of the projects to the Tanzanian economy: how much scarce resources have to be sacrificed for these projects? On the other hand the benefits are considered: what is the contribution of these projects to the Tanzanian economy on elements that are considered to be crucial?
As said, it is studied which scale of production has the best balance of costs and benefits. Furthermore the studied small scale plants are, whenever possible, compared with figures on large-scale cement plants, in order to find out if the small scale technology is indeed more suitable than the large-scale technology.
4.1.2 Social Rate of Discount In this chapter some indicators are calculated which sum up a series of costs and revenues occuring over the lifetime of a project. Just as was the case in the previous chapter, earnings which occur at a later time are valued lower than those occuring earlier; the same applies to costs. In the previous chapter the costs and revenues were discounted against the bank rate on personal savings. In the indicators which are used to evaluate projects on their national profitability the costs and revenues are dicounted using the Social Rate of Discount (SRD). The Social Rate of Discount is the quantitative estimate of the value society places on future benefits and costs, or in other words, the rate at which the value placed by society on future benefits and costs declines over time [35]. The SRD is ment to be used to decide on the allocation of public investment funds to different projects and should balance the available supply of funds and the demand. The SRD is calculated based on the interest rate at which money can actually be lent by the country in question. In a situation of shortage of capital, like is the case in Tanzania, the SRD is put on a higher level than this rate in order to select the most efficient projects and still balance the demand and supply of capital.
46
\
I \
For the application in this chapter the SRD is set at 45%. This is based on the interest rate on commercial loans, which is 40% at most banks in Tanzania. Because of the capital shortage 5% has been added to this 40%.
4.2 Costs
4.2.1 Capital Investment capital can be considered as a scarce resource in Tanzania. There are almost no local private companies or persons with the financial means to invest in larger projects, only a few families of Asean origin in Tanzania are said to have such financial power. Untill quite recently the Tanzanian government pursued a socialist policy and considered itself as the source of capital for investments. Economic problems arising as a consequence of, amongst others, a shortage of investment capital forced the government to change its policies. Presently a liberal economic policy is pursued in which the government aims at attracting investments from abroad and is strongly reducing its influence in the economy. In this period of privatization and liberalisation it is not very likely that the government will invest in any new projects.
The government owned banks and development banks are said to have suspended their lending programs because of liquidity problems, while commercial banks have only just started re-entering the Tanzanian market and are very reserved when it comes to supplying loans.
It can be concluded that investment capital is hard to acquire and as such a scarce resource. Therefore the small cement plants are evaluated on the amount of investments they require.
It is of course evident that the smaller scale plants require absolutely less investments than the larger ones. A frequently used indicator for the capital intensity of a cement factory is the capital which is invested per ton of annual output capacity. However, in this case plants with strong differences in life span are compared. The financial means invested in the Saboo plants will only generate output during a period of approximately 10 years, while the Movers plants have a life span of about 20 years (see paragraph 3.1). Large scale plants normally even have a life span of 30 years or longer. The production capacity of, for example, the Saboo plants can be considered to be 'lost' after I 0 years and it would require new investments to re-create the production capacity. A large scale plant with the same investments per ton as the Saboo plant will generate output during a period of 30 years and is hence more economical with capital as the small plant (based on the assumption that both require the same amount of investments per ton).
It was therefore decided to compare the different scales of production on the invested capital per ton of annual output capacity over a period which is a multiple of the life spans of all considered plants. As the re-investments will have to take place in the future, they are discounted to arrive at their present values. Since this section considers the investments from a macro-economic point of view, the discounting is done based on the
47

The amount of capital invested per ton of annual output capacity was already mentioned in paragraph 3.4.2. Table 3.5 displays the amount of capital required per ton of annual output capacity for the four studied small plants. These figures can be compared mutually, but also with figures on large-scale plants.
According to a very recent publication the investments required for a new large-scale cement plant are between US$ 200 and US$ 300 per ton of annual installed capacity [32]. The investments involved in setting up such a plant in Tanzania are likely to be on the high side since the whole set-up and erection of machinery and civil works will probably have to be imported. This assumption is confirmed by the cost structure of one of the two most recently constructed cement plants in Tanzania. The total investment costs of the cement factory at Tanga were Tshs 822 million; the construction and erection activities took place from 1978 untill the end of 1980 [3 3]. On average the rate of the Tanzanian Shilling to the US Dollar was 8 to 1 during this period [4]. The total investments hence were about US$ 100 million. The annual output capacity of this plant is 500,000 tons, which makes the investments per ton of annual output capacity US$ 200. If this figure is revised with a yearly inflation figure of 3%35 the investments per ton become little over US$ 300 per ton. Therefore the figure of US$ 300 per ton of annual capacity is used here in the comparison with the small scale plants.
Table 4.1 compares the three small scale cement plants on the investments they require per ton of total potential36 annual output with a large-scale plant; firstly without considering the different lifespans of the plants, and secondly over a fixed period of 60 years and taking the discounted values of the respective re-investments into consideration.
The direct investments per ton of annual output capacity are on about the same level for the three small scale plants. The large scale plant, however, requires 2 to 2.5 times as much capital per ton of output capacity. Even if the discounted values of the reinvestments are also considered there is little change in this picture: the small scale VSK plants are on about the same level while the large scale plant requires much more capital.
The fact that there is little difference is partly due to the fact that the SRD is very high and hence investments which have to be done in a future which is only a few years away are valued much lower than their actual value at the moment of investing. The small scale plants have the advantage that the (re-)investments are more spread out over time, while
34Since the SRD is used to value the re-investments the eventual outcome of this section as displayed in table 4.1 does not
reflect the amount of capital that has to be put aside to guarantee a certain output capacity for a certain period. It is not possible to let money accrue at the bank at a rate which equals the SRD in Tanzania (the bank rate in Tanzania is about 30%, while the SRD is estimated at 45%). The outcome is a valuation of the money that has to be spent over a certain period to assure a certain output capacity. However, since the re-investments are all done in a relatively far away future and both the SRD and the bank rate on savings are quite high, there is little difference in the outcome between discounting against the SRD or the bank rate on savings.
3 5 Only 3% since the cement factories are made in industrialised countries and the figures are expressed in hard currency.
36The word "potential" is used since the fact that a plant has a certain output capacity is no guarantee that this output will
also be achieved.
48
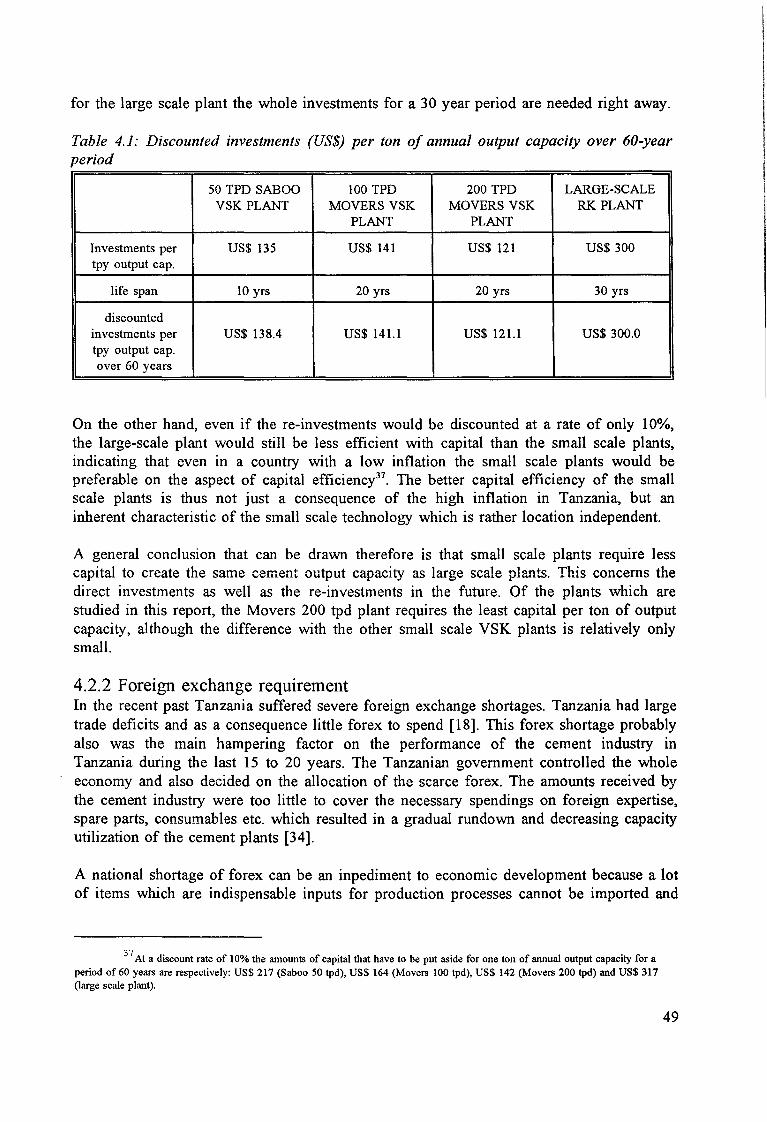
for the large scale plant the whole investments for a 30 year period are needed right away.
Table 4.1: Discounted investments (US$) per ton of annual output capacity over 60-year period
50 TPD SABOO 100 TPD 200 TPD LARGE-SCALE VSK PLANT MOVERS VSK MOVERS VSK RK PLANT
PLANT PLANT
Investments per US$ 135 US$ 141 US$ 121 US$ 300 tpy output cap.
life span 10 yrs 20 yrs 20 yrs 30 yrs
discounted investments per US$ 138.4 US$ 141.1 US$ 121.1 US$ 300.0 tpy output cap. over 60 years
On the other hand, even if the re-investments would be discounted at a rate of only 10%, the large-scale plant would still be less efficient with capital than the small scale plants, indicating that even in a country with a low inflation the small scale plants would be preferable on the aspect of capital efficiency37
• The better capital efficiency of the small scale plants is thus not just a consequence of the high inflation in Tanzania, but an inherent characteristic of the small scale technology which is rather location independent.
A general conclusion that can be drawn therefore is that small scale plants require less capital to create the same cement output capacity as large scale plants. This concerns the direct investments as well as the re-investments in the future. Of the plants which are studied in this report, the Movers 200 tpd plant requires the least capital per ton of output capacity, although the difference with the other small scale VSK plants is relatively only small.
4.2.2 Foreign exchange requirement In the recent past Tanzania suffered severe foreign exchange shortages. Tanzania had large trade deficits and as a consequence little forex to spend [18]. This forex shortage probably also was the main hampering factor on the performance of the cement industry in Tanzania during the last 15 to 20 years. The Tanzanian government controlled the whole economy and also decided on the allocation of the scarce forex. The amounts received by the cement industry were too little to cover the necessary spendings on foreign expertise, spare parts, consumables etc. which resulted in a gradual rundown and decreasing capacity utilization of the cement plants [34].
A national shortage of forex can be an inpediment to economic development because a lot of items which are indispensable inputs for production processes cannot be imported and
3 7 At a discount rate of 10% the amounts of capital that have to be put aside for one ton of annual output capacity for a
period of60 years are respectively: US$ 217 (Saboo 50 tpd), US$ 164 (Movers 100 tpd), US$ 142 (Movers 200 tpd) and US$ 317 (large scale plant).
49
hence thwart the succesfull operation of these production processes, with all due negative consequences for the economy. Since the forex shortage caused severe economic disruptions in the past, projects which demand little forex, or bring in forex, are favoured.
Cement plants in general have a number of effects on the forex balance of a developing country. The set-up and operation of such factories require vast amounts of forex, while the main market for the product is local: cement plants are usually set up to meet the local demand for cement. Cement plants in Tanzania do export a part of their output, but this has the objective of being self-sufficient in forex requirements for the operation of the plant, in order to assure a smooth production. The exports are, however, probably less profitable than the local market because of the distance to the export market. A cement plant will therefore probably aim at striking a balance between forex requirements and exports, which results in neither a positive nor a negative forex balance of the plant itself. If a cement plant fails to export enough cement to meet its own forex requirements, it will have a negative forex balance. However, on a national level also the import substitution effect of the cement plant is considered. The combined effect of the forex balance of the plant itself and the import substitution effect38 on the national forex balance might well be positive.
There are several ways of measuring the effect of a project on the forex balance of a country. One of the most common is the net foreign exchange effect. The net foreign exchange effect sums up all discounted forex flows in and out of the country caused by the project. The forex flows are discounted against the so-called Social Rate of Discount (SRD). The net foreign exchange effect does not only account for the real forex flows but also for the import substitution effects of the project39
.
Calculating the net foreign exchange effect is problematic because of three reasons. First of all it is not possible to predict the amounts of cement that a cement factory will, or will be able to export. Since the export of cement is the only source of forex inflow related to the cement plant (if it is assumed that the plants are set up with local loans and capital) it is not possible to calculate the forex inflow generated by the projects. As could be seen above a cement plant will probably aim at being self-sufficient in its forex requirements, but there is no guarantee that the plants will achieve the desired export40
• This is strongly dependent on factors of which the effects are difficult to quantify. A plant which is located close to the border of a cement importing country will of course have better opportunities
38Tue import substitution effect in this case is the reduction of the imports of cement which cause a forex outflow.
390ne would tend to think that (almost) the entire output of a new cement factory can be regarded as import substitution,
since the cement would otherwise have been imported. This would then have an indirect positive effect on the forex effect since the new plant would reduce the outflow offorex (since it cuts back imports). In this study, however, it has been assumed that the import substitution effect of setting up new cement plants in Tanzania is minimal, since the imports are only small [4) [39). The only import substitution effect that can take place is the reduction or elimination of these imports, which has only a marginal effect on the forex effect (because of the small imports and low price of cement). 111e import substitution effect has therefore been omitted in the calculation.
4 0 If it would be assumed that they do, there is little reason anymore to calculate the net foreign exchange effects of the
different projects, since they would all be self-sufficient concerning forex supply and the differences in the influence on the national forex balance would entirely originate from the forex outflow involved in the initial investments. In other words, it would suffice to compare the forex components of the initial investments of the different plants.
50

to export cement than a plant located in the middle of Tanzania. Larger plants will probably also have better opportunities to explore foreign markets than smaller ones because of their stronger financial position which allows for investments in equipment and personnel. It is therefore not possible to state anything location-independent on the exports, and hence forex inflow, that will probably be realized by the plants.
The second problem in calculating the net foreign exchange effect is the fact that in this study projects of different lifetimes are compared, while this indicator does not account for the lifetime of a project. The third problem is that the net foreign exchange effect does not account for scale, which makes the results difficult to compare.
Instead of using the net foreign exchange effect as indicator, a special indicator has been used which is based on the net foreign exchange effect. This indicator only considers the forex outflow side since no valid indications of the forex inflow of the projects are available. The indicator calculates a uniform forex outflow series (UFOS), analogous to the Uniform Annuity Series (UAS)41
. The indicator calculates a standard yearly amount of forex outflow, which, if the forex outflow is this same amount every year of the project, results in the same total present value as the real forex outflow. The advantage of this uniform forex outflow series is that it is an indicator which allows for the comparison of projects with different lifetimes. Just as is the case with the UAS, the uniform forex outflow series of two identical projects executed in succession is the same as the uniform forex outflow series of this project executed only once42
• In order to be able to compare different scales of production the eventual uniform forex outflow series is divided by the annual output capacity of the plants. This results in the uniform forex outflow series per ton of annual output capacity.
The strongest disadvantage of this indicator is the fact that it only looks at the forex outflow side. It therefore reflects the 'worst case' scenario concerning the effect of these projects on the national forex balance: the scenario in which no exports at all are realized and hence no forex inflow is generated. It also gives the opportunity of comparing the relative need of the different plants to emphasize exports.
Table 4.2 compares the three remaining projects on this indicator. The three plants show quite little difference on this indicator. Unfortunately no comparison with a large-scale plant is possible on this indicator because of a lack of data.
Table 4.2: Uniform forex out.flow series per ton of annual output capacity43
Saboo 50 tpd Movers 100 tpd Movers 200 tpd
UFOS (Tshs 'OOO) 293,272 644,668 1,146,124
UFOS/tpy (Tshs) 17,800 19,500 17,400
41Tue UAS is an indicator for the commercial viability of a project.
4 2 Proof omitted.
4 3Tue worksheets on which the calculation of this indicator is based can be found in Appendices B.
51

Based on the considerations in this paragraph and the comparison of the figures in table 4.2, the only conclusion that can be drawn is that the three different small scale plants which are considered in this chapter require relatively about the same amounts of forex.
The data which is available does allow for a limited comparison between small and large scale on the forex outflow per ton of production in the production costs. Table 4.3 compares the forex component in the production costs per ton of the discussed small scale plants and the forex part of the production costs at the TPCC factory in Dar es Salaam44
•
In the figures on the TPCC plant also indirect forex outflows like diesel and fuel oil are accounted for, since although these items are paid for in Tanzanian Shillings by TPCC, they are imported by other companies. Also the effect of a switch to using coal in stead of fuel oil as kiln burning fuel has been considered in table 4.3. Such a switch would lead to a 50% reduction of the fuel costs [34]; it has been assumed that the coal is also imported (instead of produced locally).
Table 4.3: Foreign inputs in production costs at small and large scale plants {Tshslton}45
Saboo 50 tpd Movers 1 OOtpd Movers 200tpd TPCC TPCC (coal)
forex 11,218 11,038 10,680 17,341 10,886 requirement in
prod. costs per ton output
It can be concluded from table 4.3 that the forex requirement in the production costs is generally lower at the small scale plants, but this can almost entirely be attributed to the use of coal at the small scale plants, while the TPCC factory uses much more expensive fuel oil. If the TPCC factory would switch to imported coal, the forex requirement of this factory would be about the same as of the small plants. If TPCC would use locally produced coal the forex requirement in the production costs would even be considerably smaller than the forex requirement in the production costs of the small scale plants46
•
Although the comparison in this paragraph is far from complete, based on the figures discussed above there appears to be no reason to prefer any scale of production. The forex component in the production costs is about the same for the small plants since almost all foreign inputs are variable costs (variable within and to the scale of production) and also on about the same level as the forex component in the production costs of a large scale
44The forex requirement in the production costs at TPCC is derived from the 1992 production cost figures and output (20] [36] and has been modified according to the change in the exchange rate of the Tanzanian Shilling to the US Dollar since 1992. Furthermore the figures on the small plants are based on a 90% capacity utilization, while the TPCC figure are based on the 1992 capacity utilization which was 76%. Since the major part of the foreign inputs at TPCC are variable costs there is little difference with the per ton figure as displayed in table 4.3 in case of a 90% capacity utilization.
45The costs of the transport of the fuel of the small scale plants has been excluded, since it is a local cost component.
46Shaft kiln cement production in Tanzania cannot switch to local coal since the coal produced in Tanzania is not suitable for VSK cement production.
52

plan after a switch from fuel oil as kiln fuel to coal47•
4.3 Benefits
4.3.1 Net national value added and absolute efficiency The national income of a country and its growth are generally considered as two of the most important macro-economic indicators. The national income per capita gives an indication of the wealth of the country, of the financial means which are available for consumption or investments per inhabitant of that country. The growth of the national income gives a reflection of the state of the national economy. If the national income increases the standard of living of the countries population can be increased, but the growth can also be used to finance investments and to create more growth in the future. Although there is no direct relation between the national income and its growth and the standard of living of individuals or even the whole population of a country (since there is no direct link between the creation of income and the country's inhabitants), they still are quite good indicators, because they indicate the potential of a country to materialize its objectives, like raising the standard of living.
The contribution of a project to the national income of a country therefore is an important indicator of the macro-economic benefit of this project. The potential contribution of the projects which are discussed here is calculated by looking at the value added of the projects. The value which is added by a project reflects the income which is somehow generated by the project48
•
The Net National Value Added indicates the income which is generated by a project and stays within the country. The NNV A can consist of all kinds of income: wages, salaries, dividends, profit, interest, etc. The NNV A is arrived at by comparing the value of the output to the investments involved, the material inputs which have to be purchased and the repatriated payments. The latter category is that part of the value which is added by the project which is repatriated abroad. All future spendings and incomes in the categories mentioned above are discounted according to their occurence in time and added up in order to arrive at the present value of a project. The Social Rate of Discount is used to discount the value added to present values (see 4.1.2) and it is set at 45%.
However, the NNVA does not allow for the comparison of the studied projects because of the different size of the initial investments. In order to make the projects comparable the NNVAR (NNV A-Ratio) has been calculated, which reflects the amount of NNV A generated per unit of investment capital.
It is possible to split up the NNV A of a project into two parts: the wages and salaries, and
4 7 It is not unlikely that such a switch will take place in the near future. TPCC will be privatized in the near future which
might lead to investments to increase the efficiency. A switch from fuel oil to coal is one of the most important options because of the large savings that can be realised (about 50% of the fuel costs which corresponds with over 20% of the operating costs) [2] [34].
4 8The word 'somehow' is used because the income can be salaries, dividend, interest, etc.
53
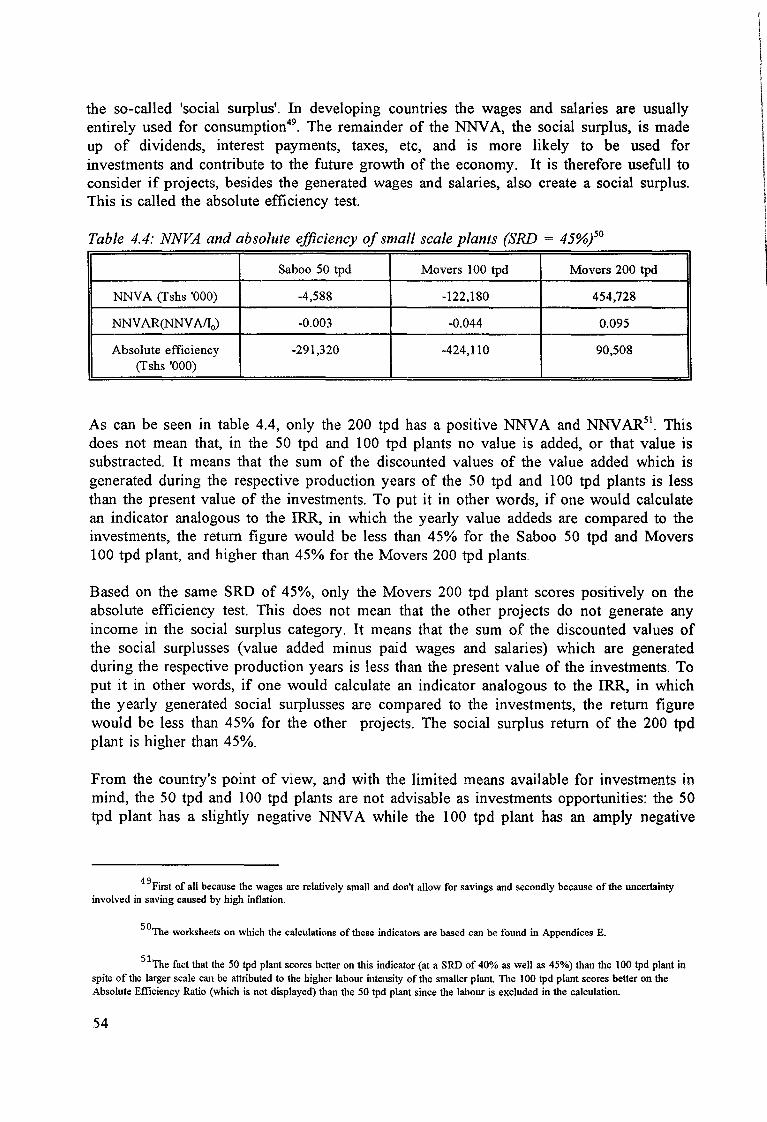
the so-called 'social surplus'. In developing countries the wages and salaries are usually entirely used for consumption49
• The remainder of the NNV A, the social surplus, is made up of dividends, interest payments, taxes, etc, and is more likely to be used for investments and contribute to the future growth of the economy. It is therefore usefull to consider if projects, besides the generated wages and salaries, also create a social surplus. This is called the absolute efficiency test.
Table 4.4: NNVA and absolute efficiency of small scale plants (SRD = 45%)5°
Saboo 50 tpd Movers 100 tpd Movers 200 tpd
NNVA (Tshs 'OOO) -4,588 -122,180 454,728
NNV AR(NNV AII0) -0.003 -0.044 0.095
Absolute efficiency -291,320 -424,110 90,508 (Tshs 'OOO)
As can be seen in table 4.4, only the 200 tpd has a positive NNV A and NNV AR51• This
does not mean that, in the 50 tpd and 100 tpd plants no value is added, or that value is substracted. It means that the sum of the discounted values of the value added which is generated during the respective production years of the 50 tpd and 100 tpd plants is less than the present value of the investments. To put it in other words, if one would calculate an indicator analogous to the IRR, in which the yearly value addeds are compared to the investments, the return figure would be less than 45% for the Saboo 50 tpd and Movers 100 tpd plant, and higher than 45% for the Movers 200 tpd plants.
Based on the same SRD of 45%, only the Movers 200 tpd plant scores positively on the absolute efficiency test. This does not mean that the other projects do not generate any income in the social surplus category. It means that the sum of the discounted values of the social surplusses (value added minus paid wages and salaries) which are generated during the respective production years is less than the present value of the investments. To put it in other words, if one would calculate an indicator analogous to the IRR, in which the yearly generated social surplusses are compared to the investments, the return figure would be less than 45% for the other projects. The social surplus return of the 200 tpd plant is higher than 45%.
From the country's point of view, and with the limited means available for investments in mind, the 50 tpd and 100 tpd plants are not advisable as investments opportunities: the 50 tpd plant has a slightly negative NNV A while the 100 tpd plant has an amply negative
4 9First of all because the wages are relatively small and don't allow for savings and secondly because of the uncertainty
involved in saving caused by high inflation.
5 0The worksheets on which the calculations of these indicators are based can be fonnd in Appendices E.
51The fact that the 50 tpd plant scores better on this indicator (at a SRD of 40% as well as 45%) than t11e 100 tpd plant in
spite oftlle larger scale can be attributed to the higher labour intensity oft11e smaller plant TI1e 100 tpd plant scores better on the Absolute Efficiency Ratio (which is not displayed) than the 50 tpd plant since the labour is excluded in the calculation.
54

NNV A. However, in drawing such conclusions it should be kept in mind that in paragraph 4.1.2 the SRD was chosen rather arbitrarely on 5% above the bank rate on commercial loans, based on the fact that there is a capital shortage. With the knowledge that there is a capital shortage and that the bank rate on commercial loans is 40%, it can be concluded that the SRD should at least be 40%. If the NNV A and absolute efficiency are recalculated based on a SRD of 40%, the conclusion mentioned above is confirmed.
As can be seen in table 4.5 only the Movers 200 tpd plant has a positive score on both indicators at a SRD of 40%. Based on the comparison of table 4.4 and 4.5 it can be concluded that the value added return of the 50 tpd and 100 tpd plants is between 40% and 45%, while the social surplus return is lower than 40% for both projects.
Table 4.5: NNVA and absolute efficiency of small scale plants (SRD = 40%)
Saboo 50 tpd Movers 100 tpd Movers 200 tpd
NNV A (Tshs 'OOO) 135,277 166,912 1,058,370
NNV AR(NNV Afl0) 0.101 0.060 0.221
Absolute Efficiency -195,313 -183,961 635,108 (Tshs 'OOO)
In order to find out if the contribution of a new large-scale plant to the national income of Tanzania would be larger, a limited analysis has been done of the set-up of a new largescale plant of the same size as the existing cement factories at Tanga and Dar es Salaam (see Appendix A. 7). It turns out that also a large-scale plant of about 500,000 tpy does not have a positive Net National Value Added or Absolute Efficiency. The SRD has to be set at levels as low as 20% in order to reach a positive score on these indicators for such a large-scale plant. Therefore there seems no reason to prefer a large-scale plant when it comes to the aspect of contribution to the national income.
One aspect that should also be considered in this paragraph on the NNV A is the fact that OPC is an indispensable input for many other production processes, and, as already discussed in Chapter 1, a prerequisite for the creation of value added in these other processes. A cement industry can be considered a 'basic industry', which is a necessary prerequisite for the start-off to industrialisation. Therefore it can sometimes be decided to set up a cement factory or industry in spite of the (relatively) low direct value added.
4.3.2 Employment Tanzania has a high degree of unemployment. This unemployment is largely in the unskilled labour sector. This can be illustrated by the following figures. In the years from 1985 to 1990 there were about 700,000 children per year at the age to enrol in primary school's first class. The average enrolment was about 570,000. This already leaves a large part un-educated. Furthermore the average enrolment in the last class of primary school was about 400,000 over the same years, indicating that there is also a considerable number which does not finish primary school. The enrolment in the first class of secondary
55

schools was about 40,000 in 1991, while the enrolment in the fourth class was about 30,000 [4]. The enrolment in technicians courses, technical colleges and universities is only marginal in comparison with these figures. It can be concluded that the major part of the people do finish primary school, but only a small part enjoys any further education. Therefore especially unskilled labour jobs are required in Tanzania.
First of all the small plants can be evaluated on their general employment creation and compared with large scale plants. In order to make different scales of production comparable the employment creation has been expressed in jobs per 1 OOO ton of annual output capacity. As can be seen in table 4.6, the employment creation per ton of output capacity is clearly in reverse proportion to the scale of production. When it comes to general employment creation the smaller plants, and especially the Saboo 50 tpd plant, are favourable.
Also the number of unskilled labour jobs is in reverse proportion to the scale of production. Altough it seems as if all small plants create more unskilled labour jobs per unit output capacity than large scale plants it has to be reminded that the figure for the
Table 4. 6: Employment creation in cement plants of different scales52
Saboo 50 tpd Movers 100 tpd Movers 200 tpd Large-scale plant
jobs per 1000 tpy 6.48 3.12 1.94 1.05 output capacity
(highly) skilled 1.82 1.03 0.52 0.17 jobs per 1000 tpy output capacity
unskilled jobs per 2.79 0.88 0.50 0.22 1000 tpy output
capacity
large scale plants is based on a plant in an industrialised country, which has an employment which is roughly half of that in the Tanzanian cement industry (per ton of output capacity). The number of unskilled labour jobs per ton of output capacity on a cement plant in Tanzania is therefore likely to be much higher, and might well exceed that of the Movers 200 tpd plant.
It can be concluded that the smaller plants create relatively more employment and more unskilled labour jobs. This also already showed in the commercial analyses in chapter 3 where the smaller plants had to cope with the highest labour costs.
The relative figures on employment creation per ton of output can also be used to get an
52TI1e employment creation of the large-scale plant is the average of the Tanzanian cement industry (l.53 [I]), Bamburi
Portland Cement Company in Mombasa, Kenya (0.91 [37]) and a cement factory comparable to those in Tanzania but located in an industrialised country (0.71 [38]). The figures of the small plants are based on the employment structures as shown in Appendices C.2. The figures on the number of (un)skilled labour jobs are based on the same employment structures of the small plants and on the employment structure of a cement factory comparable to those in Tanzania [38).
56
I l
I \ !
indication of the absolute employment creation potential of the cement industry. In chapter 2 it was concluded that the present-day demand for cement in Tanzania is roughly 900,000 tpy. If it is assumed that the demand for cement will increase at a rate little higher than the population increase rate, the demand for cement might reach 1.5 million tpy in the year 2010. If it is then assumed that 1 million tpy is supplied by the existing large-scale plants, the remaining 500,000 tpy could be supplied by small scale plants. In order to supply 500,000 tpy, 30 Saboo 50 tpd plants would be required. These plants would then create about 3,250 jobs, of which only about 1,400 would be unskilled labour jobs. If the Movers 200 tpd plants would be used to supply the 500,000 tpy, the employment creation potential would be limited to about 1,000 jobs, of which only 200 in the unskilled labour category. The employment creation of a large-scale plant would be even less.
The smallest scale of cement production appears as the one with the highest employment creation potential, as well in general as concerning unskilled labour jobs. However, there is also an aspect which might tum out to be a serious drawback to these smallest scales of production: they demand relatively the highest numbers of skilled to highly skilled employees (see table 4.6). According to the training manager of TPCC [29] there presently is not a shortage anymore in the categories of skilled and highly skilled labour53
, but a wide-spread use of small scale technologies such as the discussed small scale VSK cement production technology might lead back to such a shortage. If the previously discussed 500,000 tpy would be supplied by Saboo 50 tpd plants, this would require about 910 skilled to highly skilled employees, of which the major part is in the category 'engineering'. Although these 910 would be required over a period of 15 years, it still is quite much if compared to the yearly output of technicians and engineers in Tanzania. The total enrolment in 1991/1992 at Tanzanian technical colleges in the final years of the relevant categories54 was 316 [4], while the final year enrolment at the Tanzanian universities in Engineering was 123 in the same year [4]. The total output in the relevant skilled to highly skilled categories then comes to 450 per year, of which, under the described scenario55
, about 14% would be required annually by the cement industry only. If the same expansion of the cement industry would be realised with Movers 200 tpd plants, only about 260 skilled to highly skilled employees would be required over the same period, which corresponds with only 4% of the annual output in the relevant categories. Although it is not possible to conclude anything definite on this subject, since there are no figures available on the demand in the next 15 years for employees in the same categories by other employers than the cement industry, it can still be concluded that the wide-spread application of the smallest scales of cement production is more likely to lead to shortages in (highly) skilled employees than the larger scales of production.
The above leads to the conclusion that the absolute employment creation potential of the cement industry is quite meagre: 1,000 to 3,300 jobs in the next 15 years if small scale
53Tuis was confirmed in conversations with several Tanzanians with a high level of education who all complained about the limited number of job opportunities for highly skilled/trained people.
5 4 Full technicians courses and diploma courses for lab. technician, auto technician, mechanical and electrical course.
5 51f the cement industry is expanded with 50 tpd plants and the total production capacity of these plants would reach 500,000 tpy in 2010.
57

technology is used, and even less if large-scale technology is employed. A relatively large part of these jobs would be in the category of skilled to highly skilled jobs. The role of the cement industry in employment creation in Tanzania will therefore be strongly limited, because of the limited number of jobs that can be created and the fact that a relatively large number of jobs are not in the desired category of unskilled labour jobs.
The fact that the cement industry is not a very suitable means for employment creation is also stressed by the amounts of capital required per created job. Table 4.7 compares the capital which has to be invested to create employment in different scales of cement production and in lime production [2].
Although the Saboo 50 tpd plant creates about 10 times as much jobs per unit of capital invested as a large-scale plant, these job opportunities are lost after 10 years and have to be re-created after this period, while the jobs at the large-scale plant will probably exist three times as long. To overcome the difference in life-spans the investments are expressed in the amount of investments involved in creating and maintaining one job over a certain period. Just as was the case in the calculation of the investments involved in maintaining one ton of output capacity for a certain period (see 4.2), the re-investments are discounted against the bank rate on personal savings. It appears that the amount of money which has to be set aside to create one job for a long period is inversely related to the scale of production. For the large scale plant the amount is about nine times higher than for the Saboo 50 tpd plant.
Table 4. 7: Investments (US$) per job in cement and lime production56
Sa boo Movers Movers Large-scale Lime, Lime, 50 tpd 100 tpd 200 tpd cement large oil- heap
production fired kiln burning
US$/job 20,850 45,120 62,300 195,000 600 100
estimated 10 yrs 20 yrs 20 yrs 30 yrs 10 yrs 1 yr lifetime
discounted 22,481 45,358 62,630 195,078 647 431 investments per job57
If compared to the lime-production facilities the cement plants do not appear as very attractive investments when it comes to the aspect of employment creation: the lime production facilities create 35 to 450 times as much jobs for the same investments as the cement plants. Furthermore the lime production facilities probably create relatively much
56Tue investment figure on the large-scale plant concerns a new large-scale plant and is based on a US$ 300 investment per
tpy output capacity [32) (this was elaborated upon in paragraph 4.3.1). Furthermore the labour-intensity of the Tanzanian cement industry [ l] has been used to arrive at the investments per job. The lifetimes of the different types of lime production are estimates based on the description of the production facilities [2).
5 7 The period considered here is 60 years, but since investments which are further away than this period are valued at almost
zero, the figures can be regarded as if concerning a permanent job ('forever').
58

more unskilled labour jobs than the cement plants. A lime plant has much less elaborate and intensive quality control than a cement plant, which has to meet high quality standards which requires constant and elaborate quality control. A lime plant also has much less processing and conveying machinery and electricals which need maintenance and repairs. Lime plants are also smaller and less complex to manage. The relative number of skilled to highly skilled jobs is therefore probably much lower than in a cement plant.
The overall conclusion in this paragraph is that cement production in Tanzania is not a favourable option when it comes to employment creation. The creation of jobs in even the small scale plants requires large amounts of investments, while the total employment creation potential of this industry is only small. Furthermore a large part of the jobs that are created are jobs for skilled to highly skilled employees, while unskilled jobs are necessary. However, when it comes to making a choice for a certain scale of cement production, the smallest scales of production appear as preferable since they create the highest number of jobs at the lowest investments58
•
4.4 Summary of results and conclusions The evaluation on macro-economic costs and benefits of different scales of cement production in the previous paragraphs does not give a single reason to prefer large scale cement production to small scale VSK cement production. The small scale plants 'scored' better on all indicators, except for the consumption of forex which turned out to be relatively independent from the scale of production.
The largest scale of VSK cement production which is considered, namely the Movers 200 tpd piant, has the best score on most indicators. The amount of capital which is invested per ton of annual output capacity is about 15% lower than that of the other two small scale plants and about 60% lower than that of a large scale plant. This conclusion is also valid if the discounted value of the re-investments that have to be done to maintain the production capacity are also considered. This means that in order to assure a certain cement production capacity over a certain long period, the least capital has to be put aside at present if one employs these plants.
The Movers 200 tpd plant also turned out to be the plant with the highest contribution to the national income (if valued against the SRD). The earnings in the 'social surplus' category only, of this project are higher than 45%, which indicates a quite considerable contribution to the national income in those categories which are likely to be re-invested and to contribute to future economic growth. The other two small scale plants have an amply positive NNV A at a SRD of 40%, but their absolute efficiency remains negative even at this SRD. Large scale plants even require a SRD of 20% to arrive at a positive NNV A or absolute efficiency.
5 8 However, some uncertainty is involved in the jobs of the small scale plants. It is not sure whether, when the technical life of the plants is over, new plants will be built. 111e longer technical service life of the larger scale plants gives more certainty that the jobs on these plants will be maintained for a longer period. This factor has not been acounted for, and the validity of the figures in table 4. 7 depends on the re-investments (if these will be done or not).
59
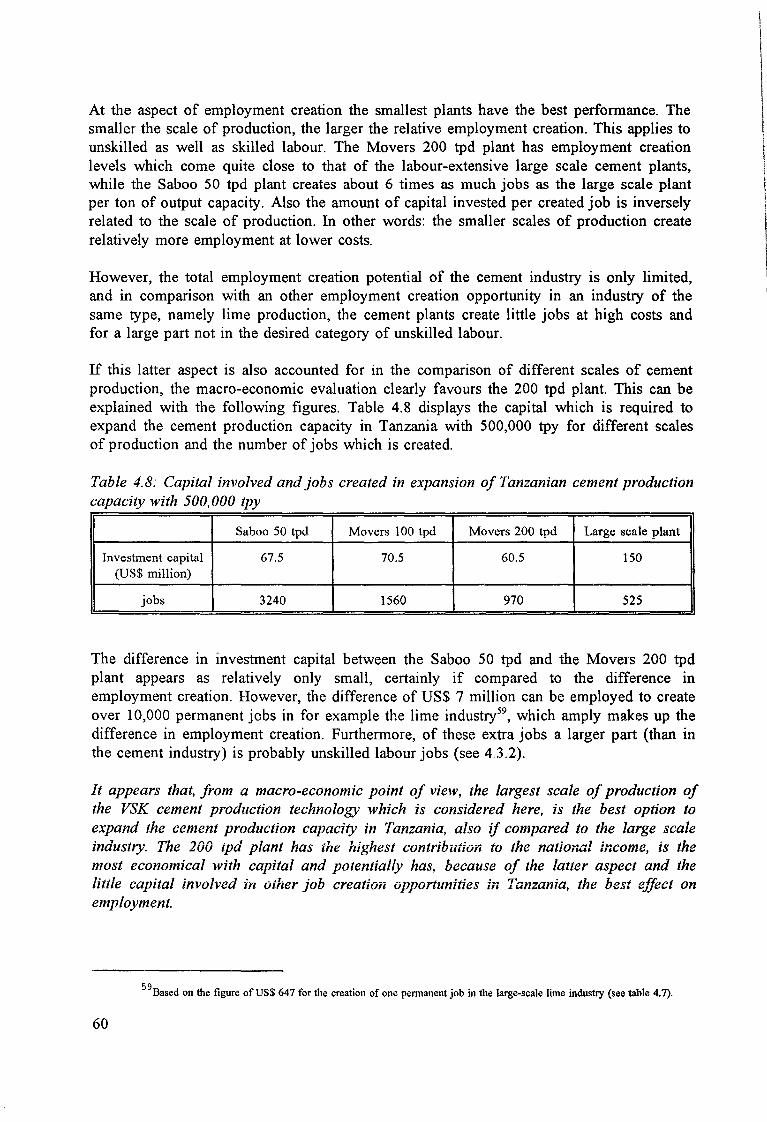
At the aspect of employment creation the smallest plants have the best performance. The smaller the scale of production, the larger the relative employment creation. This applies to unskilled as well as skilled labour. The Movers 200 tpd plant has employment creation levels which come quite close to that of the labour-extensive large scale cement plants, while the Saboo 50 tpd plant creates about 6 times as much jobs as the large scale plant per ton of output capacity. Also the amount of capital invested per created job is inversely related to the scale of production. In other words: the smaller scales of production create relatively more employment at lower costs.
However, the total employment creation potential of the cement industry is only limited, and in comparison with an other employment creation opportunity in an industry of the same type, namely lime production, the cement plants create little jobs at high costs and for a large part not in the desired category of unskilled labour.
If this latter aspect is also accounted for in the comparison of different scales of cement production, the macro-economic evaluation clearly favours the 200 tpd plant. This can be explained with the following figures. Table 4.8 displays the capital which is required to expand the cement production capacity in Tanzania with 500,000 tpy for different scales of production and the number of jobs which is created.
Table 4.8: Capital involved and jobs created in expansion of Tanzanian cement production capacity with 500,000 tpy
Saboo 50 tpd Movers 100 tpd Movers 200 tpd Large scale plant
Investment capital 67.5 70.5 60.5 150 (US$ million)
jobs 3240 1560 970 525
The difference in investment capital between the Saboo 50 tpd and the Movers 200 tpd plant appears as relatively only small, certainly if compared to the difference in employment creation. However, the difference of US$ 7 million can be employed to create over 10,000 permanent jobs in for example the lime industry59
, which amply makes up the difference in employment creation. Furthermore, of these extra jobs a larger part (than in the cement industry) is probably unskilled labour jobs (see 4.3.2).
It appears that, from a macro-economic point of view, the largest scale of production of the VSK cement production technology which is considered here, is the best option to expand the cement production capacity in Tanzania, also if compared to the large scale industry. The 200 tpd plant has the highest contribution to the national income, is the most economical with capital and potentially has, because of the latter aspect and the iittle capital involved in other job creation opportunities in Tanzania, the best effect on employment.
5 9Based on the figure of US$ 647 for the creation of one pennanent job in the large-scale lime industry (see table 4.7).
60

5. Ecological sustainability
5 .1 Introduction In this chapter the VSK small scale technology is, as far as the information which is available allows, evaluated on its ecological sustainability. This is split up into resource sustainability (energy consumption and resource exploitation) and pollution (emissions). This is a relevant aspect in the total evaluation of a technology, since it determines if the quality of the environment will deteriorate, if future generations will have to clean up the pollution effects and if resources will be depleted more or less quickly as a consequence of the implementation of this technology.
The evaluation is split up into two parts. The first describes the ecological aspects of cement production in general, and as far as possible compares VSK small-scale production with large-scale production. The second part compares cement with an other, more or less similar product.
5.2 Ecological sustainability: RK vs. VSK OPC production
5 .2.1 Introduction As can be seen in Appendix A.2, the cement production process using shaft kilns or rotary kilns does not differ that much. The differences are relatively small and therefore also the ecological sustainability does not differ much. A thwarting factor in trying to compare the different scales of production is that there has so far been little to no research into the environmental aspects of the Indian small-scale technology, probably since it exists only since relatively shortly. There are, however, still some differences that can be indicated.
5.2.2 Energy consumption In the light of the strongly increasing world-wide demand for energy and the limitation and future depletion of non-renewable energy sources energy-efficient technologies are preferable to less energy-efficient ones. Furthermore energy consumption is related to the emission of materials which are generated in the burning process, which can affect the environment.
The energy consumption in cement production consists of two parts. The first is the heat consumption in the kiln. In the kiln fuel is burnt in order to effect the desired chemical reactions. The second is the electricity consumption. The electricity consumption in cement production is quite considerable mainly because of the grinding actions in the process but also because of a muititude of conveyors, blowers, etc.
The most modem and energy-efficient large scale plants have a heat consumption of about 3,000 MJ per ton of clinker60
, while according to van der Vleuten [9] the average heat
6°Ciinker is an intermediate product in cement production. See Appendix A.2 on cement production for a further
explanation.
61
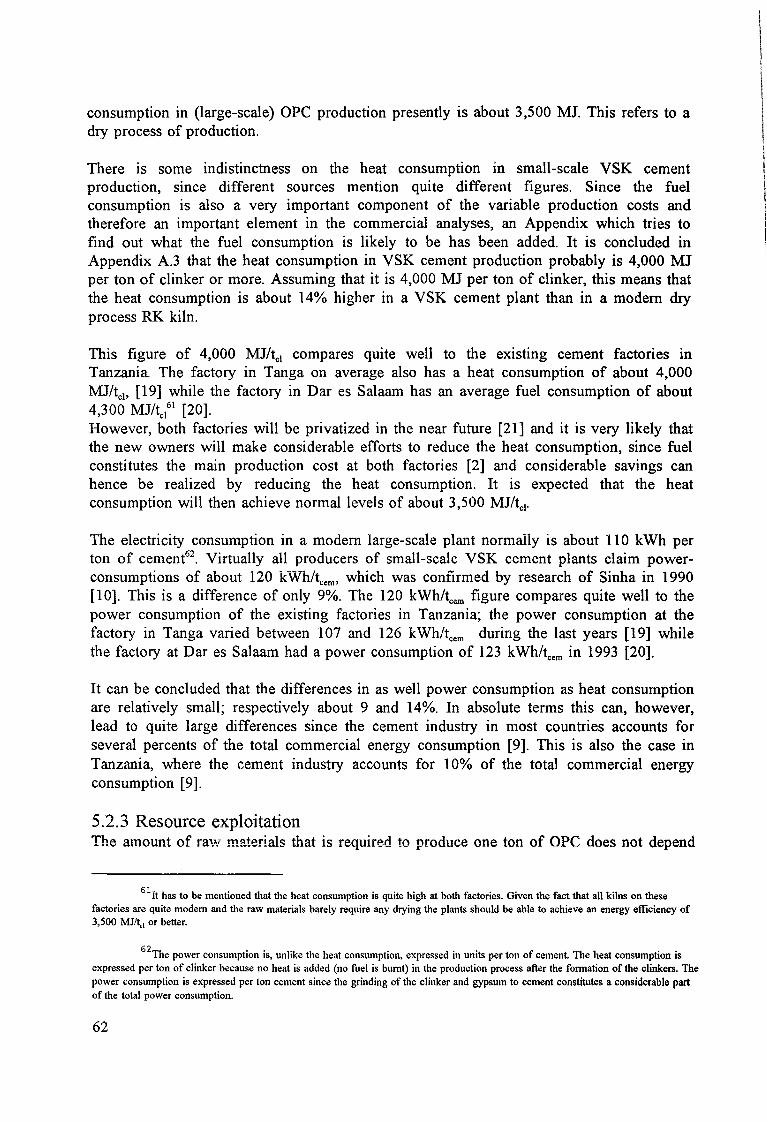
consumption in (large-scale) OPC production presently is about 3,500 MJ. This refers to a dry process of production.
There is some indistinctness on the heat consumption in small-scale VSK cement production, since different sources mention quite different figures. Since the fuel consumption is also a very important component of the variable production costs and therefore an important element in the commercial analyses, an Appendix which tries to find out what the fuel consumption is likely to be has been added. It is concluded in Appendix A.3 that the heat consumption in VSK cement production probably is 4,000 MJ per ton of clinker or more. Assuming that it is 4,000 MJ per ton of clinker, this means that the heat consumption is about 14% higher in a VSK cement plant than in a modem dry process RK kiln.
This figure of 4,000 MJ/tc1 compares quite well to the ex1stmg cement factories in Tanzania. The factory in Tanga on average also has a heat consumption of about 4,000 MJ/tc1, [19] while the factory in Dar es Salaam has an average fuel consumption of about 4,300 MJ/tc1
61 [20]. However, both factories will be privatized in the near future [21] and it is very likely that the new owners will make considerable efforts to reduce the heat consumption, since fuel constitutes the main production cost at both factories [2] and considerable savings can hence be realized by reducing the heat consumption. It is expected that the heat consumption will then achieve normal levels of about 3,500 MJ/tci·
The electricity consumption in a modem large-scale plant normally is about liO kWh per ton of cement62
• Virtually all producers of small-scale VSK cement plants claim powerconsumptions of about 120 kWh/teem• which was confirmed by research of Sinha in 1990 [10]. This is a difference of only 9%. The 120 kWh/teem figure compares quite well to the power consumption of the existing factories in Tanzania; the power consumption at the factory in Tanga varied between 107 and 126 kWh/teem during the last years [19] while the factory at Dar es Salaam had a power consumption of 123 kWh/teem in 1993 [20].
It can be concluded that the differences in as well power consumption as heat consumption are relatively small; respectively about 9 and 14%. In absolute terms this can, however, lead to quite large differences since the cement industry in most countries accounts for several percents of the total commercial energy consumption [9]. This is also the case in Tanzania, where the cement industry accounts for 10% of the total commercial energy consumption [9].
5.2.3 Resource exploitation The amount of raw materials that is required to produce one ton of OPC does not depend
61It has to be mentioned that the heat consumption is quite high at both factories. Given the fact that all kilns on these factories are quite modem and the raw materials barely require any drying the plants should be able to achieve an energy efficiency of 3,500 MJ/t" or better.
62The power consumption is, unlike the heat consumption, expressed in units per ton of cement. The heat consumption is
expressed per ton of clinker because no heat is added (no fuel is burnt) in the production process after the formation of the clinkers. The power consumption is expressed per ton cement since the grinding of the clinker and gypsum to cement constitutes a considerable part of the total power consumption.
62
\
I
I I ! !
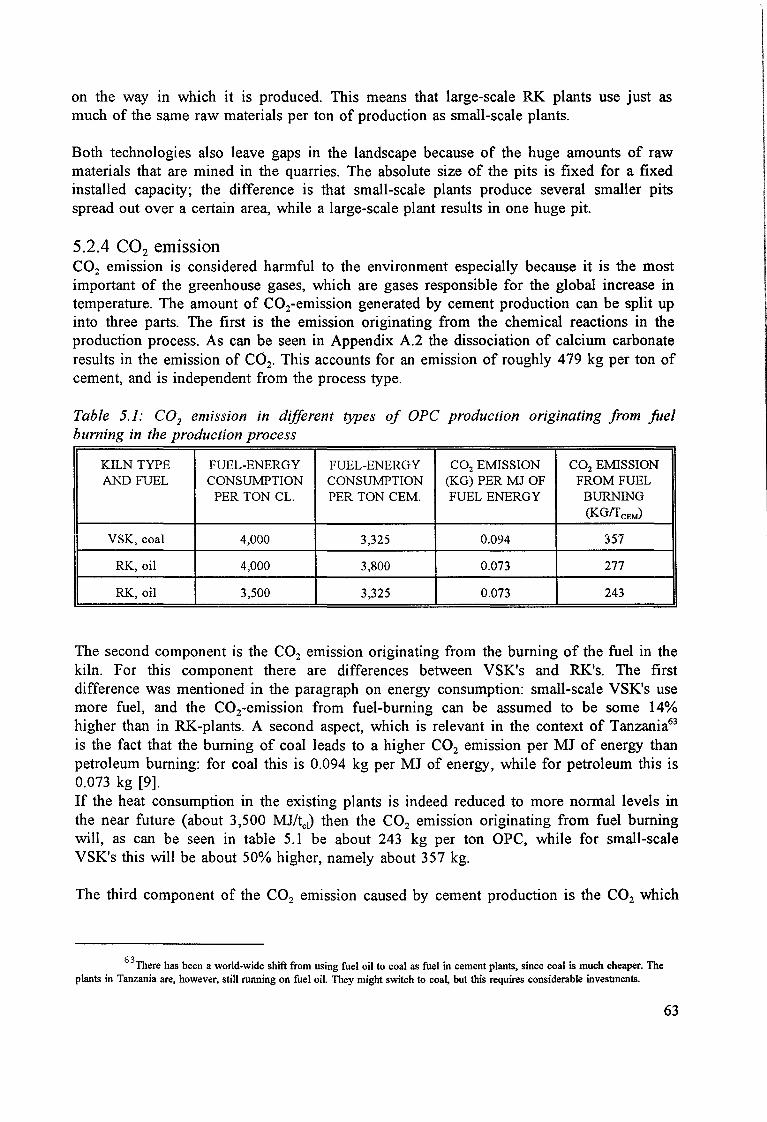
on the way in which it is produced. This means that large-scale RK plants use just as much of the same raw materials per ton of production as small-scale plants.
Both technologies also leave gaps in the landscape because of the huge amounts of raw materials that are mined in the quarries. The absolute size of the pits is fixed for a fixed installed capacity; the difference is that small-scale plants produce several smaller pits spread out over a certain area, while a large-scale plant results in one huge pit.
5.2.4 C02 emission C02 emission is considered harmful to the environment especially because it is the most important of the greenhouse gases, which are gases responsible for the global increase in temperature. The amount of C02-emission generated by cement production can be split up into three parts. The first is the emission originating from the chemical reactions in the production process. As can be seen in Appendix A.2 the dissociation of calcium carbonate results in the emission of C02• This accounts for an emission of roughly 479 kg per ton of cement, and is independent from the process type.
Table 5.1: C02 emission in different types of OPC production originating from fuel burning in the production process
KILN TYPE FUEL-ENERGY FUEL-ENERGY C02 EMISSION C02 EMISSION AND FUEL CONSUMPTION CONSUMPTION (KG) PER MJ OF FROM FUEL
PER TON CL. PER TON CEM. FUEL ENERGY BURNING (K.GrfcEM)
VSK, coal 4,000 3,325 0.094 357
RK, oil 4,000 3,800 0.073 277
RK, oil 3,500 3,325 0.073 243
The second component is the C02 emission originating from the burning of the fuel in the kiln. For this component there are differences between VSK's and RK's. The first difference was mentioned in the paragraph on energy consumption: small-scale VSK's use more fuel, and the C02-emission from fuel-burning can be assumed to be some 14% higher than in RK-plants. A second aspect, which is relevant in the context of Tanzania63
is the fact that the burning of coal leads to a higher C02 emission per MJ of energy than petroleum burning: for coal this is 0.094 kg per MJ of energy, while for petroleum this is 0.073 kg [9]. If the heat consumption in the existing plants is indeed reduced to more normal levels in the near future (about 3,500 MJ/tc1) then the C02 emission originating from fuel burning will, as can be seen in table 5.1 be about 243 kg per ton OPC, while for small-scale VSK's this will be about 50% higher, namely about 357 kg.
The third component of the C02 emission caused by cement production is the C02 which
6 3There has been a world-wide shift from using fuel oil to coal as fuel in cement plants, since coal is much cheaper. The
plants in Tanzania are, however, still running on fuel oil. They might switch to coal, but this requires considerable investments.
63
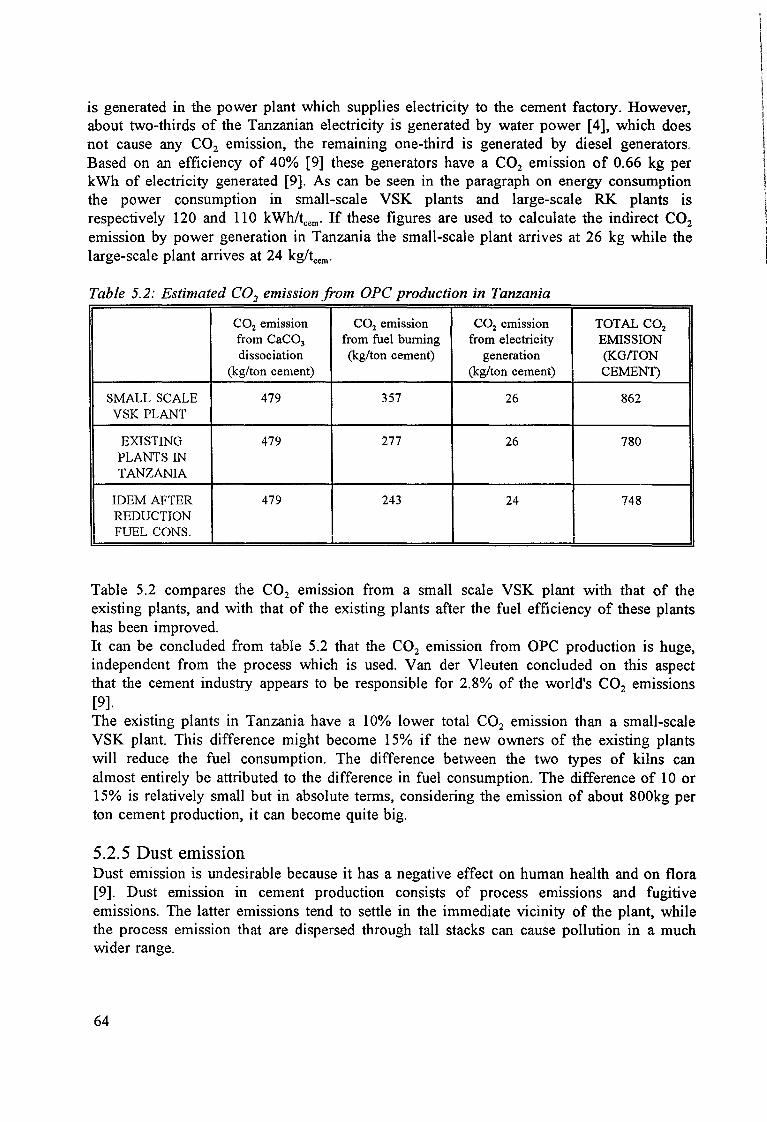
is generated in the power plant which supplies electricity to the cement factory. However, about two-thirds of the Tanzanian electricity is generated by water power [4], which does not cause any C02 emission, the remaining one-third is generated by diesel generators. Based on an efficiency of 40% [9] these generators have a C02 emission of 0.66 kg per kWh of electricity generated [9]. As can be seen in the paragraph on energy consumption the power consumption in small-scale VSK plants and large-scale RK plants is respectively 120 and llO kWh/teem· If these figures are used to calculate the indirect C02
emission by power generation in Tanzania the small-scale plant arrives at 26 kg while the large-scale plant arrives at 24 kg/teem·
Table 5.2: Estimated C02 emission from OPC production in Tanzania
C02 emission C02 emission C02 emission TOTAL C02
from CaC03 from fuel burning from electricity EMISSION dissociation (kg/ton cement) generation (KG/TON
(kg/ton cement) (kg/ton cement) CEMENT)
SMALL SCALE 479 357 26 862 VSK PLANT
EXISTING 479 277 26 780 PLANTS IN TANZANIA
IDEM AFTER 479 243 24 748 REDUCTION FUEL CONS.
Table 5.2 compares the C02 em1ss1on from a small scale VSK plant with that of the existing plants, and with that of the existing plants after the fuel efficiency of these plants has been improved. It can be concluded from table 5.2 that the C02 emission from OPC production is huge, independent from the process which is used. Van der Vleuten concluded on this aspect that the cement industry appears to be responsible for 2.8% of the world's C02 emissions [9]. The existing plants in Tanzania have a 10% lower total C02 emission than a small-scale VSK plant. This difference might become 15% if the new owners of the existing plants will reduce the fuel consumption. The difference between the two types of kilns can almost entirely be attributed to the difference in fuel consumption. The difference of 10 or 15% is relatively small but in absolute terms, considering the emission of about 800kg per ton cement production, it can become quite big.
5.2.5 Dust emission Dust emission is undesirable because it has a negative effect on human health and on flora [9]. Dust emission in cement production consists of process emissions and fugitive emissions. The latter emissions tend to settle in the immediate vicinity of the plant, while the process emission that are dispersed through tall stacks can cause pollution in a much wider range.
64
\
I
I I
I

Both types of cement plants are usually supplied with elaborate dust capturing systems. The VSK produces less process dust because of the shape in which the feed enters the kiln: as nodules. In a dry process RK the feed enters the kiln in a pulverized shape and is easily carried out the kiln by the passing air. RK plants are therefore usually equiped with expensive electrostatic precipitators to reduce dust emission. VSK's are usually only equiped with dust settling chambers to reduce the dust emission. It is not possible to conclude anything decisive on the dust emissions of both types of plants since too little figures are available on this subject.
5.2.6 Other emissions Cement production is responsible for the emission of a number of other materials that are harmful to the environment. This mainly concerns S02, which is considered to be the main cause of acid rain, and emissions of NOx, which also is a cause of acid rain and contributes to ozone formation in smog.
Concerning the S02 emissions it can be assumed that these are probably much higher in a VSK plant than in a modem dry process RK with preheating cyclones64
• This is caused by the fact that in VSK's the contact between gas and material is much less intensive than in a RK. In RK's the largest part of the S02 reacts with the raw materials and is incorporated in the clinker, which is quite harmless. There are, however, no figures available on the S02 emissions of VSK's which would make a comparison with RK's possible. Besides, the S02 emission does not only depend on the process type, but also strongly depends on the sulphur content of the raw materials.
The NOx formation in cement production originates from nitrogen in the fuel and from the nitrogen component of the combustion air. The latter turns into NOx at temperatures exceeding 1200°C [9]. This suggest that NOx formation is lower in a VSK than in a RK since there is only a small zone in a VSK which has temperatures of over 1200°C, and with a maximum of approximately 1450°C. In a RK there is a larger burning zone in which the flame temperature can exceed 2000°C [9]. However, no figures on NOx emissions that could be used for a comparison were found.
5.2.7 Conclusions It can be concluded that small scale VSK cement production is not, as was suggested in paragraph 1.3, inherently much less ecologically sustainable than large scale RK cement production. Large-scale RK plants only have a a slight advantage on small-scale VSK plants when it comes to ecologically sustainable production of OPC. This can almost entirely be attributed to the higher fuel-efficiency, which results in relatively less fuel consumption and less C02 emissions. S02 emissions are probably also lower in modem RK plants, while NOx emissions are probably higher, but it is not possible to conclude anything definite on these items.
64Modem dry process RK's are equiped with a series of preheating cyclones. TI1e hot gasses coming from the kiln pass
through these cyclones and transfer their heat to the raw meal which is traveling in the opposite direction. In these cyclones the pulverized raw materials are suspended in a violent turbulent gas stream in order to ensure maximum contact between the gasses and raw material particles.
65

5.3 Ecological sustainability of OPC vs. an other binder
5.3.1 Introduction There is a large number of construction types in which OPC is indispensable, in which there practically is no alternative for concrete containing OPC. This mainly concerns very demanding and high-strength applications, like civil works or high-rise buildings. OPC is, however, also often used in low-strength applications, like building blocks for low cost housing, for which alternatives do exist.
Especially when it concerns the latter type of applications it is often said that OPC, which is produced in a highly energy-intensive industry, is not appropriate for the application, and that it might be better to use alternatives. There are a number of alternative binders that can be used in low-strength applications and result in the same type of product. In this section OPC will be compared with a binder which is often promoted as an alternative for OPC in low-strength applications on the ecological sustainability. They are compared on three major aspects: energy consumption, resource exploitation and C02 emission.
5.3.2 The binders and application OPC will be compared with a lime-pozzolan mixture. A combination of lime and pozzolan results in a cementitious binder, which also sets on the addition of water. The pozzolan is the volcanic ash as it is found in Tanzania in both Kilimanjaro and Mbeya regions. The binder usually consists of 1 part lime and 2 parts of fine-ground pozzolan.
The binders can, for example, be compared on the application in a building block for low cost housing. This usually concerns single-storey housing for which a block with a compressive strength of 2 N/mm2 is sufficient [22][24]. This can normally be achieved by a sand block which is stabilised with 6% OPC [22]. There have been tests in Tanzania to produce such blocks using lime-pozzolan as binder. It appeared that a mixture of 1 part lime to 2 parts pozzolan to 6 parts sand resulted in a block with a compressive strength of 2 N/mm2 [2].
5.3.3 Energy consumption As could be seen in paragraph 5.2.2 the heat consumption in OPC production in Tanzania presently is about 3,800 MJ/tcem· VSK cement production would probably have about the same heat consumption. The power consumption is about 115 kWh/teem> which corresponds with 414 MJ65
, which brings the total energy consumption on OPC production on roughly 4,200 MJ.
The most energy efficient production of lime in Tanzania has a heat consumption of 5,200 MJ/tlime[2]. This is achieved by relatively large-scale and continuously operated lime kilns. most lime in Tanzania is, however, produced by heap-burning methods which results in heat consumptions of up to 35,000 MJ/t1ime[2]. The power consumption is probably negligible compared to the heat consumption since lime production requires very little
65 1 kWh corresponds with 3.6 MJ.
66

grinding actions66 and little internal conveying. The second part of the lime-pozzolan binder is the pozzolan. The pozzolan does not require much processing; it only has to be ground to a high fineness to achieve a good reactivity. Based on a fineness of 5,000 Blaine67 the power consumption in the preparation of the pozzolan is about 68 kWh/ton68
, which corresponds with 245 MJ/ton. If the energy of mining the pozzolan is estimated at 15 MJ/ton, the total energy consumption in the pozzolan is about 260 MJ/ton. Based on the energy-efficient way of lime production, the total energy consumption in the lime-pozzolan binder is about 1,900 MJ/ton, which is much less than in 1 ton of OPC.
However, if both binders are applied quite a different picture appears because much less OPC is required to obtain a sufficient strength. In a stabilised sand block only 6% OPC is required while 33% lime-pozzolan has to be added. This makes the energy-content of a low-strength building block based on lime-pozzolan 633 MJ/ton, while the blocks made with 6% OPC have an energy content of 250 MJ/ton.
Table 5.3: Energy content of different binders and applications
BINDER ENERGY CONTENT PERCENTAGE ENERGY CONTENT IN BINDER (MJ/t) BINDER IN BLOCK IN BLOCK (MJ/t)
100% OPC 4,200 6% 250
33% lime, 67% pozz. 1,900 33.3% 633
5.3.4 Resource exploitation The amount of limestone which is required to produce one ton of lime-pozzolan binder is 333 x 100/56 = 595 kg, since 44% of the weight if the limestone is lost in the calcining process. For OPC this is about 1,100 kg per ton, which is about twice as high. However, when it comes to an application much more is required from the lime-pozzolan binder to produce the same effect. If the same building block is used again as example, the production of 1 ton of blocks stabilised with lime-pozzolan would require 198 kg of limestone, while the blocks stabilised ith OPC would require only 66 kg per ton.
5.3.5 C02 emission The C02 emission from the production of lime-pozzolan binder can be calculated just like it has been done before for OPC production. The result can be seen in table 5.4, which compares it with OPC sec and in the application which has so far been used as example. It
66Especially grinding actions are strongly power-consuming, but also a complex process which requires much internal
transport actions can cont.ribute to the power consumption.
67TI1is fineness is based on several researches that have been done into the pozzolans of Tanzania which all used very fine
ground pozzolan for their tests [23).
68Tuis figure is based on the fact that the pozzolan has about the same hardness as cement raw materials [23) and that finer
grinding requires about 5% more power per 100 Blaine ei.ira (I Blaine= I cm1/gram)[9), while normal cement grinding to a fineness of 2,500 Blaine would nom1ally cost about 30 kWh [9].
67

Table 5.4: Estimated C02 emission from binder production (kg/ton binder)
BINDER C02 emission C02 emission C02 emission Total C02 C02 emission from CaC03 from fuel from emission generated by dissociation burning electricity (kg/ton stabilised
(kg/ton binder) (kg/ton binder) generation binder) building (kg/ton binder) block (kg/ton)
lime-pozzolan 262 127 10 394 131 (33:67)
100% OPC 479 277 26 780 47 (existing plants in Tanzania)
can be concluded from table 5.4 that the C02 em1ss1on which is generated by the production of a lime-pozzolan binder is about half of the emission generated by OPC production. But also in this case the picture becomes just the opposite if an application is considered because of the different amounts of binder that are required.
5.3.6 Conclusions The results of the comparison of the two binders are gathered in table 5.5. As could already be seen above, the ecological sustainability is mainly a function of the amount of limestone that is burnt in order to produce the binder and the amount of binder that is required in an application. While one needs about twice as much limestone to produce OPC as to produce a lime-pozzolan, the application requires about 5-6 times as much of
Table 5.5: Different aspects of binder production and application in low strength building blocks
PRODUCT ENERGY LIMESTONE C02 EMISSION CONSUMPTION EXPLOITATION (kg/ton)
(MJ/ton) (kg/ton)
OPC 4,200 1,100 780
lime-pozzolan 1,900 595 404
OPC stabilised block 250 66 47
OPC stabilised block 310 66 51 produced at 1 OOO km
from OPC factory
lime-pozzolan 633 198 131
I siabilised biock I
the lime-pozzolan binder. Therefore the OPC production requires twice as much energy and limestone and has a C02 emission that is twice as high. The OPC-application, however, requires roughly only one third of the energy and limestone and has a C02
emission of only one third compared to the same application of lime-pozzolan.
68
I \ I I
I
It can be concluded that the high strength of OPC, which enables the use of relatively only small amounts in the eventual applications, justifies its large energy-consumption and C02 emission.
Even at remote locations, where a lime-pozzolan binder can be produced locally, OPC stays preferable to a lime-pozzolan binder. If the lime-pozzolan binder would be produced locally at a location 1000 km's from an OPC factory, and the OPC would be transported to this location this would have the following effects. Transport increases the energy content with about 1 MJ per kilometer per ton binder69
• On 1000 km this is 1000 MJ, but on a building block with 6% OPC this is only 60 MJ/ton extra. As can be seen in table 5.5, the resulting energy consumption or content of 310 MJ/ton is is still only half of the block stabilised with lime-pozzolan. The fuel used in transporting the OPC also barely affects the 'C02 emission content' of the eventual building block, this is only 4 kg/ton extra, and results in a C02 emission content which is still much less than that of the lime-pozzolan stabilised block.
Finally it has to be reminded that in all calculations the energy consumption of lime production that has been used is based on the most energy efficient lime production in Tanzania, which uses large-scale continuously operated kilns. This type of production is responsible for only a small part of the total lime production. If an average figure of all lime production would have been used, the comparison would turn out even stronger in favour of the use of OPC.
5 .4 Overall conclusion It could be seen in the previous paragraph that OPC has better characteristics than one of the most well-known alternative binders when it comes to ecological sustainability, even at remote locations. From this point of view the use of OPC should be preferred to other binders.
However, one of the motives for this research was the fact that OPC is in short supply, especially in outlying regions. At present it will therefore be difficult to apply OPC instead of an other, locally produced binder on such outlying locations.
This is an argument to spread out OPC production to these areas. Small scale VSK cement production technology could be used to effect this. Although this type of production is somewhat inferior to large-scale production when it comes to ecological sustainability, it is still much better than the application of some alternative binders.
69 Assumptions are: transport with a 20-ton truck, fuel consumption 1:2.8 loaded and 1:3.5 unloaded. Fuel consumption per
km is 112.8 plus 113.5 (to and fro) = 0.64 liter. Energy content of fuel = 33 MJ/liter [25). Energy consumption per kilometer transport = 33x0.64 = 21.2 MJ, divided by 20 tons of load is about 1 MJ per ton per kilometer.
69

6. Conclusions and recommendations
6.1 Limitations In drawing conclusions it should be kept in mind that this is a limited study and the results only have limited validity. This mainly refers to the fact that a number of assumptions have been done concerning aspects which, due to a limitation in time, have not, or barely been investigated.
One of the most serious limitations is based on the fact that the demand projection in Chapter 2 is on the one hand based on extrapolations based on trends (the cement consumption growth over the last 20 years and the population growth) and on the other hand on the outcome of a model for estimation of present regional demands for cement. This model assumes that there is a relation between certain regional characteristics and the potential demand for cement. The trend figures are applied to the sum of the regional estimates in order to arrive at an estimate of the future demand for cement in Tanzania. The consequence of stacking of these assumptions is that the outcome is only of a very limited validity and can only be considered as an indication of the present demand for cement and the development of it in the near future.
Furthermore this study is not elaborate and accurate enough to justify any particular investment decisions. Before the set up of a cement plant can start a number of technical support studies would be required, among which geological studies into the identification of suitable limestone and clay deposits, identification of available suitable coal and burning/clinkering studies. There also is a number of items in the commercial analyses which has not been investigated in detail, but for which assumptions were made or costindex figures were used.
Besides, the outcome of the commercial and macro-economic analyses are only valid for the studied cement production equipment packages and scales of production in the Tanzanian context. No comparison was made with other packages of other suppliers70
,
which eliminates the possibility of checking if the results are only scale dependent, and not supplier dependent.
6.2 Summary of findings In chapter 2 it appeared that present extra need for cement in Tanzania (on top of the present supply) is quite small. The present demand for cement was estimated at 875,000 tpy, while the presently installed cement production capacity is 1,270,000 tpy. Therefore there presently is no pressing need to expand the cement industry in Tanzania immediately. Only the remote south-east and north-west seem suitable for the direct set-up of new production facilities. In these locations the need for local cement production is
7 0It has to be mentioned that no information was obtained from any other suppliers of VSK cement production equipment
than the two suppliers of the studied equipment. It is even questionable if there presently are other producers which have the capability of exporting their product from India to Africa and of setting up and commissioning the plant on location.
70
more pressing than m other regions, and the competition of the larger plants is at a distance.
However, if the cement consumption growth of the last 15 years is continued in the next 15 years, the consumption might reach about 1.75 million tpy in the year 2010. This will enlarge the space on the Tanzanian cement market for new producers and enable them to enter. The cement factory in Dar es Salaam, which presently already sells the major part of its production to the Dar es Salaam market [2] might by then sell its entire output to the Dar es Salaam market which creates opportunities for new small producers to supply those areas that will not be supplied anymore by TPCC. The space on the market that can be filled by new small scale plants depends on the production capacity utilization that will be reached by the existing plants and the growth of the demand for cement. In chapter 2 the space for extra production was estimated at 300,000 to 750,000 tpy by 201071, which would be enough to sustain roughly 10 to 20 VSK cement plants with a production capacity of 100 tpd, or one large scale plant of required capacity.
Furthermore it was not possible to draw any definite conclusions on the availability of the most important raw material (limestone) besides that some limestone is available in almost all regions in Tanzania. Because of the limited information available this aspect has not been imparted in the terms of reference.
In chapter 4 it appeared that, from a national point of view, small scale cement production is preferable to large scale production. Large scale cement production creates much less employment and involves much higher investments per ton of output capacity than small scale plants. From the small scale plants the Movers 200 tpd plant has, overall, the best characteristics. This mainly originates from the relatively low investment costs per ton of output. It also is the only scale of cement production with a positive NNV A and Absolute Efficiency at a SRD of 45%, indicating that the plant has the highest contribution to the national income and generates quite some income in the 'social surplus' category, of which it is assumed that it will contribute to future economic growth.
In the commercial analyses in chapter 3 it was studied which of the small scales of production is (the most) profitable. It turned out that the largest scale of the studied small scales of cement production is the most profitable scale of production: the Movers 200 tpd plant had the highest return figures, the shortest pay-back period and involved the least risk of failure. Therefore this scale of production is the most interesting one for private entrepreneurs.
Furthermore also the ecological sustainability of (small scale) cement production was studied. In chapter 5 it appeared that from an ecological point of view OPC is preferable to other cementitious binders. If the finai appiication of the binders is considered, OPC generates much less noxious emissions and consumes much less energy. Concerning this aspect iarge scale production has characteristics which are better than those of small scale production, but the differences are only marginal. The ecological aspect turned out to be
71Tuese figures are based on a 80% capacity utilization of the existing cement industry in 2010 and a demand growth of 2.8% (population growth, which assumes a constant consumption per capita) to 5% (growth of cement consumption in the past).
71
an argument to spread out cement production to remote areas, in order to enable or facilitate the use of OPC in these areas, which is, as said, preferable to other cementitious binders.
6.3 Main conclusions It can be concluded that an expansion of the cement production capacity in Tanzania within the next 15 years seems desirable. This originates from the increasing demand for cement, the relevance of cement for the development of Tanzania (see Appendix A. I) and the relatively good ecological sustainability of this material. The required expansion within the next 15 years is estimated at an additional production capacity of 300,000 to 750,000 tpy.
From a national as well as from a commercial point of view the largest scale of production of the studied small scale VSK cement plants, the Movers 200 tpd plant, has the best characteristics to effect this expansion of the cement industry in Tanzania. It also has better commercial and macro-economic characteristics than modem large scale plants. Furthermore the small scale plants in general have a less good ecological sustainability than large scale plants, but the difference is only marginal. Besides the aspects which were studied and mentioned above, the relatively small scale of production has the evident advantages that it allows for a gradual build-up of the extra cement production capacity and production of cement closer to the markets, enabling lower final retail prices.
Two of the other small scales of cement production which were studied also came out as profitable investment opportunities: the 50 tpd and the I 00 tpd plants. Both are, however, less profitable than the 200 tpd plant and are less beneficial to the national economy. They might, however, be used to enable cement production in remote areas with relatively little demand.
The hypothesis of this study is that Indian small scale VSK cement production technology is suitable to reduce or resolve the cement shortage in Tanzania, and also more suitable for this end than large scale RK technology. Within the limitations of this study it can be concluded, with some reserve, that this is true.
Main conclusion: Indian small scale VSK cement plants with an output capacity of 50 tpd and larger are suitable to reduce or resolve the cement shortage in Tanzania, and are more suitable for this end than large scale RK cement plants. The Movers 200 tpd VSK cement plant appeared as the most suitable of the studied plant types and scales.
6.4 Recommendations and further research
6.4.1 Introduction As was mentioned before in this Chapter, this study has strong limitations and does not justify any particular investment decisions. However, it does have a quite concrete
72
outcome: it identifies a certain scale of production of a certain cement production technology as a profitable investment opportunity and as the best choice to expand the cement production capacity from a macro-economic point of view. To bridge the gap between this study and the actual implementation of this technology there is a number of items which have to be dealt with, which mainly refers to further and more elaborate research into several aspects and conditions for a succesfull transfer of the technology. This will be dealt with in the following paragraph, which concerns the most important aspects that have to be attended to for a particular investment decision.
Furthermore, there is a number of general aspects which are not related to particular locations or investment decisions which could be investigated. The outcome of such studies can facilitate investments in small scale cement production and enable more general conclusions on the suitability of small scale cement production in Tanzania. This will be attended to in paragraph 6.4.3.
6.4.2 Towards a particular investment decision The first and absolute condition for the set-up of any small scale cement plant is that some person or organisation, with access to sufficient financial means, takes the initiative to investigate the option of investing in a small scale cement plant in more detail. The initiative should preferably be based on information concerning the occurence of a limestone deposit of which it is well possible that it is of sufficient size and quality to sustain the cement plant, and on an indication of the demand for cement in the area which is considered for the set-up. In other words: the initiative should preferably be based on a location. Furthermore it is also very important for the potential investor to assure that there is not only the possibility to acquire sufficient equity capital, but also to assure that there are one or more potential options to acquire long term loans from banks; if this is not the case then it would not be worthwile to spend any money on further research. Such a person or organisation would have to initiate a number of activities which can form the basis for a possible investment decision.
As was mentioned before in this study, it is then first of all important to know if there is enough demand for cement within the vicinity of the location which is considered for the set up of a cement plant. A first indication of the demand in the different regions can be found in Chapter 2 of this report, which might be a starting point for a more elaborate market study.
For the set up of small scale cement plants in certain regions it might appear as unnecessary to execute an elaborate market study. In some regions the present consumption of cement is, in spite of the distance of the existing factories and the consequent high retail price of cement, such that it is enough to sustain a certain scale of production. The fact that the demand might eventually even be higher because of the lower retail price because of the short distance to the market has then not even been considered .
. However, this assumes that the new cement factory can take over the whole market in that
73
area and that compet1t10n on price will be sufficient to establish this72• This does not
necessarily have to take place. Although the new factory will produce standard OPC, just like the existing plants, it might still meet suspicion. There presently are three brands of OPC on the market in Tanzania73
, which are the brands of the three respective cement plants in Tanzania. All three brands are well established in their own markets, and it might tum out to be more difficult to obtain a certain share of the market because of the familiarity of the cement buyers with the established brands74
• It is therefore advisable to execute a marketing study, in which not only the demand is studied, but also whether competition on price is sufficient to acquire a large share of the market. Furthermore such a study should identify other options which will enable the new plant to compete with the existing brands to such an extent that it can market its entire output. This should eventually, in a later stage, result in a marketing plan.
When the outcome of the marketing study reveals that there is sufficient demand in a certain area to sustain a small scale cement plant, preferably a 200 tpd plant, the next step is to investigate the occurences of raw materials, the options of obtaining fuel, and the possible combinations which can be used to produce OPC.
First of all it has to be studied if the considered limestone deposit is of sufficient quality and size to sustain a certain scale of production for at least 20 years, which requires extensive pitting and sampling. Then the options for obtaining coal of the right characteristics should be investigated. In combination with the coal the materials that can be used as sweetening materials should be identified. This should be a clay or clay-like material, in order to arrive at a good plasticity and to enable the forming of nodules. In an early stage it suffices to identify the raw materials and fuel(s) based on chemical analyses and caloric value, and to know the implications of using these materials (especially for the production costs). In a later stage it will be necessary to execute nodulizing and burning studies to arive at a more exact determination of raw meal composition, water addition, burning conditions, etc.
If these two aspects (demand and raw materials) have been ascertained a more detailed commercial analysis can be done. This requires information from the potential supplier of the equipment on the possible supply of equipment and information on the required auxiliaries, mainly consisting of construction works and quarry equipment. These can then be used to assess the investment costs at site. Furthermore it is also very important to have exact information on the amount and types of personnel required in order to assess if it is
72The vicinity of the market will enable the small scale plant to market its cement at a lower price than the large plant which
is located further away from the market.
7 3TPCC produces Twiga Cement ('twiga' mea.'ls giraffe), TCC produces Simba Cement (Lion Cement) and MCC produces
Tembo Cement (Elephant Cement).
7 4There are some indications that familiarity with the brand of cement is an important element in the sales of cement. The
first is based the fact that there was a short period in 1995 in which, after some massive imports, there was a saturation of the cement market, especially in DSM. The cement buyers opted for the brand they knew (Twiga Cement), while the importers could not get their imported cement sold. Finally the importers tried to sell their cement in Twiga cement bags [34]. Another indication is the fact that MCC has recently started to sell its Tembo Cement on the DSM market, but according to salesmen of building materials it is hard to sell this cement in DSM: the buyers prefer Twiga Cement.
74
\ I

possible to eventually 'man' the plant. Also information on the amount of required training and options to execute a training program (which organisation at what price) is required.
It is advisable to start talks with potential suppliers of cement production equipment in an early stage, preferably after the outcome of the marketing study has revealed that there is enough demand in the considered area and a potentially fair limestone deposit has been located. Some of the ensuing steps (after the marketing study) require knowledge which is peculiar to the VSK cement production technology, and there is only a very limited number of organisations which have the knowledge to execute or guide the rest of the process. This knowledge has almost faded out in Germany and is presently barely available outside India. Since the technical support is required at several points in the ensuing preinvestment phase activities, and there are little options to sub-contract certain parts to other parties than the supplier of the equipment75
, it is advisable to lay down a phased process package deal in this early stage.
As a part of such a process package deal, the equipment supplier should: -do raw materials and fuel investigation, including nodulizing and burning studies -supply all necessary information on the equipment and required auxiliaries and personnel in order to enable the investor to execute a detailed commercial analysis.
-supply equipment and arrange or control the set up/erection of the equipment on site -design and execute a training program for the future personnel of the plant which will eventually enable the local employees to run the plant independently
-supply ex-patriate support personnel on key-occupations for the commisioning and first months of production to assure a smooth start-up, and
-design and implement a management plan which minimizes the risk of breakdowns or production snags76
•
The advantage of such a process package deal is that the supplier's performance is not expressed in the supply of functioning equipment, but can be measured in terms of the product's performance. The contract should state that the supplier guarantees that its plant will produce Tanzanian Standard OPC, and that it will achieve a certain minimum capacity utilization within a certain period, and preferably also over a certain period, after the expatriate support has ceased. This forces the supplier to effect a complete transfer of the technology, consisting of not only the equipment, but also know-how, skills and organisation.
7 5Furthermore a lot of aspects are directly related to the specific equipment: the supplier of the equipment knows best what
kind of training is necessary for the operation of its equipment, what are factors that are most likely to lead to production snags and have to be adressed in a management plan, which raw materials are especially suitable for the equipment, etc.
7 6Tuis aspect has not been discussed yet, but is very important. Cement plants in developing countries tend to have a low
capacity utilization and hence a bad commercial perfonnance as a consequence of the same causes. These are the lack of preventive maintenance of the production equipment as well as quarry equipment and no or too little spare parts in stock. Consequently a lot of breakdowns occur and are difficult to address. Other problems can be the lack of stored raw or intem1ediate materials, hampering the output in case of a partial breakdown, the lack of forex, thwarting the purchase of foreign inputs like fuel, refractories and spares, and general ignorance of the employees concerning prevention of breakdowns. These are all aspects that can be avoided by a good management which is aware of the aspects that have to be attended to and the actions that have to be undertaken.
75

6.4.3 General recommendations As was stated in Chapter 2 the information which presently is available on limestone deposits is rather limited. Therefore a quite extensive mapping program could be done, which would identify all limestone deposits in Tanzania, or otherwise at least a few per region on strategic locations. Such a mapping scheme would give a fair indication of the quality and quantity of all investigated deposits. An overview of the occurences, quality and size of the limestone deposits would allow for more general conclusions on the suitability of small scale cement production for Tanzania. Otherwise it also facilitates the identification of locations for the set up of a plant for potential investors.
Another relatively uncertain element in the question of the need for expansion of the Tanzanian cement industry is the demand for OPC and its development in the near future. There is a general accord between authors that there is a shortage of cement, but they have different opinions on the magnitude of this shortage. A more elaborate research into the actual demand for cement and the factors which determine this demand, like price, familiarity with the product, urban or rural location,etc. can give a better insight into the actual demand and shortage, and also how these will develop based on other expected developments like for example population growth, economic growth and urbanization. Such information will then help to decide on when and where to expand the cement industry.
Furthermore, since this study only considered four equipment packages of two different suppliers it would be very usefull to execute a comparitive study of all scales of production of all exporting (Indian) manufacturers of small scale cement production equipment. In such a study attention should, besides the aspects which are discussed in this study, also be given to the supply conditions of the different suppliers and the capacity of the suppliers to effect a complete technology transfer, including erection of equipment, training, support or supervision, etc. This will facilitate the process of identifying suppliers and their product for potential investors, and also enable more general conclusions on the suitability of the discussed VSK technology.
76

7. Sources of information
[1] Tanzania Saruji Corporation administration figures (unpublished) TSC headquarters, Dares Salaam
[2] Muhegi, B. and Schilderman, T. (1994) PRODUCTION AND CONSUMPTION OF BINDERS IN TANZANIA paper prepared for regional workshop on lime and alternative binders in East Africa, ITDG, Rugby, UK
[3] Stewart, D.F. and Muhegi, B. (1989) STRATEGIES FOR MEETING TANZANIA'S FUTURE CEMENT NEEDS Natural Resources Forum, november 1989, p.294-302
[4] Bureau of Statistics (1994) STATISTICAL ABSTRACT: 1992 Dar es Salaam
[5] Kimambo, R.H. (1987) DEVELOPMENT OF THE NON-METALLIC MINERALS AND THE SILICATE INDUSTRY IN TANZANIA, volume 2 Dar es Salaam, Eastern Africa Publications Ltd.
[ 6] National Construction Council ( 1992) IDENTIFICATION AND PROMOTION OF UTILIZATION OF LOCAL RESOURCES AND LOCALLY PRODUCED MATERIALS FOR CONSTRUCTION INDUSTRY IN TANZANIA Dar es Salaam, NCC
[7] United States Department of the Interior (1988) MINERALS YEARBOOK 1986 Washington, US Government Printing Office
[8] The Software Toolworks (1994) MULTIMEDIA WORLD ATLAS, version 5 US, Electromap Inc.
[9] Vleuten, F. van der (1994) CEMENT IN DEVELOPMENT, ENERGY AND ENVIRONMENT MSc thesis, Eindhoven University of Technology Eindhoven
[10] Sinha, S. (1990) MINI-CEMENT, A REVIEW OF THE INDIAN EXPERIENCE London, Intermediate Technology Publications
77

[11] Garg, M.K., Bruce, R. (1980) MINI CEMENT, PROJECT PROPOSAL AND FEASIBILITY REPORT Appropriate Technology Development Association Lucknow (India), Lucknow Publishing House
[12] Sigurdson, J. (1977) SMALL SCALE CEMENT PLANTS London, Intermediate Technology Publications Ltd.
[13] Visvesvaraya, H.C (1986) TECHNOLOGY PROFILE ON MINI CEMENT PLANTS INTIB, UNIDO, Vienna
[14] National Council for Cement and Building Materials (1995) CRI-MVSK CEMENT PLANT, A PROFILE NCB, New Delhi, India
[15] Timpre pvba (1988) HANDBOEK CEMENT Arnhem, CBR Cementbedrijven Nederland B.V.
[16] Rajbhandari, C.D. (1995) MODERN VERTICAL SHAFT KILN TECHNOLOGY World Cement, january 1995, p.65-67
[17] Quotations for the supply of 100 tpd and 200 tpd VSK cement plants, dated 02/11/1995 Movers Private Ltd Bangalore, India
[18] Baart, P.E.H. (1995) FACILITATING TRADE POLICY MAKING AND EXECUTION AT THE MINISTRY OF INDUSTRIES AND TRADE, TANZANIA TRADE POLICIES AND PERFORMANCE - ROLE OF INFORMATION AND AUTOMATION MSc thesis, Eindhoven University of Technology Eindhoven
[19] Tanga Cement Company administration figures (unpublished) TCC, Tanga
[20] Samplonius, C. (1994)
78
ENERGY EFFICIENCY IN THh TANZA:N!AN INDUSTRY, THE CEivIBNT INDUSTRY AS CASE STUDY MSc thesis, Eindhoven University of Technology Eindhoven
I I
I

[21] Mr. Rwoga, Deputy General Manager at Tanzania Saruji Corporation TSC headquarters, Dar es Salaam
[22] International Labour Office (1987) SMALL-SCALE MANUFACTURE OF STABILISED SOIL BLOCKS Geneva
[23] Kawiche, G.M. (1983) PRODUCTION OF PORTLAND-POZZOLANA CEMENT IN TANZANIA in: APPROPRIATE BUILDING MATERIALS FOR LOW COST HOUSING, volume 2 London, E. & F.N. Spon Ltd.
[24] Spence, R.J.S., Cook, D.J. (1983) BUILDING MATERIALS IN DEVELOPING COUNTRIES Chichester, John Wiley and Sons
[25] Verkerk, G. and others (1986) BIN AS Wolters-Noordhoff Groningen, the Netherlands
[26] Mr. Mamiro, head of Research and Development Department of National Construction Council NCC, Dar es Salaam
[27] Bureau of Statistics (1989) 1988 POPULATION CENSUS, PRELIMINARY REPORT Ministry of Finance, Economic Affairs and Planning of Tanzania Dar es Salaam
[28] Mr. Ilangali, Principal Research Officer at Tanzania Saruji Corporation TSC headquarters, Dar es Salaam
[29] Ndunguru, B. , Training Manager at Tanzania Portland Cement Company TPCC, Dar es Salaam
[30] Quotation for the supply of 25 tpd and 50 tpd VSK cement plants, dated 23/11/1995 Saboo Engineers Private Ltd Jodhpur, India
[31] Kamani, B.K. (1995) MINI CEMENT PLANTS - AN APPROPRIATE TECHNOLOGY FOR DEVELOPING COUNTRIES? World Cement, march 1995, p.42-49
79

[32] Alsop, P. and Post, J. (1995) THE CEMENT PLANT OPERATIONS HANDBOOK Tradeship Publications Ltd Dorking, Surrey, UK
[33] Kimambo, R.H. (1986) DEVELOPMENT OF THE NON-METALLIC MINERALS AND THE SILICATE INDUSTRY IN TANZANIA, volume 1 Dares Salaam, Eastern Africa Publications Ltd.
[34] Jongsma, I. (1995) SECTOR-STUDY: THE CEMENT INDUSTRY IN TANZANIA (unpublished) essay, Eindhoven University of Technology
[35] UNIDO (1986) MANUAL FOR THE EVALUATION OF INDUSTRIAL PROJECTS Vienna
[36] Tanzania Portland Cement Company Ltd. administration figures (unpublished) TPCC, Dar es Salaam
[37] Bamburi Portland Cement Company Ltd. administration figures (unpublished) BPCC, Mombasa
[38] Kohlhaas, B. and Labahn, 0. (1982) RATGEBER FUER ZEMENT-INGENIEURE Bauverlag GmbH Wiesbaden, Germany
[39] Tanzania Customs department administration figures (unpublished) Customs Department, Dar es Salaam
[40] Janssen, H.J.M. (1992) BETONKONSTRUKTIES 1, KONSTRUKTIEF ONTWERPEN 3 lecture notes nr. 7239 Eindhoven University of Technology, Eindhoven
[41] World Cement (1993) CEMBUREAU SEES FURTHER FALL IN DEMAND World Cement, february 1993, p.45
[42] Pheng, L.S., Bee, T.O. (1993) ROLE OF CEMENT IN ECONOMIC DEVELOPMENT International Cement Review, february 1993, p.44-50
[43] Spence, R.J.S. (1980)
80
SMALL SCALE PRODUCTION OF CEMENTITIOUS MATERIALS London, IT Publications
[44] Microsoft Home (1994) 1994 ENCARTA MULTIMEDIA ENCYCLOPEDIA US, Microsoft Corporation
[45] ENCI (1994) ENKELE KERNGEGEVENS BOUWNIJVERHEID, BETON EN CEMENT Marketing en Marktontwikkeling, juli 1994, p.1-5 's Hertogenbosch, VNC
[46] Pronk, J.(1990) EEN WERELD VAN VERSCHIL policy note of Dutch Government The Hague
[ 4 7] Lemmens, L. ( 1993) FEASIBILITY STUDIES lecture notes nr. 1638 Eindhoven University of Technology, Eindhoven
[48] Behrens, W., Hawranek, P.M. (1991) MANUAL FOR THE PREPARATION OF INDUSTRIAL FEASIBILITY STUDIES UNIDO, Vienna
[ 49] Investment Promotion Centre (1992) NATIONAL INVESTMENT (PROMOTION AND PROTECTION) ACT revised edition IPC, Dar es Salaam
81