ejecta mass diagnostics of type ia supernovae
TRANSCRIPT

MNRAS 474, 3187–3211 (2018) doi:10.1093/mnras/stx2816Advance Access publication 2017 November 1
Ejecta mass diagnostics of Type Ia supernovae
Kevin D. Wilk,1‹ D. John Hillier1‹ and Luc Dessart21Department of Physics and Astronomy & Pittsburgh Particle Physics, Astrophysics, and Cosmology Center (PITT PACC), University of Pittsburgh,Pittsburgh, PA 15260, USA2Unidad Mixta Internacional Franco-Chilena de Astronomıa (CNRS UMI 3386), Departamento de Astronomıa, Universidad de Chile, Camino ElObservatorio 1515, Las Condes, Santiago, Chile
Accepted 2017 October 27. Received 2017 October 13; in original form 2017 June 16
ABSTRACTWe present one-dimensional non-local thermodynamic equilibrium time-dependent radiativetransfer simulations (using CMFGEN) of two sub-Chandrasekhar (sub-MCh), one MCh and onesuper-MCh Type Ia SN ejecta models. Three originate from MCh delayed detonation mod-els, and the fourth is a sub-MCh detonation model. Ejecta masses are 1.02, 1.04, 1.40 and1.70 M�, and all models have 0.62 M� of 56Ni. Sub-MCh model light curves evolve faster,reaching bolometric maximum 2–3 d earlier and having 3–4 d shorter bolometric half-lightwidths. The models vary by ∼12 per cent at maximum bolometric luminosity and by 0.17 magin Bmax. While �M15(B) increases with ejecta mass, it only varies by ∼5 per cent around1 mag. Sub-MCh models are 0.25 mag bluer in B − R at Bmax. Optical spectra share manysimilarities, but lower mass models exhibit less UV line blanketing during the photosphericphase. At nebular times, significant near-infrared (NIR) spectroscopic differences are seen.In particular, emission lines of the Ca II NIR triplet; [S III] λλ9068,9530; [Ca II] λλ7291,7324;[Ar III] λλ7135,7751 and [Ni II] 1.939 µm are stronger in higher mass models. The [Ni II] 1.939µm line is absent in the sub-MCh detonation model, and provides a valuable potential tool todistinguish sub-MCh explosions from MCh explosions. In general, the nebular phase modelsare too highly ionized. We attribute this to the neglect of clumping and/or the distributionof intermediate mass and iron group elements. The two sub-MCh models, while exploded bydifferent mechanisms, can be distinguished in the J and H bands at late times (e.g. +200 d).
Key words: radiative transfer – supernovae: general – white dwarfs.
1 IN T RO D U C T I O N
Type Ia supernovae (SNe Ia) are thought to be thermonuclearrunaway explosions of carbon-oxygen (C/O) white dwarfs (WDs;Hoyle & Fowler 1960), but the formation channel of the progenitorremains uncertain. Determining the progenitor channel(s) of SNeIa, and their diversity, is of crucial importance since it will improvetheir use as probes of cosmological parameters (Riess et al. 1998;Perlmutter et al. 1999). Further, understanding the progenitor chan-nel allows us to probe stellar evolution of binary systems prior to theSN occurring, and hence place constraints on both binary synthesismodels and binary evolution.
There are two main progenitor channels invoked to explain theorigin of SNe Ia – the single degenerate (SD) channel and doubledegenerate channel. In the ‘classic SD channel, the WD accretesmatter (usually hydrogen and/or helium) from a non-degeneratestar due to binary interaction via Roche lobe overflow. However,mass transfer in the SD channel is not limited to Roche lobe
� E-mail: [email protected] (KDW); [email protected] (DJH)
overflow – it can also be mediated by wind mass-loss as, for exam-ple, in symbiotic systems (see Maoz, Mannucci & Nelemans 2014,for a review). In the SD channel matter accumulates on the WD,where stable burning can occur, until the star approaches the Chan-drasekhar mass (MCh≈1.4 M�) and explodes leading to an SN Ia(Whelan & Iben 1973; Nomoto 1982).
How the WD explodes has long been a matter of study withinthe astrophysics community. The different explosion mechanismsinclude pure detonation (Arnett 1969; Sim et al. 2010), pure de-flagration (Nomoto, Sugimoto & Neo 1976), delayed detonationand pulsating delayed detonation (Khokhlov 1991a,b; Gamezo,Khokhlov & Oran 2005; Livne, Asida & Hoflich 2005; Ropke& Niemeyer 2007; Jackson et al. 2010; Seitenzahl et al. 2013)and gravitationally confined detonation (GCD; Plewa, Calder &Lamb 2004). More recent research on the GCD, including three-dimensional (3D) full star simulations, was presented by Seitenzahlet al. (2016). For sub-MCh WD masses, a double detonation scenariohas been explored (Woosley & Weaver 1994; Livne & Arnett 1995;Fink, Hillebrandt & Ropke 2007; Fink et al. 2010).
One of the most successful theories at reproducing the proper-ties of standard SNe Ia is the delayed-detonation transition (DDT)
C© 2017 The Author(s)Published by Oxford University Press on behalf of the Royal Astronomical Society
Downloaded from https://academic.oup.com/mnras/article-abstract/474/3/3187/4584470by Universidad de Chile useron 29 May 2018

3188 K. D. Kevin, D. J. Hillier and L. Dessart
model, where the WD first undergoes a subsonic deflagration phase.The resulting expansion of the WD creates lower density fuel,which is necessary for the production of intermediate mass ele-ments (IMEs). At a particular density, the burning switches fromsubsonic to supersonic (Khokhlov 1991a,b). This scenario is re-quired to recreate the observed chemical stratification. Pure deto-nation models produce too many iron group elements (IGEs) suchas iron and nickel but not enough IMEs at high velocities to repro-duce SN Ia spectra. On the other hand, deflagration models produceabundant amounts of IMEs but not enough 56Ni to power the SN lu-minosity. This mechanism is a possible channel for underluminousSNe Ia (Travaglio et al. 2004; Phillips et al. 2007; Jordan et al. 2012;Kromer et al. 2013). One-dimensional (1D) DDT models have beenvery successful in reproducing the observed properties of SNe Ia.However, these models describe the turbulent flame propagationonly in a parametrized way. Three-dimensional models better cap-ture the fluid instabilities and mixing. This lead to different ejectastructures that do not reproduce observables as well as 1D models(see e.g. Seitenzahl et al. 2013; Sim et al. 2013).
The double degenerate scenario corresponds to the merger oftwo WDs through loss of angular momentum by gravitational waveemission. It is not understood how the merger triggers the explo-sion, although it is thought that during the merger the smaller massWD donates matter to the more massive WD. Recently, modellingby Sato et al. (2015) has shown that, depending on the masses of thetwo WDs, explosions can occur either during the merger phase, pro-vided both WDs are within a mass range between 0.9 and 1.1 M�,or within the merger remnant phase when the more massive objectreaches MCh. From their models, the authors estimate that 9 per centof galactic SNe Ia can be attributed to mergers. One problem in thisscenario is that rapid mass accretion of carbon and oxygen leadsto an off-centre carbon ignition and subsequently an O/Ne/Mg WD(Saio & Nomoto 1985). Accretion-induced collapse creates addi-tional problems for high accretion rates, leading to the formation ofa neutron star instead of an SN Ia. For an extensive review aboutprogenitors of SNe Ia, see Maoz et al. (2014).
When almost the entire C/O WD has burnt, releasing ∼1051 erg(more energy than the gravitational binding energy of a MCh WD),the energy liberated unbinds the WD, producing an ejecta with noremnant. Ejecta velocities of the order of ∼10 000 km s−1 are pro-duced, and within minutes, the ejecta reaches a homologous coast-ing phase (radiation pressure from 56Ni decay produces second-order effects). At early times, the ejecta is radiation dominated andheated by the decay of 56Ni (56Co for post-maximum evolution).It is because of this, main decay chain of 56Ni→56Co→56Fe, withroughly 1.7 MeV of energy release per decay for 56Ni and 3.7 MeVper decay for 56Co, that these objects are so luminous. However,Dessart et al. (2014a) show the importance of heating the outer(≥20 000 km s−1) ejecta from other decay channels.
Early work by Stritzinger et al. (2006) suggested sub-MCh WDs asprogenitors for some SNe Ia based on comparisons of UVOIR lightcurves (LCs) of 16 SNe with analytical models of nuclear decayluminosities and energy deposition. Scalzo et al. (2014a), Scalzo,Ruiter & Sim (2014b), Sim et al. (2010, 2011) and Blondin et al.(2017) have shown that there is both observational and theoreticalevidence for sub-MCh explosions. From photometric model fitting,Scalzo et al. (2014a,b) shows that the mass distribution for SNe Iaincludes both sub-MCh and super-MCh events. Scalzo et al. (2014b)argue that 25–50 per cent of SN Ia events deviate from MCh events,with most of these occurring as sub-MCh explosions. Therefore, forgiven measured 56Ni masses, one can compare SNe Ia to betterunderstand how ejecta mass affects LCs and spectral evolution.
Sim et al. (2010, 2011) found good agreement with photometricobservations at maximum and reproduced IME features in syntheticspectra at maximum with 1D pure detonations of sub-MCh explo-sions. However, these models decline too rapidly post-maximum.This idealized approach ignores the influence of any accreted he-lium layer. Previous works (Woosley & Weaver 1994; Livne &Arnett 1995; Hoeflich & Khokhlov 1996; Hoeflich et al. 1996; Nu-gent et al. 1997; Kromer et al. 2010) found difficulties reproducingthe observed LCs, colours and spectral evolution after treating theburnt helium layer, which synthesizes a significant amount of 56Ni.
Woosley et al. (2007) explored a grid of SN Ia models comingfrom 1.38 M� WDs with varying amounts of mixing and 56Ni, find-ing models of similar 56Ni to have large variations of decline rates[�M15(B) – which is the change in B-band magnitude 15 d afterB-band maximum (Phillips 1993)] and antiwidth–luminosity rela-tionships. Woosley & Kasen (2011) computed hydrodynamic andradiative transfer simulations of sub-MCh mass models for helium-accreting WDs, but the authors only found reasonable agreementwith spectra and LCs of common SNe Ia for the most massiveWDs with the smallest helium layers they considered. Blondinet al. (2017) looks at broadening our understanding of the width–luminosity relation (WLR) using pure detonations of sub-MCh WDs.Their work shows promising agreement with observations of faintSNe Ia, confirming the need for two WD populations to explain thefull behaviour of the WLR seen at high- and low-SN Ia brightness.
Observations have shown high-velocity features (HVFs) in early-time spectra of SNe Ia. These features have been used to constrainthe explosion scenario (Mazzali et al. 2005a,b; Tanaka et al. 2006;Blondin et al. 2013; Childress et al. 2013, 2014; Pan et al. 2015;Silverman et al. 2015; Zhao et al. 2015). Studying the formation ofthese features as well as their correlation with galaxy environmentcan improve our understanding of Type Ia progenitors. We can gaininsights, for example, into the density and temperature structureof the outer layers. The latter will reveal itself through changes inionization and hence the strength of spectral features.
In this paper, we study two sub-MCh models (∼1 M�), a MCh
model (∼1.4 M�), and a super-MCh model (∼1.7 M�), all with thesame 56Ni mass by design, to determine the effects of ejecta mass.One model is a standard DDT model, two models are standardDDT models whose density have been scaled to give the desiredejecta mass, while the final model arises from a pure detonationin a sub-MCh model. The original DDT models are also somewhatartificial. For example, the onset of detonation in a DDT model isa free parameter. Further, it is impossible in current models to re-solve and adequately model the thermonuclear flame [see Ciaraldi-Schoolmann, Seitenzahl & Ropke (2013) and references therein].We consider evolution over more than 200 d in time – from ∼1 dafter the explosion until approximately 220 d after the explosion,and look for diagnostics of ejecta mass (Mej) for our 56Ni mass thatcan be used to distinguish between the different models. Since theprecise explosion mechanism is uncertain, the two sub-MCh mod-els were exploded using different assumptions. Spectra and LCswere computed using non-LTE and time-dependent radiative trans-fer. Looking for SN Ia diagnostics, we wanted to remove sensitivityof 56Ni while focusing on ejecta mass to uncover insights in SN Iaevolution, both spectroscopically and photometrically.
The paper is organized as follows. In Section 2, we discuss thetechniques used and initial ejecta properties. We compare the bolo-metric LCs as well as synthetic photometric LCs in Section 3.We discuss the spectral evolution, highlighting the strong spectraldifferences, in Section 4. In Section 5, we further highlight thedistinctions between our two sub-MCh models. In Section 6.1, we
MNRAS 474, 3187–3211 (2018)Downloaded from https://academic.oup.com/mnras/article-abstract/474/3/3187/4584470by Universidad de Chile useron 29 May 2018

SNe Ia ejecta mass diagnostics 3189
Table 1. Model summary. Listed are the masses in M�, ejecta kinetic energies in 1051 ergs, and the root mean square of the velocity in km s−1. Also listed ismodel mass information in M� at 0.75 d post-explosion. The parentheses (#) correspond to ×10#
Model Mass EKin υrms C O Na Mg Si S Ar(M�) (1051 ergs) (km s−1) (M�) (M�) (M�) (M�) (M�) (M�) (M�)
SUB1 1.04 1.22 10821 3.295(−3) 5.196(−2) 1.306(−5) 2.441(−3) 1.553(−1) 1.022(−1) 2.248(−2)SUB2 1.02 1.17 10695 8.803(−4) 3.906(−2) 4.466(-6) 2.615(−3) 1.185(−1) 7.488(−2) 1.654(−2)CHAN 1.40 1.51 10415 2.419(−3) 9.595(−2) 1.244(−5) 9.557(−3) 2.551(−1) 1.661(−1) 3.693(−2)SUP 1.70 1.81 10351 3.333(−3) 1.293(−1) 2.044(−5) 1.387(−2) 3.805(−1) 2.443(−1) 5.223(−2)
Model Ca Ti Cr Fe Co 58Ni + 60Ni 56Ni
(M�) (M�) (M�) (M�) (M�) (M�) (M�)
SUB1 2.361(−2) 2.665(−5) 1.030(−2) 2.226(−2) 5.526(−2) 1.1(−2) 5.684(−1)SUB2 1.822(−2) 1.083(−4) 1.516(−2) 6.654(−2) 5.680(−2) 2.6(−2) 5.710(−1)CHAN 4.120(−2) 1.486(−4) 2.689(−2) 1.020(−1) 5.713(−2) 2.5(−2) 5.708(−1)SUP 5.562(−2) 1.828(−4) 2.977(−2) 1.224(−1) 5.777(−2) 3.0(−2) 5.707(−1)
comment on the lack of HVFs. Section 6.2 shows spectral compar-ison to a few SNe Ia that are close in measured Mej and 56Ni mass.In Section 6.3, we discuss shortcomings of our models in reproduc-ing spectral characteristics of SNe Ia beyond 20 d post-maximum.Section 7 summarizes our results and conclusions.
2 T E C H N I QU E
To determine spectral and LC diagnostics, we utilize hydrodynam-ical models that have been evolved from explosion until 0.75 d.Homologous expansion of the ejecta is well established at 100 s,and it is assumed to strictly hold at all times thereafter. We allowfor non-local thermodynamic equilibrium (non-LTE) and solve thespherically symmetric, time-dependent, relativistic radiative trans-fer equation in order to produce emergent synthetic spectra fromwhich synthetic LCs can be produced.
2.1 Ejecta and radiative transfer modelling
Our models correspond to scaled ejecta of model DDC0 (densityscaled by 0.73, model SUB2) and DDC15 (density scaled by 1.22,model SUP), complemented with models DDC10 (no scaling ap-plied, model CHAN; see Blondin et al. 2013) and SCH5p5 (densityscaled by 0.98, model SUB1; see Blondin et al. 2017). This densityscaling is applied to produce ejecta with the same 56Ni mass initially(0.62 M�), but differing in ejecta mass so that they lie below, atand above the MCh. This scaling, applied exclusively to the densityat 10 s after explosion, is obviously artificial. An advantage of thisscaling method is that, while the mass varies, the chemical stratifi-cation does not. This ensures the models retain their fundamentalcharacteristic of all SN Ia ejecta. We do not compute the combustionnor make any claim that a flame would behave in the way adoptedfor the corresponding WD mass (i.e. deflagration followed by det-onation in the DDC models; pure detonation in the SCH model).Even in the original (unscaled) model, the treatment of combustionis largely imposed rather than computed from first principles. Thepurpose of the study is to investigate the signatures sensitive to vari-ations in ejecta mass, keeping the 56Ni mass the same between allmodels in order to retain only one variable quantity. Model masses,kinetic energies and important species masses are summarized inTable 1.
The use of scaled DDT models for SUB2 and SUP is problem-atical since the explosion properties will depend on the mass ofthe WD. For example, differences in the initial central densities
before the explosion will likely lead to different abundance pro-files within the ejecta. In particular, sub-MCh WDs, unlike theirMCh counterpart with stable IGEs in their inner ejecta, do not ex-hibit a ‘56Ni hole’ which is a low 56Ni abundance inside an ex-pansion velocity of 2500 km s−1. However, a comparison of SUB2with SUB1 will allow us to test the sensitivity of the results tothe adopted explosion model. The explosion mechanism for ejectawith super-Chandrasekhar masses is extremely uncertain, and anyadopted model will have limitations.
The radiative transfer models have been computed using CM-FGEN (Hillier & Miller 1998; Hillier & Dessart 2012; Dessartet al. 2014a,b), which solves the spherically symmetric, non-localthermodynamic equilibrium (non-LTE), time-dependent, relativis-tic radiative transfer equation in the comoving frame. To advancein time, we used a 10 per cent time step for each model startingfrom 0.75 d until ∼100 d, after which we used a time step of 10 d.At early times (�7 d) during the time sequence, we assumed thatγ -ray photons created from radioactive decays are locally deposited.Otherwise, we approximate the γ -ray deposition as grey, adoptingthe procedure from Swartz, Sutherland & Harkness (1995) and aκγ = 0.06Ye cm2 g−1. The kinetic energy of decay positrons is lo-cally deposited at all epochs. CMFGEN currently treats both one- andtwo-step decay chains for calculating non-thermal heating.
2.2 Ejecta conditions for radiative transfer
Table 1 shows the yields for the most abundant species in ourejecta models at 0.75 d. Since the 56Ni mass is fixed, there aresubstantial variations in the mass of the IMEs. In particular, themass of individual IMEs in model SUP is a factor of 3–5 larger thanin model SUB2; model SUB1 has ∼1.3–1.4 times the mass of IMEsand ∼1/3 times the iron mass of SUB2. The initial iron abundancein SUB1 is almost a factor of 6 lower than in SUP. The mass ofstable nickel (58Ni and 60Ni) is 0.011, 0.026, 0.025 and 0.030 M�for SUB1, SUB2, CHAN and SUP. The presence of stable nickelfeatures in nebular spectra, and the ability to measure the nickelabundance, is discussed in Sections 4 and 6.3.
In Fig. 1, we show the outward cumulative mass as a function ofvelocity. Less than 1 per cent of the mass lies beyond 25 000 km s−1
for all models, and hence we restrict future model ejecta compar-isons to velocities less than 30 000 km s−1. Higher velocity materialmakes very minor contributions to synthetic spectra.
Fig. 2 compares the initial mass fraction at 0.75 d for all mod-els. All but model SUB1 exhibit an ‘56Ni hole’ at velocities lessthan ∼2500 km s−1. As noted earlier, the hole in SUB2 is artificial,
MNRAS 474, 3187–3211 (2018)Downloaded from https://academic.oup.com/mnras/article-abstract/474/3/3187/4584470by Universidad de Chile useron 29 May 2018

3190 K. D. Kevin, D. J. Hillier and L. Dessart
Figure 1. Illustration of the outward cumulative mass as a function ofvelocity. The cumulative mass begins to flatten off around 25 000 km s−1
for all models, the velocity at which the density begins to decrease rapidly.Less than 1 per cent of the total mass is exterior to this velocity.
and arises since the model was scaled from a model based on theexplosion of a MCh WD that has a higher central density.
3 L I G H T C U RV E S
The LCs and colour evolution of Type Ia models depend on theprogenitor system and potentially offer a means to distinguish be-tween progenitor systems. Due to differences in ejecta mass, thediffusion time varies between models, giving rise to morphologicalseparations in both the width of each bolometric LC and the peakluminosity. However, from work by Pinto & Eastman (2000a,b), weexpect this effect to be small.
Fig. 3shows the bolometric LCs of all models relative to thetime of explosion. Decreasing ejecta mass (shorter diffusion time)corresponds to a faster evolving SN. In days since explosion, thebolometric luminosity maximum occurs at 14.4 (3.80× 10⁹ L�),14.4 (3.96× 10⁹ L�), 15.84 (3.63× 10⁹ L�) and 17.42 (3.47× 10⁹
L�) for models SUB1, SUB2, CHAN and SUP, respectively. Tocharacterize the bolometric LCs, we list tmax (time of bolometricmaximum), t−1/2 and t+1/2 [the times to rise from half bolometricmaximum luminosity to maximum and to decline from bolometricmaximum back to half of maximum – see Contardo, Leibundgut &Vacca (2000)] in Table 2. Between ∼1 and 1.7 M�, we have roughlya 1 d difference in half-light rise times (t−1/2), with SUB ejecta mod-els rising faster. After bolometric maximum, the SUP ejecta modeltakes roughly ∼3.5 d longer than the SUB ejecta models to declineto half light (t+1/2). With precise measurement determinations ofthe rise time in Lbol, we can put stronger constraints on the ejectamass for a given 56Ni mass.
As the 56Ni mass is the same for all models, differences in thebolometric LC evolution are primarily due to ejecta mass. However,
despite differences in ejecta mass of ∼70 per cent, the differencesare relatively small, though measurable. This effect of ejecta massshould be clearly visible from a statistical sample of deep highcadence observations of SNe Ia.
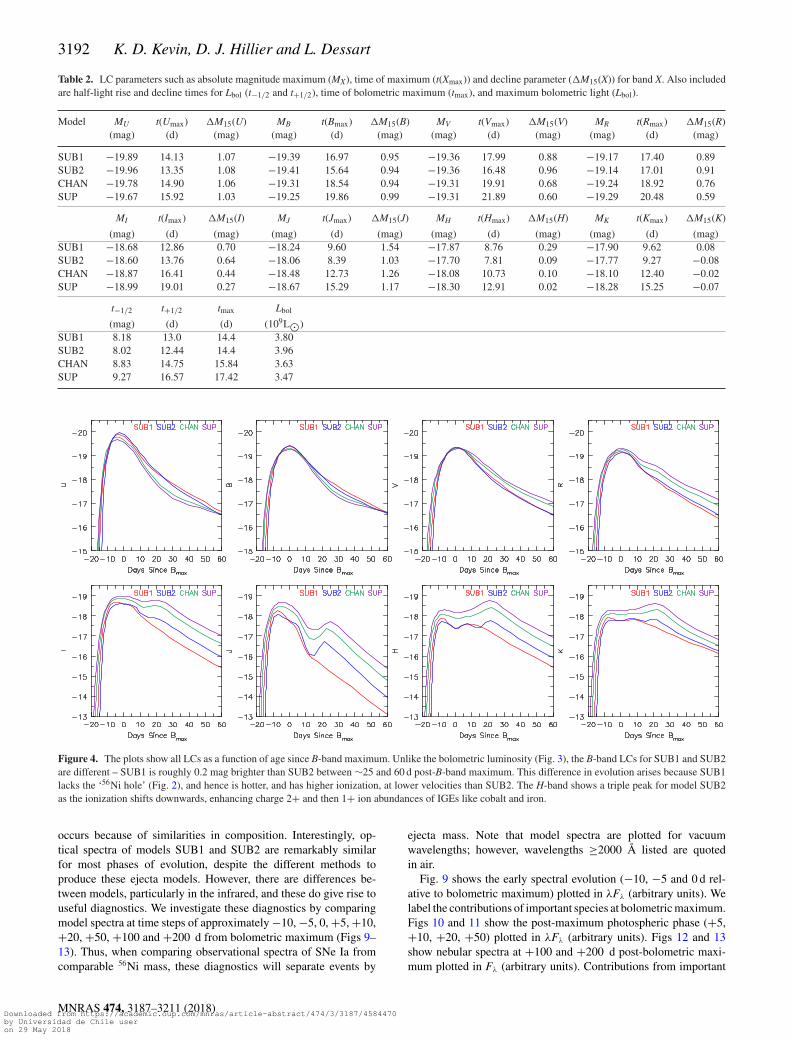
Fig. 4 shows synthetic LCs plotted in days since B-band maxi-mum. The LCs for the two sub-MCh ejecta models tend to be more lu-minous at maximum [with the exception of the near-infrared (NIR)bands] but have fainter nebular luminosities. The former arises be-cause at bolometric maximum Lbol ≈ Ldecay and since the peak isearlier, the decay rate is greater. The latter arises because of the lessefficient trapping of γ -rays. Table 2 also lists the peak LC absolutemagnitudes for different Johnson bands (MU → MK), rise times (indays since explosion), and decline parameter �M15(X) for a givenband X. All bands show a faster rise time for lower-mass ejectamodels, just as they do for Lbol.
Observational evidence suggests that H-band photometry for SNeIa can provide higher accuracy than the B-band calibration galacticdistances (Krisciunas et al. 2004, 2007; Wood-Vasey et al. 2008).However, our models have a spread of almost one magnitude inthe H-band at the time of B-band maximum light. Following thetemperature separation between models (higher mass → coolerejecta), the higher mass ejecta also show larger flux in the H-bandat all epochs. Our LCs still show two peaks in the H-band as normalSNe Ia do, a consequence of the ionization shift in iron (and otherIGEs) going from ionization states 2+ → 1+ (Kasen 2006). Thesecond peak is of the same brightness for our SUB models comparedto higher ejecta mass models. Past the second H-band peak, we seeroughly a constant decline in all models until close to 150 d pastmaximum light.
Fig. 5 shows the U − B, B − V and B − R colour evolutionrelative to B-band maximum. It shows that the lower mass modelsare bluer at most epochs. There is over a magnitude difference inB − R from sub-MCh to super-MCh around 25 d after Bmax. SUBmodels are bluest in colour post-B-band maximum compared tohigher mass models. Post-maximum, model SUP remains the mostred of all the models, while SUB1 remains bluer than other modelsafter +40 d, a result of higher temperatures and ionization due tolarger M(56Ni)/Mej. This is explored in Figs 6 and 7 and then inSection 4 where we discuss the spectral evolution.
Fig. 6 shows the temperature evolution of our models, with SUB1and SUB2 maintaining higher temperatures at all epochs. Fig. 7shows the average ionization for a few IGEs such as iron, cobalt andnickel. SUB models show a higher ionization compared to highermass models, producing ejecta with bluer colours. The monotonictemperature distribution of SUB1 below 5000 km s−1 is due to thelack of a ‘56Ni hole’. Fig. 8 shows the fraction of the energy depo-sition from positrons to the total energy deposition at about 216 dpost-explosion. At late times, SUB1 maintains a higher ionizationin the innermost ejecta due to more assumed local positron energydeposition. Generally speaking, SUB1 and SUB2 have higher tem-peratures at comparable epochs than those of CHAN and SUP. Wefurther discuss the implications of higher temperatures in Section 4.
4 SP E C T R A L D I AG N O S T I C S
Spectra provide important constraints for distinguishing progenitorand explosion models. However, despite a 70 per cent difference inmass, model optical spectra (Figs 9–13) at most phases are similar,consistent with work by Blondin et al. (2013) who concluded thatSNe Ia are mainly distinguished by their 56Ni mass. This similarityis observed for classical SNe Ia where differences in optical spectraare generally rather subtle (Filippenko 1997), which presumably
MNRAS 474, 3187–3211 (2018)Downloaded from https://academic.oup.com/mnras/article-abstract/474/3/3187/4584470by Universidad de Chile useron 29 May 2018

SNe Ia ejecta mass diagnostics 3191
Figure 2. The initial abundance as a function of velocity for carbon, oxygen, silicon, iron, cobalt and nickel for model SUB1 (top left), SUB2 (top right),CHAN (bottom left) and SUP (bottom right). Notice the absence of the ‘56Ni hole’ in model SUB1 (i.e. presence of 56Ni), a result of having lower densitiesduring the initial explosion. Also apparent is the overlap of the nickel distribution with IMEs around 8000–12 000 km s−1 in all models.
Figure 3. The bolometric luminosities for all models as a function of age since explosion. Lower mass models evolve faster in their bolometric LCs comparedwith higher mass models – the lower the ejecta mass, the earlier the time of bolometric maximum (Table 2).
MNRAS 474, 3187–3211 (2018)Downloaded from https://academic.oup.com/mnras/article-abstract/474/3/3187/4584470by Universidad de Chile useron 29 May 2018
3192 K. D. Kevin, D. J. Hillier and L. Dessart
Table 2. LC parameters such as absolute magnitude maximum (MX), time of maximum (t(Xmax)) and decline parameter (�M15(X)) for band X. Also includedare half-light rise and decline times for Lbol (t−1/2 and t+1/2), time of bolometric maximum (tmax), and maximum bolometric light (Lbol).
Model MU t(Umax) �M15(U) MB t(Bmax) �M15(B) MV t(Vmax) �M15(V) MR t(Rmax) �M15(R)(mag) (d) (mag) (mag) (d) (mag) (mag) (d) (mag) (mag) (d) (mag)
SUB1 −19.89 14.13 1.07 −19.39 16.97 0.95 −19.36 17.99 0.88 −19.17 17.40 0.89SUB2 −19.96 13.35 1.08 −19.41 15.64 0.94 −19.36 16.48 0.96 −19.14 17.01 0.91CHAN −19.78 14.90 1.06 −19.31 18.54 0.94 −19.31 19.91 0.68 −19.24 18.92 0.76SUP −19.67 15.92 1.03 −19.25 19.86 0.99 −19.31 21.89 0.60 −19.29 20.48 0.59
MI t(Imax) �M15(I) MJ t(Jmax) �M15(J) MH t(Hmax) �M15(H) MK t(Kmax) �M15(K)
(mag) (d) (mag) (mag) (d) (mag) (mag) (d) (mag) (mag) (d) (mag)SUB1 −18.68 12.86 0.70 −18.24 9.60 1.54 −17.87 8.76 0.29 −17.90 9.62 0.08SUB2 −18.60 13.76 0.64 −18.06 8.39 1.03 −17.70 7.81 0.09 −17.77 9.27 −0.08CHAN −18.87 16.41 0.44 −18.48 12.73 1.26 −18.08 10.73 0.10 −18.10 12.40 −0.02SUP −18.99 19.01 0.27 −18.67 15.29 1.17 −18.30 12.91 0.02 −18.28 15.25 −0.07
t−1/2 t+1/2 tmax Lbol
(mag) (d) (d) (109L�)SUB1 8.18 13.0 14.4 3.80SUB2 8.02 12.44 14.4 3.96CHAN 8.83 14.75 15.84 3.63SUP 9.27 16.57 17.42 3.47
Figure 4. The plots show all LCs as a function of age since B-band maximum. Unlike the bolometric luminosity (Fig. 3), the B-band LCs for SUB1 and SUB2are different – SUB1 is roughly 0.2 mag brighter than SUB2 between ∼25 and 60 d post-B-band maximum. This difference in evolution arises because SUB1lacks the ‘56Ni hole’ (Fig. 2), and hence is hotter, and has higher ionization, at lower velocities than SUB2. The H-band shows a triple peak for model SUB2as the ionization shifts downwards, enhancing charge 2+ and then 1+ ion abundances of IGEs like cobalt and iron.
occurs because of similarities in composition. Interestingly, op-tical spectra of models SUB1 and SUB2 are remarkably similarfor most phases of evolution, despite the different methods toproduce these ejecta models. However, there are differences be-tween models, particularly in the infrared, and these do give rise touseful diagnostics. We investigate these diagnostics by comparingmodel spectra at time steps of approximately −10, −5, 0, +5, +10,+20, +50, +100 and +200 d from bolometric maximum (Figs 9–13). Thus, when comparing observational spectra of SNe Ia fromcomparable 56Ni mass, these diagnostics will separate events by
ejecta mass. Note that model spectra are plotted for vacuumwavelengths; however, wavelengths ≥2000 Å listed are quotedin air.
Fig. 9 shows the early spectral evolution (−10, −5 and 0 d rel-ative to bolometric maximum) plotted in λFλ (arbitrary units). Welabel the contributions of important species at bolometric maximum.Figs 10 and 11 show the post-maximum photospheric phase (+5,+10, +20, +50) plotted in λFλ (arbitrary units). Figs 12 and 13show nebular spectra at +100 and +200 d post-bolometric maxi-mum plotted in Fλ (arbitrary units). Contributions from important
MNRAS 474, 3187–3211 (2018)Downloaded from https://academic.oup.com/mnras/article-abstract/474/3/3187/4584470by Universidad de Chile useron 29 May 2018

SNe Ia ejecta mass diagnostics 3193
Figure 5. The U − B, B − V and B − R colours relative to B-band maximum. Models SUB1 and SUB2 show bluer colours for all epochs. Ten days beforeB-band maximum all models have similar colours. As the ejecta ages, differences in the B − R colour become much larger – at B-band maximum, the B − Rcolour differs by ∼0.3 mag between SUB2 and SUP, while at later epochs the colour difference between SUB1 and SUP can be in excess of 1 mag.
Figure 6. Temperature evolution as a function of velocity for models SUB1, SUB2, CHAN and SUP at epochs −10, +0, +20 and +200 d relative tobolometric maximum. SUB1 exhibits higher temperatures at low velocities compared to SUB2, CHAN and SUP – the higher temperature arises because of themuch higher 56Ni abundance in the innermost ejecta of SUB1 (Fig. 2).
MNRAS 474, 3187–3211 (2018)Downloaded from https://academic.oup.com/mnras/article-abstract/474/3/3187/4584470by Universidad de Chile useron 29 May 2018

3194 K. D. Kevin, D. J. Hillier and L. Dessart
Figure 7. Average ionization state for bolometric maximum (left) and 216 d post-explosion (right) for IGEs. The average ionization is defined as the totalnumber of free electrons from each species divided by the total species population. At bolometric maximum, the average ionization rises beyond 20 000 km s−1
due to the low densities inhibiting recombination. The average ionization state is higher for sub-MCh models, a result of more heating per unit mass. At nebulartimes, SUB1 remains at a higher average ionization in the inner region due to a larger deposition of energy by positrons arising from the higher 56Co massfraction in the inner region (see Fig. 8).
Figure 8. Ratio of the locally deposited energy from positrons (mainly from56Co) to the energy deposited by nuclear decays in the ejecta at about 216 dpost-explosion. SUB1 shows a much higher ratio shortward of 5000 km s−1
due to the lack of a ‘56Ni hole’ and higher 56Ni production in the core. Thisleads to higher ionization and a higher temperature in the inner region (incombination with lower densities) compared to other models.
species are labelled. Notice the transition towards predominantlyforbidden lines in nebular spectra. These figures are used to high-light important diagnostics.
4.1 [Ni II] 1.939 µm
In SNe Ia, the nickel abundance is sensitive to the progenitor massand/or explosion scenario. In 1D explosion modelling, higher cen-tral densities have higher neutronization that leads to more sta-ble 58Ni being produced during nuclear burning (Nomoto 1984;Khokhlov 1991a,b). This 1D modelling implies that sub-MCh SNeIa will show a lower abundance of 58Ni compared to MCh SNeIa (for the same 56Ni mass). However, 3D DDT modelling sug-gests that the 56Ni hole predicted in 1D MCh WD DDT modelsmay be absent, and both 56Ni and 58Ni extend from the lowest
velocities to about 10 000 km s−1(Kasen, Ropke & Woosley 2009;Seitenzahl et al. 2013). 22Ne settling in sub-MCh has also beenproposed as a way to enhance the neutronization; however, thetime-scale for gravitational settling can be ∼109–1010 yr (Bildsten& Hall 2001). Therefore, nickel diagnostics, particularly at nebulartimes, may constrain the progenitor scenario, nucleosynthesis, andexplosion mechanism (Woosley 1997; Iwamoto et al. 1999; Stehleet al. 2005; Mazzali & Podsiadlowski 2006; Gerardy et al. 2007;Maeda et al. 2010; Mazzali et al. 2011; Mazzali & Hachinger 2012;Mazzali et al. 2015). At nebular times, most of the 56Ni will have de-cayed, and any nickel emission features are due to stable nickel, andin particular 58Ni and 60Ni, which are expected to be underabun-dant in (1D) sub-MCh DDT models compared with MCh models.The width of any observed nebular nickel feature will constrainthe hydrodynamic width of the emitting region, thus testing modelpredictions about the presence of a 56Ni hole. Therefore, nickelfeatures may offer the best diagnostic for ejecta masses belowMCh if ejecta do or do not have 56Ni holes as predicted by 1Dmodelling.
In the optical nebular spectra at +100 and +200 d(Figs 12 and 13), the [Ni II] λλ7378,7412 lines are blended,and hence not very useful for abundance determinations.However, in the NIR there is a forbidden [Ni II] transition(3d8(3F)4s2 F7/2 − 3d8(3F)4s4 F9/2) at 1.939 μm which in oursynthetic spectra is relatively blend free. It overlaps with telluriclines in low-redshift SNe, but higher redshift (z > 0.08) SNe avoidtelluric absorption. While observations of this line appear to berare, Friesen et al. (2014) find evidence for this line in spectra ofSN2011fe, SN2014J and SN2003du.
In our models, SUB1 shows no evidence of [Ni II] 1.939 µm.On the other hand, SUB2, CHAN and SUP show the line, witha strength that correlates with ejecta mass. The absence of [Ni II]1.939 µm in SUB1 arises from two effects — SUB1 has a smalleramount of stable nickel (see Table 1) and a higher ionization thanthe other models. The presence of 56Co under ∼3000 km s−1 inSUB1 means that there is a great amount of heating from positrons,which deposit their energy locally (Fig. 8). This, combined with thelower densities, leads to both a higher temperature, and a higherionization (Figs 6 and 7). Surprisingly, and despite their similar
MNRAS 474, 3187–3211 (2018)Downloaded from https://academic.oup.com/mnras/article-abstract/474/3/3187/4584470by Universidad de Chile useron 29 May 2018
SNe Ia ejecta mass diagnostics 3195
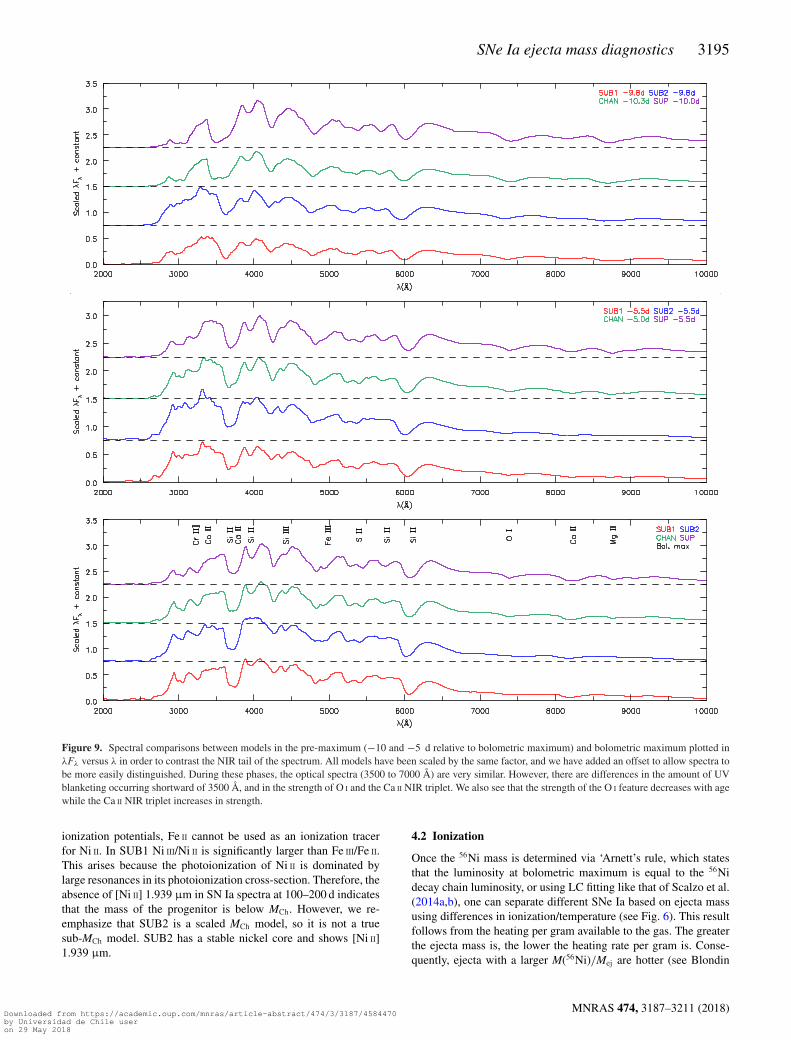
Figure 9. Spectral comparisons between models in the pre-maximum (−10 and −5 d relative to bolometric maximum) and bolometric maximum plotted inλFλ versus λ in order to contrast the NIR tail of the spectrum. All models have been scaled by the same factor, and we have added an offset to allow spectra tobe more easily distinguished. During these phases, the optical spectra (3500 to 7000 Å) are very similar. However, there are differences in the amount of UVblanketing occurring shortward of 3500 Å, and in the strength of O I and the Ca II NIR triplet. We also see that the strength of the O I feature decreases with agewhile the Ca II NIR triplet increases in strength.
ionization potentials, Fe II cannot be used as an ionization tracerfor Ni II. In SUB1 Ni III/Ni II is significantly larger than Fe III/Fe II.This arises because the photoionization of Ni II is dominated bylarge resonances in its photoionization cross-section. Therefore, theabsence of [Ni II] 1.939 µm in SN Ia spectra at 100–200 d indicatesthat the mass of the progenitor is below MCh. However, we re-emphasize that SUB2 is a scaled MCh model, so it is not a truesub-MCh model. SUB2 has a stable nickel core and shows [Ni II]1.939 µm.
4.2 Ionization
Once the 56Ni mass is determined via ‘Arnett’s rule, which statesthat the luminosity at bolometric maximum is equal to the 56Nidecay chain luminosity, or using LC fitting like that of Scalzo et al.(2014a,b), one can separate different SNe Ia based on ejecta massusing differences in ionization/temperature (see Fig. 6). This resultfollows from the heating per gram available to the gas. The greaterthe ejecta mass is, the lower the heating rate per gram is. Conse-quently, ejecta with a larger M(56Ni)/Mej are hotter (see Blondin
MNRAS 474, 3187–3211 (2018)Downloaded from https://academic.oup.com/mnras/article-abstract/474/3/3187/4584470by Universidad de Chile useron 29 May 2018

3196 K. D. Kevin, D. J. Hillier and L. Dessart
Figure 10. Spectral comparisons between models in the post-maximum phases (+5 and +10 d) relative to bolometric maximum plotted in λFλ versus λ
space in order to contrast the NIR tail of the spectrum. In each plot, all models have been scaled by the same value, and we have added a multiple of the offsetto more easily distinguish the models. The optical spectra is again similar showing still the strong Si II doublet at ∼6100 Å. The UV spectrum shows strongerblanketing in higher mass models. The strength of the Ca II NIR triplet deviates between the models, showing stronger absorption/emission in the cooler (highermass) models.
et al. 2017) for edecay ≡ Ldecay/Mtot. Indeed, our models indicatethat low-mass WD models, for a given 56Ni mass, maintain higherionizations throughout their spectral evolution.
4.2.1 UV blanketing
Previous studies focused on the UV variability and used the UVspectral region for understanding SNe Ia. These studies looked atthe role of metallicity on UV blanketing (Lentz et al. 2000; Walkeret al. 2012; Wang et al. 2012; Foley & Kirshner 2013), finding thatlower metallicities shift the blanketing blueward. Foley et al. (2016)looked at a sample of SNe Ia and found the UV diversity linearlycorrelates with the optical LC shape. In particular, the strength ofUV line flux measurements (∼2030 and 2535 Å) increases withincreasing �m15(B). Other studies of UV variation hope to use itas a cosmological utility (Ellis et al. 2008; Sullivan et al. 2009) toimprove standardizability. Therefore, understanding how Mej for agiven 56Ni mass influences the UV spectrum is important to theastronomical community.
Until the ejecta begins entering its nebular phase (∼100 d), wesee larger UV blanketing shortward of 4000 Å for larger massejecta. This effect is attributed to a temperature difference betweenmodels. We see in Figs 6 and 7 that below 25 000 km s−1modelswith higher temperatures have higher ionizations, seen as a shift
in the line blanketing to higher frequencies. Pre-maximum spectrashow the Ca II feature (H & K lines near λ3500) is affected by UVblanketing, making it difficult to distinguish in SUP and CHAN(Fig. 9). Ti II contributes to much of the blanketing more than 5 dbefore maximum, while Ti II, Fe II and Fe III shape the UV spectrajust prior to maximum. Around maximum, Co II contributes muchof the UV blanketing (below 3500 Å) with the strongest blanketingoccurring in model SUP. Looking inwards of 25 000 km s−1, SUB1and SUB2 show a higher ionization of cobalt than that of modelsSUP and CHAN. For Co II there is about a half dex difference inionization between SUB1 and SUP. These Co II differences show upas absorption affecting the slope of the feature at ∼3500 Å. Post-maximum (Figs 10 and 11), there is less variation in UV blanketingbetween the models.
If we compare the peak fluxes at bolometric maximum (Fig. 9)of three UV features (namely the features near ∼2850, ∼3150and ∼3550 Å), we can characterize the level of blanketing bycomparing the flux at peak in each feature. For all ejecta mod-els, the flux ratio F(3150)/F(2850) is close to unity (0.93, 1.07,1.03 and 1.11 for SUB1, SUB2, CHAN and SUP). However,comparing these lines to the feature just short of the Ca II H&Kand Si II ∼λ3660 Å absorption profile, we see that the flux ratioF(3550)/F(2850) is strongly dependent on ejecta mass. This fluxratio F(3550)/F(2850) is 0.99, 1.01, 1.20 and 1.75 for SUB1, SUB2,CHAN and SUP. These UV features reflect the temperature and
MNRAS 474, 3187–3211 (2018)Downloaded from https://academic.oup.com/mnras/article-abstract/474/3/3187/4584470by Universidad de Chile useron 29 May 2018

SNe Ia ejecta mass diagnostics 3197
Figure 11. Spectral comparisons between models in the post-maximum phases at roughly +20 and +50 d relative to bolometric maximum. Each separate plotshows spectra scaled by the same value. At around +20 d, we continue to see a relatively homogeneous class of objects in the optical but stronger differencesemerge in the NIR, such as the strength of the Ca II NIR triplet and the growth of Fe II and Co II lines – see Section 4.2.2. Despite the lack of Fe II and Co II
features in SUB1 (a consequence of having lower densities and higher temperatures/ionization in the inner ejecta), spectra of SUB1 and SUB2 are still fairlysimilar.
MNRAS 474, 3187–3211 (2018)Downloaded from https://academic.oup.com/mnras/article-abstract/474/3/3187/4584470by Universidad de Chile useron 29 May 2018
3198 K. D. Kevin, D. J. Hillier and L. Dessart
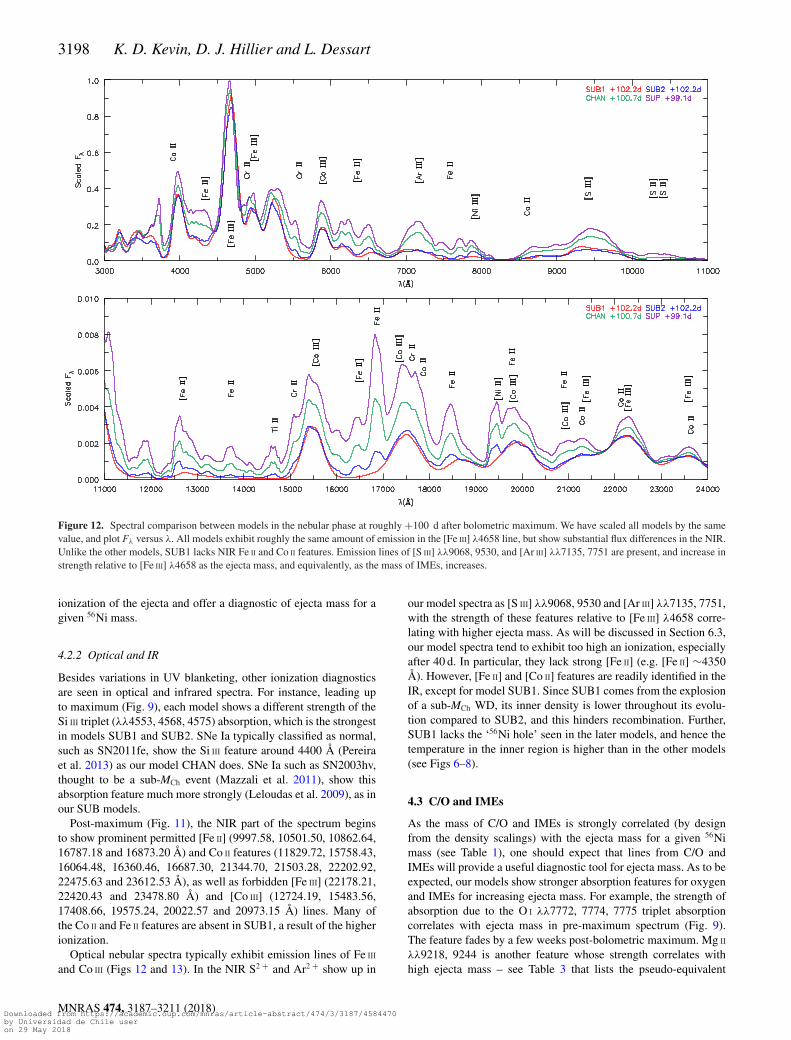
Figure 12. Spectral comparison between models in the nebular phase at roughly +100 d after bolometric maximum. We have scaled all models by the samevalue, and plot Fλ versus λ. All models exhibit roughly the same amount of emission in the [Fe III] λ4658 line, but show substantial flux differences in the NIR.Unlike the other models, SUB1 lacks NIR Fe II and Co II features. Emission lines of [S III] λλ9068, 9530, and [Ar III] λλ7135, 7751 are present, and increase instrength relative to [Fe III] λ4658 as the ejecta mass, and equivalently, as the mass of IMEs, increases.
ionization of the ejecta and offer a diagnostic of ejecta mass for agiven 56Ni mass.
4.2.2 Optical and IR
Besides variations in UV blanketing, other ionization diagnosticsare seen in optical and infrared spectra. For instance, leading upto maximum (Fig. 9), each model shows a different strength of theSi III triplet (λλ4553, 4568, 4575) absorption, which is the strongestin models SUB1 and SUB2. SNe Ia typically classified as normal,such as SN2011fe, show the Si III feature around 4400 Å (Pereiraet al. 2013) as our model CHAN does. SNe Ia such as SN2003hv,thought to be a sub-MCh event (Mazzali et al. 2011), show thisabsorption feature much more strongly (Leloudas et al. 2009), as inour SUB models.
Post-maximum (Fig. 11), the NIR part of the spectrum beginsto show prominent permitted [Fe II] (9997.58, 10501.50, 10862.64,16787.18 and 16873.20 Å) and Co II features (11829.72, 15758.43,16064.48, 16360.46, 16687.30, 21344.70, 21503.28, 22202.92,22475.63 and 23612.53 Å), as well as forbidden [Fe III] (22178.21,22420.43 and 23478.80 Å) and [Co III] (12724.19, 15483.56,17408.66, 19575.24, 20022.57 and 20973.15 Å) lines. Many ofthe Co II and Fe II features are absent in SUB1, a result of the higherionization.
Optical nebular spectra typically exhibit emission lines of Fe III
and Co III (Figs 12 and 13). In the NIR S2 + and Ar2 + show up in
our model spectra as [S III] λλ9068, 9530 and [Ar III] λλ7135, 7751,with the strength of these features relative to [Fe III] λ4658 corre-lating with higher ejecta mass. As will be discussed in Section 6.3,our model spectra tend to exhibit too high an ionization, especiallyafter 40 d. In particular, they lack strong [Fe II] (e.g. [Fe II] ∼4350Å). However, [Fe II] and [Co II] features are readily identified in theIR, except for model SUB1. Since SUB1 comes from the explosionof a sub-MCh WD, its inner density is lower throughout its evolu-tion compared to SUB2, and this hinders recombination. Further,SUB1 lacks the ‘56Ni hole’ seen in the later models, and hence thetemperature in the inner region is higher than in the other models(see Figs 6–8).
4.3 C/O and IMEs
As the mass of C/O and IMEs is strongly correlated (by designfrom the density scalings) with the ejecta mass for a given 56Nimass (see Table 1), one should expect that lines from C/O andIMEs will provide a useful diagnostic tool for ejecta mass. As to beexpected, our models show stronger absorption features for oxygenand IMEs for increasing ejecta mass. For example, the strength ofabsorption due to the O I λλ7772, 7774, 7775 triplet absorptioncorrelates with ejecta mass in pre-maximum spectrum (Fig. 9).The feature fades by a few weeks post-bolometric maximum. Mg II
λλ9218, 9244 is another feature whose strength correlates withhigh ejecta mass – see Table 3 that lists the pseudo-equivalent
MNRAS 474, 3187–3211 (2018)Downloaded from https://academic.oup.com/mnras/article-abstract/474/3/3187/4584470by Universidad de Chile useron 29 May 2018

SNe Ia ejecta mass diagnostics 3199
Figure 13. Spectral comparison between models in the nebular phase at roughly +200 d after bolometric maximum. We have scaled all models by the samevalue, and plot Fλ versus λ. As at 100 d, SUB1 shows no prominent [Fe II] or [Co II] lines. Further, spectra of SUB1 in the J and H bands are now substantiallydifferent from those of SUB2. The [S III] λλ9068, 9530 and the [Ar III] λλ7135, 7751 features have increased in strength relative to [Fe III] λ4658. The broademission feature covering 7000 through 7500 Å is a blend of [Ar III] λ7135, [Ni II] λ7378 and [Ca II] λλ7291, 7324.
Table 3. Approximate pEW (Å) based on a straight line across the profileof the absorption feature.
Model Si II λ5750 Si II λ6100 O I λ7400 Mg II λ8700
SUB1 10 139 17 �1SUB2 8 160 9 ∼1CHAN 20 156 32 32SUP 30 158 50 53
widths (pEWs) measured by a straight line across the maxima of theabsorption profile; it also fades within a few weeks post-bolometricmaximum.
Si IIλλ5958, 5979, observed roughly around ∼λ5750, is a spec-troscopic classification diagnostic for SNe Ia (R(Si) ≡ pEW(Si II
λ5750)/pEW(Si II λ6100)) and, like other IME features, its strengthcorrelates with ejecta mass. Table 3 highlights the correlation ofpEWs of various features with ejecta mass of our models. Post-maximum (Figs 10 and 11), we see the strength of the emissionincrease, giving a large morphological separation between mod-els. Calcium (as Ca II) also shows the same behaviour as Si II. Theabsorption and emission strength of the Ca II NIR triplet distin-guishes models throughout the spectral evolution. We find that thestrength of this feature correlates with ejecta mass. We further dis-cuss the Ca II NIR triplet and the Si II λλ6347, 6371 doublet inSection 6.1.
5 E X P L O S I O N S C E NA R I O : S U B 1 V E R S U SSUB2
Since the explosion process and progenitor system are unknown, wehighlight and summarize useful diagnostics for distinguishing ourmodels of the same Mej. As mentioned earlier, SUB1 comes from adetonation model of a sub-MCh WD, while SUB2 comes from theDDT of a MCh WD, which was scaled in density to have the samemass as SUB1 and the same 56Ni mass. Since SUB1 was detonatedas a sub-MCh WD, it had lower densities when exploded compared toSUB2 and lacks the ‘56Ni hole’. Without the ‘56Ni hole’, SUB1 hasa larger (assumed) local deposition fraction from decay positronscompared to the total decay energy deposition (Fig. 8) for velocitiesless than 5000 km s−1. This keeps the inner region of SUB1 hotterthan SUB2, which shows stronger features of higher ionizationstates of IGEs as the ejecta evolves past the photospheric phase andexposes the inner iron-rich material. At nebular times, the strengthof [Ni II] 1.939 µm gives a clear distinction between SUB1 andSUB2, as lower density ejecta model SUB1 does not show thisfeature.
Up to maximum light, SUB1 and SUB2 possess very similar spec-tra (Fig. 9), especially in the optical. However, as the photospherebegins to recede inwards, differences are seen in the NIR – Fe II
and Co II features are absent in SUB1 but present in SUB2 (Figs 10and 11). Below 5000 km s−1, the densities in SUB1 are roughly afactor of 3 lower than in SUB2. Further, SUB1 has a larger fractionof local radioactive heating from positrons. These factors inhibit
MNRAS 474, 3187–3211 (2018)Downloaded from https://academic.oup.com/mnras/article-abstract/474/3/3187/4584470by Universidad de Chile useron 29 May 2018

3200 K. D. Kevin, D. J. Hillier and L. Dessart
Figure 14. Normalized flux (according to equation 1 between 5800 and 6500 Å) of the Si II λλ6347, 6371 doublet relative to bolometric maximum plotted invelocity space shifted relative to λ6355. Note the lack of Si II HVFs. A vertical line at −15 000 km s−1 is included as a reference.
recombination and a higher ionization persists in SUB1 comparedto SUB2. The NIR region is potentially the best diagnostic for theionization state of the ejecta in SNe Ia (shown in Figs 12 and 13).
This higher ionization, seen in post-maximum spectra (Figs 10and 11), yields lower fluxes in the NIR. We see roughly half amagnitude difference in the post-maximum I, J and H bands. How-ever, the magnitude difference between J and H grows to ∼2 magdifference by 200 d post-maximum.
6 A D D I T I O NA L I N V E S T I G ATI O N S
In this section, we present additional investigations of our ejectamodels focusing on HVFs and comparisons to observational data.We also explore shortcomings with our ejecta models.
6.1 High velocity features – Si II and Ca II
HVFs are absorption features, seen in the strongest lines, that showa distinct difference in velocity (often early and prior to maximum),by more than a few thousand km s−1 from the lower velocity, pho-tospheric component (Gerardy et al. 2004; Mazzali et al. 2005a,b).Note the two strongest components of the Ca II NIR triplet (λ8542 &λ8662) are separated by ∼4000 km s−1. Thus, any single Ca II NIRprofile may show an absorption feature with two components sep-arated by a few thousand km s−1 that is different from an HVF.In many SNe Ia, HVFs have even been observed at maximumfor the Ca II NIR triplet but not for Si II λλ6347, 6371 (Childresset al. 2014). There is no clear indication when HVFs start to dis-appear in all observed cases. Silverman et al. (2015) state that theHVF Ca II triplet begins to disappear around −1 d prior to maxi-mum for �M15(B) = 1.4–1.6 mag; however, discoveries of HVFs
are potentially biased towards those that persist closer to maximumlight.
Shown in Figs 14 and 15 is the evolution of the Si II doubletand the Ca II NIR triplet, with a vertical line at −15 000 km s−1 asa reference. In all models, Ca II HVFs are seen before bolometricmaximum (� − 11 d). However, no HVF for Si II λλ6347, 6371 isseen. Notice the striking difference in the pre-maximum Ca II tripletprofile (� − 11 d) and the profile at later dates. The lack of a Si II
doublet HVF could just be a by-product of atomic physics. Althoughboth the Ca II NIR triplet and the Si II doublet are not resonancetransitions, the lower level of the Ca II triplet is metastable. The lowerlevel of the Si II λ6355 doublet is the 4s state that is coupled to theground state by a permitted transition. Therefore, when compared tothe Si II λ6355 doublet, the Ca II NIR triplet persists longer becausethe metastable lower level population persists longer.
By defining a straight line between the maxima on either side ofthe absorption profiles of these Si II features, we are able to computeour models’ pEWs (listed in Table 3). Comparing our work to fig.8 of Blondin et al. (2012), we find our spectra are clustered aroundthose labelled broad-lined Ia as seen in Fig. 16. Branch et al. (2006)looked at the pEWs of Si II features near λ6100 and λ5750 in thesespectra at maximum in order to group these spectra in different clas-sifications: ‘core-normal, ‘broad-line’, ‘shallow-silicon’ and ‘cool’.For the most massive model (SUP), it might fall under the ‘cool’classification from Branch et al. (2006), but it lacks the strong Ti II
absorption.
6.2 Comparison to data
Here, we present both LC and spectral comparisons to data for aspan of spectral epochs. We focus on SNe Ia that have claimed 56Nimasses similar to that of our models (0.6 M�) or similar �m15(B)
MNRAS 474, 3187–3211 (2018)Downloaded from https://academic.oup.com/mnras/article-abstract/474/3/3187/4584470by Universidad de Chile useron 29 May 2018

SNe Ia ejecta mass diagnostics 3201
Figure 15. Normalized flux (according to equation 1 between 7000 and 9000 Å) of the Ca II triplet relative to bolometric maximum plotted in velocity spaceshifted relative to λ8662. Note prior to �−11 d, HVFs are present without a photospheric component. After the HVF disappears, the photospheric componentbecomes visible. A vertical line at −15 000 km s−1 is included as a reference.
Figure 16. Plot of the pEWs of the Si II λ6355 and λ5972 features along withthe data from Blondin et al. (2012). CN, BL, SS and CL correspond to ‘corenormal’, ‘broad line’, ‘shallow silicon’ and ‘cool’ classifications defined byBranch et al. (2006). Our models lie clustered near the BL classification.
and those tagged as sub-MCh (SN2005el), MCh (SN1995D) andsimilar Branch types (SN2001ay). We used the SN identificationprogramme SNID (Blondin & Tonry 2007) on models at bolomet-ric maximum to find additional SNe Ia to compare (SN1994ae).The spectra are taken from the CfA Supernova Archive (Blondinet al. 2012). Archived LC photometry is taken from Open Super-nova Catalog (Guillochon et al. 2017). When comparing models to
observations, the spectra are normalized between λmin=4000 Å andλmax=7000 Å, such that
1
λmax − λmin
∫ λmax
λmin
Fλdλ = 1 erg cm−2 s−1 Å−1. (1)
Normalizing spectra allow us to better compare spectral features,removes uncertainties in distance and compensates for small dif-ferences in 56Ni mass. To compare LCs, we correct for extinctionusing the CCM reddening law (Cardelli, Clayton & Mathis 1989)and literature E(B − V) and RV values. We normalize the LCsby adding a constant offset (model and object dependent), suchthat Bmax = 0 mag at t(Bmax). We also shift the LCs so that time ofB-band maxima agree. Thus, uncertainties in distance and explosiontime are reduced. A constant value of 0.05 mag is included with thephotometric error bars for uncertainty in reddening. K-corrections,expected to be small, have not been applied. Photometric band mag-nitudes and bolometric luminosities of the models at maximum areprovided in Table 2.
6.2.1 SN1994ae
SN1994ae exploded in NGC 3370 (z = 0.0043 – Riess et al. 1999;Jha, Riess & Kirshner 2007) and was first discovered on 1994November 14 by van Dyk et al. (1994). It reached B-band maximum(mB = 13.21 mag) on MJD 49685.5 with �m15(B) = 0.96 mag(Riess et al. 1999; Jha et al. 2007). For comparison, we reddenedour models using E(B − V) = 0.0226 mag and RV = 3.1 (Jhaet al. 2007). Fig. 17 shows the spectral comparison of SN1994ae at
MNRAS 474, 3187–3211 (2018)Downloaded from https://academic.oup.com/mnras/article-abstract/474/3/3187/4584470by Universidad de Chile useron 29 May 2018

3202 K. D. Kevin, D. J. Hillier and L. Dessart
Figure 17. SN1994ae compared to our models at epochs +0.0, +10.0, and +152.7 d relative to B-band maximum, which occurred on MJD 49685.5. Forcomparison, we reddened our models using E(B − V) = 0.0226 mag and RV = 3.1 (Jha et al. 2007). All fluxes have been normalized between 4000 and 7000Å according to equation (1). The observational data were taken from public CfA data (https://www.cfa.harvard.edu/supernova/SNarchive.html). At +0 d, wesee that our model spectra do not reproduce the velocity of the Si II λ6347, 6371 doublet and the UV Si II triplet. The spectra show evidence of the Si III triplet(λλ4553, 4568, 4575) absorption as do our SUB models (an indication of high ionization). Spectra at later epochs indicate cooler ejecta and model SUP isclosest to reproducing the features. However, at nebular times (+152.7 d), our model optical Fe III lines appear too strong and the [S III] λλ9068, 9530 linesappear to be absent in observed spectra.
MNRAS 474, 3187–3211 (2018)Downloaded from https://academic.oup.com/mnras/article-abstract/474/3/3187/4584470by Universidad de Chile useron 29 May 2018

SNe Ia ejecta mass diagnostics 3203
Figure 18. SN1994ae multiband LCs normalized to Bmax and corrected for reddening (see Section 6.2.1). Our B-band LC agrees until 20 d post-maximum.Afterwards, our LCs show roughly half a magnitude more flux. The V/R-band LC agrees with our model CHAN. Our models disagree with observations inthe location of the I-band’s second peak and more so for models with lower ejecta mass. Archived LC photometry is taken from Open Supernova Catalog(Guillochon et al. 2017), with references from the CfA Supernova Archive (https://www.cfa.harvard.edu/supernova/SNarchive.html) and (Riess et al. 2005).
+0.0, +10.0 and +152.7 d after B-band maximum and normalizedLCs relative to band maximum are shown in Fig. 18.
At +0 d, our model spectra do not reproduce the velocity of theSi II λ6355 doublet and UV Si II triplet. Results by Dessart et al.(2014a) suggest SNe Ia resulting from pulsational-delayed detona-tions (PDD) retain more unburnt carbon and have little mass at highvelocity (�15 000 km s−1) due to pulsations. Therefore, spectralfeatures of SN1994ae might be best explained by PDD modelling,and would resemble similar radiative properties of DDT models.The spectra also show evidence of the Si III triplet (λλ4553, 4568,4575) absorption as in our SUB models (an indication of high ion-ization). Later spectra show cooler ejecta and model SUP is closestto reproducing the features. However, at nebular times (+152.7 d)our model optical [Fe III] lines appear too strong and [S III] λλ9068,9530 are absent in the observational data.
For the LC comparison, we shifted the LCs to give the same timeof Bmax and reddened the models with AB = 0.091, AV = 0.070, AR =0.057 and AI = 0.041 mag, obtained using E(B − V) = 0.0226 magand RV = 3.1 from Jha et al. (2007). We normalized the LCs to 0 magat Bmax and shifted the observational data by 12.98 mag. We see inFig. 18 that our B-band LC is consistent until 20 d post-maximum,where our LCs begin showing roughly half a magnitude more flux.Model CHAN matches well the V/R-band observations. However,our models fail to reproduce the second peak in the I-band, and thedisagreement is greater in lower mass models.
6.2.2 SN1995D
SN1995D exploded in NGC 2962 and was discovered on 1995February 10 (Nakano, Kushida & Kushida 1995). Its redshift isz = 0.0067, and it reached B-band maximum (mB = 13.44 mag) onMJD 49768.7 (Riess et al. 1999; Jha et al. 2007). SN1995D hasbeen argued as having a 56Ni mass of about 0.58 M� and an ejectamass around 1.45 M� (Childress et al. 2015). For comparison, wereddened our models using E(B − V) = 0.026 mag and RV = 3.1(Jha et al. 2007).
Fig. 19shows the spectral comparison of SN1995D at +3.6,+42.5 and +93.5 d after B-band maximum. The early epochs (+3.6d) show good qualitative agreement with SUB1 except our modelshows a larger blueshifted Si II doublet. This may be best explainedby a PDD model (Dessart et al. 2014a). SUB1 also matches theUV spectrum shortward of 4000 Å. At later epochs like +42.5 and+93.5 d, we see a better agreement to model SUP and to CHAN,due to lower temperatures and ionization. Roughly all features at+93.5 d are matched by SUP. Despite the calculated 56Ni and ejecta
mass being closest to CHAN, SN1995D shows only moderate quali-tative agreement at later epochs. SN1995D transitions from lookinglike our SUB1 into that of SUP from early to late epochs.
To compare LCs, we shifted the LCs to give the same time ofBmax and reddened the models with AB = 0.106, AV = 0.081, AR =0.066 and AI = 0.048 mag, obtained using E(B − V) = 0.026 magand RV = 3.1 (Jha et al. 2007). We normalized the LCs to 0 mag atBmax and shift the observational data by 13.35 mag.
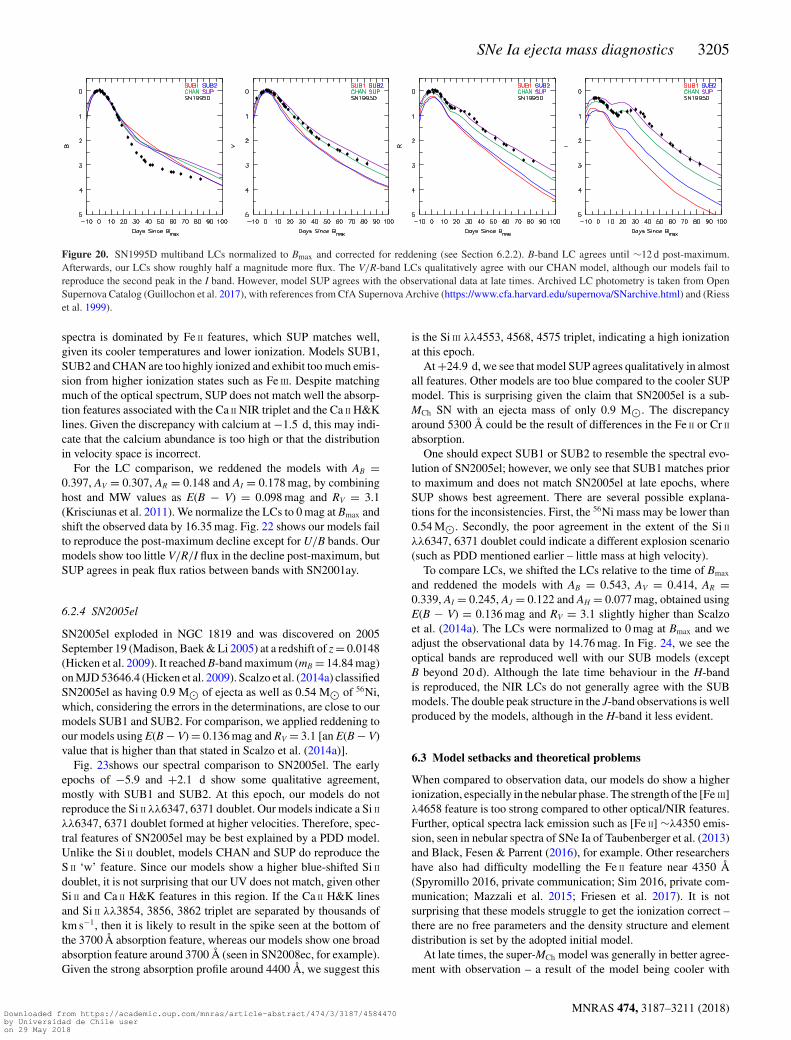
In Fig. 20, we see that our B-band LC is consistent with all mod-els until ∼12 d post-maximum, where our LCs then begin showingroughly half a magnitude more flux. Model CHAN matches wellthe V/R-band observations. Our models fail to reproduce the sec-ond peak in the I band (it occurs 10–20 d too early), although theSUP model matches the data at late times. Model SUP also seemsconsistent with the peak flux ratios in SN1995D.
6.2.3 SN2001ay
SN2001ay exploded outside IC 4423 and was discovered on 2001April 18 by Swift, Li & Schwartz (2001). Krisciunas et al. (2011)and references therein cite its redshift as z = 0.0302 and indicatethat it reached B-band maximum (MB = −19.19 mag) on 23 April2001. For spectral comparison, we reddened our model spectrausing E(B − V)MW = 0.026 mag, E(B − V)host = 0.072 mag, andRV = 3.1 (Krisciunas et al. 2011). Krisciunas et al. (2011) statesa M(56Ni) of (0.58 ± 0.15)/α M�, for an α = Lmax/ENi, typicallybetween 1 and 1.2. Given the close proximity between the estimated56Ni mass for SN2001ay and that of our model set, we explore thespectral similarities.
Fig. 21shows the spectral comparison for epochs −1.5, +9.3 and+56.3 d relative to B-band maximum. All models provide a goodqualitative fit to the optical spectrum at −1.5 d, with SUP exhibitingthe worst fit. While all models fit the Si II λλ6347, 6371 doublet inabsorption strength and velocity, our models show stronger absorp-tion in the Si II λλ5041, 5056, 5056.3 triplet around 4800 Å. Blendedwith this feature is absorption arising from Fe II λ5018, and this isalso somewhat too strong in the models. The biggest discrepancybetween model and observation for the blend occurs for model SUP.SUB1 lacks absorption at ∼4000 Å, which is clearly present in theobservations, and all of the other models. No model reproduces theshape of the UV absorption near 3700 Å, which could be due to adiscrepancy with the Ca II H&K lines.
Later, model SUP qualitatively agrees the SN2001ay spectra at+9.3 and +56.3 d best. At +9.3 d, SUP shows agreement despiteits stronger Fe II absorption lines around 4800 Å. At +56.3 d, the
MNRAS 474, 3187–3211 (2018)Downloaded from https://academic.oup.com/mnras/article-abstract/474/3/3187/4584470by Universidad de Chile useron 29 May 2018

3204 K. D. Kevin, D. J. Hillier and L. Dessart
Figure 19. SN1995D compared to models at times +3.6, +42.5 and +93.5 d relative to B-band maximum that occurred on MJD 49768.7. We have correctedfor redshift with a value of 0.0067. We reddened the models with E(B − V) = 0.026 mag and RV = 3.1. All fluxes have been normalized between 4000 and7000 Å according to equation (1). The observational data were taken from public CfA data (https://www.cfa.harvard.edu/supernova/SNarchive.html). +3.6 dshows good qualitative agreement with SUB1, except our models have the Si II λ6355 doublet formed at a higher velocity. SUB1 also matches the UV spectrumshortward of 4000 Å. Later epochs (+42.5 and +93.5 d) show a better agreement to model SUP and to CHAN, due to lower temperatures and ionization.Roughly all features at +93.5 d are matched by SUP.
MNRAS 474, 3187–3211 (2018)Downloaded from https://academic.oup.com/mnras/article-abstract/474/3/3187/4584470by Universidad de Chile useron 29 May 2018
SNe Ia ejecta mass diagnostics 3205
Figure 20. SN1995D multiband LCs normalized to Bmax and corrected for reddening (see Section 6.2.2). B-band LC agrees until ∼12 d post-maximum.Afterwards, our LCs show roughly half a magnitude more flux. The V/R-band LCs qualitatively agree with our CHAN model, although our models fail toreproduce the second peak in the I band. However, model SUP agrees with the observational data at late times. Archived LC photometry is taken from OpenSupernova Catalog (Guillochon et al. 2017), with references from CfA Supernova Archive (https://www.cfa.harvard.edu/supernova/SNarchive.html) and (Riesset al. 1999).
spectra is dominated by Fe II features, which SUP matches well,given its cooler temperatures and lower ionization. Models SUB1,SUB2 and CHAN are too highly ionized and exhibit too much emis-sion from higher ionization states such as Fe III. Despite matchingmuch of the optical spectrum, SUP does not match well the absorp-tion features associated with the Ca II NIR triplet and the Ca II H&Klines. Given the discrepancy with calcium at −1.5 d, this may indi-cate that the calcium abundance is too high or that the distributionin velocity space is incorrect.
For the LC comparison, we reddened the models with AB =0.397, AV = 0.307, AR = 0.148 and AI = 0.178 mag, by combininghost and MW values as E(B − V) = 0.098 mag and RV = 3.1(Krisciunas et al. 2011). We normalize the LCs to 0 mag at Bmax andshift the observed data by 16.35 mag. Fig. 22 shows our models failto reproduce the post-maximum decline except for U/B bands. Ourmodels show too little V/R/I flux in the decline post-maximum, butSUP agrees in peak flux ratios between bands with SN2001ay.
6.2.4 SN2005el
SN2005el exploded in NGC 1819 and was discovered on 2005September 19 (Madison, Baek & Li 2005) at a redshift of z = 0.0148(Hicken et al. 2009). It reached B-band maximum (mB = 14.84 mag)on MJD 53646.4 (Hicken et al. 2009). Scalzo et al. (2014a) classifiedSN2005el as having 0.9 M� of ejecta as well as 0.54 M� of 56Ni,which, considering the errors in the determinations, are close to ourmodels SUB1 and SUB2. For comparison, we applied reddening toour models using E(B − V) = 0.136 mag and RV = 3.1 [an E(B − V)value that is higher than that stated in Scalzo et al. (2014a)].
Fig. 23shows our spectral comparison to SN2005el. The earlyepochs of −5.9 and +2.1 d show some qualitative agreement,mostly with SUB1 and SUB2. At this epoch, our models do notreproduce the Si II λλ6347, 6371 doublet. Our models indicate a Si II
λλ6347, 6371 doublet formed at higher velocities. Therefore, spec-tral features of SN2005el may be best explained by a PDD model.Unlike the Si II doublet, models CHAN and SUP do reproduce theS II ‘w’ feature. Since our models show a higher blue-shifted Si II
doublet, it is not surprising that our UV does not match, given otherSi II and Ca II H&K features in this region. If the Ca II H&K linesand Si II λλ3854, 3856, 3862 triplet are separated by thousands ofkm s−1, then it is likely to result in the spike seen at the bottom ofthe 3700 Å absorption feature, whereas our models show one broadabsorption feature around 3700 Å (seen in SN2008ec, for example).Given the strong absorption profile around 4400 Å, we suggest this
is the Si III λλ4553, 4568, 4575 triplet, indicating a high ionizationat this epoch.
At +24.9 d, we see that model SUP agrees qualitatively in almostall features. Other models are too blue compared to the cooler SUPmodel. This is surprising given the claim that SN2005el is a sub-MCh SN with an ejecta mass of only 0.9 M�. The discrepancyaround 5300 Å could be the result of differences in the Fe II or Cr II
absorption.One should expect SUB1 or SUB2 to resemble the spectral evo-
lution of SN2005el; however, we only see that SUB1 matches priorto maximum and does not match SN2005el at late epochs, whereSUP shows best agreement. There are several possible explana-tions for the inconsistencies. First, the 56Ni mass may be lower than0.54 M�. Secondly, the poor agreement in the extent of the Si II
λλ6347, 6371 doublet could indicate a different explosion scenario(such as PDD mentioned earlier – little mass at high velocity).
To compare LCs, we shifted the LCs relative to the time of Bmax
and reddened the models with AB = 0.543, AV = 0.414, AR =0.339, AI = 0.245, AJ = 0.122 and AH = 0.077 mag, obtained usingE(B − V) = 0.136 mag and RV = 3.1 slightly higher than Scalzoet al. (2014a). The LCs were normalized to 0 mag at Bmax and weadjust the observational data by 14.76 mag. In Fig. 24, we see theoptical bands are reproduced well with our SUB models (exceptB beyond 20 d). Although the late time behaviour in the H-bandis reproduced, the NIR LCs do not generally agree with the SUBmodels. The double peak structure in the J-band observations is wellproduced by the models, although in the H-band it less evident.
6.3 Model setbacks and theoretical problems
When compared to observation data, our models do show a higherionization, especially in the nebular phase. The strength of the [Fe III]λ4658 feature is too strong compared to other optical/NIR features.Further, optical spectra lack emission such as [Fe II] ∼λ4350 emis-sion, seen in nebular spectra of SNe Ia of Taubenberger et al. (2013)and Black, Fesen & Parrent (2016), for example. Other researchershave also had difficulty modelling the Fe II feature near 4350 Å(Spyromillo 2016, private communication; Sim 2016, private com-munication; Mazzali et al. 2015; Friesen et al. 2017). It is notsurprising that these models struggle to get the ionization correct –there are no free parameters and the density structure and elementdistribution is set by the adopted initial model.
At late times, the super-MCh model was generally in better agree-ment with observation – a result of the model being cooler with
MNRAS 474, 3187–3211 (2018)Downloaded from https://academic.oup.com/mnras/article-abstract/474/3/3187/4584470by Universidad de Chile useron 29 May 2018

3206 K. D. Kevin, D. J. Hillier and L. Dessart
Figure 21. SN2001ay compared to models at epochs −1.5, +9.3 and +56.3 d relative to B-band maximum. Observed spectra have been corrected for aredshift of z = 0.0302. Models are reddened using E(B − V)MW = 0.026 mag, E(B − V)host = 0.072 mag and RV = 3.1. All fluxes are normalized in the rangeof 4000–7000 Å according to equation (1). Observational data were taken from public CfA data (https://www.cfa.harvard.edu/supernova/SNarchive.html).Early on, models reproduce velocity of the Si II λλ6347, 6371 doublet. Models show stronger Si II λλ5041, 5056, 5056.3 triplet absorption seen around 4800Å, and also show discrepancies in Fe II λ5018, seen around 4900 Å. SN2001ay shows similar Si III λλ4553, 4568, 4575 triplet absorption as CHAN. No modelreproduces the shape of the UV feature, most likely a discrepancy of formation velocity for the Ca II H&K lines. Later spectral phases (+9.3 and +56 d) arebest reproduced by SUP, indicating much lower temperature towards the innermost ejecta. SUP, however, shows a stronger absorption feature of the Ca II NIRtriplet. Given the discrepancies, we see at −1.5 d with the Ca II H&K lines, SN2001ay shows a lack of strong Ca II features.
MNRAS 474, 3187–3211 (2018)Downloaded from https://academic.oup.com/mnras/article-abstract/474/3/3187/4584470by Universidad de Chile useron 29 May 2018

SNe Ia ejecta mass diagnostics 3207
Figure 22. Multiband LCs for SN2001ay normalized to Bmax and corrected for reddening (see Section 6.2.3). Our models fail to reproduce the post-maximumdecline except for U/B bands. Models show too little V/R/I flux in the decline post-maximum. However, the peak flux ratio between bands matches to modelSUP. A larger reddening and an adjustment of the time of B-band maximum would improve the comparison. Archived LC photometry is taken from OpenSupernova Catalog (Guillochon et al. 2017), with references from Ganeshalingam et al. (2010) and Silverman et al. (2012).
lower ionization. Since we know that most of the observed SNewe discussed are not super-MCh, there is a fundamental problemwith the models. This problem might arise from the adopted explo-sion models, be related to assumptions about mixing and clumping,and/or be a problem in the ionization calculations. Since nebularspectra show strong [Fe II] and [Fe III], the Fe+/Fe2 + ratio must beof order unity, and consequently, it is sensitive to the Fe atomicmodels (and the density structure).
The disconnection between early and late time modelling is notunexpected. Early time spectra are dependent on the outer ejectawhereas late time spectra are primarily dependent on the innerejecta. Further, the processes determining the observed spectra inthe photospheric and nebular phases are distinct, and subject todifferent uncertainties in the atomic data.
Another problem is the strong nebular [S III] λλ9068, 9530 and[Ar III] λλ7135, 7751 lines. The [S III] λλ9068, 9530 does not seemto appear in nebular spectra. However, it is not clear if [Ar III]λ7135 is present. There are three additional transitions contributingto that overall feature between 7000 and 7500 Å. There are two[Fe II] λλ7155, 7172 lines that overlap [Ar III] λ7135, and dependingon the ionization structure of the ejecta, it becomes difficult todetermine the source of the feature in observations. However, atomicphysics of the [Ar III] λλ7135, 7751 lines requires that the line ratio,I(7135)/I(7751), should be a factor of 4.2, so if spectral detectionsof [Ar III] λ7751 are possible, then one can determine the strengthof the blended [Ar III] λ7135 line. However, observed SN Ia nebularspectra appear absent of IME lines. This could be due to an absenceof 56Ni in the IME zone. In our models, the presence of some 56Niin the IME zone means that positrons are available as a heatingsource after the ejecta has become optically thin to grey photons.One would expect some level of mixing to occur through Rayleigh–Taylor instabilities between these layers – see Hicks (2015) andreferences therein. To address the problem of too high an ionization,clumping, arising from radiation hydrodynamic instabilities, shouldbe considered in future studies. Our preliminary work shows that,as expected, clumping lowers the ionization, and we will addressthis issue in a future paper.
Another possible explanation concerns the validity of the explo-sion models. We have considered only four models, and only twoof the explosion models were obtained from ‘first principles’, andeven these were derived from 1D explosions. Alternative explosionmechanisms might give rise to different density and abundance pro-files, and in particular, the spatial distribution of 56Ni. The later willinfluence the amount of UV line blanketing, potentially introduc-
ing degeneracies with the ejecta mass. However, other diagnostics(e.g. the NIR nickel line) provide additional information, and canbreak the degeneracies. Further, despite the deficiencies, the modelshave highlighted important diagnostics and questions that can helpfacilitate future progress towards understanding Type Ia SNe.
7 C O N C L U S I O N
We have presented four 1D SN Ia models – three delayed deto-nation models with masses of 1.02, 1.40 and 1.70 M� and onedetonation sub-MCh model with a mass of 1.04 M�. By design,the models have the same 56Ni mass of ∼0.62 M� that allows usto investigate the dependence of LCs and spectra on ejecta mass.Despite the smallness of the model grid they serve to highlight im-portant diagnostics that can help facilitate future progress towardsunderstanding Type Ia SNe.
Our results show that despite large differences in ejecta mass,the optical flux throughout the photospheric phase shows less than0.3 mag difference in peak brightness in the LCs, as well as nearlyidentical spectral features. We have seen that the peak bolometricluminosity of each model is similar to within about 15 per cent, andthe difference in rise time is less than ∼20 per cent. Due to differ-ences in diffusion time, however, the two sub-MCh mass models doevolve faster (pre-maximum) by a day as seen from the bolometricluminosity and synthetic B-band LCs. There is only a slight dif-ference (∼5 per cent) in the decline parameter, �M15(B), betweensub-MCh and super-MCh models. Our sub-MCh models have muchbluer colours at all epochs compared with SUP (B − R difference of≈0.3 mag at maximum and a difference in B − R �1 mag roughly20 d post-maximum). Our models show larger differences in NIRLCs, particularly with the H-band’s ∼1 mag difference at maximumlight between sub-MCh and super-MCh.
Spectroscopically, at most photospheric phases, the optical spec-tra show the same gross features. However, the strength of UVblanketing between 2000 and 4000 Å is found to correlate withejecta mass. Lower mass models have higher temperature and ion-ization (as more heating per gram), and hence lower UV blanketingbetween 2000 and 4000 Å. M(56Ni)/Mej is the leading parametercontrolling this study. Higher mass models produce stronger IMEfeatures, such as the Ca II NIR triplet and the Si II λ6347, 6371doublet prior to the nebular phase, and stronger [S II] λλ9530, 9068,[Ca II] λλ7291, 7324, and [Ar III] λ7135 in the nebular phase. Lowermass models have higher ionization, as indicated by the presence ofthe Si III λλ4553, 4568, 4575 triplet near maximum and the lack of
MNRAS 474, 3187–3211 (2018)Downloaded from https://academic.oup.com/mnras/article-abstract/474/3/3187/4584470by Universidad de Chile useron 29 May 2018

3208 K. D. Kevin, D. J. Hillier and L. Dessart
Figure 23. SN2005el compared to models at times −5.9, −4.9 and +23.1 d relative to B-band maximum. Observed spectrum is corrected for a redshift of0.0148. Models are reddened with E(B − V) = 0.136 mag and RV = 3.1. All fluxes are normalized between 4000 and 7000 Å according to equation (1). Thisobservational data were taken from public CFA data (https://www.cfa.harvard.edu/supernova/SNarchive.html). Around −5 d, our models do not reproduce theSi II λλ6347, 6371 doublet. Models show line formation at higher velocities. Unlike the Si II doublet, CHAN and SUP do reproduce the S II ‘w’ feature. UVspectra is poorly reproduced due to formation velocities of Si II and Ca II H&K features in this region. If the Ca II H&K lines are formed a few thousand km s−1
away from the Si II λλ3854, 3856, 3862 triplet (which our models show both sum to the broad absorption feature around 3700 Å), it is likely to result in thespike seen at the bottom of the 3700 Å absorption feature. SN2005el also shows a strong absorption profile around 4400 Å, which we suggest to be the Si III
λλ4553, 4568, 4575 triplet, indicating a high ionization. At +24.9 d, model SUP agrees qualitatively in almost all spectral features. At this epoch, SUP hasthe coolest inner ejecta. This agreement is surprising, given the 70 per cent difference in claimed ejecta mass. The discrepancy around 5300 Å could be theresult of differences in the Fe II or Cr II absorption.
MNRAS 474, 3187–3211 (2018)Downloaded from https://academic.oup.com/mnras/article-abstract/474/3/3187/4584470by Universidad de Chile useron 29 May 2018

SNe Ia ejecta mass diagnostics 3209
Figure 24. Multiband LCs corrected for reddening and normalized to Bmax (see Section 6.2.4). Optical band normalized LCs of SN2005el agree in morphologywith our SUB models. The NIR LCs do not agree with SUB models. Instead, the NIR LCs show better agreement with CHAN and SUP. Archived LC photometryis taken from Open Supernova Catalog (Guillochon et al. 2017), with references from (Contreras et al. 2010; Ganeshalingam et al. 2010; Silverman et al. 2012;Friedman et al. 2015).
strong Fe II and Co II lines in the optical post-photospheric/nebularphase. Model SUB1, unlike SUB2, is dominated by strong [Fe III]and [Co III] lines, such as [Fe III] λ4658, [Fe III] λ5270, [Co III] λ5888and [Co III] 1.5484 µm.
In the nebular phase, the [Ni II] 1.939 µm line is absent in oursub-MCh detonation model, but readily visible in the three othermodels. Potentially, the [Ni II] 1.939 µm line provides us witha diagnostic of the amount of stable nickel (58Ni & 60Ni), un-like the blended optical [Ni II] λλ7378, 7412 lines. Its absence inNIR spectra would provide strong evidence for a lack of a ‘56Nihole’ and potentially sub-Chandrasekhar mass ejecta (given 1Dmodelling). However, complex ionization issues can influence thestrength of all [Ni II] lines, making absolute determinations of theabundance model dependent. Overall the NIR provides the best di-agnostics for distinguishing between our different SN Ia progenitormodels.
In comparing our spectra to observation at times greater than20 d post-maximum, we consistently find better qualitative fits withour cooler, high-mass super-MCh model. Given that there is a ∼20–70 per cent difference in claimed ejecta mass between our comparedobservational objects and our super-MCh model, we suggest clump-ing as a way to lower the high ionization and high temperaturesobserved in our models. While it is difficult to reproduce all ob-servational features due to the diversity of SNe Ia, we are ableto match some features shown in our comparison to observations.Prior to maximum, the best choice of model varies. Agreementdepends on the velocity structure of the ejecta. For instance, thephotospheric features Si II λλ6347, 6371 and the Ca II NIR tripletexpose the difficulty of reproducing the velocity structure of SN Ia
(Figs 21 and 23, for example). Future efforts to reproduce the di-versity of these features requires a better understanding of the outerejecta and explosion mechanism.
Parallel work has been undertaken by Blondin et al. (submit-ted to MNRAS) who studied SN 1999by using a low-mass model(0.9 M�) and a model with a Chandrasekhar mass (both with0.12 M�of 56Ni). They find that the lower mass model providesa better match to the LC and exhibits a faster rise and a brightermaximum. As in our study, the lower mass model does not show the[Ni II] 1.939 µm line, which is seen in their Chandrasekhar model
To determine more accurate diagnostic signatures of SN Ia pro-genitors, we need to understand clumping and inhomogeneities inIa ejecta. Some insights can be obtained from multidimensional ex-plosion modelling, while additional insight might be obtained fromstudies of young SN remnants that are not interacting with the sur-rounding ISM. During the photospheric phase, more UV spectraldata will help to constrain the ionization and temperature of the gas.More NIR spectral data will help to test our diagnostics, such asthe NIR Ca II triplet (or nebular [Ca II] λλ7291, 7324), the nebularfeatures between 9000 Åand 1 µm (such as [S III] λλ9068, 9530)and the [Ni II] 1.939 µm line (requiring SNe Ia at a high enoughredshift to avoid the telluric absorption). These nebular features canprovide leverage on the progenitor channel by constraining initialdensities ([Ni II]), the overlap between IMEs and IGEs ([Ca II]), andthe ionization structure.
As many more SN spectra become available it will be possibleto do systematic statistical comparisons between SNe that have asimilar initial 56Ni mass. As discussed above, our studies showthat Type Ia SN will exhibit systematic differences in spectra and
MNRAS 474, 3187–3211 (2018)Downloaded from https://academic.oup.com/mnras/article-abstract/474/3/3187/4584470by Universidad de Chile useron 29 May 2018

3210 K. D. Kevin, D. J. Hillier and L. Dessart
multiband LCs as a function of ejecta mass, thus providing funda-mental constraints on the nature of the progenitors.
AC K N OW L E D G E M E N T S
We thank Stephane Blondin for providing feedback for this work aswell as everyone at the ‘Supernovae Through the Ages: Understand-ing the Past to Prepare for the Future’ conference who presentedwork and talked with us about our research. We also thank the ref-eree for providing very detailed and useful comments and questions.This research has made use of the CfA Supernova Archive, whichis funded in part by the National Science Foundation through grantAST 0907903. DJH acknowledges partial support from STScI the-ory grant HST-AR-12640.001-A, and DJH and KDW thank NASAfor partial support through theory grant NNX14AB41G.
R E F E R E N C E S
Arnett W. D., 1969, APSS, 5, 180Bildsten L., Hall D. M., 2001, ApJ, 549, L219Black C. S., Fesen R. A., Parrent J. T., 2016, Monthly Notices of the Royal
Astronomical Society, 462, 649Blondin S., Tonry J. L., 2007, ApJ, 666, 1024Blondin S. et al., 2012, AJ, 143, 126Blondin S., Dessart L., Hillier D. J., Khokhlov A. M., 2013, MNRAS, 429,
2127Blondin S., Dessart L., Hillier D. J., Khokhlov A. M., 2017, MNRAS, 470,
157Branch D. et al., 2006, PASP, 118, 560Cardelli J. A., Clayton G. C., Mathis J. S., 1989, ApJ, 345, 245Childress M. J. et al., 2013, ApJ, 770, 29Childress M. J., Filippenko A. V., Ganeshalingam M., Schmidt B. P., 2014,
MNRAS, 437, 338Childress M. J. et al., 2015, MNRAS, 454, 3816Ciaraldi-Schoolmann F., Seitenzahl I. R., Ropke F. K., 2013, A&A, 559,
A117Contardo G., Leibundgut B., Vacca W. D., 2000, A&A, 359, 876Contreras C. et al., 2010, AJ, 139, 519Dessart L., Blondin S., Hillier D. J., Khokhlov A., 2014a, MNRAS, 441,
532Dessart L., Hillier D. J., Blondin S., Khokhlov A., 2014b, MNRAS, 441,
3249Ellis R. S. et al., 2008, ApJ, 674, 51Filippenko A. V., 1997, ARA&A, 35, 309Fink M., Hillebrandt W., Ropke F. K., 2007, AAP, 476, 1133Fink M., Ropke F. K., Hillebrandt W., Seitenzahl I. R., Sim S. A., Kromer
M., 2010, AAP, 514, A53Foley R. J., Kirshner R. P., 2013, ApJ, 769, L1Foley R. J. et al., 2016, MNRAS, 461, 1308Friedman A. S. et al., 2015, ApJS, 220, 9Friesen B., Baron E., Wisniewski J. P., Parrent J. T., Thomas R. C., Miller
T. R., Marion G. H., 2014, ApJ, 792, 120Friesen B. et al., 2017, MNRAS, 467, 2392Gamezo V. N., Khokhlov A. M., Oran E. S., 2005, APJ, 623, 337Ganeshalingam M. et al., 2010, ApJS, 190, 418Gerardy C. L. et al., 2004, ApJ, 607, 391Gerardy C. L. et al., 2007, ApJ, 661, 995Guillochon J., Parrent J., Kelley L. Z., Margutti R., 2017, ApJ, 835, 64Hicken M. et al., 2009, ApJ, 700, 331Hicks E. P., 2015, ApJ, 803, 72Hillier D. J., Dessart L., 2012, MNRAS, 424, 252Hillier D. J., Miller D. L., 1998, APJ, 496, 407Hoeflich P., Khokhlov A., 1996, ApJ, 457, 500Hoeflich P., Khokhlov A., Wheeler J. C., Phillips M. M., Suntzeff N. B.,
Hamuy M., 1996, ApJ, 472, L81Hoyle F., Fowler W. A., 1960, APJ, 132, 565
Iwamoto K., Brachwitz F., Nomoto K., Kishimoto N., Umeda H., Hix W.R., Thielemann F.-K., 1999, ApJS, 125, 439
Jackson A. P., Calder A. C., Townsley D. M., Chamulak D. A., Brown E. F.,Timmes F. X., 2010, APJ, 720, 99
Jha S., Riess A. G., Kirshner R. P., 2007, ApJ, 659, 122Jordan IV G. C., Perets H. B., Fisher R. T., van Rossum D. R., 2012, ApJ,
761, L23Kasen D., 2006, ApJ, 649, 939Kasen D., Ropke F. K., Woosley S. E., 2009, Nature, 460, 869Khokhlov A. M., 1991a, AAP, 245, 114Khokhlov A. M., 1991b, AAP, 245, L25Krisciunas K. et al., 2004, AJ, 127, 1664Krisciunas K. et al., 2007, AJ, 133, 58Krisciunas K. et al., 2011, AJ, 142, 74Kromer M., Sim S. A., Fink M., Ropke F. K., Seitenzahl I. R., Hillebrandt
W., 2010, ApJ, 719, 1067Kromer M. et al., 2013, MNRAS, 429, 2287Leloudas G. et al., 2009, A&A, 505, 265Lentz E. J., Baron E., Branch D., Hauschildt P. H., Nugent P. E., 2000, ApJ,
530, 966Livne E., Arnett D., 1995, APJ, 452, 62Livne E., Asida S. M., Hoflich P., 2005, APJ, 632, 443Madison D. R., Baek M., Li W., 2005, Cent. Bur. Elect. Telegrams, 233Maeda K., Ropke F. K., Fink M., Hillebrandt W., Travaglio C., Thielemann
F.-K., 2010, ApJ, 712, 624Maoz D., Mannucci F., Nelemans G., 2014, ARA&A, 52, 107Mazzali P. A., Hachinger S., 2012, MNRAS, 424, 2926Mazzali P. A., Podsiadlowski P., 2006, MNRAS, 369, L19Mazzali P. A., Benetti S., Stehle M., Branch D., Deng J., Maeda K., Nomoto
K., Hamuy M., 2005a, MNRAS, 357, 200Mazzali P. A. et al., 2005b, ApJ, 623, L37Mazzali P. A., Maurer I., Stritzinger M., Taubenberger S., Benetti S.,
Hachinger S., 2011, MNRAS, 416, 881Mazzali P. A. et al., 2015, MNRAS, 450, 2631Nakano S., Kushida R., Kushida Y., 1995, IAU Circ., 6134Nomoto K., 1982, ApJ, 253, 798Nomoto K., 1984, ApJ, 277, 791Nomoto K., Sugimoto D., Neo S., 1976, APSS, 39, L37Nugent P., Baron E., Branch D., Fisher A., Hauschildt P. H., 1997, ApJ, 485,
812Pan Y.-C., Sullivan M., Maguire K., Gal-Yam A., Hook I. M., Howell D. A.,
Nugent P. E., Mazzali P. A., 2015, MNRAS, 446, 354Pereira R. et al., 2013, A&A, 554, A27Perlmutter S. et al., 1999, APJ, 517, 565Phillips M. M., 1993, ApJ, 413, L105Phillips M. M. et al., 2007, PASP, 119, 360Pinto P. A., Eastman R. G., 2000a, ApJ, 530, 744Pinto P. A., Eastman R. G., 2000b, ApJ, 530, 757Plewa T., Calder A. C., Lamb D. Q., 2004, APJL, 612, L37Riess A. G. et al., 1998, AJ, 116, 1009Riess A. G. et al., 1999, AJ, 117, 707Riess A. G. et al., 2005, ApJ, 627, 579Ropke F. K., Niemeyer J. C., 2007, AAP, 464, 683Saio H., Nomoto K., 1985, A&A, 150, L21Sato Y., Nakasato N., Tanikawa A., Nomoto K., Maeda K., Hachisu I., 2015,
ApJ, 807, 105Scalzo R. et al., 2014a, MNRAS, 440, 1498Scalzo R. A., Ruiter A. J., Sim S. A., 2014b, MNRAS, 445, 2535Seitenzahl I. R. et al., 2013, MNRAS, 429, 1156Seitenzahl I. R. et al., 2016, A&A, 592, A57Silverman J. M. et al., 2012, MNRAS, 425, 1789Silverman J. M., Vinko J., Marion G. H., Marion G. H., Wheeler J. C., Barna
B., Szalai T., Mulligan B. W., Filippenko A. V., 2015, MNRAS, 451,1973
Sim S. A., Ropke F. K., Hillebrandt W., Kromer M., Pakmor R., Fink M.,Ruiter A. J., Seitenzahl I. R., 2010, ApJ, 714, L52
Sim S. A., Ropke F. K., Kromer M., Fink M., Ruiter A. J., SeitenzahlI. R., Pakmor R., Hillebrandt W., 2011, Proc. IAU Symp. 7, Type Ia
MNRAS 474, 3187–3211 (2018)Downloaded from https://academic.oup.com/mnras/article-abstract/474/3/3187/4584470by Universidad de Chile useron 29 May 2018
SNe Ia ejecta mass diagnostics 3211
Supernovae from Sub-Chandrasekhar Mass White Dwarfs. CambridgeUniv. Press, p. 267
Sim S. A. et al., 2013, MNRAS, 436, 333Stehle M., Mazzali P. A., Benetti S., Hillebrandt W., 2005, MNRAS, 360,
1231Stritzinger M., Leibundgut B., Walch S., Contardo G., 2006, A&A, 450, 241Sullivan M., Ellis R. S., Howell D. A., Riess A., Nugent P. E., Gal-Yam A.,
2009, ApJ, 693, L76Swartz D. A., Sutherland P. G., Harkness R. P., 1995, ApJ, 446, 766Swift B., Li W. D., Schwartz M., 2001, IAU Circ., 7611Tanaka M., Mazzali P. A., Maeda K., Nomoto K., 2006, ApJ, 645, 470Taubenberger S. et al., 2013, MNRAS, 432, 3117Travaglio C., Hillebrandt W., Reinecke M., Thielemann F.-K., 2004, AAP,
425, 1029van Dyk S. D., Treffers R. R., Richmond M. W., Filippenko A. V., Paik Y.
B., 1994, IAU Circ., 6105
Walker E. S., Hachinger S., Mazzali P. A., Ellis R. S., Sullivan M., Gal YamA., Howell D. A., 2012, MNRAS, 427, 103
Wang X. et al., 2012, ApJ, 749, 126Whelan J., Iben I., Jr, 1973, ApJ, 186, 1007Wood-Vasey W. M. et al., 2008, ApJ, 689, 377Woosley S. E., 1997, ApJ, 476, 801Woosley S. E., Kasen D., 2011, ApJ, 734, 38Woosley S. E., Weaver T. A., 1994, APJ, 423, 371Woosley S. E., Kasen D., Blinnikov S., Sorokina E., 2007, ApJ, 662, 487Zhao X. et al., 2015, ApJS, 220, 20
This paper has been typeset from a TEX/LATEX file prepared by the author.
MNRAS 474, 3187–3211 (2018)Downloaded from https://academic.oup.com/mnras/article-abstract/474/3/3187/4584470by Universidad de Chile useron 29 May 2018