ejournal of tax research - business school
TRANSCRIPT

eJournal of Tax Research
Volume 7, Number 2 December 2009
CONTENTS
106 The Managerial Benefits of Tax Compliance: Perception by Small Business Taxpayers
Philip Lignier
134 Are JCT Analyses of Tax Change Proposals Useful to Individual Taxpayers?
Robert F. Gary, William D. Terando and Marvin L. Bouillon
158 Antecedents to e-File Adoption: The U.S. Citizen’s Perspective
Ludwig Christian Schaupp and Lemuria D. Carter
171 Sustaining Growth in Developing Economies through Improved Taxpayer Compliance: Challenges for Policy Makers and Revenue Authorities
Margaret McKerchar and Chris Evans
© Atax, The University of New South Wales ISSN 1448-2398

eJournal of Tax Research (2009) vol. 7, no. 2, pp. 134-157
134
Are JCT Analyses of Tax Change Proposals Useful to Individual Taxpayers?
Robert F. Gary, William D. Terando and Marvin L. Bouillon
Abstract This article examines whether taxpayers may rely on Joint Committee of Taxation (JCT) studies to assess how a proposed tax change will impact their circumstances by evaluating the impact of a proposed tax law change to broaden the individual income tax base and lower individual income tax rates by performing a microeconomic analysis on their explicit tax burdens before and after the proposed change in tax law. Our results indicate that JCT studies do not fully reveal the impact of proposed tax law changes on individual explicit tax burdens. Finally, we provide a simple methodology to determine the distributional impact of tax proposals on individuals using publically available information.
1. INTRODUCTION
The 2008 election cycle has generated numerous proposals from various Members of Congress to reform and simplify the U.S. individual income tax system.1 Each proposal is then subject to a macroeconomic analysis by the Joint Committee on Taxation (JCT) to estimate it’s impact on the aggregate economy (as well as specific sectors) and predict behavioral responses of affected taxpayer groups.2, 3 The JCT utilizes three different models to perform this task: (1) a macroeconomic equilibrium
Robert F. Gary is an Assistant Professor at the Anderson School of Management, University of New
Mexico. E-mail: [email protected]. William D. Terando is an Associate Professor at the College of Business, Butler University. E-mail: [email protected]. Marvin L. Bouillon is the Mark and Pam Fisher Fellow in Accounting and Chair of the Accounting and the Finance Departments, College of Business, Iowa State University. E-mail: [email protected]. The authors thank Pat Wagaman for research assistance, as well as an anonymous reviewer and Kathrin Bain (production editor) for helpful comments. Data are available from public sources identified within this article.
1 These proposals also emanate from candidates for public office and various tax organizations such as the Americans for Tax Reform, the Americans for Fair Taxation, and the Citizens for Tax Justice.
2 Joint Committee on Taxation. 2003. Overview of Work of the Staff of the Joint Committee on Taxation to Model the Macroeconomic Effects of Proposed Tax Legislation to Comply with House Rule XIII.3.(h)(2). JCX-105-03 (December 22): 1. House Rule XIII.3.(h)(2) generally requires that a macroeconomic analysis be included in bills reported by the Committee on Ways and Means that amend the Internal Revenue Code of 1986. In addition, as required by the Congressional Budget Act of 1974 (as amended), the JCT is also required to generate tax revenue estimates associated with each proposed tax law change (Joint Committee on Taxation. 2005. Overview of Revenue Estimating Procedures and Methodologies Used by the Staff of the Joint Committee on Taxation. JCX-1-05 [February 22]: 2).
3 Other countries have similar committees that support the legislative body on tax matters (e.g., the Australian Senate establishes committees as necessary, such as the Senate Select Committee on a New Tax System; the Canadian House of Commons has the Standing Committee on Finance; New Zealand’s House of Representatives has the Select Committee on Finance and Expenditures).

eJournal of Tax Research Are JCT Analyses of Tax Change Proposals Useful to Individual Taxpayers?
135
growth model (MEG), (2) an overlapping generations lifecycle model (OLG), and (3) a dynamic stochastic general equilibrium model with infinitely lived agents (DSGE). Each model, however, provides limited range regarding the various individual taxpayer groups that may be impacted by a proposed tax law. In fact, only the DSGE model directly considers the impact of a tax law change on individual taxpayers by distinguishing between two types of individuals: savers and spenders.4 While this latter feature allows for an analysis of the differential impact of any tax proposal on low and high income taxpayer households, its definitional vagueness makes it difficult for individual taxpayers to map these results to their own particular circumstances.5
Upon request by Members of Congress, the JCT may also generate an individual distributional analysis of a proposed tax law change.6 However, unlike the macroeconomic analyses referred to above, distributional analyses are rarely produced as they are significantly costly to generate both in terms of JCT staff resources and money.7 In addition, requests made by Members of Congress are treated as confidential, and the responses are released only to the Member making the request unless the Member decides to make the information public.8 Therefore, even in the event a distributional analysis is generated by the JCT staff it is highly unlikely that its results will be communicated with individual taxpayers to allow them to evaluate how a proposed tax law change will impact their own explicit tax burdens.
The purpose of this article is two-fold. First, we investigate whether JCT macroeconomic analyses provide sufficient information to allow taxpayers to determine how proposed tax law changes will impact their explicit tax burdens. We focus on the sufficiency of these studies since they contain the information that is most likely to be released to the public for each tax law change being considered.9 Second, as our results indicate that the JCT macroeconomic analyses do not provide adequate information to inform taxpayers, we provide an alternative methodology to
4 Joint Committee on Taxation. 2006. Background Information about the Dynamic Stochastic General
Equilibrium Model Used by the Staff of the Joint Committee on Taxation in the Macroeconomic Analysis of Tax Policy. JCX-52-06 (December 14): 1.
5 Joint Committee on Taxation. 2008. Inside the JCT Revenue Estimating Process. (January 30): 10. The JCT utilizes an Individual Tax Model for revenue estimates that incorporates 180,000 actual tax returns from all categories of taxpayers. However, the results are aggregated and reported as a single amount in each year for each proposed change to current tax law.
6 The JCT distributional analysis provides the dollar change in federal taxes as well as the average tax rates under present law and the proposal for nine income brackets. In addition, this analysis provides the change in federal taxes to the following filing statuses: single, married filing jointly, and head of household.
7Joint Committee on Taxation. 2005. Overview of Revenue Estimating Procedures and Methodologies Used by the Staff of the Joint Committee on Taxation. JCX-1-05 (February 22): 22.
8 Id. at 2. The JCT does not operate under the Freedom of Information Act as this act applies only to the executive branch and “includes any executive department, military department, Government corporation, Government controlled corporation, or other establishment in the executive branch of the Government (including the Executive Office of the President), or any independent regulatory agency;” (Freedom of Information Act, 5 U.S.C. §552(f)(1). Only four distributional analyses (all concerning one piece of legislation) and two macroeconomic analyses issued from 2005-2008 are posted on the JCT web site (http://www.jct.gov/pubs.html).
9 The JCT is a Nonpartisan House-Senate Committee of the U.S. Congress. Therefore, its analysis should be objective, timely, and developed form a complete understanding of the proposed tax legislation. In addition, since this analysis is already provided to Congress, it can be made publicly available with little additional cost.

eJournal of Tax Research Are JCT Analyses of Tax Change Proposals Useful to Individual Taxpayers?
136
estimate the distributional effects of proposed changes in tax law on individual taxpayer explicit tax burdens. This methodology utilizes Statistics of Income (SOI) data to estimate average taxable income amounts for representative tax filers. The SOI data is based on a sample of tax returns, selected before audit, of individuals that filed tax returns using Forms 1040, 1040A and 1040EZ (including electronic returns). While our study is based on the United States tax system, our findings are generalizable to other taxing jurisdictions that have publically available data that allows for a similar analysis that the U.S. SOI data provides (e.g., Canada, the United Kingdom and Ireland).10 Other countries (e.g., Australia; New Zealand) provide income tax return statistics that are not stratified into various income brackets, therefore not allowing for the analysis documented in this study.
We evaluate the impact of a proposed tax law change to broaden the individual income tax base and lower individual income tax rates by performing a microeconomic analysis on their explicit tax burdens before and after the proposed change in tax law. We select this proposed tax law change for our study because of the differential predictions that the related JCT macroeconomic analysis (JCT study) makes regarding the impact of the proposal on individual taxpayer consumption patterns and explicit tax benefits. The JCT study estimates the impact of a proposal to reduce marginal tax rates on individuals by 32 percent and eliminate the alternative minimum tax (AMT) and most personal credits. It also broadens the individual tax base by eliminating most above-the-line deductions, itemized deductions and personal exemptions. Overall, the conventional JCT revenue estimate finds that the proposal is approximately revenue neutral over a ten year budget window. Each model’s simulation results predict that the proposed tax legislation will increase real gross domestic product (GDP), business investment, and employment. The MEG and OLG simulations predict that short term individual consumption will increase due to the proposal’s lower marginal tax rates (MTRs) while the DSGE simulation predicts that short term individual consumption will decrease due to a redistribution of individual tax liabilities from high wage earners to low wage earners.11
Overall, our results indicate that JCT macroeconomic studies do not fully reveal the impact of the proposed tax legislation on individual tax return filers. We show that the proposed tax law change will differentially impact two filing groups: those that pay taxes under current tax law (taxable filers) and those that do not (nontaxable filers). For the taxable filer subgroup, the proposed tax law change will redistribute explicit tax costs from high to low income taxpayers. This disparity can be reduced, but not eliminated, if the preferential tax rate on capital gains (and qualified dividends) is also eliminated in conjunction with the adoption of this proposal. In contrast, we illustrate that the proposed tax legislation will increase the explicit tax costs to all nontaxable filers by either reducing their expected tax refunds or forcing them to pay taxes to the federal government. Finally, we show that repealing the preferential tax rate on capital 10 The Canada Revenue Agency publishes Final Statistics - Sample Data that reports detailed profiles of
Canadian taxfilers based on a stratified random sample of individual tax returns (http://www.cra-arc.gc.ca/gncy/stts/fnl-eng.html). HM Revenue & Customs in the United Kingdom publishes Income Tax Statistics and Distributions (http://www.hmrc.gov.uk/stats/income_tax/menu.htm). The Office of the Revenue Commissioners of the Irish Tax & Customs publishes Statistical Reports that provide income distribution statistics (http://www.revenue.ie/en/about/publications/statistical-reports.html).
11 Joint Committee on Taxation. 2006. Macroeconomic Analysis of a Proposal to Broaden the Individual Income Tax Base and Lower Individual Income Tax Rates. JCX-53-06 (December 14): 1.

eJournal of Tax Research Are JCT Analyses of Tax Change Proposals Useful to Individual Taxpayers?
137
gains (and qualifying dividends) will have little impact on this subgroup since most nontaxable filers do not generate substantial amounts of preferential income. Our contribution to the literature is to point out the shortcomings of JCT macroeconomic analyses regularly performed for proposed tax law change legislation. In addition, this article presents an alternative methodology using publicly available information to help taxpayers estimate the distributional impact of tax law change proposals.
The remainder of this article is presented as follows. The next section describes the functions of the JCT. The third section discusses the proposed tax law change legislation and the JCT study. The fourth section describes our methodology while the fifth section contains the results that estimate the impact of the potential change in tax law on individual explicit tax costs. A summary of significant findings concludes the article and is included in the final section.
2. JCT
The JCT is a Committee of the U.S. Congress originally established under the Revenue Act of 1926 and is currently authorized under the Internal Revenue Code (IRC) of 1986.12 The JCT is composed of ten members: five from the Senate Finance Committee and five from the House Ways and Means Committee. The members of the JCT choose the Chief of Staff of the JCT, who is responsible for selecting the remainder of the staff on a nonpartisan basis. The independence and neutrality of the JCT staff serve to facilitate exchanges of information with the Internal Revenue Service (IRS), Treasury, other governmental agencies, interest groups (and their representatives) and taxpayers.13
The duties of the JCT are: (1) investigating the operation, effects, and administration of internal revenue taxes, (2) investigate measures and methods for the simplification of taxes, (3) make reports on the results of those investigations and make recommendations, and (4) review any proposed refund or credit of taxes in excess of $2,000,000. In performing these tasks, the JCT has developed the important function of providing technical expertise (usually in the form of legal analysis) to Congress on such specialized tax topics as international taxation, pensions, insurance, trusts and estates, tax administration, tax exempt bonds, excise taxes, and mergers and acquisitions.14
In addition to these functions, the Congressional Budget Act of 1974 requires that the JCT provide revenue estimates for all tax legislation considered by either the House or the Senate.15 Such analyses are the official Congressional estimates for proposed tax legislation.16 In conjunction with revenue estimates, the JCT is required by House Rule XIII.3.(h)(2) to: (1) perform macroeconomic analysis of the effects of tax
12 I.R.C. §8001-§8005 and §8021-§8023 of the I.R.C. of 1986, and predecessor sections of the I.R.C. of
1954, the I.R.C. of 1939, and preceding Revenue Acts back to the Revenue Act of 1926. 13Joint Committee on Taxation. About the Joint Committee on Taxation. Available at:
http://www.house.gov/jct/aboutjct.html. 14 Id. 15 §201(g), as amended by the Balanced Budget and Emergency Deficit Control Act of 1985 (Gramm-
Rudman-Hollings), P.L. 99-177, 99 Stat. 1037. 16 Id.

eJournal of Tax Research Are JCT Analyses of Tax Change Proposals Useful to Individual Taxpayers?
138
proposals on both the aggregate economy and specific sectors and (2) provide predictions as to the behavioral responses of affected taxpayers.17
Towards this end, the JCT estimates the impact of tax legislation proposals on GDP, real business and residential capital stock, equipment, labor supply and consumption using three different macroeconomic analyses: the MEG, OLG, and DSGE analysis.18 The MEG analysis uses an open economy model that allows international capital flows to affect investment and net exports to affect domestic consumption. This model is based on the assumption that the amount of output is determined by the availability of capital and labor, and in the long run, prices adjust so that demand equals supply. The supply of labor over time is determined by the size of the working age population and its willingness to work in response to changes in after-tax wages. Population and age profile projections are calibrated to the Census Bureau middle series projections. The path of Federal Government expenditures on Social Security and Medicare programs is calibrated between low and intermediate projections derived from the Congressional Budget Office (CBO) forecast. 19 The model is “myopic” in the sense that individuals do not anticipate changes in the economy (or government finances) but rather make decisions based on observed characteristics of the economy. In addition, consumption decisions are determined according to the lifecycle theory which implies that individuals attempt to smooth their consumption patterns over their lifetimes.20
The OLG analysis includes sectors for both business and housing and assumes that individuals make consumption and labor supply decisions to maximize their lifetime wellbeing given the resources they anticipate will be available to them. The model assumes that they have complete information about economic conditions (such as wages, prices, interest rates, tax rates and government spending) over their lifetimes. The OLG model does not allow for unemployment or the international trade of goods and services. However, it does account for adjustment costs that are related to changes in the rate of investment. In addition, the movement of assets between sectors attempts to proxy for international cash flows through interest rate adjustments. Unlike the MEG model, the OLG model treats the purchase of housing as a consumption decision (thus making investment in real estate less responsive to changes in after-tax prices) and assumes that prices adjust to changes in economic conditions so that supply always equals demand and resources are always fully utilized (after accounting for the cost of adjusting the capital stock).21
Similar to the OLG model the DSGE model assumes that the economy always operates at full employment. In contrast to both the MEG and OLG models, the DSGE
17 Joint Committee on Taxation. 2003. Overview of Work of the Staff of the Joint Committee on Taxation
to Model the Macroeconomic Effects of Proposed Tax Legislation to Comply with House Rule XIII.3.(h)(2). JCX-105-03 (December 22): 5.
18Joint Committee on Taxation. See n 11 at 7. The JCT uses three macroeconomic simulation models when analyzing tax change proposals because no one model can provide complete information about the broad array of anticipated effects of tax policy on the economy as a whole and its various sectors. Even with this multiple model approach, the JCT cannot account for all the possible effects that a particular proposal might have on the economy.
19 Congressional Budget Office (CBO). 2005. The Long-Term Budget Outlook. 20 Joint Committee on Taxation. See n 11 at 4. 21 Id. at 5.

eJournal of Tax Research Are JCT Analyses of Tax Change Proposals Useful to Individual Taxpayers?
139
model is a closed economy in the sense that individuals do not have perfect information regarding future fiscal policy. Government in the DSGE model can also operate at permanently increasing debt levels due to tax cuts as long as the economy grows at a faster rate than debt loads, thus maintaining fiscal solvency. The model has one production sector and no distinction is made between residential and production capital.
In addition, upon request by a Member of Congress, the JCT may perform a distributional analysis. A distributional analysis is a study of how a tax change’s aggregate costs and economic burdens are shared by taxpayers, taking into account their different incomes, consumption, etc. The JCT distributional analysis model the incremental changes in the distribution of tax costs and tax burdens that are expected to follow from a proposed change in law, when compared with current law and are designed to supplement the JCT macroeconomic analyses. The JCT provides the distributional effects of a proposal across a five year window for three filing statuses and nine income brackets. Complexity is increased as the JCT utilizes an expanded income concept which includes both taxable and tax exempt income. In addition, the JCT also predicts the tax impact of anticipated changes in taxpayer demographics and behavior.22 The JCT distributional analyses are more time consuming and costly to prepare than macroeconomic analyses because: (1) it is possible to determine the changes in total taxes paid without knowing how these tax changes are allocated among filing statuses and income groups, (2) data on the income levels of the affected taxpayers are not always available, and (3) in some cases, no reliable method is available to allocate to individuals the taxes paid by businesses. Unlike macroeconomic analysis, the distributional effect(s) on individual taxpayers of proposed tax law changes may not be available for two reasons. First, the JCT staff may decline a Member’s request for a distributional analysis in cases where the effects of a proposal on different income groups cannot be predicted with reasonable accuracy.23 Second, requests made by Members of Congress are treated as confidential, and the responses are released only to the Member making the request unless the Member decides to make the information public.24
3. PROPOSED TAX LAW CHANGE AND JCT STUDY
3.1 Proposed Tax Law Change
In 2006 a proposal to modify the individual income tax system by broadening the tax base and reducing statutory tax rates was introduced into Congress. As shown in Figure 1, the tax legislation proposes to broaden the individual tax base in the following ways. First, it eliminates most personal deductions for adjusted gross income (AGI) except for retirement savings deductions (individual retirement account
22 Joint Committee on Taxation. 2008. Reading JCT Staff Distribution Tables: An Introduction to
Methodologies and Issues (December 9). 23 Joint Committee on Taxation. 2000. Background Information Relating to the Joint Committee on
Taxation. JCX-1-00 (January 12). 24 Joint Committee on Taxation. See n 7 at 2.

eJournal of Tax Research Are JCT Analyses of Tax Change Proposals Useful to Individual Taxpayers?
140
(IRA) payments and Keogh plan payments) and self-employment taxes.25 In addition, all itemized deductions and personal/dependency exemptions would be eliminated.26
FIGURE 1: SUMMARY OF PROPOSED TAX CHANGES
Current Tax Law Proposed Tax Legislation
Gross income Gross income
- “For” AGI deductions - Modified “For” AGI deductions a
= AGI = Modified AGI
- Itemized deductions
or Standard deduction b - Standard deduction b
- Exemption amount c
= Taxable income = Modified taxable income
x Tax rated x Tax rated
= Current-law tax due = Proposed-law tax due
+ AMT e
- Nonrefundable credits - Reduced nonrefundable credits f
= Tax due before refundable credits = Modified tax due before refundable credits
- Refundable credits - Reduced refundable credits g
= Tax due
= Modified tax due
Notes:
a The proposal eliminates the following deductions for AGI: certain employee fringe benefits, educator expenses, certain business expenses of reservists, performing artists, etc., health savings accounts, moving expenses, self-employed health insurance, penalty on early withdrawal of savings, alimony paid, student loan
25 Under the proposal, the following deductions for AGI would be eliminated: educator expenses, certain
business expenses of reservists, performing artists, etc., health savings accounts, moving expenses, self-employed health insurance, penalty on early withdrawal of savings, alimony paid, student loan interest, tuition and fees, and domestic production activities. As a result, only business, rental, retirement savings, and self-employment tax deductions remain under the proposed tax law.
26 The JCT study states [page 2]: “[t]he largest categories of deductions repealed are present-law deductions for home mortgage interest expenses, state and local taxes, and charitable contributions. In addition, the exclusions for certain employee fringe benefits, such as employer contributions for health and life insurance as well as special tax incentives for specific activities (childcare, adoptions, and expenditures on personal residences to increase home efficiency) would be repealed.

eJournal of Tax Research Are JCT Analyses of Tax Change Proposals Useful to Individual Taxpayers?
141
interest, tuition and fees, and domestic production activities. As a result, only business, rental, retirement savings, and self-employment tax deductions remain under the proposed tax law.
b The proposal eliminates itemized deductions but retains the standard deduction.
c The proposal eliminates the personal and dependency exemption.
d Under the current tax law the short term ordinary tax rates are 10, 15, 25, 28, 33 and 35 percent. The proposed tax law reduces these rates to 7.55, 11.55, 19.10, 21.40, 25.20 and 26.80 percent.
e The proposal eliminates the AMT.
f The proposal eliminates all nonrefundable personal credits. Therefore, only the foreign tax credit, the general business credit, the empowerment zone and community renewal credit, and the nonconventional source fuel credit remain under the proposal.
g The proposal eliminates refundable personal tax credits with the exception of prepaid federal taxes, the earned income credit and the credit from regulated investment companies.
Additionally, the proposed tax legislation reduces the ordinary tax rates by approximately 32 percent relative to 2007 ordinary tax rates (10, 15, 25, 28, 33 or 35 percent). Specifically, the new rates would be 7.55, 11.55, 19.10, 21.40, 25.20, and 26.80 percent. The preferential tax rate on capital gains (and qualified dividends) would remain in effect but the AMT would be repealed. In addition, the proposal would eliminate most personal nonrefundable and refundable tax credits (except for the earned income credit and prepaid federal income taxes).27
3.2 JCT Macroeconomic Study
The impact of the proposed tax legislation on GDP, real business and residential capital stock, equipment, labor supply and consumption is estimated by the JCT staff using the MEG, OLG, and DSGE analyses. Each simulation model is run for three time periods: 2007 to 2011 (short-run), 2012 to 2016 (medium-run), and 2034 (long-run). The simulation results show that, in general, the base broadening provisions and lower MTRs provide additional incentives for work and investment, which is expected to increase real GDP, business investment, and employment. This analysis also suggests that housing investment is likely to decline due to the elimination of the property tax and home mortgage interest expense deductions. The extent of these declines, however, are expected to be dependent upon the sensitivity of individual labor choices to the changing ordinary tax rates, as well as how the new tax regime impacts Federal government borrowing and interest rates.28 Finally, both the MEG and OLG simulation results suggest that taxpayers’ short-run consumption will increase due to an overall reduction in their MTRs. In contrast, the DSGE model simulation results suggest that short term consumption will decrease primarily 27 As a result, only the foreign tax credit, the general business credit, the empowerment zone and
community renewal credit and the non-conventional source fuel credit would remain under the proposal. 28 Joint Committee on Taxation. Seee n 11 at 1.

eJournal of Tax Research Are JCT Analyses of Tax Change Proposals Useful to Individual Taxpayers?
142
because of a redistribution of individual explicit tax costs from high income to the low income wage earners. However, consistent with the other two models, this model predicts that individual consumption will increase over the two longer term periods.
4. METHODOLOGY
While the MEG and OLG analysis fail to incorporate any alternative individual taxpayer grouping variables into their models, the DSGE includes one variable to distinguish between two types of individuals: savers and spenders. Spenders are assumed to be those individuals in the lower portion of the income distribution (40th percentile of filers with positive income) with savers comprising the balance of the income distribution. While this feature allows for an analysis of the differential impact of a proposed tax law change on the explicit tax costs and consumption patterns of relatively low and high income individual households, it does not allow for more discrete individual taxpayer group partitions based on factors such as income level, filing status, itemizing deductions vs. taking the standard deduction, etc.29
We evaluate the range limitations inherent in the JCT macroeconomic studies by performing a microeconomic analysis on their explicit tax burdens before and after the proposed change in tax law. Whether individual tax costs will increase or decrease under the proposed tax legislation relative to the current law is an empirical issue. We utilize the SOI data obtained from the Fall 2007 Statistics of Income Bulletin as provided by the Internal Revenue Service (IRS) for the 2005 tax year to estimate average taxable income amounts for representative tax filers.30 The SOI data is based on a sample of tax returns, selected before audit, of individuals that filed tax returns using Forms 1040, 1040A and 1040EZ (including electronic returns). We estimate the tax due for each representative filer by applying the 2007 ordinary tax rates to the estimated current law taxable income amounts. Next, we estimate the total current year tax due amount by adding any AMT tax owed by each representative tax filer (obtained from SOI data) and reducing the total tax due by all nonrefundable and refundable tax credits (except for prepaid federal income taxes) available under current law (obtained from the SOI data).31
29 Id. at 6. 30 Internal Revenue Service (IRS). 2007. Statistics of Income Bulletin. 31 Taxable income for each filing status and AGI bracket is calculated by taking the mean AGI and
subtracting either the mean itemized deductions or the mean standard deduction and then subtracting the mean exemption amount. These SOI data are obtained from Table 1.2 – All Returns: Adjusted Gross Income, Exemptions, Deductions, and Tax Items, by Size of Adjusted Gross Income and by Marital Status, Tax Year 2005. The data provided in the IRS SOI tables do not explicitly state the amount of capital gains income that receives preferential treatment, nor the tax rate. Therefore, we estimate the maximum amount of income that might receive preferential treatment by adding mean qualified dividends and mean taxable net capital gains and subtracting the mean investment interest expense deduction. These SOI data are obtained from Table 2.1 – Returns with Itemized deductions: Sources of Income, Adjustments, Itemized Deductions by Type, Exemptions, and Tax Items, by Size of Adjusted Gross Income, Tax Year 2005 or Table 1.4 – All returns: Sources of Income, Adjustments, and Tax Items, by Size of Adjusted Gross Income, Tax Year 2005 for returns with itemized deductions or using the standard deduction, respectively. Then, the amount of preferential income is subjected to a tax rate of either five or 15 percent. The remaining taxable income is then subjected to individual rates using the 2007 tax brackets. The mean alternative minimum tax is also obtained from either Table 2.1 or Table 1.4 and added to the sum of the preferential tax and individual tax to determine the tax liability before credits. Table 3.3 – All Returns: Tax Liability, Tax Credits, and Tax Payments, by Size of Adjusted

eJournal of Tax Research Are JCT Analyses of Tax Change Proposals Useful to Individual Taxpayers?
143
Next, we estimate each representative tax filer’s modified taxable income by considering the impact of the base broadening provisions associated with the proposed tax legislation to convert “current law” taxable income to “proposed law” taxable income.32 We then estimate each representative tax filer’s tax due under the proposed legislation by applying the proposed ordinary tax rates to their modified taxable income amount. We then reduce this amount by any nonrefundable/refundable tax credits allowed under the proposal to estimate the modified tax due under the proposed tax legislation.33 Finally, we evaluate the impact of the proposed tax law change by comparing the estimated current law tax due to the proposed law tax due for each hypothetical taxpayer. Table 1 describes how the SOI data is used; Panel A provides the calculations for taxable income, preferential income calculations are in Panel B, while the calculations for total income taxes are in Panel C.34
TABLE 1: CALCULATIONS UTILIZING THE INTERNAL REVENUE SERVICES (IRS) STATISTICS OF
INCOME (SOI) DATA Current Law - Standard Deduction
Current Law - Itemized Deductions
Proposed Tax Law
Variable
IRS SOI Table
Variable
IRS SOI Table
Variable
IRS SOI Table
Panel A: Determination of Taxable Income Adjusted Gross Income
1.2a
Adjusted Gross Income
1.2a
Adjusted Gross Income
1.2a
+ “For” AGI deductions eliminated
1.4b
Revised AGI - Standard Deduction
1.2a - Itemized Deductions 1.2a - Standard Deduction 1.2a
- Exemption Amount 1.2a - Exemption Amount 1.2a Taxable Income Taxable Income Taxable Income Panel B: Determination of Preferential Income Net gain from sales of capital assets
1.4c
Net gain from sales of capital assets
1.4c
Net gain from sales of capital assets
1.4c
+ Capital Gain 1.4c + Capital Gain 1.4c + Capital Gain 1.4c
Gross Income, Tax Year 2005 is used to obtain SOI data for tax credits. First, the mean nonrefundable credits are subtracted from the tax liability before credits. This amount is set to zero if the result is negative. Then, the mean refundable credits are subtracted to determine the total income tax.
32 We determine the mean gross income for each filing status and AGI bracket by adding the mean “for” AGI deductions to the mean AGI. We then subtract the “for” AGI deductions remaining in the proposal to determine the modified AGI. These SOI data are obtained from Table 1.4.
33 The SOI data for mean credit amounts remaining in the proposal are obtained from Table 3.3. 34 All supporting calculations are available from the authors upon request.

eJournal of Tax Research Are JCT Analyses of Tax Change Proposals Useful to Individual Taxpayers?
144
Distributions Distributions Distributions + Qualified Dividends
1.4c + Qualified Dividends
2.1d + Qualified Dividends 1.4c
- Investment Interest Expense
2.1d
Preferential Income Preferential Income Preferential Income Panel C: Determination of Income Tax Capital Gains Tax
Capital Gains Tax
Capital Gains Tax
+ Ordinary Income Tax + Ordinary Income Tax + Ordinary Income Tax + Alternative Minimum Tax
1.4c + Alternative Minimum Tax
2.1d + Alternative Minimum Tax
1.4c
- Nonrefundable Credits 3.3e - Nonrefundable Credits 3.3e - Nonrefundable Creditsf
3.3e
Tax before Refundable Credits (≥ 0)
Tax before Refundable Credits (≥ 0)
Tax before Refundable Credits (≥ 0)
- Refundable Credits 3.3e - Refundable Credits 3.3e - Refundable Creditsf 3.3e
Income Tax (Refund) Income Tax (Refund) Income Tax (Refund)
Notes:
a Adjusted gross income, the standard deduction, itemized deductions, and the exemption amount are obtained from the Internal Revenue Service (IRS) 2007 Statistics of Income (SOI) Bulletin Table 1.2 – All Returns: Adjusted Gross Income, Exemptions, Deductions, and Tax Items, by Size of Adjusted Gross Income and by Marital Status, Tax Year 2005.
b The tax change proposal eliminates most above-the-line deductions with the exception of retirement savings deductions and self-employment taxes. Therefore, we add back all “For” AGI deductions with the exception of individual retirement account (IRA) payments, Keogh plan payments, and self-employment taxes to determine a revised AGI amount. These data are obtained from the Internal Revenue Service (IRS) 2007 Statistics of Income (SOI) Bulletin Table 1.4 – All returns: Sources of Income, Adjustments, and Tax Items, by Size of Adjusted Gross Income, Tax Year 2005.
c Taxable net gain from the sales of capital assets, capital gain distributions, qualified dividends, and the alternative minimum tax are obtained from the Internal Revenue Service (IRS) 2007 Statistics of Income (SOI) Bulletin Table 1.4 – All returns: Sources of Income, Adjustments, and Tax Items, by Size of Adjusted Gross Income, Tax Year 2005.
d Qualified dividends, the investment interest expense deduction, and the alternative minimum tax for itemized returns are obtained from the Internal Revenue Service (IRS) 2007 Statistics of Income (SOI) Bulletin Table 2.1 – Returns with Itemized deductions: Sources of Income, Adjustments, Itemized Deductions by Type, Exemptions, and Tax Items, by Size of Adjusted Gross Income, Tax Year 2005.
e The Internal Revenue Service (IRS) 2007 Statistics of Income (SOI) Bulletin Table 3.3 – All Returns: Tax Liability, Tax Credits, and Tax Payments, by Size of Adjusted Gross Income, Tax Year 2005 is used to obtain SOI data for tax credits.

eJournal of Tax Research Are JCT Analyses of Tax Change Proposals Useful to Individual Taxpayers?
145
f The proposal eliminates most personal nonrefundable and refundable credits except for prepaid federal income taxes and the earned income credit. The foreign tax credit, the general business credit, the empowerment zone and community renewal credit and the non conventional source fuel credit would remain under the proposal.
We increase the precision of different taxpayer groups examined by performing this analysis for taxpayers in each of the following AGI income ranges35:
Under $5,000,
$5,000 to under $10,000,
$10,000 to under $15,000,
$15,000 to under $20,000,
$20,000 to under $25,000,
$25,000 to under $30,000,
$30,000 to under $40,000,
$40,000 to under $50,000,
$50,000 to under $75,000,
$75,000 to under $100,000,
$100,000 to under $200,000,
$200,000 to under $500,000, and
$500,000 to under $1,000,000.
We also expand the range of alternative taxpayer groups that might be impacted by the proposed change in tax law by separately considering two distinct filing groups: those that had an explicit tax burden upon filing (taxable filers) and those who did not (non taxable filers). For each subgroup, we perform this analysis separately for representative tax filers that itemized deductions or claimed the standard deduction. In addition, this analysis is stratified into the following filing status subgroups: Single, Unmarried Head of Household (HofH) and Married Filing Jointly (MFJ). 36
The SOI data for each variable in each AGI bracket is presented as a total dollar amount. In addition, the number of returns is provided, so that the mean amount for each return in that AGI bracket can be determined.37 This SOI data is provided for
35 These AGI ranges correspond to the ranges used in the SOI Bulletin. As the proposal impacts “For”
AGI deductions, modified AGI’s are calculated to determine the impact of the proposal (See Figure 1). 36 Single, HofH and MFJ returns comprised 98 percent of the total returns filed for the 2005 tax year
[Internal Revenue Service (IRS). 2007. Statistics of Income Bulletin]. Distributional analyses performed by the JCT only include nine different income brackets, and make no distinction between taxpayers that itemize and those that take the standard deduction, or between taxable and nontaxable filers.
37 The IRS SOI data does not provide sufficient detail to determine either the median or mode.

eJournal of Tax Research Are JCT Analyses of Tax Change Proposals Useful to Individual Taxpayers?
146
both all returns filed and taxable returns filed. Therefore, by subtracting the taxable return amount from the total return amount (both the dollar amount and the number of returns), the mean nontaxable return amount can also be determined. This methodology is used to determine the mean amount for each variable listed in Table 1.
eJournal of Tax Research Are JCT Analyses of Tax Change Proposals Useful to Individual Taxpayers?
147
5. RESULTS
5.1 Selected Descriptive Statistics
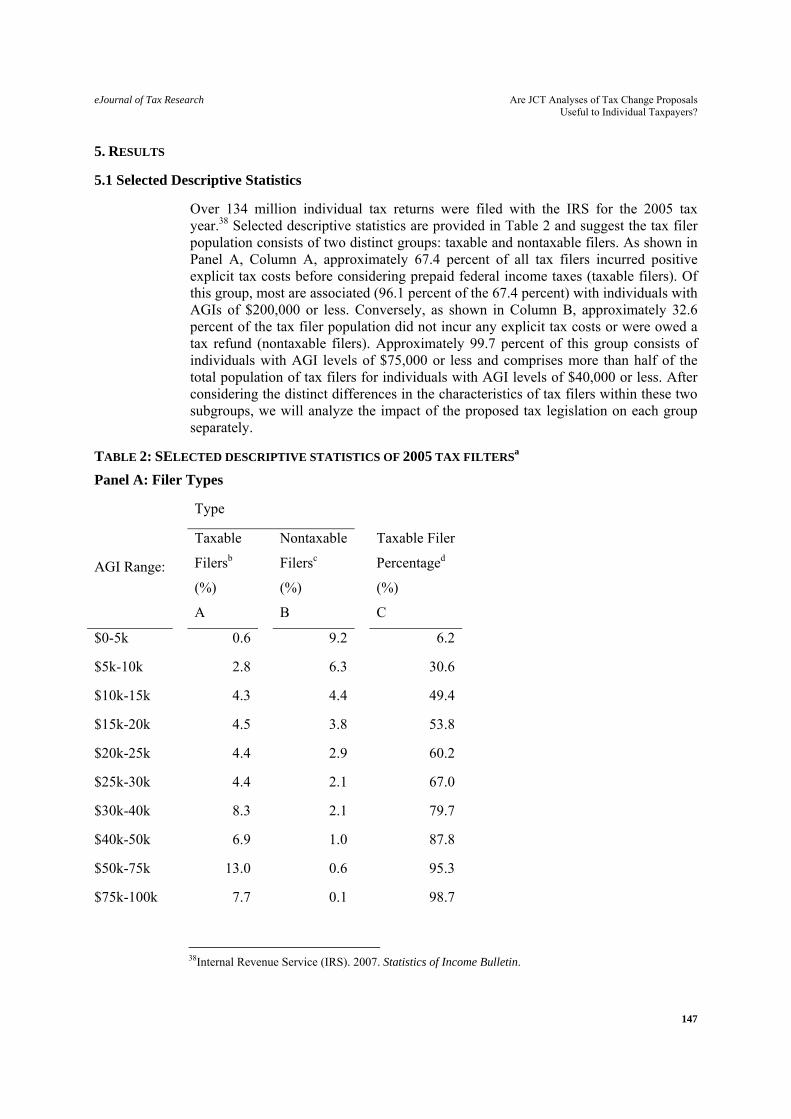
Over 134 million individual tax returns were filed with the IRS for the 2005 tax year.38 Selected descriptive statistics are provided in Table 2 and suggest the tax filer population consists of two distinct groups: taxable and nontaxable filers. As shown in Panel A, Column A, approximately 67.4 percent of all tax filers incurred positive explicit tax costs before considering prepaid federal income taxes (taxable filers). Of this group, most are associated (96.1 percent of the 67.4 percent) with individuals with AGIs of $200,000 or less. Conversely, as shown in Column B, approximately 32.6 percent of the tax filer population did not incur any explicit tax costs or were owed a tax refund (nontaxable filers). Approximately 99.7 percent of this group consists of individuals with AGI levels of $75,000 or less and comprises more than half of the total population of tax filers for individuals with AGI levels of $40,000 or less. After considering the distinct differences in the characteristics of tax filers within these two subgroups, we will analyze the impact of the proposed tax legislation on each group separately.
TABLE 2: SELECTED DESCRIPTIVE STATISTICS OF 2005 TAX FILTERSa
Panel A: Filer Types
Type
AGI Range:
Taxable
Filersb
(%)
A
Nontaxable
Filersc
(%)
B
Taxable Filer
Percentaged
(%)
C
$0-5k 0.6 9.2 6.2
$5k-10k 2.8 6.3 30.6
$10k-15k 4.3 4.4 49.4
$15k-20k 4.5 3.8 53.8
$20k-25k 4.4 2.9 60.2
$25k-30k 4.4 2.1 67.0
$30k-40k 8.3 2.1 79.7
$40k-50k 6.9 1.0 87.8
$50k-75k 13.0 0.6 95.3
$75k-100k 7.7 0.1 98.7
38Internal Revenue Service (IRS). 2007. Statistics of Income Bulletin.

eJournal of Tax Research Are JCT Analyses of Tax Change Proposals Useful to Individual Taxpayers?
148
$100k-200k 8.0 0.0 100.0
$200k-500k 2.0 0.0 100.0
$500k-1M 0.4 0.0 100.0
> $1M 0.2 0.0 100.0
Total 67.4 32.6
Panel B: Standard Deduction Filers vs. Itemizers
Taxable Filersb (%) Nontaxable Filersc (%)
AGI Range:
Standarde
A
Itemizerse
B
Standarde
C
Itemizerse
D
$0-5k 98.5 1.4 96.9 3.1
$5k-10k 99.3 0.7 93.0 7.0
$10k-15k 95.2 4.8 86.9 13.1
$15k-20k 89.4 10.6 85.6 14.4
$20k-25k 84.6 15.4 81.3 18.7
$25k-30k 79.0 21.0 75.7 24.3
$30k-40k 70.5 29.5 61.5 38.5
$40k-50k 58.5 41.4 40.7 59.3
$50k-75k 42.2 57.8 16.6 83.4
$75k-100k 23.9 76.1 2.7 97.3
$100k-200k 10.4 89.6 10.3 89.7
$200k-500k 5.8 94.2 17.7 82.2
$500k-1M 8.0 92.0 19.6 80.4
> $1M 8.2 91.8 16.6 83.3
Notes:
a This table is developed using data taken from the Fall 2007 SOI Bulletin for the 2005 tax year.
b Represents individual taxpayers that owed federal income taxes for the 2005 tax year (prior to considering prepaid income taxes).
c Represents individual taxpayers that did not owe federal income taxes (or expected a tax refund) for the 2005 tax year (prior to considering prepaid income taxes).

eJournal of Tax Research Are JCT Analyses of Tax Change Proposals Useful to Individual Taxpayers?
149
d Computed as follows: percentage of taxable filers divided by the sum of the percentage of taxable and non taxable filers.
e Standard represents the percentage of individual filers that claimed the standard deduction on their 2005 tax returns. Itemizers represent the percentage of individual filers that itemized deductions on their 2005 tax returns.
The breakout between tax filers that claimed the standard deduction or who itemized deductions is shown in Panel B of Table 2. As shown in Columns A and B, more than half of the taxable filers with AGI levels less than $50,000 claimed the standard deduction on their 2005 tax returns while the majority of filers with AGI levels in excess of $50,000 itemized deductions. Similarly, the majority of nontaxable filers with AGI levels less than $40,000 claimed the standard deduction on their 2005 tax return, while the majority of filers with AGIs in excess of $40,000 itemized deductions (Columns C and D).
5.2 Results: Taxable Returns
The microeconomic results for the taxable filers’ subgroup are presented in Table 3. The estimated current law tax due (before prepaid federal income taxes) is shown in Column A for representative filers claiming the standard deduction and Column B for representative filers that itemized deductions. The proposed law tax due (before prepaid income taxes) is shown in Column C. The next column indicates whether the proposed tax law change increases (decreases) each representative tax filers explicit tax costs relative to their current law tax amounts (standard deduction or itemizer). We do not consider representative filers with AGI levels less than $5,000 or greater than $1 million since they comprise a relatively small percentage of this tax filer population.39 Consistent with the DSGE model simulation result predictions, our results suggest that representative filers with the highest AGIs (over $200,000) will enjoy a reduction in their explicit tax costs under the proposed tax legislation at the expense of representative filers at the lower AGI levels. More specifically, taxpayers with the lowest AGIs (less than $25,000) will generally experience an increase in their explicit tax costs.40 The impact to taxpayers with AGIs between $25,000 and $200,000 depends somewhat on their filing status and whether they use the standard deduction (or itemize) but generally we show they will also experience an increase in their explicit tax costs.
39 After this adjustment, our analysis addresses approximately 98.8 percent of the total population of
taxable filers. 40 Similar results were obtained using the 2004 SOI data.

eJournal of Tax Research Are JCT Analyses of Tax Change Proposals Useful to Individual Taxpayers?
150
TABLE 3: ESTIMATED TAX DUE COMPARISONS FOR TAXABLE FILER SUBGROUP
Tax Due: Current Law Tax Due: Proposed Tax Law
AGI Range:
Standardb
A
Itemizersb
B
Tax Dueb
C
Increase (+)
Decrease (-)
(C-A , C-B)
Eliminate
Pref. Tax
Ratesb
D
Increase (+)
Decrease (-)
(D-A , D-B)
Panel A: Single
$5k-10k $ 176 $ 245 $ 204e (+,-) $ 209 (+,-)
$10k-15k 427 176 546d,f (+,+) 552 (+,+)
$15k-20k 958 465 1,127d,f (+,+) 1,117 (+,+)
$20k-25k 1,644 911 1,709f (+,+) 1,697 (+,+)
$25k-30k 2,341 1,516 2,285f (-,+) 2,270 (-,+)
$30k-40k 3,292 2,348 3,131c,f (-,+) 3,114 (-,+)
$40k-50k 4,975 3,565 4,837f (-,+) 4,870 (-,+)
$50k-75k 8,550 6,118 7,776d,f (-,+) 7,828 (-,+)
$75k-100k 14,535 11,304 12,596d,f (-,+) 12,756 (-,+)
$100k-200k 27,426 21,786 22,269d,f (-,+) 22,750h (-,+)
$200k-500k 73,703 60,601 55,878d,f (-,-) 60,081i (-,-)
$500k-1M 190,870 155,042 144,270d,f (-,-) 161,708i (-,+)
Panel B: Head of Household
$5k-10k $ 19 $ (3) $ 498d,f (+,+) $ 503 (+,+)
$10k-15k 93 10 468d,f (+,+) 474 (+,+)
$15k-20k 374 90 759d,f (+,+) 766 (+,+)
$20k-25k 813 540 1,315d,f (+,+) 1,339 (+,+)
$25k-30k 1,439 899 1,887d,f (+,+) 1,917 (+,+)
$30k-40k 2,271 1,537 2,719d,f (+,+) 2,751 (+,+)
$40k-50k 3,559 2,569 3,862d,f (+,+) 3,916 (+,+)
$50k-75k 5,663 4,060 6,381d,f (+,+) 6,433 (+,+)
$75k-100k 11,646 8,178 11,169d,f (-,+) 11,272 (-,+)

eJournal of Tax Research Are JCT Analyses of Tax Change Proposals Useful to Individual Taxpayers?
151
$100k-200k 22,448 17,219 19,314d,f (-,+) 19,795i (-,+)
$200k-500k 71,001 57,641 54,291d,f (-,-) 58,493i (-,+)
$500k-1M 188,092 150,862 142,153d,f (-,-) 159,591i (-,+)
Panel C: Married Filing Jointly
$5k-10k $ (3) $ (3) $ (3) (0,0) $ (3) (0,0)
$10k-15k (6) (6) 247d,f (+,+) 253 (+,+)
$15k-20k 94 22 590d,f (+,+) 598 (+,+)
$20k-25k 390 159 857d,f (+,+) 866 (+,+)
$25k-30k 846 455 1,273d,f (+,+) 1,302 (+,+)
$30k-40k 1,565 913 2,214d,f (+,+) 2,246 (+,+)
$40k-50k 2,776 1,892 3,379d,f (+,+) 3,432 (+,+)
$50k-75k 5,019 3,963 5,361d,f (+,+) 5,445 (+,+)
$75k-100k 8,333 6,840 9,088d,f (+,+) 9,190 (+,+)
$100k-200k 19,835 15,648 17,689d,f (-,+) 17,997g (-,+)
$200k-500k 64,073 52,680 49,787d,f (-,-) 53,989i (-,+)
$500k-1M 183,450 151,832 138,618d,f (-,-) 156,056i (-,+)
Notes:
a This table is developed by using data taken from the Fall 2007 SOI Bulletin for the 2005 tax year. Supporting calculations are available from the authors upon request.
b Represents estimated tax due (before prepaid income taxes) for the following taxable filer subgroups: (1) individual filers that claimed the standard deduction (itemized) under the current law, (2) individual filers under the proposed tax law and (3) individual filers under the proposed tax law assuming that the preferential tax rate on capital gains (and qualifying dividends) was also eliminated.
c The tax due under the proposal is significantly different from the current tax due for taxpayers using the standard deduction at the 0.05 level using a two-tailed Chi-squared test.
d The tax due under the proposal is significantly different from the current tax due for taxpayers using the standard deduction at the 0.01 level using a two-tailed Chi-squared test.
e The tax due under the proposal is significantly different from the current tax due for taxpayers itemizing deductions at the 0.05 level using a two-tailed Chi-squared test.
f The tax due under the proposal is significantly different from the current tax due for taxpayers itemizing deductions at the 0.01 level using a two-tailed Chi-squared test.

eJournal of Tax Research Are JCT Analyses of Tax Change Proposals Useful to Individual Taxpayers?
152
g The tax due without preferential treatment for capital gains is significantly different from the tax due under the proposal at the 0.1 level using a two-tailed Chi-squared test.
h The tax due without preferential treatment for capital gains is significantly different from the tax due under the proposal at the 0.05 level using a two-tailed Chi-squared test.
i The tax due without preferential treatment for capital gains is significantly different from the tax due under the proposal at the 0.01 level using a two-tailed Chi-squared test.
We further investigate this result by examining the gross income composition for 2005 individual tax filers. As shown in Figure 2, tax filers with gross income levels less than $100,000 generate relatively low percentages (less than 3 percent) of preferential type income (long term capital gains and qualifying dividends). Meanwhile, tax filers with gross income levels in excess of $100,000 report increasing (by gross income) relative percentages of preferential type income. This result suggests that the explicit tax cost redistribution effect noted above may be due to the proposals failure to repeal the preferential tax rates afforded to long term capital gains/qualifying dividends. We examine whether this is the case by re-estimating each representative filer’s explicit tax cost (before prepaid income taxes) under the proposed tax law assuming that the preferential income tax rates is also repealed.41 The result as presented Column D of Table 3, show that the additional repeal of the preferential income ordinary tax rates reduces (but does not eliminate) the explicit tax redistribution effect by increasing the tax costs of representative tax filers with AGI levels of $200,000 or more. As expected, any repeal would have a negligible effect on representative filers with AGI levels of $200,000 or less due to their relatively low use of preferential income investment vehicles.
41 It is beyond the scope of this study to forecast the behavioral changes of taxpayers due to a capital
gains tax rate change as we perform a static distributional analysis. We suggest that this change be considered in conjunction with the proposal for two reasons. First, while the proposal is obviously designed to simplify the tax system, the preferential rates for capital gains vastly complicates this system (Burman, Leonard. 1999. The Labyrinth of Capital Gains Tax Policy: A Guide for the Perplexed. Washington, DC: Brookings Institution, 49). Second, the proposal eliminates the tax benefits of increasing consumption by eliminating deductions for mortgage interest on residences, sales taxes, and property taxes in addition to decreasing the lock-in effect on capital gains by eliminating deductions for charitable contributions. Further reduction in the lock-in effect could be accomplished by the elimination the step-up of basis on inherited capital assets. Therefore, the elimination of the preferential treatment of capital gains should not increase consumption, but only shift investments from current tax-favored investments into other investments that may be more efficient. Efficiency can also be enhanced by decreasing the lock-in effect as discussed above.

eJournal of Tax Research Are JCT Analyses of Tax Change Proposals Useful to Individual Taxpayers?
153
FIGURE 2: PREFERENTIAL INCOME AS A PERCENTAGE OF GROSS INCOME. MARRIED FILING
JOINTLY – ALL RETURNS
5.3 Results: Nontaxable Returns
The microeconomic results for the nontaxable return filers’ subgroup are presented in Table 4. Consistent with Table 3, the estimated current law tax due (before prepaid federal income taxes) is shown in Column A for representative filers that claimed the standard deduction and Column B for representative filers that itemized deductions. The proposed law tax due (before prepaid income taxes) is shown in Column C. The next column indicates whether the proposed tax law change increases (decreases) each representative tax filers explicit tax costs relative to their current law tax cost amounts (standard deduction or itemizer). Based on the descriptive statistics for this subgroup as provided in Table 2, we only present information for nontaxable representative filers with AGI levels of $75,000 or less.42
42 This allows us to consider approximately 99.6 percent of the nontaxable filer population.
0.0%
5.0%
10.0%
15.0%
20.0%
25.0%
$5-10K $10-15K $15-20K $20-25K $25-30K $30-40K $40-50K $50-75K $75-100K $100-200K $200-500K $500-1,000K
AGI Bracket
Perc
enta
ge o
f Pr
efer
inti
al I
ncom
e

eJournal of Tax Research Are JCT Analyses of Tax Change Proposals Useful to Individual Taxpayers?
154
TABLE 4: ESTIMATED TAX DUE COMPARISONS FOR NONTAXABLE FILER SUBGROUPa
Tax Due: Current Law Tax Due: Proposed Tax Law
AGI Range:
Standardb
A
Itemizersb
B
Tax Dueb
C
Increase (+)
Decrease (-)
(C-A, C-B)
Eliminate
Pref. Tax
Ratesb
Increase (+)
Decrease (-)
(C-A, C-B)
Panel A: Single
< $5k $ (188) $ (188) $ (156) (+,+) $ (156) (+,+)
$5k-10k (961) (961) (789)d,f (+,+) (786) (+,+)
$10k-15k (1,985) (2,199) (1,493)d,f (+,+) (1,487) (+,+)
$15k-20k (1,894) (2,452) (793)d,f (+,+) (801) (+,+)
$20k-25k (1,530) (2,388) 79d,f (+,+) 73 (+,+)
$25k-30k (581) (1,984) $1,196d,f (+,+) 1,188 (+,+)
$30k-40k 0 (1,454) 2,778d,f (+,+) 2,760 (+,+)
$40k-50k 0 0 5,013d,f (+,+) 5,049 (+,+)
$50k-75k 0 0 7,580d,f (+,+) 7,679 (+,+)
Panel B: Head of Household
< $5k $ (188) $ (188) $ (156)c,e (+,+) $ (156) (+,+)
$5k-10k (961) (961) (354)d,f (+,+) (351) (+,+)
$10k-15k (2,199) (2,199) (1,659)d,f (+,+) (1,653) (+,+)
$15k-20k (2,452) (2,452) (1,151)d,f (+,+) (1,145) (+,+)
$20k-25k (2,164) (2,388) (299)d,f (+,+) (289) (+,+)
$25k-30k (1,606) (1,984) 780d,f (+,+) 795 (+,+)
$30k-40k (630) (1,454) 2,270d,f (+,+) 2,303 (+,+)
$40k-50k 0 0 3,738d,f (+,+) 3,796 (+,+)
$50k-75k 0 0 5,755d,f (+,+) 5,854 (+,+)
Panel C: Married Filing Jointly
< $5k $ (188) $ (188) $ (156)c,e (+,+) $ (156) (+,+)
$5k-10k (961) (961) (950) (+,+) (950) (+,+)
$10k-15k (2,199) (2,199) (1,900)d,f (+,+) (1,894) (+,+)

eJournal of Tax Research Are JCT Analyses of Tax Change Proposals Useful to Individual Taxpayers?
155
$15k-20k (2,452) (2,452) (1,418)d,f (+,+) (1,412) (+,+)
$20k-25k (2,388) (2,388) (658)d,f (+,+) (654) (+,+)
$25k-30k (1,984) (1,984) 326d,f (+,+) 340 (+,+)
$30k-40k (1,386) (1,454) 1,879d,f (+,+) 1,913 (+,+)
$40k-50k 0 0 3,337d,f (+,+) 3,394 (+,+)
$50k-75k 0 0 4,869d,f (+,+) 5,027g (+,+)
Notes
a This table is developed by using data taken from the Fall 2007 SOI Bulletin for the 2005 tax year. Supporting calculations are available from the authors upon request.
b Represents estimated tax due (before prepaid income taxes) for the following nontaxable filer subgroups: (1) individual filers that claimed the standard deduction (itemized) under the current law, (2) individual filers under the proposed tax law and (3) individual filers under the proposed tax law assuming that the preferential tax rate on capital gains (and qualifying dividends) was also eliminated.
c The tax due under the proposal is significantly different from the current tax due for taxpayers using the standard deduction at the 0.1 level using a two-tailed Chi-squared test.
d The tax due under the proposal is significantly different from the current tax due for taxpayers using the standard deduction at the 0.01 level using a two-tailed Chi-squared test.
e The tax due under the proposal is significantly different from the current tax due for taxpayers itemizing deductions at the 0.1 level using a two-tailed Chi-squared test.
f The tax due under the proposal is significantly different from the current tax due for taxpayers itemizing deductions at the 0.01 level using a two-tailed Chi-squared test.
g The tax due without preferential treatment for capital gains is significantly different from the tax due under the proposal at the 0.1 level using a two-tailed Chi-squared test.
Our results indicate that most representative nontaxable filers expect to receive tax refunds under the current law due to the utilization of the earned income credit. Consistent with the predictions of the MEG/OLG simulation models, we show that the proposed tax legislation will increase explicit tax costs across the board to this subgroup by reducing their expected refunds. We also show that some representative filers will be forced to incur positive explicit tax costs to the federal government (before considering prepaid federal income taxes). More specifically, this involves typical taxpayers in the following AGI groups: single filers with AGIs greater than $20,000; HofH filers with AGIs greater than $25,000; and MFJ filers with AGIs greater than $30,000. This latter result is important because it suggest that the proposed tax legislation will negatively impact a group of taxpayers that typically can least afford to pay taxes. Consistent with taxable return group, we also estimate the impact of repealing the preferential tax rates on long term capital gains (and

eJournal of Tax Research Are JCT Analyses of Tax Change Proposals Useful to Individual Taxpayers?
156
qualifying dividends) on nontaxable filers. As expected, this additional repeal would not appreciably impact this subgroup since, on average; they do not significantly rely on these investment vehicles as an income source.43
6. SUMMARY AND CONCLUSIONS
This study examines whether individual taxpayers can rely on the JCT proposed tax law change studies for their own tax purposes. Overall, our results indicate that the JCT macroeconomic studies do not fully reveal the impact of proposed tax legislation on individual tax return filers. More specifically, we show that the proposed tax legislation entitled Macroeconomic Analysis of a Proposal to Broaden the Individual Income Tax Base and Lower Individual Income Tax Rates will differentially impact two filing groups: those that pay taxes under the current tax law (taxable filers) and those that do not (nontaxable filers). For the taxable filer subgroup, we show the proposed tax legislation will result in a redistribution of explicit tax costs from high to low income taxpayers. We also show that this disparity can be reduced, but not eliminated if the preferential tax rate on capital gains (and qualified dividends) is eliminated in conjunction with the adoption of the proposal. In contrast, we illustrate that the proposed tax legislation will increase the explicit tax costs to all nontaxable filers by either reducing their tax refunds or forcing them to pay taxes to the federal government. Finally, we show that repealing the preferential tax rate on capital gains (and qualifying dividends) will have little impact on this subgroup since most nontaxable filers do not generate substantial amounts of preferential income.
The JCT study reports that all three macroeconomic simulations predict an increase in short run real GDP under the proposal, partially attributable to the decrease in marginal tax rates.44 However, we believe that these analyses do not adequately take into account the increase in average tax rates for most of the low and middle income filers, resulting in higher explicit tax burdens and leaving less disposable income. Therefore, these groups of filers will, by necessity, reduce consumption which should result in a reduction in real GDP. Our contribution to the literature is to point out the shortcomings of JCT proposed tax law change studies. In addition, this article presents a simple methodology to determine the distributional impact of tax proposals on individuals using publically available information.
Similar to JCT distributional studies, our methodology allows individual taxpayers to estimate the distributional impact of a proposed tax law change on individual explicit tax burdens. In contrast to JCT distributional studies that attempts to incorporate both taxpayer behavioral changes to the proposal and compliance issues, our analyses predicts the static impact to taxpayers prior to behavioral changes. In addition, our methodology allows for the estimation of the impact of a proposed tax law change on taxable and nontaxable filers as well as individual taxpayers who itemize or take the standard deduction.45 Since the JCT is not legally required to perform a distributional analysis for each proposed tax law change or make any report it does produce
43 Average filers with AGIs of less than $100,000 have less than 3% of preferential income (see Figure 2). 44 Joint Committee on Taxation. 2006. Macroeconomic Analysis of a Proposal to Broaden the Individual
Income Tax Base and Lower Individual Income Tax Rates. JCX-53-06 (December 14): 10. 45 Joint Committee on Taxation. 2008. Reading JCT Staff Distribution Tables: An Introduction to
Methodologies and Issues (December 9) provides additional detail on the methodology used to develop JCT distribution tables.

eJournal of Tax Research Are JCT Analyses of Tax Change Proposals Useful to Individual Taxpayers?
157
available to the public, our methodology provides individual taxpayers a cost effective means of estimating the distributional effects of proposed tax legislation on their explicit tax burdens using publically available data.
Our methodology is applicable to other countries that have publically available tax return statistics that is stratified into various income brackets. Some countries (e.g., Australia; New Zealand) that do not provide this type of data may want to consider the benefit of supplying this data so that individuals can determine the impact of proposed tax legislation on their own particular circumstance.46
46 We thank an anonymous reviewer for this suggestion.