eko10 - security monitoring for big infrastructures without a million dollar budget (juan berner...
TRANSCRIPT

Security Monitoring for big Infrastructureswithout a Million Dollar budget
oMonitoring like the NSA (con precios
cuidados)
#eko10

About us● Juan Berner
○ @89berner○ Hobbies = ['Movies/Series','Reading','Programming']○ Mostly Blue Team○ http://secureandscalable.wordpress.com/
● Hernán Costante○ @hachedece○ Security Monitoring & Incident Response fan○ Open Source lover ♥
About MercadoLibre● Devops culture (everyone and their mothers can access the boxes)● Hybrid Cloud of Openstack & Others (servers being destroyed constantly)● Infrastructure as a service● Database as a service● Database servers > 1K && Servers > 15K● Daily logs > 100GB (and growing)
What is this talk about?● ELK (Elasticsearch - Logstash - Kibana)
● Controlling the infrastructure that supports it ● Monitoring at scale with open source tools
Outline
● Introduction to Monitoring● How it used to be● Background● Implementation● Demo● Outro

Intro
So why monitoring?
Monitoring helps in● Fulfilling compliance (PCI, SOX, BACEN, HIPAA, BCRA, etc)
● Not just trusting your audits (what happens in the mean time?)
● Crucial for Incident Response
● Know how your infrastructure works (you can’t protect what you don’t know is there)
Some Warnings● This talk is not an offensive talk (no 0days
coming up)
● Being free does not mean it has no cost ● You will need to invest in training your staff to
handle the infrastructure ● Your only limit is what you can build around it

What we mean is● We will talk about a LOT of open source solutions
● Every setup can be different (choose what helps your environment)
● > 30k lines of code supporting the infrastructure (ruby, python, node.js and go mostly)
● You will do most of the support but will not be limited by a vendor
● google -> irc -> mailing lists

We will talk about the old security monitoring for just a moment
The old monitoring paradigm● A lot of limitations
○ Limited storage○ Only security logs○ Select and filter inputs…○ Regex everywhere: lifestyle & nightmares○ Relational databases for storage

The old monitoring paradigm (2)● Commercial SIEMs
○ Expensive○ Hard & soft closed○ Inflexible○ Licenses & support & professional services ($$$)○ You are learning about a product○ Being a Gartner’s Magic Quadrant Leader doesn’t
resolve security incidents

… and now about their problems

Efficiency

Capacity

Complexity

Preparing for the worst Consider that sooner or later:
Are you prepared?Can you resolve a complex security incident with your old SIEM?

...but things are changing
New security monitoring paradigm● Ask for your logs in huge amounts of data at any time● Get fast responses● Log absolutely everything... even the network flows● Contextualization● Behavior analysis & historical comparisons● Holistic visualization● Metadata (tags)
New security monitoring paradigm (2) ● Hybrid cloud (private & public)● Integration● Bigger security monitoring infrastructure● Resilience & distribution● Hybrid storage (expensive & cheap)● Open source synergy

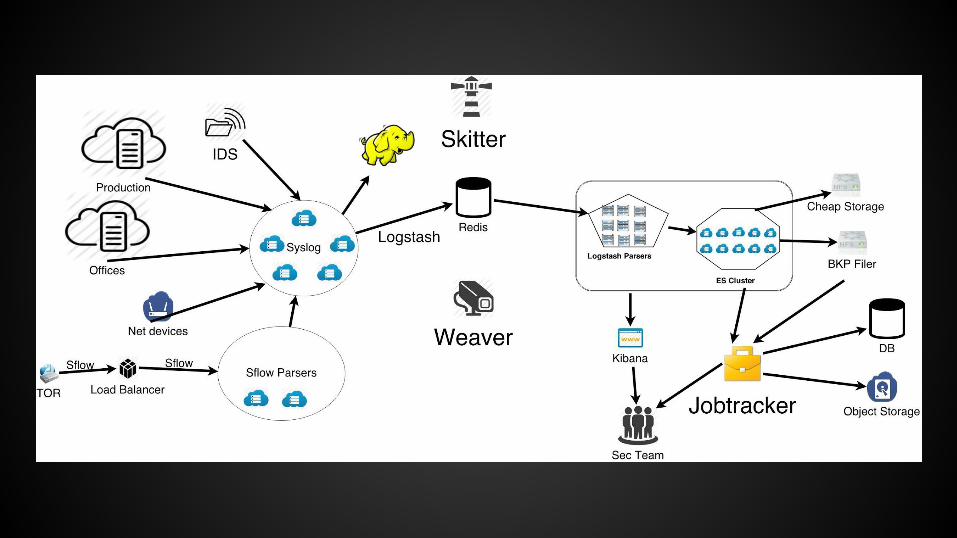
How we Implement it● ELK (Elasticsearch - Logstash - Kibana)
● Archiving with Hadoop and Block Storage
● Centralized reporting tool
● Our own system to control our infrastructure
● A custom monitoring tool
Some Inputs● Server logs● Firewalls● User activity● WAF● Databases● Netflow● Load Balancers● DNS● Honeypots
● Sflow● IDS● IPS● Switches● Routers● Applications● Storage● Openldap● Cloud logs● etc..
If it can log, you can collect it.
Delivery● syslog, syslog-ng, rsyslog, nxlog, lumberjack
● Centralization all of the logs in one place ● Not just for shipping, you will need to keep them
● Consider some redundancy for fail over
● Not the same as shipping
Delivery - Shipper - Broker - Tagging - Storage
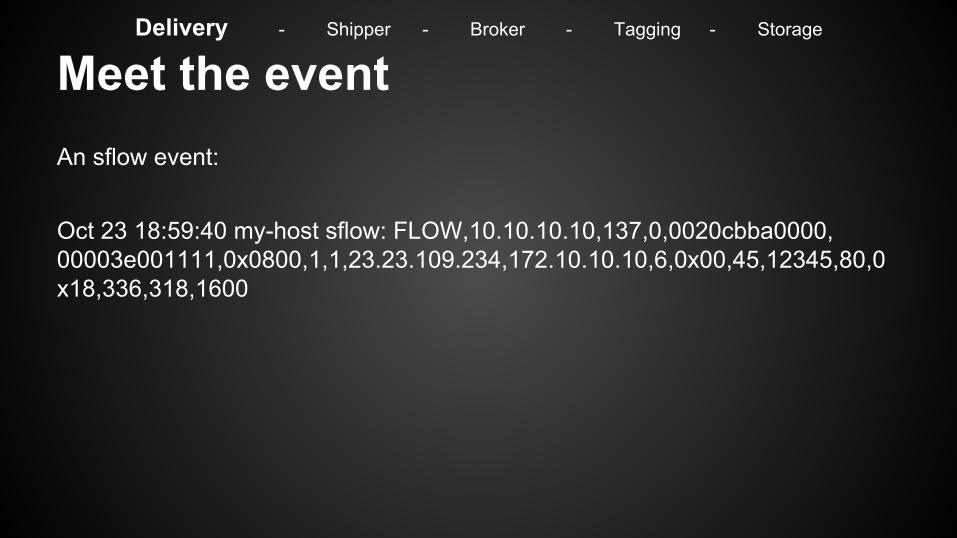
Meet the eventAn sflow event:
Oct 23 18:59:40 my-host sflow: FLOW,10.10.10.10,137,0,0020cbba0000,00003e001111,0x0800,1,1,23.23.109.234,172.10.10.10,6,0x00,45,12345,80,0x18,336,318,1600
Delivery - Shipper - Broker - Tagging - Storage

Shipper
The Logstash Book Version: v1.4.2.1
We are here!
Delivery - Shipper - Broker - Tagging - Storage

Logstash● Great as a shipper or indexer
● Awesome community and flexibility
● Allows tagging, metrics, hundreds of inputs and outputs
● Lots of codecs for encoding/decoding input/output
● You can generate actions based on events
Delivery - Shipper - Broker - Tagging - Storage
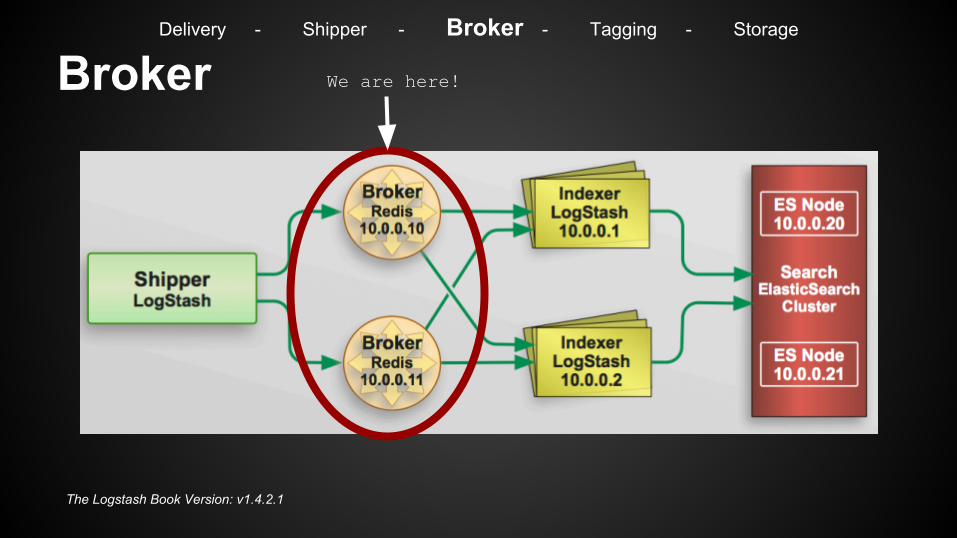
Broker
The Logstash Book Version: v1.4.2.1
We are here!
Delivery - Shipper - Broker - Tagging - Storage
Broker● We use Redis, but there are other options
● Allows for a better parallelization of event indexing
● At least 2 nodes for redundancy
● Buffer in case of failure (size the ram accordingly)
Delivery - Shipper - Broker - Tagging - Storage
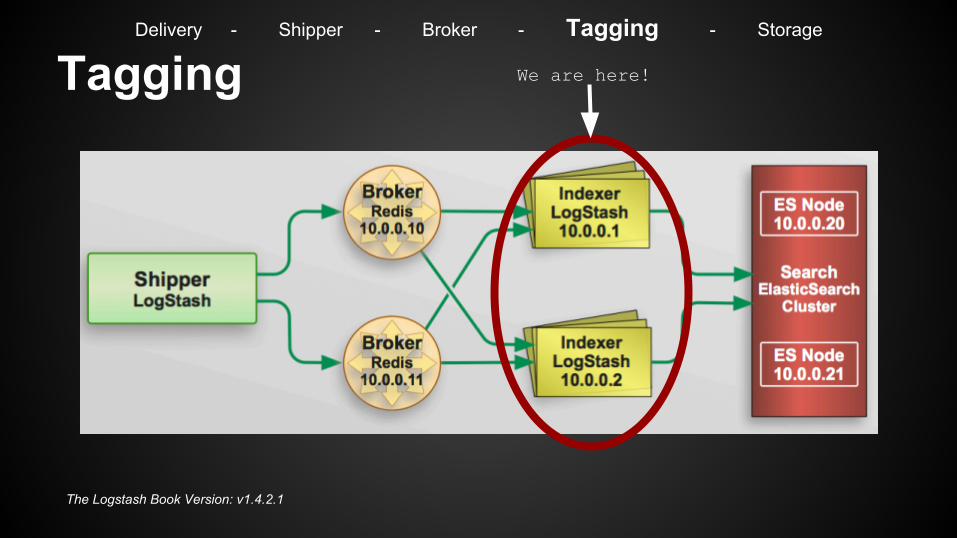
Tagging
The Logstash Book Version: v1.4.2.1
We are here!
Delivery - Shipper - Broker - Tagging - Storage

Logstash Inputs● How to get events to logstash
● Many different plugins to use ● Lumberjack -> Logstash default shipper
● In this case the redis input is enough
input { redis { host => "10.0.0.1" type => "redis-input" data_type => "list" key => "logstash" } }
Delivery - Shipper - Broker - Tagging - Storage

Logstash Filters● They can help you parse, tag and modify
events on the fly
● GROK => Replacing regex with names ● You can build your own custom GROK
patterns ● Other useful filters such as Metrics,
Geoip, DNS, Anonymize, Date, etc..
filter { grok { pattern => "%{SYSLOGTIMESTAMP:date}...%{HOSTNAME:srcip},%{HOSTNAME:dstip}...%{NUMBER:srcport},%{NUMBER:dstport}..." } geoip { source => "dstip" target => "dst_geo" fields => ["country_code2"] } dns { resolve => [ "@dns"] action => "replace" }}
Delivery - Shipper - Broker - Tagging - Storage
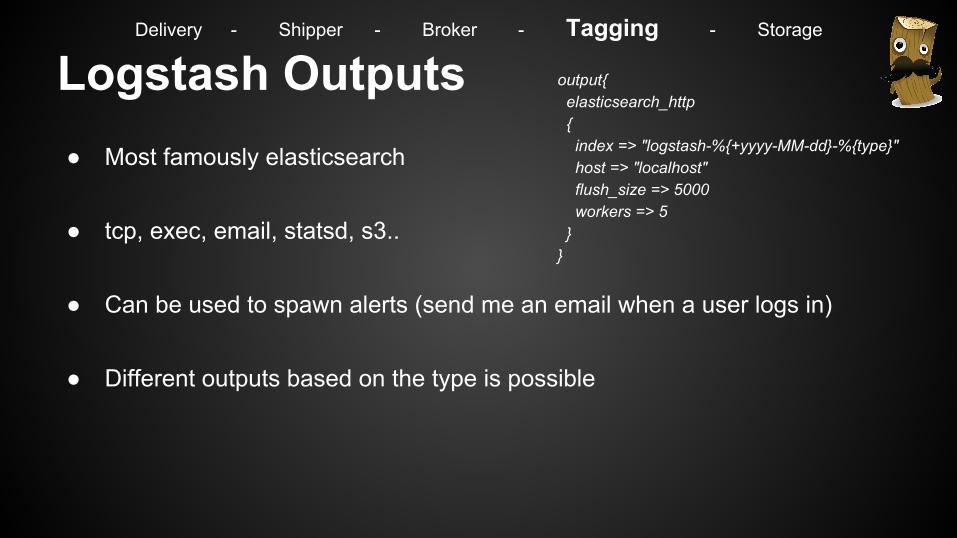
Logstash Outputs● Most famously elasticsearch
● tcp, exec, email, statsd, s3..
● Can be used to spawn alerts (send me an email when a user logs in)
● Different outputs based on the type is possible
output{ elasticsearch_http { index => "logstash-%{+yyyy-MM-dd}-%{type}" host => "localhost" flush_size => 5000 workers => 5 }}
Delivery - Shipper - Broker - Tagging - Storage

The event in logstash{
….
"inputport":"137", "outputport":"0", "srcmac":"0020cbba0000", "dstmac":"00003e001111", "invlan":"1", "outvlan":"1", "packetsize":"336",
"srcip":"172.10.10.10", "dstip":"23.23.80.130",
"dns":"ekoparty.org", "srcport":"12345", "dstport":"80",
"dst_geo":{
"country_code2":"US" }
}
Delivery - Shipper - Broker - Tagging - Storage
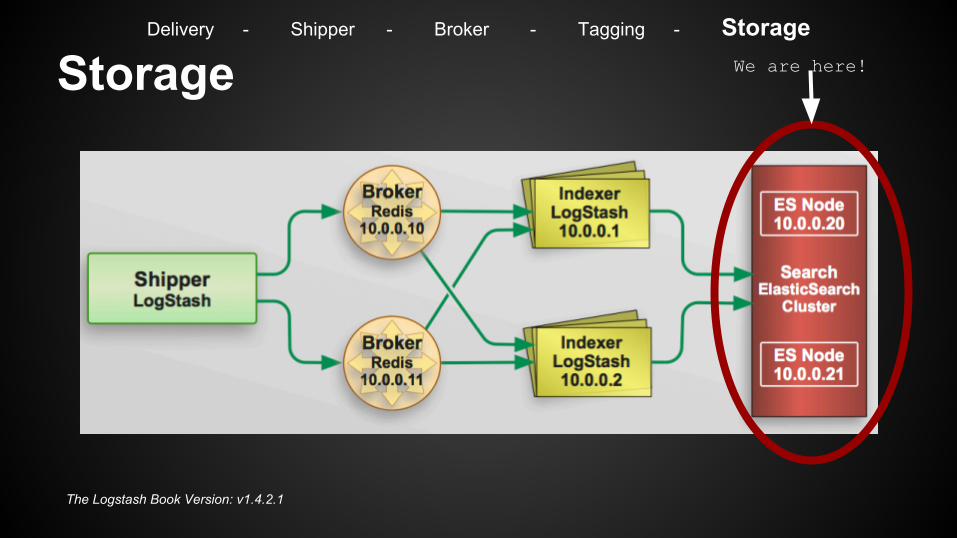
Storage
The Logstash Book Version: v1.4.2.1
We are here!
Delivery - Shipper - Broker - Tagging - Storage

Elasticsearch● JSON data store built on top of Apache Lucene
● Documents divided in indices, and those in shards ● Allows replication and scales amaizingly!
● Search Billions of records in seconds
● Great support for ELK
Delivery - Shipper - Broker - Tagging - Storage
Elasticsearch for Bulk Indexing● We are talking of hundreds of millions of events per day
● Daily or hourly indices, increase refresh time
● Watch out for the bulk thread pool and caches ● Give most of the ram to the jvm
● Every setup is different
Delivery - Shipper - Broker - Tagging - Storage

The event in ElasticSearch{
"_index":"logstash-2014-10-23-sflow", "_type":"sflow", "_id":"JKWMv9J2T767IjxyasWjZw", … "_source":{ "message":"Oct 23 18:59:40 mihost sflow: FLOW,10.5.4.11,137,0,0020cbbbb000,00003eee1111,0x0800,1,1,10.10.10.100,10.10.10.10,6,0x00,45,80,14887,0x18,336,318,1600",
"@timestamp":"2014-10-23T18:59:40.000-04:00",
"@version":"1",
….
},
"sort":[ 1414105180000 ] }
Delivery - Shipper - Broker - Tagging - Storage

Elasticsearch Security● Insecure by default (slowly changing)
● Jetty or elasticsearch-http-basic plugins
● Nginx or node.js proxy in front of kibana
(and log all the requests) ● Segmentation is the best bet yet to secure
the cluster
Delivery - Shipper - Broker - Tagging - Storage

What Elasticsearch is not for● Not a primary data store
● There are no transactions, you might lose some data
● Few tools to help with reporting besides kibana
● Not stable enough (yet)
Delivery - Shipper - Broker - Tagging - Storage

Backup
● Filesystem replicas (hardware problems)
● Filesystem snapshots (human mistakes)
● External backup of your raw logs (total disaster)
● Int/Ext backup of you ES indices (to avoid reindexing)
Delivery - Shipper - Broker - Tagging - Storage

Archiving
● Hadoop○ Open source!○ Process large amounts of data○ Distributed process & storage○ Highly scalable (linearly) & fault tolerant○ SQL language (with Hive or Impala)
● Excellent to store all our data in a queryable way!
Delivery - Shipper - Broker - Tagging - Storage
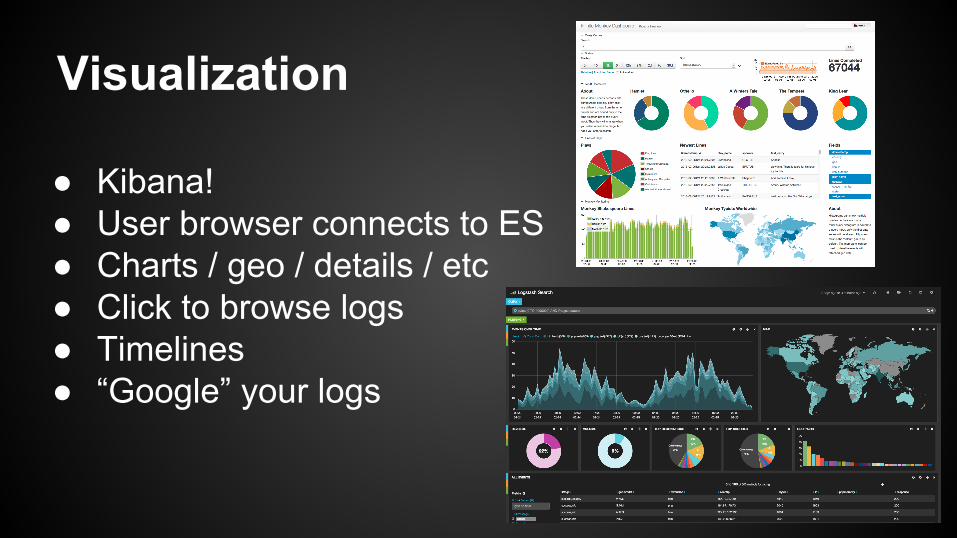
Visualization
● Kibana!● User browser connects to ES● Charts / geo / details / etc● Click to browse logs● Timelines● “Google” your logs

Visualization (2)● For cluster state
○ ElasticHQ (free)
○ Marvell (commercial)

Reporting
● Avoid crons
● Hadoop is better than ElasticSearch for reporting

Controlling your infrastructure
Everything is working, right?
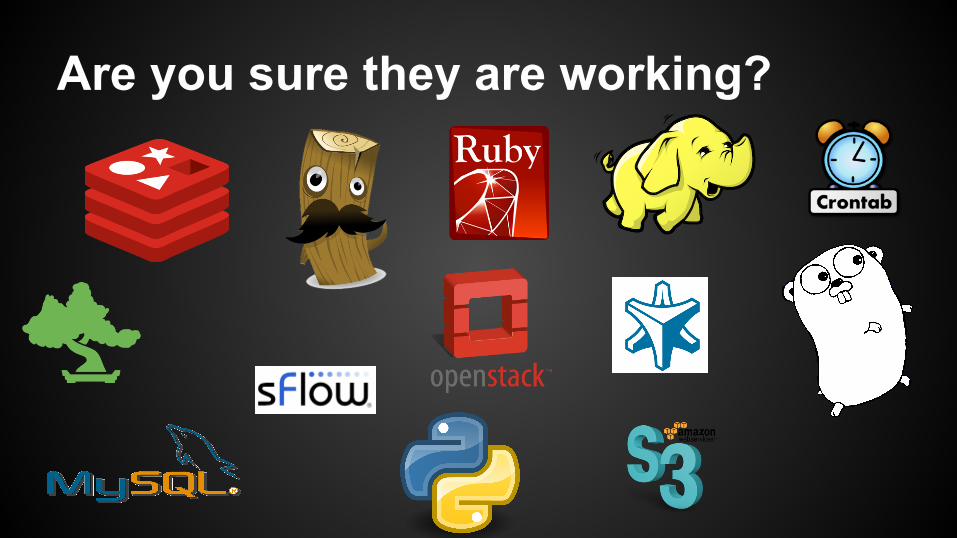
Are you sure they are working?

Prepare for failure● Skitter
○ Most components will fail sometimes
○ Don’t just alert. Fix it if possible.
○ Sometimes you can just check the end of the flow.
○ If you are not controlling it, you can’t depend on it.
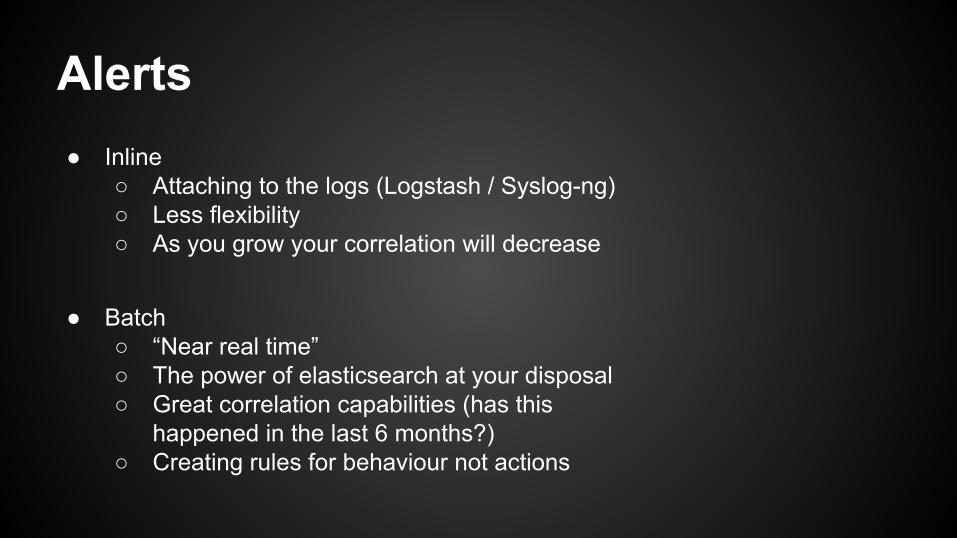
Alerts● Inline
○ Attaching to the logs (Logstash / Syslog-ng)○ Less flexibility○ As you grow your correlation will decrease
● Batch
○ “Near real time”○ The power of elasticsearch at your disposal○ Great correlation capabilities (has this
happened in the last 6 months?)○ Creating rules for behaviour not actions
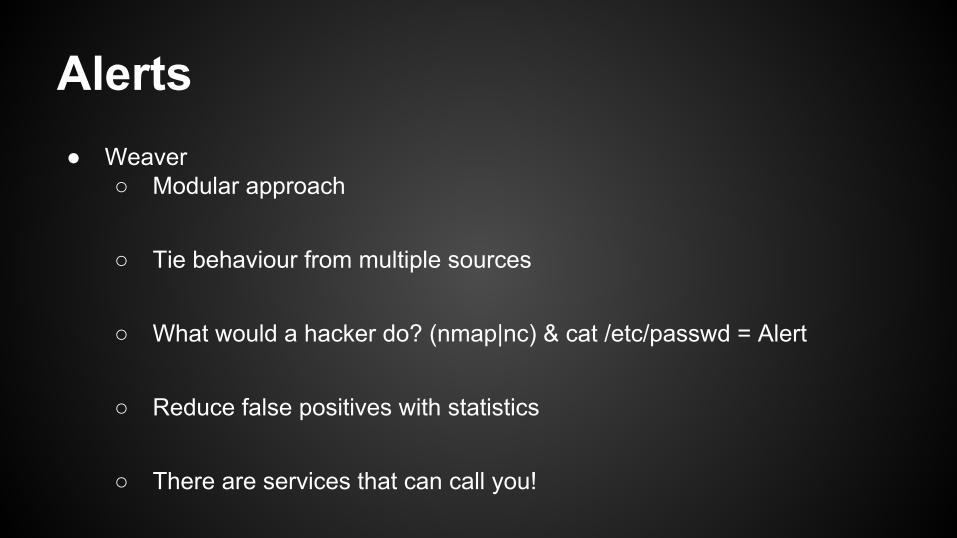
Alerts● Weaver
○ Modular approach
○ Tie behaviour from multiple sources
○ What would a hacker do? (nmap|nc) & cat /etc/passwd = Alert
○ Reduce false positives with statistics ○ There are services that can call you!
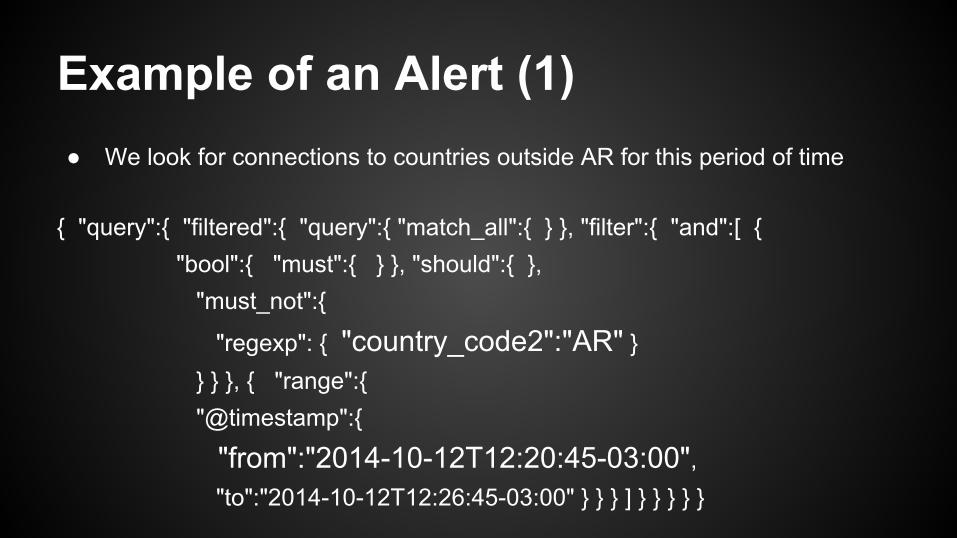
Example of an Alert (1)● We look for connections to countries outside AR for this period of time
{ "query":{ "filtered":{ "query":{ "match_all":{ } }, "filter":{ "and":[ { "bool":{ "must":{ } }, "should":{ }, "must_not":{
"regexp": { "country_code2":"AR" } } } }, { "range":{ "@timestamp":{
"from":"2014-10-12T12:20:45-03:00", "to":"2014-10-12T12:26:45-03:00" } } } ] } } } } }
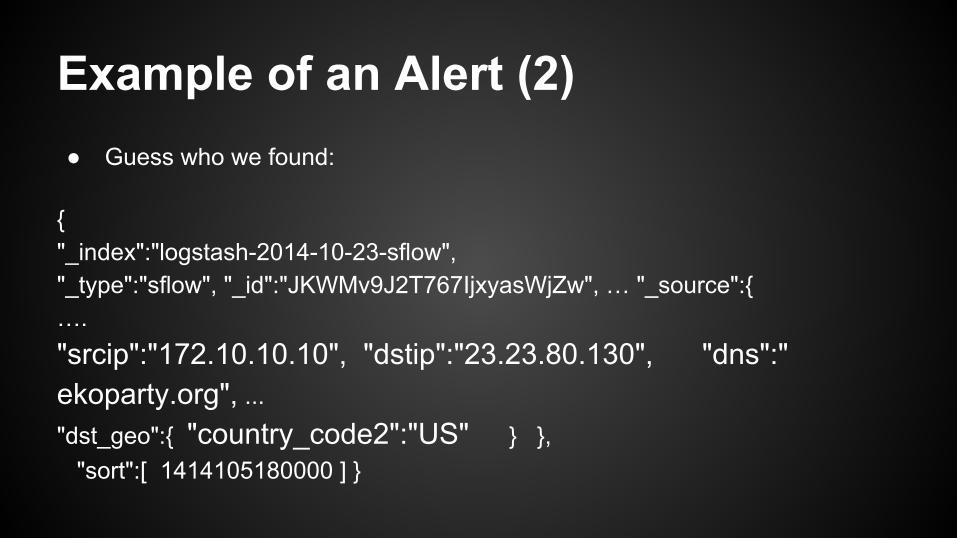
Example of an Alert (2)● Guess who we found:
{ "_index":"logstash-2014-10-23-sflow","_type":"sflow", "_id":"JKWMv9J2T767IjxyasWjZw", … "_source":{ …."srcip":"172.10.10.10", "dstip":"23.23.80.130", "dns":"ekoparty.org", ..."dst_geo":{ "country_code2":"US" } }, "sort":[ 1414105180000 ] }
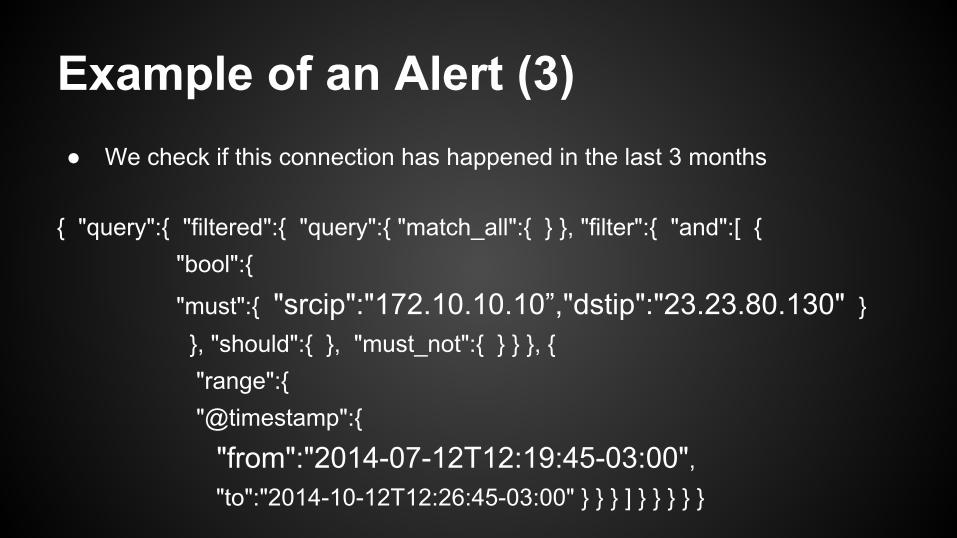
Example of an Alert (3)● We check if this connection has happened in the last 3 months
{ "query":{ "filtered":{ "query":{ "match_all":{ } }, "filter":{ "and":[ { "bool":{
"must":{ "srcip":"172.10.10.10”,"dstip":"23.23.80.130" } }, "should":{ }, "must_not":{ } } }, { "range":{ "@timestamp":{
"from":"2014-07-12T12:19:45-03:00", "to":"2014-10-12T12:26:45-03:00" } } } ] } } } } }

Example of an Alert (4)● Our result is:
[] => Nothing
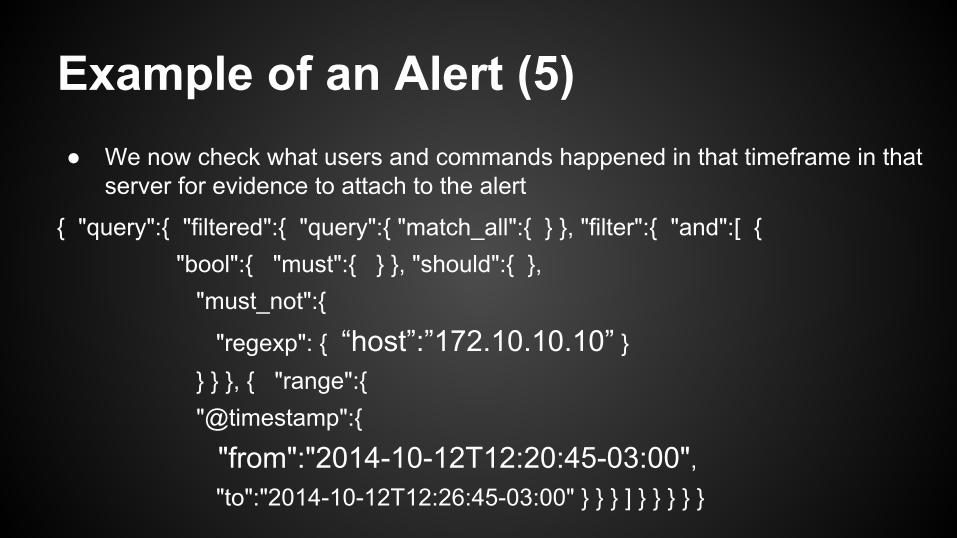
Example of an Alert (5)● We now check what users and commands happened in that timeframe in that
server for evidence to attach to the alert
{ "query":{ "filtered":{ "query":{ "match_all":{ } }, "filter":{ "and":[ { "bool":{ "must":{ } }, "should":{ }, "must_not":{
"regexp": { “host”:”172.10.10.10” } } } }, { "range":{ "@timestamp":{
"from":"2014-10-12T12:20:45-03:00", "to":"2014-10-12T12:26:45-03:00" } } } ] } } } } }

Example of an Alert (6)● We find different users and commands and we don’t alert since a user from
the group networking had a command which includes as the argument the address resolved by the dns filter :
{ .... "xhost": "54.191.133.118", "realuser": "web", "group": "apache", "command": "ls"}
{ .... "xhost": "54.191.133.118",
"realuser": "net",
"group": "networking", "command": "wget http://www.ekoparty.org/charlas-2014.php?a=2014&c=green&m=176" }

So how does this look like?

DEMO!
ssh 54.191.133.118

outro
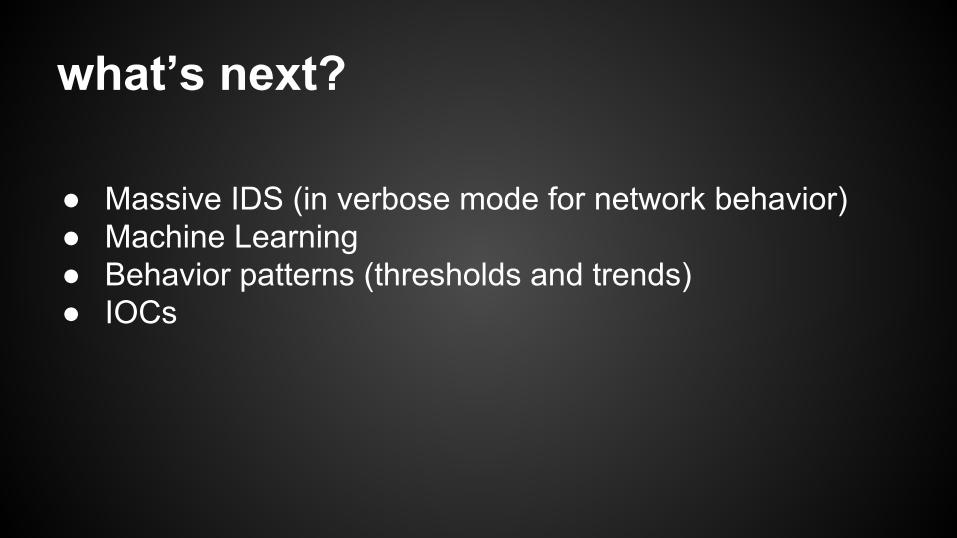
what’s next?
● Massive IDS (in verbose mode for network behavior)● Machine Learning● Behavior patterns (thresholds and trends)● IOCs

biblio & references ● https://github.com/89berner/Monitor ● The Logstash Book by James Turnbull
● elastichsearch.org

greetings ● Audience
● Ekoparty staff
● Meli’s SegInf Team

questions?