el camino hospital quality, patient care and patient ... · april 21, 2014 attachment 4 5. service...
TRANSCRIPT

A copy of the agenda for the Regular Committee Meeting will be posted and distributed at least seventy-two (72) hours prior to the
meeting. In observance of the Americans with Disabilities Act, please notify us at 650-988-7504 prior to the meeting so that we
may provide the agenda in alternative formats or make disability-related modifications and accommodations.
AGENDA Quality, Patient Care and Patient Experience Committee Meeting of the
El Camino Hospital Board
Monday, May 19, 2014, 5:30 p.m.
El Camino Hospital, Conference Room E & F
2500 Grant Road, Mountain View, California Purpose: The purpose of the Quality, Patient Care and Patient Experience Committee (“Quality Committee”) is to advise and assist the
El Camino Hospital (ECH) Board of Directors (“Board”) in constantly enhancing and enabling a culture of quality and safety at ECH,
and to ensure delivery of effective, evidence-based care for all patients. The Quality Committee helps to assure that excellent patient
care and exceptional patient experience are attained through monitoring organizational quality and safety measures, leadership
development in quality and safety methods and assuring appropriate resource allocation to achieve this purpose.
AGENDA ITEM PRESENTED BY
1. CALL TO ORDER Dave Reeder, Chair
Quality Committee
5:30 – 5:31 p.m.
2. ROLL CALL Dave Reeder, Chair
Quality Committee
5:31
3. POTENTIAL CONFLICT OF
INTEREST DISCLOSURES
Dave Reeder, Chair
Quality Committee
5:31 – 5:32
4. CONSENT CALENDAR ITEMS:
Any Committee Member may remove an
item for discussion before a motion is made.
Dave Reeder, Chair
Quality Committee
public
comment motion required
5:32 – 5:36
Approval:
a. Minutes of Quality Committee Meeting
April 21, 2014
ATTACHMENT 4
5. SERVICE LINE UPDATE:
NEUROSCIENCES
ATTACHMENT 5
Martin Lesica,
Executive Director
Thomas Wolfe, MD
Medical Director
information
5:36 – 6:20
6. REVIEW COMMITTEE ASSESSMENT
RESULTS
ATTACHMENT 6
Dave Reeder, Chair
Quality Committee
information
6:20 – 6:30
7. REVIEW CURRENT CORPORATE
SCORECARD
ATTACHMENT 7
Eric Pifer, MD, Chief
Medical Officer
public
comment possible motion
6:30 – 6:45
8. RECRUITMENT PROCESS UPDATE
Dave Reeder, Chair
Quality Committee
information
6:45 – 6:55
9. COMMITTEE CHARTER
ATTACHMENT 9
Dave Reeder, Chair
Quality Committee
public
comment motion required
6:55 – 7:05

Agenda: El Camino Hospital Quality, Patient Care, and Patient Experience Committee Meeting May 21, 2014 Page 2
AGENDA ITEM PRESENTED BY
10. PUBLIC COMMUNICATION David Reeder, Chair, Quality Committee
7:05 – 7:10
11. ADJOURN TO CLOSED SESSION 7:10 12. POTENTIAL CONFLICT OF
INTEREST DISCLOSURES
David Reeder, Chair, Quality Committee
7:10 – 7:15
13. CONSENT CALENDAR Any Committee Member may pull an item for discussion before a motion is made.
David Reeder, Chair, Quality Committee
motion required 7:15 – 7:20
Approval: Meeting Minutes of the Closed Session (April 21, 2014) Gov’t Code Section 54957.2.
Information: Report involving health care facility trade secrets, Health and Safety Code Section 32106(b)
- Pacing Plan
14. Report of Medical Staff Quality Assurance Committee, Health and Safety Code Section 32155 and report involving health care facility trade secrets, Health and Safety Code Section 32106(b) - Quality Council Minutes
information 7:20 – 7:30
15. RECONVENE OPEN SESSION David Reeder, Chair, Quality Committee
7:30
To report any required disclosures regarding permissible actions taken during Closed Session.
16. ADJOURNMENT David Reeder, Chair,
Quality Committee 7:31 p.m.
Upcoming Quality Committee Meetings: June 16, 2014 (Jeff Davis, MD to chair meeting)
Tentative Upcoming FY 2015 Quality Committee Meetings:
August 18, 2014 September 15, 2014 October 20, 2014 November 17, 2014

Separator Page
Attach 4b-BQC Open Minutes 4-21-14.docx

Minutes of the Open Session
Quality, Patient Care and Patient Experience Committee
Of El Camino Hospital
Monday April 21, 2014
1. Call to Order. The Open Session meeting of the Quality, Patient Care and
Patient Experience Committee of El Camino Hospital (the “Committee”) was called to order by
Committee Chair David Reeder, at 5:35 p.m. on Monday, April 21, 2014, Conference Rooms E
& F, at El Camino Hospital, 2500 Grant Road, Mountain View, California.
2. Roll Call. Roll call was taken. Committee members present were David Reeder,
Katie Anderson, Lisa Freeman, Jeffrey Davis, MD and R. Cary Hill MD, was absent from roll
call and arrived at 5:44pm.
3. Potential Conflict of Interests Disclosures. Chair Reeder asked if any
Committee member or anyone in the audience believes that a Committee member may have a
conflict of interest on any of the items on the agenda. No conflict of interest was reported.
4. Consent Calendar. Chair Reeder asked if any Committee member had any
corrections to the consent calendar items. None were noted.
Action: Committee member Davis made a motion, seconded by Committee member
Anderson and adopted by a vote of five members in favor, two absent (Pinsker and Einarson) to
approve the consent calendar (Minutes of the February 17, 2014 and March 17, 2014 meeting,
and Quality Update on Website).
5. Performance Improvement in Mother Child Health (MCH) Christopher Pratt,
Senior Director of Performance Improvement and Debbie Groth, RN, Director of Maternal Child
Health Services presented on the Performance Improvement Update. They gave an overview of
the current LEAN work in progress and the plan for future work. They discussed the various VIS
Boards around the hospital and how briefly discussed the various progresses for specific areas.
They also briefly discussed the various PaCT training classes, Gemba Rounds and the Value
Stream Progress. Chair Reeder would like to attend one Gemba rounding with any executive.
6. Committee Vacancy and Role of Medical Staff Leaders Chair Reeder
requested feedback on whether the Committee should fill the vacancies currently open and it was
agreed upon that the potential candidate would have some sort of quality background and show
competency and inquisitiveness around quality as a whole. There was a discussion on whether
Medical Staff Officers should become standing members and it was agreed that Medical Staff
Officers would hold two votes; one from each campus, therefore the Charter would need to be
changed to address this notion.
Action: Chair Reeder will move forward with the recruiter to find a candidate to fill the
committee vacancy.
7. Flow of Agenda. Chair Reeder requested feedback from Committee members on
the current flow of the Quality Committee Agenda. A discussion ensued on whether an
DRAFT

Minutes: Quality Patient Care and Patient Experience Committee
April 21, 2014
Page 2
individual from outside the organization would be beneficial to come and speak to the
Committee and give their insight on what the Committee is currently doing and how to get better
at what we are doing. It was stated that this Committee has had tremendous progress on thought
and process on quality from six months ago. Chair Reeder stated that the discussion was good
input since there will be some changes in the Committee members for FY15.
No action was taken.
8. Review Final Draft of FY15 Corporate Goals, Scorecard Adjustments and
Priorities. Mr. Zdeblick stated that the attachment had no changes from the previous month and
it was ready for the approval of the Quality Committee.
Action: Committee member Freeman made a motion, seconded by Committee member Davis
and adopted by a vote of five members in favor, two absent (Pinsker and Einarson) to approve
the FY15 Corporate Scorecard and FY15 Organizational Goals and recommend these documents
to the Full Board.
9. Review Final FY15 Committee Goals. Chair Reeder stated that the goals have
not changed from the previous month.
Action: Committee member Anderson made a motion, seconded by Committee member
Freeman and adopted by a vote of four members in favor, two absent (Pinsker and Einarson) to
approve the FY15 Committee Goals and recommend these documents to the Full Board.
10. Review of Current Corporate Scorecard. Ms. Bukunt discussed the number of
incidents in preventable harm in more detail for the Committee. She explained why the number
was so high and explained that the new changes that have been put in place have definitely
improved things thus far. For the months Jan-March, there are only 15 incidents on the harm
report, and there are 0 sentinel events, 0 HAPU and 0 Catheter UTI’s. 7 out of the 15 incidents
are surgical site infections and out of those 7, 4 are lumbar incidents so the Neurology
department is currently looking into this. Falls have decreased in the past year due to all the
education and the work around fall prevention. All in all, we are tracking in a better direction
from last year. There was a discussion around having 0% goal for preventable harm and that
seems to be an unrealistic expectation, but the purpose is to have it as a stretch goal and strive to
achieve it.
No action was taken.
11. Annual Review of Committee Charter. Chair Reeder made a change to the
current charter to include Medical Staff Officers.
Action: Committee member Anderson made a motion, seconded by Committee member Davis
and adopted by a vote of five members in favor, two absent (Pinsker and Einarson) to approve
the Committee Charter.
12. Set Proposed Committee Dates for FY2015. Chair Reeder reviewed the dates
for FY15 Committee Meetings.
13. Public Communication. None

Minutes: Quality Patient Care and Patient Experience Committee
April 21, 2014
Page 3
14. Adjourn to Closed Session. Committee member Anderson made a motion,
seconded by Committee member Davis and adopted by a vote of five Committee members in
favor, two absent (Pinsker and Einarson) to adjourn to closed session at 7:23 pm.
Agenda Item 16 was completed in Closed Session.
15. Reconvene Open Session. Open session was reconvened at 7:25 pm. Chair
Reeder reported that the committee approved the Closed Session minutes of the Committee’s
February 17, 2014 meeting.
16. Adjournment. Committee member Anderson made a motion, seconded by
Committee member Davis and adopted by a vote of five Committee members in favor, two
absent (Pinsker and Einarson), to adjourn the meeting at 7:26 pm.
Information: Chair Reeder will be out of town for the June 16th
meeting and he has asked
Committee member Davis to chair the meeting in his absence.
______________________________ ______________________________
David Reeder Patricia A. Einarson, MD
Chair, ECH Quality, Patient Care ECH Board Secretary
And Patient Experience Committee

Separator Page
Attach 5 -Neurosciences 05 19 14 rev 2.ppt

Neuroscience Service Line Thomas Wolfe, MD
Medical Director, Neuro Interventional and Neuro Critical Care
Martin Lesica
Executive Director, Orthopedics, Neuroscience and Spine Service Lines
ECH Quality Committee
May 19, 2014

What does a Neuroscience Institute Look Like?
2
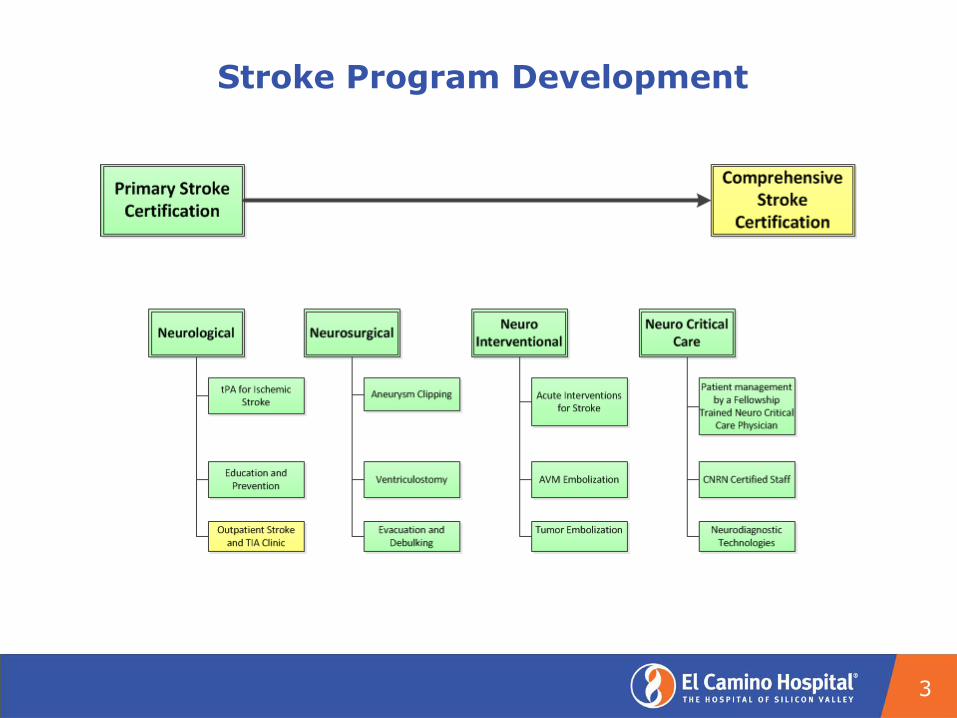
Stroke Program Development
3

Stroke Team
• EMS
• ED Physicians
• ED Nurses
• Stroke Neurologists
• Neuro Interventionalist
• Neurosurgeons
• Neuro Interventional Lab
Team
• OR/PACU Team
• Rapid Response Nurses
• Critical Care Nurses
• Neuro Critical Care
• Stroke Unit Nurses
• Acute Rehab Team
• In-Pt. Rehab Team
• Neuro Psychology
• Physiatry
4

Scope of Services
Ischemic Stroke Interventions
• Tissue plasminogen activator (tPA)for acute ischemic stroke
• Intra-arterial tPA
• Clot retrieval
Hemorrhagic Stroke Interventions
• Coiling
• Stenting
• Aneurysm Clipping
• Gluing
Acute Inpatient Rehabilitation
• CARF Accredited Stroke
5
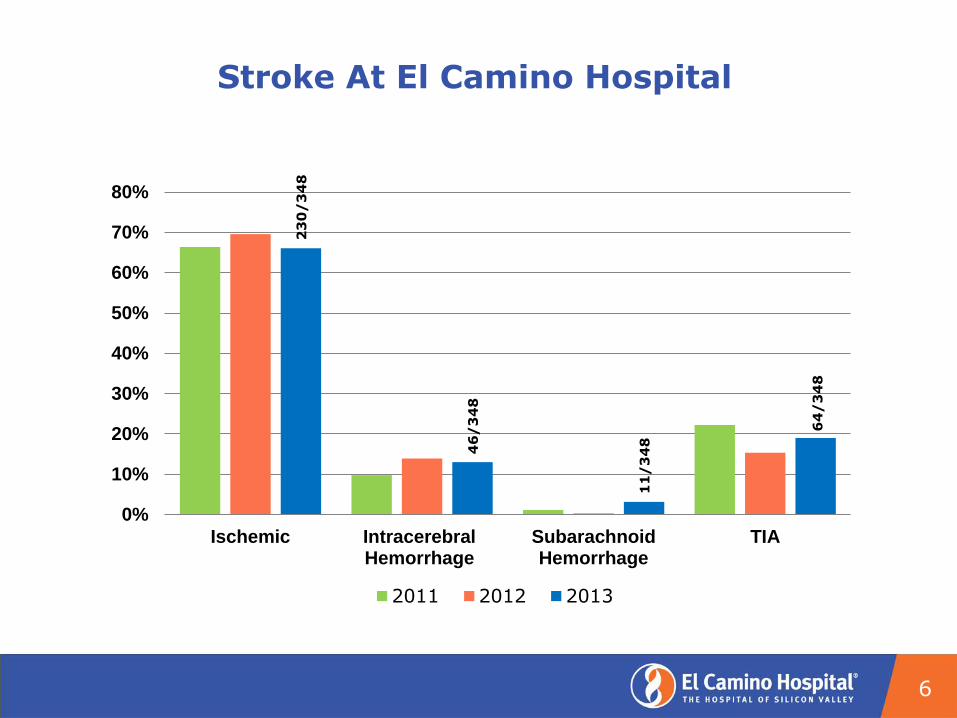
Stroke At El Camino Hospital
6
23
0/
34
8
46
/3
48
11
/3
48
64
/3
48
0%
10%
20%
30%
40%
50%
60%
70%
80%
Ischemic IntracerebralHemorrhage
SubarachnoidHemorrhage
TIA
2011 2012 2013
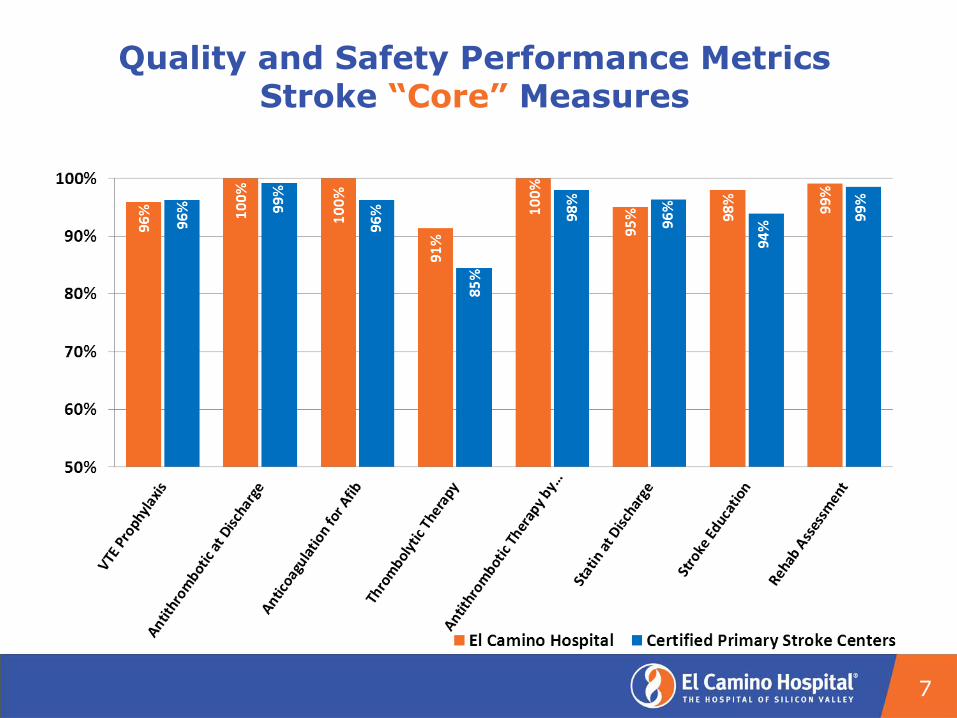
Quality and Safety Performance Metrics Stroke “Core” Measures
7
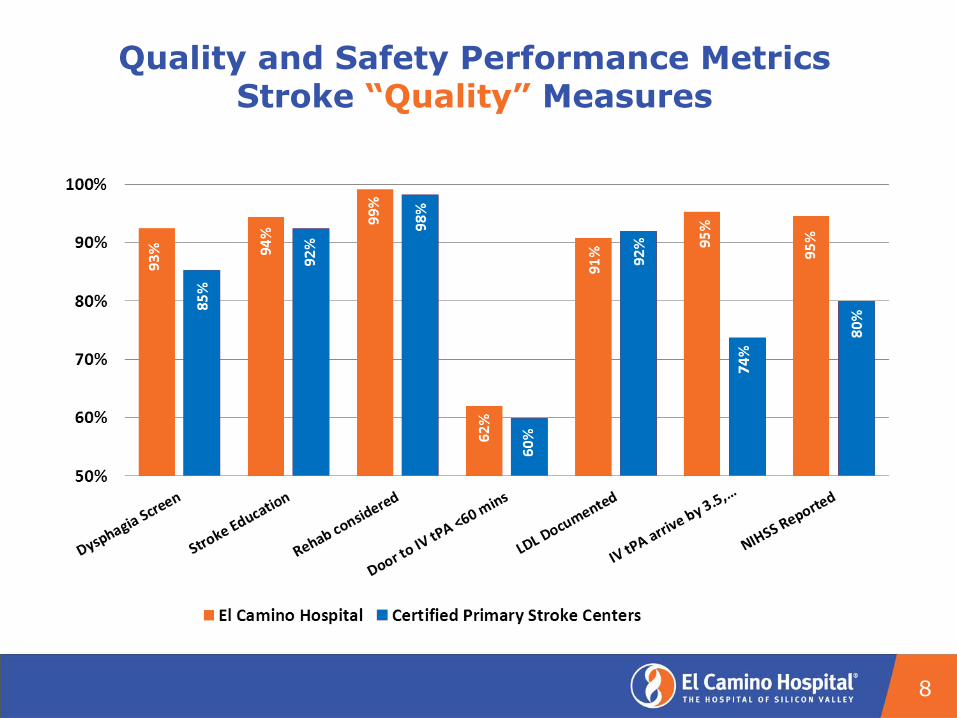
Quality and Safety Performance Metrics Stroke “Quality” Measures
8
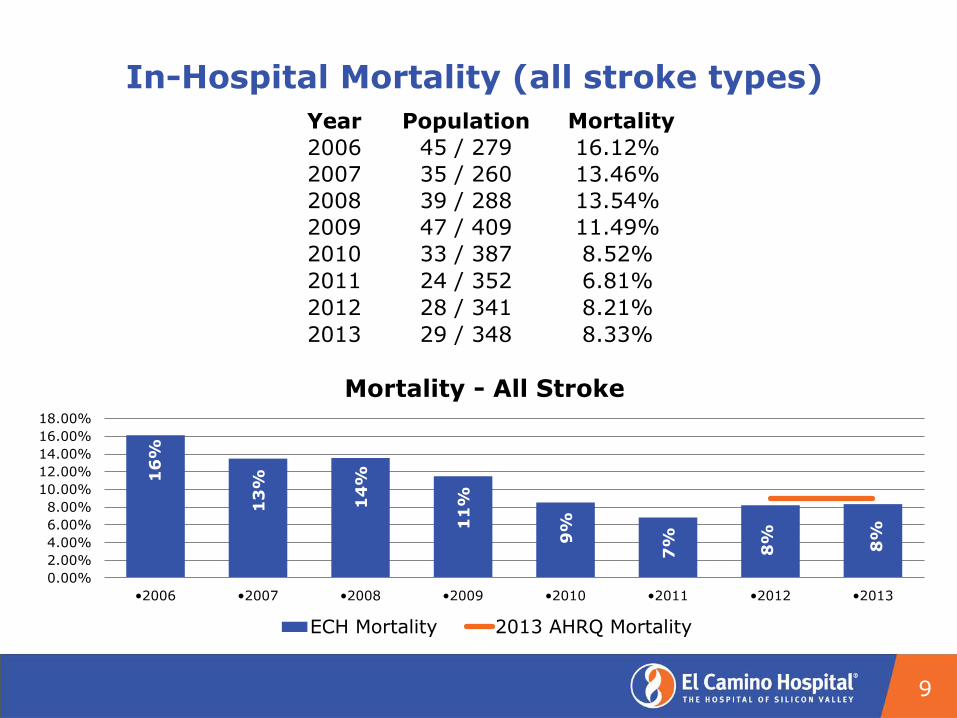
In-Hospital Mortality (all stroke types)
9
Year Population Mortality
2006 45 / 279 16.12%
2007 35 / 260 13.46%
2008 39 / 288 13.54%
2009 47 / 409 11.49%
2010 33 / 387 8.52%
2011 24 / 352 6.81%
2012 28 / 341 8.21%
2013 29 / 348 8.33%
16
%
13
%
14
%
11
%
9%
7%
8%
8%
0.00%
2.00%
4.00%
6.00%
8.00%
10.00%
12.00%
14.00%
16.00%
18.00%
•2006 •2007 •2008 •2009 •2010 •2011 •2012 •2013
Mortality - All Stroke
ECH Mortality 2013 AHRQ Mortality

Neuro Interventional Services
10
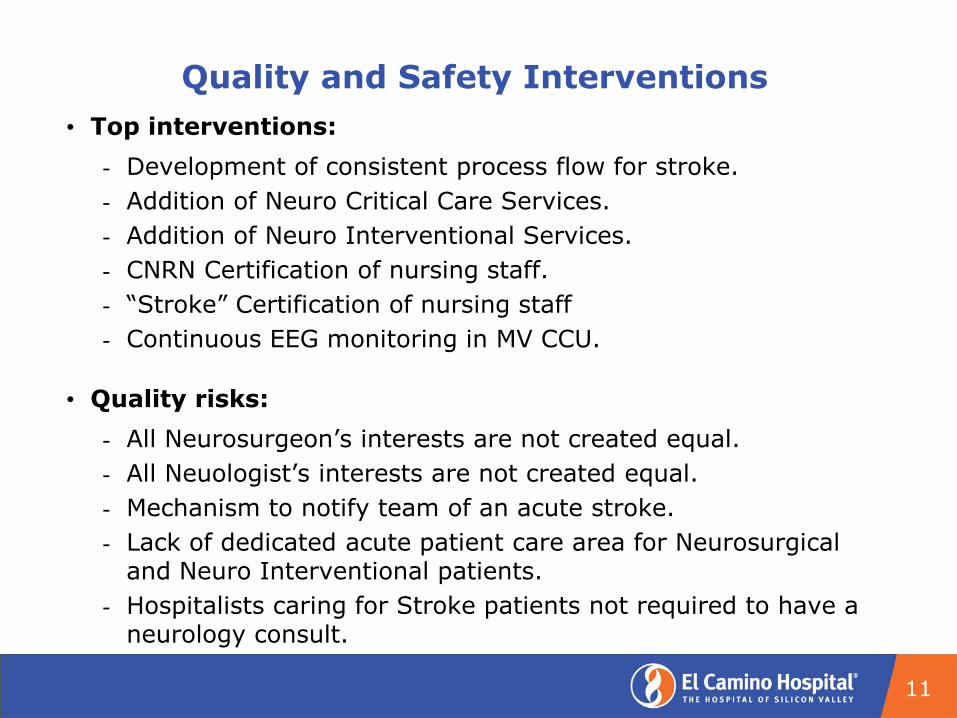
Quality and Safety Interventions
• Top interventions:
- Development of consistent process flow for stroke.
- Addition of Neuro Critical Care Services.
- Addition of Neuro Interventional Services.
- CNRN Certification of nursing staff.
- “Stroke” Certification of nursing staff
- Continuous EEG monitoring in MV CCU.
• Quality risks:
- All Neurosurgeon’s interests are not created equal.
- All Neuologist’s interests are not created equal.
- Mechanism to notify team of an acute stroke.
- Lack of dedicated acute patient care area for Neurosurgical and Neuro Interventional patients.
- Hospitalists caring for Stroke patients not required to have a neurology consult.
11
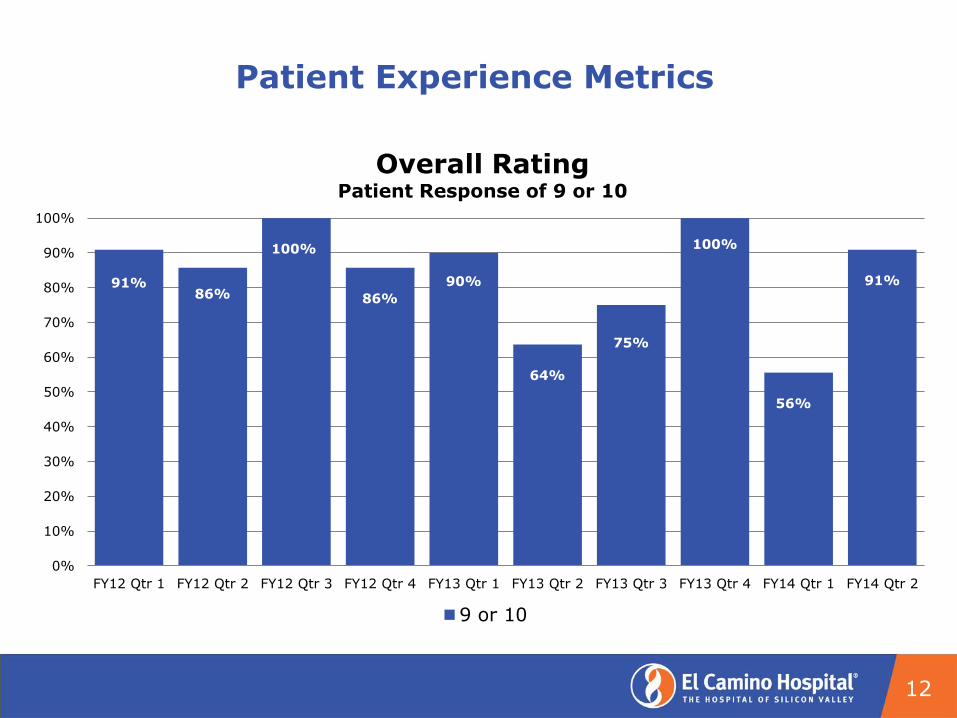
Patient Experience Metrics
12
91% 86%
100%
86%
90%
64%
75%
100%
56%
91%
0%
10%
20%
30%
40%
50%
60%
70%
80%
90%
100%
FY12 Qtr 1 FY12 Qtr 2 FY12 Qtr 3 FY12 Qtr 4 FY13 Qtr 1 FY13 Qtr 2 FY13 Qtr 3 FY13 Qtr 4 FY14 Qtr 1 FY14 Qtr 2
Overall Rating Patient Response of 9 or 10
9 or 10

Patient Experience Interventions
• Stroke specific “rounding” questions being utilized at both
the campuses to determine the “real time” opportunities
impacting the patient experience. (April 2014)
• Improving the linkages to the accredited stroke
rehabilitation program in Los Gatos. (On-going)
• Facilitating successful reintegration into the community via
a coordinated “Stroke Clinic” focused on wellness and
prevention (Proposed).
• Implementation of a TIA Clinic which is designed to
provide options for care of the patient following an ED
visit. (Proposed)
13
“Connect to Purpose”
• 61 year female.
• Presented after a motor vehicle crash caused by altered
consciousness related to an aneurysm rupture.
• Collaboration with specialty providers during the month long stay
included:
- Neurosurgery,
- Physiatry and Rehabilitation Team,
- Pulmonary Critical Care
- Neuro Critical Care
- Neuro Interventional,
- Interventional Radiology, and
- ENT
• Celebrated her birthday with a popsicle prior to transfer to acute
rehabilitation
• Currently living at home with her husband.
14
Closing Discussion
• What is the future scope of a Neuroscience Institute at ECH?
• What are we willing to commit to developing that vision?
• Technology (SPECT, FMRI),
• Personnel (24 hour EEG),
• Infrastructure (Clinics and support staff)?
• Neuro Interventional team expansion?
• Telemedicine?
• ETC.
15
Appendix
16
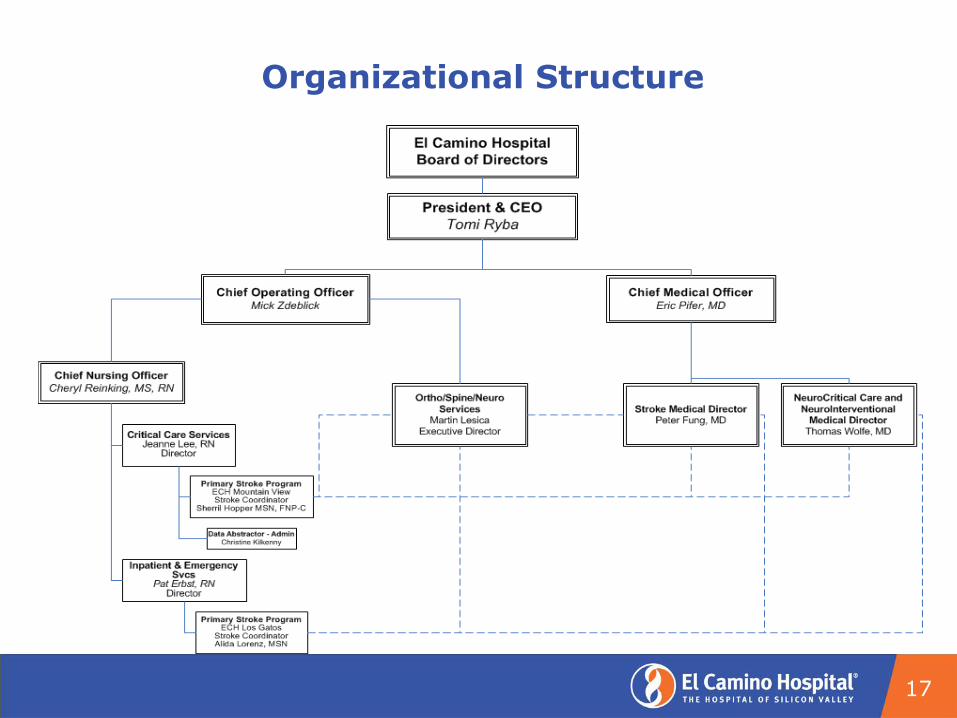
Organizational Structure
17

Acute Stroke Decision Process
18

19
91% 89%
67% 65%
87% 71% 67%
89%
55%
78%
9% 6%
33% 19%
13% 29% 33%
11%
38%
22% 6%
15% 7%
0%
20%
40%
60%
80%
100%
FY12 Qtr 1 FY12 Qtr 2 FY12 Qtr 3 FY12 Qtr 4 FY13 Qtr 1 FY13 Qtr 2 FY13 Qtr 3 FY13 Qtr 4 FY14 Qtr 1 FY14 Qtr 2
Physician Communication
Always Usually Sometimes Never
71% 56%
75% 83% 75%
48% 60%
75%
37%
64%
24%
28%
25% 17% 20%
43% 37%
17%
42%
23%
5% 17%
5% 9% 3% 8% 21% 14%
0%
20%
40%
60%
80%
100%
FY12 Qtr 1 FY12 Qtr 2 FY12 Qtr 3 FY12 Qtr 4 FY13 Qtr 1 FY13 Qtr 2 FY13 Qtr 3 FY13 Qtr 4 FY14 Qtr 1 FY14 Qtr 2
Hospital Environment
Always Usually Sometimes Never

20
76% 89%
53%
75% 87%
77% 60%
90%
61% 77%
15% 8%
47%
25% 13%
20% 38%
5%
32%
23%
4% 3% 2% 5% 7% 9%
0%
20%
40%
60%
80%
100%
FY12 Qtr 1 FY12 Qtr 2 FY12 Qtr 3 FY12 Qtr 4 FY13 Qtr 1 FY13 Qtr 2 FY13 Qtr 3 FY13 Qtr 4 FY14 Qtr 1 FY14 Qtr 2
Nurse Communication
Always Usually Sometimes Never
50% 43%
67%
100%
50%
90% 75%
67%
25% 57%
33% 50%
10% 25%
33% 25%
100%
0%
20%
40%
60%
80%
100%
FY12 Qtr 1 FY12 Qtr 2 FY12 Qtr 3 FY12 Qtr 4 FY13 Qtr 1 FY13 Qtr 2 FY13 Qtr 3 FY13 Qtr 4 FY14 Qtr 1 FY14 Qtr 2
Pain Management
Always Usually Sometimes Never
No
Resp
on
ses
Th
is Q
tr.

21
73% 68%
25%
90% 86% 87%
48% 60%
50%
75%
27% 28%
50%
10% 14% 13%
52%
10% 43%
25%
4%
25% 30%
7%
0%
10%
20%
30%
40%
50%
60%
70%
80%
90%
100%
FY12 Qtr 1 FY12 Qtr 2 FY12 Qtr 3 FY12 Qtr 4 FY13 Qtr 1 FY13 Qtr 2 FY13 Qtr 3 FY13 Qtr 4 FY14 Qtr 1 FY14 Qtr 2
Responsiveness Of Staff
Always Usually Sometimes Never
70% 59% 60%
33% 45% 50% 42%
67%
22%
77%
20% 23% 20%
33% 27%
7% 21%
33%
22%
15% 18%
33% 18%
21% 21%
44%
8% 10% 20%
9% 21% 16% 11%
0%10%20%30%40%50%60%70%80%90%
100%
FY12 Qtr 1 FY12 Qtr 2 FY12 Qtr 3 FY12 Qtr 4 FY13 Qtr 1 FY13 Qtr 2 FY13 Qtr 3 FY13 Qtr 4 FY14 Qtr 1 FY14 Qtr 2
Communication About Medication
Always Usually Sometimes Never
Separator Page
Attach 6- ECH 2014 Quality Committee Assessment
Summary Report - March 24 2014.pdf

Date:
Prepared for:
Prepared by:
March 25, 2014
Quality, Patient Care, and Patient Experience Committee
JoAnn McNutt, PhD David Nygren, PhD Sara Finesilver
FY 2013-2014 Quality, Patient Care, and Patient Experience Committee Self-Assessment Summary Report
El Camino Hospital
El Camino Hospital Quality Committee Self-Assessment FY 2013-2014 Summary Report
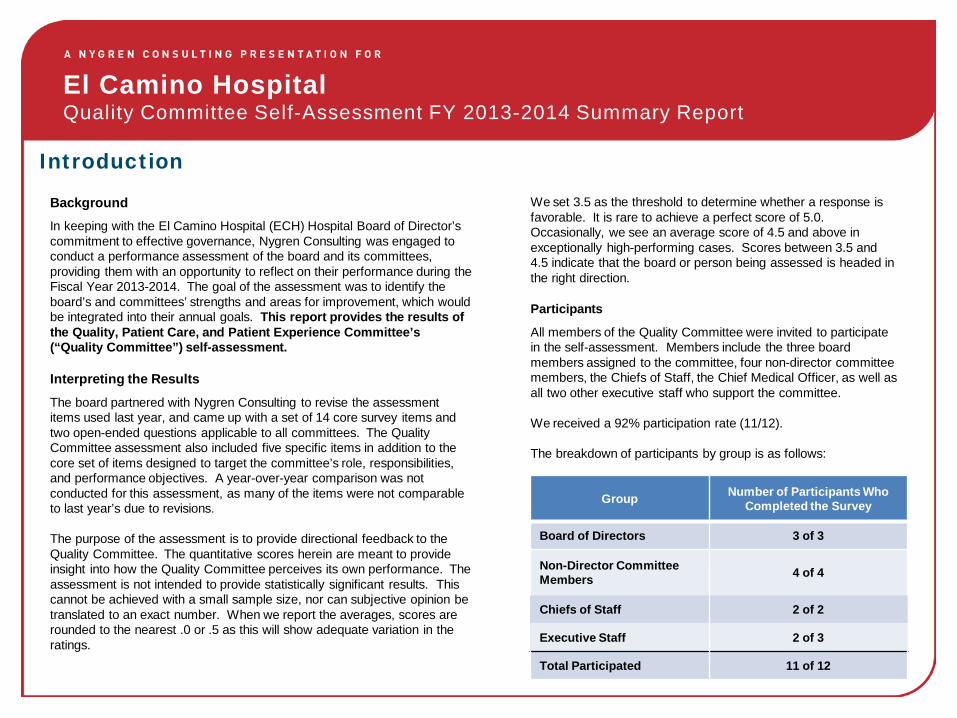
Background In keeping with the El Camino Hospital (ECH) Hospital Board of Director’s commitment to effective governance, Nygren Consulting was engaged to conduct a performance assessment of the board and its committees, providing them with an opportunity to reflect on their performance during the Fiscal Year 2013-2014. The goal of the assessment was to identify the board’s and committees’ strengths and areas for improvement, which would be integrated into their annual goals. This report provides the results of the Quality, Patient Care, and Patient Experience Committee’s (“Quality Committee”) self-assessment.
Interpreting the Results
The board partnered with Nygren Consulting to revise the assessment items used last year, and came up with a set of 14 core survey items and two open-ended questions applicable to all committees. The Quality Committee assessment also included five specific items in addition to the core set of items designed to target the committee’s role, responsibilities, and performance objectives. A year-over-year comparison was not conducted for this assessment, as many of the items were not comparable to last year’s due to revisions. The purpose of the assessment is to provide directional feedback to the Quality Committee. The quantitative scores herein are meant to provide insight into how the Quality Committee perceives its own performance. The assessment is not intended to provide statistically significant results. This cannot be achieved with a small sample size, nor can subjective opinion be translated to an exact number. When we report the averages, scores are rounded to the nearest .0 or .5 as this will show adequate variation in the ratings.
Introduction
We set 3.5 as the threshold to determine whether a response is favorable. It is rare to achieve a perfect score of 5.0. Occasionally, we see an average score of 4.5 and above in exceptionally high-performing cases. Scores between 3.5 and 4.5 indicate that the board or person being assessed is headed in the right direction.
Participants
All members of the Quality Committee were invited to participate in the self-assessment. Members include the three board members assigned to the committee, four non-director committee members, the Chiefs of Staff, the Chief Medical Officer, as well as all two other executive staff who support the committee. We received a 92% participation rate (11/12). The breakdown of participants by group is as follows:
Group Number of Participants Who Completed the Survey
Board of Directors 3 of 3
Non-Director Committee Members 4 of 4
Chiefs of Staff 2 of 2
Executive Staff 2 of 3
Total Participated 11 of 12

El Camino Hospital Quality Committee Self-Assessment FY 2013-2014 Summary Report
Committee’s Overall Average Score: 4.1
The committee assessment results suggest committee members are generally satisfied with the working dynamic and practices of the committee. There is also agreement that the committee has effective leadership.
In looking at the committee specific goals, however, committee members indicate there is room for improvement with regards to overseeing quality on behalf of the organization. The board as a whole seems to agree with a rating of 3.4 on the question of if the committee provides effective oversight of its functional areas.
Executive Summary
Written Comments
When asked how the Quality Committee can improve it’s overall performance and working relationship with the board, other committees, and/or support functions, committee members mentioned the following:
Integrate greater quality focus into the work of the entire organization as well as the other board committees. One approach could be the addition of a Vice President of Quality who reports to the CEO.
Increase the alignment of the committee’s agenda to ECH’s quality goals.
Develop stronger interactions with members of senior management responsible for quality issues within the hospital.
Focus committee work on a higher level of quality oversight and stay out of operational issues.
Clarify the direction of the committee in order to add more value to the good work the hospital is already doing to oversee quality issues.
Add additional committee members with quality expertise.

El Camino Hospital Quality Committee Self-Assessment FY 2013-2014 Summary Report
Highest and Lowest Rated Items
Highest Rated Items Lowest Rated Items
Strongly Disagree
Strongly Agree
Strongly Disagree
Strongly Agree
4.3
4.4
4.4
4.5
1.0 2.0 3.0 4.0 5.0
The committee has the resources neededto fulfill its purpose.
The committee has a healthy,professional group dynamic that is
characterized by active engagement andopen discussion.
The committee efficiently reachesconsensus on its decisions or
recommendations to the board.
The committee meets often enough toeffectively carry out its duties.
Quality Committee
3.8
3.8
3.7
3.5
1.0 2.0 3.0 4.0 5.0
The committee effectively oversees management’s development of the hospital’s goals encompassing the measurement and improvement of
quality, safety, risk and clinical resource …
The committee effectively oversees management’s development of a multi-year strategic quality plan to benchmark
progress using a dashboard.
The committee leadership effectivelyretains committee members.
The committee effectively reviewssentinel events and the corresponding
root cause analyses.
Quality Committee

El Camino Hospital Quality Committee Self-Assessment FY 2013-2014 Summary Report
4.4
4.4
4.3
4.5
1.0 2.0 3.0 4.0 5.0
The committee has a healthy, professionalgroup dynamic that is characterized by active
engagement and open discussion.
The committee efficiently reaches consensuson its decisions or recommendations to the
board.
The committee has the resources needed tofulfill its purpose.
The committee meets often enough toeffectively carry out its duties.
Quality Committee
Areas of Greatest Agreement Among Committee Members
0 0 1 6 4
0 0 1 5 5
1s 2s 3s 4s 5s
0 0 2 3 6
0 0 0 6 5
Distribution of Ratings
Strongly Disagree
Strongly Agree
SD = 0.37
Greatest and least agreement items are determined by their standard deviation (SD) scores. Standard Deviations are a measure of the dataset’s spread around its mean. Higher standard deviations relate to a lower consistency or agreement across ratings for a particular survey item. The lower the SD score, the greater the agreement among respondents. The higher the SD score, the less agreement among respondents. The Distribution of Ratings shows the number of unfavorable responses received indicated by ratings of 1 or 2, neutral responses indicated by ratings of 3, and favorable responses indicated by ratings of 4 or 5.
SD = 0.50
SD = 0.62
SD = 0.64
SD = 0.77
El Camino Hospital Quality Committee Self-Assessment FY 2013-2014 Summary Report
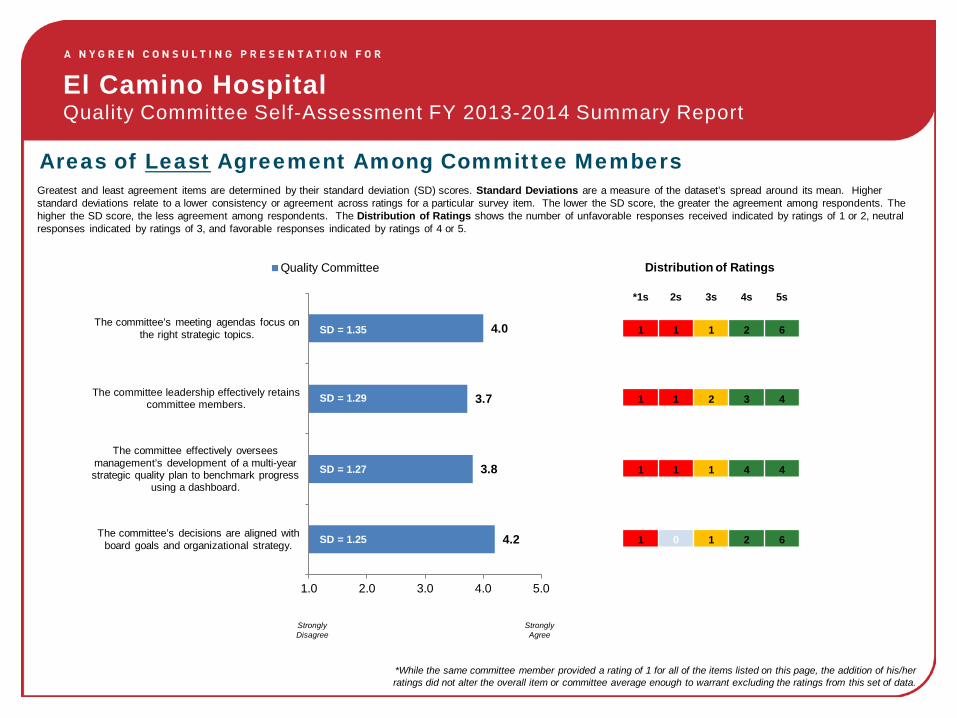
4.2
3.8
3.7
4.0
1.0 2.0 3.0 4.0 5.0
The committee’s decisions are aligned with board goals and organizational strategy.
The committee effectively oversees management’s development of a multi-year strategic quality plan to benchmark progress
using a dashboard.
The committee leadership effectively retainscommittee members.
The committee’s meeting agendas focus on the right strategic topics.
Quality Committee
Areas of Least Agreement Among Committee Members Greatest and least agreement items are determined by their standard deviation (SD) scores. Standard Deviations are a measure of the dataset’s spread around its mean. Higher standard deviations relate to a lower consistency or agreement across ratings for a particular survey item. The lower the SD score, the greater the agreement among respondents. The higher the SD score, the less agreement among respondents. The Distribution of Ratings shows the number of unfavorable responses received indicated by ratings of 1 or 2, neutral responses indicated by ratings of 3, and favorable responses indicated by ratings of 4 or 5.
1 1 2 3 4
1 1 1 4 4
*1s 2s 3s 4s 5s
1 0 1 2 6
1 1 1 2 6
Distribution of Ratings
Strongly Disagree
Strongly Agree
SD = 1.35
SD = 1.29
SD = 1.27
SD = 1.25
*While the same committee member provided a rating of 1 for all of the items listed on this page, the addition of his/her ratings did not alter the overall item or committee average enough to warrant excluding the ratings from this set of data.

El Camino Hospital Quality Committee Self-Assessment FY 2013-2014 Summary Report
All Item Scores Rated Highest to Lowest
Item Average Standard Deviation
The committee meets often enough to effectively carry out its duties. 4.5 0.50 The committee has a healthy, professional group dynamic that is characterized by active engagement and open discussion. 4.4 0.77
The committee efficiently reaches consensus on its decisions or recommendations to the board. 4.4 0.64
The committee chair provides effective leadership for this committee. 4.3 1.14
The committee effectively leverages staff support to get the information it needs in a timely manner. 4.3 1.14
The committee has the resources needed to fulfill its purpose. 4.3 0.62
The committee’s decisions are aligned with board goals and organizational strategy. 4.2 1.25
Committee members understand the hospital well enough to add value. 4.2 0.94
The committee leadership effectively recruits top talent. 4.0 1.18
The committee’s meeting agendas focus on the right strategic topics. 4.0 1.35
The committee effectively monitors and oversees the quality of patient care and service provided. 4.0 1.13
The committee ensures that non value-added work is actively identified and eliminated. 3.9 1.04
The committee effectively monitors compliance with accreditation and licensing requirements. 3.9 0.87 The committee effectively oversees management’s development of the hospital’s goals encompassing the measurement and improvement of quality, safety, risk and clinical resource utilization. 3.8 1.11
The committee effectively oversees management’s development of a multi-year strategic quality plan to benchmark progress using a dashboard. 3.8 1.27
The committee leadership effectively retains committee members. 3.7 1.29
The committee effectively reviews sentinel events and the corresponding root cause analyses. 3.5 1.20
Committee Average
= 4.1
El Camino Hospital Quality Committee Self-Assessment FY 2013-2014 Summary Report
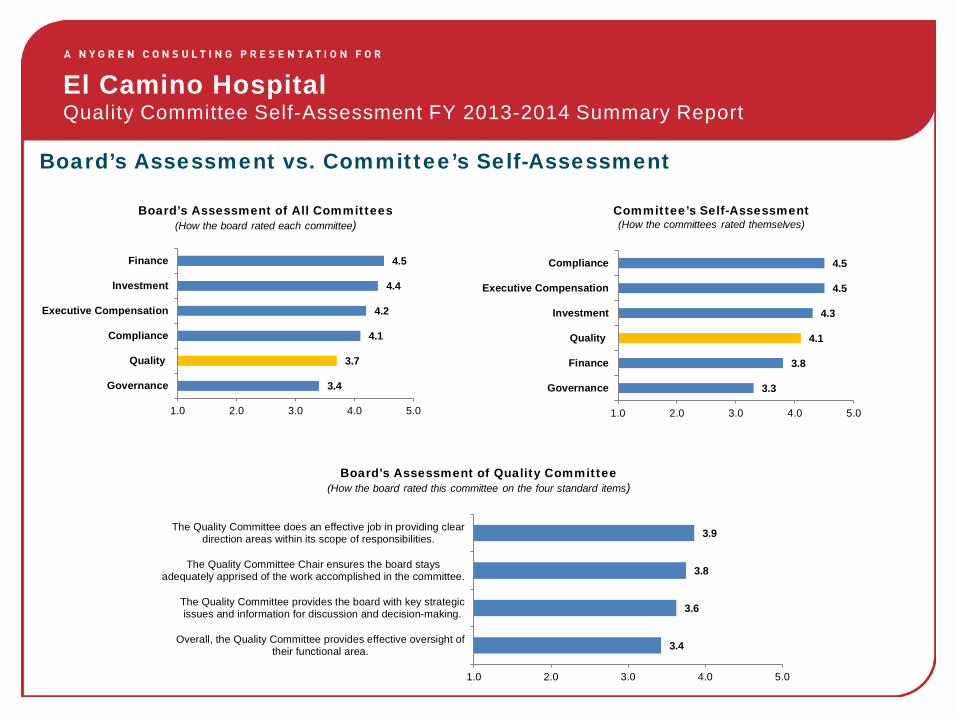
Board’s Assessment vs. Committee’s Self-Assessment
Board’s Assessment of All Committees (How the board rated each committee)
Committee’s Self-Assessment (How the committees rated themselves)
Board’s Assessment of Quality Committee (How the board rated this committee on the four standard items)
3.4
3.7
4.1
4.2
4.4
4.5
1.0 2.0 3.0 4.0 5.0
Governance
Quality
Compliance
Executive Compensation
Investment
Finance
3.3
3.8
4.1
4.3
4.5
4.5
1.0 2.0 3.0 4.0 5.0
Governance
Finance
Quality
Investment
Executive Compensation
Compliance
3.4
3.6
3.8
3.9
1.0 2.0 3.0 4.0 5.0
Overall, the Quality Committee provides effective oversight oftheir functional area.
The Quality Committee provides the board with key strategicissues and information for discussion and decision-making.
The Quality Committee Chair ensures the board staysadequately apprised of the work accomplished in the committee.
The Quality Committee does an effective job in providing cleardirection areas within its scope of responsibilities.


Separator Page
Attach 7- Corporate Scorecard FY14 through Mar.pdf

Corporate Scorecard FY14 Date Prepared: 4/21/14
Key Performance Indicator Status Trend vs Goal
Current
Available
Period
Previous
Available
Period
FY13
Baseline
FY14
Goal
Bench
mark
Benchmark
Standard
Quality
Core Measures (1 quarter lag) QuarterlyOct-Dec
2013
Jul-Sep
2013
Surgical DVT Prophylaxis (SCIP VTE-2) � ���N��N��N��N��N��N��N��N��N��N��N��N��N��N��N��N��N�N�N�N��N�N�N�N�N��N�� 98.1% 99.2% 98.9% 100% 100% Top Decile
Foley Cath Removed 1-2 days post-op � ���N��N��N��N��N��N��N��N��N��N� N��N��N��N��N�N�N�N��N�N�N�N�N��N��N��N�� 99.5% 96.7% 99.5% 100% 100% Top Decile
Core Measures % of Possible Performance Points � ���N��N��N��N��N��N��N��N� N��N��N��N��N� N��N��N��N��N��N��N��N��N��N��N� N�!N�"N�� 85.0% 73.0% 82.5% 86% 100% CMS Max
Service (45 day lag) Dec-Feb
2014
Nov-Jan
2014
N= 677 720
Communication with Nurses � ��#N�%N�&N�'N��N�(N�)N�*N�+N�,N�-N�.N�/N�0N�1N�2N�3N�4N�5N�� 75.0% 76.8% 76.3% 79.0% 81.5%CMS Top
Quartile-CY12
Responsiveness of Hospital Staff � ��6N�8N�9N�:N�;N��N�<N�*N� N�=N�>N�?N�@N�AN�BN�CN�DN�EN�FN�� 67.1% 68.2% 64.8% 68.0% 72.5%CMS Top
Quartile-CY12
Communication About Medicines � ��GN�IN�JN�9N�:N�KN�LN�MN�NN�ON�PN�QN�RN��N��N�SN�TN�UN�VN�� 58.9% 60.8% 59.8% 64.0% 66.8%CMS Top
Quartile-CY12
Outcomes (10 day lag) MonthlyJan-Mar
2014
Dec-Feb
2014
Hospital Onset C. diff Infection Rate ☺ ��WN�YN�ZN�[N�\N�]N�^N�_N�`N�aN�bN�cN�dN�eN�fN�gN�hN�iN�jN�kN�� 4.53 4.10 7.79 7.00 7.00CA Hospital
Average
Mortality (90 day lag) QuarterlyJul-Sep
2013
Apr-Jun
2013
Mortality: AMI (Observed / Expected Ratio) ☺ ���N�mN�nN�oN�pN�qN�rN�rN�� 0.55 0.55 0.70 0.75 0.77Premier 2012
Top 25% CS Std
Mortality: CHF (Observed / Expected Ratio) ☺ ��sN�uN�vN�wN�xN�yN�zN�'N�� 0.32 1.34 1.20 0.56 0.56Premier 2012
Top 25% CS Std
Mortality: Pneumonia (Observed / Expected Ratio) � ��{N�}N�N��N�~N��N��N��N�� 0.79 0.81 0.94 0.65 0.65Premier 2012
Top 25% CS Std
Morbidity (6 month lag) QuarterlyJul-Sep
2013
Apr-Jun
2013
As of Sep
2013
Risk Adj Morbidity After PCI Procedures (NCDR) � ���N��N��N��N��N��N��N��N��N��N��N��N��N�ON�ON�� 1.09% 1.12% 0.80% < 0.93 0.93%Top Decile of most
recent qtr reported by
NCDR
������������������������� 10/2012-9/2013 7/2012-6/2013
Risk Adj Morbidity After Surgical Proc (all specialties) (NSQIP) ☺ ��ON�ON�ON�ON�ON�ON�ON�ON��N��N��N��N��N�]N��N��N�� 0.82 0.89 0.89 <1.00 0.65Top Decile of most
recent rpt from NSQIP
Patient Safety (10 day lag) MonthlyJan-Mar
2014
Dec-Feb
2014
# Stage 3-4 Hospital Acquired Reported Pressure Ulcers ☺ ���N��N��N��N��N�'N��N��N��N��N��N��N��N��N��N��N��N��N��N��N�� 0 0 10 5 0NDNQI best
Quartile
Med/Surg/CC Falls /1000 CALNOC Pt Days ☺ ���N��N��N��N��N��N��N� N�¡N�%N�¢N�£N�¤N�¥N�9N�:N�¦N�§N�¨N�¡N�� 1.58 1.25 2.26 1.60 1.60CALNOC best
Quartile
5 Rights Medication Errors / 1000 Adj Acute Pt Days ☺ ��©N�«N�¬N�N�®N�¯N�°N�±N�²N�³N�´N�µN�¶N��N�·N�¸N�¹N�ºN�»N�¼N�� 1.59 1.94 2.12 2.00 2.12Prior
Performance
# Mislabeled Specimens / Month � ��aN��N�¾N�¿N�ÀN�ÁN�ÂN�ÃN�ÄN�ÅN�ÆN�ÇN�ÈN�ÉN�ÊN�ËN�ÌN�ÍN�ÎN�ÏN�� 22 21 47 20 47Prior
PerformanceOct-Dec 2013 Jul-Sep 2013
# Incidents of Preventable Harm / Calendar Quarter ☺ ��ÐN�ÑN�&N�ÒN�ÓN�ÔN�bN�ÕN��N�ÖN�×N�ØN�ÙN��N�ÚN�ØN��N�ÛN�ÜN�ÝN�� 15 22 23 15 23Prior
Performance
� = within 10% of goal 1 of 2 4/23/2014

Corporate Scorecard FY14 Date Prepared: 4/21/14
Key Performance Indicator Status Trend vs Goal
Current
Available
Period
Previous
Available
Period
FY13
Baseline
FY14
Goal
Bench
mark
Benchmark
Standard
Affordability
Efficiency (10 Day lag) MonthlyJan-Mar
2014
Dec-Feb
2014
Medical-Surgical Length of Stay Improvement Opportunity � ��ÞN�ÞN�ßN�àN�áN�âN�ãN�äN�åN�æN�ßN�çN�èN�éN�êN�ëN�ìN�íN�îN�ïN�� 0.67 0.73 0.31 0.30 0.00 CMS GMLOS
Median Minutes from ED Arrival to Admit to Unit � ���N�LN�ðN�ñN�òN�óN�ôN�sN�õN�öN�÷N�øN�ùN�úN�ûN�üN�ýN�dN�þN�_N�� 293 293 305 255 305Prior
Performance
OR Room Turnaround within 35 min � ��F N� � N�î N� � N� � N� � N� � N�Z N� � N� � N� N� N� � N� � N� N� � N� � N� � N�¬ N�� N�� 67% 64% 66% 67% 66%Prior
Performance
Worked Hours per CMI Adjusted Discharge � ��� N�� N�� N�� N�� N�ý N�� N�� N�� N�� N��N�� N�� N�� N�K N�� N� N�! N�" N�� N�# N�$ N�% N�& N�{ N�} N�î N�' N�D N�( N�) N�* N�� 96.8 98.0 90.7 94.3 89.2 Truven 65th %ile
Total Operating Expense per CMI Adjusted Discharge � ��÷N�+ N�, N�- N�. N��N�§N�+ N�/ N� N��N�0 N�1 N�2 N�wN�3 N�4 N�5 N�6 N�7 N�8 N�& N�{N�9 N�: N�; N�< N�= N�> N�? N�@ N�A N�� 14,938 14,876 13,876 13,967 13,967 Budget
Financial Viability (1 quarter lag) QuarterlyOct-Dec
2013
Jul-Sep
2013
Inpatient Operating Margin (excludes settlement) � ��� N�� N�� N�C N�� N�� N�+ N�I N�D N�E N�F N�� N�G N�H N�ù N�I N�� -3.0% -5.0% -1.0% -0.4% -1.0%Prior
Performance
Outpatient Operating Margin (excludes settlement) ☺ ��J N�K N�L N�M N�@N�AN�N N�O N�P N�2N�òN�Q N�R N�S N�T N�ôN�� 29.0% 28.0% 27% 24% 27%Prior
Performance
(10 day lag)Jan-Mar
2014
Dec-Feb
2014
Investment Return � ��U N�W N�X N�Y N�Z N�! N�[ N�Û N�2 N�\ N�] N�̂N�_ N�7 N�® N�̀N�aN�b N�c N�d N�eN�f N�g N�h N�i N�j N�� N�k N�� N�à N�l N�m N�� 0.4% 0.7% 1.4% 1.0% 2.8%Index based on
asset allocation
Total Operating Margin � ��n N�p N�� N�� N�q N�r N�s N�t N�u N�v N�w N�x N�y N�£ N�z N�M N�} N�{ N�# N�g N�| N�aN�£ N�̂N�µ N�� N�} N�� N�~ N�S N�� N�� N�� 6.2% 10.3% 9.9% 8.5% 3.3% S&P A Rating
Adjusted Acute Discharges ☺ ��� N�� N�� N�¥ N�� N�� N�Ë N�� N�� N�� N�� N�� N�� N�� N�� N�� N�� N�� N�� N�� N�� N�� N�� N�� N�� N�� N�z N�� N�º N�� N�� N�� N�� 8,099 7,774 8,055 7,823 7,823 Budget
Total Days Cash on Hand (average/mo) � ��ÍN�ÇN�� N�� N��N�ýN�� N�� N�� N�¶N�� N�̀N��N�� N�� N�rN�� N�þN�� N�� N� N�¡N�¡N�¢ N��N�òN�£N�£N�¤ N�¥N�¥N�¦ N�� 376 375 350 394 225 S&P A Rating
Days of Accounts Receivable (average/mo) � ��§ N�̈N�© N�ÓN��N�ª N�« N�; N�¬ N�]N� N�® N�̄N�[N�° N�± N�² N�¡N�ÜN�@N��N�� N��N�� N�³ N�́N�vN�vN�µ N�¶ N�· N�oN�� 52.7 52.1 47.8 50.0 48.9 S&P A Rating
FY 2013 FY 2013
Community Benefit as a Percent of Total Net Revenue(district & hospital, including grants, charity, subsidized services)
��N�) N�̧N�' N�¹ N�º N�@N�AN�» N�¼ N�½ N�} N�¾ N�¿ N�À N�Á N�P N�2N�� 7.9% 7.9% 7.9% N/A N/A N/A
Continuum of Care (30 day lag) MonthlyDec-Feb
2014
Nov-Jan
2014
30 Day Medicare Unplanned Readmission (single campus)* ☺ �� N�Ä N�Å N�Æ N�Ç N�È N�q N�� N�Ä N�É N�Ê N�w N�Ë N�Ì N�� N�Í N�Î N�Ï N�ÐN�� 8.88% 9.18% 10.63% 10.00% 10.63%Prior
Performance
*Margin of error +/- 0.3%
Employee Wellbeing (1 calendar quarter lag) QuarterlyJan-Mar
2014
Oct-Dec
2013
All Employee Patient Lift/Transfer Injuries / 100 FTE � ��Ñ N�- N�Ò N�Ó N�Ô N�Õ N�yN�Ö N�× N�Ø N�� N�Ê N�Ù N�Ú N�Û N��N�Ü N�Ý N�Þ N�ß N�& N�: N�à N�èN�éN�á N�âN�� N�� 5.60 5.40 6.30 5.35 6.30Prior
Performance
% Employees Completing Biometric Screening � �� N�ãN�ä N�åN�æ N�ç N�IN�JN��N�è N��N�ÏN�é N�ê N�ë N�ZN�� 23.4% 3.7% 42.0% 48.0% 42.0%Prior
Performance
� = within 10% of goal 2 of 2 4/23/2014

Separator Page
Attach 9-Quality Committee Charter.pdf