elac annual report - aguila blanca · elac annual report january 2016. ... 4 developed a five-year...
TRANSCRIPT

2016 Annual Report Indiana Early Learning Advisory Committee 1
ELAC ANNUAL REPORT
JANUARY 2016
THE CHAIRMANA LETTER FROM...
Governor Pence and the Indiana General Assembly:
Since its inception in late 2013, Indiana’s Early Learning Advisory Committee (ELAC) has had as its mission to help promote accessibility, affordability, and high quality in early childhood experiences. The fact that 2/3 of families in the Hoosier State require care for their children ages 0-5, brings an added urgency to this mission - an urgency underscored by the fact that only 1 out of 10 of these children are currently in a known high quality setting. These and other key benchmarks are found in the pages that follow. By dimensionalizing the need, ELAC hopes to provide sound, fact-based data for use in legislation and decision-making in this important arena. But ELAC’s role encompasses more than just reporting numbers. The 150+ volunteers that comprise the 7 ELAC workgroups use their significant expertise to research and develop best-practice based tools and recommendations to advance our shared mission. Just in the past 12 months, this has included toolkits that equip providers to engage more effectively with families, definitions that align the work, and documents that frame the funding sources available. We’re also proud to have been part of Indiana University’s evaluation of our first cohort of 4-year old participants in the pilot pre-K Early Education Matching Grant program. These results show conclusively the impact of high-quality pre-K in enabling at-risk children of poverty to make up lost ground on the way to kindergarten readiness. You’ll find all of this and much more on our new dedicated website, www.ELACIndiana.org. Your collective investments in high-quality pre-K ARE paying off. By continuing to advance this work, you are paving the way for future generations to thrive educationally and play significant workforce leadership roles in the Hoosier state. The volunteers of ELAC remain committed to assist and equip all of Indiana’s stakeholders in this critical endeavor. Sincerely,
Kevin R. BainChairman, ELACExecutive Director/CEO, Welborn Baptist Foundation

2016 Annual Report Indiana Early Learning Advisory Committee 3
TABLE OF CONTENTS
I. Executive Summary .....................................................4
II. Needs Assessment .......................................................6
A. Hoosier Children and Families .................................7
B. Accessibility .............................................................8
C. Affordability ............................................................10
D. High Quality ...........................................................12
E. Kindergarten Readiness ........................................15
III. Recommendations......................................................18
IV. Endnotes .........................................................................19

2016 Annual Report Indiana Early Learning Advisory Committee 4
EXECUTIVE SUMMARY
APPOINTED COMMITTEE MEMBERS
KEVIN BAIN, Chairman, Welborn Baptist Foundation, Inc.
ROBIN ATKINS, Indiana Head Start State Collaboration Office
MELANIE BRIZZI, FSSA Office of Early Childhood and Out-of-School Learning
Annually, Indiana’s Early Learning Advisory Committee (ELAC) conducts a comprehensive needs assessment on critical early learning indicators to identify recommendations for the Governor’s Office and the Indiana General Assembly. This report is a culmination of the needs assessment completed in 2015.
4 More children are enrolled in high quality programs than ever before.
4 In the past five years, Indiana has nearly doubled the number of high quality programs 1 available for children and families.
4 Through the additional pathway for public preschools, 28 public schools are now participating in Paths to QUALITY.
4 Indiana has made available a high quality early learning experience for nearly 2,200 low-income three and four-year old children through the implementation of state and local-funded pilot preschool programs. 2
PROGRESS
High-Quality
AffordabilityAcce
ssibi
lity
Based on the information that ELAC has collected this past year and included throughout this report, Indiana is making progress in some areas and still has work to do in others.
• While Indiana has expanded access to high quality programs, there is still a significant gap in the availability to match the need. For all children likely in need of care, high quality seats are only available for 13 percent of them.
• In Indiana, we do not consistently assess the readiness of children entering kindergarten. Therefore, we do not know how ready our children are for school.
• An increasing number of children are being retained in kindergarten costing the state over $22 million this past school year.
• Indiana has a projected shortfall for early childhood education teachers based on current demand.
• Indiana is lacking the critical infrastructure needed to ensure that Hoosier children ages birth to 8 years and their families have access to affordable, high-quality early childhood education programs.
AREAS TO IMPROVE
ELAC is working to ensure that children ages birth to 8 years and their families have access to affordable, high-quality early childhood education programs that keep children healthy, safe and learning.
CINDY FREY, Columbus Area Chamber of Commerce
CHARLIE GEIER, Indiana Department of Education
CONNIE SHERMAN, St. Mary’s Child Center
CHRISTOPHER STOKES, Eli Lilly
1 High quality is defined as participation in Paths to QUALITY Level 3 or Level 4.2 The pilot preschool programs include On My Way Pre-K, Early Education Matching Grant and Indy Preschool Scholarship Program.
2016 Annual Report Indiana Early Learning Advisory Committee 5
EXECUTIVE SUMMARY
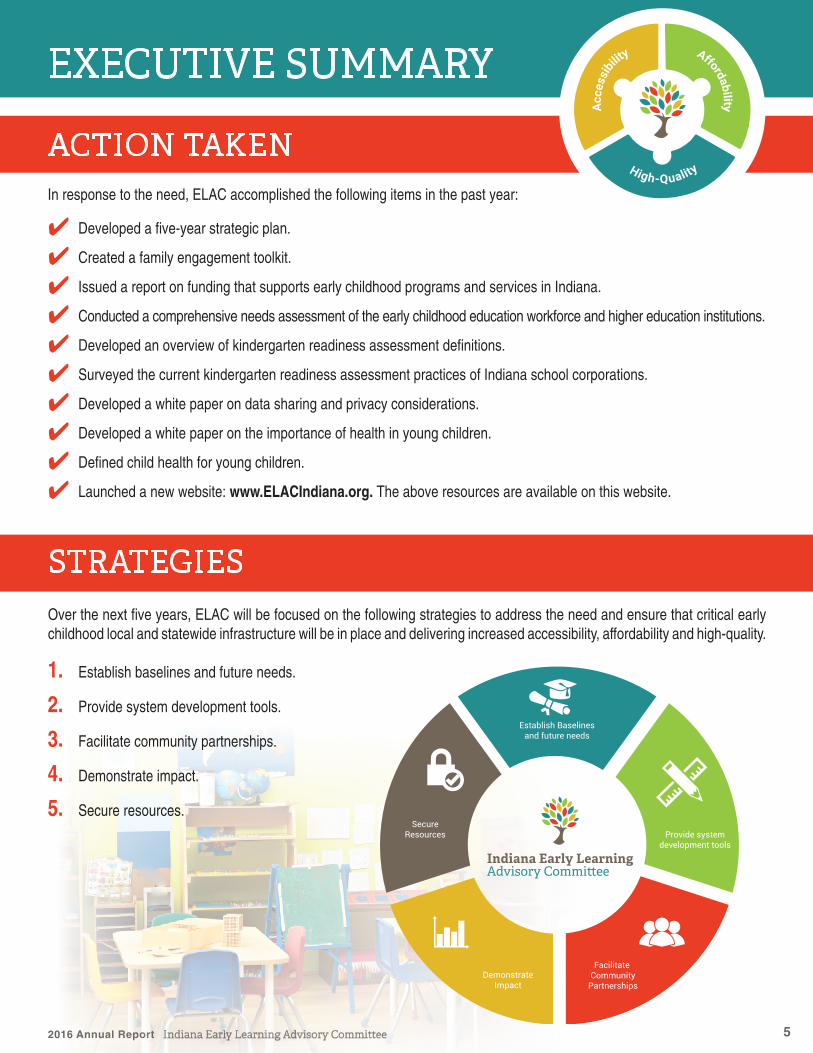
In response to the need, ELAC accomplished the following items in the past year:
4 Developed a five-year strategic plan.
4 Created a family engagement toolkit.
4 Issued a report on funding that supports early childhood programs and services in Indiana.
4 Conducted a comprehensive needs assessment of the early childhood education workforce and higher education institutions.
4 Developed an overview of kindergarten readiness assessment definitions.
4 Surveyed the current kindergarten readiness assessment practices of Indiana school corporations.
4 Developed a white paper on data sharing and privacy considerations.
4 Developed a white paper on the importance of health in young children.
4 Defined child health for young children.
4 Launched a new website: www.ELACIndiana.org. The above resources are available on this website.
ACTION TAKEN
Over the next five years, ELAC will be focused on the following strategies to address the need and ensure that critical early childhood local and statewide infrastructure will be in place and delivering increased accessibility, affordability and high-quality.
STRATEGIES
Establish Baselinesand future needs
Provide systemdevelopment tools
Facilitate Community
PartnershipsDemonstrate
Impact
SecureResources
High-Quality
AffordabilityAcce
ssibi
lity
1. Establish baselines and future needs.
2. Provide system development tools.
3. Facilitate community partnerships.
4. Demonstrate impact.
5. Secure resources.
2016 Annual Report Indiana Early Learning Advisory Committee 6
2016 Annual ELAC Report
2015
?
2011 N/A
HOOSIER CHILDREN
AND FAMILIES
A HIGH QUALITY EARLY
CARE AND CHILDHOOD EDUCATION
EARLY CHILDHOOD WORKFORCE
KINDERGARTENREADINESS
HOOSIER CHILDREN
AGES 0-5
2014
505,090
2011 517,115
YOUNG CHILDREN LIVING
IN POVERTY
PERCENT OF ANNUAL INCOME
A FAMILY IN POVERTY PAYS FOR
HIGH QUALITY CARE
CHILDREN ENROLLED IN
KNOWN PROGRAMS
CHILDREN ENROLLED IN
HIGH QUALITY PROGRAMS
HIGH QUALITY SEATS IN KNOWN
PROGRAMS
HIGH QUALITY SEATS AVAILABLE
FOR ALL CHILDREN LIKELY IN NEED
OF CARE
EARLY CHILDHOOD EDUCATION WORKFORCE
EARLY CHILDHOOD EDUCATION
WORKFORCE WITH ANY BA DEGREE
ANNUAL MEDIAN WAGES FOR PRESCHOOLTEACHERS
PROJECTED EARLY CHILDHOOD
EDUCATION WORKFORCE
DEFICIT
CHILDREN ENROLLED IN
KINDERGARTEN
CHILDREN RETAINED IN
KINDERGARTEN
COST OF
RETENTION
CHILDREN READY
FOR SCHOOL
2016 ELAC DashboardINDIANA’S CHILDREN LIVE IN HOUSEHOLDS WHERE ALL PARENTS
WORK AND LIKELY NEED CARE
2014
24%
2011 26%
2015
42%
2011 41%
2014
66%
2011 67%
2015
113,393
2014 109,681
2015
42,299
2011 24,961
2015
37%
2011 34%
2015
13%
2011 11%
2015
25,227
2012 23,400
2015
27%
2010 23%
2015
$24,030
2011 $23,890
2014
8,043
2012 N/A
2015
92%
2011 89%
2015
5%
2011 3%
2014
$22,712,393
2013 $21,609,375
Improved Worsened
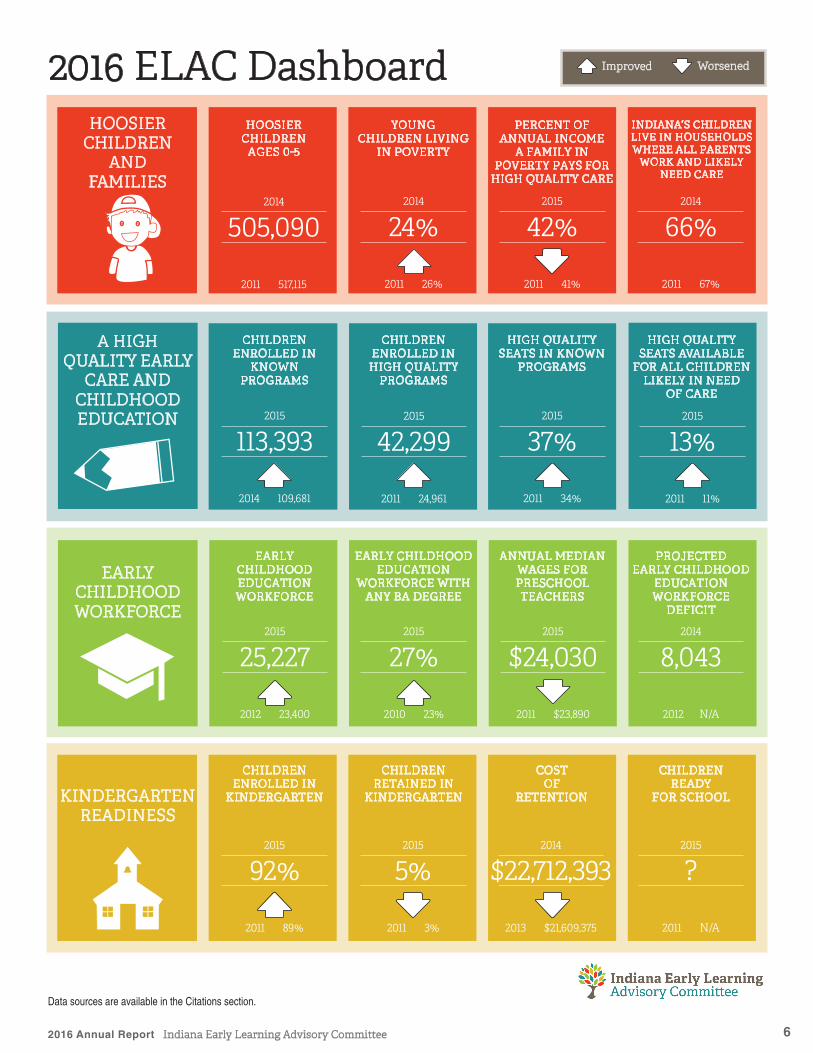
Data sources are available in the Citations section.

2016 Annual Report Indiana Early Learning Advisory Committee 7
CHILDREN AND FAMILIES
Indiana has over 500,000 children ages 0-5 from 334,000 families.i Over half (254,629) of our youngest children live in low-income families 3 compared to the national average of 48 percent. Of those children, 24 percent are living in poverty.ii
Indiana’s families are working families. Two of every three children from birth to five years oldin Indiana require care because their families are in the labor force.4 iii This is a total of 330,000 children who, each day, are learning and growing away from a parent’s view.
Indiana’s ability to assure that children are ready for school, can read at grade level, graduate from high school, pursue a post- secondary education and contribute to the economy is influenced by the healthy development of our youngest children.
49% ABOVE LOW-INCOME
27%100-200% FPL
24% LESS THAN 100% FPL
YOUNG CHILDREN IN INDIANA BY INCOME LEVEL
Above Low-Income
Not employed
Part-time or part-year
PARENTS’ EMPLOYMENT STATUS IN INDIANA, BY INCOME LEVEL, 2013
Low-Income
Full-time, year-round
INDIANA’S YOUNG
CHILDREN (AGES 0-5)iv
INFANT
82,993TODDLER
167,294PRESCHOOL
169,200KINDERGARTEN
85,603
49% Above Low-Income 27% Low-Income 24% In Poverty
66% of Indiana children live in households where all parents work and likely need care.
HEALTHY START
READY FOR SCHOOL
READING AT GRADE LEVEL
GRADUATE HIGH SCHOOL
POST-SECONDARY ATTAINMENT
CONTRIBUTING EMPLOYEE
7.2% infant deaths per 1,000 v
24% under 5 receive developmental screening.vi
5% of kindergartners were retained.vii
83% of 3rd graders passed ISTEP ELA.viii
89% of students graduated
high school.ix
35% of adults hold a two-or
four-year degree.x
80% of adults ages 25 - 54
years old are part of the workforce.xi
INDIANA’S CRADLE TO CAREER PIPELINE
High-Quality
AffordabilityAcce
ssibi
lity
3 Families and children are defined as low-income if the family income is less than twice the federal poverty threshold - $48,500 for a family of four with two children in 2015.
4 For children living in a married-couple family, this means that both parents are in the labor force. For children living in a single-parent family or subfamily, this means the resident parent is in the labor force. The civilian labor force includes persons who are employed and those who are unemployed but looking for work.
Data Source: National Center for Children in Poverty, 2013.

2016 Annual Report Indiana Early Learning Advisory Committee 8
While parents are children’s first teachers, early childhood education programs provide early learning opportunities for thousands of young children daily and can have a significant impact on their development and readiness for school. Every week in Indiana, approximately 333,000 children younger than age six are in some type of child care arrangement. Of the 330,000 children likely in need of care, we know that approximately one-third of them are enrolled in a “known setting” (licensed homes, licensed centers and registered ministries). The majority of children (over 216,000), however, are receiving care in “informal settings” from a family member, friend or neighbor.
THE EARLY LEARNING LANDSCAPE IN INDIANA
High quality early childhood care and education will be more accessible for all children and families.
NEED
ACCESSIBILITY
5 YEAR GOAL
PreschoolPrograms
Head StartPrograms
INDIANA’S MIXED DELIVERY SYSTEM
LicensedCenter
Registered Ministry
Family Child Care Home
3%16% 12%68%
ACCESSIBILITY OF EARLY CARE AND
CHILDHOOD EDUCATION
CHILDREN UNDER 6 LIKELY IN
NEED OF CARE
330,000xii
CHILDREN ENROLLED IN KNOWN
PROGRAMS
113,393xiii
AVAILABILITY OF CARE IS IN FAMILY CHILD
CARE HOMES
68%xiv
INDIVIDUALS EMPLOYED IN THE EARLY CHILDHOOD
EDUCATION WORKFORCE
25,227xv
1%
Indiana has a strong mixed delivery system and prides itself on providing families with choice in selecting the type of care that best fits their family’s needs and values. As displayed in the bar graph, family home providers are the largest source of child care available to Hoosier families followed by registered ministries and licensed centers respectively.
Avai
labi
lity
of
child
car
e
Data Source: Indiana Association for Child Care Resource and Referral, December 2015.
2016 Annual Report Indiana Early Learning Advisory Committee 9
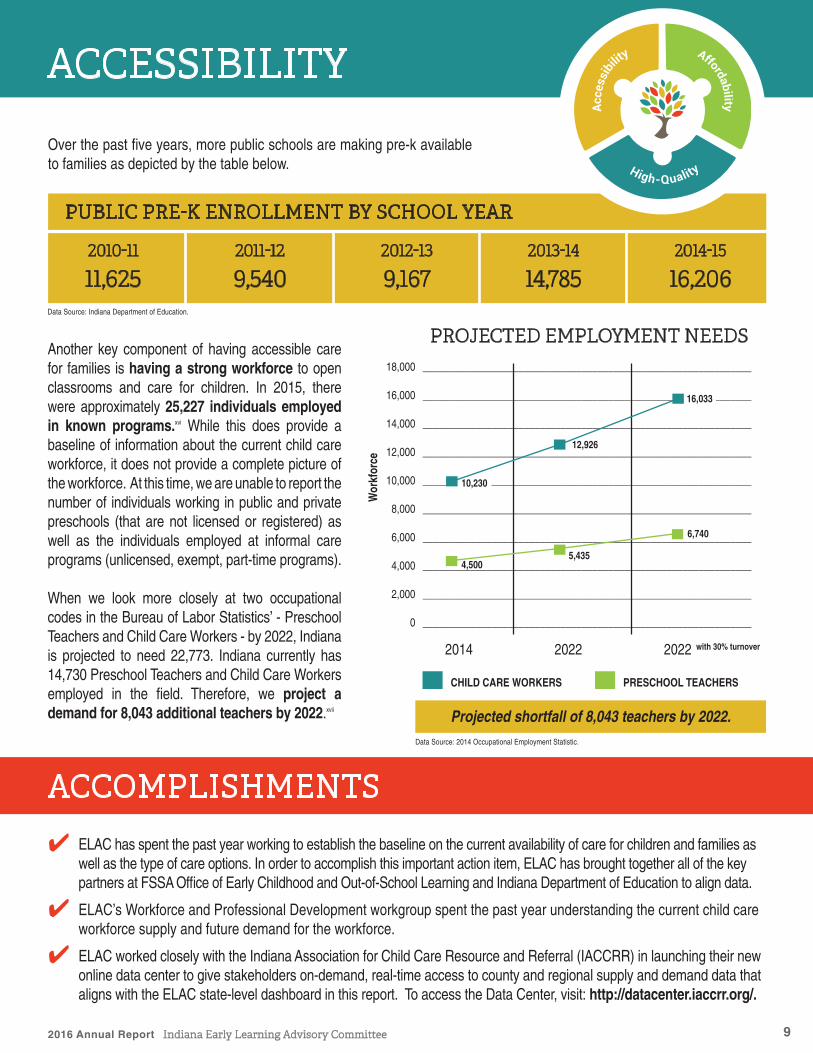
Another key component of having accessible care for families is having a strong workforce to open classrooms and care for children. In 2015, there were approximately 25,227 individuals employed in known programs.xvi While this does provide a baseline of information about the current child care workforce, it does not provide a complete picture of the workforce. At this time, we are unable to report the number of individuals working in public and private preschools (that are not licensed or registered) as well as the individuals employed at informal care programs (unlicensed, exempt, part-time programs).
When we look more closely at two occupational codes in the Bureau of Labor Statistics’ - Preschool Teachers and Child Care Workers - by 2022, Indiana is projected to need 22,773. Indiana currently has 14,730 Preschool Teachers and Child Care Workers employed in the field. Therefore, we project a demand for 8,043 additional teachers by 2022.xvii
ACCESSIBILITY
Over the past five years, more public schools are making pre-k available to families as depicted by the table below.
PUBLIC PRE-K ENROLLMENT BY SCHOOL YEAR
18,000
16,000
14,000
12,000
10,000
8,000
6,000
4,000
2,000
0
Wor
kfor
ce
2014 2022 2022 with 30% turnover
10,230
12,926
16,033
6,740
CHILD CARE WORKERS PRESCHOOL TEACHERS
4 ELAC has spent the past year working to establish the baseline on the current availability of care for children and families as well as the type of care options. In order to accomplish this important action item, ELAC has brought together all of the key partners at FSSA Office of Early Childhood and Out-of-School Learning and Indiana Department of Education to align data.
4 ELAC’s Workforce and Professional Development workgroup spent the past year understanding the current child care workforce supply and future demand for the workforce.
4 ELAC worked closely with the Indiana Association for Child Care Resource and Referral (IACCRR) in launching their new online data center to give stakeholders on-demand, real-time access to county and regional supply and demand data that aligns with the ELAC state-level dashboard in this report. To access the Data Center, visit: http://datacenter.iaccrr.org/.
ACCOMPLISHMENTS
PROJECTED EMPLOYMENT NEEDS
2010-11
11,6252011-12
9,5402012-13
9,1672013-14
14,7852014-15
16,206
4,5005,435
Projected shortfall of 8,043 teachers by 2022.
Data Source: Indiana Department of Education.
Data Source: 2014 Occupational Employment Statistic.

2016 Annual Report Indiana Early Learning Advisory Committee 10
High quality early childhood care and education will be more affordable for at-risk families.5 YEAR GOAL
AFFORDABILITY
COST OF CARE IN INDIANAParents in the labor force face numerous decisions when balancing their work and home life, including the type of care to provide for their children while they work. Child care arrangements and their costs are significant issues for families. Having access to reliable, affordable care impacts a family’s ability to be employed and contribute to the economy.
In Indiana the cost of care varies dramatically depending on the type of provider and level of quality. The cost of a home provider is typically less expensive than the cost of a licensed center. In addition, the cost of care for an infant is significantly higher than the cost of care for a preschooler. When comparing the cost of care for all types of care versus high quality care, the cost is approximately $1,000 more. In the past five years, the cost of care has increased approximately $750 or an average of $14/week.
INFANT/TODDLER PRESCHOOL AVG 0-5
CENTERS $11,096 $8,983 $10,040
HOMES $6,928 $6,205 $6,567
MINISTRIES $9,857 $7,768 $8,812
NEED
AFFORDABILITYOF EARLY CARE AND
CHILDHOOD EDUCATION
AVERAGE COST OF ALL CARE
$7,498xviii
AVERAGE COST OF HIGH QUALITY CARE
$8,473xix
A FAMILY IN POVERTY PAYS OF THEIR
INCOME FOR HIGH QUALITY CARE
42%xx
FAMILIES ON THE CCDF WAITLIST
10,975xxi
2015 AVERAGE COST OF HIGH QUALITY CARE BY PROGRAM TYPE
AVERAGE COST OF CARE (AGES 0-5)
ALL CARE HIGH QUALITY
2011
$6,752
2015
$7,498
2011
$7,582
2015
$8,473
Data Source: Indiana Association for Child Care Resource and Referral. Data Source: Indiana Association for Child Care Resource and Referral, December 2015.

2016 Annual Report Indiana Early Learning Advisory Committee 11
In Indiana, with the average annual cost of high quality care at $8,473, low-income families can be priced out of the market and middle class families may struggle with the cost – particularly for families with more than one young child in need of care. For a family of three living in poverty,5 42 percent of their income would go to pay for high quality care. Even median income families 6 would contribute 15 percent of their income for high quality care. xxii
The cost of care, let alone high quality care, is unaffordable for most Hoosier families. Indiana ranks 29th and 31st for least affordable center-based infant and four-year old care respectively. The average costs for two children in child care7 ($15,678) is nearly double the cost of annualized rent and 15 percent higher than the annualized cost of a mortgage.xxiii When putting the cost of child care into context of other expenses in Indiana, infant care costs the same as full-time, in-state public college tuition. xxiv
Child care assistance can help families work and contribute to the economy, especially for low-income families. In Indiana, we currently have 10,975 eligible families waiting to receive a child care voucher.xxv In North Carolina and in New York City, one-third of families on the waiting list for child care either lost their job or were unable to work before they received a child care subsidy. The benefits of child care assistance are particularly strong for single parents, who are nearly 40 percent more likely to maintain employment over two years compared to those who do not have help paying for child care.xxvi
AFFORDABILITY
ACCOMPLISHMENTS
In 2015, ELAC’s Funding Streams workgroup completed a report on the Analysis of Funding that Supports Early Childhood Programs and Services in Indiana. From this analysis, ELAC identified that 35% of funding is available to help subsidize early childhood care and education for families from state and federal sources. However, the majority (62%) of funding comes from families paying for care.
62%
4 In the past year, Indiana has made high quality early childhood care and education available for approximately 2,200 low-income preschool children through implementation of On My Way Pre-K, Early Education Matching Grants, and the Indy Preschool Scholarship Program. Low-income families who most likely would not have been able to afford high quality care for their preschooler were able to receive this benefit.
4 In addition, 518 infants and toddlers were able to enroll in high quality Early Head Start and child care programs through the new federal Early Head Start-Child Care Partnership grant program.
4 Key state agencies; FSSA Office of Early Childhood and Out-of-School Learning and Indiana Department of Education (IDOE) have both been working to assist early childhood education programs in layering their funding to support more families. For example, IDOE has developed guidance for public schools on how to use their Title 1 funding to support preschool; similarly FSSA has provided guidance to public schools on how to layer CCDF funding with their funding sources to serve more low-income children and families. With the addition of the new state-funded pre-k pilot programs, state officials and early childhood education programs are both learning new ways of layering funding to help more families access and afford high quality early childhood care and education.
Private
Federal
State
INDIANA EARLY LEARNING FUNDING SOURCES FOR BIRTH TO AGE FIVE
Philanthropy
Local29%
6% 0.3%3%
5 Income for a family of three in poverty is $19,790. 6 Median income for a family with children (under age 18) in Indiana is $56,800.7 Center-based child care costs include the sum cost of one infant and one four-year-old in child care.
Data Source: Analysis of Funding that supports Early Childhood Programs and Services, 2015.

2016 Annual Report Indiana Early Learning Advisory Committee 12
High quality early childhood care and education will be supported by best practices in all communities.5 YEAR GOAL
HIGH-QUALITY
HIGH QUALITY EARLY LEARNING EXPERIENCESStrong and consistent evidence demonstrates that participation in high-quality early learning programs can lead to positive outcomes for all children, especially children from low-income families.xxvii Research has shown the multiple benefits of attending preschool programs that are of high-quality, including increased school readiness, lower rates of grade retention and special education placements, improved high school graduation rates, reduced interaction with law enforcement, and higher rates of college attendance and completion.xxviii
NEED
HIGH QUALITYEARLY
CARE AND CHILDHOOD EDUCATION
HIGH QUALITY EARLY CHILDHOOD
EDUCATION PROGRAMS
968xxix
CHILDREN ENROLLED IN
HIGH QUALITY PROGRAMS
42,299xxx
HIGH QUALITY SEATS AVAILABLE FOR ALL
CHILDREN LIKELY IN NEED OF CARE
13%xxxi
COUNTIES WITH NO HIGH QUALITY
PROGRAM
8%xxxii
Total Centers Homes Ministries
Number of known programs 4,254 523 3,035 696
Number of programs in Paths to QUALITY 2,425 437 1,865 123
Number of “high quality” programs 968 433 478 57
PATHS TO QUALITY UTILIZATION
COUNT OF HIGH QUALITY PROGRAMS 2011 - 2015In the past five years, Indiana has increased the number of high quality programs available for children and families from 520 in 2011 to 968 in 2015. As a result, more Hoosier children are enrolled in high quality programs as evidenced in the chart.
With the implementation of the Paths to QUALITY pathway for public schools, 28 additional public preschools have achieved the designation of “high quality” and are reflected in the “Center Exempt” category chart.
Data Source: Indiana Association for Child Care Resource and Referral.
Data Source: Indiana Association for Child Care Resource and Referral.
2016 Annual Report Indiana Early Learning Advisory Committee 13
HIGH-QUALITY
0% Enrolled (no high quality seats available)
Less than 25% Enrolled
26% - 50% Enrolled
Greater than 50% Enrolled
Lake
17%
Porter
14%
La Porte
34%
St. Joseph
24%Elkhart
10%La Grange
6%Steuben
21%
De Kalb
18%Noble
11%
Whitley
14%Allen
34%
Adams
3%Wells
0%
Jay
9%
Randolph
7%
Wayne
17%
Newton
0%
Jasper
0%
Starke
0%Marshall
5% Kosciusko
9%Pulaski
14%Fulton
11%
Benton
16%
White
26%Cass 5%
Carroll
7%
Miami7%
Wabash
12%Huntington
29%
Warren
0%
Tippecanoe
26% Clinton
5%
Howard 25%Grant
17% Blackford
17%Delaware
25%
Henry
14%
Union
31%Franklin
9%
Dearborn
14%
Fayette
5%
Tipton
14% Madison
20%
Hancock
8%Rush
0%
Decatur
11%Ripley
22%Ohio
10%Switzerland
14%Jefferson
31%
Jennings
4%
Shelby
4%
Scott
5%Clark
9%
Floyd23%
Harrison
18%
Washington
3%
Hamilton
30%Boone
22%
Marion
30%Hendricks
15%
Johnson
15%
Bartholomew
21%Brown
6%
Morgan
5%
Jackson
46%Lawrence
14%
Orange
7%
Crawford
0%Perry
10%Spencer
16%
Warrick
18%Vanderburgh
37%Posey
26%
Gibson
49%Dubois
61%
Daviess
30%Knox
21% Martin
10%
Greene
5%
Pike
16%
Sullivan
0%
Vigo
29%Clay
35%Owen
6% Monroe
31%
Fountain
11% Montgomery
15%
Putnam
1%
Parke
20%7%
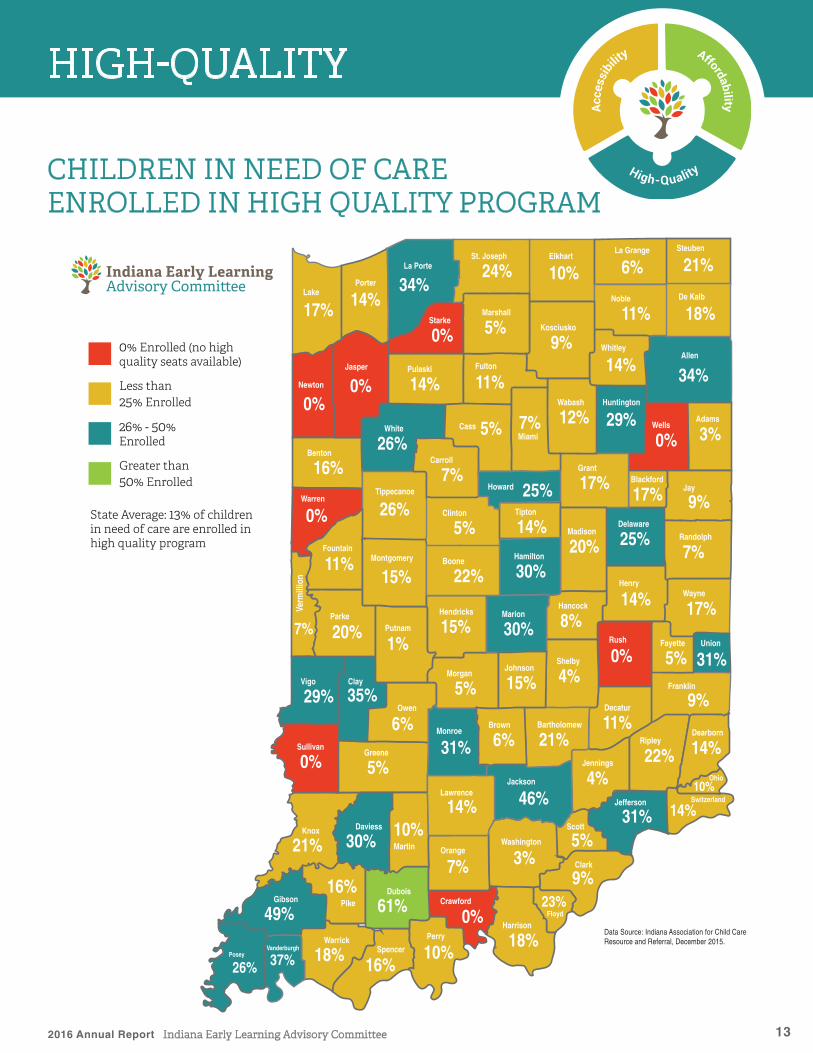
CHILDREN IN NEED OF CARE ENROLLED IN HIGH QUALITY CARE 2016
State Average: 13% of children in need of care are enrolled in high quality program
CHILDREN IN NEED OF CAREENROLLED IN HIGH QUALITY PROGRAM
Data Source: Indiana Association for Child Care Resource and Referral, December 2015.

2016 Annual Report Indiana Early Learning Advisory Committee 14
HIGH-QUALITY
ACCOMPLISHMENTS
4With the implementation of the pre-k pilot programs, additional capacity of high quality programs and seats were created to support the enrollment of these programs. Through a partnership between FSSA Office of Early Childhood and Out-of-School Learning, Early Learning Indiana and United Way of Central Indiana building grants were awarded to early childhood education programs in the five pilot counties that added over 500 high quality seats.
4 New Early Learning Guidelines (The Foundations)
4 Family Engagement Toolkit
4 Early Education Matching Grant Year 1 Program Evaluation Summary Results
HIGH QUALITY ENROLLMENT BY AGE GROUP
AGE GROUP 2011 2015
INFANTS 1,892 3,146
TODDLERS 6,297 10,418
PRESCHOOL 16,772 28,735
TOTAL HIGH QUALITY 24,961 42,299 ENROLLMENT
TYPES OF HIGH QUALITY SEATS AVAILABLE
REGISTERED MINISTRY
LICENSED CENTER
LICENSED HOME
45,855
6,403
5,442
11%
Ministries
Homes
Centers
9%
80%
When we look closer at the distribution of high quality seats across the state, there are significant gaps in the availability based on the community. Most Hoosier children are not enrolled in a high quality program. There are eight Counties with no high quality program available for families. With only one County having greater than half of the children in need of care enrolled in a high quality program, there is opportunity to increase the number of high quality seats available for children likely in need of care because all parents work.
While Licensed Homes are the largest source of care available to families, the majority of high quality seats are offered in licensed centers compared to homes and ministries. In addition, there are more preschool children enrolled in high quality programs compared to infants and toddlers.
Data Source: Indiana Association for Child Care Resource and Referral. December, 2015
Data Source: Indiana Association for Child Care Resource and Referral. December, 2015

2016 Annual Report Indiana Early Learning Advisory Committee 15
Determine the readiness of children entering school in Indiana.5 YEAR GOAL
READY FOR SCHOOL
NEED
KINDERGARTEN READINESS
FOR SCHOOL
CHILDREN ENTERING
KINDERGARTEN
92%xxxiii
CHILDREN RETAINED IN
KINDERGARTEN
5%xxxiv
COST OF KINDERGARTEN
RETENTION
$22 million
CHILDREN READY FOR
KINDERGARTEN
?
High-Quality
AffordabilityAcce
ssibi
lity
We define kindergarten readiness as: In Indiana we work together so that every child can develop to his or her fullest potential - socially, emotionally, physically, cognitively and academically. Through growth in all of these domains, the child will become a healthy, capable, competent and powerful learner.
Nationally, slightly less than half of low-income children are ready for school at kindergarten. Even among non low-income families, 25 percent of children are often not ready for school.xxxvi Children from low-income families often start kindergarten 12 to 14 months (or one-year) behind their peers in pre-reading and language skills. xxxvii
In Indiana, we are currently unable to determine the readiness of children entering kindergarten. Indiana does not have a uniform kindergarten readiness assessment tool that is used statewide. ELAC’s Evaluation of Child Outcomes workgroup completed a survey to identify the current Kindergarten Readiness Assessment (KRA) practices of Indiana school corporations through an online survey administered to school districts. Of the 139 public school corporations who responded, 74% reported some form of KRA in place. The majority of KRAs used were locally-developed, so there is not one consistent tool used statewide to gather data.
In Indiana, we know that the rate of children being retained in kindergarten has increased as well as the cost of kindergarten retention. In taking a closer look at who is being retained, a significant portion of the students were low-income, boys and children of color.
2011-12 2012-13 2013-14 2014-15
Children Enrolled in Kindergarten 78,161 80,610 80,603 78,856
% of Children Enrolled in Kindergarten 89% 91% 91% 92%
Children Retained in Kindergarten 2,419 2,902 3,750 3,921
% of Children Retained in Kindergarten 3% 4% 5% 5%
INDIANA KINDERGARTEN ENROLLMENT AND RETENTION
xxxv
Increasing access to high quality early childhood education, particularly for at-risk families, can help children begin kindergarten ready for school and stay on track with their peers as demonstrated in the evaluation results of the first year of the Early Education Matching Grant pre-k pilot program summarized below.
Data Source: Indiana Department of Education.

2016 Annual Report Indiana Early Learning Advisory Committee 16
PRE-K PILOT PROGRAM’S IMPACT ON KINDERGARTEN READINESS
READY FOR SCHOOL
High-Quality
AffordabilityAcce
ssibi
lity
BACKGROUNDThe Early Education Matching Grant (EEMG) program, enacted in 2013 state legislation, represents Indiana’s first broad scale pilot in high quality pre-K education. Thirty programs in 15 counties, totaling approximately 50 classrooms, participated in the pilot during the 2014-2015 school year. These classrooms were housed in licensed centers, registered ministries, Head Starts and public school programs; were a mix of full- and half-day, Levels 3 and 4 on the Paths to Quality rating system; and, served rural and urban communities. The EEMG classrooms served approximately 484 four-year old children coming from home environments at or below 100% of the poverty level. Indiana University completed an evaluation of the first year. These evaluation results focus on pre-post measures of participants, as funds were not appropriated for control group comparisons. The full EEMG Year 1 evaluation report can be found at www.elacindiana.org/resources.
SUMMARY OF PROGRAM RESULTS
• The EEMG Year 1 evaluation demonstrated that high quality preschool experiences resulted in significant gains and overcoming gaps in delays for the majority of the children involved.
• Children in EEMG programs showed significant gains in all areas of development including receptive language and vocabulary development, concept learning (i.e., letter and number identification), and social competence as well as a decrease in anxiety.
• The number of children identified as delayed at the start of the program year was significantly reduced by the end of the program year.
80
70
60
50
40
30
20
10
0 PRE POST
AVERAGE LEARNING GAINS IN MONTH
• Children in EEMG programs made accelerated gains in school readiness skills and in all domains as measured by the ISTAR-KR, as seen below. Children made approximately 13 months of gains in English Language Arts and Math after only 8 months of participating in EEMG programming.
• Both families and teachers reported a significant increase in family engagement over the length of the EEMG program.
• The Classroom Assessment Scoring System (CLASS) was used to study the quality of interactions in the EEMG classrooms. Three domains are studied through CLASS: emotional support, classroom organization, and instructional support. EEMG program classrooms demonstrated similar scores to national and state data in the domains of emotional support and classroom organization. The domain of instructional support had a larger difference between EEMG program classrooms and national / state data.
AVG Age
Bracken
PPVT
Children made 13 months of gains after only 8 months in pre-k.
MO
NTHS
Data Source: Indiana University, 2015

2016 Annual Report Indiana Early Learning Advisory Committee 17
READY FOR SCHOOL
High-Quality
AffordabilityAcce
ssibi
lity
IMPLICATIONSHigh Quality Preschool Positively Impacts Children and Families
Research shows children are at-risk for developmental delays and later academic challenges when they live in home environments where annual income is at 100% or less of the poverty level.xxxviii The EEMG Year 1 evaluation demonstrated that high quality preschool experiences resulted in significant gains and overcoming gaps in delays for the majority of the children involved. Growth was demonstrated in all areas (i.e., receptive language, vocabulary development, concept development, social competence, school readiness skills) and the number of children identified as delayed at the start of the program year was significantly reduced by the end of the program year. The data suggest that the majority of the children who participated in EEMG will be better equipped to succeed in school. Additional studies have shown that investing in a high-quality pre-K experience can save future expenditures by reducing the number of children retained in Kindergarten and/or who need special education services, hence, reducing the associated costs with retention and remediation. xxxix
Families who are living in poverty have a lower level of engagement in their children’s education.xl The EEMG Year 1 evaluation, however, demonstrated that the high quality preschool environment provided more opportunities for families to engage. The teachers and families both noted increases in engagement as well as improved opportunities. When a family is more involved in their child’s education, a child is more successful and achieves greater gains in readiness outcomes.
Indiana Must Invest in Infrastructure to Continue and Expand Positive Outcomes.
Certain elements are critical to driving the positive outcomes of these results. The quality of the EEMG Level 3 and 4 Paths to Quality programs was adequate to deliver improved child and family outcomes. These positive outcomes can be further expanded through selective investments in areas identified in the research. For example, program observations suggest that classroom curriculum and instructional support could be further improved. With proper best-practice technical assistance and training, improvements in classroom curriculum and instructional support have an excellent chance to further drive positive outcomes for children and families.xli This could take the form of access to proven high-quality professional development and resources for continued growth in teacher skills and professional practices. The degreed professional teachers in these programs are the front line of results. By offering high quality opportunities for teachers to grow their own skills, we will undoubtedly see consequent gains in child and family outcomes.
70
60
50
40
30
20
10
0 PRE POST
ISTAR-KR CHILD OUTCOMES
AVG Age
English Language Arts
Mathematics
Social
MO
NTHS
Data Source: Indiana University, 2015

2016 Annual Report Indiana Early Learning Advisory Committee 18
RECOMMENDATIONS
High-Quality
AffordabilityAcce
ssibi
lity
The state has made considerable progress in ensuring that young children have access to a high quality, affordable early childhood experience. In order for Indiana to continue to enhance accessibility, affordability, and quality for Indiana’s children, critical early childhood local and statewide infrastructure needs to be in place:
1) A better understanding of the state’s current baseline and future needs; 2) More rigorous definitions of the desired outcomes; and 3) Enhanced coordination of efforts: cross-functional cooperation among the organizations that serve and report, as well as efficient and effective public/private funding streams.
Towards that end, ELAC offers the following recommendations:
Better Understanding of the State’s Current Baseline and Future Needs
1. We recommend relevant state agencies identify, collect and release when available (according to all state and federal laws) essential data elements to answer important early learning research questions. This may include information such as: the reporting of preschool capacity, enrollment and funding sources; the reporting of Indiana Head Start programs’ child outcome data; and the reporting of the preschool teacher and child care workforce.
More Rigorous Definitions of the Desired Outcomes
2. We recommend IDOE and FSSA designate a liaison to work with ELAC to align and integrate their programs and standards with the ELAC-approved definition for kindergarten readiness.
3. We recommend that IDOE and FSSA designate a liaison to work with ELAC to align and integrate their programs and standards with the ELAC-approved definition for family engagement.
4. We recommend that FSSA and Indiana State Department of Health (ISDH) designate a liaison to work with ELAC to align and integrate their programs and standards with the ELAC-approved definition for child health.
5. With these approved definitions of desired outcomes, we recommend that the identified agencies work to widely disseminate, share and promote these definitions and supporting tools and resources to the public and key stakeholders via their website and other communication tools.
Enhanced Coordination of Efforts
6. We recommend that IDOE and FSSA provide early learning data that will link to the Indiana Network of Knowledge’s statewide longitudinal data system of pre-k to career data.
7. We recommend that FSSA, ISDH and the Department of Child Services (DCS) coordinate the enrollment of families and their young children in evidence-based home visiting programs and high quality early childhood education programs.

2016 Annual Report Indiana Early Learning Advisory Committee 19
ENDNOTES
High-Quality
AffordabilityAcce
ssibi
lity
i 2009 - 2013 American Community Survey 5 - Year Estimates, Table B17024ii National Center for Children in Poverty, “State Profiles: Demographics of Young, Low-Income Children and Poor Children.” National Center for Children in Poverty, 2013, www.nccp.org.iii Population Reference Bureau, analysis of data from the U.S. Census Bureau, 2008 - 2014 American Community Survey, www.datacenter.kidscount.org.iv 2009 - 2013 American Community Survey 5 - Year Estimates, Table B17024v Matthews, TJ, M.S., et. al. (2015). Infant Mortality Statistics from the 2013 Period Linked Birth/Infant Death Data Set. Division of Vital Statistics, CDC. National Vital Statistics Report 64 (9). Retrieved from http://kff.org/other/state-indicator/infant-death-rate/.vi The Annie E. Casey Foundation, KIDS COUNT Data Center. (2012). Children under age 6 who received a developmental screening. Retrieved from www.datacenter.kidscount.org.vii Indiana Department of Education, 2014 – 2015 school yearviii Indiana Department of Education, 2013-2014 ISTEP English/Language Arts results for 3rd grade students.ix Indiana Department of Education, 2014 – 2015 school yearx U.S. Census Bureau, 2013 American Community Surveyxi Ibid.xii Population Reference Bureau, analysis of data from the U.S. Census Bureau, 2008 - 2014 American Community Survey. xiii Indiana Association for Child Care Resource and Referral, December 2015.xiv Ibid.xv Indiana Family and Social Services Office of Early Childhood and Out of School Learning, December 2014.xvi Indiana Family and Social Services Office of Early Childhood and Out of School Learning, December 2015.xvii Indiana Workforce Development, Research & Analysis. 2014 Occupational Employment Statistics: Employment and Wage Report; Indiana Association for the Education of Young Children (2014) Indiana Child Care Workforce Study.xviii Indiana Association for Child Care Resource and Referral, December 2015.xix Ibid.xx Indiana Association for Child Care Resource and Referral, December 2015; 2014 HHS Poverty Guidelines retrieved from https://aspe.hhs.gov/2014-poverty-guidelines#guidelines.xxi Indiana Family and Social Services Office of Early Childhood and Out of School Learning, December 2015.xxii Indiana Association for Child Care Resource and Referral, December 2014; Population Reference Bureau, analysis of data from the U.S. Census Bureau, 2005 through 2014 American Community Survey.xxiii Child Care Aware of America’s January 2015 survey of Child Care Resource and Referral State Networks. U.S. Department of Labor, Bureau of Labor Statistics, Consumer Expenditure Survey 2013-14. Retrieved from http://usa.childcareaware.org/wp-content/uploads/2015/12/Parents-and-the-High-Cost-of-Child-Care-2015-FINAL.pdf.xxiv Child Care Aware of America’s January 2015 survey of Child Care Resource and Referral State Networks. College Board Trends in College Pricing: 2013. Retrieved from http://usa.childcareaware.org/wp-content/uploads/2015/12/Parents-and-the-High-Cost-of-Child-Care-2015-FINAL.pdf.xxv Indiana Association for Child Care Resource and Referral, December 2014.xxvi Glynn, Farrell, and Wu, “The Importance of Preschool and Child Care for Working Mothers,” Center for American Progress. May 7, 2013. Retrieved from https://cdn.americanprogress.org/wp-content/uploads/2013/05/ChildCareBrief-copy.pdf.xxvii Yoshikawa, H., Weiland, C., Brooks-Gunn, J., Burchinal, M., Espinosa, L., Gormley, W., Ludwig, J.O., Magnuson, K.A., Phillips, D.A., & Zaslow, M.J. (2013). “Investing in Our Future: The Evidence Base on Preschool Education.” New York: Foundation for Child Development and Ann Arbor, MI: Society for Research in Child Development. Retrieved from http://fcd-us.org/resources/evidence-base-preschool
xxviii Barnett, W. S. (2008). “Preschool education and its lasting effects: Research and policy implications.” Boulder and Tempe: Education and the Public Interest Center & Education Policy Research Unit. Retrieved from http://epicpolicy.org/publication/preschooleducation. Tempe: Education and the Public Interest Center & Education Policy Research Unit. Available at: http://nieer.org/resources/research/PreschoolLastingEffects.pdf. xxix Indiana Association for Child Care Resource and Referral, December 2015.xxx Ibid.xxxi Indiana Association for Child Care Resource and Referral, December 2015; Population Reference Bureau, analysis of data from the U.S. Census Bureau, 2008 - 2014 American Community Survey, www.datacenter.kidscount.org.xxxii Indiana Association for Child Care Resource and Referral, December 2015.xxxiii Indiana Department of Education, 2014 – 2015 school year.xxxiv Ibid.xxxv Ibidxxxvi Isaacs, Julia. (2012), “Starting School at a Disadvantage: The School Readiness of Poor Children.” Brookings Institution, Retrieved from www.brookings.edu/~/media/research/files/papers/2012/3/19%20school%20disadvantage%20isaacs/0319schooldisadvantageisaacs.pdf.xxxvii A Quiet Crisis: The Urgent Need to Build Early Childhood Systems and Quality Programs for Children Birth to Age Five, Policy Statement, (2009). Council of Chief State School Officers. Retrieved from http://www.ccsso.org/Documents/2009/PolicyStatementAQuietCrisis2009.pdf.xxxviii Komro, K. A., Flay, B. R., & Biglan, A. (2011). Creating nurturing environments: A science-based framework for promoting child health and development within high-poverty neighborhoods. Clinical Child & Family Psychology Review, 14(2), 111-134. Aikens, N. L., & Barbarin, O. (2008). Socioeconomic differences in reading trajectories: The contribution of family, neighborhood, and school contexts. Journal of Educational Psychology, 100, 235–251.xxxix Bagnato, S. J., Suen, H. K., Brickley, D., Smith-Jones, J., & Dettore, E. (2002). Child developmental impact of Pittsburgh’s Early Childhood Initiative (ECI) in high-risk communities: first-phase authentic evaluation research. Early Childhood Research Quarterly, 17(4), 559.xl Komro, K. A., Flay, B. R., & Biglan, A. (2011). Creating nurturing environments: A science-based framework for promoting child health and development within high-poverty neighborhoods. Clinical Child & Family Psychology Review, 14(2), 111-134.Aikens, N. L., & Barbarin, O. (2008). Socioeconomic differences in reading trajectories: The contribution of family, neighborhood, and school contexts. Journal of Educational Psychology, 100, 235–251.xli Pianta, R. C., Mashburn, A. J., Downer, J. T., Hamre, B. K., & Justice, L. (2008). Effects of web-mediated professional development resources on teacher–child interactions in pre-kindergarten classrooms. Early Childhood Research Quarterly, 23(4), 431-451. Powell, D. R., & Diamond, K. E. (2013). Implementation fidelity of a coaching-based professional development program for improving Head Start teachers’ literacy and language instruction. Journal Of Early Intervention, 35(2), 102-128.

2016 Annual Report Indiana Early Learning Advisory Committee 20
ENDNOTES
High-Quality
AffordabilityAcce
ssibi
lity
SOURCES FOR ELAC DASHBOARD
Hoosier Children and FamiliesYoung Children Ages 0-5: 2009 - 2013 American Community Survey 5 - Year Estimates, Table B17024.
Children Living in Families in Poverty: Population Reference Bureau, analysis of data from the U.S. Census Bureau, Census 2000 Supplementary Survey, 2001 Supplementary Survey, 2002 through 2014 American Community Survey. Located at http://datacenter.kidscount.org/data/tables/5650-children-in-poverty-by-age-group
Affordability of Care: 2009 - 2013 American Community Survey 5 - Year Estimates, Table B17024; Indiana Association of Child Care Resource and Referral (IACCRR), 2015. Calculated as the mean cost of high quality care for children ages 0-5, divided by the median salary of a family in poverty (100% FPL) family of 3.
Children Likely in Need of Care: Children “likely in need of care” are considered to be those who live in households where all parents are in the workforce. Population Reference Bureau, analysis of data from the U.S. Census Bureau, 2008 - 2014 American Community Survey.
High Quality Early Childhood Education Children Enrolled in Known Programs: Indiana Association of Child Care Resource and Referral (IACCRR), 2015. Indiana Department of Education data for Title 1 and Special Education preschool funded children.
Children Enrolled in High Quality Programs: Indiana Association of Child Care Resource and Referral (IACCRR), 2015. Indiana Department of Education data for Title 1 and Special Education preschool funded children.
Availability of High Quality Seats: Indiana Association of Child Care Resource and Referral (IACCRR), 2015. Indiana Department of Education data for Title 1 and Special Education preschool funded children. Calculated as the number of children enrolled in high quality programs divided by number of children enrolled in known programs.
High Quality Seats for All Children Likely in Need of Care: Population Reference Bureau, analysis of data from the U.S. Census Bureau, 2008 - 2014 American Community Survey, www.datacenter.kidscount.org. Indiana Association of Child Care Resource and Referral (IACCRR), 2015. Calculated as the number of children enrolled in high quality programs divided by the number of children who live in households where all parents are in the workforce.
Early Childhood WorkforceEarly Childhood Education Workforce: Effective July 1, 2014, Indiana State law required all child care applicants, workers and volunteers, as well as household members over the age of 18 residing within child care homes, to receive a comprehensive background check that includes a national fingerprint based check of the FBI database, a check of the Child Protection Index and a check of the Sex Offender Registry. At this time, Indiana’s child care data system, CCIS, was modified to collect information on these comprehensive checks for applicants, staff, volunteers and household members for all regulated provider types including licensed centers, licensed child care homes, registered ministries and CCDF certified licensed exempt providers. The data reflects the number of staff (not volunteers or household members) at known program who submitted background checks for 2015.
Early Childhood Education Teachers with Any BA Degree: “Working in Child Care in Indiana.” 2014 Indiana Child Care Workforce Study by the Indiana Association for the Education of Young Children. Retrieved from http://secure.iaeyc.org/wp-content/uploads/2013/03/2014-Indiana-Child-Care-Workforce-Study-FINAL.pdf.
Annual Wages for Preschool Teachers: Indiana Workforce Development, Research & Analysis. 2014 Occupational Employment Statistics: Employment and Wage Report.
Projected Early Childhood Education Teacher Shortage: Indiana Workforce Development, Research & Analysis. 2014 Occupational Employment Statistics: Employment and Wage Report; “Working in Child Care in Indiana.” 2014 Indiana Child Care Workforce Study by the Indiana Association for the Education of Young Children. Calculation: The state currently has 14,730 Preschool Teachers and Child Care Workers employed in the field. By 2022, Indiana is projected to need 22,773 Preschool Teachers and Child Care Workers. By 2022, with a 30% turnover rate (factoring in average annual openings, growth, and turnover), there will be a shortfall of 8,043 in the workforce.
Kindergarten ReadinessChildren Enrolled in Kindergarten Full-Time: Indiana Department of Education (IDOE), 2015. Note: This only includes students reported to IDOE and does not include community based preschools and private schools with kindergarten programs that do not report data to IDOE.
Children Retained in Kindergarten: Indiana Department of Education (IDOE), 2015. Note: This only includes students reported to IDOE and does not include community based preschools and private schools with kindergarten programs that do not report data to IDOE.
Cost of Retention: Indiana Department of Education (IDOE), 2015.
Calculation: Based on the kindergarten funding formula of half of the foundational grant per student ($3,320.50 in FY 2015), plus the full day kindergarten grant of $2,472 per student, the cost of retaining a student in kindergarten was approximately $5,792.50. Therefore, the approximate cost of a second year of kindergarten for those students (3,921) not ready to advance to first grade in 2015 was $22,712,393.
Children Ready for School: Indiana currently does not have a uniform, adopted kindergarten readiness assessment to determine the percent of children that are ready for school. Therefore, no data is currently available at the state level.

ACKNOWLEDGEMENTS
High-Quality
AffordabilityAcce
ssibi
lity
The Indiana Early Learning Advisory Committee (ELAC) would like to thank several organizations for their assistance in the development of this report, including the seven ELAC Workgroups, Indiana Association for Child Care Resource and Referral, Indiana Association for the Education of Young Children, Indiana Department of Education, Indiana Family and Social Services Administration Office of Early Childhood and Out of School Learning, and Indiana University’s Early Childhood Center.
The report was written by Amanda Lopez, President, Transform Consulting Group.
2016 Annual Report Indiana Early Learning Advisory Committee 21