election auditing: how much? - berkeleystark/seminars/msri08.pdf · make sure the election uses...
TRANSCRIPT

Election Auditing: How Much Is Enough?
MSRI
Berkeley, CA
7 March 2008
Philip B. Stark
Department of Statistics
University of California, Berkeley
statistics.berkeley.edu/∼stark
[Election Leak]
1
Abstract: The apparent margin in an election can be inflated by ma-
chine error, programming error, processing error, voter error or even
deliberate fraud. Did the apparent winner of an election really win?
Post-election audits hand tally ballots in a random sample of precincts.
18 states require or allow post election audits; NJ is the latest. Generally,
mandated audits do not answer the question, “could error plausibly ac-
count for the margin?” Confirming an election outcome can be couched
as a statistical hypothesis test. The null hypothesis is that the apparent
winner is not the winner a full recount would show. If, on the assumption
that anybody other than the apparent winner really won, there is only a
tiny chance that the observed miscount in the sampled precincts would be
as small is it was observed to be, we can conclude with high confidence
that a full manual recount would find the same winner. If not, we should
keep counting by hand until that chance is tiny or until all ballots have
been hand tallied. This approach has been tested on data from a U.S.
Senate race in MN in 2006 and “live” on a 2008 ballot measure in Marin
County, CA.
2

Outline
• Voting systems: punchcard, optically scanned, DRE (VVPAT)
• Sample of sorrows: NJ 2008, OH 2004, FL 2004, CA 2004
• Laws: California, New Jersey
• Mechanical random selection
• Hypothesis testing framework: the math
• The realities
• Examples: 2006 MN Senate race; 2008 Marin Measure A.
• Complications & potential improvements
• References
3

Voting Systems
Punchcard & lever systems. Discouraged by Help America
Vote Act of 2002. NY still uses—but not for much longer.
Optically scanned ballots: “bubble in” like a Scantron form.
Produces auditable paper trail. Voter intent vs. machine
scan.
Direct-recording Electronic (DRE): touchscreens, etc. VVPATs.
Felten group, TTBR. De-certified in CA, CO, OH.
4
New Jersey 2008
County finds vote errors: Discrepancies discovered in
5% of machines by Robert Stern
Five percent of the 600 electronic voting machines used
in Mercer County during the Feb. 5 presidential primary
recorded inaccurate voter turnout totals, county officials said
yesterday . . .
23 February 2008, New Jersey Times
5

Ohio 2004
Machine Error Gives Bush Thousands of Extra Ohio
Votes by John McCarthy
COLUMBUS, Ohio – An error with an electronic voting sys-
tem gave President Bush 3,893 extra votes in suburban Colum-
bus, elections officials said. Franklin County’s unofficial re-
sults had Bush receiving 4,258 votes to Democrat John Kerry’s
260 votes in a precinct in Gahanna. Records show only 638
voters cast ballots in that precinct. Bush’s total should have
been recorded as 365.
5 November 2004, Associated Press
6
Florida 2004
Broward Machines Count Backward by Eliot Kleinberg
. . . Early Thursday, as Broward County elections officials wrappedup after a long day of canvassing votes, something unusualcaught their eye. Tallies should go up as more votes arecounted. Thats simple math. But in some races, the num-bers had gone . . . down.
Officials found the software used in Broward can handle only32,000 votes per precinct. After that, the system startscounting backward.
. . . The problem cropped up in the 2002 election. . . . Browardelections officials said they had thought the problem wasfixed.
5 November 2004, The Palm Beach Post
7

California 2004
Lost E-Votes Could Flip Napa Race by Kim Zetter
Napa County in Northern California said on Friday that electronic votingmachines used in the March presidential primary failed to record voteson some of its paper ballots, which will force the county to re-scan over11,000 ballots and possibly change the outcome of some close local races.
. . . Napa Registrar of Voters John Tuteur said they discovered the problemon Thursday while conducting a manual recount of 1 percent of precincts,. . . they discovered that the machine wasn’t recording certain votes.
. . . the machine was calibrated to detect carbon-based ink, but not dye-based ink commonly used in gel pens, . . . a Sequoia technician ran testballots through the machine to calibrate its reading sensitivity, but failedto test for gel ink.
12 March 2004, Wired News
8

Machine (Voting System) Counting
• Want to count votes by machine: saves time and money
(or so we are told).
• Machine counts are subject to various kinds of error.
(So are hand counts, but they’re the gold standard. Progress
on accuracy, too.)
• Counting errors ⇒ risk that machines name the wrong
winner.
9

Statistical Audits
Can limit and quantify that risk.
Could guarantee that, if the election is certified,
either
machines named the right winner
or
a rare event (say, 1 in 100) happened
even if an evil adversary built the hardware and wrote the
software.
Essential that voters create an audit trail.
Essential to select precincts at random.10

California Elections Code §15360
. . . the official conducting the election shall conduct a public manual tallyof the ballots tabulated by those devices, including absent voters’ ballots,cast in 1 percent of the precincts chosen at random by the electionsofficial . . .
The elections official shall use either a random number generator or othermethod specified in regulations . . .
The official conducting the election shall include a report on the results
of the 1 percent manual tally in the certification of the official canvass
of the vote. This report shall identify any discrepancies between the
machine count and the manual tally and a description of how each of
these discrepancies was resolved . . .
11

NJ S507 [1R] (Gill)
. . . shall conduct random hand counts of the voter-verified paper recordsin at least two percent of the election districts where elections are heldfor federal or State office . . .
Any procedure designed, adopted, and implemented by the audit teamshall be implemented to ensure with at least 99% statistical power that foreach federal, gubernatorial or other Statewide election held in the State,a 100% manual recount of the voter-verifiable paper records would notalter the electoral outcome reported by the audit . . .
[procedures] shall be based upon scientifically reasonable assumptions
. . . including but not limited to: the possibility that within any election
district up to 20% of the total votes cast may have been counted for a
candidate or ballot position other than the one intended by the voters
. . .
Say what?
12

Selecting precincts at random
Software pseudo-random number generators:
not transparent, hackable.
One ticket per precinct:
hard to verify; hard to mix (Vietnam draft).
10-sided dice (Marin County) [Roll 1] [Roll 2]
Ping-pong balls (Alameda County) [Static] [Tumbling]
Alameda has 1204 precincts. Pick 1s digit, 10s, 100s.
If result is between 205 and 999, stop.
Else, remove 2–9 & pick 1000s digit.
Unintended consequences?
13

How to commit election fraud (if you must)
• make sure the election uses DREs w/o VVPATs; hack
the software.
• if the jurisdiction uses DREs w/ VVPATS, hack the soft-
ware and spoil the VVPATs with “household chemicals”
(TTBR report)
• if you know that the audit will be based on whether any
errors are found in a simple random sample, hide the fraud
in as few precincts as possible. (But in Alameda County,
avoid precincts 205–1000.)
• target a jurisdiction where audits are illegal
14

General principles
Margin small ⇒ less error required to produce it erro-
neously.
Sample small ⇒ can be likely that sample will find few
or no errors, even if machines named the wrong winner.
No look, no see: absence of evidence is not evidence of
absence.
Smaller margins ⇒ lower confidence.
Smaller samples ⇒ lower confidence.
Larger discrepancies in sample ⇒ lower confidence.
Sample big (compared with margin) ⇒ likely to see big dis-
crepancies in the sample if machines named wrong winner.
15
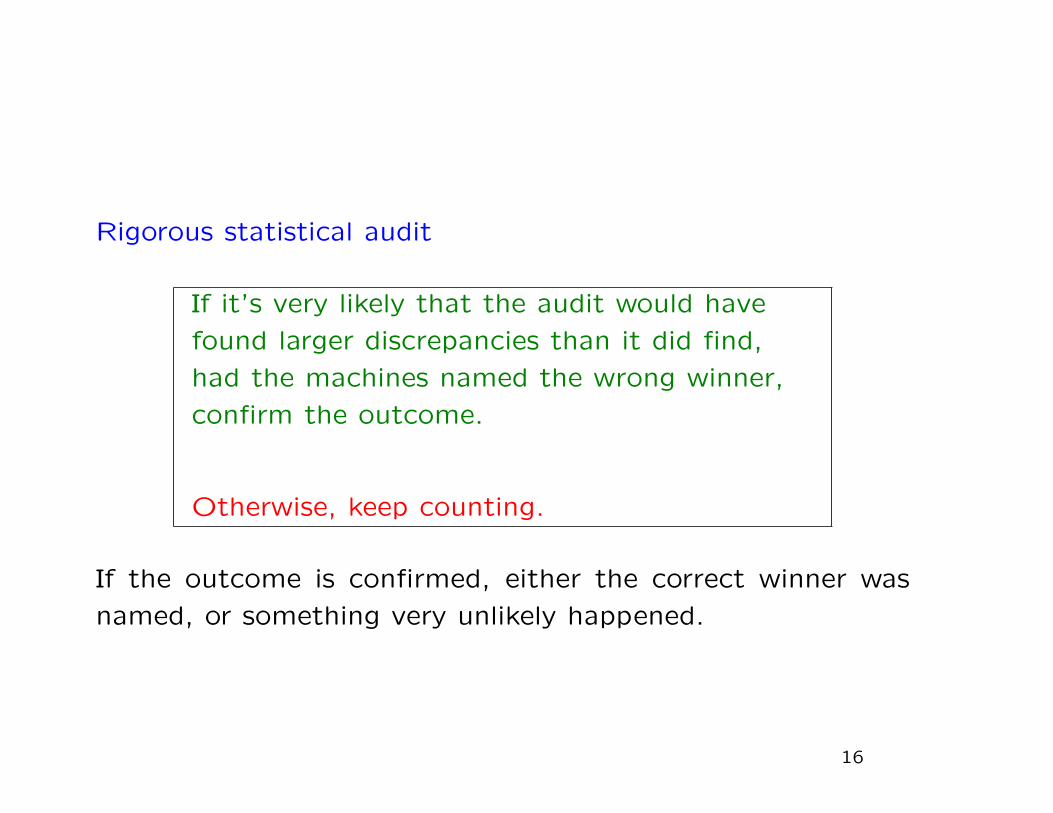
Rigorous statistical audit
If it’s very likely that the audit would have
found larger discrepancies than it did find,
had the machines named the wrong winner,
confirm the outcome.
Otherwise, keep counting.
If the outcome is confirmed, either the correct winner was
named, or something very unlikely happened.
16

Complete procedure says:
• how many precincts to audit initially
• given the discrepancies in the audit sample, whether to
confirm the outcome or expand the audit
• eventually declares “outcome confirmed” or “full recount.”
• limits chance of confirming outcome if a full recount
would show a different outcome to at most 1%, e.g.
Only one approach so far does that.
17

Notation
f # winners (vote for f)N # precincts in the contestN {1, . . . , N}bp f× # voters reported in precinct pK # candidates in contest, after “pooling”K {1, . . . ,K}Kw indices of the f apparent winnersK` indices of the K − f apparent losersakp actual vote for candidate k in precinct pAk ≡
∑p∈N akp actual total vote for candidate k
rp upper bound on∑k∈K akp
vkp reported vote for candidate k in precinct pVk ≡
∑p∈N vkp total vote reported for candidate k
M apparent margin: M = ∧k∈KwVk − ∨k∈K`Vk
18

Marginal notes
Potential margin overstatement in precinct p:
ep ≡∑k∈Kw
(vkp − akp)+ +∑k∈K`
(akp − vkp)+.
Total potential margin overstatement :
E ≡∑p∈N
ep.
19

Necessary condition for wrong outcome
Set of apparent winners agrees with full hand tally if
∧k∈KwAk − ∨k∈K`Ak > 0.
Apparent margin is
M = ∧k∈KwVk − ∨k∈K`Vk.
Easy to show
∧k∈KwAk − ∨k∈K`Ak ≥M − E.
(Bound max by sum & use triangle inequality).
So, apparent winners must be true winners if
E < M.
20
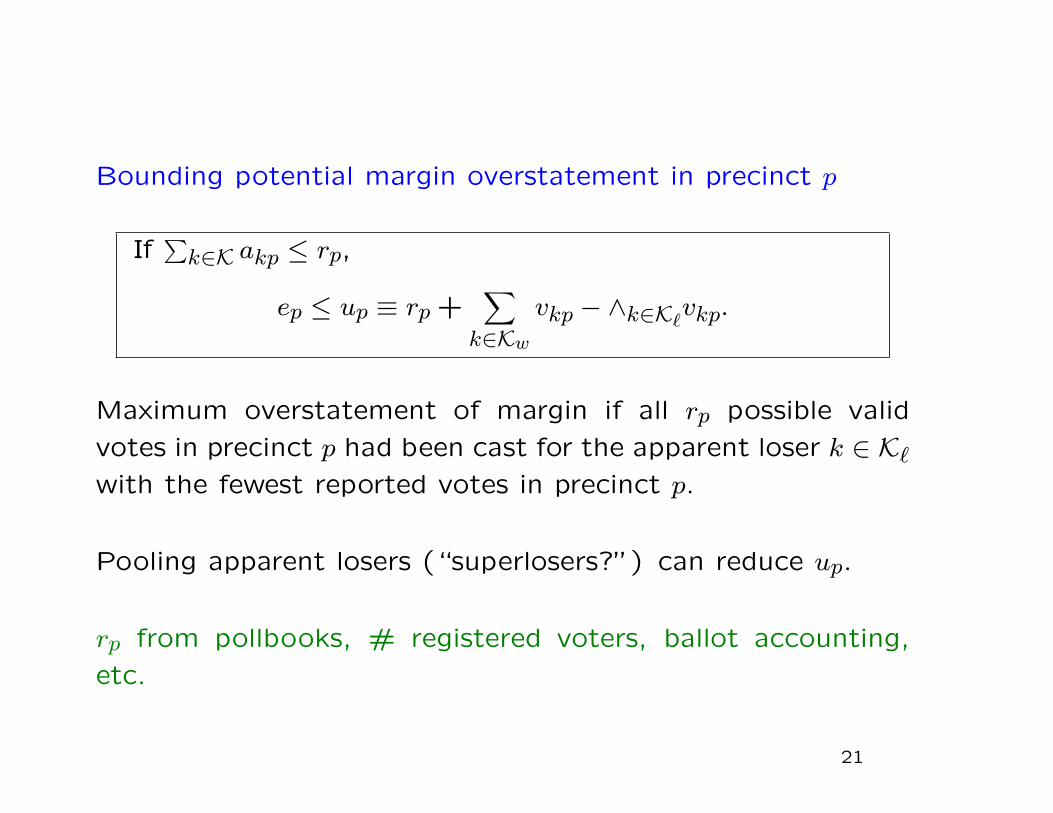
Bounding potential margin overstatement in precinct p
If∑k∈K akp ≤ rp,
ep ≤ up ≡ rp +∑k∈Kw
vkp − ∧k∈K`vkp.
Maximum overstatement of margin if all rp possible valid
votes in precinct p had been cast for the apparent loser k ∈ K`with the fewest reported votes in precinct p.
Pooling apparent losers (“superlosers?”) can reduce up.
rp from pollbooks, # registered voters, ballot accounting,
etc.
21

Test Statistic
Pick monotonically increasing functions w = (wp(·))Np=1.
These quantify relative tolerance for error in different precincts.
Reasonable choice: wp(z) = (z − 3)+/up.
J ?n is a simple random sample of size n from N .
Test statistic:
∨p∈J ?nwp(ep).
22

P -values for the hypothesis E ≥M
t ∈ IR; n < N fixed.
X = X (u,M) ≡ {x ∈ IRN : x ≤ u and∑Nx ≥M}.
π?(t) = π?(t;n, u,w,M) ≡ maxx∈X (u,M)
IPx{∨p∈J ?nwp(xp) ≤ t}.
Maximum chance the test statistic is no greater than t
if e ≤ u and E ≥M .
If observe ∨p∈J ?nwp(ep) = t and π?(t) is small, that’s evidence
that E < M .
π?(∨p∈J ?nwp(ep)) is the P -value.
23

The whole shebang
1. Select overall significance level α and a sequence (αs) so that sequen-tial tests at significance levels α1, α2, . . ., give an overall significancelevel no larger than α. E.g., αs ≡ α/2s, s = 1,2, . . ..
2. Pool apparent losing candidates into fewest groups s.t. none hasmore votes than the runner-up.
3. Set (wp). Compute u, M .
4. Select an initial sample size n1 ≥ 0 and a rule for selecting ns whenthe hypothesis E ≥M is not rejected at stage s− 1. Need ns > ns−1.
5. Set s = 1, n0 = 0 and J0 = ∅.
6. Draw a random sample J ?ns−ns−1
of size ns − ns−1 from N \ Js−1. SetJs = Js−1 ∪ J ?
ns−ns−1. Calculate ∨p∈Jswp(ep).
7. If π?(∨p∈Jswp(ep);ns, u, w,M) ≤ αs, confirm the outcome and stop.Otherwise, increment s.
8. If ns < N , return to step 6. Otherwise, audit any precincts not yetin the sample. Confirm the outcome if the outcome was correct.
24
Logistical issues: stratification, etc.
Samples for different counties drawn independently: strati-
fied.
VBM and absentee ballots not counted right away.
Makes sense to start with a uniform sampling rate, then es-
calate as necessary.
Can test separately in each stratum for proportional share of
M .
Reject overall hypothesis if all reject; conservative.
OR, P -value for proportional sample ≤ P -value for unstrati-
fied sample w/ replacement.25

November 2006 Minnesota U.S. Senate Race
MN requires:Counties with <50,000 registered voters audit ≥ 2 precincts;counties with 50,000–100,000 registered voters audit ≥ 3;counties with ≥100,000 registered voters audit ≥ 4.
≥ 1 precinct audited in each county must have ≥150 votes cast.
87 counties, 4,123 precincts, 202 audited.
Statewide margin 443,196 votes for 2,217,818 voters.
Voters Fitzgerald Kennedy Klobuchar Cavlan Powers Write-ins(Indep) (R) (D/Farm/ (Green) (Const)
Labor)2,217,818 71,194 835,653 1,278,849 10,714 5,408 901
Precincts audited had from 2 to 2,393 ballots cast. 25 potential over-statements. wp(z) = (z − 2)+/bp. Need 130 precincts tainted more thanmax observed to throw the election.
1.9% sample w/ replacement proportional sample sample w/o replacement8.2% 0.15% 0.13%
26

5 February 2008 Marin County Measure A
First election ever audited to attain target level of
confidence in the result.
Audited to attain 75% confidence that a full manual recount
would find the same outcome.
Required 2/3 majority to pass. Margin 298 votes.
Stratified random sample: 6 polling-place counts, 6 VBM
counts.
27

Marin Measure A data
precinct registered type ballots yes no bound audited
2001 1326IP 391 278 101 286 yes
VBM 657 438 193 456 no
2004 893IP 284 204 66 214 yes
VBM 389 257 116 268 yes2010 6 VBM 6 4 2 4 no
2012 740IP 218 167 43 173 yes
VBM 342 242 89 250 no
2014 983IP 299 214 75 221 no
VBM 420 306 95 319 yes
2015 905IP 217 167 44 171 yes
VBM 483 332 131 346 yes
2019 1048IP 295 215 70 222 yes
VBM 567 395 160 403 yes
2101 923IP 265 169 79 181 no
VBM 439 275 133 296 yes
2102 900IP 223 144 68 152 yes
VBM 410 233 142 257 yesAll 7724 PRO 252 176 54 191 no
28

Marin Measure A audit timeline
Milestone DateElection day 5 FebruaryPolling place results available 7 FebruaryRandom selection of polling place precincts 14 FebruaryVBM results available 20 FebruaryRandom selection of VBM precincts 20 FebruaryHand tally complete 20 FebruaryProvisional ballot results available 29 FebruaryComputations complete 3 March
Costs:
$1,501, including salaries and benefits for 4 people tallying
the count, a supervisor, support staff to print reports, resolve
discrepancies, transport ballots and locate and retrieve VBM
ballots from the batches in which they were counted.
$0.35 per ballot audited. 134 days.
29

Other stuff
Other sampling schemes: PPEB
Connection to financial auditing.
False Discovery Rate.
Small races? Lower confidence? Only audit random sample
of races?
Sharper treatment of stratification.
Sharper treatment of potential margin overstatement. Can-
cellation of errors?
30
Recap
• Vote counting is not perfect; errors can affect outcomes
• Auditing laws that address the problem fall short
• There’s a way to fix them using Statistics
• It seems practical/workable in examples
31
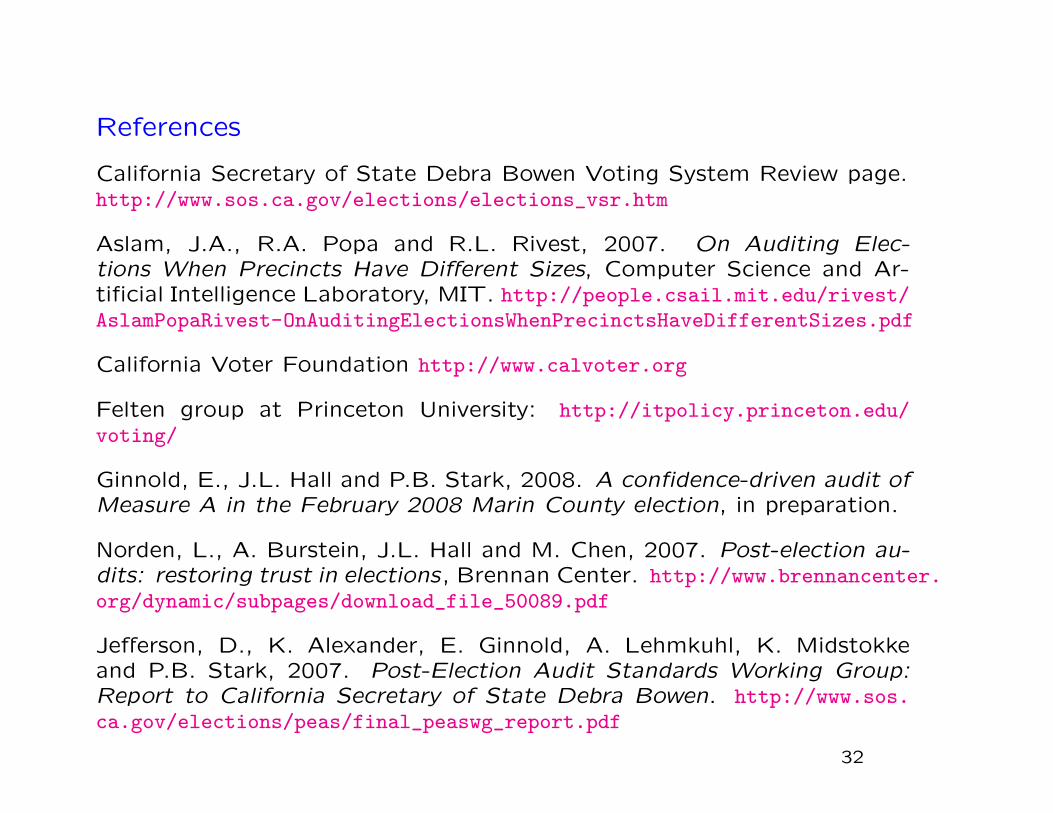
References
California Secretary of State Debra Bowen Voting System Review page.http://www.sos.ca.gov/elections/elections_vsr.htm
Aslam, J.A., R.A. Popa and R.L. Rivest, 2007. On Auditing Elec-tions When Precincts Have Different Sizes, Computer Science and Ar-tificial Intelligence Laboratory, MIT. http://people.csail.mit.edu/rivest/AslamPopaRivest-OnAuditingElectionsWhenPrecinctsHaveDifferentSizes.pdf
California Voter Foundation http://www.calvoter.org
Felten group at Princeton University: http://itpolicy.princeton.edu/voting/
Ginnold, E., J.L. Hall and P.B. Stark, 2008. A confidence-driven audit ofMeasure A in the February 2008 Marin County election, in preparation.
Norden, L., A. Burstein, J.L. Hall and M. Chen, 2007. Post-election au-dits: restoring trust in elections, Brennan Center. http://www.brennancenter.org/dynamic/subpages/download_file_50089.pdf
Jefferson, D., K. Alexander, E. Ginnold, A. Lehmkuhl, K. Midstokkeand P.B. Stark, 2007. Post-Election Audit Standards Working Group:Report to California Secretary of State Debra Bowen. http://www.sos.ca.gov/elections/peas/final_peaswg_report.pdf
32

McCarthy, J., H. Stanislevic, M. Lindeman, A. Ash, V. Addona andM. Batcher, 2007. Percentage based vs. SAFE vote tabulation au-diting: a graphic comparison. http://www.verifiedvotingfoundation.org/auditcomparison
Rivest, R.L., 2006. On Estimating the Size of a Statistical Audit, Com-
puter Science and Artificial Intelligence Laboratory, MIT. http://people.
csail.mit.edu/rivest/Rivest-OnEstimatingTheSizeOfAStatisticalAudit.pdf
Saltman, R.G., 1975. Effective use of computing technology
in vote-tallying, National Bureau of Standards report NBSIR
75-687, Washington, DC
Stark, P.B., 2008. Conservative Statistical Post-Election Au-
dits, Annals of Applied Statistics, in press. http://statistics.
berkeley.edu/~stark/Preprints/conservativeElectionAudits07.

Stark, P.B., 2008. Election audits by sampling with proba-
bility proportional to an error bound: dealing with discrepan-
cies, working paper. http://statistics.berkeley.edu/~stark/
Preprints/ppebwrwd08.pdf
More voting-related links: http://statistics.berkeley.edu/
~stark/Vote/index.htm