electoral democracy and human development gauri & khaleghian 2002; hallerod et al. 2013;...
TRANSCRIPT

1
Electoral Democracy and Human Development
John Gerring Boston University
Carl Henrik Knutsen
University of Oslo
Svend-Erik Skaaning Aarhus University [email protected]
Jan Teorell
Lund University
Matthew Maguire Boston University
Michael Coppedge
University of Notre Dame
Staffan Lindberg University of Gothenburg
Paper prepared for presentation at the ECPR joint sessions of workshops, Pisa, April 24-28, 2016.

2
ABSTRACT
This study reconciles competing positions in the debate over whether democracy improves human development. We argue that electoral competition incentivizes politicians to provide public goods and services, and these, in turn, save lives. Hence, the electoral aspect of democracy should have a substantial impact on human development while other aspects, e.g. related to citizen empowerment or civil liberties, should be less consequential. Extant measures of democracy do not allow for the disambiguation of various components of democracy, which may help to account for the mixed results reported by various studies (contrast Ross 2006 and Gerring et al. 2012). We draw on the new Varieties of Democracy dataset, which provides a highly differentiated set of democracy indicators, and a new collection of mortality data compiled by the Gapminder project. With these tools, we are able to conduct panel analyses that include most (semi-)sovereign countries from 1900 to the present – a much more extensive sample than has ever been mustered for this particular research question. We find that composite indices such as Polity have a tenuous relationship to human development, while indices focused on the electoral component of democracy yield a highly robust relationship.

3
Does democracy improve human wellbeing? Debate over this question generally focuses on the impact of regime-type on per capita gross domestic product (GDP) or on various economic policies that are thought to affect a country’s growth performance.1 Yet, GDP does not provide – and does not even purport to provide – a summary measure of human welfare, and is an especially poor guide to the welfare of less advantaged citizens (Costanza et al. 2009; Philipsen 2015).
To measure the welfare of the poor at national levels one must turn to a different sort of indicator, one focused on poverty (e.g., consumption-based income measures), life-enhancing policies (e.g., immunization and schooling), or more direct measures of wellbeing (e.g., health and educational attainment) (Dasgupta & Weale 1992; Morris 1979; ul Haq 1995). In contrast to GDP, these human development or quality-of-life indices reflect the status of those who are underprivileged. They are only minimally affected by the status of the middle and upper classes, who tend to enjoy salubrious lives wherever they happen to reside. Appropriately, human development indicators form the backbone of the Millennium Development Goals (Sachs & McArthur 2005).
A small but growing body of literature examines the role of political institutions in fostering human development. Many studies report a causal connection between democracy and improved quality of life (Altman & Castiglioni 2009; Besley & Kudamatsu 2006; Blaydes & Kayser 2011; Brown 1999; Brown & Hunter 1999, 2004; Deacon 2009; Eterovic & Sweet 2014; Gerring et al. 2012; Ghobarah, Huth & Russett 2004; Haggard & Kaufman 2008; Hanson 2015; Kaufman & Segura-Ubiergo 2001; Lake & Baum 2001; Lindert 2004: chs 15–17; McGuire 2013; Muntaner et al. 2011; Przeworski et al. 2000; Stasavage 2005; Zweifel & Navia 2003).2
This optimistic assessment has been strongly challenged in a series of recent studies (Doces 2008; Gauri & Khaleghian 2002; Hallerod et al. 2013; Jacobsen 2015; Houweling et al. 2005; Miller 2016; Nelson 2007; Ramos & Tournillon 2014; Ross 2006; Rothstein 2015; Shandra 2004). These scholars call attention to potential problems of causal identification arising from highly trended variables, sample bias, and non-robustness in the relationship of interest. In addition, they cast doubt on the mechanisms that might plausibly connect democracy to human development. First, voters may be focused on outcomes that are more salient such as employment, inflation, and economic growth, in preference to human development outcomes, some of which are difficult to dramatize and rarely covered by the news media (Harding & Stasavage 2014). If so, the mechanism of electoral accountability is called into question. Second, less economically advantaged citizens carry less weight in a polity, even a polity with full democratic rights (Przeworski 2010). Resources may therefore be captured by citizens who are in a better position to organize and to make demands on the state (Lipton 1977). Third, democratization is often accompanied by conflict and instability (Mansfield & Snyder 2005), which presumably impairs human development. Fourth, newly democratized polities are, almost by definition, poorly institutionalized and thus may be inclined to adopt clientelistic or populist policies rather than to undertake long-term investments in human capital (Kapstein & Converse 2008; Keefer 2006). Finally, and relatedly, even if a democratically elected government enacts legislation in favor of human development, low state capacity may undermine efficient implementation. Democratic development without state development may doom progressive goals (Rothstein 2011).3
1 Despite a fairly large body of work, researchers have not yet arrived at a consensus view on the question of whether democracy brings an economic dividend. For optimistic views see Acemoglu et al. (2014), Gerring et al. (2005), Knutsen (2015). For skeptical views see Barro (1996), Hausmann, Pritchett & Rodrik (2005), Przeworski et al. (2000). 2 While most studies regard countries as units of analysis a few studies focus on subnational units – e.g., in Brazil (Fujiwara 2015) and the United States (Miller 2008) – and one study combines individual- and country-level data, but with a relatively small crossnational sample (Kudamatsu 2012). 3 Writers discussed in this paragraph are not necessarily skeptical of a democracy-human development connection.

4
This study attempts to reconcile competing positions in this important debate by showing that some aspects of democracy – but not others – affect human development. Specifically, we argue that the electoral aspect of democracy improves human development, while what we term the citizen empowerment aspect does not (or scarcely so). We argue, second, that electoral democracy contains multiple institutional components that interact with one another in a complementary manner to foster human development. Properly measuring these interactions is critical to understanding the impact of democracy on human development. It follows that composite indices of democracy – which combine electoral, empowerment, and often additional elements of democracy – may bear only a weak relationship to human development, especially if they do not take the mutual dependence between electoral components into account in their aggregation procedures. We argue, finally, that public policies serve as a key causal mechanism in this relationship. Electoral competition incentivizes politicians to provide public goods and services, and these, in turn, save lives.
In addition to developing a theory to explain the connection between democracy and human development, this study also makes an empirical contribution to the literature. First, we enlist a new dataset compiled by the Gapminder project that measures mortality – infant mortality, child mortality, and life expectancy – for most sovereign countries from 1900 to the present. While extant studies generally focus on recent decades, we are able to interrogate change across a century, affording greater empirical leverage into a question that involves highly-trended left- and right-side variables.
Second, we draw on the new Varieties of Democracy (V-Dem) dataset, which provides highly differentiated measures of democracy, measured annually for most sovereign countries from 1900 to the present (Coppedge et al. 2015; see also Appendix B). Prior work has been limited by the blunt nature of extant indices, which lump a variety of features together into a single index. The dominance of these indices may also help to account for the mixed results found in previous studies.4 We begin, in Section I, by laying out our argument about the causal relationship between democracy and human development. In Section II we explore the matter empirically using a variety of input and output measures and a supplementary mediation analysis to analyze potential causal mechanisms.
I. Arguments
Two general theoretical frameworks may be discerned in the literature on democracy and human development. The first focuses on citizen empowerment and the second on elite-level contestation.
Following the participatory conception of democracy, democracy should affect human development through the empowerment of lay citizens and civic associations (Barber 1988; Benelo & Roussopoulos 1971; Christoforou 2010; Fung & Wright 2003; Kawachi 2001; Macpherson 1977; Mansbridge 1983; Pateman 1976, 2012; Putnam 1993). One avenue of empowerment is a free media. Granted freedom of the press, news outlets are likely to report on policy disasters such as widespread famine, enhancing their salience in the public mind and invigorating public dissent (Sen 1982). Likewise, by disseminating mundane information pertaining to public health (e.g., why it is important to utilize lavatories rather than open-field defecation), the quality of life may be improved
However, their work is relevant to the skeptics’ argument. 4 At issue is not simply the components themselves but also the way in which they might be combined into a single index. Aggregation matters, as numerous studies have shown (Goertz 2006; Munck 2009).

5
(Wigley & Unlu-Wigley 2011). Another avenue of empowerment centers on the character of civil society. Social connectedness (aka social capital) should have positive repercussions for public health, providing “people with a basis for cooperation that is mutually advantageous, a source of aid or assistance, a means of staying well informed about health issues, and a source of self-esteem” (Wigley & Unlu-Wigley 2011: 653). Popular participation in politics may also have direct effects on public health. Wigley & Unlu-Wigley (2011: 651) cite evidence from epidemiological studies showing that “the extent to which individuals perceive they have control over their lives plays a significant role in determining their health.” For all these reasons, one might expect a connection between citizen empowerment and human development.
Yet, there are also reasons to doubt the participatory/empowerment narrative. First, there are questions about whether empowerment stands prior to, or posterior to, human development (see Inglehart & Welzel 2005). A large body of work suggests that health boosts economic performance (Hamoudi & Sachs 1999); it is not far-fetched to imagine it might also affect social engagement and political participation, as some studies suggest (e.g., Mattila et al. 2013). If so, the relationship is circular. Second, some of the afore-mentioned channels do not operate independently of elite behavior. Specifically, insofar as a free press helps to avert policy disasters, it is through incentivizing politicians to take particular actions – a matter that lies at the heart of our alternative theory. Third, social capital is unlikely to bridge the enormous gulf separating rich and poor citizens. This is because social and civic engagement is fostered by strong ties, and strong ties are likely to be grounded in ascriptive and social class identities. Bonding often trumps bridging (Wright & Reeskens 2013). As a consequence, mechanisms of popular empowerment are unlikely to foster the kind of political and social ties that would greatly improve human development outcomes. Finally, and relatedly, improving nationwide conditions for human development requires vast resources. It is unclear how citizen empowerment could muster these resources or manage their distribution on a permanent basis, especially in a poor country with limited infrastructure. The state is the only actor with sufficient material and managerial capacity to make significant and sustained improvements in the quality of human life for the thousands or millions of citizens located across a national territory.
Accordingly, we contend that any relationship between democracy and human development involves masses and elites within a structure of electoral accountability such that the resources of the state can be mobilized for a common purpose. Two features of electoral democracy concern us: selecting leaders and providing these leaders with the right incentives.
Consider, first, the role of regimes in establishing mechanisms of leadership selection. It seems plausible that different sorts of people – with different ideologies and perspectives – might choose to enter politics, and might succeed in climbing the leadership ladder in relatively democratic and autocratic regimes (Besley 2005; Besley & Reynal-Querol 2011; Wintrobe 1998). Specifically, those who prize improvements in human development may be more likely to rise to the top of a democratic polity, while those who prize other goals, such as internal stability, are more likely to rise to the top of an autocratic polity.
Consider, second, the set of incentives facing such leaders once they gain office. As highlighted by numerous political-economy models, competitive elections establish a relationship of accountability between electors (principals) and leaders (agents) such that principals punish agents who do not perform as expected (Ferejohn 1986). It follows that when leaders compete for approval before the electorate in free elections, they will orient their policies to please their constituents. Insofar as electorates favor human development, democratic governments should seek to satisfy that desire.5
5 This is not to say that certain autocrats, under certain conditions, cannot be incentivized to pursue policies that improve certain human development outcomes. Recent studies point out that specific institutional features (e.g., Wright

6
Mechanisms
A key causal mechanism in this argument lies in public policies adopted by governments, especially those that may be classified as redistributive (focused on those falling below median income in a society) or public goods (benefitting a broad swath of the general public). A simple median-voter model suggests that competitive elections pressure politicians to institute redistributive policies in order to address social inequality (Boix 2003; Meltzer & Richards 1981). Further, a large theoretical literature suggests that voters reward incumbents at the polls for resisting predation and providing public goods (Bueno de Mesquita et al. 2003; Lake & Baum 2001; Saint-Paul & Verdier 1993).
The empirical literature has shown a strong correlation between democratic regimes and certain policies having a redistributive or public goods orientation. Such policies include education (Ansell 2010; Eterovic & Sweet 2014; Gallego 2010) – especially primary education (Brown 1999; Brown & Hunter 2004; Stasavage 2005) – and infrastructure, insofar as projects are focused on the needs of the masses (e.g., sanitation and clean water) rather than on privileged urban clienteles (e.g., hospitals) (Besley & Kudamatsu 2006). Some studies also find that democracy enhances aggregate levels of social spending and total public sector size (Boix 2001; Brown & Hunter 1999; Huber, Mustillo & Stephens 2008; Lee 2005; but, see Mulligan et al. 2003), which (with some reservations) can be anticipated to correlate with the overall level of redistribution or of public goods.
There is, therefore, ample reason to expect that democracy affects public policies, and the professed intent of those policies is quite clearly to improve human development. It is another matter to claim that these policies achieve their stated goal, given the oft-noted inefficiency with which policies are administered in the developing world. Classrooms may be filled while teachers are absent (Chaudhury et al. 2006). Health care expenditures may not reach rural areas where they are most needed (van de Walle 1994). McGuire (2010: 9) notes that “voters in rich and poor countries alike tend to demand curative services excessively and preventive services insufficiently, so politicians who seek their support may well promise and implement policies that are not optimal for mortality decline.” Many factors connive to inhibit the delivery of public services to the poor, attenuating the connection between social spending and human development (Filmer & Pritchett 1999; Ross 2006).
Despite inefficiencies, we expect that such policies still make a big difference in the lives of poor people throughout the world, and especially in the developing world, where their plight is especially grave. Conditional cash transfer programs, for example, have been found to increase enrollment rates, improve preventive health care, and raise household consumption (Rawlings & Rubio 2005). As a rule, and leaving aside “poverty trap” situations, we expect that the ease of improving someone’s condition is inversely proportional to the severity of their condition. The poor are, in this sense, easier to assist than the rich. So, even where service delivery is flawed we expect to find a relationship between policy effort, as measured by social expenditures, and human development outcomes.
Electoral Democracy
We turn now to the question of how to conceptualize and measure electoral democracy for the purpose of explaining human development. Electoral democracy is a highly diffuse concept that may include many potential ingredients and calls forth many potential aggregation techniques (Coppedge
2008), characteristics of the autocrat’s core supporters (e.g., Bueno de Mesquita et al. 2003), or objectives of the ruling elite (e.g., Fielding, Freytag & Münch 2014) may induce leaders to pursue good policies even without contested elections. Still, we maintain that in most relevant contexts, improvements in electoral democracy should, ceteris paribus, strengthen leaders’ incentives to improve nation-wide human development outcomes.

7
& Gerring et al. 2011). Issues of conceptualization and measurement are, however, inescapably theoretical; they do not flow ineluctably from a measurement model (Adcock & Collier 2001; Borsboom 2006; Munck 2009). And decisions about operationalization often have important consequences (Casper & Tufis 2003), a point that our analyses confirm.
Electoral contestation is sometimes viewed as a binary feature of polities – either present (in democracies) or absent (in autocracies) (Boix et al. 2013; Przeworski et al. 2000). For some outcomes, a single-threshold measure is appropriate. However, when considering human development outcomes we see no reason to suppose that the impact of contestation conforms to a threshold causal model. Nor do we see any strong theoretical rationale for supposing that elections might matter in the presence of minimum competition (i.e., in electoral authoritarian regimes) but not in the presence of free and fair competition. Our theoretical account suggests that a minimal amount of contestation is good for human development but that greater contestation is even better (cf. Miller 2016). The relationship between electoral contestation and human development should therefore be continuous and monotonic (though not necessarily linear).
Relatedly, we argue that features having an appreciable impact on electoral contestation should also enhance human development. This includes all the institutional aspects of what Dahl (1989) has termed polyarchy, i.e., whether (or to what extent) key policymaking bodies are elective; rights of free association and free expression; the extensiveness of suffrage; and the quality of the electoral process. To the extent that a polity approximates the polyarchy ideal, human development should be improved.6
We also argue that the elements of electoral contestation – clean elections, an (indirectly or directly) elected executive, free association, free expression, suffrage – have an interactive, complementary relationship with one another. While clean elections are perhaps the most crucial, each feature enhances the value of the others with respect to human development. Likewise, a single weak link may critically impair the attainment of electoral contestation. Most obviously, if there are no elections it matters little if the regime tolerates free association or free expression. Similarly, if participation in elections is restricted to a single party, it matters little if suffrage is universal. This follows from the idea that elites deploy a “menu of manipulation,” choosing different mechanisms to suppress competition, any one of which may be sufficient in securing incumbency (Schedler 2002). The ingredients of electoral contestation must be aggregated in a way that captures these complementarities, e.g., in a multiplicative fashion (following Inglehart & Welzel 2005; Munck 2009).
We argue, following Gerring et al. (2012), that democracy is likely to have both short- and long-term effects on human development. Insofar as democracy affects public policies (as argued below), we can differentiate policies with more or less immediate effects (e.g., vaccinating infants) and policies that involve investments to be realized in the future such as improvements in roads, the electrical grid, sanitation facilities and the education of nurses and doctors. In order to take account of proximal and distal effects when the variable of interest is sluggish (and hence inappropriate for a distributed lag model) it is essential to calculate a “stock” measure of democracy that takes account of a country’s regime history, going back as far as is feasible. While all depreciation rates are in some sense arbitrary, we believe that a modest ten percent annual depreciation rate is more plausible than the extremely slow one percent rate proposed by Gerring et al. (2012).
6 This closely follows Dahl’s seminal work on the components of polyarchy (see also Dahl 1971; 1998).

8
Hypotheses
The foregoing arguments culminate in a set of testable hypotheses, which we explore in the remainder of this study.
H1: Indices focused on non-electoral aspects of democracy such as citizen empowerment, as well as composite indices that embrace multiple dimensions of democracy, bear a weak relationship to human development.
H2: Indices focused on electoral democracy have a strong impact on human development.
H2b: Electoral democracy bears a continuous and monotonic relationship to human development.
H2c: Electoral democracy includes multiple elements which interact in a complementary fashion to foster human development.
H2d: Electoral democracy has both short- and long-term effects on human development, appropriately modeled in a “stock” fashion.
H3: A principal mechanism by which electoral democracy contributes to human development is through public policies, specifically social policies that target human development outcomes such as public health.
II. Tests
In this section, we endeavor to test the foregoing hypotheses in a systematic fashion. First, we discuss our approach to measuring human development. Second, we test the relationship between democracy – measured by composite and empowerment indices – and human development. Third, we introduce our proposed Multiplicative Electoral Democracy Index (“MEDI”). Fourth, we disaggregate MEDI into its component parts. Finally, we construct a mediation analysis focused on the role of public policies as causal mechanisms.
Measuring Human Development
Human development can be measured in a variety of ways (McGillivray 2005; McGuire 2010: 17-21). We choose to focus on mortality-based health outcomes – infant mortality, child mortality, and life expectancy – for three reasons. First, mortality measures a good of paramount importance to all people and upon which the enjoyment of all other goods depends. Life is primary. Second, mortality is relatively easy to measure since deaths are generally recorded, or at least remembered (and hence accurately registered in retrospective surveys). Likewise, mortality does not involve difficult debates over definition and operationalization, and does not take on different meanings in diverse contexts. A death is a death, regardless of when or where it occurs. Third, mortality-based indices offer strong coverage across countries and through time. The ability to project mortality rates backward in time – based on a variety of sources but most especially surveys and censuses – is a useful feature (Riley 2005).
By contrast, measures of human development based on education are difficult to interpret since education is a hard thing to evaluate and often hinges on context. Even the measurement of literacy, a seemingly straightforward topic, is subject to the incomparability of languages and literacy standards throughout the world. Measures of health that add other features to mortality – e.g., disability-adjusted life-years – are more difficult to measure and therefore provide restricted temporal coverage. Policy-based measures of health such as vaccination rates are also limited in

9
temporal coverage, and are not applied to highly developed countries, limiting spatial coverage. Composite measures such as the Human Development Index – combining health, education, and GDP – involve the foregoing problems as well as aggregation formulas that are hard to defend and to interpret (Acharya & Wall 1994; Kovacevic 2011; Raworth & Stewart 2003). In light of this, it is unsurprising that global studies of human development often focus on mortality-based indices (Sen 1998). Among these, we choose infant mortality as the focus of our benchmark analysis. Humans are most vulnerable in the first year of life, and this means that a society’s infant mortality rate (IMR), calculated as the number of babies who expire prior to their first birthday as a share of 1,000 live births, is likely to be sensitive to changes in public policy and to environmental disorders. Not surprisingly, it displays the highest variance among the three measures, both through time and across countries. While the child mortality rate (CMR; child deaths prior to age 5 as share of 1,000 live births) is sometimes preferred, the two indices are extremely highly correlated (Pearson’s r=0.99), and IMR offers a somewhat longer time-series for most countries. IMR is also highly correlated with life expectancy (LE) (Pearson’s r=0.89; 0.93 with our transformed LE index), since early loss of life has the greatest impact on a society’s aggregate life expectancy. Thus, we regard IMR as the primary outcome of interest, with CMR and LE as secondary outcomes.7 Data is drawn from Gapminder with supplemental data from the World Bank World Development Indicators, as explained in Table A1. To account for the bounded nature of IMR and CMR, which makes it more difficult to achieve improvements when a society has reached a lower level of mortality, both are transformed by the natural logarithm (following convention). LE is also bounded, but in a less obvious way. To account for this boundedness we recalculate the index by subtracting LE from the maximum value in our sample (85), and then taking the logarithm of that number. This also flips the scale so that, like IMR and CMR, a low number signals better performance.
Composite Indices and Empowerment Indices
We begin, in Table 1, by exploring several composite democracy indices that offer extensive coverage and fine-grained distinctions between levels of democracy.8 Polity2 (Marshall et al. 2014) uses a weighted additive aggregation procedure across five sub-components: competitiveness and openness of executive recruitment, competitiveness and regulation of political participation, and constraints on the chief executive. (The latter is accorded a particularly large weight, accounting for about 1/3 of the index’s range.) The Unified Democracy Scores (UDS), developed by Pemstein et al. (2010), employ a Bayesian latent variable model to combine a large set of commonly used measures of democracy into a single index. Finally, we include two summary indices – “Contestation” and “Inclusiveness” – developed by Miller (2015), following the conceptual model developed by Coppedge et al. (2008). While intended to capture the two classical polyarchy dimensions of Dahl (1971), the measures also draw on indicators that seem to tap into other aspects of democracy. For instance, the “Contestation” measure draws on the Executive Constraints indicator from Polity and a measure of Legislative Effectiveness from Banks.
7 Potential problems in the measurement of IMR – largely related to under-counting in poor countries – are discussed in Anthopolos & Becker (2009). While this problem is a concern, it may be regarded as orthogonal to the treatment of interest in this study – regime-type – and hence part of the error term. Insofar as per capita GDP (logged) explains under-reporting across the sample, as suggested by Anthopolos & Becker (2009), any remaining bias from measurement error is conditioned in our analyses. 8 Accordingly, we exclude indices with shorter time-series, e.g., those produced by Freedom House, World Governance Indicators, and Bertelsmann Transformation Index, because they are less appropriate for estimators privileging within-unit change over time, as discussed below.

10
A second set of indices, drawn from the V-Dem project, focus on various features of citizen empowerment, which provides the main alternative theoretical account for why democracy might enhance human development. This set of indices includes Participation, Deliberation, Egalitarian, Female Empowerment, Civil Society, and Equality before the Law and Individual Liberty (see Appendix A1). A final set of indices measure democracy in a binary fashion. The “BMR” index developed by Boix, Miller & Rosato (2013) resembles the wellknown Democracy-Dictatorship (“DD”) measure constructed by Przeworski and colleagues (Cheibub et al. 2010; Przeworski et al. 2000), which is based on the existence of multi-party elections. Unlike DD, BMR adds a participation criterion, checks for reports of electoral irregularities and does not rely solely on post-electoral alternation of governments when coding elections as free and fair, and extends back to the nineteenth century. A second binary measure, “BNR,” constructed by Bernhard, Nordstrom & Reenock (2001), covers 124 countries from 1913 to 2010. Following Dahl (1971), BNR define a country as democratic if there is a high level of contestation and at least 50% of the adult population is allowed to vote. Each of the foregoing indices is tested in several plausible specifications in order to gauge their relationship to human development, proxied by infant mortality. The benchmark model, shown in the first row of Table 1, regresses IMR (logged) against a democracy index, per capita GDP (logged) – to account for levels of economic development – and year and country fixed-effects. We regard unit fixed effects as an important element in light of the probability that mortality rates may be affected by static country characteristics (related, e.g., to culture, colonial experience or geography) that may otherwise serve as confounders. We regard year fixed effects as equally important elements of the model since mortality reduction may be fostered by global factors that affect all countries such as the diffusion of health-relevant information and technological developments. An ordinary least squares (OLS) estimator is employed, and standard errors are clustered by country in order to deal with panel correlated errors. All right-side variables are lagged one time-period (one year) behind the outcome.
The second set of tests, shown in the second row of Table 1, calculates each democracy index as a stock variable, extending back to 1900 with an annual depreciation rate of ten percent. This is intended to embrace both short- and long-term effects of democracy on human development by imposing a modest depreciation rate. The third set of tests, shown in the third row, again calculates each index as a stock variable, this time with a very slow annual depreciation rate of one percent (following Gerring et al. 2012). The final set of tests, shown in the fourth row, introduces a lagged dependent variable to the previous specification in order to correct for possible trend effects or potential unmeasured confounders.
Each column in Table 1 thus reports four regressions, with results inserted only for the key variable of interest. Naturally, the interpretation of the coefficients in each of these four models is somewhat different. At present, however, we focus only on statistical significance, taking the classic p-value thresholds (90%, 95%, and 99%) as markers of success. This is arbitrary, to be sure, but it has the virtue of imposing a uniform threshold and is therefore useful for comparing the performance of different measures of a similar underlying concept. Results posted in Table 1 suggest that these ten measures of democracy are not associated with lower infant mortality with a simple level measure (row 1) or when stock indices are calculated with a ten percent annual depreciation rate (row 2). A negative association with IMR is revealed (for most measures) when stock is depreciated at the very slow rate of one percent annually (row 3), corroborating Gerring et al. (2012). However, this result does not hold when a lagged dependent variable is added to the model (row 4). The importance of a lagged dependent variable in this model can hardly be over-stated, given the highly trended nature of both the right- and left-side variables of

11
interest. Without some way to effectively de-trend the data, spurious results are highly probable. (There are of course other approaches, as explored in the next section.)
We conclude, therefore, that composite democracy indices, along with indices focused on various elements of citizen empowerment, are not robustly associated with human development as proxied by IMR. So far, the relationship between democracy and IMR appears weak and fragile – contingent upon particular ways of measuring the independent variable and particular choices among covariates. This seems to corroborate previous studies that are skeptical of a connection between democracy and human development in general (e.g., Ross 2006).9
9 Additional tests (not shown) suggest that the stock (1%) measure of Polity2 is related to declining IMR in a lagged DV model only when (a) the sample is restricted to the contemporary period (1960-) and (b) standard errors are not clustered by country, as initially reported in Gerring (2012).

12
Table 1: Composite Indices and Empowerment Indices
Composite Indices Empowerment Indices Binary Indices
Polity2 UDS
Contes -tation
Inclusive -ness
Partici -pation
Deliber -ation
Egalit -arian
Female Power
Civil Society
Individual Liberty BMR BNR
(Marshall) (Pemstein) (Miller) (Miller) (V-Dem) (V-Dem) (V-Dem) (V-Dem) (V-Dem) (V-Dem) (Boix) (Bernhard)
1 2 3 4 5 6 7 8 9 10 11 12
1. Level -0.004 -0.041 -0.068 -0.069 0.239 0.034 0.148 -0.014 0.114 0.054 -0.046 -0.044 (0.003) (0.028) (0.052) (0.044) (0.147) (0.067) (0.142) (0.185) (0.083) (0.080) (0.036) (0.036) 2. Stock (10%) -0.001 -0.002 -0.012 0.010 0.026 0.002 -0.004 -0.010 0.008 -0.002 -0.016* -0.017** (0.001) (0.004) (0.011) (0.010) (0.022) (0.013) (0.022) (0.017) (0.013) (0.013) (0.009) (0.007) 3. Stock (1%) -0.000* -0.002* -0.008** 0.004 -0.004 -0.009** -0.029*** -0.019*** -0.008* -0.013*** -0.008*** -0.009*** (0.000) (0.001) (0.004) (0.005) (0.007) (0.004) (0.008) (0.007) (0.004) (0.004) (0.003) (0.003) 4. Stock (1%), Yt-1 0.000 0.000 0.000 0.001*** 0.000* 0.000** -0.000 0.000 0.000 0.000 0.000 0.000 (0.000) (0.000) (0.000) (0.000) (0.000) (0.000) (0.000) (0.000) (0.000) (0.000) (0.000) (0.000) GDPpc (ln) Year FE Country FE Countries 154 154 152 152 156 150 150 149 150 150 151 154 Years 111 63 105 105 111 111 111 111 111 111 107 60 Obs (approx.) 8505 7077 7568 7579 9333 9022 9022 7802 8987 9022 7982 6608
Outcome: Infant mortality rate (ln). For each index, we conduct four separate tests: (1) level, (2) stock (10% annual depreciation rate), (3) stock (1% annual depreciation rate), and (4) stock (1% annual depreciation rate) with a lagged dependent variable. Units of analysis: country-years. FE: fixed effects. All right-side variables measured at t-1. Estimator: ordinary least squares, standard errors clustered by country. *** p<01 **p<.05 *p<.10

13
A Multiplicative Electoral Democracy Index (MEDI)
In contrast to wide-ranging composite indices and more focused empowerment indices we hypothesize that indices focused on the electoral component of democracy will be robustly associated with improved human development. This disaggregated approach to measuring democracy is made possible by the Varieties of Democracy (V-Dem) project. Because the results of this study depend upon the validity of the underlying data, we include a general description of the data collection process in Appendix B.
Our chosen index draws on indicators that tap into the institutional procedures emphasized by Dahl (1989) in connection with the concept of polyarchy. Specifically, it is intended to measure the extent of responsiveness and accountability between leaders and citizens through the mechanism of competitive elections. This is presumed to be maximized when (a) elections are clean and not marred by fraud or systematic irregularities, (b) the chief executive of a country is selected (directly or indirectly) through elections, (c) suffrage is extensive, (d) political and civil society organizations operate freely, and (e) there is freedom of expression, including access to alternative information. A full description of each component can be found in Table A1.
Following our hypothesis of complementarity across factors, these elements are multiplied together to form a Multiplicative Electoral Democracy Index (MEDI). Note that because three of these components – (a), (b) and (c) – have a true zero, this method of aggregation applies a weakest-link interactive principle (to those components). A polity receives a zero score if any of these three sub-components is coded 0 and the impact of one component depends on the scores of other components.
In Table 2, we subject MEDI to a series of empirical tests that begin with formats explored in Table 1 and then expand to provide a fuller set of robustness tests. A key feature of this table is the incorporation of measurement error drawn from the V-Dem measurement model, where multiple raters are combined into a single point estimate along with a confidence interval for each country-year-indicator, as described briefly in Appendix B and more extensively in Pemstein et al. (2015). Note that measurement error associated with democracy and other macro-level indices, while often informally acknowledged, is rarely incorporated into empirical tests. We do so here by running the specified model on 900 draws of the posterior distribution estimated for MEDI, based on an aggregation of the posteriors for each component of the index (Pemstein et al. 2010).
Model 1 in Table 2 is regarded as the benchmark. Here, MEDI is measured as a stock variable with a ten percent annual depreciation rate. Recall that this represents a compromise between no stock (the untransformed, level variable) and a very weak depreciation rate of one percent annually that counts distant history nearly as heavily as the recent past. As it happens, MEDI predicts lower IMR regardless of which depreciation rate is employed, as shown in Models 1-3.

14
Table 2: MEDI and Mortality Outcome (Y) IMR IMR IMR IMR IMR IMR IMR IMR IMR IMR IMR(WDI) CMR LE
Estimator OLS OLS OLS OLS FD, RE OLS OLS OLS OLS Sys. GMM OLS OLS OLS
Sample Full Full Full Full Full Full Full Imputed Full 5-yr panel Full Full Full
1 2 3 4 5 6 7 8 9 10 11 12 13
MEDI -0.222*** (0.072) MEDI stock -0.017*** (1%) (0.004) MEDI stock -0.058*** -0.002** -0.023*** -0.079*** -0.038*** -0.164*** -0.009** -0.054*** -0.056*** -0.021*** (10%) (0.013) (0.001) (0.005) (0.013) (0.013) (0.013) (0.004) (0.014) (0.014) (0.006) MEDI stock -0.028* (10%), T-30 (0.015) GDPpc (ln) -0.389*** -0.380*** -0.419*** -0.002 -0.064*** -0.378*** -0.479*** -0.422*** -0.070*** -0.338*** -0.385*** -0.184*** (0.066) (0.066) (0.068) (0.004) (0.016) (0.053) (0.033) (0.080) (0.024) (0.058) (0.072) (0.036) Urbanization 0.328 (0.268) Fertility (ln) 0.422*** (0.085) Growth 0.002** 0.001 Internal Conflict 0.008 (0.027) External Conflict 0.005 (0.034) Corruption stock 0.057*** (10%) (0.016) Yt-1 0.978*** 0.914*** (0.004) (0.030) Year FE Country FE Time trend Countries 150 150 150 150 150 165 106 172 130 150 150 151 150 Years 111 111 111 111 111 112 110 114 81 22 51 81 111 Obs 8776 8776 8776 8693 8615 9965 6309 15246 7074 1684 6179 7176 10,029 R2 (within) (0.909) (0.910) (0.905) (0.996) 0.116 (0.887) (0.937) (0.852) (0.885) (0.849) (0.865) (0.895)
Outcomes (Y): IMR (infant mortality rate, logged), CMR (child mortality rate, logged), LE (life expectancy, reverse scale, logged). Units of analysis: country-years. Right-side variables measured at T-1 unless otherwise noted. Estimators: OLS (ordinary least squares), FD (first-difference), RE (random effects). All models incorporate measurement error for MEDI based on posteriors produced by the V-Dem measurement model. Robust standard errors clustered by country. *** p<01 **p<.05 *p<.10

15
In Model 4, we return to the benchmark depreciation rate of ten percent, this time including a lagged dependent variable on the right side. This model estimates how MEDI stock at t-1 affects changes in infant mortality from t-1 to t. While the coefficient of the lagged dependent variable is high (0.97), confirming the highly trended nature of IMR, higher MEDI stock is still associated with reductions in mortality, and the effect is significant at the 5% level.
In Model 5, we adopt a first-difference specification, with a random effects estimator, in which right- and left-side variables are measured as a change from t-1 to t. This approach to de-trending reveals a very similar result.
In Model 6, we remove per capita GDP from the model, leaving a bivariate regression in which IMR is regressed on MEDI (along with year and country fixed effects). The estimated impact of a change in MEDI stock is enhanced, relative to the benchmark model. If one is willing to believe that electoral democracy has a (positive) causal effect on GDP per capita growth (Acemoglu et al. 2014; Gerring et al. 2005; Knutsen 2015), this model may be regarded as providing an estimate of the total effect of MEDI on IMR. Because this is a contentious claim taking us well beyond the scope of the present study, and because income may simultaneously affect regime type, we revert to the standard interpretation in subsequent tests – i.e., that MEDI affects human development through channels other than economic development (holding per capita GDP constant).
In Model 7, we add several additional covariates to the benchmark model that might be expected to affect infant mortality and perhaps MEDI. These potential confounders include urbanization, fertility, GDP per capita growth, internal conflict, external conflict, and corruption – as described in Table A1. Although the sample is diminished, the coefficient estimate for the key variable of interest is comparable to the benchmark, suggesting that this result is not sensitive to alternate specifications. The inclusion of indices measuring conflict and corruption is noteworthy, as it suggests that MEDI is not serving as a proxy for state capacity. (The inclusion of other measures of state capacity, drawn from the V-Dem project, confirms this result, as none of these covariates mitigates the estimated effect of MEDI on IMR.) We disregard these covariates in other models because they depress the sample and, more importantly, because they risk introducing post-treatment bias.
Sample bias is a potential problem when units are not chosen randomly from a known universe, when that universe cannot be represented in its entirety, and when missing data is not missing at random, potentially affecting the results of a crossnational analysis of this nature (Ross 2006). In particular, we must be wary of the possibility that data for democracy and IMR might be missing for poorly performing countries, low-income countries, and for non-democracies (Halperin et al. 2005). To alleviate this concern, we impute missing data using the Amelia II software, which models the cross-section time-series structure of our data (Honaker et al. 2011). The resulting datasets include 203 countries observed across 114 years – or fewer, if the country was not independent during some portion of the 1900-2014 period – producing over 18,000 observations. Results of our benchmark model averaged across twenty imputed datasets are shown in Model 8. Reassuringly, the estimated coefficient for MEDI is virtually identical to the benchmark model (with no imputed data). Interestingly, the estimated coefficient for per capita GDP diminishes by half in the imputed sample, suggesting that sample bias may affect this relationship.
Another problem of causal identification concerns possible endogeneity between MEDI and IMR. One approach to this problem utilizes time to “exogenize” the regressor of interest. In our benchmark model, right-side variables are lagged one period behind the outcome. In Model 9, we take this approach to an extreme, lagging MEDI by three decades (t-30), which should offer more assurance against X/Y circularity and simultaneity (an unmeasured confounder that affects both X and Y). The estimated coefficient is diminished relative to the benchmark, but remains sizeable and (weakly) significant.

16
In Model 10, we enlist a more complex dynamic panel model known as system generalized method of moments (GMM), using a version developed explicitly for studying sluggish variables (Blundell & Bond 1998). Our chosen specification is run on 5-year panels, and includes a one-period lagged dependent variable as a regressor as well as a time trend (replacing the annual dummies). The 5-year panel is used to mitigate the too-many-instruments problem (Roodman 2009). In order to comply with the standard recommendation (fewer instruments than cross-section units) we also restrict the number of lags used for instrumentation to three (the third to fifth lag). The model treats both MEDI and GDP per capita as endogenous, and, in contrast with several alternative specifications (e.g., including a two-year lag on the dependent variable, modelling GDP as exogenous, or using 1-year panels) that we tried out, it performs well on all relevant specification tests.10 This suggests that Model 10 yields a consistent estimate of the causal effect of MEDI on IMR. The GMM model corroborates our main result, as MEDI is significant at 5%. Due to the presence of a lagged dependent variable, the long-term impact of MEDI on IMR – calculated as βMEDI/1-βlagged DV – is roughly -0.09, an estimate that is even larger than the benchmark model.
The final set of models in Table 2 focus on alternate mortality-based outcome measures, as discussed above. Model 11 employs a measure of IMR drawn from the World Development Indicators (WDI) (World Bank 2013), an alternate data source that is highly correlated with the Gapminder dataset but more limited in temporal coverage. Model 12 adopts the child mortality rate (“CMR”) as an outcome, transformed by the natural logarithm. Model 13 adopts Life expectancy (“LE”), a summary measure of mortality rates across the lifespan, with a transformed index (described above). These alternate outcomes corroborate the main result, despite the truncated samples for IMR (WDI) and CMR. MEDI is consistently associated with lower mortality.
Several additional robustness tests are contained in Appendix A. In Table A4, we conduct restricted-sample tests in order to gauge the sensitivity of our benchmark estimate to the exclusion of particular regions – Eastern Europe and the Post-Soviet region, Latin America, MENA, Africa, Western Europe and North America, Southeast Asia, South Asia, and the Caribbean. Results show that the relationship between MEDI and IMR is robust, though estimates vary as the sample changes, as one might expect.
In Table A5, we conduct tests of functional form. Recall that IMR is transformed by the natural logarithm, reflecting a theoretical expectation that mortality is more elastic at higher rates. In particular, we expect that improvements in mortality are easier to achieve when the mortality rate is high. This is in keeping with (a) the general downward trend in mortality throughout the modern world in the contemporary era, (b) the left-bounded nature of IMR, and (c) a well-established tradition by which right-skewed variables (and IMR in particular) are logged. However, other transformations are also possible. Models 1-2 in Table A5 adopt a square root transformation, which deals with the skewed distribution of IMR but is also difficult to interpret and to make sense of (from a theoretical perspective). Another approach to functional form retains the linear (raw) format of IMR while adopting an estimator designed to handle skewed distributions, the Tobit regression (Long & Freese 2014). Results, shown in Model 3 of Table A5, are robust. However, one must be somewhat skeptical of these results given that we have dispensed with country fixed-effects, thus introducing a whole new set of potential specification problems. Suffice to say, we find the traditional approach to functional form – the logarithmic transformation – superior on both econometric and theoretical grounds. In Model 4, we examine the independent variable of interest, the MEDI index (discounted at 10% annually). The multiplicative aggregation rule, when combined with components that recognize a zero score, truncates this index at zero, generating a right-skewed
10 The Hansen J-test p-value is .27, the Ar(2)- and AR(3)-test p-values are, respectively, .29 and .85. There are 148 instruments, less than the 150 cross-section units.

17
distribution. Conceivably, results shown for our benchmark model may reflect a binary distinction – between country-years coded 0 and country-years receiving a positive score. Accordingly, in Model 4, we exclude observations for which MEDI (10%) is equal to zero. Results of all of these tests of functional form corroborate our previously reported findings, as shown in Table A5.
In Table A6, we explore possible non-linearities in the relationship between MEDI and human development. To do so, we replicate tests shown in Table 2 with an additional quadratic term – MEDI stock (10%)2. Results are indeterminate. The squared term is often (though not always) statistically significant. However, the sign of the coefficient is sometimes positive and sometimes negative, suggesting that curvilinearities – if present – are inconsistent or highly contingent upon the choice of estimators and specifications. Since we have no strong theoretical rationale for any non-monotonic effect we discard this possibility for now, leaving the question open for future research.
In Table A7, we explore an instrumental-variable approach to estimation. Following recent work (Acemoglu et al. 2014; Knutsen 2011), we look to the process of diffusion as an instrument that may affect the assignment of the treatment (in this case, electoral democracy) but not the outcome (IMR) – except as mediated by the theoretical variable of interest (MEDI) – in order to satisfy the exclusion restriction. To do so, we employ the WAVE instrument of democracy from Knutsen (2011), as well as regional and global averages of MEDI, to tap exogenous variation in domestic MEDI stemming from international or regional trends. These are tested separately, and together, in Models 1-4, all of which focus on MEDI stock (10%). In Model 5, we apply the same technique – all instruments combined – with a focus on MEDI level. Initial tests with a two-stage least squares estimator followed the specification of our benchmark model, with country and year fixed effects and clustered standard errors. Although these tests yield highly significant, and substantively large, effects in line with our expectations, the Sargan-test p-values are often low, suggesting that the exclusion restriction might not hold. Thus, models shown in Table A7 add a lagged dependent variable to the benchmark model. In this specification we find that the instruments are strong, the Sargan p-values acceptable, and estimates for MEDI (both stock and level) are statistically significant and comparable in size to the lagged dependent variable model in Table 2 (Model 4).
In Table A8, we explore possible non-linearities in a key covariate, per capita GDP (logged). Model 1 reproduces the benchmark model as a baseline for comparison. Model 2 introduces a polynomial – GDPpc2 – intended to model a quadratic relationship. Model 3 introduces a second polynomial – GDPpc3 – intended to model a cubed relationship. The variable of theoretical interest, MEDI stock (10%), is robust, though somewhat attenuated in the latter specifications. Thus, whether or not GDP bears a curvilinear relationship to human development, this has little bearing on our main finding.
In Table A9, we conduct “horse-race” tests in which MEDI stock (with our preferred 10% annual depreciation rate) and various alternative indices of democracy (initially tested in Table 1) are regressed side-by-side in the benchmark model. We measure these alternative indices with a one percent annual depreciation rate. This is a strong test. Results shown in Table 1 suggest that, for most indices, this very slow depreciation rate has a stronger relationship to IMR than faster depreciation rates when tested without the inclusion of a lagged dependent variable. Yet, these tests demonstrate that the inclusion of alternate indices in the benchmark specification do not interfere with the relationship between MEDI stock and reduced IMR. In some instances the estimated coefficient is slightly stronger and in some instances slightly weaker, but in all instances it remains statistically significant (at 1%). By contrast, most of the alternate indices are no longer significant, and for those that retain significance the estimated coefficients are considerably attenuated relative to the tests shown in Table 1. This offers direct corroboration for our main hypothesis: MEDI has a stronger relationship to IMR than other democracy indices.

18
Having conducted a wide range of empirical tests intended to show that the relationship between MEDI and IMR is robust, we turn now to the question of substantive impact. To grasp the matter in a concrete setting, let us imagine a very poor country with a per capita GDP of $1,000 that has no regime history, or an extremely autocratic regime history (both of which render a score of 0 on the MEDI index; all other variables are set to their means). This approximates the condition of many African countries upon attaining independence in the 1950s and 1960s. Our benchmark model predicts that this country should experience an infant mortality rate of about 93 (per 1,000 live births). Now, let us suppose that this hypothetical country quickly transitions to high-quality democracy (as measured by MEDI) and maintains that level of democracy for a decade – without any increase in wealth. Our model predicts that the improvement in MEDI stock will result in a 50% drop in IMR – from 93 to 49 – during those ten years. Evidently, most countries’ histories are not so simple, or so dramatic. However, many poor countries have transitioned to multi-party democracy in a decisive fashion, and some of these transitions have occurred shortly after attaining independence. In any case, the purpose of this stylized example is to provide an illustration of what the coefficients entail for country performance. Democracy may have a dramatic effect on mortality rates, especially for countries at the low end of the democracy/development scales.
Disaggregating and Re-aggregating MEDI
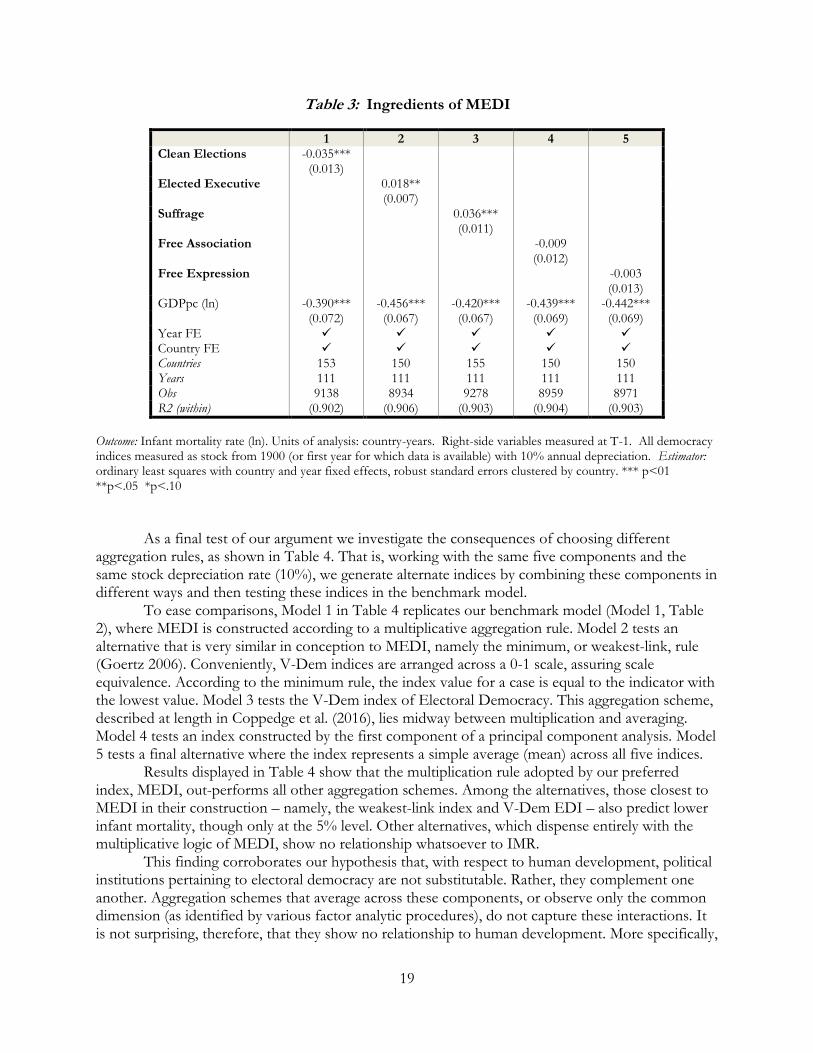
The strong effect of electoral democracy on human development is, according to our theoretical expectation, a product of five components – clean elections, elected executive, suffrage, free association, and free expression – working in combination. These indicators are correlated with each other, though not as highly one might expect. Pearson’s r correlations range from 0.39 to 0.93 (see Table A3). In a principal components factor analysis (not shown) the first component explains roughly 70% of the variance.
We argue that only in the presence of all features will incumbents be incentivized to expend efforts and resources on policies that improve human development for the poor. We do not expect that any of these components has a direct impact on human development in isolation from other components, with the possible exception of the core component of clean elections, which by itself could ensure meaningful contestation.
To test this hypothesis, we generate stock variables for each of the five components using a ten percent annual depreciation rate (replicating our benchmark measure of MEDI). We then regress IMR against each of the components in our benchmark model. As expected, only the core component, Clean Elections, predicts lowered infant mortality.11 Other components of MEDI predict higher IMR (Elected Executive and Suffrage) or seem to have no relationship to IMR (Free Association, Free Expression). This provides strong evidence for our contention that the ingredients of electoral democracy have important interactive effects. One cannot account for the relationship between electoral democracy and human development without an aggregation technique that acknowledges these interactive properties.
11 This effect is not especially strong, however, judging from additional robustness tests (not displayed here).
19
Table 3: Ingredients of MEDI
1 2 3 4 5 Clean Elections -0.035*** (0.013) Elected Executive 0.018** (0.007) Suffrage 0.036*** (0.011) Free Association -0.009 (0.012) Free Expression -0.003 (0.013) GDPpc (ln) -0.390*** -0.456*** -0.420*** -0.439*** -0.442*** (0.072) (0.067) (0.067) (0.069) (0.069) Year FE Country FE Countries 153 150 155 150 150 Years 111 111 111 111 111 Obs 9138 8934 9278 8959 8971 R2 (within) (0.902) (0.906) (0.903) (0.904) (0.903)
Outcome: Infant mortality rate (ln). Units of analysis: country-years. Right-side variables measured at T-1. All democracy indices measured as stock from 1900 (or first year for which data is available) with 10% annual depreciation. Estimator: ordinary least squares with country and year fixed effects, robust standard errors clustered by country. *** p<01 **p<.05 *p<.10
As a final test of our argument we investigate the consequences of choosing different aggregation rules, as shown in Table 4. That is, working with the same five components and the same stock depreciation rate (10%), we generate alternate indices by combining these components in different ways and then testing these indices in the benchmark model.
To ease comparisons, Model 1 in Table 4 replicates our benchmark model (Model 1, Table 2), where MEDI is constructed according to a multiplicative aggregation rule. Model 2 tests an alternative that is very similar in conception to MEDI, namely the minimum, or weakest-link, rule (Goertz 2006). Conveniently, V-Dem indices are arranged across a 0-1 scale, assuring scale equivalence. According to the minimum rule, the index value for a case is equal to the indicator with the lowest value. Model 3 tests the V-Dem index of Electoral Democracy. This aggregation scheme, described at length in Coppedge et al. (2016), lies midway between multiplication and averaging. Model 4 tests an index constructed by the first component of a principal component analysis. Model 5 tests a final alternative where the index represents a simple average (mean) across all five indices.
Results displayed in Table 4 show that the multiplication rule adopted by our preferred index, MEDI, out-performs all other aggregation schemes. Among the alternatives, those closest to MEDI in their construction – namely, the weakest-link index and V-Dem EDI – also predict lower infant mortality, though only at the 5% level. Other alternatives, which dispense entirely with the multiplicative logic of MEDI, show no relationship whatsoever to IMR.
This finding corroborates our hypothesis that, with respect to human development, political institutions pertaining to electoral democracy are not substitutable. Rather, they complement one another. Aggregation schemes that average across these components, or observe only the common dimension (as identified by various factor analytic procedures), do not capture these interactions. It is not surprising, therefore, that they show no relationship to human development. More specifically,

20
these results resonate with a body of work showing that there are many ways to subvert the ideal of electoral democracy even while maintaining a pretense of democracy by satisfying some elements of that ideal (Levitsky & Way 2010; Gandhi & Lust-Okar 2009; Schedler 2006, 2013).
Table 4: Electoral Democracy Indices with Varying Aggregation Rules
1 2 3 4 5 Multiplication -0.059*** (MEDI) (0.013) Minimum -0.025* (weakest-link) (0.014) V-Dem EDI -0.023 (½ mean, ½ mult.) (0.017) Factor scores 0.002 (pca) (0.003) Average 0.020 (arithmetic) (0.015) GDPpc (ln) -0.388*** -0.405*** -0.422*** -0.439*** -0.441*** (0.067) (0.070) (0.069) (0.068) (0.067) Year FE Country FE Countries 150 156 150 150 150 Years 111 111 111 111 111 Obs 8787 9333 8803 8787 8787 R2 (within) (0.910) (0.898) (0.904) (0.904) (0.904)
Outcome: Infant mortality rate (ln). Units of analysis: country-years. Right-side variables measured at T-1. All democracy indices measured as stock from 1900 (or first year for which data is available) with 10% annual depreciation. Estimator: ordinary least squares with country and year fixed effects, standard errors clustered by country. *** p<01 **p<.05 *p<.10
Mediation Analysis
We have focused thus far on the hypothesized causal effect of electoral democracy on human development. Here, we turn to the question of causal mechanisms. Why might electoral democracy (measured with the MEDI index) be robustly associated with improvements in quality of life? In Section I, we argued that public spending plays an important role in this story. Specifically, selection effects (into leadership positions) and post-selection incentives (via electoral accountability) induce politicians in democracies to increase redistributive and public goods spending.
Given our focus on mortality as a summary measure of human development, the most relevant – and measurable – causal pathway is health care spending. Regrettably, it is not possible to obtain fine-grained measures of health care spending for a large number of countries, e.g., on money spent in rural versus urban areas, hospital expenditures versus expenditures targeted on primary care, and so forth. Nonetheless, aggregate spending statistics are useful in this context as they generally reflect formal policies approved by top leaders. (Allocative decisions, by contrast, may be the product of decisions made by unelected bureaucrats and are on this account less relevant for present purposes, since our theory focuses on those at the apex of the policymaking process.)
While public expenditures have been examined by prior studies, these analyses have focused either on regime type and spending (Fielding, Freytag & Munch 2014) or on spending and health (Filmer & Pritchett 1999) – or, occasionally, on both, analyzed separately (McGuire 2010). Our

21
objective is to assess the role of health spending as a mechanism lying in between political institutions and health. To do so in an adequate fashion we must combine all three elements – X, M, and Y – into the same model. Accordingly, we employ a series of mediation analyses designed to test different indicators of health spending, different specifications, and different lag structures, as shown in Table 5.
Three data sources for public health expenditures are utilized: Nooruddin & Rudra (2014), Jensen & Skaaning (2015), and World Development Indicators (World Bank 2013). Data from these sources are correlated, though not as highly as one might think – which suggests the utility of running robustness tests with all three sources. The WDI offers the best country coverage, but the shortest time-series (16 years); consequently, we do not employ this data for models with country fixed effects.
Public health expenditures may be measured as a share of (a) GDP, (b) total central government expenditures, or (c) population (per capita). Each of these measures seems relevant to our theory, though “effort” is probably best proxied by (a) or (b), so we regard these as providing somewhat more appropriate tests of our theory.
The variable of theoretical interest – MEDI – may be measured as a stock (with a 10% annual depreciation rate) or as a level (unadjusted for history). We have already argued for a stock approach to this concept, but we also test the simpler level measure.
Specifications may include country or region fixed effects (dummies for each major region of the world). Although the latter departs from our benchmark model, our mediation tests are limited by data coverage to shorter panels, raising questions about a unit fixed-effect model with sluggish variables on the left and right sides. All models include year dummies and per capita GDP (logged) on the right side.
The lag structure among the key variables – X, M, and Y – may be modeled as Xt-Mt-Yt+1 or (perhaps more plausibly) as Xt-Mt+1-Yt+2. The outcome of interest, mortality, may be measured by infant mortality (IMR), child mortality (CMR), or life expectancy (LE).
The first model in Table 5 follows our benchmark model (Model 1, Table 2) closely. IMR (logged) is regressed on MEDI stock (10%), per capita GDP (logged), and country fixed effects, with public health expenditure (Jensen & Skaaning 2015) treated as the mediator in a 0-1-2 lag structure. Here, we find that the indirect effect via public expenditure accounts for about 19% of the total effect of MEDI on IMR, and the indirect effect is highly significant.
Subsequent models introduce permutations of this benchmark, altering one or more of the features described above. In all but one of these robustness tests the mediator is in the predicted direction, and it is significant at 1% in 16 of the 19 specifications. Thus, we find corroboration of our argument that the positive net effect of electoral democracy on health outcomes stems, in part, from the type of policies that autocratic and democratic leaders choose to pursue.
Of course, one must bear in mind the strong assumptions required for mediation analysis (Imai et al 2011). In particular, estimates of an indirect effect are sensitive to the omission of other relevant mediators. In this instance, we have been able to identify only one potential (measurable) mediator. If there are others, and if these are correlated with health spending, estimates for health spending are attenuated. Second, data coverage for health spending is limited. Even the longest panel is only 35 years, and the variables of theoretical interest tend to be sluggish, as noted. This feature of the data may introduce bias when including country-fixed effects in a regression model (Nickell 1981) – hence, the importance of region fixed-effect models as supplemental tests.
For these reasons, we have stronger confidence in estimates of the net effect, as shown in previous tables, than in estimates of the indirect effect, as shown in Table 5. Even so, the mediation analyses corroborate our theoretical claims and point the way forward for further investigation, perhaps including other possible mediators.

22
Table 5: Mediation Analysis
Y: human development, measured as infant mortality (IMR), child mortality (CMR), or life expectancy (LE). X: MEDI, measured as stock (10% depreciation rate) or level (untransformed). M: mediator, health care spending, measured as total spending or public spending and as share of GDP or per capita, using data from J&S (Jensen & Skaaning 2015), N&R (Nooruddin & Rudra 2014), or WDI (World Bank 2013). All models include year fixed effects (FE) and GDP per capita (ln). Unit of analysis: country-year. Estimator: ordinary least squares. *** p<01 **p<.05 *p<.10
Y X Fixed effects M
Lag structure Total effect Indirect effect Sample
MEDI Country Region Health care exp X-M-Y β [t stat] p β [t stat] p Mediated Countries Years Obs.
1. IMR Stock Public/GDP (J&S) 0-1-2 -0.027 [-6.910] *** -0.006 [-4.837] *** 22.12 97 29 1493
2. IMR Stock Public/GDP (J&S) 0-0-1 -0.029 [-7.476] *** -0.006 [-4.910] *** 21.39 97 29 1494
3. IMR Stock Public/GDP (N&R) 0-0-1 -0.005 [-1.060] -0.002 [-1.470] 34.53 50 35 1215
4. IMR Stock Public/GDP (N&R) 0-1-2 -0.002 [-0.364] -0.001 [-1.165] 78.16 50 35 1215
5. IMR Stock Public/GDP (WDI) 0-0-1 -0.063 [-11.93] *** -0.026 [-10.15] *** 41.31 144 16 2189
6. IMR Stock Public/GDP (N&R) 0-0-1 -0.061 [-10.21] *** -0.022 [-7.583] *** 36.21 50 35 1215
7. IMR Stock Public/GDP (J&S) 0-0-1 -0.060 [-12.24] *** -0.008 [-5.529] *** 12.74 97 29 1494
8. IMR Stock Public/GDP (WDI) 0-1-2 -0.061 [-11.32] *** -0.023 [-9.235] *** 38.35 144 16 2226
9. IMR Stock Public/GDP (N&R) 0-1-2 -0.064 [-10.55] *** -0.022 [-7.580] *** 34.69 50 35 1215
10. IMR Stock Public/GDP (J&S) 0-1-2 -0.061 [-12.49] *** -0.008 [-5.535] *** 12.49 97 29 1493
11. IMR Stock Public/GDP (WDI) 0-1-2 -0.051 [-11.31] *** -0.037 [-14.58] *** 72.69 144 16 2226 12. IMR Level Public/GDP (J&S) 0-1-2 -0.159 [-7.657] *** -0.026 [-4.692] *** 16.39 97 29 1493
13. IMR Level Public/GDP (J&S) 0-1-2 -0.318 [-8.111] *** -0.063 [-5.623] *** 19.80 97 29 1493
14. IMR Stock Public/cap (WDI) 0-1-2 -0.061 [-11.36] *** -0.004 [-4.264] *** 6.73 144 17 2228
15. IMR Stock Public/cap (N&R) 0-1-2 -0.001 [-0.150] 0.001 [0.566] -74.8 49 33 1164
16. IMR Stock Public/cap (N&R) 0-1-2 -0.056 [-9.093] *** -0.017 [-6.920] *** 30.29 49 33 1164
17. CMR Stock Public/GDP (J&S) 0-1-2 -0.027 [-6.952] *** -0.006 [-4.742] *** 21.53 96 29 1488
18. CMR Stock Public/GDP (J&S) 0-1-2 -0.058 [-11.39] *** -0.010 [-6.077] *** 16.42 96 29 1488
19. LE Stock Public/GDP (J&S) 0-1-2 -0.017 [-6.992] *** -0.002 [-3.069] *** 13.07 97 29 1493
20. LE Stock Public/GDP (J&S) 0-1-2 -0.026 [-9.502] *** -0.004 [-5.503] *** 16.24 97 29 1493

23
III. Discussion
This study has taken a hard look at the relationship between regime-type and human development. While previous analyses focused on a few decades in the contemporary era and/or on highly aggregated measures of democracy, our analyses utilize fine-grained measures of democracy drawn from the Varieties of Democracy (V-Dem) project and mortality-based human development indicators drawn from Gapminder and other sources, allowing us to track the quality of institutions, and the rate of mortality decline, across a century-long period. With this set-up we have made a strong case for the role of democracy in fostering human development. Moreover, we have pinpointed various aspects of this relationship that have eluded previous work on the subject.
First, our results suggest that electoral competition bears a stronger relationship to human development than citizen empowerment (e.g., individual liberty, political equality, female empowerment, civil society, deliberation), and may be regarded as the driving force connecting regime-type to human development. The robustness of elite-level institutions vis-à-vis mass-level institutions supports a state-centered view of human development, in contrast to a society-centered view.12
Second, we have demonstrated that the electoral aspect of democracy bears a continuous and monotonic relationship to human development. Binary indices such as BMR and BNR – while focused appropriately on the electoral aspects of democracy – discard important information, which may explain why they do not show a robust relationship to IMR, as shown in Table 1.
Third, we have shown that rules of aggregation matter greatly for understanding this particular issue. Tests of various aggregation schemes, made possible by the highly disaggregated V-Dem dataset, demonstrate that a multiplicative rule out-performs other aggregation rules, suggesting that elements of electoral democracy interact with one another and that the impact of electoral democracy on human development is contingent upon this interaction. We suspect that aggregation rules play a similarly important role in other institutional relationships, an issue that is usually left un-tested.
Finally, we have argued that a principal mechanism by which electoral democracy contributes to human development lies in an accountability relationship in which politicians are incentivized to expand social policies. While scholars often highlight the inefficiency of social policies in the developing world (as discussed in Section I) – and our results by no means contradict this overall impression – it is worthwhile pointing out that social policies still matter. So far as we can tell, the “leaky bucket” of health expenditures contains enough water when it reaches its target to save a considerable number of lives. This, in turn, may be due to an important feature of social policy in the developing world, namely, the relative ease of saving a life in settings where mortality threatens on a daily basis. The worse off people are, the more effective a small dose of assistance is likely to be. That is why social policy does not need to be highly efficient in order to save a considerable number of lives in the developing world.
12 This is also supported by the preliminary results shown for a covariate measuring overall corruption (Model 7, Table 2), which seems to indicate a key role for state capacity in achieving human development.
24
IV. References
Acemoglu, Daron, Suresh Naidu, Pascual Restrepo, James A. Robinson. 2014. “Democracy Does Cause Growth.” NBER Working Paper No. 20004.
Acharya, A., Wall, H.J. 1994. “An Evaluation of the United Nations’ Human Development Index.”
Journal of Economic and Social Measurement 20: 51‐65.
Adcock, Robert, David Collier. 2001. “Measurement Validity: A Shared Standard for Qualitative and Quantitative Research.” American Political Science Review 95:3 (September) 529-46.
Altman, David, Rossana Castiglioni. 2009. “Democratic Quality and Human Development in Latin America: 1972–2001.” Canadian Journal of Political Science 42, 297–319.
Ansell, Ben W. 2010. From the Ballot to the Blackboard: The Redistributive Political Economy of Education. Cambridge: Cambridge University Press.
Anthopolos, Rebecca, Charles H. Becker. 2010. “Global Infant Mortality: Correcting for
Undercounting.” World Development 38, 467‐481
Barber, Benjamin. 1988. The Conquest of Politics: Liberal Philosophy in Democratic Times. Princeton: Princeton University Press.
Barro, Robert J. 1996. “Democracy and Growth.” Journal of Economic Growth 1:1, 1–27.
Benelo, George C., Dimitrios Roussopoulos (eds). 1971. The Case for Participatory Democracy: Some Prospects for a Radical Society. New York: Viking Press.
Bernhard, Michael, Timothy Nordstrom, Christopher Reenock. 2001. “Economic Performance, Institutional Intermediation, and Democratic Survival.” Journal of Politics 63: 775–803.
Besley, Timothy. 2005. “Political Selection.” Journal of Economic Perspectives 19:3 (Summer) 43-60.
Besley, Timothy; Marta Reynal-Querol. 2011. “Do Democracies Select More Educated Leaders?” American Political Science Review 105:3, 552-66.
Besley, Timothy, Masayuki Kudamatsu. 2006. “Health and Democracy.” American Economic Review 313-18.
Blaydes, Lisa, Mark A. Kayser. 2011. “Counting Calories: Democracy and Distribution in the Developing World.” International Studies Quarterly 57, 887-908.
Blundell, Richard, Stephen Bond. 1998. “Initial Conditions and Moment Restrictions in Dynamic Panel Data Models.” Journal of Econometrics 87, 115-43.
Boix, Carles. 2001. “Democracy, Development and the Public Sector.” American Journal of Political Science 45, 1-17.
Boix, Carles. 2003. Democracy and Redistribution. Princeton: Princeton University Press.
Boix, Carles, Michael K. Miller, Sebastian Rosato. 2013. “A Complete Data Set of Political Regimes, 1800-2007.” Comparative Political Studies 46:12, 1523-54.
Borsboom, Denny. 2006. “The Attack of the Psychometricians.” Psychometrika 71:3, 425–440.
Brown, David. 1999. “Reading, Writing and Regime Type: Democracy’s Impact on Primary School Enrollment.” Political Research Quarterly 52, 681–707.
Brown, David, Wendy Hunter. 1999. “Democracy and Social Spending in Latin America, 1980–1992.” American Political Science Review 93, 779–790.
Brown, David, Wendy Hunter. 2004. “Democracy and Human Capital Formation.” Comparative Political Studies 37, 842–64.

25
Bueno de Mesquita, Bruce, Alastair Smith, Randolph M. Siverson, James M. Morrow. 2003. The Logic of Political Survival. Cambridge: MIT Press.
Casper, Gretchen, Claudiu Tufis. 2003. “Correlation Versus Interchangeability: The Limited Robustness of Empirical Findings on Democracy Using Highly Correlated Data Sets.” Political Analysis 11:196–203.
Chaudhury, Nazmul, Jeffrey Hammer, Michael Kremer, Karthik Muralidharan, F. Halsey Rogers. 2006. “Missing in Action: Teacher and Health Worker Absence in Developing Countries.” Journal of Economic Perspectives 20:1 (Winter) 91–116.
Cheibub, Jose Antonio, Jennifer Gandhi, James Raymond Vreeland. 2010. “Democracy and Dictatorship Revisited.” Public Choice 143:1–2, 67–101.
Christoforou, Asimina. 2010. “Social Capital and Human Development: An Empirical Investigation across European Countries.” Journal of Institutional Economics 6, 191-214.
Clio Infra (clio-infra.eu). 2008.
Coppedge, Michael, Angel Alvarez, Claudia Maldonado. 2008. “Two Persistent Dimensions of Democracy: Contestation and Inclusiveness.” Journal of Politics 70:3, 632–647.
Coppedge, Michael, John Gerring, with David Altman, Michael Bernhard, Steven Fish, Allen Hicken, Matthew Kroenig, Staffan I. Lindberg, Kelly McMann, Pamela Paxton, Holli A. Semetko, Svend-Erik Skaaning, Jeffrey Staton, and Jan Teorell. 2011. “Conceptualizing and Measuring Democracy: A New Approach.” Perspectives on Politics 9:1 (June) 247-67.
Coppedge, Michael, John Gerring, Staffan I. Lindberg, Jan Teorell, David Altman, Michael Bernhard, M. Steven Fish, Adam Glynn, Allen Hicken, Carl Henrik Knutsen, Kelly McMann, Daniel Pemstein, Megan Reif, Svend-Erik Skaaning, Jeffrey Staton, Eitan Tzelgov, Yi-ting Wang, and Brigitte Zimmerman. 2015. “Varieties of Democracy: Methodology v4.” Varieties of Democracy (V-Dem) Project.
Coppedge, Michael, Staffan I. Lindberg, Svend-Erik Skaaning, Jan Teorell. 2016. Measuring high level democratic principles using the V-Dem data. International Political Science Review. Forthcoming.
Costanza, Robert, Maureen Hart, Stephen Posner, John Talberth. 2009. “Beyond GDP: The Need for New Measures of Progress.” Pardee Papers #4, The Frederick S. Pardee Center for the Study of the Longer-Range Future at Boston University.
Dahl, Robert A. 1971. Polyarchy: Participation and Opposition. New Haven: Yale University Press.
Dahl, Robert A. 1989. Democracy and its Critics. New Haven: Yale University Press.
Dasgupta, Partha, Martin Weale. 1992. “On Measuring the Quality of Life.” World Development 20:1 (January) 119-31.
Deacon, Robert T. 2009. “Public Good Provision under Dictatorship and Democracy.” Public Choice 139:1–2, 241–62.
Doces, John A. 2008. “Political Institutions and Human Well-Being: The Case of Corruption and Child Mortality.” Prepared for delivery at the 2008 Annual Meeting of the American Political Science Association, Boston, MA.
Eterovic, Dalibor S., Cassandra M. Sweet. 2014. “Democracy and Education in Twentieth-Century Latin America.” Economics & Politics 26:2 (July) 237-62.
Ferejohn, John. 1986. “Incumbent Performance and Electoral Control.” Public Choice 50:1-3, 5-25.
Fielding, David, Andreas Freytag, Angela Münch. 2014. “Public Spending on Health as Political Instrument?: Regime-type dependency of public spending.” Working paper, Department of
26
Environmental and Business Economics, University of Southern Denmark.
Filmer, Deon, Lant Pritchett. 1999. “The Impact of Public Spending on Health: Does Money Matter?” Social Science and Medicine 49:10 (November) 1309-23.
Freedom House. 2012. Freedom in the World 2012. See: https://freedomhouse.org/report/freedom-world-2012/methodology#.VVe-b3Y4VaQ
Fujiwara, Thomas. 2015. “Voting Technology, Political Responsiveness, and Infant Health: Evidence from Brazil.” Econometrica 83:2, 423-64.
Fung, Archon, Erik Olin Wright (eds). 2003. Deepening Democracy: Institutional Innovations in Empowered Participatory Governance. Verso.
Gandhi, Jennifer and Ellen Lust-Oskar. 2009. “Elections under Authoritarianism.” Annual Review of Political Science 12, 403-422.
Gallego, Francisco A. 2010. “Historical Origins of Schooling: The Role of Democracy and Political Decentralization.” Review of Economics and Statistics 92:2, 228-43.
Gauri, Varun, Peyvand Khaleghian. 2002. ‘‘Immunization in Developing Countries: Its Political and Organizational Determinants.’’ World Development 30 (December) 2109–32.
Gerring, John, Philip Bond, William T. Barndt, Carola Moreno. 2005. “Democracy and Economic Growth: A Historical Perspective.” World Politics 57:3 (April) 323-64.
Gerring, John, Strom C. Thacker, Rodrigo Alfaro. 2012. “Democracy and Human Development.” Journal of Politics 74:1 (January) 1-17.
Ghobarah, Hazem Adam, Paul Huth, Bruce Russett. 2004. ‘‘Comparative Public Health: The Political Economy of Human Misery and Well-Being.’’ International Studies Quarterly 48 (1): 73–94.
Goertz, Gary. 2006. Social Science Concepts: A User's Guide. Princeton: Princeton University Press.
Haggard, Stephan, Robert Kaufman. 2008. Development, Democracy and Welfare States. Princeton: Princeton University Press.
Hallerod, Bjorn, Bo Rothstein, Adel Daoud, Shailen Nandy. 2013. “Bad Governance and Poor Children: A Comparative Analysis of Government Efficiency and Severe Child Deprivation in 68 Low and Middle-income Countries.” World Development 48, 19-31.
Halperin, Morton H., Joseph T Siegle, Michael M. Weinstein (2005). The Democracy Advantage: How Democracies Promote Prosperity and Peace. New York: Routledge.
Hamoudi, Amar, Jeffrey Sachs. 1999. “Economic Consequences of Health Status: A Review of Evidence.” Harvard University, Center for International Development.
Hanson, Jonathan K. 2015. “Democracy and State Capacity: Complements or Substitutes?” Studies in Comparative International Development (forthcoming).
Harding, Robin, David Stasavage. 2014. “What Democracy Does (and Doesn’t do) for Basic Services: School Fees, School Inputs, and African Elections.” Journal of Politics 76:01, 229-45.
Hausmann, Ricardo; Lant Pritchett; Dani Rodrik. 2005. “Growth Accelerations.” Journal of Economic Growth 10:4, 303-29.
Honaker, James, Gary King, Matthew Blackwell. 2011. “Amelia II: A Program for Missing Data.” Journal of Statistical Software 45:7, 1-47.
Houweling, Tanja A.J., Anton E. Kunst Caspar, W.N. Looman, Johan P. Mackenbach. 2005. “Determinants of under-5 mortality among the poor and the rich: a cross-national analysis of 43 developing countries.” International Journal of Epidemiology 34: 1257-1265.
Huber, Evelyne, Thomas Mustillo, John D. Stephens. 2008. “Politics and Social Spending in Latin

27
America.” Journal of Politics 70, 420-36.
Huntington, Samuel P. 1968. Political Order in Changing Societies. New Haven: Yale University Press.
Imai, Kosuke, Luke Keele, Dustin Tingley, Teppei Yamamoto. 2011. “Unpacking the Black Box of Causality: Learning about Causal Mechanisms from Experimental and Observational Studies.” American Political Science Review 105:4, 765-89.
Inglehart, Ronald, Christian Welzel. 2005. Modernization, Cultural Change, and Democracy. Cambridge: Cambridge University Press.
Jacobsen, Joannes. 2015. “Revisiting the Modernization Hypothesis: Longevity and Democracy.” World Development 67, 174–85.
Jensen, Carsten, Svend-Erik Skaaning. 2015. “Democracy, Ethnic Fractionalization, and the Politics of Social Spending: Disentangling a Conditional Relationship.” International Political Science Review 36:4, 457-72.
Kapstein, Ethan B., Nathan Converse. 2008. The Fate of Young Democracies. Cambridge: Cambridge University Press.
Kaufman, Robert R., Alex Segura-Ubiergo. 2001. “Globalization, Domestic Politics, and Social Spending in Latin America: A Time-Series Cross-Section Analysis, 1973–97.” World Politics 53:4, 553–87.
Kawachi, Ichiro. 2001. “Social Capital for Health and Human Development.” Development 44:1, 31-35.
Keefer, Philip. 2006. “Clientelism, Credibility and the Policy Choices of Young Democracies.” American Journal of Political Science 51:4 (October) 804-21.
Knutsen, Carl Henrik. 2011. “Democracy, Dictatorship and Protection of Property Rights.” Journal of Development Studies 47:1, 164-182.
Knutsen, Carl Henrik. 2015. “Why democracies outgrow autocracies in the long run: Civil liberties, information flows and technological change.” Kyklos 68:3, 357-384.
Kovacevic, Milorad. 2011. “Review of HDI Critiques and Potential Improvements.” Human Development Reports Research Paper 2010/33, United Nations Development Programme.
Kudamatsu, Masayuki. 2012. “Has democratization reduced infant mortality in sub-Saharan Africa? Evidence from micro data.” Journal of the European Economic Association 10:6, 1294–1317.
Lake, David A., Matthew A. Baum. 2001. “The Invisible Hand of Democracy: Political Control and the Provision of Public Services.” Comparative Political Studies 34:6 (August) 587-621.
Lee, Cheol-Sung. 2005. “Income Inequality, Democracy, and Public Sector Size.” American Sociological Review 70:1 (February) 158-81.
Levitsky, Steven, Lucan A. Way. 2010. Competitive Authoritarianism: Hybrid Regimes After the Cold War. Cambridge: Cambridge University Press.
Lindert, Peter. 2004. Growing Public: Volume 1: Social Spending and Economic Growth since the Eighteenth Century, 2d ed. Cambridge: Cambridge University Press.
Lipton, Michael. 1977. Why Poor People Stay Poor: Urban Bias in World Development. Cambridge: Harvard University Press.
Long, J. Scott, Jeremy Freese. 2014. Regression Models for Categorical Dependent Variables Using Stata, 3rd ed. Stata Press.
Macpherson, C.B. 1977. The Life and Times of Liberal Democracy. Oxford: Oxford University Press.
Mansbridge, Jane. 1983. Beyond Adversarial Democracy. Chicago: University of Chicago Press.
28
Mansfield, Edward D., Jack Snyder. 2005. Electing to Fight: Why Emerging Democracies go to War. Cambridge: MIT Press.
Marshall, Monty, Ted Gurr, Keith Jaggers. 2014. Polity IV project: Dataset users’ manual. http://www.systemicpeace.org/inscr/p4manualv2013.pdf
Mattila, Mikko, Söderlund, Peter, Wass, Hanna, Rapeli, Lauri (2013): Healthy voting: The effect of self-reported health on turnout in 30 countries. Electoral Studies 32:4, 886-891.
McGillivray, M. 2005. “Measuring Non-Economic Well-Being Achievement.” Review of Income and Wealth 51:2, 337-364.
McGuire, James W. 2010. Wealth, Health, and Democracy in East Asia and Latin America. Cambridge: Cambridge University Press.
McGuire, James W. 2013. “Political Regime and Social Performance.” Contemporary Politics 19:1 (March) 55-75.
Meltzer, Allan H., Scott F. Richards. 1981. “A Rational Theory of the Size of Government.” Journal of Political Economy 89:5, 914-27.
Miller, Grant. 2008. “Women’s Suffrage, Political Responsiveness, and Child Survival in American History.” Quarterly Journal of Economics 123:3, 1287-1327.
Miller, Michael K. 2015. “Democratic Pieces: Autocratic Elections and Democratic Development since 1815.” British Journal of Political Science 45:3, 501-30.
Miller, Michael K. 2016. “Electoral Authoritarianism and Human Development.” Comparative Political Studies (forthcoming).
Morris, David. 1979. Measuring the Condition of the World’s Poor: The Physical Quality of Life Index. New York: Pergamon.
Mulligan, Casey B., Xavier Sala-i Martin, Ricard Gill. 2003. “Do Democracies Have Different Public Policies than Nondemocracies?” Journal of Economic Perspectives 18:1, 51-74.
Munck, Gerardo L. 2009. Measuring Democracy: A Bridge Between Scholarship and Politics. Baltimore, Md: Johns Hopkins University Press.
Muntaner, Carles, Carme Borrell, Edwin Ng, Haejoo Chung, Albert Espelt, Mmaica Rodriguez Sanz, Joan Benach, Patricia O’Campo. 2011. “Politics, Welfare Regimes, and Population Health: Controversies and Evidence.” Sociology of health & illness 33, 946-64.
Nelson, Joan M. 2007. “Elections, Democracy, and Social Services.” Studies in Comparative International Development (Winter) 41:4, 79-97.
Nickell, Stephen. 1981. Biases in Dynamic Models with Fixed Effects. Econometrica 49:6, 1417-1426.
Nooruddin, Irfan, Nita Rudra. 2014. “Are Developing Countries Really Defying the Embedded Liberalism Hypothesis?” World Politics 66:04 (October) 603-40.
Pateman, Carole. 1976. Participation and Democratic Theory. Cambridge: Cambridge University Press.
Pateman, Carole. 2012. “Participatory Democracy Revisited.” Perspectives on Politics 10, 7-19.
Pemstein, Daniel, Eitan Tzelgov, Yi-ting Wang. 2015. “Evaluating and Improving Item Response Theory Models for Cross-National Expert Surveys.” V-Dem Working Paper 2015:1.
Pemstein, Dan, Kyle L. Marquardt, Eitan Tzelgov, Yi-ting Wang, Farhad Miri. 2015. “The V-Dem Measurement Model: Latent Variable Analysis for Cross-National and Cross-Temporal Expert-Coded Data.” University of Gothenburg, Varieties of Democracy Institute: V-Dem Working Papers Series No. 20
Pemstein, Daniel, Stephen A. Meserve, James Melton. 2010. “Democratic Compromise: A Latent

29
Variable Analysis of Ten Measures of Regime Type.” Political Analysis 18:4, 426-449
Philipsen, Dirk. 2015. The Little Big Number: How GDP Came to Rule the World and What to Do about It. Princeton: Princeton University Press.
Przeworski, Adam. 2010. Democracy and the Limits of Self-Government. Cambridge: Cambridge University Press.
Przeworski, Adam, Michael E. Alvarez, Jose Antonio Cheibub, Fernando Limongi. 2000. Democracy and Development. Cambridge: Cambridge University Press.
Putnam, Robert D. 1993. Making Democracy Work: Civic Traditions in Modern Italy. Princeton: Princeton University Press.
Ramos, Antonio P. Tournillon O. 2014. “Does Democracy Reduce Infant Mortality? Evidence from new data for 181 countries between 1970 and 2009.” Unpublished paper.
Rawlings, Laura B., Gloria M. Rubio. 2005. “Evaluating the Impact of Conditional Cash Transfer Programs.” World Bank Research Observer 20:1 (Spring) 29-55.
Raworth, K. and Stewart, D. 2003. “Critiques of the Human Development Index: A review.” In
Fukuda‐ Parr and Kumar (eds.) Readings in Human Development (New Delhi: Oxford University Press).
Riley, James C. 2005. “Estimates of Regional and Global Life Expectancy, 1800-2001.” Population and Development Review 31:3 (September) 537-43.
Roodman, David. 2009. “A Note on the Theme of too many Instruments.” Oxford Bulletin of Economics and Statistics 71:1, 135-158.
Ross, Michael. 2006. ‘‘Is Democracy Good for the Poor?’’ American Journal of Political Science 50 (October): 860–74.
Rothstein, Bo. 2011. Quality of Government: Corruption, Social Trust, and Inequality in International Perspective. Chicago: University of Chicago Press.
Rothstein, Bo. 2015. “Guilty as Charged? Human Well-being and the Unsung Relevance of Political Science.” In Gerry Stoker, B. Guy Peters & Jon Pierre (eds), The Relevance of Political Science (London: Palgrave Macmillan) 84-103.
Sachs, Jeffrey D.; John W. McArthur. 2005. “The Millennium Project: a plan for meeting the Millennium Development Goals.” Lancet 365:9456, 347-353.
Saint-Paul, Gilles, Thierry Verdier. 1993. “Education, Democracy and Growth.” Journal of Development Economics 42 399-407.
Schedler, Andreas. 2002. “The Menu of Manipulation.” Journal of Democracy 13:2 (April).
Schedler, Andreas. 2006. The Logic of Electoral Authoritarianism. In Electoral Authoritarianism: The Dynamics of Unfree Competition, ed. Andreas Schedler. Lynne Rienner Publishers.
Sen, Amartya. 1982. Poverty and famines: an essay on entitlement and deprivation. Oxford: Clarendon Press.
Sen, Amartya. 1998. “Mortality as an Indicator of Economic Success and Failure.” Economic Journal 108:446, 1–25.
Shandra, John M., Jenna Nobles, Bruce London, John B. Williamson. 2004. ‘‘Dependency, Democracy, and Infant Mortality: A Quantitative, Cross-National Analysis of Less Developed Countries.’’ Social Science and Medicine 59 (July) 321–33.
Stasavage, David. 2005. “Democracy and Education Spending in Africa.” American Journal of Political Science 49:2, 343-58.
ul Haq, Mahbub. 1995. Reflections on Human Development. New Dehli: Oxford University Press.

30
van de Walle, Dominique. 1994. “The distribution of subsidies through public health services in Indonesia, 1978–87.” World Bank Economic Review 8:2, 279–309.
Wigley, Simon, Arzu Akkoy, Unlu-Wigley. 2011. “The Impact of Regime Type on Health: Does Redistribution Explain Everything?” World Politics 63:4 (October) 647–77.
Wintrobe, Ronald. 1998. The Political Economy of Dictatorship. Cambridge: Cambridge University Press
Wright, Joseph. 2008. “Do Authoritarian Institutions Constrain? How Legislatures Affect Economic Growth and Investment.” American Journal of Political Science 52:2, 322-43.
Wright, Matthew, Tim Reeskens. 2013. “Of what cloth are the ties that bind? National identity and support for the welfare state across 29 European countries.” Journal of European Public Policy 20:10, 1443-63.
World Bank. 2013. World Development Indicators 2013. Washington, DC: World Bank.
Zweifel, Thomas D., Patricio Navia. 2003. “Democracy, Dictatorship, and Infant Mortality Revisited.” Journal of Democracy 14:3 (July) 90-103.
31
APPENDIX A: Data and Additional Tests

32
Table A1: Variable Descriptions
Outcomes
Infant mortality rate (IMR). Babies who die prior to their first birthday as a share of 1,000 live births, transformed by the natural logarithm (unless otherwise noted). Missing data within a time series is interpolated using a linear model. Source: Gapminder (gapminder.org). Tag: imr_gapminder_ipo_ln
Infant mortality rate (IMR), WDI. Babies who die prior to their first birthday as a share of 1,000 live births, transformed by the natural logarithm (unless otherwise noted). Source: WDI (World Bank 2013). Tag: wdi_mort_ln
Child mortality rate (CMR). Children who die prior to their fifth birthday as a share of 1,000 live births, transformed by the natural logarithm (unless otherwise noted). Missing data within a time series is interpolated using a linear model. Source: Gapminder (gapminder.org). Tag: cme_gapminder_ipo_ln
Life expectancy (LE). Expected longevity at birth based on current age-specific mortality rates. The variable is transformed by subtracting LE from the maximum value in our sample (85) and then taking the logarithm of that number. A low number signals a lower mortality rate. Missing data within a time series is interpolated using a linear model. Source: Gapminder (gapminder.org). Tag: le_gapminder_ipo_85mln
Components of MEDI
Clean elections. Free and fair elections connote an absence of registration fraud, systematic irregularities, government intimidation of the opposition, vote buying, and election violence. The index is formed by taking the point estimates from a Bayesian factor analysis model of the indicators for EMB autonomy (v2elembaut), EMB capacity (v2elembcap), election voter registry (v2elrgstry), election vote buying (v2elvotbuy), election other voting irregularities (v2elirreg), election government intimidation (v2elintim), election other electoral violence (v2elpeace), and election free and fair (v2elfrfair). Since the bulk of these indicators are only observed in election years, the index scores have then been repeated within election regime periods (as defined by v2x_elecreg). Source: V-Dem. Tag: v2xel_frefair
Elected executive. This index attempts to measure whether the chief executive is elected, either directly elected through popular elections or indirectly through a popularly elected legislature that then appoints the chief executive. There are six different chains of appointment/selection to take into account in constructing this index, all of which are scaled to vary from 0 to 1. First, whether the head of state is directly elected (a=1) or not (a=0). Second, the extent to which the legislature is popularly elected (b), measured as the proportion of legislators elected (if legislature is unicameral), or the weighted average of the proportion elected for each house, with the weight defined by which house is dominant (if legislature is bicameral). Third, whether the head of state is appointed by the legislature, or the approval of the legislature is necessary for the appointment of the head of state (c1=1, otherwise 0). Fourth, whether the head of government is appointed by the legislature, or the approval of the legislature is necessary for the appointment of the head of government (c2=1, otherwise 0). Fifth, whether the head of government is appointed by the head of state (d=1) or not (d=0). Sixth, whether the head of government is directly elected (e=1) or not (e=0). Define hosw as the weight for the head of state. If the head of state is also head of government (v2exhoshog==1), hosw=1. If the head of state has more power than the head of government over the appointment and dismissal of cabinet ministers, then hosw=1; if the reverse is true, hosw=0. If they share equal power, hosw=.5. Define the weight for the head of government as hogw=1-hosw. Source: V-Dem. Tag: v2x_accex
Free association. This index attempts to measure the extent to which parties, including opposition parties, are allowed to form and to participate in elections, and the extent to which civil society organizations are able to form and to operate freely. The index is formed by taking the point estimates from a Bayesian factor analysis model of the indicators for party ban (v2psparban), barriers to parties (v2psbars), opposition parties autonomy (v2psoppaut), elections multiparty (v2elmulpar), CSO entry and exit (v2cseeorgs) and CSO repression (v2csreprss). Since the multiparty elections indicator is only observed in election years, its values have first been repeated within election regime periods (as defined by v2x_elecreg). Source: V-Dem. Tag: v2x_frassoc_thick
Free expression. This index attempts to measure the extent to which the government respects press and media freedom, the freedom of ordinary people to discuss political matters at home and in the public sphere, as well as the freedom of academic and cultural expression. The index is formed by taking the point estimates from a Bayesian factor

33
analysis model of the indicators for print/broadcast censorship effort (v2mecenefm), internet censorship effort (v2mecenefi), harassment of journalists (v2meharjrn), media bias (v2mebias), media self-censorship (v2meslfcen), print/broadcast media critical (v2mecrit), and print/broadcast media perspectives (v2merange), freedom of discussion for men/women (v2cldiscm, v2cldiscw) and freedom of academic and cultural expression (v2clacfree). Source: V-Dem. Tag: v2x_freexp_thick
Suffrage. The share of adult citizens (as defined by statute) that has the legal right to vote in national elections. This measure covers legal (de jure) restrictions, not restrictions that may be operative in practice (de facto). The scores reflect de jure provisions of suffrage extension in percentage of the adult population as of January 1 in a particular year. The adult population (as defined by statute) is defined by citizens in the case of independent countries or the people living in the territorial entity in the case of colonies. Universal suffrage is coded as 100%. Universal male suffrage only is coded as 50%. Years before electoral provisions are introduced are scored 0%. The scores do not reflect whether an electoral regime was interrupted or not. Only if new constitutions, electoral laws, or the like explicitly introduce new regulations of suffrage, the scores were adjusted accordingly if the changes suggested doing so. If qualifying criteria other than gender apply (such as property, tax payments, income, literacy, region, race, ethnicity, religion, and/or ‘economic independence’), estimates have been calculated by combining information on the restrictions with different kinds of statistical information (on population size, age distribution, wealth distribution, literacy rates, size of ethnic groups, etc.), secondary country-specific sources, and – in the case of very poor information – the conditions in similar countries or colonies. Source: V-Dem. Tag: v2x_suffr
Other Measures of Democracy
Polity2. Measures the extent to which democratic or autocratic “authority patterns” are institutionalized in a given country. It takes into account how the executive is selected, the degree of checks on executive power, and the form of political competition. Source: Marshall et al. (2014). Tag: e_polity2.
UDS. A democracy index comprised of multiple indicators and aggregated through a Bayesian IRT measurement model. Source: Pemstein et al. (2010). Tag: e_uds_mean.
Contestation. Defined as the “extent and fairness of electoral competition between parties and distinct interests,” including “the existence of independent political parties, the freedom of electoral competition, the extent of intra-governmental constraints, legislative membership by opposition parties and the closeness of national votes,” as measured by a variety of extant indicators. Source: Miller (2015). Tag: contdim.
Inclusiveness. Defined as “the extent of popular electoral involvement across the citizenry,” understood as including suffrage and turnout, and measured with a variety of extant indicators. Source: Miller (2015). Tag: partdim.
Participation. The participatory principle of democracy emphasizes active participation by citizens in all political processes, electoral and non-electoral. It is motivated by uneasiness about a bedrock practice of electoral democracy: delegating authority to representatives. Thus, direct rule by citizens is preferred, wherever practicable. This model of democracy thus takes suffrage for granted, emphasizing engagement in civil society organizations, direct democracy, and subnational elected bodies. This index is formed by averaging the following indices: civil society participation (v2x_cspart), direct popular vote (v2xdd_dd), elected local government power (v2xel_locelec), and elected regional government power(v2xel_regelec). Source: V-Dem. Tag: v2x_partip.
Deliberation. The deliberative principle of democracy focuses on the process by which decisions are reached in a polity. A deliberative process is one in which public reasoning focused on the common good motivates political decisions—as contrasted with emotional appeals, solidary attachments, parochial interests, or coercion. According to this principle, democracy requires more than an aggregation of existing preferences. There should also be respectful dialogue at all levels—from preference formation to final decision—among informed and competent participants who are open to persuasion. To measure these features of a polity we try to determine the extent to which political elites give public justifications for their positions on matters of public policy, justify their positions in terms of the public good, acknowledge and respect counter-arguments; and how wide the range of consultation is at elite levels. The index is formed by point estimates drawn from a Bayesian factor analysis model including the following indicators: reasoned justification (v2dlreason), common good justification (v2dlcommon), respect for counterarguments (v2dlcountr), range of consultation (v2dlconslt), and engaged society (v2dlengage). Source: V-Dem. Tag: v2xdl_delib.
Egalitarian. The egalitarian principle of democracy addresses the distribution of political power across social groups, i.e., groups defined by class, sex, religion, and ethnicity. This perspective on democracy emphasizes that a formal

34
guarantee of political rights and civil liberties are not always sufficient for political equality. Ideally, all social groups should have approximately equal participation, representation, agenda-setting power, protection under the law, and influence over policymaking and policy implementation. If such equality does not exist, the state ought to seek to redistribute socio-economic resources, education, and health so as to enhance political equality. The index is formed by point estimates drawn from a Bayesian factor analysis model including indicators of power distribution according to socioeconomic position (v2pepwrses), power distribution according to social group (v2pepwrsoc), social group equality in respect for civil liberties (v2clsocgrp), equal access to education (v2peedueq), equal access to health (v2pehealth), power distribution according to gender (v2pepwrgen), share of budget allocated to public/common goods (v2dlencmps), and the share of welfare programs that provide universal rather than means-tested benefits (v2dlunivl). Source: V-Dem. Tag: v2x_egal.
Female power. Political empowerment is understood to include open discussion of political issues, participation in civil society organizations, freedom of movement, the right to private property, access to justice, freedom from forced labor, representation in the ranks of journalists, and an equal share in the overall distribution of power. The index is formed by taking the point estimates from a Bayesian factor analysis model of the indicators for CSO women’s participation (v2csgender), female journalists (v2mefemjrn), freedom of domestic movement for women (v2cldmovew), freedom of discussion for women (v2cldiscw), freedom from forced labor for women (v2clslavef), property rights for women (v2clprptyw), access to justice for women (v2clacjstw), and power distributed by gender (v2pepwrgen). Source: V-Dem. Tag: v2x_gender.
Civil society. The sphere of civil society lies in the public space between the private sphere and the state. Here, citizens organize in groups to pursue their collective interests and ideals. We call these groups civil society organizations (CSOs). CSOs include, but are by no means limited to, interest groups, labor unions, spiritual organizations (if they are engaged in civic or political activities), social movements, professional associations, charities, and other non-governmental organizations. The core civil society index (CCSI) is designed to provide a measure of a robust civil society, understood as one that enjoys autonomy from the state and in which citizens freely and actively pursue their political and civic goals, however conceived. The index is formed by taking the point estimates from a Bayesian factor analysis model of the indicators for candidate selection – national/local (v2pscnslnl), CSO consultation (v2cscnsult), CSO participatory environment (v2csprtcpt), and CSO women’s participation (v2csgender). Source: V-Dem. Tag: v2x_cspart.
Individual liberty. To what extent are laws transparent and rigorously enforced and public administration impartial, and to what extent do citizens enjoy access to justice, secure property rights, freedom from forced labor, freedom of movement, physical integrity rights, and freedom of religion? The index is formed by taking the point estimates from a Bayesian factor analysis model of the indicators for rigorous and impartial public administration (v2clrspct), transparent laws with predictable enforcement (v2cltrnslw), access to justice for men/women (v2clacjstm, v2clacjstw), property rights for men/women (v2clprptym, v2clprptyw), freedom from torture (v2cltort), freedom from political killings (v2clkill), from forced labor for men/women (v2clslavem v2clslavef), freedom of religion (v2clrelig), freedom of foreign movement (v2clfmove), and freedom of domestic movement for men/women (v2cldmovem, v2cldmovew). Source: V-Dem. Tag: v2xcl_rol.
BMR. Dichotomous democracy measure based on contestation and participation. Countries coded democratic have (1) political leaders that are chosen through free and fair elections and (2) a minimal level of suffrage. Source: Boix, Miller & Rosato (2013). Tag: e_boix_regime.
BNR. Following Dahl (1971), a country is defined as democratic if there is a high level of contestation and at least 50% of the adult population is allowed to vote. Source: Bernhard, Nordstrom & Reenock (2011). Tag: e_bnr_dem.
Covariates
GDP per capita (ln). Gross domestic product per capita, transformed by the natural logarithm. Source: Maddison Project (Bolt & van Zanden 2014). Tag: e_migdppc_ln.
Urbanization. Ratio of urban population to total population. Source: V-Dem, constructed from data from CLIO Infra (clio-infra.eu). Tag: e_miurbani.
Fertility (ln). Fertility rate, transformed by the natural logarithm. The fertility rate (aka total fertility rate, period total fertility rate, total period fertility rate) of a population is the mean number of children that would be born to a woman over her lifetime if (a) she were to experience the current age-specific fertility rates through her lifetime, and (b) she were
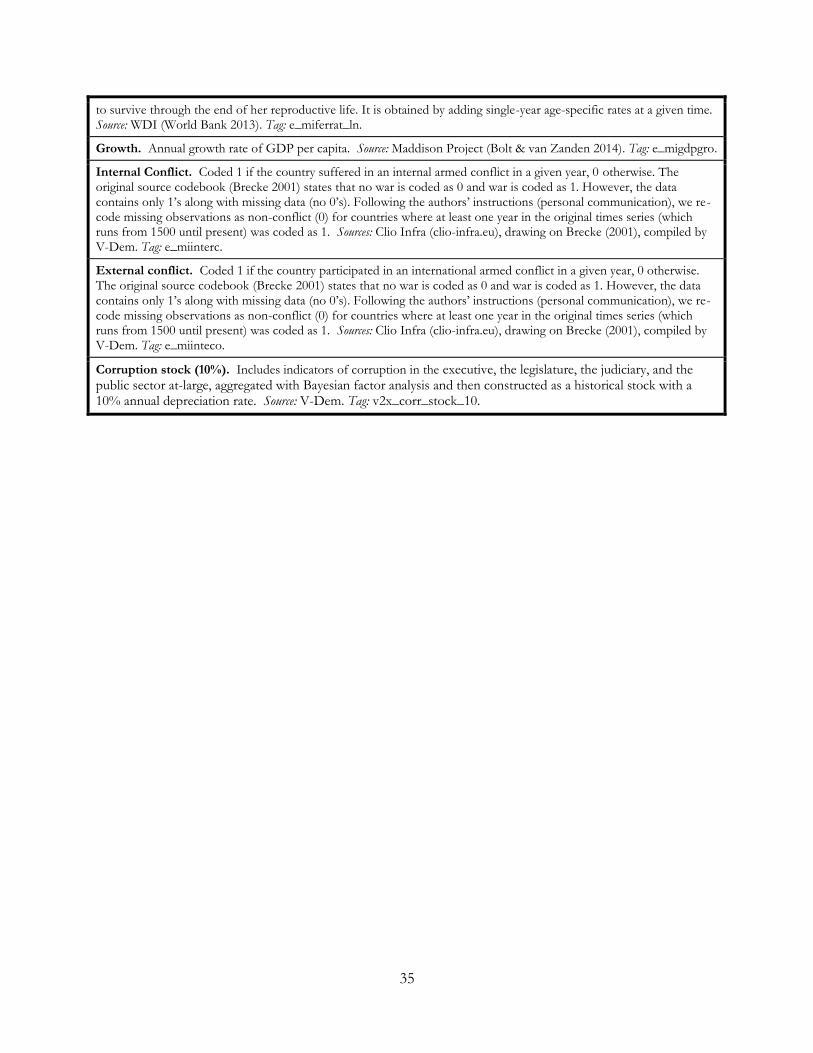
35
to survive through the end of her reproductive life. It is obtained by adding single-year age-specific rates at a given time. Source: WDI (World Bank 2013). Tag: e_miferrat_ln.
Growth. Annual growth rate of GDP per capita. Source: Maddison Project (Bolt & van Zanden 2014). Tag: e_migdpgro.
Internal Conflict. Coded 1 if the country suffered in an internal armed conflict in a given year, 0 otherwise. The original source codebook (Brecke 2001) states that no war is coded as 0 and war is coded as 1. However, the data contains only 1’s along with missing data (no 0’s). Following the authors’ instructions (personal communication), we re-code missing observations as non-conflict (0) for countries where at least one year in the original times series (which runs from 1500 until present) was coded as 1. Sources: Clio Infra (clio-infra.eu), drawing on Brecke (2001), compiled by V-Dem. Tag: e_miinterc.
External conflict. Coded 1 if the country participated in an international armed conflict in a given year, 0 otherwise. The original source codebook (Brecke 2001) states that no war is coded as 0 and war is coded as 1. However, the data contains only 1’s along with missing data (no 0’s). Following the authors’ instructions (personal communication), we re-code missing observations as non-conflict (0) for countries where at least one year in the original times series (which runs from 1500 until present) was coded as 1. Sources: Clio Infra (clio-infra.eu), drawing on Brecke (2001), compiled by V-Dem. Tag: e_miinteco.
Corruption stock (10%). Includes indicators of corruption in the executive, the legislature, the judiciary, and the public sector at-large, aggregated with Bayesian factor analysis and then constructed as a historical stock with a 10% annual depreciation rate. Source: V-Dem. Tag: v2x_corr_stock_10.

36
Table A2: Descriptive Statistics
Obs. mean SD min max
Infant mortality rate (ln) 12,130 3.811 1.058 0.531 6.040
MEDI 15,432 0.184 0.288 0.000 0.944
MEDI stock (1%) 15,432 4.729 9.642 0.000 56.778
MEDI stock (10%) 15,432 1.485 2.474 0.000 9.228
Clean elections (V-Dem) 17,661 0.324 0.358 0.000 0.995
Elected executive (V-Dem) 16,382 0.517 0.485 0.000 1.000
Free association (V-Dem) 16,105 0.473 0.332 0.023 0.966
Free expression (V-Dem) 15,997 0.470 0.312 0.015 0.989
Suffrage (V-Dem) 19,948 0.616 0.443 0.000 1.000
GDP per capita (ln) 11,627 7.787 1.034 5.315 10.667
Urbanization 20,764 0.350 0.251 0.008 1.000
Fertility (ln) 13,371 1.349 0.525 -0.179 2.222
Growth 10,694 1.933 6.452 -61.493 86.946
Internal Conflict 12,932 0.098 0.297 0.000 1.000
External conflict 16,612 0.075 0.264 0.000 1.000
Corruption (10%) 16,369 3.887 2.495 0.027 9.294
Polity2 (Marshall) 11,796 0.459 7.306 -10.000 10.000
Polity2 stock (1%) 11,796 319.979 310.454 0.000 1,364.022
Polity2 stock (10%) 11,796 87.391 64.412 0.000 199.999
UDS (Pemstein) 8,802 0.013 0.979 -2.103 2.117
UDS stock (1%) 8,802 46.621 36.928 0.317 191.096
UDS stock (10%) 8,802 17.422 9.627 0.317 42.008
Contestation (Miller) 9,878 0.471 0.356 0.000 1.000
Contestation stock (1%) 9,878 13.923 14.373 0.000 63.604
Contestation stock (10%) 9,878 3.889 3.082 0.000 9.969
Inclusiveness (Miller) 9,916 0.519 0.264 0.000 1.000
Inclusiveness stock (1%) 9,916 13.947 11.353 0.000 51.412
Inclusiveness stock (10%) 9,916 4.255 2.363 0.000 8.846
Participation (V-Dem) 20,055 0.277 0.222 0.000 0.889
Participation stock (1%) 20,044 9.003 9.762 0.000 58.604
Participation stock (10%) 20,044 2.377 2.038 0.000 8.658
Deliberation (V-Dem) 16,301 0.422 0.308 0.010 0.992
Deliberation stock (1%) 16,296 13.481 13.287 0.010 67.184
Deliberation stock (10%) 16,296 3.607 2.780 0.010 9.904
Egalitarian (V-Dem) 16,485 0.440 0.273 0.030 0.990
Egalitarian stock (1%) 16,480 14.150 13.151 0.035 64.499
Egalitarian stock (10%) 16,480 3.794 2.632 0.035 9.865
Female power (V-Dem) 11,032 0.503 0.238 0.042 0.969
Female power stock (1%) 11,032 13.234 11.276 0.042 57.273
Female power stock (10%) 11,032 3.994 2.381 0.042 9.624
Civil society (V-Dem) 16,296 0.438 0.292 0.024 0.993
Civil society stock (1%) 16,285 14.204 13.184 0.024 66.112
Civil society stock (10%) 16,285 3.748 2.687 0.024 9.910

37
Individual liberty (V-Dem) 16,491 0.488 0.307 0.001 0.991
Individual liberty stock (1%) 16,480 16.748 14.647 0.013 66.749
Individual liberty stock (10%) 16,480 4.238 2.849 0.013 9.894
BMR (Boix) 10,577 0.362 0.481 0.000 1.000
BMR stock (1%) 10,577 10.153 16.010 0.000 65.883
BMR stock (10%) 10,577 2.965 3.909 0.000 10.000
BNR (Berhard) 7,984 0.382 0.486 0.000 1.000
BNR stock (1%) 7,984 7.218 11.120 0.000 45.284
BNR stock (10%) 7,984 2.854 3.764 0.000 9.982
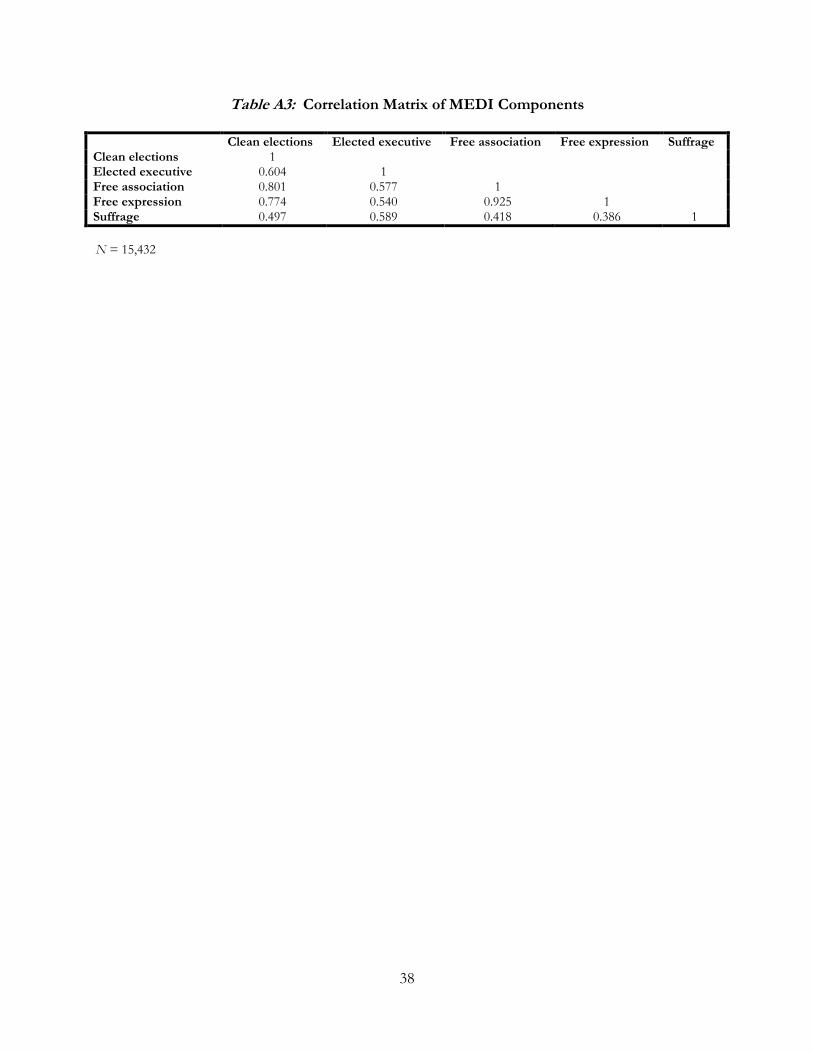
38
Table A3: Correlation Matrix of MEDI Components
Clean elections Elected executive Free association Free expression Suffrage Clean elections 1 Elected executive 0.604 1 Free association 0.801 0.577 1 Free expression 0.774 0.540 0.925 1 Suffrage 0.497 0.589 0.418 0.386 1
N = 15,432
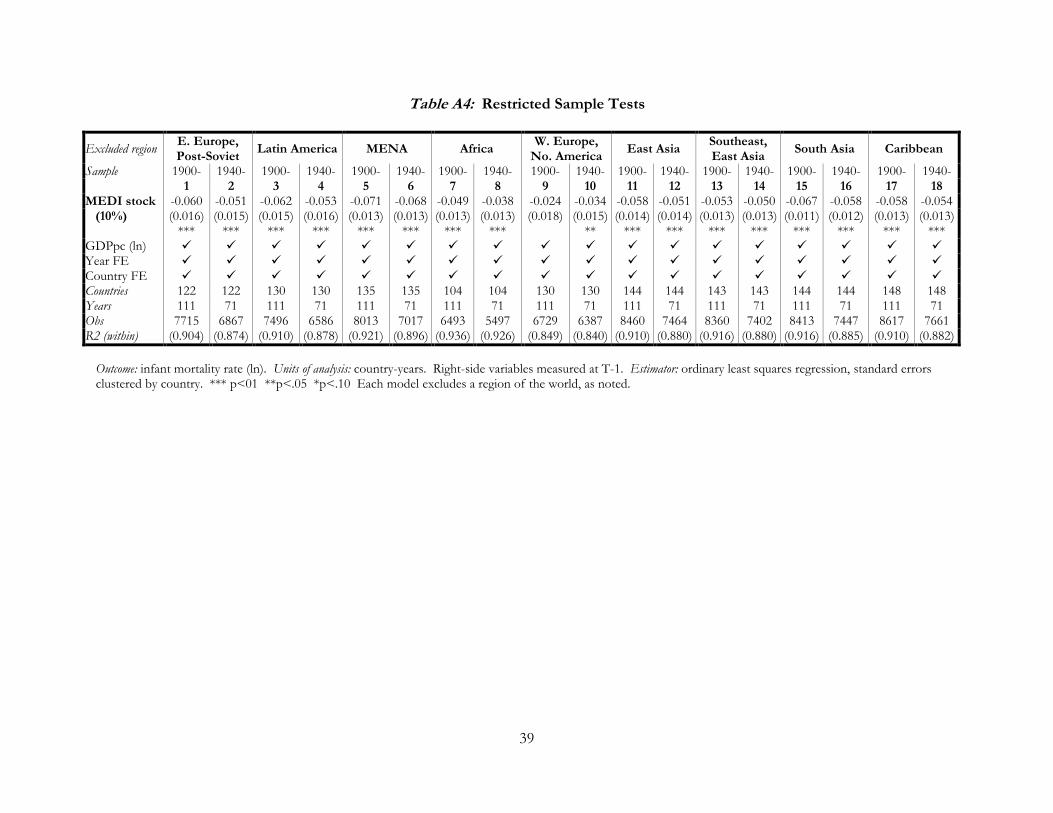
39
Table A4: Restricted Sample Tests
Excluded region E. Europe, Post-Soviet
Latin America MENA Africa W. Europe,
No. America East Asia
Southeast, East Asia
South Asia Caribbean
Sample 1900- 1940- 1900- 1940- 1900- 1940- 1900- 1940- 1900- 1940- 1900- 1940- 1900- 1940- 1900- 1940- 1900- 1940- 1 2 3 4 5 6 7 8 9 10 11 12 13 14 15 16 17 18
MEDI stock -0.060 -0.051 -0.062 -0.053 -0.071 -0.068 -0.049 -0.038 -0.024 -0.034 -0.058 -0.051 -0.053 -0.050 -0.067 -0.058 -0.058 -0.054 (10%) (0.016)
*** (0.015)
*** (0.015)
*** (0.016)
*** (0.013)
*** (0.013)
*** (0.013)
*** (0.013)
*** (0.018) (0.015)
** (0.014)
*** (0.014)
*** (0.013)
*** (0.013)
*** (0.011)
*** (0.012)
*** (0.013)
*** (0.013)
*** GDPpc (ln) Year FE Country FE Countries 122 122 130 130 135 135 104 104 130 130 144 144 143 143 144 144 148 148 Years 111 71 111 71 111 71 111 71 111 71 111 71 111 71 111 71 111 71 Obs 7715 6867 7496 6586 8013 7017 6493 5497 6729 6387 8460 7464 8360 7402 8413 7447 8617 7661 R2 (within) (0.904) (0.874) (0.910) (0.878) (0.921) (0.896) (0.936) (0.926) (0.849) (0.840) (0.910) (0.880) (0.916) (0.880) (0.916) (0.885) (0.910) (0.882)
Outcome: infant mortality rate (ln). Units of analysis: country-years. Right-side variables measured at T-1. Estimator: ordinary least squares regression, standard errors clustered by country. *** p<01 **p<.05 *p<.10 Each model excludes a region of the world, as noted.

40
Table A5: Tests of Functional Form
Outcome √𝑌 √𝑌 Y Y(ln)
Sample Full Full Full MEDI>0 Estimator OLS FD, RE Tobit OLS 1 2 3 4 MEDI stock (10%) -0.021*** -0.007*** -1.948*** -0.060*** (0.004) (0.002) (0.703) (0.012) GDPpc (ln) Year FE Country FE Countries 150 150 150 140 Years 111 110 111 111 Obs 8787 8626 8787 7410 R2 (within) (0.893) 0.132 0.107 (0.936)
Outcome (Y): infant mortality rate. Units of analysis: country-years. Right-side variables measured at T-1. Estimators: OLS (ordinary least squares), FD (first-difference), RE (random effects). Standard errors clustered by country. *** p<01 **p<.05 *p<.10

41
Table A6: Possible Non-linearities in MEDI stock
Outcome (Y) IMR IMR IMR IMR IMR IMR IMR IMR IMR(WDI) CMR LE
Estimator OLS OLS FD, RE OLS OLS OLS OLS Sys. GMM OLS OLS OLS
Sample Full Full Full Full Full Imputed Full 5-yr panel Full Full Full
1 2 3 4 5 6 7 8 9 10 11
MEDI stock 0.036 -0.005*** 0.003 0.041 0.057** -0.055*** -0.033*** 0.030 0.008 0.030** (10%) (0.025) (0.001) (0.007) (0.027) (0.022) (0.017) (0.009) (0.023) (0.025) (0.015) MEDI stock -0.013*** 0.001*** -0.006*** -0.016*** -0.013*** -0.014*** 0.004*** -0.012*** -0.009*** -0.007*** (10%)2 (0.003) (0.000) (0.001) (0.003) (0.003) (0.002) (0.001) (0.003) (0.003) (0.002) MEDI stock -0.009 (10%), T-30 (0.042) MEDI stock -0.003 (10%)2, T-30 (0.005) GDPpc (ln) -0.355*** -0.002 -0.062*** -0.315*** -0.453*** -0.425*** -0.075*** -0.296*** -0.350*** -0.166*** (0.063) (0.004) (0.015) (0.049) (0.030) (0.079) (0.024) (0.059) (0.077) (0.036) Urbanization 0.065 (0.258) Fertility (ln) 0.499*** (0.081) Growth 0.001* (0.001) Internal conflict 0.009 (0.026) External conflict 0.012 (0.028) Corruption (10%) 0.046*** (0.015) Y 0.981*** 0.937*** (0.004) (0.028) Y, T-2 -0.042 (0.092) Year FE Country FE Time trend Countries 150 150 150 165 106 203 130 150 150 151 150 Years 111 111 110 112 110 114 81 22 51 81 111 Obs 8787 8704 8626 9977 6314 17968 7081 1693 6176 7172 10029 R2 (within) (0.916) (0.996) 0.121 (0.899) (0.943) (0.853) (0.888) (0.858) (0.870) (0.900)
Outcomes (Y): IMR (infant mortality rate, logged), CMR (child mortality rate, logged), LE (life expectancy, reverse scale, logged). Units of analysis: country-years. Right-side variables measured at T-1 unless otherwise noted. Estimators: OLS (ordinary least squares), FD (first-difference), RE (random effects). Robust standard errors clustered by country. *** p<01 **p<.05 *p<.10

42
Table A7: Instrumental Variable Tests
Instruments WAVE Regional mean
WAVE Regional mean
WAVE Regional mean Global mean
WAVE Regional mean Global mean
1 2 3 4 5
MEDI -0.026*** (0.004) MEDI stock (10%) -0.008*** -0.005*** -0.003** -0.002*** (0.002) (0.001) (0.001) (0.001) GDPpc (ln) Regional avg. dep. var. Global avg. dep. var. Lagged dep. var. Year fixed effects Country fixed effects Countries 147 150 147 147 147 Years 111 111 111 111 111 Obs 8040 8673 8021 8021 8021 Sargan test p-value 0.016 0.000 0.000 Cragg-Donald Wald F-stat. 386 1388 1003 52740 37510
Two-stage least squares regression analyses with various instruments, as explained in the text. Second-stage results only (first-stage results available upon request). Outcome: infant mortality rate. Units of analysis: country-years. Right-side variables measured at T-1. *** p<01 **p<.05 *p<.10

43
Table A8: Possible Non-linearities in GDP
1 2 3
MEDI stock (10%) -0.059*** -0.040*** -0.040*** (0.013) (0.013) (0.012) GDPpc (ln) -0.388*** 1.063** 8.363** (0.067) (0.420) (3.745) GDPpc (ln)2 -0.090*** -0.999** (0.028) (0.463) GDPpc (ln)3 0.037* (0.019) Year FE Country FE Countries 150 150 150 Years 111 111 111 Obs 8787 8787 8787 R2 (within) (0.910) (0.917) (0.920)
Outcome: infant mortality rate (ln). Units of analysis: country-years. Right-side variables measured at T-1. Estimator: ordinary least squares. Standard errors clustered by country. *** p<01 **p<.05 *p<.10

44
Table A9: Horse-race Tests
Alternate Indices Polity2 UDS Contes -tation
Inclusive -ness
Partici -pation
Deliber -ation
Egalit -arian
Female power
Civil society
Individual liberty BMR BNR
(Marshall) (Pemstein) (Miller) (Miller) (V-Dem) (V-Dem) (V-Dem) (V-Dem) (V-Dem) (V-Dem) (Boix) (Bernhard) 1 2 3 4 5 6 7 8 9 10 11 12
MEDI stock -0.063*** -0.048*** -0.060*** -0.065*** -0.059*** -0.061*** -0.036** -0.050*** -0.061*** -0.049*** -0.057*** -0.038*** (10%) (0.012) (0.012) (0.012) (0.011) (0.015) (0.014) (0.014) (0.015) (0.015) (0.015) (0.012) (0.014) Alternate index 0.000 -0.001 0.000 0.009* 0.001 0.001 -0.024*** -0.010 0.001 -0.005 -0.001 -0.006* stock (1%) (0.000) (0.001) (0.004) (0.005) (0.006) (0.004) (0.009) (0.007) (0.005) (0.005) (0.003) (0.003) GDPpc (ln) Year FE Country FE Countries 148 148 146 146 150 150 150 149 150 150 145 148 Years 111 63 105 105 111 111 111 111 111 111 107 60 Obs (approx.) 8054 6773 7190 7201 8787 8787 8787 7645 8787 8787 7558 6337
Outcome: infant mortality rate (ln). Units of analysis: country-years. Right-side variables measured at T-1. Estimator: ordinary least squares. Standard errors clustered by country. *** p<01 **p<.05 *p<.10

45
APPENDIX B: Data Collection

46
The MEDI index is based on indicators drawn from the Varieties of Democracy (V-Dem) project, as are several of the other measures tested in Tables 1 and 2. It is important, therefore, to understand a bit about how the data was collected and aggregated across coders. (For further information see Coppedge et al. (2015) and Pemstein et al. (2015).)
Each indicator in the V-Dem dataset that is not factual in nature is coded by multiple Country Experts, generally about five (5). Most experts do not possess the requisite expertise to code the entire V-Dem questionnaire, which means that a single country will generally be coded by a dozen or more experts, each working on different facets of the questionnaire. To date, V-Dem has engaged in collaboration with over 2,500 Country Experts.
Recruitment
The following procedure is used to recruit Country Experts. First, we identify a list of potential coders for a country (typically 100-200 names per country). This bulk of names on the list are provided by Regional Managers (members of the V-Dem project located in universities and think-tanks throughout the world) in consultation with other members of the V-Dem team. Assistant Researchers (located at V-Dem Institute, University of Gothenburg) also contribute to this list, using information about potential country experts gathered from the web. Other members of the project team provide additional names if they have country-specific expertise. At present, V-Dem has accrued a roster of 15,000+ potential Country Experts.
For each potential Country Expert on the resulting list, we compile basic information – country of origin, current location, highest educational degree, current position, and area of expertise in terms of the surveys the expert could code as evidenced by a short biographical sketch and/or list of publications, website information and the like. We also take note of any possible biases that might affect their ability to code questions in a dispassionate manner.
In selecting whom to recruit from this list five criteria come into play: The most important selection criterion, naturally, is expertise in the country(ies) and the
section of the survey they are assigned to code. This is usually signified by an advanced degree in the social sciences, law, or history; a record of publications; and positions in civil society that establish their expertise in the chosen area (e.g. a well-known and respected journalist). Naturally, potential coders are drawn to areas of the survey that they are most familiar with, and are unlikely to agree to code topics they know little about. So, self-selection also works to achieve our primary goal of matching questions in the survey with country-specific expertise.
The second criterion is origin in the country to be coded. V-Dem’s goal is that a minimum of three out of five (60%) Country Experts should be nationals or permanent residents of the country they code (preferably both). Exceptions are required for a few countries where it is difficult to find in-country coders who are both qualified and independent of the governing regime. This criterion should help avoid potential Western/Northern biases in the coding.
The third criterion is the prospective coder’s seriousness of purpose. By this, we mean a person’s willingness to devote time to the project, to deliberate carefully over the questions asked in the survey, and to report their honest judgment. Sometimes, personal acquaintanceship is enough to convince a Regional Manager that a person is fit, or unfit, for the job. Sometimes, this feature becomes apparent in communications with Project Coordinators that precede the offer to work on V-Dem.
The fourth criterion is impartiality. V-Dem aims to recruit coders who will answer survey questions in an impartial manner. This means avoiding those who might be beholden to powerful actors – by reason of coercive threats or material incentives – or who serve as spokespersons for a political party or ideological tendency (in some instances, such as North Korea, this may entail avoiding all in-country coders). Where this is difficult, or where the reality is difficult to determine, we aim to include a variety of coders who, collectively, represent an

47
array of views and political perspectives on the country in question. The final criterion is obtaining diversity in professional background among the coders
chosen for a particular country. For certain areas (e.g the media, judiciary, and civil society surveys) this entails a mixture of highly recognized professionals from the sector along with academics who study these topics. Generally, it also means finding experts who are located at a variety of institutions, universities and research institutes.
After weighing these five criteria, the 100-200 potential experts on the list are given a rank from “1” to “3” indicating order of priority.
The two Project Coordinators at the V-Dem Institute, University of Gothenburg, then handle the enrolment of Country Experts from the list of potential country experts. In handling the recruitment, the continuously review the resulting mix of actual country experts in light of the five criteria to ensure that V-Dem ends up with a set of experts for each country that fulfill our standards.
If the quota of five Country Experts per section of the survey for each country is not met, we work down the list of potential Country Experts until the quota is obtained. Others, following the same procedure, replace those who fail to complete the survey in a reasonable time. Coders receive a modest honorarium for their work that is proportional to the number of surveys they have completed.
A number of steps are taken to assure informed consent and confidentiality among participants. The on-line survey provides full information about the project (including this document) and the use of the data, so that coders are fully informed. It also requires that prospective coders certify that they accept the terms of the agreement. They can access the surveys only with a randomized username that we assign and a secret password that they create themselves. The data they supply is stored on a firewall-protected server. Any data released to the public excludes information that might be used to identify coders. All personal identifying information is kept in a separate database in order to ensure the protected identities of coders.
In order to ensure that we are able to recruit widely among potential experts, and in order to minimize confusion due to unfamiliarity with English, questions are translated from English into five additional languages: Arabic, French, Portuguese, Russian, and Spanish. Approximately 15 percent of the experts code in a non-English version of the questionnaire.
About 35 percent of the Country Experts are women, and over 80 percent have PhDs or MAs and are affiliated with research institutions, think tanks, or similar organizations.
Coding
Coding is carried out using the V-Dem online survey tool. The web-based coding interfaces are directly connected with a postgres database where the original coder-level data is kept, maintaining coder confidentiality.
In addition to country-specific ratings, Country Experts are requested to code several additional countries that they are familiar with for a shorter time-slice. This «bridge» or «lateral» coding assures cross-country equivalence by forcing coders to make explicit comparisons across countries, and provides critical information for the measurement model (described below).
For each question, and for each country-year, experts are required to report a self-assessed level of certainty. This is an indicator of their subjective level of uncertainty for the data point they provide. This is scored on a scale from 0 to 100 with substantive anchor points for each 10-percent interval.
Measurement
Having discussed the process of data collection, we proceed to the task of measurement. Under this rubric, we include (a) the questionnaire, (b) our measurement model, (c) methods of

48
identifying error in measurement, (d) studies of measurement error, and (e) methods of correcting error. In principle, the discussions are relevant for different types of data (A, B, and C in the V-Dem scheme) but most if not all of them are much more acute when it comes to expert-based coding of evaluative, non-factual yet critical indicators. Hence, most of the following is focused on the C-type indicators.
The most important feature of a survey is the construction of the questionnaire itself. In crafting indicators we have sought to construct questions whose meaning is clear and specific and not open to a wide variety of interpretations. They should mean the same thing (more or less) in each context and not suffer from temporal or spatial non-equivalence. Our methodology involves enlisting some of the leading scholars in the world on different aspects of democracy and democratization – known as Project Managers.
Each Project Manager was enrolled because of his/her specific and evidenced expertise in a particular area (e.g. legislatures, executives, elections, civil society, and so on) and with a view to generate a group that also had substantive experiences and expertise on all regions of the world. Starting in 2009, Project Managers designed survey-questions in their area to measure democraticness in relation to the different traditions of democratic theory. All suggestions were reviewed and refined collectively over the course of two years. The V-Dem pilot test carried out in 2011 served as an initial test of our questionnaire, prompting quite a few revisions in the next round of surveys. Another round of collective deliberation followed that also involved a number of consultations with scholars outside of the project team. The revised questions for C-coding thus went through several rounds of review with the Project Managers and outside experts over the course of two years before emerging in their final form, depicted in the Codebook.
Even with careful question design, a project of this nature cannot help but encounter error. This may be the product of linguistic misunderstandings (recall that most of our coders do not speak English as their first language and some take the survey in a translated form), misunderstandings about the way in which a question applies to a particular context, factual errors, errors due to the scarcity or ambiguity of the historical record, differing interpretations about the reality of a situation, variation in standards, coder inattention, errors introduced by the coder interface or the handling of data once it has been entered into the database, or random mistakes.
Some of these errors are stochastic in the sense of affecting the precision of our estimates but not their validity. Other errors are systematic, potentially introducing bias into the estimates that we produce.
Having five coders for each question is immensely useful, as it allows us to identify wayward coders as well as to conduct inter-coder reliability tests. These sorts of tests – standard in most social science studies – are rarely if ever employed in extant democracy indices.
While we select experts carefully, they clearly exhibit varying levels of reliability and bias, and may not interpret questions consistently. In such circumstances, the literature recommends that researchers use measurement models to aggregate diverse measures where possible, incorporating information characterized by a wide variety of perspectives, biases, and levels of reliability (Bollen & Paxton 2000, Clinton & Lapinski 2006, Clinton & Lewis 2008, Jackman 2004, Treier & Jackman 2008, Pemstein, Meserve & Melton 2010). To combine expert ratings for a particular country/indicator/year to generate a single “best estimate” for each question, we employ methods inspired by the psychometric and educational testing literature (see e.g. Lord & Novick 1968, Jonson & Albert 1999, Junker 1999, Patz & Junker 1999).
The underpinnings of these measurement models are straightforward: they use patterns of cross-rater (dis)agreement to estimate variations in reliability and systematic bias. In turn, these techniques make use of the bias and reliability estimates to adjust estimates of the latent—that is, only indirectly observed—concept (e.g. executive respect for the constitution, judicial independence, or property rights) in question. These statistical tools allow us to leverage our multi-coder approach to both identify and correct for measurement error, and to quantify

49
confidence in the reliability of our estimates. Variation in these confidence estimates reflect situations where experts disagree, or where little information is available because few raters have coded a case. These confidence estimates are tremendously useful. Indeed, the tendency of most researchers to treat the quality of measures of complex, unobservable concepts as equal across space and time, ignoring dramatic differences in ease of access and measurement across cases, is fundamentally misguided, and constitutes a key threat to inference.
The majority of expert-coded questions are ordinal: they require raters to rank cases on a discrete scale, generally with four or five response categories. To achieve scale consistency, we fit ordinal IRT models to each question (see Johnson & Albert 1999 for a technical description of these models). These models achieve three goals. First, they work by treating coders’ ordinal ratings as imperfect reflections of interval-level latent concepts. Therefore, while an IRT model takes ordinal values as input, its output is an interval-level estimate of the given latent trait (e.g. election violence). Interval-valued estimates are valuable for a variety of reasons; in particular, they are especially amenable to statistical analysis. Second, IRT models allow for the possibility that coders have different thresholds for their ratings (e.g. one coder’s somewhat might fall above another coder’s almost on the latent scale), estimate those thresholds from patterns in the data, and adjust latent trait estimates accordingly. Therefore, they allow us to correct for this potentially serious source of bias. This is very important in a multi-rater project like V-Dem, where coders from different geographic or cultural backgrounds may apply differing standards to their ratings. Finally, IRT models assume that coder reliability varies, produce estimates of rater precision, and use these estimates—in combination with the amount of available data and the extent to which coders agree—to quantify confidence in reported scores. With lateral and bridge coding we are able to mitigate the incomparability of coders’ thresholds and the problem of cross-national estimates’ calibration. While helpful in this regard, our tests indicate that given the sparsity of our data, even this extensive bridge-coding is not sufficient in solving cross-national comparability issues. We therefore also employ a data-collapsing procedure. At its core, this procedure relies on the assumption that as long as none of the experts change their ratings for a given time period, we can treat the country-years in this period as one year. The results of our statistical models indicate that this technique is extremely helpful in increasing the weight given to lateral/bridge coders, and thus further mitigates cross-national comparability problems.

50
APPENDIX REFERENCES
Aboubarb, M.R., A.L. Kimball. 2007. “A New Dataset on Infant Mortality Rates, 1816-2002.” Journal of Peace Research, 44: 743.
Bernhard, Michael, Timothy Nordstrom, Christopher Reenock. 2001. “Economic Performance, Institutional Intermediation, and Democratic Survival.” Journal of Politics 63: 775–803.
Boix, Carles, Michael K. Miller, Sebastian Rosato. 2013. “A Complete Data Set of Political Regimes, 1800-2007.” Comparative Political Studies 46:12, 1523-54.
Bollen, Kenneth A., Pamela Paxton. 2000. “Subjective Measures of Liberal Democracy.” Comparative Political Studies 33(1): 58–86.
Brecke, Peter. 2001. “The Long-Term Patterns of Violent Conflict in Different Regions of the World.” Paper presented at the Uppsala Conflict Data Conference, Uppsala, Sweden.
Clinton, J. D., David Lewis. 2007. “Expert Opinion, Agency Characteristics, and Agency Preferences.” Political Analysis 16(1): 3–20.
Clinton, J. D., J.S. Lapinski. 2006. “Measuring Legislative Accomplishment, 1877-1994.” American Journal of Political Science 50(1): 232–249.
Gapminder. Accessed 2015. http://www.gapminder.org/data/
Human Life-Table Database: Methodology note http://www.lifetable.de/methodology.pdf
Human Mortality Database. 2008. The Human Mortality Database. Berkeley: University of California and Rostock: Max Planck Institute for Demographic Research. Available at www.mortality.org or www.humanmortality.de
Jackman, Simon. 2004. “What Do We Learn from Graduate Admissions Committees? A Multiple Rater, Latent Variable Model, with Incomplete Discrete and Continuous Indicators.” Political Analysis 12 (4): 400–424.
Johnson, Valen E,; James H Albert. 1999. Ordinal Data Modeling. New York: Springer.
Junker, B. 1999. “Some Statistical Models and Computational Methods that may be Useful for Cognitively-Relevant Assessment.” Carnegie Mellon University.
Lord, F. M. and Novick, M. R. 1968. Statistical Theories of Mental Test Scores. Reading, MA: Addison-Wesley.
Miller, Michael K. 2015. “Democratic Pieces: Autocratic Elections and Democratic Development since 1815.” British Journal of Political Science 45:3, 501-30.
Mitchell, BR. 1998a. International Historical Statistics. Africa, Asia & Oceania 1750-1993. Third edition. Basingstoke: Macmillan.
Mitchell, BR. 1998b. International Historical Statistics. The Americas 1750-1993. Fourth edition. Basingstoke: Macmillan.
Mitchell, BR. 1998c. International Historical Statistics. Europe 1750-1993. Fourth edition. Basingstoke: Macmillan.
Montevideo-Oxford Latin America Economic History Database. Available at: http://moxlad.fcs.edu.uy/
Patz, Richard J., and Brian W. Junker. 1999. “A Straightforward Approach to Markov Chain Monte Carlo Methods for Item Response Models.” Journal of Educational and Behavioral Statistics 24: 146-178.
Pemstein, Daniel, Stephen A. Meserve, James Melton. 2010. “Democratic Compromise: A Latent Variable Analysis of Ten Measures of Regime Type.” Political Analysis 18:4, 426-449
Riley, James C. 2005a. “Estimates of Regional and Global Life Expectancy, 1800–2001”.

51
Population and development review 31:3, 537–543.
Riley, James C. 2005b. “The Timing and Pace of Health Transitions around the World.” Population and development review 31:4, 741–764.
Treier, Shawn, and Simon Jackman. 2008. “Democracy as a Latent Variable.” American Journal of Political Science 52(1): 201–17.
UNICEF. 2005. Multiple Indicator Cluster Survey (MICS). New York: UNICEF. Available at: www.childinfo.org
United Nations Population Division. 2010. World Population Prospects: The 2008 Revision. Life expectancy at birth, both sexes, estimates 1950-2009. New York: United Nations. Available at: http://esa.un.org/unpp/
World Bank. 2013. World Development Indicators 2013. Washington, DC: World Bank.