electoral division profiles 2008 - dorset · pdf file... white british 97.3 96.6 96.8...
TRANSCRIPT
PAGE 1
PO
PU
LATI
ON
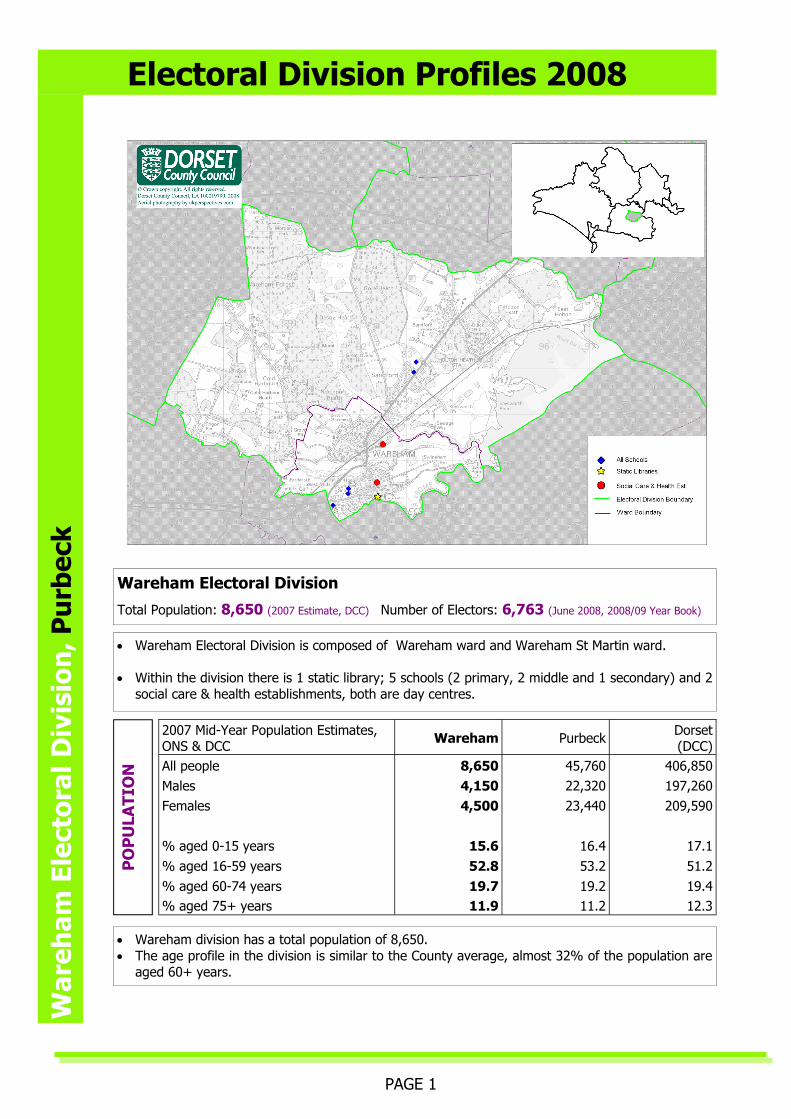
• Wareham Electoral Division is composed of Wareham ward and Wareham St Martin ward. • Within the division there is 1 static library; 5 schools (2 primary, 2 middle and 1 secondary) and 2
social care & health establishments, both are day centres.
Wareham Electoral Division
Total Population: 8,650 (2007 Estimate, DCC) Number of Electors: 6,763 (June 2008, 2008/09 Year Book)
2007 Mid-Year Population Estimates, ONS & DCC Wareham Purbeck Dorset
(DCC) All people 8,650 45,760 406,850 Males 4,150 22,320 197,260 Females 4,500 23,440 209,590 % aged 0-15 years 15.6 16.4 17.1 % aged 16-59 years 52.8 53.2 51.2 % aged 60-74 years 19.7 19.2 19.4 % aged 75+ years 11.9 11.2 12.3
• Wareham division has a total population of 8,650. • The age profile in the division is similar to the County average, almost 32% of the population are
aged 60+ years.
Electoral Division Profiles 2008 W
areh
am E
lect
oral
Div
isio
n, P
urb
eck

PAGE 2
ETH
NIC
ITY
& C
OU
NTR
Y O
F B
IRTH
H
OU
SEH
OLD
S H
EALT
H &
CA
RE
• 97.3% of the population are white British, slightly higher than the County average (96.8%).
• Wareham division has a relatively low proportion of both vacant properties and second/holiday homes, overall 96.5% of dwellings have permanent residents.
• The majority of households (73.6%) are owner occupied. • The level of car ownership is similar to the County average, almost 18% of households do not
have a car.
• Overall the health of those who live in Wareham division is similar to the County average. • 19.2% of the population have a long term illness or disability and 9% described their health as
not good. • Just over one in ten people in the division are providing unpaid care to a relative or friend. • Wareham has a very small number who are resident in a communal establishment, 0.1% of the
total population.
Census, 2001 Wareham Electoral Division
Purbeck Dorset (DCC)
Ethnicity: white British 97.3 96.6 96.8
Ethnicity: BME 2.7 3.4 3.2 % born in England 91.7 90.8 91.2
% born in rest of UK 3.8 3.8 3.9
% born Republic of Ireland 0.4 0.5 0.5
% born in other EU countries 1.8 1.9 1.4
% born elsewhere 2.3 3.1 2.9
Census, 2001 Wareham Electoral Division
Purbeck Dorset (DCC)
All dwellings/household spaces 3,789 20,625 178,065
% vacant properties 2.3 3.4 2.9
% second homes 1.2 5.4 2.8 No. of household spaces with residents 3,658 18,804 167,998
% owner occupied 73.6 73.4 76.3
% rented (public) council/housing association 13.9 11.8 12.1
% rented privately & other 12.5 14.8 11.6
% with no car 17.8 15.6 17.0
% with two or more cars/vans 34.2 37.6 36.7
% households composed of pensioners 33.4 31.4 33.4
% households composed of married couples 37.6 39.3 37.7
% households composed of co-habiting couples 6.3 6.9 7.0
% households composed of lone-parents 6.5 7.1 6.8
% households composed of other 16.2 15.3 15.1
Average household size 2.34 2.32 2.26
Census, 2001 Wareham Electoral Division
Purbeck Dorset (DCC)
% of people with a Limiting Long-term Illness (LLTI)/disability 19.2 18.6 19.2
% of people in good health 67.8 68.3 68.1
% of people in not good health 9.0 8.2 8.4
% of people providing unpaid care 10.2 10.9 10.8
% of people resident in a communal establishment 0.1 1.5 2.5
War
eham
Ele
ctor
al D
ivis
ion
, Pu
rbec
k

PAGE 3
EMP
LOY
MEN
T &
QU
ALI
FIC
ATI
ON
S
Index of Deprivation 2007, CLG.
ACORN socio-economic classifications, 2007, CACI.
• IMD stands for the Index of Multiple Deprivation. • All super output areas in England are ranked from 1 for
the most deprived to 32,482 for the least deprived. • Wareham Town is the most deprived area in the division • Apart from Wareham Town all other parts of the
Wareham division are in the 50% least deprived areas in England.
• ACORN classifications use a range of Census data and market research data to give an indication of the most probable socio-economic conditions of residents.
• In Wareham division the majority of households are classified as comfortably off (41.3%), higher than the County average.
• Almost 32% of households are classified as either hard pressed or of moderate means, higher than the County figure (18.5%) and just below the national average (37%).
• Almost 60% of those who are economically active are employed full time and a further 22% are employed part time.
• Unemployment in the division is lower than average. 2.6% of the economically active population are unemployed compared with 3.1% across Dorset.
• Over 29% of 16-74 year olds in the division have no qualifications, higher than the County average of 26.2%.
• Overall those in employment have lower skill occupations than average. 34% have a high skill occupation compared with almost 40% across Dorset, whilst over 23% have a low skill occupation, the Dorset figure is 18.3%.
Census, 2001 Wareham Electoral Division
Purbeck Dorset (DCC)
All people aged 16-74 years 6,129 31,637 275,193
All people aged 16-74 years economically active 4,070 21,001 178,519
% employed: part time 21.8 21.4 20.9
% employed: full time 59.3 55.4 55.3
% self-employed 12.9 17.2 17.6
% unemployed 2.6 2.9 3.1
% students 3.4 3.1 3.1
All people aged 16-74 years economically inactive 2,059 10,636 96,674
% retired 58.3 55.2 56.1
% student 6.1 8.8 7.9
% looking after family / home 16.9 18.3 17.5
% permanently sick / disabled 12.1 11.2 11.4
% other 6.7 6.5 7.1
% of 16-74 year olds with no qualifications 29.2 27.4 26.2
% of 16-74 year olds with higher level qualifications 16.5 17.6 18.3 All people aged 16-74 years in employment 3,959 20,333 172,441
% in high skill occupations 34.3 37.7 39.7
% in intermediate skill occupations 42.6 41.6 41.6
% in low skill occupations 23.1 20.7 18.7
Electoral Division Profiles 2008
Super output area IMD
Sandford North & Holton Heath 20,616
Sandford South 22,485
Wareham Town 14,744
Wareham Worgret 19,288
Wareham Northmoor Park 24,229
Wareham Northport 19,171
Wareham ED
DCC average
UK average
% Wealthy Achievers 26.6 43.7 26.6
% Urban Prosperity 0.4 3.3 10.7
% Comfortably Off 41.3 34.5 26.6
% Moderate Means 16.4 9.3 14.5
% Hard Pressed 15.3 9.2 22.4

PAGE 4
Produced by the Research & Information Group, Dorset County Council, County Hall, Dorchester, DT1 1XJ Tel. 01305 224354.
Source: Council Tax Charges 2008/09, highest and lowest parishes in division
*Source: Dorset Police & 2007 mid-year population estimate. **Crime in England & Wales 2007/08, Home Office
Firms
Employment
Area Employees in employment
% employed in the service sector
Wareham ED 4,500 67.0% DCC Dorset 147,600 80.0%
Great Britain 26,320,600 83.0%
Note: Excludes self-employed
Source: Annual Business Inquiry 2006, ONS
Source: Claimant Count, Jan-Dec 2007, ONS
Electoral Division Profiles 2008 W
areh
am E
lect
oral
Div
isio
n, P
urb
eck
Average House Prices
Source: HM Land Registry, based on sales April-June 2008
Council Tax Crime Rates
Earnings—average weekly earnings of full time employees
Source: Annual Survey of Hours and Earnings 2007, ONS
Postcode district Detached Sales Semi-Det Sales Terraced Sales Flat/Mais Sales Overall
Average Total
Wareham ED BH20 £321,695 25 £231,999 13 £221,956 14 £166,213 7 £259,818 59
BH16 £305,677 22 £206,492 7 £176,333 6 £131,100 5 £247,096 40
£314,197 47 £223,072 20 £208,269 20 £151,583 12 £254,678 99
Dorset £359,666 531 £237,966 264 £209,024 297 £168,079 266 £265,534 1,358 England & Wales £338,378 35,527 £196,539 48,858 £174,332 56,477 £204,003 38,279 £219,262 179,141
average
Workplace based
Residence based
DCC Dorset £400.30 £415.40 Christchurch £429.90 £373.80
East Dorset £424.20 £446.60
North Dorset £385.40 £402.20
Purbeck £450.30 £443.60
West Dorset £392.60 £425.50 Weymouth & Portland £337.20 £383.40
Area Rate of total crime per 1,000 population
Wareham ED* 57.9 Dorset County Council* 56.0
South West Region** 77.6
England & Wales** 90.9
lowest: Wareham St. Martin
highest: Wareham Town
Band A £996.47 £1,007.31
Band B £1,162.55 £1,175.19
Band C £1,328.62 £1,343.08
Band D £1,494.70 £1,510.96
Band E £1,826.85 £1,846.73
Band F £2,159.01 £2,182.49
Band G £2,491.17 £2,518.27
Band H £2,989.40 £3,021.92
Area Male Female Total % of claimants long term unemployed number rate number rate number rate
Wareham ED 20 0.8 8 0.3 28 0.6 13.9 DCC Dorset 1,419 1.2 585 0.6 2,004 0.9 8.2 Great Britain 617,150 3.2 231,404 1.3 848,554 2.3 16.3
Source: Annual Business Inquiry 2006, ONS
Unemployment
Number of firms
% employing 1-10 people
(micro firms)
Wareham ED 480 84%
Note: Excludes the self-employed
Warning: This dataset excludes farm based agriculture data