electric machine design toolkit -...
TRANSCRIPT

© 2012 ANSYS, Inc. June 19, 2013 1
Electric Machine Design Toolkit Efficiency and Loss Maps for IPM Motors
Emad Dlala, Mark Solveson, and Zed Tang, ANSYS, Inc.
Raymond Ong, Magna Electronics

© 2012 ANSYS, Inc. June 19, 2013 2
User Defined Outputs of Electric Machines
Average & RMS Solutions
Transient D-Q Solutions
Solutions for Special Machines
Design Toolkits of Electric Machines
Torque-Speed Curve
Efficiency Map
Comparison of Efficiency Map with Measurements
Magna IPM Motor
Reduction of Magnet Size Application
Outline

© 2012 ANSYS, Inc. June 19, 2013 3
Motivation
Reduce weight, size, cost
Reduce magnet size
Improve efficiency
Reduce torque ripple
0.00 0.50 1.00 1.50 2.00 2.50 3.00 3.50 4.00Time [ms]
0.00
10.00
20.00
30.00
40.00
50.00
60.00
70.00
Mo
vin
g1
.To
rqu
e [N
ew
ton
Me
ter]
Design_BH_right_1_Current_Gamma_Sweep1XY Plot 2Curve Info
Moving1.TorqueSetup1 : Transient
© 2012 ANSYS, Inc. June 19, 2013 4
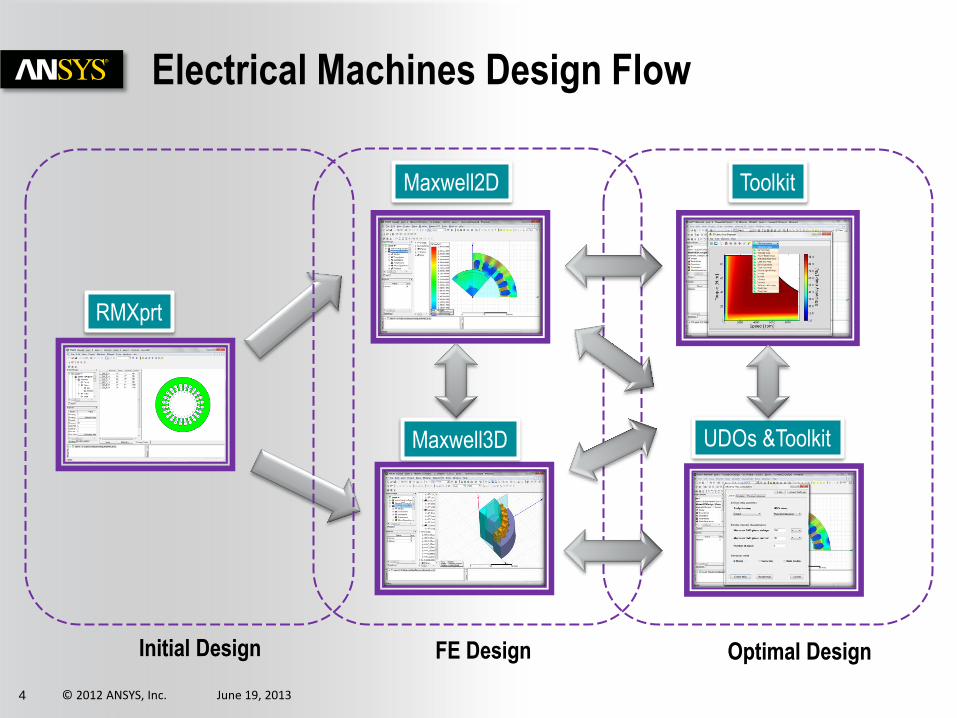
Electrical Machines Design Flow
RMXprt
Maxwell2D
Maxwell3D
Toolkit
UDOs &Toolkit
Initial Design FE Design Optimal Design

© 2012 ANSYS, Inc. June 19, 2013 5
User Defined Outputs (UDOs)

© 2012 ANSYS, Inc. June 19, 2013 6
D-Q Solution Calculation Method (1/3)
Phase diagram
d-axis
q-a
xis
E
Vq
Vs
Is
-Id -Vd
Iq
we Lq Iq
-we Ld Id
g
d
j
Ypm
Phasor diagram illustrating the operation of a PM machine based on the D-Q axis theory where 𝛿 is the torque angle, 𝜑 is the power factor angle, 𝐸 is the induced voltage, 𝜔𝑒 is the operating fundamental frequency
𝐼𝑠 = 𝐼𝑑2 + 𝐼𝑞
2 ≤ 𝐼max
𝑉𝑠 = 𝑉𝑑2 + 𝑉𝑞
2 ≤ 𝑉max

© 2012 ANSYS, Inc. June 19, 2013 7
-
--
-
-
3
2sin
3
2cos
3
2sin
3
2cos
sincos
3
2C
CLCL ABC
T
QD **
θ = 0[deg]
C
B
A
T
q
d
i
i
i
Ci
i
CCCBCA
BCBBBA
ACABAA
ABC
LLL
LLL
LLL
L
w
v
u
T
q
dC
where is in electrical degrees
D-Q Solution Calculation Method (2/3)

© 2012 ANSYS, Inc. June 19, 2013 8
D-Q Solution Results
-200
0
200
-300
-200
-100
0
100
200
300-400
-200
0
200
400
Id [A]I
q [A]
To
rque [
N.m
]
-300
-200
-100
0
100
200
300
-300
-200
-100
0
100
200
300-0.4
-0.2
0
0.2
Id [A]I
q [A]
Flu
xL
inag
e(q
-axis
) [W
b]
-300
-200
-100
0
100
200
300
-300
-200
-100
0
100
200
300-0.4
-0.2
0
0.2
Id [A]I
q [A]
Flu
xL
inag
e(d
-axis
) [W
b]

© 2012 ANSYS, Inc. June 19, 2013 9
D-Q ECE Model vs. Finite-Element Analysis
dqqd IIpT -2
3
The validation shows that the ECE model of DQ solution is accurate
0 100 200 300 400-300
-200
-100
0
100
200
300
Current angle [degree]
To
rque [
N.m
]
FEA
DQ-solution
0 100 200 300 40020
40
60
80
100
120
Current angle [degree]
Vo
ltag
e [V
]
FEA
DQ-solution
qeqsq
dedsd
IRv
IRv
w
w
22
qds vvV

© 2012 ANSYS, Inc. June 19, 2013 10
Electric Machines Design Toolkit

© 2012 ANSYS, Inc. June 19, 2013 11
• Maximum-Torque Per Ampere unit (MTPA) control strategy applied
Efficiency Mapping: Method of Computation
• At a given operating condition, the trajectory of the current is crucial for the
optimal efficiency operation of PM machines • By varying the input voltage, there can be an infinite number of Id and Iq
combinations that can produce the required torque at a given speed
• MTPA strategy is applied. The scheme results in minimizing the stator current and thus maximizing the efficiency below base speed assuming that the winding loss is dominant
• In flux-weakening region, output power is maximized & apparent power is minimized to improve power factor

© 2012 ANSYS, Inc. June 19, 2013 12
• Time-domain (2D or 3D) FEA is used with current source
• Simulate a parametric sweep of transient simulations for different current magnitudes and angles, g, at a constant speed.
• Apply the MTPA algorithm using multi-objective optimization to calculate the operation points (Id and Iq) for the torque-speed range
• Run the final time-stepping simulations at the operating speed range using the calculated operation points found by the MTPA
• Compute the efficiency from the output power and total losses
Efficiency Mapping: Method of Computation
Tlossshaft
shaft
PP
P
shaft
Tlossshaft
P
PP -
Motor Generator
TlossP = Copper Loss + Core Loss + Magnet Loss + Mechanical Loss

© 2012 ANSYS, Inc. June 19, 2013 13
End –Winding Inductance
The toolkit also considers the effect of end winding inductance manifested in the torque speed curve
dt
td
dt
tdiLtiRtv es
)()()()(
2D approach 3D approach
Base speed

© 2012 ANSYS, Inc. June 19, 2013 14
• Script integrates vital effects on loss & efficiency mapping:
Efficiency Map Computations
AC Resistance of Stator Windings
Effect of Temperature

© 2012 ANSYS, Inc. June 19, 2013 15
Effect of Rotor Segmented Skewing
Skewing influences the torque and back emf voltage
0.00 12.50 25.00 37.50 50.00 62.50 75.00 87.50Gamma_TSC [deg]
-12.50
7.50
27.50
47.50
67.50
87.50
100.00
Y1
[N
ew
ton
Me
ter]
Design_BH_right_Current_Gamma_Sweep1Torque vs Gamma
Skewed
No skew

© 2012 ANSYS, Inc. June 19, 2013 16
Skewing Effect – Maxwell2D
Skewing angle
Segment
Skewing angle
Segment
Single-sided staircase
Double-sided staircase

© 2012 ANSYS, Inc. June 19, 2013 17
Skewing Effect – Maxwell2D
Example double-sided staircase:
Skew angle = 3.75 Poles = 8 Segments = 4
-20 0 20 40 60 80 100 120-0.6
-0.4
-0.2
0
0.2
0.4
0.6
0.8
1
Gamma
To
rque
Center
Positive
Negative
Skew angle (electrical) = 3.75*8/2 = 15 degrees
0 10 20 30 40 50 60 70 80 900
0.2
0.4
0.6
0.8
1
Gamma
To
rqu
e
Unskewed
Skewed

© 2012 ANSYS, Inc. June 19, 2013 18
Frequency-Dependent Core Loss Coefficients Kh, Kc, Ke
𝑝 = 𝐾ℎ 𝑓 𝐵2𝑓 + 𝐾𝑐 𝑓 (𝐵 𝑓)2+𝐾𝑒 𝑓 (𝐵 𝑓)1.5

© 2012 ANSYS, Inc. June 19, 2013 19
• Script offers an intuitive UI to display:
Efficiency Map Displayer: List of Maps

© 2012 ANSYS, Inc. June 19, 2013 20
Script Compresses Simulation Data in txt Files

© 2012 ANSYS, Inc. June 19, 2013 21
• 2D Prius Motor:
2D Simulations of Efficiency Map

© 2012 ANSYS, Inc. June 19, 2013 22
• 3D Prius Motor:
3D Simulations of Efficiency Map

© 2012 ANSYS, Inc. June 19, 2013 23
• Motor specifications:
Imax = 300 A (peak value)
Vdc = 200 V
Rdc = 8 mohm @ 20 C (per-phase stator resistance)
Le = 30 uH (per-phase end-turn inductance)
P = 8
Max. speed = 9000 rpm
Magna Electronics IPM Motor – Test Case

© 2012 ANSYS, Inc. June 19, 2013 24
Experimental vs. Simulation
Experimental 2D Simulation

© 2012 ANSYS, Inc. June 19, 2013 25
Magna Electronics IPM Motor – MTPA Simulation Results
0 1000 2000 3000 4000 5000 6000 7000 8000 90000
50
100
150
200
250
300
Speed, rpm
sta
tor
cu
rren
t , A
Each line represents a constant torque level

© 2012 ANSYS, Inc. June 19, 2013 26
Magna Electronics IPM Motor - Simulation
Torque Ripple
Current Voltage
Power Factor

© 2012 ANSYS, Inc. June 19, 2013 27
Magna Electronics IPM Motor - Simulation Total loss
Copper loss
Core loss
Magnet loss

© 2012 ANSYS, Inc. June 19, 2013 28
Magna Electronics IPM Motor - Simulation Id
Saliency Ratio d
Ld

© 2012 ANSYS, Inc. June 19, 2013 29
Investigation on Magnet Size Reduction
Our goal is to reduce
magnet size by 20%
V-angle is varied in
parametric analysis to
maintain the
maximum torque
Same current and
voltage
Original Design
V-angle
Magnet
Length
Modified Design

© 2012 ANSYS, Inc. June 19, 2013 30
Investigation on Magnet Size Reduction
FEA results of 𝐿𝑑 and 𝐿𝑞 of the original and modified designs.
𝑇𝑒 =3
2𝑝 ψ𝑃𝑀𝐼𝑞 − 𝐿𝑞 − 𝐿𝑑 𝐼𝑑𝐼𝑞
The increase in the saliency of the modified design is illustrated by the slight increase of 𝐿𝑞, and the
decrease of 𝐿𝑑 which is due to the magnet reduction.

© 2012 ANSYS, Inc. June 19, 2013 31
Investigation on Magnet Size Reduction – Efficiency
• Percentage difference
of efficiency between
the original and
modified designs
• The positive scale
means that an increase
of the efficiency is
gained in the modified
design.

© 2012 ANSYS, Inc. June 19, 2013 32
Investigation on Magnet Size Reduction - Harmonics
Instantaneous flux densities at a point in a tooth tip of the stator simulated at 𝐼𝑑 = −42 A, 𝐼𝑞 = 56 A, 𝑆𝑝𝑒𝑒𝑑 = 8500 rpm. Higher harmonics cause an increase in
losses with an increase of speed.

© 2012 ANSYS, Inc. June 19, 2013 33
Investigation on Magnet Size Reduction – Torque Ripple
• Absolute difference in the torque ripple in N∙m between the modified & original designs.

© 2012 ANSYS, Inc. June 19, 2013 34
• Simulations run on Distributed Solve Option (DSO):
Speed-up Improvements
0 20 40 60 80 1000
20
40
60
80
100
Number of cores
Sp
eed-u
p f
acto
r
Total CPU time ~3 hours on a laptop with 6 cores

© 2012 ANSYS, Inc. June 19, 2013 35
Summary • User Defined Outputs and Toolkit Scripts were created by ANSYS for
computing Torque Speed Curve as well as Efficiency and Loss Maps • Script is generic, fully automated, extendable, efficient and robust • Method integrates most vital effects on losses such as end-turn inductance,
ac resistance, skewing, and frequency-dependent core loss coefficients • Optimal operation points are calculated by the toolkit for the whole torque
and speed range • Efficiency map simulations for a Magna Interior PM Motor with
experimental comparison showed that the method is accurate • An investigation of reducing the permanent magnet size where 20% of
magnet size reduction was achieved while maintaining the desired efficiency over the operating range

© 2012 ANSYS, Inc. June 19, 2013 36
Click to edit Master text styles
Coming Soon: User Defined Core Loss
Solve Time Step
Solver
Read User.Ctl
Call
Solution.ctl
A, B, J, w
Last Time Step
MyCoreLoss.exe
CoreLoss.txt Hysteresis.txt Excess.txt Eddy.txt

© 2012 ANSYS, Inc. June 19, 2013 37
Click to edit Master text styles
User Defined Core Loss

© 2012 ANSYS, Inc. June 19, 2013 38
Click to edit Master text styles
User Defined Core Loss

© 2012 ANSYS, Inc. June 19, 2013 39
Click to edit Master text styles
User Defined Core Loss
0 0.01 0.02 0.03 0.04 0.05 0.06 0.07 0.080
2
4
6
8
10
12
14
16
18
time, s
Co
re l
oss
, W
User Defined
Maxwell

© 2012 ANSYS, Inc. June 19, 2013 40
Click to edit Master text styles
Separation of Core Loss
0 0.01 0.02 0.03 0.04 0.05 0.06 0.07 0.080
2
4
6
8
10
12
14
16
18
time, s
Co
re l
oss
, W
Total loss
Hysteresis loss
Eddy loss
Excess loss