electric metals green book - byron capital markets (april 2010)
TRANSCRIPT

Ele
ctr
ic M
eta
ls |
Gr
ee
n B
oo
k |
Ap
ril 2
01
0
G r e e n B o o k | A p r i l 2 0 1 0
ELECTRIC METALS
4 King Street West, Suite 1100 | Toronto, Ontario | M5H 1B6
t:647 426 1660 | f:647 426 1661 | byroncapitalmarkets.com
Company Directory
Executive
Campbell Becher, President 647-426-1657 [email protected]
Corporate Finance
Cliff Rich, Managing Director – Vancouver 604-805-3606
Robert Orviss, Managing Director – Toronto 647-426-1668 [email protected]
Alex Watson, Associate – Vancouver 604-616-0190
John Rak, Associate 647-426-1663 [email protected]
Russell Mills, Associate647-426-0290 [email protected]
Yeganeh Pakdaman, [email protected]
Research
Guy Gordon, Head – Research, Oil & Gas Analyst647-426-1672 [email protected]
Jon Hykawy, Ph.D., Clean Technologies & Materials Analyst647-426-1656 [email protected]
Drew Clark, Mining Analyst 647-426-1673 [email protected]
Al P. Nagaraj, Special Situations Analyst 647-426-0291 [email protected]
Arun Thomas, Associate 647-426-1674 [email protected]
Gabriela Casasnovas, Associate647-426-0287 [email protected]
Sales & Trading
Main Trading Line 647-426-1670
Cyrus Osena, Head – Institutional Sales 647-426-1675 [email protected]
David Kemp, Head – Institutional Trading 647-426-1666 [email protected]
Kariv Oretsky, Institutional Sales 647-426-1658 [email protected]
Nick Stajduhar, Institutional Sales 647-426-1664 [email protected]
Steve Low, Institutional Sales 647-426-1667 [email protected]
Tom Chudnovsky, Institutional Sales 647-426-1665 [email protected]
Jonathan Samahin, Institutional Sales & Trading 647-426-1670 [email protected]
Nick Perkell, Institutional Trading 647-426-1671 [email protected]
Elisa Chio, Associate 647-426-0288 [email protected]
Operations
Derrick Chiu, Head – Syndication 647-426-1662 [email protected]
Marco Beretta, [email protected]
Robyn [email protected]
Table of Contents
Lithium: The Next Strategic Material ............................................................................................................................1
Western Lithium Canada Corporation – Initiating Coverage .................................................................................... 14
Western Lithium Canada Corporation – Note .......................................................................................................... 25
Rodinia Minerals Inc. – Initiating Coverage .............................................................................................................. 27
Rodinia Minerals Inc. – Note ................................................................................................................................... 36
Salares Lithium Inc. – Initiating Coverage ................................................................................................................ 39
Lithium Comparables Tables .................................................................................................................................... 52
Lithium Snapshots ................................................................................................................................................... 56
Vanadium: The Supercharger ..................................................................................................................................... 82
Largo Resources Ltd. – Initiating Coverage ............................................................................................................... 93
Vanadium Comparables Table ................................................................................................................................ 104
Vanadium Snapshots .............................................................................................................................................. 105
Rare Earth Elements – Pick Your Spots, Carefully ................................................................................................... 119
Rare Earth Elements Comparables Table ................................................................................................................ 132
Rare Earth Elements Snapshots .............................................................................................................................. 134

Lithium: The Next Strategic MaterialMarch 31, 2010
Supply is stagnant• Major players in the market produce from brines
through evaporation
• Brines cannot easily respond to spot increases in demand or price
• Brine sources are “living”, dynamic systems, and dramatically increasing production can damage them
• Hard-rock mining is too expensive, and takes too long to establish
• Clays are promising, but under development
Demand is rising• Demand today is in the range of 120,000 tonnes of
lithium carbonate equivalent (LCE) annually
• With GDP levels of growth in some industries, and 10% CAGR in areas such as consumer battery demand, plus automotive use, we foresee demand rising nearly 40% by 2014
Low cost suppliers will win the battle• Lowest cost suppliers are brines. Variable cost of a
brine production is perhaps $1,200 per tonne LCE, ex-labor. Cost may be $2,300 per tonne LCE including amortization, ex-labor. But cost is highly dependent on low magnesium content in the brine.
• Hard rock/spodumene mining has highest costs. Variable costs may be as high as $3,100 per tonne LCE ex-labor, and fully amortized costs may be $6,400 per tonne LCE. If present prices continue to rise, all is well, but varying prices for LCE can spell doom for spodumene-based producers.
• We suggest investors also look at clay-based producers. While variable costs for such an operation may be as high as $2,300 per tonne LCE ex-labor, this is acceptable compared to brines that are higher in magnesium content. Amortized costs are also reasonable at $3,300 per tonne LCE, especially given it appears LCE produced via this route is cleaner than brine-sourced lithium.
Investors can win the war• We believe investors with appropriate risk profi les
are best served by owning a basket of lithium stocks, concentrating on brine-based explorers working in known regions, and some strong speculative plays such as clay-based production.
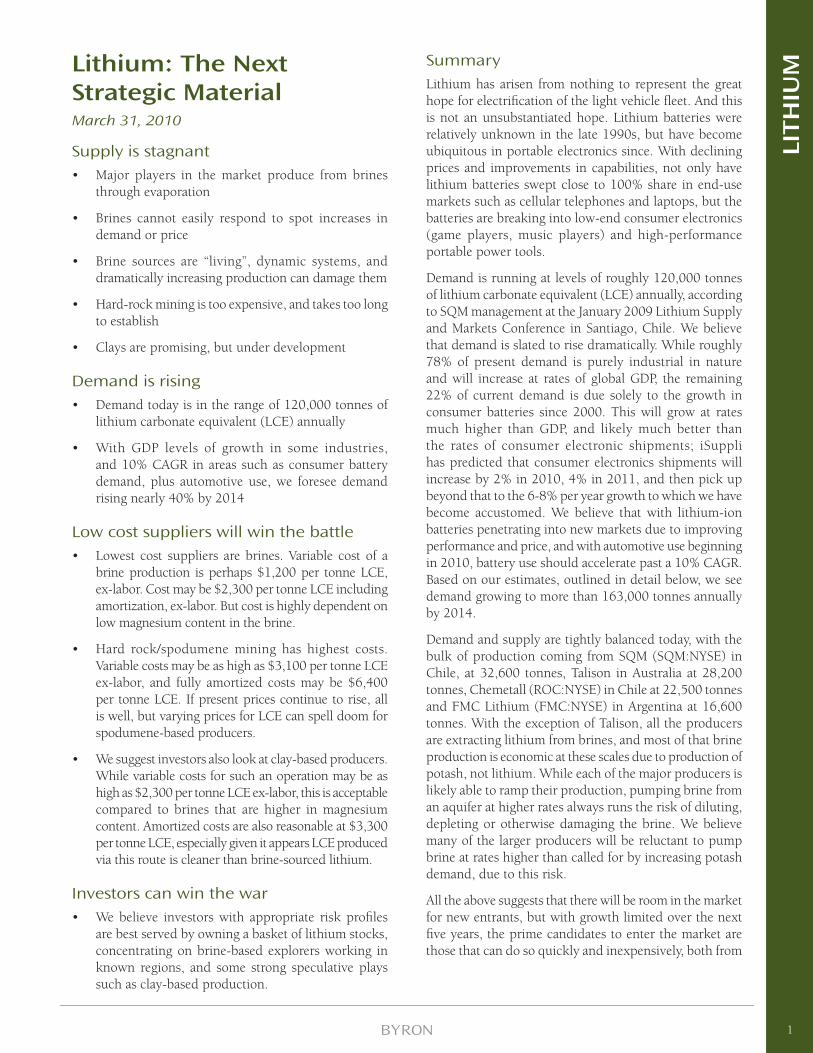
SummaryLithium has arisen from nothing to represent the great hope for electrifi cation of the light vehicle fl eet. And this is not an unsubstantiated hope. Lithium batteries were relatively unknown in the late 1990s, but have become ubiquitous in portable electronics since. With declining prices and improvements in capabilities, not only have lithium batteries swept close to 100% share in end-use markets such as cellular telephones and laptops, but the batteries are breaking into low-end consumer electronics (game players, music players) and high-performance portable power tools.
Demand is running at levels of roughly 120,000 tonnes of lithium carbonate equivalent (LCE) annually, according to SQM management at the January 2009 Lithium Supply and Markets Conference in Santiago, Chile. We believe that demand is slated to rise dramatically. While roughly 78% of present demand is purely industrial in nature and will increase at rates of global GDP, the remaining 22% of current demand is due solely to the growth in consumer batteries since 2000. This will grow at rates much higher than GDP, and likely much better than the rates of consumer electronic shipments; iSuppli has predicted that consumer electronics shipments will increase by 2% in 2010, 4% in 2011, and then pick up beyond that to the 6-8% per year growth to which we have become accustomed. We believe that with lithium-ion batteries penetrating into new markets due to improving performance and price, and with automotive use beginning in 2010, battery use should accelerate past a 10% CAGR. Based on our estimates, outlined in detail below, we see demand growing to more than 163,000 tonnes annually by 2014.
Demand and supply are tightly balanced today, with the bulk of production coming from SQM (SQM:NYSE) in Chile, at 32,600 tonnes, Talison in Australia at 28,200 tonnes, Chemetall (ROC:NYSE) in Chile at 22,500 tonnes and FMC Lithium (FMC:NYSE) in Argentina at 16,600 tonnes. With the exception of Talison, all the producers are extracting lithium from brines, and most of that brine production is economic at these scales due to production of potash, not lithium. While each of the major producers is likely able to ramp their production, pumping brine from an aquifer at higher rates always runs the risk of diluting, depleting or otherwise damaging the brine. We believe many of the larger producers will be reluctant to pump brine at rates higher than called for by increasing potash demand, due to this risk.
All the above suggests that there will be room in the market for new entrants, but with growth limited over the next fi ve years, the prime candidates to enter the market are those that can do so quickly and inexpensively, both from
1
LITH
IUM
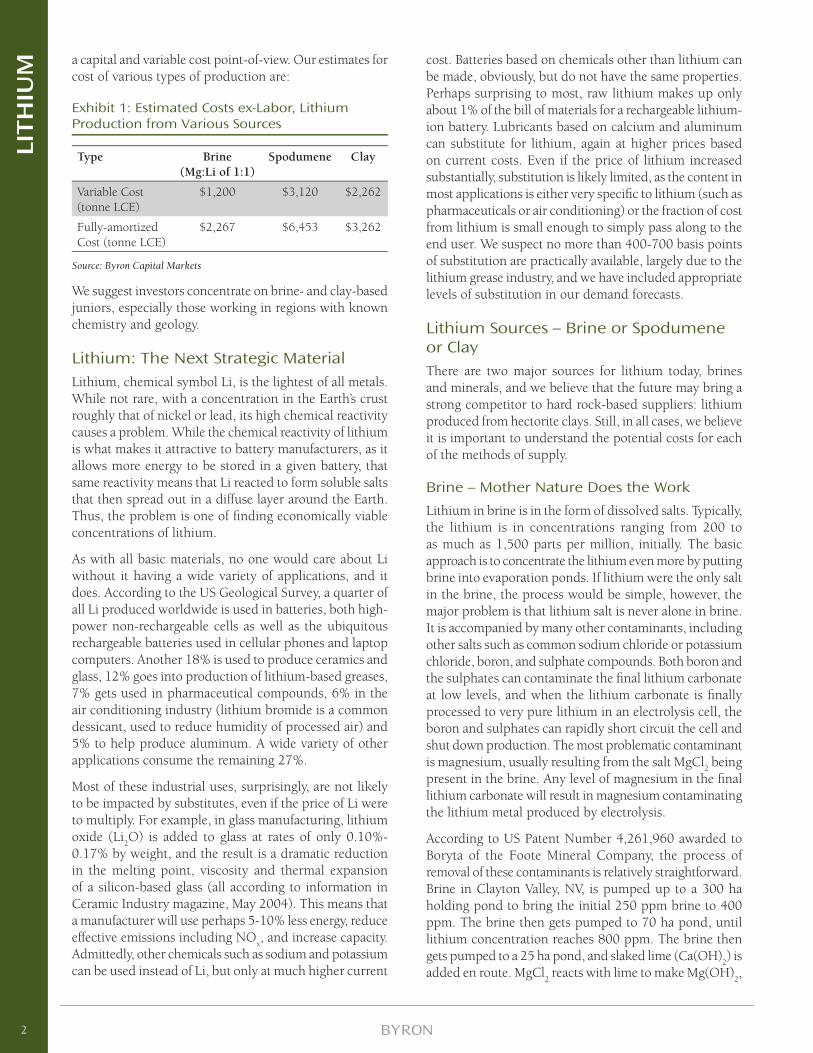
a capital and variable cost point-of-view. Our estimates for cost of various types of production are:
Exhibit 1: Estimated Costs ex-Labor, Lithium Production from Various Sources
Type Brine (Mg:Li of 1:1)
Spodumene Clay
Variable Cost (tonne LCE)
$1,200 $3,120 $2,262
Fully-amortized Cost (tonne LCE)
$2,267 $6,453 $3,262
Source: Byron Capital Markets
We suggest investors concentrate on brine- and clay-based juniors, especially those working in regions with known chemistry and geology.
Lithium: The Next Strategic MaterialLithium, chemical symbol Li, is the lightest of all metals. While not rare, with a concentration in the Earth’s crust roughly that of nickel or lead, its high chemical reactivity causes a problem. While the chemical reactivity of lithium is what makes it attractive to battery manufacturers, as it allows more energy to be stored in a given battery, that same reactivity means that Li reacted to form soluble salts that then spread out in a diffuse layer around the Earth. Thus, the problem is one of fi nding economically viable concentrations of lithium.
As with all basic materials, no one would care about Li without it having a wide variety of applications, and it does. According to the US Geological Survey, a quarter of all Li produced worldwide is used in batteries, both high-power non-rechargeable cells as well as the ubiquitous rechargeable batteries used in cellular phones and laptop computers. Another 18% is used to produce ceramics and glass, 12% goes into production of lithium-based greases, 7% gets used in pharmaceutical compounds, 6% in the air conditioning industry (lithium bromide is a common dessicant, used to reduce humidity of processed air) and 5% to help produce aluminum. A wide variety of other applications consume the remaining 27%.
Most of these industrial uses, surprisingly, are not likely to be impacted by substitutes, even if the price of Li were to multiply. For example, in glass manufacturing, lithium oxide (Li
2O) is added to glass at rates of only 0.10%-
0.17% by weight, and the result is a dramatic reduction in the melting point, viscosity and thermal expansion of a silicon-based glass (all according to information in Ceramic Industry magazine, May 2004). This means that a manufacturer will use perhaps 5-10% less energy, reduce effective emissions including NO
x, and increase capacity.
Admittedly, other chemicals such as sodium and potassium can be used instead of Li, but only at much higher current
cost. Batteries based on chemicals other than lithium can be made, obviously, but do not have the same properties. Perhaps surprising to most, raw lithium makes up only about 1% of the bill of materials for a rechargeable lithium-ion battery. Lubricants based on calcium and aluminum can substitute for lithium, again at higher prices based on current costs. Even if the price of lithium increased substantially, substitution is likely limited, as the content in most applications is either very specifi c to lithium (such as pharmaceuticals or air conditioning) or the fraction of cost from lithium is small enough to simply pass along to the end user. We suspect no more than 400-700 basis points of substitution are practically available, largely due to the lithium grease industry, and we have included appropriate levels of substitution in our demand forecasts.
Lithium Sources – Brine or Spodumene or ClayThere are two major sources for lithium today, brines and minerals, and we believe that the future may bring a strong competitor to hard rock-based suppliers: lithium produced from hectorite clays. Still, in all cases, we believe it is important to understand the potential costs for each of the methods of supply.
Brine – Mother Nature Does the Work
Lithium in brine is in the form of dissolved salts. Typically, the lithium is in concentrations ranging from 200 to as much as 1,500 parts per million, initially. The basic approach is to concentrate the lithium even more by putting brine into evaporation ponds. If lithium were the only salt in the brine, the process would be simple, however, the major problem is that lithium salt is never alone in brine. It is accompanied by many other contaminants, including other salts such as common sodium chloride or potassium chloride, boron, and sulphate compounds. Both boron and the sulphates can contaminate the fi nal lithium carbonate at low levels, and when the lithium carbonate is fi nally processed to very pure lithium in an electrolysis cell, the boron and sulphates can rapidly short circuit the cell and shut down production. The most problematic contaminant is magnesium, usually resulting from the salt MgCl
2 being
present in the brine. Any level of magnesium in the fi nal lithium carbonate will result in magnesium contaminating the lithium metal produced by electrolysis.
According to US Patent Number 4,261,960 awarded to Boryta of the Foote Mineral Company, the process of removal of these contaminants is relatively straightforward. Brine in Clayton Valley, NV, is pumped up to a 300 ha holding pond to bring the initial 250 ppm brine to 400 ppm. The brine then gets pumped to 70 ha pond, until lithium concentration reaches 800 ppm. The brine then gets pumped to a 25 ha pond, and slaked lime (Ca(OH)
2) is
added en route. MgCl2 reacts with lime to make Mg(OH)
2,
2
LITH
IUM
which is barely soluble in water and settles out in the holding pond. As LiCl concentrations increase to 2,000 ppm, MgCl
2 concentrations drop to 2 ppm as the Mg(OH)
2
is formed and precipitates. At this point, Foote Minerals would add hydrochloric acid (HCl) and then calcium chloride (CaCl
2). The result is that both boron and sulphate
compounds react and precipitate out of solution, primarily as gypsum. The resulting “clean” brine is then pumped to a series of 5 ha ponds until LiCl concentration reaches high levels, perhaps 6,000 ppm. At this point, soda ash (Na
2CO
3) is added and the LiCl reacts to form lithium
carbonate, Li2CO
3. Obviously, extraction effi ciency cannot
be 100%, and testing has shown extraction effi ciency of lithium of roughly 50% is reasonable.
The most common salts in brine, sodium and potassium chloride have relatively low solubility, 359 g and 342 g per liter of water at 20 ºC, respectively. Thus, as the brine becomes more concentrated, both sodium and potassium crystallize out of solution. Once carbonates are added, the sodium and potassium are not generally problematic, as both sodium and potassium carbonate have high levels of solubility; 215 g and 1,110 g per liter of water at 20°C, respectively.
Costing this process is relatively straightforward, but is very dependent on shipping costs for large quantities of industrial chemicals. Shipping truckloads of chemicals to a valley in Nevada only two hours from Las Vegas is one thing, but getting tonnes of supplies up to a remote salar in Bolivia would be another, indeed. No matter how much contaminant is contained by the brine, the fi nal step is usually to add soda ash and precipitate out lithium carbonate. The cost of soda ash is now roughly $180/tonne FOB, but has been as high as $215/tonne (according to ICIS). Because of the remote nature of many brine sites, we will include shipping costs for all raw materials of $50/tonne. In order to produce one tonne of Li
2CO
3, 1.43
tonnes of soda ash are required, for a process chemical cost of $380. With extraction effi ciency of 50%, the price is effectively higher at $760/tonne of lithium carbonate. This chemical cost does not vary with contaminant levels, it is fi xed and necessary to produce stable lithium carbonate.
The cost of dealing with sulphates and boron is also important. HCl has a price of roughly $100/tonne FOB (plus $50 per tonne shipping), but the amount required to adjust pH in the holding ponds is relatively low per tonne of lithium carbonate produced, no more than $20. However, the cost of calcium chloride to treat boron and sulphates can be meaningful. At Clayton Valley, boron levels in the brine are about 20% of the levels of lithium. Calcium chloride price is roughly $110/tonne FOB (plus $50 shipping), so to treat the amount of boron carried along with a tonne of lithum carbonate equivalent requires $240 of CaCl
2. Thus,
treating sulphates and boron requires $260 in process chemicals per tonne of lithium carbonate produced.
It has been a matter of industry wisdom that to be economically viable, the ratio of Mg to Li in brine must be below the range of 9:1 or 10:1. At present price points we believe that ratio may have moved up, but certainly we can demonstrate why lower Mg:Li ratios are preferred. Slaked lime is added to brine to react with magnesium salt and remove it from the water. Lime prices were rising through 2008 and even into early 2009, and stood at roughly $106/tonne FOB (according to the USGS; we will add $50 per tonne in shipping cost). To deplete water of one tonne of MgCl
2 results in the production of 612 kg
of Mg(OH)2. To create 612 kg of Mg(OH)
2 requires the
use of 778 kg of Ca(OH)2. Removal effi ciency is nearly
100%, as Mg(OH)2 is barely soluble in water. If the ratio
is 1:1, i.e. there is one tonne of MgCl2 per tonne of LiCl
in the original brine, then the added cost due to lime is $180/tonne of lithium carbonate produced. Each integer increase in the Mg:Li ratio adds another $180 of cost per tonne of carbonate.
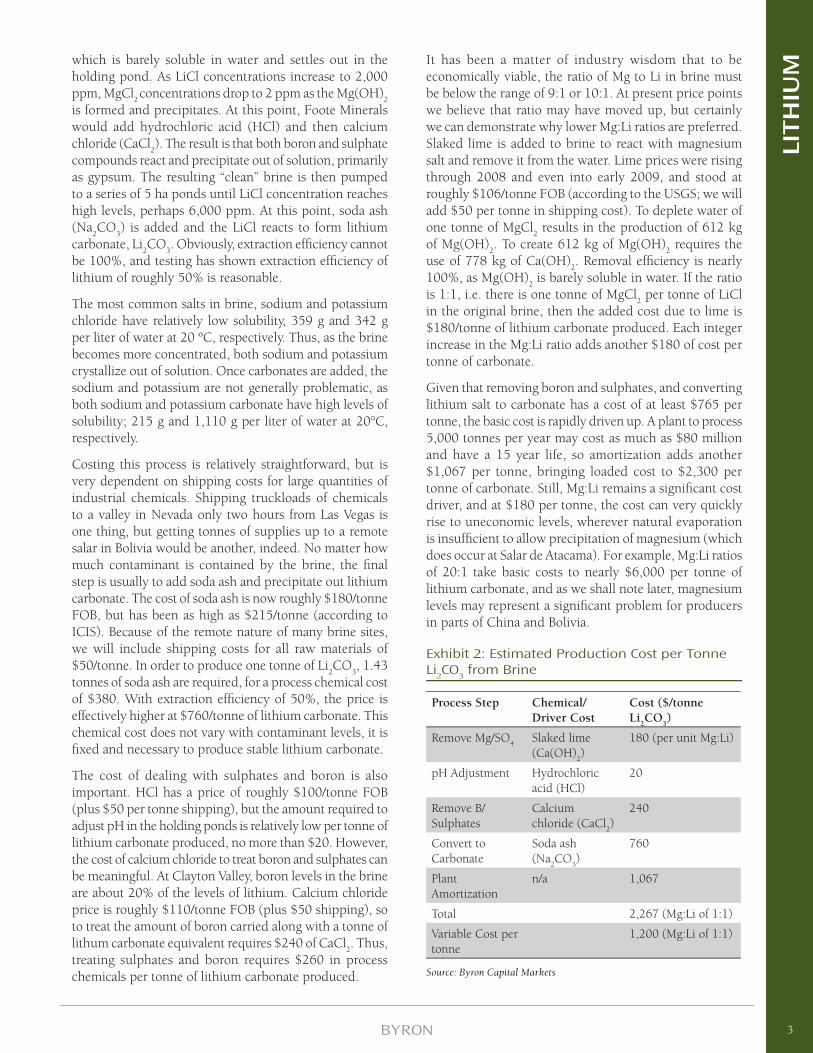
Given that removing boron and sulphates, and converting lithium salt to carbonate has a cost of at least $765 per tonne, the basic cost is rapidly driven up. A plant to process 5,000 tonnes per year may cost as much as $80 million and have a 15 year life, so amortization adds another $1,067 per tonne, bringing loaded cost to $2,300 per tonne of carbonate. Still, Mg:Li remains a signifi cant cost driver, and at $180 per tonne, the cost can very quickly rise to uneconomic levels, wherever natural evaporation is insuffi cient to allow precipitation of magnesium (which does occur at Salar de Atacama). For example, Mg:Li ratios of 20:1 take basic costs to nearly $6,000 per tonne of lithium carbonate, and as we shall note later, magnesium levels may represent a signifi cant problem for producers in parts of China and Bolivia.
Exhibit 2: Estimated Production Cost per Tonne Li2CO3 from Brine
Process Step Chemical/Driver Cost
Cost ($/tonne Li
2CO
3)
Remove Mg/SO4
Slaked lime (Ca(OH)
2)
180 (per unit Mg:Li)
pH Adjustment Hydrochloric acid (HCl)
20
Remove B/Sulphates
Calcium chloride (CaCl
2)
240
Convert to Carbonate
Soda ash (Na
2CO
3)
760
Plant Amortization
n/a 1,067
Total 2,267 (Mg:Li of 1:1)
Variable Cost per tonne
1,200 (Mg:Li of 1:1)
Source: Byron Capital Markets
3
LITH
IUM
Spodumene – Lithium from Granite
The other major source of Li is mineral. In the past, a pegmatic mineral known as spodumene was the major source of Li. Pegmatite is basically coarse-grained granite, an igneous rock with grain sizes of 10 mm or larger. Spodumene is actually lithium aluminum silicate, LiAl(SiO
3)
2. Producers from this type of hard-rock mining
have to contend with lithium concentrations of only 1-2% in this type of deposit (with a theoretical maximum of 8%).
Again, however, the problem and costs come from separating the lithium from everything else in the minerals. Basically, a spodumene concentrate is heated to 1,100°C and then pulverized. The heat is necessary to make the crystalline spodumene amenable to reacting with sulphuric acid, which is now added and heated to 250°C to produce lithium sulphate, which falls out of solution in the acid. The Li
2SO
4 is soluble in water, however, at a level of 348
g per liter of water at 20°C. This allows dissolved Li2SO
4
to react with carbonates and produce Li2CO
3 that will
then fall out of solution to be dried and sold. Obviously, this is a more energy intensive and expensive process than producing lithium from brine, but at the right prices for lithium, it can remain an economically viable process. It should be noted that spodumene-based lithium has historically not been processed to remove contaminants such as boron or sulphates, which are problematic when attempting to produce the highly purifi ed lithium used in batteries. Again, we do not imply that this purifi cation cannot be done, only that it will again increase costs.
And the cost of spodumene-based lithium is, indeed, high. The concentration of spodumene is usually no higher than 1-2% in lithium. In order to create one tonne of lithium carbonate, we require 189 kg of lithium metal. At 2% concentration, a high value for any spodumene deposit, we need to remove 9.4 tonnes of ore. However, this also assumes the processing of spodumene is 100% effi cient at recovery of lithium, and it is not; heap leaching is generally no more than 35% effi cient, so the volume of ore required to make one tonne of lithium carbonate is now 27 tonnes. Moon et al in “Introduction to Mineral Exploration” set broad parameters on the cost of hard rock underground mining, but generally these costs will be from $23-45 per tonne. Therefore, the initial cost of getting ore out of the ground is between $600 and $1,200 per tonne of lithium carbonate.
The spodumene extracted from the ore body must then be concentrated by a factor of between three and six. As per description by Banks et al in the February, 1953 issue of Mining Engineering (mining of spodumene is by no means a new science), the cost of such a separation is roughly $500 per tonne of lithium carbonate.
At this point, the volume of mineral to be treated has been reduced to perhaps nine tonnes. The next step in the process is to heat the mineral to roughly 1,200 °C. This requires a large amount of energy. The specifi c heat of this material will be roughly between granite and mica, quoted as 0.5 kJ/kg K and 0.79 kJ/kg K, respectively. Given we want to heat the material from 20 °C to 1,200 °C, and we have 9,000 kg, the energy required is of order 7.02 GJ. Heating is never 100% effi cient, rough 50% effi ciency would be considered good results, so we need 14 GJ. This requires the lower heating value of 2.3 barrels of oil, perhaps $230 worth of heat per tonne of lithium carbonate.
Pulverizing of the heat-treated material is necessary, to allow reasonable access for chemicals as they extract lithium from the ore. Cost of pulverizing rock is not high per tonne, and we are only dealing with nine tonnes of concentrate at this point, but we can infer from various sources that pulverizing will cost $100 per tonne of lithium carbonate.
Finally we require process chemicals, specifi cally sulphuric acid. Sulphuric acid had been selling for as much as $400 per US ton in the middle of 2008, but prices have retreated to a more reasonable $250 per tonne. To react with 189 kg of lithium metal and produce lithium sulphate, we need at least 1.3 tonnes of sulphuric acid. At the high price, which we regard as being a longer-term level, this is worth $585 per tonne of lithium carbonate produced, including shipping.
There is now a washing step, to put the lithium sulphate produced earlier into solution. We will assign no cost to this stage of the process. Finally, the lithium sulphate must be reacted with soda ash, producing relatively insoluble lithium carbonate. Here the cost of the soda ash, as determined for brines, above, is $505 per tonne of lithium carbonate.
The total variable cost to produce a tonne of lithium carbonate through hard rock mining of spodumene is between $2,500 and $3,100 per tonne of lithium carbonate, explaining why spodumene producers became especially aggressive in late 2000 when lithium carbonate prices topped $4,000 per tonne, and why the same spodumene producers disappeared from the market when pressure from SQM dropped the price to an average $1,400 per tonne in 2001.
Note that the amortization of capital cost on the mine also needs to be included, in order to reach a fi nal cost. The capital cost of the mine and plant for a 10,000 tonne per year annual producer is above $500 million. Based on 15 year life (lower than might be expected owing to the caustic nature of the solutions required during processing), this equates to an additional $3,333 per tonne
4
LITH
IUM
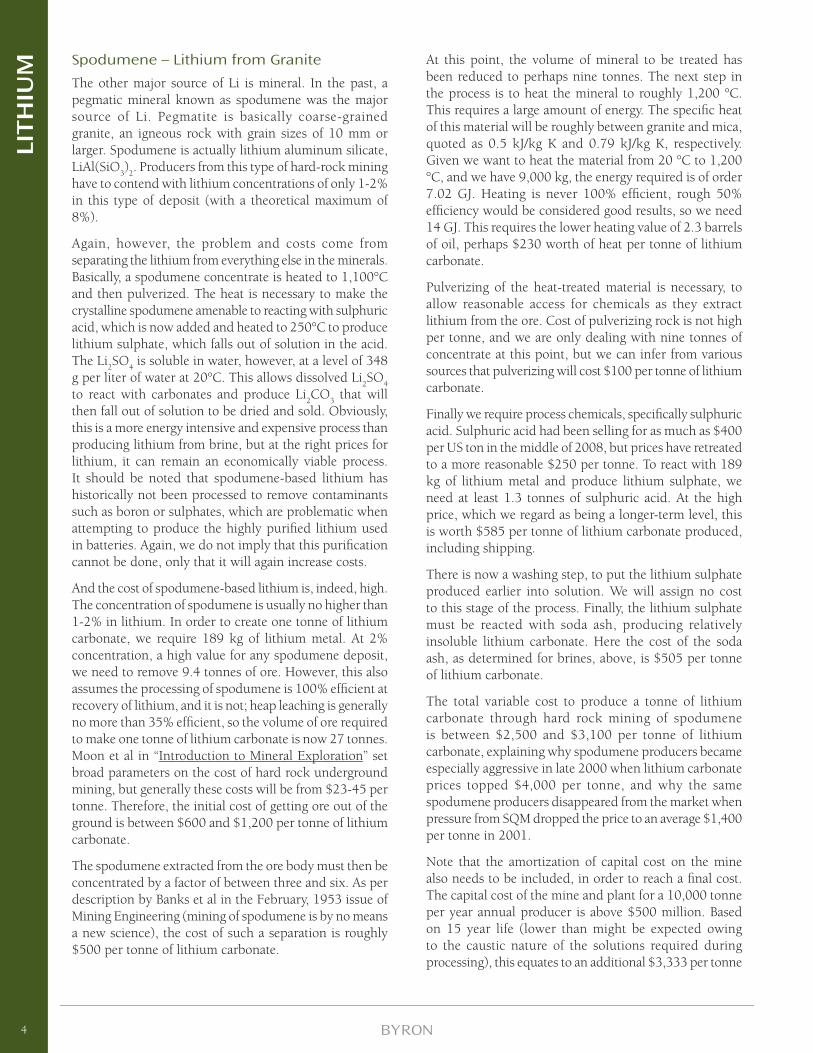
of lithium carbonate. Final cost of the lithium carbonate from spodumene is thus likely now in the range $5,800 to $6,400 per tonne.
Exhibit 3: Estimated Production Cost per Tonne Li2CO3 from Spodumene
Process Step Chemical/Driver Cost
Cost ($/tonne Li
2CO
3)
Extract Ore n/a < 1,200
Spodumene Concentration
n/a 500
Calcining Oil 230
Pulverizing Concentrate
n/a 100
Leaching Sulfuric acid (H
2SO
4)
585
Washing Water 0
Convert to Carbonate
Soda ash (Na
2CO
3)
505
Plant Amortization
n/a 3,333
Total < 6,453
Variable Cost per tonne
< 3,120
Source: Byron Capital Markets
Hectorite Clay – Lithium Just Lying Around (Sort Of)
A third possibility which is gaining traction is the production of Li compounds from lithium-bearing clays, such as the hectorite in Nevada. Hectorite is a lithium-rich clay, with general chemical formula NaO
3(Mg,Li)
3Si
4O
10(F,OH)
2. This
is a daunting formula, but basically amounts to lithium-bearing clay that can range in colour from brown to green to grey, and happens to contain a small percentage, perhaps 0.35% by weight, of Li.
The processing of the clay should result in saleable co-products. There will, as there always is, be potassium in the clays. We assume a 2:1 level of potassium to lithium, and have included the required chemicals/equipment to extract this limited amount of potash. At a selling price of $500 per tonne of K
2SO
4, the potash provides a credit
of roughly $1,500 to lithium costs. Note that this IS a properly included part of cash costing; the potash must be created if the lithium is to be successfully extracted, and money on chemicals to create it must be spent. Potash is part of the same process, not a separate item.
Similarly, the clay contains fl uorine and if the clay is roasted then the fl uorine will be liberated and can be converted to hydrofl uoric acid, much as it is in standard fl uorspar-based production of hydrofl uoric acid. However, we have
no solid information on the fl uorine content of specifi c clay deposits outside of California, and these levels can vary quite widely. We will not incorporate any hydrofl uoric acid co-product credit in our numbers, but do caution that such a number can be signifi cant, perhaps of similar magnitude to any potash credit.
While processing clays will, we believe, be necessarily more expensive than processing brines, it is also very likely to be much less expensive than processing spodumene. Two completely independent fl ow sheets have been developed for processing clays, one leaching process developed by Chevron and a number of roasting processes developed by the US Federal Bureau of Mines.
Leaching is like to take the form described by US Patent Number 4,588,566, awarded to Harris Kluksdahl of Chevron Research. Kluksdahl’s process involves milling the clay down to very fi ne particles, slurrying these fi nes in a hydroxide solution, heating to less than 125ºC, separating out the solids and then combining with sulphuric acid, again heating to less than 125 ºC, then taking off the liquid and treating with a variety of hydroxides and carbonates to fi rst separate out other alkaline metals, and then to produce lithium carbonate. The high-heat initial calcining step required in processing spodumene is not required here.
To begin, the hectorite deposits in Nevada are 0.35% lithium. To get 189 kg of lithium metal, the amount required for one tonne of lithium carbonate, one would need to extract 54 tonnes of clay. The recovery effi ciency as given in the patent awarded to Chevron Research can be as low as 45%, however, so the actual requirement is 120 tonnes of clay per tonne of lithium carbonate. Moon et al and Infomine both give costs for surface mining with various levels of stripping ratios (in this case, the ratio between tonnes of overburden removed to tonnes of lithium-bearing clay removed) and we can safely say that costs for extracting the clay should not be more than $4/tonne. This gives us a cost of less than $480 per tonne of produced carbonate.
Grinding the clay down is analogous to the pulverizing step in dealing with spodumene. We will assign it a value of $100 per tonne of carbonate.
The clay must be immersed in a base solution containing hydroxides, in order to precipitate out magnesium and prepare the hectorite for lithium extraction. The ratio of lithium to magnesium in hectorite, chemical formula NaO
3(Mg,Li)
3Si
4O
10(F,OH)
2, is constrained to be roughly
5.5:1, normally. This does not present any problem in processing, and has a cost, as per removal of MgCl from brine in our above discussion is $800 per tonne of carbonate, using a lower cost of shipping of $20 per tonne due to Western Lithium’s location.
5
LITH
IUM
We also add in the cost of sulfuric acid, to convert the lithium in the clay to lithium sulfate. As per the above discussion regarding spodumene, the cost of sulfuric acid to properly convert 189 kg of lithium metal to sulfate is $546 per tonne of carbonate, but again using a lower shipping cost.
Finally, soda ash is required to convert the lithium sulfate to lithium carbonate. The fi nal tally here, as per brines and spodumene both but incorporating the lower shipping cost, is $336 per tonne of carbonate.
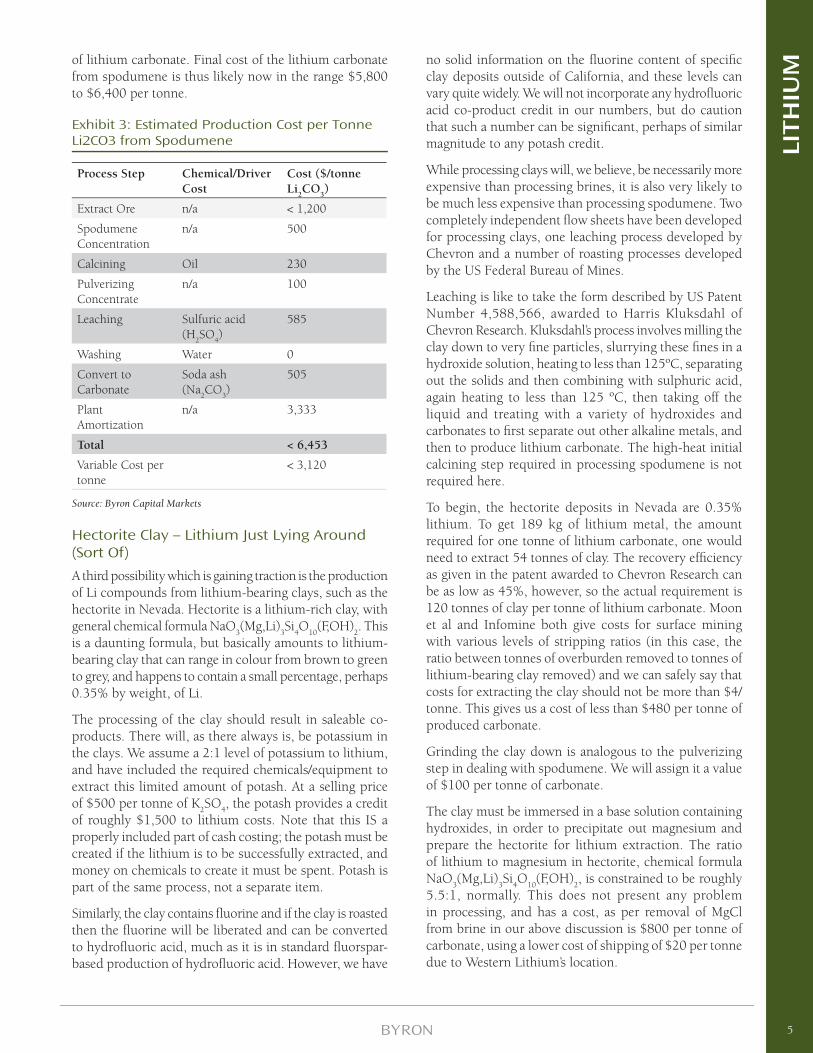
Hence, the total tally for variable costs is roughly $1,800 per tonne of lithium carbonate. In the specifi c case of hectorite clays in Nevada, we are likely overestimating costs as we are using shipping rates for the bulk chemicals that are more suited to remote locations than sites in the United States.
When the amortized cost of a plant is added to the mix, the situation actually tips more heavily in favor of clays as opposed to spodumene ores. A clay plant does not involve underground mining, it utilizes open pit operations and a vat leaching plant, a much simpler operation than that required for spodumene. Our estimate is that a 20,000 tonne per year carbonate plant based on hectorite clays would cost less than $300 million, and have the same 15 year life of a spodumene facility. Amortization adds $1,000 per tonne to carbonate costs, taking the total to approximately $2,800 per tonne, albeit with higher shipping costs than are likely warranted in the specifi c case of hectorite clays in Nevada.
Exhibit 4: Estimated Production Cost per Tonne Li2CO3 from Clay Leaching
Process Step Chemical/Driver Cost
Cost ($/tonne Li
2CO
3)
Extract Clay n/a 480
Grind Clay n/a 100
Magnesium Removal/Prep
Slaked lime (Ca(OH)
2)
800
Leaching Sulfuric acid (H
2SO
4)
546
Washing Water 0
Convert to Carbonate
Soda ash (Na
2CO
3)
336
Plant Amortization
n/a 1,000
Total 3,262
Variable Cost per tonne
2,262
Source: Byron Capital Markets
The roasting process was originally conjectured and described by J.T. May and colleagues from the US Bureau
of Mines in the late 1970s and early 1980s. A modifi ed version of one of the roasting circuits developed by May et al. is being investigated Western Lithium (WLC:TSXV). The company asserts this process will produce a cleaner, superior form of lithium carbonate. The process involves mining and grinding the clays, then roasting with a combination of lime and gypsum. Extraction of Li using this process is roughly 70%, according to May et al., and the usage of raw materials is outlined in the original paper “Extracting Lithium from Clays by Roast-Leach Treatment.”
Extracting clays for this process is less expensive than the leaching process, as effi ciency is higher. Again, to produce one tonne of lithium carbonate requires 189 kg of metal. At 70% fi nal extraction effi ciency and a concentration of 0.35%, the roasting process requires only 77 tonnes of clay, at a fi nal cost of $308.
Grinding, given the lower amount of clay per tonne of carbonate, has a fractionally lower cost for roasting the clays than for leaching, as well. This value is estimated at $64 per tonne of carbonate.
Roasting is done with gypsum, or calcium sulphate, to remove lithium sulphate from the clay. The percentage of gypsum required is very high, as much as 50% of the clay mass. Since we are dealing with 77 tonnes of clay to produce one tonne of lithium carbonate, we need 39 tonnes of gypsum. The price of gypsum is less than $10 per tonne, and shipping is likely to be less than $20 per tonne to the Western Lithium site in Nevada, so a total cost of $1,170 per tonne of carbonate.
The clays must be heated to an optimal temperature of 1,000 °C according to May et al, and this will likely be done using natural gas and steam. The amount of energy required is based on a generic specifi c heat for clays of roughly 1,400 J/kg °C, and for gypsum of 1,100 J/kg °C. We are attempting to convert water to suffi cient quantities of live steam to heat 77 tonnes of clay and 39 tonnes of gypsum by 980 °C. Assuming we have the water, the basic natural gas requirement, at a price of $6 per million BTU will be $400/tonne of LCE produced.
Finally, the lithium sulphate must be washed out of the calcined clay, and converted to carbonate using soda ash. Incorporating the lower shipping costs allowed by the Western Lithium location, and the higher removal effi ciencies as compared to leaching, the cost of this conversion is roughly $480 per tonne of carbonate.
Plant cost is roughly the same as for the leaching process, above, and adds an additional amortization of $1,000 per tonne of carbonate. Final costs are outlined below.
6
LITH
IUM

Exhibit 5: Estimated Production Cost per Tonne Li2CO3 from Clay Roasting
Process Step Chemical/Driver Cost
Cost ($/tonne Li
2CO
3)
Extract Clay n/a 308
Grind Clay n/a 64
Heat for Roasting Steam to 1,000 °C 400
Gypsum Calcium sulphate (CaSO
4)
1,170
Wash Water 0
Convert to Carbonate
Soda ash (Na
2CO
3)
480
Plant Amortization
n/a 1,000
Total 3,422
Variable Cost per tonne
2,422
Source: Byron Capital Markets
The product produced from roasting may be superior to the product produced from leaching. Western Lithium management has asserted that their roasting process improves contaminate levels remaining in the carbonate signifi cantly, making the fi nal electrolytic refi ning step by a battery maker far less expensive. The cost of electrolytic refi ning of most high purity metals, according to Jerry Woodall of Purdue University in a presentation given in September 2008, is about $660/tonne of material. This may, although we are not in a position at present to judge, result in lithium produced from hectorite clays being economically superior to those from brines for battery use.
Current Lithium Pricing and Future SubstitutionWe also note that an increase in lithium carbonate cost is not likely to be catastrophic for any industry relying on lithium. As reported by Evans from the January 2009 Santiago conference on lithium, a benchmark figure recognized in the industry is that 600 grams of LCE is used per kWh of battery storage required (probably slightly low, given the current state of design). Costs for lithium carbonate have been as high as US$6,600 per tonne, so a 1 kWh battery would use roughly $4 of lithium carbonate equivalent. The cost of a 1 kWh battery pack will be no lower than $400, based solely on the cost of the standard 18650 cells used to build it, and excluding any manufacturing costs for the battery module. Clearly, doubling the cost of the lithium required for the battery will have little impact on demand, but not having enough lithium to construct the battery certainly would be disastrous.
Similarly, use of lithium in its oxide form in the glass industry amounts to only 0.03-0.20% by weight, according to articles in Ceramic Industry Magazine (Christine Grahl, May 2004). While offering a signifi cant reduction in energy demand during glass manufacturing, the dollar cost of glass is barely impacted by the cost of lithium. Again, price increases in lithium are unlikely to result in any sort of substitution.
We also note that a trend in the battery industry is a willingness to use more Li in a battery, in order to meet performance specifi cations. This is easily understood, economically; adding $2 of lithium to a battery that can then sell for an additional $5 because of its superior performance is justifi ed.
In short, we believe that potential substitutions to alleviate lithium consumption due to higher lithium prices are unlikely to amount to more than 300-500 basis points of use, and will only occur if Li prices were to increase by factors of three or more. As we do not see this sort of price increase as likely over our fi ve year window, we do not include substitutions in our model.
Lithium Batteries: High Voltage = High Energy and High PowerThe reason Li is so desirable in terms of use in batteries is precisely what makes it available only in low concentrations, its chemical reactivity. Li is a convenient metal that is able to carry large amounts of energy and power in a small and lightweight package. Batteries are built and arranged in individual cells, with the power available from each cell being roughly dependent on the area available for ion exchange across the batteries electrolyte, and the energy it carries dependent more on its volume and its chemistry. Each battery chemistry has different cell voltages, and power is actually directly related to voltage through the equation P = V2/R, where V is battery voltage, R is electrical resistance of the attached load, and P is power. A high voltage from a cell will generally result in higher power being available from the battery, all other things being equal. The cell voltage of a lithium battery is 3.7 V, while the cell voltage of a nickel metal hydride battery is only 1.2 V. Normally, cells are wired together to build fi nal battery packs, but the fewer cells that must be connected, the simpler, cheaper and less failure-prone the fi nal battery will be. The 12 V lead-acid car battery, for example, is typically made up of six lead-acid cells, each one at 2.0 V.
So batteries based on Li chemistry can produce more power and carry more energy than batteries based on other more common materials. For example, typically quoted energy densities for a Li-ion rechargeable battery would be roughly 150 Watt-hours per kilogram of battery mass (abbreviated as Wh/kg; a 100 Wh lithium battery would mass 0.7 kg, and be capable of powering a 100 Watt light
7
LITH
IUM
bulb for one hour, which would be a terrible way to use such a battery, but it can be done). Typical energy density for a nickel metal-hydride (NiMH) rechargeable battery would be roughly 100 Wh/kg, due largely to the heavier mass of the raw materials in a NiMH battery. Li-ion also wins on the basis of energy per volume; Li-ion has energy density of over 300 Wh/l, while NiMH comes in at roughly the same level, perhaps 280 Wh/l. But one must be willing to move a much heavier NiMH battery around, and to settle for the lower peak power that a NiMH battery can generate compared to Li-ion.
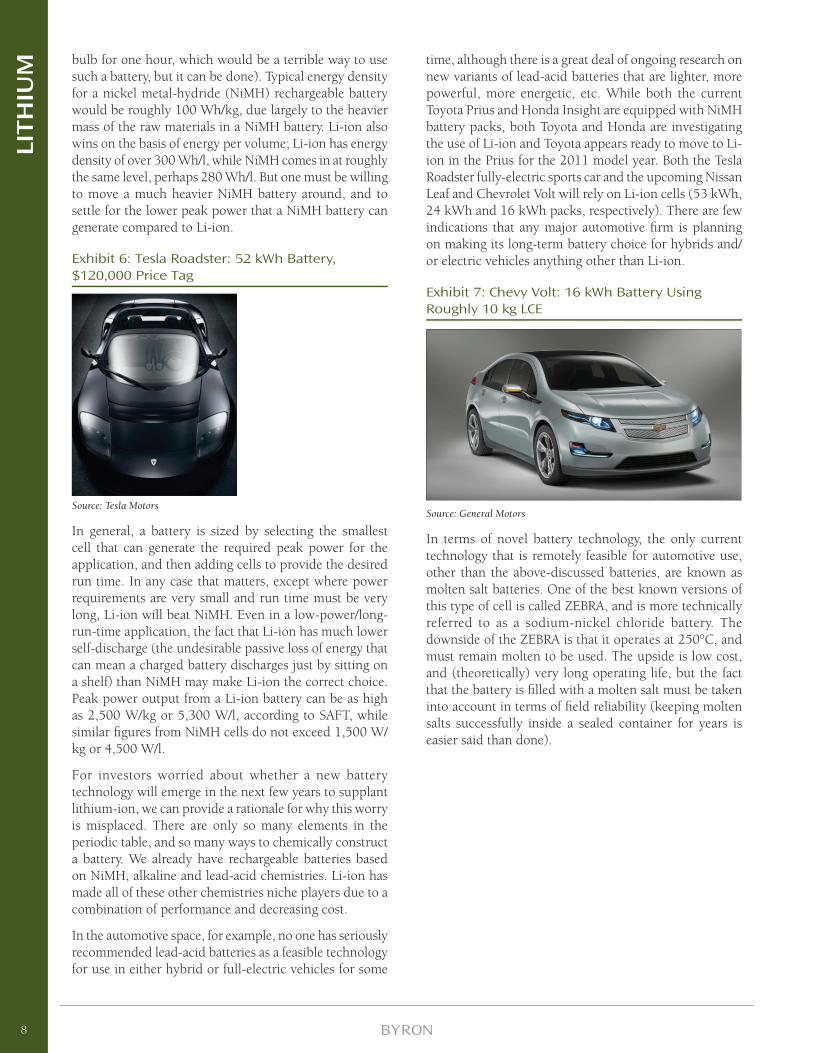
Exhibit 6: Tesla Roadster: 52 kWh Battery, $120,000 Price Tag
Source: Tesla Motors
In general, a battery is sized by selecting the smallest cell that can generate the required peak power for the application, and then adding cells to provide the desired run time. In any case that matters, except where power requirements are very small and run time must be very long, Li-ion will beat NiMH. Even in a low-power/long-run-time application, the fact that Li-ion has much lower self-discharge (the undesirable passive loss of energy that can mean a charged battery discharges just by sitting on a shelf) than NiMH may make Li-ion the correct choice. Peak power output from a Li-ion battery can be as high as 2,500 W/kg or 5,300 W/l, according to SAFT, while similar fi gures from NiMH cells do not exceed 1,500 W/kg or 4,500 W/l.
For investors worried about whether a new battery technology will emerge in the next few years to supplant lithium-ion, we can provide a rationale for why this worry is misplaced. There are only so many elements in the periodic table, and so many ways to chemically construct a battery. We already have rechargeable batteries based on NiMH, alkaline and lead-acid chemistries. Li-ion has made all of these other chemistries niche players due to a combination of performance and decreasing cost.
In the automotive space, for example, no one has seriously recommended lead-acid batteries as a feasible technology for use in either hybrid or full-electric vehicles for some
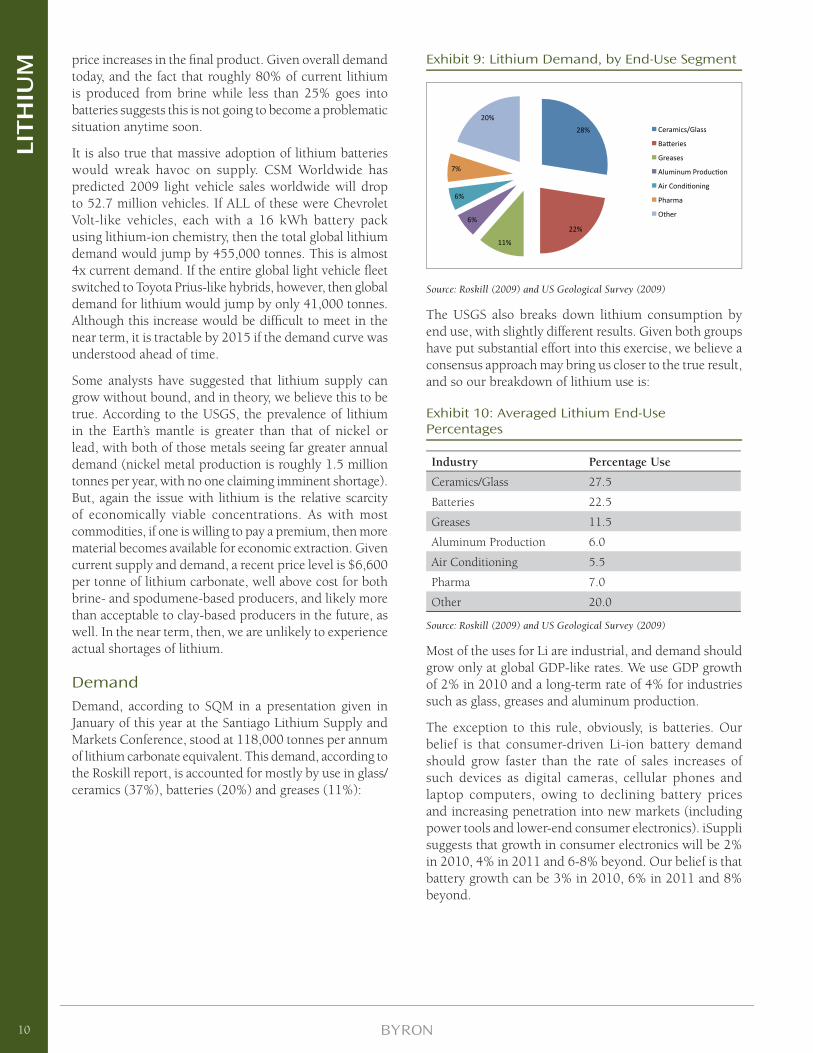
time, although there is a great deal of ongoing research on new variants of lead-acid batteries that are lighter, more powerful, more energetic, etc. While both the current Toyota Prius and Honda Insight are equipped with NiMH battery packs, both Toyota and Honda are investigating the use of Li-ion and Toyota appears ready to move to Li-ion in the Prius for the 2011 model year. Both the Tesla Roadster fully-electric sports car and the upcoming Nissan Leaf and Chevrolet Volt will rely on Li-ion cells (53 kWh, 24 kWh and 16 kWh packs, respectively). There are few indications that any major automotive fi rm is planning on making its long-term battery choice for hybrids and/or electric vehicles anything other than Li-ion.
Exhibit 7: Chevy Volt: 16 kWh Battery Using Roughly 10 kg LCE
Source: General Motors
In terms of novel battery technology, the only current technology that is remotely feasible for automotive use, other than the above-discussed batteries, are known as molten salt batteries. One of the best known versions of this type of cell is called ZEBRA, and is more technically referred to as a sodium-nickel chloride battery. The downside of the ZEBRA is that it operates at 250°C, and must remain molten to be used. The upside is low cost, and (theoretically) very long operating life, but the fact that the battery is fi lled with a molten salt must be taken into account in terms of fi eld reliability (keeping molten salts successfully inside a sealed container for years is easier said than done).
8
LITH
IUM
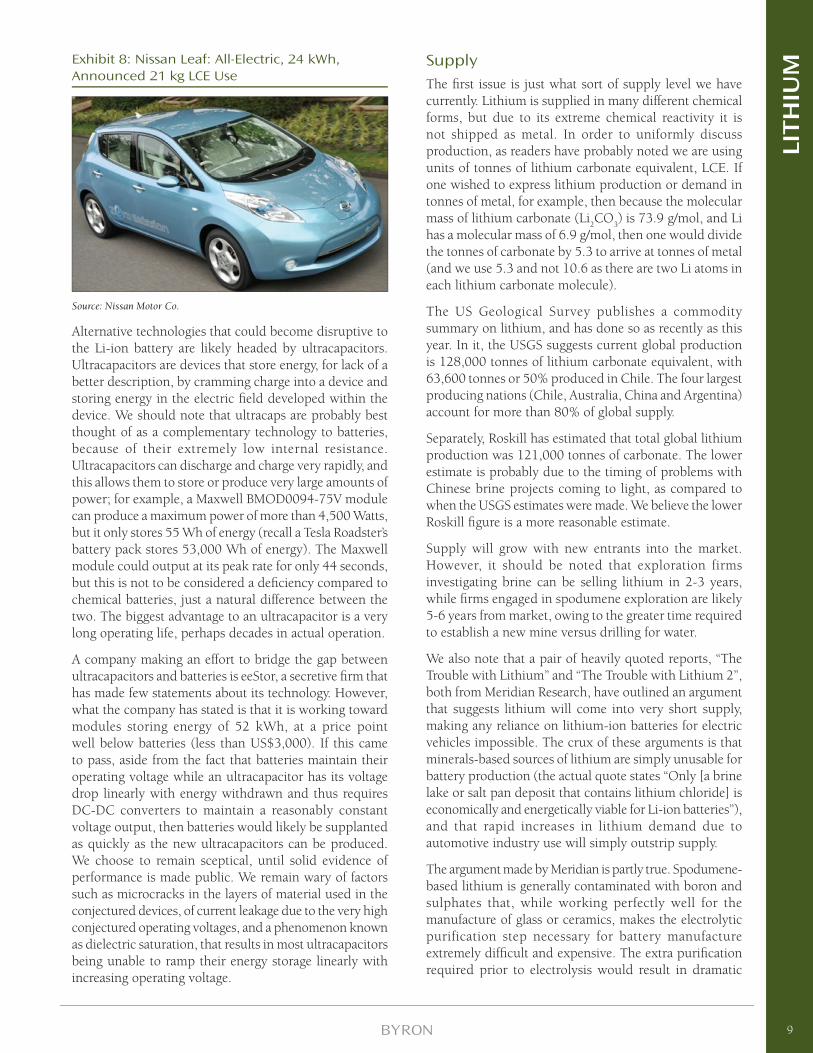
Exhibit 8: Nissan Leaf: All-Electric, 24 kWh, Announced 21 kg LCE Use
Source: Nissan Motor Co.
Alternative technologies that could become disruptive to the Li-ion battery are likely headed by ultracapacitors. Ultracapacitors are devices that store energy, for lack of a better description, by cramming charge into a device and storing energy in the electric fi eld developed within the device. We should note that ultracaps are probably best thought of as a complementary technology to batteries, because of their extremely low internal resistance. Ultracapacitors can discharge and charge very rapidly, and this allows them to store or produce very large amounts of power; for example, a Maxwell BMOD0094-75V module can produce a maximum power of more than 4,500 Watts, but it only stores 55 Wh of energy (recall a Tesla Roadster’s battery pack stores 53,000 Wh of energy). The Maxwell module could output at its peak rate for only 44 seconds, but this is not to be considered a defi ciency compared to chemical batteries, just a natural difference between the two. The biggest advantage to an ultracapacitor is a very long operating life, perhaps decades in actual operation.
A company making an effort to bridge the gap between ultracapacitors and batteries is eeStor, a secretive fi rm that has made few statements about its technology. However, what the company has stated is that it is working toward modules storing energy of 52 kWh, at a price point well below batteries (less than US$3,000). If this came to pass, aside from the fact that batteries maintain their operating voltage while an ultracapacitor has its voltage drop linearly with energy withdrawn and thus requires DC-DC converters to maintain a reasonably constant voltage output, then batteries would likely be supplanted as quickly as the new ultracapacitors can be produced. We choose to remain sceptical, until solid evidence of performance is made public. We remain wary of factors such as microcracks in the layers of material used in the conjectured devices, of current leakage due to the very high conjectured operating voltages, and a phenomenon known as dielectric saturation, that results in most ultracapacitors being unable to ramp their energy storage linearly with increasing operating voltage.
Supply The fi rst issue is just what sort of supply level we have currently. Lithium is supplied in many different chemical forms, but due to its extreme chemical reactivity it is not shipped as metal. In order to uniformly discuss production, as readers have probably noted we are using units of tonnes of lithium carbonate equivalent, LCE. If one wished to express lithium production or demand in tonnes of metal, for example, then because the molecular mass of lithium carbonate (Li
2CO
3) is 73.9 g/mol, and Li
has a molecular mass of 6.9 g/mol, then one would divide the tonnes of carbonate by 5.3 to arrive at tonnes of metal (and we use 5.3 and not 10.6 as there are two Li atoms in each lithium carbonate molecule).
The US Geological Survey publishes a commodity summary on lithium, and has done so as recently as this year. In it, the USGS suggests current global production is 128,000 tonnes of lithium carbonate equivalent, with 63,600 tonnes or 50% produced in Chile. The four largest producing nations (Chile, Australia, China and Argentina) account for more than 80% of global supply.
Separately, Roskill has estimated that total global lithium production was 121,000 tonnes of carbonate. The lower estimate is probably due to the timing of problems with Chinese brine projects coming to light, as compared to when the USGS estimates were made. We believe the lower Roskill fi gure is a more reasonable estimate.
Supply will grow with new entrants into the market. However, it should be noted that exploration firms investigating brine can be selling lithium in 2-3 years, while fi rms engaged in spodumene exploration are likely 5-6 years from market, owing to the greater time required to establish a new mine versus drilling for water.
We also note that a pair of heavily quoted reports, “The Trouble with Lithium” and “The Trouble with Lithium 2”, both from Meridian Research, have outlined an argument that suggests lithium will come into very short supply, making any reliance on lithium-ion batteries for electric vehicles impossible. The crux of these arguments is that minerals-based sources of lithium are simply unusable for battery production (the actual quote states “Only [a brine lake or salt pan deposit that contains lithium chloride] is economically and energetically viable for Li-ion batteries”), and that rapid increases in lithium demand due to automotive industry use will simply outstrip supply.
The argument made by Meridian is partly true. Spodumene-based lithium is generally contaminated with boron and sulphates that, while working perfectly well for the manufacture of glass or ceramics, makes the electrolytic purification step necessary for battery manufacture extremely diffi cult and expensive. The extra purifi cation required prior to electrolysis would result in dramatic
9
LITH
IUM
price increases in the fi nal product. Given overall demand today, and the fact that roughly 80% of current lithium is produced from brine while less than 25% goes into batteries suggests this is not going to become a problematic situation anytime soon.
It is also true that massive adoption of lithium batteries would wreak havoc on supply. CSM Worldwide has predicted 2009 light vehicle sales worldwide will drop to 52.7 million vehicles. If ALL of these were Chevrolet Volt-like vehicles, each with a 16 kWh battery pack using lithium-ion chemistry, then the total global lithium demand would jump by 455,000 tonnes. This is almost 4x current demand. If the entire global light vehicle fl eet switched to Toyota Prius-like hybrids, however, then global demand for lithium would jump by only 41,000 tonnes. Although this increase would be diffi cult to meet in the near term, it is tractable by 2015 if the demand curve was understood ahead of time.
Some analysts have suggested that lithium supply can grow without bound, and in theory, we believe this to be true. According to the USGS, the prevalence of lithium in the Earth’s mantle is greater than that of nickel or lead, with both of those metals seeing far greater annual demand (nickel metal production is roughly 1.5 million tonnes per year, with no one claiming imminent shortage). But, again the issue with lithium is the relative scarcity of economically viable concentrations. As with most commodities, if one is willing to pay a premium, then more material becomes available for economic extraction. Given current supply and demand, a recent price level is $6,600 per tonne of lithium carbonate, well above cost for both brine- and spodumene-based producers, and likely more than acceptable to clay-based producers in the future, as well. In the near term, then, we are unlikely to experience actual shortages of lithium.
DemandDemand, according to SQM in a presentation given in January of this year at the Santiago Lithium Supply and Markets Conference, stood at 118,000 tonnes per annum of lithium carbonate equivalent. This demand, according to the Roskill report, is accounted for mostly by use in glass/ceramics (37%), batteries (20%) and greases (11%):
Exhibit 9: Lithium Demand, by End-Use Segment
Source: Roskill (2009) and US Geological Survey (2009)
The USGS also breaks down lithium consumption by end use, with slightly different results. Given both groups have put substantial effort into this exercise, we believe a consensus approach may bring us closer to the true result, and so our breakdown of lithium use is:
Exhibit 10: Averaged Lithium End-Use Percentages
Industry Percentage Use
Ceramics/Glass 27.5
Batteries 22.5
Greases 11.5
Aluminum Production 6.0
Air Conditioning 5.5
Pharma 7.0
Other 20.0
Source: Roskill (2009) and US Geological Survey (2009)
Most of the uses for Li are industrial, and demand should grow only at global GDP-like rates. We use GDP growth of 2% in 2010 and a long-term rate of 4% for industries such as glass, greases and aluminum production.
The exception to this rule, obviously, is batteries. Our belief is that consumer-driven Li-ion battery demand should grow faster than the rate of sales increases of such devices as digital cameras, cellular phones and laptop computers, owing to declining battery prices and increasing penetration into new markets (including power tools and lower-end consumer electronics). iSuppli suggests that growth in consumer electronics will be 2% in 2010, 4% in 2011 and 6-8% beyond. Our belief is that battery growth can be 3% in 2010, 6% in 2011 and 8% beyond.
10
LITH
IUM
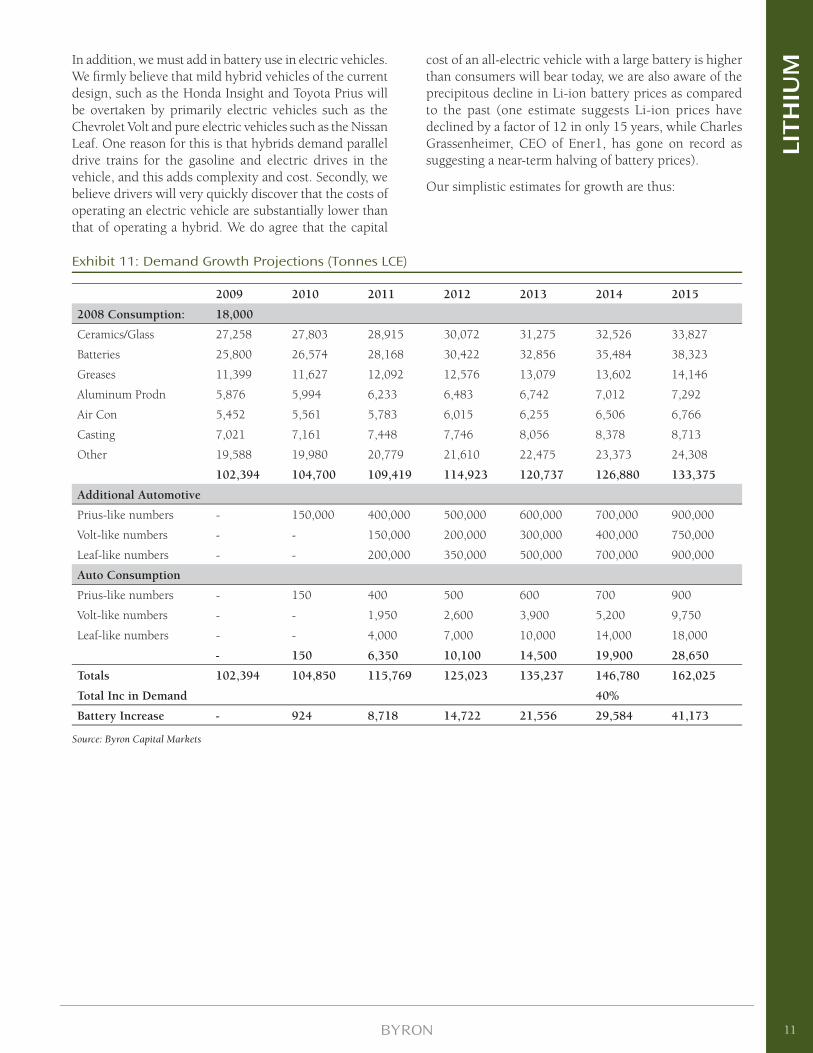
Exhibit 11: Demand Growth Projections (Tonnes LCE)
2009 2010 2011 2012 2013 2014 2015
2008 Consumption: 18,000
Ceramics/Glass 27,258 27,803 28,915 30,072 31,275 32,526 33,827
Batteries 25,800 26,574 28,168 30,422 32,856 35,484 38,323
Greases 11,399 11,627 12,092 12,576 13,079 13,602 14,146
Aluminum Prodn 5,876 5,994 6,233 6,483 6,742 7,012 7,292
Air Con 5,452 5,561 5,783 6,015 6,255 6,506 6,766
Casting 7,021 7,161 7,448 7,746 8,056 8,378 8,713
Other 19,588 19,980 20,779 21,610 22,475 23,373 24,308
102,394 104,700 109,419 114,923 120,737 126,880 133,375
Additional Automotive
Prius-like numbers - 150,000 400,000 500,000 600,000 700,000 900,000
Volt-like numbers - - 150,000 200,000 300,000 400,000 750,000
Leaf-like numbers - - 200,000 350,000 500,000 700,000 900,000
Auto Consumption
Prius-like numbers - 150 400 500 600 700 900
Volt-like numbers - - 1,950 2,600 3,900 5,200 9,750
Leaf-like numbers - - 4,000 7,000 10,000 14,000 18,000
- 150 6,350 10,100 14,500 19,900 28,650
Totals 102,394 104,850 115,769 125,023 135,237 146,780 162,025
Total Inc in Demand 40%
Battery Increase - 924 8,718 14,722 21,556 29,584 41,173
Source: Byron Capital Markets
In addition, we must add in battery use in electric vehicles. We fi rmly believe that mild hybrid vehicles of the current design, such as the Honda Insight and Toyota Prius will be overtaken by primarily electric vehicles such as the Chevrolet Volt and pure electric vehicles such as the Nissan Leaf. One reason for this is that hybrids demand parallel drive trains for the gasoline and electric drives in the vehicle, and this adds complexity and cost. Secondly, we believe drivers will very quickly discover that the costs of operating an electric vehicle are substantially lower than that of operating a hybrid. We do agree that the capital
cost of an all-electric vehicle with a large battery is higher than consumers will bear today, we are also aware of the precipitous decline in Li-ion battery prices as compared to the past (one estimate suggests Li-ion prices have declined by a factor of 12 in only 15 years, while Charles Grassenheimer, CEO of Ener1, has gone on record as suggesting a near-term halving of battery prices).
Our simplistic estimates for growth are thus:
11
LITH
IUM
Conclusion – Our Green Thought(s) for the DayWe are now beginning to see the sort of vacillation that has plagued the environmental movement for years be applied to the question of automobiles. As the automotive industry moves toward electric vehicles, some are noting that electric cars may actually be net negative factors for the environment. For example, one argument suggests that since electricity in the United States is at least 50% generated by coal-fi red plants, using electric cars will result in more pollution and greenhouse gas emissions, not less.
We are pleased to be able to refute that concern with some hard data. Recently, Chevrolet touted the effi ciency of the upcoming Volt by widely publicizing a 230 mpg fuel economy rating, the level Chevrolet management believe the new Volt will attain in offi cial testing. But much less widely reported was a more meaningful economy rating; the Volt uses only 25 kWh of energy to travel 100 miles. A very fuel effi cient gasoline-powered car can get 50 mpg on the highway, taking 2 gallons of gasoline to travel 100 miles. Two gallons of gasoline contain roughly 70 kWh of energy. Hence, the primarily electric Volt uses only 36% the energy to travel down the highway as a fuel-effi cient gasoline powered car. This is because the electric car wastes less energy, generated in a gasoline powered car as waste heat from its engine or mechanical losses in the drive train.
The US consumes nine million barrels of motor gasoline per day. This is equivalent to nearly 13 billion kWh of energy per day, simply to drive gasoline powered vehicles around the nation’s roads. If this consumption can be cut to 36% of present levels, the decrease in greenhouse gas emissions would be enormous, regardless of whether the necessary electrical energy comes from burning coal, the fi ssion of uranium, or sunlight falling on solar cells.
Of course, nothing is perfect. While electrical energy consumption to drive a converted US small vehicle fl eet might drop from 13 billion kWh per day to only 5 billion kWh, the entire US generating grid delivered only 11 billion kWh in 2008. Clearly, adding 50% to the generating burden of the United States is a massive undertaking. The problem is actually worse, because if most of those electric vehicles must be recharged overnight, then all those kilowatt hours of energy must be delivered in 12 hours, and we are left, again, with a required doubling of US generating capacity.
Even a reasonably small fraction of the US transportation fl eet converting to electricity would necessitate the use of some sort of technology to prevent blackouts owing to sudden increases in demand from electric vehicle charging,
a “smart grid” of sorts. This, too, would be expensive, but perhaps it holds out the greatest hope of all.
Unreliable forms of power generation, such as wind or solar photovoltaic or solar thermal, can only penetrate into the grid at high rates when some sort of buffer is available. Electric cars can provide that buffer, but not as a form of mass storage. Of nearly equivalent value to a power utility as a storage buffer is a readily variable load. And a smart grid that knows when electric cars are plugged in and can commence charging them or stop charging them at will would allow the demand on the grid to adjust to unreliable (the industry term is “non-dispatchable”) generating technology, such as wind. Wind and solar could then become signifi cant fractions of grid generating capacity.
Now, in the end we do believe that new nuclear generating stations are ultimately required to wean us off fossil fuels and drastically curtail greenhouse gas emissions, but wind makes an interesting stop-gap. Electric vehicles may well turn out to be just what the environment ordered, and electric vehicles are dependent on the lightest metal in the periodic table, lithium.
In order to reap the rewards of increasing lithium demand, we would suggest to investors that they are best served by owning junior exploration companies, the fi rms most heavily levered to increasing lithium demand. We would further suggest owning a basket of these equities, as the exploration and fi nancial risk in any one name is high. We also strongly suggest owning the likely lowest-cost producers, since this protects against fl uctuations in the price of lithium most effectively. We prefer companies basing their exploration on brine, especially brine in known regions where chemistry and hydrogeology are more likely to yield economically viable discoveries.
We are also attracted to those companies exploring the potential of hectorite clays. Since brine producers are limited in terms of having to wait for evaporation to take place, they are largely unable to respond to surges in price or demand. Spodumene-based producers could, but we are concerned about their high operating costs. So we would also suggest that investors reserve part of their portfolio for fi rms researching lithium from clays, such as the deposits of hectorite in Nevada.
It seems to us that there will be no shortage of demand for Li-ion batteries in the future. While we cannot at present predict what particular permutation of chemistry will win the day, or what battery company may be the largest benefi ciary of this demand, we can confi dently predict that there will be more demand for lithium. We can equally confi dently say that those owning shares in strong lithium exploration companies stand to be rewarded.
12
LITH
IUM
Disclosures
Information contained in this Industry report has been drawn from sources believed to be reliable but its accuracy or completeness is not guaranteed, nor in providing it does Byron Capital Markets (a division of Byron Securities Limited) assume any responsibility or liability. From time to time, Byron Capital Markets and its directors, offi cers and other employees may maintain positions in the securities that are directly or indirectly involved in this Industry. The contents of this report cannot be reproduced in whole or in part without the expressed permission of Byron Capital Markets. This information is intended for use by accredited investors only, and is not intended for use by any U.S. investor.
Byron Capital Markets Policies and Procedures Regarding the Dissemination of Research
General policy is to make available a research report to its clients for an exclusive period of up to 30 days. Following that period, the research report will appear on the Byron Capital Markets website at www.byroncapitalmarkets.com.
Analyst Certifi cation
I, Jon Hykawy, certify the views expressed in this report were formed by my review of relevant company data and industry investigation, and accurately refl ect my opinion about the investment merits of the securities mentioned in the report. I also certify that my compensation is not related to specifi c recommendations or views expressed in this report.
Byron Capital Markets publishes research and investment recommendations for the use of its clients. Information regarding our categories of recommendations, quarterly summaries of the percentage of our recommendations that fall into each category and our policies regarding the release of our research reports is available at www.byroncapitalmarkets.com, or may be requested by contacting the analyst.
13
LITH
IUM
Western Lithium Canada Corporation(WLC-TSXV: $1.51)
Rating: SPECULATIVE BUYTarget Price: $3.50 December 3, 2009
Battery Grade or (Maybe?) BustInitiating Coverage with a BUY Recommendation:
• Western Lithium (WLC:TSXV) is a developer targeting production of pure lithium from clays for the rechargeable battery industry.
• We initiate coverage as SPECULATIVE BUY with a 3.50 target.
Potentially Pure:
• Of the two fl ow sheets developed for hectorite clay, leaching by Chevron and roasting by the US Bureau of Mines, WLC has targeted and refi ned lithium production via roasting.
• We believe roasting is inherently more expensive than leaching, but roasting may produce cleaner lithium which can be sold at a premium, compared to brine-based lithium carbonate.
Pure U.S. Made Lithium Means High Margins:
• The ability to manufacture pure lithium in the United States may allow WLC to achieve high margins by selling its product to U.S. and Asian lithium battery manufacturers.
• With 22% of current lithium demand from the battery industry, WLC could easily fi nd demand for
All fi gures in US$, unless otherwise noted
Recent Price: C$1.51
52 Week Range: C$0.11-1.62
Shares O/S: basic 79.70 million
f.d. 99.91 million
Market Cap (f.d.): C$150.9 million
Average Vol. (3 mo.) 386,000
Fiscal Year End: Sep. 30
Cash (Sep 30/09, est.): C$21 million
Financials 2013E 2014E
Tonnes Li2CO
3 6,000 25,000
Revenue (C$ M) $45.0 $187.5
EPS (C$) $(0.06) $0.49
Cash Flow/Share (C$) $0.14 $0.71
Company DescriptionWestern Lithium Canada Corporation is a junior lithium developer, with a twist. Rather than searching for brines as most companies in the space, the company is seeking cost-effective ways to produce and market highly purifi ed lithium chemicals made from hectorite clay deposits located in Nevada.
its initial annual production target of 25,000 tonnes of carbonate equivalent.
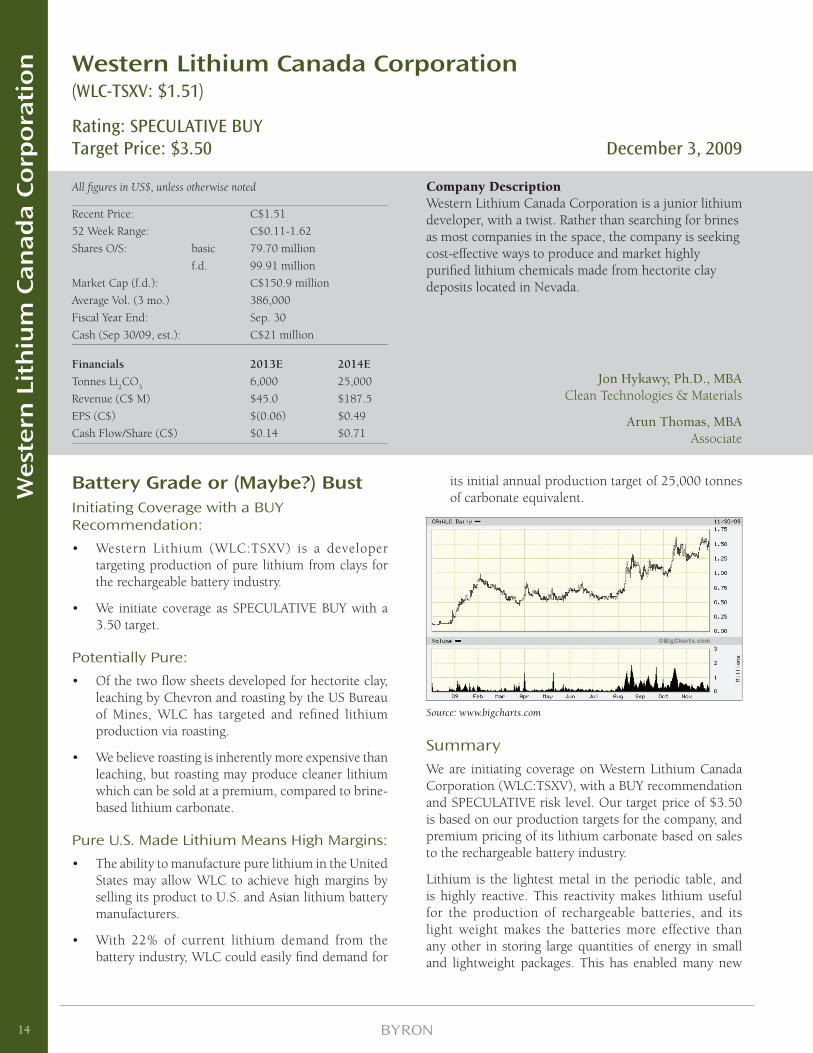
Source: www.bigcharts.com
SummaryWe are initiating coverage on Western Lithium Canada Corporation (WLC:TSXV), with a BUY recommendation and SPECULATIVE risk level. Our target price of $3.50 is based on our production targets for the company, and premium pricing of its lithium carbonate based on sales to the rechargeable battery industry.
Lithium is the lightest metal in the periodic table, and is highly reactive. This reactivity makes lithium useful for the production of rechargeable batteries, and its light weight makes the batteries more effective than any other in storing large quantities of energy in small and lightweight packages. This has enabled many new
Jon Hykawy, Ph.D., MBAClean Technologies & Materials
Arun Thomas, MBAAssociate
14
West
ern
Lit
hiu
m C
an
ad
a C
orp
ora
tio
n
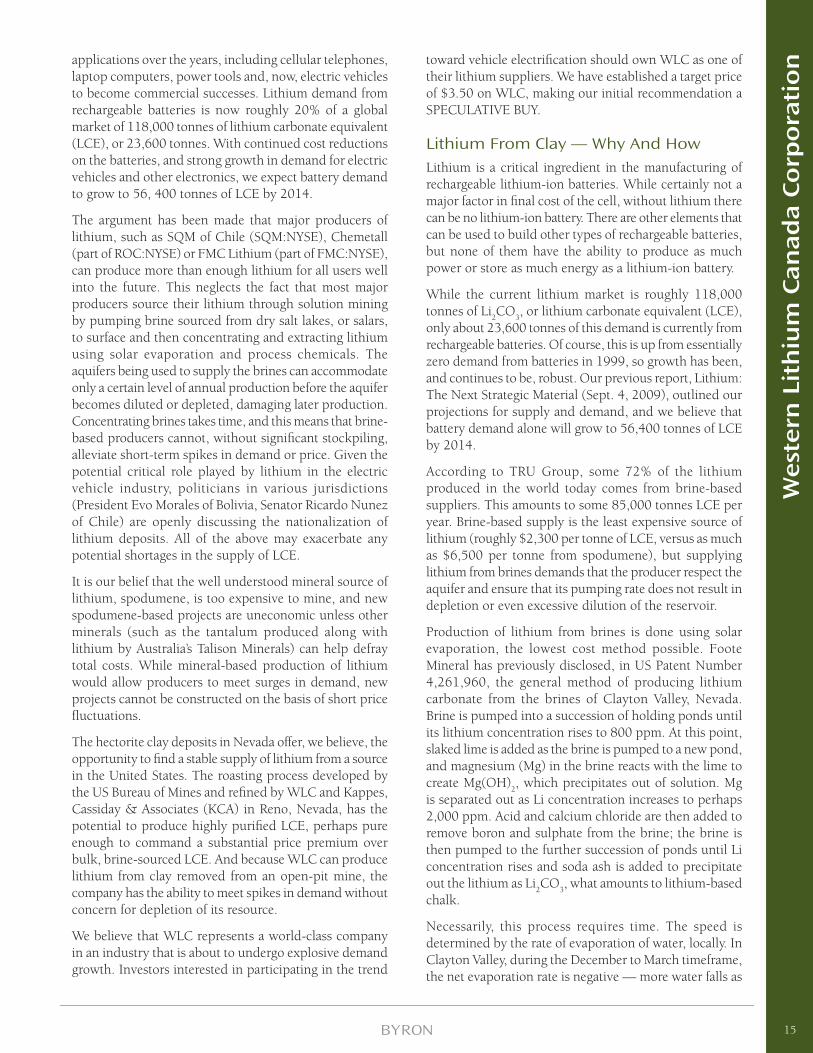
applications over the years, including cellular telephones, laptop computers, power tools and, now, electric vehicles to become commercial successes. Lithium demand from rechargeable batteries is now roughly 20% of a global market of 118,000 tonnes of lithium carbonate equivalent (LCE), or 23,600 tonnes. With continued cost reductions on the batteries, and strong growth in demand for electric vehicles and other electronics, we expect battery demand to grow to 56, 400 tonnes of LCE by 2014.
The argument has been made that major producers of lithium, such as SQM of Chile (SQM:NYSE), Chemetall (part of ROC:NYSE) or FMC Lithium (part of FMC:NYSE), can produce more than enough lithium for all users well into the future. This neglects the fact that most major producers source their lithium through solution mining by pumping brine sourced from dry salt lakes, or salars, to surface and then concentrating and extracting lithium using solar evaporation and process chemicals. The aquifers being used to supply the brines can accommodate only a certain level of annual production before the aquifer becomes diluted or depleted, damaging later production. Concentrating brines takes time, and this means that brine-based producers cannot, without signifi cant stockpiling, alleviate short-term spikes in demand or price. Given the potential critical role played by lithium in the electric vehicle industry, politicians in various jurisdictions (President Evo Morales of Bolivia, Senator Ricardo Nunez of Chile) are openly discussing the nationalization of lithium deposits. All of the above may exacerbate any potential shortages in the supply of LCE.
It is our belief that the well understood mineral source of lithium, spodumene, is too expensive to mine, and new spodumene-based projects are uneconomic unless other minerals (such as the tantalum produced along with lithium by Australia’s Talison Minerals) can help defray total costs. While mineral-based production of lithium would allow producers to meet surges in demand, new projects cannot be constructed on the basis of short price fl uctuations.
The hectorite clay deposits in Nevada offer, we believe, the opportunity to fi nd a stable supply of lithium from a source in the United States. The roasting process developed by the US Bureau of Mines and refi ned by WLC and Kappes, Cassiday & Associates (KCA) in Reno, Nevada, has the potential to produce highly purifi ed LCE, perhaps pure enough to command a substantial price premium over bulk, brine-sourced LCE. And because WLC can produce lithium from clay removed from an open-pit mine, the company has the ability to meet spikes in demand without concern for depletion of its resource.
We believe that WLC represents a world-class company in an industry that is about to undergo explosive demand growth. Investors interested in participating in the trend
toward vehicle electrifi cation should own WLC as one of their lithium suppliers. We have established a target price of $3.50 on WLC, making our initial recommendation a SPECULATIVE BUY.
Lithium From Clay — Why And HowLithium is a critical ingredient in the manufacturing of rechargeable lithium-ion batteries. While certainly not a major factor in fi nal cost of the cell, without lithium there can be no lithium-ion battery. There are other elements that can be used to build other types of rechargeable batteries, but none of them have the ability to produce as much power or store as much energy as a lithium-ion battery.
While the current lithium market is roughly 118,000 tonnes of Li
2CO
3, or lithium carbonate equivalent (LCE),
only about 23,600 tonnes of this demand is currently from rechargeable batteries. Of course, this is up from essentially zero demand from batteries in 1999, so growth has been, and continues to be, robust. Our previous report, Lithium: The Next Strategic Material (Sept. 4, 2009), outlined our projections for supply and demand, and we believe that battery demand alone will grow to 56,400 tonnes of LCE by 2014.
According to TRU Group, some 72% of the lithium produced in the world today comes from brine-based suppliers. This amounts to some 85,000 tonnes LCE per year. Brine-based supply is the least expensive source of lithium (roughly $2,300 per tonne of LCE, versus as much as $6,500 per tonne from spodumene), but supplying lithium from brines demands that the producer respect the aquifer and ensure that its pumping rate does not result in depletion or even excessive dilution of the reservoir.
Production of lithium from brines is done using solar evaporation, the lowest cost method possible. Foote Mineral has previously disclosed, in US Patent Number 4,261,960, the general method of producing lithium carbonate from the brines of Clayton Valley, Nevada. Brine is pumped into a succession of holding ponds until its lithium concentration rises to 800 ppm. At this point, slaked lime is added as the brine is pumped to a new pond, and magnesium (Mg) in the brine reacts with the lime to create Mg(OH)
2, which precipitates out of solution. Mg
is separated out as Li concentration increases to perhaps 2,000 ppm. Acid and calcium chloride are then added to remove boron and sulphate from the brine; the brine is then pumped to the further succession of ponds until Li concentration rises and soda ash is added to precipitate out the lithium as Li
2CO
3, what amounts to lithium-based
chalk.
Necessarily, this process requires time. The speed is determined by the rate of evaporation of water, locally. In Clayton Valley, during the December to March timeframe, the net evaporation rate is negative — more water falls as
15
West
ern
Lit
hiu
m C
an
ad
a C
orp
ora
tio
n
snow than evaporates from ponds. As such, Chemetall does not even attempt to use its ponds during winter months. And even in the best environments on Earth, the time to produce lithium is measured in sizeable fractions of a year, not days or weeks. It is thus impossible, barring stockpiling, for a brine-based producer to respond to sudden spikes in price or demand for lithium. Note that it is during shortages when we would expect demand spikes to be most problematic, so stockpiles would likely have been drawn down.
A mineral-based producer can respond to spikes in demand relatively quickly, compared to a brine-based producer. The problem is that we estimate all-in costs for a spodumene operation producing lithium and no other metals to be as high as $6,500 per tonne LCE. This is due to high costs from the extraction of the ore, and high costs to leach out the lithium. Spodumene operations can be very cost effective if selling to the glass industry, as the glass makers can settle for using concentrates, removing a signifi cant amount of both process chemical and plant costs. But there has not historically been a low-cost mineral-based lithium solution for the chemical or battery industries.
This possibility was originally investigated by Chevron Research. In the 1970s and 1980s, Chevron looked into clay deposits in Nevada that showed anomalously high levels of Li. This clay, known as hectorite after the town of Hector, California, where it was fi rst identifi ed, has a substitution chemistry, with Li atoms taking the place of Mg in the form NaO
3(Mg,Li)
3Si
4O
10(F,OH)
2. Chevron found
that its leaching process (using lime to precipitate out Mg, leaching the clay with sulphuric acid to free lithium and then converting lithium sulphate to carbonate using soda ash) would produce quality lithium but at a price disadvantage to brine production. We believe the cost of lithium produced from clays by leaching is roughly $3,000 per tonne, as opposed to perhaps $2,300 per tonne for very good brine. Given that at the time the lithium market was small and purely industrial, with industrial rates of growth, it is not surprising that Chevron chose to discontinue its work on the Kings Valley hectorite deposit.
The US Bureau of Mines examined an even more expensive method of producing lithium from hectorite, namely roasting. The roasting cycle involves removing and pulverizing the clays, then heating to roughly 1,000°C in the presence of sulphates (such as gypsum) and oxides (such as lime or, in the case of the circuit developed by WLC and its partner KCA, dolomite). Roasting converts lithium in the hectorite to lithium sulphate, which is then washed out of the clay into solution in water, and the presence of hydroxides keep undesirable contaminants such as magnesium from converting to water-soluble form. Once the lithium is dissolved in process water, the conversion to insoluble lithium carbonate is done using soda ash.
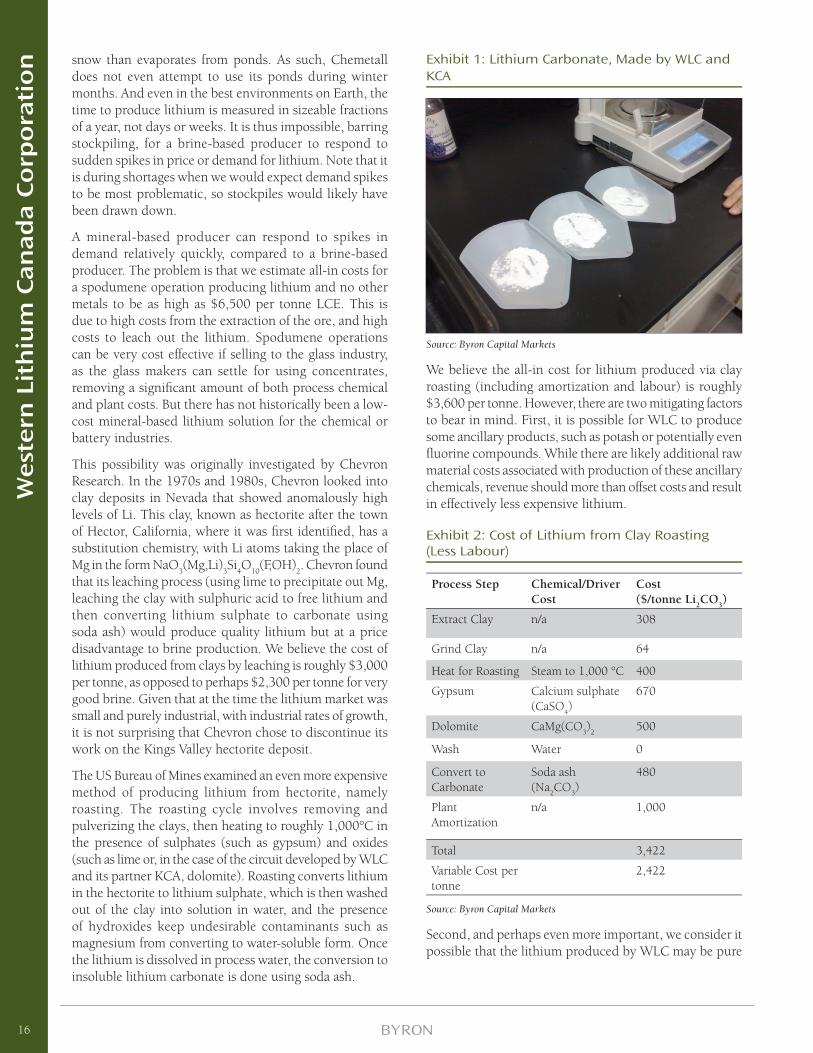
Exhibit 1: Lithium Carbonate, Made by WLC and KCA
Source: Byron Capital Markets
We believe the all-in cost for lithium produced via clay roasting (including amortization and labour) is roughly $3,600 per tonne. However, there are two mitigating factors to bear in mind. First, it is possible for WLC to produce some ancillary products, such as potash or potentially even fl uorine compounds. While there are likely additional raw material costs associated with production of these ancillary chemicals, revenue should more than offset costs and result in effectively less expensive lithium.
Exhibit 2: Cost of Lithium from Clay Roasting (Less Labour)
Process Step Chemical/Driver Cost
Cost ($/tonne Li
2CO
3)
Extract Clay n/a 308
Grind Clay n/a 64
Heat for Roasting Steam to 1,000 °C 400
Gypsum Calcium sulphate (CaSO
4)
670
Dolomite CaMg(CO3)
2500
Wash Water 0
Convert to Carbonate
Soda ash (Na
2CO
3)
480
Plant Amortization
n/a 1,000
Total 3,422
Variable Cost per tonne
2,422
Source: Byron Capital Markets
Second, and perhaps even more important, we consider it possible that the lithium produced by WLC may be pure
16
West
ern
Lit
hiu
m C
an
ad
a C
orp
ora
tio
n
enough to either substantially reduce the costs associated with refi ning bulk lithium to battery-grade chemical, or eliminate those costs entirely. Normal bulk-grade lithium carbonate from brine production is at roughly 99% purity, but battery production, depending on the manufacturer, may demand lithium of 99.9% purity or higher, with certain contaminants such as iron or calcium mandated to be below stringent thresholds. If WLC can produce what is essentially battery-grade product at the above cost, the company would likely be extremely successful.
The Deposit — Hectorite Clay in the Desert
We have recently had the opportunity to take a brief tour of Western Lithium’s claims in the Nevada desert, near the Oregon border. WLC shares a fi eld house and sample collection centre with Western Uranium Corp. (WUC:TSXV), the original holder of the claims and a shareholder in WLC. We drove with Western Lithium’s Senior VP of Development, Dennis Bryan, and Marketing Director, James Hayter, through both the PCD and South lens deposits of hectorite.
Exhibit 3: Our Tour Route in Nevada
Source: Byron Capital Markets
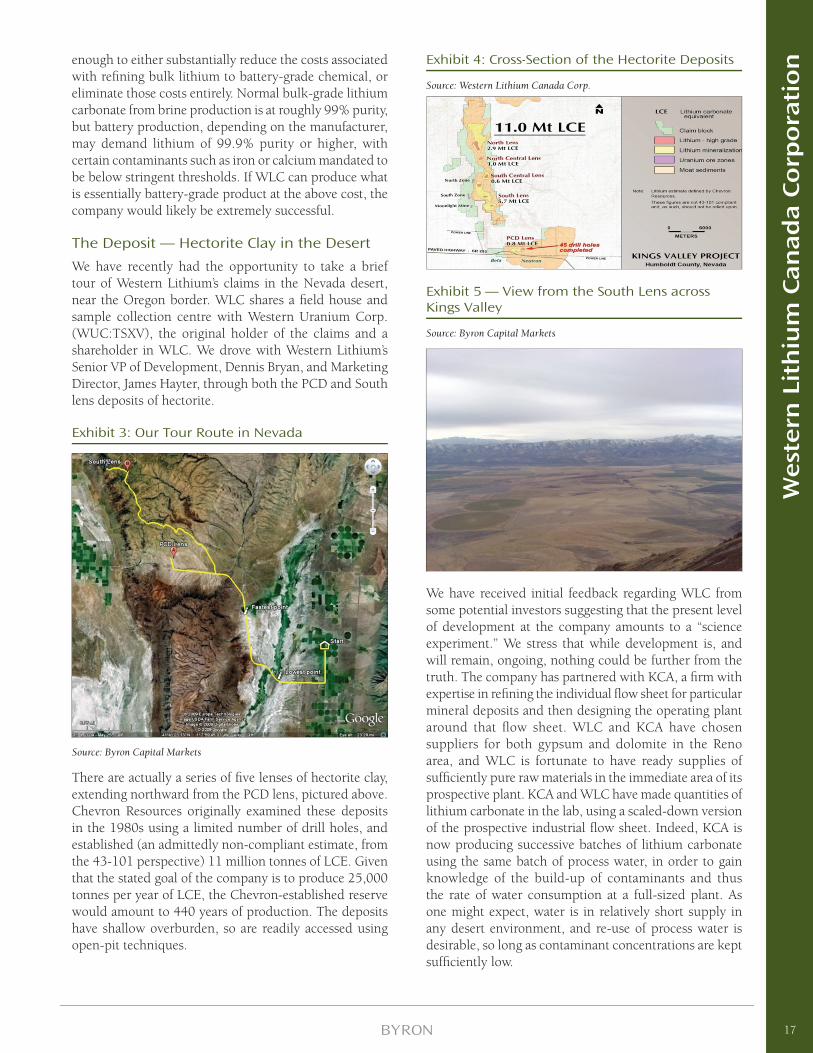
There are actually a series of fi ve lenses of hectorite clay, extending northward from the PCD lens, pictured above. Chevron Resources originally examined these deposits in the 1980s using a limited number of drill holes, and established (an admittedly non-compliant estimate, from the 43-101 perspective) 11 million tonnes of LCE. Given that the stated goal of the company is to produce 25,000 tonnes per year of LCE, the Chevron-established reserve would amount to 440 years of production. The deposits have shallow overburden, so are readily accessed using open-pit techniques.
Exhibit 4: Cross-Section of the Hectorite Deposits
Source: Western Lithium Canada Corp.
Exhibit 5 — View from the South Lens across Kings Valley
Source: Byron Capital Markets
We have received initial feedback regarding WLC from some potential investors suggesting that the present level of development at the company amounts to a “science experiment.” We stress that while development is, and will remain, ongoing, nothing could be further from the truth. The company has partnered with KCA, a fi rm with expertise in refi ning the individual fl ow sheet for particular mineral deposits and then designing the operating plant around that fl ow sheet. WLC and KCA have chosen suppliers for both gypsum and dolomite in the Reno area, and WLC is fortunate to have ready supplies of suffi ciently pure raw materials in the immediate area of its prospective plant. KCA and WLC have made quantities of lithium carbonate in the lab, using a scaled-down version of the prospective industrial fl ow sheet. Indeed, KCA is now producing successive batches of lithium carbonate using the same batch of process water, in order to gain knowledge of the build-up of contaminants and thus the rate of water consumption at a full-sized plant. As one might expect, water is in relatively short supply in any desert environment, and re-use of process water is desirable, so long as contaminant concentrations are kept suffi ciently low.
17
West
ern
Lit
hiu
m C
an
ad
a C
orp
ora
tio
n
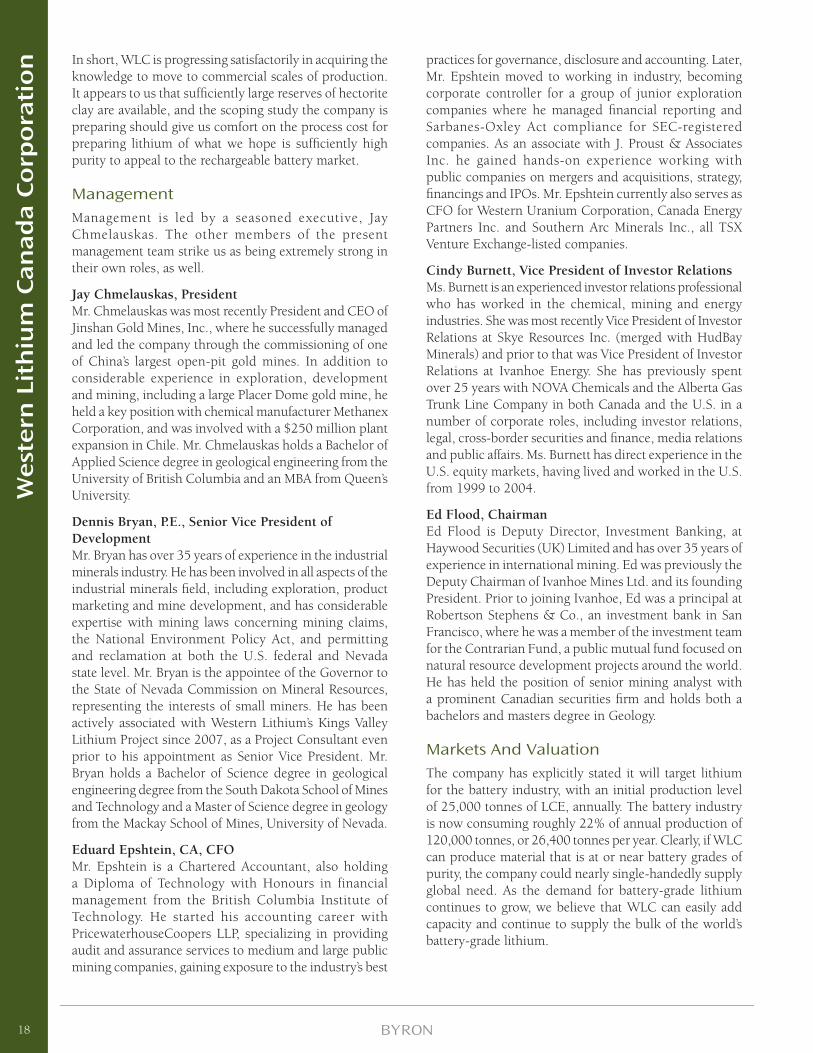
In short, WLC is progressing satisfactorily in acquiring the knowledge to move to commercial scales of production. It appears to us that suffi ciently large reserves of hectorite clay are available, and the scoping study the company is preparing should give us comfort on the process cost for preparing lithium of what we hope is suffi ciently high purity to appeal to the rechargeable battery market.
ManagementManagement is led by a seasoned executive, Jay Chmelauskas. The other members of the present management team strike us as being extremely strong in their own roles, as well.
Jay Chmelauskas, PresidentMr. Chmelauskas was most recently President and CEO of Jinshan Gold Mines, Inc., where he successfully managed and led the company through the commissioning of one of China’s largest open-pit gold mines. In addition to considerable experience in exploration, development and mining, including a large Placer Dome gold mine, he held a key position with chemical manufacturer Methanex Corporation, and was involved with a $250 million plant expansion in Chile. Mr. Chmelauskas holds a Bachelor of Applied Science degree in geological engineering from the University of British Columbia and an MBA from Queen’s University.
Dennis Bryan, P.E., Senior Vice President of DevelopmentMr. Bryan has over 35 years of experience in the industrial minerals industry. He has been involved in all aspects of the industrial minerals fi eld, including exploration, product marketing and mine development, and has considerable expertise with mining laws concerning mining claims, the National Environment Policy Act, and permitting and reclamation at both the U.S. federal and Nevada state level. Mr. Bryan is the appointee of the Governor to the State of Nevada Commission on Mineral Resources, representing the interests of small miners. He has been actively associated with Western Lithium’s Kings Valley Lithium Project since 2007, as a Project Consultant even prior to his appointment as Senior Vice President. Mr. Bryan holds a Bachelor of Science degree in geological engineering degree from the South Dakota School of Mines and Technology and a Master of Science degree in geology from the Mackay School of Mines, University of Nevada.
Eduard Epshtein, CA, CFOMr. Epshtein is a Chartered Accountant, also holding a Diploma of Technology with Honours in financial management from the British Columbia Institute of Technology. He started his accounting career with PricewaterhouseCoopers LLP, specializing in providing audit and assurance services to medium and large public mining companies, gaining exposure to the industry’s best
practices for governance, disclosure and accounting. Later, Mr. Epshtein moved to working in industry, becoming corporate controller for a group of junior exploration companies where he managed fi nancial reporting and Sarbanes-Oxley Act compliance for SEC-registered companies. As an associate with J. Proust & Associates Inc. he gained hands-on experience working with public companies on mergers and acquisitions, strategy, fi nancings and IPOs. Mr. Epshtein currently also serves as CFO for Western Uranium Corporation, Canada Energy Partners Inc. and Southern Arc Minerals Inc., all TSX Venture Exchange-listed companies.
Cindy Burnett, Vice President of Investor RelationsMs. Burnett is an experienced investor relations professional who has worked in the chemical, mining and energy industries. She was most recently Vice President of Investor Relations at Skye Resources Inc. (merged with HudBay Minerals) and prior to that was Vice President of Investor Relations at Ivanhoe Energy. She has previously spent over 25 years with NOVA Chemicals and the Alberta Gas Trunk Line Company in both Canada and the U.S. in a number of corporate roles, including investor relations, legal, cross-border securities and fi nance, media relations and public affairs. Ms. Burnett has direct experience in the U.S. equity markets, having lived and worked in the U.S. from 1999 to 2004.
Ed Flood, ChairmanEd Flood is Deputy Director, Investment Banking, at Haywood Securities (UK) Limited and has over 35 years of experience in international mining. Ed was previously the Deputy Chairman of Ivanhoe Mines Ltd. and its founding President. Prior to joining Ivanhoe, Ed was a principal at Robertson Stephens & Co., an investment bank in San Francisco, where he was a member of the investment team for the Contrarian Fund, a public mutual fund focused on natural resource development projects around the world. He has held the position of senior mining analyst with a prominent Canadian securities fi rm and holds both a bachelors and masters degree in Geology.
Markets And ValuationThe company has explicitly stated it will target lithium for the battery industry, with an initial production level of 25,000 tonnes of LCE, annually. The battery industry is now consuming roughly 22% of annual production of 120,000 tonnes, or 26,400 tonnes per year. Clearly, if WLC can produce material that is at or near battery grades of purity, the company could nearly single-handedly supply global need. As the demand for battery-grade lithium continues to grow, we believe that WLC can easily add capacity and continue to supply the bulk of the world’s battery-grade lithium.
18
West
ern
Lit
hiu
m C
an
ad
a C
orp
ora
tio
n
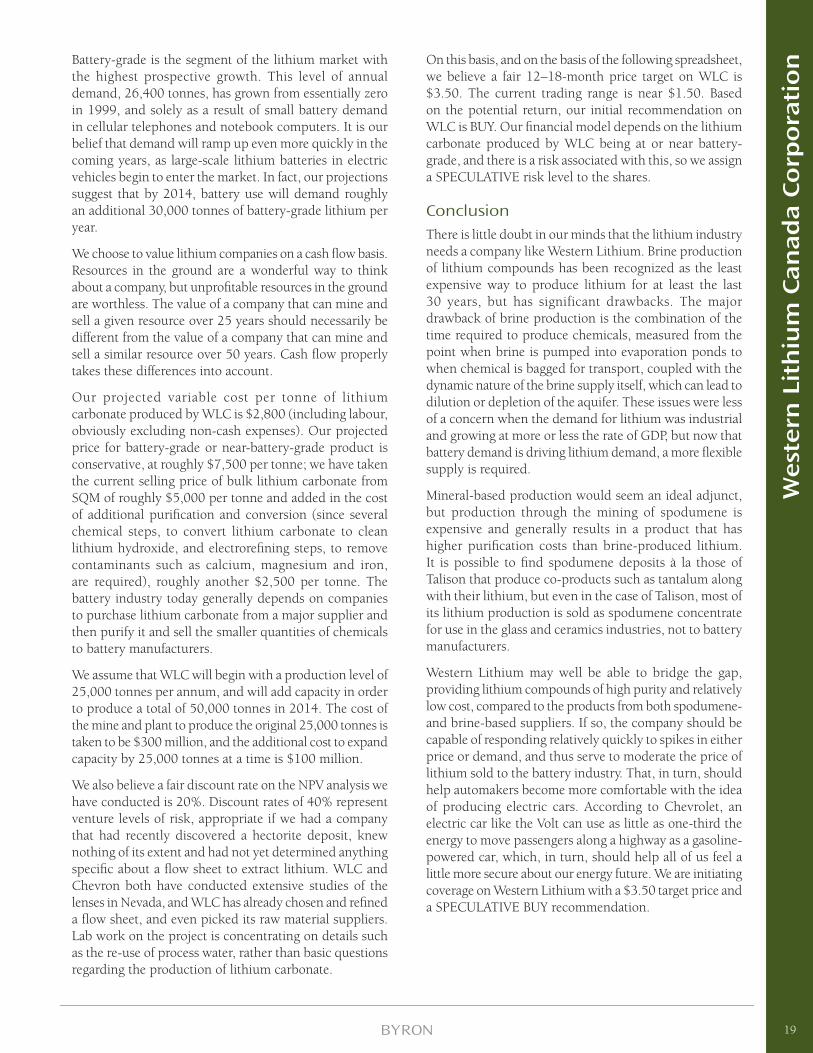
Battery-grade is the segment of the lithium market with the highest prospective growth. This level of annual demand, 26,400 tonnes, has grown from essentially zero in 1999, and solely as a result of small battery demand in cellular telephones and notebook computers. It is our belief that demand will ramp up even more quickly in the coming years, as large-scale lithium batteries in electric vehicles begin to enter the market. In fact, our projections suggest that by 2014, battery use will demand roughly an additional 30,000 tonnes of battery-grade lithium per year.
We choose to value lithium companies on a cash fl ow basis. Resources in the ground are a wonderful way to think about a company, but unprofi table resources in the ground are worthless. The value of a company that can mine and sell a given resource over 25 years should necessarily be different from the value of a company that can mine and sell a similar resource over 50 years. Cash fl ow properly takes these differences into account.
Our projected variable cost per tonne of lithium carbonate produced by WLC is $2,800 (including labour, obviously excluding non-cash expenses). Our projected price for battery-grade or near-battery-grade product is conservative, at roughly $7,500 per tonne; we have taken the current selling price of bulk lithium carbonate from SQM of roughly $5,000 per tonne and added in the cost of additional purifi cation and conversion (since several chemical steps, to convert lithium carbonate to clean lithium hydroxide, and electrorefi ning steps, to remove contaminants such as calcium, magnesium and iron, are required), roughly another $2,500 per tonne. The battery industry today generally depends on companies to purchase lithium carbonate from a major supplier and then purify it and sell the smaller quantities of chemicals to battery manufacturers.
We assume that WLC will begin with a production level of 25,000 tonnes per annum, and will add capacity in order to produce a total of 50,000 tonnes in 2014. The cost of the mine and plant to produce the original 25,000 tonnes is taken to be $300 million, and the additional cost to expand capacity by 25,000 tonnes at a time is $100 million.
We also believe a fair discount rate on the NPV analysis we have conducted is 20%. Discount rates of 40% represent venture levels of risk, appropriate if we had a company that had recently discovered a hectorite deposit, knew nothing of its extent and had not yet determined anything specifi c about a fl ow sheet to extract lithium. WLC and Chevron both have conducted extensive studies of the lenses in Nevada, and WLC has already chosen and refi ned a fl ow sheet, and even picked its raw material suppliers. Lab work on the project is concentrating on details such as the re-use of process water, rather than basic questions regarding the production of lithium carbonate.
On this basis, and on the basis of the following spreadsheet, we believe a fair 12–18-month price target on WLC is $3.50. The current trading range is near $1.50. Based on the potential return, our initial recommendation on WLC is BUY. Our fi nancial model depends on the lithium carbonate produced by WLC being at or near battery-grade, and there is a risk associated with this, so we assign a SPECULATIVE risk level to the shares.
ConclusionThere is little doubt in our minds that the lithium industry needs a company like Western Lithium. Brine production of lithium compounds has been recognized as the least expensive way to produce lithium for at least the last 30 years, but has significant drawbacks. The major drawback of brine production is the combination of the time required to produce chemicals, measured from the point when brine is pumped into evaporation ponds to when chemical is bagged for transport, coupled with the dynamic nature of the brine supply itself, which can lead to dilution or depletion of the aquifer. These issues were less of a concern when the demand for lithium was industrial and growing at more or less the rate of GDP, but now that battery demand is driving lithium demand, a more fl exible supply is required.
Mineral-based production would seem an ideal adjunct, but production through the mining of spodumene is expensive and generally results in a product that has higher purifi cation costs than brine-produced lithium. It is possible to fi nd spodumene deposits à la those of Talison that produce co-products such as tantalum along with their lithium, but even in the case of Talison, most of its lithium production is sold as spodumene concentrate for use in the glass and ceramics industries, not to battery manufacturers.
Western Lithium may well be able to bridge the gap, providing lithium compounds of high purity and relatively low cost, compared to the products from both spodumene-and brine-based suppliers. If so, the company should be capable of responding relatively quickly to spikes in either price or demand, and thus serve to moderate the price of lithium sold to the battery industry. That, in turn, should help automakers become more comfortable with the idea of producing electric cars. According to Chevrolet, an electric car like the Volt can use as little as one-third the energy to move passengers along a highway as a gasoline-powered car, which, in turn, should help all of us feel a little more secure about our energy future. We are initiating coverage on Western Lithium with a $3.50 target price and a SPECULATIVE BUY recommendation.
19
West
ern
Lit
hiu
m C
an
ad
a C
orp
ora
tio
n
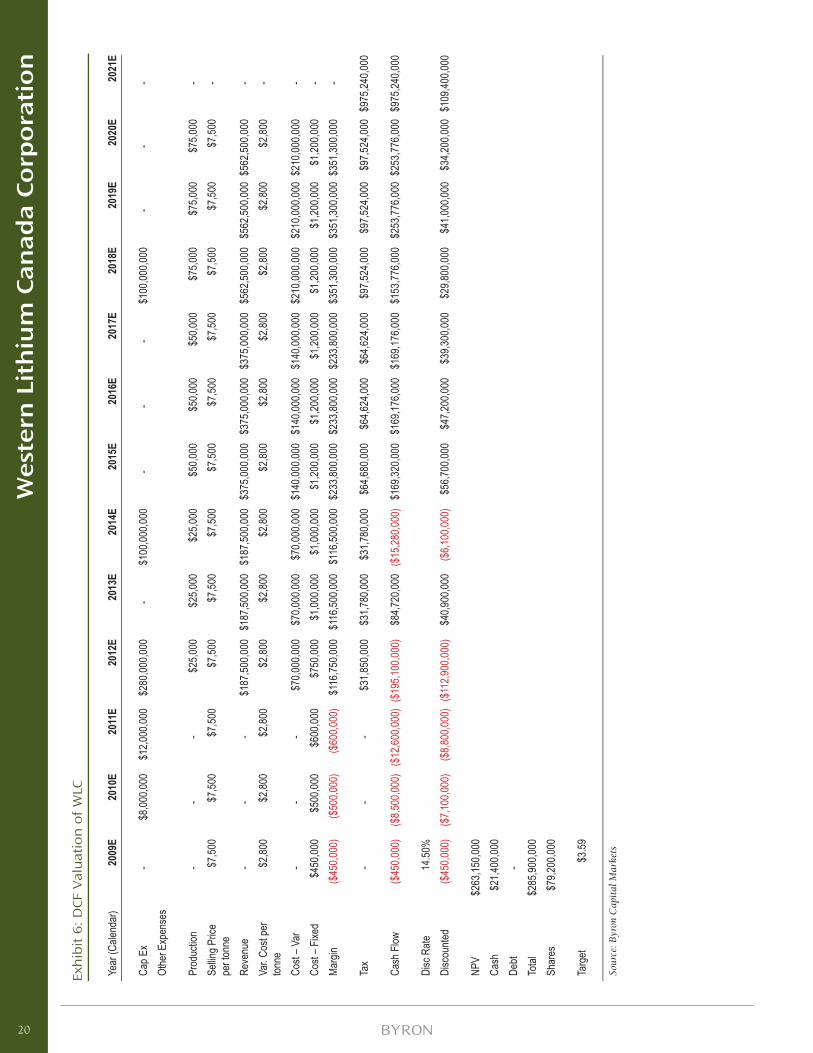
Exh
ibit
6:
DCF
Val
uat
ion
of
WLC
Year
(Cale
ndar
) 20
09E
2010
E20
11E
2012
E20
13E
2014
E20
15E
2016
E20
17E
2018
E20
19E
2020
E20
21E
Cap E
x -
$8,00
0,000
$1
2,000
,000
$280
,000,0
00
- $1
00,00
0,000
-
- -
$100
,000,0
00
- -
- Ot
her E
xpen
ses
Prod
uctio
n -
- -
$25,0
00
$25,0
00
$25,0
00
$50,0
00
$50,0
00
$50,0
00
$75,0
00
$75,0
00
$75,0
00
- Se
lling P
rice
per t
onne
$7,50
0 $7
,500
$7,50
0 $7
,500
$7,50
0 $7
,500
$7,50
0 $7
,500
$7,50
0 $7
,500
$7,50
0 $7
,500
-
Reve
nue
- -
- $1
87,50
0,000
$1
87,50
0,000
$1
87,50
0,000
$3
75,00
0,000
$3
75,00
0,000
$3
75,00
0,000
$5
62,50
0,000
$5
62,50
0,000
$56
2,500
,000
- Va
r. Cos
t per
ton
ne$2
,800
$2,80
0 $2
,800
$2,80
0 $2
,800
$2,80
0 $2
,800
$2,80
0 $2
,800
$2,80
0 $2
,800
$2,80
0 -
Cost
– Var
- -
- $7
0,000
,000
$70,0
00,00
0 $7
0,000
,000
$140
,000,0
00
$140
,000,0
00
$140
,000,0
00
$210
,000,0
00
$210
,000,0
00 $
210,0
00,00
0 -
Cost
– Fixe
d$4
50,00
0 $5
00,00
0 $6
00,00
0 $7
50,00
0 $1
,000,0
00
$1,00
0,000
$1
,200,0
00
$1,20
0,000
$1
,200,0
00
$1,20
0,000
$1
,200,0
00
$1,20
0,000
-
Marg
in($
450,0
00)
($50
0,000
)($
600,0
00)
$116
,750,0
00
$116
,500,0
00
$116
,500,0
00
$233
,800,0
00
$233
,800,0
00
$233
,800,0
00
$351
,300,0
00
$351
,300,0
00 $
351,3
00,00
0 -
Tax
- -
- $3
1,850
,000
$31,7
80,00
0 $3
1,780
,000
$64,6
80,00
0 $6
4,624
,000
$64,6
24,00
0 $9
7,524
,000
$97,5
24,00
0 $9
7,524
,000
$975
,240,0
00
Cash
Flow
($45
0,000
)($
8,500
,000)
($12
,600,0
00)
($19
5,100
,000)
$84,7
20,00
0 ($
15,28
0,000
)$1
69,32
0,000
$1
69,17
6,000
$1
69,17
6,000
$1
53,77
6,000
$2
53,77
6,000
$25
3,776
,000
$975
,240,0
00
Disc
Rate
14.50
%Di
scou
nted
($45
0,000
)($
7,100
,000)
($8,8
00,00
0)($
112,9
00,00
0)$4
0,900
,000
($6,1
00,00
0)$5
6,700
,000
$47,2
00,00
0 $3
9,300
,000
$29,8
00,00
0 $4
1,000
,000
$34,2
00,00
0 $1
09,40
0,000
NPV
$263
,150,0
00
Cash
$2
1,400
,000
Debt
- To
tal$2
85,90
0,000
Sh
ares
$79,2
00,00
0
Targ
et$3
.59
Sour
ce: B
yron
Cap
ital
Mar
kets
20
West
ern
Lit
hiu
m C
an
ad
a C
orp
ora
tio
n
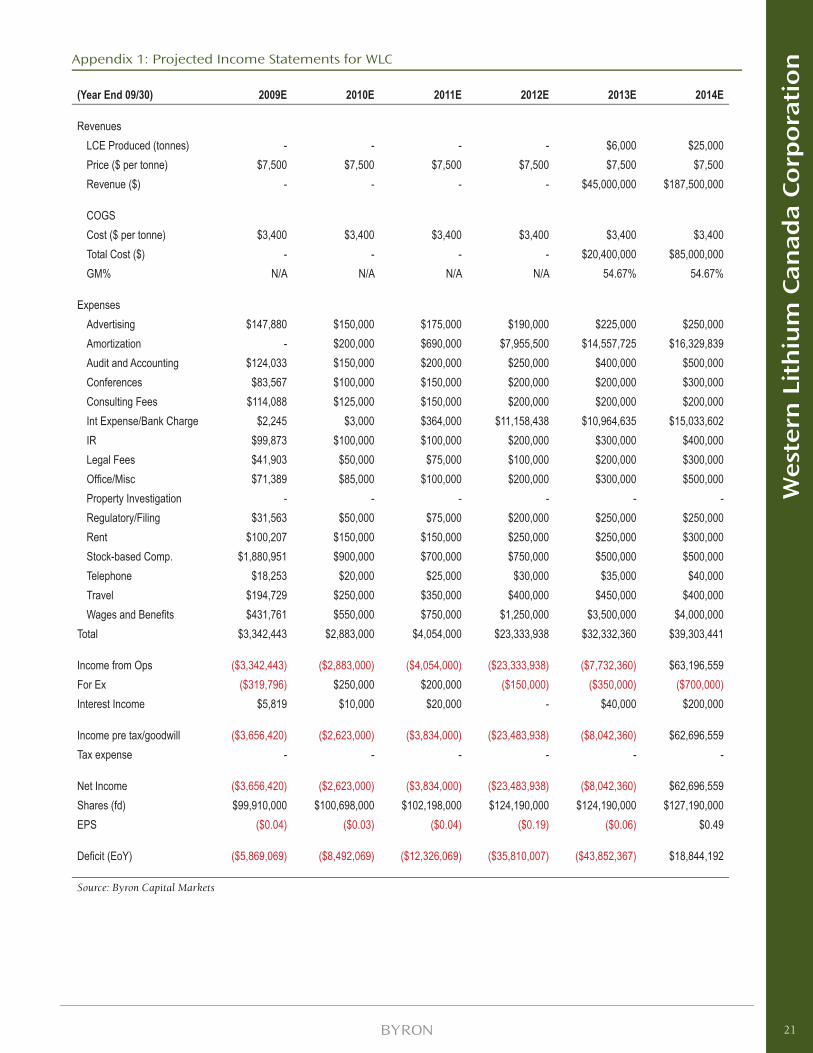
Appendix 1: Projected Income Statements for WLC
(Year End 09/30) 2009E 2010E 2011E 2012E 2013E 2014E
RevenuesLCE Produced (tonnes) - - - - $6,000 $25,000 Price ($ per tonne) $7,500 $7,500 $7,500 $7,500 $7,500 $7,500 Revenue ($) - - - - $45,000,000 $187,500,000
COGSCost ($ per tonne) $3,400 $3,400 $3,400 $3,400 $3,400 $3,400 Total Cost ($) - - - - $20,400,000 $85,000,000 GM% N/A N/A N/A N/A 54.67% 54.67%
ExpensesAdvertising $147,880 $150,000 $175,000 $190,000 $225,000 $250,000 Amortization - $200,000 $690,000 $7,955,500 $14,557,725 $16,329,839 Audit and Accounting $124,033 $150,000 $200,000 $250,000 $400,000 $500,000 Conferences $83,567 $100,000 $150,000 $200,000 $200,000 $300,000 Consulting Fees $114,088 $125,000 $150,000 $200,000 $200,000 $200,000 Int Expense/Bank Charge $2,245 $3,000 $364,000 $11,158,438 $10,964,635 $15,033,602 IR $99,873 $100,000 $100,000 $200,000 $300,000 $400,000 Legal Fees $41,903 $50,000 $75,000 $100,000 $200,000 $300,000 Offi ce/Misc $71,389 $85,000 $100,000 $200,000 $300,000 $500,000 Property Investigation - - - - - - Regulatory/Filing $31,563 $50,000 $75,000 $200,000 $250,000 $250,000 Rent $100,207 $150,000 $150,000 $250,000 $250,000 $300,000 Stock-based Comp. $1,880,951 $900,000 $700,000 $750,000 $500,000 $500,000 Telephone $18,253 $20,000 $25,000 $30,000 $35,000 $40,000 Travel $194,729 $250,000 $350,000 $400,000 $450,000 $400,000 Wages and Benefi ts $431,761 $550,000 $750,000 $1,250,000 $3,500,000 $4,000,000
Total $3,342,443 $2,883,000 $4,054,000 $23,333,938 $32,332,360 $39,303,441
Income from Ops ($3,342,443) ($2,883,000) ($4,054,000) ($23,333,938) ($7,732,360) $63,196,559 For Ex ($319,796) $250,000 $200,000 ($150,000) ($350,000) ($700,000)Interest Income $5,819 $10,000 $20,000 - $40,000 $200,000
Income pre tax/goodwill ($3,656,420) ($2,623,000) ($3,834,000) ($23,483,938) ($8,042,360) $62,696,559 Tax expense - - - - - -
Net Income ($3,656,420) ($2,623,000) ($3,834,000) ($23,483,938) ($8,042,360) $62,696,559 Shares (fd) $99,910,000 $100,698,000 $102,198,000 $124,190,000 $124,190,000 $127,190,000 EPS ($0.04) ($0.03) ($0.04) ($0.19) ($0.06) $0.49
Defi cit (EoY) ($5,869,069) ($8,492,069) ($12,326,069) ($35,810,007) ($43,852,367) $18,844,192
Source: Byron Capital Markets
21
West
ern
Lit
hiu
m C
an
ad
a C
orp
ora
tio
n
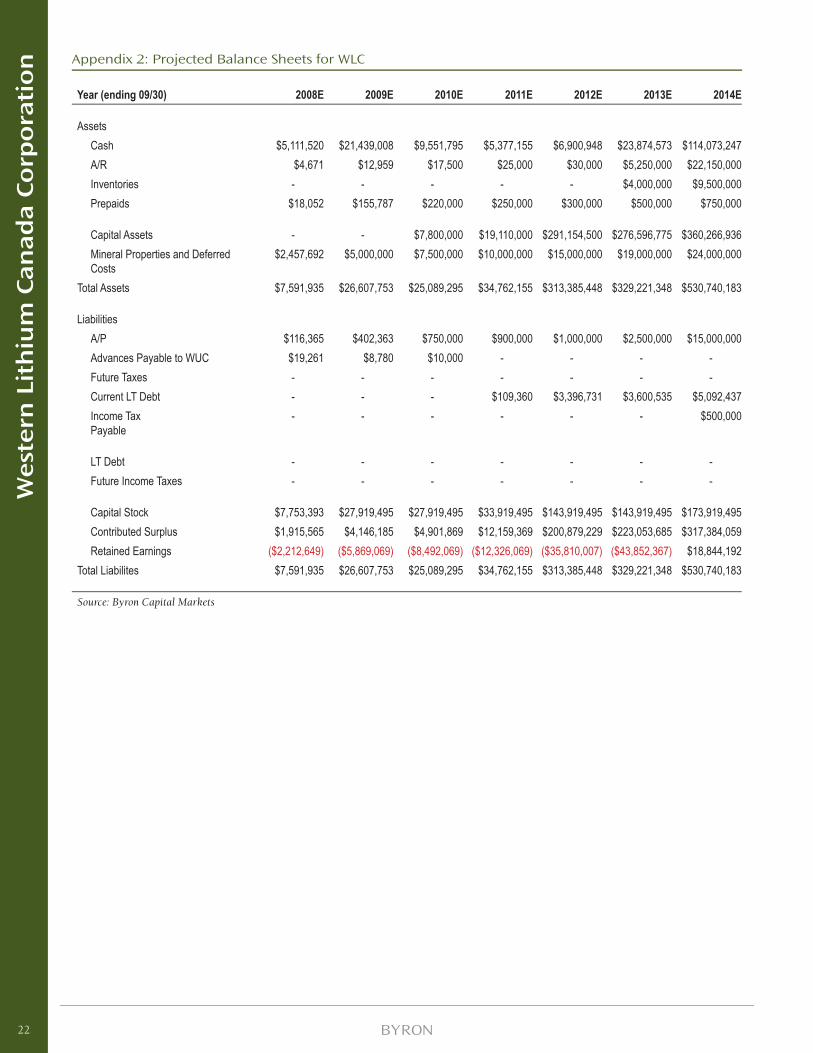
Appendix 2: Projected Balance Sheets for WLC
Year (ending 09/30) 2008E 2009E 2010E 2011E 2012E 2013E 2014E
AssetsCash $5,111,520 $21,439,008 $9,551,795 $5,377,155 $6,900,948 $23,874,573 $114,073,247 A/R $4,671 $12,959 $17,500 $25,000 $30,000 $5,250,000 $22,150,000 Inventories - - - - - $4,000,000 $9,500,000 Prepaids $18,052 $155,787 $220,000 $250,000 $300,000 $500,000 $750,000
Capital Assets - - $7,800,000 $19,110,000 $291,154,500 $276,596,775 $360,266,936 Mineral Properties and Deferred Costs
$2,457,692 $5,000,000 $7,500,000 $10,000,000 $15,000,000 $19,000,000 $24,000,000
Total Assets $7,591,935 $26,607,753 $25,089,295 $34,762,155 $313,385,448 $329,221,348 $530,740,183
LiabilitiesA/P $116,365 $402,363 $750,000 $900,000 $1,000,000 $2,500,000 $15,000,000 Advances Payable to WUC $19,261 $8,780 $10,000 - - - - Future Taxes - - - - - - - Current LT Debt - - - $109,360 $3,396,731 $3,600,535 $5,092,437 Income Tax Payable
- - - - - - $500,000
LT Debt - - - - - - - Future Income Taxes - - - - - - -
Capital Stock $7,753,393 $27,919,495 $27,919,495 $33,919,495 $143,919,495 $143,919,495 $173,919,495 Contributed Surplus $1,915,565 $4,146,185 $4,901,869 $12,159,369 $200,879,229 $223,053,685 $317,384,059 Retained Earnings ($2,212,649) ($5,869,069) ($8,492,069) ($12,326,069) ($35,810,007) ($43,852,367) $18,844,192
Total Liabilites $7,591,935 $26,607,753 $25,089,295 $34,762,155 $313,385,448 $329,221,348 $530,740,183
Source: Byron Capital Markets
22
West
ern
Lit
hiu
m C
an
ad
a C
orp
ora
tio
n
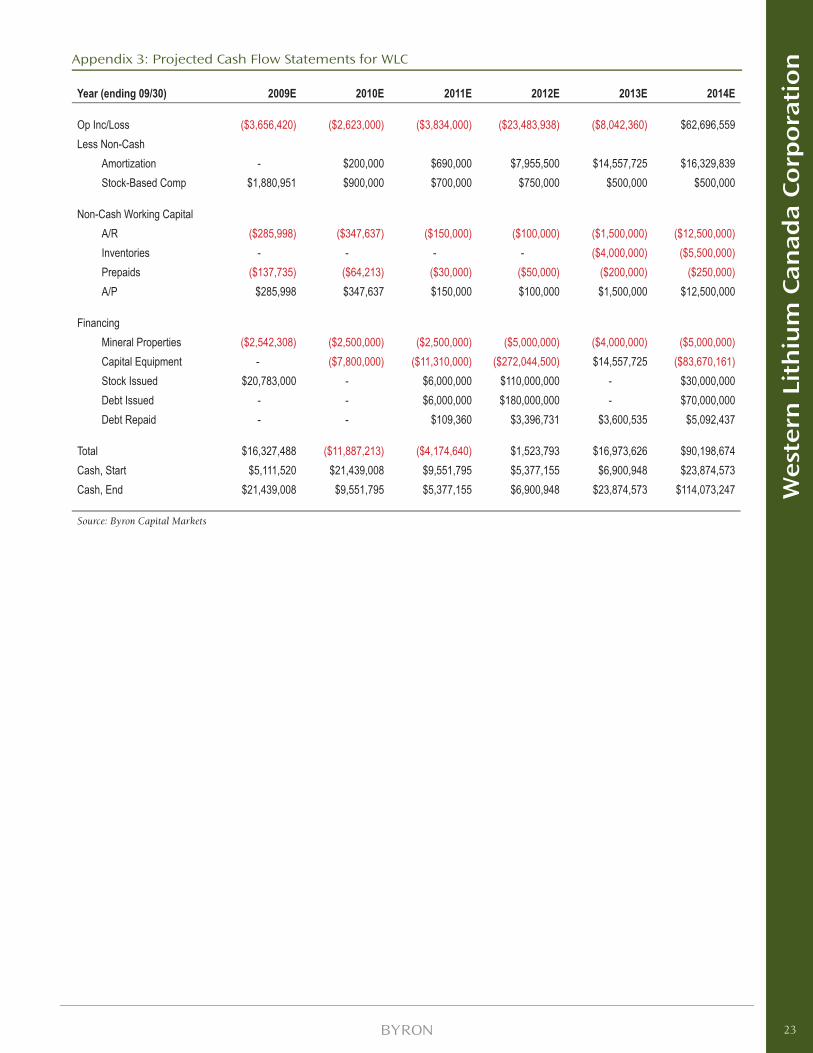
Appendix 3: Projected Cash Flow Statements for WLC
Year (ending 09/30) 2009E 2010E 2011E 2012E 2013E 2014E
Op Inc/Loss ($3,656,420) ($2,623,000) ($3,834,000) ($23,483,938) ($8,042,360) $62,696,559 Less Non-Cash
Amortization - $200,000 $690,000 $7,955,500 $14,557,725 $16,329,839 Stock-Based Comp $1,880,951 $900,000 $700,000 $750,000 $500,000 $500,000
Non-Cash Working CapitalA/R ($285,998) ($347,637) ($150,000) ($100,000) ($1,500,000) ($12,500,000)Inventories - - - - ($4,000,000) ($5,500,000)Prepaids ($137,735) ($64,213) ($30,000) ($50,000) ($200,000) ($250,000)A/P $285,998 $347,637 $150,000 $100,000 $1,500,000 $12,500,000
FinancingMineral Properties ($2,542,308) ($2,500,000) ($2,500,000) ($5,000,000) ($4,000,000) ($5,000,000)Capital Equipment - ($7,800,000) ($11,310,000) ($272,044,500) $14,557,725 ($83,670,161)Stock Issued $20,783,000 - $6,000,000 $110,000,000 - $30,000,000 Debt Issued - - $6,000,000 $180,000,000 - $70,000,000 Debt Repaid - - $109,360 $3,396,731 $3,600,535 $5,092,437
Total $16,327,488 ($11,887,213) ($4,174,640) $1,523,793 $16,973,626 $90,198,674 Cash, Start $5,111,520 $21,439,008 $9,551,795 $5,377,155 $6,900,948 $23,874,573 Cash, End $21,439,008 $9,551,795 $5,377,155 $6,900,948 $23,874,573 $114,073,247
Source: Byron Capital Markets
23
West
ern
Lit
hiu
m C
an
ad
a C
orp
ora
tio
n
IMPORTANT DISCLOSURES
Analyst’s Certifi cation
All of the views expressed in this report accurately refl ect the personal views of the responsible analyst(s) about any and all of the subject securities or issuers. No part of the compensation of the responsible analyst(s) named herein is, or will be, directly or indirectly, related to the specifi c recommendations or views expressed by the responsible analyst(s) in this report. The particulars contained herein were obtained from sources which we believe to be reliable but are not guaranteed by us and may be incomplete.
Byron Capital Markets (“BCM”) is a division of Byron Securities Limited which is a Member of IIROC and CIPF. BCM compensates its research analysts from a variety of sources. The research department is a cost centre and is funded by the business activities of BCM including institutional equity sales and trading, retail sales and corporate and investment banking. Since the revenues from these businesses vary the funds for research compensation vary. No one business line has greater infl uence than any other for research analyst compensation.
Dissemination of Research
BCM endeavors to make all reasonable efforts to provide research simultaneously to all eligible clients. BCM equity research is distributed electronically via email and is posted on our proprietary websites to ensure eligible clients receive coverage initiations and ratings changes, targets and opinions in a timely manner. Additional distribution may be done by the sales personnel via email, fax or regular mail. Clients may also receive our research via a third party.
Company Specifi c Disclosures:
1. BCM has managed or co-managed a secondary offering of equity or equity-related securities for Western Lithium Canada Corp. in the past 12 months, the closing date of which was at least 10 calendar days prior to the issuance of this report.
2. BCM has received compensation for investment banking services from Western Lithium Canada Corp. during the preceding 12 months.
3. The research analyst(s) and/or associate(s) who prepared this research report have viewed the material operations of Western Lithium Canada Corp.
Investment Rating Criteria
BUY The security represents attractive value and is expected to appreciate signifi cantly from the current price over the next 12-18 month time horizon.
SPECULATIVE BUY The security is considered a BUY but in the analyst’s opinion possesses certain operational and/or fi nancial risks that may be higher than average.
HOLD The security represents fair value and no material appreciation is expected over the next 12-18 month time horizon.
SELL The security represents poor value and is expected to depreciate over the next 12-18 month time horizon.
Other Disclosures
This report has been approved by BCM which takes responsibility for this report and its dissemination in Canada. Canadian clients wishing to effect transactions in any security discussed should do so through a qualifi ed salesperson of BCM.
Informational Reports
From time to time BCM will issue reports that are for information purposes only and will not include investment ratings. These reports will be clearly labelled accordingly.
24
West
ern
Lit
hiu
m C
an
ad
a C
orp
ora
tio
n
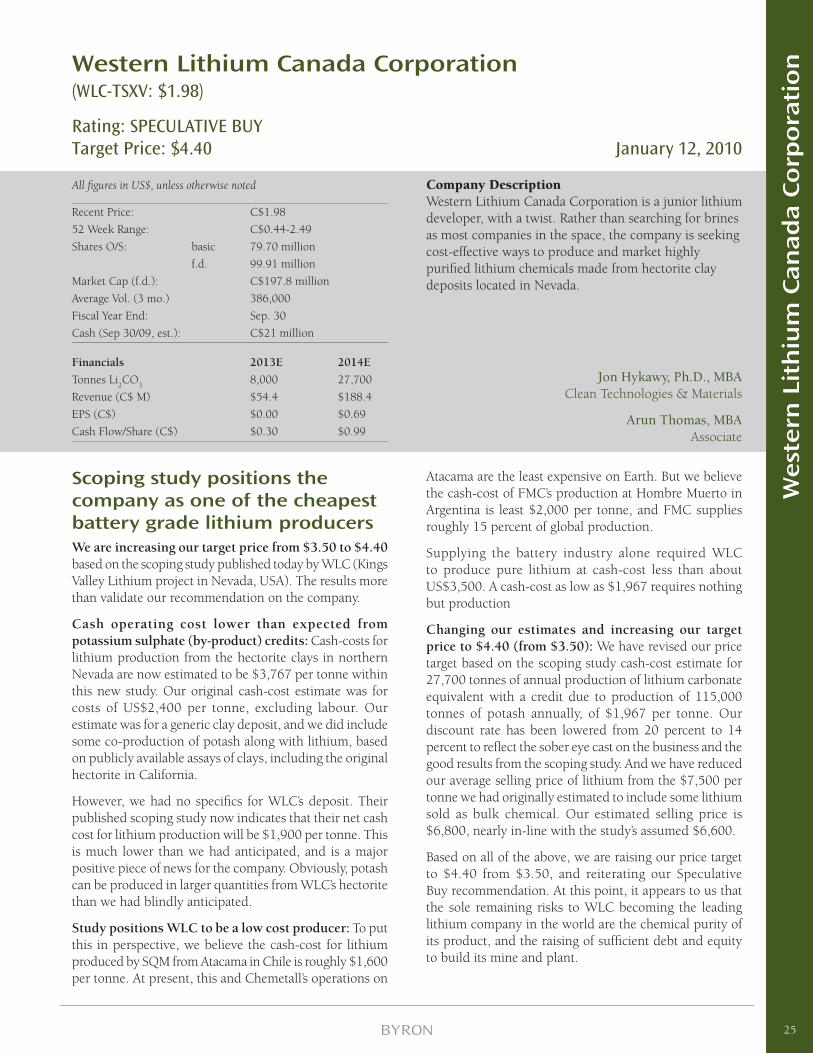
Western Lithium Canada Corporation(WLC-TSXV: $1.98)
Rating: SPECULATIVE BUYTarget Price: $4.40 January 12, 2010
All fi gures in US$, unless otherwise noted
Recent Price: C$1.98
52 Week Range: C$0.44-2.49
Shares O/S: basic 79.70 million
f.d. 99.91 million
Market Cap (f.d.): C$197.8 million
Average Vol. (3 mo.) 386,000
Fiscal Year End: Sep. 30
Cash (Sep 30/09, est.): C$21 million
Financials 2013E 2014E
Tonnes Li2CO
3 8,000 27,700
Revenue (C$ M) $54.4 $188.4
EPS (C$) $0.00 $0.69
Cash Flow/Share (C$) $0.30 $0.99
Company DescriptionWestern Lithium Canada Corporation is a junior lithium developer, with a twist. Rather than searching for brines as most companies in the space, the company is seeking cost-effective ways to produce and market highly purifi ed lithium chemicals made from hectorite clay deposits located in Nevada.
Scoping study positions the company as one of the cheapest battery grade lithium producers We are increasing our target price from $3.50 to $4.40 based on the scoping study published today by WLC (Kings Valley Lithium project in Nevada, USA). The results more than validate our recommendation on the company.
Cash operating cost lower than expected from potassium sulphate (by-product) credits: Cash-costs for lithium production from the hectorite clays in northern Nevada are now estimated to be $3,767 per tonne within this new study. Our original cash-cost estimate was for costs of US$2,400 per tonne, excluding labour. Our estimate was for a generic clay deposit, and we did include some co-production of potash along with lithium, based on publicly available assays of clays, including the original hectorite in California.
However, we had no specifi cs for WLC’s deposit. Their published scoping study now indicates that their net cash cost for lithium production will be $1,900 per tonne. This is much lower than we had anticipated, and is a major positive piece of news for the company. Obviously, potash can be produced in larger quantities from WLC’s hectorite than we had blindly anticipated.
Study positions WLC to be a low cost producer: To put this in perspective, we believe the cash-cost for lithium produced by SQM from Atacama in Chile is roughly $1,600 per tonne. At present, this and Chemetall’s operations on
Atacama are the least expensive on Earth. But we believe the cash-cost of FMC’s production at Hombre Muerto in Argentina is least $2,000 per tonne, and FMC supplies roughly 15 percent of global production.
Supplying the battery industry alone required WLC to produce pure lithium at cash-cost less than about US$3,500. A cash-cost as low as $1,967 requires nothing but production
Changing our estimates and increasing our target price to $4.40 (from $3.50): We have revised our price target based on the scoping study cash-cost estimate for 27,700 tonnes of annual production of lithium carbonate equivalent with a credit due to production of 115,000 tonnes of potash annually, of $1,967 per tonne. Our discount rate has been lowered from 20 percent to 14 percent to refl ect the sober eye cast on the business and the good results from the scoping study. And we have reduced our average selling price of lithium from the $7,500 per tonne we had originally estimated to include some lithium sold as bulk chemical. Our estimated selling price is $6,800, nearly in-line with the study’s assumed $6,600.
Based on all of the above, we are raising our price target to $4.40 from $3.50, and reiterating our Speculative Buy recommendation. At this point, it appears to us that the sole remaining risks to WLC becoming the leading lithium company in the world are the chemical purity of its product, and the raising of suffi cient debt and equity to build its mine and plant.
Jon Hykawy, Ph.D., MBAClean Technologies & Materials
Arun Thomas, MBAAssociate
25
West
ern
Lit
hiu
m C
an
ad
a C
orp
ora
tio
n
IMPORTANT DISCLOSURES
Analyst’s Certifi cation
All of the views expressed in this report accurately refl ect the personal views of the responsible analyst(s) about any and all of the subject securities or issuers. No part of the compensation of the responsible analyst(s) named herein is, or will be, directly or indirectly, related to the specifi c recommendations or views expressed by the responsible analyst(s) in this report. The particulars contained herein were obtained from sources which we believe to be reliable but are not guaranteed by us and may be incomplete.
Byron Capital Markets (“BCM”) is a division of Byron Securities Limited which is a Member of IIROC and CIPF. BCM compensates its research analysts from a variety of sources. The research department is a cost centre and is funded by the business activities of BCM including institutional equity sales and trading, retail sales and corporate and investment banking. Since the revenues from these businesses vary the funds for research compensation vary. No one business line has greater infl uence than any other for research analyst compensation.
Dissemination of Research
BCM endeavors to make all reasonable efforts to provide research simultaneously to all eligible clients. BCM equity research is distributed electronically via email and is posted on our proprietary websites to ensure eligible clients receive coverage initiations and ratings changes, targets and opinions in a timely manner. Additional distribution may be done by the sales personnel via email, fax or regular mail. Clients may also receive our research via a third party.
Company Specifi c Disclosures:
1. BCM has managed or co-managed a secondary offering of equity or equity-related securities for Western Lithium Canada Corp. in the past 12 months, the closing date of which was at least 10 calendar days prior to the issuance of this report.
2. BCM has received compensation for investment banking services from Western Lithium Canada Corp. during the preceding 12 months.
3. The research analyst(s) and/or associate(s) who prepared this research report have viewed the material operations of Western Lithium Canada Corp.
Investment Rating Criteria
BUY The security represents attractive value and is expected to appreciate signifi cantly from the current price over the next 12-18 month time horizon.
SPECULATIVE BUY The security is considered a BUY but in the analyst’s opinion possesses certain operational and/or fi nancial risks that may be higher than average.
HOLD The security represents fair value and no material appreciation is expected over the next 12-18 month time horizon.
SELL The security represents poor value and is expected to depreciate over the next 12-18 month time horizon.
Other Disclosures
This report has been approved by BCM which takes responsibility for this report and its dissemination in Canada. Canadian clients wishing to effect transactions in any security discussed should do so through a qualifi ed salesperson of BCM.
Informational Reports
From time to time BCM will issue reports that are for information purposes only and will not include investment ratings. These reports will be clearly labelled accordingly.
26
West
ern
Lit
hiu
m C
an
ad
a C
orp
ora
tio
n
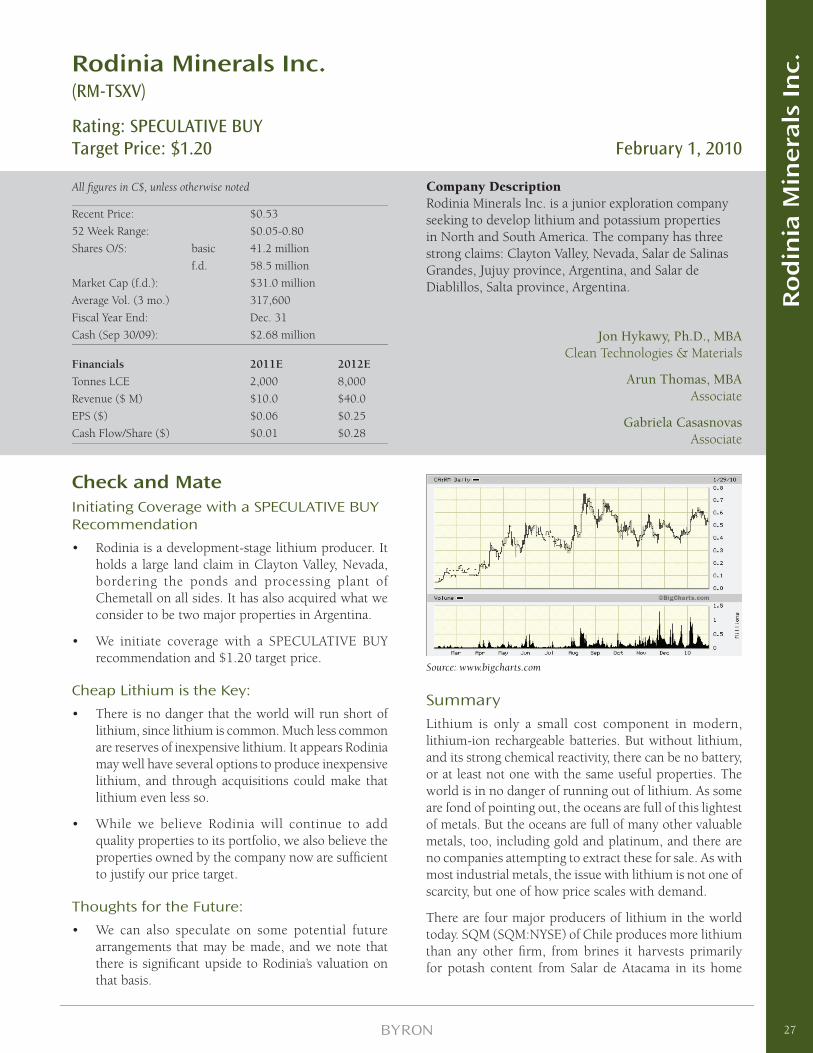
Rodinia Minerals Inc.(RM-TSXV)
Rating: SPECULATIVE BUYTarget Price: $1.20 February 1, 2010
All fi gures in C$, unless otherwise noted
Recent Price: $0.53
52 Week Range: $0.05-0.80
Shares O/S: basic 41.2 million
f.d. 58.5 million
Market Cap (f.d.): $31.0 million
Average Vol. (3 mo.) 317,600
Fiscal Year End: Dec. 31
Cash (Sep 30/09): $2.68 million
Financials 2011E 2012E
Tonnes LCE 2,000 8,000
Revenue ($ M) $10.0 $40.0
EPS ($) $0.06 $0.25
Cash Flow/Share ($) $0.01 $0.28
Company DescriptionRodinia Minerals Inc. is a junior exploration company seeking to develop lithium and potassium properties in North and South America. The company has three strong claims: Clayton Valley, Nevada, Salar de Salinas Grandes, Jujuy province, Argentina, and Salar de Diablillos, Salta province, Argentina.
Check and MateInitiating Coverage with a SPECULATIVE BUY Recommendation
• Rodinia is a development-stage lithium producer. It holds a large land claim in Clayton Valley, Nevada, bordering the ponds and processing plant of Chemetall on all sides. It has also acquired what we consider to be two major properties in Argentina.
• We initiate coverage with a SPECULATIVE BUY recommendation and $1.20 target price.
Cheap Lithium is the Key:
• There is no danger that the world will run short of lithium, since lithium is common. Much less common are reserves of inexpensive lithium. It appears Rodinia may well have several options to produce inexpensive lithium, and through acquisitions could make that lithium even less so.
• While we believe Rodinia will continue to add quality properties to its portfolio, we also believe the properties owned by the company now are suffi cient to justify our price target.
Thoughts for the Future:
• We can also speculate on some potential future arrangements that may be made, and we note that there is signifi cant upside to Rodinia’s valuation on that basis.
Source: www.bigcharts.com
SummaryLithium is only a small cost component in modern, lithium-ion rechargeable batteries. But without lithium, and its strong chemical reactivity, there can be no battery, or at least not one with the same useful properties. The world is in no danger of running out of lithium. As some are fond of pointing out, the oceans are full of this lightest of metals. But the oceans are full of many other valuable metals, too, including gold and platinum, and there are no companies attempting to extract these for sale. As with most industrial metals, the issue with lithium is not one of scarcity, but one of how price scales with demand.
There are four major producers of lithium in the world today. SQM (SQM:NYSE) of Chile produces more lithium than any other fi rm, from brines it harvests primarily for potash content from Salar de Atacama in its home
Jon Hykawy, Ph.D., MBAClean Technologies & Materials
Arun Thomas, MBAAssociate
Gabriela CasasnovasAssociate
27
Ro
din
ia M
inera
ls I
nc.
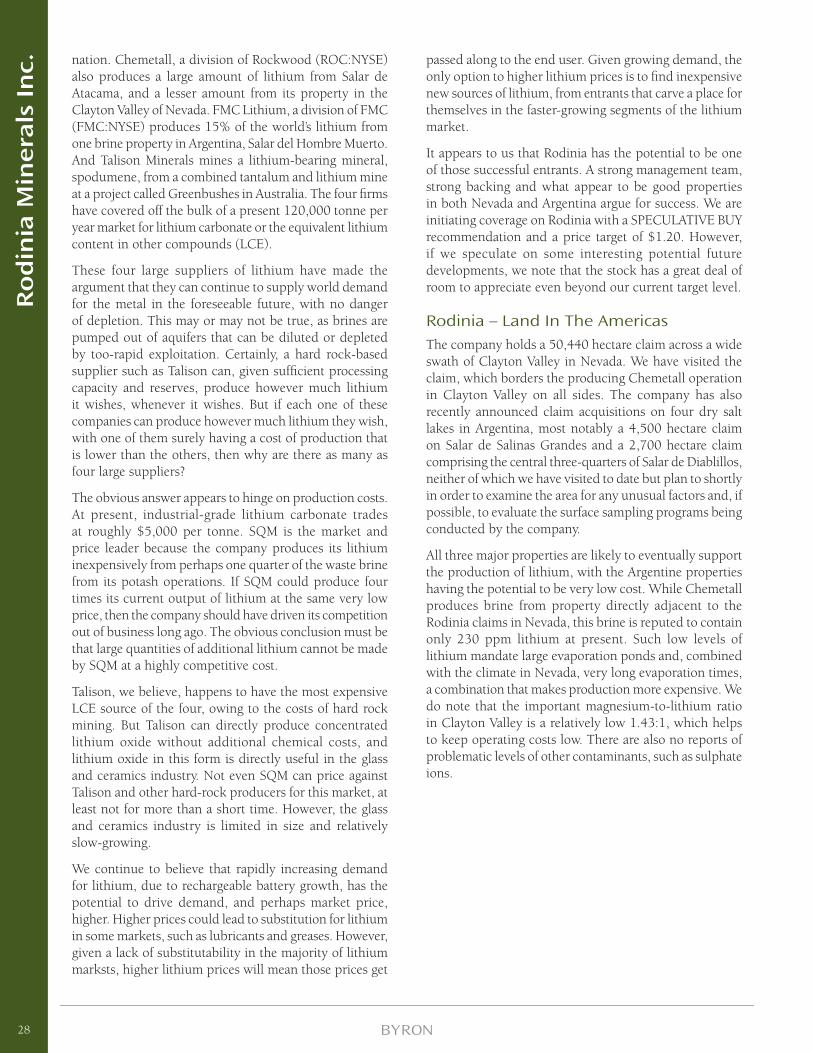
nation. Chemetall, a division of Rockwood (ROC:NYSE) also produces a large amount of lithium from Salar de Atacama, and a lesser amount from its property in the Clayton Valley of Nevada. FMC Lithium, a division of FMC (FMC:NYSE) produces 15% of the world’s lithium from one brine property in Argentina, Salar del Hombre Muerto. And Talison Minerals mines a lithium-bearing mineral, spodumene, from a combined tantalum and lithium mine at a project called Greenbushes in Australia. The four fi rms have covered off the bulk of a present 120,000 tonne per year market for lithium carbonate or the equivalent lithium content in other compounds (LCE).
These four large suppliers of lithium have made the argument that they can continue to supply world demand for the metal in the foreseeable future, with no danger of depletion. This may or may not be true, as brines are pumped out of aquifers that can be diluted or depleted by too-rapid exploitation. Certainly, a hard rock-based supplier such as Talison can, given suffi cient processing capacity and reserves, produce however much lithium it wishes, whenever it wishes. But if each one of these companies can produce however much lithium they wish, with one of them surely having a cost of production that is lower than the others, then why are there as many as four large suppliers?
The obvious answer appears to hinge on production costs. At present, industrial-grade lithium carbonate trades at roughly $5,000 per tonne. SQM is the market and price leader because the company produces its lithium inexpensively from perhaps one quarter of the waste brine from its potash operations. If SQM could produce four times its current output of lithium at the same very low price, then the company should have driven its competition out of business long ago. The obvious conclusion must be that large quantities of additional lithium cannot be made by SQM at a highly competitive cost.
Talison, we believe, happens to have the most expensive LCE source of the four, owing to the costs of hard rock mining. But Talison can directly produce concentrated lithium oxide without additional chemical costs, and lithium oxide in this form is directly useful in the glass and ceramics industry. Not even SQM can price against Talison and other hard-rock producers for this market, at least not for more than a short time. However, the glass and ceramics industry is limited in size and relatively slow-growing.
We continue to believe that rapidly increasing demand for lithium, due to rechargeable battery growth, has the potential to drive demand, and perhaps market price, higher. Higher prices could lead to substitution for lithium in some markets, such as lubricants and greases. However, given a lack of substitutability in the majority of lithium marksts, higher lithium prices will mean those prices get
passed along to the end user. Given growing demand, the only option to higher lithium prices is to fi nd inexpensive new sources of lithium, from entrants that carve a place for themselves in the faster-growing segments of the lithium market.
It appears to us that Rodinia has the potential to be one of those successful entrants. A strong management team, strong backing and what appear to be good properties in both Nevada and Argentina argue for success. We are initiating coverage on Rodinia with a SPECULATIVE BUY recommendation and a price target of $1.20. However, if we speculate on some interesting potential future developments, we note that the stock has a great deal of room to appreciate even beyond our current target level.
Rodinia – Land In The AmericasThe company holds a 50,440 hectare claim across a wide swath of Clayton Valley in Nevada. We have visited the claim, which borders the producing Chemetall operation in Clayton Valley on all sides. The company has also recently announced claim acquisitions on four dry salt lakes in Argentina, most notably a 4,500 hectare claim on Salar de Salinas Grandes and a 2,700 hectare claim comprising the central three-quarters of Salar de Diablillos, neither of which we have visited to date but plan to shortly in order to examine the area for any unusual factors and, if possible, to evaluate the surface sampling programs being conducted by the company.
All three major properties are likely to eventually support the production of lithium, with the Argentine properties having the potential to be very low cost. While Chemetall produces brine from property directly adjacent to the Rodinia claims in Nevada, this brine is reputed to contain only 230 ppm lithium at present. Such low levels of lithium mandate large evaporation ponds and, combined with the climate in Nevada, very long evaporation times, a combination that makes production more expensive. We do note that the important magnesium-to-lithium ratio in Clayton Valley is a relatively low 1.43:1, which helps to keep operating costs low. There are also no reports of problematic levels of other contaminants, such as sulphate ions.
28
Ro
din
ia M
inera
ls I
nc.
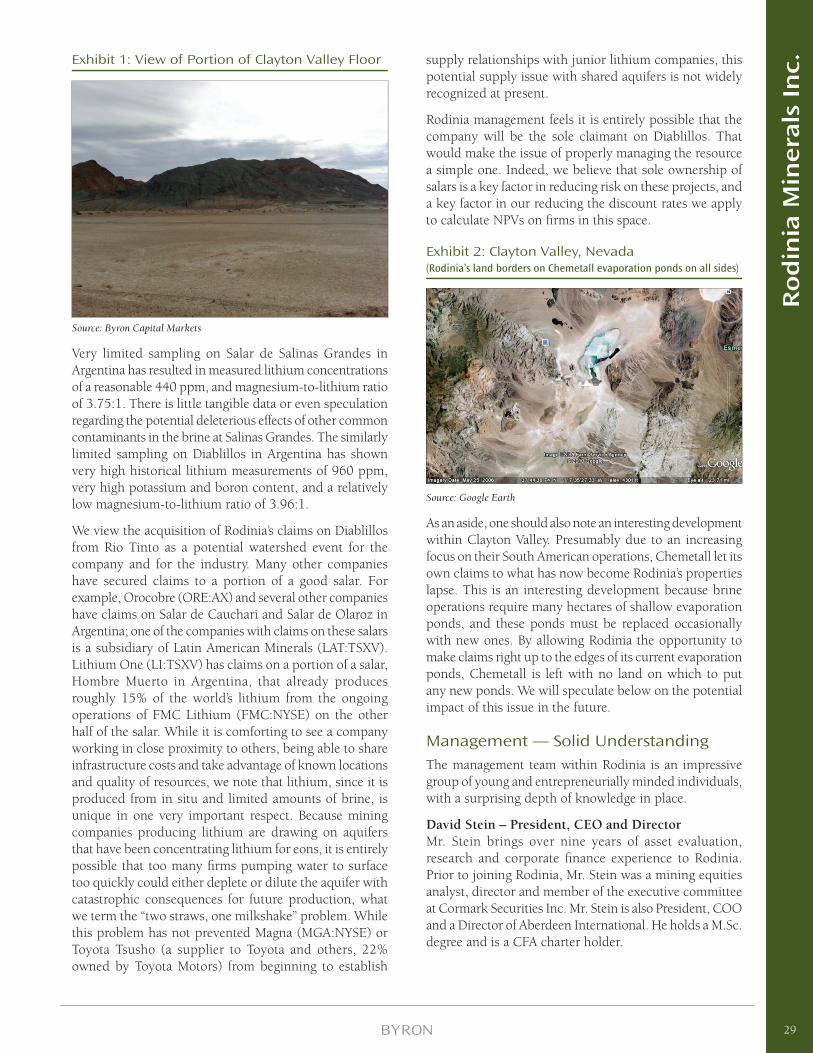
Exhibit 1: View of Portion of Clayton Valley Floor
Source: Byron Capital Markets
Very limited sampling on Salar de Salinas Grandes in Argentina has resulted in measured lithium concentrations of a reasonable 440 ppm, and magnesium-to-lithium ratio of 3.75:1. There is little tangible data or even speculation regarding the potential deleterious effects of other common contaminants in the brine at Salinas Grandes. The similarly limited sampling on Diablillos in Argentina has shown very high historical lithium measurements of 960 ppm, very high potassium and boron content, and a relatively low magnesium-to-lithium ratio of 3.96:1.
We view the acquisition of Rodinia’s claims on Diablillos from Rio Tinto as a potential watershed event for the company and for the industry. Many other companies have secured claims to a portion of a good salar. For example, Orocobre (ORE:AX) and several other companies have claims on Salar de Cauchari and Salar de Olaroz in Argentina; one of the companies with claims on these salars is a subsidiary of Latin American Minerals (LAT:TSXV). Lithium One (LI:TSXV) has claims on a portion of a salar, Hombre Muerto in Argentina, that already produces roughly 15% of the world’s lithium from the ongoing operations of FMC Lithium (FMC:NYSE) on the other half of the salar. While it is comforting to see a company working in close proximity to others, being able to share infrastructure costs and take advantage of known locations and quality of resources, we note that lithium, since it is produced from in situ and limited amounts of brine, is unique in one very important respect. Because mining companies producing lithium are drawing on aquifers that have been concentrating lithium for eons, it is entirely possible that too many fi rms pumping water to surface too quickly could either deplete or dilute the aquifer with catastrophic consequences for future production, what we term the “two straws, one milkshake” problem. While this problem has not prevented Magna (MGA:NYSE) or Toyota Tsusho (a supplier to Toyota and others, 22% owned by Toyota Motors) from beginning to establish
supply relationships with junior lithium companies, this potential supply issue with shared aquifers is not widely recognized at present.
Rodinia management feels it is entirely possible that the company will be the sole claimant on Diablillos. That would make the issue of properly managing the resource a simple one. Indeed, we believe that sole ownership of salars is a key factor in reducing risk on these projects, and a key factor in our reducing the discount rates we apply to calculate NPVs on fi rms in this space.
Exhibit 2: Clayton Valley, Nevada (Rodinia’s land borders on Chemetall evaporation ponds on all sides)
Source: Google Earth
As an aside, one should also note an interesting development within Clayton Valley. Presumably due to an increasing focus on their South American operations, Chemetall let its own claims to what has now become Rodinia’s properties lapse. This is an interesting development because brine operations require many hectares of shallow evaporation ponds, and these ponds must be replaced occasionally with new ones. By allowing Rodinia the opportunity to make claims right up to the edges of its current evaporation ponds, Chemetall is left with no land on which to put any new ponds. We will speculate below on the potential impact of this issue in the future.
Management — Solid UnderstandingThe management team within Rodinia is an impressive group of young and entrepreneurially minded individuals, with a surprising depth of knowledge in place.
David Stein – President, CEO and DirectorMr. Stein brings over nine years of asset evaluation, research and corporate fi nance experience to Rodinia. Prior to joining Rodinia, Mr. Stein was a mining equities analyst, director and member of the executive committee at Cormark Securities Inc. Mr. Stein is also President, COO and a Director of Aberdeen International. He holds a M.Sc. degree and is a CFA charter holder.
29
Ro
din
ia M
inera
ls I
nc.
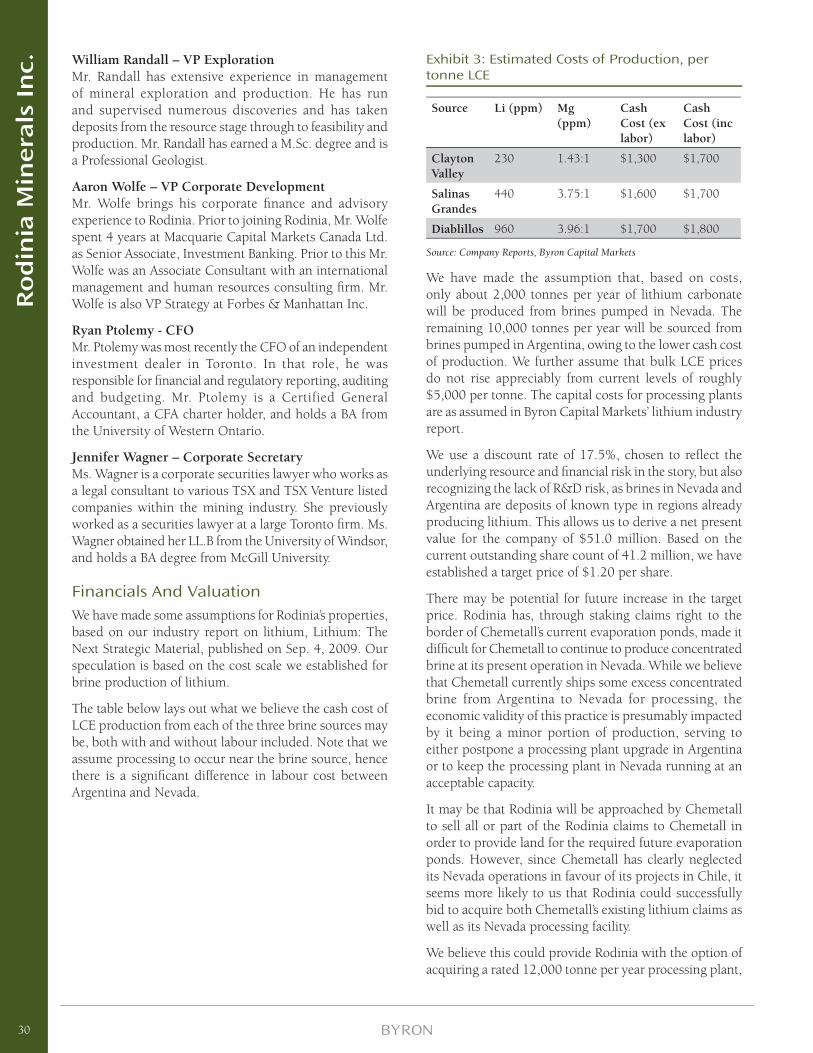
William Randall – VP ExplorationMr. Randall has extensive experience in management of mineral exploration and production. He has run and supervised numerous discoveries and has taken deposits from the resource stage through to feasibility and production. Mr. Randall has earned a M.Sc. degree and is a Professional Geologist.
Aaron Wolfe – VP Corporate DevelopmentMr. Wolfe brings his corporate fi nance and advisory experience to Rodinia. Prior to joining Rodinia, Mr. Wolfe spent 4 years at Macquarie Capital Markets Canada Ltd. as Senior Associate, Investment Banking. Prior to this Mr. Wolfe was an Associate Consultant with an international management and human resources consulting fi rm. Mr. Wolfe is also VP Strategy at Forbes & Manhattan Inc.
Ryan Ptolemy - CFOMr. Ptolemy was most recently the CFO of an independent investment dealer in Toronto. In that role, he was responsible for fi nancial and regulatory reporting, auditing and budgeting. Mr. Ptolemy is a Certified General Accountant, a CFA charter holder, and holds a BA from the University of Western Ontario.
Jennifer Wagner – Corporate Secretary Ms. Wagner is a corporate securities lawyer who works as a legal consultant to various TSX and TSX Venture listed companies within the mining industry. She previously worked as a securities lawyer at a large Toronto fi rm. Ms. Wagner obtained her LL.B from the University of Windsor, and holds a BA degree from McGill University.
Financials And ValuationWe have made some assumptions for Rodinia’s properties, based on our industry report on lithium, Lithium: The Next Strategic Material, published on Sep. 4, 2009. Our speculation is based on the cost scale we established for brine production of lithium.
The table below lays out what we believe the cash cost of LCE production from each of the three brine sources may be, both with and without labour included. Note that we assume processing to occur near the brine source, hence there is a signifi cant difference in labour cost between Argentina and Nevada.
Exhibit 3: Estimated Costs of Production, per tonne LCE
Source Li (ppm) Mg (ppm)
Cash Cost (ex labor)
Cash Cost (inc labor)
Clayton Valley
230 1.43:1 $1,300 $1,700
Salinas Grandes
440 3.75:1 $1,600 $1,700
Diablillos 960 3.96:1 $1,700 $1,800
Source: Company Reports, Byron Capital Markets
We have made the assumption that, based on costs, only about 2,000 tonnes per year of lithium carbonate will be produced from brines pumped in Nevada. The remaining 10,000 tonnes per year will be sourced from brines pumped in Argentina, owing to the lower cash cost of production. We further assume that bulk LCE prices do not rise appreciably from current levels of roughly $5,000 per tonne. The capital costs for processing plants are as assumed in Byron Capital Markets’ lithium industry report.
We use a discount rate of 17.5%, chosen to refl ect the underlying resource and fi nancial risk in the story, but also recognizing the lack of R&D risk, as brines in Nevada and Argentina are deposits of known type in regions already producing lithium. This allows us to derive a net present value for the company of $51.0 million. Based on the current outstanding share count of 41.2 million, we have established a target price of $1.20 per share.
There may be potential for future increase in the target price. Rodinia has, through staking claims right to the border of Chemetall’s current evaporation ponds, made it diffi cult for Chemetall to continue to produce concentrated brine at its present operation in Nevada. While we believe that Chemetall currently ships some excess concentrated brine from Argentina to Nevada for processing, the economic validity of this practice is presumably impacted by it being a minor portion of production, serving to either postpone a processing plant upgrade in Argentina or to keep the processing plant in Nevada running at an acceptable capacity.
It may be that Rodinia will be approached by Chemetall to sell all or part of the Rodinia claims to Chemetall in order to provide land for the required future evaporation ponds. However, since Chemetall has clearly neglected its Nevada operations in favour of its projects in Chile, it seems more likely to us that Rodinia could successfully bid to acquire both Chemetall’s existing lithium claims as well as its Nevada processing facility.
We believe this could provide Rodinia with the option of acquiring a rated 12,000 tonne per year processing plant,
30
Ro
din
ia M
inera
ls I
nc.
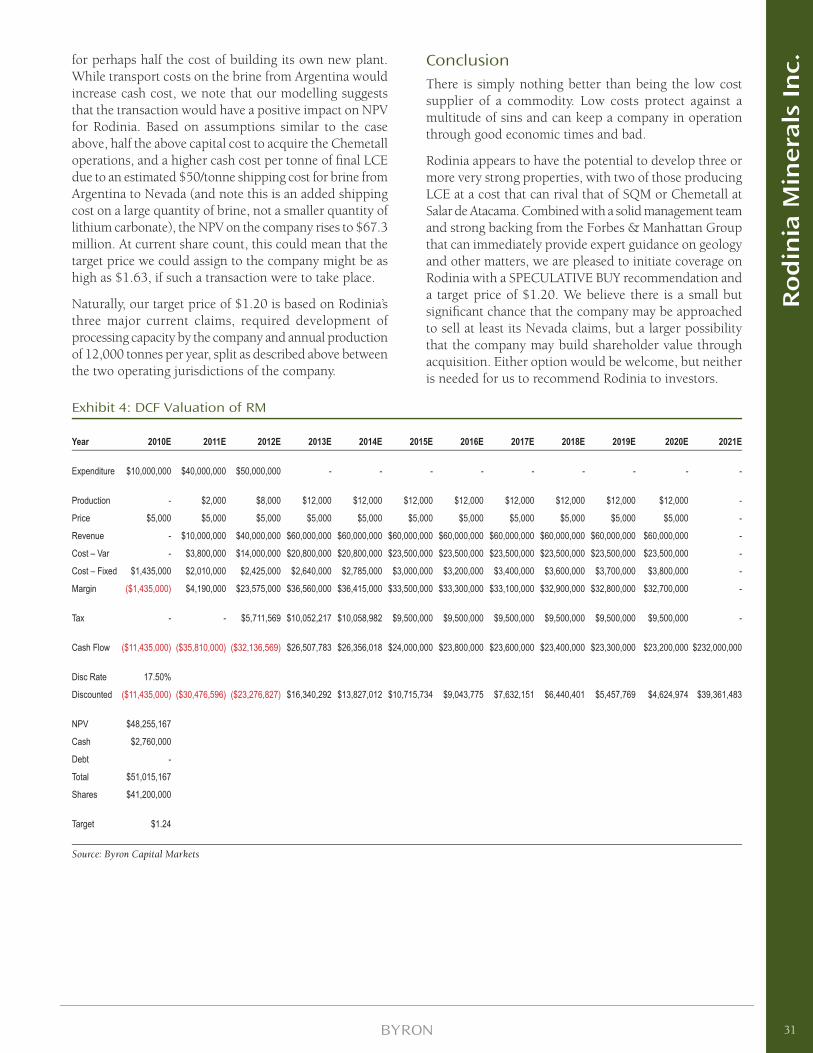
for perhaps half the cost of building its own new plant. While transport costs on the brine from Argentina would increase cash cost, we note that our modelling suggests that the transaction would have a positive impact on NPV for Rodinia. Based on assumptions similar to the case above, half the above capital cost to acquire the Chemetall operations, and a higher cash cost per tonne of fi nal LCE due to an estimated $50/tonne shipping cost for brine from Argentina to Nevada (and note this is an added shipping cost on a large quantity of brine, not a smaller quantity of lithium carbonate), the NPV on the company rises to $67.3 million. At current share count, this could mean that the target price we could assign to the company might be as high as $1.63, if such a transaction were to take place.
Naturally, our target price of $1.20 is based on Rodinia’s three major current claims, required development of processing capacity by the company and annual production of 12,000 tonnes per year, split as described above between the two operating jurisdictions of the company.
ConclusionThere is simply nothing better than being the low cost supplier of a commodity. Low costs protect against a multitude of sins and can keep a company in operation through good economic times and bad.
Rodinia appears to have the potential to develop three or more very strong properties, with two of those producing LCE at a cost that can rival that of SQM or Chemetall at Salar de Atacama. Combined with a solid management team and strong backing from the Forbes & Manhattan Group that can immediately provide expert guidance on geology and other matters, we are pleased to initiate coverage on Rodinia with a SPECULATIVE BUY recommendation and a target price of $1.20. We believe there is a small but signifi cant chance that the company may be approached to sell at least its Nevada claims, but a larger possibility that the company may build shareholder value through acquisition. Either option would be welcome, but neither is needed for us to recommend Rodinia to investors.
Exhibit 4: DCF Valuation of RM
Year 2010E 2011E 2012E 2013E 2014E 2015E 2016E 2017E 2018E 2019E 2020E 2021E
Expenditure $10,000,000 $40,000,000 $50,000,000 - - - - - - - - -
Production - $2,000 $8,000 $12,000 $12,000 $12,000 $12,000 $12,000 $12,000 $12,000 $12,000 -
Price $5,000 $5,000 $5,000 $5,000 $5,000 $5,000 $5,000 $5,000 $5,000 $5,000 $5,000 -
Revenue - $10,000,000 $40,000,000 $60,000,000 $60,000,000 $60,000,000 $60,000,000 $60,000,000 $60,000,000 $60,000,000 $60,000,000 -
Cost – Var - $3,800,000 $14,000,000 $20,800,000 $20,800,000 $23,500,000 $23,500,000 $23,500,000 $23,500,000 $23,500,000 $23,500,000 -
Cost – Fixed $1,435,000 $2,010,000 $2,425,000 $2,640,000 $2,785,000 $3,000,000 $3,200,000 $3,400,000 $3,600,000 $3,700,000 $3,800,000 -
Margin ($1,435,000) $4,190,000 $23,575,000 $36,560,000 $36,415,000 $33,500,000 $33,300,000 $33,100,000 $32,900,000 $32,800,000 $32,700,000 -
Tax - - $5,711,569 $10,052,217 $10,058,982 $9,500,000 $9,500,000 $9,500,000 $9,500,000 $9,500,000 $9,500,000 -
Cash Flow ($11,435,000) ($35,810,000) ($32,136,569) $26,507,783 $26,356,018 $24,000,000 $23,800,000 $23,600,000 $23,400,000 $23,300,000 $23,200,000 $232,000,000
Disc Rate 17.50%
Discounted ($11,435,000) ($30,476,596) ($23,276,827) $16,340,292 $13,827,012 $10,715,734 $9,043,775 $7,632,151 $6,440,401 $5,457,769 $4,624,974 $39,361,483
NPV $48,255,167
Cash $2,760,000
Debt -
Total $51,015,167
Shares $41,200,000
Target $1.24
Source: Byron Capital Markets
31
Ro
din
ia M
inera
ls I
nc.
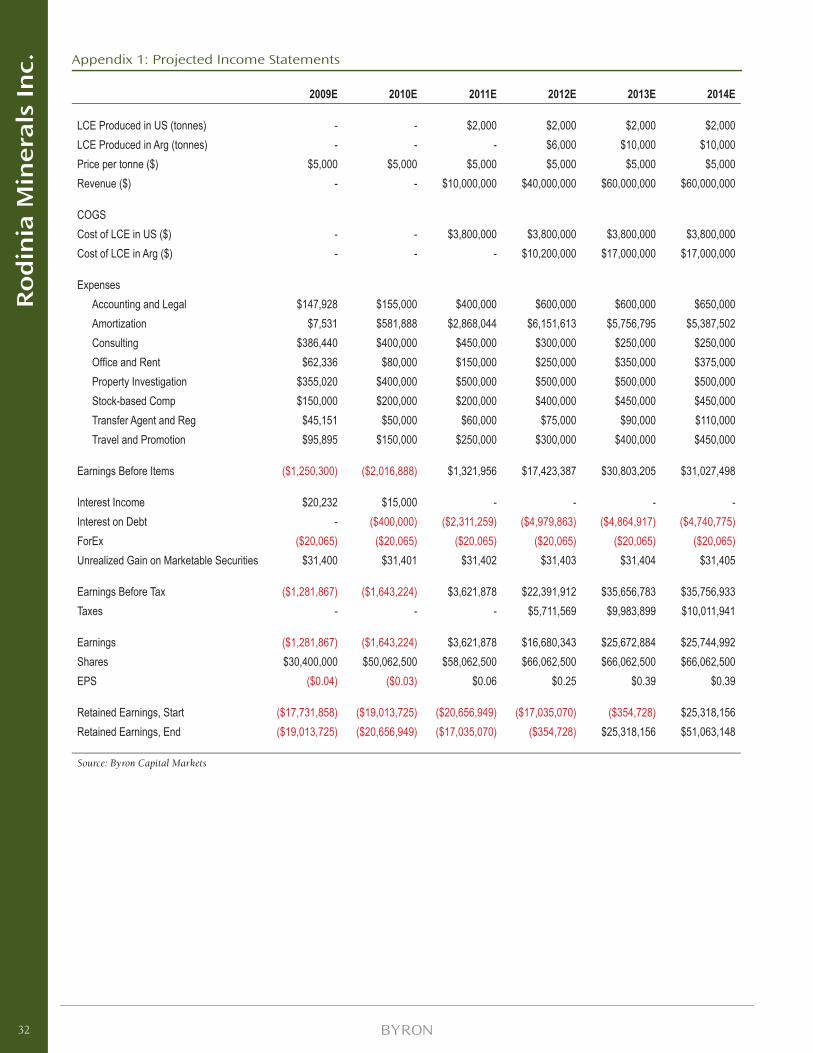
Appendix 1: Projected Income Statements
2009E 2010E 2011E 2012E 2013E 2014E
LCE Produced in US (tonnes) - - $2,000 $2,000 $2,000 $2,000 LCE Produced in Arg (tonnes) - - - $6,000 $10,000 $10,000 Price per tonne ($) $5,000 $5,000 $5,000 $5,000 $5,000 $5,000 Revenue ($) - - $10,000,000 $40,000,000 $60,000,000 $60,000,000
COGSCost of LCE in US ($) - - $3,800,000 $3,800,000 $3,800,000 $3,800,000 Cost of LCE in Arg ($) - - - $10,200,000 $17,000,000 $17,000,000
ExpensesAccounting and Legal $147,928 $155,000 $400,000 $600,000 $600,000 $650,000 Amortization $7,531 $581,888 $2,868,044 $6,151,613 $5,756,795 $5,387,502 Consulting $386,440 $400,000 $450,000 $300,000 $250,000 $250,000 Offi ce and Rent $62,336 $80,000 $150,000 $250,000 $350,000 $375,000 Property Investigation $355,020 $400,000 $500,000 $500,000 $500,000 $500,000 Stock-based Comp $150,000 $200,000 $200,000 $400,000 $450,000 $450,000 Transfer Agent and Reg $45,151 $50,000 $60,000 $75,000 $90,000 $110,000 Travel and Promotion $95,895 $150,000 $250,000 $300,000 $400,000 $450,000
Earnings Before Items ($1,250,300) ($2,016,888) $1,321,956 $17,423,387 $30,803,205 $31,027,498
Interest Income $20,232 $15,000 - - - - Interest on Debt - ($400,000) ($2,311,259) ($4,979,863) ($4,864,917) ($4,740,775)ForEx ($20,065) ($20,065) ($20,065) ($20,065) ($20,065) ($20,065)Unrealized Gain on Marketable Securities $31,400 $31,401 $31,402 $31,403 $31,404 $31,405
Earnings Before Tax ($1,281,867) ($1,643,224) $3,621,878 $22,391,912 $35,656,783 $35,756,933 Taxes - - - $5,711,569 $9,983,899 $10,011,941
Earnings ($1,281,867) ($1,643,224) $3,621,878 $16,680,343 $25,672,884 $25,744,992 Shares $30,400,000 $50,062,500 $58,062,500 $66,062,500 $66,062,500 $66,062,500 EPS ($0.04) ($0.03) $0.06 $0.25 $0.39 $0.39
Retained Earnings, Start ($17,731,858) ($19,013,725) ($20,656,949) ($17,035,070) ($354,728) $25,318,156 Retained Earnings, End ($19,013,725) ($20,656,949) ($17,035,070) ($354,728) $25,318,156 $51,063,148
Source: Byron Capital Markets
32
Ro
din
ia M
inera
ls I
nc.

Appendix 2: Projected Balance Sheets
2009E 2010E 2011E 2012E 2013E 2014E
AssetsCash and Equiv $2,026,425 $3,398,290 $4,138,354 $22,534,258 $48,474,514 $74,436,640 Marketable Securities $129,310 $140,000 $150,000 $190,000 $190,000 $190,000 Receivables $18,000 $25,000 $1,800,000 $3,300,000 $5,000,000 $5,000,000 Notes Receivable $75,000 $75,000 $75,000 $75,000 $75,000 $75,000 Prepaids $18,000 $25,000 $75,000 $200,000 $300,000 $400,000
Property, Plant and Equipment $19,600 $9,437,712 $46,569,668 $90,418,054 $84,661,259 $79,273,757 Mineral Properties $8,900,000 $12,500,000 $14,400,000 $15,000,000 $16,000,000 $17,000,000 Advance Royalties $50,000 $75,000 $75,000 $100,000 $100,000 $100,000 Advance Mineral Properties $50,000 $75,000 $100,000 $125,000 $150,000 - Deposits $20,000 $60,000 $250,000 $1,600,000 $2,000,000 $3,000,000 Reclamation Bonds $115,000 $650,000 $1,000,000 $2,000,000 $3,000,000 $4,000,000
Total Assets $11,421,335 $26,461,002 $68,633,021 $135,542,312 $159,950,773 $183,475,398
LiabilitiesPayables $8,200 $24,000 $317,000 $1,292,000 $1,958,000 $1,958,000 Current Portion of LT Debt - $109,261 $642,455 $1,436,826 $1,551,773 $1,675,914 Credit Lines - $20,000 $150,000 $250,000 $320,000 $400,000
LT Debt - $4,890,739 $28,248,284 $60,811,458 $59,259,685 $57,583,771
S/EShare Capital $27,672,418 $32,672,418 $48,672,418 $64,672,418 $64,672,418 $64,672,418 Contributed Surplus $2,754,442 $9,401,533 $7,637,935 $7,434,338 $6,870,742 $6,122,147 Retained Earnings ($19,013,725) ($20,656,949) ($17,035,070) ($354,728) $25,318,156 $51,063,148
Total Liabilities and S/E $11,421,335 $26,461,002 $68,633,021 $135,542,312 $159,950,773 $183,475,398
Source: Byron Capital Markets
33
Ro
din
ia M
inera
ls I
nc.
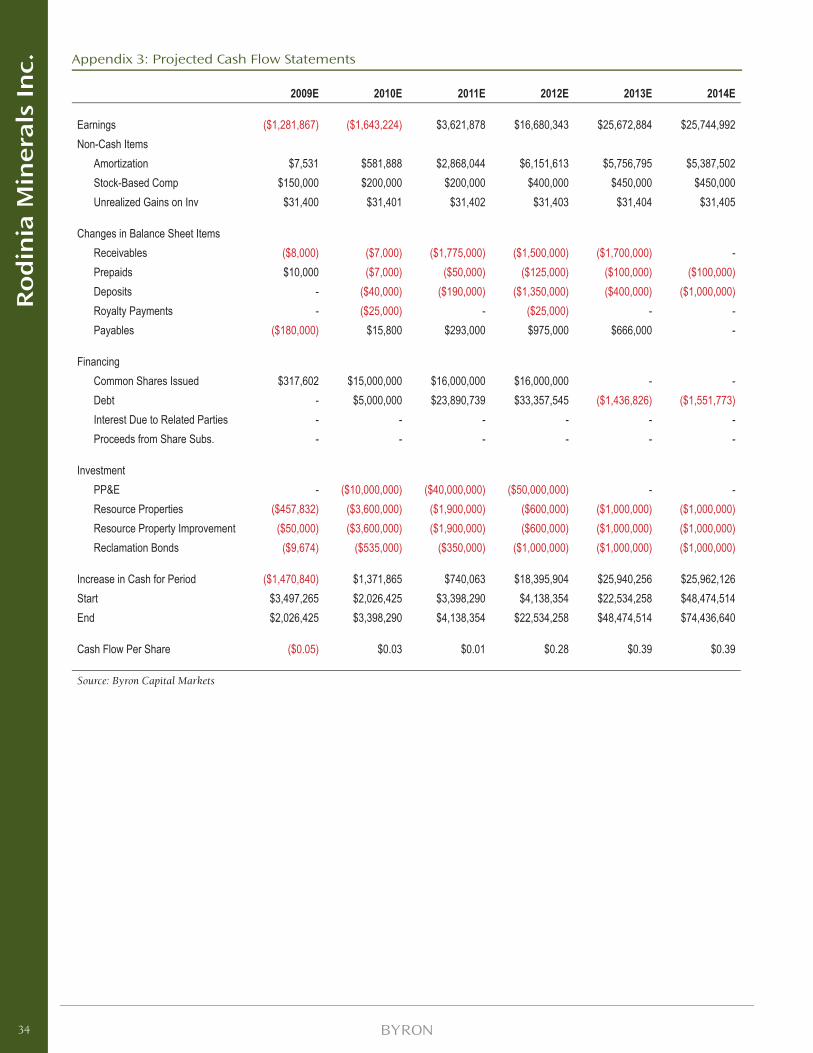
Appendix 3: Projected Cash Flow Statements
2009E 2010E 2011E 2012E 2013E 2014E
Earnings ($1,281,867) ($1,643,224) $3,621,878 $16,680,343 $25,672,884 $25,744,992 Non-Cash Items
Amortization $7,531 $581,888 $2,868,044 $6,151,613 $5,756,795 $5,387,502 Stock-Based Comp $150,000 $200,000 $200,000 $400,000 $450,000 $450,000 Unrealized Gains on Inv $31,400 $31,401 $31,402 $31,403 $31,404 $31,405
Changes in Balance Sheet ItemsReceivables ($8,000) ($7,000) ($1,775,000) ($1,500,000) ($1,700,000) - Prepaids $10,000 ($7,000) ($50,000) ($125,000) ($100,000) ($100,000)Deposits - ($40,000) ($190,000) ($1,350,000) ($400,000) ($1,000,000)Royalty Payments - ($25,000) - ($25,000) - - Payables ($180,000) $15,800 $293,000 $975,000 $666,000 -
FinancingCommon Shares Issued $317,602 $15,000,000 $16,000,000 $16,000,000 - - Debt - $5,000,000 $23,890,739 $33,357,545 ($1,436,826) ($1,551,773)Interest Due to Related Parties - - - - - - Proceeds from Share Subs. - - - - - -
Investment PP&E - ($10,000,000) ($40,000,000) ($50,000,000) - - Resource Properties ($457,832) ($3,600,000) ($1,900,000) ($600,000) ($1,000,000) ($1,000,000)Resource Property Improvement ($50,000) ($3,600,000) ($1,900,000) ($600,000) ($1,000,000) ($1,000,000)Reclamation Bonds ($9,674) ($535,000) ($350,000) ($1,000,000) ($1,000,000) ($1,000,000)
Increase in Cash for Period ($1,470,840) $1,371,865 $740,063 $18,395,904 $25,940,256 $25,962,126 Start $3,497,265 $2,026,425 $3,398,290 $4,138,354 $22,534,258 $48,474,514 End $2,026,425 $3,398,290 $4,138,354 $22,534,258 $48,474,514 $74,436,640
Cash Flow Per Share ($0.05) $0.03 $0.01 $0.28 $0.39 $0.39
Source: Byron Capital Markets
34
Ro
din
ia M
inera
ls I
nc.
IMPORTANT DISCLOSURES
Analyst’s Certifi cation
All of the views expressed in this report accurately refl ect the personal views of the responsible analyst(s) about any and all of the subject securities or issuers. No part of the compensation of the responsible analyst(s) named herein is, or will be, directly or indirectly, related to the specifi c recommendations or views expressed by the responsible analyst(s) in this report. The particulars contained herein were obtained from sources which we believe to be reliable but are not guaranteed by us and may be incomplete.
Byron Capital Markets (“BCM”) is a division of Byron Securities Limited which is a Member of IIROC and CIPF. BCM compensates its research analysts from a variety of sources. The research department is a cost centre and is funded by the business activities of BCM including institutional equity sales and trading, retail sales and corporate and investment banking. Since the revenues from these businesses vary the funds for research compensation vary. No one business line has greater infl uence than any other for research analyst compensation.
Dissemination of Research
BCM endeavours to make all reasonable efforts to provide research simultaneously to all eligible clients. BCM equity research is distributed electronically via email and is posted on our proprietary websites to ensure eligible clients receive coverage initiations and ratings changes, targets and opinions in a timely manner. Additional distribution may be done by the sales personnel via email, fax or regular mail. Clients may also receive our research via a third party.
Company Specifi c Disclosures:
1. The research analyst(s) and/or associate(s) who prepared this research report have viewed the material operations of Rodinia Minerals.
Investment Rating Criteria
BUY The security represents attractive value and is expected to appreciate signifi cantly from the current price over the next 12-18 month time horizon.
SPECULATIVE BUY The security is considered a BUY but in the analyst’s opinion possesses certain operational and/or fi nancial risks that may be higher than average.
HOLD The security represents fair value and no material appreciation is expected over the next 12-18 month time horizon.
SELL The security represents poor value and is expected to depreciate over the next 12-18 month time horizon.
Other Disclosures
This report has been approved by BCM which takes responsibility for this report and its dissemination in Canada. Canadian clients wishing to effect transactions in any security discussed should do so through a qualifi ed salesperson of BCM.
Informational Reports
From time to time BCM will issue reports that are for information purposes only and will not include investment ratings. These reports will be clearly labelled accordingly.
35
Ro
din
ia M
inera
ls I
nc.
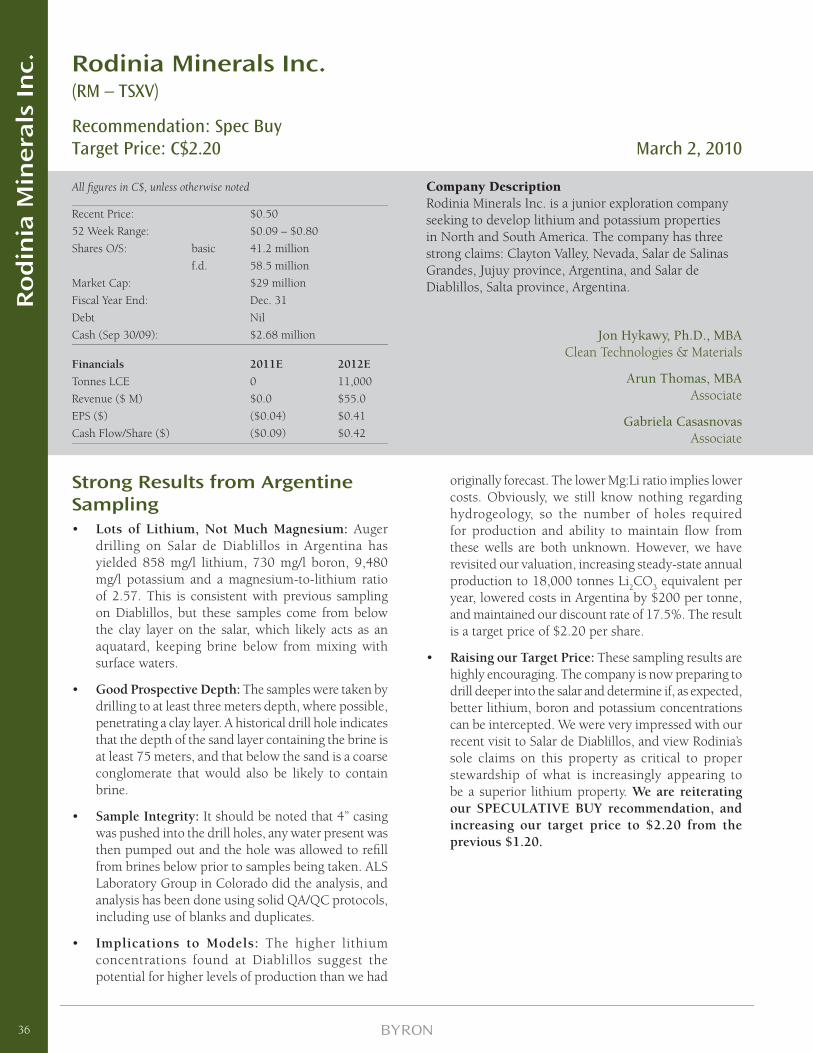
Rodinia Minerals Inc.(RM – TSXV)
Recommendation: Spec BuyTarget Price: C$2.20 March 2, 2010
All fi gures in C$, unless otherwise noted
Recent Price: $0.50
52 Week Range: $0.09 – $0.80
Shares O/S: basic 41.2 million
f.d. 58.5 million
Market Cap: $29 million
Fiscal Year End: Dec. 31
Debt Nil
Cash (Sep 30/09): $2.68 million
Financials 2011E 2012E
Tonnes LCE 0 11,000
Revenue ($ M) $0.0 $55.0
EPS ($) ($0.04) $0.41
Cash Flow/Share ($) ($0.09) $0.42
Company DescriptionRodinia Minerals Inc. is a junior exploration company seeking to develop lithium and potassium properties in North and South America. The company has three strong claims: Clayton Valley, Nevada, Salar de Salinas Grandes, Jujuy province, Argentina, and Salar de Diablillos, Salta province, Argentina.
Strong Results from Argentine Sampling • Lots of Lithium, Not Much Magnesium: Auger
drilling on Salar de Diablillos in Argentina has yielded 858 mg/l lithium, 730 mg/l boron, 9,480 mg/l potassium and a magnesium-to-lithium ratio of 2.57. This is consistent with previous sampling on Diablillos, but these samples come from below the clay layer on the salar, which likely acts as an aquatard, keeping brine below from mixing with surface waters.
• Good Prospective Depth: The samples were taken by drilling to at least three meters depth, where possible, penetrating a clay layer. A historical drill hole indicates that the depth of the sand layer containing the brine is at least 75 meters, and that below the sand is a coarse conglomerate that would also be likely to contain brine.
• Sample Integrity: It should be noted that 4” casing was pushed into the drill holes, any water present was then pumped out and the hole was allowed to refi ll from brines below prior to samples being taken. ALS Laboratory Group in Colorado did the analysis, and analysis has been done using solid QA/QC protocols, including use of blanks and duplicates.
• Implications to Models: The higher lithium concentrations found at Diablillos suggest the potential for higher levels of production than we had
originally forecast. The lower Mg:Li ratio implies lower costs. Obviously, we still know nothing regarding hydrogeology, so the number of holes required for production and ability to maintain fl ow from these wells are both unknown. However, we have revisited our valuation, increasing steady-state annual production to 18,000 tonnes Li
2CO
3 equivalent per
year, lowered costs in Argentina by $200 per tonne, and maintained our discount rate of 17.5%. The result is a target price of $2.20 per share.
• Raising our Target Price: These sampling results are highly encouraging. The company is now preparing to drill deeper into the salar and determine if, as expected, better lithium, boron and potassium concentrations can be intercepted. We were very impressed with our recent visit to Salar de Diablillos, and view Rodinia’s sole claims on this property as critical to proper stewardship of what is increasingly appearing to be a superior lithium property. We are reiterating our SPECULATIVE BUY recommendation, and increasing our target price to $2.20 from the previous $1.20.
Jon Hykawy, Ph.D., MBAClean Technologies & Materials
Arun Thomas, MBAAssociate
Gabriela CasasnovasAssociate
36
Ro
din
ia M
inera
ls I
nc.
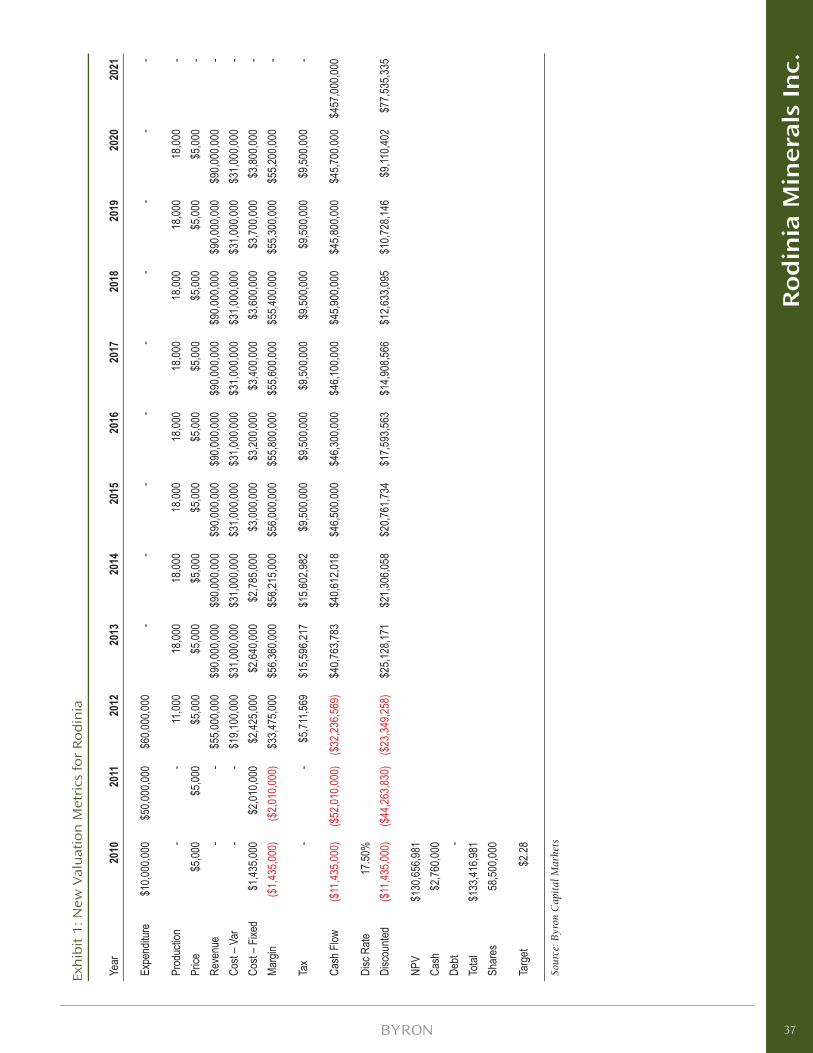
Exh
ibit
1:
New
Val
uat
ion
Met
rics
fo
r R
od
inia
Year
2010
2011
2012
2013
2014
2015
2016
2017
2018
2019
2020
2021
Expe
nditu
re$1
0,000
,000
$50,0
00,00
0$6
0,000
,000
--
--
--
--
-
Prod
uctio
n-
-11
,000
18,00
018
,000
18,00
018
,000
18,00
018
,000
18,00
018
,000
-Pr
ice$5
,000
$5,00
0$5
,000
$5,00
0$5
,000
$5,00
0$5
,000
$5,00
0$5
,000
$5,00
0$5
,000
-Re
venu
e-
-$5
5,000
,000
$90,0
00,00
0$9
0,000
,000
$90,0
00,00
0$9
0,000
,000
$90,0
00,00
0$9
0,000
,000
$90,0
00,00
0$9
0,000
,000
-Co
st – V
ar-
-$1
9,100
,000
$31,0
00,00
0$3
1,000
,000
$31,0
00,00
0$3
1,000
,000
$31,0
00,00
0$3
1,000
,000
$31,0
00,00
0$3
1,000
,000
-Co
st – F
ixed
$1,43
5,000
$2,01
0,000
$2,42
5,000
$2,64
0,000
$2,78
5,000
$3,00
0,000
$3,20
0,000
$3,40
0,000
$3,60
0,000
$3,70
0,000
$3,80
0,000
-Ma
rgin
($1,4
35,00
0)($
2,010
,000)
$33,4
75,00
0$5
6,360
,000
$56,2
15,00
0$5
6,000
,000
$55,8
00,00
0$5
5,600
,000
$55,4
00,00
0$5
5,300
,000
$55,2
00,00
0-
Tax
--
$5,71
1,569
$15,5
96,21
7$1
5,602
,982
$9,50
0,000
$9,50
0,000
$9,50
0,000
$9,50
0,000
$9,50
0,000
$9,50
0,000
-
Cash
Flow
($11
,435,0
00)
($52
,010,0
00)
($32
,236,5
69)
$40,7
63,78
3$4
0,612
,018
$46,5
00,00
0$4
6,300
,000
$46,1
00,00
0$4
5,900
,000
$45,8
00,00
0$4
5,700
,000
$457
,000,0
00
Disc
Rate
17.50
%Di
scou
nted
($11
,435,0
00)
($44
,263,8
30)
($23
,349,2
58)
$25,1
28,17
1$2
1,306
,058
$20,7
61,73
4$1
7,593
,563
$14,9
08,56
6$1
2,633
,095
$10,7
28,14
6$9
,110,4
02$7
7,535
,335
NPV
$130
,656,9
81Ca
sh
$2,76
0,000
Debt
-To
tal$1
33,41
6,981
Shar
es58
,500,0
00
Targ
et$2
.28
Sour
ce: B
yron
Cap
ital
Mar
kets
37
Ro
din
ia M
inera
ls I
nc.
IMPORTANT DISCLOSURES
Analyst’s Certifi cation
All of the views expressed in this report accurately refl ect the personal views of the responsible analyst(s) about any and all of the subject securities or issuers. No part of the compensation of the responsible analyst(s) named herein is, or will be, directly or indirectly, related to the specifi c recommendations or views expressed by the responsible analyst(s) in this report. The particulars contained herein were obtained from sources which we believe to be reliable but are not guaranteed by us and may be incomplete.
Byron Capital Markets (“BCM”) is a division of Byron Securities Limited which is a Member of IIROC and CIPF. BCM compensates its research analysts from a variety of sources. The research department is a cost centre and is funded by the business activities of BCM including institutional equity sales and trading, retail sales and corporate and investment banking. Since the revenues from these businesses vary the funds for research compensation vary. No one business line has greater infl uence than any other for research analyst compensation.
Dissemination of Research
BCM endeavors to make all reasonable efforts to provide research simultaneously to all eligible clients. BCM equity research is distributed electronically via email and is posted on our proprietary websites to ensure eligible clients receive coverage initiations and ratings changes, targets and opinions in a timely manner. Additional distribution may be done by the sales personnel via email, fax or regular mail. Clients may also receive our research via a third party.
Company Specifi c Disclosures: N/A
Investment Rating Criteria
BUY The security represents attractive value and is expected to appreciate signifi cantly from the current price over the next 12-18 month time horizon.
SPECULATIVE BUY The security is considered a BUY but in the analyst’s opinion possesses certain operational and/or fi nancial risks that may be higher than average.
HOLD The security represents fair value and no material appreciation is expected over the next 12-18 month time horizon.
SELL The security represents poor value and is expected to depreciate over the next 12-18 month time horizon.
Other Disclosures
This report has been approved by BCM which takes responsibility for this report and its dissemination in Canada. Canadian clients wishing to effect transactions in any security discussed should do so through a qualifi ed salesperson of BCM.
Informational Reports
From time to time BCM will issue reports that are for information purposes only and will not include investment ratings. These reports will be clearly labeled accordingly.
38
Ro
din
ia M
inera
ls I
nc.
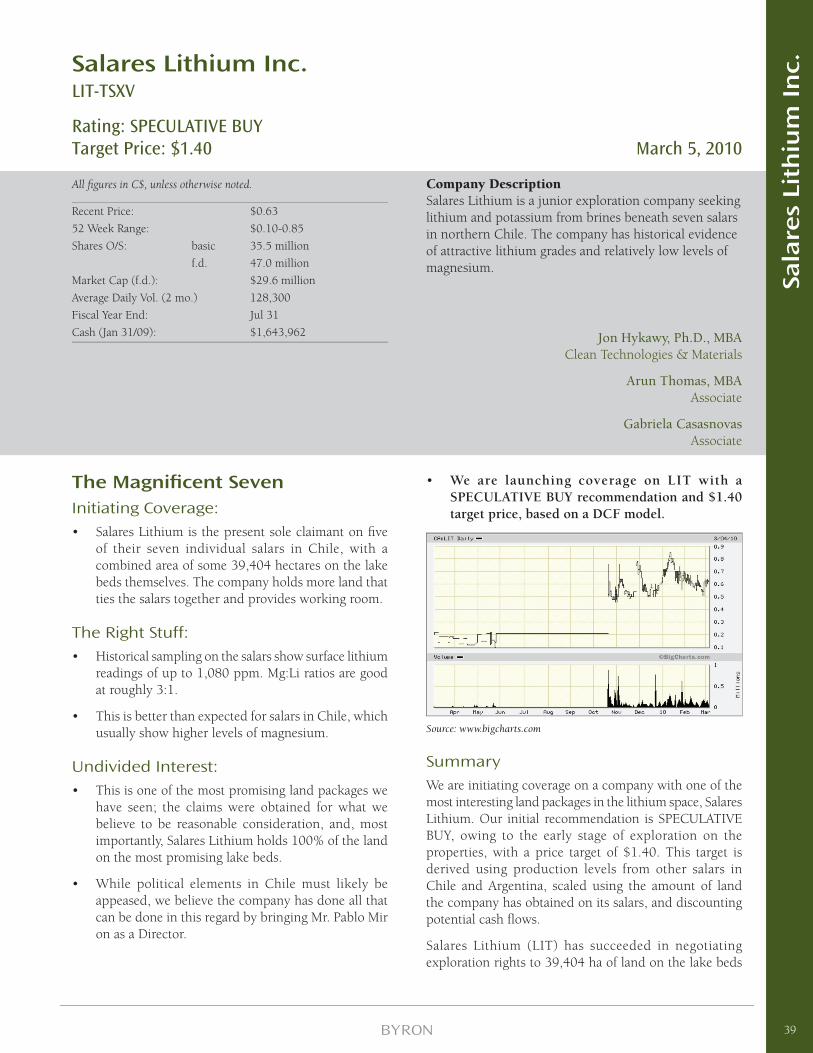
Salares Lithium Inc.LIT-TSXV
Rating: SPECULATIVE BUYTarget Price: $1.40 March 5, 2010
All fi gures in C$, unless otherwise noted.
Recent Price: $0.63
52 Week Range: $0.10-0.85
Shares O/S: basic 35.5 million
f.d. 47.0 million
Market Cap (f.d.): $29.6 million
Average Daily Vol. (2 mo.) 128,300
Fiscal Year End: Jul 31
Cash (Jan 31/09): $1,643,962
Company DescriptionSalares Lithium is a junior exploration company seeking lithium and potassium from brines beneath seven salars in northern Chile. The company has historical evidence of attractive lithium grades and relatively low levels of magnesium.
The Magnifi cent SevenInitiating Coverage:• Salares Lithium is the present sole claimant on fi ve
of their seven individual salars in Chile, with a combined area of some 39,404 hectares on the lake beds themselves. The company holds more land that ties the salars together and provides working room.
The Right Stuff:• Historical sampling on the salars show surface lithium
readings of up to 1,080 ppm. Mg:Li ratios are good at roughly 3:1.
• This is better than expected for salars in Chile, which usually show higher levels of magnesium.
Undivided Interest:• This is one of the most promising land packages we
have seen; the claims were obtained for what we believe to be reasonable consideration, and, most importantly, Salares Lithium holds 100% of the land on the most promising lake beds.
• While political elements in Chile must likely be appeased, we believe the company has done all that can be done in this regard by bringing Mr. Pablo Mir on as a Director.
• We are launching coverage on LIT with a SPECULATIVE BUY recommendation and $1.40 target price, based on a DCF model.
Source: www.bigcharts.com
SummaryWe are initiating coverage on a company with one of the most interesting land packages in the lithium space, Salares Lithium. Our initial recommendation is SPECULATIVE BUY, owing to the early stage of exploration on the properties, with a price target of $1.40. This target is derived using production levels from other salars in Chile and Argentina, scaled using the amount of land the company has obtained on its salars, and discounting potential cash fl ows.
Salares Lithium (LIT) has succeeded in negotiating exploration rights to 39,404 ha of land on the lake beds
Jon Hykawy, Ph.D., MBAClean Technologies & Materials
Arun Thomas, MBAAssociate
Gabriela CasasnovasAssociate
39
Sala
res
Lith
ium
In
c.
themselves. Through their Chilean partner, the company holds sole claim to fi ve salars and is a claimant on two others. The company has signifi cantly more land claims that serve to provide area for evaporation ponds should production prove to be warranted, to tie its claims together and to prevent others from staking claims at the edge of these salars. However, we have already seen enough geophysical data from companies in both Chile and Argentina to recognize that it is very likely to be the land on the dry lake beds themselves that will provide any potential productive brine fl ow. And 39,404 ha is a very signifi cant area, with the company also claiming an additional 57,200 hectares of land surrounding their salars.
Of course, this land is useless without lithium. Historical grab sampling on the surfaces of these salars, from lagoons, streams and springs, has shown grades of up to 1,080 ppm Li, which is more than acceptable. Surprisingly, these grab samples also showed some consistency with Argentine salars, in that the ratio of magnesium to lithium on the largest salar claimed by LIT, Salar de la Isla, was roughly 3:1. Chilean salars generally have very high grades of lithium, and acceptable levels of magnesium. We do note that some Chilean salars also have high levels of sulphate ions, which can also prove problematic, but no historical data on sulphate levels is available in regard to LIT’s properties.
The company plans to move rapidly from TEM analysis to a program of surface sampling, and has already engaged a noted expert to guide them in this work. Dr. Luis Ignacio Silva’s biography is available below. Our conversations with Dr. Silva would suggest he is already contemplating a program that should be rapid and complete, and leave little room for doubt regarding its conclusions.
In short, the company has secured a large quantity of potentially useful land on seven closely grouped salars in Chile. These salars seem to have interesting grades of Li and acceptable Mg:Li ratios, on a historical basis. They have already secured the services of what appear to be several talented individuals to guide the company and attempt to increase shareholder value. And they are in a region where additional talent and equipment is readily available for projects such as this. We believe that Salares Lithium has vaulted over many others to become one of the most interesting companies in this space. We are initiating coverage with a SPECULATIVE BUY recommendation, and are establishing a target price of $1.40.
Lithium From Brine — Why And HowLithium is a critical ingredient in the manufacturing of rechargeable lithium-ion batteries. While certainly not a major factor in fi nal cost of the cell, without lithium there would be no lithium-ion battery. There are other chemicals
that can create other rechargeable batteries, but none of them have the ability to produce as much power or store as much energy as a lithium-ion battery of a given size.
While the lithium market was roughly 118,000 tonnes of Li
2CO
3, or lithium carbonate equivalent (LCE), in
2008, and a heavily recession-impacted 85,000 tonnes in 2009, it is important to note that about 23,600 tonnes of this demand is from rechargeable batteries alone. Of course, this is up from essentially zero demand from batteries in 1999, so battery demand growth has been, and continues to be, robust. Our previous report, Lithium: The Next Strategic Material (Sept. 4, 2009), outlined our projections for supply and demand, and we believe that battery demand alone will grow to 56,400 tonnes of LCE by 2014.
According to TRU Group, some 72% of the lithium produced in the world today comes from brine-based suppliers. This amounted to some 85,000 tonnes LCE per year in 2008. Brine-based supply is the least expensive source of lithium (roughly $2,300 per tonne of LCE, all-in cost, versus as much as $6,500 per tonne from underground-mined spodumene), but supplying lithium from brines demands that the producer respect their aquifer and ensure that excess pumping does not result in permanent impairment of the resource through depletion or dilution.
Production of lithium from brines is most inexpensively accomplished using solar evaporation. Foote Minerals has previously disclosed, in US Patent Number 4,261,960, the general method of producing lithium carbonate from the brines of Clayton Valley, Nevada. Brine is pumped into a succession of holding ponds until its lithium concentration rises to 800 ppm. At this point, slaked lime is added as the brine is pumped to a new pond, and magnesium (Mg) in the brine reacts with the lime to create Mg(OH)
2,
which precipitates out of solution. Mg is separated out as Li concentration increases to perhaps 2,000 ppm. Acid and calcium chloride are then added to remove boron and sulphate from the brine; the brine is then pumped to a further succession of ponds until Li concentration rises and soda ash is added to precipitate out the lithium as Li
2CO
3, what amounts to lithium-based chalk.
Necessarily, this process requires time. The speed is determined by the rate of evaporation of water, locally. In Clayton Valley, from December to March the net evaporation rate is negative — more water falls as snow than evaporates from ponds. As such, Chemetall does not even attempt to use its ponds during winter months. And even in the best environments on Earth, the time to produce lithium is measured in sizeable fractions of a year, not days or weeks. It is thus impossible, barring stockpiling, for a brine-based producer to respond to sudden spikes in price or demand for lithium. Note that it
40
Sala
res
Lith
ium
In
c.
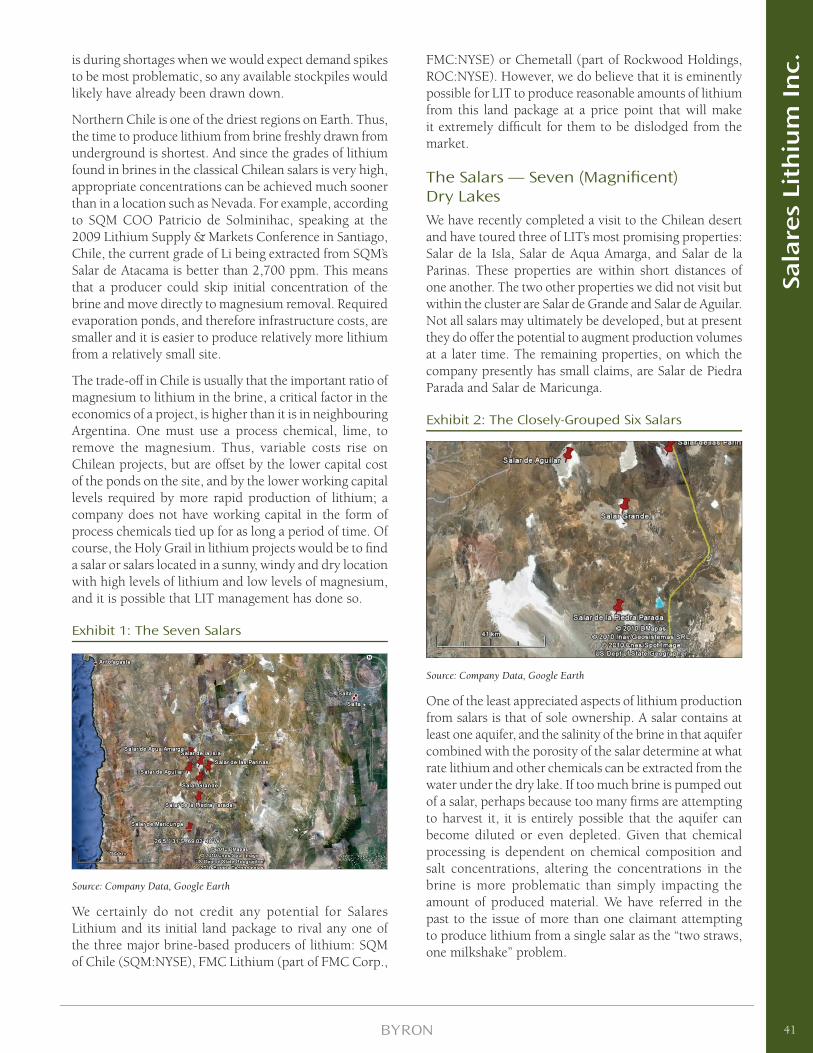
is during shortages when we would expect demand spikes to be most problematic, so any available stockpiles would likely have already been drawn down.
Northern Chile is one of the driest regions on Earth. Thus, the time to produce lithium from brine freshly drawn from underground is shortest. And since the grades of lithium found in brines in the classical Chilean salars is very high, appropriate concentrations can be achieved much sooner than in a location such as Nevada. For example, according to SQM COO Patricio de Solminihac, speaking at the 2009 Lithium Supply & Markets Conference in Santiago, Chile, the current grade of Li being extracted from SQM’s Salar de Atacama is better than 2,700 ppm. This means that a producer could skip initial concentration of the brine and move directly to magnesium removal. Required evaporation ponds, and therefore infrastructure costs, are smaller and it is easier to produce relatively more lithium from a relatively small site.
The trade-off in Chile is usually that the important ratio of magnesium to lithium in the brine, a critical factor in the economics of a project, is higher than it is in neighbouring Argentina. One must use a process chemical, lime, to remove the magnesium. Thus, variable costs rise on Chilean projects, but are offset by the lower capital cost of the ponds on the site, and by the lower working capital levels required by more rapid production of lithium; a company does not have working capital in the form of process chemicals tied up for as long a period of time. Of course, the Holy Grail in lithium projects would be to fi nd a salar or salars located in a sunny, windy and dry location with high levels of lithium and low levels of magnesium, and it is possible that LIT management has done so.
Exhibit 1: The Seven Salars
Source: Company Data, Google Earth
We certainly do not credit any potential for Salares Lithium and its initial land package to rival any one of the three major brine-based producers of lithium: SQM of Chile (SQM:NYSE), FMC Lithium (part of FMC Corp.,
FMC:NYSE) or Chemetall (part of Rockwood Holdings, ROC:NYSE). However, we do believe that it is eminently possible for LIT to produce reasonable amounts of lithium from this land package at a price point that will make it extremely diffi cult for them to be dislodged from the market.
The Salars — Seven (Magnifi cent) Dry Lakes We have recently completed a visit to the Chilean desert and have toured three of LIT’s most promising properties: Salar de la Isla, Salar de Aqua Amarga, and Salar de la Parinas. These properties are within short distances of one another. The two other properties we did not visit but within the cluster are Salar de Grande and Salar de Aguilar. Not all salars may ultimately be developed, but at present they do offer the potential to augment production volumes at a later time. The remaining properties, on which the company presently has small claims, are Salar de Piedra Parada and Salar de Maricunga.
Exhibit 2: The Closely-Grouped Six Salars
Source: Company Data, Google Earth
One of the least appreciated aspects of lithium production from salars is that of sole ownership. A salar contains at least one aquifer, and the salinity of the brine in that aquifer combined with the porosity of the salar determine at what rate lithium and other chemicals can be extracted from the water under the dry lake. If too much brine is pumped out of a salar, perhaps because too many fi rms are attempting to harvest it, it is entirely possible that the aquifer can become diluted or even depleted. Given that chemical processing is dependent on chemical composition and salt concentrations, altering the concentrations in the brine is more problematic than simply impacting the amount of produced material. We have referred in the past to the issue of more than one claimant attempting to produce lithium from a single salar as the “two straws, one milkshake” problem.
41
Sala
res
Lith
ium
In
c.
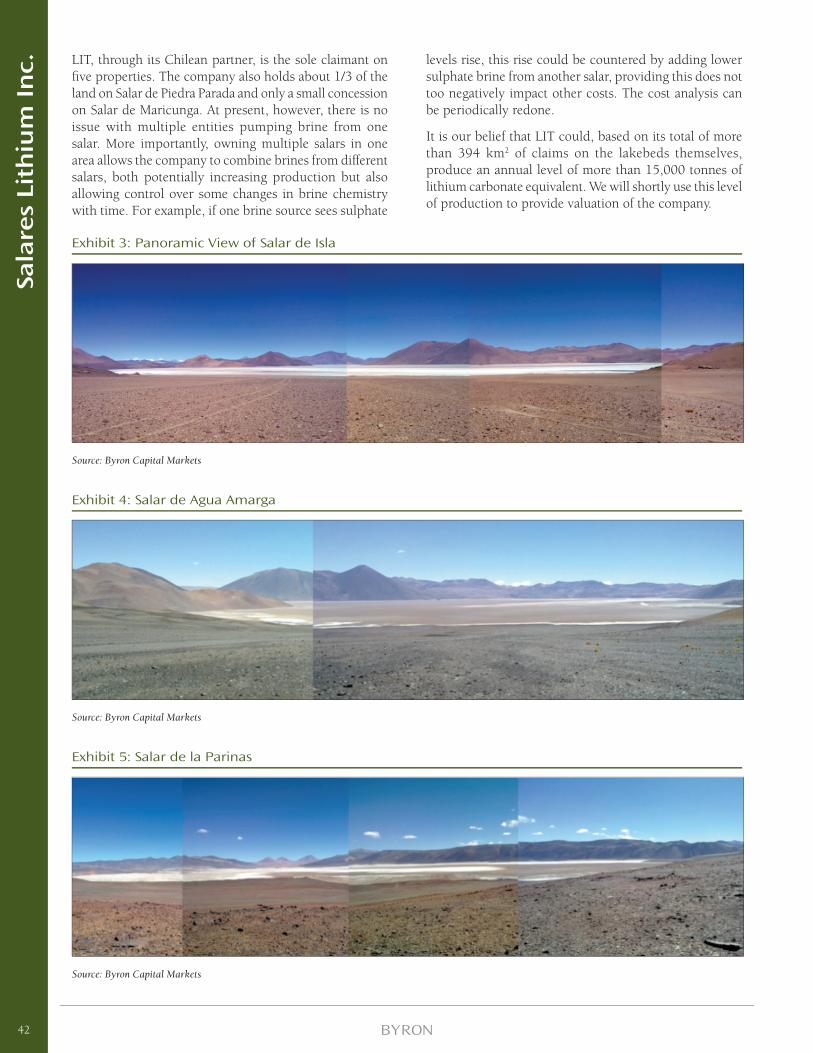
Exhibit 4: Salar de Agua Amarga
Source: Byron Capital Markets
LIT, through its Chilean partner, is the sole claimant on fi ve properties. The company also holds about 1/3 of the land on Salar de Piedra Parada and only a small concession on Salar de Maricunga. At present, however, there is no issue with multiple entities pumping brine from one salar. More importantly, owning multiple salars in one area allows the company to combine brines from different salars, both potentially increasing production but also allowing control over some changes in brine chemistry with time. For example, if one brine source sees sulphate
Exhibit 3: Panoramic View of Salar de Isla
Source: Byron Capital Markets
Exhibit 5: Salar de la Parinas
Source: Byron Capital Markets
levels rise, this rise could be countered by adding lower sulphate brine from another salar, providing this does not too negatively impact other costs. The cost analysis can be periodically redone.
It is our belief that LIT could, based on its total of more than 394 km2 of claims on the lakebeds themselves, produce an annual level of more than 15,000 tonnes of lithium carbonate equivalent. We will shortly use this level of production to provide valuation of the company.
42
Sala
res
Lith
ium
In
c.
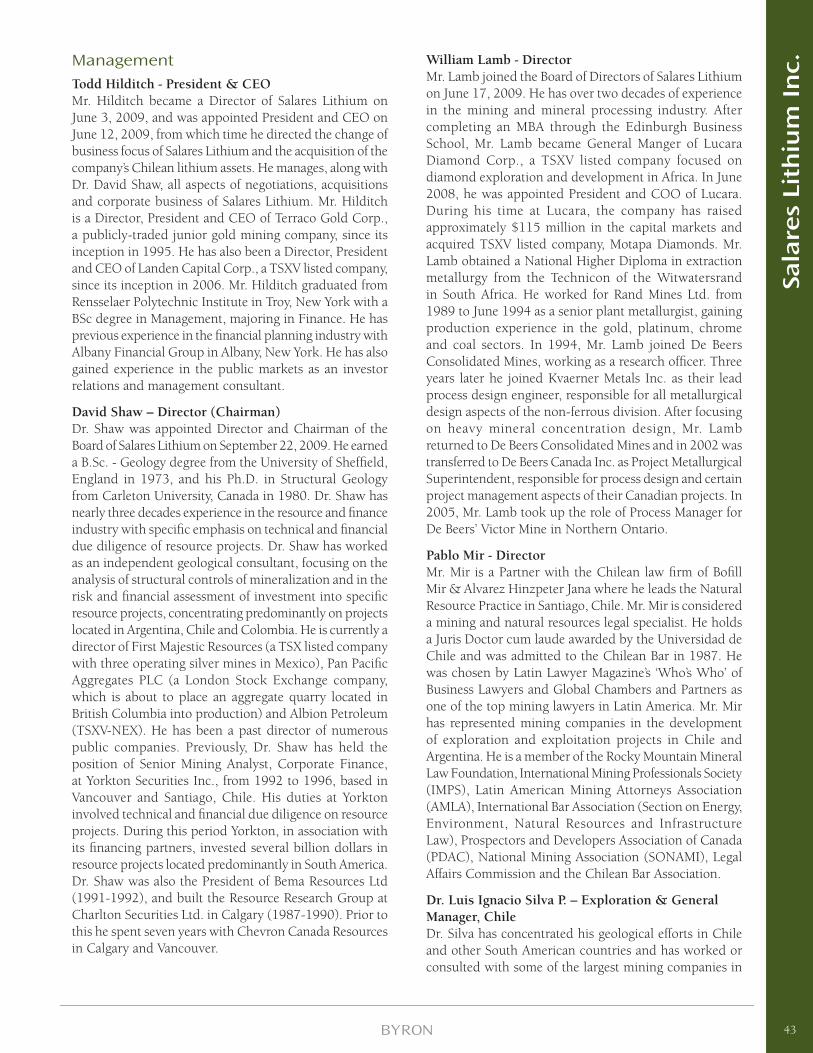
ManagementTodd Hilditch - President & CEO Mr. Hilditch became a Director of Salares Lithium on June 3, 2009, and was appointed President and CEO on June 12, 2009, from which time he directed the change of business focus of Salares Lithium and the acquisition of the company’s Chilean lithium assets. He manages, along with Dr. David Shaw, all aspects of negotiations, acquisitions and corporate business of Salares Lithium. Mr. Hilditch is a Director, President and CEO of Terraco Gold Corp., a publicly-traded junior gold mining company, since its inception in 1995. He has also been a Director, President and CEO of Landen Capital Corp., a TSXV listed company, since its inception in 2006. Mr. Hilditch graduated from Rensselaer Polytechnic Institute in Troy, New York with a BSc degree in Management, majoring in Finance. He has previous experience in the fi nancial planning industry with Albany Financial Group in Albany, New York. He has also gained experience in the public markets as an investor relations and management consultant.
David Shaw – Director (Chairman)Dr. Shaw was appointed Director and Chairman of the Board of Salares Lithium on September 22, 2009. He earned a B.Sc. - Geology degree from the University of Sheffi eld, England in 1973, and his Ph.D. in Structural Geology from Carleton University, Canada in 1980. Dr. Shaw has nearly three decades experience in the resource and fi nance industry with specifi c emphasis on technical and fi nancial due diligence of resource projects. Dr. Shaw has worked as an independent geological consultant, focusing on the analysis of structural controls of mineralization and in the risk and fi nancial assessment of investment into specifi c resource projects, concentrating predominantly on projects located in Argentina, Chile and Colombia. He is currently a director of First Majestic Resources (a TSX listed company with three operating silver mines in Mexico), Pan Pacifi c Aggregates PLC (a London Stock Exchange company, which is about to place an aggregate quarry located in British Columbia into production) and Albion Petroleum (TSXV-NEX). He has been a past director of numerous public companies. Previously, Dr. Shaw has held the position of Senior Mining Analyst, Corporate Finance, at Yorkton Securities Inc., from 1992 to 1996, based in Vancouver and Santiago, Chile. His duties at Yorkton involved technical and fi nancial due diligence on resource projects. During this period Yorkton, in association with its fi nancing partners, invested several billion dollars in resource projects located predominantly in South America. Dr. Shaw was also the President of Bema Resources Ltd (1991-1992), and built the Resource Research Group at Charlton Securities Ltd. in Calgary (1987-1990). Prior to this he spent seven years with Chevron Canada Resources in Calgary and Vancouver.
William Lamb - DirectorMr. Lamb joined the Board of Directors of Salares Lithium on June 17, 2009. He has over two decades of experience in the mining and mineral processing industry. After completing an MBA through the Edinburgh Business School, Mr. Lamb became General Manger of Lucara Diamond Corp., a TSXV listed company focused on diamond exploration and development in Africa. In June 2008, he was appointed President and COO of Lucara. During his time at Lucara, the company has raised approximately $115 million in the capital markets and acquired TSXV listed company, Motapa Diamonds. Mr. Lamb obtained a National Higher Diploma in extraction metallurgy from the Technicon of the Witwatersrand in South Africa. He worked for Rand Mines Ltd. from 1989 to June 1994 as a senior plant metallurgist, gaining production experience in the gold, platinum, chrome and coal sectors. In 1994, Mr. Lamb joined De Beers Consolidated Mines, working as a research offi cer. Three years later he joined Kvaerner Metals Inc. as their lead process design engineer, responsible for all metallurgical design aspects of the non-ferrous division. After focusing on heavy mineral concentration design, Mr. Lamb returned to De Beers Consolidated Mines and in 2002 was transferred to De Beers Canada Inc. as Project Metallurgical Superintendent, responsible for process design and certain project management aspects of their Canadian projects. In 2005, Mr. Lamb took up the role of Process Manager for De Beers’ Victor Mine in Northern Ontario.
Pablo Mir - DirectorMr. Mir is a Partner with the Chilean law fi rm of Bofi ll Mir & Alvarez Hinzpeter Jana where he leads the Natural Resource Practice in Santiago, Chile. Mr. Mir is considered a mining and natural resources legal specialist. He holds a Juris Doctor cum laude awarded by the Universidad de Chile and was admitted to the Chilean Bar in 1987. He was chosen by Latin Lawyer Magazine’s ‘Who’s Who’ of Business Lawyers and Global Chambers and Partners as one of the top mining lawyers in Latin America. Mr. Mir has represented mining companies in the development of exploration and exploitation projects in Chile and Argentina. He is a member of the Rocky Mountain Mineral Law Foundation, International Mining Professionals Society (IMPS), Latin American Mining Attorneys Association (AMLA), International Bar Association (Section on Energy, Environment, Natural Resources and Infrastructure Law), Prospectors and Developers Association of Canada (PDAC), National Mining Association (SONAMI), Legal Affairs Commission and the Chilean Bar Association.
Dr. Luis Ignacio Silva P. – Exploration & General Manager, ChileDr. Silva has concentrated his geological efforts in Chile and other South American countries and has worked or consulted with some of the largest mining companies in
43
Sala
res
Lith
ium
In
c.
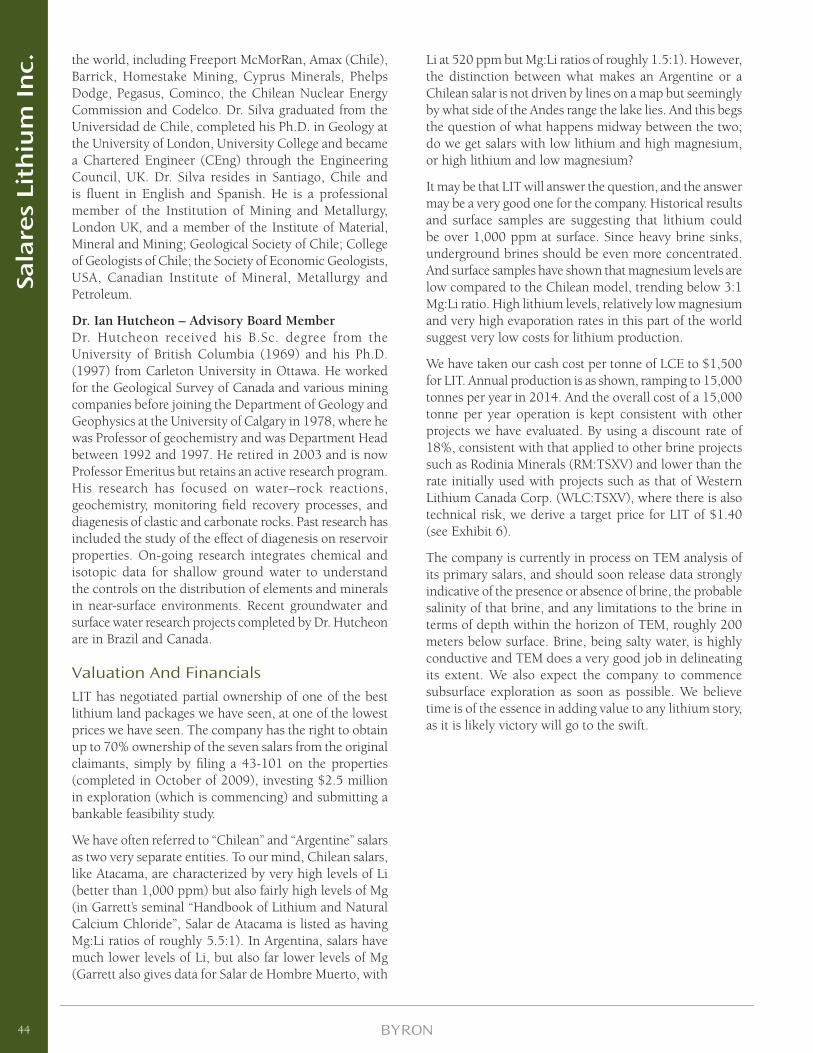
the world, including Freeport McMorRan, Amax (Chile), Barrick, Homestake Mining, Cyprus Minerals, Phelps Dodge, Pegasus, Cominco, the Chilean Nuclear Energy Commission and Codelco. Dr. Silva graduated from the Universidad de Chile, completed his Ph.D. in Geology at the University of London, University College and became a Chartered Engineer (CEng) through the Engineering Council, UK. Dr. Silva resides in Santiago, Chile and is fl uent in English and Spanish. He is a professional member of the Institution of Mining and Metallurgy, London UK, and a member of the Institute of Material, Mineral and Mining; Geological Society of Chile; College of Geologists of Chile; the Society of Economic Geologists, USA, Canadian Institute of Mineral, Metallurgy and Petroleum.
Dr. Ian Hutcheon – Advisory Board MemberDr. Hutcheon received his B.Sc. degree from the University of British Columbia (1969) and his Ph.D. (1997) from Carleton University in Ottawa. He worked for the Geological Survey of Canada and various mining companies before joining the Department of Geology and Geophysics at the University of Calgary in 1978, where he was Professor of geochemistry and was Department Head between 1992 and 1997. He retired in 2003 and is now Professor Emeritus but retains an active research program. His research has focused on water–rock reactions, geochemistry, monitoring fi eld recovery processes, and diagenesis of clastic and carbonate rocks. Past research has included the study of the effect of diagenesis on reservoir properties. On-going research integrates chemical and isotopic data for shallow ground water to understand the controls on the distribution of elements and minerals in near-surface environments. Recent groundwater and surface water research projects completed by Dr. Hutcheon are in Brazil and Canada.
Valuation And FinancialsLIT has negotiated partial ownership of one of the best lithium land packages we have seen, at one of the lowest prices we have seen. The company has the right to obtain up to 70% ownership of the seven salars from the original claimants, simply by fi ling a 43-101 on the properties (completed in October of 2009), investing $2.5 million in exploration (which is commencing) and submitting a bankable feasibility study.
We have often referred to “Chilean” and “Argentine” salars as two very separate entities. To our mind, Chilean salars, like Atacama, are characterized by very high levels of Li (better than 1,000 ppm) but also fairly high levels of Mg (in Garrett’s seminal “Handbook of Lithium and Natural Calcium Chloride”, Salar de Atacama is listed as having Mg:Li ratios of roughly 5.5:1). In Argentina, salars have much lower levels of Li, but also far lower levels of Mg (Garrett also gives data for Salar de Hombre Muerto, with
Li at 520 ppm but Mg:Li ratios of roughly 1.5:1). However, the distinction between what makes an Argentine or a Chilean salar is not driven by lines on a map but seemingly by what side of the Andes range the lake lies. And this begs the question of what happens midway between the two; do we get salars with low lithium and high magnesium, or high lithium and low magnesium?
It may be that LIT will answer the question, and the answer may be a very good one for the company. Historical results and surface samples are suggesting that lithium could be over 1,000 ppm at surface. Since heavy brine sinks, underground brines should be even more concentrated. And surface samples have shown that magnesium levels are low compared to the Chilean model, trending below 3:1 Mg:Li ratio. High lithium levels, relatively low magnesium and very high evaporation rates in this part of the world suggest very low costs for lithium production.
We have taken our cash cost per tonne of LCE to $1,500 for LIT. Annual production is as shown, ramping to 15,000 tonnes per year in 2014. And the overall cost of a 15,000 tonne per year operation is kept consistent with other projects we have evaluated. By using a discount rate of 18%, consistent with that applied to other brine projects such as Rodinia Minerals (RM:TSXV) and lower than the rate initially used with projects such as that of Western Lithium Canada Corp. (WLC:TSXV), where there is also technical risk, we derive a target price for LIT of $1.40 (see Exhibit 6).
The company is currently in process on TEM analysis of its primary salars, and should soon release data strongly indicative of the presence or absence of brine, the probable salinity of that brine, and any limitations to the brine in terms of depth within the horizon of TEM, roughly 200 meters below surface. Brine, being salty water, is highly conductive and TEM does a very good job in delineating its extent. We also expect the company to commence subsurface exploration as soon as possible. We believe time is of the essence in adding value to any lithium story, as it is likely victory will go to the swift.
44
Sala
res
Lith
ium
In
c.
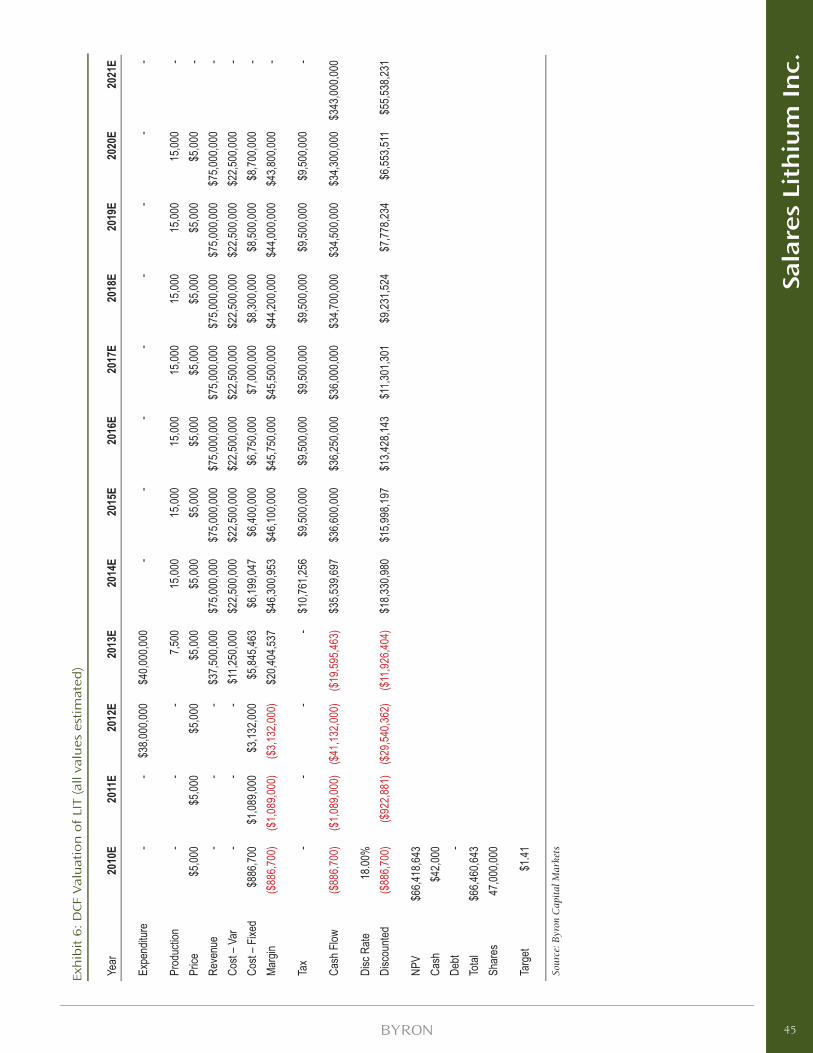
Exh
ibit
6:
DCF
Val
uat
ion
of
LIT
(all
valu
es e
stim
ated
)
Year
2010
E20
11E
2012
E20
13E
2014
E20
15E
2016
E20
17E
2018
E20
19E
2020
E20
21E
Expe
nditu
re-
-$3
8,000
,000
$40,0
00,00
0-
--
--
--
-
Prod
uctio
n-
--
7,500
15,00
015
,000
15,00
015
,000
15,00
015
,000
15,00
0-
Price
$5,00
0$5
,000
$5,00
0$5
,000
$5,00
0$5
,000
$5,00
0$5
,000
$5,00
0$5
,000
$5,00
0-
Reve
nue
--
-$3
7,500
,000
$75,0
00,00
0$7
5,000
,000
$75,0
00,00
0$7
5,000
,000
$75,0
00,00
0$7
5,000
,000
$75,0
00,00
0-
Cost
– Var
--
-$1
1,250
,000
$22,5
00,00
0$2
2,500
,000
$22,5
00,00
0$2
2,500
,000
$22,5
00,00
0$2
2,500
,000
$22,5
00,00
0-
Cost
– Fixe
d$8
86,70
0$1
,089,0
00$3
,132,0
00$5
,845,4
63$6
,199,0
47$6
,400,0
00$6
,750,0
00$7
,000,0
00$8
,300,0
00$8
,500,0
00$8
,700,0
00-
Marg
in($
886,7
00)
($1,0
89,00
0)($
3,132
,000)
$20,4
04,53
7$4
6,300
,953
$46,1
00,00
0$4
5,750
,000
$45,5
00,00
0$4
4,200
,000
$44,0
00,00
0$4
3,800
,000
-
Tax
--
--
$10,7
61,25
6$9
,500,0
00$9
,500,0
00$9
,500,0
00$9
,500,0
00$9
,500,0
00$9
,500,0
00-
Cash
Flow
($88
6,700
)($
1,089
,000)
($41
,132,0
00)
($19
,595,4
63)
$35,5
39,69
7$3
6,600
,000
$36,2
50,00
0$3
6,000
,000
$34,7
00,00
0$3
4,500
,000
$34,3
00,00
0$3
43,00
0,000
Disc
Rate
18.00
%Di
scou
nted
($88
6,700
)($
922,8
81)
($29
,540,3
62)
($11
,926,4
04)
$18,3
30,98
0$1
5,998
,197
$13,4
28,14
3$1
1,301
,301
$9,23
1,524
$7,77
8,234
$6,55
3,511
$55,5
38,23
1
NPV
$66,4
18,64
3Ca
sh
$42,0
00De
bt-
Total
$66,4
60,64
3Sh
ares
47,00
0,000
Targ
et$1
.41
Sour
ce: B
yron
Cap
ital
Mar
kets
45
Sala
res
Lith
ium
In
c.
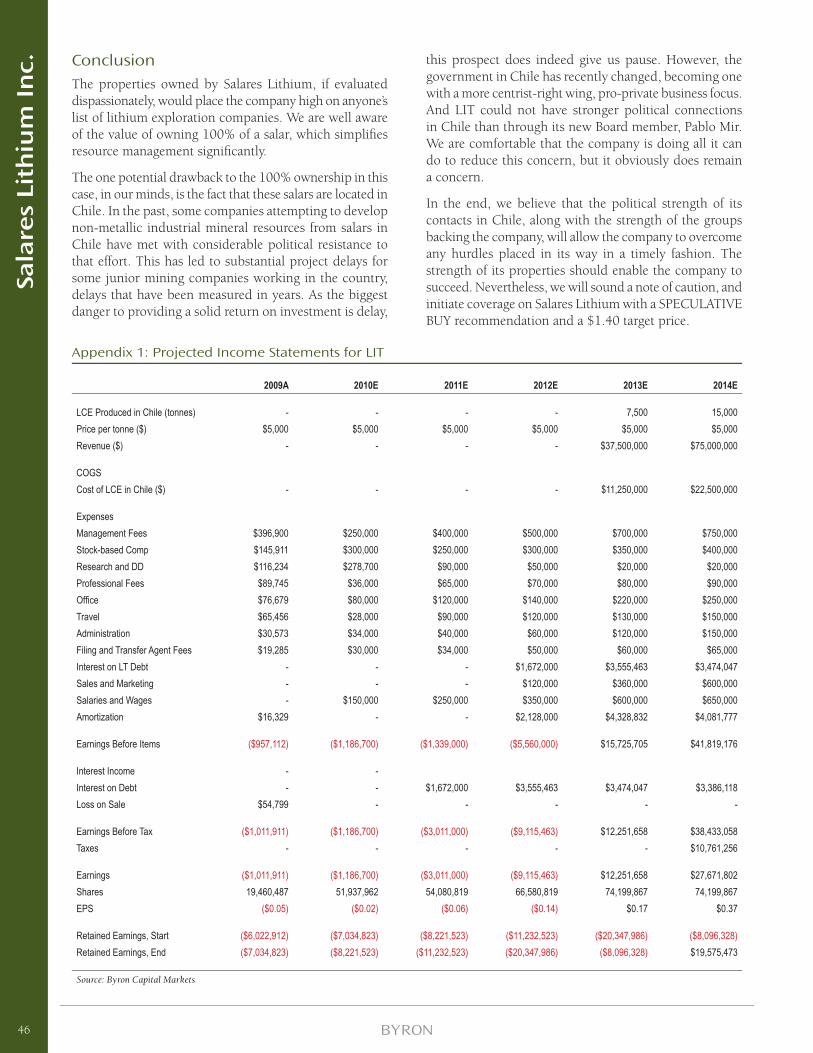
ConclusionThe properties owned by Salares Lithium, if evaluated dispassionately, would place the company high on anyone’s list of lithium exploration companies. We are well aware of the value of owning 100% of a salar, which simplifi es resource management signifi cantly.
The one potential drawback to the 100% ownership in this case, in our minds, is the fact that these salars are located in Chile. In the past, some companies attempting to develop non-metallic industrial mineral resources from salars in Chile have met with considerable political resistance to that effort. This has led to substantial project delays for some junior mining companies working in the country, delays that have been measured in years. As the biggest danger to providing a solid return on investment is delay,
this prospect does indeed give us pause. However, the government in Chile has recently changed, becoming one with a more centrist-right wing, pro-private business focus. And LIT could not have stronger political connections in Chile than through its new Board member, Pablo Mir. We are comfortable that the company is doing all it can do to reduce this concern, but it obviously does remain a concern.
In the end, we believe that the political strength of its contacts in Chile, along with the strength of the groups backing the company, will allow the company to overcome any hurdles placed in its way in a timely fashion. The strength of its properties should enable the company to succeed. Nevertheless, we will sound a note of caution, and initiate coverage on Salares Lithium with a SPECULATIVE BUY recommendation and a $1.40 target price.
Appendix 1: Projected Income Statements for LIT
2009A 2010E 2011E 2012E 2013E 2014E
LCE Produced in Chile (tonnes) - - - - 7,500 15,000 Price per tonne ($) $5,000 $5,000 $5,000 $5,000 $5,000 $5,000 Revenue ($) - - - - $37,500,000 $75,000,000
COGSCost of LCE in Chile ($) - - - - $11,250,000 $22,500,000
ExpensesManagement Fees $396,900 $250,000 $400,000 $500,000 $700,000 $750,000 Stock-based Comp $145,911 $300,000 $250,000 $300,000 $350,000 $400,000 Research and DD $116,234 $278,700 $90,000 $50,000 $20,000 $20,000 Professional Fees $89,745 $36,000 $65,000 $70,000 $80,000 $90,000 Offi ce $76,679 $80,000 $120,000 $140,000 $220,000 $250,000 Travel $65,456 $28,000 $90,000 $120,000 $130,000 $150,000 Administration $30,573 $34,000 $40,000 $60,000 $120,000 $150,000 Filing and Transfer Agent Fees $19,285 $30,000 $34,000 $50,000 $60,000 $65,000 Interest on LT Debt - - - $1,672,000 $3,555,463 $3,474,047 Sales and Marketing - - - $120,000 $360,000 $600,000 Salaries and Wages - $150,000 $250,000 $350,000 $600,000 $650,000 Amortization $16,329 - - $2,128,000 $4,328,832 $4,081,777
Earnings Before Items ($957,112) ($1,186,700) ($1,339,000) ($5,560,000) $15,725,705 $41,819,176
Interest Income - -Interest on Debt - - $1,672,000 $3,555,463 $3,474,047 $3,386,118 Loss on Sale $54,799 - - - - -
Earnings Before Tax ($1,011,911) ($1,186,700) ($3,011,000) ($9,115,463) $12,251,658 $38,433,058 Taxes - - - - - $10,761,256
Earnings ($1,011,911) ($1,186,700) ($3,011,000) ($9,115,463) $12,251,658 $27,671,802 Shares 19,460,487 51,937,962 54,080,819 66,580,819 74,199,867 74,199,867 EPS ($0.05) ($0.02) ($0.06) ($0.14) $0.17 $0.37
Retained Earnings, Start ($6,022,912) ($7,034,823) ($8,221,523) ($11,232,523) ($20,347,986) ($8,096,328)Retained Earnings, End ($7,034,823) ($8,221,523) ($11,232,523) ($20,347,986) ($8,096,328) $19,575,473
Source: Byron Capital Markets
46
Sala
res
Lith
ium
In
c.
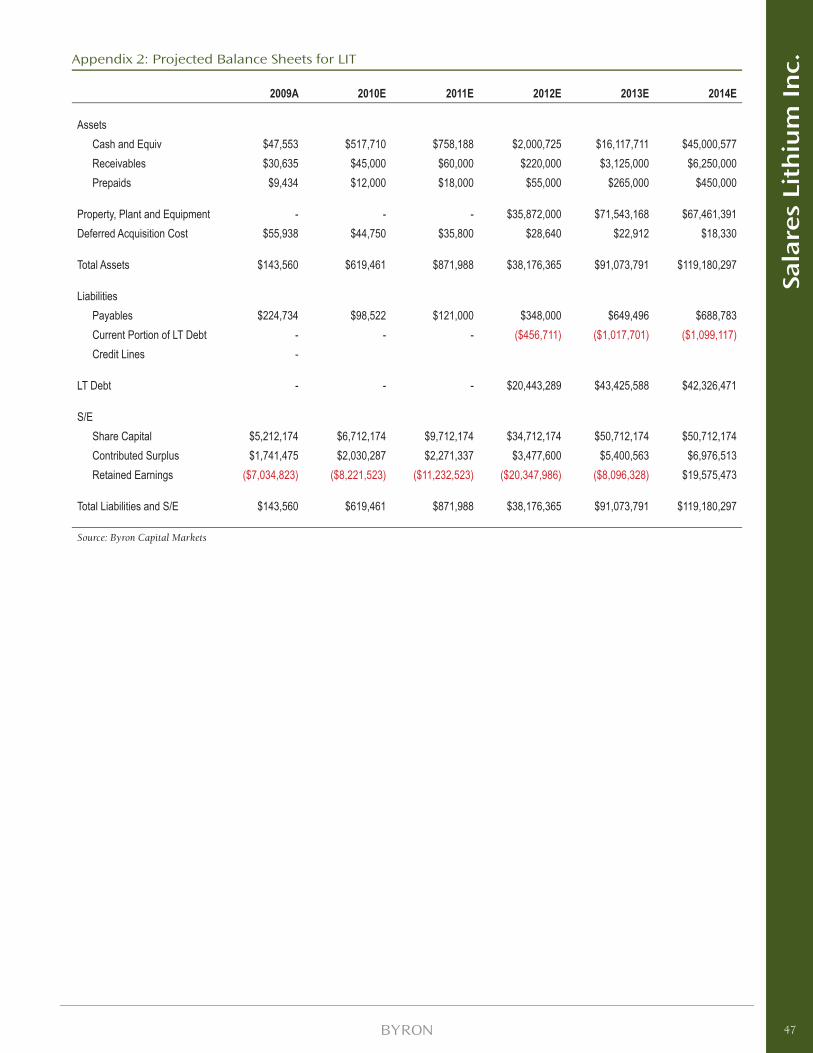
Appendix 2: Projected Balance Sheets for LIT
2009A 2010E 2011E 2012E 2013E 2014E
AssetsCash and Equiv $47,553 $517,710 $758,188 $2,000,725 $16,117,711 $45,000,577 Receivables $30,635 $45,000 $60,000 $220,000 $3,125,000 $6,250,000 Prepaids $9,434 $12,000 $18,000 $55,000 $265,000 $450,000
Property, Plant and Equipment - - - $35,872,000 $71,543,168 $67,461,391 Deferred Acquisition Cost $55,938 $44,750 $35,800 $28,640 $22,912 $18,330
Total Assets $143,560 $619,461 $871,988 $38,176,365 $91,073,791 $119,180,297
LiabilitiesPayables $224,734 $98,522 $121,000 $348,000 $649,496 $688,783 Current Portion of LT Debt - - - ($456,711) ($1,017,701) ($1,099,117)Credit Lines -
LT Debt - - - $20,443,289 $43,425,588 $42,326,471
S/EShare Capital $5,212,174 $6,712,174 $9,712,174 $34,712,174 $50,712,174 $50,712,174 Contributed Surplus $1,741,475 $2,030,287 $2,271,337 $3,477,600 $5,400,563 $6,976,513 Retained Earnings ($7,034,823) ($8,221,523) ($11,232,523) ($20,347,986) ($8,096,328) $19,575,473
Total Liabilities and S/E $143,560 $619,461 $871,988 $38,176,365 $91,073,791 $119,180,297
Source: Byron Capital Markets
47
Sala
res
Lith
ium
In
c.
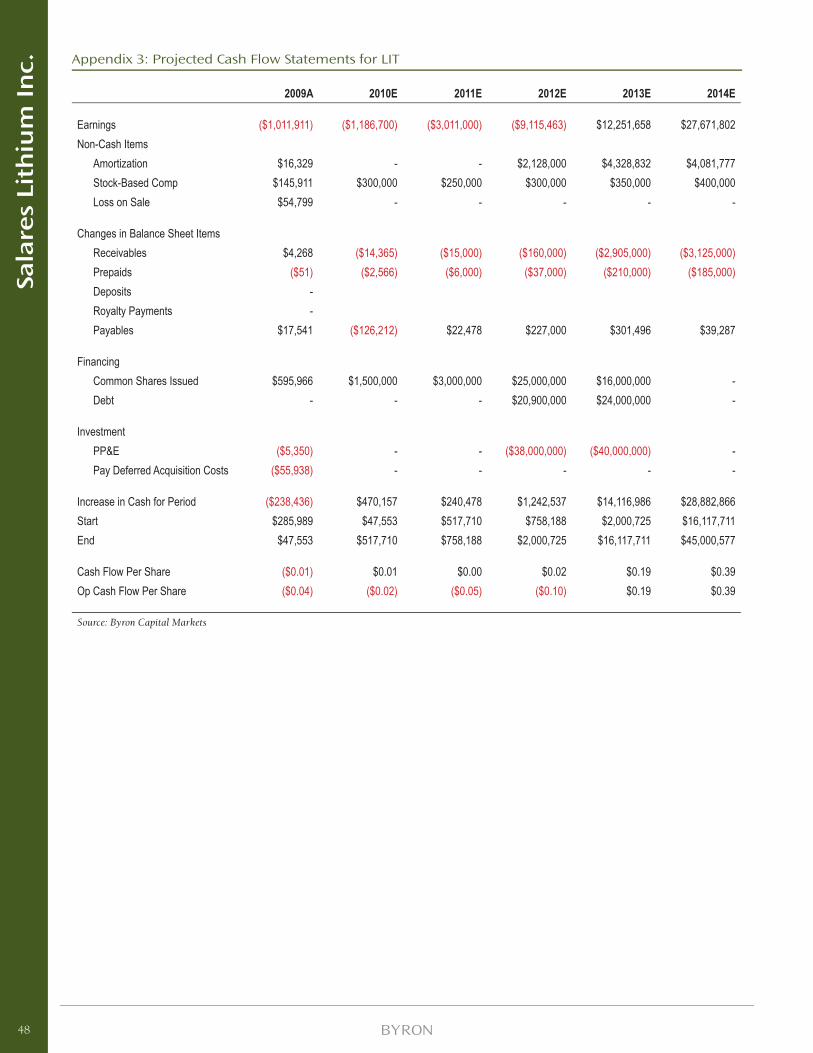
2009A 2010E 2011E 2012E 2013E 2014E
Earnings ($1,011,911) ($1,186,700) ($3,011,000) ($9,115,463) $12,251,658 $27,671,802 Non-Cash Items
Amortization $16,329 - - $2,128,000 $4,328,832 $4,081,777 Stock-Based Comp $145,911 $300,000 $250,000 $300,000 $350,000 $400,000 Loss on Sale $54,799 - - - - -
Changes in Balance Sheet ItemsReceivables $4,268 ($14,365) ($15,000) ($160,000) ($2,905,000) ($3,125,000)Prepaids ($51) ($2,566) ($6,000) ($37,000) ($210,000) ($185,000)Deposits - Royalty Payments - Payables $17,541 ($126,212) $22,478 $227,000 $301,496 $39,287
FinancingCommon Shares Issued $595,966 $1,500,000 $3,000,000 $25,000,000 $16,000,000 - Debt - - - $20,900,000 $24,000,000 -
InvestmentPP&E ($5,350) - - ($38,000,000) ($40,000,000) - Pay Deferred Acquisition Costs ($55,938) - - - - -
Increase in Cash for Period ($238,436) $470,157 $240,478 $1,242,537 $14,116,986 $28,882,866 Start $285,989 $47,553 $517,710 $758,188 $2,000,725 $16,117,711 End $47,553 $517,710 $758,188 $2,000,725 $16,117,711 $45,000,577
Cash Flow Per Share ($0.01) $0.01 $0.00 $0.02 $0.19 $0.39 Op Cash Flow Per Share ($0.04) ($0.02) ($0.05) ($0.10) $0.19 $0.39
Source: Byron Capital Markets
Appendix 3: Projected Cash Flow Statements for LIT
48
Sala
res
Lith
ium
In
c.
Disclosures
• This report was prepared by Jon Hykawy (Analyst), Gabriela Casanovas and Arun Thomas (Associates). At the date of release of this report Jon Hykawy owns no common shares, Arun Thomas owns no common shares, and Gabriela Casanovas owns 8,200 common shares of Salares Lithium.
• As of March 5, 2010 Byron Capital Markets owned no shares of Salares Lithium. The total number of shares held directly or under option by offi cers or directors of Byron were less than 2% of the total number of common shares outstanding.
• From July 2009 to March 2010, analyst or associates have made one visit to the salars claimed by Salares Lithium, outside Antofagasta, Chile. The company paid travel expenses within Chile.
• A percentage of Byron Capital Markets’ total investment banking revenues is allocated to a pool from which all of its analysts receive a portion of their compensation. Analysts are not compensated based upon any specifi c investment banking transaction.
The information contained in this report has been drawn from sources believed to be reliable but its accuracy or completeness is not guaranteed, nor in providing it does Byron Capital Markets assume any responsibility or liability. Byron Capital Markets, its directors, offi cers and other employees may, from time to time, have positions in the securities mentioned herein. Contents of this report cannot be reproduced in whole or in part without the express permission of Byron Capital Markets.
Byron Capital Markets Policies and Procedures Regarding the Dissemination of Research
General policy is to make available a research report to its clients for an exclusive period of up to 30 days. Following that period, the research report will appear on the Byron Capital Markets website at www.byroncapitalmarkets.com.
Analyst Certifi cation
I, Jon Hykawy, certify the views expressed in this report were formed by my review of relevant company data and industry investigation, and accurately refl ect my opinion about the investment merits of the securities mentioned in the report. I also certify that my compensation is not related to specifi c recommendations or views expressed in this report.
Byron Capital Markets publishes research and investment recommendations for the use of its clients. Information regarding our categories of recommendations, quarterly summaries of the percentage of our recommendations that fall into each category and our policies regarding the release of our research reports is available at www.byroncapitalmarkets.com, or may be requested by contacting the analyst.
49
Sala
res
Lith
ium
In
c.

The following section has been prepared by:Gabriela Casasnovas, Associate
Elisa Chio, Associate
LITHIUMFor the company snapshots:
1. Currency used is native to the exchange.
2. Unless otherwise stated and except for per share data, all values are listed in millions.
3. Abbreviations used:
a. N/A – Not available
b. WI – Working interest
4. JORC is the acronym for the Australasian Joint Ore Reserves Committee who has set the standards for the reporting of mineral resources and ore reserves. From a mineral resource point of view, this Australasian standard is considered comparable to the Canadian Securities Administrators NI 43-101 with the distinction that NI 43-101 is a securities disclosure whereas JORC is a mineral disclosure.
a. For further information on JORC, please visit http://www.jorc.org/.
5. Ownership refers to working interest in the project, not necessarily to the ownership of the salar(s) as a whole.
6. All fi nancial information have been sourced from Capital IQ, https://www.capitaliq.com/.
51
LITH
IUM
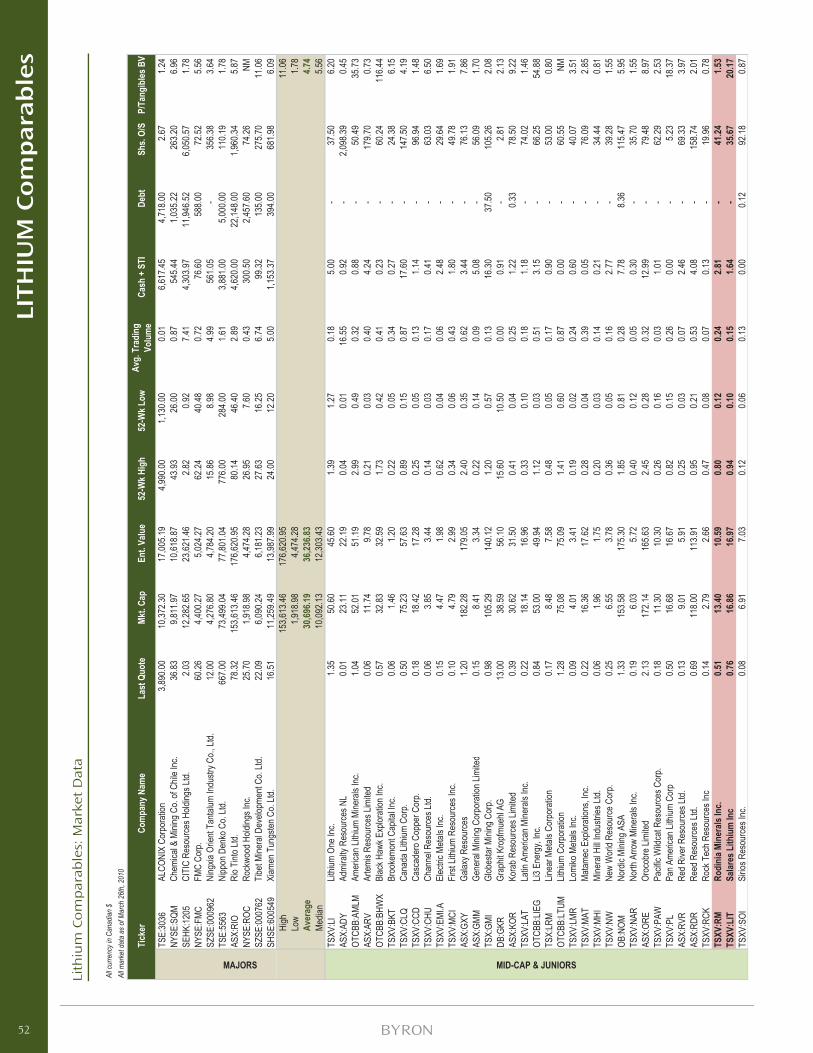
Lith
ium
Co
mp
arab
les:
Mar
ket
Dat
a
52
LITH
IUM
Co
mp
ara
ble
s
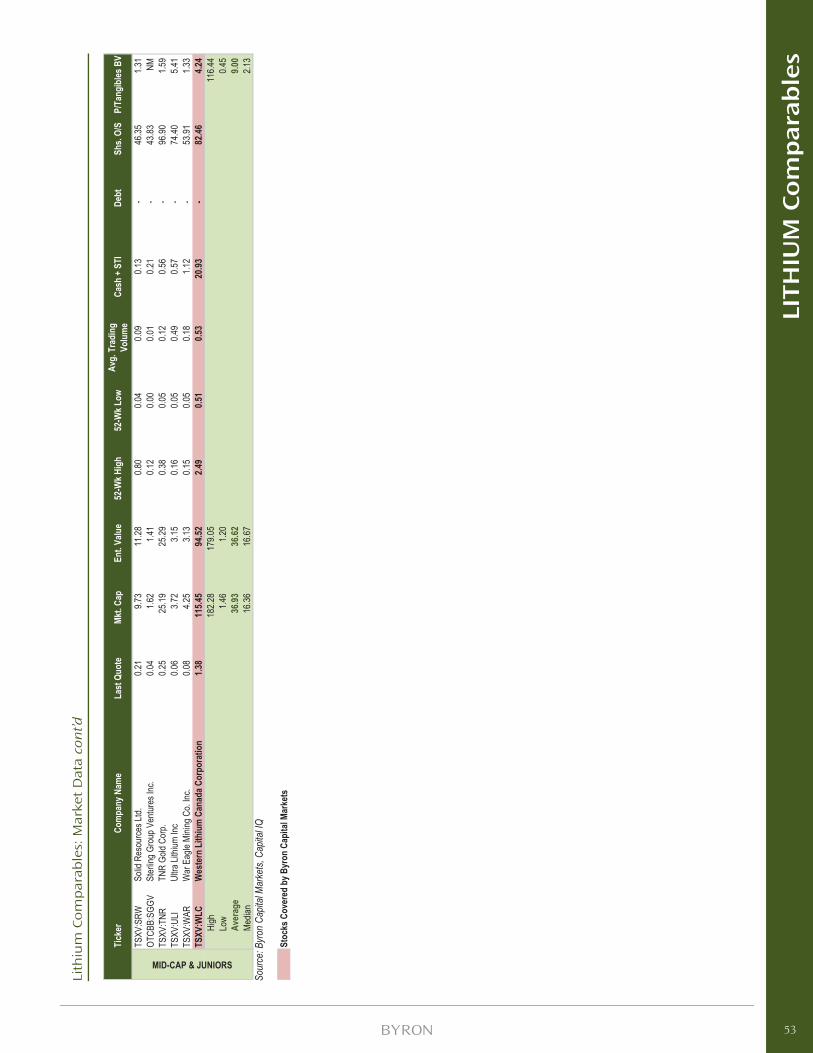
Lith
ium
Co
mp
arab
les:
Mar
ket
Dat
a co
nt’d
Sour
ce: B
yron
Cap
ital M
arke
ts, C
apita
l IQ
53
LITH
IUM
Co
mp
ara
ble
s
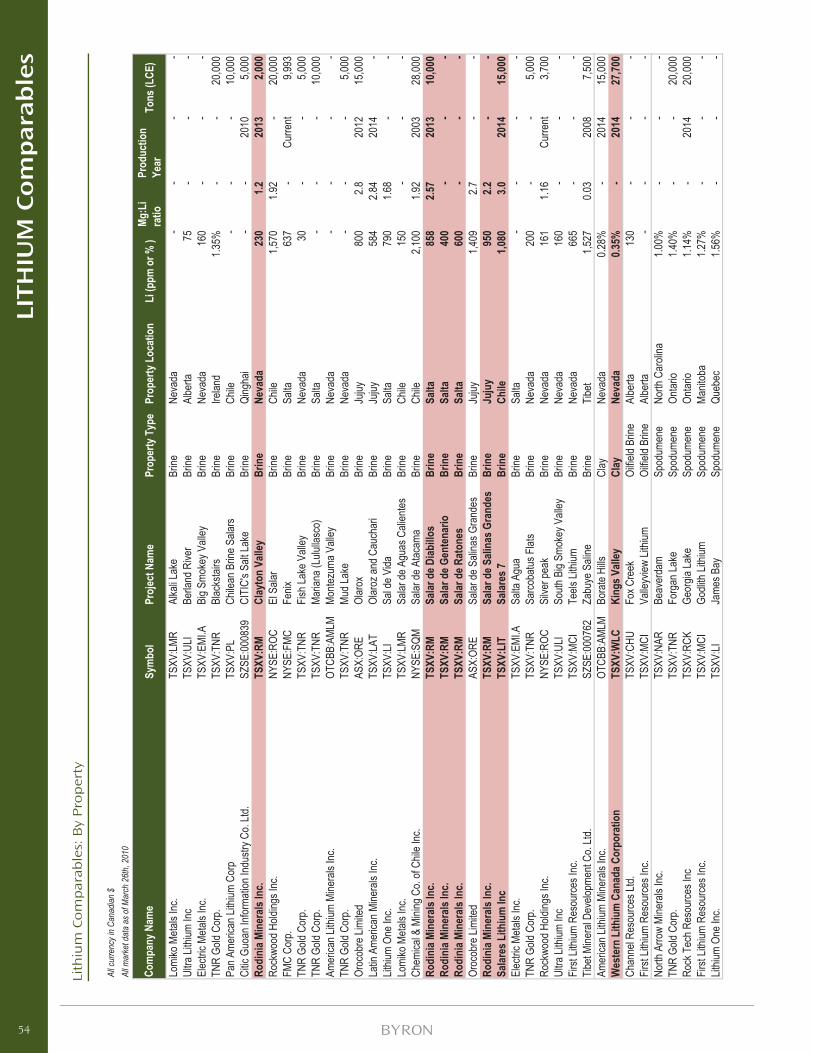
Lith
ium
Co
mp
arab
les:
By
Pro
per
ty
54
LITH
IUM
Co
mp
ara
ble
s
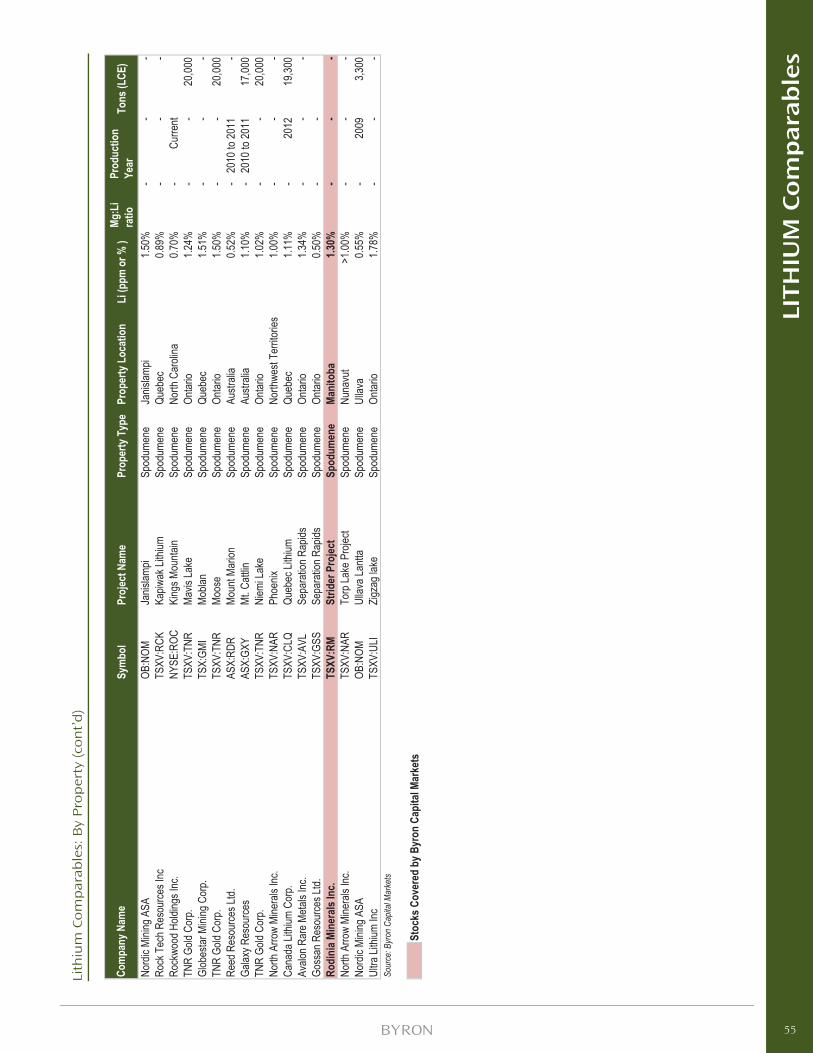
Lith
ium
Co
mp
arab
les:
By
Pro
per
ty (co
nt’
d)
55
LITH
IUM
Co
mp
ara
ble
s
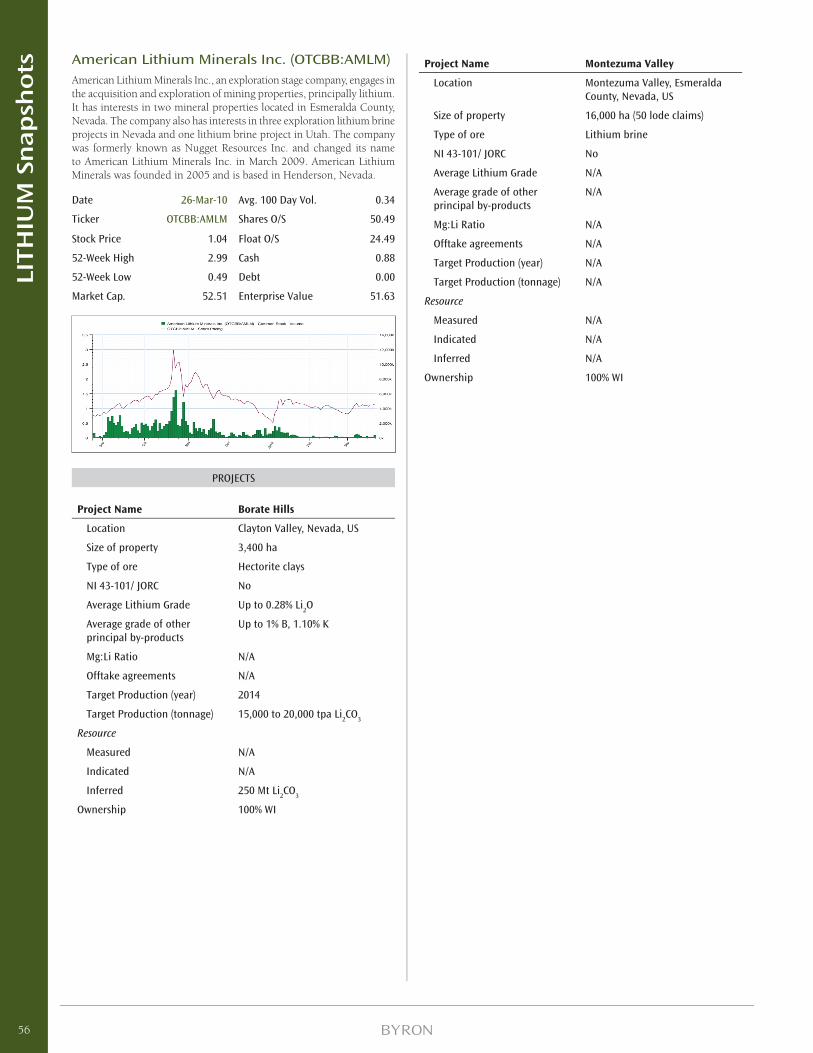
American Lithium Minerals Inc. (OTCBB:AMLM)American Lithium Minerals Inc., an exploration stage company, engages in the acquisition and exploration of mining properties, principally lithium. It has interests in two mineral properties located in Esmeralda County, Nevada. The company also has interests in three exploration lithium brine projects in Nevada and one lithium brine project in Utah. The company was formerly known as Nugget Resources Inc. and changed its name to American Lithium Minerals Inc. in March 2009. American Lithium Minerals was founded in 2005 and is based in Henderson, Nevada.
Date 26-Mar-10 Avg. 100 Day Vol. 0.34
Ticker OTCBB:AMLM Shares O/S 50.49
Stock Price 1.04 Float O/S 24.49
52-Week High 2.99 Cash 0.88
52-Week Low 0.49 Debt 0.00
Market Cap. 52.51 Enterprise Value 51.63
PROJECTS
Project Name Borate Hills
Location Clayton Valley, Nevada, US
Size of property 3,400 ha
Type of ore Hectorite clays
NI 43-101/ JORC No
Average Lithium Grade Up to 0.28% Li2O
Average grade of other principal by-products
Up to 1% B, 1.10% K
Mg:Li Ratio N/A
Offtake agreements N/A
Target Production (year) 2014
Target Production (tonnage) 15,000 to 20,000 tpa Li2CO
3
Resource
Measured N/A
Indicated N/A
Inferred 250 Mt Li2CO
3
Ownership 100% WI
Project Name Montezuma Valley
Location Montezuma Valley, Esmeralda County, Nevada, US
Size of property 16,000 ha (50 lode claims)
Type of ore Lithium brine
NI 43-101/ JORC No
Average Lithium Grade N/A
Average grade of other principal by-products
N/A
Mg:Li Ratio N/A
Offtake agreements N/A
Target Production (year) N/A
Target Production (tonnage) N/A
Resource
Measured N/A
Indicated N/A
Inferred N/A
Ownership 100% WI
56
LITH
IUM
Sn
ap
sho
ts
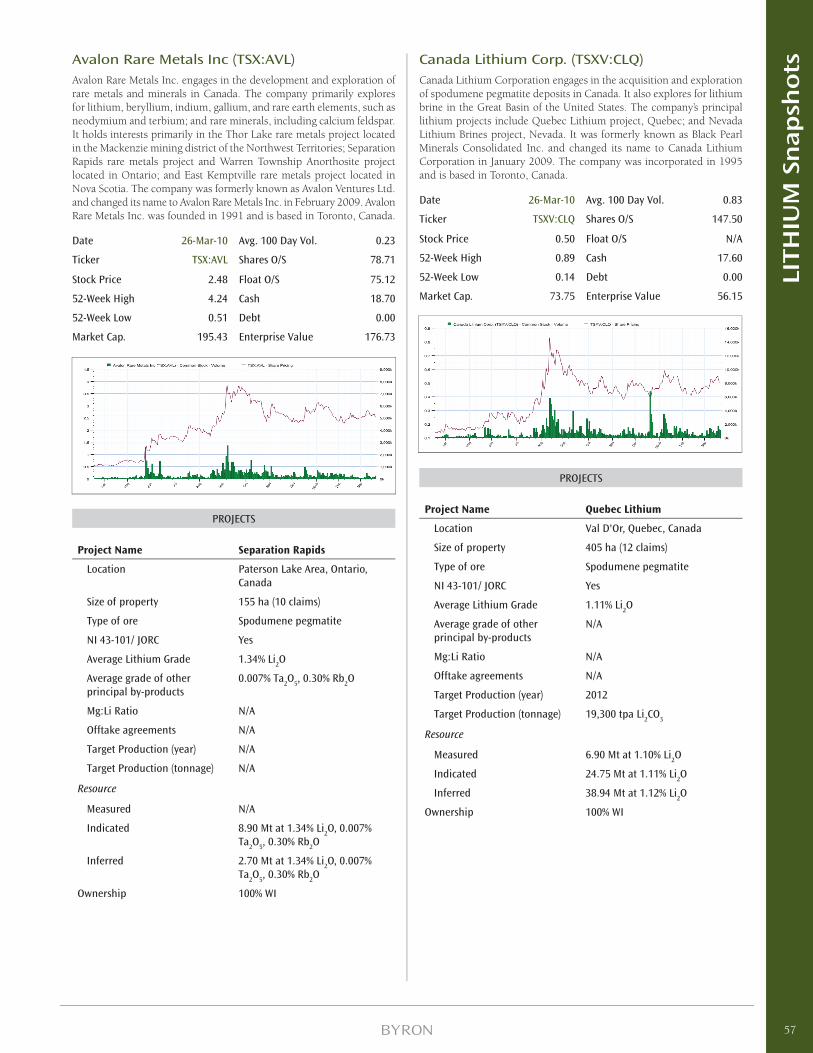
Avalon Rare Metals Inc (TSX:AVL)Avalon Rare Metals Inc. engages in the development and exploration of rare metals and minerals in Canada. The company primarily explores for lithium, beryllium, indium, gallium, and rare earth elements, such as neodymium and terbium; and rare minerals, including calcium feldspar. It holds interests primarily in the Thor Lake rare metals project located in the Mackenzie mining district of the Northwest Territories; Separation Rapids rare metals project and Warren Township Anorthosite project located in Ontario; and East Kemptville rare metals project located in Nova Scotia. The company was formerly known as Avalon Ventures Ltd. and changed its name to Avalon Rare Metals Inc. in February 2009. Avalon Rare Metals Inc. was founded in 1991 and is based in Toronto, Canada.
Date 26-Mar-10 Avg. 100 Day Vol. 0.23
Ticker TSX:AVL Shares O/S 78.71
Stock Price 2.48 Float O/S 75.12
52-Week High 4.24 Cash 18.70
52-Week Low 0.51 Debt 0.00
Market Cap. 195.43 Enterprise Value 176.73
PROJECTS
Project Name Separation Rapids
Location Paterson Lake Area, Ontario, Canada
Size of property 155 ha (10 claims)
Type of ore Spodumene pegmatite
NI 43-101/ JORC Yes
Average Lithium Grade 1.34% Li2O
Average grade of other principal by-products
0.007% Ta2O
5, 0.30% Rb
2O
Mg:Li Ratio N/A
Offtake agreements N/A
Target Production (year) N/A
Target Production (tonnage) N/A
Resource
Measured N/A
Indicated 8.90 Mt at 1.34% Li2O, 0.007%
Ta2O
5, 0.30% Rb
2O
Inferred 2.70 Mt at 1.34% Li2O, 0.007%
Ta2O
5, 0.30% Rb
2O
Ownership 100% WI
Canada Lithium Corp. (TSXV:CLQ)Canada Lithium Corporation engages in the acquisition and exploration of spodumene pegmatite deposits in Canada. It also explores for lithium brine in the Great Basin of the United States. The company’s principal lithium projects include Quebec Lithium project, Quebec; and Nevada Lithium Brines project, Nevada. It was formerly known as Black Pearl Minerals Consolidated Inc. and changed its name to Canada Lithium Corporation in January 2009. The company was incorporated in 1995 and is based in Toronto, Canada.
Date 26-Mar-10 Avg. 100 Day Vol. 0.83
Ticker TSXV:CLQ Shares O/S 147.50
Stock Price 0.50 Float O/S N/A
52-Week High 0.89 Cash 17.60
52-Week Low 0.14 Debt 0.00
Market Cap. 73.75 Enterprise Value 56.15
PROJECTS
Project Name Quebec Lithium
Location Val D'Or, Quebec, Canada
Size of property 405 ha (12 claims)
Type of ore Spodumene pegmatite
NI 43-101/ JORC Yes
Average Lithium Grade 1.11% Li2O
Average grade of other principal by-products
N/A
Mg:Li Ratio N/A
Offtake agreements N/A
Target Production (year) 2012
Target Production (tonnage) 19,300 tpa Li2CO
3
Resource
Measured 6.90 Mt at 1.10% Li2O
Indicated 24.75 Mt at 1.11% Li2O
Inferred 38.94 Mt at 1.12% Li2O
Ownership 100% WI
57
LITH
IUM
Sn
ap
sho
ts
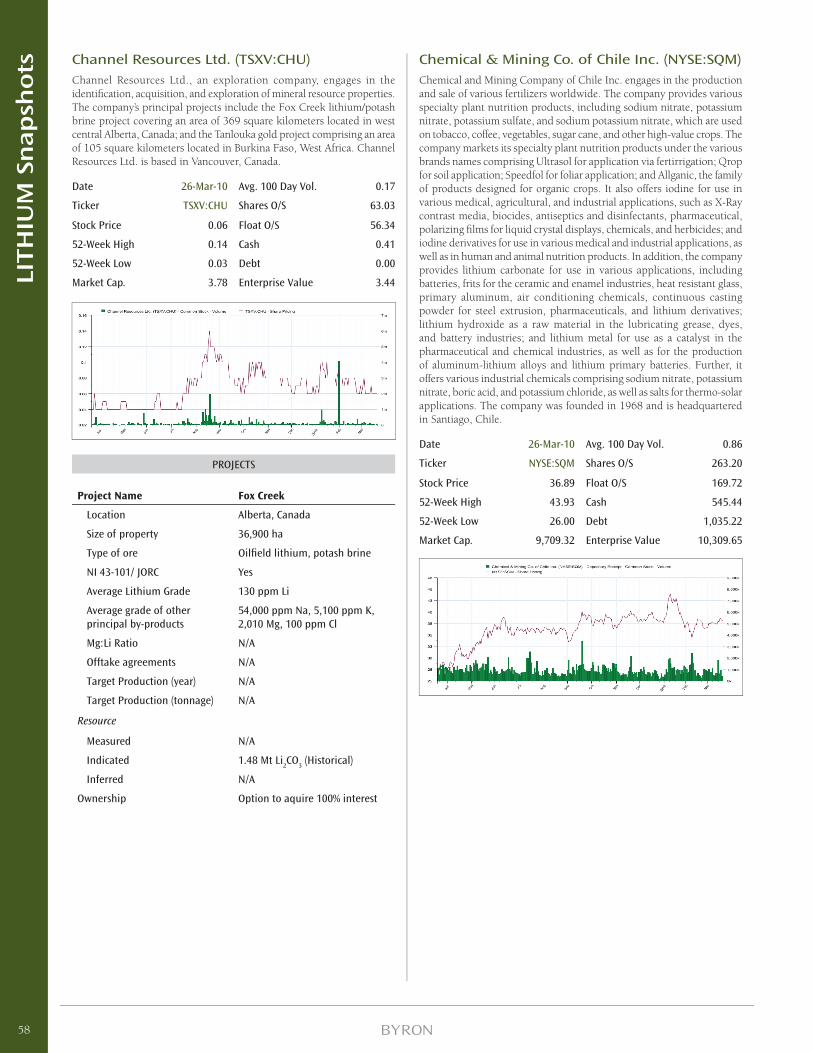
Channel Resources Ltd. (TSXV:CHU)Channel Resources Ltd., an exploration company, engages in the identifi cation, acquisition, and exploration of mineral resource properties. The company’s principal projects include the Fox Creek lithium/potash brine project covering an area of 369 square kilometers located in west central Alberta, Canada; and the Tanlouka gold project comprising an area of 105 square kilometers located in Burkina Faso, West Africa. Channel Resources Ltd. is based in Vancouver, Canada.
Date 26-Mar-10 Avg. 100 Day Vol. 0.17
Ticker TSXV:CHU Shares O/S 63.03
Stock Price 0.06 Float O/S 56.34
52-Week High 0.14 Cash 0.41
52-Week Low 0.03 Debt 0.00
Market Cap. 3.78 Enterprise Value 3.44
PROJECTS
Project Name Fox Creek
Location Alberta, Canada
Size of property 36,900 ha
Type of ore Oilfi eld lithium, potash brine
NI 43-101/ JORC Yes
Average Lithium Grade 130 ppm Li
Average grade of other principal by-products
54,000 ppm Na, 5,100 ppm K, 2,010 Mg, 100 ppm Cl
Mg:Li Ratio N/A
Offtake agreements N/A
Target Production (year) N/A
Target Production (tonnage) N/A
Resource
Measured N/A
Indicated 1.48 Mt Li2CO
3 (Historical)
Inferred N/A
Ownership Option to aquire 100% interest
Chemical & Mining Co. of Chile Inc. (NYSE:SQM)Chemical and Mining Company of Chile Inc. engages in the production and sale of various fertilizers worldwide. The company provides various specialty plant nutrition products, including sodium nitrate, potassium nitrate, potassium sulfate, and sodium potassium nitrate, which are used on tobacco, coffee, vegetables, sugar cane, and other high-value crops. The company markets its specialty plant nutrition products under the various brands names comprising Ultrasol for application via fertirrigation; Qrop for soil application; Speedfol for foliar application; and Allganic, the family of products designed for organic crops. It also offers iodine for use in various medical, agricultural, and industrial applications, such as X-Ray contrast media, biocides, antiseptics and disinfectants, pharmaceutical, polarizing fi lms for liquid crystal displays, chemicals, and herbicides; and iodine derivatives for use in various medical and industrial applications, as well as in human and animal nutrition products. In addition, the company provides lithium carbonate for use in various applications, including batteries, frits for the ceramic and enamel industries, heat resistant glass, primary aluminum, air conditioning chemicals, continuous casting powder for steel extrusion, pharmaceuticals, and lithium derivatives; lithium hydroxide as a raw material in the lubricating grease, dyes, and battery industries; and lithium metal for use as a catalyst in the pharmaceutical and chemical industries, as well as for the production of aluminum-lithium alloys and lithium primary batteries. Further, it offers various industrial chemicals comprising sodium nitrate, potassium nitrate, boric acid, and potassium chloride, as well as salts for thermo-solar applications. The company was founded in 1968 and is headquartered in Santiago, Chile.
Date 26-Mar-10 Avg. 100 Day Vol. 0.86
Ticker NYSE:SQM Shares O/S 263.20
Stock Price 36.89 Float O/S 169.72
52-Week High 43.93 Cash 545.44
52-Week Low 26.00 Debt 1,035.22
Market Cap. 9,709.32 Enterprise Value 10,309.65
58
LITH
IUM
Sn
ap
sho
ts
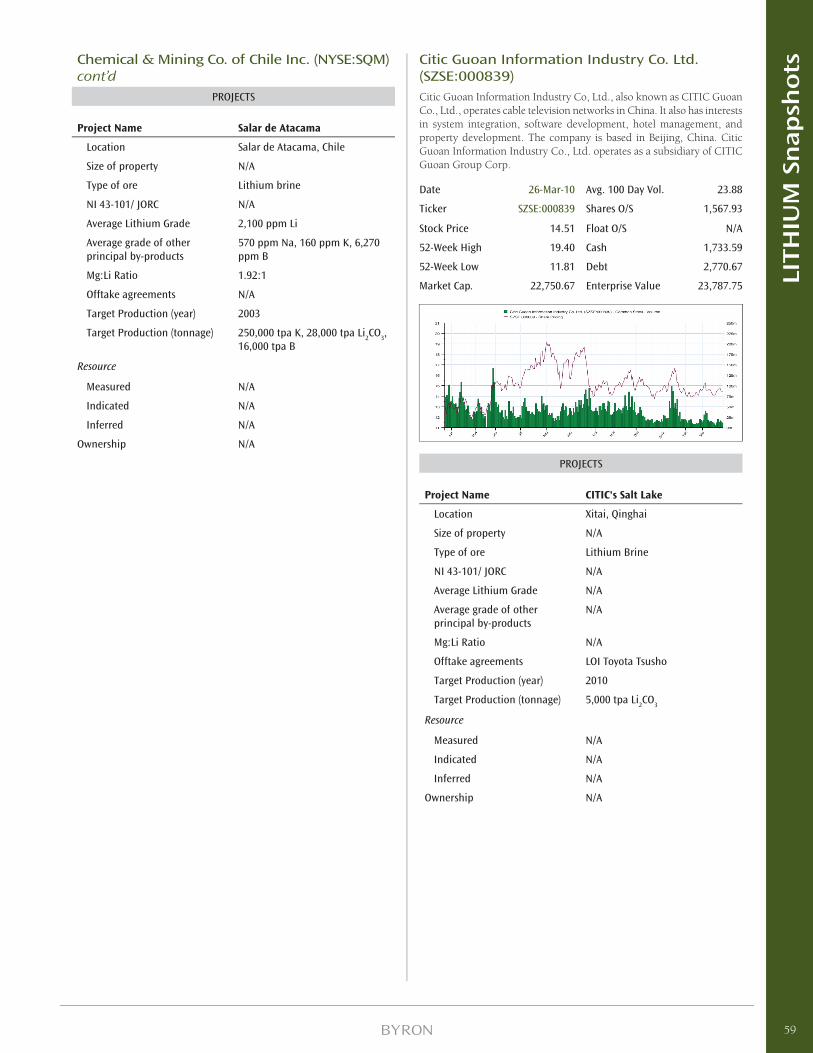
Chemical & Mining Co. of Chile Inc. (NYSE:SQM) cont’d
PROJECTS
Project Name Salar de Atacama
Location Salar de Atacama, Chile
Size of property N/A
Type of ore Lithium brine
NI 43-101/ JORC N/A
Average Lithium Grade 2,100 ppm Li
Average grade of other principal by-products
570 ppm Na, 160 ppm K, 6,270 ppm B
Mg:Li Ratio 1.92:1
Offtake agreements N/A
Target Production (year) 2003
Target Production (tonnage) 250,000 tpa K, 28,000 tpa Li2CO
3,
16,000 tpa B
Resource
Measured N/A
Indicated N/A
Inferred N/A
Ownership N/A
Citic Guoan Information Industry Co. Ltd. (SZSE:000839)Citic Guoan Information Industry Co, Ltd., also known as CITIC Guoan Co., Ltd., operates cable television networks in China. It also has interests in system integration, software development, hotel management, and property development. The company is based in Beijing, China. Citic Guoan Information Industry Co., Ltd. operates as a subsidiary of CITIC Guoan Group Corp.
Date 26-Mar-10 Avg. 100 Day Vol. 23.88
Ticker SZSE:000839 Shares O/S 1,567.93
Stock Price 14.51 Float O/S N/A
52-Week High 19.40 Cash 1,733.59
52-Week Low 11.81 Debt 2,770.67
Market Cap. 22,750.67 Enterprise Value 23,787.75
PROJECTS
Project Name CITIC's Salt Lake
Location Xitai, Qinghai
Size of property N/A
Type of ore Lithium Brine
NI 43-101/ JORC N/A
Average Lithium Grade N/A
Average grade of other principal by-products
N/A
Mg:Li Ratio N/A
Offtake agreements LOI Toyota Tsusho
Target Production (year) 2010
Target Production (tonnage) 5,000 tpa Li2CO
3
Resource
Measured N/A
Indicated N/A
Inferred N/A
Ownership N/A
59
LITH
IUM
Sn
ap
sho
ts
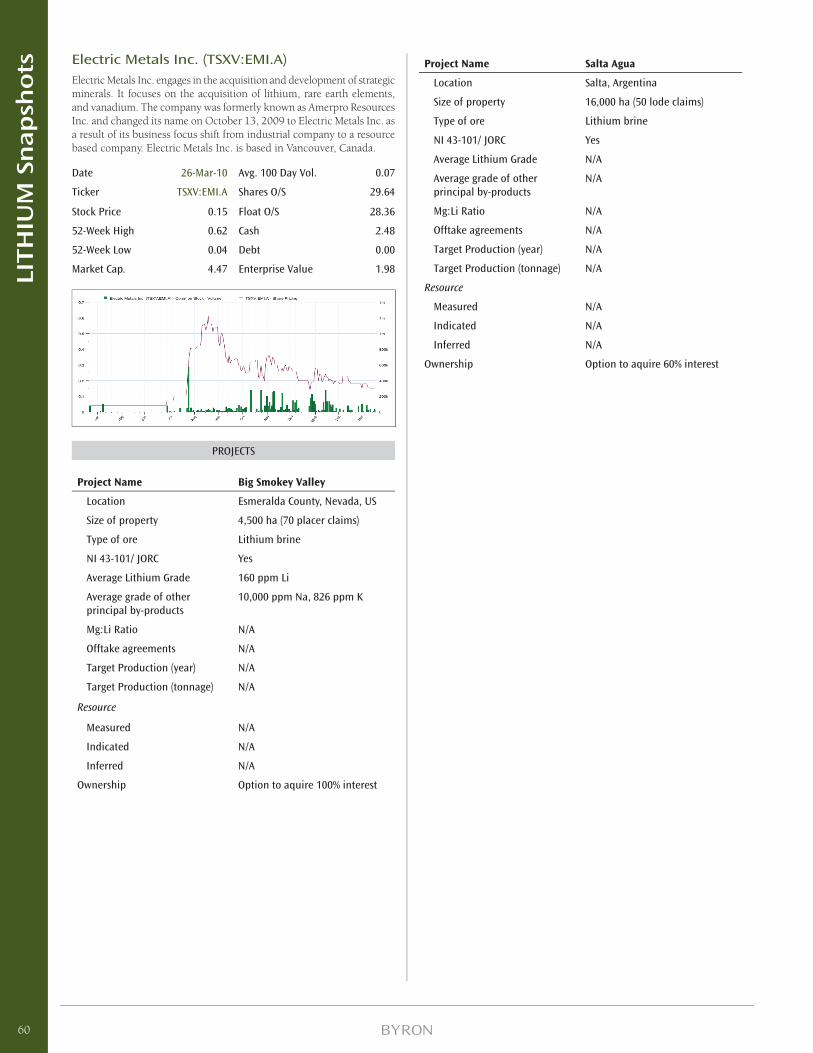
Electric Metals Inc. (TSXV:EMI.A)Electric Metals Inc. engages in the acquisition and development of strategic minerals. It focuses on the acquisition of lithium, rare earth elements, and vanadium. The company was formerly known as Amerpro Resources Inc. and changed its name on October 13, 2009 to Electric Metals Inc. as a result of its business focus shift from industrial company to a resource based company. Electric Metals Inc. is based in Vancouver, Canada.
Date 26-Mar-10 Avg. 100 Day Vol. 0.07
Ticker TSXV:EMI.A Shares O/S 29.64
Stock Price 0.15 Float O/S 28.36
52-Week High 0.62 Cash 2.48
52-Week Low 0.04 Debt 0.00
Market Cap. 4.47 Enterprise Value 1.98
PROJECTS
Project Name Big Smokey Valley
Location Esmeralda County, Nevada, US
Size of property 4,500 ha (70 placer claims)
Type of ore Lithium brine
NI 43-101/ JORC Yes
Average Lithium Grade 160 ppm Li
Average grade of other principal by-products
10,000 ppm Na, 826 ppm K
Mg:Li Ratio N/A
Offtake agreements N/A
Target Production (year) N/A
Target Production (tonnage) N/A
Resource
Measured N/A
Indicated N/A
Inferred N/A
Ownership Option to aquire 100% interest
Project Name Salta Agua
Location Salta, Argentina
Size of property 16,000 ha (50 lode claims)
Type of ore Lithium brine
NI 43-101/ JORC Yes
Average Lithium Grade N/A
Average grade of other principal by-products
N/A
Mg:Li Ratio N/A
Offtake agreements N/A
Target Production (year) N/A
Target Production (tonnage) N/A
Resource
Measured N/A
Indicated N/A
Inferred N/A
Ownership Option to aquire 60% interest
60
LITH
IUM
Sn
ap
sho
ts
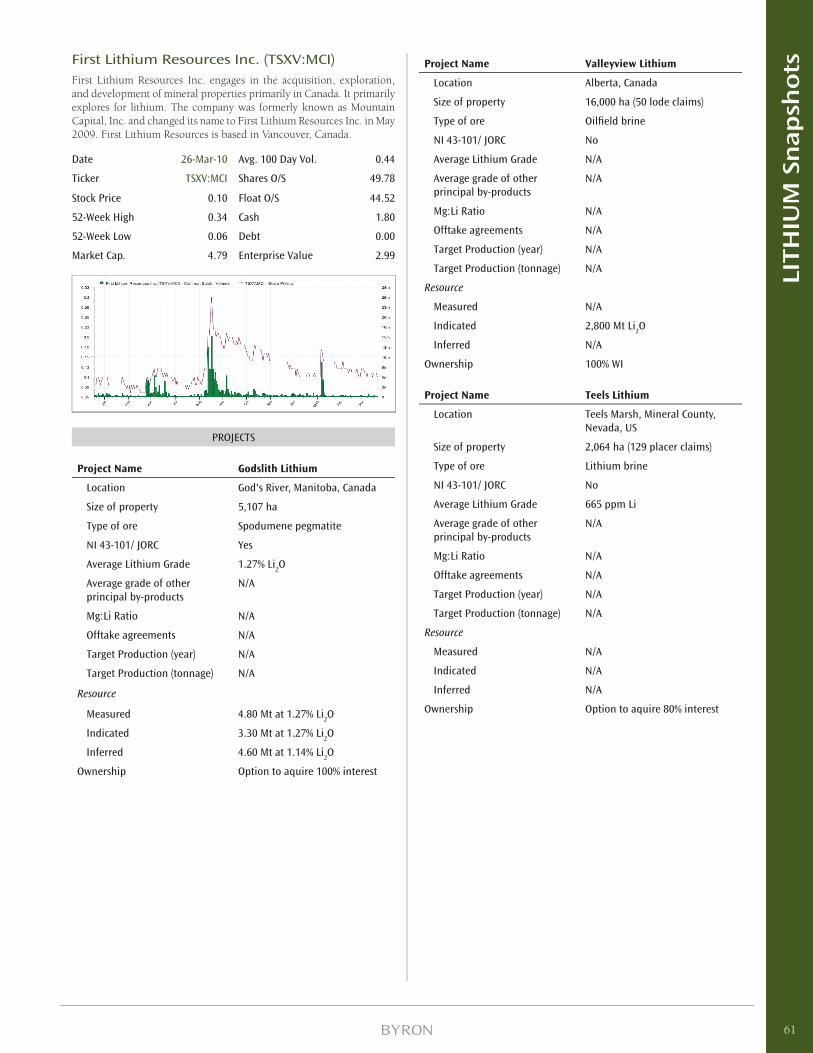
First Lithium Resources Inc. (TSXV:MCI)First Lithium Resources Inc. engages in the acquisition, exploration, and development of mineral properties primarily in Canada. It primarily explores for lithium. The company was formerly known as Mountain Capital, Inc. and changed its name to First Lithium Resources Inc. in May 2009. First Lithium Resources is based in Vancouver, Canada.
Date 26-Mar-10 Avg. 100 Day Vol. 0.44
Ticker TSXV:MCI Shares O/S 49.78
Stock Price 0.10 Float O/S 44.52
52-Week High 0.34 Cash 1.80
52-Week Low 0.06 Debt 0.00
Market Cap. 4.79 Enterprise Value 2.99
PROJECTS
Project Name Godslith Lithium
Location God's River, Manitoba, Canada
Size of property 5,107 ha
Type of ore Spodumene pegmatite
NI 43-101/ JORC Yes
Average Lithium Grade 1.27% Li2O
Average grade of other principal by-products
N/A
Mg:Li Ratio N/A
Offtake agreements N/A
Target Production (year) N/A
Target Production (tonnage) N/A
Resource
Measured 4.80 Mt at 1.27% Li2O
Indicated 3.30 Mt at 1.27% Li2O
Inferred 4.60 Mt at 1.14% Li2O
Ownership Option to aquire 100% interest
NI 43-101/ JORG
Target Production (tonnag Unknown
Resource
Mg:Li Ratio (if applicable) Not applicable
Offtake agreements (if anyNone
Target Production (year) Unknown
Yes
Average Lithium Grade
(ppm or %)1.27% Li2O
Average grade of other
principal by-productsN/A
Location God's River, Manitoba, Canada
Size of property 5,107 ha
Type of ore Spodumene pegmatite
[chart]
PROJECTS
Project Name Godslith Lithium
Project Name Valleyview Lithium
Location Alberta, Canada
Size of property 16,000 ha (50 lode claims)
Type of ore Oilfi eld brine
NI 43-101/ JORC No
Average Lithium Grade N/A
Average grade of other principal by-products
N/A
Mg:Li Ratio N/A
Offtake agreements N/A
Target Production (year) N/A
Target Production (tonnage) N/A
Resource
Measured N/A
Indicated 2,800 Mt Li2O
Inferred N/A
Ownership 100% WI
Project Name Teels Lithium
Location Teels Marsh, Mineral County, Nevada, US
Size of property 2,064 ha (129 placer claims)
Type of ore Lithium brine
NI 43-101/ JORC No
Average Lithium Grade 665 ppm Li
Average grade of other principal by-products
N/A
Mg:Li Ratio N/A
Offtake agreements N/A
Target Production (year) N/A
Target Production (tonnage) N/A
Resource
Measured N/A
Indicated N/A
Inferred N/A
Ownership Option to aquire 80% interest
61
LITH
IUM
Sn
ap
sho
ts

FMC Corp. (NYSE:FMC)FMC Corporation, a chemical company, provides solutions, applications, and products for agricultural, consumer, and industrial markets worldwide. It operates in three segments: Agricultural Products, Specialty Chemicals, and Industrial Chemicals. The Agricultural Products segment develops, markets, and sells a portfolio of crop protection, pest control, and lawn and garden products. It produces insecticides and herbicides to protect various crops, including cotton, sugarcane, rice, corn, soybeans, cereals, fruits, and vegetables from insects and weed growth. The company’s insecticides are also used in non-agricultural applications, including pest control for home, garden, and other specialty markets; and herbicides in turf and roadsides applications. The Specialty Chemicals segment produces microcrystalline cellulose that is used as drug dry tablet binder and disintegrant, and food ingredient; carrageenan, which is used as food ingredient for thickening and stabilizing; encapsulant for pharmaceutical and nutraceutical applications; alginates that are used as food ingredients, and for pharmaceutical excipient, wound care, orthopedic uses, and industrial uses; and lithium that is used in pharmaceuticals, polymers, batteries, greases and lubricants, air conditioning, and other industrial applications. The Industrial Chemicals segment produces soda ash for glass, chemicals, and detergents; peroxygens for pulp and paper, chemical processing, detergents, antimicrobial disinfectants, environmental applications, electronics, and polymers; and phosphorus chemicals for detergents, cleaning compounds, and animal feed. The company was founded in 1884 and is based in Philadelphia, Pennsylvania.
Date 26-Mar-10 Avg. 100 Day Vol. 0.73
Ticker NYSE:FMC Shares O/S 72.52
Stock Price 60.30 Float O/S 71.67
52-Week High 62.24 Cash 76.60
52-Week Low 40.69 Debt 588.00
Market Cap. 4,390.08 Enterprise Value 4,901.48
ate 26-Mar-10 Avg. 100 Day Vo 0.72
cker NYSE:FMC Shares O/S 72.52
ock Price 60.30 Float O/S 71.67
2-Week High 62.24 Cash 76.60
2-Week Low 40.48 Debt 588.00
arket Cap. 4,390.08 Enterprise Value 4,901.48
[chart]
PROJECTS
Project Name Fenix
Location Salar del Hombre Muerto, Salta, Argentina
Size of property 32,340 ha
Type of ore Lithium brine
NI 43-101/ JORC N/A
Average Lithium Grade 637 ppm Li
Average grade of other principal by-products
9.90% to 10.10% Na, 0.24 to 0.97% K, 15.80% to 16.80% Cl
Mg:Li Ratio 2:1
Offtake agreements N/A
Target Production (year) Current
Target Production (tonnage) 9,993 tpa Li2CO
3, 7,586 tpa LiCl
Resource
Measured N/A
Indicated N/A
Inferred 850,000 t Li
Ownership N/A
62
LITH
IUM
Sn
ap
sho
ts
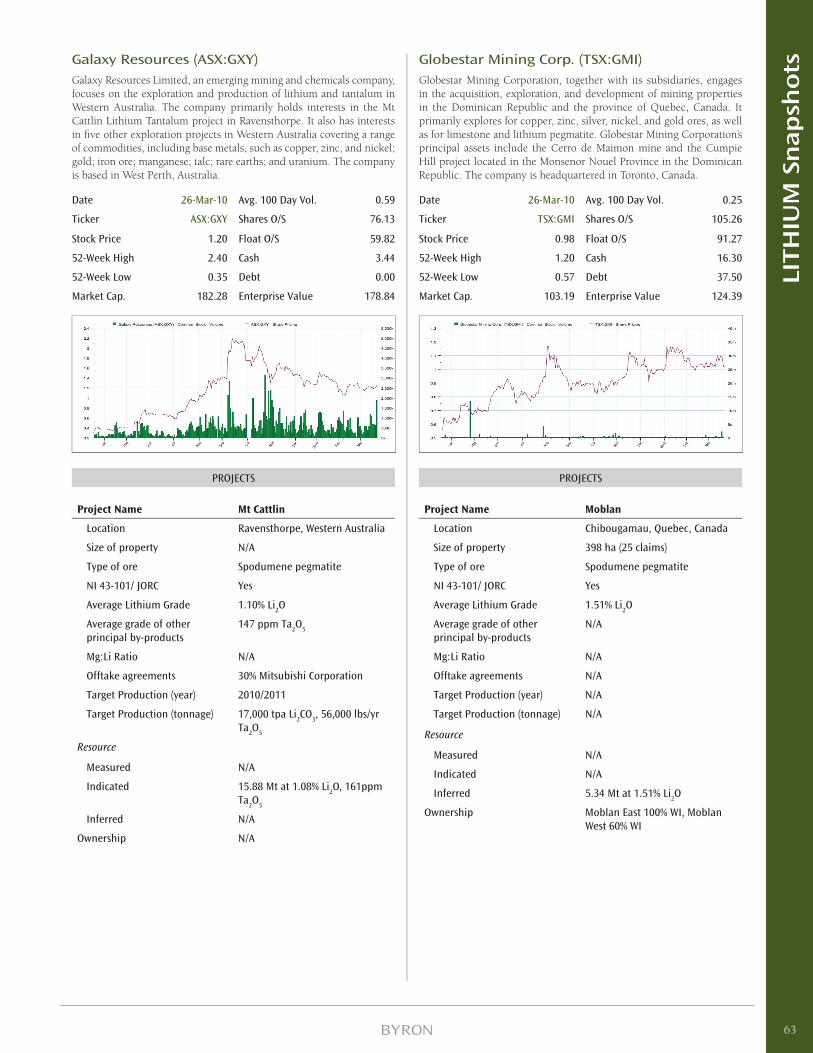
Galaxy Resources (ASX:GXY)Galaxy Resources Limited, an emerging mining and chemicals company, focuses on the exploration and production of lithium and tantalum in Western Australia. The company primarily holds interests in the Mt Cattlin Lithium Tantalum project in Ravensthorpe. It also has interests in fi ve other exploration projects in Western Australia covering a range of commodities, including base metals, such as copper, zinc, and nickel; gold; iron ore; manganese; talc; rare earths; and uranium. The company is based in West Perth, Australia.
Date 26-Mar-10 Avg. 100 Day Vol. 0.59
Ticker ASX:GXY Shares O/S 76.13
Stock Price 1.20 Float O/S 59.82
52-Week High 2.40 Cash 3.44
52-Week Low 0.35 Debt 0.00
Market Cap. 182.28 Enterprise Value 178.84
PROJECTS
Project Name Mt Cattlin
Location Ravensthorpe, Western Australia
Size of property N/A
Type of ore Spodumene pegmatite
NI 43-101/ JORC Yes
Average Lithium Grade 1.10% Li2O
Average grade of other principal by-products
147 ppm Ta2O
5
Mg:Li Ratio N/A
Offtake agreements 30% Mitsubishi Corporation
Target Production (year) 2010/2011
Target Production (tonnage) 17,000 tpa Li2CO
3, 56,000 lbs/yr
Ta2O
5
Resource
Measured N/A
Indicated 15.88 Mt at 1.08% Li2O, 161ppm
Ta2O
5
Inferred N/A
Ownership N/A
Globestar Mining Corp. (TSX:GMI)Globestar Mining Corporation, together with its subsidiaries, engages in the acquisition, exploration, and development of mining properties in the Dominican Republic and the province of Quebec, Canada. It primarily explores for copper, zinc, silver, nickel, and gold ores, as well as for limestone and lithium pegmatite. Globestar Mining Corporation’s principal assets include the Cerro de Maimon mine and the Cumpie Hill project located in the Monsenor Nouel Province in the Dominican Republic. The company is headquartered in Toronto, Canada.
Date 26-Mar-10 Avg. 100 Day Vol. 0.25
Ticker TSX:GMI Shares O/S 105.26
Stock Price 0.98 Float O/S 91.27
52-Week High 1.20 Cash 16.30
52-Week Low 0.57 Debt 37.50
Market Cap. 103.19 Enterprise Value 124.39
PROJECTS
Project Name Moblan
Location Chibougamau, Quebec, Canada
Size of property 398 ha (25 claims)
Type of ore Spodumene pegmatite
NI 43-101/ JORC Yes
Average Lithium Grade 1.51% Li2O
Average grade of other principal by-products
N/A
Mg:Li Ratio N/A
Offtake agreements N/A
Target Production (year) N/A
Target Production (tonnage) N/A
Resource
Measured N/A
Indicated N/A
Inferred 5.34 Mt at 1.51% Li2O
Ownership Moblan East 100% WI, Moblan West 60% WI
63
LITH
IUM
Sn
ap
sho
ts
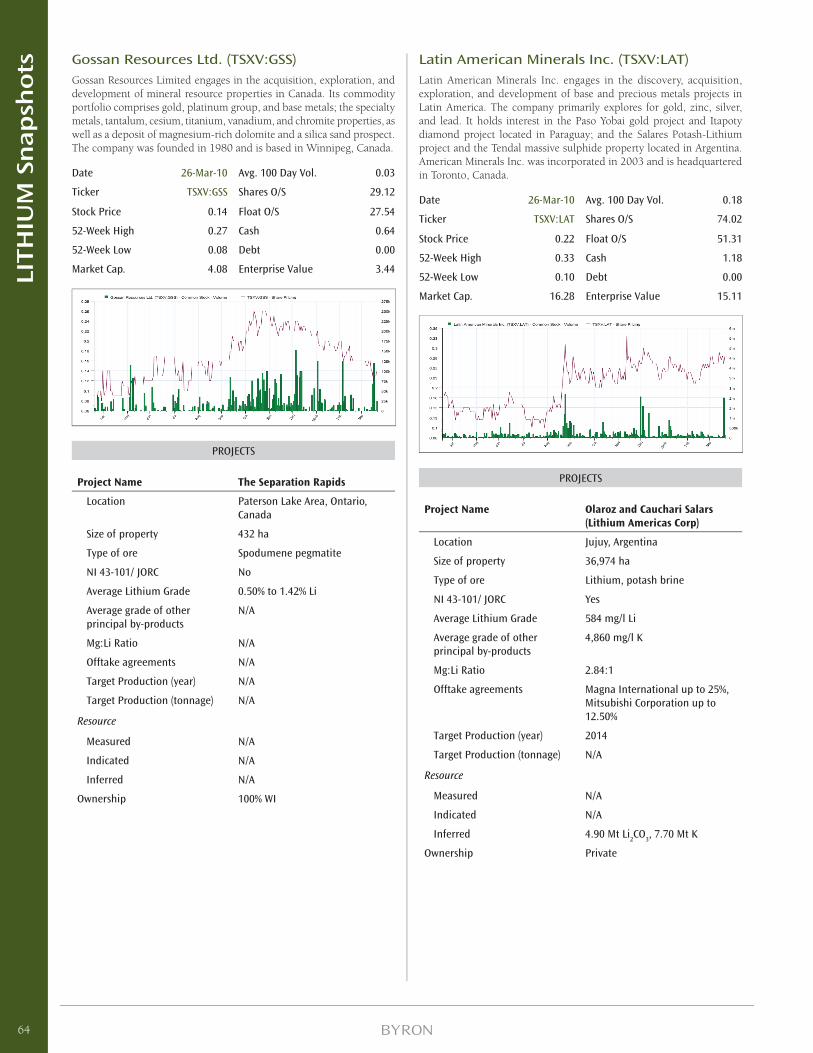
Gossan Resources Ltd. (TSXV:GSS)Gossan Resources Limited engages in the acquisition, exploration, and development of mineral resource properties in Canada. Its commodity portfolio comprises gold, platinum group, and base metals; the specialty metals, tantalum, cesium, titanium, vanadium, and chromite properties, as well as a deposit of magnesium-rich dolomite and a silica sand prospect. The company was founded in 1980 and is based in Winnipeg, Canada.
Date 26-Mar-10 Avg. 100 Day Vol. 0.03
Ticker TSXV:GSS Shares O/S 29.12
Stock Price 0.14 Float O/S 27.54
52-Week High 0.27 Cash 0.64
52-Week Low 0.08 Debt 0.00
Market Cap. 4.08 Enterprise Value 3.44
PROJECTS
Project Name The Separation Rapids
Location Paterson Lake Area, Ontario, Canada
Size of property 432 ha
Type of ore Spodumene pegmatite
NI 43-101/ JORC No
Average Lithium Grade 0.50% to 1.42% Li
Average grade of other principal by-products
N/A
Mg:Li Ratio N/A
Offtake agreements N/A
Target Production (year) N/A
Target Production (tonnage) N/A
Resource
Measured N/A
Indicated N/A
Inferred N/A
Ownership 100% WI
Latin American Minerals Inc. (TSXV:LAT)Latin American Minerals Inc. engages in the discovery, acquisition, exploration, and development of base and precious metals projects in Latin America. The company primarily explores for gold, zinc, silver, and lead. It holds interest in the Paso Yobai gold project and Itapoty diamond project located in Paraguay; and the Salares Potash-Lithium project and the Tendal massive sulphide property located in Argentina. American Minerals Inc. was incorporated in 2003 and is headquartered in Toronto, Canada.
Date 26-Mar-10 Avg. 100 Day Vol. 0.18
Ticker TSXV:LAT Shares O/S 74.02
Stock Price 0.22 Float O/S 51.31
52-Week High 0.33 Cash 1.18
52-Week Low 0.10 Debt 0.00
Market Cap. 16.28 Enterprise Value 15.11
PROJECTS
Project Name Olaroz and Cauchari Salars (Lithium Americas Corp)
Location Jujuy, Argentina
Size of property 36,974 ha
Type of ore Lithium, potash brine
NI 43-101/ JORC Yes
Average Lithium Grade 584 mg/l Li
Average grade of other principal by-products
4,860 mg/l K
Mg:Li Ratio 2.84:1
Offtake agreements Magna International up to 25%, Mitsubishi Corporation up to 12.50%
Target Production (year) 2014
Target Production (tonnage) N/A
Resource
Measured N/A
Indicated N/A
Inferred 4.90 Mt Li2CO
3, 7.70 Mt K
Ownership Private
64
LITH
IUM
Sn
ap
sho
ts
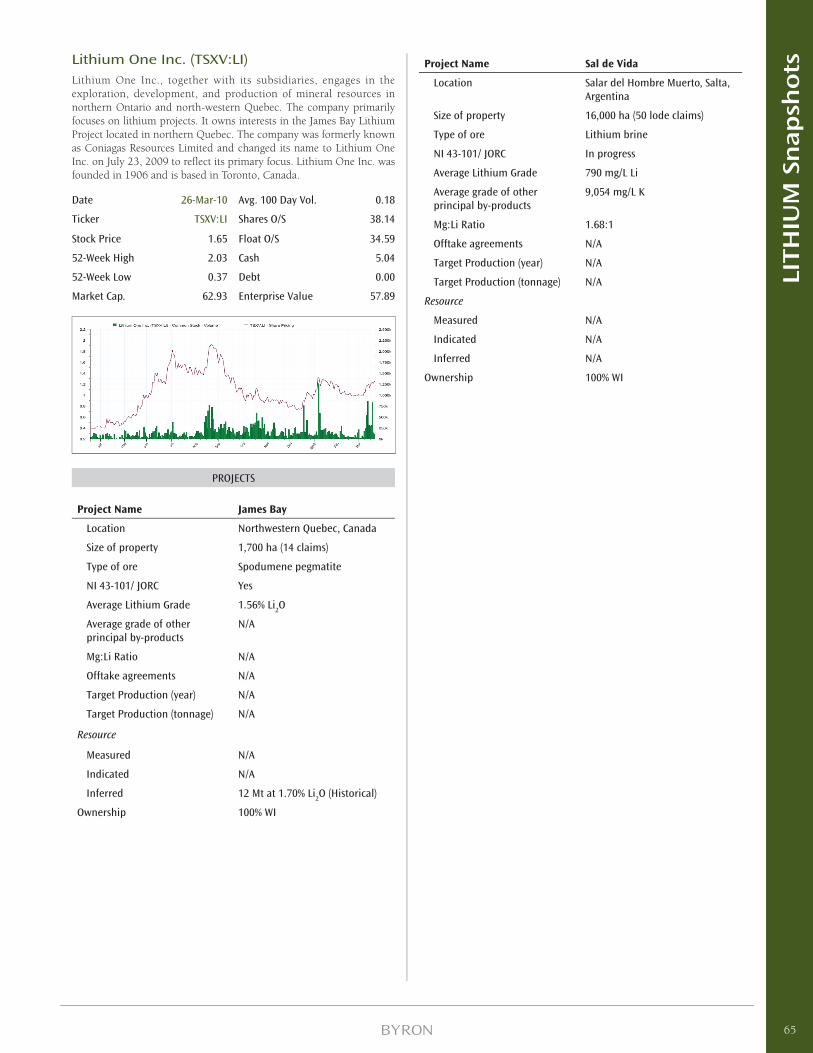
Lithium One Inc. (TSXV:LI)Lithium One Inc., together with its subsidiaries, engages in the exploration, development, and production of mineral resources in northern Ontario and north-western Quebec. The company primarily focuses on lithium projects. It owns interests in the James Bay Lithium Project located in northern Quebec. The company was formerly known as Coniagas Resources Limited and changed its name to Lithium One Inc. on July 23, 2009 to refl ect its primary focus. Lithium One Inc. was founded in 1906 and is based in Toronto, Canada.
Date 26-Mar-10 Avg. 100 Day Vol. 0.18
Ticker TSXV:LI Shares O/S 38.14
Stock Price 1.65 Float O/S 34.59
52-Week High 2.03 Cash 5.04
52-Week Low 0.37 Debt 0.00
Market Cap. 62.93 Enterprise Value 57.89
PROJECTS
Project Name James Bay
Location Northwestern Quebec, Canada
Size of property 1,700 ha (14 claims)
Type of ore Spodumene pegmatite
NI 43-101/ JORC Yes
Average Lithium Grade 1.56% Li2O
Average grade of other principal by-products
N/A
Mg:Li Ratio N/A
Offtake agreements N/A
Target Production (year) N/A
Target Production (tonnage) N/A
Resource
Measured N/A
Indicated N/A
Inferred 12 Mt at 1.70% Li2O (Historical)
Ownership 100% WI
Project Name Sal de Vida
Location Salar del Hombre Muerto, Salta, Argentina
Size of property 16,000 ha (50 lode claims)
Type of ore Lithium brine
NI 43-101/ JORC In progress
Average Lithium Grade 790 mg/L Li
Average grade of other principal by-products
9,054 mg/L K
Mg:Li Ratio 1.68:1
Offtake agreements N/A
Target Production (year) N/A
Target Production (tonnage) N/A
Resource
Measured N/A
Indicated N/A
Inferred N/A
Ownership 100% WI
65
LITH
IUM
Sn
ap
sho
ts
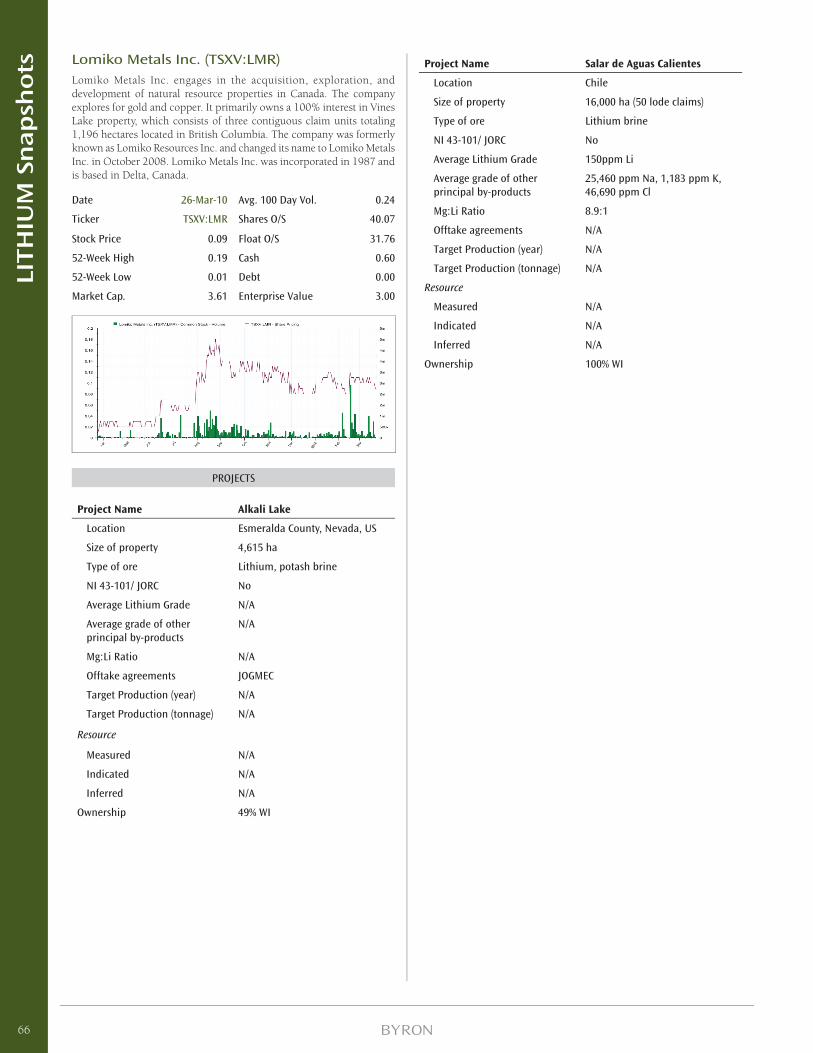
Lomiko Metals Inc. (TSXV:LMR)Lomiko Metals Inc. engages in the acquisition, exploration, and development of natural resource properties in Canada. The company explores for gold and copper. It primarily owns a 100% interest in Vines Lake property, which consists of three contiguous claim units totaling 1,196 hectares located in British Columbia. The company was formerly known as Lomiko Resources Inc. and changed its name to Lomiko Metals Inc. in October 2008. Lomiko Metals Inc. was incorporated in 1987 and is based in Delta, Canada.
Date 26-Mar-10 Avg. 100 Day Vol. 0.24
Ticker TSXV:LMR Shares O/S 40.07
Stock Price 0.09 Float O/S 31.76
52-Week High 0.19 Cash 0.60
52-Week Low 0.01 Debt 0.00
Market Cap. 3.61 Enterprise Value 3.00
PROJECTS
Project Name Alkali Lake
Location Esmeralda County, Nevada, US
Size of property 4,615 ha
Type of ore Lithium, potash brine
NI 43-101/ JORC No
Average Lithium Grade N/A
Average grade of other principal by-products
N/A
Mg:Li Ratio N/A
Offtake agreements JOGMEC
Target Production (year) N/A
Target Production (tonnage) N/A
Resource
Measured N/A
Indicated N/A
Inferred N/A
Ownership 49% WI
Project Name Salar de Aguas Calientes
Location Chile
Size of property 16,000 ha (50 lode claims)
Type of ore Lithium brine
NI 43-101/ JORC No
Average Lithium Grade 150ppm Li
Average grade of other principal by-products
25,460 ppm Na, 1,183 ppm K, 46,690 ppm Cl
Mg:Li Ratio 8.9:1
Offtake agreements N/A
Target Production (year) N/A
Target Production (tonnage) N/A
Resource
Measured N/A
Indicated N/A
Inferred N/A
Ownership 100% WI
66
LITH
IUM
Sn
ap
sho
ts
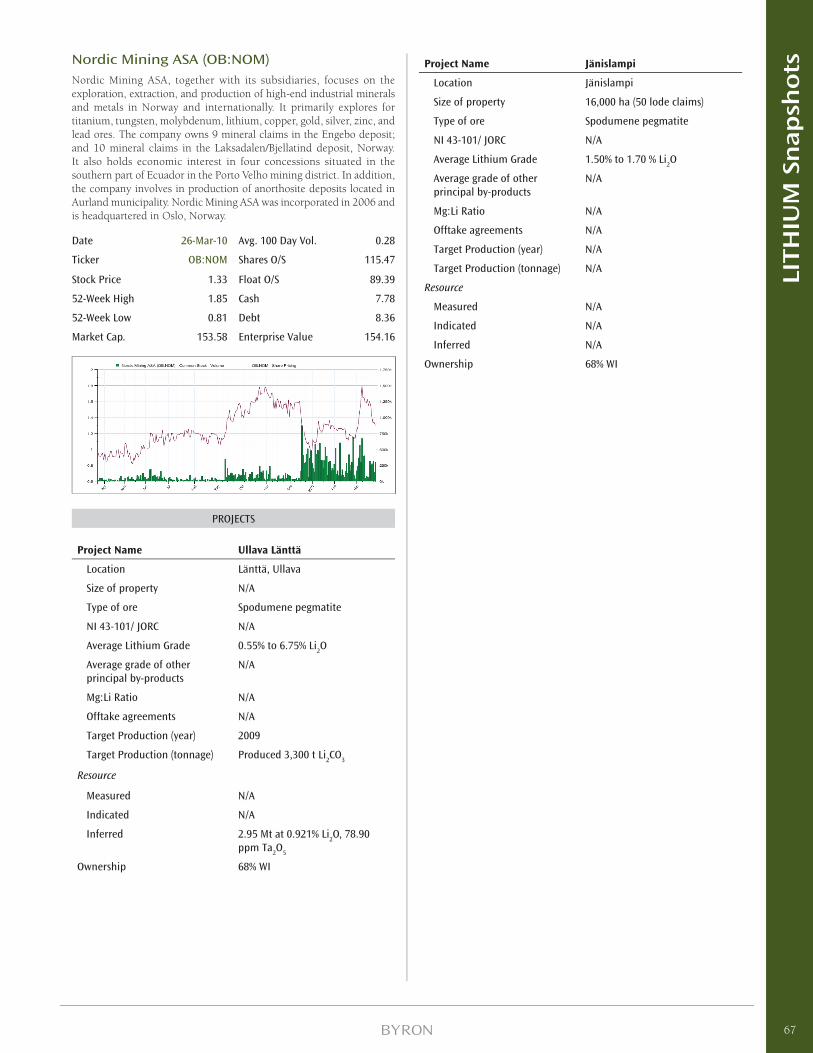
Nordic Mining ASA (OB:NOM)Nordic Mining ASA, together with its subsidiaries, focuses on the exploration, extraction, and production of high-end industrial minerals and metals in Norway and internationally. It primarily explores for titanium, tungsten, molybdenum, lithium, copper, gold, silver, zinc, and lead ores. The company owns 9 mineral claims in the Engebo deposit; and 10 mineral claims in the Laksadalen/Bjellatind deposit, Norway. It also holds economic interest in four concessions situated in the southern part of Ecuador in the Porto Velho mining district. In addition, the company involves in production of anorthosite deposits located in Aurland municipality. Nordic Mining ASA was incorporated in 2006 and is headquartered in Oslo, Norway.
Date 26-Mar-10 Avg. 100 Day Vol. 0.28
Ticker OB:NOM Shares O/S 115.47
Stock Price 1.33 Float O/S 89.39
52-Week High 1.85 Cash 7.78
52-Week Low 0.81 Debt 8.36
Market Cap. 153.58 Enterprise Value 154.16
PROJECTS
Project Name Ullava Länttä
Location Länttä, Ullava
Size of property N/A
Type of ore Spodumene pegmatite
NI 43-101/ JORC N/A
Average Lithium Grade 0.55% to 6.75% Li2O
Average grade of other principal by-products
N/A
Mg:Li Ratio N/A
Offtake agreements N/A
Target Production (year) 2009
Target Production (tonnage) Produced 3,300 t Li2CO
3
Resource
Measured N/A
Indicated N/A
Inferred 2.95 Mt at 0.921% Li2O, 78.90
ppm Ta2O
5
Ownership 68% WI
Project Name Jänislampi
Location Jänislampi
Size of property 16,000 ha (50 lode claims)
Type of ore Spodumene pegmatite
NI 43-101/ JORC N/A
Average Lithium Grade 1.50% to 1.70 % Li2O
Average grade of other principal by-products
N/A
Mg:Li Ratio N/A
Offtake agreements N/A
Target Production (year) N/A
Target Production (tonnage) N/A
Resource
Measured N/A
Indicated N/A
Inferred N/A
Ownership 68% WI
67
LITH
IUM
Sn
ap
sho
ts
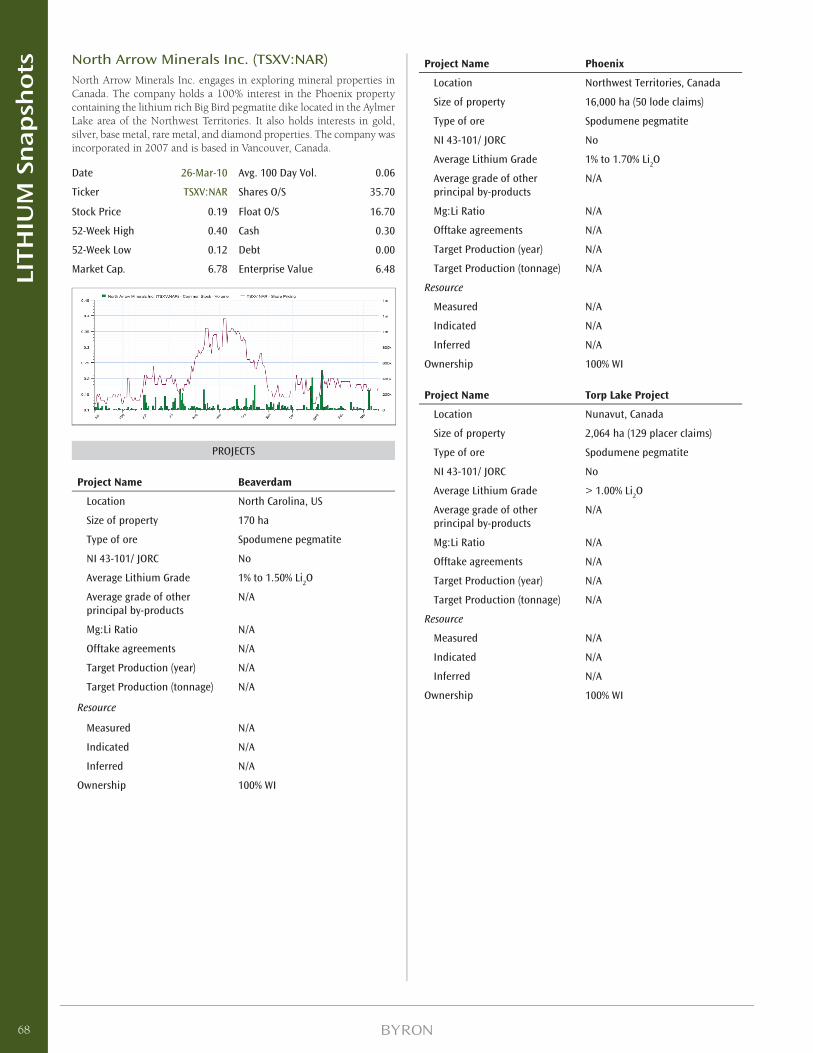
North Arrow Minerals Inc. (TSXV:NAR)North Arrow Minerals Inc. engages in exploring mineral properties in Canada. The company holds a 100% interest in the Phoenix property containing the lithium rich Big Bird pegmatite dike located in the Aylmer Lake area of the Northwest Territories. It also holds interests in gold, silver, base metal, rare metal, and diamond properties. The company was incorporated in 2007 and is based in Vancouver, Canada.
Date 26-Mar-10 Avg. 100 Day Vol. 0.06
Ticker TSXV:NAR Shares O/S 35.70
Stock Price 0.19 Float O/S 16.70
52-Week High 0.40 Cash 0.30
52-Week Low 0.12 Debt 0.00
Market Cap. 6.78 Enterprise Value 6.48
PROJECTS
Project Name Beaverdam
Location North Carolina, US
Size of property 170 ha
Type of ore Spodumene pegmatite
NI 43-101/ JORC No
Average Lithium Grade 1% to 1.50% Li2O
Average grade of other principal by-products
N/A
Mg:Li Ratio N/A
Offtake agreements N/A
Target Production (year) N/A
Target Production (tonnage) N/A
Resource
Measured N/A
Indicated N/A
Inferred N/A
Ownership 100% WI
Project Name Phoenix
Location Northwest Territories, Canada
Size of property 16,000 ha (50 lode claims)
Type of ore Spodumene pegmatite
NI 43-101/ JORC No
Average Lithium Grade 1% to 1.70% Li2O
Average grade of other principal by-products
N/A
Mg:Li Ratio N/A
Offtake agreements N/A
Target Production (year) N/A
Target Production (tonnage) N/A
Resource
Measured N/A
Indicated N/A
Inferred N/A
Ownership 100% WI
Project Name Torp Lake Project
Location Nunavut, Canada
Size of property 2,064 ha (129 placer claims)
Type of ore Spodumene pegmatite
NI 43-101/ JORC No
Average Lithium Grade > 1.00% Li2O
Average grade of other principal by-products
N/A
Mg:Li Ratio N/A
Offtake agreements N/A
Target Production (year) N/A
Target Production (tonnage) N/A
Resource
Measured N/A
Indicated N/A
Inferred N/A
Ownership 100% WI
68
LITH
IUM
Sn
ap
sho
ts
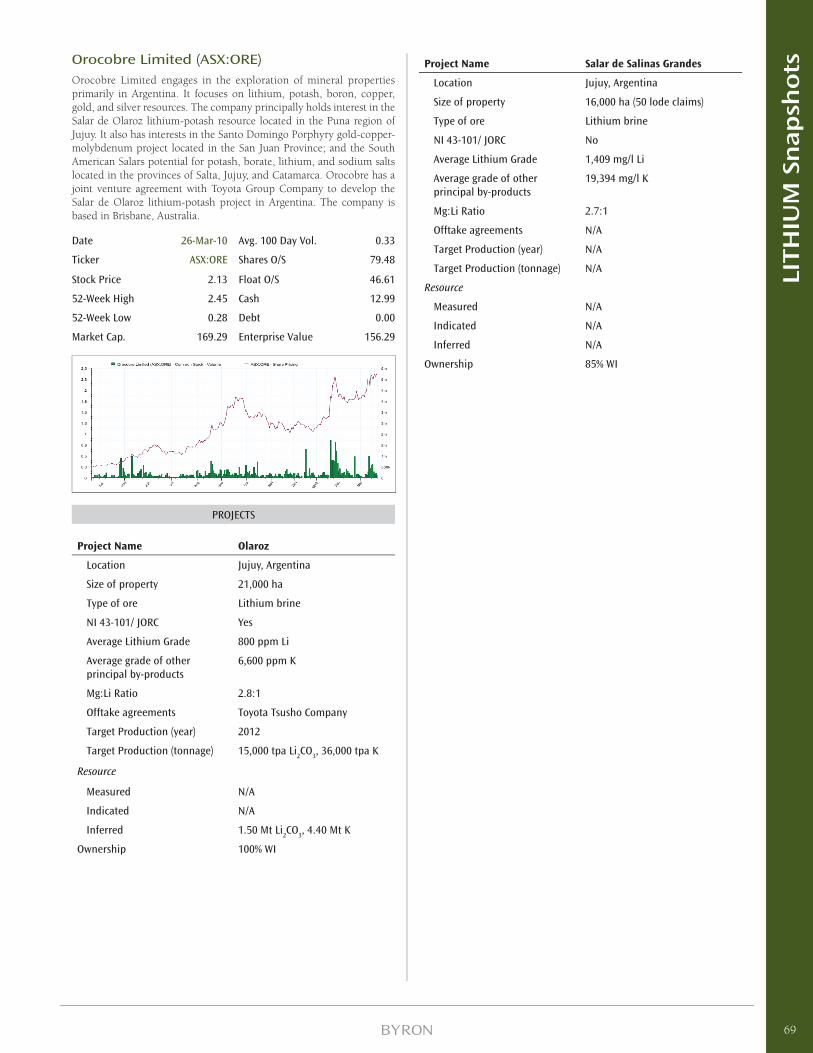
Orocobre Limited (ASX:ORE)Orocobre Limited engages in the exploration of mineral properties primarily in Argentina. It focuses on lithium, potash, boron, copper, gold, and silver resources. The company principally holds interest in the Salar de Olaroz lithium-potash resource located in the Puna region of Jujuy. It also has interests in the Santo Domingo Porphyry gold-copper-molybdenum project located in the San Juan Province; and the South American Salars potential for potash, borate, lithium, and sodium salts located in the provinces of Salta, Jujuy, and Catamarca. Orocobre has a joint venture agreement with Toyota Group Company to develop the Salar de Olaroz lithium-potash project in Argentina. The company is based in Brisbane, Australia.
Date 26-Mar-10 Avg. 100 Day Vol. 0.33
Ticker ASX:ORE Shares O/S 79.48
Stock Price 2.13 Float O/S 46.61
52-Week High 2.45 Cash 12.99
52-Week Low 0.28 Debt 0.00
Market Cap. 169.29 Enterprise Value 156.29
PROJECTS
Project Name Olaroz
Location Jujuy, Argentina
Size of property 21,000 ha
Type of ore Lithium brine
NI 43-101/ JORC Yes
Average Lithium Grade 800 ppm Li
Average grade of other principal by-products
6,600 ppm K
Mg:Li Ratio 2.8:1
Offtake agreements Toyota Tsusho Company
Target Production (year) 2012
Target Production (tonnage) 15,000 tpa Li2CO
3, 36,000 tpa K
Resource
Measured N/A
Indicated N/A
Inferred 1.50 Mt Li2CO
3, 4.40 Mt K
Ownership 100% WI
Project Name Salar de Salinas Grandes
Location Jujuy, Argentina
Size of property 16,000 ha (50 lode claims)
Type of ore Lithium brine
NI 43-101/ JORC No
Average Lithium Grade 1,409 mg/l Li
Average grade of other principal by-products
19,394 mg/l K
Mg:Li Ratio 2.7:1
Offtake agreements N/A
Target Production (year) N/A
Target Production (tonnage) N/A
Resource
Measured N/A
Indicated N/A
Inferred N/A
Ownership 85% WI
69
LITH
IUM
Sn
ap
sho
ts
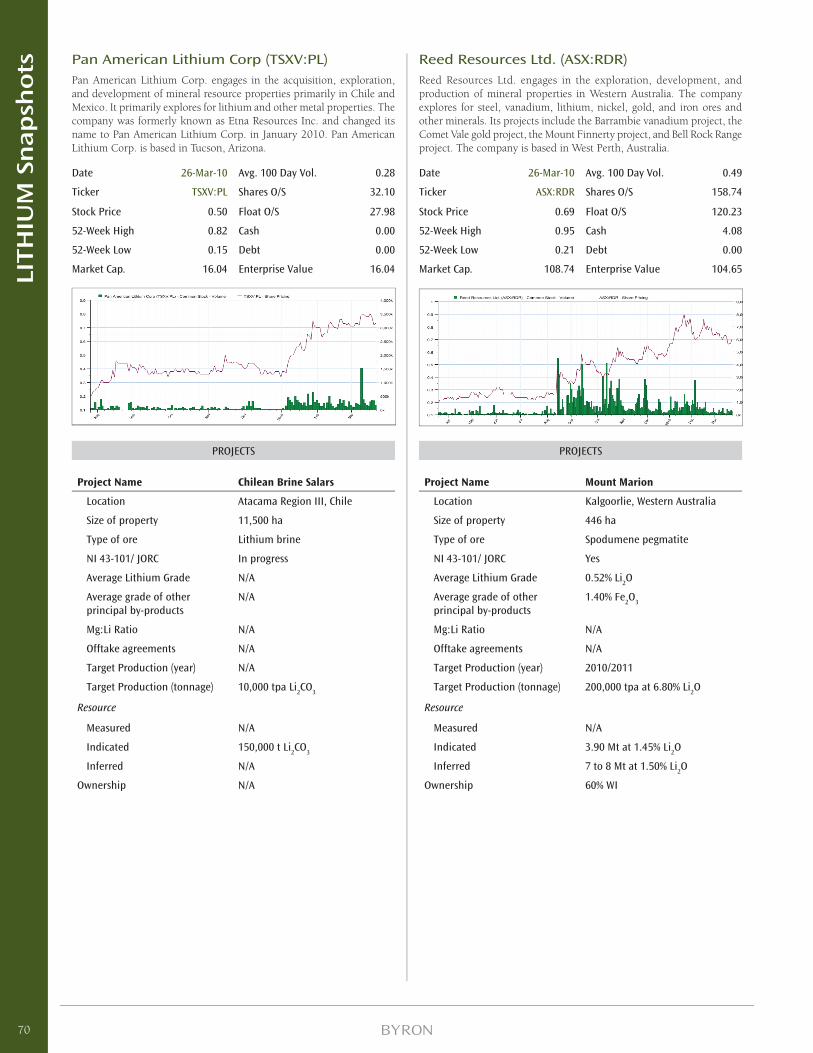
Pan American Lithium Corp (TSXV:PL)Pan American Lithium Corp. engages in the acquisition, exploration, and development of mineral resource properties primarily in Chile and Mexico. It primarily explores for lithium and other metal properties. The company was formerly known as Etna Resources Inc. and changed its name to Pan American Lithium Corp. in January 2010. Pan American Lithium Corp. is based in Tucson, Arizona.
Date 26-Mar-10 Avg. 100 Day Vol. 0.28
Ticker TSXV:PL Shares O/S 32.10
Stock Price 0.50 Float O/S 27.98
52-Week High 0.82 Cash 0.00
52-Week Low 0.15 Debt 0.00
Market Cap. 16.04 Enterprise Value 16.04
PROJECTS
Project Name Chilean Brine Salars
Location Atacama Region III, Chile
Size of property 11,500 ha
Type of ore Lithium brine
NI 43-101/ JORC In progress
Average Lithium Grade N/A
Average grade of other principal by-products
N/A
Mg:Li Ratio N/A
Offtake agreements N/A
Target Production (year) N/A
Target Production (tonnage) 10,000 tpa Li2CO
3
Resource
Measured N/A
Indicated 150,000 t Li2CO
3
Inferred N/A
Ownership N/A
Reed Resources Ltd. (ASX:RDR)Reed Resources Ltd. engages in the exploration, development, and production of mineral properties in Western Australia. The company explores for steel, vanadium, lithium, nickel, gold, and iron ores and other minerals. Its projects include the Barrambie vanadium project, the Comet Vale gold project, the Mount Finnerty project, and Bell Rock Range project. The company is based in West Perth, Australia.
Date 26-Mar-10 Avg. 100 Day Vol. 0.49
Ticker ASX:RDR Shares O/S 158.74
Stock Price 0.69 Float O/S 120.23
52-Week High 0.95 Cash 4.08
52-Week Low 0.21 Debt 0.00
Market Cap. 108.74 Enterprise Value 104.65
PROJECTS
Project Name Mount Marion
Location Kalgoorlie, Western Australia
Size of property 446 ha
Type of ore Spodumene pegmatite
NI 43-101/ JORC Yes
Average Lithium Grade 0.52% Li2O
Average grade of other principal by-products
1.40% Fe2O
3
Mg:Li Ratio N/A
Offtake agreements N/A
Target Production (year) 2010/2011
Target Production (tonnage) 200,000 tpa at 6.80% Li2O
Resource
Measured N/A
Indicated 3.90 Mt at 1.45% Li2O
Inferred 7 to 8 Mt at 1.50% Li2O
Ownership 60% WI
70
LITH
IUM
Sn
ap
sho
ts
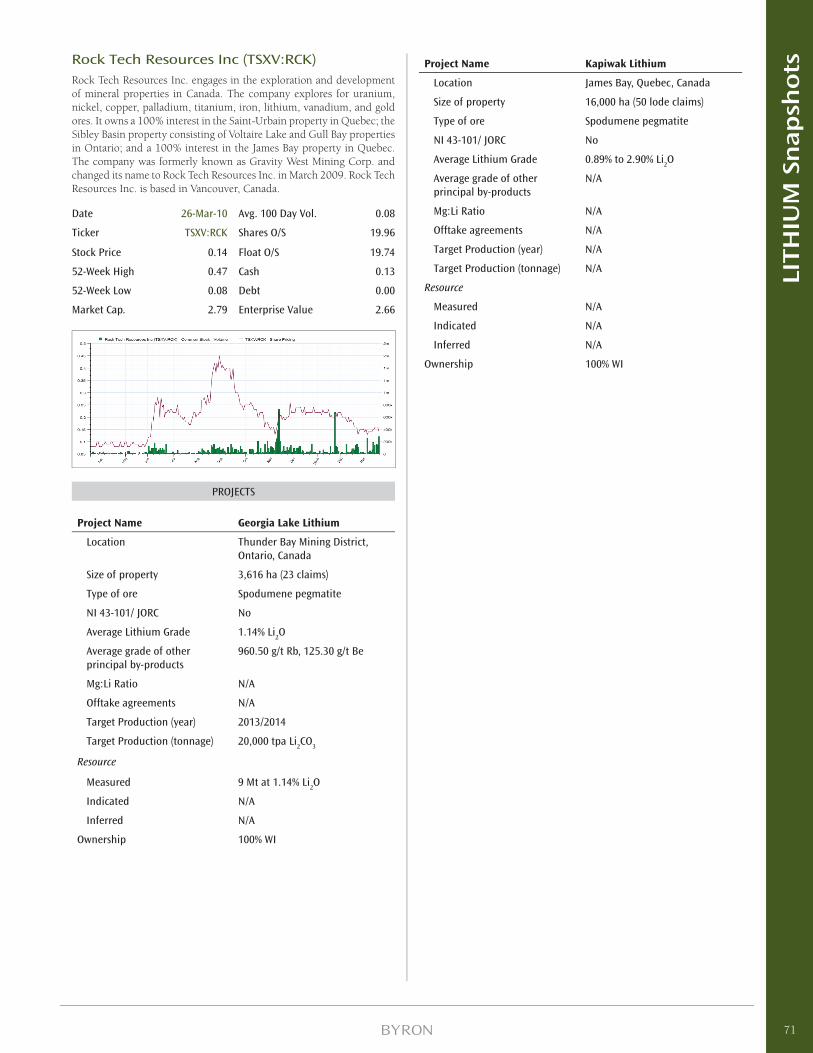
Rock Tech Resources Inc (TSXV:RCK)Rock Tech Resources Inc. engages in the exploration and development of mineral properties in Canada. The company explores for uranium, nickel, copper, palladium, titanium, iron, lithium, vanadium, and gold ores. It owns a 100% interest in the Saint-Urbain property in Quebec; the Sibley Basin property consisting of Voltaire Lake and Gull Bay properties in Ontario; and a 100% interest in the James Bay property in Quebec. The company was formerly known as Gravity West Mining Corp. and changed its name to Rock Tech Resources Inc. in March 2009. Rock Tech Resources Inc. is based in Vancouver, Canada.
Date 26-Mar-10 Avg. 100 Day Vol. 0.08
Ticker TSXV:RCK Shares O/S 19.96
Stock Price 0.14 Float O/S 19.74
52-Week High 0.47 Cash 0.13
52-Week Low 0.08 Debt 0.00
Market Cap. 2.79 Enterprise Value 2.66
PROJECTS
Project Name Georgia Lake Lithium
Location Thunder Bay Mining District, Ontario, Canada
Size of property 3,616 ha (23 claims)
Type of ore Spodumene pegmatite
NI 43-101/ JORC No
Average Lithium Grade 1.14% Li2O
Average grade of other principal by-products
960.50 g/t Rb, 125.30 g/t Be
Mg:Li Ratio N/A
Offtake agreements N/A
Target Production (year) 2013/2014
Target Production (tonnage) 20,000 tpa Li2CO
3
Resource
Measured 9 Mt at 1.14% Li2O
Indicated N/A
Inferred N/A
Ownership 100% WI
Project Name Kapiwak Lithium
Location James Bay, Quebec, Canada
Size of property 16,000 ha (50 lode claims)
Type of ore Spodumene pegmatite
NI 43-101/ JORC No
Average Lithium Grade 0.89% to 2.90% Li2O
Average grade of other principal by-products
N/A
Mg:Li Ratio N/A
Offtake agreements N/A
Target Production (year) N/A
Target Production (tonnage) N/A
Resource
Measured N/A
Indicated N/A
Inferred N/A
Ownership 100% WI
71
LITH
IUM
Sn
ap
sho
ts
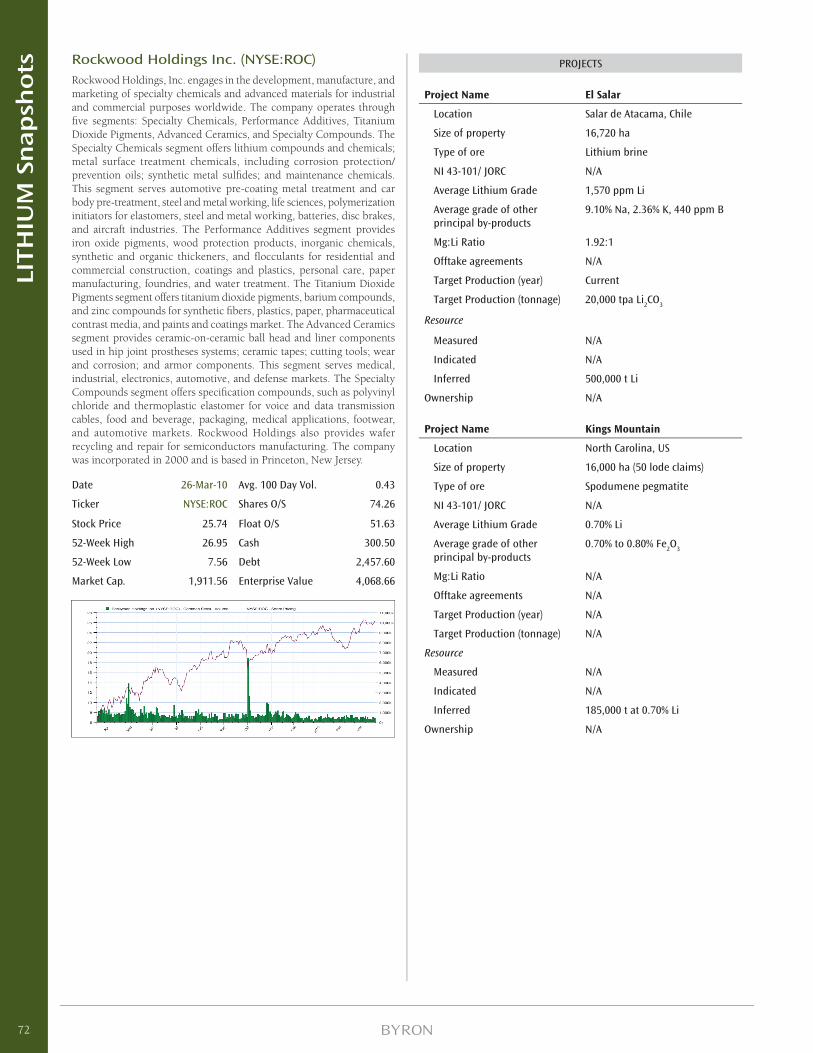
Rockwood Holdings Inc. (NYSE:ROC)Rockwood Holdings, Inc. engages in the development, manufacture, and marketing of specialty chemicals and advanced materials for industrial and commercial purposes worldwide. The company operates through fi ve segments: Specialty Chemicals, Performance Additives, Titanium Dioxide Pigments, Advanced Ceramics, and Specialty Compounds. The Specialty Chemicals segment offers lithium compounds and chemicals; metal surface treatment chemicals, including corrosion protection/prevention oils; synthetic metal sulfi des; and maintenance chemicals. This segment serves automotive pre-coating metal treatment and car body pre-treatment, steel and metal working, life sciences, polymerization initiators for elastomers, steel and metal working, batteries, disc brakes, and aircraft industries. The Performance Additives segment provides iron oxide pigments, wood protection products, inorganic chemicals, synthetic and organic thickeners, and fl occulants for residential and commercial construction, coatings and plastics, personal care, paper manufacturing, foundries, and water treatment. The Titanium Dioxide Pigments segment offers titanium dioxide pigments, barium compounds, and zinc compounds for synthetic fi bers, plastics, paper, pharmaceutical contrast media, and paints and coatings market. The Advanced Ceramics segment provides ceramic-on-ceramic ball head and liner components used in hip joint prostheses systems; ceramic tapes; cutting tools; wear and corrosion; and armor components. This segment serves medical, industrial, electronics, automotive, and defense markets. The Specialty Compounds segment offers specifi cation compounds, such as polyvinyl chloride and thermoplastic elastomer for voice and data transmission cables, food and beverage, packaging, medical applications, footwear, and automotive markets. Rockwood Holdings also provides wafer recycling and repair for semiconductors manufacturing. The company was incorporated in 2000 and is based in Princeton, New Jersey.
Date 26-Mar-10 Avg. 100 Day Vol. 0.43
Ticker NYSE:ROC Shares O/S 74.26
Stock Price 25.74 Float O/S 51.63
52-Week High 26.95 Cash 300.50
52-Week Low 7.56 Debt 2,457.60
Market Cap. 1,911.56 Enterprise Value 4,068.66
PROJECTS
Project Name El Salar
Location Salar de Atacama, Chile
Size of property 16,720 ha
Type of ore Lithium brine
NI 43-101/ JORC N/A
Average Lithium Grade 1,570 ppm Li
Average grade of other principal by-products
9.10% Na, 2.36% K, 440 ppm B
Mg:Li Ratio 1.92:1
Offtake agreements N/A
Target Production (year) Current
Target Production (tonnage) 20,000 tpa Li2CO
3
Resource
Measured N/A
Indicated N/A
Inferred 500,000 t Li
Ownership N/A
Project Name Kings Mountain
Location North Carolina, US
Size of property 16,000 ha (50 lode claims)
Type of ore Spodumene pegmatite
NI 43-101/ JORC N/A
Average Lithium Grade 0.70% Li
Average grade of other principal by-products
0.70% to 0.80% Fe2O
3
Mg:Li Ratio N/A
Offtake agreements N/A
Target Production (year) N/A
Target Production (tonnage) N/A
Resource
Measured N/A
Indicated N/A
Inferred 185,000 t at 0.70% Li
Ownership N/A
72
LITH
IUM
Sn
ap
sho
ts
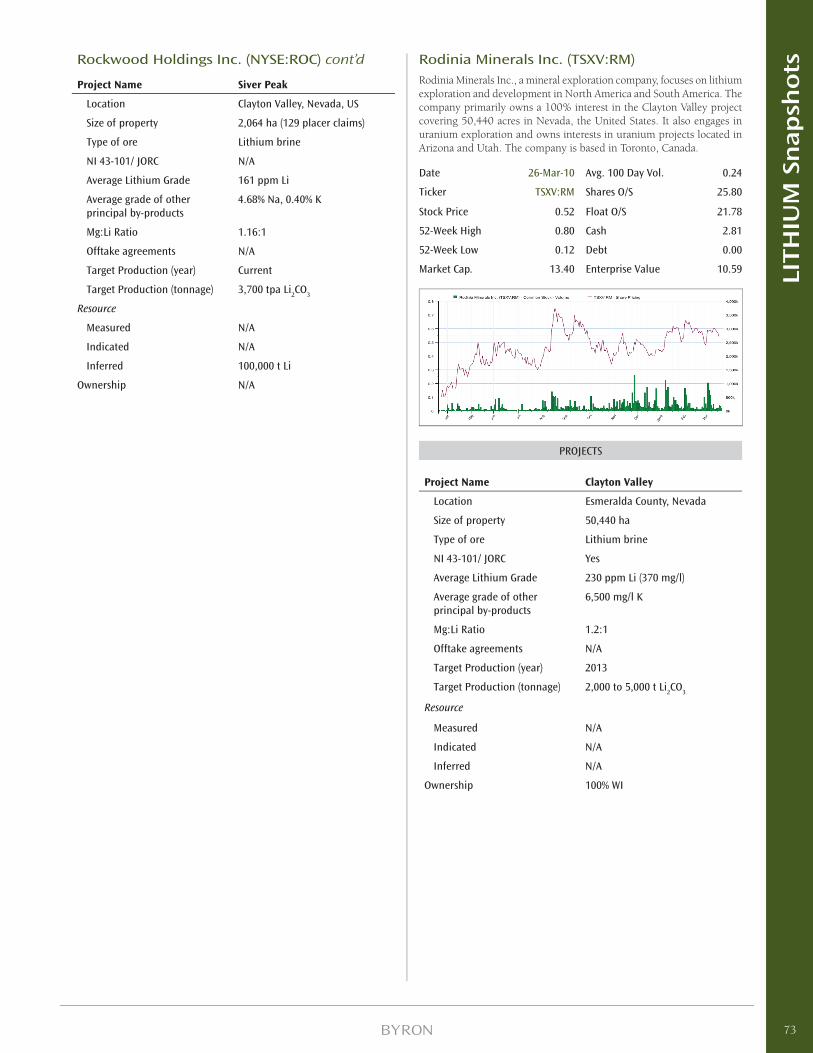
Rockwood Holdings Inc. (NYSE:ROC) cont’d
Project Name Siver Peak
Location Clayton Valley, Nevada, US
Size of property 2,064 ha (129 placer claims)
Type of ore Lithium brine
NI 43-101/ JORC N/A
Average Lithium Grade 161 ppm Li
Average grade of other principal by-products
4.68% Na, 0.40% K
Mg:Li Ratio 1.16:1
Offtake agreements N/A
Target Production (year) Current
Target Production (tonnage) 3,700 tpa Li2CO
3
Resource
Measured N/A
Indicated N/A
Inferred 100,000 t Li
Ownership N/A
Rodinia Minerals Inc. (TSXV:RM)Rodinia Minerals Inc., a mineral exploration company, focuses on lithium exploration and development in North America and South America. The company primarily owns a 100% interest in the Clayton Valley project covering 50,440 acres in Nevada, the United States. It also engages in uranium exploration and owns interests in uranium projects located in Arizona and Utah. The company is based in Toronto, Canada.
Date 26-Mar-10 Avg. 100 Day Vol. 0.24
Ticker TSXV:RM Shares O/S 25.80
Stock Price 0.52 Float O/S 21.78
52-Week High 0.80 Cash 2.81
52-Week Low 0.12 Debt 0.00
Market Cap. 13.40 Enterprise Value 10.59
PROJECTS
Project Name Clayton Valley
Location Esmeralda County, Nevada
Size of property 50,440 ha
Type of ore Lithium brine
NI 43-101/ JORC Yes
Average Lithium Grade 230 ppm Li (370 mg/l)
Average grade of other principal by-products
6,500 mg/l K
Mg:Li Ratio 1.2:1
Offtake agreements N/A
Target Production (year) 2013
Target Production (tonnage) 2,000 to 5,000 t Li2CO
3
Resource
Measured N/A
Indicated N/A
Inferred N/A
Ownership 100% WI
73
LITH
IUM
Sn
ap
sho
ts
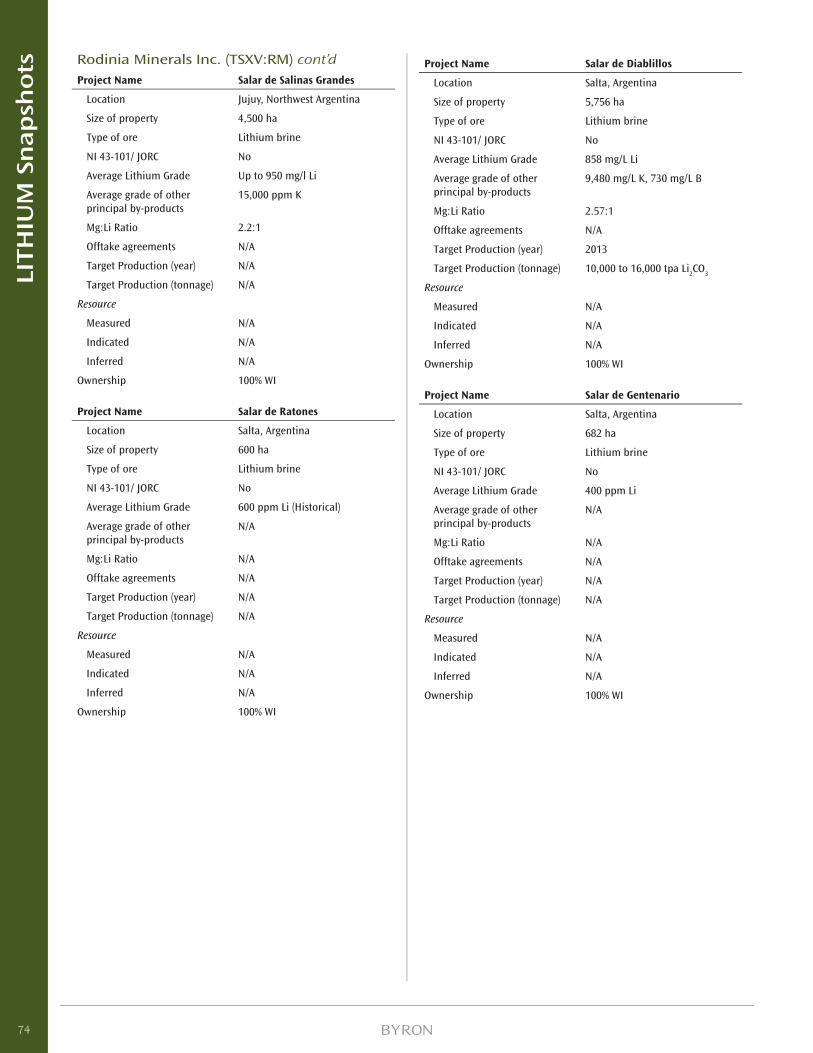
Rodinia Minerals Inc. (TSXV:RM) cont’dProject Name Salar de Salinas Grandes
Location Jujuy, Northwest Argentina
Size of property 4,500 ha
Type of ore Lithium brine
NI 43-101/ JORC No
Average Lithium Grade Up to 950 mg/l Li
Average grade of other principal by-products
15,000 ppm K
Mg:Li Ratio 2.2:1
Offtake agreements N/A
Target Production (year) N/A
Target Production (tonnage) N/A
Resource
Measured N/A
Indicated N/A
Inferred N/A
Ownership 100% WI
Project Name Salar de Ratones
Location Salta, Argentina
Size of property 600 ha
Type of ore Lithium brine
NI 43-101/ JORC No
Average Lithium Grade 600 ppm Li (Historical)
Average grade of other principal by-products
N/A
Mg:Li Ratio N/A
Offtake agreements N/A
Target Production (year) N/A
Target Production (tonnage) N/A
Resource
Measured N/A
Indicated N/A
Inferred N/A
Ownership 100% WI
Project Name Salar de Diablillos
Location Salta, Argentina
Size of property 5,756 ha
Type of ore Lithium brine
NI 43-101/ JORC No
Average Lithium Grade 858 mg/L Li
Average grade of other principal by-products
9,480 mg/L K, 730 mg/L B
Mg:Li Ratio 2.57:1
Offtake agreements N/A
Target Production (year) 2013
Target Production (tonnage) 10,000 to 16,000 tpa Li2CO
3
Resource
Measured N/A
Indicated N/A
Inferred N/A
Ownership 100% WI
Project Name Salar de Gentenario
Location Salta, Argentina
Size of property 682 ha
Type of ore Lithium brine
NI 43-101/ JORC No
Average Lithium Grade 400 ppm Li
Average grade of other principal by-products
N/A
Mg:Li Ratio N/A
Offtake agreements N/A
Target Production (year) N/A
Target Production (tonnage) N/A
Resource
Measured N/A
Indicated N/A
Inferred N/A
Ownership 100% WI
74
LITH
IUM
Sn
ap
sho
ts
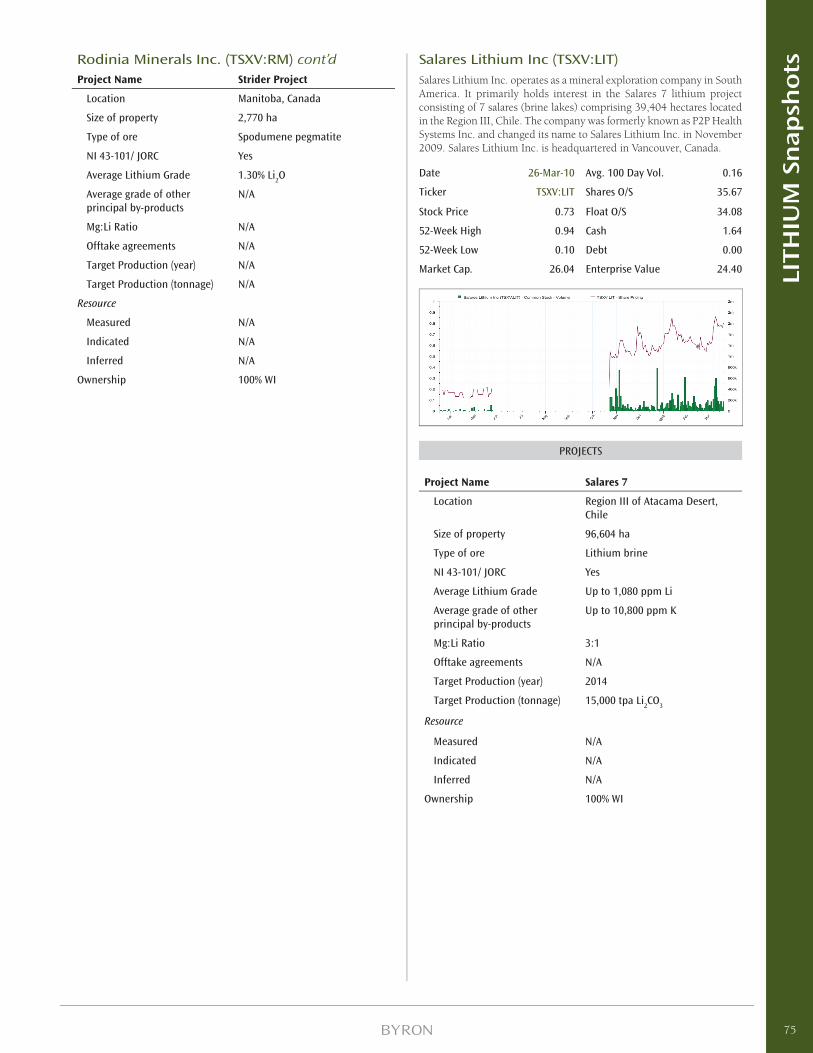
Rodinia Minerals Inc. (TSXV:RM) cont’dProject Name Strider Project
Location Manitoba, Canada
Size of property 2,770 ha
Type of ore Spodumene pegmatite
NI 43-101/ JORC Yes
Average Lithium Grade 1.30% Li2O
Average grade of other principal by-products
N/A
Mg:Li Ratio N/A
Offtake agreements N/A
Target Production (year) N/A
Target Production (tonnage) N/A
Resource
Measured N/A
Indicated N/A
Inferred N/A
Ownership 100% WI
Salares Lithium Inc (TSXV:LIT)Salares Lithium Inc. operates as a mineral exploration company in South America. It primarily holds interest in the Salares 7 lithium project consisting of 7 salares (brine lakes) comprising 39,404 hectares located in the Region III, Chile. The company was formerly known as P2P Health Systems Inc. and changed its name to Salares Lithium Inc. in November 2009. Salares Lithium Inc. is headquartered in Vancouver, Canada.
Date 26-Mar-10 Avg. 100 Day Vol. 0.16
Ticker TSXV:LIT Shares O/S 35.67
Stock Price 0.73 Float O/S 34.08
52-Week High 0.94 Cash 1.64
52-Week Low 0.10 Debt 0.00
Market Cap. 26.04 Enterprise Value 24.40
PROJECTS
Project Name Salares 7
Location Region III of Atacama Desert, Chile
Size of property 96,604 ha
Type of ore Lithium brine
NI 43-101/ JORC Yes
Average Lithium Grade Up to 1,080 ppm Li
Average grade of other principal by-products
Up to 10,800 ppm K
Mg:Li Ratio 3:1
Offtake agreements N/A
Target Production (year) 2014
Target Production (tonnage) 15,000 tpa Li2CO
3
Resource
Measured N/A
Indicated N/A
Inferred N/A
Ownership 100% WI
75
LITH
IUM
Sn
ap
sho
ts
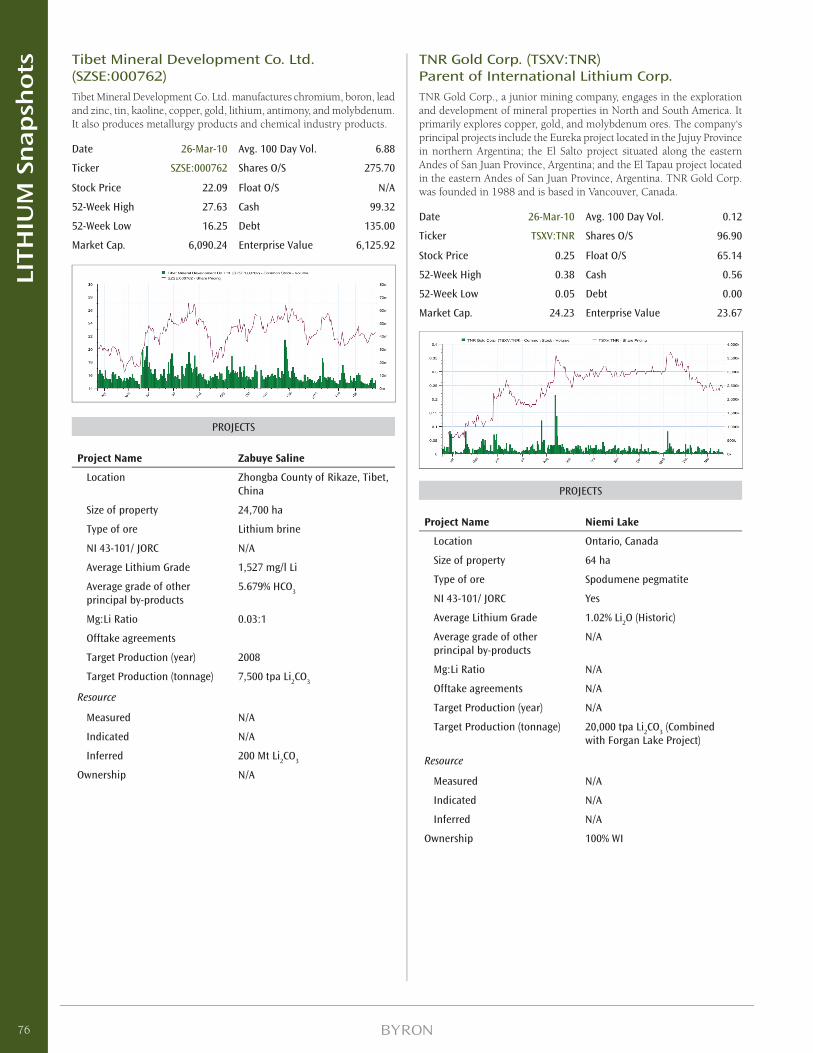
Tibet Mineral Development Co. Ltd. (SZSE:000762)Tibet Mineral Development Co. Ltd. manufactures chromium, boron, lead and zinc, tin, kaoline, copper, gold, lithium, antimony, and molybdenum. It also produces metallurgy products and chemical industry products.
Date 26-Mar-10 Avg. 100 Day Vol. 6.88
Ticker SZSE:000762 Shares O/S 275.70
Stock Price 22.09 Float O/S N/A
52-Week High 27.63 Cash 99.32
52-Week Low 16.25 Debt 135.00
Market Cap. 6,090.24 Enterprise Value 6,125.92
PROJECTS
Project Name Zabuye Saline
Location Zhongba County of Rikaze, Tibet, China
Size of property 24,700 ha
Type of ore Lithium brine
NI 43-101/ JORC N/A
Average Lithium Grade 1,527 mg/l Li
Average grade of other principal by-products
5.679% HCO3
Mg:Li Ratio 0.03:1
Offtake agreements
Target Production (year) 2008
Target Production (tonnage) 7,500 tpa Li2CO
3
Resource
Measured N/A
Indicated N/A
Inferred 200 Mt Li2CO
3
Ownership N/A
TNR Gold Corp. (TSXV:TNR)Parent of International Lithium Corp.TNR Gold Corp., a junior mining company, engages in the exploration and development of mineral properties in North and South America. It primarily explores copper, gold, and molybdenum ores. The company‘s principal projects include the Eureka project located in the Jujuy Province in northern Argentina; the El Salto project situated along the eastern Andes of San Juan Province, Argentina; and the El Tapau project located in the eastern Andes of San Juan Province, Argentina. TNR Gold Corp. was founded in 1988 and is based in Vancouver, Canada.
Date 26-Mar-10 Avg. 100 Day Vol. 0.12
Ticker TSXV:TNR Shares O/S 96.90
Stock Price 0.25 Float O/S 65.14
52-Week High 0.38 Cash 0.56
52-Week Low 0.05 Debt 0.00
Market Cap. 24.23 Enterprise Value 23.67
PROJECTS
Project Name Niemi Lake
Location Ontario, Canada
Size of property 64 ha
Type of ore Spodumene pegmatite
NI 43-101/ JORC Yes
Average Lithium Grade 1.02% Li2O (Historic)
Average grade of other principal by-products
N/A
Mg:Li Ratio N/A
Offtake agreements N/A
Target Production (year) N/A
Target Production (tonnage) 20,000 tpa Li2CO
3 (Combined
with Forgan Lake Project)
Resource
Measured N/A
Indicated N/A
Inferred N/A
Ownership 100% WI
76
LITH
IUM
Sn
ap
sho
ts
TNR Gold Corp. (TSXV:TNR)Parent of International Lithium Corp. cont’dProject Name Forgan Lake
Location Ontario, Canada
Size of property 256 ha
Type of ore Spodumene pegmatite
NI 43-101/ JORC Yes
Average Lithium Grade 1.40% Li2O
Average grade of other principal by-products
Ta, Nb
Mg:Li Ratio N/A
Offtake agreements N/A
Target Production (year) N/A
Target Production (tonnage) 20,000 tpa Li2CO
3 (Combined
with Niemi Lake Project)
Resource
Measured N/A
Indicated N/A
Inferred N/A
Ownership 100% WI
Project Name Mavis lake
Location Ontario, Canada
Size of property 2,632 ha
Type of ore Spodumene pegmatite
NI 43-101/ JORC Yes
Average Lithium Grade 1.24% Li2O
Average grade of other principal by-products
Up to 1% Rb2O, > 500 ppm Cs
2O
Ta, Ce, Nb
Mg:Li Ratio N/A
Offtake agreements N/A
Target Production (year) N/A
Target Production (tonnage) 20,000 tpa Li2CO
3
Resource
Measured N/A
Indicated N/A
Inferred N/A
Ownership 100% WI
Project Name Moose
Location Ontario, Canada
Size of property 1,877 ha
Type of ore Spodumene pegmatite
NI 43-101/ JORC Yes
Average Lithium Grade 1.50% to 3% Li2O
Average grade of other principal by-products
36% TaO5, 41% Nb
2O
Mg:Li Ratio N/A
Offtake agreements N/A
Target Production (year) N/A
Target Production (tonnage) 20,000 tpa Li2CO
3
Resource
Measured N/A
Indicated N/A
Inferred N/A
Ownership 100% WI
Project Name Fish Lake Valley
Location Nevada, US
Size of property 259 ha
Type of ore Lithium Brine
NI 43-101/ JORC N/A
Average Lithium Grade 30 to 409 ppm Li
Average grade of other principal by-products
N/A
Mg:Li Ratio N/A
Offtake agreements N/A
Target Production (year) N/A
Target Production (tonnage) 5,000 tpa Li2CO
3
Resource
Measured N/A
Indicated N/A
Inferred N/A
Ownership 100% WI
77
LITH
IUM
Sn
ap
sho
ts
TNR Gold Corp. (TSXV:TNR)Parent of International Lithium Corp. cont’dProject Name Sarcobatus Flats
Location Nevada, US
Size of property 1,076 ha
Type of ore Lithium Brine
NI 43-101/ JORC N/A
Average Lithium Grade 200 to 350 ppm Li
Average grade of other principal by-products
N/A
Mg:Li Ratio N/A
Offtake agreements N/A
Target Production (year) N/A
Target Production (tonnage) 5,000 tpa Li2CO
3
Resource
Measured N/A
Indicated N/A
Inferred N/A
Ownership Option to earn 100%
Project Name Mud Lake
Location Nevada, US
Size of property 1,300 ha
Type of ore Lithium Brine
NI 43-101/ JORC N/A
Average Lithium Grade N/A
Average grade of other principal by-products
N/A
Mg:Li Ratio N/A
Offtake agreements N/A
Target Production (year) N/A
Target Production (tonnage) 5,000 tpa Li2CO
3
Resource
Measured N/A
Indicated N/A
Inferred N/A
Ownership 100% WI
Project Name Blackstairs
Location Ireland
Size of property 29,200 ha
Type of ore Lithium Brine
NI 43-101/ JORC N/A
Average Lithium Grade 1.35% Li2O
Average grade of other principal by-products
Ta, Nb, Be
Mg:Li Ratio N/A
Offtake agreements N/A
Target Production (year) N/A
Target Production (tonnage) 20,000 tpa Li2CO
3
Resource
Measured N/A
Indicated N/A
Inferred N/A
Ownership 100% WI
Project Name Mariana (Lulullasco)
Location Salta, Argentina
Size of property 12,000 ha
Type of ore Lithium Brine
NI 43-101/ JORC Yes
Average Lithium Grade N/A
Average grade of other principal by-products
B, K
Mg:Li Ratio N/A
Offtake agreements N/A
Target Production (year) N/A
Target Production (tonnage) 10,000 to 15,000 tpa Li2CO
3
Resource
Measured N/A
Indicated N/A
Inferred N/A
Ownership Option to earn 100%
78
LITH
IUM
Sn
ap
sho
ts
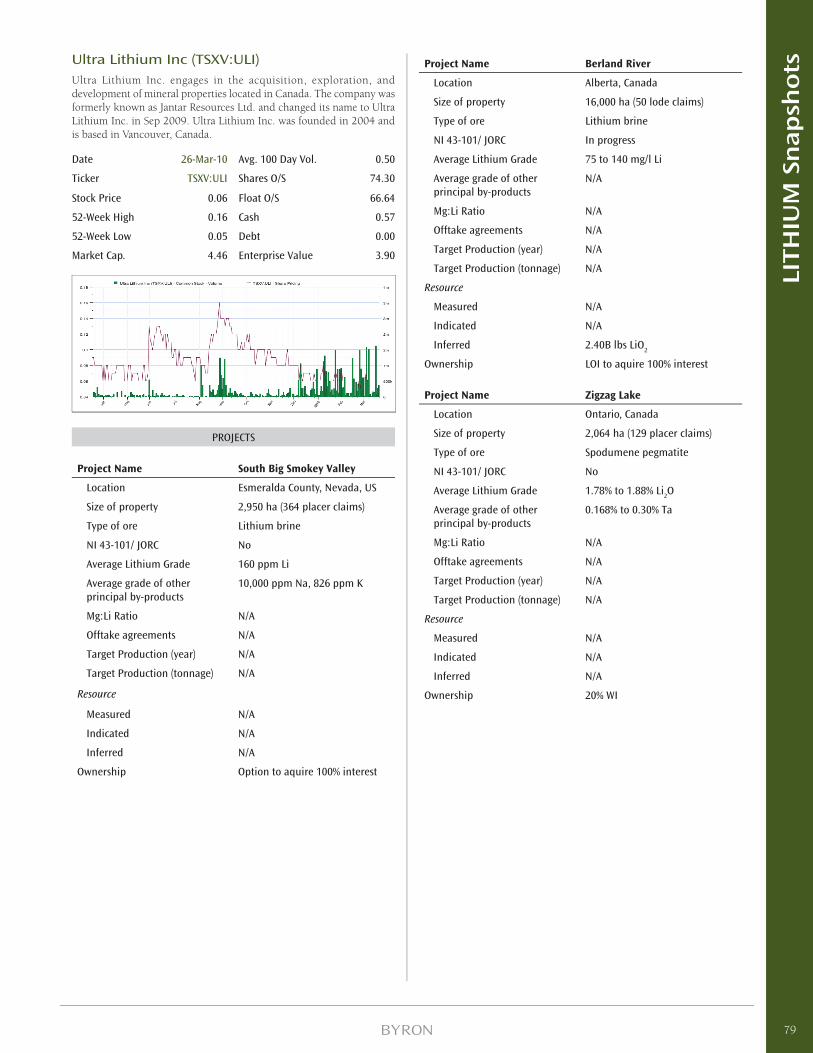
Ultra Lithium Inc (TSXV:ULI)Ultra Lithium Inc. engages in the acquisition, exploration, and development of mineral properties located in Canada. The company was formerly known as Jantar Resources Ltd. and changed its name to Ultra Lithium Inc. in Sep 2009. Ultra Lithium Inc. was founded in 2004 and is based in Vancouver, Canada.
Date 26-Mar-10 Avg. 100 Day Vol. 0.50
Ticker TSXV:ULI Shares O/S 74.30
Stock Price 0.06 Float O/S 66.64
52-Week High 0.16 Cash 0.57
52-Week Low 0.05 Debt 0.00
Market Cap. 4.46 Enterprise Value 3.90
PROJECTS
Project Name South Big Smokey Valley
Location Esmeralda County, Nevada, US
Size of property 2,950 ha (364 placer claims)
Type of ore Lithium brine
NI 43-101/ JORC No
Average Lithium Grade 160 ppm Li
Average grade of other principal by-products
10,000 ppm Na, 826 ppm K
Mg:Li Ratio N/A
Offtake agreements N/A
Target Production (year) N/A
Target Production (tonnage) N/A
Resource
Measured N/A
Indicated N/A
Inferred N/A
Ownership Option to aquire 100% interest
Project Name Berland River
Location Alberta, Canada
Size of property 16,000 ha (50 lode claims)
Type of ore Lithium brine
NI 43-101/ JORC In progress
Average Lithium Grade 75 to 140 mg/l Li
Average grade of other principal by-products
N/A
Mg:Li Ratio N/A
Offtake agreements N/A
Target Production (year) N/A
Target Production (tonnage) N/A
Resource
Measured N/A
Indicated N/A
Inferred 2.40B lbs LiO2
Ownership LOI to aquire 100% interest
Project Name Zigzag Lake
Location Ontario, Canada
Size of property 2,064 ha (129 placer claims)
Type of ore Spodumene pegmatite
NI 43-101/ JORC No
Average Lithium Grade 1.78% to 1.88% Li2O
Average grade of other principal by-products
0.168% to 0.30% Ta
Mg:Li Ratio N/A
Offtake agreements N/A
Target Production (year) N/A
Target Production (tonnage) N/A
Resource
Measured N/A
Indicated N/A
Inferred N/A
Ownership 20% WI
79
LITH
IUM
Sn
ap
sho
ts
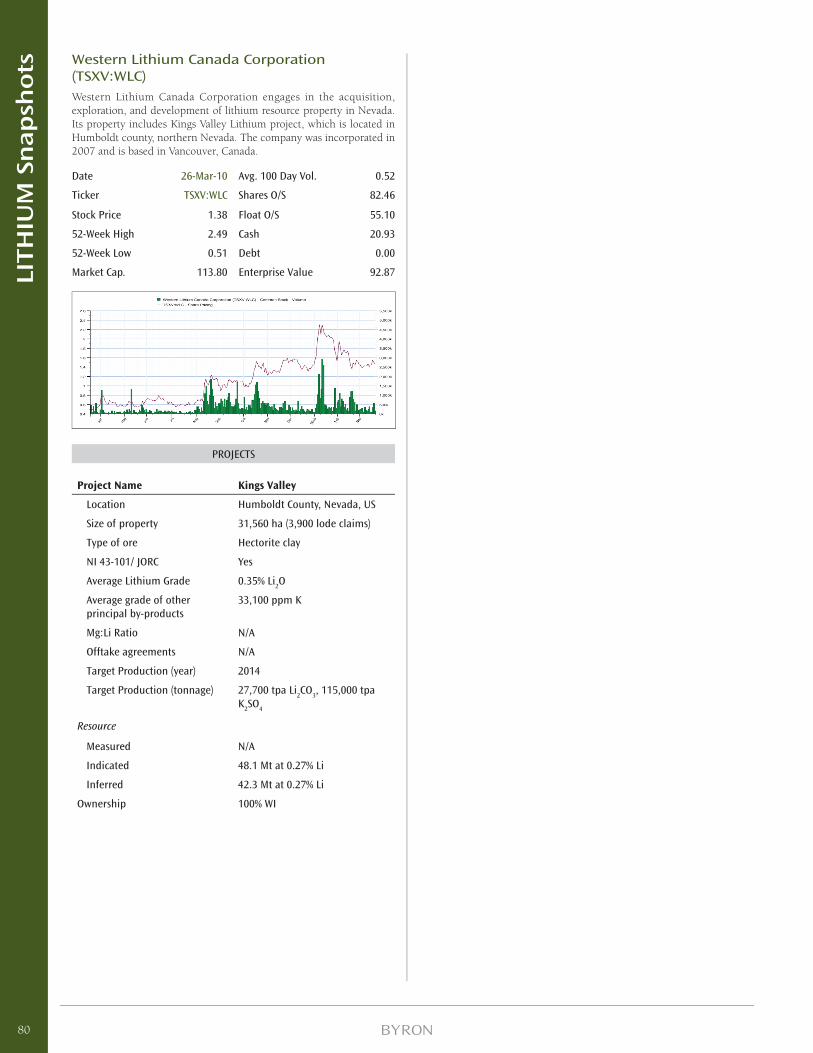
Western Lithium Canada Corporation (TSXV:WLC)Western Lithium Canada Corporation engages in the acquisition, exploration, and development of lithium resource property in Nevada. Its property includes Kings Valley Lithium project, which is located in Humboldt county, northern Nevada. The company was incorporated in 2007 and is based in Vancouver, Canada.
Date 26-Mar-10 Avg. 100 Day Vol. 0.52
Ticker TSXV:WLC Shares O/S 82.46
Stock Price 1.38 Float O/S 55.10
52-Week High 2.49 Cash 20.93
52-Week Low 0.51 Debt 0.00
Market Cap. 113.80 Enterprise Value 92.87
PROJECTS
Project Name Kings Valley
Location Humboldt County, Nevada, US
Size of property 31,560 ha (3,900 lode claims)
Type of ore Hectorite clay
NI 43-101/ JORC Yes
Average Lithium Grade 0.35% Li2O
Average grade of other principal by-products
33,100 ppm K
Mg:Li Ratio N/A
Offtake agreements N/A
Target Production (year) 2014
Target Production (tonnage) 27,700 tpa Li2CO
3, 115,000 tpa
K2SO
4
Resource
Measured N/A
Indicated 48.1 Mt at 0.27% Li
Inferred 42.3 Mt at 0.27% Li
Ownership 100% WI
80
LITH
IUM
Sn
ap
sho
ts
Disclosures
Information contained in the company snap-shots and comp tables have been drawn from third party sources believed to be reliable. The accuracy or completeness of the information cannot be guaranteed, nor in providing it does Byron Capital Markets (a division of Byron Securities Limited) assume any responsibility or liability for the contents. From time to time, Byron Capital Markets and its directors, offi cers and other employees may maintain positions in the securities that are directly or indirectly involved in this Industry. The contents of this report cannot be reproduced in whole or in part without the expressed permission of Byron Capital Markets or Byron Securities Ltd. This information is intended for use by accredited investors only, and is not intended for use by any U.S. investor.
81
LITH
IUM
Sn
ap
sho
ts
Vanadium: The SuperchargerNovember 12, 2009
Limited Supply• Vanadium is a metal that strengthens and hardens
alloys like steel, but that we believe has a bright future in energy storage. Both lithium ion batteries to be used in the automotive industry and redox batteries to be used in grid-level electricity storage benefi t greatly from the use of vanadium, and this use is cost-effective.
• Vanadium is produced in limited quantity as a by-product of other processes.
• In 2007, only about 59,100 tonnes of contained vanadium was produced globally, with this coming largely from South Africa, China and Russia.
• There is a threat that Chinese supply may be declared strategic and export curtailed, further constraining global supply.
Rapidly Rising Demand• Ferrovanadium is used to strengthen steel. Both
China and Japan are mandating stronger rebar in construction, likely increasing vanadium demand.
• We also foresee at least three new demand channels for vanadium in the alternative energy and clean technology arenas. At least two of these could result in signifi cant vanadium shortages.
Stable Prices are the Catalyst• A major issue in the past has been vanadium price
volatility. Prices have oscillated between levels of $11 per kg. for the metal to as high as $50 per kg.
• While there are some opportunities for substitution in steel production, the same is not true for other markets, including our projected new markets.
• In order to make end prices of products predictable, the price of vanadium must stabilize. This provides pull for new producers of vanadium to enter the market.
There Just Isn’t Enough• Without doubt, vanadium is growing into one of the
most important metals about which no one has ever heard. Soon, everyone is likely to become a lot more knowledgeable about vanadium, and investors can benefi t by staying ahead of the curve and owning companies that can benefi t from rapidly increasing vanadium demand.
SummaryVanadium (chemical symbol V) is a relatively rare metal that has one predominant use - a strengthening additive in steel and some forms of iron. According to the US Geological Survey (USGS) (2007), of the approximate 59,100 tonnes of vanadium produced in 2007, about 85% of this metal is used as a steel additive (Moskalyk and Alfantazi, Minerals Engineering, v16, 2003). In their 2008 update, the USGS notes that 93% of US consumption of V is metallurgical, including steel, iron and titanium alloys.
Of the balance of material, the remainder is largely used in catalysts (in the form of vanadium pentoxide, V
2O
5, in
the manufacture of sulfuric acid, or as an oxidizer in the manufacture of maleic anhydride), and ceramics (V
2O
5 is
a widely used material in ceramic production). There are also a horde of minor uses, as one would typically fi nd for any metal.
Both China and Japan have upgraded their requirements for building materials, including the strength of rebar. In China, the requirement was phased-in commencing 2007, and in Japan various enhancements to the requirements for building materials has been adding to vanadium demand for years, and will continue to do so.
It is worth noting that for many different types of steels, ferroniobium can be substituted for ferrovanadium. However, the substitution is only economic at very high vanadium prices. It should also be noted that the amount of V used in steels is small, therefore the price of V must increase substantially to allow for substitution. For example, typical high-carbon steel containing vanadium as a hardener would have no more than 0.25% V content by weight, while ultra-hard tool steels like those used in high-speed machining would contain no more than 5% V by weight, and typically much less (down to perhaps 1%).
Vanadium is used in other alloys as well, including the aerospace industry, where there are no other metallic substitutes. For example, a common titanium alloy in use in aerospace is Ti6Al4V, denoting titanium alloyed with 6% pure aluminum and 4% pure V. V has a peculiar ability to allow titanium to perform better and at higher temperatures, with no other options available. However, this use is, again, not a high volume driver of V demand.
We do believe there are several drivers that could have a significant impact on V demand in coming years. One is the use of lithium vanadium phosphate or fl uorophosphate cathodes and lithium vanadium oxide anodes in rechargeable lithium batteries. These batteries exhibit much improved safety compared to the more generic lithium cobalt oxide-type cathodes seen in
82
VA
NA
DIU
M
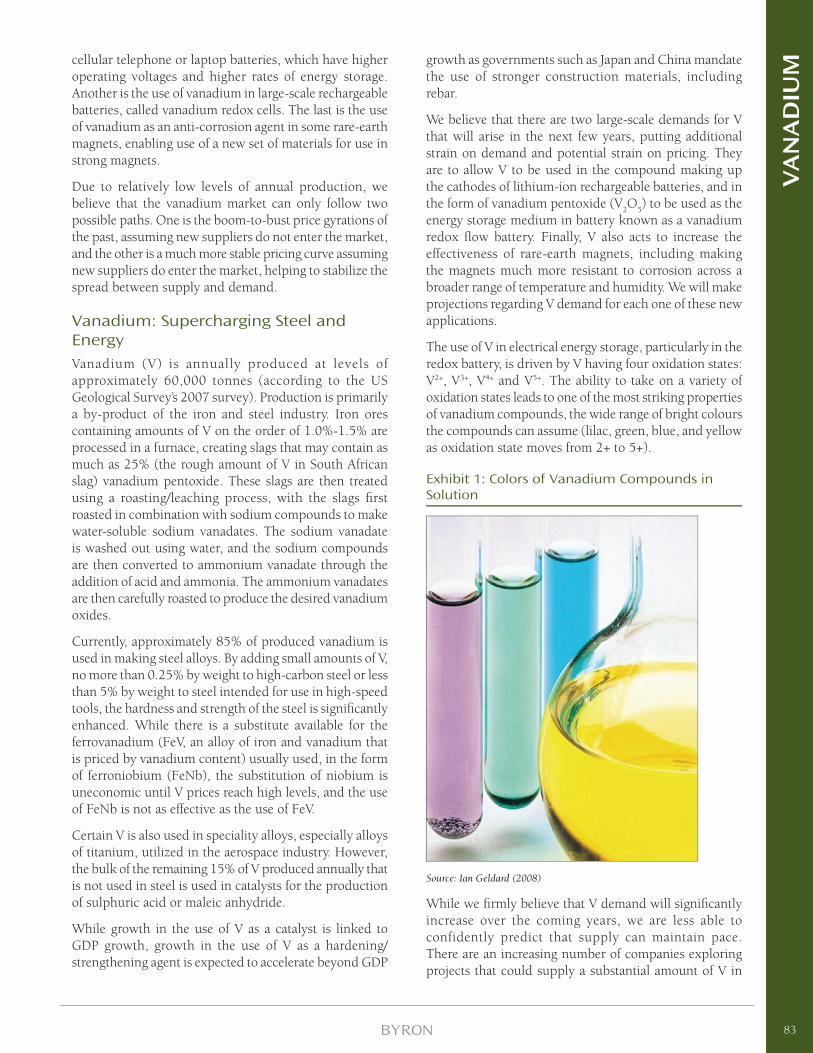
cellular telephone or laptop batteries, which have higher operating voltages and higher rates of energy storage. Another is the use of vanadium in large-scale rechargeable batteries, called vanadium redox cells. The last is the use of vanadium as an anti-corrosion agent in some rare-earth magnets, enabling use of a new set of materials for use in strong magnets.
Due to relatively low levels of annual production, we believe that the vanadium market can only follow two possible paths. One is the boom-to-bust price gyrations of the past, assuming new suppliers do not enter the market, and the other is a much more stable pricing curve assuming new suppliers do enter the market, helping to stabilize the spread between supply and demand.
Vanadium: Supercharging Steel and EnergyVanadium (V) is annually produced at levels of approximately 60,000 tonnes (according to the US Geological Survey’s 2007 survey). Production is primarily a by-product of the iron and steel industry. Iron ores containing amounts of V on the order of 1.0%-1.5% are processed in a furnace, creating slags that may contain as much as 25% (the rough amount of V in South African slag) vanadium pentoxide. These slags are then treated using a roasting/leaching process, with the slags fi rst roasted in combination with sodium compounds to make water-soluble sodium vanadates. The sodium vanadate is washed out using water, and the sodium compounds are then converted to ammonium vanadate through the addition of acid and ammonia. The ammonium vanadates are then carefully roasted to produce the desired vanadium oxides.
Currently, approximately 85% of produced vanadium is used in making steel alloys. By adding small amounts of V, no more than 0.25% by weight to high-carbon steel or less than 5% by weight to steel intended for use in high-speed tools, the hardness and strength of the steel is signifi cantly enhanced. While there is a substitute available for the ferrovanadium (FeV, an alloy of iron and vanadium that is priced by vanadium content) usually used, in the form of ferroniobium (FeNb), the substitution of niobium is uneconomic until V prices reach high levels, and the use of FeNb is not as effective as the use of FeV.
Certain V is also used in speciality alloys, especially alloys of titanium, utilized in the aerospace industry. However, the bulk of the remaining 15% of V produced annually that is not used in steel is used in catalysts for the production of sulphuric acid or maleic anhydride.
While growth in the use of V as a catalyst is linked to GDP growth, growth in the use of V as a hardening/strengthening agent is expected to accelerate beyond GDP
growth as governments such as Japan and China mandate the use of stronger construction materials, including rebar.
We believe that there are two large-scale demands for V that will arise in the next few years, putting additional strain on demand and potential strain on pricing. They are to allow V to be used in the compound making up the cathodes of lithium-ion rechargeable batteries, and in the form of vanadium pentoxide (V
2O
5) to be used as the
energy storage medium in battery known as a vanadium redox fl ow battery. Finally, V also acts to increase the effectiveness of rare-earth magnets, including making the magnets much more resistant to corrosion across a broader range of temperature and humidity. We will make projections regarding V demand for each one of these new applications.
The use of V in electrical energy storage, particularly in the redox battery, is driven by V having four oxidation states: V2+, V3+, V4+ and V5+. The ability to take on a variety of oxidation states leads to one of the most striking properties of vanadium compounds, the wide range of bright colours the compounds can assume (lilac, green, blue, and yellow as oxidation state moves from 2+ to 5+).
Exhibit 1: Colors of Vanadium Compounds in Solution
Source: Ian Geldard (2008)
While we fi rmly believe that V demand will signifi cantly increase over the coming years, we are less able to confidently predict that supply can maintain pace. There are an increasing number of companies exploring projects that could supply a substantial amount of V in
83
VA
NA
DIU
M
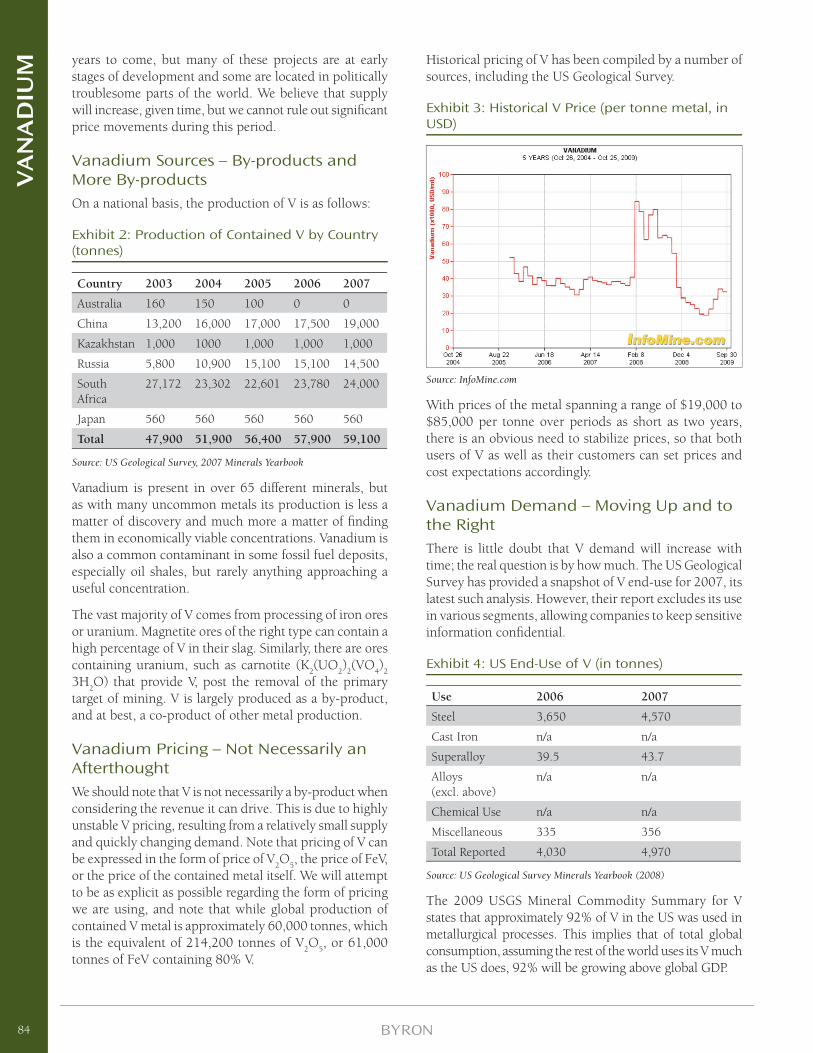
years to come, but many of these projects are at early stages of development and some are located in politically troublesome parts of the world. We believe that supply will increase, given time, but we cannot rule out signifi cant price movements during this period.
Vanadium Sources – By-products and More By-productsOn a national basis, the production of V is as follows:
Exhibit 2: Production of Contained V by Country (tonnes)
Country 2003 2004 2005 2006 2007
Australia 160 150 100 0 0
China 13,200 16,000 17,000 17,500 19,000
Kazakhstan 1,000 1000 1,000 1,000 1,000
Russia 5,800 10,900 15,100 15,100 14,500
South Africa
27,172 23,302 22,601 23,780 24,000
Japan 560 560 560 560 560
Total 47,900 51,900 56,400 57,900 59,100
Source: US Geological Survey, 2007 Minerals Yearbook
Vanadium is present in over 65 different minerals, but as with many uncommon metals its production is less a matter of discovery and much more a matter of fi nding them in economically viable concentrations. Vanadium is also a common contaminant in some fossil fuel deposits, especially oil shales, but rarely anything approaching a useful concentration.
The vast majority of V comes from processing of iron ores or uranium. Magnetite ores of the right type can contain a high percentage of V in their slag. Similarly, there are ores containing uranium, such as carnotite (K
2(UO
2)
2(VO
4)
2
3H2O) that provide V, post the removal of the primary
target of mining. V is largely produced as a by-product, and at best, a co-product of other metal production.
Vanadium Pricing – Not Necessarily an AfterthoughtWe should note that V is not necessarily a by-product when considering the revenue it can drive. This is due to highly unstable V pricing, resulting from a relatively small supply and quickly changing demand. Note that pricing of V can be expressed in the form of price of V
2O
5, the price of FeV,
or the price of the contained metal itself. We will attempt to be as explicit as possible regarding the form of pricing we are using, and note that while global production of contained V metal is approximately 60,000 tonnes, which is the equivalent of 214,200 tonnes of V
2O
5, or 61,000
tonnes of FeV containing 80% V.
Historical pricing of V has been compiled by a number of sources, including the US Geological Survey.
Exhibit 3: Historical V Price (per tonne metal, in USD)
Source: InfoMine.com
With prices of the metal spanning a range of $19,000 to $85,000 per tonne over periods as short as two years, there is an obvious need to stabilize prices, so that both users of V as well as their customers can set prices and cost expectations accordingly.
Vanadium Demand – Moving Up and to the RightThere is little doubt that V demand will increase with time; the real question is by how much. The US Geological Survey has provided a snapshot of V end-use for 2007, its latest such analysis. However, their report excludes its use in various segments, allowing companies to keep sensitive information confi dential.
Exhibit 4: US End-Use of V (in tonnes)
Use 2006 2007
Steel 3,650 4,570
Cast Iron n/a n/a
Superalloy 39.5 43.7
Alloys (excl. above)
n/a n/a
Chemical Use n/a n/a
Miscellaneous 335 356
Total Reported 4,030 4,970
Source: US Geological Survey Minerals Yearbook (2008)
The 2009 USGS Mineral Commodity Summary for V states that approximately 92% of V in the US was used in metallurgical processes. This implies that of total global consumption, assuming the rest of the world uses its V much as the US does, 92% will be growing above global GDP.
84
VA
NA
DIU
M
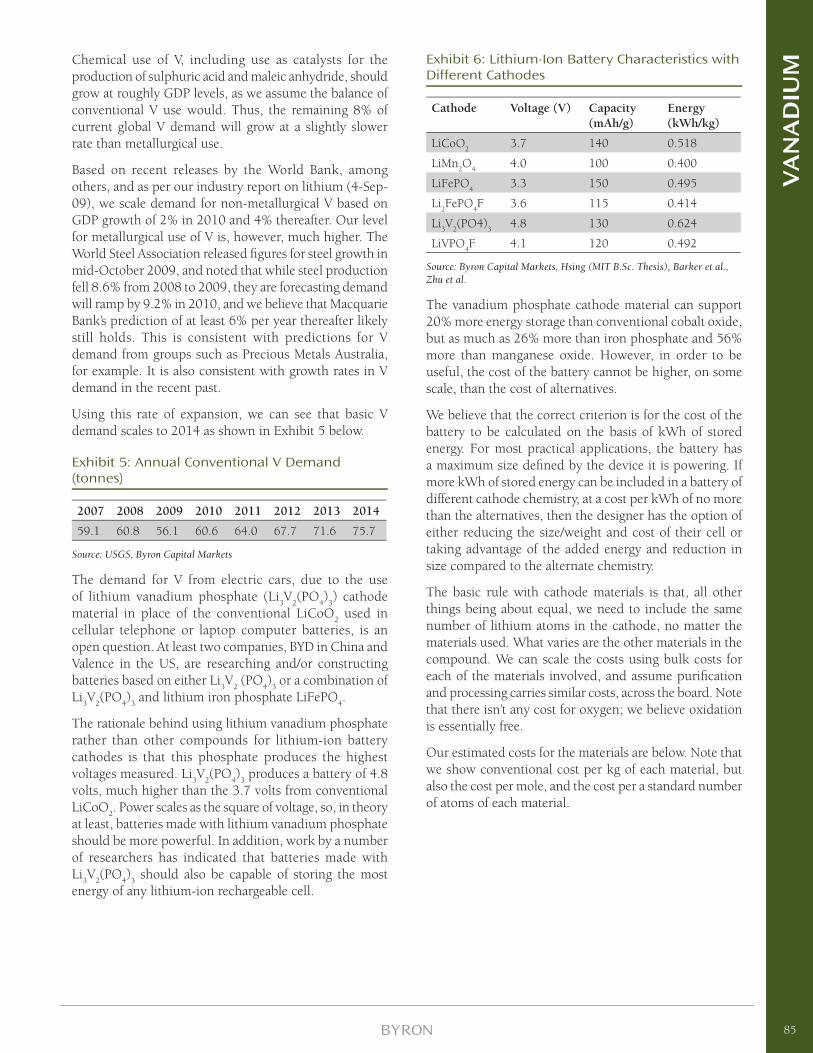
Chemical use of V, including use as catalysts for the production of sulphuric acid and maleic anhydride, should grow at roughly GDP levels, as we assume the balance of conventional V use would. Thus, the remaining 8% of current global V demand will grow at a slightly slower rate than metallurgical use.
Based on recent releases by the World Bank, among others, and as per our industry report on lithium (4-Sep-09), we scale demand for non-metallurgical V based on GDP growth of 2% in 2010 and 4% thereafter. Our level for metallurgical use of V is, however, much higher. The World Steel Association released fi gures for steel growth in mid-October 2009, and noted that while steel production fell 8.6% from 2008 to 2009, they are forecasting demand will ramp by 9.2% in 2010, and we believe that Macquarie Bank’s prediction of at least 6% per year thereafter likely still holds. This is consistent with predictions for V demand from groups such as Precious Metals Australia, for example. It is also consistent with growth rates in V demand in the recent past.
Using this rate of expansion, we can see that basic V demand scales to 2014 as shown in Exhibit 5 below.
Exhibit 5: Annual Conventional V Demand (tonnes)
2007 2008 2009 2010 2011 2012 2013 2014
59.1 60.8 56.1 60.6 64.0 67.7 71.6 75.7
Source: USGS, Byron Capital Markets
The demand for V from electric cars, due to the use of lithium vanadium phosphate (Li
3V
2(PO
4)
3) cathode
material in place of the conventional LiCoO2 used in
cellular telephone or laptop computer batteries, is an open question. At least two companies, BYD in China and Valence in the US, are researching and/or constructing batteries based on either Li
3V
2 (PO
4)
3 or a combination of
Li3V
2(PO
4)
3 and lithium iron phosphate LiFePO
4.
The rationale behind using lithium vanadium phosphate rather than other compounds for lithium-ion battery cathodes is that this phosphate produces the highest voltages measured. Li
3V
2(PO
4)
3 produces a battery of 4.8
volts, much higher than the 3.7 volts from conventional LiCoO
2. Power scales as the square of voltage, so, in theory
at least, batteries made with lithium vanadium phosphate should be more powerful. In addition, work by a number of researchers has indicated that batteries made with Li
3V
2(PO
4)
3 should also be capable of storing the most
energy of any lithium-ion rechargeable cell.
Exhibit 6: Lithium-Ion Battery Characteristics with Different Cathodes
Cathode Voltage (V) Capacity (mAh/g)
Energy (kWh/kg)
LiCoO2
3.7 140 0.518
LiMn2O
44.0 100 0.400
LiFePO4
3.3 150 0.495
Li2FePO
4F 3.6 115 0.414
Li3V
2(PO4)
34.8 130 0.624
LiVPO4F 4.1 120 0.492
Source: Byron Capital Markets, Hsing (MIT B.Sc. Thesis), Barker et al., Zhu et al.
The vanadium phosphate cathode material can support 20% more energy storage than conventional cobalt oxide, but as much as 26% more than iron phosphate and 56% more than manganese oxide. However, in order to be useful, the cost of the battery cannot be higher, on some scale, than the cost of alternatives.
We believe that the correct criterion is for the cost of the battery to be calculated on the basis of kWh of stored energy. For most practical applications, the battery has a maximum size defi ned by the device it is powering. If more kWh of stored energy can be included in a battery of different cathode chemistry, at a cost per kWh of no more than the alternatives, then the designer has the option of either reducing the size/weight and cost of their cell or taking advantage of the added energy and reduction in size compared to the alternate chemistry.
The basic rule with cathode materials is that, all other things being about equal, we need to include the same number of lithium atoms in the cathode, no matter the materials used. What varies are the other materials in the compound. We can scale the costs using bulk costs for each of the materials involved, and assume purifi cation and processing carries similar costs, across the board. Note that there isn’t any cost for oxygen; we believe oxidation is essentially free.
Our estimated costs for the materials are below. Note that we show conventional cost per kg of each material, but also the cost per mole, and the cost per a standard number of atoms of each material.
85
VA
NA
DIU
M
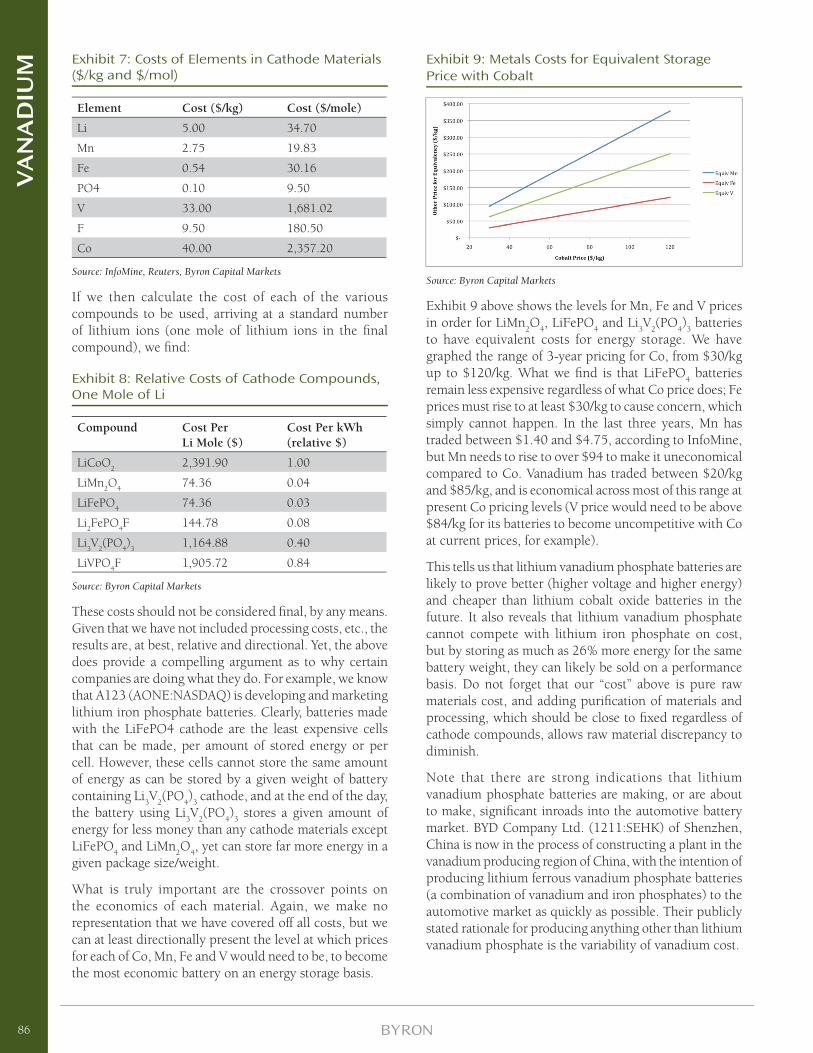
Exhibit 7: Costs of Elements in Cathode Materials ($/kg and $/mol)
Element Cost ($/kg) Cost ($/mole)
Li 5.00 34.70
Mn 2.75 19.83
Fe 0.54 30.16
PO4 0.10 9.50
V 33.00 1,681.02
F 9.50 180.50
Co 40.00 2,357.20
Source: InfoMine, Reuters, Byron Capital Markets
If we then calculate the cost of each of the various compounds to be used, arriving at a standard number of lithium ions (one mole of lithium ions in the fi nal compound), we fi nd:
Exhibit 8: Relative Costs of Cathode Compounds, One Mole of Li
Compound Cost Per Li Mole ($)
Cost Per kWh (relative $)
LiCoO2
2,391.90 1.00
LiMn2O
474.36 0.04
LiFePO4
74.36 0.03
Li2FePO
4F 144.78 0.08
Li3V
2(PO
4)
31,164.88 0.40
LiVPO4F 1,905.72 0.84
Source: Byron Capital Markets
These costs should not be considered fi nal, by any means. Given that we have not included processing costs, etc., the results are, at best, relative and directional. Yet, the above does provide a compelling argument as to why certain companies are doing what they do. For example, we know that A123 (AONE:NASDAQ) is developing and marketing lithium iron phosphate batteries. Clearly, batteries made with the LiFePO4 cathode are the least expensive cells that can be made, per amount of stored energy or per cell. However, these cells cannot store the same amount of energy as can be stored by a given weight of battery containing Li
3V
2(PO
4)
3 cathode, and at the end of the day,
the battery using Li3V
2(PO
4)
3 stores a given amount of
energy for less money than any cathode materials except LiFePO
4 and LiMn
2O
4, yet can store far more energy in a
given package size/weight.
What is truly important are the crossover points on the economics of each material. Again, we make no representation that we have covered off all costs, but we can at least directionally present the level at which prices for each of Co, Mn, Fe and V would need to be, to become the most economic battery on an energy storage basis.
Exhibit 9: Metals Costs for Equivalent Storage Price with Cobalt
Source: Byron Capital Markets
Exhibit 9 above shows the levels for Mn, Fe and V prices in order for LiMn
2O
4, LiFePO
4 and Li
3V
2(PO
4)
3 batteries
to have equivalent costs for energy storage. We have graphed the range of 3-year pricing for Co, from $30/kg up to $120/kg. What we fi nd is that LiFePO
4 batteries
remain less expensive regardless of what Co price does; Fe prices must rise to at least $30/kg to cause concern, which simply cannot happen. In the last three years, Mn has traded between $1.40 and $4.75, according to InfoMine, but Mn needs to rise to over $94 to make it uneconomical compared to Co. Vanadium has traded between $20/kg and $85/kg, and is economical across most of this range at present Co pricing levels (V price would need to be above $84/kg for its batteries to become uncompetitive with Co at current prices, for example).
This tells us that lithium vanadium phosphate batteries are likely to prove better (higher voltage and higher energy) and cheaper than lithium cobalt oxide batteries in the future. It also reveals that lithium vanadium phosphate cannot compete with lithium iron phosphate on cost, but by storing as much as 26% more energy for the same battery weight, they can likely be sold on a performance basis. Do not forget that our “cost” above is pure raw materials cost, and adding purifi cation of materials and processing, which should be close to fi xed regardless of cathode compounds, allows raw material discrepancy to diminish.
Note that there are strong indications that lithium vanadium phosphate batteries are making, or are about to make, signifi cant inroads into the automotive battery market. BYD Company Ltd. (1211:SEHK) of Shenzhen, China is now in the process of constructing a plant in the vanadium producing region of China, with the intention of producing lithium ferrous vanadium phosphate batteries (a combination of vanadium and iron phosphates) to the automotive market as quickly as possible. Their publicly stated rationale for producing anything other than lithium vanadium phosphate is the variability of vanadium cost.
86
VA
NA
DIU
M
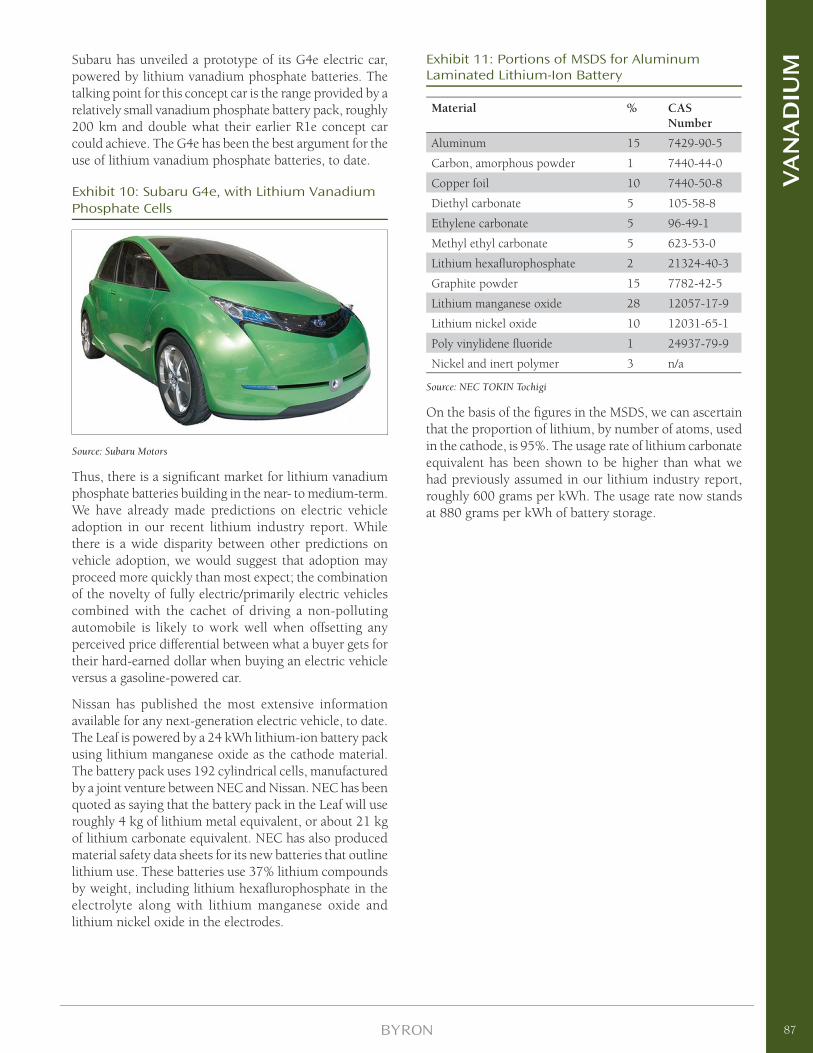
Subaru has unveiled a prototype of its G4e electric car, powered by lithium vanadium phosphate batteries. The talking point for this concept car is the range provided by a relatively small vanadium phosphate battery pack, roughly 200 km and double what their earlier R1e concept car could achieve. The G4e has been the best argument for the use of lithium vanadium phosphate batteries, to date.
Exhibit 10: Subaru G4e, with Lithium Vanadium Phosphate Cells
Source: Subaru Motors
Thus, there is a signifi cant market for lithium vanadium phosphate batteries building in the near- to medium-term. We have already made predictions on electric vehicle adoption in our recent lithium industry report. While there is a wide disparity between other predictions on vehicle adoption, we would suggest that adoption may proceed more quickly than most expect; the combination of the novelty of fully electric/primarily electric vehicles combined with the cachet of driving a non-polluting automobile is likely to work well when offsetting any perceived price differential between what a buyer gets for their hard-earned dollar when buying an electric vehicle versus a gasoline-powered car.
Nissan has published the most extensive information available for any next-generation electric vehicle, to date. The Leaf is powered by a 24 kWh lithium-ion battery pack using lithium manganese oxide as the cathode material. The battery pack uses 192 cylindrical cells, manufactured by a joint venture between NEC and Nissan. NEC has been quoted as saying that the battery pack in the Leaf will use roughly 4 kg of lithium metal equivalent, or about 21 kg of lithium carbonate equivalent. NEC has also produced material safety data sheets for its new batteries that outline lithium use. These batteries use 37% lithium compounds by weight, including lithium hexafl urophosphate in the electrolyte along with lithium manganese oxide and lithium nickel oxide in the electrodes.
Exhibit 11: Portions of MSDS for Aluminum Laminated Lithium-Ion Battery
Material % CAS Number
Aluminum 15 7429-90-5
Carbon, amorphous powder 1 7440-44-0
Copper foil 10 7440-50-8
Diethyl carbonate 5 105-58-8
Ethylene carbonate 5 96-49-1
Methyl ethyl carbonate 5 623-53-0
Lithium hexafl urophosphate 2 21324-40-3
Graphite powder 15 7782-42-5
Lithium manganese oxide 28 12057-17-9
Lithium nickel oxide 10 12031-65-1
Poly vinylidene fl uoride 1 24937-79-9
Nickel and inert polymer 3 n/a
Source: NEC TOKIN Tochigi
On the basis of the fi gures in the MSDS, we can ascertain that the proportion of lithium, by number of atoms, used in the cathode, is 95%. The usage rate of lithium carbonate equivalent has been shown to be higher than what we had previously assumed in our lithium industry report, roughly 600 grams per kWh. The usage rate now stands at 880 grams per kWh of battery storage.
87
VA
NA
DIU
M

Exhibit 12: Electric Vehicle Adoption and Potential V Demand
Vehicle: 2009 2010 2011 2012 2013 2014
Prius-like - 300,000 400,000 500,000 600,000 700,000
Volt-like - - 150,000 200,000 300,000 400,000
Leaf-like - - 200,000 350,000 500,000 700,000
V Required:
Prius-like - 236 314 393 472 550
Volt-like - - 1,572 2,096 3,144 4,192
Leaf-like - - 2,751 4,814 6,877 9,628
Auto Totals - 236 4,637 7,303 10,492 14,369
Source: Byron Capital Markets
Finally, we have one other potential large-scale use of V metal - the grid-level storage allowed by vanadium reduction-oxidation batteries, usually referred to by the acronym VRB. A VRB is a large-sized battery, with the ability to have its output power and its energy storage levels scaled independently; if one builds a battery out of fi xed cells, such as lead-acid car batteries, then one is limited to adding them in discrete chunks, and adding additional storage still requires one to pay the premium for additional power. A VRB can be designed to produce exactly the desired power for exactly the desired time, no more than required.
Exhibit 13: A Representative VRB
Source: Dept. of Chemistry, Washington University in St. Louis
Although many discuss the ability of VRBs, or other large-scale storage systems, to allow greater levels of penetration of alternative energy, such as wind or solar, we believe the true use of VRBs by utilities may be far more pedestrian. This use would be the augmentation of the existing grid, to put off major capital expenditures. For example, one of the fi rst uses of a VRB in North America was to augment
a local substation that was being strained by faster-than-anticipated community development. Essentially, a remote community had grown faster than the utility serving it had expected; the utility was left with the choice of spending millions of dollars to upgrade the substation and pull additional feeder cables, to meet an electricity supply shortfall that lasted hours each day, or add a VRB for less money and put off the upgrade for years. Given that in North America, utility rates are generally set by pricing boards their costs of capital are such that putting off such capital expenditures results in a very high IRR for the utility.
We believe there is signifi cant latent demand for such a product. As an aside, while we were covering a company working on grid-scale storage, we were receiving phone calls from major North American utilities interested in learning more about the product from an unbiased source. This is the fi rst and only time such a thing has happened in our experience.
There are several companies working on grid-level storage using VRBs. Prudent Energy of Beijing, China purchased the assets of VRB Power of Vancouver, and is working to develop and sell large-scale VRBs worldwide. Cellstrom of Austria and Cellenium of Thailand are also working in similar capacities. All have the potential to sell relatively large batteries to utilities and others, with Prudent likely having the commercial lead in this regard.
All VRBs aim to put V ions into solution, as it is the ability of the V ion to assume any one of four oxidation states that allows the battery to store energy. The V can come in the form of any one of a number of compounds, including vanadium sulphate or vanadium pentoxide, all dissolved in relatively dilute sulphuric acid. Our past work with VRB Power allowed us to carry out some basic calculations regarding V requirements. For a VRB, storage was 20 Wh/liter of electrolyte. According to the inventors of the technology at the University of New South Wales, the concentration of the electrolyte is 2M V
2(SO
4)
3 in 2.5M
88
VA
NA
DIU
M
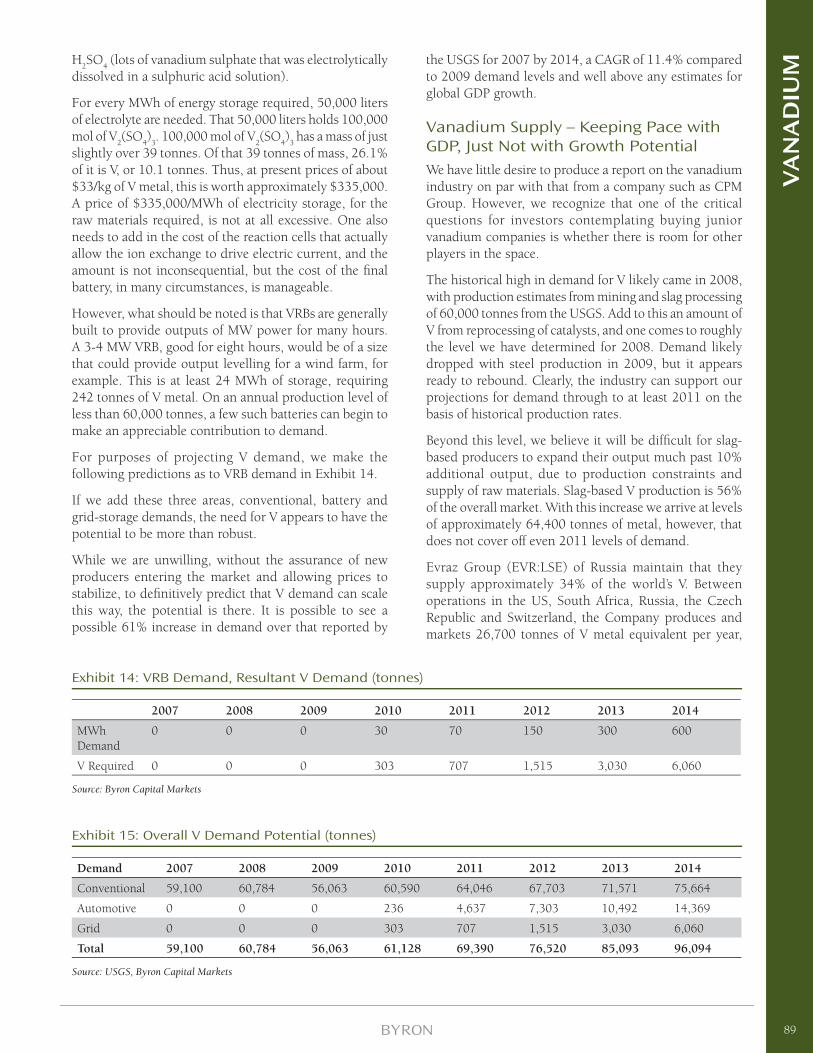
H2SO
4 (lots of vanadium sulphate that was electrolytically
dissolved in a sulphuric acid solution).
For every MWh of energy storage required, 50,000 liters of electrolyte are needed. That 50,000 liters holds 100,000 mol of V
2(SO
4)
3. 100,000 mol of V
2(SO
4)
3 has a mass of just
slightly over 39 tonnes. Of that 39 tonnes of mass, 26.1% of it is V, or 10.1 tonnes. Thus, at present prices of about $33/kg of V metal, this is worth approximately $335,000. A price of $335,000/MWh of electricity storage, for the raw materials required, is not at all excessive. One also needs to add in the cost of the reaction cells that actually allow the ion exchange to drive electric current, and the amount is not inconsequential, but the cost of the fi nal battery, in many circumstances, is manageable.
However, what should be noted is that VRBs are generally built to provide outputs of MW power for many hours. A 3-4 MW VRB, good for eight hours, would be of a size that could provide output levelling for a wind farm, for example. This is at least 24 MWh of storage, requiring 242 tonnes of V metal. On an annual production level of less than 60,000 tonnes, a few such batteries can begin to make an appreciable contribution to demand.
For purposes of projecting V demand, we make the following predictions as to VRB demand in Exhibit 14.
If we add these three areas, conventional, battery and grid-storage demands, the need for V appears to have the potential to be more than robust.
While we are unwilling, without the assurance of new producers entering the market and allowing prices to stabilize, to defi nitively predict that V demand can scale this way, the potential is there. It is possible to see a possible 61% increase in demand over that reported by
Exhibit 14: VRB Demand, Resultant V Demand (tonnes)
2007 2008 2009 2010 2011 2012 2013 2014
MWh Demand
0 0 0 30 70 150 300 600
V Required 0 0 0 303 707 1,515 3,030 6,060
Source: Byron Capital Markets
Exhibit 15: Overall V Demand Potential (tonnes)
Demand 2007 2008 2009 2010 2011 2012 2013 2014
Conventional 59,100 60,784 56,063 60,590 64,046 67,703 71,571 75,664
Automotive 0 0 0 236 4,637 7,303 10,492 14,369
Grid 0 0 0 303 707 1,515 3,030 6,060
Total 59,100 60,784 56,063 61,128 69,390 76,520 85,093 96,094
Source: USGS, Byron Capital Markets
the USGS for 2007 by 2014, a CAGR of 11.4% compared to 2009 demand levels and well above any estimates for global GDP growth.
Vanadium Supply – Keeping Pace with GDP, Just Not with Growth Potential We have little desire to produce a report on the vanadium industry on par with that from a company such as CPM Group. However, we recognize that one of the critical questions for investors contemplating buying junior vanadium companies is whether there is room for other players in the space.
The historical high in demand for V likely came in 2008, with production estimates from mining and slag processing of 60,000 tonnes from the USGS. Add to this an amount of V from reprocessing of catalysts, and one comes to roughly the level we have determined for 2008. Demand likely dropped with steel production in 2009, but it appears ready to rebound. Clearly, the industry can support our projections for demand through to at least 2011 on the basis of historical production rates.
Beyond this level, we believe it will be diffi cult for slag-based producers to expand their output much past 10% additional output, due to production constraints and supply of raw materials. Slag-based V production is 56% of the overall market. With this increase we arrive at levels of approximately 64,400 tonnes of metal, however, that does not cover off even 2011 levels of demand.
Evraz Group (EVR:LSE) of Russia maintain that they supply approximately 34% of the world’s V. Between operations in the US, South Africa, Russia, the Czech Republic and Switzerland, the Company produces and markets 26,700 tonnes of V metal equivalent per year,
89
VA
NA
DIU
M
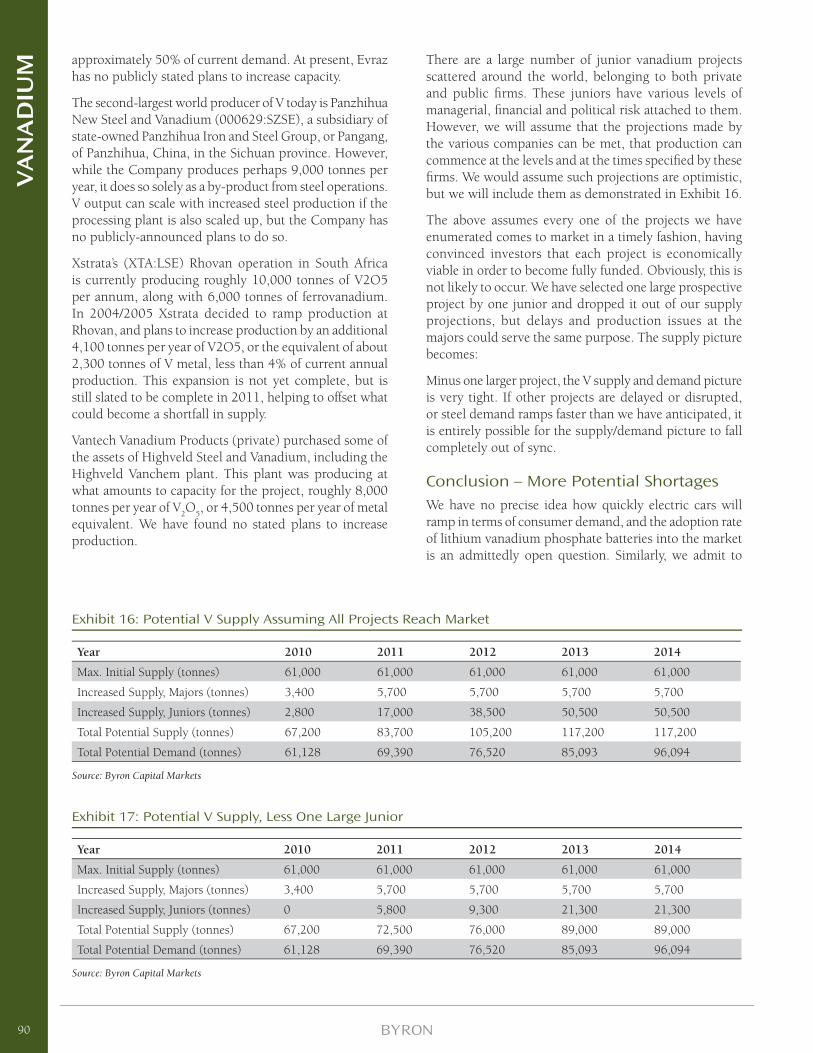
approximately 50% of current demand. At present, Evraz has no publicly stated plans to increase capacity.
The second-largest world producer of V today is Panzhihua New Steel and Vanadium (000629:SZSE), a subsidiary of state-owned Panzhihua Iron and Steel Group, or Pangang, of Panzhihua, China, in the Sichuan province. However, while the Company produces perhaps 9,000 tonnes per year, it does so solely as a by-product from steel operations. V output can scale with increased steel production if the processing plant is also scaled up, but the Company has no publicly-announced plans to do so.
Xstrata’s (XTA:LSE) Rhovan operation in South Africa is currently producing roughly 10,000 tonnes of V2O5 per annum, along with 6,000 tonnes of ferrovanadium. In 2004/2005 Xstrata decided to ramp production at Rhovan, and plans to increase production by an additional 4,100 tonnes per year of V2O5, or the equivalent of about 2,300 tonnes of V metal, less than 4% of current annual production. This expansion is not yet complete, but is still slated to be complete in 2011, helping to offset what could become a shortfall in supply.
Vantech Vanadium Products (private) purchased some of the assets of Highveld Steel and Vanadium, including the Highveld Vanchem plant. This plant was producing at what amounts to capacity for the project, roughly 8,000 tonnes per year of V
2O
5, or 4,500 tonnes per year of metal
equivalent. We have found no stated plans to increase production.
There are a large number of junior vanadium projects scattered around the world, belonging to both private and public fi rms. These juniors have various levels of managerial, fi nancial and political risk attached to them. However, we will assume that the projections made by the various companies can be met, that production can commence at the levels and at the times specifi ed by these fi rms. We would assume such projections are optimistic, but we will include them as demonstrated in Exhibit 16.
The above assumes every one of the projects we have enumerated comes to market in a timely fashion, having convinced investors that each project is economically viable in order to become fully funded. Obviously, this is not likely to occur. We have selected one large prospective project by one junior and dropped it out of our supply projections, but delays and production issues at the majors could serve the same purpose. The supply picture becomes:
Minus one larger project, the V supply and demand picture is very tight. If other projects are delayed or disrupted, or steel demand ramps faster than we have anticipated, it is entirely possible for the supply/demand picture to fall completely out of sync.
Conclusion – More Potential ShortagesWe have no precise idea how quickly electric cars will ramp in terms of consumer demand, and the adoption rate of lithium vanadium phosphate batteries into the market is an admittedly open question. Similarly, we admit to
Exhibit 16: Potential V Supply Assuming All Projects Reach Market
Year 2010 2011 2012 2013 2014
Max. Initial Supply (tonnes) 61,000 61,000 61,000 61,000 61,000
Increased Supply, Majors (tonnes) 3,400 5,700 5,700 5,700 5,700
Increased Supply, Juniors (tonnes) 2,800 17,000 38,500 50,500 50,500
Total Potential Supply (tonnes) 67,200 83,700 105,200 117,200 117,200
Total Potential Demand (tonnes) 61,128 69,390 76,520 85,093 96,094
Source: Byron Capital Markets
Exhibit 17: Potential V Supply, Less One Large Junior
Year 2010 2011 2012 2013 2014
Max. Initial Supply (tonnes) 61,000 61,000 61,000 61,000 61,000
Increased Supply, Majors (tonnes) 3,400 5,700 5,700 5,700 5,700
Increased Supply, Juniors (tonnes) 0 5,800 9,300 21,300 21,300
Total Potential Supply (tonnes) 67,200 72,500 76,000 89,000 89,000
Total Potential Demand (tonnes) 61,128 69,390 76,520 85,093 96,094
Source: Byron Capital Markets
90
VA
NA
DIU
M
having little ability to predict the future in terms of the adoption rate for large-scale vanadium redox batteries. Even something as relatively simple as a prediction for V use in steel making in the future is dubious. One should take the above fi gures with respect to potential supply and potential demand of V with a very large grain of salt.
However, we are certain of the following. Lithium-ion batteries containing lithium vanadium phosphate cathodes are the rechargeable lithium-ion batteries with the greatest ability to store electricity. Ultimately, these cells should prove to be of lower cost than the conventional lithium cobalt oxide cathode-equipped cells, commonly used in cell phones and laptops. Certainly, the automotive market should gravitate not to the cheapest rechargeable battery available (otherwise why not use nickel metal hydride throughout) but to the battery with the highest energy content in the given space, giving the car the ability to travel as far as possible. We have not included the laptop battery market in our projections, but this is an area where operating time per charge is valued highly as well, therefore should be a ready market for lithium vanadium phosphate.
There is really only one competitive technology for grid-level electricity storage, as far as we are concerned, and that is vanadium redox batteries. The VRB may not fi nd much use as a backup system for the individual home, but there is no shortage of use at the substation level.
Finally, barring catastrophic price increases in V, we also know that the use of V as a hardening/strengthening agent in steel will dramatically increase over the next few years. Demand from China and developing nations will see to that, alone.
Overall, we know that the need for stronger and more steel is driving V demand up. We believe there may be signifi cant V demand building from areas such as lithium-ion battery use and redox battery deployment. All in all, this is more than enough reason for investors to look at investments involving another uncommon metal, vanadium.
91
VA
NA
DIU
M
Disclosures
Information contained in this Industry report has been drawn from sources believed to be reliable but its accuracy or completeness is not guaranteed, nor in providing it does Byron Capital Markets (a division of Byron Securities Limited) assume any responsibility or liability. From time to time, Byron Capital Markets and its directors, offi cers and other employees may maintain positions in the securities that are directly or indirectly involved in this Industry. The contents of this report cannot be reproduced in whole or in part without the expressed permission of Byron Capital Markets. This information is intended for use by accredited investors only, and is not intended for use by any U.S. investor.
Byron Capital Markets Policies and Procedures Regarding the Dissemination of Research
General policy is to make available a research report to its clients for an exclusive period of up to 30 days. Following that period, the research report will appear on the Byron Capital Markets website at www.byroncapitalmarkets.com.
Analyst Certifi cation
I, Jon Hykawy, certify the views expressed in this report were formed by my review of relevant company data and industry investigation, and accurately refl ect my opinion about the investment merits of the securities mentioned in the report. I also certify that my compensation is not related to specifi c recommendations or views expressed in this report.
Byron Capital Markets publishes research and investment recommendations for the use of its clients. Information regarding our categories of recommendations, quarterly summaries of the percentage of our recommendations that fall into each category and our policies regarding the release of our research reports is available at www.byroncapitalmarkets.com, or may be requested by contacting the analyst.
92
VA
NA
DIU
M
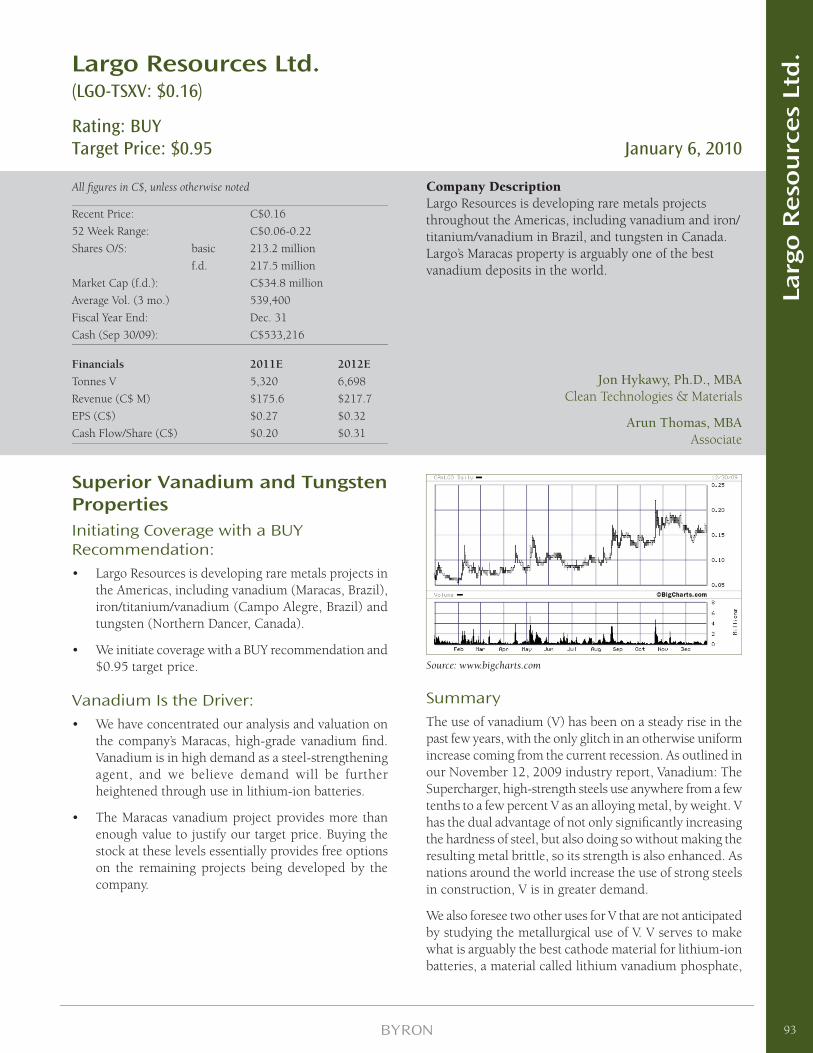
Largo Resources Ltd.(LGO-TSXV: $0.16)
Rating: BUYTarget Price: $0.95 January 6, 2010
All fi gures in C$, unless otherwise noted
Recent Price: C$0.16
52 Week Range: C$0.06-0.22
Shares O/S: basic 213.2 million
f.d. 217.5 million
Market Cap (f.d.): C$34.8 million
Average Vol. (3 mo.) 539,400
Fiscal Year End: Dec. 31
Cash (Sep 30/09): C$533,216
Financials 2011E 2012E
Tonnes V 5,320 6,698
Revenue (C$ M) $175.6 $217.7
EPS (C$) $0.27 $0.32
Cash Flow/Share (C$) $0.20 $0.31
Company DescriptionLargo Resources is developing rare metals projects throughout the Americas, including vanadium and iron/titanium/vanadium in Brazil, and tungsten in Canada. Largo’s Maracas property is arguably one of the best vanadium deposits in the world.
Superior Vanadium and Tungsten PropertiesInitiating Coverage with a BUY Recommendation:• Largo Resources is developing rare metals projects in
the Americas, including vanadium (Maracas, Brazil), iron/titanium/vanadium (Campo Alegre, Brazil) and tungsten (Northern Dancer, Canada).
• We initiate coverage with a BUY recommendation and $0.95 target price.
Vanadium Is the Driver:• We have concentrated our analysis and valuation on
the company’s Maracas, high-grade vanadium fi nd. Vanadium is in high demand as a steel-strengthening agent, and we believe demand will be further heightened through use in lithium-ion batteries.
• The Maracas vanadium project provides more than enough value to justify our target price. Buying the stock at these levels essentially provides free options on the remaining projects being developed by the company.
Source: www.bigcharts.com
SummaryThe use of vanadium (V) has been on a steady rise in the past few years, with the only glitch in an otherwise uniform increase coming from the current recession. As outlined in our November 12, 2009 industry report, Vanadium: The Supercharger, high-strength steels use anywhere from a few tenths to a few percent V as an alloying metal, by weight. V has the dual advantage of not only signifi cantly increasing the hardness of steel, but also doing so without making the resulting metal brittle, so its strength is also enhanced. As nations around the world increase the use of strong steels in construction, V is in greater demand.
We also foresee two other uses for V that are not anticipated by studying the metallurgical use of V. V serves to make what is arguably the best cathode material for lithium-ion batteries, a material called lithium vanadium phosphate,
Jon Hykawy, Ph.D., MBAClean Technologies & Materials
Arun Thomas, MBAAssociate
93
Larg
o R
eso
urc
es
Ltd
.
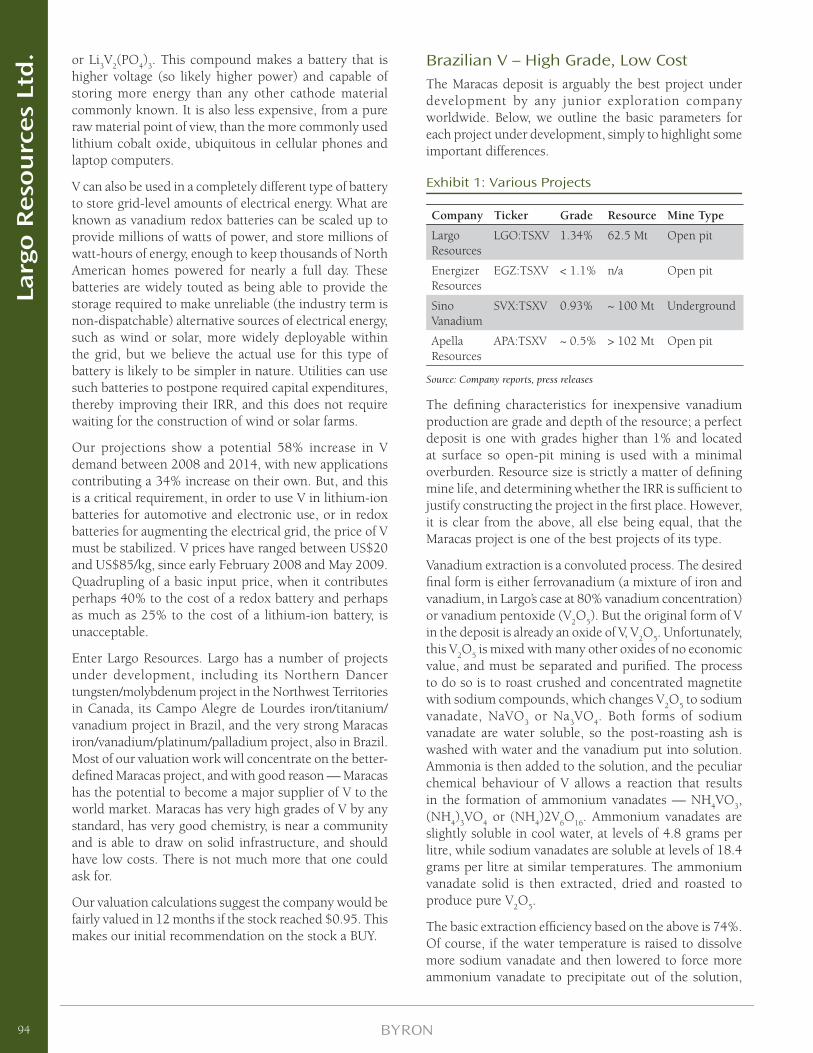
or Li3V
2(PO
4)
3. This compound makes a battery that is
higher voltage (so likely higher power) and capable of storing more energy than any other cathode material commonly known. It is also less expensive, from a pure raw material point of view, than the more commonly used lithium cobalt oxide, ubiquitous in cellular phones and laptop computers.
V can also be used in a completely different type of battery to store grid-level amounts of electrical energy. What are known as vanadium redox batteries can be scaled up to provide millions of watts of power, and store millions of watt-hours of energy, enough to keep thousands of North American homes powered for nearly a full day. These batteries are widely touted as being able to provide the storage required to make unreliable (the industry term is non-dispatchable) alternative sources of electrical energy, such as wind or solar, more widely deployable within the grid, but we believe the actual use for this type of battery is likely to be simpler in nature. Utilities can use such batteries to postpone required capital expenditures, thereby improving their IRR, and this does not require waiting for the construction of wind or solar farms.
Our projections show a potential 58% increase in V demand between 2008 and 2014, with new applications contributing a 34% increase on their own. But, and this is a critical requirement, in order to use V in lithium-ion batteries for automotive and electronic use, or in redox batteries for augmenting the electrical grid, the price of V must be stabilized. V prices have ranged between US$20 and US$85/kg, since early February 2008 and May 2009. Quadrupling of a basic input price, when it contributes perhaps 40% to the cost of a redox battery and perhaps as much as 25% to the cost of a lithium-ion battery, is unacceptable.
Enter Largo Resources. Largo has a number of projects under development, including its Northern Dancer tungsten/molybdenum project in the Northwest Territories in Canada, its Campo Alegre de Lourdes iron/titanium/vanadium project in Brazil, and the very strong Maracas iron/vanadium/platinum/palladium project, also in Brazil. Most of our valuation work will concentrate on the better-defi ned Maracas project, and with good reason — Maracas has the potential to become a major supplier of V to the world market. Maracas has very high grades of V by any standard, has very good chemistry, is near a community and is able to draw on solid infrastructure, and should have low costs. There is not much more that one could ask for.
Our valuation calculations suggest the company would be fairly valued in 12 months if the stock reached $0.95. This makes our initial recommendation on the stock a BUY.
Brazilian V – High Grade, Low CostThe Maracas deposit is arguably the best project under development by any junior exploration company worldwide. Below, we outline the basic parameters for each project under development, simply to highlight some important differences.
Exhibit 1: Various Projects
Company Ticker Grade Resource Mine Type
Largo Resources
LGO:TSXV 1.34% 62.5 Mt Open pit
Energizer Resources
EGZ:TSXV < 1.1% n/a Open pit
Sino Vanadium
SVX:TSXV 0.93% ~ 100 Mt Underground
Apella Resources
APA:TSXV ~ 0.5% > 102 Mt Open pit
Source: Company reports, press releases
The defi ning characteristics for inexpensive vanadium production are grade and depth of the resource; a perfect deposit is one with grades higher than 1% and located at surface so open-pit mining is used with a minimal overburden. Resource size is strictly a matter of defi ning mine life, and determining whether the IRR is suffi cient to justify constructing the project in the fi rst place. However, it is clear from the above, all else being equal, that the Maracas project is one of the best projects of its type.
Vanadium extraction is a convoluted process. The desired fi nal form is either ferrovanadium (a mixture of iron and vanadium, in Largo’s case at 80% vanadium concentration) or vanadium pentoxide (V
2O
5). But the original form of V
in the deposit is already an oxide of V, V2O
5. Unfortunately,
this V2O
5 is mixed with many other oxides of no economic
value, and must be separated and purifi ed. The process to do so is to roast crushed and concentrated magnetite with sodium compounds, which changes V
2O
5 to sodium
vanadate, NaVO3 or Na
3VO
4. Both forms of sodium
vanadate are water soluble, so the post-roasting ash is washed with water and the vanadium put into solution. Ammonia is then added to the solution, and the peculiar chemical behaviour of V allows a reaction that results in the formation of ammonium vanadates — NH
4VO
3,
(NH4)
3VO
4 or (NH
4)2V
6O
16. Ammonium vanadates are
slightly soluble in cool water, at levels of 4.8 grams per litre, while sodium vanadates are soluble at levels of 18.4 grams per litre at similar temperatures. The ammonium vanadate solid is then extracted, dried and roasted to produce pure V
2O
5.
The basic extraction effi ciency based on the above is 74%. Of course, if the water temperature is raised to dissolve more sodium vanadate and then lowered to force more ammonium vanadate to precipitate out of the solution,
94
Larg
o R
eso
urc
es
Ltd
.
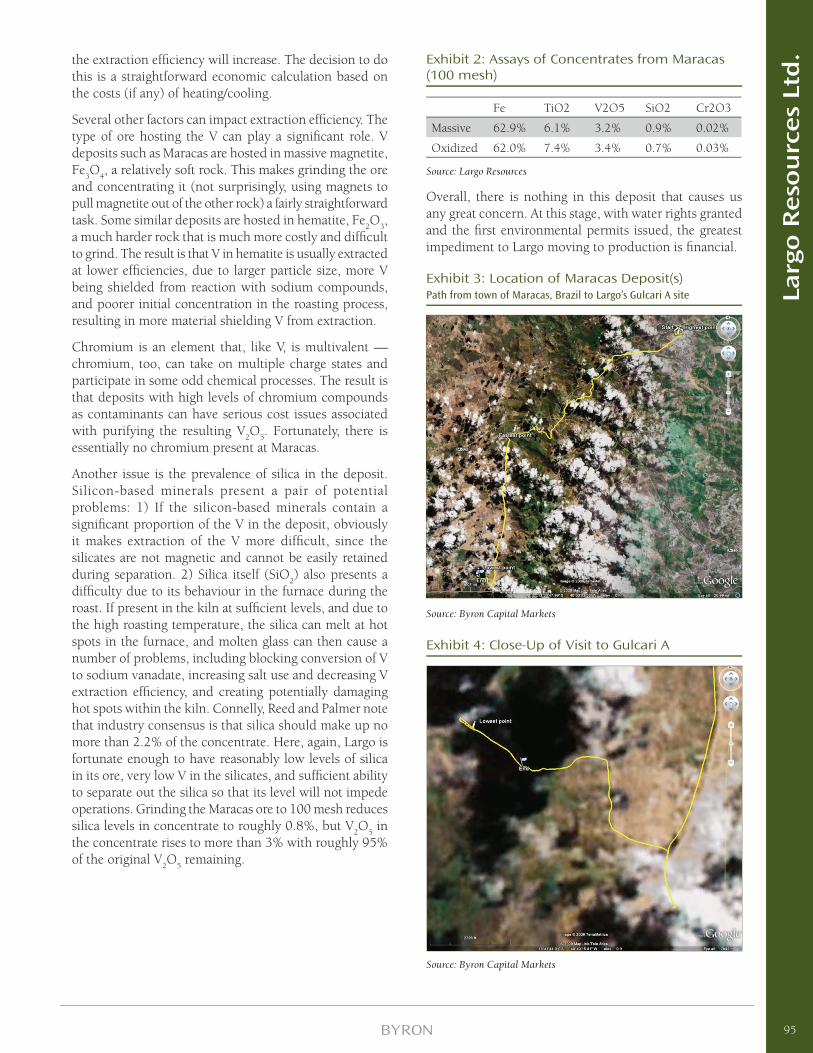
the extraction effi ciency will increase. The decision to do this is a straightforward economic calculation based on the costs (if any) of heating/cooling.
Several other factors can impact extraction effi ciency. The type of ore hosting the V can play a signifi cant role. V deposits such as Maracas are hosted in massive magnetite, Fe
3O
4, a relatively soft rock. This makes grinding the ore
and concentrating it (not surprisingly, using magnets to pull magnetite out of the other rock) a fairly straightforward task. Some similar deposits are hosted in hematite, Fe
2O
3,
a much harder rock that is much more costly and diffi cult to grind. The result is that V in hematite is usually extracted at lower effi ciencies, due to larger particle size, more V being shielded from reaction with sodium compounds, and poorer initial concentration in the roasting process, resulting in more material shielding V from extraction.
Chromium is an element that, like V, is multivalent — chromium, too, can take on multiple charge states and participate in some odd chemical processes. The result is that deposits with high levels of chromium compounds as contaminants can have serious cost issues associated with purifying the resulting V
2O
5. Fortunately, there is
essentially no chromium present at Maracas.
Another issue is the prevalence of silica in the deposit. Silicon-based minerals present a pair of potential problems: 1) If the silicon-based minerals contain a signifi cant proportion of the V in the deposit, obviously it makes extraction of the V more diffi cult, since the silicates are not magnetic and cannot be easily retained during separation. 2) Silica itself (SiO
2) also presents a
diffi culty due to its behaviour in the furnace during the roast. If present in the kiln at suffi cient levels, and due to the high roasting temperature, the silica can melt at hot spots in the furnace, and molten glass can then cause a number of problems, including blocking conversion of V to sodium vanadate, increasing salt use and decreasing V extraction effi ciency, and creating potentially damaging hot spots within the kiln. Connelly, Reed and Palmer note that industry consensus is that silica should make up no more than 2.2% of the concentrate. Here, again, Largo is fortunate enough to have reasonably low levels of silica in its ore, very low V in the silicates, and suffi cient ability to separate out the silica so that its level will not impede operations. Grinding the Maracas ore to 100 mesh reduces silica levels in concentrate to roughly 0.8%, but V
2O
5 in
the concentrate rises to more than 3% with roughly 95% of the original V
2O
5 remaining.
Exhibit 2: Assays of Concentrates from Maracas (100 mesh)
Fe TiO2 V2O5 SiO2 Cr2O3
Massive 62.9% 6.1% 3.2% 0.9% 0.02%
Oxidized 62.0% 7.4% 3.4% 0.7% 0.03%
Source: Largo Resources
Overall, there is nothing in this deposit that causes us any great concern. At this stage, with water rights granted and the fi rst environmental permits issued, the greatest impediment to Largo moving to production is fi nancial.
Exhibit 3: Location of Maracas Deposit(s)Path from town of Maracas, Brazil to Largo’s Gulcari A site
Source: Byron Capital Markets
Exhibit 4: Close-Up of Visit to Gulcari A
Source: Byron Capital Markets
95
Larg
o R
eso
urc
es
Ltd
.
Management — Strong And DeepLargo’s management team is deep, with impressive backgrounds. This team incorporates a large amount of experience in individual disciplines, but has also brought together people with a strong background of bringing mines to market.
Mark Brennan — President & CEOMr. Brennan has been the President and CEO of Largo Resources since March 2005. He is a co-founder of Brasoil do Brasil Exploracao Petrolifera S.A., a private oil and gas production/exploration company in Brazil. In addition, he was founder, principal and past-President of Linear Capital Corporation, a private merchant bank. Mr. Brennan was a founding member of Desert Sun Mining, founder and Chairman of Castle Resources Inc., and is a director of Vast Exploration, SEA NG and James Bay Resources Limited.
Deborah Battiston — CFOMs. Battiston is a CGA and holds a Bachelor of Arts in economics from the University of Guelph. She has over 25 years of senior fi nancial management experience, with extensive international public company experience. She has dealt with companies and their subsidiaries in over 14 countries, including Ecuador, Chili, Brazil, Colombia, Peru, Bolivia, Costa Rica, Ethiopia, Israel, Japan, France, U.K., Russia and the U.S. Ms. Battiston also has extensive resource sector experience, having been Chief Financial Offi cer for several TSX and TSX.V-listed companies in the resource sector over the past seven years.
Tim Mann — Vice President, EngineeringMr. Mann currently serves as Largo’s Vice President of Engineering, but he has nearly 40 years’ experience working as a mining engineer. He has owned and operated his own consultancy fi rm since 2004, but has also served with SNC Lavalin (mainly as a Project Manager, from 1997 to 2004), Goldcorp (1996 to 1997) and Placer Dome (as manager or general manager, from 1984 to 1996). Mr. Mann holds a B.Sc. degree in Mining Engineering from the University of Nottingham, is a professional engineer in Ontario, a Fellow of the CIM, and a Member of the Institution of Mining and Metallurgy in the U.K.
Andy Campbell — Vice President, ExplorationMr. Campbell joined Largo Resources in 2003 as Vice President of Exploration. His responsibilities include managing and supervising exploration programs in Ecuador, Brazil and the Yukon. He has over 33 years of experience in the mining and exploration industry throughout Canada, the United States and Latin America. Mr. Campbell has previously served for over 10 years as a geologist with LAC Minerals, and for more than two years each with Callahan Mining and Noranda. He has also operated his own consulting fi rm for more than 15 years. He holds a Bachelor of Arts degree in Geological Science from the University of California at Santa Barbara, and a
Master of Science degree in Geology from the University of Western Ontario.
Financials And ValuationWe have made several assumptions in valuing the company’s Maracas project. Management at Largo has suggested to us that the company may be able to begin initial production in late 2010, but we would suggest that early to mid-2011 is a safer assumption. We have also assumed that today’s price of V, roughly $24/kg, will slowly rise back to a level of $33/kg by 2013. It should be noted that $33/kg is at the low end of V’s historical price range, so we believe this is a conservative assumption as we have modeled rising demand in our industry report, Vanadium: The Supercharger.
Our one necessary major fi nancial assumption is that the company can fi nd debt and equity to build its mine and processing plant. We assume a full cost for the infrastructure of just over US$224 million, paid for with roughly US$93 million in debt plus an equity raise. We note that, similar to Canadian banks, Brazilian banks were largely unexposed to the investment instruments that caused problems in the U.S. industry and remain willing to provide fi nancing to Brazilian-based mining projects. We believe fi nancing for the project can be obtained.
Our production assumption is that Largo can produce between 5,000 and 7,500 tonnes of V metal per year, from high-grade ore initially, for at least the next 15 years. Even with conservative pricing assumptions, we believe the company can be extremely profi table. For example, in 2015 we assume the company can produce roughly 7,130 tonnes of V. At $33/kg, this results in revenue of nearly US$170 million. Even servicing its debt and paying costs, the company can generate signifi cant free cash fl ows — in 2015, roughly US$83 million.
We also note that, as of September 30, 2009, the company had yet to make a fi nal US$5 million payment to the property vendors to move to 90% ownership of the Maracas property. At present, the company has a 45.5% interest in the project. We believe that the fi nal payment will be made and that the company will own at least 90% of the project, and have made our valuation accordingly, but should the vendors wish to hold Largo to 45.5% ownership, this would appropriately reduce the value accruing to Largo and decrease our target price.
Using a 15% discount rate, appropriate to a project where the resource has been located and characterized and where the processing methodology is well known to the industry (a rate that may even be considered conservative by some), we determine a NPV for the Maracas project alone of US$205 million. Adjusting for current cash and debt, and dividing by the current number of shares, we believe the company should be worth roughly $0.96 per issued share.
96
Larg
o R
eso
urc
es
Ltd
.
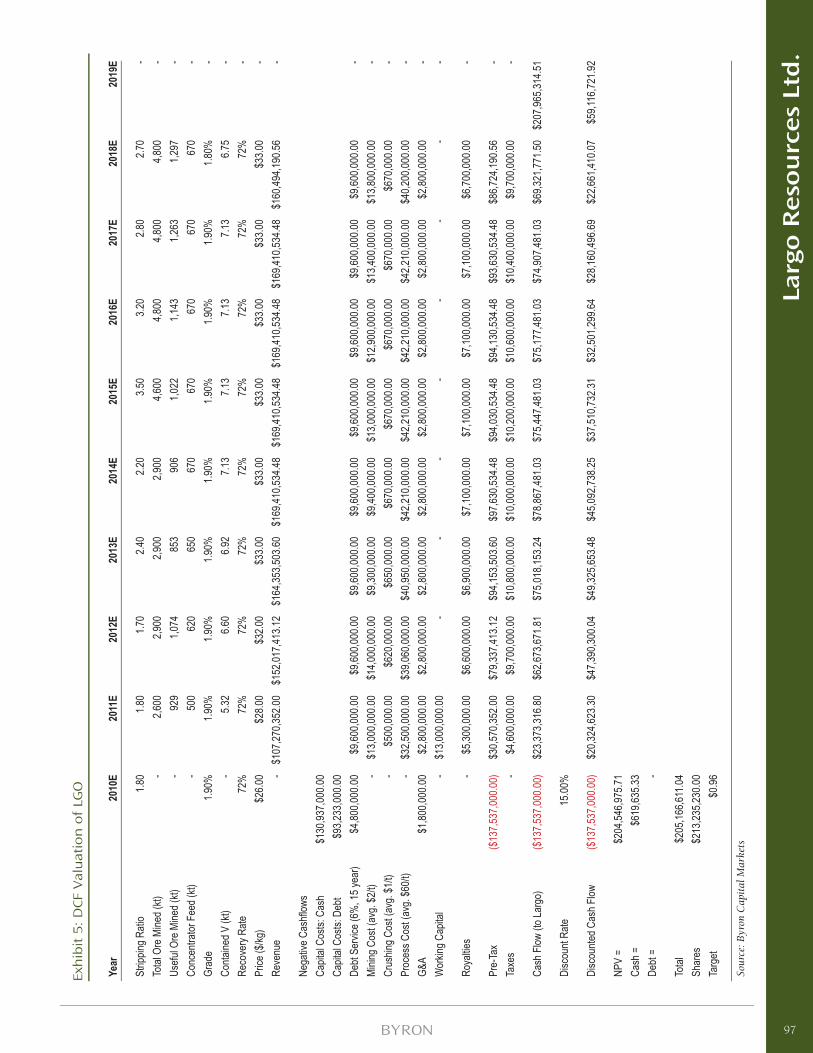
Exh
ibit
5:
DCF
Val
uat
ion
of
LGO
Year
2010
E20
11E
2012
E20
13E
2014
E20
15E
2016
E20
17E
2018
E20
19E
Strip
ping R
atio
1.80
1.
80
1.70
2.
40
2.20
3.
50
3.20
2.
80
2.70
-
Total
Ore
Mine
d (kt)
- 2,
600
2,90
0 2,
900
2,90
0 4,
600
4,80
0 4,
800
4,80
0 -
Usefu
l Ore
Mine
d (kt)
- 92
9 1,
074
853
906
1,02
2 1,
143
1,26
3 1,
297
- Co
ncen
trator
Fee
d (kt)
- 50
0 62
0 65
0 67
0 67
0 67
0 67
0 67
0 -
Grad
e1.9
0%1.9
0%1.9
0%1.9
0%1.9
0%1.9
0%1.9
0%1.9
0%1.8
0% -
Conta
ined V
(kt)
- 5.
32
6.60
6.
92
7.13
7.
13
7.13
7.
13
6.75
-
Reco
very
Rate
72%
72%
72%
72%
72%
72%
72%
72%
72%
- Pr
ice ($
/kg)
$26.0
0 $2
8.00
$32.0
0 $3
3.00
$33.0
0 $3
3.00
$33.0
0 $3
3.00
$33.0
0 -
Reve
nue
- $1
07,27
0,352
.00
$152
,017,4
13.12
$1
64,35
3,503
.60
$169
,410,5
34.48
$1
69,41
0,534
.48
$169
,410,5
34.48
$1
69,41
0,534
.48
$160
,494,1
90.56
-
Nega
tive C
ashfl
ows
Capit
al Co
sts: C
ash
$130
,937,0
00.00
Ca
pital
Costs
: Deb
t$9
3,233
,000.0
0 De
bt Se
rvice
(6%
, 15 y
ear)
$4,80
0,000
.00
$9,60
0,000
.00
$9,60
0,000
.00
$9,60
0,000
.00
$9,60
0,000
.00
$9,60
0,000
.00
$9,60
0,000
.00
$9,60
0,000
.00
$9,60
0,000
.00
- Mi
ning C
ost (
avg.
$2/t)
- $1
3,000
,000.0
0 $1
4,000
,000.0
0 $9
,300,0
00.00
$9
,400,0
00.00
$1
3,000
,000.0
0 $1
2,900
,000.0
0 $1
3,400
,000.0
0 $1
3,800
,000.0
0 -
Crus
hing C
ost (
avg.
$1/t)
- $5
00,00
0.00
$620
,000.0
0 $6
50,00
0.00
$670
,000.0
0 $6
70,00
0.00
$670
,000.0
0 $6
70,00
0.00
$670
,000.0
0 -
Proc
ess C
ost (
avg.
$60/t
) -
$32,5
00,00
0.00
$39,0
60,00
0.00
$40,9
50,00
0.00
$42,2
10,00
0.00
$42,2
10,00
0.00
$42,2
10,00
0.00
$42,2
10,00
0.00
$40,2
00,00
0.00
- G&
A $1
,800,0
00.00
$2
,800,0
00.00
$2
,800,0
00.00
$2
,800,0
00.00
$2
,800,0
00.00
$2
,800,0
00.00
$2
,800,0
00.00
$2
,800,0
00.00
$2
,800,0
00.00
-
Wor
king C
apita
l -
$13,0
00,00
0.00
- -
- -
- -
- -
Roya
lties
- $5
,300,0
00.00
$6
,600,0
00.00
$6
,900,0
00.00
$7
,100,0
00.00
$7
,100,0
00.00
$7
,100,0
00.00
$7
,100,0
00.00
$6
,700,0
00.00
-
Pre-
Tax
($13
7,537
,000.0
0)$3
0,570
,352.0
0 $7
9,337
,413.1
2 $9
4,153
,503.6
0 $9
7,630
,534.4
8 $9
4,030
,534.4
8 $9
4,130
,534.4
8 $9
3,630
,534.4
8 $8
6,724
,190.5
6 -
Taxe
s -
$4,60
0,000
.00
$9,70
0,000
.00
$10,8
00,00
0.00
$10,0
00,00
0.00
$10,2
00,00
0.00
$10,6
00,00
0.00
$10,4
00,00
0.00
$9,70
0,000
.00
-
Cash
Flow
(to L
argo
)($
137,5
37,00
0.00)
$23,3
73,31
6.80
$62,6
73,67
1.81
$75,0
18,15
3.24
$78,8
67,48
1.03
$75,4
47,48
1.03
$75,1
77,48
1.03
$74,9
07,48
1.03
$69,3
21,77
1.50
$207
,965,3
14.51
Disc
ount
Rate
15.00
%
Disc
ounte
d Cas
h Flow
($13
7,537
,000.0
0)$2
0,324
,623.3
0 $4
7,390
,300.0
4 $4
9,325
,653.4
8 $4
5,092
,738.2
5 $3
7,510
,732.3
1 $3
2,501
,299.6
4 $2
8,160
,496.6
9 $2
2,661
,410.0
7 $5
9,116
,721.9
2
NPV
= $2
04,54
6,975
.71
Cash
=
$619
,635.3
3 De
bt =
-
Total
$205
,166,6
11.04
Sh
ares
$213
,235,2
30.00
Ta
rget
$0.96
Sour
ce: B
yron
Cap
ital
Mar
kets
97
Larg
o R
eso
urc
es
Ltd
.
ConclusionVanadium demand has been on a rollercoaster for the last few years. Spiking with demand for stronger construction steels in China and elsewhere in Asia, the price of V peaked at nearly US$85/kg in early 2008. Since then, with the corresponding loss in demand resulting from the global recession, V prices have relaxed, dropping to less than US$20/kg in mid-2009.
Nothing has changed, however, in terms of the fundamental drivers of V demand. V is the best strengthening agent in steel, both from a performance and cost point of view. China and other emerging economies continue to demand large quantities of high-strength steel, and demand is already beginning to grow, according to the World Steel Association. There are no new replacements for V in this use.
There are also good reasons to believe that automotive and mobile computer lithium-ion batteries will eventually be made using cathodes made from lithium vanadium phosphate, as per our industry report, Vanadium: The Supercharger. It is quite possible that we will see a V shortage as a result, but use in batteries will only occur if a shortfall is impossible, and if V prices are stabilized. The large price swings of the past, from US$20/kg to US$80/kg, must become unlikely or battery manufacturers simply will not take the risk of signing any sort of long-term contracts.
This will only happen if new mineral-based producers of V enter the market. We believe Largo is one of the best, if not the best, option for a new, low-cost V supplier. We are establishing a target price on Largo Resources of $0.95. Based on its current trading range, this makes our initial recommendation on the company a BUY.
98
Larg
o R
eso
urc
es
Ltd
.
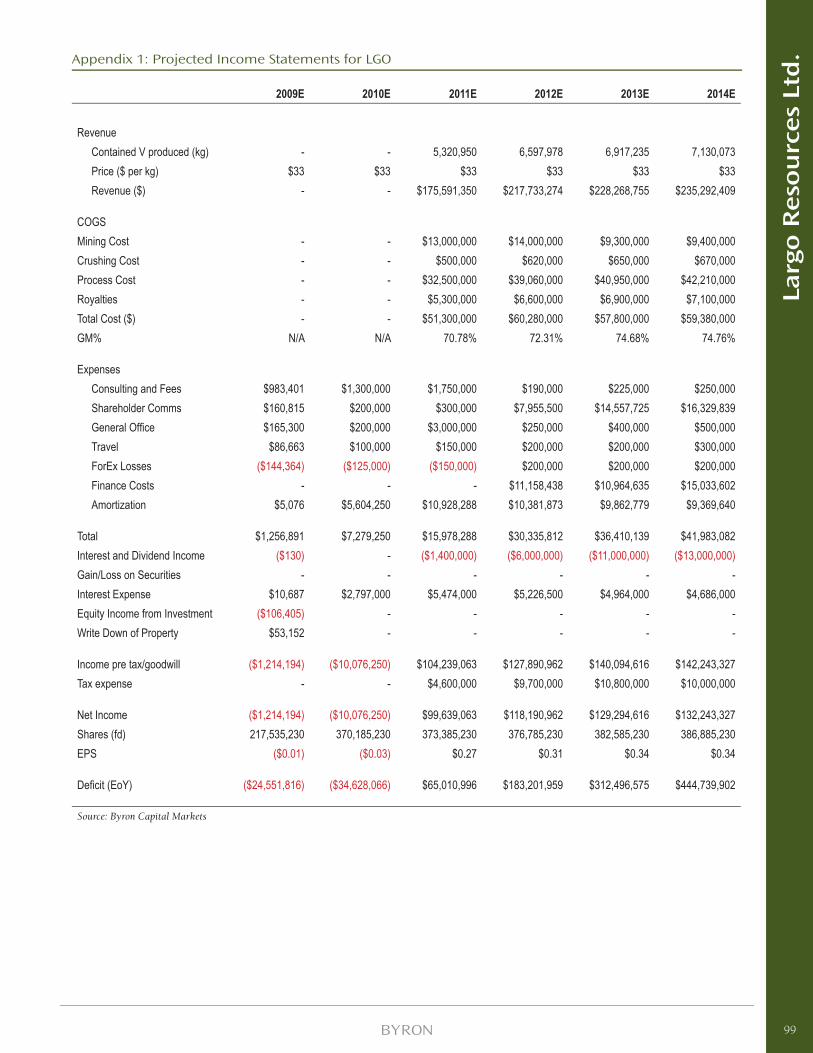
Appendix 1: Projected Income Statements for LGO
2009E 2010E 2011E 2012E 2013E 2014E
RevenueContained V produced (kg) - - 5,320,950 6,597,978 6,917,235 7,130,073 Price ($ per kg) $33 $33 $33 $33 $33 $33 Revenue ($) - - $175,591,350 $217,733,274 $228,268,755 $235,292,409
COGSMining Cost - - $13,000,000 $14,000,000 $9,300,000 $9,400,000 Crushing Cost - - $500,000 $620,000 $650,000 $670,000 Process Cost - - $32,500,000 $39,060,000 $40,950,000 $42,210,000 Royalties - - $5,300,000 $6,600,000 $6,900,000 $7,100,000 Total Cost ($) - - $51,300,000 $60,280,000 $57,800,000 $59,380,000 GM% N/A N/A 70.78% 72.31% 74.68% 74.76%
ExpensesConsulting and Fees $983,401 $1,300,000 $1,750,000 $190,000 $225,000 $250,000 Shareholder Comms $160,815 $200,000 $300,000 $7,955,500 $14,557,725 $16,329,839 General Offi ce $165,300 $200,000 $3,000,000 $250,000 $400,000 $500,000 Travel $86,663 $100,000 $150,000 $200,000 $200,000 $300,000 ForEx Losses ($144,364) ($125,000) ($150,000) $200,000 $200,000 $200,000 Finance Costs - - - $11,158,438 $10,964,635 $15,033,602 Amortization $5,076 $5,604,250 $10,928,288 $10,381,873 $9,862,779 $9,369,640
Total $1,256,891 $7,279,250 $15,978,288 $30,335,812 $36,410,139 $41,983,082 Interest and Dividend Income ($130) - ($1,400,000) ($6,000,000) ($11,000,000) ($13,000,000)Gain/Loss on Securities - - - - - - Interest Expense $10,687 $2,797,000 $5,474,000 $5,226,500 $4,964,000 $4,686,000 Equity Income from Investment ($106,405) - - - - - Write Down of Property $53,152 - - - - -
Income pre tax/goodwill ($1,214,194) ($10,076,250) $104,239,063 $127,890,962 $140,094,616 $142,243,327 Tax expense - - $4,600,000 $9,700,000 $10,800,000 $10,000,000
Net Income ($1,214,194) ($10,076,250) $99,639,063 $118,190,962 $129,294,616 $132,243,327 Shares (fd) 217,535,230 370,185,230 373,385,230 376,785,230 382,585,230 386,885,230 EPS ($0.01) ($0.03) $0.27 $0.31 $0.34 $0.34
Defi cit (EoY) ($24,551,816) ($34,628,066) $65,010,996 $183,201,959 $312,496,575 $444,739,902
Source: Byron Capital Markets
99
Larg
o R
eso
urc
es
Ltd
.
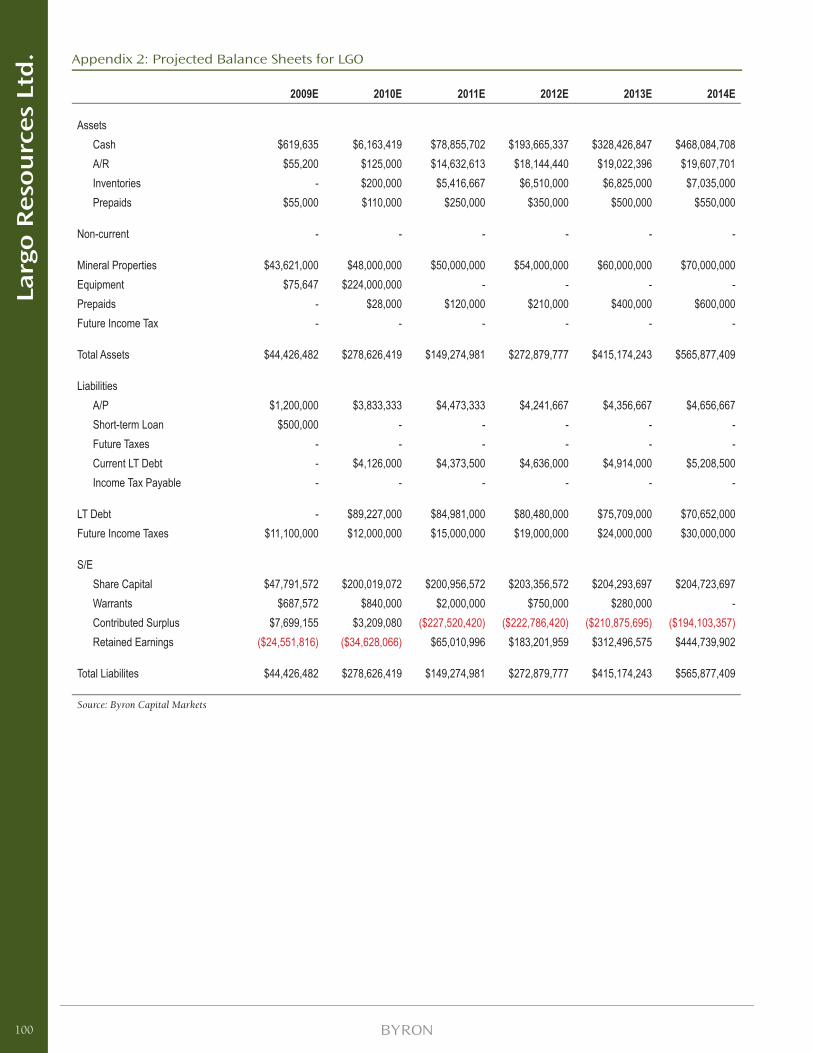
Appendix 2: Projected Balance Sheets for LGO
2009E 2010E 2011E 2012E 2013E 2014E
AssetsCash $619,635 $6,163,419 $78,855,702 $193,665,337 $328,426,847 $468,084,708 A/R $55,200 $125,000 $14,632,613 $18,144,440 $19,022,396 $19,607,701 Inventories - $200,000 $5,416,667 $6,510,000 $6,825,000 $7,035,000 Prepaids $55,000 $110,000 $250,000 $350,000 $500,000 $550,000
Non-current - - - - - -
Mineral Properties $43,621,000 $48,000,000 $50,000,000 $54,000,000 $60,000,000 $70,000,000 Equipment $75,647 $224,000,000 - - - - Prepaids - $28,000 $120,000 $210,000 $400,000 $600,000 Future Income Tax - - - - - -
Total Assets $44,426,482 $278,626,419 $149,274,981 $272,879,777 $415,174,243 $565,877,409
LiabilitiesA/P $1,200,000 $3,833,333 $4,473,333 $4,241,667 $4,356,667 $4,656,667 Short-term Loan $500,000 - - - - - Future Taxes - - - - - - Current LT Debt - $4,126,000 $4,373,500 $4,636,000 $4,914,000 $5,208,500 Income Tax Payable - - - - - -
LT Debt - $89,227,000 $84,981,000 $80,480,000 $75,709,000 $70,652,000 Future Income Taxes $11,100,000 $12,000,000 $15,000,000 $19,000,000 $24,000,000 $30,000,000
S/EShare Capital $47,791,572 $200,019,072 $200,956,572 $203,356,572 $204,293,697 $204,723,697 Warrants $687,572 $840,000 $2,000,000 $750,000 $280,000 - Contributed Surplus $7,699,155 $3,209,080 ($227,520,420) ($222,786,420) ($210,875,695) ($194,103,357)Retained Earnings ($24,551,816) ($34,628,066) $65,010,996 $183,201,959 $312,496,575 $444,739,902
Total Liabilites $44,426,482 $278,626,419 $149,274,981 $272,879,777 $415,174,243 $565,877,409
Source: Byron Capital Markets
100
Larg
o R
eso
urc
es
Ltd
.

Appendix 3: Projected Cash Flow Statements for LGO
Year 2009E 2010E 2011E 2012E 2013E 2014E
Op Inc/Loss ($1,214,194) ($10,076,250) $99,639,063 $118,190,962 $129,294,616 $132,243,327 Less Non-Cash
Amortization $5,076 $200,000 $690,000 $7,955,500 $14,557,725 $16,329,839 Stock-Based Comp $307,091 $500,000 $750,000 $800,000 $800,000 $800,000 Equity Income from Inv ($106,405) - - - - - Write Down of Prop $53,152 - - - - -
Non-Cash Working CapitalA/R $87,843 ($69,800) ($14,507,613) ($3,511,827) ($877,957) ($585,305)Inventories - ($200,000) ($5,216,667) ($1,093,333) ($315,000) ($210,000)Prepaids $8,522 ($55,000) ($140,000) ($100,000) ($150,000) ($50,000)A/P ($1,019,000) $2,633,333 $640,000 ($231,667) $115,000 $300,000
FinancingShort-term Loans ($140,000) $500,000 ($500,000) - - - Net Shares Issued $5,250,569 $152,000,000 - - - - Options - $227,500 $937,500 $2,400,000 $937,125 $430,000 Warrants - - - - - - Long-term Debt - $88,433,000 ($9,600,000) ($9,600,000) ($9,600,000) ($9,600,000)
InvestmentProperty Exploration ($1,636,953) ($4,379,000) ($2,000,000) ($4,000,000) ($6,000,000) ($10,000,000)Capital Equipment - ($224,170,000) - - - - Property Interests ($1,700,000) - - - - -
Total ($104,300) $5,543,783 $72,692,283 $114,809,635 $134,761,509 $139,657,862 Cash, Start $723,935 $619,635 $6,163,419 $78,855,702 $193,665,337 $328,426,847 Cash, End $619,635 $6,163,419 $78,855,702 $193,665,337 $328,426,847 $468,084,708
Shares $217,535,230 $370,185,230 $373,385,230 $376,785,230 $382,585,230 $386,885,230 Cash Flow per Share ($0.00) $0.01 $0.19 $0.30 $0.35 $0.36
Source: Byron Capital Markets
101
Larg
o R
eso
urc
es
Ltd
.
IMPORTANT DISCLOSURES
Analyst’s Certifi cation
All of the views expressed in this report accurately refl ect the personal views of the responsible analyst(s) about any and all of the subject securities or issuers. No part of the compensation of the responsible analyst(s) named herein is, or will be, directly or indirectly, related to the specifi c recommendations or views expressed by the responsible analyst(s) in this report. The particulars contained herein were obtained from sources which we believe to be reliable but are not guaranteed by us and may be incomplete.
Byron Capital Markets (“BCM”) is a division of Byron Securities Limited which is a Member of IIROC and CIPF. BCM compensates its research analysts from a variety of sources. The research department is a cost centre and is funded by the business activities of BCM including institutional equity sales and trading, retail sales and corporate and investment banking. Since the revenues from these businesses vary the funds for research compensation vary. No one business line has greater infl uence than any other for research analyst compensation.
Dissemination of Research
BCM endeavours to make all reasonable efforts to provide research simultaneously to all eligible clients. BCM equity research is distributed electronically via email and is posted on our proprietary websites to ensure eligible clients receive coverage initiations and ratings changes, targets and opinions in a timely manner. Additional distribution may be done by the sales personnel via email, fax or regular mail. Clients may also receive our research via a third party.
Company Specifi c Disclosures:
1. BCM has managed or co-managed a secondary offering of equity or equity-related securities for Largo Resources in the past 12 months, the closing date of which was at least 10 calendar days prior to the issuance of this report.
2. BCM has received compensation for investment banking services from Largo Resources during the preceding 12 months.
3. The research analyst(s) and/or associate(s) who prepared this research report have viewed the material operations of Largo Resources.
Investment Rating Criteria
BUY The security represents attractive value and is expected to appreciate signifi cantly from the current price over the next 12-18 month time horizon.
SPECULATIVE BUY The security is considered a BUY but in the analyst’s opinion possesses certain operational and/or fi nancial risks that may be higher than average.
HOLD The security represents fair value and no material appreciation is expected over the next 12-18 month time horizon.
SELL The security represents poor value and is expected to depreciate over the next 12-18 month time horizon.
Other Disclosures
This report has been approved by BCM which takes responsibility for this report and its dissemination in Canada. Canadian clients wishing to effect transactions in any security discussed should do so through a qualifi ed salesperson of BCM.
Informational Reports
From time to time BCM will issue reports that are for information purposes only and will not include investment ratings. These reports will be clearly labelled accordingly.
102
Larg
o R
eso
urc
es
Ltd
.
The following section has been prepared by:Gabriela Casasnovas, Associate
Elisa Chio, Associate
VANADIUMFor the company snapshots:
1. Currency used is native to the exchange.
2. Unless otherwise stated and except for per share data, all values are listed in millions.
3. Abbreviations used:
a. N/A – Not available
b. WI – Working interest
4. JORC is the acronym for the Australasian Joint Ore Reserves Committee who has set the standards for the reporting of mineral resources and ore reserves. From a mineral resource point of view, this Australasian standard is considered comparable to the Canadian Securities Administrators NI 43-101 with the distinction that NI 43-101 is a securities disclosure whereas JORC is a mineral disclosure.
a. For further information on JORC, please visit http://www.jorc.org/.
5. Ownership refers to working interest in the project.
6. All fi nancial information have been sourced from Capital IQ, https://www.capitaliq.com/.
103
VA
NA
DIU
M
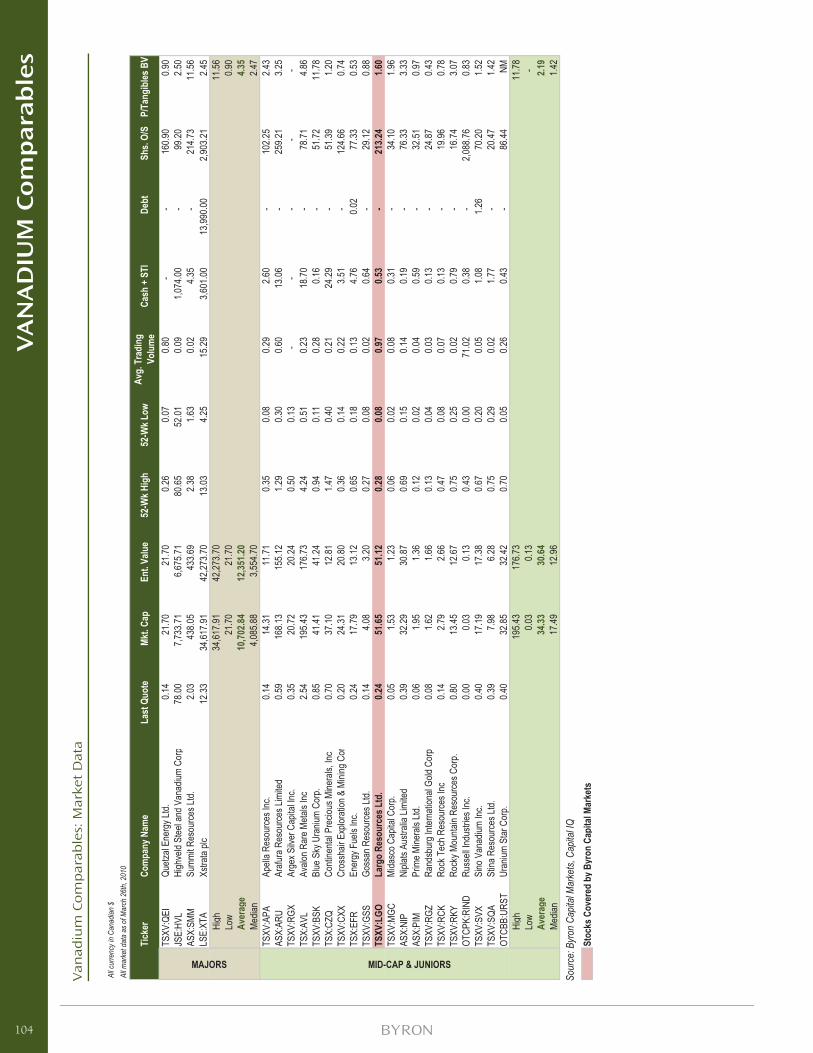
Van
adiu
m C
om
par
able
s: M
arke
t D
ata
Sour
ce: B
yron
Cap
ital M
arke
ts, C
apita
l IQ
104
VA
NA
DIU
M C
om
para
ble
s
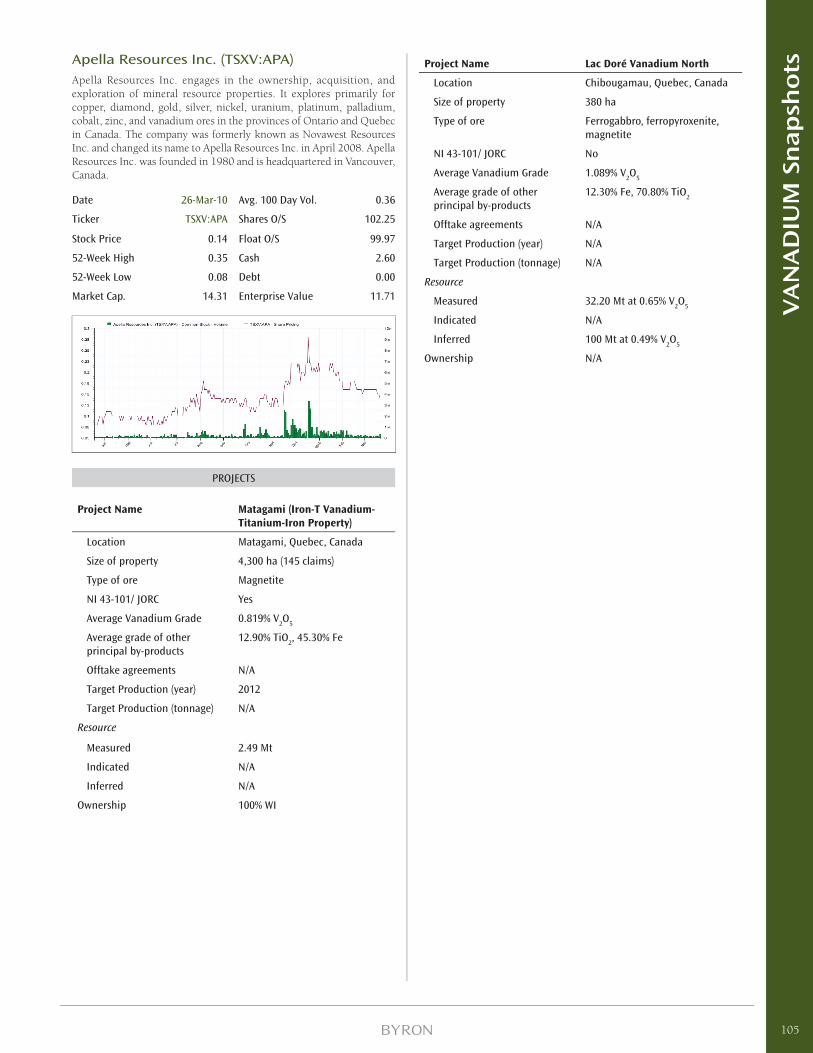
Apella Resources Inc. (TSXV:APA)Apella Resources Inc. engages in the ownership, acquisition, and exploration of mineral resource properties. It explores primarily for copper, diamond, gold, silver, nickel, uranium, platinum, palladium, cobalt, zinc, and vanadium ores in the provinces of Ontario and Quebec in Canada. The company was formerly known as Novawest Resources Inc. and changed its name to Apella Resources Inc. in April 2008. Apella Resources Inc. was founded in 1980 and is headquartered in Vancouver, Canada.
Date 26-Mar-10 Avg. 100 Day Vol. 0.36
Ticker TSXV:APA Shares O/S 102.25
Stock Price 0.14 Float O/S 99.97
52-Week High 0.35 Cash 2.60
52-Week Low 0.08 Debt 0.00
Market Cap. 14.31 Enterprise Value 11.71
PROJECTS
Project Name Matagami (Iron-T Vanadium-Titanium-Iron Property)
Location Matagami, Quebec, Canada
Size of property 4,300 ha (145 claims)
Type of ore Magnetite
NI 43-101/ JORC Yes
Average Vanadium Grade 0.819% V2O
5
Average grade of other principal by-products
12.90% TiO2, 45.30% Fe
Offtake agreements N/A
Target Production (year) 2012
Target Production (tonnage) N/A
Resource
Measured 2.49 Mt
Indicated N/A
Inferred N/A
Ownership 100% WI
Project Name Lac Doré Vanadium North
Location Chibougamau, Quebec, Canada
Size of property 380 ha
Type of ore Ferrogabbro, ferropyroxenite, magnetite
NI 43-101/ JORC No
Average Vanadium Grade 1.089% V2O
5
Average grade of other principal by-products
12.30% Fe, 70.80% TiO2
Offtake agreements N/A
Target Production (year) N/A
Target Production (tonnage) N/A
Resource
Measured 32.20 Mt at 0.65% V2O
5
Indicated N/A
Inferred 100 Mt at 0.49% V2O
5
Ownership N/A
105
VA
NA
DIU
M S
nap
sho
ts
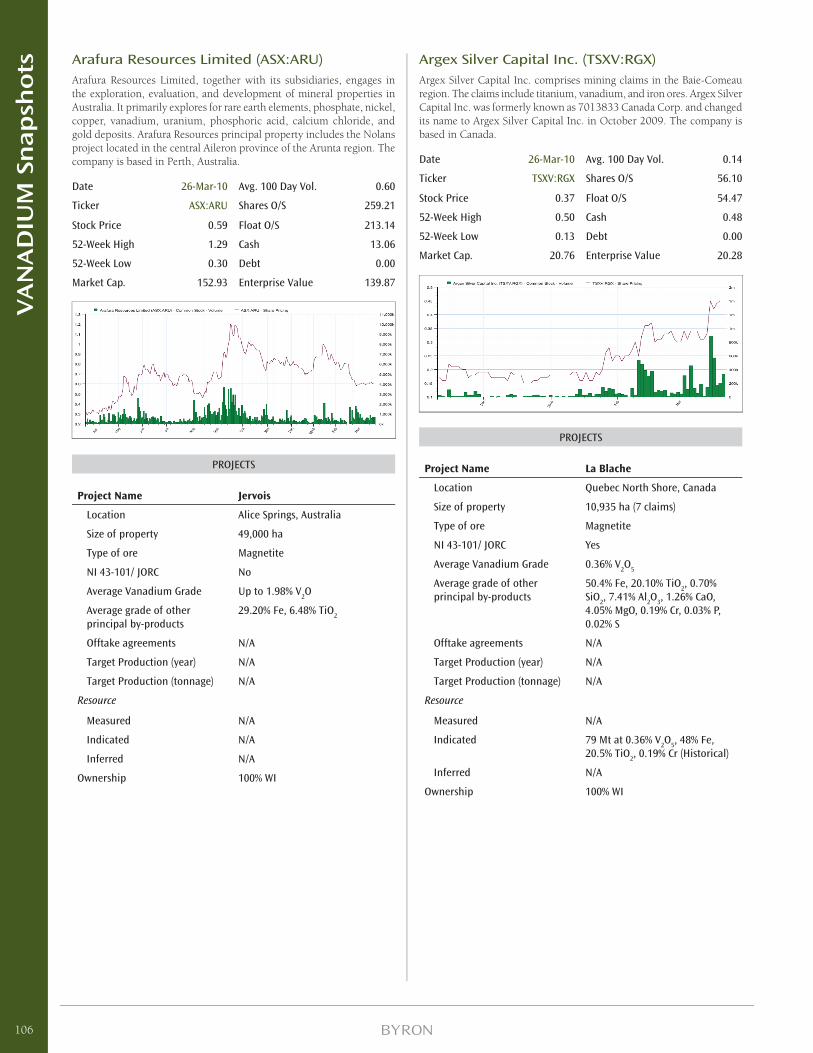
Arafura Resources Limited (ASX:ARU)Arafura Resources Limited, together with its subsidiaries, engages in the exploration, evaluation, and development of mineral properties in Australia. It primarily explores for rare earth elements, phosphate, nickel, copper, vanadium, uranium, phosphoric acid, calcium chloride, and gold deposits. Arafura Resources principal property includes the Nolans project located in the central Aileron province of the Arunta region. The company is based in Perth, Australia.
Date 26-Mar-10 Avg. 100 Day Vol. 0.60
Ticker ASX:ARU Shares O/S 259.21
Stock Price 0.59 Float O/S 213.14
52-Week High 1.29 Cash 13.06
52-Week Low 0.30 Debt 0.00
Market Cap. 152.93 Enterprise Value 139.87
PROJECTS
Project Name Jervois
Location Alice Springs, Australia
Size of property 49,000 ha
Type of ore Magnetite
NI 43-101/ JORC No
Average Vanadium Grade Up to 1.98% V2O
Average grade of other principal by-products
29.20% Fe, 6.48% TiO2
Offtake agreements N/A
Target Production (year) N/A
Target Production (tonnage) N/A
Resource
Measured N/A
Indicated N/A
Inferred N/A
Ownership 100% WI
Argex Silver Capital Inc. (TSXV:RGX)Argex Silver Capital Inc. comprises mining claims in the Baie-Comeau region. The claims include titanium, vanadium, and iron ores. Argex Silver Capital Inc. was formerly known as 7013833 Canada Corp. and changed its name to Argex Silver Capital Inc. in October 2009. The company is based in Canada.
Date 26-Mar-10 Avg. 100 Day Vol. 0.14
Ticker TSXV:RGX Shares O/S 56.10
Stock Price 0.37 Float O/S 54.47
52-Week High 0.50 Cash 0.48
52-Week Low 0.13 Debt 0.00
Market Cap. 20.76 Enterprise Value 20.28
PROJECTS
Project Name La Blache
Location Quebec North Shore, Canada
Size of property 10,935 ha (7 claims)
Type of ore Magnetite
NI 43-101/ JORC Yes
Average Vanadium Grade 0.36% V2O
5
Average grade of other principal by-products
50.4% Fe, 20.10% TiO2, 0.70%
SiO2, 7.41% Al
2O
3, 1.26% CaO,
4.05% MgO, 0.19% Cr, 0.03% P, 0.02% S
Offtake agreements N/A
Target Production (year) N/A
Target Production (tonnage) N/A
Resource
Measured N/A
Indicated 79 Mt at 0.36% V2O
5, 48% Fe,
20.5% TiO2, 0.19% Cr (Historical)
Inferred N/A
Ownership 100% WI
106
VA
NA
DIU
M S
nap
sho
ts
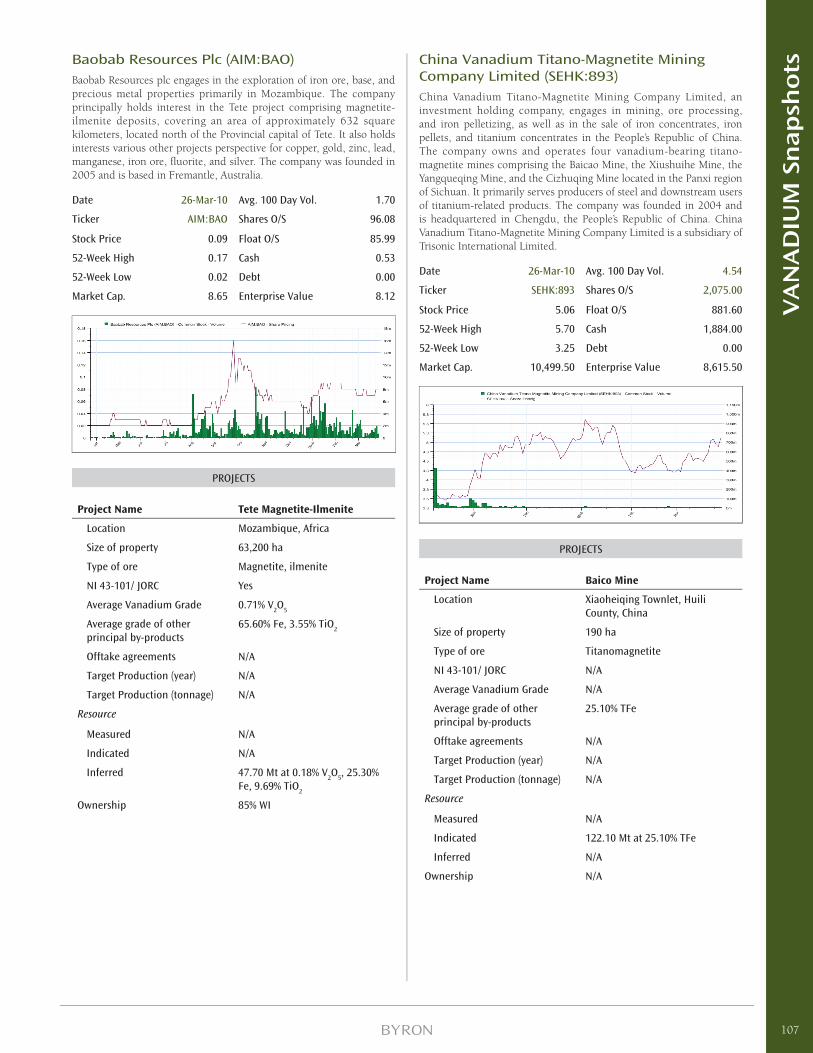
Baobab Resources Plc (AIM:BAO)Baobab Resources plc engages in the exploration of iron ore, base, and precious metal properties primarily in Mozambique. The company principally holds interest in the Tete project comprising magnetite-ilmenite deposits, covering an area of approximately 632 square kilometers, located north of the Provincial capital of Tete. It also holds interests various other projects perspective for copper, gold, zinc, lead, manganese, iron ore, fl uorite, and silver. The company was founded in 2005 and is based in Fremantle, Australia.
Date 26-Mar-10 Avg. 100 Day Vol. 1.70
Ticker AIM:BAO Shares O/S 96.08
Stock Price 0.09 Float O/S 85.99
52-Week High 0.17 Cash 0.53
52-Week Low 0.02 Debt 0.00
Market Cap. 8.65 Enterprise Value 8.12
PROJECTS
Project Name Tete Magnetite-Ilmenite
Location Mozambique, Africa
Size of property 63,200 ha
Type of ore Magnetite, ilmenite
NI 43-101/ JORC Yes
Average Vanadium Grade 0.71% V2O
5
Average grade of other principal by-products
65.60% Fe, 3.55% TiO2
Offtake agreements N/A
Target Production (year) N/A
Target Production (tonnage) N/A
Resource
Measured N/A
Indicated N/A
Inferred 47.70 Mt at 0.18% V2O
5, 25.30%
Fe, 9.69% TiO2
Ownership 85% WI
China Vanadium Titano-Magnetite Mining Company Limited (SEHK:893)China Vanadium Titano-Magnetite Mining Company Limited, an investment holding company, engages in mining, ore processing, and iron pelletizing, as well as in the sale of iron concentrates, iron pellets, and titanium concentrates in the People’s Republic of China. The company owns and operates four vanadium-bearing titano-magnetite mines comprising the Baicao Mine, the Xiushuihe Mine, the Yangqueqing Mine, and the Cizhuqing Mine located in the Panxi region of Sichuan. It primarily serves producers of steel and downstream users of titanium-related products. The company was founded in 2004 and is headquartered in Chengdu, the People’s Republic of China. China Vanadium Titano-Magnetite Mining Company Limited is a subsidiary of Trisonic International Limited.
Date 26-Mar-10 Avg. 100 Day Vol. 4.54
Ticker SEHK:893 Shares O/S 2,075.00
Stock Price 5.06 Float O/S 881.60
52-Week High 5.70 Cash 1,884.00
52-Week Low 3.25 Debt 0.00
Market Cap. 10,499.50 Enterprise Value 8,615.50
PROJECTS
Project Name Baico Mine
Location Xiaoheiqing Townlet, Huili County, China
Size of property 190 ha
Type of ore Titanomagnetite
NI 43-101/ JORC N/A
Average Vanadium Grade N/A
Average grade of other principal by-products
25.10% TFe
Offtake agreements N/A
Target Production (year) N/A
Target Production (tonnage) N/A
Resource
Measured N/A
Indicated 122.10 Mt at 25.10% TFe
Inferred N/A
Ownership N/A
107
VA
NA
DIU
M S
nap
sho
ts
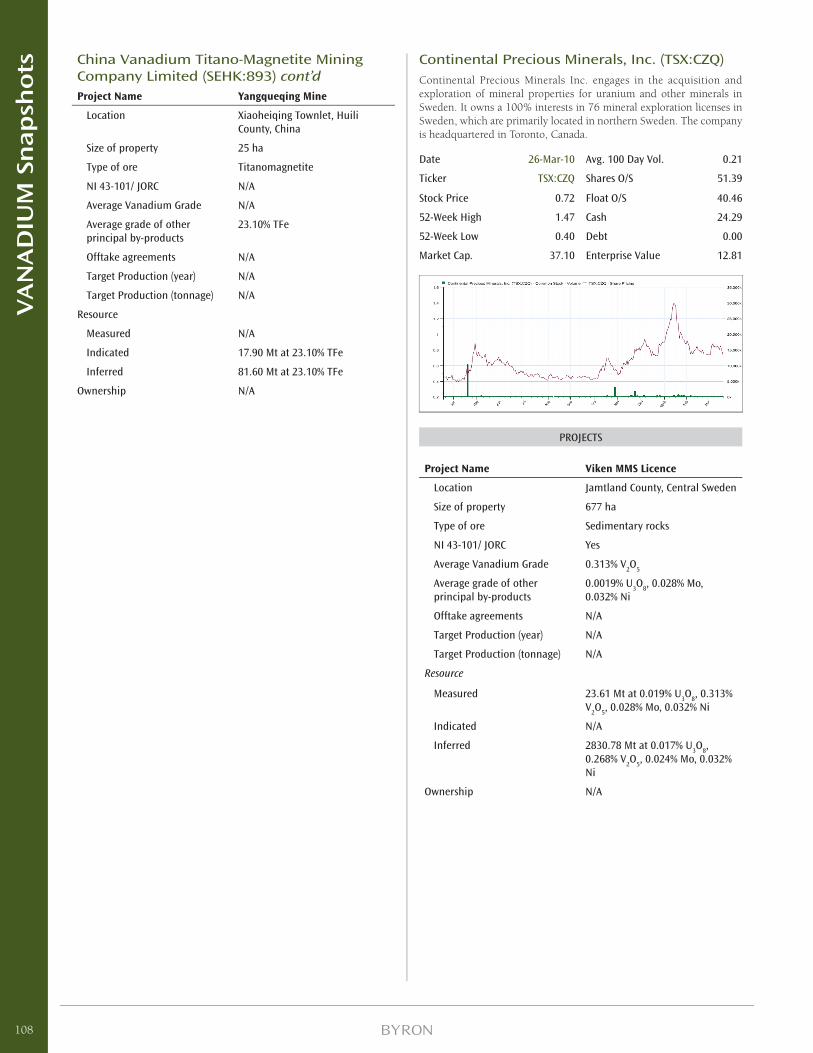
China Vanadium Titano-Magnetite Mining Company Limited (SEHK:893) cont’dProject Name Yangqueqing Mine
Location Xiaoheiqing Townlet, Huili County, China
Size of property 25 ha
Type of ore Titanomagnetite
NI 43-101/ JORC N/A
Average Vanadium Grade N/A
Average grade of other principal by-products
23.10% TFe
Offtake agreements N/A
Target Production (year) N/A
Target Production (tonnage) N/A
Resource
Measured N/A
Indicated 17.90 Mt at 23.10% TFe
Inferred 81.60 Mt at 23.10% TFe
Ownership N/A
Continental Precious Minerals, Inc. (TSX:CZQ)Continental Precious Minerals Inc. engages in the acquisition and exploration of mineral properties for uranium and other minerals in Sweden. It owns a 100% interests in 76 mineral exploration licenses in Sweden, which are primarily located in northern Sweden. The company is headquartered in Toronto, Canada.
Date 26-Mar-10 Avg. 100 Day Vol. 0.21
Ticker TSX:CZQ Shares O/S 51.39
Stock Price 0.72 Float O/S 40.46
52-Week High 1.47 Cash 24.29
52-Week Low 0.40 Debt 0.00
Market Cap. 37.10 Enterprise Value 12.81
PROJECTS
Project Name Viken MMS Licence
Location Jamtland County, Central Sweden
Size of property 677 ha
Type of ore Sedimentary rocks
NI 43-101/ JORC Yes
Average Vanadium Grade 0.313% V2O
5
Average grade of other principal by-products
0.0019% U3O
8, 0.028% Mo,
0.032% Ni
Offtake agreements N/A
Target Production (year) N/A
Target Production (tonnage) N/A
Resource
Measured 23.61 Mt at 0.019% U3O
8, 0.313%
V2O
5, 0.028% Mo, 0.032% Ni
Indicated N/A
Inferred 2830.78 Mt at 0.017% U3O
8,
0.268% V2O
5, 0.024% Mo, 0.032%
Ni
Ownership N/A
108
VA
NA
DIU
M S
nap
sho
ts
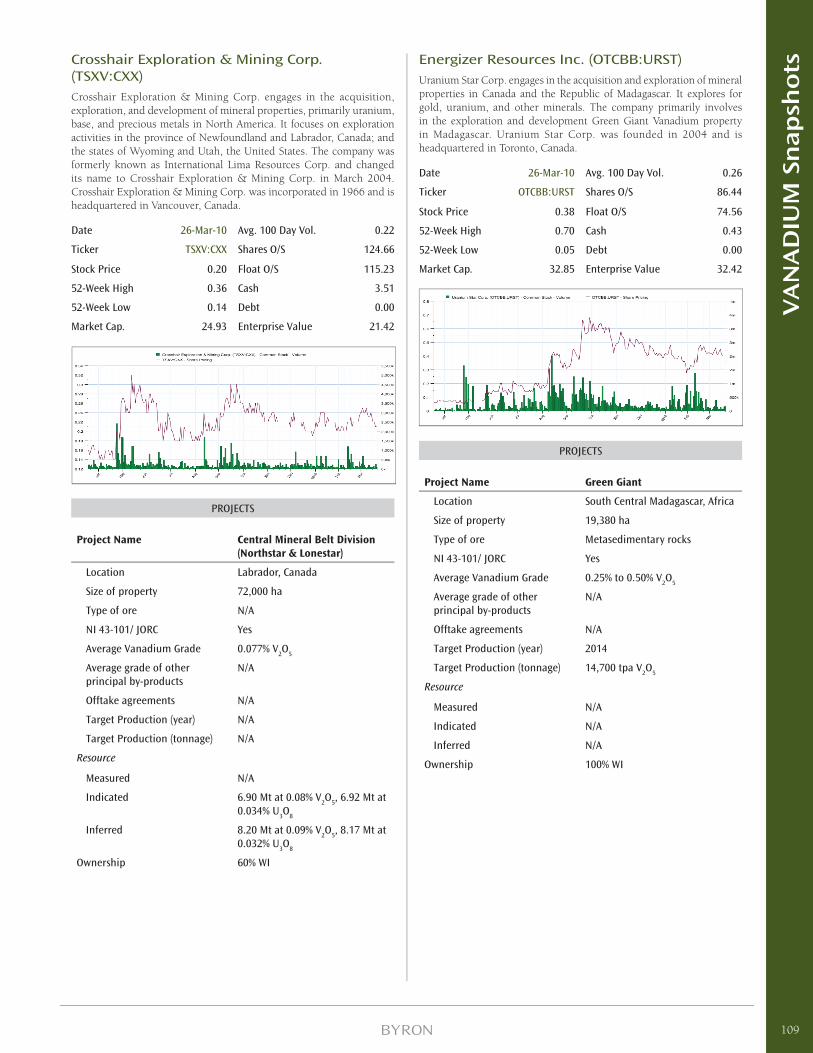
Crosshair Exploration & Mining Corp. (TSXV:CXX)Crosshair Exploration & Mining Corp. engages in the acquisition, exploration, and development of mineral properties, primarily uranium, base, and precious metals in North America. It focuses on exploration activities in the province of Newfoundland and Labrador, Canada; and the states of Wyoming and Utah, the United States. The company was formerly known as International Lima Resources Corp. and changed its name to Crosshair Exploration & Mining Corp. in March 2004. Crosshair Exploration & Mining Corp. was incorporated in 1966 and is headquartered in Vancouver, Canada.
Date 26-Mar-10 Avg. 100 Day Vol. 0.22
Ticker TSXV:CXX Shares O/S 124.66
Stock Price 0.20 Float O/S 115.23
52-Week High 0.36 Cash 3.51
52-Week Low 0.14 Debt 0.00
Market Cap. 24.93 Enterprise Value 21.42
PROJECTS
Project Name Central Mineral Belt Division (Northstar & Lonestar)
Location Labrador, Canada
Size of property 72,000 ha
Type of ore N/A
NI 43-101/ JORC Yes
Average Vanadium Grade 0.077% V2O
5
Average grade of other principal by-products
N/A
Offtake agreements N/A
Target Production (year) N/A
Target Production (tonnage) N/A
Resource
Measured N/A
Indicated 6.90 Mt at 0.08% V2O
5, 6.92 Mt at
0.034% U3O
8
Inferred 8.20 Mt at 0.09% V2O
5, 8.17 Mt at
0.032% U3O
8
Ownership 60% WI
Energizer Resources Inc. (OTCBB:URST)Uranium Star Corp. engages in the acquisition and exploration of mineral properties in Canada and the Republic of Madagascar. It explores for gold, uranium, and other minerals. The company primarily involves in the exploration and development Green Giant Vanadium property in Madagascar. Uranium Star Corp. was founded in 2004 and is headquartered in Toronto, Canada.
Date 26-Mar-10 Avg. 100 Day Vol. 0.26
Ticker OTCBB:URST Shares O/S 86.44
Stock Price 0.38 Float O/S 74.56
52-Week High 0.70 Cash 0.43
52-Week Low 0.05 Debt 0.00
Market Cap. 32.85 Enterprise Value 32.42
PROJECTS
Project Name Green Giant
Location South Central Madagascar, Africa
Size of property 19,380 ha
Type of ore Metasedimentary rocks
NI 43-101/ JORC Yes
Average Vanadium Grade 0.25% to 0.50% V2O
5
Average grade of other principal by-products
N/A
Offtake agreements N/A
Target Production (year) 2014
Target Production (tonnage) 14,700 tpa V2O
5
Resource
Measured N/A
Indicated N/A
Inferred N/A
Ownership 100% WI
109
VA
NA
DIU
M S
nap
sho
ts
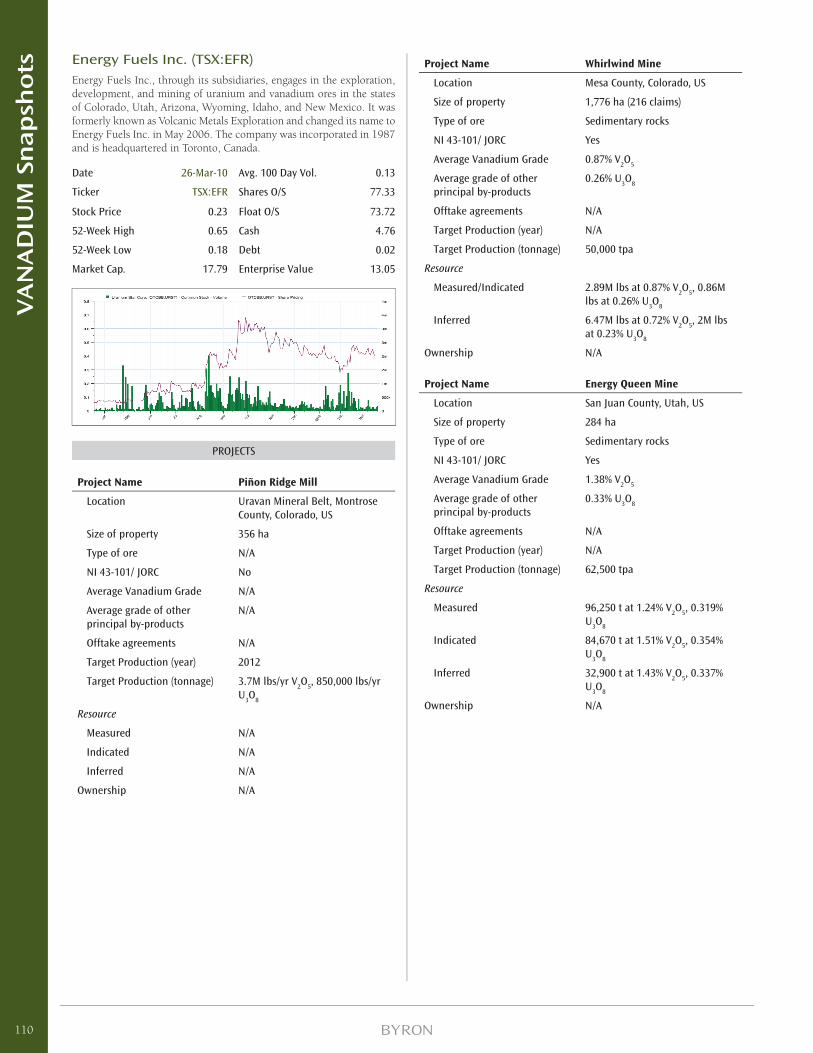
Energy Fuels Inc. (TSX:EFR)Energy Fuels Inc., through its subsidiaries, engages in the exploration, development, and mining of uranium and vanadium ores in the states of Colorado, Utah, Arizona, Wyoming, Idaho, and New Mexico. It was formerly known as Volcanic Metals Exploration and changed its name to Energy Fuels Inc. in May 2006. The company was incorporated in 1987 and is headquartered in Toronto, Canada.
Date 26-Mar-10 Avg. 100 Day Vol. 0.13
Ticker TSX:EFR Shares O/S 77.33
Stock Price 0.23 Float O/S 73.72
52-Week High 0.65 Cash 4.76
52-Week Low 0.18 Debt 0.02
Market Cap. 17.79 Enterprise Value 13.05
PROJECTS
Project Name Piñon Ridge Mill
Location Uravan Mineral Belt, Montrose County, Colorado, US
Size of property 356 ha
Type of ore N/A
NI 43-101/ JORC No
Average Vanadium Grade N/A
Average grade of other principal by-products
N/A
Offtake agreements N/A
Target Production (year) 2012
Target Production (tonnage) 3.7M lbs/yr V2O
5, 850,000 lbs/yr
U3O
8
Resource
Measured N/A
Indicated N/A
Inferred N/A
Ownership N/A
Project Name Whirlwind Mine
Location Mesa County, Colorado, US
Size of property 1,776 ha (216 claims)
Type of ore Sedimentary rocks
NI 43-101/ JORC Yes
Average Vanadium Grade 0.87% V2O
5
Average grade of other principal by-products
0.26% U3O
8
Offtake agreements N/A
Target Production (year) N/A
Target Production (tonnage) 50,000 tpa
Resource
Measured/Indicated 2.89M lbs at 0.87% V2O
5, 0.86M
lbs at 0.26% U3O
8
Inferred 6.47M lbs at 0.72% V2O
5, 2M lbs
at 0.23% U3O
8
Ownership N/A
Project Name Energy Queen Mine
Location San Juan County, Utah, US
Size of property 284 ha
Type of ore Sedimentary rocks
NI 43-101/ JORC Yes
Average Vanadium Grade 1.38% V2O
5
Average grade of other principal by-products
0.33% U3O
8
Offtake agreements N/A
Target Production (year) N/A
Target Production (tonnage) 62,500 tpa
Resource
Measured 96,250 t at 1.24% V2O
5, 0.319%
U3O
8
Indicated 84,670 t at 1.51% V2O
5, 0.354%
U3O
8
Inferred 32,900 t at 1.43% V2O
5, 0.337%
U3O
8
Ownership N/A
110
VA
NA
DIU
M S
nap
sho
ts
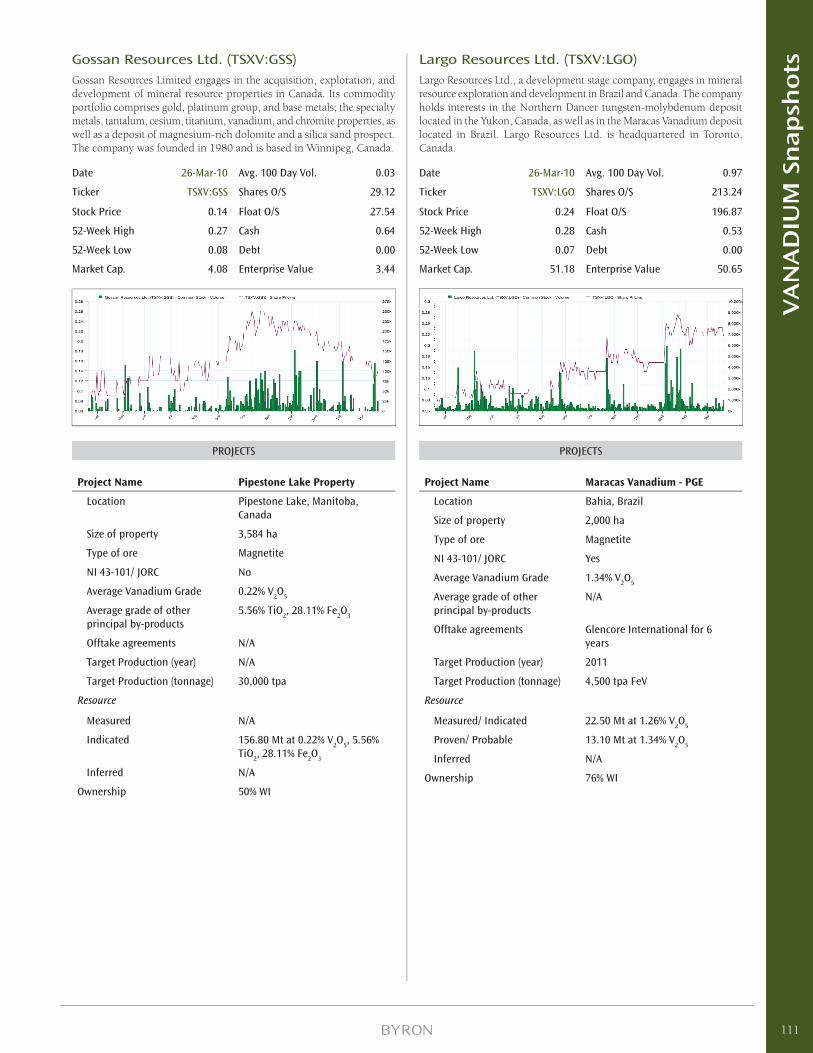
Gossan Resources Ltd. (TSXV:GSS)Gossan Resources Limited engages in the acquisition, exploration, and development of mineral resource properties in Canada. Its commodity portfolio comprises gold, platinum group, and base metals; the specialty metals, tantalum, cesium, titanium, vanadium, and chromite properties, as well as a deposit of magnesium-rich dolomite and a silica sand prospect. The company was founded in 1980 and is based in Winnipeg, Canada.
Date 26-Mar-10 Avg. 100 Day Vol. 0.03
Ticker TSXV:GSS Shares O/S 29.12
Stock Price 0.14 Float O/S 27.54
52-Week High 0.27 Cash 0.64
52-Week Low 0.08 Debt 0.00
Market Cap. 4.08 Enterprise Value 3.44
PROJECTS
Project Name Pipestone Lake Property
Location Pipestone Lake, Manitoba, Canada
Size of property 3,584 ha
Type of ore Magnetite
NI 43-101/ JORC No
Average Vanadium Grade 0.22% V2O
5
Average grade of other principal by-products
5.56% TiO2, 28.11% Fe
2O
3
Offtake agreements N/A
Target Production (year) N/A
Target Production (tonnage) 30,000 tpa
Resource
Measured N/A
Indicated 156.80 Mt at 0.22% V2O
5, 5.56%
TiO2, 28.11% Fe
2O
3
Inferred N/A
Ownership 50% WI
Largo Resources Ltd. (TSXV:LGO)Largo Resources Ltd., a development stage company, engages in mineral resource exploration and development in Brazil and Canada. The company holds interests in the Northern Dancer tungsten-molybdenum deposit located in the Yukon, Canada, as well as in the Maracas Vanadium deposit located in Brazil. Largo Resources Ltd. is headquartered in Toronto, Canada.
Date 26-Mar-10 Avg. 100 Day Vol. 0.97
Ticker TSXV:LGO Shares O/S 213.24
Stock Price 0.24 Float O/S 196.87
52-Week High 0.28 Cash 0.53
52-Week Low 0.07 Debt 0.00
Market Cap. 51.18 Enterprise Value 50.65
PROJECTS
Project Name Maracas Vanadium - PGE
Location Bahia, Brazil
Size of property 2,000 ha
Type of ore Magnetite
NI 43-101/ JORC Yes
Average Vanadium Grade 1.34% V2O
5
Average grade of other principal by-products
N/A
Offtake agreements Glencore International for 6 years
Target Production (year) 2011
Target Production (tonnage) 4,500 tpa FeV
Resource
Measured/ Indicated 22.50 Mt at 1.26% V2O
5
Proven/ Probable 13.10 Mt at 1.34% V2O
5
Inferred N/A
Ownership 76% WI
111
VA
NA
DIU
M S
nap
sho
ts
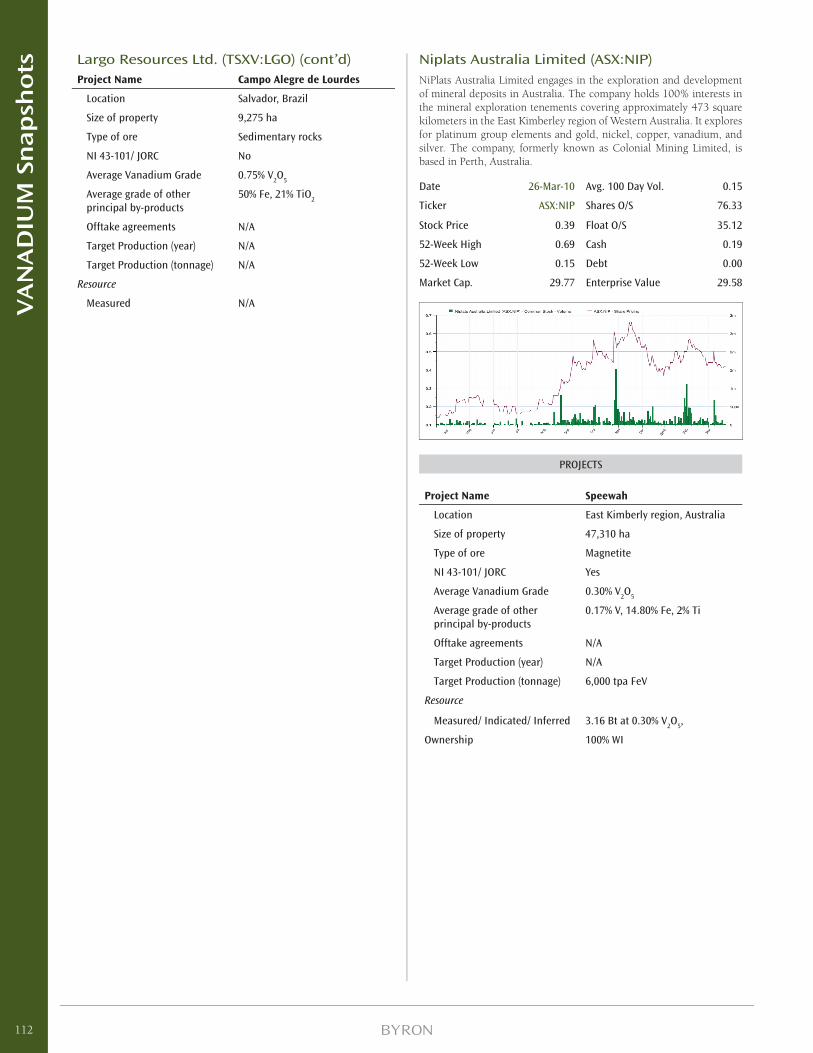
Largo Resources Ltd. (TSXV:LGO) (cont’d)Project Name Campo Alegre de Lourdes
Location Salvador, Brazil
Size of property 9,275 ha
Type of ore Sedimentary rocks
NI 43-101/ JORC No
Average Vanadium Grade 0.75% V2O
5
Average grade of other principal by-products
50% Fe, 21% TiO2
Offtake agreements N/A
Target Production (year) N/A
Target Production (tonnage) N/A
Resource
Measured N/A
Niplats Australia Limited (ASX:NIP)NiPlats Australia Limited engages in the exploration and development of mineral deposits in Australia. The company holds 100% interests in the mineral exploration tenements covering approximately 473 square kilometers in the East Kimberley region of Western Australia. It explores for platinum group elements and gold, nickel, copper, vanadium, and silver. The company, formerly known as Colonial Mining Limited, is based in Perth, Australia.
Date 26-Mar-10 Avg. 100 Day Vol. 0.15
Ticker ASX:NIP Shares O/S 76.33
Stock Price 0.39 Float O/S 35.12
52-Week High 0.69 Cash 0.19
52-Week Low 0.15 Debt 0.00
Market Cap. 29.77 Enterprise Value 29.58
PROJECTS
Project Name Speewah
Location East Kimberly region, Australia
Size of property 47,310 ha
Type of ore Magnetite
NI 43-101/ JORC Yes
Average Vanadium Grade 0.30% V2O
5
Average grade of other principal by-products
0.17% V, 14.80% Fe, 2% Ti
Offtake agreements N/A
Target Production (year) N/A
Target Production (tonnage) 6,000 tpa FeV
Resource
Measured/ Indicated/ Inferred 3.16 Bt at 0.30% V2O
5,
Ownership 100% WI
112
VA
NA
DIU
M S
nap
sho
ts
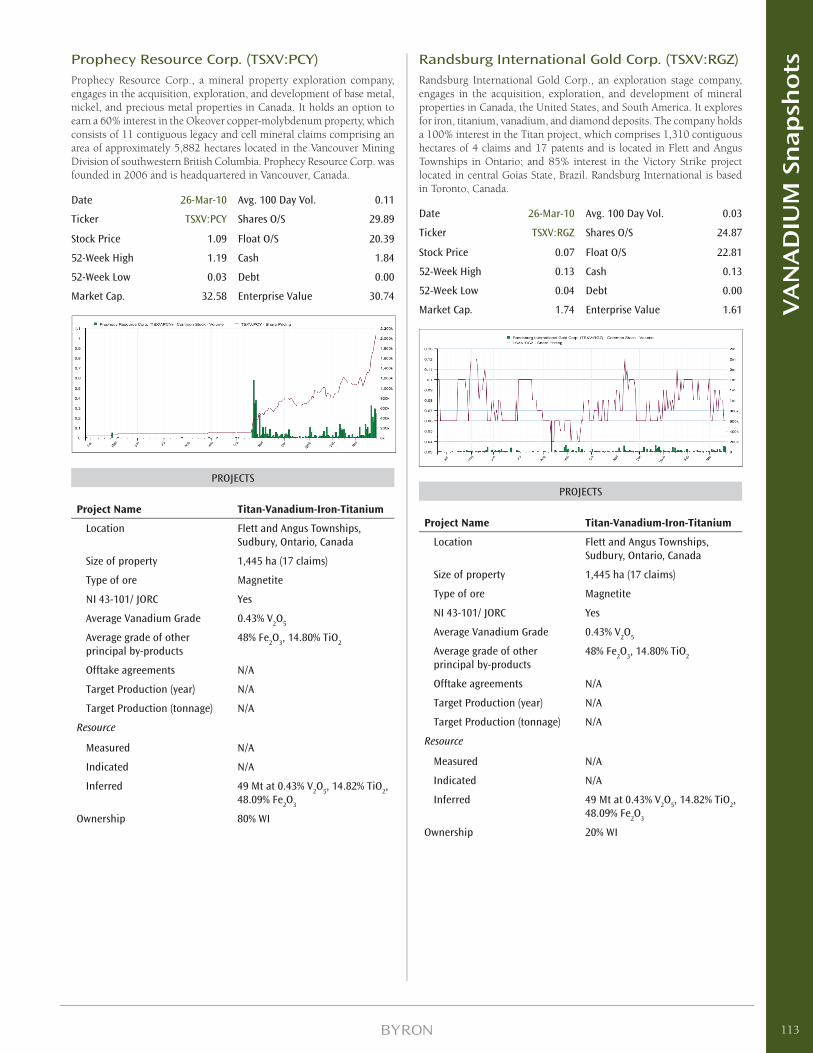
Prophecy Resource Corp. (TSXV:PCY)Prophecy Resource Corp., a mineral property exploration company, engages in the acquisition, exploration, and development of base metal, nickel, and precious metal properties in Canada. It holds an option to earn a 60% interest in the Okeover copper-molybdenum property, which consists of 11 contiguous legacy and cell mineral claims comprising an area of approximately 5,882 hectares located in the Vancouver Mining Division of southwestern British Columbia. Prophecy Resource Corp. was founded in 2006 and is headquartered in Vancouver, Canada.
Date 26-Mar-10 Avg. 100 Day Vol. 0.11
Ticker TSXV:PCY Shares O/S 29.89
Stock Price 1.09 Float O/S 20.39
52-Week High 1.19 Cash 1.84
52-Week Low 0.03 Debt 0.00
Market Cap. 32.58 Enterprise Value 30.74
PROJECTS
Project Name Titan-Vanadium-Iron-Titanium
Location Flett and Angus Townships, Sudbury, Ontario, Canada
Size of property 1,445 ha (17 claims)
Type of ore Magnetite
NI 43-101/ JORC Yes
Average Vanadium Grade 0.43% V2O
5
Average grade of other principal by-products
48% Fe2O
3, 14.80% TiO
2
Offtake agreements N/A
Target Production (year) N/A
Target Production (tonnage) N/A
Resource
Measured N/A
Indicated N/A
Inferred 49 Mt at 0.43% V2O
5, 14.82% TiO
2,
48.09% Fe2O
3
Ownership 80% WI
Randsburg International Gold Corp. (TSXV:RGZ)Randsburg International Gold Corp., an exploration stage company, engages in the acquisition, exploration, and development of mineral properties in Canada, the United States, and South America. It explores for iron, titanium, vanadium, and diamond deposits. The company holds a 100% interest in the Titan project, which comprises 1,310 contiguous hectares of 4 claims and 17 patents and is located in Flett and Angus Townships in Ontario; and 85% interest in the Victory Strike project located in central Goias State, Brazil. Randsburg International is based in Toronto, Canada.
Date 26-Mar-10 Avg. 100 Day Vol. 0.03
Ticker TSXV:RGZ Shares O/S 24.87
Stock Price 0.07 Float O/S 22.81
52-Week High 0.13 Cash 0.13
52-Week Low 0.04 Debt 0.00
Market Cap. 1.74 Enterprise Value 1.61
PROJECTS
Project Name Titan-Vanadium-Iron-Titanium
Location Flett and Angus Townships, Sudbury, Ontario, Canada
Size of property 1,445 ha (17 claims)
Type of ore Magnetite
NI 43-101/ JORC Yes
Average Vanadium Grade 0.43% V2O
5
Average grade of other principal by-products
48% Fe2O
3, 14.80% TiO
2
Offtake agreements N/A
Target Production (year) N/A
Target Production (tonnage) N/A
Resource
Measured N/A
Indicated N/A
Inferred 49 Mt at 0.43% V2O
5, 14.82% TiO
2,
48.09% Fe2O
3
Ownership 20% WI
113
VA
NA
DIU
M S
nap
sho
ts
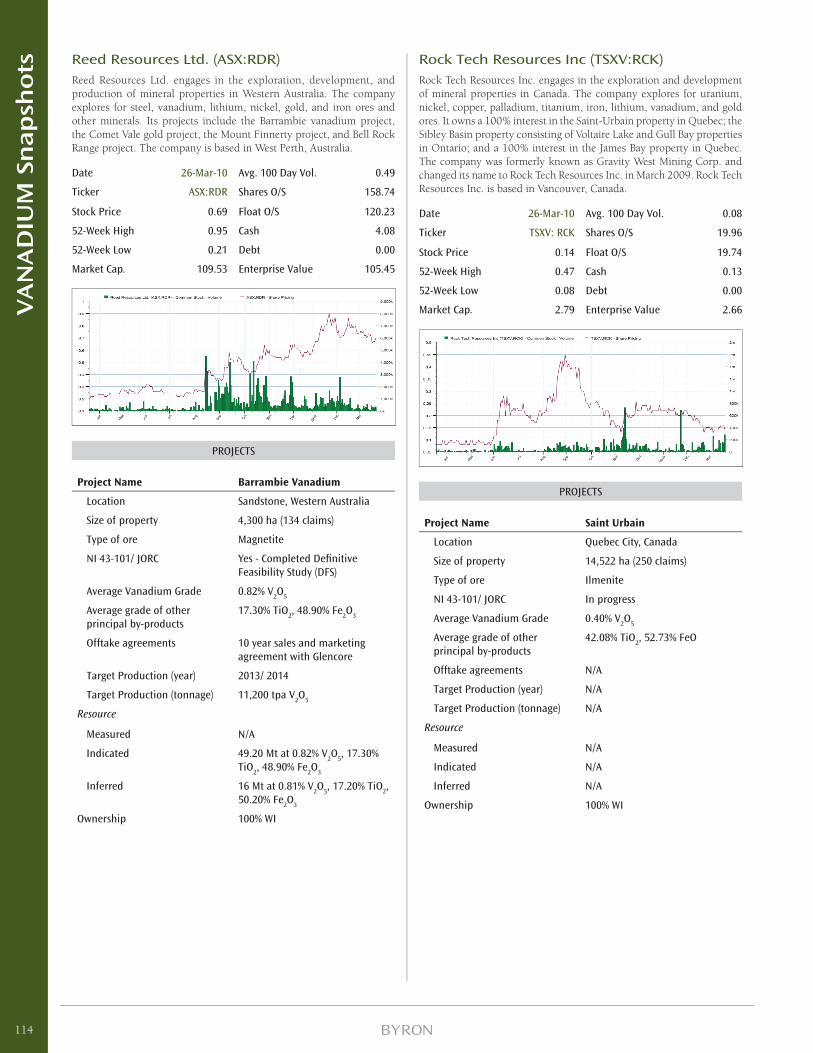
Reed Resources Ltd. (ASX:RDR)Reed Resources Ltd. engages in the exploration, development, and production of mineral properties in Western Australia. The company explores for steel, vanadium, lithium, nickel, gold, and iron ores and other minerals. Its projects include the Barrambie vanadium project, the Comet Vale gold project, the Mount Finnerty project, and Bell Rock Range project. The company is based in West Perth, Australia.
Date 26-Mar-10 Avg. 100 Day Vol. 0.49
Ticker ASX:RDR Shares O/S 158.74
Stock Price 0.69 Float O/S 120.23
52-Week High 0.95 Cash 4.08
52-Week Low 0.21 Debt 0.00
Market Cap. 109.53 Enterprise Value 105.45
PROJECTS
Project Name Barrambie Vanadium
Location Sandstone, Western Australia
Size of property 4,300 ha (134 claims)
Type of ore Magnetite
NI 43-101/ JORC Yes - Completed Defi nitive Feasibility Study (DFS)
Average Vanadium Grade 0.82% V2O
5
Average grade of other principal by-products
17.30% TiO2, 48.90% Fe
2O
3
Offtake agreements 10 year sales and marketing agreement with Glencore
Target Production (year) 2013/ 2014
Target Production (tonnage) 11,200 tpa V2O
5
Resource
Measured N/A
Indicated 49.20 Mt at 0.82% V2O
5, 17.30%
TiO2, 48.90% Fe
2O
3
Inferred 16 Mt at 0.81% V2O
5, 17.20% TiO
2,
50.20% Fe2O
3
Ownership 100% WI
Rock Tech Resources Inc (TSXV:RCK)Rock Tech Resources Inc. engages in the exploration and development of mineral properties in Canada. The company explores for uranium, nickel, copper, palladium, titanium, iron, lithium, vanadium, and gold ores. It owns a 100% interest in the Saint-Urbain property in Quebec; the Sibley Basin property consisting of Voltaire Lake and Gull Bay properties in Ontario; and a 100% interest in the James Bay property in Quebec. The company was formerly known as Gravity West Mining Corp. and changed its name to Rock Tech Resources Inc. in March 2009. Rock Tech Resources Inc. is based in Vancouver, Canada.
Date 26-Mar-10 Avg. 100 Day Vol. 0.08
Ticker TSXV: RCK Shares O/S 19.96
Stock Price 0.14 Float O/S 19.74
52-Week High 0.47 Cash 0.13
52-Week Low 0.08 Debt 0.00
Market Cap. 2.79 Enterprise Value 2.66
PROJECTS
Project Name Saint Urbain
Location Quebec City, Canada
Size of property 14,522 ha (250 claims)
Type of ore Ilmenite
NI 43-101/ JORC In progress
Average Vanadium Grade 0.40% V2O
5
Average grade of other principal by-products
42.08% TiO2, 52.73% FeO
Offtake agreements N/A
Target Production (year) N/A
Target Production (tonnage) N/A
Resource
Measured N/A
Indicated N/A
Inferred N/A
Ownership 100% WI
114
VA
NA
DIU
M S
nap
sho
ts
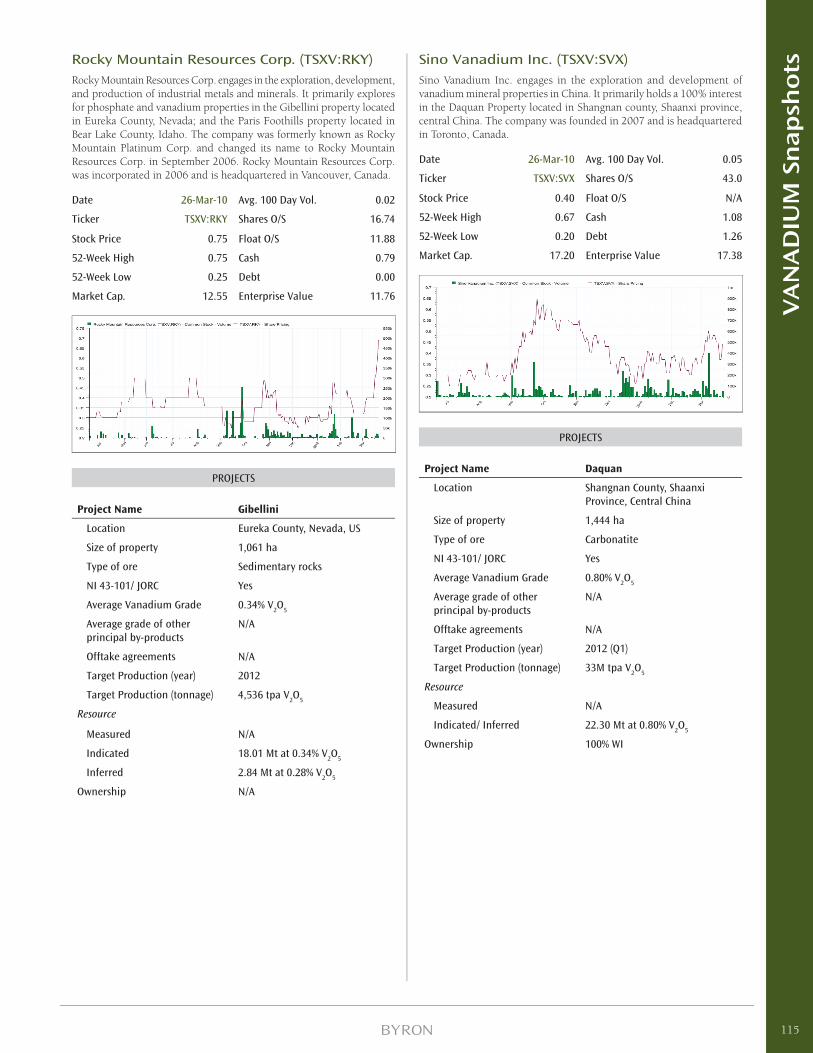
Rocky Mountain Resources Corp. (TSXV:RKY)Rocky Mountain Resources Corp. engages in the exploration, development, and production of industrial metals and minerals. It primarily explores for phosphate and vanadium properties in the Gibellini property located in Eureka County, Nevada; and the Paris Foothills property located in Bear Lake County, Idaho. The company was formerly known as Rocky Mountain Platinum Corp. and changed its name to Rocky Mountain Resources Corp. in September 2006. Rocky Mountain Resources Corp. was incorporated in 2006 and is headquartered in Vancouver, Canada.
Date 26-Mar-10 Avg. 100 Day Vol. 0.02
Ticker TSXV:RKY Shares O/S 16.74
Stock Price 0.75 Float O/S 11.88
52-Week High 0.75 Cash 0.79
52-Week Low 0.25 Debt 0.00
Market Cap. 12.55 Enterprise Value 11.76
PROJECTS
Project Name Gibellini
Location Eureka County, Nevada, US
Size of property 1,061 ha
Type of ore Sedimentary rocks
NI 43-101/ JORC Yes
Average Vanadium Grade 0.34% V2O
5
Average grade of other principal by-products
N/A
Offtake agreements N/A
Target Production (year) 2012
Target Production (tonnage) 4,536 tpa V2O
5
Resource
Measured N/A
Indicated 18.01 Mt at 0.34% V2O
5
Inferred 2.84 Mt at 0.28% V2O
5
Ownership N/A
Sino Vanadium Inc. (TSXV:SVX)Sino Vanadium Inc. engages in the exploration and development of vanadium mineral properties in China. It primarily holds a 100% interest in the Daquan Property located in Shangnan county, Shaanxi province, central China. The company was founded in 2007 and is headquartered in Toronto, Canada.
Date 26-Mar-10 Avg. 100 Day Vol. 0.05
Ticker TSXV:SVX Shares O/S 43.0
Stock Price 0.40 Float O/S N/A
52-Week High 0.67 Cash 1.08
52-Week Low 0.20 Debt 1.26
Market Cap. 17.20 Enterprise Value 17.38
PROJECTS
Project Name Daquan
Location Shangnan County, Shaanxi Province, Central China
Size of property 1,444 ha
Type of ore Carbonatite
NI 43-101/ JORC Yes
Average Vanadium Grade 0.80% V2O
5
Average grade of other principal by-products
N/A
Offtake agreements N/A
Target Production (year) 2012 (Q1)
Target Production (tonnage) 33M tpa V2O
5
Resource
Measured N/A
Indicated/ Inferred 22.30 Mt at 0.80% V2O
5
Ownership 100% WI
115
VA
NA
DIU
M S
nap
sho
ts
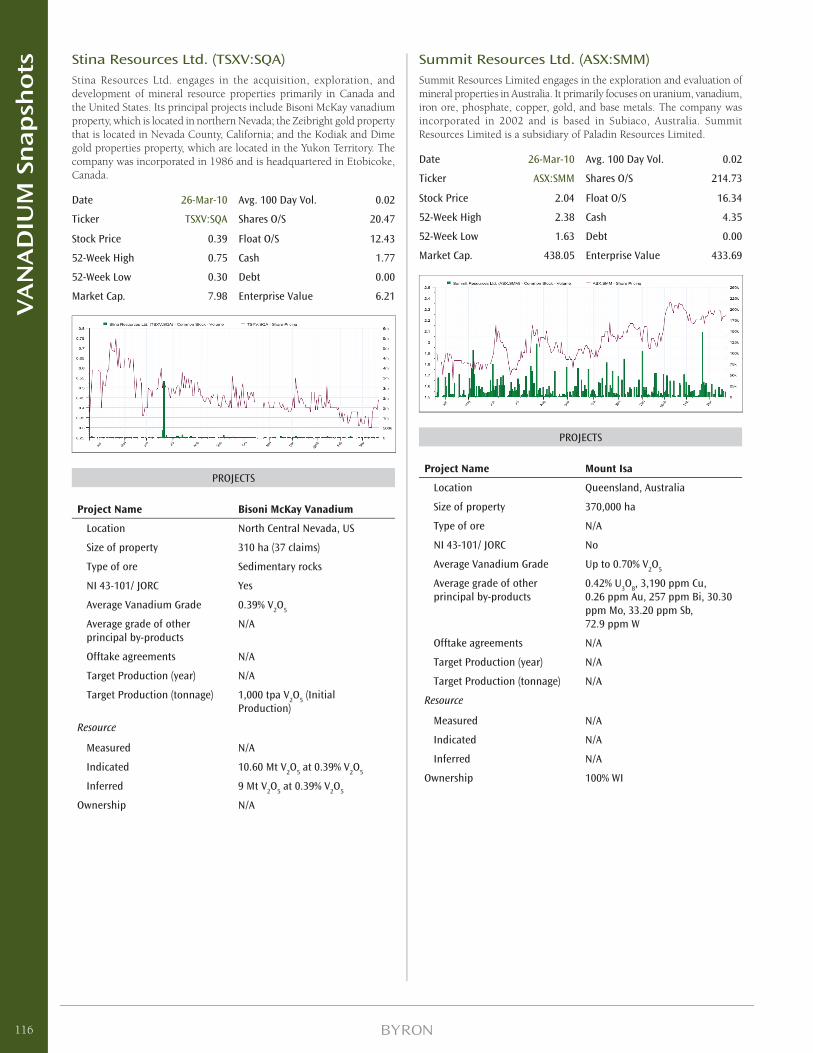
Stina Resources Ltd. (TSXV:SQA)Stina Resources Ltd. engages in the acquisition, exploration, and development of mineral resource properties primarily in Canada and the United States. Its principal projects include Bisoni McKay vanadium property, which is located in northern Nevada; the Zeibright gold property that is located in Nevada County, California; and the Kodiak and Dime gold properties property, which are located in the Yukon Territory. The company was incorporated in 1986 and is headquartered in Etobicoke, Canada.
Date 26-Mar-10 Avg. 100 Day Vol. 0.02
Ticker TSXV:SQA Shares O/S 20.47
Stock Price 0.39 Float O/S 12.43
52-Week High 0.75 Cash 1.77
52-Week Low 0.30 Debt 0.00
Market Cap. 7.98 Enterprise Value 6.21
PROJECTS
Project Name Bisoni McKay Vanadium
Location North Central Nevada, US
Size of property 310 ha (37 claims)
Type of ore Sedimentary rocks
NI 43-101/ JORC Yes
Average Vanadium Grade 0.39% V2O
5
Average grade of other principal by-products
N/A
Offtake agreements N/A
Target Production (year) N/A
Target Production (tonnage) 1,000 tpa V2O
5 (Initial
Production)
Resource
Measured N/A
Indicated 10.60 Mt V2O
5 at 0.39% V
2O
5
Inferred 9 Mt V2O
5 at 0.39% V
2O
5
Ownership N/A
Summit Resources Ltd. (ASX:SMM)Summit Resources Limited engages in the exploration and evaluation of mineral properties in Australia. It primarily focuses on uranium, vanadium, iron ore, phosphate, copper, gold, and base metals. The company was incorporated in 2002 and is based in Subiaco, Australia. Summit Resources Limited is a subsidiary of Paladin Resources Limited.
Date 26-Mar-10 Avg. 100 Day Vol. 0.02
Ticker ASX:SMM Shares O/S 214.73
Stock Price 2.04 Float O/S 16.34
52-Week High 2.38 Cash 4.35
52-Week Low 1.63 Debt 0.00
Market Cap. 438.05 Enterprise Value 433.69
PROJECTS
Project Name Mount Isa
Location Queensland, Australia
Size of property 370,000 ha
Type of ore N/A
NI 43-101/ JORC No
Average Vanadium Grade Up to 0.70% V2O
5
Average grade of other principal by-products
0.42% U3O
8, 3,190 ppm Cu,
0.26 ppm Au, 257 ppm Bi, 30.30 ppm Mo, 33.20 ppm Sb, 72.9 ppm W
Offtake agreements N/A
Target Production (year) N/A
Target Production (tonnage) N/A
Resource
Measured N/A
Indicated N/A
Inferred N/A
Ownership 100% WI
116
VA
NA
DIU
M S
nap
sho
ts
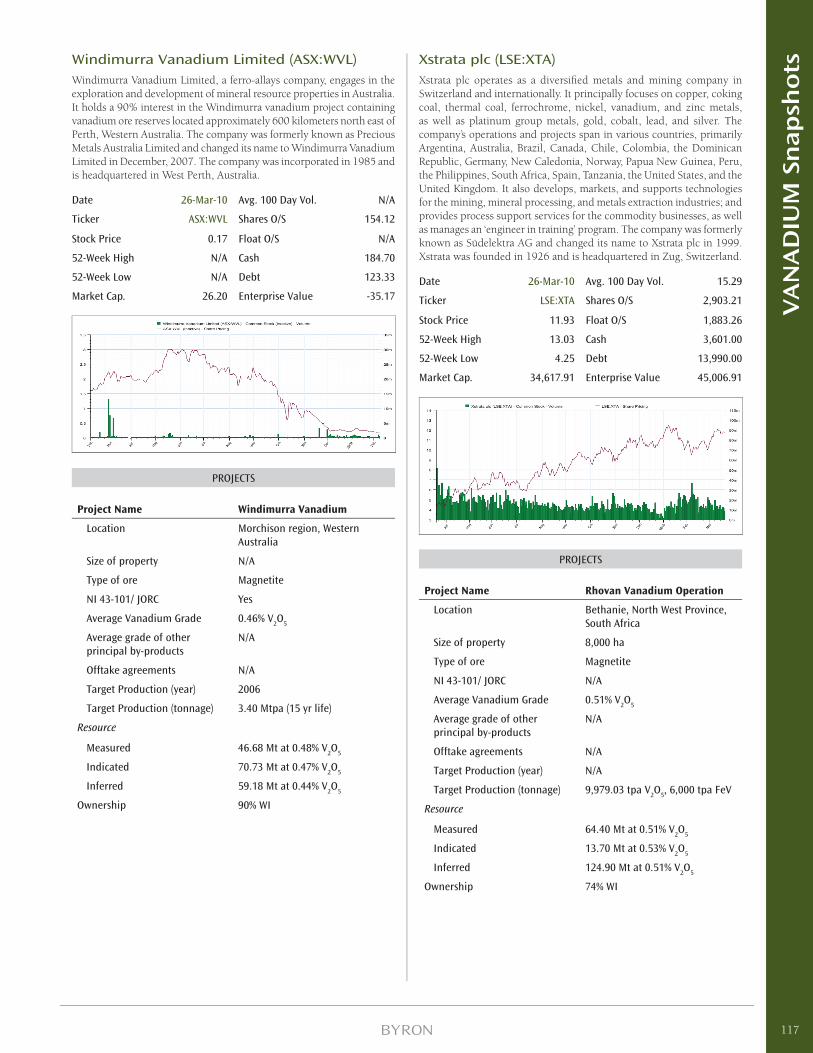
Windimurra Vanadium Limited (ASX:WVL)Windimurra Vanadium Limited, a ferro-allays company, engages in the exploration and development of mineral resource properties in Australia. It holds a 90% interest in the Windimurra vanadium project containing vanadium ore reserves located approximately 600 kilometers north east of Perth, Western Australia. The company was formerly known as Precious Metals Australia Limited and changed its name to Windimurra Vanadium Limited in December, 2007. The company was incorporated in 1985 and is headquartered in West Perth, Australia.
Date 26-Mar-10 Avg. 100 Day Vol. N/A
Ticker ASX:WVL Shares O/S 154.12
Stock Price 0.17 Float O/S N/A
52-Week High N/A Cash 184.70
52-Week Low N/A Debt 123.33
Market Cap. 26.20 Enterprise Value -35.17
PROJECTS
Project Name Windimurra Vanadium
Location Morchison region, Western Australia
Size of property N/A
Type of ore Magnetite
NI 43-101/ JORC Yes
Average Vanadium Grade 0.46% V2O
5
Average grade of other principal by-products
N/A
Offtake agreements N/A
Target Production (year) 2006
Target Production (tonnage) 3.40 Mtpa (15 yr life)
Resource
Measured 46.68 Mt at 0.48% V2O
5
Indicated 70.73 Mt at 0.47% V2O
5
Inferred 59.18 Mt at 0.44% V2O
5
Ownership 90% WI
Xstrata plc (LSE:XTA)Xstrata plc operates as a diversifi ed metals and mining company in Switzerland and internationally. It principally focuses on copper, coking coal, thermal coal, ferrochrome, nickel, vanadium, and zinc metals, as well as platinum group metals, gold, cobalt, lead, and silver. The company’s operations and projects span in various countries, primarily Argentina, Australia, Brazil, Canada, Chile, Colombia, the Dominican Republic, Germany, New Caledonia, Norway, Papua New Guinea, Peru, the Philippines, South Africa, Spain, Tanzania, the United States, and the United Kingdom. It also develops, markets, and supports technologies for the mining, mineral processing, and metals extraction industries; and provides process support services for the commodity businesses, as well as manages an ‘engineer in training’ program. The company was formerly known as Südelektra AG and changed its name to Xstrata plc in 1999. Xstrata was founded in 1926 and is headquartered in Zug, Switzerland.
Date 26-Mar-10 Avg. 100 Day Vol. 15.29
Ticker LSE:XTA Shares O/S 2,903.21
Stock Price 11.93 Float O/S 1,883.26
52-Week High 13.03 Cash 3,601.00
52-Week Low 4.25 Debt 13,990.00
Market Cap. 34,617.91 Enterprise Value 45,006.91
PROJECTS
Project Name Rhovan Vanadium Operation
Location Bethanie, North West Province, South Africa
Size of property 8,000 ha
Type of ore Magnetite
NI 43-101/ JORC N/A
Average Vanadium Grade 0.51% V2O
5
Average grade of other principal by-products
N/A
Offtake agreements N/A
Target Production (year) N/A
Target Production (tonnage) 9,979.03 tpa V2O
5, 6,000 tpa FeV
Resource
Measured 64.40 Mt at 0.51% V2O
5
Indicated 13.70 Mt at 0.53% V2O
5
Inferred 124.90 Mt at 0.51% V2O
5
Ownership 74% WI
117
VA
NA
DIU
M S
nap
sho
ts
Disclosures
Information contained in the company snap-shots and comp tables have been drawn from third party sources believed to be reliable. The accuracy or completeness of the information cannot be guaranteed, nor in providing it does Byron Capital Markets (a division of Byron Securities Limited) assume any responsibility or liability for the contents. From time to time, Byron Capital Markets and its directors, offi cers and other employees may maintain positions in the securities that are directly or indirectly involved in this Industry. The contents of this report cannot be reproduced in whole or in part without the expressed permission of Byron Capital Markets or Byron Securities Ltd. This information is intended for use by accredited investors only, and is not intended for use by any U.S. investor.
118
VA
NA
DIU
M S
nap
sho
ts
Rare Earth Elements – Pick Your Spots, CarefullyMarch 25, 2010
Limited Supply• Rare earths are not that rare, but like many other
industrial metals, finding economically viable concentrations is diffi cult. The annual potential world supply of concentrated rare earth oxides (REOs) is currently only about 128,000 tonnes.
• Adding to the scarcity of global supply is the fact that, while China produces almost 90% of the world’s rare earths, China is now imposing export restrictions. This limitation on useful REOs outside of China is making life diffi cult for consumers of rare earths.
Rising Demand, but Rising Fast Enough?• Rare earths are critical components in some of
our latest and greatest high-technology and green inventions. Without rare earths, ultra-strong magnets, LEDs and other innovations become impossible to manufacture.
• But there are more than 190 companies, worldwide, claiming to have REO properties, according to Intierra of Australia.
• We expect demand for rare earth magnets (due to electric vehicle use and wind power) and LEDs (due to lighting and display use) to accelerate demand for rare earths, but we do not expect this demand to support anything like 190 companies.
So Why All the Fuss?• We do acknowledge that, while we believe light
rare earth elements (LREEs) will rapidly become oversupplied, heavy rare earth elements (HREEs), particularly dysprosium and terbium, may be in signifi cant undersupply, and soon.
• Oversupply of LREEs may, however, depress their price and create economic problems for all projects, whether categorized as “light” or “heavy”.
Picking Your Spots• These are still mining projects. Good grade in the
ground combined with good metallurgy, therefore good recovery rates, will yield the lowest costs. In any commodity market, the safest place to be is invested in the lowest cost producers.
• HREEs carry higher prices than LREEs, per unit mass, and this discrepancy will, we believe, grow with
time. We believe it is safest to invest in projects that produce larger quantities of HREEs. Note that even the so-called “heavy” deposits are still 80% LREEs, so a “light” deposit can still produce meaningful amounts of HREEs.
• Be aware of the magnitude of risk attached to metallurgy. A new deposit may never produce if it has the wrong contaminants in its ore, but a mine that is being restarted is substantially derisked.
SummaryAnyone paying attention to the technology market at all has seen some startling things happening over the last 25 years. Magnets incorporating a little-known class of materials called rare earth elements (REEs) have been developed that are orders of magnitude stronger than old-fashioned ferrite or iron magnets. This new technology has enabled huge leaps in performance in hard drives, wind turbine generators and electric motors. Light emitting diodes, or LEDs, that originally came in any color you wanted, as long as it was red, now come in every color of the rainbow and quite a few colors that human eyes can’t even see. We have computer memories now that are orders of magnitude faster and smaller than computer memory of the recent past and many of these developments owe their success to these largely unrecognized elements.
REEs comprise a swath of 15 elements that are placed across the middle of the periodic table, and are known as the lanthanide series. Additionally, one or two other elements that demonstrate similar chemical properties, yttrium and perhaps scandium, are also recognized as rare earths. In all, there are a total of 16 or 17 elements that are recognized as being rare earths. And note that lithium, vanadium and some other elements that are commonly confused with rare earths are not.
119
RA
RE E
AR
TH
ELE
MEN
TS
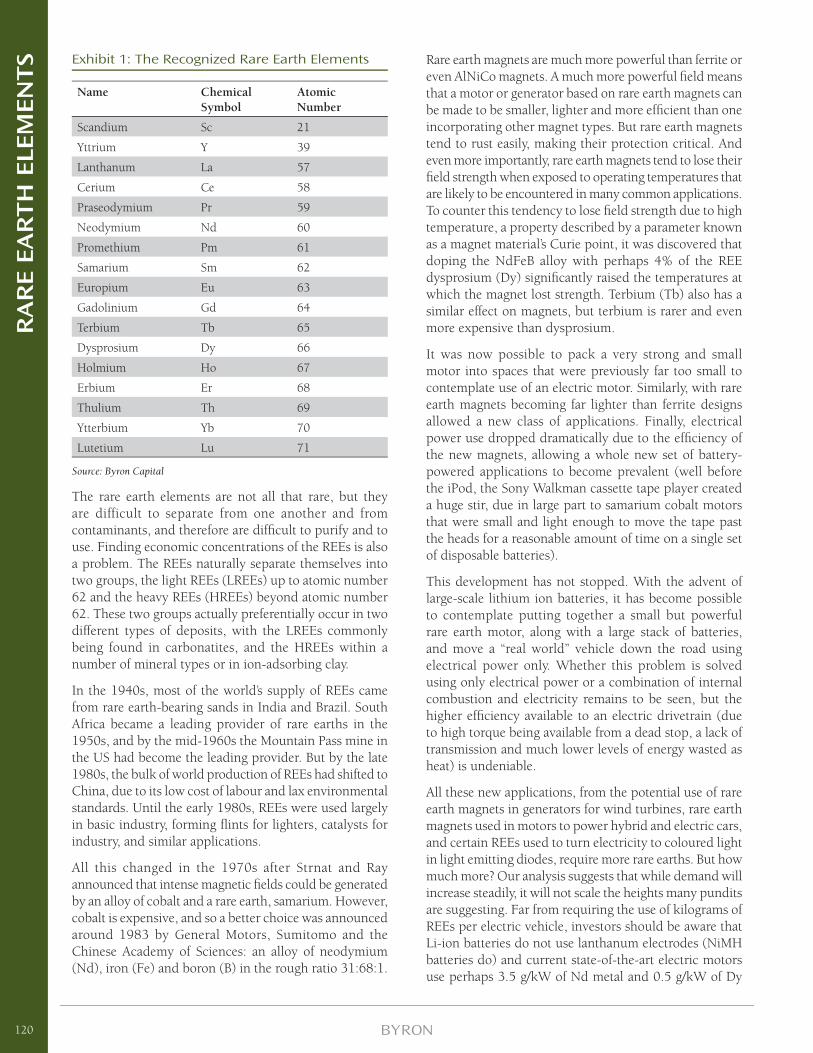
Exhibit 1: The Recognized Rare Earth Elements
Name Chemical Symbol
Atomic Number
Scandium Sc 21
Yttrium Y 39
Lanthanum La 57
Cerium Ce 58
Praseodymium Pr 59
Neodymium Nd 60
Promethium Pm 61
Samarium Sm 62
Europium Eu 63
Gadolinium Gd 64
Terbium Tb 65
Dysprosium Dy 66
Holmium Ho 67
Erbium Er 68
Thulium Th 69
Ytterbium Yb 70
Lutetium Lu 71
Source: Byron Capital
The rare earth elements are not all that rare, but they are difficult to separate from one another and from contaminants, and therefore are diffi cult to purify and to use. Finding economic concentrations of the REEs is also a problem. The REEs naturally separate themselves into two groups, the light REEs (LREEs) up to atomic number 62 and the heavy REEs (HREEs) beyond atomic number 62. These two groups actually preferentially occur in two different types of deposits, with the LREEs commonly being found in carbonatites, and the HREEs within a number of mineral types or in ion-adsorbing clay.
In the 1940s, most of the world’s supply of REEs came from rare earth-bearing sands in India and Brazil. South Africa became a leading provider of rare earths in the 1950s, and by the mid-1960s the Mountain Pass mine in the US had become the leading provider. But by the late 1980s, the bulk of world production of REEs had shifted to China, due to its low cost of labour and lax environmental standards. Until the early 1980s, REEs were used largely in basic industry, forming fl ints for lighters, catalysts for industry, and similar applications.
All this changed in the 1970s after Strnat and Ray announced that intense magnetic fi elds could be generated by an alloy of cobalt and a rare earth, samarium. However, cobalt is expensive, and so a better choice was announced around 1983 by General Motors, Sumitomo and the Chinese Academy of Sciences: an alloy of neodymium (Nd), iron (Fe) and boron (B) in the rough ratio 31:68:1.
Rare earth magnets are much more powerful than ferrite or even AlNiCo magnets. A much more powerful fi eld means that a motor or generator based on rare earth magnets can be made to be smaller, lighter and more effi cient than one incorporating other magnet types. But rare earth magnets tend to rust easily, making their protection critical. And even more importantly, rare earth magnets tend to lose their fi eld strength when exposed to operating temperatures that are likely to be encountered in many common applications. To counter this tendency to lose fi eld strength due to high temperature, a property described by a parameter known as a magnet material’s Curie point, it was discovered that doping the NdFeB alloy with perhaps 4% of the REE dysprosium (Dy) signifi cantly raised the temperatures at which the magnet lost strength. Terbium (Tb) also has a similar effect on magnets, but terbium is rarer and even more expensive than dysprosium.
It was now possible to pack a very strong and small motor into spaces that were previously far too small to contemplate use of an electric motor. Similarly, with rare earth magnets becoming far lighter than ferrite designs allowed a new class of applications. Finally, electrical power use dropped dramatically due to the effi ciency of the new magnets, allowing a whole new set of battery-powered applications to become prevalent (well before the iPod, the Sony Walkman cassette tape player created a huge stir, due in large part to samarium cobalt motors that were small and light enough to move the tape past the heads for a reasonable amount of time on a single set of disposable batteries).
This development has not stopped. With the advent of large-scale lithium ion batteries, it has become possible to contemplate putting together a small but powerful rare earth motor, along with a large stack of batteries, and move a “real world” vehicle down the road using electrical power only. Whether this problem is solved using only electrical power or a combination of internal combustion and electricity remains to be seen, but the higher effi ciency available to an electric drivetrain (due to high torque being available from a dead stop, a lack of transmission and much lower levels of energy wasted as heat) is undeniable.
All these new applications, from the potential use of rare earth magnets in generators for wind turbines, rare earth magnets used in motors to power hybrid and electric cars, and certain REEs used to turn electricity to coloured light in light emitting diodes, require more rare earths. But how much more? Our analysis suggests that while demand will increase steadily, it will not scale the heights many pundits are suggesting. Far from requiring the use of kilograms of REEs per electric vehicle, investors should be aware that Li-ion batteries do not use lanthanum electrodes (NiMH batteries do) and current state-of-the-art electric motors use perhaps 3.5 g/kW of Nd metal and 0.5 g/kW of Dy
120
RA
RE E
AR
TH
ELE
MEN
TS
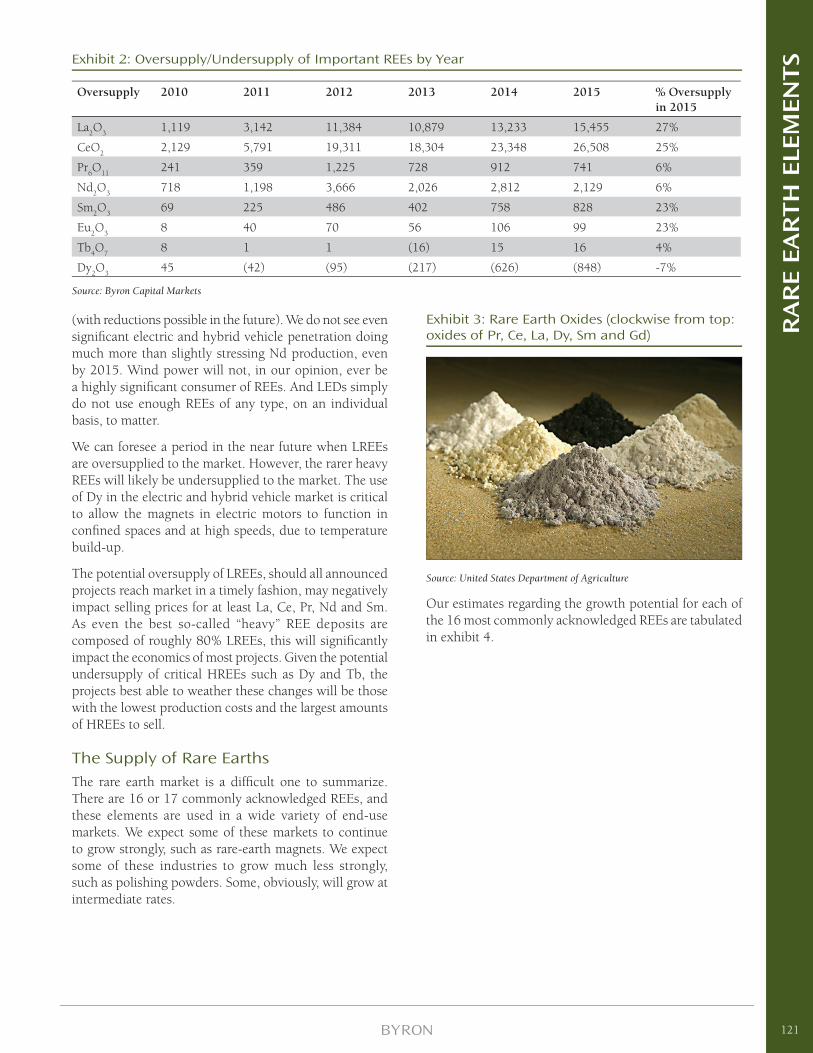
(with reductions possible in the future). We do not see even signifi cant electric and hybrid vehicle penetration doing much more than slightly stressing Nd production, even by 2015. Wind power will not, in our opinion, ever be a highly signifi cant consumer of REEs. And LEDs simply do not use enough REEs of any type, on an individual basis, to matter.
We can foresee a period in the near future when LREEs are oversupplied to the market. However, the rarer heavy REEs will likely be undersupplied to the market. The use of Dy in the electric and hybrid vehicle market is critical to allow the magnets in electric motors to function in confi ned spaces and at high speeds, due to temperature build-up.
The potential oversupply of LREEs, should all announced projects reach market in a timely fashion, may negatively impact selling prices for at least La, Ce, Pr, Nd and Sm. As even the best so-called “heavy” REE deposits are composed of roughly 80% LREEs, this will signifi cantly impact the economics of most projects. Given the potential undersupply of critical HREEs such as Dy and Tb, the projects best able to weather these changes will be those with the lowest production costs and the largest amounts of HREEs to sell.
The Supply of Rare EarthsThe rare earth market is a diffi cult one to summarize. There are 16 or 17 commonly acknowledged REEs, and these elements are used in a wide variety of end-use markets. We expect some of these markets to continue to grow strongly, such as rare-earth magnets. We expect some of these industries to grow much less strongly, such as polishing powders. Some, obviously, will grow at intermediate rates.
Exhibit 3: Rare Earth Oxides (clockwise from top: oxides of Pr, Ce, La, Dy, Sm and Gd)
Source: United States Department of Agriculture
Our estimates regarding the growth potential for each of the 16 most commonly acknowledged REEs are tabulated in exhibit 4.
Exhibit 2: Oversupply/Undersupply of Important REEs by Year
Oversupply 2010 2011 2012 2013 2014 2015 % Oversupply in 2015
La2O
31,119 3,142 11,384 10,879 13,233 15,455 27%
CeO2
2,129 5,791 19,311 18,304 23,348 26,508 25%
Pr6O
11241 359 1,225 728 912 741 6%
Nd2O
3718 1,198 3,666 2,026 2,812 2,129 6%
Sm2O
369 225 486 402 758 828 23%
Eu2O
38 40 70 56 106 99 23%
Tb4O
78 1 1 (16) 15 16 4%
Dy2O
345 (42) (95) (217) (626) (848) -7%
Source: Byron Capital Markets
121
RA
RE E
AR
TH
ELE
MEN
TS
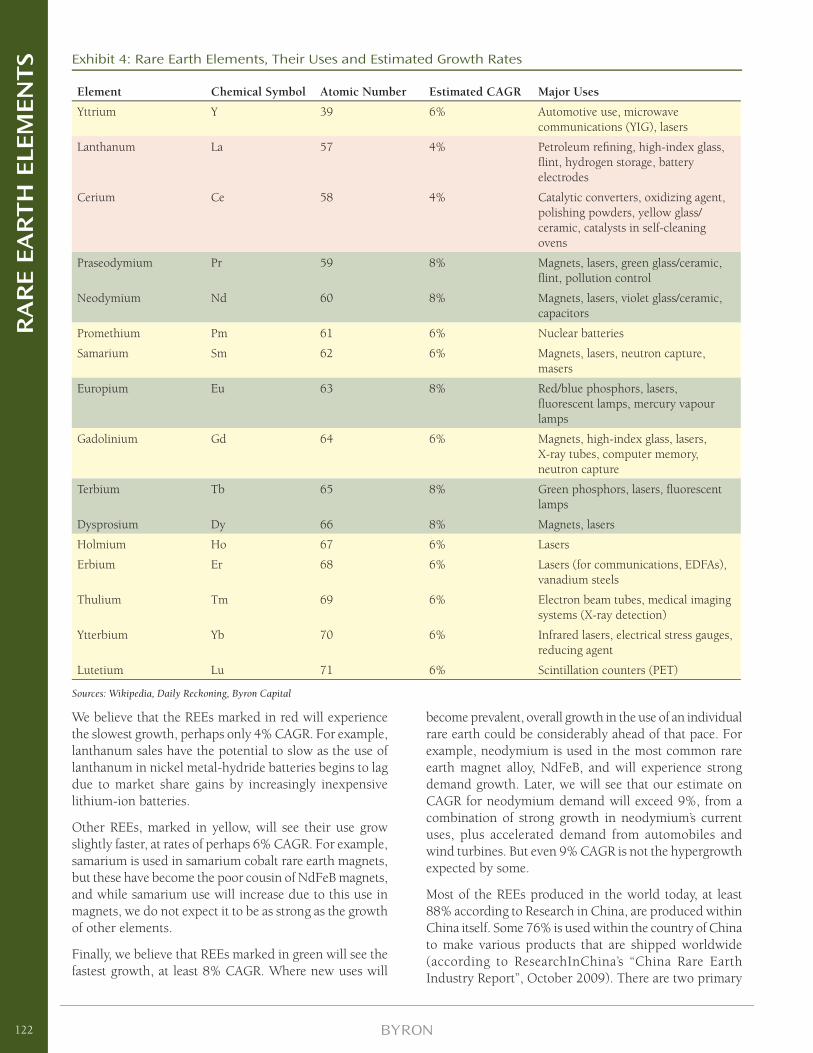
Exhibit 4: Rare Earth Elements, Their Uses and Estimated Growth Rates
Element Chemical Symbol Atomic Number Estimated CAGR Major Uses
Yttrium Y 39 6% Automotive use, microwave communications (YIG), lasers
Lanthanum La 57 4% Petroleum refi ning, high-index glass, fl int, hydrogen storage, battery electrodes
Cerium Ce 58 4% Catalytic converters, oxidizing agent, polishing powders, yellow glass/ceramic, catalysts in self-cleaning ovens
Praseodymium Pr 59 8% Magnets, lasers, green glass/ceramic, fl int, pollution control
Neodymium Nd 60 8% Magnets, lasers, violet glass/ceramic, capacitors
Promethium Pm 61 6% Nuclear batteries
Samarium Sm 62 6% Magnets, lasers, neutron capture, masers
Europium Eu 63 8% Red/blue phosphors, lasers, fl uorescent lamps, mercury vapour lamps
Gadolinium Gd 64 6% Magnets, high-index glass, lasers, X-ray tubes, computer memory, neutron capture
Terbium Tb 65 8% Green phosphors, lasers, fl uorescent lamps
Dysprosium Dy 66 8% Magnets, lasers
Holmium Ho 67 6% Lasers
Erbium Er 68 6% Lasers (for communications, EDFAs), vanadium steels
Thulium Tm 69 6% Electron beam tubes, medical imaging systems (X-ray detection)
Ytterbium Yb 70 6% Infrared lasers, electrical stress gauges, reducing agent
Lutetium Lu 71 6% Scintillation counters (PET)
Sources: Wikipedia, Daily Reckoning, Byron Capital
We believe that the REEs marked in red will experience the slowest growth, perhaps only 4% CAGR. For example, lanthanum sales have the potential to slow as the use of lanthanum in nickel metal-hydride batteries begins to lag due to market share gains by increasingly inexpensive lithium-ion batteries.
Other REEs, marked in yellow, will see their use grow slightly faster, at rates of perhaps 6% CAGR. For example, samarium is used in samarium cobalt rare earth magnets, but these have become the poor cousin of NdFeB magnets, and while samarium use will increase due to this use in magnets, we do not expect it to be as strong as the growth of other elements.
Finally, we believe that REEs marked in green will see the fastest growth, at least 8% CAGR. Where new uses will
become prevalent, overall growth in the use of an individual rare earth could be considerably ahead of that pace. For example, neodymium is used in the most common rare earth magnet alloy, NdFeB, and will experience strong demand growth. Later, we will see that our estimate on CAGR for neodymium demand will exceed 9%, from a combination of strong growth in neodymium’s current uses, plus accelerated demand from automobiles and wind turbines. But even 9% CAGR is not the hypergrowth expected by some.
Most of the REEs produced in the world today, at least 88% according to Research in China, are produced within China itself. Some 76% is used within the country of China to make various products that are shipped worldwide (according to ResearchInChina’s “China Rare Earth Industry Report”, October 2009). There are two primary
122
RA
RE E
AR
TH
ELE
MEN
TS
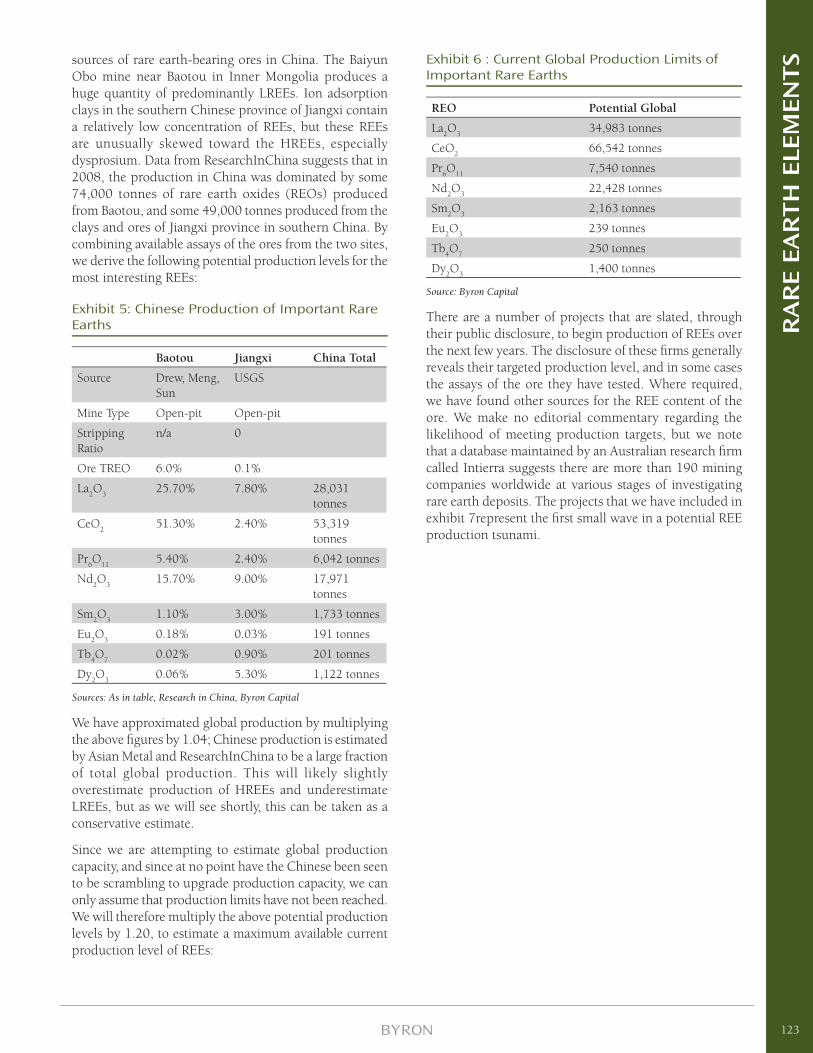
sources of rare earth-bearing ores in China. The Baiyun Obo mine near Baotou in Inner Mongolia produces a huge quantity of predominantly LREEs. Ion adsorption clays in the southern Chinese province of Jiangxi contain a relatively low concentration of REEs, but these REEs are unusually skewed toward the HREEs, especially dysprosium. Data from ResearchInChina suggests that in 2008, the production in China was dominated by some 74,000 tonnes of rare earth oxides (REOs) produced from Baotou, and some 49,000 tonnes produced from the clays and ores of Jiangxi province in southern China. By combining available assays of the ores from the two sites, we derive the following potential production levels for the most interesting REEs:
Exhibit 5: Chinese Production of Important Rare Earths
Baotou Jiangxi China Total
Source Drew, Meng, Sun
USGS
Mine Type Open-pit Open-pit
Stripping Ratio
n/a 0
Ore TREO 6.0% 0.1%
La2O
325.70% 7.80% 28,031
tonnes
CeO2
51.30% 2.40% 53,319 tonnes
Pr6O
115.40% 2.40% 6,042 tonnes
Nd2O
315.70% 9.00% 17,971
tonnes
Sm2O
31.10% 3.00% 1,733 tonnes
Eu2O
30.18% 0.03% 191 tonnes
Tb4O
70.02% 0.90% 201 tonnes
Dy2O
30.06% 5.30% 1,122 tonnes
Sources: As in table, Research in China, Byron Capital
We have approximated global production by multiplying the above fi gures by 1.04; Chinese production is estimated by Asian Metal and ResearchInChina to be a large fraction of total global production. This will likely slightly overestimate production of HREEs and underestimate LREEs, but as we will see shortly, this can be taken as a conservative estimate.
Since we are attempting to estimate global production capacity, and since at no point have the Chinese been seen to be scrambling to upgrade production capacity, we can only assume that production limits have not been reached. We will therefore multiply the above potential production levels by 1.20, to estimate a maximum available current production level of REEs:
Exhibit 6 : Current Global Production Limits of Important Rare Earths
REO Potential Global
La2O
334,983 tonnes
CeO2
66,542 tonnes
Pr6O
117,540 tonnes
Nd2O
322,428 tonnes
Sm2O
32,163 tonnes
Eu2O
3239 tonnes
Tb4O
7250 tonnes
Dy2O
31,400 tonnes
Source: Byron Capital
There are a number of projects that are slated, through their public disclosure, to begin production of REEs over the next few years. The disclosure of these fi rms generally reveals their targeted production level, and in some cases the assays of the ore they have tested. Where required, we have found other sources for the REE content of the ore. We make no editorial commentary regarding the likelihood of meeting production targets, but we note that a database maintained by an Australian research fi rm called Intierra suggests there are more than 190 mining companies worldwide at various stages of investigating rare earth deposits. The projects that we have included in exhibit 7represent the fi rst small wave in a potential REE production tsunami.
123
RA
RE E
AR
TH
ELE
MEN
TS
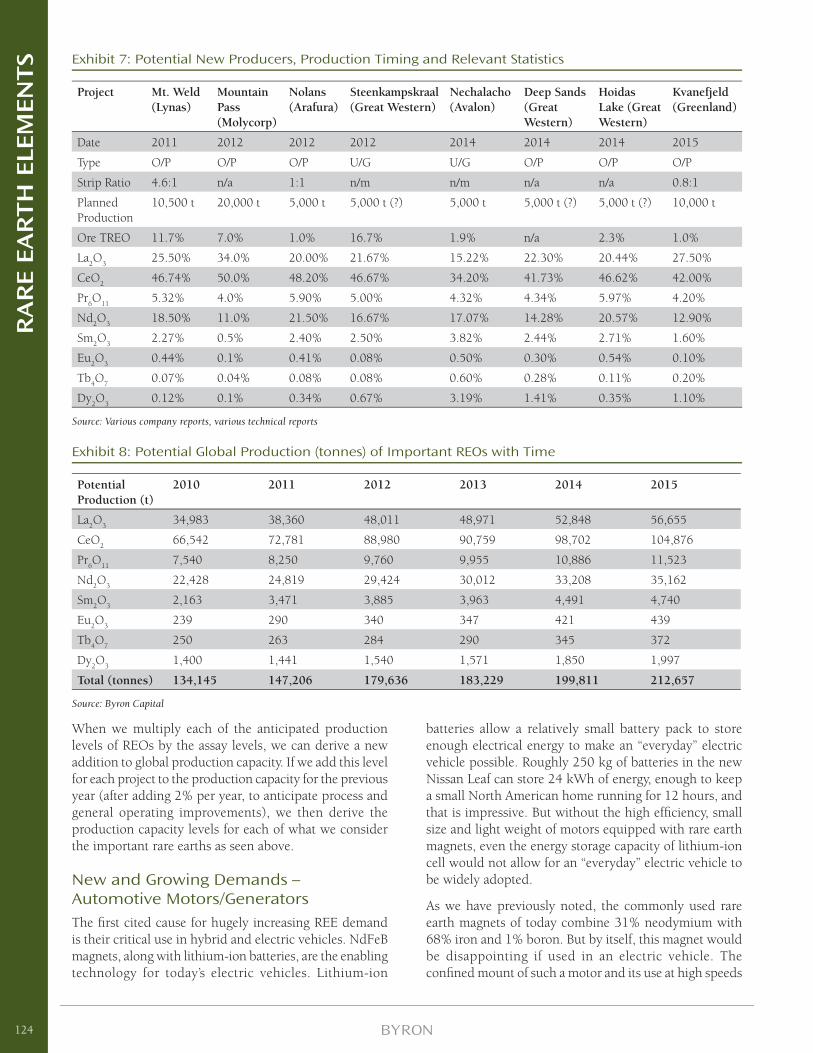
Exhibit 7: Potential New Producers, Production Timing and Relevant Statistics
Project Mt. Weld (Lynas)
Mountain Pass (Molycorp)
Nolans (Arafura)
Steenkampskraal (Great Western)
Nechalacho (Avalon)
Deep Sands (Great Western)
Hoidas Lake (Great Western)
Kvanefjeld (Greenland)
Date 2011 2012 2012 2012 2014 2014 2014 2015
Type O/P O/P O/P U/G U/G O/P O/P O/P
Strip Ratio 4.6:1 n/a 1:1 n/m n/m n/a n/a 0.8:1
Planned Production
10,500 t 20,000 t 5,000 t 5,000 t (?) 5,000 t 5,000 t (?) 5,000 t (?) 10,000 t
Ore TREO 11.7% 7.0% 1.0% 16.7% 1.9% n/a 2.3% 1.0%
La2O
325.50% 34.0% 20.00% 21.67% 15.22% 22.30% 20.44% 27.50%
CeO2
46.74% 50.0% 48.20% 46.67% 34.20% 41.73% 46.62% 42.00%
Pr6O
115.32% 4.0% 5.90% 5.00% 4.32% 4.34% 5.97% 4.20%
Nd2O
318.50% 11.0% 21.50% 16.67% 17.07% 14.28% 20.57% 12.90%
Sm2O
32.27% 0.5% 2.40% 2.50% 3.82% 2.44% 2.71% 1.60%
Eu2O
30.44% 0.1% 0.41% 0.08% 0.50% 0.30% 0.54% 0.10%
Tb4O
70.07% 0.04% 0.08% 0.08% 0.60% 0.28% 0.11% 0.20%
Dy2O
30.12% 0.1% 0.34% 0.67% 3.19% 1.41% 0.35% 1.10%
Source: Various company reports, various technical reports
Exhibit 8: Potential Global Production (tonnes) of Important REOs with Time
Potential Production (t)
2010 2011 2012 2013 2014 2015
La2O
334,983 38,360 48,011 48,971 52,848 56,655
CeO2
66,542 72,781 88,980 90,759 98,702 104,876
Pr6O
117,540 8,250 9,760 9,955 10,886 11,523
Nd2O
322,428 24,819 29,424 30,012 33,208 35,162
Sm2O
32,163 3,471 3,885 3,963 4,491 4,740
Eu2O
3239 290 340 347 421 439
Tb4O
7250 263 284 290 345 372
Dy2O
31,400 1,441 1,540 1,571 1,850 1,997
Total (tonnes) 134,145 147,206 179,636 183,229 199,811 212,657
Source: Byron Capital
When we multiply each of the anticipated production levels of REOs by the assay levels, we can derive a new addition to global production capacity. If we add this level for each project to the production capacity for the previous year (after adding 2% per year, to anticipate process and general operating improvements), we then derive the production capacity levels for each of what we consider the important rare earths as seen above.
New and Growing Demands – Automotive Motors/GeneratorsThe fi rst cited cause for hugely increasing REE demand is their critical use in hybrid and electric vehicles. NdFeB magnets, along with lithium-ion batteries, are the enabling technology for today’s electric vehicles. Lithium-ion
batteries allow a relatively small battery pack to store enough electrical energy to make an “everyday” electric vehicle possible. Roughly 250 kg of batteries in the new Nissan Leaf can store 24 kWh of energy, enough to keep a small North American home running for 12 hours, and that is impressive. But without the high effi ciency, small size and light weight of motors equipped with rare earth magnets, even the energy storage capacity of lithium-ion cell would not allow for an “everyday” electric vehicle to be widely adopted.
As we have previously noted, the commonly used rare earth magnets of today combine 31% neodymium with 68% iron and 1% boron. But by itself, this magnet would be disappointing if used in an electric vehicle. The confi ned mount of such a motor and its use at high speeds
124
RA
RE E
AR
TH
ELE
MEN
TS
would quickly result in temperature build-up, and the major drawback to simple rare earth magnets is that their magnetic fi eld strength drops fairly quickly with increasing temperature. However, NdFeB alloyed with up to 4.5% (we will use 4% as our fi gure) of dysprosium, by weight, dramatically improves temperature handling capability. Terbium, although more expensive and much rarer than dysprosium, can accomplish the same thing.
The drawback to dysprosium use is that the maximum fi eld strength of the magnet is decreased. However, by alloying a small amount of praseodymium, a LREE that is rarer than neodymium, into the magnet material, the fi eld strength can be augmented.
So, we believe that the use of materials such as neodymium, praseodymium, dysprosium and terbium will be increased by the adoption of large electric vehicles. And it is not just large electric vehicles that will drive demand. Electric bicycles and scooters are almost unknown in North America and Europe, but are selling at phenomenal rates in China where the population would like physically less demanding methods of transport than a human-powered bicycle, but cannot afford large fossil fuel-powered or electric vehicles. In 2009, according to the British Bicycle Association, some 20 million electric bicycles were sold in China, and the rate is climbing rapidly.
These bikes are largely moved by a combination of a small rare earth magnet-equipped motor, something small and very lightweight but also highly effi cient, and cheap but bulky and heavy lead-gelled acid batteries (the same sort of battery used in a small uninterruptible power supply attached to a home PC). The motor to move such a bike is small, certainly under 5 kW in size, but the total amount of NdFeB magnet material (also incorporating Dy and perhaps Pr) for millions of such motors is substantial.
However, we believe the fi nancial markets in North America and abroad have incorporated a substantial misconception into their thinking. Within a Reuters article (“As hybrid cars gobble rare metals, shortage looms”, August 31, 2009) prominent pundit Jack Lifton is quoted as saying that the Toyota Prius motor uses 1 kg of neodymium, and that its battery uses 10-15 kg of lanthanum. He is then quoted as suggesting that these amounts would double as Toyota executes on its stated goal of increasing the fuel economy ratings of the Prius. Not to put a fi ne point on it, these conclusions and even the basic assumptions made by Mr. Lifton are, we believe, entirely incorrect.
Mr. Lifton and others have quoted 10-15 kg of lanthanum use in the Prius battery. It is true that nickel metal-hydride (NiMH) cells such as those used in the current version of the Prius do utilize lanthanum electrodes, and are very substantial repositories for lanthanum. But the upcoming plug-in version of the Prius will use lithium-ion (Li-ion)
batteries to increase energy storage and decrease size and weight of the resulting battery, as announced by Toyota in late August of 2009. Lithium-ion batteries do not require lanthanum electrodes. Speculation was always focused on lithium-ion battery use in a plug-in version of the Prius hybrid, as use of a much higher capacity battery made with NiMH chemistry would have been too heavy and too large.
We have just recently attended the 2010 Geneva International Motor Show, and were impressed with a growing slate of fully electric vehicles and an absolutely booming number of hybrids being brought to market by the major automobile manufacturers. All of the vehicles we looked at or photographed, without exception, incorporate Li-ion batteries, not NiMH. Lanthanum supply will not be an issue.
Logically, a plug-in hybrid requires greater electrical storage capacity, so bigger batteries, to improve fuel economy; what it does not require is a larger electric main motor. The 55 kW motor in the current Toyota Prius provides more than enough motivation to the vehicle, along with its gasoline engine. There is absolutely no need, within the bounds of requiring the same acceleration and top speed, to increase the power output of the electric motor. And increasing power is the only reason the size of the magnets in the motor will grow. Claiming more rare earths will be used in the motor solely to increase fuel economy is dubious, at best.
Similarly, Mr. Lifton gives a number that we have seen quoted by others: 1 kg of neodymium is required for the Toyota Prius motor. This number, too, is in error. Dr. Peter Campbell was commissioned by the Ames Laboratory of the Iowa State University to write a report pertaining to the US Department of Energy’s FreedomCAR project (“System Cost Analysis for an Interior Permanent Magnet Motor”, Ames Laboratory, Iowa State University, IS-5191, August 2008). This report should be required reading for anyone working in the rare earths market. In it, Dr. Campbell, who is one of the foremost engineers in the area of rare earth magnet-equipped motors, and is the former VP for Technology and Sales at Magnequench, still the leading company in the world in the production and sale of doped NdFeB powder, describes designing a 55 kW motor that met the FreedomCAR specifi cation. With a sintered magnet, the motor uses only 650 grams of NdFeB. If we assume the magnet is doped at a 4% level by weight with dysprosium, then the entire Prius main motor uses 24 g of dysprosium and only 193 g of Nd, not the 1,000 g suggested by Mr. Lifton. Factors of more than fi ve are, we believe, important when we discuss consumption rates.
We were concerned, although simple calculations on the fi eld strengths of NdFeB magnets today suggested we need not be, that Dr. Campbell’s motor design was perhaps
125
RA
RE E
AR
TH
ELE
MEN
TS
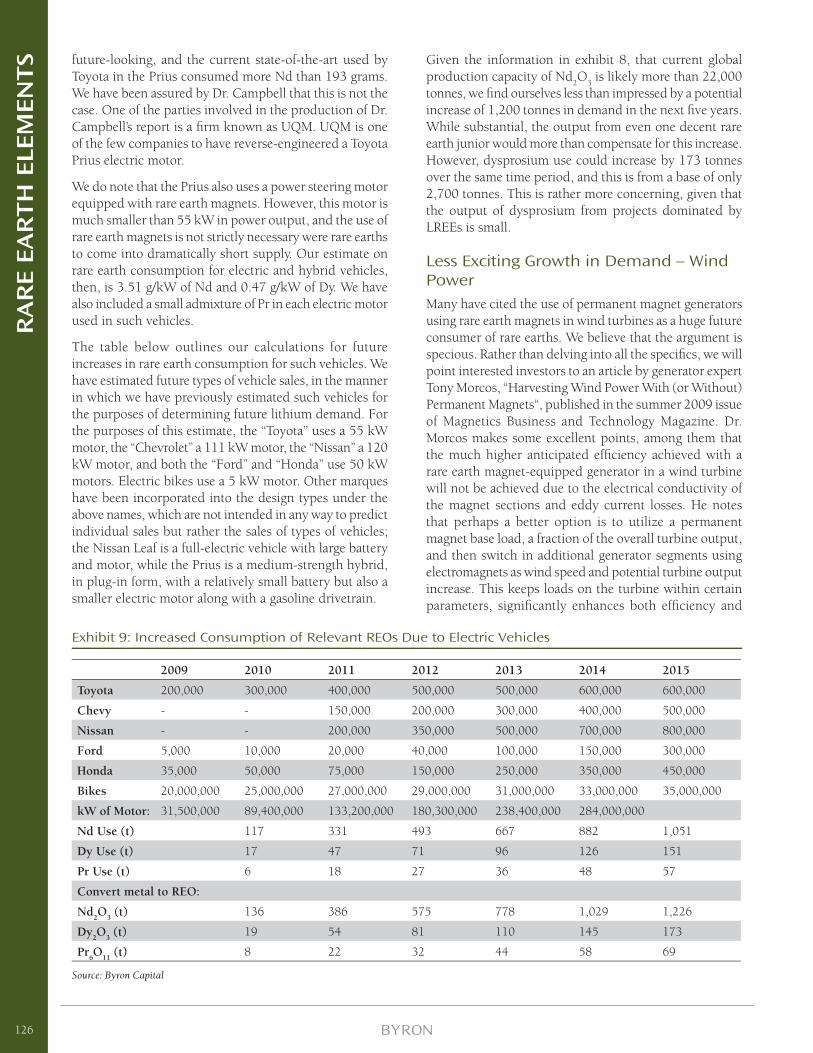
future-looking, and the current state-of-the-art used by Toyota in the Prius consumed more Nd than 193 grams. We have been assured by Dr. Campbell that this is not the case. One of the parties involved in the production of Dr. Campbell’s report is a fi rm known as UQM. UQM is one of the few companies to have reverse-engineered a Toyota Prius electric motor.
We do note that the Prius also uses a power steering motor equipped with rare earth magnets. However, this motor is much smaller than 55 kW in power output, and the use of rare earth magnets is not strictly necessary were rare earths to come into dramatically short supply. Our estimate on rare earth consumption for electric and hybrid vehicles, then, is 3.51 g/kW of Nd and 0.47 g/kW of Dy. We have also included a small admixture of Pr in each electric motor used in such vehicles.
The table below outlines our calculations for future increases in rare earth consumption for such vehicles. We have estimated future types of vehicle sales, in the manner in which we have previously estimated such vehicles for the purposes of determining future lithium demand. For the purposes of this estimate, the “Toyota” uses a 55 kW motor, the “Chevrolet” a 111 kW motor, the “Nissan” a 120 kW motor, and both the “Ford” and “Honda” use 50 kW motors. Electric bikes use a 5 kW motor. Other marques have been incorporated into the design types under the above names, which are not intended in any way to predict individual sales but rather the sales of types of vehicles; the Nissan Leaf is a full-electric vehicle with large battery and motor, while the Prius is a medium-strength hybrid, in plug-in form, with a relatively small battery but also a smaller electric motor along with a gasoline drivetrain.
Exhibit 9: Increased Consumption of Relevant REOs Due to Electric Vehicles
2009 2010 2011 2012 2013 2014 2015
Toyota 200,000 300,000 400,000 500,000 500,000 600,000 600,000
Chevy - - 150,000 200,000 300,000 400,000 500,000
Nissan - - 200,000 350,000 500,000 700,000 800,000
Ford 5,000 10,000 20,000 40,000 100,000 150,000 300,000
Honda 35,000 50,000 75,000 150,000 250,000 350,000 450,000
Bikes 20,000,000 25,000,000 27,000,000 29,000,000 31,000,000 33,000,000 35,000,000
kW of Motor: 31,500,000 89,400,000 133,200,000 180,300,000 238,400,000 284,000,000
Nd Use (t) 117 331 493 667 882 1,051
Dy Use (t) 17 47 71 96 126 151
Pr Use (t) 6 18 27 36 48 57
Convert metal to REO:
Nd2O
3 (t) 136 386 575 778 1,029 1,226
Dy2O
3 (t) 19 54 81 110 145 173
Pr6O
11 (t) 8 22 32 44 58 69
Source: Byron Capital
Given the information in exhibit 8, that current global production capacity of Nd
2O
3 is likely more than 22,000
tonnes, we fi nd ourselves less than impressed by a potential increase of 1,200 tonnes in demand in the next fi ve years. While substantial, the output from even one decent rare earth junior would more than compensate for this increase. However, dysprosium use could increase by 173 tonnes over the same time period, and this is from a base of only 2,700 tonnes. This is rather more concerning, given that the output of dysprosium from projects dominated by LREEs is small.
Less Exciting Growth in Demand – Wind PowerMany have cited the use of permanent magnet generators using rare earth magnets in wind turbines as a huge future consumer of rare earths. We believe that the argument is specious. Rather than delving into all the specifi cs, we will point interested investors to an article by generator expert Tony Morcos, “Harvesting Wind Power With (or Without) Permanent Magnets“, published in the summer 2009 issue of Magnetics Business and Technology Magazine. Dr. Morcos makes some excellent points, among them that the much higher anticipated effi ciency achieved with a rare earth magnet-equipped generator in a wind turbine will not be achieved due to the electrical conductivity of the magnet sections and eddy current losses. He notes that perhaps a better option is to utilize a permanent magnet base load, a fraction of the overall turbine output, and then switch in additional generator segments using electromagnets as wind speed and potential turbine output increase. This keeps loads on the turbine within certain parameters, signifi cantly enhances both effi ciency and
126
RA
RE E
AR
TH
ELE
MEN
TS
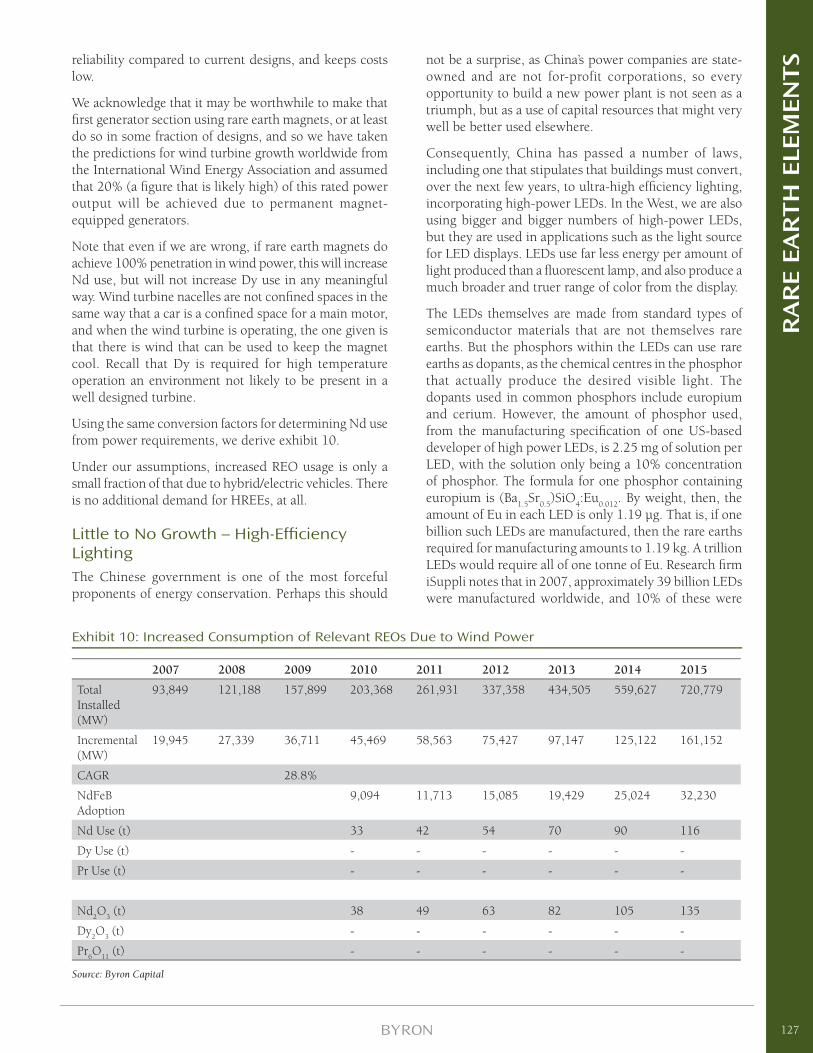
reliability compared to current designs, and keeps costs low.
We acknowledge that it may be worthwhile to make that fi rst generator section using rare earth magnets, or at least do so in some fraction of designs, and so we have taken the predictions for wind turbine growth worldwide from the International Wind Energy Association and assumed that 20% (a fi gure that is likely high) of this rated power output will be achieved due to permanent magnet-equipped generators.
Note that even if we are wrong, if rare earth magnets do achieve 100% penetration in wind power, this will increase Nd use, but will not increase Dy use in any meaningful way. Wind turbine nacelles are not confi ned spaces in the same way that a car is a confi ned space for a main motor, and when the wind turbine is operating, the one given is that there is wind that can be used to keep the magnet cool. Recall that Dy is required for high temperature operation an environment not likely to be present in a well designed turbine.
Using the same conversion factors for determining Nd use from power requirements, we derive exhibit 10.
Under our assumptions, increased REO usage is only a small fraction of that due to hybrid/electric vehicles. There is no additional demand for HREEs, at all.
Little to No Growth – High-Effi ciency LightingThe Chinese government is one of the most forceful proponents of energy conservation. Perhaps this should
Exhibit 10: Increased Consumption of Relevant REOs Due to Wind Power
2007 2008 2009 2010 2011 2012 2013 2014 2015
Total Installed (MW)
93,849 121,188 157,899 203,368 261,931 337,358 434,505 559,627 720,779
Incremental (MW)
19,945 27,339 36,711 45,469 58,563 75,427 97,147 125,122 161,152
CAGR 28.8%
NdFeB Adoption
9,094 11,713 15,085 19,429 25,024 32,230
Nd Use (t) 33 42 54 70 90 116
Dy Use (t) - - - - - -
Pr Use (t) - - - - - -
Nd2O
3 (t) 38 49 63 82 105 135
Dy2O
3 (t) - - - - - -
Pr6O
11 (t) - - - - - -
Source: Byron Capital
not be a surprise, as China’s power companies are state-owned and are not for-profit corporations, so every opportunity to build a new power plant is not seen as a triumph, but as a use of capital resources that might very well be better used elsewhere.
Consequently, China has passed a number of laws, including one that stipulates that buildings must convert, over the next few years, to ultra-high effi ciency lighting, incorporating high-power LEDs. In the West, we are also using bigger and bigger numbers of high-power LEDs, but they are used in applications such as the light source for LED displays. LEDs use far less energy per amount of light produced than a fl uorescent lamp, and also produce a much broader and truer range of color from the display.
The LEDs themselves are made from standard types of semiconductor materials that are not themselves rare earths. But the phosphors within the LEDs can use rare earths as dopants, as the chemical centres in the phosphor that actually produce the desired visible light. The dopants used in common phosphors include europium and cerium. However, the amount of phosphor used, from the manufacturing specifi cation of one US-based developer of high power LEDs, is 2.25 mg of solution per LED, with the solution only being a 10% concentration of phosphor. The formula for one phosphor containing europium is (Ba
1.5Sr
0.5)SiO
4:Eu
0.012. By weight, then, the
amount of Eu in each LED is only 1.19 µg. That is, if one billion such LEDs are manufactured, then the rare earths required for manufacturing amounts to 1.19 kg. A trillion LEDs would require all of one tonne of Eu. Research fi rm iSuppli notes that in 2007, approximately 39 billion LEDs were manufactured worldwide, and 10% of these were
127
RA
RE E
AR
TH
ELE
MEN
TS
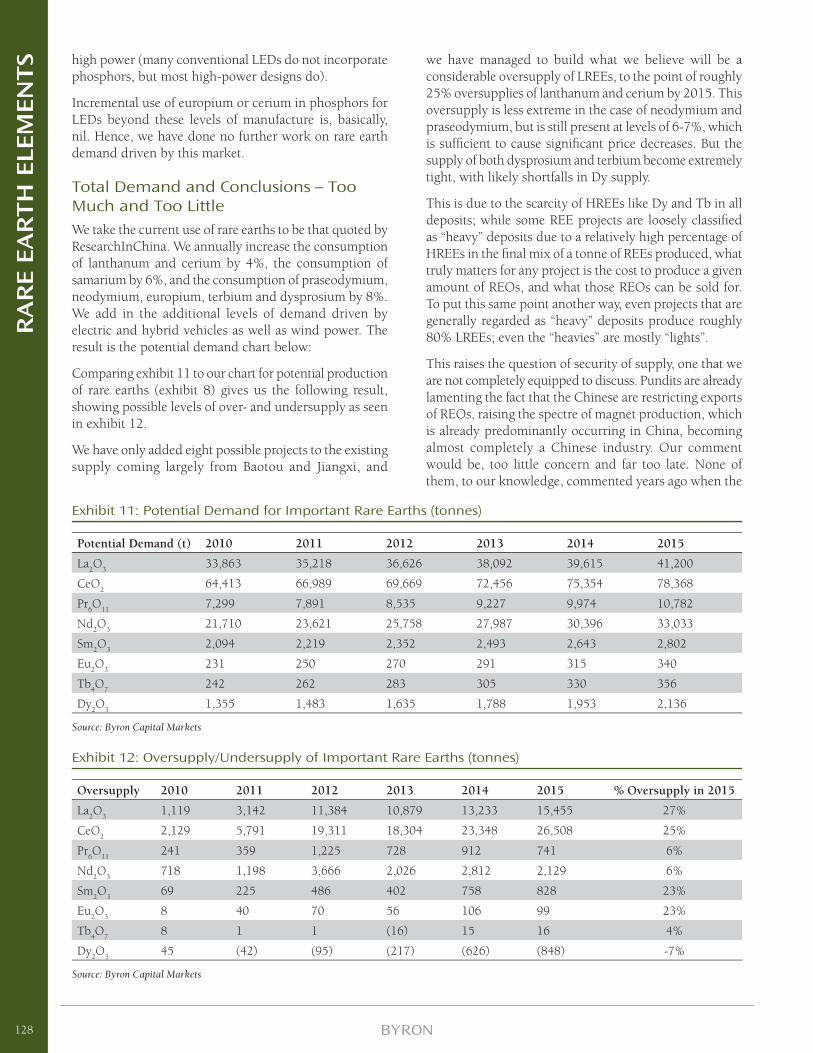
high power (many conventional LEDs do not incorporate phosphors, but most high-power designs do).
Incremental use of europium or cerium in phosphors for LEDs beyond these levels of manufacture is, basically, nil. Hence, we have done no further work on rare earth demand driven by this market.
Total Demand and Conclusions – Too Much and Too LittleWe take the current use of rare earths to be that quoted by ResearchInChina. We annually increase the consumption of lanthanum and cerium by 4%, the consumption of samarium by 6%, and the consumption of praseodymium, neodymium, europium, terbium and dysprosium by 8%. We add in the additional levels of demand driven by electric and hybrid vehicles as well as wind power. The result is the potential demand chart below:
Comparing exhibit 11 to our chart for potential production of rare earths (exhibit 8) gives us the following result, showing possible levels of over- and undersupply as seen in exhibit 12.
We have only added eight possible projects to the existing supply coming largely from Baotou and Jiangxi, and
Exhibit 11: Potential Demand for Important Rare Earths (tonnes)
Potential Demand (t) 2010 2011 2012 2013 2014 2015
La2O
333,863 35,218 36,626 38,092 39,615 41,200
CeO2
64,413 66,989 69,669 72,456 75,354 78,368
Pr6O
117,299 7,891 8,535 9,227 9,974 10,782
Nd2O
321,710 23,621 25,758 27,987 30,396 33,033
Sm2O
32,094 2,219 2,352 2,493 2,643 2,802
Eu2O
3231 250 270 291 315 340
Tb4O
7242 262 283 305 330 356
Dy2O
31,355 1,483 1,635 1,788 1,953 2,136
Source: Byron Capital Markets
Exhibit 12: Oversupply/Undersupply of Important Rare Earths (tonnes)
Oversupply 2010 2011 2012 2013 2014 2015 % Oversupply in 2015
La2O
31,119 3,142 11,384 10,879 13,233 15,455 27%
CeO2
2,129 5,791 19,311 18,304 23,348 26,508 25%
Pr6O
11241 359 1,225 728 912 741 6%
Nd2O
3718 1,198 3,666 2,026 2,812 2,129 6%
Sm2O
369 225 486 402 758 828 23%
Eu2O
38 40 70 56 106 99 23%
Tb4O
78 1 1 (16) 15 16 4%
Dy2O
345 (42) (95) (217) (626) (848) -7%
Source: Byron Capital Markets
we have managed to build what we believe will be a considerable oversupply of LREEs, to the point of roughly 25% oversupplies of lanthanum and cerium by 2015. This oversupply is less extreme in the case of neodymium and praseodymium, but is still present at levels of 6-7%, which is suffi cient to cause signifi cant price decreases. But the supply of both dysprosium and terbium become extremely tight, with likely shortfalls in Dy supply.
This is due to the scarcity of HREEs like Dy and Tb in all deposits; while some REE projects are loosely classifi ed as “heavy” deposits due to a relatively high percentage of HREEs in the fi nal mix of a tonne of REEs produced, what truly matters for any project is the cost to produce a given amount of REOs, and what those REOs can be sold for. To put this same point another way, even projects that are generally regarded as “heavy” deposits produce roughly 80% LREEs; even the “heavies” are mostly “lights”.
This raises the question of security of supply, one that we are not completely equipped to discuss. Pundits are already lamenting the fact that the Chinese are restricting exports of REOs, raising the spectre of magnet production, which is already predominantly occurring in China, becoming almost completely a Chinese industry. Our comment would be, too little concern and far too late. None of them, to our knowledge, commented years ago when the
128
RA
RE E
AR
TH
ELE
MEN
TS
production of REOs became centered in China. None of them commented when the fi rst companies making powders and rare earth magnets were purchased by the Chinese, giving them a signifi cant head-start into the magnet industry.
Since the numbers indicate that we will be unable to ramp the production of REOs outside of China suffi ciently quickly to make it possible to keep magnet production out of China, should the Chinese decide to simply curtail all shipments of neodymium oxide, for example, then we should prepare for the inevitable on two fronts. First, we need to come to terms with the fact that we will be buying our magnets in the future from Chinese companies, and acquire those relationships and make the necessary arrangements now. The second is that we should emphasize the right areas of research. We may be able to produce suffi cient LREEs, given time, to rebuild a high-value automotive magnet industry, but only if alternatives to the use of Dy and Tb to improve high-temperature operation can be found. Alternatively, if you can’t beat them, then improve on them, and instead of building better magnets, simply take Chinese magnets and build the best motors and generators in the world, moving farther up the value chain. There are many ways to continue to make money, even if Chinese business is the only source for rare earth magnets.
As far as investment in rare earth companies is concerned, our simple belief is that there are three fi gures of merit that matter for a REE project. One is the grade of REO in the ground; the higher the grade, the fewer tonnes of ore must be extracted and processed to yield a tonne of REO, and this keeps costs down. The second is the relative ratio of LREEs to HREEs; we are concerned that the price of LREEs may well remain level or go down over time, as more projects come into production to supply critical HREEs to the magnet and automotive industries. As long as companies can earn incremental positive cash fl ows from the production of LREEs, they will continue to produce, and this will keep LREEs in abundant supply. Finally, the last fi gure of merit is the absolute level of production of HREEs; we believe Dy and Tb will be in short supply, driving up their price and shifting the economics of projects in favour of those that can produce a large quantity of HREEs. Note that this does NOT mean we are against projects that are classifi ed as “light” deposits, just that we would rather invest in a project, all else equal, that has high grade TREOs in the ground, a relatively high abundance of Dy and Tb, and that is able to produce relatively large quantities of REOs, thus having reasonable amounts of HREEs for sale. If no new LREE projects were to come into production, all REEs will be in short supply in relatively short order.
However, we wish to caution investors in this market that not all REE companies are worth their asking price. We
do not believe that REO demand will rise so rapidly and for such an extended time that every project will make money. Such a belief is, we believe, patently incorrect, and investors who are holding companies that have deposits with low grades of REOs in the ground, requiring too many tonnes of ore to be processed just to produce a small annual level of predominantly LREEs, are treading on thin ice. We suggest investors carefully examine where they are putting their dollars in this market, and pick their spots with care.
129
RA
RE E
AR
TH
ELE
MEN
TS
IMPORTANT DISCLOSURES
Analyst’s Certifi cation
All of the views expressed in this report accurately refl ect the personal views of the responsible analyst(s) about any and all of the subject securities or issuers. No part of the compensation of the responsible analyst(s) named herein is, or will be, directly or indirectly, related to the specifi c recommendations or views expressed by the responsible analyst(s) in this report. The particulars contained herein were obtained from sources which we believe to be reliable but are not guaranteed by us and may be incomplete.
Byron Capital Markets (“BCM”) is a division of Byron Securities Limited which is a Member of IIROC and CIPF. BCM compensates its research analysts from a variety of sources. The research department is a cost centre and is funded by the business activities of BCM including institutional equity sales and trading, retail sales and corporate and investment banking. Since the revenues from these businesses vary the funds for research compensation vary. No one business line has greater infl uence than any other for research analyst compensation.
Dissemination of Research
BCM endeavors to make all reasonable efforts to provide research simultaneously to all eligible clients. BCM equity research is distributed electronically via email and is posted on our proprietary websites to ensure eligible clients receive coverage initiations and ratings changes, targets and opinions in a timely manner. Additional distribution may be done by the sales personnel via email, fax or regular mail. Clients may also receive our research via a third party.
Investment Rating Criteria
BUY The security represents attractive value and is expected to appreciate signifi cantly from the current price over the next 12-18 month time horizon.
SPECULATIVE BUY The security is considered a BUY but in the analyst’s opinion possesses certain operational and/or fi nancial risks that may be higher than average.
HOLD The security represents fair value and no material appreciation is expected over the next 12-18 month time horizon.
SELL The security represents poor value and is expected to depreciate over the next 12-18 month time horizon.
Other Disclosures
This report has been approved by BCM which takes responsibility for this report and its dissemination in Canada. Canadian clients wishing to effect transactions in any security discussed should do so through a qualifi ed salesperson of BCM.
Informational Reports
From time to time BCM issues reports that are for information purposes only and will not include investment ratings. This report is an informational report.
130
RA
RE E
AR
TH
ELE
MEN
TS
The following section has been prepared by:Gabriela Casasnovas, Associate
Elisa Chio, Associate
RARE EARTH ELEMENTSFor the company snapshots:
1. Currency used is native to the exchange.
2. Unless otherwise stated and except for per share data, all values are listed in millions.
3. Abbreviations used:
a. N/A – Not available
b. WI – Working interest
4. JORC is the acronym for the Australasian Joint Ore Reserves Committee who has set the standards for the reporting of mineral resources and ore reserves. From a mineral resource point of view, this Australasian standard is considered comparable to the Canadian Securities Administrators NI 43-101 with the distinction that NI 43-101 is a securities disclosure whereas JORC is a mineral disclosure.
a. For further information on JORC, please visit http://www.jorc.org/.
5. Ownership refers to working interest in the project.
6. All fi nancial information have been sourced from Capital IQ, https://www.capitaliq.com/.
131
RA
RE E
AR
TH
ELE
MEN
TS
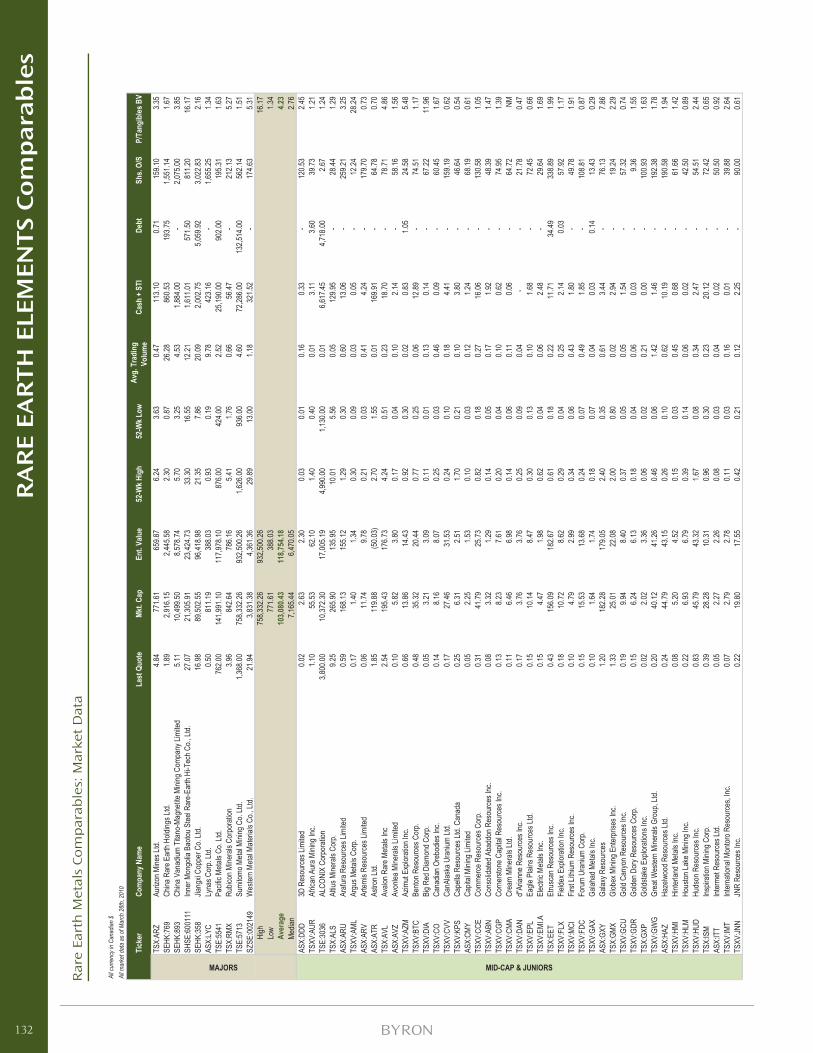
Rar
e Ea
rth
Met
als
Com
par
able
s: M
arke
t D
ata
132
RA
RE E
AR
TH
ELE
MEN
TS
Co
mp
ara
ble
s
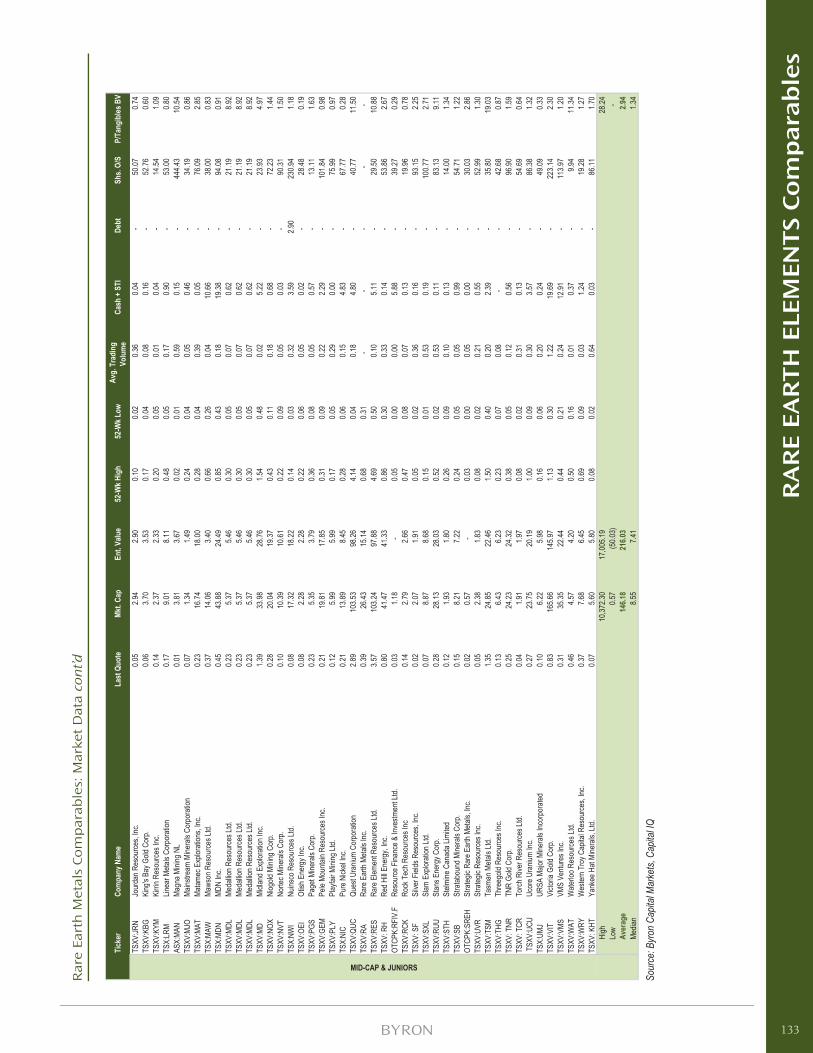
Rar
e Ea
rth
Met
als
Com
par
able
s: M
arke
t D
ata
con
t’d
Sour
ce: B
yron
Cap
ital M
arke
ts, C
apita
l IQ
133
RA
RE E
AR
TH
ELE
MEN
TS
Co
mp
ara
ble
s
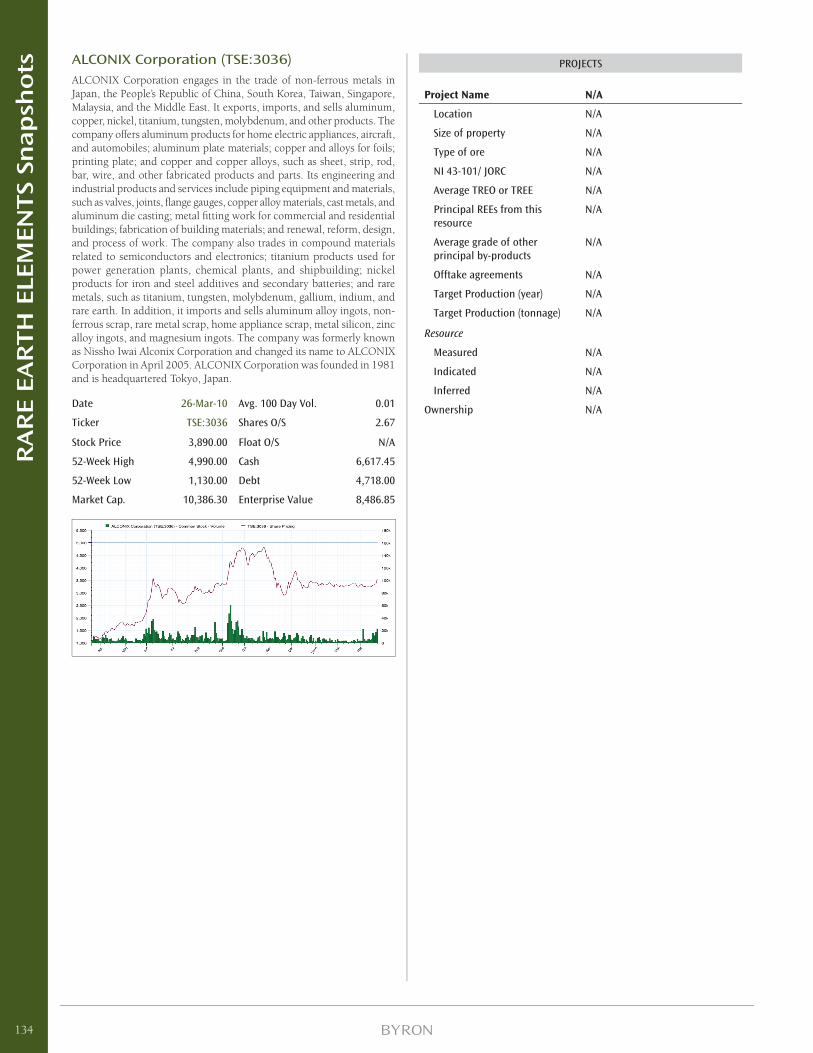
ALCONIX Corporation (TSE:3036)ALCONIX Corporation engages in the trade of non-ferrous metals in Japan, the People’s Republic of China, South Korea, Taiwan, Singapore, Malaysia, and the Middle East. It exports, imports, and sells aluminum, copper, nickel, titanium, tungsten, molybdenum, and other products. The company offers aluminum products for home electric appliances, aircraft, and automobiles; aluminum plate materials; copper and alloys for foils; printing plate; and copper and copper alloys, such as sheet, strip, rod, bar, wire, and other fabricated products and parts. Its engineering and industrial products and services include piping equipment and materials, such as valves, joints, fl ange gauges, copper alloy materials, cast metals, and aluminum die casting; metal fi tting work for commercial and residential buildings; fabrication of building materials; and renewal, reform, design, and process of work. The company also trades in compound materials related to semiconductors and electronics; titanium products used for power generation plants, chemical plants, and shipbuilding; nickel products for iron and steel additives and secondary batteries; and rare metals, such as titanium, tungsten, molybdenum, gallium, indium, and rare earth. In addition, it imports and sells aluminum alloy ingots, non-ferrous scrap, rare metal scrap, home appliance scrap, metal silicon, zinc alloy ingots, and magnesium ingots. The company was formerly known as Nissho Iwai Alconix Corporation and changed its name to ALCONIX Corporation in April 2005. ALCONIX Corporation was founded in 1981 and is headquartered Tokyo, Japan.
Date 26-Mar-10 Avg. 100 Day Vol. 0.01
Ticker TSE:3036 Shares O/S 2.67
Stock Price 3,890.00 Float O/S N/A
52-Week High 4,990.00 Cash 6,617.45
52-Week Low 1,130.00 Debt 4,718.00
Market Cap. 10,386.30 Enterprise Value 8,486.85
PROJECTS
Project Name N/A
Location N/A
Size of property N/A
Type of ore N/A
NI 43-101/ JORC N/A
Average TREO or TREE N/A
Principal REEs from this resource
N/A
Average grade of other principal by-products
N/A
Offtake agreements N/A
Target Production (year) N/A
Target Production (tonnage) N/A
Resource
Measured N/A
Indicated N/A
Inferred N/A
Ownership N/A
134
RA
RE E
AR
TH
ELE
MEN
TS
Snap
sho
ts
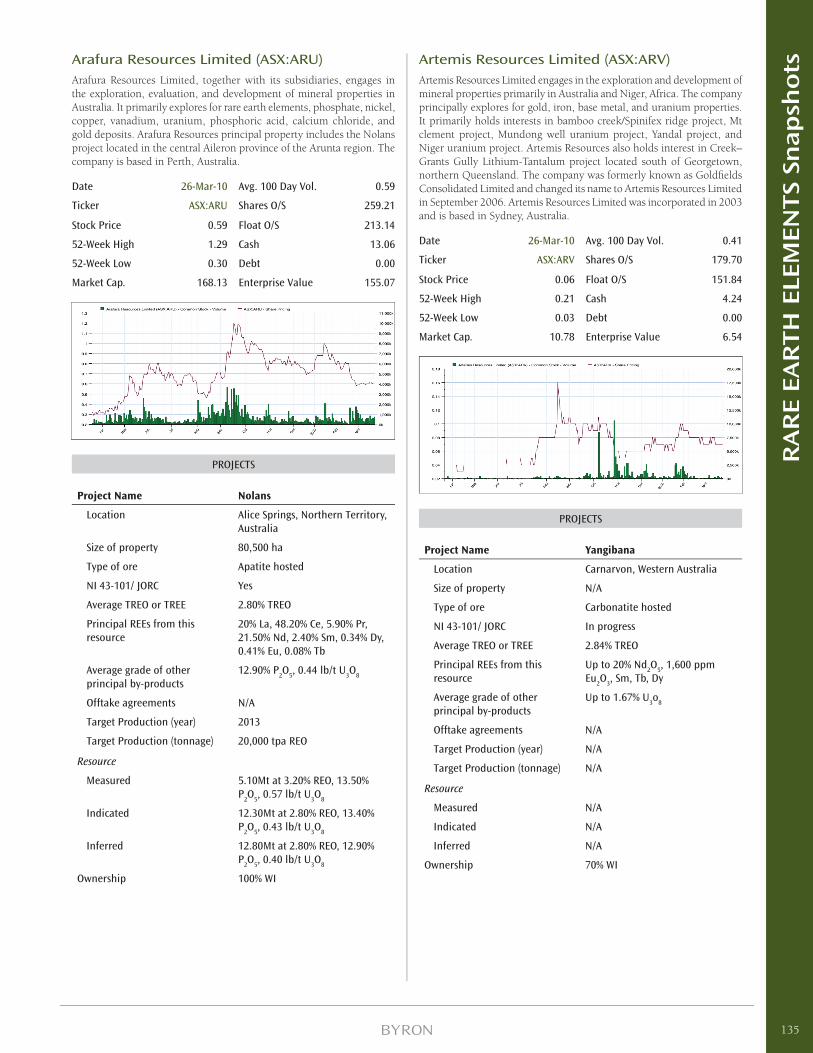
Arafura Resources Limited (ASX:ARU)Arafura Resources Limited, together with its subsidiaries, engages in the exploration, evaluation, and development of mineral properties in Australia. It primarily explores for rare earth elements, phosphate, nickel, copper, vanadium, uranium, phosphoric acid, calcium chloride, and gold deposits. Arafura Resources principal property includes the Nolans project located in the central Aileron province of the Arunta region. The company is based in Perth, Australia.
Date 26-Mar-10 Avg. 100 Day Vol. 0.59
Ticker ASX:ARU Shares O/S 259.21
Stock Price 0.59 Float O/S 213.14
52-Week High 1.29 Cash 13.06
52-Week Low 0.30 Debt 0.00
Market Cap. 168.13 Enterprise Value 155.07
PROJECTS
Project Name Nolans
Location Alice Springs, Northern Territory, Australia
Size of property 80,500 ha
Type of ore Apatite hosted
NI 43-101/ JORC Yes
Average TREO or TREE 2.80% TREO
Principal REEs from this resource
20% La, 48.20% Ce, 5.90% Pr, 21.50% Nd, 2.40% Sm, 0.34% Dy, 0.41% Eu, 0.08% Tb
Average grade of other principal by-products
12.90% P2O
5, 0.44 lb/t U
3O
8
Offtake agreements N/A
Target Production (year) 2013
Target Production (tonnage) 20,000 tpa REO
Resource
Measured 5.10Mt at 3.20% REO, 13.50% P
2O
5, 0.57 lb/t U
3O
8
Indicated 12.30Mt at 2.80% REO, 13.40% P
2O
5, 0.43 lb/t U
3O
8
Inferred 12.80Mt at 2.80% REO, 12.90% P
2O
5, 0.40 lb/t U
3O
8
Ownership 100% WI
Artemis Resources Limited (ASX:ARV)Artemis Resources Limited engages in the exploration and development of mineral properties primarily in Australia and Niger, Africa. The company principally explores for gold, iron, base metal, and uranium properties. It primarily holds interests in bamboo creek/Spinifex ridge project, Mt clement project, Mundong well uranium project, Yandal project, and Niger uranium project. Artemis Resources also holds interest in Creek–Grants Gully Lithium-Tantalum project located south of Georgetown, northern Queensland. The company was formerly known as Goldfi elds Consolidated Limited and changed its name to Artemis Resources Limited in September 2006. Artemis Resources Limited was incorporated in 2003 and is based in Sydney, Australia.
Date 26-Mar-10 Avg. 100 Day Vol. 0.41
Ticker ASX:ARV Shares O/S 179.70
Stock Price 0.06 Float O/S 151.84
52-Week High 0.21 Cash 4.24
52-Week Low 0.03 Debt 0.00
Market Cap. 10.78 Enterprise Value 6.54
PROJECTS
Project Name Yangibana
Location Carnarvon, Western Australia
Size of property N/A
Type of ore Carbonatite hosted
NI 43-101/ JORC In progress
Average TREO or TREE 2.84% TREO
Principal REEs from this resource
Up to 20% Nd2O
5, 1,600 ppm
Eu2O
3, Sm, Tb, Dy
Average grade of other principal by-products
Up to 1.67% U3o
8
Offtake agreements N/A
Target Production (year) N/A
Target Production (tonnage) N/A
Resource
Measured N/A
Indicated N/A
Inferred N/A
Ownership 70% WI
135
RA
RE E
AR
TH
ELE
MEN
TS
Snap
sho
ts
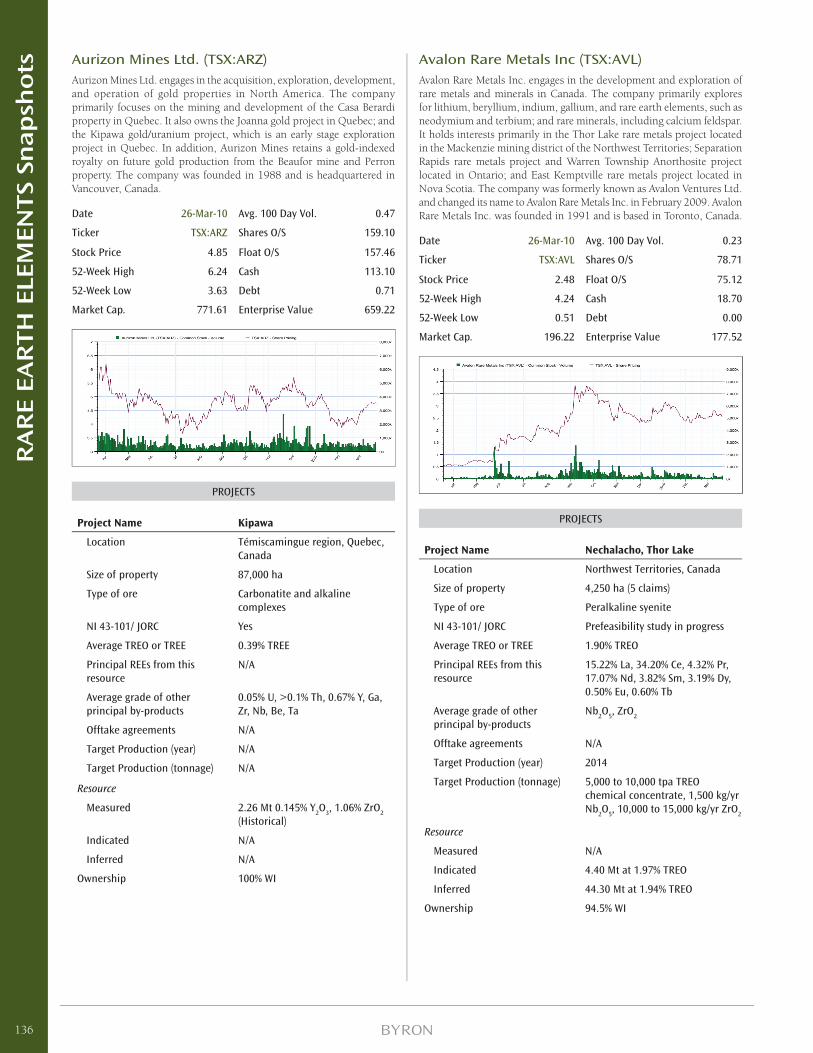
Aurizon Mines Ltd. (TSX:ARZ)Aurizon Mines Ltd. engages in the acquisition, exploration, development, and operation of gold properties in North America. The company primarily focuses on the mining and development of the Casa Berardi property in Quebec. It also owns the Joanna gold project in Quebec; and the Kipawa gold/uranium project, which is an early stage exploration project in Quebec. In addition, Aurizon Mines retains a gold-indexed royalty on future gold production from the Beaufor mine and Perron property. The company was founded in 1988 and is headquartered in Vancouver, Canada.
Date 26-Mar-10 Avg. 100 Day Vol. 0.47
Ticker TSX:ARZ Shares O/S 159.10
Stock Price 4.85 Float O/S 157.46
52-Week High 6.24 Cash 113.10
52-Week Low 3.63 Debt 0.71
Market Cap. 771.61 Enterprise Value 659.22
PROJECTS
Project Name Kipawa
Location Témiscamingue region, Quebec, Canada
Size of property 87,000 ha
Type of ore Carbonatite and alkaline complexes
NI 43-101/ JORC Yes
Average TREO or TREE 0.39% TREE
Principal REEs from this resource
N/A
Average grade of other principal by-products
0.05% U, >0.1% Th, 0.67% Y, Ga, Zr, Nb, Be, Ta
Offtake agreements N/A
Target Production (year) N/A
Target Production (tonnage) N/A
Resource
Measured 2.26 Mt 0.145% Y2O
3, 1.06% ZrO
2
(Historical)
Indicated N/A
Inferred N/A
Ownership 100% WI
Avalon Rare Metals Inc (TSX:AVL)Avalon Rare Metals Inc. engages in the development and exploration of rare metals and minerals in Canada. The company primarily explores for lithium, beryllium, indium, gallium, and rare earth elements, such as neodymium and terbium; and rare minerals, including calcium feldspar. It holds interests primarily in the Thor Lake rare metals project located in the Mackenzie mining district of the Northwest Territories; Separation Rapids rare metals project and Warren Township Anorthosite project located in Ontario; and East Kemptville rare metals project located in Nova Scotia. The company was formerly known as Avalon Ventures Ltd. and changed its name to Avalon Rare Metals Inc. in February 2009. Avalon Rare Metals Inc. was founded in 1991 and is based in Toronto, Canada.
Date 26-Mar-10 Avg. 100 Day Vol. 0.23
Ticker TSX:AVL Shares O/S 78.71
Stock Price 2.48 Float O/S 75.12
52-Week High 4.24 Cash 18.70
52-Week Low 0.51 Debt 0.00
Market Cap. 196.22 Enterprise Value 177.52
PROJECTS
Project Name Nechalacho, Thor Lake
Location Northwest Territories, Canada
Size of property 4,250 ha (5 claims)
Type of ore Peralkaline syenite
NI 43-101/ JORC Prefeasibility study in progress
Average TREO or TREE 1.90% TREO
Principal REEs from this resource
15.22% La, 34.20% Ce, 4.32% Pr, 17.07% Nd, 3.82% Sm, 3.19% Dy, 0.50% Eu, 0.60% Tb
Average grade of other principal by-products
Nb2O
5, ZrO
2
Offtake agreements N/A
Target Production (year) 2014
Target Production (tonnage) 5,000 to 10,000 tpa TREO chemical concentrate, 1,500 kg/yr Nb
2O
5, 10,000 to 15,000 kg/yr ZrO
2
Resource
Measured N/A
Indicated 4.40 Mt at 1.97% TREO
Inferred 44.30 Mt at 1.94% TREO
Ownership 94.5% WI
136
RA
RE E
AR
TH
ELE
MEN
TS
Snap
sho
ts
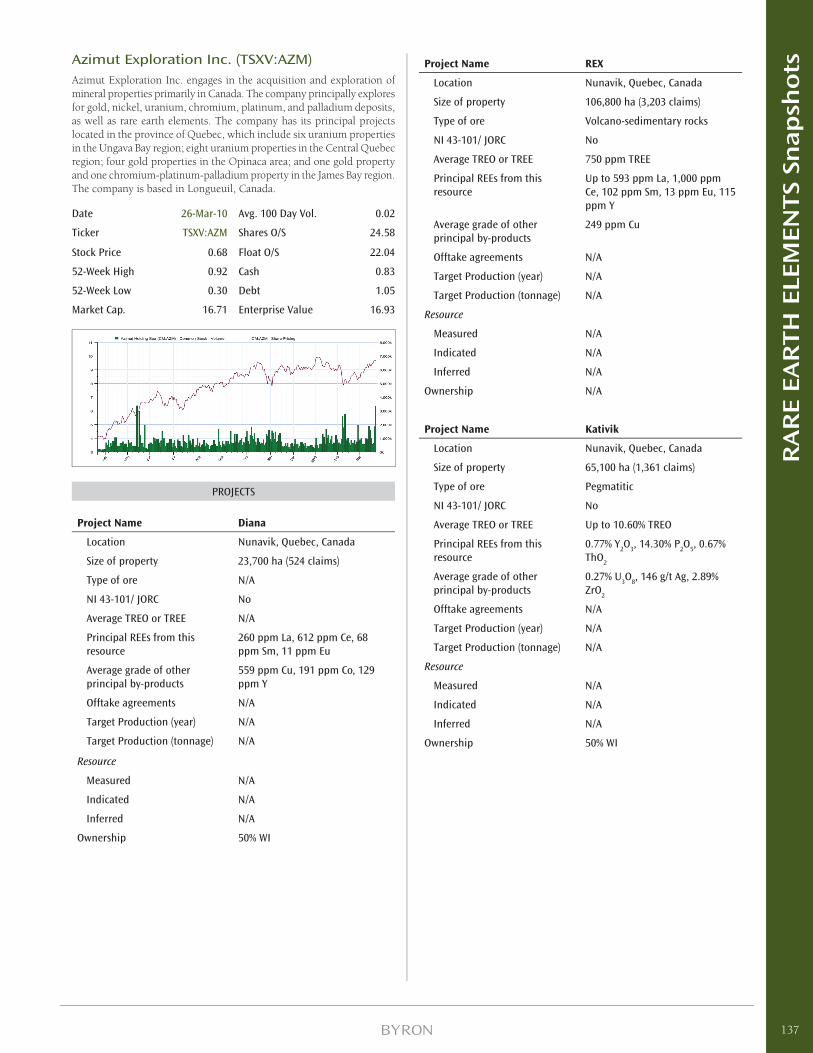
Azimut Exploration Inc. (TSXV:AZM)Azimut Exploration Inc. engages in the acquisition and exploration of mineral properties primarily in Canada. The company principally explores for gold, nickel, uranium, chromium, platinum, and palladium deposits, as well as rare earth elements. The company has its principal projects located in the province of Quebec, which include six uranium properties in the Ungava Bay region; eight uranium properties in the Central Quebec region; four gold properties in the Opinaca area; and one gold property and one chromium-platinum-palladium property in the James Bay region. The company is based in Longueuil, Canada.
Date 26-Mar-10 Avg. 100 Day Vol. 0.02
Ticker TSXV:AZM Shares O/S 24.58
Stock Price 0.68 Float O/S 22.04
52-Week High 0.92 Cash 0.83
52-Week Low 0.30 Debt 1.05
Market Cap. 16.71 Enterprise Value 16.93
PROJECTS
Project Name Diana
Location Nunavik, Quebec, Canada
Size of property 23,700 ha (524 claims)
Type of ore N/A
NI 43-101/ JORC No
Average TREO or TREE N/A
Principal REEs from this resource
260 ppm La, 612 ppm Ce, 68 ppm Sm, 11 ppm Eu
Average grade of other principal by-products
559 ppm Cu, 191 ppm Co, 129 ppm Y
Offtake agreements N/A
Target Production (year) N/A
Target Production (tonnage) N/A
Resource
Measured N/A
Indicated N/A
Inferred N/A
Ownership 50% WI
Project Name REX
Location Nunavik, Quebec, Canada
Size of property 106,800 ha (3,203 claims)
Type of ore Volcano-sedimentary rocks
NI 43-101/ JORC No
Average TREO or TREE 750 ppm TREE
Principal REEs from this resource
Up to 593 ppm La, 1,000 ppm Ce, 102 ppm Sm, 13 ppm Eu, 115 ppm Y
Average grade of other principal by-products
249 ppm Cu
Offtake agreements N/A
Target Production (year) N/A
Target Production (tonnage) N/A
Resource
Measured N/A
Indicated N/A
Inferred N/A
Ownership N/A
Project Name Kativik
Location Nunavik, Quebec, Canada
Size of property 65,100 ha (1,361 claims)
Type of ore Pegmatitic
NI 43-101/ JORC No
Average TREO or TREE Up to 10.60% TREO
Principal REEs from this resource
0.77% Y2O
3, 14.30% P
2O
5, 0.67%
ThO2
Average grade of other principal by-products
0.27% U3O
8, 146 g/t Ag, 2.89%
ZrO2
Offtake agreements N/A
Target Production (year) N/A
Target Production (tonnage) N/A
Resource
Measured N/A
Indicated N/A
Inferred N/A
Ownership 50% WI
137
RA
RE E
AR
TH
ELE
MEN
TS
Snap
sho
ts

Bolero Resources Corp. (TSXV:BRU)Bolero Resources Corp., a development stage company, engages in the acquisition and exploration of precious and base metal properties in Canada and the United States. The company primarily explores for molybdenum, copper, and gold properties. It focuses on the Bald Butte property located in southwestern Montana; and Cannivan Gulch molybdenum project located in northern Beaverhead County, Montana; Arcadia Bay project located in Nunavut territory; and the Copper Star project located in Montana. The company was formerly known as United Bolero Development Corp. and changed its name to Bolero Resources Corp in September 2007. Bolero Resources Corp. was incorporated in 1985 and is headquartered in Vancouver, Canada.
Date 26-Mar-10 Avg. 100 Day Vol. 0.04
Ticker TSXV:BRU Shares O/S 17.10
Stock Price 0.29 Float O/S 13.46
52-Week High 0.69 Cash 0.01
52-Week Low 0.19 Debt 0.00
Market Cap. 4.96 Enterprise Value 4.95
PROJECTS
Project Name Carbonatite Syndicate
Location Prince George, British Columbia, Canada
Size of property 16,072 ha (43 mineral claims)
Type of ore Carbonatite-syenite breccia intrusive complex
NI 43-101/ JORC No
Average TREO or TREE 2.92% TREE
Principal REEs from this resource
N/A
Average grade of other principal by-products
N/A
Offtake agreements N/A
Target Production (year) N/A
Target Production (tonnage) N/A
Resource
Measured N/A
Indicated N/A
Inferred N/A
Ownership Option to acquire 100% interest
Big Red Diamond Corp. (TSXV:DIA)Big Red Diamond Corporation engages in the acquisition, exploration, and development of mineral resource properties, primarily uranium, gold, and diamond ores in Ontario and Quebec, Canada. The company has a joint venture agreement with Melkior Resources Inc. to explore the Bristol property located in the Bristol Township of West Timmins, Ontario. Big Red Diamond Corporation was founded in 1999 and is headquartered in Montreal, Canada.
Date 26-Mar-10 Avg. 100 Day Vol. 0.12
Ticker TSXV:DIA Shares O/S 67.22
Stock Price 0.05 Float O/S 57.36
52-Week High 0.11 Cash 0.14
52-Week Low 0.01 Debt 0.00
Market Cap. 3.36 Enterprise Value 3.22
PROJECTS
Project Name J6L1
Location Septiles, Quebec, Canada
Size of property 4,715 ha (86 claims)
Type of ore N/A
NI 43-101/ JORC No
Average TREO or TREE N/A
Principal REEs from this resource
0.08% Y, 0.455% La
Average grade of other principal by-products
2.63% Nb2O
5, 0.21% Ta
2O
5, 7.62%
Zr, 0.025% ThO2
Offtake agreements N/A
Target Production (year) N/A
Target Production (tonnage) N/A
Resource
Measured N/A
Indicated N/A
Inferred N/A
Ownership 100% WI
138
RA
RE E
AR
TH
ELE
MEN
TS
Snap
sho
ts
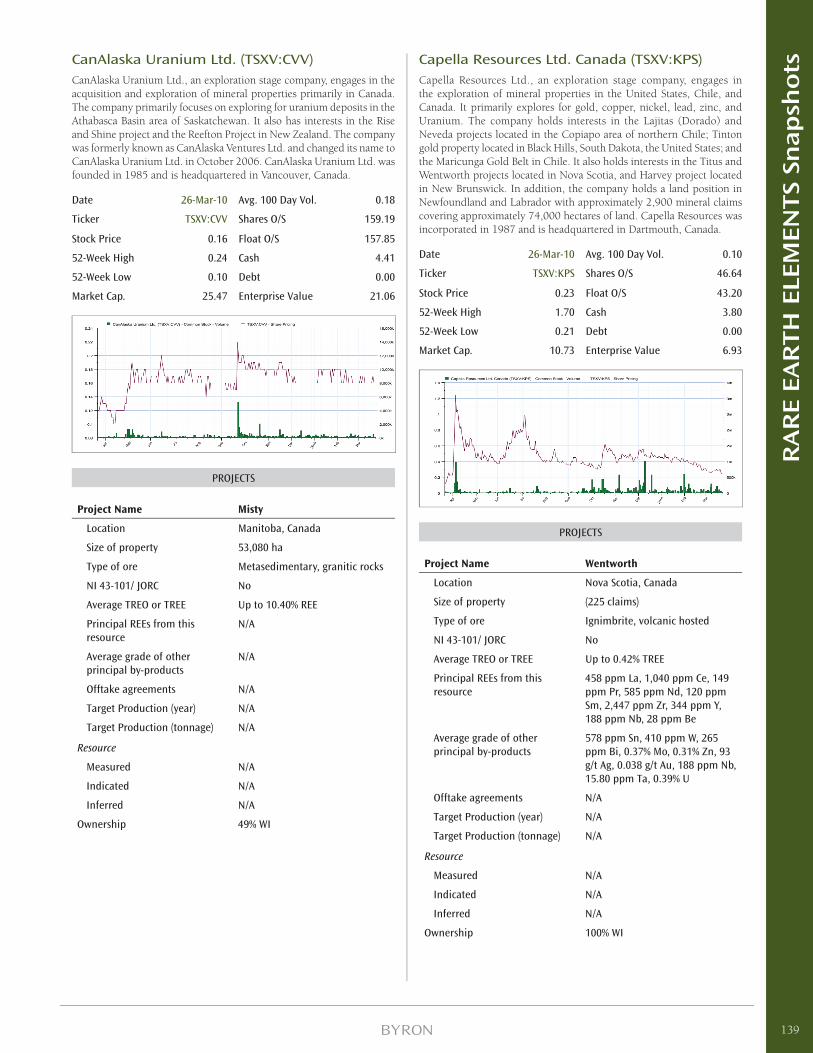
Capella Resources Ltd. Canada (TSXV:KPS)Capella Resources Ltd., an exploration stage company, engages in the exploration of mineral properties in the United States, Chile, and Canada. It primarily explores for gold, copper, nickel, lead, zinc, and Uranium. The company holds interests in the Lajitas (Dorado) and Neveda projects located in the Copiapo area of northern Chile; Tinton gold property located in Black Hills, South Dakota, the United States; and the Maricunga Gold Belt in Chile. It also holds interests in the Titus and Wentworth projects located in Nova Scotia, and Harvey project located in New Brunswick. In addition, the company holds a land position in Newfoundland and Labrador with approximately 2,900 mineral claims covering approximately 74,000 hectares of land. Capella Resources was incorporated in 1987 and is headquartered in Dartmouth, Canada.
Date 26-Mar-10 Avg. 100 Day Vol. 0.10
Ticker TSXV:KPS Shares O/S 46.64
Stock Price 0.23 Float O/S 43.20
52-Week High 1.70 Cash 3.80
52-Week Low 0.21 Debt 0.00
Market Cap. 10.73 Enterprise Value 6.93
PROJECTS
Project Name Wentworth
Location Nova Scotia, Canada
Size of property (225 claims)
Type of ore Ignimbrite, volcanic hosted
NI 43-101/ JORC No
Average TREO or TREE Up to 0.42% TREE
Principal REEs from this resource
458 ppm La, 1,040 ppm Ce, 149 ppm Pr, 585 ppm Nd, 120 ppm Sm, 2,447 ppm Zr, 344 ppm Y, 188 ppm Nb, 28 ppm Be
Average grade of other principal by-products
578 ppm Sn, 410 ppm W, 265 ppm Bi, 0.37% Mo, 0.31% Zn, 93 g/t Ag, 0.038 g/t Au, 188 ppm Nb, 15.80 ppm Ta, 0.39% U
Offtake agreements N/A
Target Production (year) N/A
Target Production (tonnage) N/A
Resource
Measured N/A
Indicated N/A
Inferred N/A
Ownership 100% WI
CanAlaska Uranium Ltd. (TSXV:CVV)CanAlaska Uranium Ltd., an exploration stage company, engages in the acquisition and exploration of mineral properties primarily in Canada. The company primarily focuses on exploring for uranium deposits in the Athabasca Basin area of Saskatchewan. It also has interests in the Rise and Shine project and the Reefton Project in New Zealand. The company was formerly known as CanAlaska Ventures Ltd. and changed its name to CanAlaska Uranium Ltd. in October 2006. CanAlaska Uranium Ltd. was founded in 1985 and is headquartered in Vancouver, Canada.
Date 26-Mar-10 Avg. 100 Day Vol. 0.18
Ticker TSXV:CVV Shares O/S 159.19
Stock Price 0.16 Float O/S 157.85
52-Week High 0.24 Cash 4.41
52-Week Low 0.10 Debt 0.00
Market Cap. 25.47 Enterprise Value 21.06
PROJECTS
Project Name Misty
Location Manitoba, Canada
Size of property 53,080 ha
Type of ore Metasedimentary, granitic rocks
NI 43-101/ JORC No
Average TREO or TREE Up to 10.40% REE
Principal REEs from this resource
N/A
Average grade of other principal by-products
N/A
Offtake agreements N/A
Target Production (year) N/A
Target Production (tonnage) N/A
Resource
Measured N/A
Indicated N/A
Inferred N/A
Ownership 49% WI
139
RA
RE E
AR
TH
ELE
MEN
TS
Snap
sho
ts
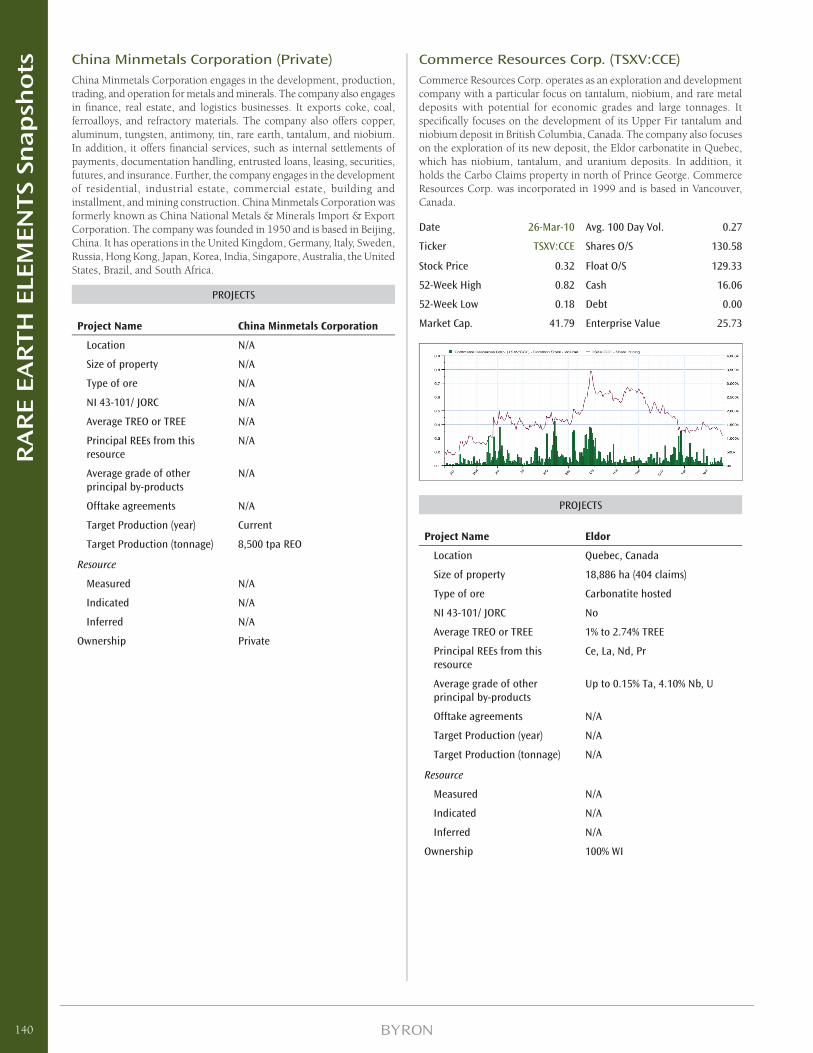
Commerce Resources Corp. (TSXV:CCE)Commerce Resources Corp. operates as an exploration and development company with a particular focus on tantalum, niobium, and rare metal deposits with potential for economic grades and large tonnages. It specifi cally focuses on the development of its Upper Fir tantalum and niobium deposit in British Columbia, Canada. The company also focuses on the exploration of its new deposit, the Eldor carbonatite in Quebec, which has niobium, tantalum, and uranium deposits. In addition, it holds the Carbo Claims property in north of Prince George. Commerce Resources Corp. was incorporated in 1999 and is based in Vancouver, Canada.
Date 26-Mar-10 Avg. 100 Day Vol. 0.27
Ticker TSXV:CCE Shares O/S 130.58
Stock Price 0.32 Float O/S 129.33
52-Week High 0.82 Cash 16.06
52-Week Low 0.18 Debt 0.00
Market Cap. 41.79 Enterprise Value 25.73
PROJECTS
Project Name Eldor
Location Quebec, Canada
Size of property 18,886 ha (404 claims)
Type of ore Carbonatite hosted
NI 43-101/ JORC No
Average TREO or TREE 1% to 2.74% TREE
Principal REEs from this resource
Ce, La, Nd, Pr
Average grade of other principal by-products
Up to 0.15% Ta, 4.10% Nb, U
Offtake agreements N/A
Target Production (year) N/A
Target Production (tonnage) N/A
Resource
Measured N/A
Indicated N/A
Inferred N/A
Ownership 100% WI
China Minmetals Corporation (Private)China Minmetals Corporation engages in the development, production, trading, and operation for metals and minerals. The company also engages in fi nance, real estate, and logistics businesses. It exports coke, coal, ferroalloys, and refractory materials. The company also offers copper, aluminum, tungsten, antimony, tin, rare earth, tantalum, and niobium. In addition, it offers fi nancial services, such as internal settlements of payments, documentation handling, entrusted loans, leasing, securities, futures, and insurance. Further, the company engages in the development of residential, industrial estate, commercial estate, building and installment, and mining construction. China Minmetals Corporation was formerly known as China National Metals & Minerals Import & Export Corporation. The company was founded in 1950 and is based in Beijing, China. It has operations in the United Kingdom, Germany, Italy, Sweden, Russia, Hong Kong, Japan, Korea, India, Singapore, Australia, the United States, Brazil, and South Africa.
PROJECTS
Project Name China Minmetals Corporation
Location N/A
Size of property N/A
Type of ore N/A
NI 43-101/ JORC N/A
Average TREO or TREE N/A
Principal REEs from this resource
N/A
Average grade of other principal by-products
N/A
Offtake agreements N/A
Target Production (year) Current
Target Production (tonnage) 8,500 tpa REO
Resource
Measured N/A
Indicated N/A
Inferred N/A
Ownership Private
140
RA
RE E
AR
TH
ELE
MEN
TS
Snap
sho
ts
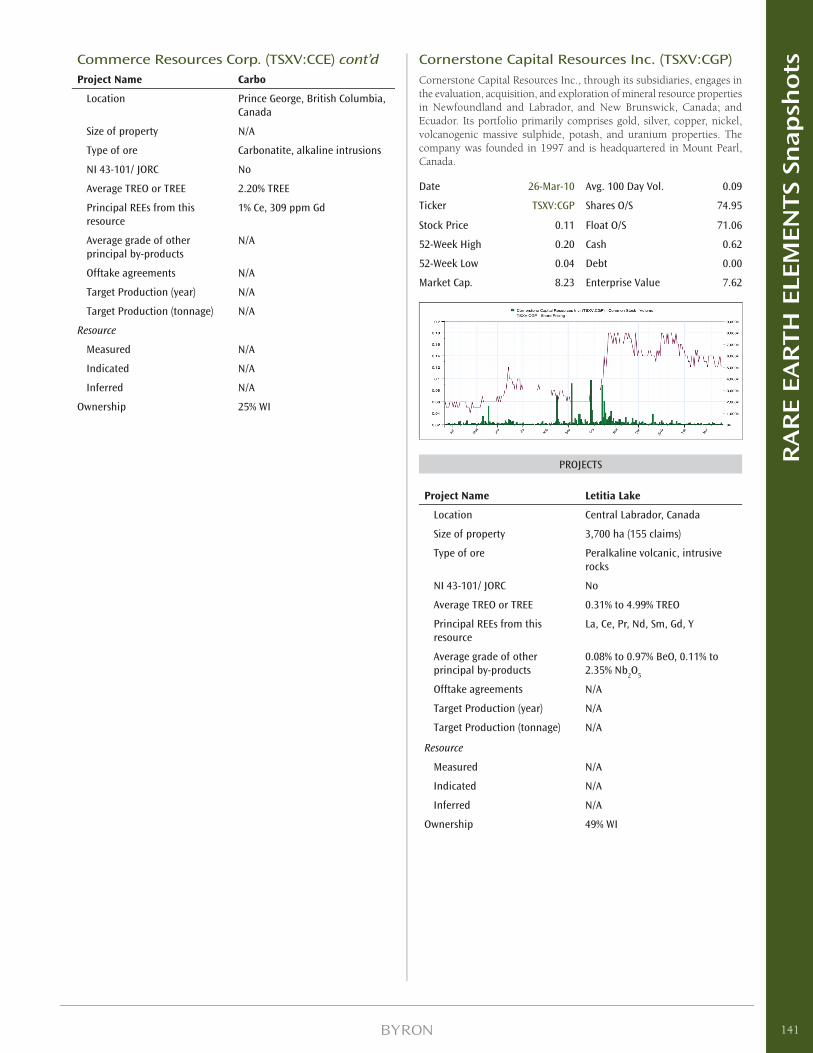
Commerce Resources Corp. (TSXV:CCE) cont’dProject Name Carbo
Location Prince George, British Columbia, Canada
Size of property N/A
Type of ore Carbonatite, alkaline intrusions
NI 43-101/ JORC No
Average TREO or TREE 2.20% TREE
Principal REEs from this resource
1% Ce, 309 ppm Gd
Average grade of other principal by-products
N/A
Offtake agreements N/A
Target Production (year) N/A
Target Production (tonnage) N/A
Resource
Measured N/A
Indicated N/A
Inferred N/A
Ownership 25% WI
Cornerstone Capital Resources Inc. (TSXV:CGP)Cornerstone Capital Resources Inc., through its subsidiaries, engages in the evaluation, acquisition, and exploration of mineral resource properties in Newfoundland and Labrador, and New Brunswick, Canada; and Ecuador. Its portfolio primarily comprises gold, silver, copper, nickel, volcanogenic massive sulphide, potash, and uranium properties. The company was founded in 1997 and is headquartered in Mount Pearl, Canada.
Date 26-Mar-10 Avg. 100 Day Vol. 0.09
Ticker TSXV:CGP Shares O/S 74.95
Stock Price 0.11 Float O/S 71.06
52-Week High 0.20 Cash 0.62
52-Week Low 0.04 Debt 0.00
Market Cap. 8.23 Enterprise Value 7.62
PROJECTS
Project Name Letitia Lake
Location Central Labrador, Canada
Size of property 3,700 ha (155 claims)
Type of ore Peralkaline volcanic, intrusive rocks
NI 43-101/ JORC No
Average TREO or TREE 0.31% to 4.99% TREO
Principal REEs from this resource
La, Ce, Pr, Nd, Sm, Gd, Y
Average grade of other principal by-products
0.08% to 0.97% BeO, 0.11% to 2.35% Nb
2O
5
Offtake agreements N/A
Target Production (year) N/A
Target Production (tonnage) N/A
Resource
Measured N/A
Indicated N/A
Inferred N/A
Ownership 49% WI
141
RA
RE E
AR
TH
ELE
MEN
TS
Snap
sho
ts
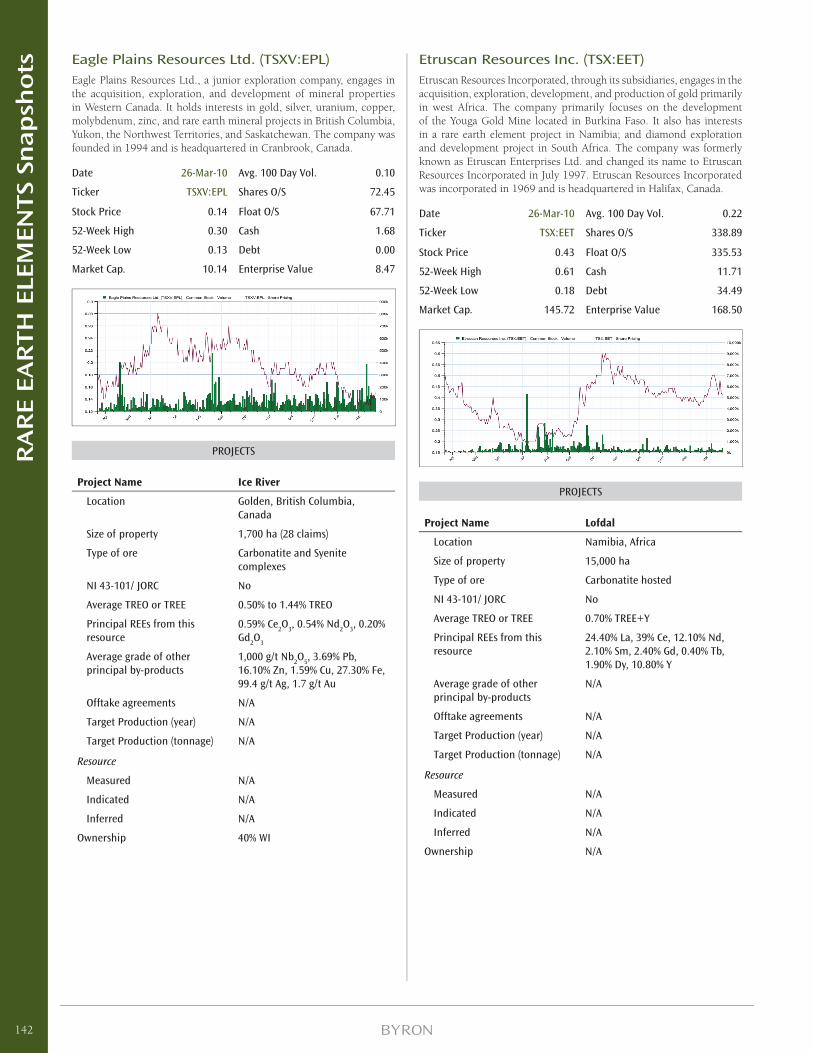
Etruscan Resources Inc. (TSX:EET)Etruscan Resources Incorporated, through its subsidiaries, engages in the acquisition, exploration, development, and production of gold primarily in west Africa. The company primarily focuses on the development of the Youga Gold Mine located in Burkina Faso. It also has interests in a rare earth element project in Namibia; and diamond exploration and development project in South Africa. The company was formerly known as Etruscan Enterprises Ltd. and changed its name to Etruscan Resources Incorporated in July 1997. Etruscan Resources Incorporated was incorporated in 1969 and is headquartered in Halifax, Canada.
Date 26-Mar-10 Avg. 100 Day Vol. 0.22
Ticker TSX:EET Shares O/S 338.89
Stock Price 0.43 Float O/S 335.53
52-Week High 0.61 Cash 11.71
52-Week Low 0.18 Debt 34.49
Market Cap. 145.72 Enterprise Value 168.50
PROJECTS
Project Name Lofdal
Location Namibia, Africa
Size of property 15,000 ha
Type of ore Carbonatite hosted
NI 43-101/ JORC No
Average TREO or TREE 0.70% TREE+Y
Principal REEs from this resource
24.40% La, 39% Ce, 12.10% Nd, 2.10% Sm, 2.40% Gd, 0.40% Tb, 1.90% Dy, 10.80% Y
Average grade of other principal by-products
N/A
Offtake agreements N/A
Target Production (year) N/A
Target Production (tonnage) N/A
Resource
Measured N/A
Indicated N/A
Inferred N/A
Ownership N/A
Eagle Plains Resources Ltd. (TSXV:EPL)Eagle Plains Resources Ltd., a junior exploration company, engages in the acquisition, exploration, and development of mineral properties in Western Canada. It holds interests in gold, silver, uranium, copper, molybdenum, zinc, and rare earth mineral projects in British Columbia, Yukon, the Northwest Territories, and Saskatchewan. The company was founded in 1994 and is headquartered in Cranbrook, Canada.
Date 26-Mar-10 Avg. 100 Day Vol. 0.10
Ticker TSXV:EPL Shares O/S 72.45
Stock Price 0.14 Float O/S 67.71
52-Week High 0.30 Cash 1.68
52-Week Low 0.13 Debt 0.00
Market Cap. 10.14 Enterprise Value 8.47
PROJECTS
Project Name Ice River
Location Golden, British Columbia, Canada
Size of property 1,700 ha (28 claims)
Type of ore Carbonatite and Syenite complexes
NI 43-101/ JORC No
Average TREO or TREE 0.50% to 1.44% TREO
Principal REEs from this resource
0.59% Ce2O
3, 0.54% Nd
2O
3, 0.20%
Gd2O
3
Average grade of other principal by-products
1,000 g/t Nb2O
5, 3.69% Pb,
16.10% Zn, 1.59% Cu, 27.30% Fe, 99.4 g/t Ag, 1.7 g/t Au
Offtake agreements N/A
Target Production (year) N/A
Target Production (tonnage) N/A
Resource
Measured N/A
Indicated N/A
Inferred N/A
Ownership 40% WI
142
RA
RE E
AR
TH
ELE
MEN
TS
Snap
sho
ts
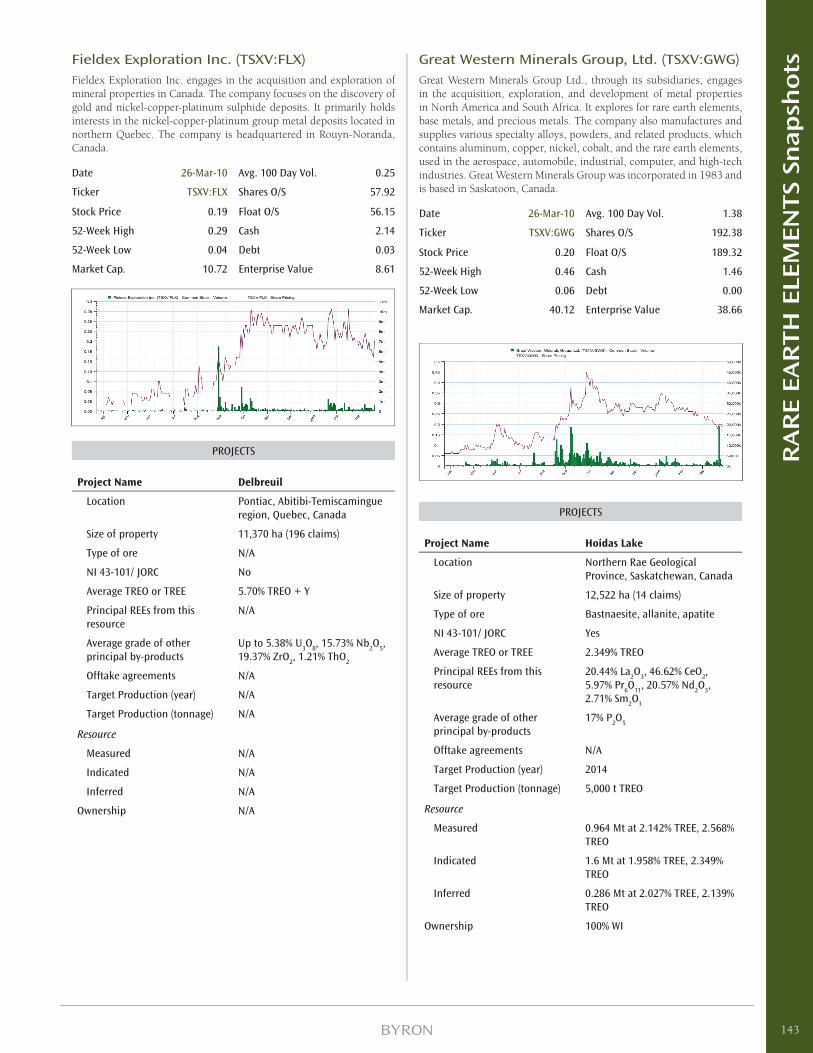
Fieldex Exploration Inc. (TSXV:FLX)Fieldex Exploration Inc. engages in the acquisition and exploration of mineral properties in Canada. The company focuses on the discovery of gold and nickel-copper-platinum sulphide deposits. It primarily holds interests in the nickel-copper-platinum group metal deposits located in northern Quebec. The company is headquartered in Rouyn-Noranda, Canada.
Date 26-Mar-10 Avg. 100 Day Vol. 0.25
Ticker TSXV:FLX Shares O/S 57.92
Stock Price 0.19 Float O/S 56.15
52-Week High 0.29 Cash 2.14
52-Week Low 0.04 Debt 0.03
Market Cap. 10.72 Enterprise Value 8.61
PROJECTS
Project Name Delbreuil
Location Pontiac, Abitibi-Temiscamingue region, Quebec, Canada
Size of property 11,370 ha (196 claims)
Type of ore N/A
NI 43-101/ JORC No
Average TREO or TREE 5.70% TREO + Y
Principal REEs from this resource
N/A
Average grade of other principal by-products
Up to 5.38% U3O
8, 15.73% Nb
2O
5,
19.37% ZrO2, 1.21% ThO
2
Offtake agreements N/A
Target Production (year) N/A
Target Production (tonnage) N/A
Resource
Measured N/A
Indicated N/A
Inferred N/A
Ownership N/A
Great Western Minerals Group, Ltd. (TSXV:GWG)Great Western Minerals Group Ltd., through its subsidiaries, engages in the acquisition, exploration, and development of metal properties in North America and South Africa. It explores for rare earth elements, base metals, and precious metals. The company also manufactures and supplies various specialty alloys, powders, and related products, which contains aluminum, copper, nickel, cobalt, and the rare earth elements, used in the aerospace, automobile, industrial, computer, and high-tech industries. Great Western Minerals Group was incorporated in 1983 and is based in Saskatoon, Canada.
Date 26-Mar-10 Avg. 100 Day Vol. 1.38
Ticker TSXV:GWG Shares O/S 192.38
Stock Price 0.20 Float O/S 189.32
52-Week High 0.46 Cash 1.46
52-Week Low 0.06 Debt 0.00
Market Cap. 40.12 Enterprise Value 38.66
PROJECTS
Project Name Hoidas Lake
Location Northern Rae Geological Province, Saskatchewan, Canada
Size of property 12,522 ha (14 claims)
Type of ore Bastnaesite, allanite, apatite
NI 43-101/ JORC Yes
Average TREO or TREE 2.349% TREO
Principal REEs from this resource
20.44% La2O
3, 46.62% CeO
2,
5.97% Pr6O
11, 20.57% Nd
2O
3,
2.71% Sm2O
3
Average grade of other principal by-products
17% P2O
5
Offtake agreements N/A
Target Production (year) 2014
Target Production (tonnage) 5,000 t TREO
Resource
Measured 0.964 Mt at 2.142% TREE, 2.568% TREO
Indicated 1.6 Mt at 1.958% TREE, 2.349% TREO
Inferred 0.286 Mt at 2.027% TREE, 2.139% TREO
Ownership 100% WI
143
RA
RE E
AR
TH
ELE
MEN
TS
Snap
sho
ts

Great Western Minerals Group, Ltd. (TSXV:GWG) cont’dProject Name Deep Sands
Location Utah, US
Size of property 17,094 ha
Type of ore Heavy mineral-rich sands
NI 43-101/ JORC No
Average TREO or TREE 0.14% to 0.80% TREO
Principal REEs from this resource
22.30% La2O
3, 41.73% CeO
2,
4.34% Pr6O
11, 14.28% Nd
2O
3,
2.44% Sm2O
3, 1.41% Dy
2O
3
Average grade of other principal by-products
N/A
Offtake agreements N/A
Target Production (year) 2014
Target Production (tonnage) 5,000 t TREO
Resource
Measured N/A
Indicated N/A
Inferred N/A
Ownership 25% WI
Project Name Steenkampskraal Mine
Location Western Cape, South Africa
Size of property 474 ha
Type of ore Monazite deposit
NI 43-101/ JORC No
Average TREO or TREE 16.74% TREO
Principal REEs from this resource
21.67% La2O
3, 46.67% CeO
2, 5%
Pr6O
11, 16.67% Nd
2O
3, 2.50%
Sm2O
3, 0.67% Dy
2O
3
Average grade of other principal by-products
0.8% Cu, 0.5g/t Au, 6g/t Ag
Offtake agreements N/A
Target Production (year) 2012
Target Production (tonnage) 2,500 t TREO
Resource
Measured 52,000 t at 18.86% TREO
Indicated 32,000 t at 16.57% TREO
Inferred 33.500 t at 13.60% TREO
Ownership 100% WI
Project Name Douglas River
Location Northern Saskatchewan, Canada
Size of property 1,405 ha (3 claims)
Type of ore Hematitic sandstone
NI 43-101/ JORC No
Average TREO or TREE 3.88% TREO
Principal REEs from this resource
4.8% P2O, 4.9% Y, 9,100 ppm Dy,
2,990 ppm Er, 1,440 ppm Yb, 2,150 ppm Tb
Average grade of other principal by-products
N/A
Offtake agreements N/A
Target Production (year) N/A
Target Production (tonnage) N/A
Resource
Measured N/A
Indicated N/A
Inferred N/A
Ownership 100% WI
Project Name Benjamin River
Location New Brunswick, Canada
Size of property 11,400 ha (491 claims)
Type of ore Diopside, apatite, magnetite
NI 43-101/ JORC No
Average TREO or TREE 0.6% to 1.0% TREO
Principal REEs from this resource
3% Dy
Average grade of other principal by-products
Up to 18% phosphate, 39% Fe2O
3
Offtake agreements N/A
Target Production (year) N/A
Target Production (tonnage) N/A
Resource
Measured N/A
Indicated N/A
Inferred N/A
Ownership 100% WI
144
RA
RE E
AR
TH
ELE
MEN
TS
Snap
sho
ts
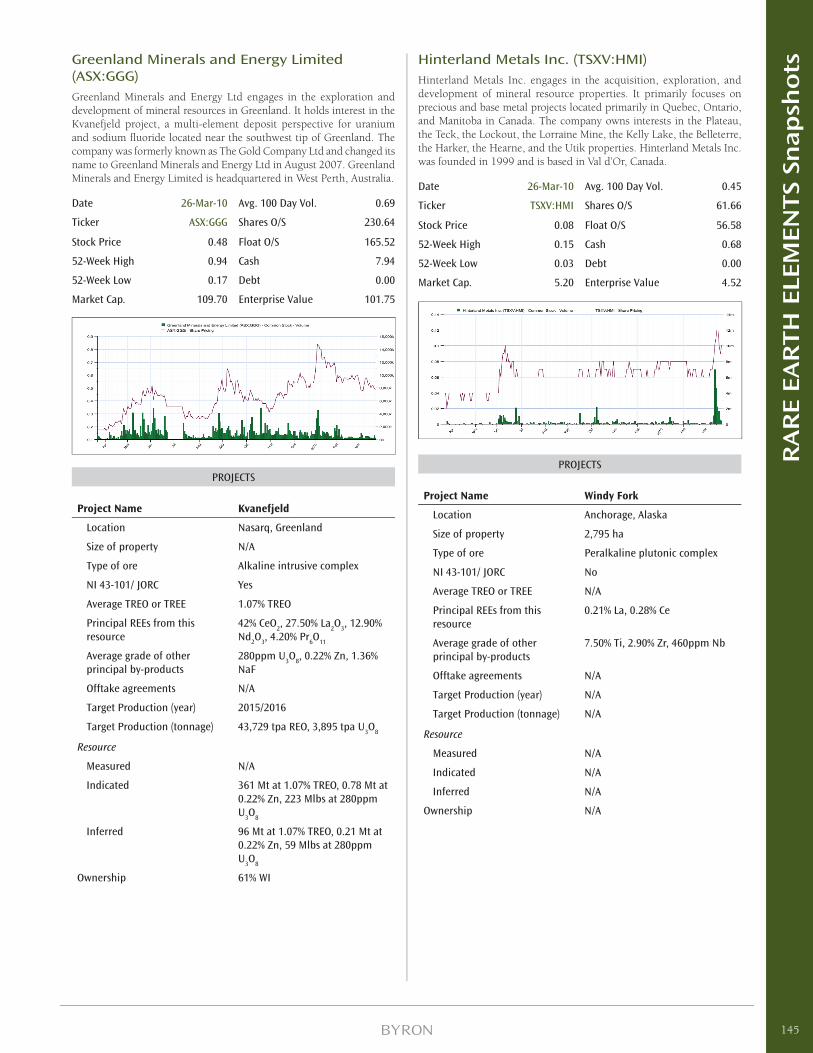
Greenland Minerals and Energy Limited (ASX:GGG)Greenland Minerals and Energy Ltd engages in the exploration and development of mineral resources in Greenland. It holds interest in the Kvanefjeld project, a multi-element deposit perspective for uranium and sodium fl uoride located near the southwest tip of Greenland. The company was formerly known as The Gold Company Ltd and changed its name to Greenland Minerals and Energy Ltd in August 2007. Greenland Minerals and Energy Limited is headquartered in West Perth, Australia.
Date 26-Mar-10 Avg. 100 Day Vol. 0.69
Ticker ASX:GGG Shares O/S 230.64
Stock Price 0.48 Float O/S 165.52
52-Week High 0.94 Cash 7.94
52-Week Low 0.17 Debt 0.00
Market Cap. 109.70 Enterprise Value 101.75
PROJECTS
Project Name Kvanefjeld
Location Nasarq, Greenland
Size of property N/A
Type of ore Alkaline intrusive complex
NI 43-101/ JORC Yes
Average TREO or TREE 1.07% TREO
Principal REEs from this resource
42% CeO2, 27.50% La
2O
3, 12.90%
Nd2O
3, 4.20% Pr
6O
11
Average grade of other principal by-products
280ppm U3O
8, 0.22% Zn, 1.36%
NaF
Offtake agreements N/A
Target Production (year) 2015/2016
Target Production (tonnage) 43,729 tpa REO, 3,895 tpa U3O
8
Resource
Measured N/A
Indicated 361 Mt at 1.07% TREO, 0.78 Mt at 0.22% Zn, 223 Mlbs at 280ppm U
3O
8
Inferred 96 Mt at 1.07% TREO, 0.21 Mt at 0.22% Zn, 59 Mlbs at 280ppm U
3O
8
Ownership 61% WI
Hinterland Metals Inc. (TSXV:HMI)Hinterland Metals Inc. engages in the acquisition, exploration, and development of mineral resource properties. It primarily focuses on precious and base metal projects located primarily in Quebec, Ontario, and Manitoba in Canada. The company owns interests in the Plateau, the Teck, the Lockout, the Lorraine Mine, the Kelly Lake, the Belleterre, the Harker, the Hearne, and the Utik properties. Hinterland Metals Inc. was founded in 1999 and is based in Val d’Or, Canada.
Date 26-Mar-10 Avg. 100 Day Vol. 0.45
Ticker TSXV:HMI Shares O/S 61.66
Stock Price 0.08 Float O/S 56.58
52-Week High 0.15 Cash 0.68
52-Week Low 0.03 Debt 0.00
Market Cap. 5.20 Enterprise Value 4.52
PROJECTS
Project Name Windy Fork
Location Anchorage, Alaska
Size of property 2,795 ha
Type of ore Peralkaline plutonic complex
NI 43-101/ JORC No
Average TREO or TREE N/A
Principal REEs from this resource
0.21% La, 0.28% Ce
Average grade of other principal by-products
7.50% Ti, 2.90% Zr, 460ppm Nb
Offtake agreements N/A
Target Production (year) N/A
Target Production (tonnage) N/A
Resource
Measured N/A
Indicated N/A
Inferred N/A
Ownership N/A
145
RA
RE E
AR
TH
ELE
MEN
TS
Snap
sho
ts
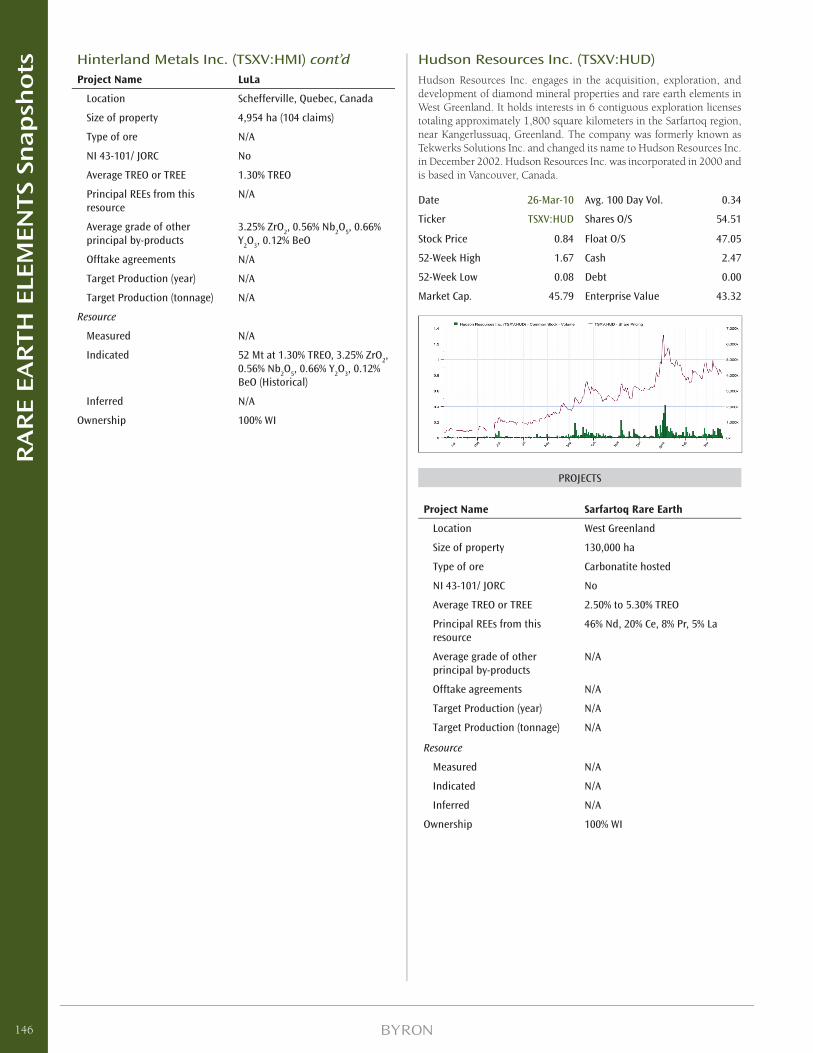
Hinterland Metals Inc. (TSXV:HMI) cont’dProject Name LuLa
Location Schefferville, Quebec, Canada
Size of property 4,954 ha (104 claims)
Type of ore N/A
NI 43-101/ JORC No
Average TREO or TREE 1.30% TREO
Principal REEs from this resource
N/A
Average grade of other principal by-products
3.25% ZrO2, 0.56% Nb
2O
5, 0.66%
Y2O
3, 0.12% BeO
Offtake agreements N/A
Target Production (year) N/A
Target Production (tonnage) N/A
Resource
Measured N/A
Indicated 52 Mt at 1.30% TREO, 3.25% ZrO2,
0.56% Nb2O
5, 0.66% Y
2O
3, 0.12%
BeO (Historical)
Inferred N/A
Ownership 100% WI
Hudson Resources Inc. (TSXV:HUD)Hudson Resources Inc. engages in the acquisition, exploration, and development of diamond mineral properties and rare earth elements in West Greenland. It holds interests in 6 contiguous exploration licenses totaling approximately 1,800 square kilometers in the Sarfartoq region, near Kangerlussuaq, Greenland. The company was formerly known as Tekwerks Solutions Inc. and changed its name to Hudson Resources Inc. in December 2002. Hudson Resources Inc. was incorporated in 2000 and is based in Vancouver, Canada.
Date 26-Mar-10 Avg. 100 Day Vol. 0.34
Ticker TSXV:HUD Shares O/S 54.51
Stock Price 0.84 Float O/S 47.05
52-Week High 1.67 Cash 2.47
52-Week Low 0.08 Debt 0.00
Market Cap. 45.79 Enterprise Value 43.32
PROJECTS
Project Name Sarfartoq Rare Earth
Location West Greenland
Size of property 130,000 ha
Type of ore Carbonatite hosted
NI 43-101/ JORC No
Average TREO or TREE 2.50% to 5.30% TREO
Principal REEs from this resource
46% Nd, 20% Ce, 8% Pr, 5% La
Average grade of other principal by-products
N/A
Offtake agreements N/A
Target Production (year) N/A
Target Production (tonnage) N/A
Resource
Measured N/A
Indicated N/A
Inferred N/A
Ownership 100% WI
146
RA
RE E
AR
TH
ELE
MEN
TS
Snap
sho
ts
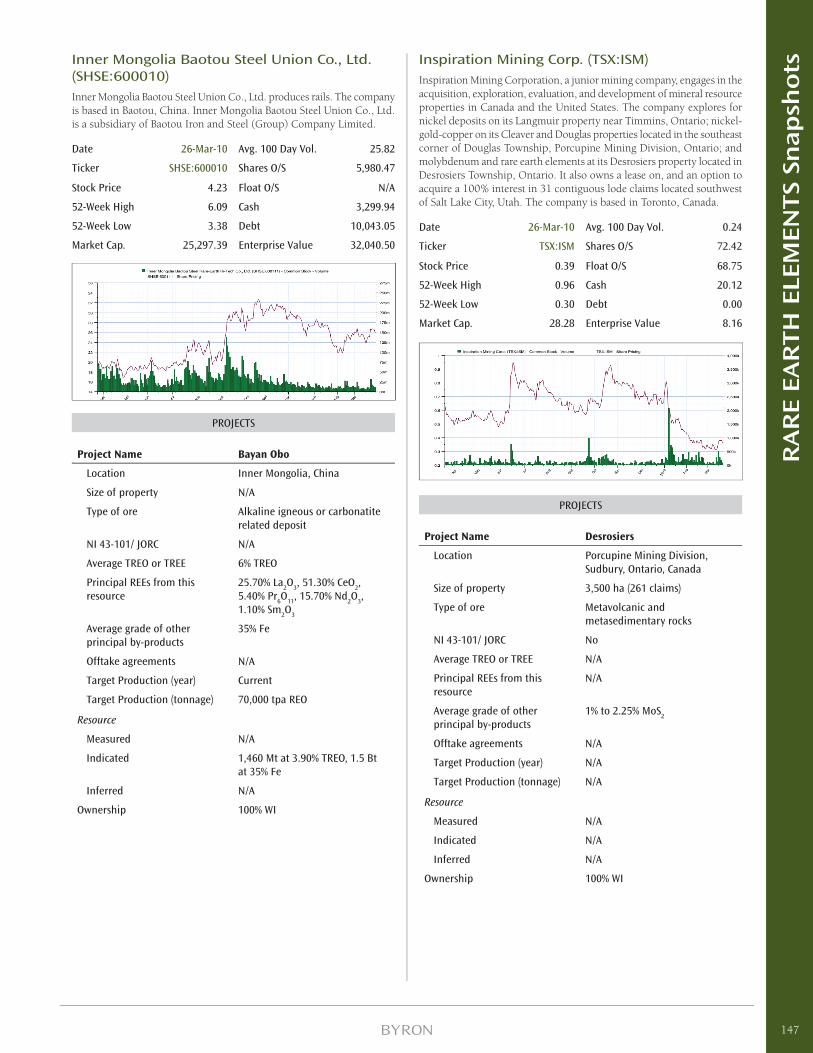
Inner Mongolia Baotou Steel Union Co., Ltd. (SHSE:600010)Inner Mongolia Baotou Steel Union Co., Ltd. produces rails. The company is based in Baotou, China. Inner Mongolia Baotou Steel Union Co., Ltd. is a subsidiary of Baotou Iron and Steel (Group) Company Limited.
Date 26-Mar-10 Avg. 100 Day Vol. 25.82
Ticker SHSE:600010 Shares O/S 5,980.47
Stock Price 4.23 Float O/S N/A
52-Week High 6.09 Cash 3,299.94
52-Week Low 3.38 Debt 10,043.05
Market Cap. 25,297.39 Enterprise Value 32,040.50
PROJECTS
Project Name Bayan Obo
Location Inner Mongolia, China
Size of property N/A
Type of ore Alkaline igneous or carbonatite related deposit
NI 43-101/ JORC N/A
Average TREO or TREE 6% TREO
Principal REEs from this resource
25.70% La2O
3, 51.30% CeO
2,
5.40% Pr6O
11, 15.70% Nd
2O
3,
1.10% Sm2O
3
Average grade of other principal by-products
35% Fe
Offtake agreements N/A
Target Production (year) Current
Target Production (tonnage) 70,000 tpa REO
Resource
Measured N/A
Indicated 1,460 Mt at 3.90% TREO, 1.5 Bt at 35% Fe
Inferred N/A
Ownership 100% WI
Inspiration Mining Corp. (TSX:ISM)Inspiration Mining Corporation, a junior mining company, engages in the acquisition, exploration, evaluation, and development of mineral resource properties in Canada and the United States. The company explores for nickel deposits on its Langmuir property near Timmins, Ontario; nickel-gold-copper on its Cleaver and Douglas properties located in the southeast corner of Douglas Township, Porcupine Mining Division, Ontario; and molybdenum and rare earth elements at its Desrosiers property located in Desrosiers Township, Ontario. It also owns a lease on, and an option to acquire a 100% interest in 31 contiguous lode claims located southwest of Salt Lake City, Utah. The company is based in Toronto, Canada.
Date 26-Mar-10 Avg. 100 Day Vol. 0.24
Ticker TSX:ISM Shares O/S 72.42
Stock Price 0.39 Float O/S 68.75
52-Week High 0.96 Cash 20.12
52-Week Low 0.30 Debt 0.00
Market Cap. 28.28 Enterprise Value 8.16
PROJECTS
Project Name Desrosiers
Location Porcupine Mining Division, Sudbury, Ontario, Canada
Size of property 3,500 ha (261 claims)
Type of ore Metavolcanic and metasedimentary rocks
NI 43-101/ JORC No
Average TREO or TREE N/A
Principal REEs from this resource
N/A
Average grade of other principal by-products
1% to 2.25% MoS2
Offtake agreements N/A
Target Production (year) N/A
Target Production (tonnage) N/A
Resource
Measured N/A
Indicated N/A
Inferred N/A
Ownership 100% WI
147
RA
RE E
AR
TH
ELE
MEN
TS
Snap
sho
ts

Jiangxi Copper Co. Ltd. (SEHK:358)Jiangxi Copper Company Limited, together with its subsidiaries, engages in mining, milling, smelting, and refi ning copper in the People’s Republic of China. The company produces copper cathodes, copper rods and wires, and other related products, including pyrite concentrates, sulphuric acid, electrolytic gold and silver, and rare metals, such as molybdenum. It also provides smelting and refi ning services. In addition, the company engages in providing construction and installation, mine exploration and examination, and transportation, as well as deposit and fi nancing, and consultation services; development and sale of construction materials; production and sale of pressure bearable gas locks; the development of resources of copper, gold, silver, lead, zinc, sulphur, and tungsten; the manufacture of benefi ciation drugs, fi ne chemicals, rubber items, and other industry and civilian products; and manufacturing mining equipment parts. Further, it involves in the maintenance of carriages, trucks, and construction machinery; and sale of spare parts and construction machines. As of December 31, 2008, the company had reserves of approximately 11,140,000 tons of copper metal; 363 tons of gold; 9,098 tons of silver; 277,000 tons of molybdenum; and 103,900,000 tons accompanying sulphur and symbiotic sulphur. It has operations in Mainland China, Hong Kong, Taiwan, Australia, and Thailand. The company was incorporated in 1997 and is headquartered in Guixi City, the People’s Republic of China. Jiangxi Copper Company Limited is a subsidiary of Jiangxi Copper Corporation.
Date 26-Mar-10 Avg. 100 Day Vol. 20.95
Ticker SEHK:358 Shares O/S 3,022.83
Stock Price 16.56 Float O/S 1,718.73
52-Week High 21.35 Cash 2,002.75
52-Week Low 7.86 Debt 5,059.92
Market Cap. 50,058.06 Enterprise Value 53,115.23
PROJECTS
Project Name Maoniliping Mine
Location Sichuan Province, China
Size of property 29,400 ha
Type of ore Syenite
NI 43-101/ JORC N/A
Average TREO or TREE 0.10% TREO
Principal REEs from this resource
7.80% La2O
3, 2.40% CeO
2, 2.40%
Pr6O
11, 9% Nd
2O
3, 3% Sm
2O
3,
5.30% Dy2O
3
Average grade of other principal by-products
N/A
Offtake agreements N/A
Target Production (year) N/A
Target Production (tonnage) N/A
Resource
Measured N/A
Indicated N/A
Inferred N/A
Ownership 56% WI
148
RA
RE E
AR
TH
ELE
MEN
TS
Snap
sho
ts
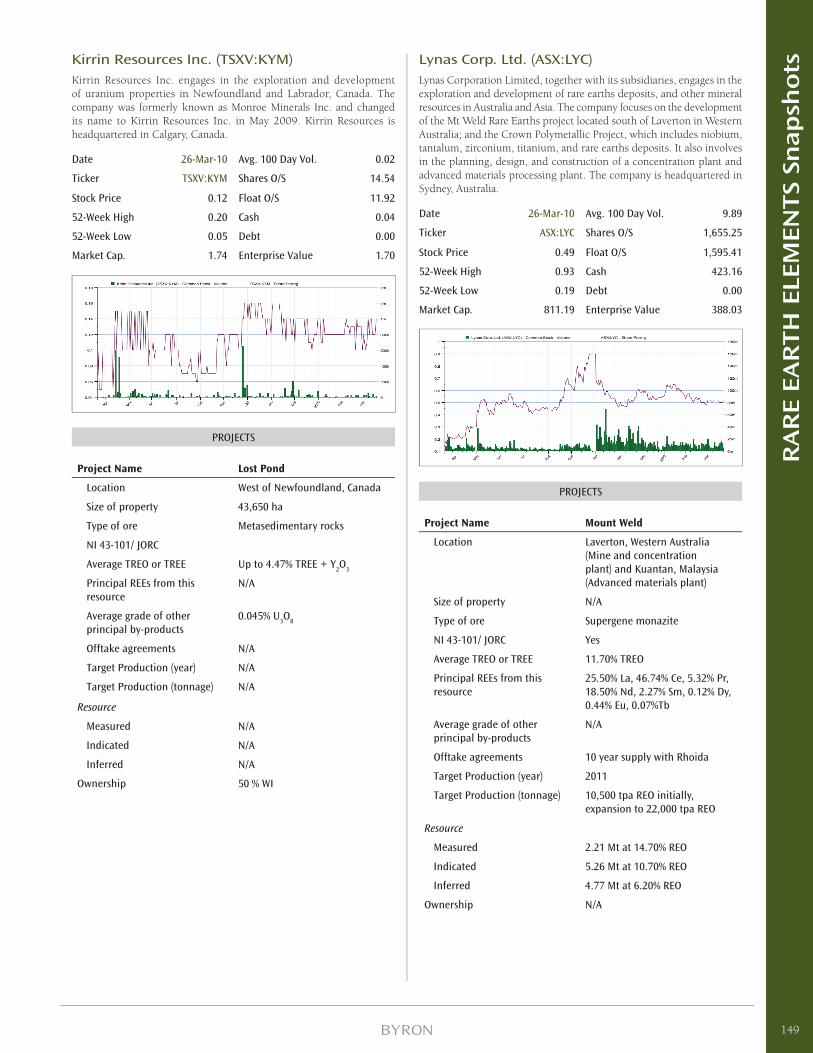
Kirrin Resources Inc. (TSXV:KYM)Kirrin Resources Inc. engages in the exploration and development of uranium properties in Newfoundland and Labrador, Canada. The company was formerly known as Monroe Minerals Inc. and changed its name to Kirrin Resources Inc. in May 2009. Kirrin Resources is headquartered in Calgary, Canada.
Date 26-Mar-10 Avg. 100 Day Vol. 0.02
Ticker TSXV:KYM Shares O/S 14.54
Stock Price 0.12 Float O/S 11.92
52-Week High 0.20 Cash 0.04
52-Week Low 0.05 Debt 0.00
Market Cap. 1.74 Enterprise Value 1.70
PROJECTS
Project Name Lost Pond
Location West of Newfoundland, Canada
Size of property 43,650 ha
Type of ore Metasedimentary rocks
NI 43-101/ JORC
Average TREO or TREE Up to 4.47% TREE + Y2O
3
Principal REEs from this resource
N/A
Average grade of other principal by-products
0.045% U3O
8
Offtake agreements N/A
Target Production (year) N/A
Target Production (tonnage) N/A
Resource
Measured N/A
Indicated N/A
Inferred N/A
Ownership 50 % WI
Lynas Corp. Ltd. (ASX:LYC)Lynas Corporation Limited, together with its subsidiaries, engages in the exploration and development of rare earths deposits, and other mineral resources in Australia and Asia. The company focuses on the development of the Mt Weld Rare Earths project located south of Laverton in Western Australia; and the Crown Polymetallic Project, which includes niobium, tantalum, zirconium, titanium, and rare earths deposits. It also involves in the planning, design, and construction of a concentration plant and advanced materials processing plant. The company is headquartered in Sydney, Australia.
Date 26-Mar-10 Avg. 100 Day Vol. 9.89
Ticker ASX:LYC Shares O/S 1,655.25
Stock Price 0.49 Float O/S 1,595.41
52-Week High 0.93 Cash 423.16
52-Week Low 0.19 Debt 0.00
Market Cap. 811.19 Enterprise Value 388.03
PROJECTS
Project Name Mount Weld
Location Laverton, Western Australia (Mine and concentration plant) and Kuantan, Malaysia (Advanced materials plant)
Size of property N/A
Type of ore Supergene monazite
NI 43-101/ JORC Yes
Average TREO or TREE 11.70% TREO
Principal REEs from this resource
25.50% La, 46.74% Ce, 5.32% Pr, 18.50% Nd, 2.27% Sm, 0.12% Dy, 0.44% Eu, 0.07%Tb
Average grade of other principal by-products
N/A
Offtake agreements 10 year supply with Rhoida
Target Production (year) 2011
Target Production (tonnage) 10,500 tpa REO initially, expansion to 22,000 tpa REO
Resource
Measured 2.21 Mt at 14.70% REO
Indicated 5.26 Mt at 10.70% REO
Inferred 4.77 Mt at 6.20% REO
Ownership N/A
149
RA
RE E
AR
TH
ELE
MEN
TS
Snap
sho
ts
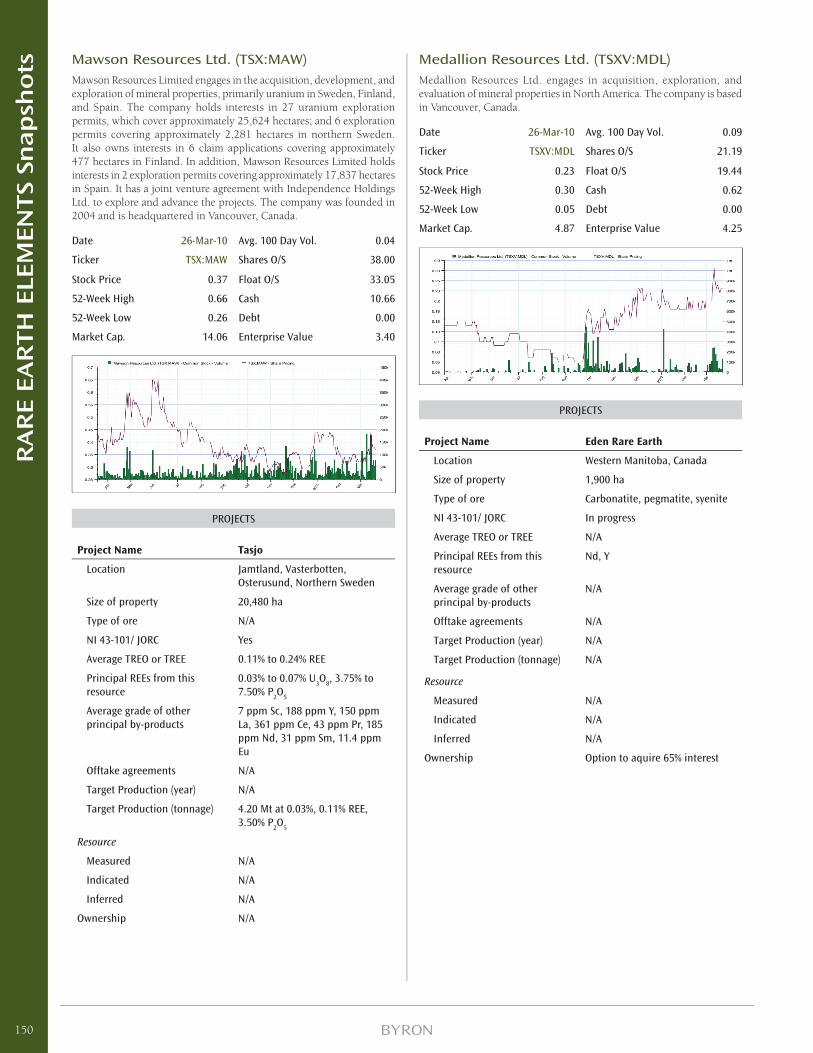
Mawson Resources Ltd. (TSX:MAW)Mawson Resources Limited engages in the acquisition, development, and exploration of mineral properties, primarily uranium in Sweden, Finland, and Spain. The company holds interests in 27 uranium exploration permits, which cover approximately 25,624 hectares; and 6 exploration permits covering approximately 2,281 hectares in northern Sweden. It also owns interests in 6 claim applications covering approximately 477 hectares in Finland. In addition, Mawson Resources Limited holds interests in 2 exploration permits covering approximately 17,837 hectares in Spain. It has a joint venture agreement with Independence Holdings Ltd. to explore and advance the projects. The company was founded in 2004 and is headquartered in Vancouver, Canada.
Date 26-Mar-10 Avg. 100 Day Vol. 0.04
Ticker TSX:MAW Shares O/S 38.00
Stock Price 0.37 Float O/S 33.05
52-Week High 0.66 Cash 10.66
52-Week Low 0.26 Debt 0.00
Market Cap. 14.06 Enterprise Value 3.40
PROJECTS
Project Name Tasjo
Location Jamtland, Vasterbotten, Osterusund, Northern Sweden
Size of property 20,480 ha
Type of ore N/A
NI 43-101/ JORC Yes
Average TREO or TREE 0.11% to 0.24% REE
Principal REEs from this resource
0.03% to 0.07% U3O
8, 3.75% to
7.50% P2O
5
Average grade of other principal by-products
7 ppm Sc, 188 ppm Y, 150 ppm La, 361 ppm Ce, 43 ppm Pr, 185 ppm Nd, 31 ppm Sm, 11.4 ppm Eu
Offtake agreements N/A
Target Production (year) N/A
Target Production (tonnage) 4.20 Mt at 0.03%, 0.11% REE, 3.50% P
2O
5
Resource
Measured N/A
Indicated N/A
Inferred N/A
Ownership N/A
Medallion Resources Ltd. (TSXV:MDL)Medallion Resources Ltd. engages in acquisition, exploration, and evaluation of mineral properties in North America. The company is based in Vancouver, Canada.
Date 26-Mar-10 Avg. 100 Day Vol. 0.09
Ticker TSXV:MDL Shares O/S 21.19
Stock Price 0.23 Float O/S 19.44
52-Week High 0.30 Cash 0.62
52-Week Low 0.05 Debt 0.00
Market Cap. 4.87 Enterprise Value 4.25
PROJECTS
Project Name Eden Rare Earth
Location Western Manitoba, Canada
Size of property 1,900 ha
Type of ore Carbonatite, pegmatite, syenite
NI 43-101/ JORC In progress
Average TREO or TREE N/A
Principal REEs from this resource
Nd, Y
Average grade of other principal by-products
N/A
Offtake agreements N/A
Target Production (year) N/A
Target Production (tonnage) N/A
Resource
Measured N/A
Indicated N/A
Inferred N/A
Ownership Option to aquire 65% interest
150
RA
RE E
AR
TH
ELE
MEN
TS
Snap
sho
ts
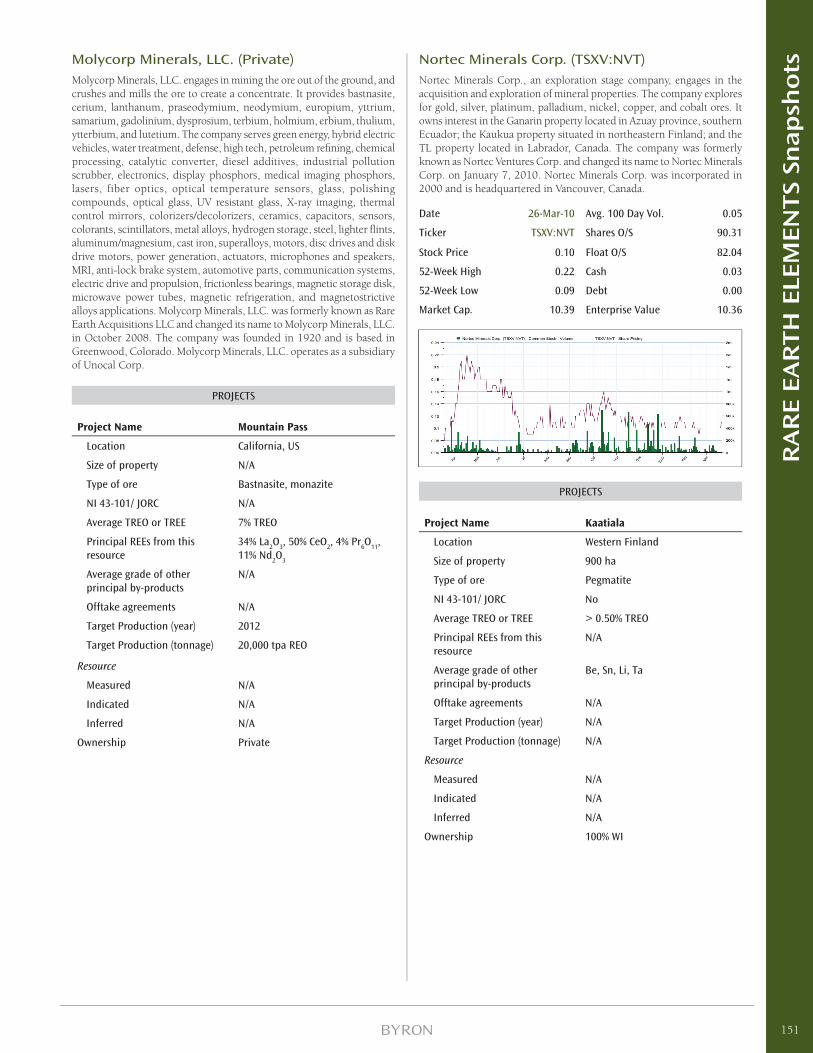
Molycorp Minerals, LLC. (Private)Molycorp Minerals, LLC. engages in mining the ore out of the ground, and crushes and mills the ore to create a concentrate. It provides bastnasite, cerium, lanthanum, praseodymium, neodymium, europium, yttrium, samarium, gadolinium, dysprosium, terbium, holmium, erbium, thulium, ytterbium, and lutetium. The company serves green energy, hybrid electric vehicles, water treatment, defense, high tech, petroleum refi ning, chemical processing, catalytic converter, diesel additives, industrial pollution scrubber, electronics, display phosphors, medical imaging phosphors, lasers, fiber optics, optical temperature sensors, glass, polishing compounds, optical glass, UV resistant glass, X-ray imaging, thermal control mirrors, colorizers/decolorizers, ceramics, capacitors, sensors, colorants, scintillators, metal alloys, hydrogen storage, steel, lighter fl ints, aluminum/magnesium, cast iron, superalloys, motors, disc drives and disk drive motors, power generation, actuators, microphones and speakers, MRI, anti-lock brake system, automotive parts, communication systems, electric drive and propulsion, frictionless bearings, magnetic storage disk, microwave power tubes, magnetic refrigeration, and magnetostrictive alloys applications. Molycorp Minerals, LLC. was formerly known as Rare Earth Acquisitions LLC and changed its name to Molycorp Minerals, LLC. in October 2008. The company was founded in 1920 and is based in Greenwood, Colorado. Molycorp Minerals, LLC. operates as a subsidiary of Unocal Corp.
PROJECTS
Project Name Mountain Pass
Location California, US
Size of property N/A
Type of ore Bastnasite, monazite
NI 43-101/ JORC N/A
Average TREO or TREE 7% TREO
Principal REEs from this resource
34% La2O
3, 50% CeO
2, 4% Pr
6O
11,
11% Nd2O
3
Average grade of other principal by-products
N/A
Offtake agreements N/A
Target Production (year) 2012
Target Production (tonnage) 20,000 tpa REO
Resource
Measured N/A
Indicated N/A
Inferred N/A
Ownership Private
Nortec Minerals Corp. (TSXV:NVT)Nortec Minerals Corp., an exploration stage company, engages in the acquisition and exploration of mineral properties. The company explores for gold, silver, platinum, palladium, nickel, copper, and cobalt ores. It owns interest in the Ganarin property located in Azuay province, southern Ecuador; the Kaukua property situated in northeastern Finland; and the TL property located in Labrador, Canada. The company was formerly known as Nortec Ventures Corp. and changed its name to Nortec Minerals Corp. on January 7, 2010. Nortec Minerals Corp. was incorporated in 2000 and is headquartered in Vancouver, Canada.
Date 26-Mar-10 Avg. 100 Day Vol. 0.05
Ticker TSXV:NVT Shares O/S 90.31
Stock Price 0.10 Float O/S 82.04
52-Week High 0.22 Cash 0.03
52-Week Low 0.09 Debt 0.00
Market Cap. 10.39 Enterprise Value 10.36
PROJECTS
Project Name Kaatiala
Location Western Finland
Size of property 900 ha
Type of ore Pegmatite
NI 43-101/ JORC No
Average TREO or TREE > 0.50% TREO
Principal REEs from this resource
N/A
Average grade of other principal by-products
Be, Sn, Li, Ta
Offtake agreements N/A
Target Production (year) N/A
Target Production (tonnage) N/A
Resource
Measured N/A
Indicated N/A
Inferred N/A
Ownership 100% WI
151
RA
RE E
AR
TH
ELE
MEN
TS
Snap
sho
ts
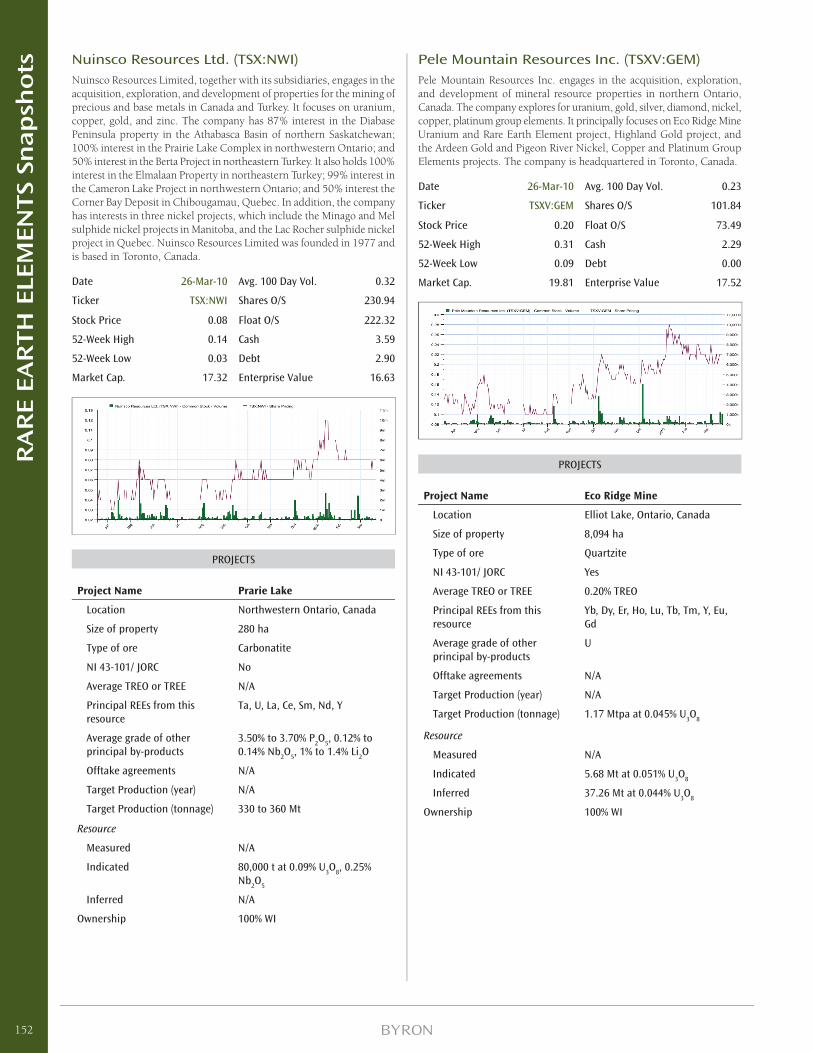
Nuinsco Resources Ltd. (TSX:NWI)Nuinsco Resources Limited, together with its subsidiaries, engages in the acquisition, exploration, and development of properties for the mining of precious and base metals in Canada and Turkey. It focuses on uranium, copper, gold, and zinc. The company has 87% interest in the Diabase Peninsula property in the Athabasca Basin of northern Saskatchewan; 100% interest in the Prairie Lake Complex in northwestern Ontario; and 50% interest in the Berta Project in northeastern Turkey. It also holds 100% interest in the Elmalaan Property in northeastern Turkey; 99% interest in the Cameron Lake Project in northwestern Ontario; and 50% interest the Corner Bay Deposit in Chibougamau, Quebec. In addition, the company has interests in three nickel projects, which include the Minago and Mel sulphide nickel projects in Manitoba, and the Lac Rocher sulphide nickel project in Quebec. Nuinsco Resources Limited was founded in 1977 and is based in Toronto, Canada.
Date 26-Mar-10 Avg. 100 Day Vol. 0.32
Ticker TSX:NWI Shares O/S 230.94
Stock Price 0.08 Float O/S 222.32
52-Week High 0.14 Cash 3.59
52-Week Low 0.03 Debt 2.90
Market Cap. 17.32 Enterprise Value 16.63
PROJECTS
Project Name Prarie Lake
Location Northwestern Ontario, Canada
Size of property 280 ha
Type of ore Carbonatite
NI 43-101/ JORC No
Average TREO or TREE N/A
Principal REEs from this resource
Ta, U, La, Ce, Sm, Nd, Y
Average grade of other principal by-products
3.50% to 3.70% P2O
5, 0.12% to
0.14% Nb2O
5, 1% to 1.4% Li
2O
Offtake agreements N/A
Target Production (year) N/A
Target Production (tonnage) 330 to 360 Mt
Resource
Measured N/A
Indicated 80,000 t at 0.09% U3O
8, 0.25%
Nb2O
5
Inferred N/A
Ownership 100% WI
Pele Mountain Resources Inc. (TSXV:GEM)Pele Mountain Resources Inc. engages in the acquisition, exploration, and development of mineral resource properties in northern Ontario, Canada. The company explores for uranium, gold, silver, diamond, nickel, copper, platinum group elements. It principally focuses on Eco Ridge Mine Uranium and Rare Earth Element project, Highland Gold project, and the Ardeen Gold and Pigeon River Nickel, Copper and Platinum Group Elements projects. The company is headquartered in Toronto, Canada.
Date 26-Mar-10 Avg. 100 Day Vol. 0.23
Ticker TSXV:GEM Shares O/S 101.84
Stock Price 0.20 Float O/S 73.49
52-Week High 0.31 Cash 2.29
52-Week Low 0.09 Debt 0.00
Market Cap. 19.81 Enterprise Value 17.52
PROJECTS
Project Name Eco Ridge Mine
Location Elliot Lake, Ontario, Canada
Size of property 8,094 ha
Type of ore Quartzite
NI 43-101/ JORC Yes
Average TREO or TREE 0.20% TREO
Principal REEs from this resource
Yb, Dy, Er, Ho, Lu, Tb, Tm, Y, Eu, Gd
Average grade of other principal by-products
U
Offtake agreements N/A
Target Production (year) N/A
Target Production (tonnage) 1.17 Mtpa at 0.045% U3O
8
Resource
Measured N/A
Indicated 5.68 Mt at 0.051% U3O
8
Inferred 37.26 Mt at 0.044% U3O
8
Ownership 100% WI
152
RA
RE E
AR
TH
ELE
MEN
TS
Snap
sho
ts

Quest Uranium Corporation (TSXV:QUC)Quest Uranium Corporation, an exploration stage company, engages in the acquisition, exploration, and development of uranium and rare earth deposits in North America. It has interests in the George River, Quest-Nebu George River Option, and Quest-Midland James Bay Option projects in northwestern Quebec; the Kenora North and Snook Lake, Croon Lake, and Claw Lake projects in northwestern Ontario; and the Plaster Rock area of northeastern New Brunswick, as well as the Strange Lake rare earth project in Quebec/Labrador. The company was incorporated in 2007 and is headquartered in Montreal, Canada. As of January 11, 2008, Quest Uranium Corporation operates independently of Freewest Resources Canada Inc.
Date 26-Mar-10 Avg. 100 Day Vol. 0.17
Ticker TSXV:QUC Shares O/S 40.77
Stock Price 2.85 Float O/S 34.45
52-Week High 4.14 Cash 4.80
52-Week Low 0.04 Debt 0.00
Market Cap. 116.18 Enterprise Value 111.38
PROJECTS
Project Name Strange Lake
Location George River, Labrador, Quebec, Canada
Size of property 216,000 ha (1 claim)
Type of ore N/A
NI 43-101/ JORC Yes
Average TREO or TREE 1.30% TREO
Principal REEs from this resource
N/A
Average grade of other principal by-products
N/A
Offtake agreements N/A
Target Production (year) N/A
Target Production (tonnage) N/A
Resource
Measured N/A
Indicated 52 Mt at 3.25% ZrO2, 0.56%
Nb2O
5, 0.66% Y
2O
3, 0.12% BeO
(Historical)
Inferred N/A
Ownership 100% WI
Project Name Misery Lake
Location George River, Quebec, Canada
Size of property 79,400 ha
Type of ore N/A
NI 43-101/ JORC N/A
Average TREO or TREE Up to 8.56% TREO
Principal REEs from this resource
1.38% Nd2O
3, 1.57% Y
2O
3, 0.41%
Pr2O
3, 0.144% Dy
2O
3, 0.15%
Gd2O
3, 0.24% Yb
2O
3
Average grade of other principal by-products
42.30% FeO, 7.12% P2O
5, 4.85%
TiO2, 3.05% ZrO
2, 2.72% Nb
2O
5
Offtake agreements N/A
Target Production (year) N/A
Target Production (tonnage) N/A
Resource
Measured N/A
Indicated N/A
Inferred N/A
Ownership N/A
153
RA
RE E
AR
TH
ELE
MEN
TS
Snap
sho
ts
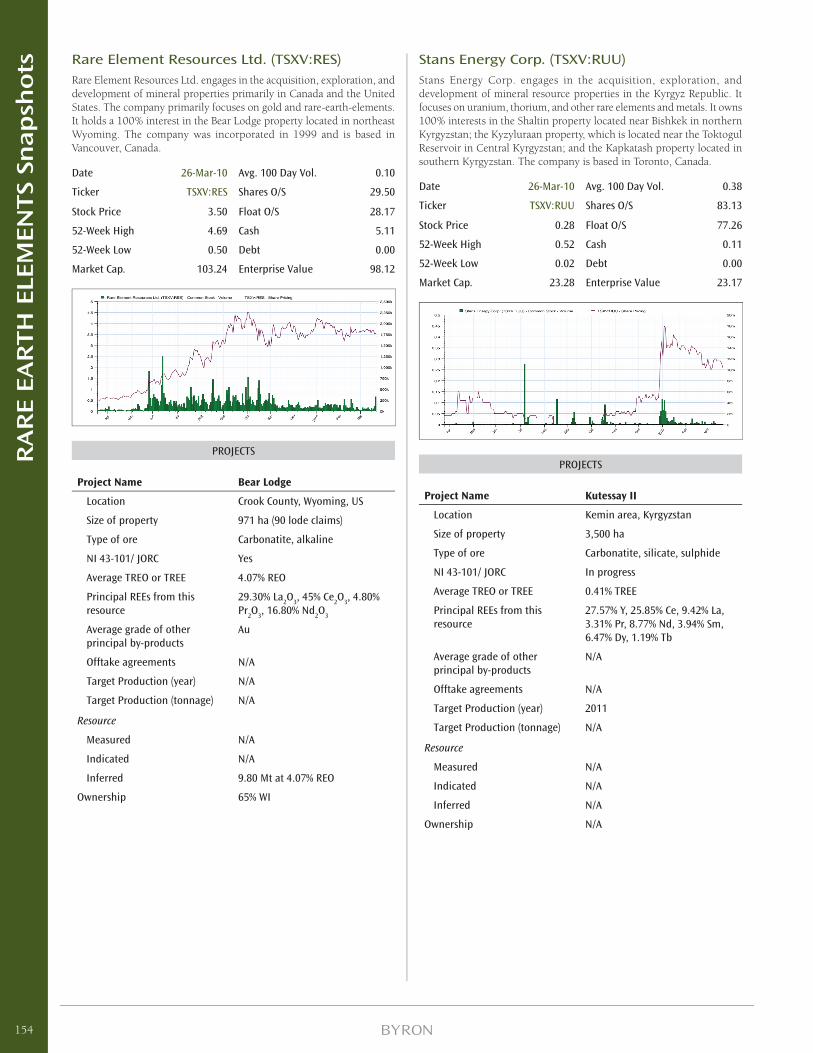
Rare Element Resources Ltd. (TSXV:RES)Rare Element Resources Ltd. engages in the acquisition, exploration, and development of mineral properties primarily in Canada and the United States. The company primarily focuses on gold and rare-earth-elements. It holds a 100% interest in the Bear Lodge property located in northeast Wyoming. The company was incorporated in 1999 and is based in Vancouver, Canada.
Date 26-Mar-10 Avg. 100 Day Vol. 0.10
Ticker TSXV:RES Shares O/S 29.50
Stock Price 3.50 Float O/S 28.17
52-Week High 4.69 Cash 5.11
52-Week Low 0.50 Debt 0.00
Market Cap. 103.24 Enterprise Value 98.12
PROJECTS
Project Name Bear Lodge
Location Crook County, Wyoming, US
Size of property 971 ha (90 lode claims)
Type of ore Carbonatite, alkaline
NI 43-101/ JORC Yes
Average TREO or TREE 4.07% REO
Principal REEs from this resource
29.30% La2O
3, 45% Ce
2O
3, 4.80%
Pr2O
3, 16.80% Nd
2O
3
Average grade of other principal by-products
Au
Offtake agreements N/A
Target Production (year) N/A
Target Production (tonnage) N/A
Resource
Measured N/A
Indicated N/A
Inferred 9.80 Mt at 4.07% REO
Ownership 65% WI
Stans Energy Corp. (TSXV:RUU)Stans Energy Corp. engages in the acquisition, exploration, and development of mineral resource properties in the Kyrgyz Republic. It focuses on uranium, thorium, and other rare elements and metals. It owns 100% interests in the Shaltin property located near Bishkek in northern Kyrgyzstan; the Kyzyluraan property, which is located near the Toktogul Reservoir in Central Kyrgyzstan; and the Kapkatash property located in southern Kyrgyzstan. The company is based in Toronto, Canada.
Date 26-Mar-10 Avg. 100 Day Vol. 0.38
Ticker TSXV:RUU Shares O/S 83.13
Stock Price 0.28 Float O/S 77.26
52-Week High 0.52 Cash 0.11
52-Week Low 0.02 Debt 0.00
Market Cap. 23.28 Enterprise Value 23.17
PROJECTS
Project Name Kutessay II
Location Kemin area, Kyrgyzstan
Size of property 3,500 ha
Type of ore Carbonatite, silicate, sulphide
NI 43-101/ JORC In progress
Average TREO or TREE 0.41% TREE
Principal REEs from this resource
27.57% Y, 25.85% Ce, 9.42% La, 3.31% Pr, 8.77% Nd, 3.94% Sm, 6.47% Dy, 1.19% Tb
Average grade of other principal by-products
N/A
Offtake agreements N/A
Target Production (year) 2011
Target Production (tonnage) N/A
Resource
Measured N/A
Indicated N/A
Inferred N/A
Ownership N/A
154
RA
RE E
AR
TH
ELE
MEN
TS
Snap
sho
ts
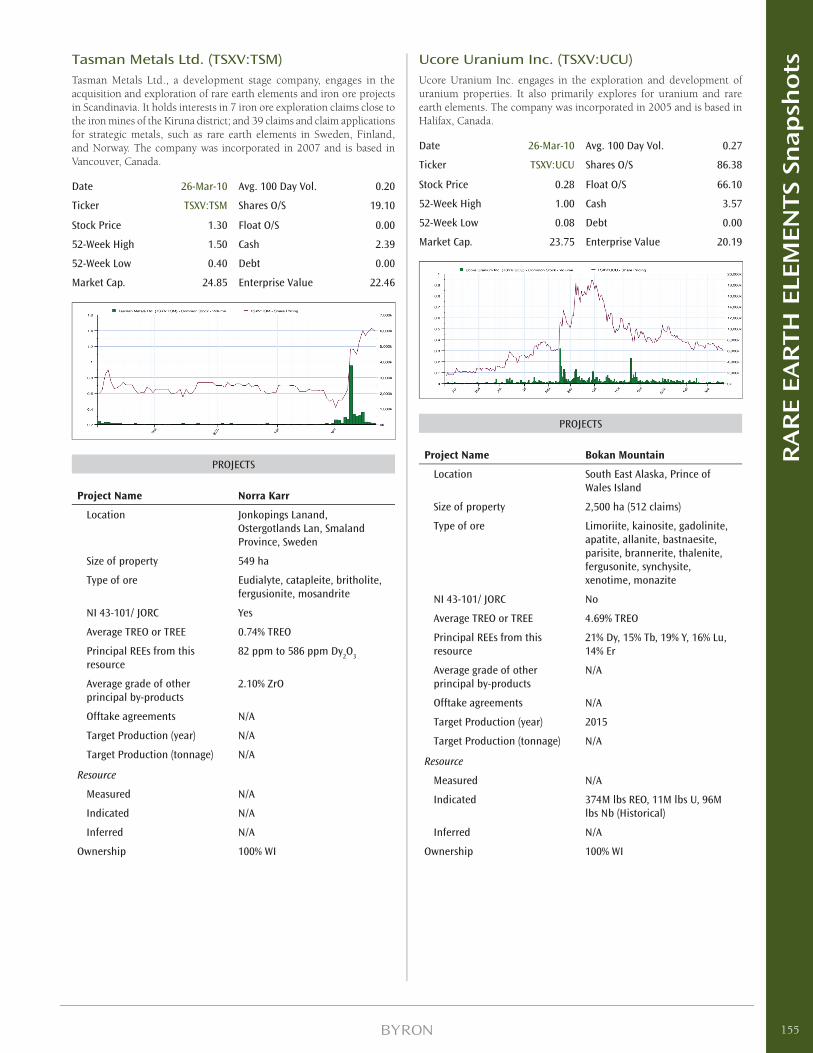
Tasman Metals Ltd. (TSXV:TSM)Tasman Metals Ltd., a development stage company, engages in the acquisition and exploration of rare earth elements and iron ore projects in Scandinavia. It holds interests in 7 iron ore exploration claims close to the iron mines of the Kiruna district; and 39 claims and claim applications for strategic metals, such as rare earth elements in Sweden, Finland, and Norway. The company was incorporated in 2007 and is based in Vancouver, Canada.
Date 26-Mar-10 Avg. 100 Day Vol. 0.20
Ticker TSXV:TSM Shares O/S 19.10
Stock Price 1.30 Float O/S 0.00
52-Week High 1.50 Cash 2.39
52-Week Low 0.40 Debt 0.00
Market Cap. 24.85 Enterprise Value 22.46
PROJECTS
Project Name Norra Karr
Location Jonkopings Lanand, Ostergotlands Lan, Smaland Province, Sweden
Size of property 549 ha
Type of ore Eudialyte, catapleite, britholite, fergusionite, mosandrite
NI 43-101/ JORC Yes
Average TREO or TREE 0.74% TREO
Principal REEs from this resource
82 ppm to 586 ppm Dy2O
3
Average grade of other principal by-products
2.10% ZrO
Offtake agreements N/A
Target Production (year) N/A
Target Production (tonnage) N/A
Resource
Measured N/A
Indicated N/A
Inferred N/A
Ownership 100% WI
Ucore Uranium Inc. (TSXV:UCU)Ucore Uranium Inc. engages in the exploration and development of uranium properties. It also primarily explores for uranium and rare earth elements. The company was incorporated in 2005 and is based in Halifax, Canada.
Date 26-Mar-10 Avg. 100 Day Vol. 0.27
Ticker TSXV:UCU Shares O/S 86.38
Stock Price 0.28 Float O/S 66.10
52-Week High 1.00 Cash 3.57
52-Week Low 0.08 Debt 0.00
Market Cap. 23.75 Enterprise Value 20.19
PROJECTS
Project Name Bokan Mountain
Location South East Alaska, Prince of Wales Island
Size of property 2,500 ha (512 claims)
Type of ore Limoriite, kainosite, gadolinite, apatite, allanite, bastnaesite, parisite, brannerite, thalenite, fergusonite, synchysite, xenotime, monazite
NI 43-101/ JORC No
Average TREO or TREE 4.69% TREO
Principal REEs from this resource
21% Dy, 15% Tb, 19% Y, 16% Lu, 14% Er
Average grade of other principal by-products
N/A
Offtake agreements N/A
Target Production (year) 2015
Target Production (tonnage) N/A
Resource
Measured N/A
Indicated 374M lbs REO, 11M lbs U, 96M lbs Nb (Historical)
Inferred N/A
Ownership 100% WI
155
RA
RE E
AR
TH
ELE
MEN
TS
Snap
sho
ts
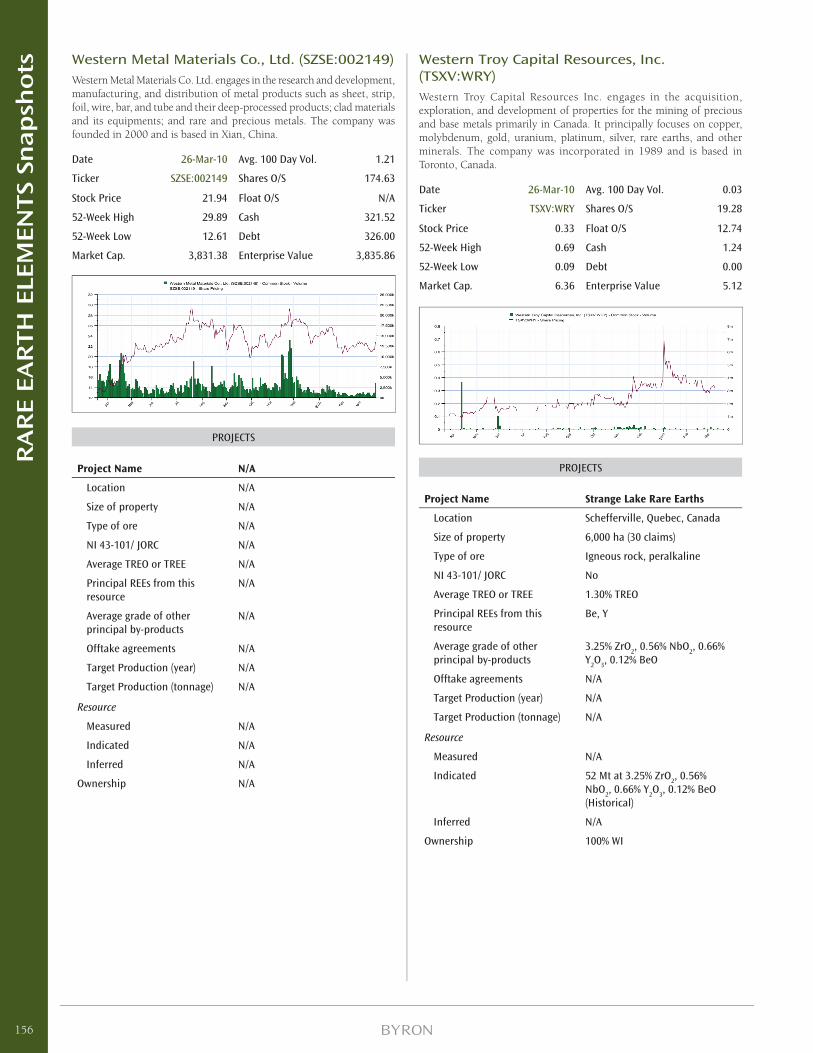
Western Metal Materials Co., Ltd. (SZSE:002149)Western Metal Materials Co. Ltd. engages in the research and development, manufacturing, and distribution of metal products such as sheet, strip, foil, wire, bar, and tube and their deep-processed products; clad materials and its equipments; and rare and precious metals. The company was founded in 2000 and is based in Xian, China.
Date 26-Mar-10 Avg. 100 Day Vol. 1.21
Ticker SZSE:002149 Shares O/S 174.63
Stock Price 21.94 Float O/S N/A
52-Week High 29.89 Cash 321.52
52-Week Low 12.61 Debt 326.00
Market Cap. 3,831.38 Enterprise Value 3,835.86
PROJECTS
Project Name N/A
Location N/A
Size of property N/A
Type of ore N/A
NI 43-101/ JORC N/A
Average TREO or TREE N/A
Principal REEs from this resource
N/A
Average grade of other principal by-products
N/A
Offtake agreements N/A
Target Production (year) N/A
Target Production (tonnage) N/A
Resource
Measured N/A
Indicated N/A
Inferred N/A
Ownership N/A
Western Troy Capital Resources, Inc. (TSXV:WRY)Western Troy Capital Resources Inc. engages in the acquisition, exploration, and development of properties for the mining of precious and base metals primarily in Canada. It principally focuses on copper, molybdenum, gold, uranium, platinum, silver, rare earths, and other minerals. The company was incorporated in 1989 and is based in Toronto, Canada.
Date 26-Mar-10 Avg. 100 Day Vol. 0.03
Ticker TSXV:WRY Shares O/S 19.28
Stock Price 0.33 Float O/S 12.74
52-Week High 0.69 Cash 1.24
52-Week Low 0.09 Debt 0.00
Market Cap. 6.36 Enterprise Value 5.12
PROJECTS
Project Name Strange Lake Rare Earths
Location Schefferville, Quebec, Canada
Size of property 6,000 ha (30 claims)
Type of ore Igneous rock, peralkaline
NI 43-101/ JORC No
Average TREO or TREE 1.30% TREO
Principal REEs from this resource
Be, Y
Average grade of other principal by-products
3.25% ZrO2, 0.56% NbO
2, 0.66%
Y2O
3, 0.12% BeO
Offtake agreements N/A
Target Production (year) N/A
Target Production (tonnage) N/A
Resource
Measured N/A
Indicated 52 Mt at 3.25% ZrO2, 0.56%
NbO2, 0.66% Y
2O
3, 0.12% BeO
(Historical)
Inferred N/A
Ownership 100% WI
156
RA
RE E
AR
TH
ELE
MEN
TS
Snap
sho
ts
Disclosures
Information contained in the company snap-shots and comp tables have been drawn from third party sources believed to be reliable. The accuracy or completeness of the information cannot be guaranteed, nor in providing it does Byron Capital Markets (a division of Byron Securities Limited) assume any responsibility or liability for the contents. From time to time, Byron Capital Markets and its directors, offi cers and other employees may maintain positions in the securities that are directly or indirectly involved in this Industry. The contents of this report cannot be reproduced in whole or in part without the expressed permission of Byron Capital Markets or Byron Securities Ltd. This information is intended for use by accredited investors only, and is not intended for use by any U.S. investor.
157
RA
RE E
AR
TH
ELE
MEN
TS
Snap
sho
ts

- Notes -
158
No
tes

- Notes -
159
No
tes

- Notes -
160
No
tes

- Notes -
161
No
tes