electric power monthly - energy information administration · may 2018 preface the electric power...
TRANSCRIPT
This report was prepared by the U.S. Energy Information Administration (EIA), the statistical and analytical agency within the U.S. Department of Energy. By law, EIA’s data, analyses, and forecasts are independent of approval by any other officer or employee of the United States Government. The views in this report therefore should not be construed as representing those of the Department of Energy or other Federal agencies
This issue of the Electric Power Monthly includes a new Chapter 8 with data for the Commonwealth of Puerto Rico. The chapter currently includes data on electricity sales to ultimate consumers. Coverage will eventually be expanded to include power plant characteristics, operations, and generation data. Note that the data for Puerto Rico is not included in the other tables in the EPM, which continue to show data for the 50 states and the District of Columbia. Also, Table 7.1 electicity exports and imports to/from Mexico for 2016 were revised from the May 2018 issue.
Electric Power Monthly with Data for April 2018
June 2018
Independent Statistics & Analysis
www.eia.gov
U.S. Department of Energy
Washington, DC 20585
June 2018
Contacts The Electric Power Monthly is prepared by the U.S. Energy Information Administration.
Questions and comments concerning the contents of the Electric Power Monthly may be directed to:
Ronald Hankey, Project Leader U.S. Energy Information Administration, EI-23 U.S. Department of Energy 1000 Independence Avenue, S.W. Washington, DC, 20585-0650
Email address: [email protected]
Subject specialists:
Requests for additional information on other statistics available from the U.S. Energy Information Administration or questions concerning subscriptions and report distribution may be directed to the Office of Communications of the U.S. Energy Information Administration at [email protected].
Subject Specialist
U.S. electric net generation Ronald Hankey
U.S. electric consumption of fuels Christopher Cassar
U.S. electric stocks of fuels Christopher Cassar
U.S. electric fossil-fuel receipts Joy Liu
U.S. electric fossil-fuel costs Joy Liu
U.S. sales of electricity to ultimate
consumers
Peter Wong
Sampling and estimation methodologies Orhan Yildiz.
June 2018
Preface The Electric Power Monthly (EPM) presents monthly electricity statistics for a wide audience including Congress, Federal and State agencies, the electric power industry, and the general public. The purpose of this publication is to provide energy decision makers with accurate and timely information that may be used in forming various perspectives on electric issues that lie ahead. In order to provide an integrated view of the electric power industry, data in this report have been separated into two major categories: electric power sector and combined heat and power producers. The U.S. Energy Information Administration (EIA) collected the information in this report to fulfill its data collection and dissemination responsibilities as specified in the Federal Energy Administration Act of 1974 (Public Law 93 275) as amended.
Background The Office of Electricity, Renewables & Uranium Statistics, U.S. EIA, U.S. Department of Energy, prepares the EPM. This publication provides monthly statistics at the State (lowest level of aggregation), Census Division, and U.S. levels for net generation, fossil fuel consumption and stocks, cost, quantity, and quality of fossil fuels received, sales of electricity to ultimate consumers, associated revenue, and average price of electricity sold. In addition, the report contains rolling 12-month totals in the national overviews, as appropriate.
Data sources The EPM contains information from the following data sources: Form EIA-923, "Power Plant Operations Report;" Form EIA-826, "Monthly Electric Sales and Revenue With State Distributions Report;" Form EIA-860, "Annual Electric Generator Report;" Form EIA-860M, "Monthly Update to the Annual Electric Generator Report;" and Form EIA-861, "Annual Electric Power Industry Report." Forms and their instructions may be obtained from: http://www.eia.gov/survey/#electricity. A detailed description of these forms and associated algorithms are found in Appendix C, “Technical Notes.”
June 2018
Table of Contents
Contacts
Quality
Preface
Background
Data Sources
Table and Figure Index
References
Glossary
June 2018
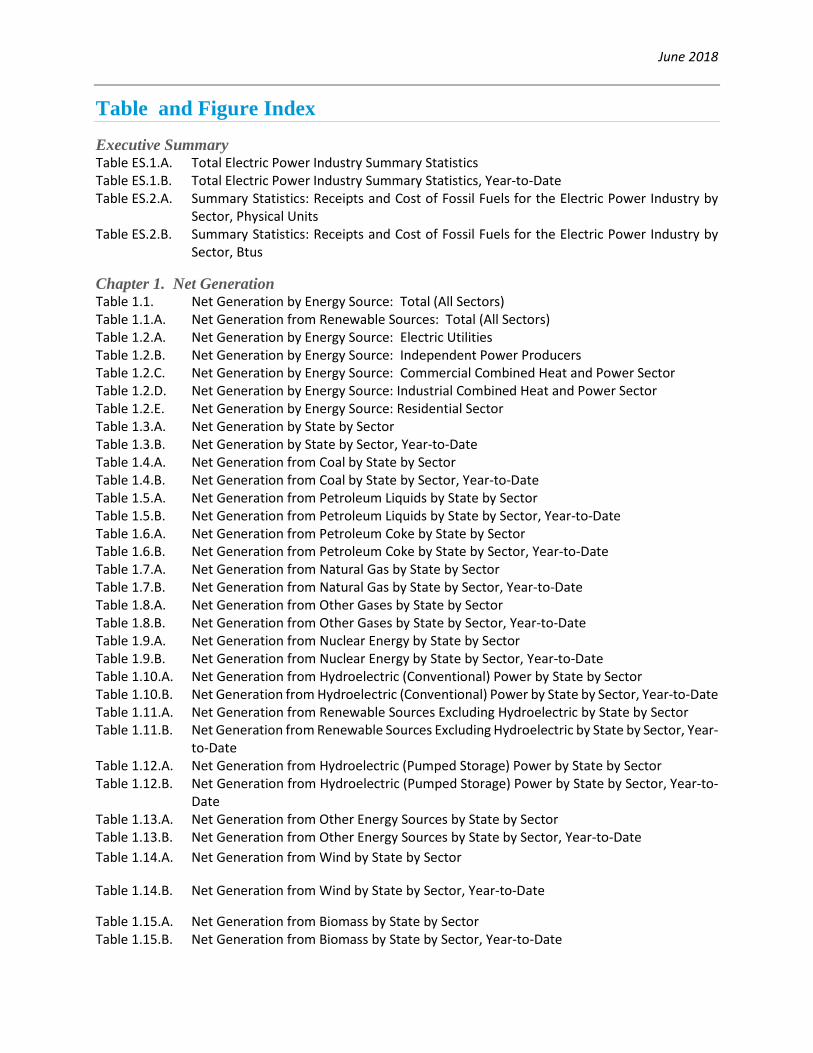
Table and Figure Index Executive Summary Table ES.1.A. Total Electric Power Industry Summary Statistics Table ES.1.B. Total Electric Power Industry Summary Statistics, Year-to-Date Table ES.2.A. Summary Statistics: Receipts and Cost of Fossil Fuels for the Electric Power Industry by
Sector, Physical Units Table ES.2.B. Summary Statistics: Receipts and Cost of Fossil Fuels for the Electric Power Industry by
Sector, Btus
Chapter 1. Net Generation Table 1.1. Net Generation by Energy Source: Total (All Sectors) Table 1.1.A. Net Generation from Renewable Sources: Total (All Sectors) Table 1.2.A. Net Generation by Energy Source: Electric Utilities Table 1.2.B. Net Generation by Energy Source: Independent Power Producers Table 1.2.C. Net Generation by Energy Source: Commercial Combined Heat and Power Sector Table 1.2.D. Net Generation by Energy Source: Industrial Combined Heat and Power Sector Table 1.2.E. Net Generation by Energy Source: Residential Sector Table 1.3.A. Net Generation by State by Sector Table 1.3.B. Net Generation by State by Sector, Year-to-Date Table 1.4.A. Net Generation from Coal by State by Sector Table 1.4.B. Net Generation from Coal by State by Sector, Year-to-Date Table 1.5.A. Net Generation from Petroleum Liquids by State by Sector Table 1.5.B. Net Generation from Petroleum Liquids by State by Sector, Year-to-Date Table 1.6.A. Net Generation from Petroleum Coke by State by Sector Table 1.6.B. Net Generation from Petroleum Coke by State by Sector, Year-to-Date Table 1.7.A. Net Generation from Natural Gas by State by Sector Table 1.7.B. Net Generation from Natural Gas by State by Sector, Year-to-Date Table 1.8.A. Net Generation from Other Gases by State by Sector Table 1.8.B. Net Generation from Other Gases by State by Sector, Year-to-Date Table 1.9.A. Net Generation from Nuclear Energy by State by Sector Table 1.9.B. Net Generation from Nuclear Energy by State by Sector, Year-to-Date Table 1.10.A. Net Generation from Hydroelectric (Conventional) Power by State by Sector Table 1.10.B. Net Generation from Hydroelectric (Conventional) Power by State by Sector, Year-to-Date Table 1.11.A. Net Generation from Renewable Sources Excluding Hydroelectric by State by Sector Table 1.11.B. Net Generation from Renewable Sources Excluding Hydroelectric by State by Sector, Year-
to-Date Table 1.12.A. Net Generation from Hydroelectric (Pumped Storage) Power by State by Sector Table 1.12.B. Net Generation from Hydroelectric (Pumped Storage) Power by State by Sector, Year-to-
Date Table 1.13.A. Net Generation from Other Energy Sources by State by Sector Table 1.13.B. Net Generation from Other Energy Sources by State by Sector, Year-to-Date Table 1.14.A. Net Generation from Wind by State by Sector
Table 1.14.B. Net Generation from Wind by State by Sector, Year-to-Date
Table 1.15.A. Net Generation from Biomass by State by Sector Table 1.15.B. Net Generation from Biomass by State by Sector, Year-to-Date
June 2018
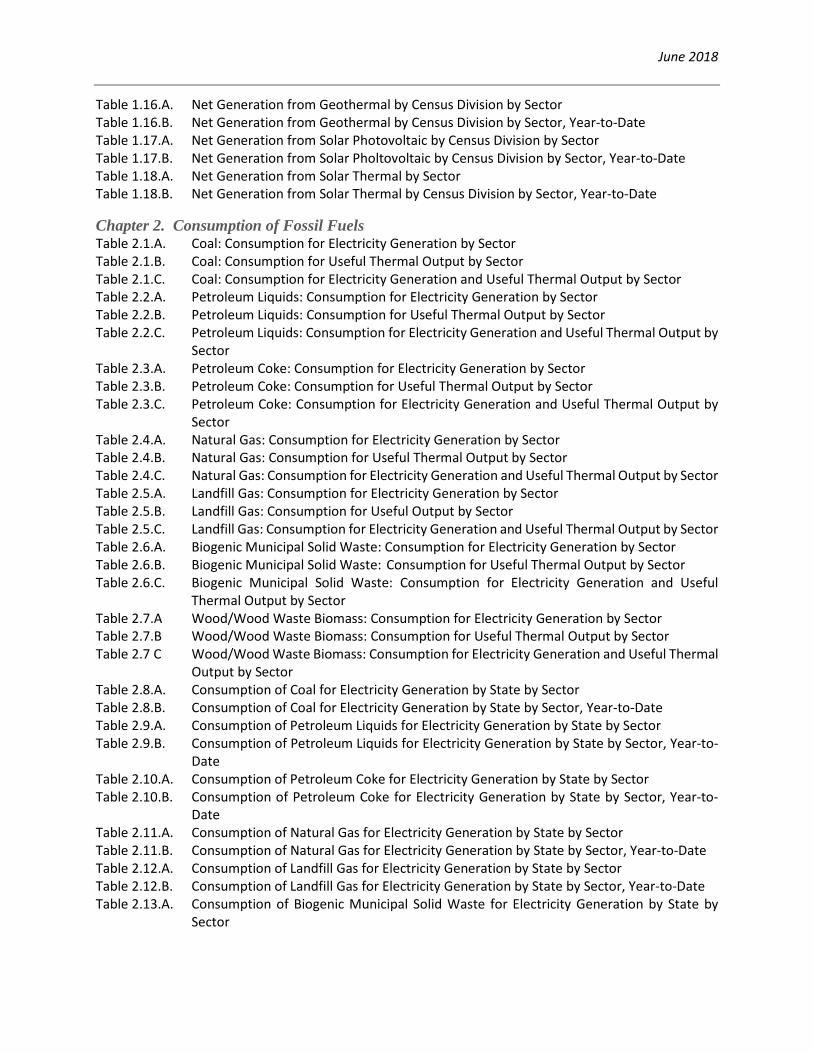
Table 1.16.A. Net Generation from Geothermal by Census Division by Sector Table 1.16.B. Net Generation from Geothermal by Census Division by Sector, Year-to-Date Table 1.17.A. Net Generation from Solar Photovoltaic by Census Division by Sector Table 1.17.B. Net Generation from Solar Pholtovoltaic by Census Division by Sector, Year-to-Date Table 1.18.A. Net Generation from Solar Thermal by Sector Table 1.18.B. Net Generation from Solar Thermal by Census Division by Sector, Year-to-Date
Chapter 2. Consumption of Fossil Fuels Table 2.1.A. Coal: Consumption for Electricity Generation by Sector Table 2.1.B. Coal: Consumption for Useful Thermal Output by Sector Table 2.1.C. Coal: Consumption for Electricity Generation and Useful Thermal Output by Sector Table 2.2.A. Petroleum Liquids: Consumption for Electricity Generation by Sector Table 2.2.B. Petroleum Liquids: Consumption for Useful Thermal Output by Sector Table 2.2.C. Petroleum Liquids: Consumption for Electricity Generation and Useful Thermal Output by
Sector Table 2.3.A. Petroleum Coke: Consumption for Electricity Generation by Sector Table 2.3.B. Petroleum Coke: Consumption for Useful Thermal Output by Sector Table 2.3.C. Petroleum Coke: Consumption for Electricity Generation and Useful Thermal Output by
Sector Table 2.4.A. Natural Gas: Consumption for Electricity Generation by Sector Table 2.4.B. Natural Gas: Consumption for Useful Thermal Output by Sector Table 2.4.C. Natural Gas: Consumption for Electricity Generation and Useful Thermal Output by Sector Table 2.5.A. Landfill Gas: Consumption for Electricity Generation by Sector Table 2.5.B. Landfill Gas: Consumption for Useful Output by Sector Table 2.5.C. Landfill Gas: Consumption for Electricity Generation and Useful Thermal Output by Sector Table 2.6.A. Biogenic Municipal Solid Waste: Consumption for Electricity Generation by Sector Table 2.6.B. Biogenic Municipal Solid Waste: Consumption for Useful Thermal Output by Sector Table 2.6.C. Biogenic Municipal Solid Waste: Consumption for Electricity Generation and Useful
Thermal Output by Sector Table 2.7.A Wood/Wood Waste Biomass: Consumption for Electricity Generation by Sector Table 2.7.B Wood/Wood Waste Biomass: Consumption for Useful Thermal Output by Sector Table 2.7 C Wood/Wood Waste Biomass: Consumption for Electricity Generation and Useful Thermal
Output by Sector Table 2.8.A. Consumption of Coal for Electricity Generation by State by Sector Table 2.8.B. Consumption of Coal for Electricity Generation by State by Sector, Year-to-Date Table 2.9.A. Consumption of Petroleum Liquids for Electricity Generation by State by Sector Table 2.9.B. Consumption of Petroleum Liquids for Electricity Generation by State by Sector, Year-to-
Date Table 2.10.A. Consumption of Petroleum Coke for Electricity Generation by State by Sector Table 2.10.B. Consumption of Petroleum Coke for Electricity Generation by State by Sector, Year-to-
Date Table 2.11.A. Consumption of Natural Gas for Electricity Generation by State by Sector Table 2.11.B. Consumption of Natural Gas for Electricity Generation by State by Sector, Year-to-Date Table 2.12.A. Consumption of Landfill Gas for Electricity Generation by State by Sector Table 2.12.B. Consumption of Landfill Gas for Electricity Generation by State by Sector, Year-to-Date Table 2.13.A. Consumption of Biogenic Municipal Solid Waste for Electricity Generation by State by
Sector
June 2018
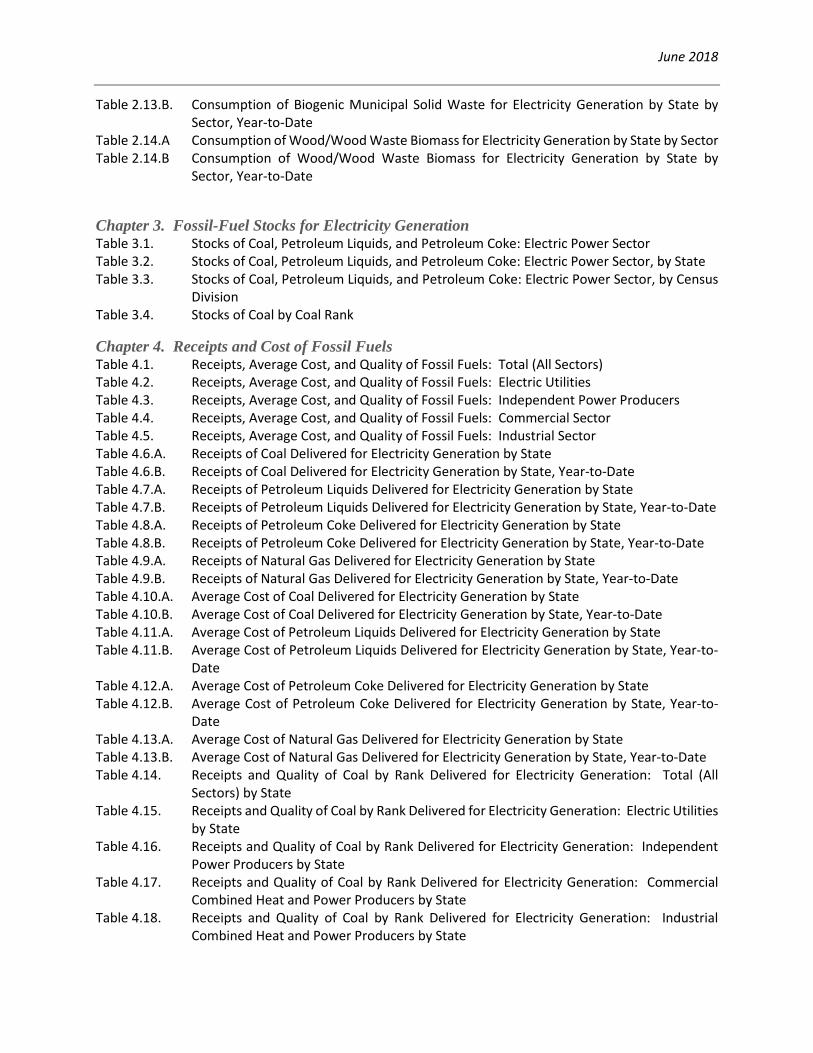
Table 2.13.B. Consumption of Biogenic Municipal Solid Waste for Electricity Generation by State by Sector, Year-to-Date
Table 2.14.A Consumption of Wood/Wood Waste Biomass for Electricity Generation by State by Sector Table 2.14.B Consumption of Wood/Wood Waste Biomass for Electricity Generation by State by
Sector, Year-to-Date
Chapter 3. Fossil-Fuel Stocks for Electricity Generation Table 3.1. Stocks of Coal, Petroleum Liquids, and Petroleum Coke: Electric Power Sector Table 3.2. Stocks of Coal, Petroleum Liquids, and Petroleum Coke: Electric Power Sector, by State Table 3.3. Stocks of Coal, Petroleum Liquids, and Petroleum Coke: Electric Power Sector, by Census
Division Table 3.4. Stocks of Coal by Coal Rank
Chapter 4. Receipts and Cost of Fossil Fuels Table 4.1. Receipts, Average Cost, and Quality of Fossil Fuels: Total (All Sectors) Table 4.2. Receipts, Average Cost, and Quality of Fossil Fuels: Electric Utilities Table 4.3. Receipts, Average Cost, and Quality of Fossil Fuels: Independent Power Producers Table 4.4. Receipts, Average Cost, and Quality of Fossil Fuels: Commercial Sector Table 4.5. Receipts, Average Cost, and Quality of Fossil Fuels: Industrial Sector Table 4.6.A. Receipts of Coal Delivered for Electricity Generation by State Table 4.6.B. Receipts of Coal Delivered for Electricity Generation by State, Year-to-Date Table 4.7.A. Receipts of Petroleum Liquids Delivered for Electricity Generation by State Table 4.7.B. Receipts of Petroleum Liquids Delivered for Electricity Generation by State, Year-to-Date Table 4.8.A. Receipts of Petroleum Coke Delivered for Electricity Generation by State Table 4.8.B. Receipts of Petroleum Coke Delivered for Electricity Generation by State, Year-to-Date Table 4.9.A. Receipts of Natural Gas Delivered for Electricity Generation by State Table 4.9.B. Receipts of Natural Gas Delivered for Electricity Generation by State, Year-to-Date Table 4.10.A. Average Cost of Coal Delivered for Electricity Generation by State Table 4.10.B. Average Cost of Coal Delivered for Electricity Generation by State, Year-to-Date Table 4.11.A. Average Cost of Petroleum Liquids Delivered for Electricity Generation by State Table 4.11.B. Average Cost of Petroleum Liquids Delivered for Electricity Generation by State, Year-to-
Date Table 4.12.A. Average Cost of Petroleum Coke Delivered for Electricity Generation by State Table 4.12.B. Average Cost of Petroleum Coke Delivered for Electricity Generation by State, Year-to-
Date Table 4.13.A. Average Cost of Natural Gas Delivered for Electricity Generation by State Table 4.13.B. Average Cost of Natural Gas Delivered for Electricity Generation by State, Year-to-Date Table 4.14. Receipts and Quality of Coal by Rank Delivered for Electricity Generation: Total (All
Sectors) by State Table 4.15. Receipts and Quality of Coal by Rank Delivered for Electricity Generation: Electric Utilities
by State Table 4.16. Receipts and Quality of Coal by Rank Delivered for Electricity Generation: Independent
Power Producers by State Table 4.17. Receipts and Quality of Coal by Rank Delivered for Electricity Generation: Commercial
Combined Heat and Power Producers by State Table 4.18. Receipts and Quality of Coal by Rank Delivered for Electricity Generation: Industrial
Combined Heat and Power Producers by State
June 2018
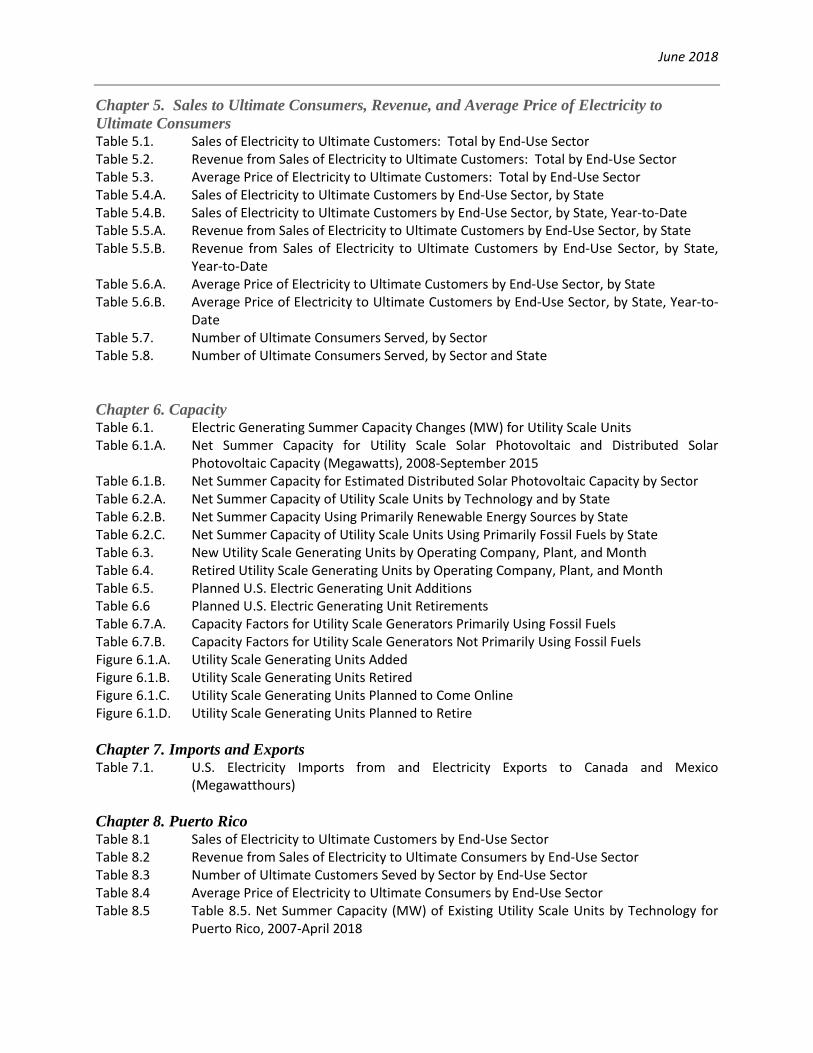
Chapter 5. Sales to Ultimate Consumers, Revenue, and Average Price of Electricity to Ultimate Consumers Table 5.1. Sales of Electricity to Ultimate Customers: Total by End-Use Sector Table 5.2. Revenue from Sales of Electricity to Ultimate Customers: Total by End-Use Sector Table 5.3. Average Price of Electricity to Ultimate Customers: Total by End-Use Sector Table 5.4.A. Sales of Electricity to Ultimate Customers by End-Use Sector, by State Table 5.4.B. Sales of Electricity to Ultimate Customers by End-Use Sector, by State, Year-to-Date Table 5.5.A. Revenue from Sales of Electricity to Ultimate Customers by End-Use Sector, by State Table 5.5.B. Revenue from Sales of Electricity to Ultimate Customers by End-Use Sector, by State,
Year-to-Date Table 5.6.A. Average Price of Electricity to Ultimate Customers by End-Use Sector, by State Table 5.6.B. Average Price of Electricity to Ultimate Customers by End-Use Sector, by State, Year-to-
Date Table 5.7. Number of Ultimate Consumers Served, by Sector Table 5.8. Number of Ultimate Consumers Served, by Sector and State Chapter 6. Capacity Table 6.1. Electric Generating Summer Capacity Changes (MW) for Utility Scale Units Table 6.1.A. Net Summer Capacity for Utility Scale Solar Photovoltaic and Distributed Solar
Photovoltaic Capacity (Megawatts), 2008-September 2015 Table 6.1.B. Net Summer Capacity for Estimated Distributed Solar Photovoltaic Capacity by Sector Table 6.2.A. Net Summer Capacity of Utility Scale Units by Technology and by State Table 6.2.B. Net Summer Capacity Using Primarily Renewable Energy Sources by State Table 6.2.C. Net Summer Capacity of Utility Scale Units Using Primarily Fossil Fuels by State Table 6.3. New Utility Scale Generating Units by Operating Company, Plant, and Month Table 6.4. Retired Utility Scale Generating Units by Operating Company, Plant, and Month Table 6.5. Planned U.S. Electric Generating Unit Additions Table 6.6 Planned U.S. Electric Generating Unit Retirements Table 6.7.A. Capacity Factors for Utility Scale Generators Primarily Using Fossil Fuels Table 6.7.B. Capacity Factors for Utility Scale Generators Not Primarily Using Fossil Fuels Figure 6.1.A. Utility Scale Generating Units Added Figure 6.1.B. Utility Scale Generating Units Retired Figure 6.1.C. Utility Scale Generating Units Planned to Come Online Figure 6.1.D. Utility Scale Generating Units Planned to Retire Chapter 7. Imports and Exports Table 7.1. U.S. Electricity Imports from and Electricity Exports to Canada and Mexico
(Megawatthours) Chapter 8. Puerto Rico Table 8.1 Sales of Electricity to Ultimate Customers by End-Use Sector Table 8.2 Revenue from Sales of Electricity to Ultimate Consumers by End-Use Sector Table 8.3 Number of Ultimate Customers Seved by Sector by End-Use Sector Table 8.4 Average Price of Electricity to Ultimate Consumers by End-Use Sector Table 8.5 Table 8.5. Net Summer Capacity (MW) of Existing Utility Scale Units by Technology for
Puerto Rico, 2007-April 2018
June 2018
Appendices Table A.1.A. Relative Standard Error for Net Generation by Fuel Type: Total (All Sectors) by Census
Division and State Table A.1.A. Relative Standard Error for Net Generation by Fuel Type: Total (All Sectors) by Census
Division and State (Continued) Table A.1.B. Relative Standard Error for Net Generation by Fuel Type: Total (All Sectors) by Census
Division and State, Year-to-Date Table A.1.B. Relative Standard Error for Net Generation by Fuel Type: Total (All Sectors) by Census
Division and State, Year-to-Date (Continued) Table A.2.A. Relative Standard Error for Net Generation by Fuel Type: Electric Utilities by Census
Division and State Table A.2.A. Relative Standard Error for Net Generation by Fuel Type: Electric Utilities by Census
Division and State (Continued) Table A.2.B. Relative Standard Error for Net Generation by Fuel Type: Electric Utilities by Census
Division and State, Year-to-Date Table A.2.B. Relative Standard Error for Net Generation by Fuel Type: Electric Utilities by Census
Division and State, Year-to-Date (Continued) Table A.3.A. Relative Standard Error for Net Generation by Fuel Type: Independent Power Producers
by Census Division and State Table A.3.A. Relative Standard Error for Net Generation by Fuel Type: Independent Power Producers
by Census Division and State (Continued) Table A.3.B. Relative Standard Error for Net Generation by Fuel Type: Independent Power Producers
by Census Division and State, Year-to-Date Table A.3.B. Relative Standard Error for Net Generation by Fuel Type: Independent Power Producers
by Census Division and State, Year-to-Date (Continued) Table A.4.A. Relative Standard Error for Net Generation by Fuel Type: Commercial Sector by Census
Division and State Table A.4.A. Relative Standard Error for Net Generation by Fuel Type: Commercial Sector by Census
Division and State (Continued) Table A.4.B. Relative Standard Error for Net Generation by Fuel Type: Commercial Sector by Census
Division and State, Year-to-Date Table A.4.B. Relative Standard Error for Net Generation by Fuel Type: Commercial Sector by Census
Division and State, Year-to-Date (Continued) Table A.5.A. Relative Standard Error for Net Generation by Fuel Type: Industrial Sector by Census
Division and State Table A.5.A. Relative Standard Error for Net Generation by Fuel Type: Industrial Sector by Census
Division and State, (Continued) Table A.5.B. Relative Standard Error for Net Generation by Fuel Type: Industrial Sector by Census
Division and State, Year-to-Date Table A.5.B. Relative Standard Error for Net Generation by Fuel Type: Industrial Sector by Census
Division and State, Year-to-Date (Continued) Table A.6.A. Relative Standard Error for Sales of Electricity to Ultimate Customers by End-Use Sector,
Census Division, and State Table A.6.B. Relative Standard Error for Sales of Electricity to Ultimate Customers by End-Use Sector,
Census Division, and State, Year-to-Date
June 2018
Table A.7.A. Relative Standard Error for Revenue from Sales of Electricity to Ultimate Customers by End-Use Sector, Census Division, and State
Table A.7.B. Relative Standard Error for Revenue from Sales of Electricity to Ultimate Customers by End-Use Sector, Census Division, and State, Year-to-Date
Table A.8.A. Relative Standard Error for Average Price of Electricity to Ultimate Customers by End-Use Sector, Census Division, and State
Table A.8.B. Relative Standard Error for Average Price of Electricity to Ultimate Customers by End-Use Sector, Census Division, and State, Year-to-Date
Table B.1. Major Disturbances and Unusual Occurrences, Year-to-Date Table B.2 Major Disturbances and Unusual Occurrences, Prior Year Table C.1. Average Heat Content of Fossil-Fuel Receipts Table C.2. Comparison of Preliminary Monthly Data versus Final Monthly Data at the U.S. Level Table C.3. Comparison of Annual Monthly Estimates versus Annual Data at the U.S. Level, All Sectors Table C.4. Unit-of-Measure Equivalents for Electricity
6/19/2018 5:24:33 PM
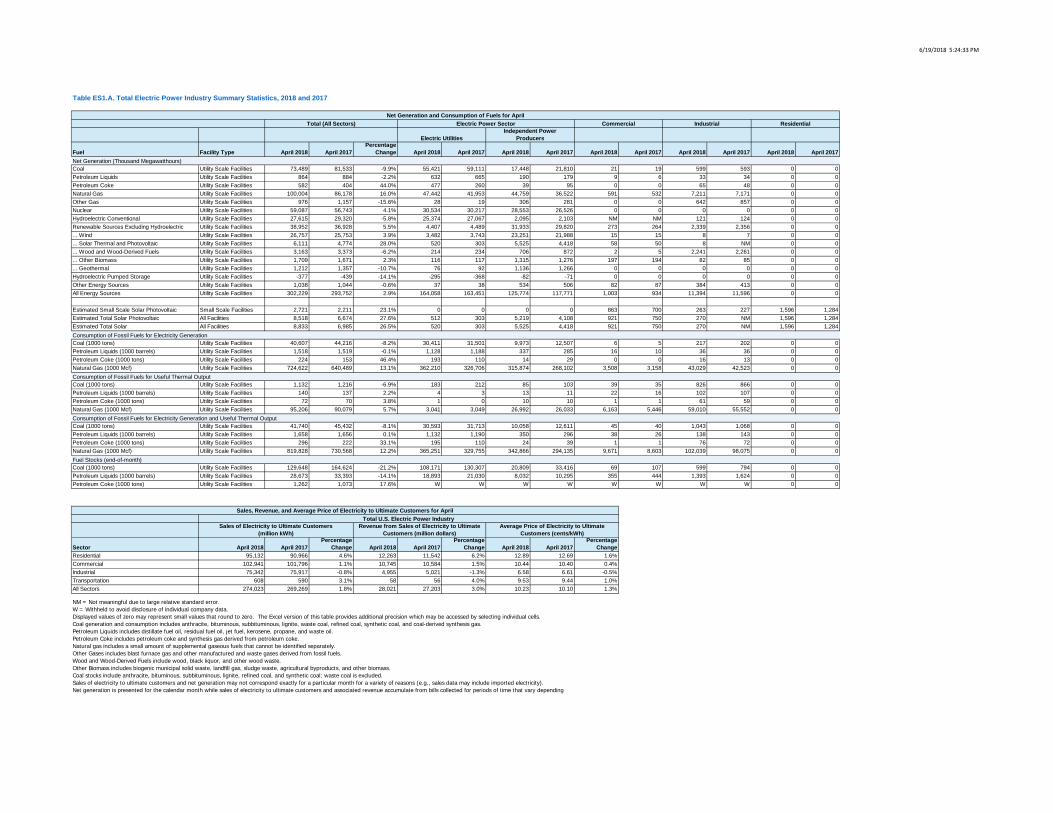
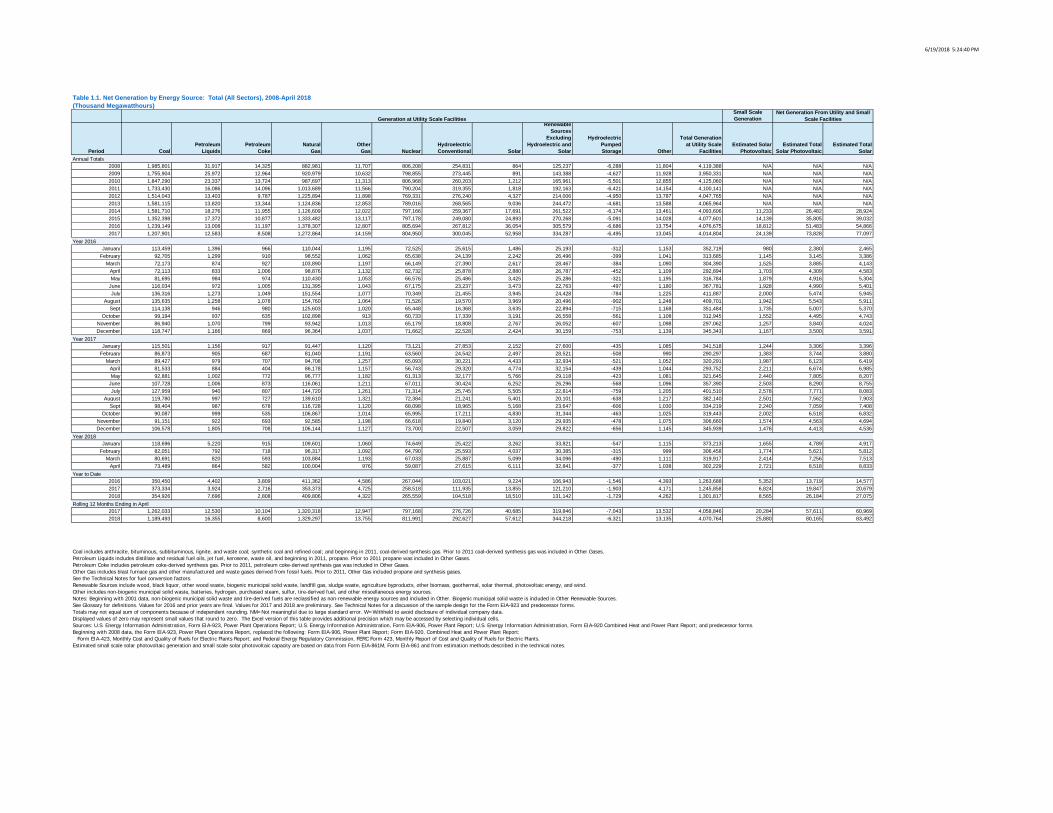
Fuel Facility Type April 2018 April 2017Percentage
Change April 2018 April 2017 April 2018 April 2017 April 2018 April 2017 April 2018 April 2017 April 2018 April 2017
Coal Utility Scale Facilities 73,489 81,533 -9.9% 55,421 59,111 17,448 21,810 21 19 599 593 0 0Petroleum Liquids Utility Scale Facilities 864 884 -2.2% 632 665 190 179 9 6 33 34 0 0Petroleum Coke Utility Scale Facilities 582 404 44.0% 477 260 39 95 0 0 65 48 0 0Natural Gas Utility Scale Facilities 100,004 86,178 16.0% 47,442 41,953 44,759 36,522 591 532 7,211 7,171 0 0Other Gas Utility Scale Facilities 976 1,157 -15.6% 28 19 306 281 0 0 642 857 0 0Nuclear Utility Scale Facilities 59,087 56,743 4.1% 30,534 30,217 28,553 26,526 0 0 0 0 0 0Hydroelectric Conventional Utility Scale Facilities 27,615 29,320 -5.8% 25,374 27,067 2,095 2,103 NM NM 121 124 0 0Renewable Sources Excluding Hydroelectric Utility Scale Facilities 38,952 36,928 5.5% 4,407 4,489 31,933 29,820 273 264 2,339 2,356 0 0... Wind Utility Scale Facilities 26,757 25,753 3.9% 3,482 3,743 23,251 21,988 15 15 8 7 0 0... Solar Thermal and Photovoltaic Utility Scale Facilities 6,111 4,774 28.0% 520 303 5,525 4,418 58 50 8 NM 0 0... Wood and Wood-Derived Fuels Utility Scale Facilities 3,163 3,373 -6.2% 214 234 706 872 2 5 2,241 2,261 0 0... Other Biomass Utility Scale Facilities 1,709 1,671 2.3% 116 117 1,315 1,276 197 194 82 85 0 0... Geothermal Utility Scale Facilities 1,212 1,357 -10.7% 76 92 1,136 1,266 0 0 0 0 0 0Hydroelectric Pumped Storage Utility Scale Facilities -377 -439 -14.1% -295 -368 -82 -71 0 0 0 0 0 0Other Energy Sources Utility Scale Facilities 1,038 1,044 -0.6% 37 38 534 506 82 87 384 413 0 0All Energy Sources Utility Scale Facilities 302,229 293,752 2.9% 164,058 163,451 125,774 117,771 1,003 934 11,394 11,596 0 0
Estimated Small Scale Solar Photovoltaic Small Scale Facilities 2,721 2,211 23.1% 0 0 0 0 863 700 263 227 1,596 1,284Estimated Total Solar Photovoltaic All Facilities 8,518 6,674 27.6% 512 303 5,219 4,108 921 750 270 NM 1,596 1,284Estimated Total Solar All Facilities 8,833 6,985 26.5% 520 303 5,525 4,418 921 750 270 NM 1,596 1,284
Coal (1000 tons) Utility Scale Facilities 40,607 44,216 -8.2% 30,411 31,501 9,973 12,507 6 5 217 202 0 0Petroleum Liquids (1000 barrels) Utility Scale Facilities 1,518 1,519 -0.1% 1,128 1,188 337 285 16 10 36 36 0 0Petroleum Coke (1000 tons) Utility Scale Facilities 224 153 46.4% 193 110 14 29 0 0 16 13 0 0Natural Gas (1000 Mcf) Utility Scale Facilities 724,622 640,489 13.1% 362,210 326,706 315,874 268,102 3,508 3,158 43,029 42,523 0 0
Coal (1000 tons) Utility Scale Facilities 1,132 1,216 -6.9% 183 212 85 103 39 35 826 866 0 0Petroleum Liquids (1000 barrels) Utility Scale Facilities 140 137 2.2% 4 3 13 11 22 16 102 107 0 0Petroleum Coke (1000 tons) Utility Scale Facilities 72 70 3.8% 1 0 10 10 1 1 61 59 0 0Natural Gas (1000 Mcf) Utility Scale Facilities 95,206 90,079 5.7% 3,041 3,049 26,992 26,033 6,163 5,446 59,010 55,552 0 0
Coal (1000 tons) Utility Scale Facilities 41,740 45,432 -8.1% 30,593 31,713 10,058 12,611 45 40 1,043 1,068 0 0Petroleum Liquids (1000 barrels) Utility Scale Facilities 1,658 1,656 0.1% 1,132 1,190 350 296 38 26 138 143 0 0Petroleum Coke (1000 tons) Utility Scale Facilities 296 222 33.1% 195 110 24 39 1 1 76 72 0 0Natural Gas (1000 Mcf) Utility Scale Facilities 819,828 730,568 12.2% 365,251 329,755 342,866 294,135 9,671 8,603 102,039 98,075 0 0
Coal (1000 tons) Utility Scale Facilities 129,648 164,624 -21.2% 108,171 130,307 20,809 33,416 69 107 599 794 0 0Petroleum Liquids (1000 barrels) Utility Scale Facilities 28,673 33,393 -14.1% 18,893 21,030 8,032 10,295 355 444 1,393 1,624 0 0Petroleum Coke (1000 tons) Utility Scale Facilities 1,262 1,073 17.6% W W W W W W W W 0 0
Sector April 2018 April 2017Percentage
Change April 2018 April 2017Percentage
Change April 2018 April 2017Percentage
ChangeResidential 95,132 90,966 4.6% 12,263 11,542 6.2% 12.89 12.69 1.6%Commercial 102,941 101,796 1.1% 10,745 10,584 1.5% 10.44 10.40 0.4%Industrial 75,342 75,917 -0.8% 4,955 5,021 -1.3% 6.58 6.61 -0.5%Transportation 608 590 3.1% 58 56 4.0% 9.53 9.44 1.0%All Sectors 274,023 269,269 1.8% 28,021 27,203 3.0% 10.23 10.10 1.3%
Table ES1.A. Total Electric Power Industry Summary Statistics, 2018 and 2017
Net Generation and Consumption of Fuels for AprilTotal (All Sectors) Electric Power Sector Commercial Industrial Residential
Electric UtilitiesIndependent Power
Producers
Net Generation (Thousand Megawatthours)
Consumption of Fossil Fuels for Electricity Generation
Consumption of Fossil Fuels for Useful Thermal Output
Consumption of Fossil Fuels for Electricity Generation and Useful Thermal Output
Fuel Stocks (end-of-month)
NM = Not meaningful due to large relative standard error.W = Withheld to avoid disclosure of individual company data.Displayed values of zero may represent small values that round to zero. The Excel version of this table provides additional precision which may be accessed by selecting individual cells.Coal generation and consumption includes anthracite, bituminous, subbituminous, lignite, waste coal, refined coal, synthetic coal, and coal-derived synthesis gas.Petroleum Liquids includes distillate fuel oil, residual fuel oil, jet fuel, kerosene, propane, and waste oil.Petroleum Coke includes petroleum coke and synthesis gas derived from petroleum coke. Natural gas includes a small amount of supplemental gaseous fuels that cannot be identified separately.Other Gases includes blast furnace gas and other manufactured and waste gases derived from fossil fuels.Wood and Wood-Derived Fuels include wood, black liquor, and other wood waste.Other Biomass includes biogenic municipal solid waste, landfill gas, sludge waste, agricultural byproducts, and other biomass.Coal stocks include anthracite, bituminous, subbituminous, lignite, refined coal, and synthetic coal; waste coal is excluded.Sales of electricity to ultimate customers and net generation may not correspond exactly for a particular month for a variety of reasons (e.g., sales data may include imported electricity).Net generation is presented for the calendar month while sales of electricity to ultimate customers and associated revenue accumulate from bills collected for periods of time that vary depending
Sales, Revenue, and Average Price of Electricity to Ultimate Customers for April
Total U.S. Electric Power IndustrySales of Electricity to Ultimate Customers
(million kWh)Revenue from Sales of Electricity to Ultimate
Customers (million dollars)Average Price of Electricity to Ultimate
Customers (cents/kWh)
6/19/2018 5:24:35 PM
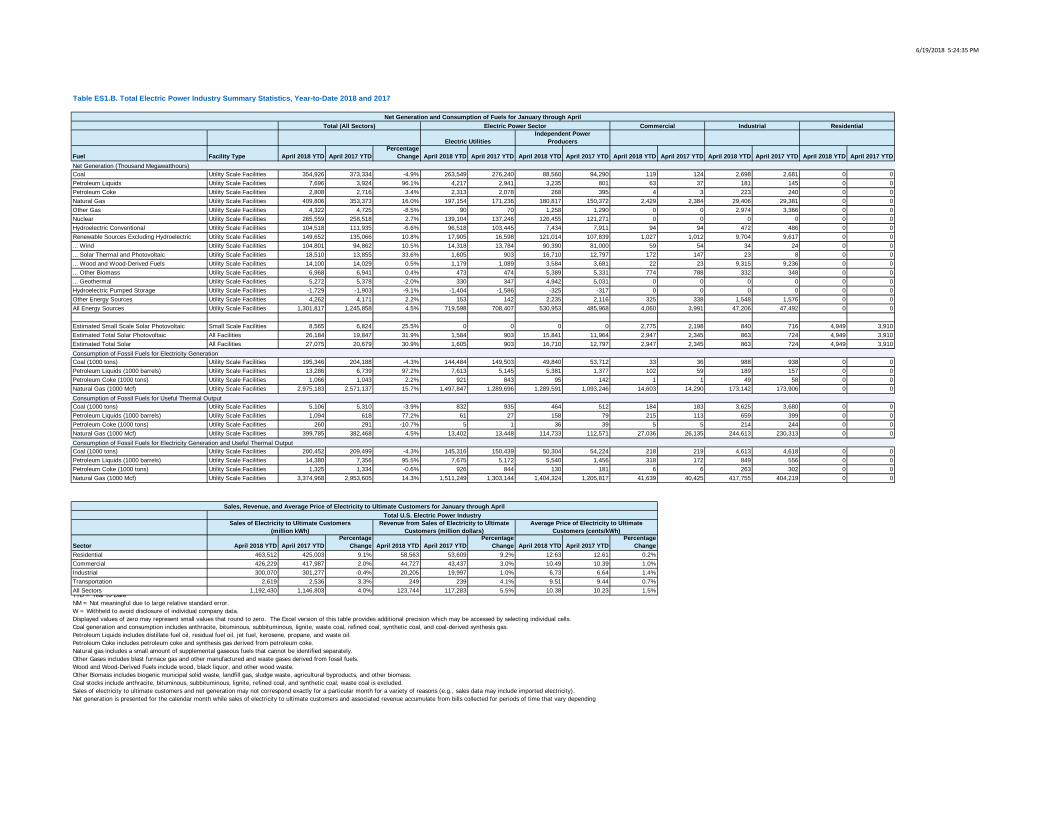
Fuel Facility Type April 2018 YTD April 2017 YTDPercentage
Change April 2018 YTD April 2017 YTD April 2018 YTD April 2017 YTD April 2018 YTD April 2017 YTD April 2018 YTD April 2017 YTD April 2018 YTD April 2017 YTD
Coal Utility Scale Facilities 354,926 373,334 -4.9% 263,549 276,240 88,560 94,290 119 124 2,698 2,681 0 0Petroleum Liquids Utility Scale Facilities 7,696 3,924 96.1% 4,217 2,941 3,235 801 63 37 181 145 0 0Petroleum Coke Utility Scale Facilities 2,808 2,716 3.4% 2,313 2,078 268 395 4 3 223 240 0 0Natural Gas Utility Scale Facilities 409,806 353,373 16.0% 197,154 171,236 180,817 150,372 2,429 2,384 29,406 29,381 0 0Other Gas Utility Scale Facilities 4,322 4,725 -8.5% 90 70 1,258 1,290 0 0 2,974 3,366 0 0Nuclear Utility Scale Facilities 265,559 258,518 2.7% 139,104 137,246 126,455 121,271 0 0 0 0 0 0Hydroelectric Conventional Utility Scale Facilities 104,518 111,935 -6.6% 96,518 103,445 7,434 7,911 94 94 472 486 0 0Renewable Sources Excluding Hydroelectric Utility Scale Facilities 149,652 135,066 10.8% 17,905 16,598 121,014 107,839 1,027 1,012 9,704 9,617 0 0... Wind Utility Scale Facilities 104,801 94,862 10.5% 14,318 13,784 90,390 81,000 59 54 34 24 0 0... Solar Thermal and Photovoltaic Utility Scale Facilities 18,510 13,855 33.6% 1,605 903 16,710 12,797 172 147 23 8 0 0... Wood and Wood-Derived Fuels Utility Scale Facilities 14,100 14,029 0.5% 1,179 1,089 3,584 3,681 22 23 9,315 9,236 0 0... Other Biomass Utility Scale Facilities 6,968 6,941 0.4% 473 474 5,389 5,331 774 788 332 348 0 0... Geothermal Utility Scale Facilities 5,272 5,378 -2.0% 330 347 4,942 5,031 0 0 0 0 0 0Hydroelectric Pumped Storage Utility Scale Facilities -1,729 -1,903 -9.1% -1,404 -1,586 -325 -317 0 0 0 0 0 0Other Energy Sources Utility Scale Facilities 4,262 4,171 2.2% 153 142 2,235 2,116 325 338 1,548 1,576 0 0All Energy Sources Utility Scale Facilities 1,301,817 1,245,858 4.5% 719,598 708,407 530,953 485,968 4,060 3,991 47,206 47,492 0 0
Estimated Small Scale Solar Photovoltaic Small Scale Facilities 8,565 6,824 25.5% 0 0 0 0 2,775 2,198 840 716 4,949 3,910Estimated Total Solar Photovoltaic All Facilities 26,184 19,847 31.9% 1,584 903 15,841 11,964 2,947 2,345 863 724 4,949 3,910Estimated Total Solar All Facilities 27,075 20,679 30.9% 1,605 903 16,710 12,797 2,947 2,345 863 724 4,949 3,910
Coal (1000 tons) Utility Scale Facilities 195,346 204,188 -4.3% 144,484 149,503 49,840 53,712 33 36 988 938 0 0Petroleum Liquids (1000 barrels) Utility Scale Facilities 13,286 6,739 97.2% 7,613 5,145 5,381 1,377 102 59 189 157 0 0Petroleum Coke (1000 tons) Utility Scale Facilities 1,066 1,043 2.2% 921 843 95 142 1 1 49 58 0 0Natural Gas (1000 Mcf) Utility Scale Facilities 2,975,183 2,571,137 15.7% 1,497,847 1,289,696 1,289,591 1,093,246 14,603 14,290 173,142 173,906 0 0
Coal (1000 tons) Utility Scale Facilities 5,106 5,310 -3.9% 832 935 464 512 184 183 3,625 3,680 0 0Petroleum Liquids (1000 barrels) Utility Scale Facilities 1,094 618 77.2% 61 27 158 79 215 113 659 399 0 0Petroleum Coke (1000 tons) Utility Scale Facilities 260 291 -10.7% 5 1 36 39 5 5 214 244 0 0Natural Gas (1000 Mcf) Utility Scale Facilities 399,785 382,468 4.5% 13,402 13,448 114,733 112,571 27,036 26,135 244,613 230,313 0 0
Coal (1000 tons) Utility Scale Facilities 200,452 209,499 -4.3% 145,316 150,439 50,304 54,224 218 219 4,613 4,618 0 0Petroleum Liquids (1000 barrels) Utility Scale Facilities 14,380 7,356 95.5% 7,675 5,172 5,540 1,456 318 172 849 556 0 0Petroleum Coke (1000 tons) Utility Scale Facilities 1,325 1,334 -0.6% 926 844 130 181 6 6 263 302 0 0Natural Gas (1000 Mcf) Utility Scale Facilities 3,374,968 2,953,605 14.3% 1,511,249 1,303,144 1,404,324 1,205,817 41,639 40,425 417,755 404,219 0 0
Sector April 2018 YTD April 2017 YTDPercentage
Change April 2018 YTD April 2017 YTDPercentage
Change April 2018 YTD April 2017 YTDPercentage
ChangeResidential 463,512 425,003 9.1% 58,563 53,609 9.2% 12.63 12.61 0.2%Commercial 426,229 417,987 2.0% 44,727 43,437 3.0% 10.49 10.39 1.0%Industrial 300,070 301,277 -0.4% 20,205 19,997 1.0% 6.73 6.64 1.4%Transportation 2,619 2,536 3.3% 249 239 4.1% 9.51 9.44 0.7%All Sectors 1,192,430 1,146,803 4.0% 123,744 117,283 5.5% 10.38 10.23 1.5%
Table ES1.B. Total Electric Power Industry Summary Statistics, Year-to-Date 2018 and 2017
Net Generation and Consumption of Fuels for January through AprilTotal (All Sectors) Electric Power Sector Commercial Industrial Residential
Electric UtilitiesIndependent Power
Producers
YTD = Year to DateNM = Not meaningful due to large relative standard error.W = Withheld to avoid disclosure of individual company data.Displayed values of zero may represent small values that round to zero. The Excel version of this table provides additional precision which may be accessed by selecting individual cells.Coal generation and consumption includes anthracite, bituminous, subbituminous, lignite, waste coal, refined coal, synthetic coal, and coal-derived synthesis gas.Petroleum Liquids includes distillate fuel oil, residual fuel oil, jet fuel, kerosene, propane, and waste oil.Petroleum Coke includes petroleum coke and synthesis gas derived from petroleum coke. Natural gas includes a small amount of supplemental gaseous fuels that cannot be identified separately.Other Gases includes blast furnace gas and other manufactured and waste gases derived from fossil fuels.Wood and Wood-Derived Fuels include wood, black liquor, and other wood waste.Other Biomass includes biogenic municipal solid waste, landfill gas, sludge waste, agricultural byproducts, and other biomass.Coal stocks include anthracite, bituminous, subbituminous, lignite, refined coal, and synthetic coal; waste coal is excluded.Sales of electricity to ultimate customers and net generation may not correspond exactly for a particular month for a variety of reasons (e.g., sales data may include imported electricity).Net generation is presented for the calendar month while sales of electricity to ultimate customers and associated revenue accumulate from bills collected for periods of time that vary depending
Net Generation (Thousand Megawatthours)
Consumption of Fossil Fuels for Electricity Generation
Consumption of Fossil Fuels for Useful Thermal Output
Consumption of Fossil Fuels for Electricity Generation and Useful Thermal Output
Sales, Revenue, and Average Price of Electricity to Ultimate Customers for January through AprilTotal U.S. Electric Power Industry
Sales of Electricity to Ultimate Customers(million kWh)
Revenue from Sales of Electricity to Ultimate Customers (million dollars)
Average Price of Electricity to Ultimate Customers (cents/kWh)
6/19/2018 5:24:37 PM
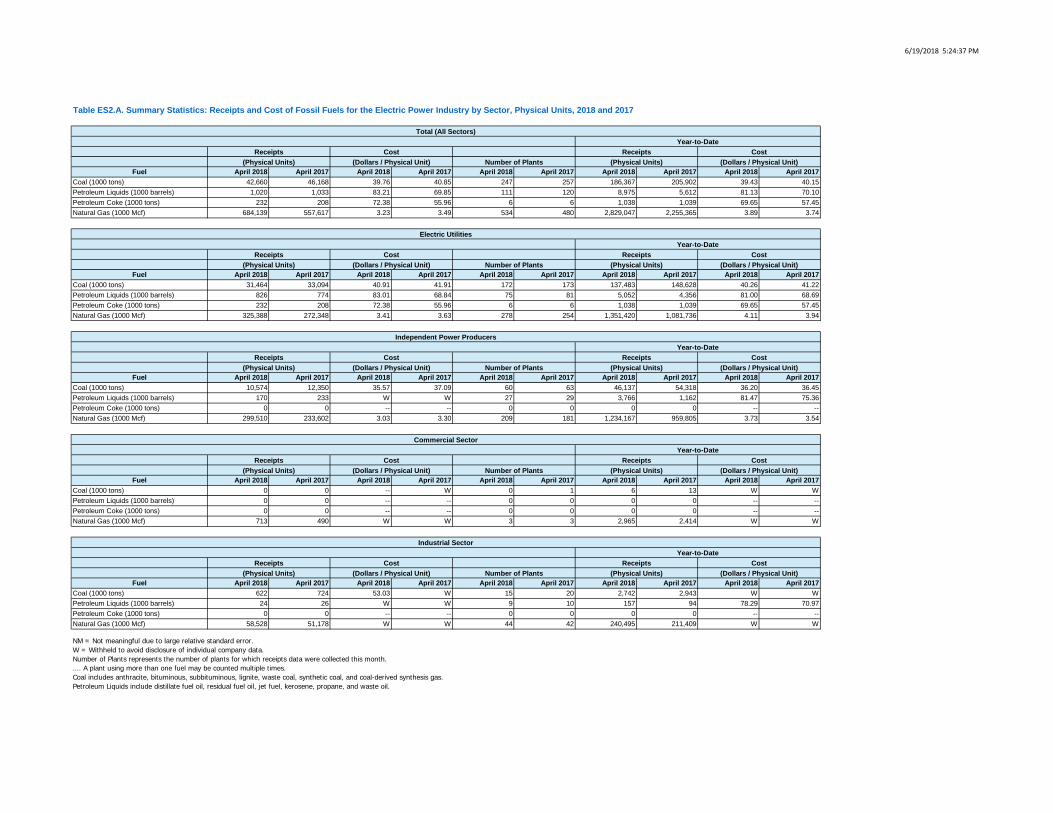
Fuel April 2018 April 2017 April 2018 April 2017 April 2018 April 2017 April 2018 April 2017 April 2018 April 2017Coal (1000 tons) 42,660 46,168 39.76 40.85 247 257 186,367 205,902 39.43 40.15Petroleum Liquids (1000 barrels) 1,020 1,033 83.21 69.85 111 120 8,975 5,612 81.13 70.10Petroleum Coke (1000 tons) 232 208 72.38 55.96 6 6 1,038 1,039 69.65 57.45Natural Gas (1000 Mcf) 684,139 557,617 3.23 3.49 534 480 2,829,047 2,255,365 3.89 3.74
Fuel April 2018 April 2017 April 2018 April 2017 April 2018 April 2017 April 2018 April 2017 April 2018 April 2017Coal (1000 tons) 31,464 33,094 40.91 41.91 172 173 137,483 148,628 40.26 41.22Petroleum Liquids (1000 barrels) 826 774 83.01 68.84 75 81 5,052 4,356 81.00 68.69Petroleum Coke (1000 tons) 232 208 72.38 55.96 6 6 1,038 1,039 69.65 57.45Natural Gas (1000 Mcf) 325,388 272,348 3.41 3.63 278 254 1,351,420 1,081,736 4.11 3.94
Fuel April 2018 April 2017 April 2018 April 2017 April 2018 April 2017 April 2018 April 2017 April 2018 April 2017Coal (1000 tons) 10,574 12,350 35.57 37.09 60 63 46,137 54,318 36.20 36.45Petroleum Liquids (1000 barrels) 170 233 W W 27 29 3,766 1,162 81.47 75.36Petroleum Coke (1000 tons) 0 0 -- -- 0 0 0 0 -- --Natural Gas (1000 Mcf) 299,510 233,602 3.03 3.30 209 181 1,234,167 959,805 3.73 3.54
Fuel April 2018 April 2017 April 2018 April 2017 April 2018 April 2017 April 2018 April 2017 April 2018 April 2017Coal (1000 tons) 0 0 -- W 0 1 6 13 W WPetroleum Liquids (1000 barrels) 0 0 -- -- 0 0 0 0 -- --Petroleum Coke (1000 tons) 0 0 -- -- 0 0 0 0 -- --Natural Gas (1000 Mcf) 713 490 W W 3 3 2,965 2,414 W W
Fuel April 2018 April 2017 April 2018 April 2017 April 2018 April 2017 April 2018 April 2017 April 2018 April 2017Coal (1000 tons) 622 724 53.03 W 15 20 2,742 2,943 W WPetroleum Liquids (1000 barrels) 24 26 W W 9 10 157 94 78.29 70.97Petroleum Coke (1000 tons) 0 0 -- -- 0 0 0 0 -- --Natural Gas (1000 Mcf) 58,528 51,178 W W 44 42 240,495 211,409 W W
Table ES2.A. Summary Statistics: Receipts and Cost of Fossil Fuels for the Electric Power Industry by Sector, Physical Units, 2018 and 2017
Total (All Sectors)Year-to-Date
Receipts Cost Receipts Cost(Physical Units) (Dollars / Physical Unit) Number of Plants (Physical Units) (Dollars / Physical Unit)
Electric UtilitiesYear-to-Date
Receipts Cost Receipts Cost(Physical Units) (Dollars / Physical Unit) Number of Plants (Physical Units) (Dollars / Physical Unit)
Independent Power ProducersYear-to-Date
Receipts Cost Receipts Cost(Physical Units) (Dollars / Physical Unit) Number of Plants (Physical Units) (Dollars / Physical Unit)
Commercial SectorYear-to-Date
Receipts Cost Receipts Cost(Physical Units) (Dollars / Physical Unit) Number of Plants (Physical Units) (Dollars / Physical Unit)
NM = Not meaningful due to large relative standard error.W = Withheld to avoid disclosure of individual company data.Number of Plants represents the number of plants for which receipts data were collected this month..... A plant using more than one fuel may be counted multiple times.Coal includes anthracite, bituminous, subbituminous, lignite, waste coal, synthetic coal, and coal-derived synthesis gas.Petroleum Liquids include distillate fuel oil, residual fuel oil, jet fuel, kerosene, propane, and waste oil.
Industrial SectorYear-to-Date
Receipts Cost Receipts Cost(Physical Units) (Dollars / Physical Unit) Number of Plants (Physical Units) (Dollars / Physical Unit)
6/19/2018 5:24:39 PM
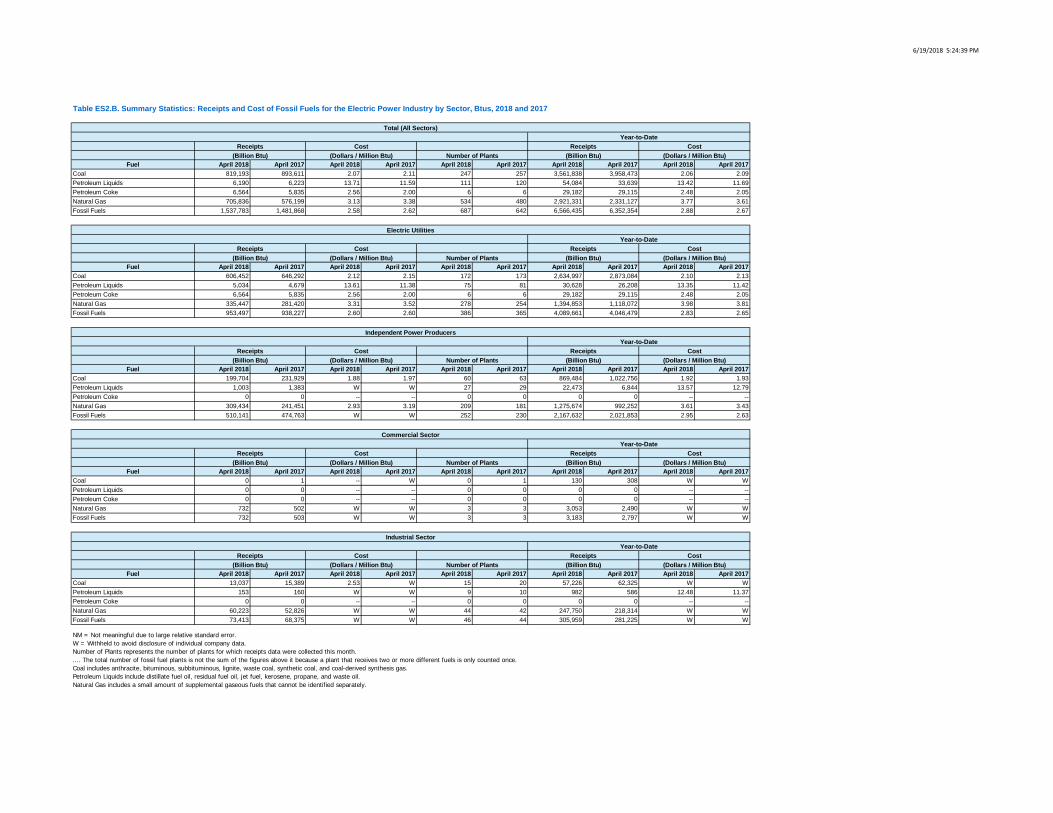
Fuel April 2018 April 2017 April 2018 April 2017 April 2018 April 2017 April 2018 April 2017 April 2018 April 2017Coal 819,193 893,611 2.07 2.11 247 257 3,561,838 3,958,473 2.06 2.09Petroleum Liquids 6,190 6,223 13.71 11.59 111 120 54,084 33,639 13.42 11.69Petroleum Coke 6,564 5,835 2.56 2.00 6 6 29,182 29,115 2.48 2.05Natural Gas 705,836 576,199 3.13 3.38 534 480 2,921,331 2,331,127 3.77 3.61Fossil Fuels 1,537,783 1,481,868 2.58 2.62 687 642 6,566,435 6,352,354 2.88 2.67
Fuel April 2018 April 2017 April 2018 April 2017 April 2018 April 2017 April 2018 April 2017 April 2018 April 2017Coal 606,452 646,292 2.12 2.15 172 173 2,634,997 2,873,084 2.10 2.13Petroleum Liquids 5,034 4,679 13.61 11.38 75 81 30,628 26,208 13.35 11.42Petroleum Coke 6,564 5,835 2.56 2.00 6 6 29,182 29,115 2.48 2.05Natural Gas 335,447 281,420 3.31 3.52 278 254 1,394,853 1,118,072 3.98 3.81Fossil Fuels 953,497 938,227 2.60 2.60 386 365 4,089,661 4,046,479 2.83 2.65
Fuel April 2018 April 2017 April 2018 April 2017 April 2018 April 2017 April 2018 April 2017 April 2018 April 2017Coal 199,704 231,929 1.88 1.97 60 63 869,484 1,022,756 1.92 1.93Petroleum Liquids 1,003 1,383 W W 27 29 22,473 6,844 13.57 12.79Petroleum Coke 0 0 -- -- 0 0 0 0 -- --Natural Gas 309,434 241,451 2.93 3.19 209 181 1,275,674 992,252 3.61 3.43Fossil Fuels 510,141 474,763 W W 252 230 2,167,632 2,021,853 2.95 2.63
Fuel April 2018 April 2017 April 2018 April 2017 April 2018 April 2017 April 2018 April 2017 April 2018 April 2017Coal 0 1 -- W 0 1 130 308 W WPetroleum Liquids 0 0 -- -- 0 0 0 0 -- --Petroleum Coke 0 0 -- -- 0 0 0 0 -- --Natural Gas 732 502 W W 3 3 3,053 2,490 W WFossil Fuels 732 503 W W 3 3 3,183 2,797 W W
Fuel April 2018 April 2017 April 2018 April 2017 April 2018 April 2017 April 2018 April 2017 April 2018 April 2017Coal 13,037 15,389 2.53 W 15 20 57,226 62,325 W WPetroleum Liquids 153 160 W W 9 10 982 586 12.48 11.37Petroleum Coke 0 0 -- -- 0 0 0 0 -- --Natural Gas 60,223 52,826 W W 44 42 247,750 218,314 W WFossil Fuels 73,413 68,375 W W 46 44 305,959 281,225 W W
Table ES2.B. Summary Statistics: Receipts and Cost of Fossil Fuels for the Electric Power Industry by Sector, Btus, 2018 and 2017
Total (All Sectors)Year-to-Date
Receipts Cost Receipts Cost(Billion Btu) (Dollars / Million Btu) Number of Plants (Billion Btu) (Dollars / Million Btu)
Electric UtilitiesYear-to-Date
Receipts Cost Receipts Cost(Billion Btu) (Dollars / Million Btu) Number of Plants (Billion Btu) (Dollars / Million Btu)
Independent Power ProducersYear-to-Date
Receipts Cost Receipts Cost(Billion Btu) (Dollars / Million Btu) Number of Plants (Billion Btu) (Dollars / Million Btu)
Commercial SectorYear-to-Date
Receipts Cost Receipts Cost(Billion Btu) (Dollars / Million Btu) Number of Plants (Billion Btu) (Dollars / Million Btu)
NM = Not meaningful due to large relative standard error.W = Withheld to avoid disclosure of individual company data.Number of Plants represents the number of plants for which receipts data were collected this month..... The total number of fossil fuel plants is not the sum of the figures above it because a plant that receives two or more different fuels is only counted once.Coal includes anthracite, bituminous, subbituminous, lignite, waste coal, synthetic coal, and coal-derived synthesis gas.Petroleum Liquids include distillate fuel oil, residual fuel oil, jet fuel, kerosene, propane, and waste oil.Natural Gas includes a small amount of supplemental gaseous fuels that cannot be identified separately.
Industrial SectorYear-to-Date
Receipts Cost Receipts Cost(Billion Btu) (Dollars / Million Btu) Number of Plants (Billion Btu) (Dollars / Million Btu)
6/19/2018 5:24:40 PM
Small Scale Generation
Period CoalPetroleum
LiquidsPetroleum
CokeNatural
GasOther
Gas NuclearHydroelectricConventional Solar
RenewableSources
ExcludingHydroelectric and
Solar
HydroelectricPumpedStorage Other
Total Generation at Utility Scale
FacilitiesEstimated Solar
PhotovoltaicEstimated Total
Solar PhotovoltaicEstimated Total
Solar
2008 1,985,801 31,917 14,325 882,981 11,707 806,208 254,831 864 125,237 -6,288 11,804 4,119,388 N/A N/A N/A2009 1,755,904 25,972 12,964 920,979 10,632 798,855 273,445 891 143,388 -4,627 11,928 3,950,331 N/A N/A N/A2010 1,847,290 23,337 13,724 987,697 11,313 806,968 260,203 1,212 165,961 -5,501 12,855 4,125,060 N/A N/A N/A2011 1,733,430 16,086 14,096 1,013,689 11,566 790,204 319,355 1,818 192,163 -6,421 14,154 4,100,141 N/A N/A N/A2012 1,514,043 13,403 9,787 1,225,894 11,898 769,331 276,240 4,327 214,006 -4,950 13,787 4,047,765 N/A N/A N/A2013 1,581,115 13,820 13,344 1,124,836 12,853 789,016 268,565 9,036 244,472 -4,681 13,588 4,065,964 N/A N/A N/A2014 1,581,710 18,276 11,955 1,126,609 12,022 797,166 259,367 17,691 261,522 -6,174 13,461 4,093,606 11,233 26,482 28,9242015 1,352,398 17,372 10,877 1,333,482 13,117 797,178 249,080 24,893 270,268 -5,091 14,028 4,077,601 14,139 35,805 39,0322016 1,239,149 13,008 11,197 1,378,307 12,807 805,694 267,812 36,054 305,579 -6,686 13,754 4,076,675 18,812 51,483 54,8662017 1,207,901 12,583 8,508 1,272,864 14,159 804,950 300,045 52,958 334,287 -6,495 13,045 4,014,804 24,139 73,828 77,097
January 113,459 1,396 966 110,044 1,195 72,525 25,615 1,486 25,193 -312 1,153 352,719 980 2,380 2,465February 92,705 1,299 910 98,552 1,062 65,638 24,139 2,242 26,496 -399 1,041 313,685 1,145 3,145 3,386
March 72,173 874 927 103,890 1,197 66,149 27,390 2,617 28,467 -384 1,090 304,390 1,525 3,885 4,143April 72,113 833 1,006 98,876 1,132 62,732 25,878 2,880 26,787 -452 1,109 292,894 1,703 4,309 4,583May 81,695 984 974 110,430 1,053 66,576 25,486 3,425 25,286 -321 1,195 316,784 1,879 4,916 5,304
June 116,034 972 1,005 131,395 1,043 67,175 23,237 3,473 22,763 -497 1,180 367,781 1,928 4,990 5,401July 136,316 1,273 1,049 151,554 1,077 70,349 21,455 3,945 24,428 -784 1,225 411,887 2,000 5,474 5,945
August 135,635 1,258 1,078 154,760 1,064 71,526 19,570 3,969 20,496 -902 1,248 409,701 1,942 5,543 5,911Sept 114,138 946 980 125,603 1,020 65,448 16,368 3,635 22,894 -715 1,168 351,484 1,735 5,007 5,370
October 99,194 937 635 102,898 913 60,733 17,339 3,191 26,558 -561 1,108 312,945 1,552 4,495 4,743November 86,940 1,070 799 93,942 1,013 65,179 18,808 2,767 26,052 -607 1,098 297,062 1,257 3,840 4,024December 118,747 1,166 869 96,364 1,037 71,662 22,528 2,424 30,159 -753 1,139 345,343 1,167 3,500 3,591
January 115,501 1,156 917 91,447 1,120 73,121 27,853 2,152 27,600 -435 1,085 341,518 1,244 3,306 3,396February 86,873 905 687 81,040 1,191 63,560 24,542 2,497 28,521 -508 990 290,297 1,383 3,744 3,880
March 89,427 979 707 94,708 1,257 65,093 30,221 4,433 32,934 -521 1,052 320,291 1,987 6,123 6,419April 81,533 884 404 86,178 1,157 56,743 29,320 4,774 32,154 -439 1,044 293,752 2,211 6,674 6,985May 92,881 1,002 772 96,777 1,182 61,313 32,177 5,766 29,118 -423 1,081 321,645 2,440 7,805 8,207
June 107,728 1,006 873 116,061 1,211 67,011 30,424 6,252 26,296 -568 1,096 357,390 2,503 8,290 8,755July 127,959 940 807 144,720 1,261 71,314 25,745 5,505 22,814 -759 1,205 401,510 2,578 7,771 8,083
August 119,780 997 727 139,610 1,321 72,384 21,241 5,401 20,101 -638 1,217 382,140 2,501 7,562 7,903Sept 98,404 987 678 116,728 1,120 68,098 18,965 5,168 23,647 -606 1,030 334,219 2,240 7,059 7,408
October 90,087 999 535 106,867 1,014 65,995 17,211 4,830 31,344 -463 1,025 319,443 2,002 6,518 6,832November 91,151 922 693 92,585 1,198 66,618 19,840 3,120 29,935 -478 1,075 306,660 1,574 4,563 4,694December 106,578 1,805 708 106,144 1,127 73,700 22,507 3,059 29,822 -656 1,145 345,939 1,476 4,413 4,536
January 118,696 5,220 915 109,601 1,060 74,649 25,422 3,262 33,821 -547 1,115 373,213 1,655 4,789 4,917February 82,051 792 718 96,317 1,092 64,790 25,593 4,037 30,385 -315 999 306,458 1,774 5,621 5,812
March 80,691 820 593 103,884 1,193 67,033 25,887 5,099 34,096 -490 1,111 319,917 2,414 7,256 7,513April 73,489 864 582 100,004 976 59,087 27,615 6,111 32,841 -377 1,038 302,229 2,721 8,518 8,833
2016 350,450 4,402 3,809 411,362 4,586 267,044 103,021 9,224 106,943 -1,546 4,393 1,263,688 5,352 13,719 14,5772017 373,334 3,924 2,716 353,373 4,725 258,518 111,935 13,855 121,210 -1,903 4,171 1,245,858 6,824 19,847 20,6792018 354,926 7,696 2,808 409,806 4,322 265,559 104,518 18,510 131,142 -1,729 4,262 1,301,817 8,565 26,184 27,075
2017 1,262,033 12,530 10,104 1,320,318 12,947 797,168 276,726 40,685 319,846 -7,043 13,532 4,058,846 20,284 57,611 60,9692018 1,189,493 16,355 8,600 1,329,297 13,755 811,991 292,627 57,612 344,218 -6,321 13,135 4,070,764 25,880 80,165 83,492
Year 2016
Table 1.1. Net Generation by Energy Source: Total (All Sectors), 2008-April 2018(Thousand Megawatthours)
Generation at Utility Scale FacilitiesNet Generation From Utility and Small
Scale Facilities
Annual Totals
Year 2017
Year 2018
Year to Date
Rolling 12 Months Ending in April
Coal includes anthracite, bituminous, subbituminous, lignite, and waste coal; synthetic coal and refined coal; and beginning in 2011, coal-derived synthesis gas. Prior to 2011 coal-derived synthesis gas was included in Other Gases.Petroleum Liquids includes distillate and residual fuel oils, jet fuel, kerosene, waste oil, and beginning in 2011, propane. Prior to 2011 propane was included in Other Gases.Petroleum Coke includes petroleum coke-derived synthesis gas. Prior to 2011, petroleum coke-derived synthesis gas was included in Other Gases.Other Gas includes blast furnace gas and other manufactured and waste gases derived from fossil fuels. Prior to 2011, Other Gas included propane and synthesis gases.See the Technical Notes for fuel conversion factors.Renewable Sources include wood, black liquor, other wood waste, biogenic municipal solid waste, landfill gas, sludge waste, agriculture byproducts, other biomass, geothermal, solar thermal, photovoltaic energy, and wind.Other includes non-biogenic municipal solid waste, batteries, hydrogen, purchased steam, sulfur, tire-derived fuel, and other miscellaneous energy sources.Notes: Beginning with 2001 data, non-biogenic municipal solid waste and tire-derived fuels are reclassified as non-renewable energy sources and included in Other. Biogenic municipal solid waste is included in Other Renewable Sources.See Glossary for definitions. Values for 2016 and prior years are final. Values for 2017 and 2018 are preliminary. See Technical Notes for a discussion of the sample design for the Form EIA-923 and predecessor forms.Totals may not equal sum of components because of independent rounding. NM=Not meaningful due to large standard error. W=Withheld to avoid disclosure of individual company data.Displayed values of zero may represent small values that round to zero. The Excel version of this table provides additional precision which may be accessed by selecting individual cells.Sources: U.S. Energy Information Administration, Form EIA-923, Power Plant Operations Report; U.S. Energy Information Administration, Form EIA-906, Power Plant Report; U.S. Energy Information Administration, Form EIA-920 Combined Heat and Power Plant Report; and predecessor forms.Beginning with 2008 data, the Form EIA-923, Power Plant Operations Report, replaced the following: Form EIA-906, Power Plant Report; Form EIA-920, Combined Heat and Power Plant Report; Form EIA-423, Monthly Cost and Quality of Fuels for Electric Plants Report; and Federal Energy Regulatory Commission, FERC Form 423, Monthly Report of Cost and Quality of Fuels for Electric Plants.Estimated small scale solar photovoltaic generation and small scale solar photovoltaic capacity are based on data from Form EIA-861M, Form EIA-861 and from estimation methods described in the technical notes.
6/19/2018 5:24:42 PM
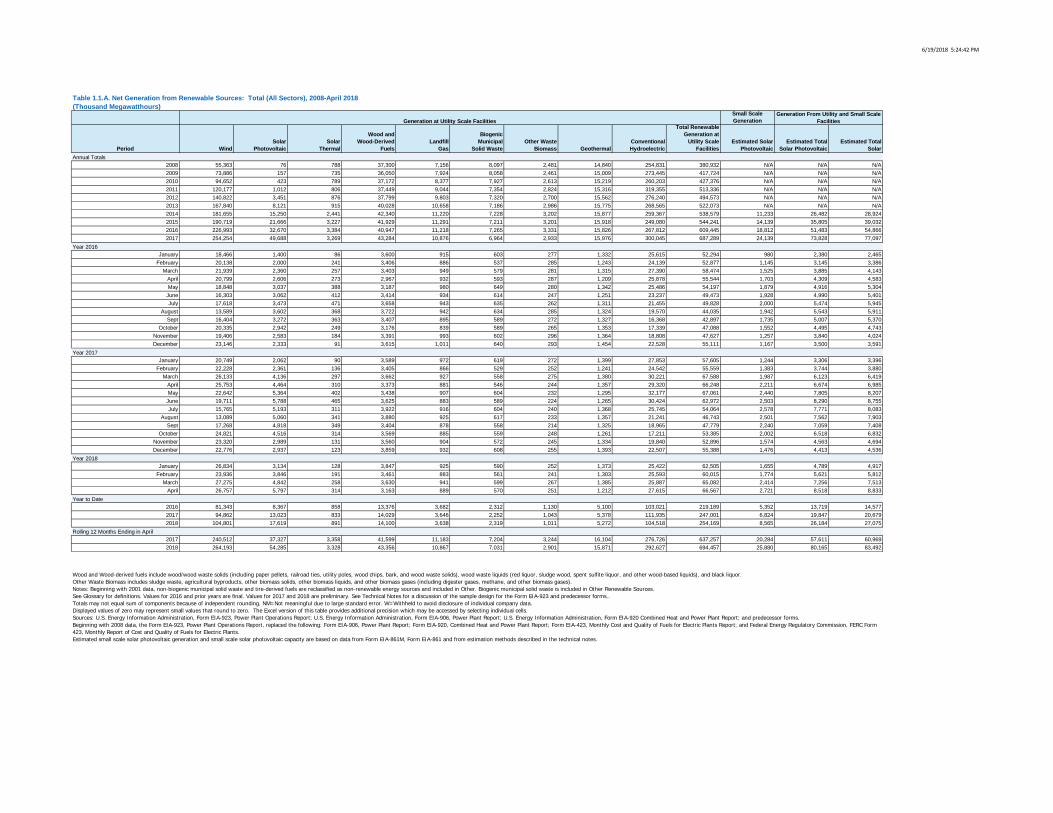
Small Scale Generation
Period WindSolar
PhotovoltaicSolar
Thermal
Wood andWood-Derived
FuelsLandfill
Gas
BiogenicMunicipal
Solid WasteOther Waste
Biomass GeothermalConventionalHydroelectric
Total Renewable Generation at
Utility Scale Facilities
Estimated Solar Photovoltaic
Estimated Total Solar Photovoltaic
Estimated Total Solar
2008 55,363 76 788 37,300 7,156 8,097 2,481 14,840 254,831 380,932 N/A N/A N/A2009 73,886 157 735 36,050 7,924 8,058 2,461 15,009 273,445 417,724 N/A N/A N/A2010 94,652 423 789 37,172 8,377 7,927 2,613 15,219 260,203 427,376 N/A N/A N/A2011 120,177 1,012 806 37,449 9,044 7,354 2,824 15,316 319,355 513,336 N/A N/A N/A2012 140,822 3,451 876 37,799 9,803 7,320 2,700 15,562 276,240 494,573 N/A N/A N/A2013 167,840 8,121 915 40,028 10,658 7,186 2,986 15,775 268,565 522,073 N/A N/A N/A2014 181,655 15,250 2,441 42,340 11,220 7,228 3,202 15,877 259,367 538,579 11,233 26,482 28,9242015 190,719 21,666 3,227 41,929 11,291 7,211 3,201 15,918 249,080 544,241 14,139 35,805 39,0322016 226,993 32,670 3,384 40,947 11,218 7,265 3,331 15,826 267,812 609,445 18,812 51,483 54,8662017 254,254 49,688 3,269 43,284 10,876 6,964 2,933 15,976 300,045 687,289 24,139 73,828 77,097
January 18,466 1,400 86 3,600 915 603 277 1,332 25,615 52,294 980 2,380 2,465February 20,138 2,000 241 3,406 886 537 285 1,243 24,139 52,877 1,145 3,145 3,386
March 21,939 2,360 257 3,403 949 579 281 1,315 27,390 58,474 1,525 3,885 4,143April 20,799 2,606 273 2,967 932 593 287 1,209 25,878 55,544 1,703 4,309 4,583May 18,848 3,037 388 3,187 980 649 280 1,342 25,486 54,197 1,879 4,916 5,304
June 16,303 3,062 412 3,414 934 614 247 1,251 23,237 49,473 1,928 4,990 5,401July 17,618 3,473 471 3,658 943 635 262 1,311 21,455 49,828 2,000 5,474 5,945
August 13,589 3,602 368 3,722 942 634 285 1,324 19,570 44,035 1,942 5,543 5,911Sept 16,404 3,272 363 3,407 895 589 272 1,327 16,368 42,897 1,735 5,007 5,370
October 20,335 2,942 249 3,176 839 589 265 1,353 17,339 47,088 1,552 4,495 4,743November 19,406 2,583 184 3,391 993 602 296 1,364 18,808 47,627 1,257 3,840 4,024December 23,146 2,333 91 3,615 1,011 640 293 1,454 22,528 55,111 1,167 3,500 3,591
January 20,749 2,062 90 3,589 972 619 272 1,399 27,853 57,605 1,244 3,306 3,396February 22,228 2,361 136 3,405 866 529 252 1,241 24,542 55,559 1,383 3,744 3,880
March 26,133 4,136 297 3,662 927 558 275 1,380 30,221 67,588 1,987 6,123 6,419April 25,753 4,464 310 3,373 881 546 244 1,357 29,320 66,248 2,211 6,674 6,985May 22,642 5,364 402 3,438 907 604 232 1,295 32,177 67,061 2,440 7,805 8,207
June 19,711 5,788 465 3,625 883 589 224 1,265 30,424 62,972 2,503 8,290 8,755July 15,765 5,193 311 3,922 916 604 240 1,368 25,745 54,064 2,578 7,771 8,083
August 13,089 5,060 341 3,880 925 617 233 1,357 21,241 46,743 2,501 7,562 7,903Sept 17,268 4,818 349 3,404 878 558 214 1,325 18,965 47,779 2,240 7,059 7,408
October 24,821 4,516 314 3,569 885 559 248 1,261 17,211 53,385 2,002 6,518 6,832November 23,320 2,989 131 3,560 904 572 245 1,334 19,840 52,896 1,574 4,563 4,694December 22,776 2,937 123 3,859 932 608 255 1,393 22,507 55,388 1,476 4,413 4,536
January 26,834 3,134 128 3,847 925 590 252 1,373 25,422 62,505 1,655 4,789 4,917February 23,936 3,846 191 3,461 883 561 241 1,303 25,593 60,015 1,774 5,621 5,812
March 27,275 4,842 258 3,630 941 599 267 1,385 25,887 65,082 2,414 7,256 7,513April 26,757 5,797 314 3,163 889 570 251 1,212 27,615 66,567 2,721 8,518 8,833
2016 81,343 8,367 858 13,376 3,682 2,312 1,130 5,100 103,021 219,189 5,352 13,719 14,5772017 94,862 13,023 833 14,029 3,646 2,252 1,043 5,378 111,935 247,001 6,824 19,847 20,6792018 104,801 17,619 891 14,100 3,638 2,319 1,011 5,272 104,518 254,169 8,565 26,184 27,075
2017 240,512 37,327 3,358 41,599 11,183 7,204 3,244 16,104 276,726 637,257 20,284 57,611 60,9692018 264,193 54,285 3,328 43,356 10,867 7,031 2,901 15,871 292,627 694,457 25,880 80,165 83,492
Year 2016
Table 1.1.A. Net Generation from Renewable Sources: Total (All Sectors), 2008-April 2018(Thousand Megawatthours)
Generation at Utility Scale FacilitiesGeneration From Utility and Small Scale
Facilities
Annual Totals
Year 2017
Year 2018
Year to Date
Rolling 12 Months Ending in April
Wood and Wood-derived fuels include wood/wood waste solids (including paper pellets, railroad ties, utility poles, wood chips, bark, and wood waste solids), wood waste liquids (red liquor, sludge wood, spent sulfite liquor, and other wood-based liquids), and black liquor.Other Waste Biomass includes sludge waste, agricultural byproducts, other biomass solids, other biomass liquids, and other biomass gases (including digester gases, methane, and other biomass gases).Notes: Beginning with 2001 data, non-biogenic municipal solid waste and tire-derived fuels are reclassified as non-renewable energy sources and included in Other. Biogenic municipal solid waste is included in Other Renewable Sources.See Glossary for definitions. Values for 2016 and prior years are final. Values for 2017 and 2018 are preliminary. See Technical Notes for a discussion of the sample design for the Form EIA-923 and predecessor forms..Totals may not equal sum of components because of independent rounding. NM=Not meaningful due to large standard error. W=Withheld to avoid disclosure of individual company data.Displayed values of zero may represent small values that round to zero. The Excel version of this table provides additional precision which may be accessed by selecting individual cells.Sources: U.S. Energy Information Administration, Form EIA-923, Power Plant Operations Report; U.S. Energy Information Administration, Form EIA-906, Power Plant Report; U.S. Energy Information Administration, Form EIA-920 Combined Heat and Power Plant Report; and predecessor forms.Beginning with 2008 data, the Form EIA-923, Power Plant Operations Report, replaced the following: Form EIA-906, Power Plant Report; Form EIA-920, Combined Heat and Power Plant Report; Form EIA-423, Monthly Cost and Quality of Fuels for Electric Plants Report; and Federal Energy Regulatory Commission, FERC Form 423, Monthly Report of Cost and Quality of Fuels for Electric Plants.Estimated small scale solar photovoltaic generation and small scale solar photovoltaic capacity are based on data from Form EIA-861M, Form EIA-861 and from estimation methods described in the technical notes.
6/19/2018 5:24:43 PM
Period CoalPetroleum
LiquidsPetroleum
CokeNatural
GasOther
Gas NuclearHydroelectricConventional Solar
RenewableSources
ExcludingHydroelectric
and Solar
HydroelectricPumpedStorage Other Total
2008 1,466,395 22,206 5,918 320,190 46 424,256 229,645 17 11,291 -5,143 545 2,475,3672009 1,322,092 18,035 7,182 349,166 96 417,275 247,198 28 14,589 -3,369 483 2,372,7762010 1,378,028 17,258 8,807 392,616 52 424,843 236,104 101 17,826 -4,466 462 2,471,6322011 1,301,107 11,688 9,428 414,843 29 415,298 291,413 216 21,717 -5,492 604 2,460,8512012 1,146,480 9,892 5,664 504,958 0 394,823 252,936 639 27,378 -4,202 603 2,339,1722013 1,188,452 9,446 9,522 501,427 798 406,114 243,040 943 31,474 -3,773 615 2,388,0582014 1,173,073 10,696 9,147 501,414 112 419,871 238,185 1,218 33,278 -5,144 622 2,382,4732015 998,385 10,386 8,278 617,817 199 416,680 229,640 1,494 35,992 -4,105 558 2,315,3232016 922,399 9,069 8,881 654,780 154 424,400 247,787 1,995 40,666 -5,629 421 2,304,9232017 895,095 8,805 6,711 617,725 164 424,485 276,804 3,512 42,618 -5,448 473 2,270,945
January 84,012 965 832 52,818 3 37,974 23,579 95 3,303 -230 34 203,384February 69,852 830 734 48,009 4 34,281 22,015 135 3,624 -332 30 179,182
March 56,982 623 724 49,949 5 34,445 25,125 151 3,696 -291 42 171,452April 53,542 602 858 46,425 7 34,036 23,742 169 3,887 -367 34 162,936May 62,093 695 763 52,908 10 36,531 23,508 187 3,098 -257 33 179,569
June 86,611 710 793 63,858 16 37,000 21,716 188 3,034 -409 40 213,557July 100,856 926 833 71,913 21 37,919 20,030 197 2,837 -678 34 234,890
August 100,156 905 856 72,293 13 37,927 18,241 207 2,432 -787 33 232,277Sept 83,223 644 807 58,392 23 33,919 15,283 190 3,215 -626 35 195,105
October 72,950 658 418 47,710 7 30,016 16,149 182 3,479 -471 36 171,134November 64,830 700 596 44,171 22 33,082 17,599 154 3,635 -522 35 164,301December 87,293 811 667 46,333 22 37,268 20,799 139 4,425 -657 36 197,136
January 86,110 838 743 44,020 14 38,425 25,700 148 3,310 -346 37 198,999February 64,900 658 540 39,303 19 33,911 22,668 172 3,771 -418 31 165,556
March 66,119 779 535 45,959 17 34,693 28,009 281 4,428 -455 35 180,401April 59,111 665 260 41,953 19 30,217 27,067 303 4,186 -368 38 163,451May 69,189 730 654 47,955 6 31,728 29,772 368 3,690 -350 35 183,780
June 81,393 719 698 56,424 12 35,022 28,303 382 3,400 -474 38 205,918July 96,931 671 673 70,858 21 37,874 23,736 358 2,627 -646 43 233,146
August 90,678 722 540 68,465 NM 38,667 19,464 352 2,252 -531 46 220,659Sept 71,951 705 523 56,671 NM 35,496 17,450 338 2,848 -522 42 185,504
October 66,669 752 405 51,469 10 35,038 15,750 320 4,224 -388 41 174,289November 65,099 654 583 44,546 17 34,541 18,048 241 3,978 -394 42 167,355December 76,945 911 556 50,102 25 38,871 20,836 251 3,904 -557 43 191,887
January 88,381 2,364 770 54,200 26 39,366 23,621 257 4,401 -475 37 212,947February 61,125 624 575 46,364 18 33,941 23,653 354 3,803 -226 35 170,268
March 58,622 598 491 49,147 17 35,262 23,870 473 4,209 -408 44 172,325April 55,421 632 477 47,442 28 30,534 25,374 520 3,887 -295 37 164,058
2016 264,388 3,020 3,148 197,201 19 140,737 94,462 550 14,510 -1,221 140 716,9542017 276,240 2,941 2,078 171,236 70 137,246 103,445 903 15,695 -1,586 142 708,4072018 263,549 4,217 2,313 197,154 90 139,104 96,518 1,605 16,300 -1,404 153 719,598
2017 934,251 8,990 7,811 628,814 204 420,909 256,770 2,348 41,850 -5,994 423 2,296,3762018 882,404 10,082 6,946 643,643 NM 426,342 269,877 4,214 43,224 -5,266 484 2,282,136
Year 2018
Year to Date
Rolling 12 Months Ending in April
Coal includes anthracite, bituminous, subbituminous, lignite, and waste coal; synthetic coal and refined coal; and beginning in 2011, coal-derived synthesis gas. Prior to 2011 coal-derived synthesis gas was included in Other Gases.Petroleum Liquids includes distillate and residual fuel oils, jet fuel, kerosene, waste oil, and beginning in 2011, propane. Prior to 2011 propane was included in Other Gases.Petroleum Coke includes petroleum coke-derived synthesis gas. Prior to 2011, petroleum coke-derived synthesis gas was included in Other Gases.Other Gas includes blast furnace gas and other manufactured and waste gases derived from fossil fuels. Prior to 2011, Other Gas included propane and synthesis gases.See the Technical Notes for fuel conversion factors.Renewable Sources include wood, black liquor, other wood waste, biogenic municipal solid waste, landfill gas, sludge waste, agriculture byproducts, other biomass, geothermal, solar thermal, photovoltaic energy, and wind.Other includes non-biogenic municipal solid waste, batteries, hydrogen, purchased steam, sulfur, tire-derived fuel, and other miscellaneous energy sources.Notes: Beginning with 2001 data, non-biogenic municipal solid waste and tire-derived fuels are reclassified as non-renewable energy sources and included in Other. Biogenic municipal solid waste is included in Other Renewable Sources.See Glossary for definitions. Values for 2016 and prior years are final. Values for 2017 and 2018 are preliminary. See Technical Notes for a discussion of the sample design for the Form EIA-923 and predecessor forms.Totals may not equal sum of components because of independent rounding. NM=Not meaningful due to large standard error. W=Withheld to avoid disclosure of individual company data.Displayed values of zero may represent small values that round to zero. The Excel version of this table provides additional precision which may be accessed by selecting individual cells.Sources: U.S. Energy Information Administration, Form EIA-923, Power Plant Operations Report; U.S. Energy Information Administration, Form EIA-906, Power Plant Report; U.S. Energy Information Administration, Form EIA-920 Combined Heat and Power Plant Report; and predecessor forms.Beginning with 2008 data, the Form EIA-923, Power Plant Operations Report, replaced the following: Form EIA-906, Power Plant Report; Form EIA-920, Combined Heat and Power Plant Report; Form EIA-423, Monthly Cost and Quality of Fuels for Electric Plants Report; and Federal Energy Regulatory Commission, FERC Form 423, Monthly Report of Cost and Quality of Fuels for Electric Plants.
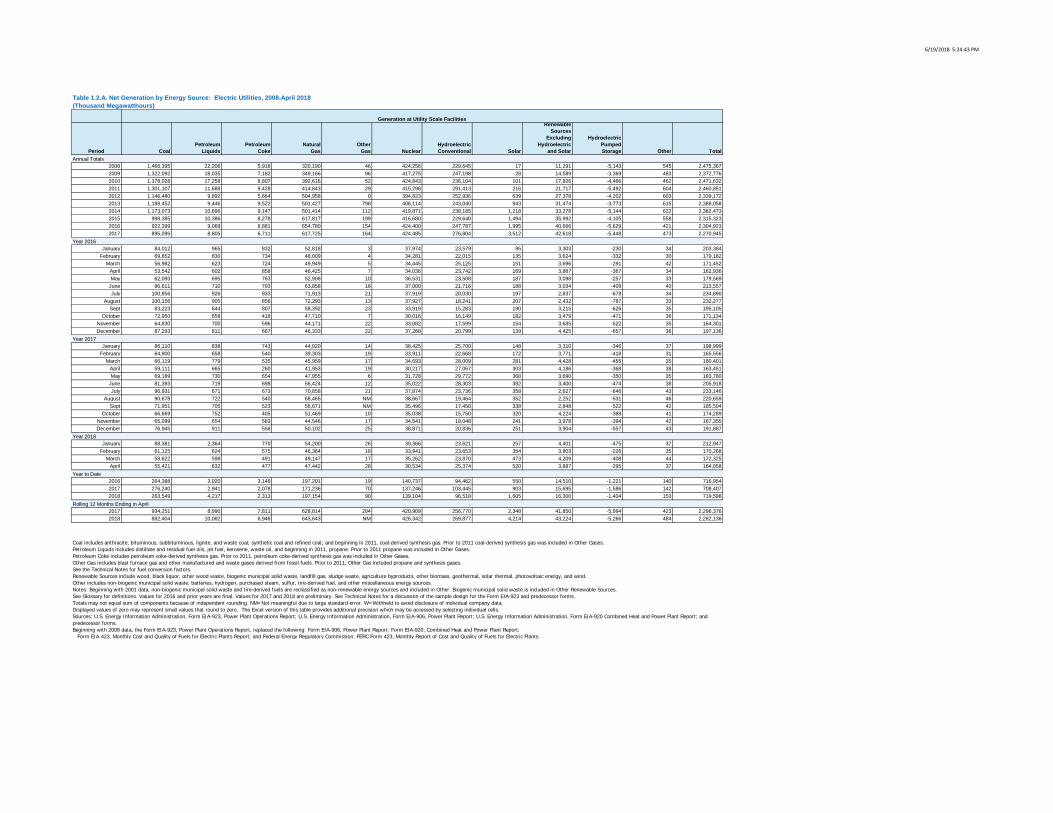
Table 1.2.A. Net Generation by Energy Source: Electric Utilities, 2008-April 2018(Thousand Megawatthours)
Generation at Utility Scale Facilities
Annual Totals
Year 2016
Year 2017

6/19/2018 5:24:44 PM
Period CoalPetroleum
LiquidsPetroleum
CokeNatural
GasOther
Gas NuclearHydroelectricConventional Solar
RenewableSources
ExcludingHydroelectric
and Solar
HydroelectricPumpedStorage Other Total
2008 502,442 8,021 6,737 482,182 3,154 381,952 23,451 847 84,928 -1,145 6,414 1,498,9822009 419,031 6,306 4,288 491,839 2,962 381,579 24,308 863 100,997 -1,259 6,146 1,437,0612010 449,709 5,117 3,497 508,774 2,915 382,126 22,351 1,105 119,851 -1,035 6,345 1,500,7542011 416,783 3,655 3,431 511,447 2,911 374,906 26,117 1,511 140,442 -928 7,059 1,487,3352012 354,076 2,757 1,758 627,833 2,984 374,509 20,923 3,525 156,539 -748 7,030 1,551,1862013 379,270 3,761 1,780 527,522 3,524 382,902 22,018 7,782 181,263 -908 6,742 1,515,6572014 395,701 6,789 1,410 531,758 3,246 377,295 19,861 16,086 196,723 -1,030 6,690 1,554,5302015 342,608 6,240 1,601 619,839 3,517 380,498 17,996 22,962 202,858 -987 6,838 1,603,9712016 307,263 3,360 1,401 624,600 3,758 381,294 18,539 33,502 233,553 -1,057 6,941 1,613,1562017 304,398 3,235 1,013 558,439 4,013 380,465 21,585 48,814 259,889 -1,047 6,509 1,587,313
January 28,612 379 42 48,969 341 34,551 1,884 1,363 19,168 -82 589 135,816February 22,057 416 99 42,840 295 31,357 1,991 2,065 20,345 -66 540 121,939
March 14,363 210 138 45,900 355 31,704 2,100 2,420 22,164 -93 549 119,810April 17,877 188 97 44,832 311 28,696 1,993 2,662 20,487 -84 554 117,612May 18,842 233 124 49,574 303 30,046 1,847 3,188 19,608 -64 610 124,310
June 28,585 214 131 59,185 335 30,175 1,410 3,229 17,117 -88 595 140,888July 34,564 291 136 70,645 324 32,430 1,306 3,690 18,856 -106 610 162,745
August 34,607 309 140 73,317 319 33,599 1,217 3,701 15,341 -115 617 163,051Sept 30,124 258 113 58,805 323 31,529 996 3,394 17,145 -89 557 143,155
October 25,524 232 141 47,044 228 30,717 1,080 2,965 20,549 -90 549 128,939November 21,446 325 116 41,736 330 32,097 1,122 2,576 19,760 -85 560 119,981December 30,661 307 124 41,755 296 34,394 1,591 2,250 23,013 -96 613 134,908
January 28,593 264 116 38,893 337 34,695 2,008 1,981 21,600 -90 580 128,978February 21,279 203 92 34,219 317 29,650 1,741 2,297 22,205 -90 513 112,426
March 22,607 155 92 40,738 355 30,400 2,059 4,101 25,836 -66 517 126,794April 21,810 179 95 36,522 281 26,526 2,103 4,418 25,402 -71 506 117,771May 23,035 229 41 40,987 340 29,585 2,243 5,330 22,880 -73 544 125,140
June 25,605 246 100 51,504 331 31,988 1,972 5,792 20,276 -93 549 138,270July 30,301 227 47 65,181 356 33,440 1,867 5,077 17,361 -114 571 154,316
August 28,374 232 113 62,813 366 33,717 1,652 4,982 15,031 -107 580 147,754Sept 25,775 243 97 52,413 332 32,602 1,402 4,764 18,304 -84 508 136,355
October 22,715 203 84 47,683 306 30,957 1,346 4,451 24,554 -75 518 132,743November 25,391 222 35 40,082 348 32,077 1,657 2,845 23,363 -84 537 126,473December 28,912 832 100 47,404 343 34,828 1,534 2,776 23,076 -99 586 140,293
January 29,517 2,753 92 46,793 304 35,283 1,665 2,972 26,648 -72 582 146,536February 20,233 119 95 42,294 313 30,849 1,804 3,639 24,057 -89 550 123,864
March 21,362 174 41 46,971 337 31,770 1,870 4,574 27,192 -82 569 134,779April 17,448 190 39 44,759 306 28,553 2,095 5,525 26,408 -82 534 125,774
2016 82,910 1,192 377 182,540 1,301 126,307 7,969 8,510 82,165 -325 2,231 495,1772017 94,290 801 395 150,372 1,290 121,271 7,911 12,797 95,043 -317 2,116 485,9682018 88,560 3,235 268 180,817 1,258 126,455 7,434 16,710 104,304 -325 2,235 530,953
2017 318,643 2,968 1,419 592,432 3,747 376,259 18,481 37,789 246,432 -1,049 6,826 1,603,9472018 298,668 5,670 886 588,885 3,981 385,648 21,108 52,727 269,150 -1,055 6,629 1,632,297
Year 2018
Year to Date
Rolling 12 Months Ending in April
Coal includes anthracite, bituminous, subbituminous, lignite, and waste coal; synthetic coal and refined coal; and beginning in 2011, coal-derived synthesis gas. Prior to 2011 coal-derived synthesis gas was included in Other Gases.Petroleum Liquids includes distillate and residual fuel oils, jet fuel, kerosene, waste oil, and beginning in 2011, propane. Prior to 2011 propane was included in Other Gases.Petroleum Coke includes petroleum coke-derived synthesis gas. Prior to 2011, petroleum coke-derived synthesis gas was included in Other Gases.Other Gas includes blast furnace gas and other manufactured and waste gases derived from fossil fuels. Prior to 2011, Other Gas included propane and synthesis gases.See the Technical Notes for fuel conversion factors.Renewable Sources include wood, black liquor, other wood waste, biogenic municipal solid waste, landfill gas, sludge waste, agriculture byproducts, other biomass, geothermal, solar thermal, photovoltaic energy, and wind.Other includes non-biogenic municipal solid waste, batteries, hydrogen, purchased steam, sulfur, tire-derived fuel, and other miscellaneous energy sources.Notes: Beginning with 2001 data, non-biogenic municipal solid waste and tire-derived fuels are reclassified as non-renewable energy sources and included in Other. Biogenic municipal solid waste is included in Other Renewable Sources.See Glossary for definitions. Values for 2016 and prior years are final. Values for 2017 and 2018 are preliminary. See Technical Notes for a discussion of the sample design for the Form EIA-923 and predecessor forms.Totals may not equal sum of components because of independent rounding. NM=Not meaningful due to large standard error. W=Withheld to avoid disclosure of individual company data.Displayed values of zero may represent small values that round to zero. The Excel version of this table provides additional precision which may be accessed by selecting individual cells.Sources: U.S. Energy Information Administration, Form EIA-923, Power Plant Operations Report; U.S. Energy Information Administration, Form EIA-906, Power Plant Report; U.S. Energy Information Administration, Form EIA-920 Combined Heat and Power Plant Report; and predecessor forms.Beginning with 2008 data, the Form EIA-923, Power Plant Operations Report, replaced the following: Form EIA-906, Power Plant Report; Form EIA-920, Combined Heat and Power Plant Report; Form EIA-423, Monthly Cost and Quality of Fuels for Electric Plants Report; and Federal Energy Regulatory Commission, FERC Form 423, Monthly Report of Cost and Quality of Fuels for Electric Plants.
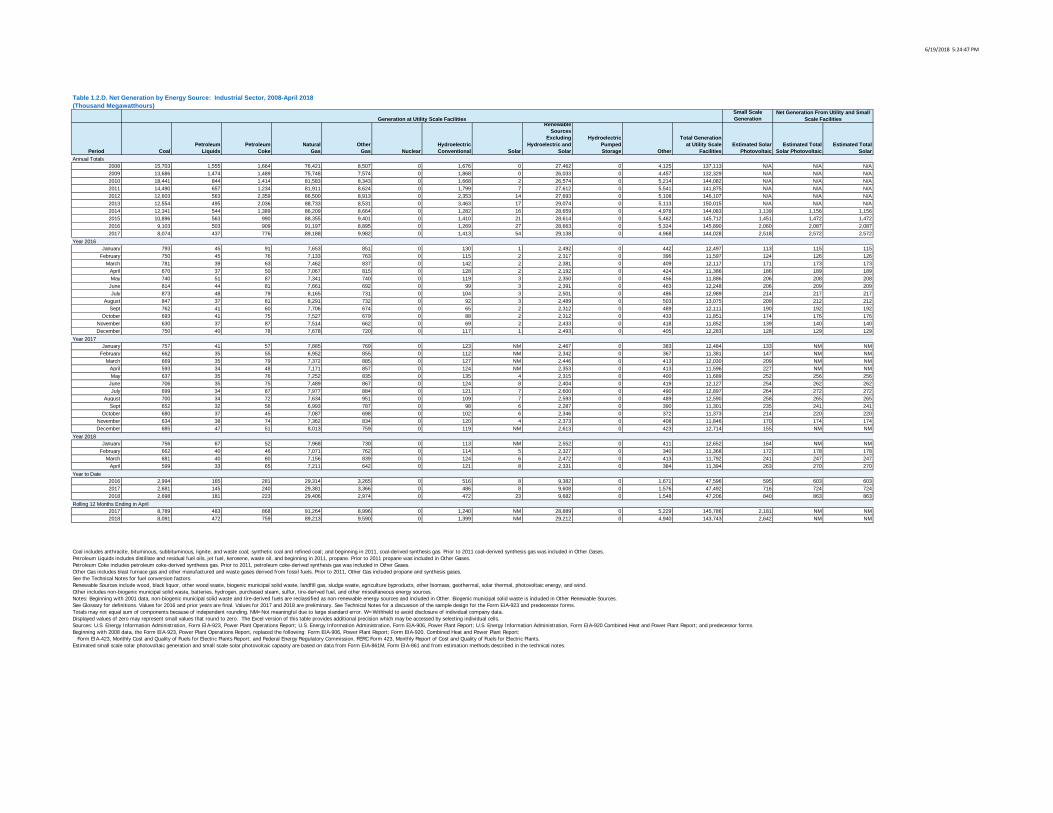
Table 1.2.B Net Generation by Energy Source: Independent Power Producers, 2008-April 2018(Thousand Megawatthours)
Generation at Utility Scale Facilities
Annual Totals
Year 2016
Year 2017

6/19/2018 5:24:46 PM
Small Scale Generation
Period CoalPetroleum
LiquidsPetroleum
CokeNatural
GasOther
Gas NuclearHydroelectricConventional Solar
RenewableSources
ExcludingHydroelectric and
Solar
HydroelectricPumpedStorage Other
Total Generation at Utility Scale
FacilitiesEstimated Solar
PhotovoltaicEstimated Total
Solar PhotovoltaicEstimated Total
Solar
2008 1,261 136 6 4,188 0 0 60 0 1,555 0 720 7,926 N/A N/A N/A2009 1,096 157 5 4,225 0 0 71 0 1,769 0 842 8,165 N/A N/A N/A2010 1,111 117 7 4,725 3 0 80 5 1,709 0 834 8,592 N/A N/A N/A2011 1,049 86 3 5,487 3 0 26 84 2,392 0 950 10,080 N/A N/A N/A2012 883 191 6 6,603 0 0 28 148 2,397 0 1,046 11,301 N/A N/A N/A2013 839 118 5 7,154 0 0 44 294 2,662 0 1,118 12,234 N/A N/A N/A2014 595 247 9 7,227 0 0 38 371 2,862 0 1,171 12,520 5,146 5,516 5,5162015 509 183 8 7,471 0 0 35 416 2,803 0 1,170 12,595 5,689 6,106 6,1062016 383 77 6 7,730 0 0 217 529 2,697 0 1,068 12,706 6,158 6,687 6,6872017 335 106 8 7,512 0 0 243 578 2,642 0 1,095 12,518 7,700 8,277 8,277
January 43 8 1 605 0 0 21 26 230 0 89 1,022 346 373 373February 45 8 1 570 0 0 18 39 210 0 75 967 398 437 437
March 46 3 1 579 0 0 22 44 225 0 90 1,011 520 564 564April 24 6 0 551 0 0 15 46 221 0 97 961 566 612 612May 20 6 0 607 0 0 12 48 230 0 96 1,019 616 663 663
June 23 5 0 692 0 0 13 53 220 0 83 1,089 623 676 676July 24 8 1 831 0 0 15 55 234 0 96 1,263 640 696 696
August 26 7 0 859 0 0 19 58 234 0 95 1,298 620 677 677Sept 29 4 0 700 0 0 23 48 223 0 87 1,114 556 605 605
October 27 5 0 617 0 0 21 42 218 0 90 1,021 493 536 536November 35 8 0 521 0 0 17 36 224 0 85 927 393 428 428December 42 8 1 598 0 0 21 33 228 0 85 1,015 387 420 420
January 41 14 1 648 0 0 23 22 224 0 85 1,057 414 436 436February 32 8 1 566 0 0 NM 26 203 0 78 934 454 480 480
March 32 10 1 638 0 0 NM 48 224 0 87 1,066 630 679 679April 19 6 0 532 0 0 NM 50 214 0 87 934 700 750 750May 19 7 0 583 0 0 NM 65 233 0 101 1,036 774 838 838
June 23 6 0 645 0 0 NM 71 215 0 90 1,075 781 852 852July 29 8 0 703 0 0 NM 63 226 0 100 1,150 818 881 881
August 27 9 1 698 0 0 NM 60 225 0 101 1,137 798 858 858Sept 27 8 1 651 0 0 14 58 208 0 90 1,058 713 772 772
October 24 7 1 627 0 0 NM 53 219 0 95 1,039 633 686 686November 27 8 1 595 0 0 NM 31 221 0 88 986 501 532 532December 36 NM 1 626 0 0 NM 29 229 0 92 1,046 485 514 514
January 42 NM 1 640 0 0 NM 29 221 0 85 1,078 540 569 569February 30 8 1 588 0 0 NM 39 198 0 73 959 594 632 632
March 25 9 1 610 0 0 NM 46 222 0 84 1,021 779 825 825April 21 9 0 591 0 0 NM 58 214 0 82 1,003 863 921 921
2016 157 25 4 2,306 0 0 76 156 886 0 351 3,961 1,830 1,986 1,9862017 124 37 3 2,384 0 0 94 147 865 0 338 3,991 2,198 2,345 2,3452018 119 63 4 2,429 0 0 94 172 855 0 325 4,060 2,775 2,947 2,947
2017 350 89 5 7,808 0 0 NM 521 2,675 0 1,054 12,737 6,525 7,046 7,0462018 330 NM 9 7,557 0 0 NM 603 2,632 0 1,082 12,588 8,277 8,880 8,880
Year 2016
Table 1.2.C. Net Generation by Energy Source: Commercial Sector, 2008-April 2018(Thousand Megawatthours)
Generation at Utility Scale FacilitiesNet Generation From Utility and Small
Scale Facilities
Annual Totals
Year 2017
Year 2018
Year to Date
Rolling 12 Months Ending in April
Coal includes anthracite, bituminous, subbituminous, lignite, and waste coal; synthetic coal and refined coal; and beginning in 2011, coal-derived synthesis gas. Prior to 2011 coal-derived synthesis gas was included in Other Gases.Petroleum Liquids includes distillate and residual fuel oils, jet fuel, kerosene, waste oil, and beginning in 2011, propane. Prior to 2011 propane was included in Other Gases.Petroleum Coke includes petroleum coke-derived synthesis gas. Prior to 2011, petroleum coke-derived synthesis gas was included in Other Gases.Other Gas includes blast furnace gas and other manufactured and waste gases derived from fossil fuels. Prior to 2011, Other Gas included propane and synthesis gases.See the Technical Notes for fuel conversion factors.Renewable Sources include wood, black liquor, other wood waste, biogenic municipal solid waste, landfill gas, sludge waste, agriculture byproducts, other biomass, geothermal, solar thermal, photovoltaic energy, and wind.Other includes non-biogenic municipal solid waste, batteries, hydrogen, purchased steam, sulfur, tire-derived fuel, and other miscellaneous energy sources.Notes: Beginning with 2001 data, non-biogenic municipal solid waste and tire-derived fuels are reclassified as non-renewable energy sources and included in Other. Biogenic municipal solid waste is included in Other Renewable Sources.See Glossary for definitions. Values for 2016 and prior years are final. Values for 2017 and 2018 are preliminary. See Technical Notes for a discussion of the sample design for the Form EIA-923 and predecessor forms.Totals may not equal sum of components because of independent rounding. NM=Not meaningful due to large standard error. W=Withheld to avoid disclosure of individual company data.Displayed values of zero may represent small values that round to zero. The Excel version of this table provides additional precision which may be accessed by selecting individual cells.Sources: U.S. Energy Information Administration, Form EIA-923, Power Plant Operations Report; U.S. Energy Information Administration, Form EIA-906, Power Plant Report; U.S. Energy Information Administration, Form EIA-920 Combined Heat and Power Plant Report; and predecessor forms.Beginning with 2008 data, the Form EIA-923, Power Plant Operations Report, replaced the following: Form EIA-906, Power Plant Report; Form EIA-920, Combined Heat and Power Plant Report; Form EIA-423, Monthly Cost and Quality of Fuels for Electric Plants Report; and Federal Energy Regulatory Commission, FERC Form 423, Monthly Report of Cost and Quality of Fuels for Electric Plants.Estimated small scale solar photovoltaic generation and small scale solar photovoltaic capacity are based on data from Form EIA-861M, Form EIA-861 and from estimation methods described in the technical notes.
6/19/2018 5:24:47 PM
Small Scale Generation
Period CoalPetroleum
LiquidsPetroleum
CokeNatural
GasOther
Gas NuclearHydroelectricConventional Solar
RenewableSources
ExcludingHydroelectric and
Solar
HydroelectricPumpedStorage Other
Total Generation at Utility Scale
FacilitiesEstimated Solar
PhotovoltaicEstimated Total
Solar PhotovoltaicEstimated Total
Solar
2008 15,703 1,555 1,664 76,421 8,507 0 1,676 0 27,462 0 4,125 137,113 N/A N/A N/A2009 13,686 1,474 1,489 75,748 7,574 0 1,868 0 26,033 0 4,457 132,329 N/A N/A N/A2010 18,441 844 1,414 81,583 8,343 0 1,668 2 26,574 0 5,214 144,082 N/A N/A N/A2011 14,490 657 1,234 81,911 8,624 0 1,799 7 27,612 0 5,541 141,875 N/A N/A N/A2012 12,603 563 2,359 86,500 8,913 0 2,353 14 27,693 0 5,108 146,107 N/A N/A N/A2013 12,554 495 2,036 88,733 8,531 0 3,463 17 29,074 0 5,113 150,015 N/A N/A N/A2014 12,341 544 1,389 86,209 8,664 0 1,282 16 28,659 0 4,978 144,083 1,139 1,156 1,1562015 10,896 563 990 88,355 9,401 0 1,410 21 28,614 0 5,462 145,712 1,451 1,472 1,4722016 9,103 503 909 91,197 8,895 0 1,269 27 28,663 0 5,324 145,890 2,060 2,087 2,0872017 8,074 437 776 89,188 9,982 0 1,413 54 29,138 0 4,968 144,028 2,518 2,572 2,572
January 793 45 91 7,653 851 0 130 1 2,492 0 442 12,497 113 115 115February 750 45 76 7,133 763 0 115 2 2,317 0 396 11,597 124 126 126
March 781 39 63 7,462 837 0 142 2 2,381 0 409 12,117 171 173 173April 670 37 50 7,067 815 0 128 2 2,192 0 424 11,386 186 189 189May 740 51 87 7,341 740 0 119 3 2,350 0 456 11,886 206 208 208
June 814 44 81 7,661 692 0 99 3 2,391 0 463 12,248 206 209 209July 873 48 79 8,165 731 0 104 3 2,501 0 486 12,989 214 217 217
August 847 37 81 8,291 732 0 92 3 2,489 0 503 13,075 209 212 212Sept 762 41 60 7,706 674 0 65 2 2,312 0 489 12,111 190 192 192
October 693 41 75 7,527 679 0 88 2 2,312 0 433 11,851 174 176 176November 630 37 87 7,514 662 0 69 2 2,433 0 418 11,852 139 140 140December 750 40 78 7,678 720 0 117 1 2,493 0 405 12,283 128 129 129
January 757 41 57 7,885 769 0 123 NM 2,467 0 383 12,484 133 NM NMFebruary 662 35 55 6,952 855 0 112 NM 2,342 0 367 11,381 147 NM NM
March 669 35 79 7,372 885 0 127 NM 2,446 0 413 12,030 209 NM NMApril 593 34 48 7,171 857 0 124 NM 2,353 0 413 11,596 227 NM NMMay 637 35 76 7,252 835 0 135 4 2,315 0 400 11,689 252 256 256
June 706 35 75 7,489 867 0 124 8 2,404 0 419 12,127 254 262 262July 699 34 87 7,977 884 0 121 7 2,600 0 490 12,897 264 272 272
August 700 34 72 7,634 951 0 109 7 2,593 0 489 12,590 258 265 265Sept 652 32 56 6,993 787 0 98 6 2,287 0 390 11,301 235 241 241
October 680 37 45 7,087 698 0 102 6 2,346 0 372 11,373 214 220 220November 634 38 74 7,362 834 0 120 4 2,373 0 408 11,846 170 174 174December 685 47 51 8,013 759 0 119 NM 2,613 0 423 12,714 155 NM NM
January 756 67 52 7,968 730 0 113 NM 2,552 0 411 12,652 164 NM NMFebruary 662 40 46 7,071 762 0 114 5 2,327 0 340 11,368 172 178 178
March 681 40 60 7,156 839 0 124 6 2,472 0 413 11,792 241 247 247April 599 33 65 7,211 642 0 121 8 2,331 0 384 11,394 263 270 270
2016 2,994 165 281 29,314 3,265 0 516 8 9,382 0 1,671 47,596 595 603 6032017 2,681 145 240 29,381 3,366 0 486 8 9,608 0 1,576 47,492 716 724 7242018 2,698 181 223 29,406 2,974 0 472 23 9,682 0 1,548 47,206 840 863 863
2017 8,789 483 868 91,264 8,996 0 1,240 NM 28,889 0 5,229 145,786 2,181 NM NM2018 8,091 472 759 89,213 9,590 0 1,399 NM 29,212 0 4,940 143,743 2,642 NM NM
Year 2016
Table 1.2.D. Net Generation by Energy Source: Industrial Sector, 2008-April 2018(Thousand Megawatthours)
Generation at Utility Scale FacilitiesNet Generation From Utility and Small
Scale Facilities
Annual Totals
Year 2017
Year 2018
Year to Date
Rolling 12 Months Ending in April
Coal includes anthracite, bituminous, subbituminous, lignite, and waste coal; synthetic coal and refined coal; and beginning in 2011, coal-derived synthesis gas. Prior to 2011 coal-derived synthesis gas was included in Other Gases.Petroleum Liquids includes distillate and residual fuel oils, jet fuel, kerosene, waste oil, and beginning in 2011, propane. Prior to 2011 propane was included in Other Gases.Petroleum Coke includes petroleum coke-derived synthesis gas. Prior to 2011, petroleum coke-derived synthesis gas was included in Other Gases.Other Gas includes blast furnace gas and other manufactured and waste gases derived from fossil fuels. Prior to 2011, Other Gas included propane and synthesis gases.See the Technical Notes for fuel conversion factors.Renewable Sources include wood, black liquor, other wood waste, biogenic municipal solid waste, landfill gas, sludge waste, agriculture byproducts, other biomass, geothermal, solar thermal, photovoltaic energy, and wind.Other includes non-biogenic municipal solid waste, batteries, hydrogen, purchased steam, sulfur, tire-derived fuel, and other miscellaneous energy sources.Notes: Beginning with 2001 data, non-biogenic municipal solid waste and tire-derived fuels are reclassified as non-renewable energy sources and included in Other. Biogenic municipal solid waste is included in Other Renewable Sources.See Glossary for definitions. Values for 2016 and prior years are final. Values for 2017 and 2018 are preliminary. See Technical Notes for a discussion of the sample design for the Form EIA-923 and predecessor forms.Totals may not equal sum of components because of independent rounding. NM=Not meaningful due to large standard error. W=Withheld to avoid disclosure of individual company data.Displayed values of zero may represent small values that round to zero. The Excel version of this table provides additional precision which may be accessed by selecting individual cells.Sources: U.S. Energy Information Administration, Form EIA-923, Power Plant Operations Report; U.S. Energy Information Administration, Form EIA-906, Power Plant Report; U.S. Energy Information Administration, Form EIA-920 Combined Heat and Power Plant Report; and predecessor forms.Beginning with 2008 data, the Form EIA-923, Power Plant Operations Report, replaced the following: Form EIA-906, Power Plant Report; Form EIA-920, Combined Heat and Power Plant Report; Form EIA-423, Monthly Cost and Quality of Fuels for Electric Plants Report; and Federal Energy Regulatory Commission, FERC Form 423, Monthly Report of Cost and Quality of Fuels for Electric Plants.Estimated small scale solar photovoltaic generation and small scale solar photovoltaic capacity are based on data from Form EIA-861M, Form EIA-861 and from estimation methods described in the technical notes.
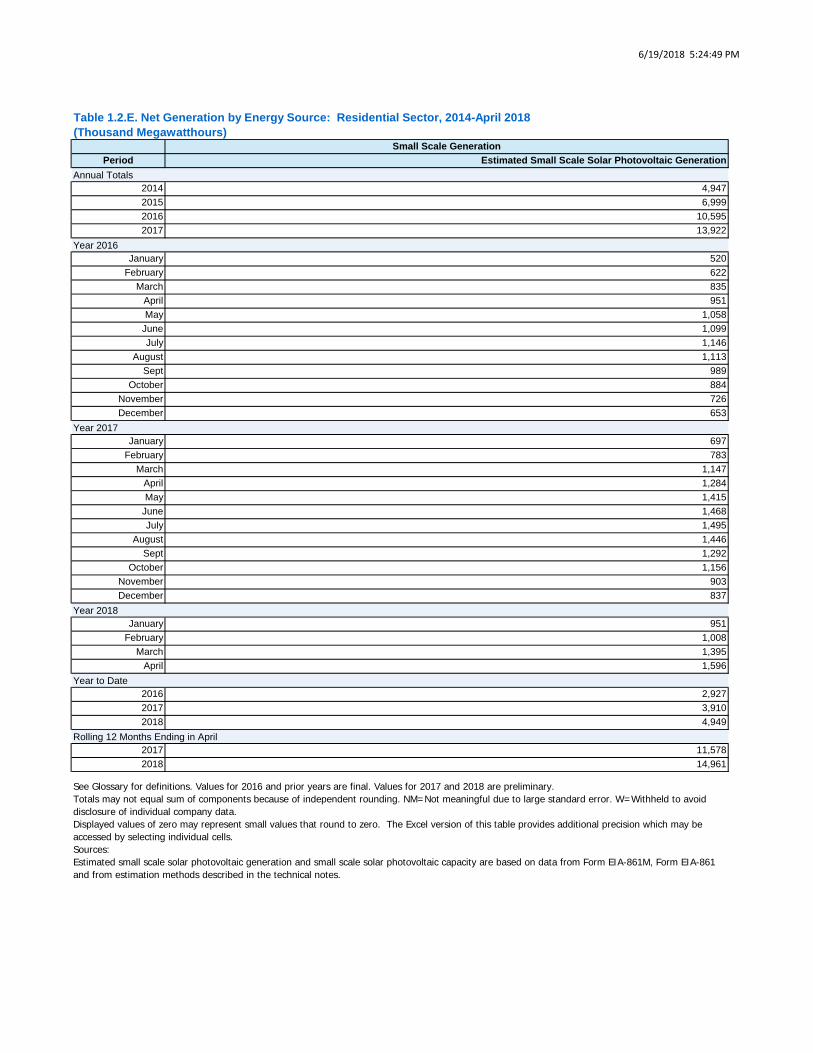
6/19/2018 5:24:49 PM
Small Scale GenerationPeriod Estimated Small Scale Solar Photovoltaic Generation
2014 4,9472015 6,9992016 10,5952017 13,922
January 520February 622
March 835April 951May 1,058
June 1,099July 1,146
August 1,113Sept 989
October 884November 726December 653
January 697February 783
March 1,147April 1,284May 1,415
June 1,468July 1,495
August 1,446Sept 1,292
October 1,156November 903December 837
January 951February 1,008
March 1,395April 1,596
2016 2,9272017 3,9102018 4,949
2017 11,5782018 14,961
Year to Date
Rolling 12 Months Ending in April
See Glossary for definitions. Values for 2016 and prior years are final. Values for 2017 and 2018 are preliminary.Totals may not equal sum of components because of independent rounding. NM=Not meaningful due to large standard error. W=Withheld to avoid disclosure of individual company data.Displayed values of zero may represent small values that round to zero. The Excel version of this table provides additional precision which may be accessed by selecting individual cells.Sources:Estimated small scale solar photovoltaic generation and small scale solar photovoltaic capacity are based on data from Form EIA-861M, Form EIA-861 and from estimation methods described in the technical notes.
Table 1.2.E. Net Generation by Energy Source: Residential Sector, 2014-April 2018(Thousand Megawatthours)
Annual Totals
Year 2016
Year 2017
Year 2018

6/19/2018 5:24:50 PM
Census Divisionand State April 2018 April 2017
PercentageChange April 2018 April 2017 April 2018 April 2017 April 2018 April 2017 April 2018 April 2017
New England 7,577 6,621 14.4% 248 146 6,997 6,158 103 86 230 231Connecticut 3,015 2,073 45.4% 8 8 2,932 2,002 34 26 41 37Maine 910 915 -0.5% 0 0 738 728 11 18 162 169Massachusetts 1,634 2,317 -29.5% 48 NM 1,515 2,230 47 36 24 22New Hampshire 1,341 777 72.6% 112 31 1,220 742 6 1 3 3Rhode Island 487 362 34.4% 0 1 482 358 5 4 0 0Vermont 190 176 7.8% 79 77 110 99 0 0 0 0Middle Atlantic 30,673 28,637 7.1% 2,726 2,600 27,405 25,537 184 169 358 330New Jersey 5,850 5,562 5.2% 20 10 5,719 5,442 58 53 53 57New York 9,610 9,147 5.1% 2,693 2,578 6,744 6,416 98 83 76 70Pennsylvania 15,213 13,929 9.2% 14 12 14,942 13,680 28 33 229 204East North Central 43,854 42,927 2.2% 17,311 17,586 25,551 24,292 142 131 849 918Illinois 13,719 14,164 -3.1% 360 301 13,104 13,603 30 24 225 237Indiana 8,411 6,797 23.7% 6,385 5,659 1,684 726 21 19 321 394Michigan 8,252 8,625 -4.3% 5,192 6,510 2,884 1,956 64 59 111 100Ohio 8,868 9,285 -4.5% 2,051 2,003 6,738 7,200 18 19 61 62Wisconsin 4,605 4,056 13.5% 3,323 3,113 1,141 808 10 10 130 125West North Central 26,881 24,708 8.8% 20,820 18,940 5,688 5,443 50 47 322 277Iowa 5,023 4,536 10.7% 3,671 3,214 1,169 1,175 18 17 165 130Kansas 3,504 3,674 -4.6% 1,804 1,948 1,695 1,723 NM NM NM NMMinnesota 4,931 3,757 31.3% 3,671 2,624 1,140 1,006 15 13 105 113Missouri 6,139 6,387 -3.9% 5,654 6,074 467 296 14 14 4 4Nebraska 2,828 2,363 19.7% 2,357 1,881 439 458 2 2 31 21North Dakota 3,596 3,084 16.6% 2,985 2,500 597 577 0 0 14 NMSouth Dakota 860 907 -5.2% 679 698 181 209 NM NM 0 0South Atlantic 57,631 59,106 -2.5% 45,810 48,644 10,204 8,794 105 99 1,512 1,569Delaware 548 519 5.6% NM NM 483 411 1 NM 63 107District of Columbia 10 4 146.9% 0 0 0 4 10 0 0 0Florida 18,468 18,792 -1.7% 17,038 17,132 987 1,205 6 6 437 448Georgia 8,679 9,501 -8.7% 6,915 8,093 1,329 991 NM NM 434 417Maryland 3,578 2,450 46.1% 401 NM 3,114 2,390 37 38 26 21North Carolina 8,951 8,921 0.3% 7,738 7,783 1,041 987 15 15 158 136South Carolina 6,826 7,466 -8.6% 6,422 7,086 250 215 0 0 153 165Virginia 6,144 6,600 -6.9% 4,154 5,259 1,773 1,105 37 38 181 197West Virginia 4,427 4,853 -8.8% 3,142 3,290 1,225 1,486 0 0 60 77East South Central 25,910 25,072 3.3% 21,679 21,314 3,519 3,007 17 13 695 739Alabama 10,893 11,056 -1.5% 7,726 8,165 2,838 2,533 0 0 329 358Kentucky 5,017 4,856 3.3% 4,881 4,802 93 9 0 0 42 45Mississippi 4,608 4,208 9.5% 3,888 3,607 558 440 1 0 161 161Tennessee 5,393 4,952 8.9% 5,184 4,741 30 25 16 13 163 174West South Central 52,629 50,191 4.9% 16,179 14,091 30,495 29,996 59 54 5,896 6,050Arkansas 4,933 4,155 18.7% 3,657 2,927 1,131 1,088 0 1 145 140Louisiana 7,235 6,852 5.6% 4,507 3,355 362 987 12 NM 2,354 2,505Oklahoma 6,820 5,710 19.4% 2,661 2,477 4,081 3,166 0 0 77 68Texas 33,641 33,473 0.5% 5,353 5,332 24,921 24,755 47 49 3,320 3,337Mountain 25,453 24,704 3.0% 18,845 18,496 6,303 5,920 47 48 259 240Arizona 7,282 7,007 3.9% 6,319 6,049 950 945 13 13 0 0Colorado 4,111 4,024 2.1% 2,877 2,846 1,225 1,171 NM NM 6 5Idaho 1,377 1,477 -6.7% 869 951 454 475 3 4 50 47Montana 2,125 2,143 -0.9% 1,041 1,101 1,082 1,040 0 0 2 2Nevada 2,763 2,518 9.7% 1,818 1,568 913 921 11 11 21 18New Mexico 2,499 2,492 0.3% 1,384 1,738 1,107 745 9 9 0 0Utah 2,172 2,081 4.4% 1,809 1,702 308 322 7 8 48 49Wyoming 3,125 2,962 5.5% 2,728 2,541 264 302 0 0 133 119Pacific Contiguous 30,358 30,544 -0.6% 19,611 20,844 9,276 8,261 231 231 1,241 1,209California 15,034 15,308 -1.8% 6,338 7,232 7,416 6,807 220 221 1,061 1,049Oregon 5,116 4,679 9.3% 3,941 3,776 1,117 845 7 7 50 51Washington 10,208 10,557 -3.3% 9,332 9,836 743 609 3 3 130 109Pacific Noncontiguous 1,263 1,243 1.6% 829 791 337 362 65 57 32 33Alaska 480 433 10.7% 418 377 22 18 30 NM 9 9Hawaii 783 809 -3.3% 411 413 315 344 34 29 23 24U.S. Total 302,229 293,752 2.9% 164,058 163,451 125,774 117,771 1,003 934 11,394 11,596
Table 1.3.A. Utility Scale Facility Net Generationby State, by Sector, April 2018 and 2017 (Thousand Megawatthours)
All Sectors Electric Power Sector Commercial Sector Industrial Sector
Displayed values of zero may represent small values that round to zero. The Excel version of this table provides additional precision which may be accessed by selecting individual cells.NM = Not meaningful due to large relative standard error or excessive percentage change.Notes: See Glossary for definitions. Values are preliminary. See Technical Notes for a discussion of the sample design for the Form EIA-923.Negative generation denotes that electric power consumed for plant use exceeds gross generation.Totals may not equal sum of components because of independent rounding. Percentage change is calculated before rounding.Source: U.S. Energy Information Administration, Form EIA-923, Power Plant Operations Report.
Electric UtilitiesIndependent
Power Producers
Generation at Utility Scale FacilitiesGeneration at Utility Scale
FacilitiesGeneration at Utility Scale
FacilitiesGeneration at Utility Scale
FacilitiesGeneration at Utility Scale
Facilities

6/19/2018 5:24:52 PM
Census Divisionand State
April 2018 YTD
April 2017 YTD
PercentageChange
April 2018 YTD
April 2017 YTD
April 2018 YTD
April 2017 YTD
April 2018 YTD
April 2017 YTD
April 2018 YTD
April 2017 YTD
New England 33,280 32,164 3.5% 1,273 750 30,645 30,059 413 399 948 957Connecticut 12,462 10,949 13.8% 32 28 12,141 10,639 124 120 165 162Maine 3,911 3,712 5.4% 0 0 3,175 2,953 60 64 676 695Massachusetts 8,778 10,523 -16.6% 185 112 8,314 10,149 183 173 96 90New Hampshire 5,644 4,958 13.8% 713 293 4,895 4,633 27 23 10 10Rhode Island 1,714 1,323 29.6% 0 3 1,696 1,302 18 17 0 0Vermont 770 699 10.2% 344 315 425 383 1 1 0 0Middle Atlantic 133,655 126,398 5.7% 11,485 10,895 119,962 113,294 728 701 1,480 1,507New Jersey 24,307 24,003 1.3% 39 28 23,810 23,513 221 212 236 250New York 41,219 39,298 4.9% 11,399 10,823 29,141 27,807 371 360 307 308Pennsylvania 68,130 63,097 8.0% 47 44 67,011 61,975 135 129 936 949East North Central 197,954 185,653 6.6% 79,469 77,887 114,181 103,408 599 578 3,705 3,780Illinois 60,907 58,822 3.5% 1,542 1,728 58,267 56,010 132 115 967 969Indiana 36,315 32,130 13.0% 27,968 27,095 6,803 3,382 82 76 1,461 1,576Michigan 37,979 36,106 5.2% 25,358 26,275 11,863 9,138 278 257 479 437Ohio 41,072 39,122 5.0% 7,832 7,591 32,941 31,199 69 86 230 246Wisconsin 21,680 19,474 11.3% 16,768 15,198 4,307 3,678 37 45 568 553West North Central 117,032 109,484 6.9% 92,443 87,411 22,907 20,558 210 198 1,471 1,316Iowa 20,538 17,920 14.6% 14,966 12,730 4,814 4,549 81 68 678 573Kansas 16,675 16,110 3.5% 10,114 9,951 6,524 6,142 NM NM 32 12Minnesota 21,463 18,960 13.2% 16,262 14,418 4,582 3,920 65 64 554 558Missouri 27,464 27,427 0.1% 25,649 26,330 1,744 1,024 52 54 18 19Nebraska 12,218 11,636 5.0% 10,118 9,595 1,966 1,927 6 7 128 107North Dakota 14,780 13,705 7.8% 12,239 11,510 2,481 2,148 0 0 60 47South Dakota 3,892 3,725 4.5% 3,096 2,877 796 848 NM NM 0 0South Atlantic 251,404 242,020 3.9% 205,290 202,579 39,439 32,656 414 405 6,262 6,380Delaware 2,102 2,196 -4.3% 8 NM 1,813 1,714 3 2 278 477District of Columbia 33 28 17.7% 0 0 15 18 18 10 0 0Florida 71,614 70,056 2.2% 66,168 64,349 3,677 3,945 25 27 1,744 1,734Georgia 38,994 38,062 2.4% 32,773 32,154 4,444 4,216 4 NM 1,774 1,690Maryland 13,808 9,764 41.4% 972 NM 12,563 9,503 174 160 99 98North Carolina 41,918 39,395 6.4% 37,050 35,209 4,135 3,529 63 61 671 596South Carolina 30,622 29,900 2.4% 28,834 28,472 1,135 760 1 1 652 667Virginia 30,747 29,651 3.7% 23,622 24,766 6,245 3,969 126 141 754 775West Virginia 21,565 22,968 -6.1% 15,863 17,623 5,412 5,002 0 0 290 343East South Central 114,037 107,731 5.9% 97,361 92,934 13,725 11,793 71 63 2,881 2,941Alabama 44,178 42,712 3.4% 31,938 31,839 10,845 9,453 0 0 1,394 1,419Kentucky 23,170 22,859 1.4% 22,692 22,572 287 92 0 0 192 196Mississippi 20,548 17,852 15.1% 17,451 15,046 2,493 2,173 6 3 599 630Tennessee 26,141 24,308 7.5% 25,279 23,478 100 74 65 60 696 696West South Central 217,807 203,144 7.2% 67,222 62,614 126,236 115,749 238 268 24,112 24,513Arkansas 20,801 18,273 13.8% 14,337 14,036 5,864 3,664 2 2 598 571Louisiana 29,969 29,305 2.3% 17,667 15,799 2,638 3,555 49 50 9,615 9,901Oklahoma 26,494 23,275 13.8% 11,119 11,377 15,071 11,614 0 0 305 284Texas 140,543 132,291 6.2% 24,099 21,402 102,663 96,916 186 215 13,595 13,758Mountain 109,533 108,976 0.5% 83,443 85,386 24,828 22,410 185 178 1,077 1,002Arizona 30,743 28,806 6.7% 28,052 26,207 2,638 2,550 53 49 0 0Colorado 17,567 17,542 0.1% 12,849 13,103 4,685 4,406 8 9 25 25Idaho 5,682 5,627 1.0% 3,611 3,723 1,847 1,692 17 17 206 195Montana 10,256 9,698 5.8% 4,355 4,293 5,891 5,394 0 0 10 11Nevada 10,998 10,735 2.5% 7,361 7,384 3,497 3,244 39 37 101 69New Mexico 8,673 11,119 -22.0% 4,673 8,292 3,959 2,790 37 36 3 1Utah 10,577 10,596 -0.2% 9,191 9,158 1,156 1,197 31 30 199 210Wyoming 15,037 14,855 1.2% 13,350 13,227 1,154 1,137 0 0 533 490Pacific Contiguous 121,884 125,162 -2.6% 78,066 84,474 37,727 34,774 949 958 5,142 4,956California 56,640 63,203 -10.4% 22,378 30,361 28,953 27,654 908 920 4,401 4,267Oregon 22,456 20,693 8.5% 17,184 16,559 5,033 3,906 27 24 213 204Washington 42,788 41,267 3.7% 38,504 37,554 3,741 3,214 15 14 528 485Pacific Noncontiguous 5,232 5,127 2.0% 3,547 3,477 1,302 1,268 254 243 128 138Alaska 2,126 1,950 9.0% 1,868 1,706 89 77 133 124 36 43Hawaii 3,105 3,177 -2.2% 1,679 1,771 1,213 1,191 122 120 92 96U.S. Total 1,301,817 1,245,858 4.5% 719,598 708,407 530,953 485,968 4,060 3,991 47,206 47,492
Table 1.3.B. Utility Scale Facility Net Generation
by State, by Sector, Year-to-Date through April 2018 and 2017 (Thousand Megawatthours)All Sectors Electric Power Sector Commercial Sector Industrial Sector
Displayed values of zero may represent small values that round to zero. The Excel version of this table provides additional precision which may be accessed by selecting individual cells.NM = Not meaningful due to large relative standard error or excessive percentage change.Notes: See Glossary for definitions. Values are preliminary. See Technical Notes for a discussion of the sample design for the Form EIA-923.Negative generation denotes that electric power consumed for plant use exceeds gross generation.Totals may not equal sum of components because of independent rounding. Percentage change is calculated before rounding.Source: U.S. Energy Information Administration, Form EIA-923, Power Plant Operations Report.
Electric UtilitiesIndependent
Power Producers
Generation at Utility Scale FacilitiesGeneration at Utility Scale
FacilitiesGeneration at Utility Scale
FacilitiesGeneration at Utility Scale
FacilitiesGeneration at Utility Scale
Facilities
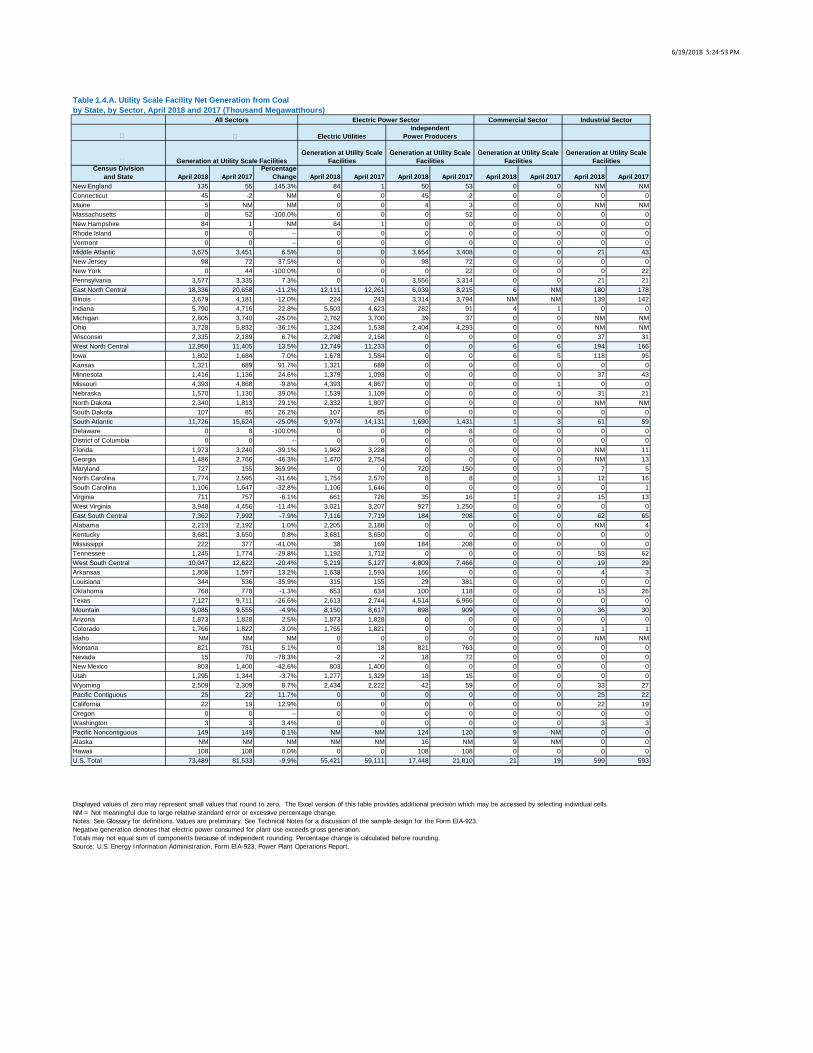
6/19/2018 5:24:53 PM
Census Divisionand State April 2018 April 2017
PercentageChange April 2018 April 2017 April 2018 April 2017 April 2018 April 2017 April 2018 April 2017
New England 135 55 145.3% 84 1 50 53 0 0 NM NMConnecticut 45 -2 NM 0 0 45 -2 0 0 0 0Maine 5 NM NM 0 0 4 3 0 0 NM NMMassachusetts 0 52 -100.0% 0 0 0 52 0 0 0 0New Hampshire 84 1 NM 84 1 0 0 0 0 0 0Rhode Island 0 0 -- 0 0 0 0 0 0 0 0Vermont 0 0 -- 0 0 0 0 0 0 0 0Middle Atlantic 3,675 3,451 6.5% 0 0 3,654 3,408 0 0 21 43New Jersey 98 72 37.5% 0 0 98 72 0 0 0 0New York 0 44 -100.0% 0 0 0 22 0 0 0 22Pennsylvania 3,577 3,335 7.3% 0 0 3,556 3,314 0 0 21 21East North Central 18,336 20,658 -11.2% 12,111 12,261 6,039 8,215 6 NM 180 178Illinois 3,679 4,181 -12.0% 224 243 3,314 3,794 NM NM 139 142Indiana 5,790 4,716 22.8% 5,503 4,623 282 91 4 1 0 0Michigan 2,805 3,740 -25.0% 2,762 3,700 39 37 0 0 NM NMOhio 3,728 5,832 -36.1% 1,324 1,538 2,404 4,293 0 0 NM NMWisconsin 2,335 2,189 6.7% 2,298 2,158 0 0 0 0 37 31West North Central 12,950 11,405 13.5% 12,749 11,233 0 0 6 6 194 166Iowa 1,802 1,684 7.0% 1,678 1,584 0 0 6 5 118 95Kansas 1,321 689 91.7% 1,321 689 0 0 0 0 0 0Minnesota 1,416 1,136 24.6% 1,379 1,093 0 0 0 0 37 43Missouri 4,393 4,868 -9.8% 4,393 4,867 0 0 0 1 0 0Nebraska 1,570 1,130 39.0% 1,539 1,109 0 0 0 0 31 21North Dakota 2,340 1,813 29.1% 2,332 1,807 0 0 0 0 NM NMSouth Dakota 107 85 26.2% 107 85 0 0 0 0 0 0South Atlantic 11,726 15,624 -25.0% 9,974 14,131 1,690 1,431 1 3 61 59Delaware 0 8 -100.0% 0 0 0 8 0 0 0 0District of Columbia 0 0 -- 0 0 0 0 0 0 0 0Florida 1,973 3,240 -39.1% 1,962 3,228 0 0 0 0 NM 11Georgia 1,486 2,766 -46.3% 1,470 2,754 0 0 0 0 NM 13Maryland 727 155 369.9% 0 0 720 150 0 0 7 5North Carolina 1,774 2,595 -31.6% 1,754 2,570 8 8 0 1 12 16South Carolina 1,106 1,647 -32.8% 1,106 1,646 0 0 0 0 0 1Virginia 711 757 -6.1% 661 726 35 16 1 2 15 13West Virginia 3,948 4,456 -11.4% 3,021 3,207 927 1,250 0 0 0 0East South Central 7,362 7,992 -7.9% 7,116 7,719 184 208 0 0 62 65Alabama 2,213 2,192 1.0% 2,205 2,188 0 0 0 0 NM 4Kentucky 3,681 3,650 0.8% 3,681 3,650 0 0 0 0 0 0Mississippi 222 377 -41.0% 38 169 184 208 0 0 0 0Tennessee 1,245 1,774 -29.8% 1,192 1,712 0 0 0 0 53 62West South Central 10,047 12,622 -20.4% 5,219 5,127 4,809 7,466 0 0 19 29Arkansas 1,808 1,597 13.2% 1,638 1,593 166 0 0 0 4 3Louisiana 344 536 -35.9% 315 155 29 381 0 0 0 0Oklahoma 768 778 -1.3% 653 634 100 118 0 0 15 26Texas 7,127 9,711 -26.6% 2,613 2,744 4,514 6,966 0 0 0 0Mountain 9,085 9,555 -4.9% 8,150 8,617 898 909 0 0 36 30Arizona 1,873 1,828 2.5% 1,873 1,828 0 0 0 0 0 0Colorado 1,766 1,822 -3.0% 1,765 1,821 0 0 0 0 1 1Idaho NM NM NM 0 0 0 0 0 0 NM NMMontana 821 781 5.1% 0 18 821 763 0 0 0 0Nevada 15 70 -78.3% -2 -2 18 72 0 0 0 0New Mexico 803 1,400 -42.6% 803 1,400 0 0 0 0 0 0Utah 1,295 1,344 -3.7% 1,277 1,329 18 15 0 0 0 0Wyoming 2,509 2,309 8.7% 2,434 2,222 42 59 0 0 33 27Pacific Contiguous 25 22 11.7% 0 0 0 0 0 0 25 22California 22 19 12.9% 0 0 0 0 0 0 22 19Oregon 0 0 -- 0 0 0 0 0 0 0 0Washington 3 3 3.4% 0 0 0 0 0 0 3 3Pacific Noncontiguous 149 149 0.1% NM NM 124 120 9 NM 0 0Alaska NM NM NM NM NM 16 NM 9 NM 0 0Hawaii 108 108 0.0% 0 0 108 108 0 0 0 0U.S. Total 73,489 81,533 -9.9% 55,421 59,111 17,448 21,810 21 19 599 593
Table 1.4.A. Utility Scale Facility Net Generation from Coalby State, by Sector, April 2018 and 2017 (Thousand Megawatthours)
All Sectors Electric Power Sector Commercial Sector Industrial Sector
Displayed values of zero may represent small values that round to zero. The Excel version of this table provides additional precision which may be accessed by selecting individual cells.NM = Not meaningful due to large relative standard error or excessive percentage change.Notes: See Glossary for definitions. Values are preliminary. See Technical Notes for a discussion of the sample design for the Form EIA-923.Negative generation denotes that electric power consumed for plant use exceeds gross generation.Totals may not equal sum of components because of independent rounding. Percentage change is calculated before rounding.Source: U.S. Energy Information Administration, Form EIA-923, Power Plant Operations Report.
Electric UtilitiesIndependent
Power Producers
Generation at Utility Scale FacilitiesGeneration at Utility Scale
FacilitiesGeneration at Utility Scale
FacilitiesGeneration at Utility Scale
FacilitiesGeneration at Utility Scale
Facilities
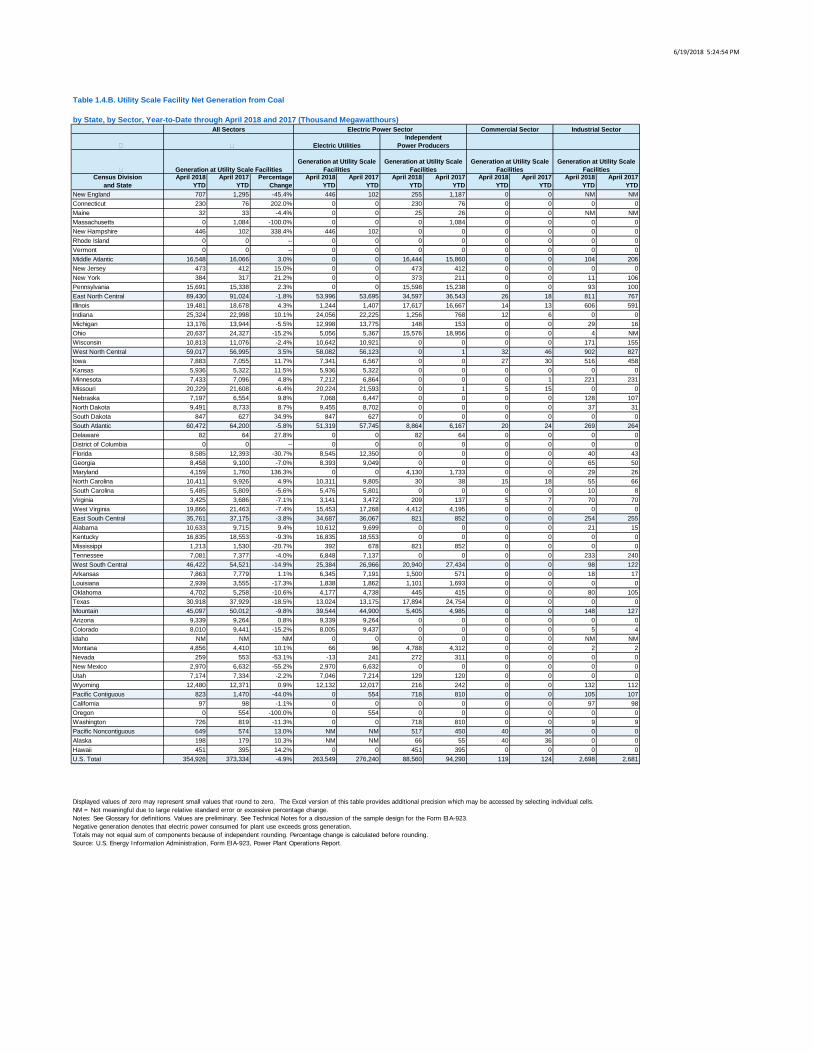
6/19/2018 5:24:54 PM
Census Divisionand State
April 2018 YTD
April 2017 YTD
PercentageChange
April 2018 YTD
April 2017 YTD
April 2018 YTD
April 2017 YTD
April 2018 YTD
April 2017 YTD
April 2018 YTD
April 2017 YTD
New England 707 1,295 -45.4% 446 102 255 1,187 0 0 NM NMConnecticut 230 76 202.0% 0 0 230 76 0 0 0 0Maine 32 33 -4.4% 0 0 25 26 0 0 NM NMMassachusetts 0 1,084 -100.0% 0 0 0 1,084 0 0 0 0New Hampshire 446 102 338.4% 446 102 0 0 0 0 0 0Rhode Island 0 0 -- 0 0 0 0 0 0 0 0Vermont 0 0 -- 0 0 0 0 0 0 0 0Middle Atlantic 16,548 16,066 3.0% 0 0 16,444 15,860 0 0 104 206New Jersey 473 412 15.0% 0 0 473 412 0 0 0 0New York 384 317 21.2% 0 0 373 211 0 0 11 106Pennsylvania 15,691 15,338 2.3% 0 0 15,598 15,238 0 0 93 100East North Central 89,430 91,024 -1.8% 53,996 53,695 34,597 36,543 26 18 811 767Illinois 19,481 18,678 4.3% 1,244 1,407 17,617 16,667 14 13 606 591Indiana 25,324 22,998 10.1% 24,056 22,225 1,256 768 12 6 0 0Michigan 13,176 13,944 -5.5% 12,998 13,775 148 153 0 0 29 16Ohio 20,637 24,327 -15.2% 5,056 5,367 15,576 18,956 0 0 4 NMWisconsin 10,813 11,076 -2.4% 10,642 10,921 0 0 0 0 171 155West North Central 59,017 56,995 3.5% 58,082 56,123 0 1 32 46 902 827Iowa 7,883 7,055 11.7% 7,341 6,567 0 0 27 30 516 458Kansas 5,936 5,322 11.5% 5,936 5,322 0 0 0 0 0 0Minnesota 7,433 7,096 4.8% 7,212 6,864 0 0 0 1 221 231Missouri 20,229 21,608 -6.4% 20,224 21,593 0 1 5 15 0 0Nebraska 7,197 6,554 9.8% 7,068 6,447 0 0 0 0 128 107North Dakota 9,491 8,733 8.7% 9,455 8,702 0 0 0 0 37 31South Dakota 847 627 34.9% 847 627 0 0 0 0 0 0South Atlantic 60,472 64,200 -5.8% 51,319 57,745 8,864 6,167 20 24 269 264Delaware 82 64 27.8% 0 0 82 64 0 0 0 0District of Columbia 0 0 -- 0 0 0 0 0 0 0 0Florida 8,585 12,393 -30.7% 8,545 12,350 0 0 0 0 40 43Georgia 8,458 9,100 -7.0% 8,393 9,049 0 0 0 0 65 50Maryland 4,159 1,760 136.3% 0 0 4,130 1,733 0 0 29 26North Carolina 10,411 9,926 4.9% 10,311 9,805 30 38 15 18 55 66South Carolina 5,485 5,809 -5.6% 5,476 5,801 0 0 0 0 10 8Virginia 3,425 3,686 -7.1% 3,141 3,472 209 137 5 7 70 70West Virginia 19,866 21,463 -7.4% 15,453 17,268 4,412 4,195 0 0 0 0East South Central 35,761 37,175 -3.8% 34,687 36,067 821 852 0 0 254 255Alabama 10,633 9,715 9.4% 10,612 9,699 0 0 0 0 21 15Kentucky 16,835 18,553 -9.3% 16,835 18,553 0 0 0 0 0 0Mississippi 1,213 1,530 -20.7% 392 678 821 852 0 0 0 0Tennessee 7,081 7,377 -4.0% 6,848 7,137 0 0 0 0 233 240West South Central 46,422 54,521 -14.9% 25,384 26,966 20,940 27,434 0 0 98 122Arkansas 7,863 7,779 1.1% 6,345 7,191 1,500 571 0 0 18 17Louisiana 2,939 3,555 -17.3% 1,838 1,862 1,101 1,693 0 0 0 0Oklahoma 4,702 5,258 -10.6% 4,177 4,738 445 415 0 0 80 105Texas 30,918 37,929 -18.5% 13,024 13,175 17,894 24,754 0 0 0 0Mountain 45,097 50,012 -9.8% 39,544 44,900 5,405 4,985 0 0 148 127Arizona 9,339 9,264 0.8% 9,339 9,264 0 0 0 0 0 0Colorado 8,010 9,441 -15.2% 8,005 9,437 0 0 0 0 5 4Idaho NM NM NM 0 0 0 0 0 0 NM NMMontana 4,856 4,410 10.1% 66 96 4,788 4,312 0 0 2 2Nevada 259 553 -53.1% -13 241 272 311 0 0 0 0New Mexico 2,970 6,632 -55.2% 2,970 6,632 0 0 0 0 0 0Utah 7,174 7,334 -2.2% 7,046 7,214 129 120 0 0 0 0Wyoming 12,480 12,371 0.9% 12,132 12,017 216 242 0 0 132 112Pacific Contiguous 823 1,470 -44.0% 0 554 718 810 0 0 105 107California 97 98 -1.1% 0 0 0 0 0 0 97 98Oregon 0 554 -100.0% 0 554 0 0 0 0 0 0Washington 726 819 -11.3% 0 0 718 810 0 0 9 9Pacific Noncontiguous 649 574 13.0% NM NM 517 450 40 36 0 0Alaska 198 179 10.3% NM NM 66 55 40 36 0 0Hawaii 451 395 14.2% 0 0 451 395 0 0 0 0U.S. Total 354,926 373,334 -4.9% 263,549 276,240 88,560 94,290 119 124 2,698 2,681
Table 1.4.B. Utility Scale Facility Net Generation from Coal
by State, by Sector, Year-to-Date through April 2018 and 2017 (Thousand Megawatthours)All Sectors Electric Power Sector Commercial Sector Industrial Sector
Displayed values of zero may represent small values that round to zero. The Excel version of this table provides additional precision which may be accessed by selecting individual cells.NM = Not meaningful due to large relative standard error or excessive percentage change.Notes: See Glossary for definitions. Values are preliminary. See Technical Notes for a discussion of the sample design for the Form EIA-923.Negative generation denotes that electric power consumed for plant use exceeds gross generation.Totals may not equal sum of components because of independent rounding. Percentage change is calculated before rounding.Source: U.S. Energy Information Administration, Form EIA-923, Power Plant Operations Report.
Electric UtilitiesIndependent
Power Producers
Generation at Utility Scale FacilitiesGeneration at Utility Scale
FacilitiesGeneration at Utility Scale
FacilitiesGeneration at Utility Scale
FacilitiesGeneration at Utility Scale
Facilities
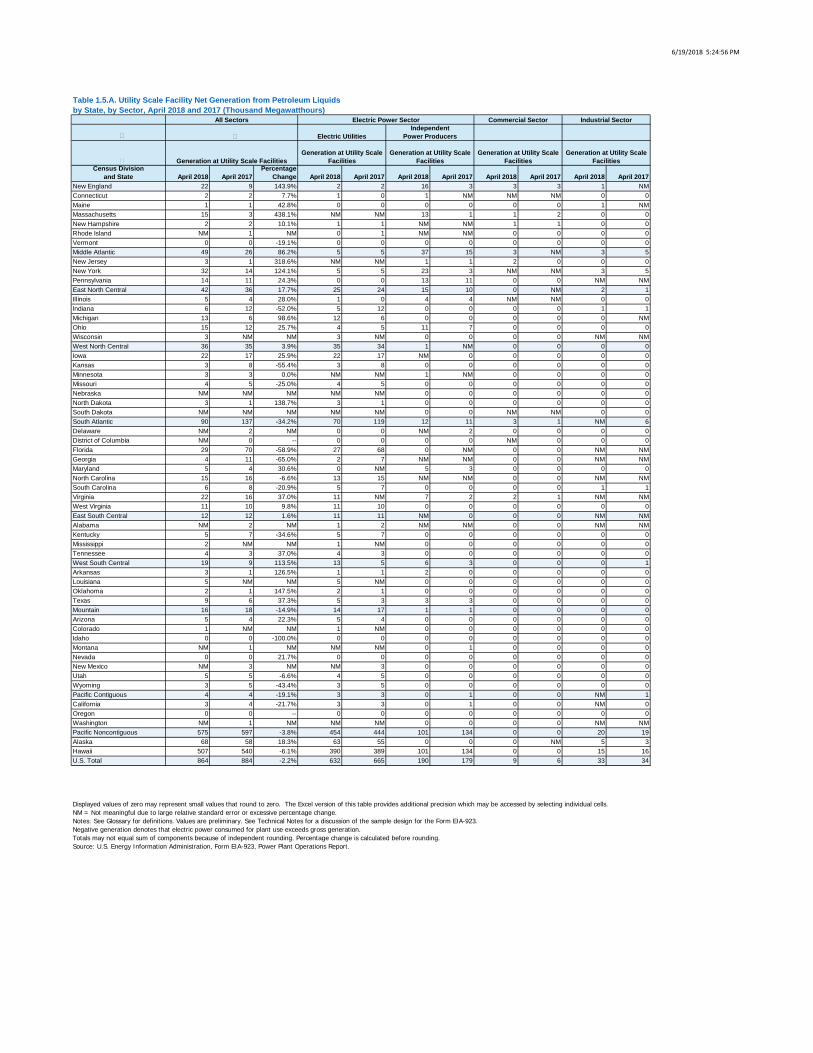
6/19/2018 5:24:56 PM
Census Divisionand State April 2018 April 2017
PercentageChange April 2018 April 2017 April 2018 April 2017 April 2018 April 2017 April 2018 April 2017
New England 22 9 143.9% 2 2 16 3 3 3 1 NMConnecticut 2 2 7.7% 1 0 1 NM NM NM 0 0Maine 1 1 42.8% 0 0 0 0 0 0 1 NMMassachusetts 15 3 438.1% NM NM 13 1 1 2 0 0New Hampshire 2 2 10.1% 1 1 NM NM 1 1 0 0Rhode Island NM 1 NM 0 1 NM NM 0 0 0 0Vermont 0 0 -19.1% 0 0 0 0 0 0 0 0Middle Atlantic 49 26 86.2% 5 5 37 15 3 NM 3 5New Jersey 3 1 318.6% NM NM 1 1 2 0 0 0New York 32 14 124.1% 5 5 23 3 NM NM 3 5Pennsylvania 14 11 24.3% 0 0 13 11 0 0 NM NMEast North Central 42 36 17.7% 25 24 15 10 0 NM 2 1Illinois 5 4 28.0% 1 0 4 4 NM NM 0 0Indiana 6 12 -52.0% 5 12 0 0 0 0 1 1Michigan 13 6 98.6% 12 6 0 0 0 0 0 NMOhio 15 12 25.7% 4 5 11 7 0 0 0 0Wisconsin 3 NM NM 3 NM 0 0 0 0 NM NMWest North Central 36 35 3.9% 35 34 1 NM 0 0 0 0Iowa 22 17 25.9% 22 17 NM 0 0 0 0 0Kansas 3 8 -55.4% 3 8 0 0 0 0 0 0Minnesota 3 3 0.0% NM NM 1 NM 0 0 0 0Missouri 4 5 -25.0% 4 5 0 0 0 0 0 0Nebraska NM NM NM NM NM 0 0 0 0 0 0North Dakota 3 1 138.7% 3 1 0 0 0 0 0 0South Dakota NM NM NM NM NM 0 0 NM NM 0 0South Atlantic 90 137 -34.2% 70 119 12 11 3 1 NM 6Delaware NM 2 NM 0 0 NM 2 0 0 0 0District of Columbia NM 0 -- 0 0 0 0 NM 0 0 0Florida 29 70 -58.9% 27 68 0 NM 0 0 NM NMGeorgia 4 11 -65.0% 2 7 NM NM 0 0 NM NMMaryland 5 4 30.6% 0 NM 5 3 0 0 0 0North Carolina 15 16 -6.6% 13 15 NM NM 0 0 NM NMSouth Carolina 6 8 -20.9% 5 7 0 0 0 0 1 1Virginia 22 16 37.0% 11 NM 7 2 2 1 NM NMWest Virginia 11 10 9.8% 11 10 0 0 0 0 0 0East South Central 12 12 1.6% 11 11 NM 0 0 0 NM NMAlabama NM 2 NM 1 2 NM NM 0 0 NM NMKentucky 5 7 -34.6% 5 7 0 0 0 0 0 0Mississippi 2 NM NM 1 NM 0 0 0 0 0 0Tennessee 4 3 37.0% 4 3 0 0 0 0 0 0West South Central 19 9 113.5% 13 5 6 3 0 0 0 1Arkansas 3 1 126.5% 1 1 2 0 0 0 0 0Louisiana 5 NM NM 5 NM 0 0 0 0 0 0Oklahoma 2 1 147.5% 2 1 0 0 0 0 0 0Texas 9 6 37.3% 5 3 3 3 0 0 0 0Mountain 16 18 -14.9% 14 17 1 1 0 0 0 0Arizona 5 4 22.3% 5 4 0 0 0 0 0 0Colorado 1 NM NM 1 NM 0 0 0 0 0 0Idaho 0 0 -100.0% 0 0 0 0 0 0 0 0Montana NM 1 NM NM NM 0 1 0 0 0 0Nevada 0 0 21.7% 0 0 0 0 0 0 0 0New Mexico NM 3 NM NM 3 0 0 0 0 0 0Utah 5 5 -6.6% 4 5 0 0 0 0 0 0Wyoming 3 5 -43.4% 3 5 0 0 0 0 0 0Pacific Contiguous 4 4 -19.1% 3 3 0 1 0 0 NM 1California 3 4 -21.7% 3 3 0 1 0 0 NM 0Oregon 0 0 -- 0 0 0 0 0 0 0 0Washington NM 1 NM NM NM 0 0 0 0 NM NMPacific Noncontiguous 575 597 -3.8% 454 444 101 134 0 0 20 19Alaska 68 58 18.3% 63 55 0 0 0 NM 5 3Hawaii 507 540 -6.1% 390 389 101 134 0 0 15 16U.S. Total 864 884 -2.2% 632 665 190 179 9 6 33 34
Table 1.5.A. Utility Scale Facility Net Generation from Petroleum Liquidsby State, by Sector, April 2018 and 2017 (Thousand Megawatthours)
All Sectors Electric Power Sector Commercial Sector Industrial Sector
Displayed values of zero may represent small values that round to zero. The Excel version of this table provides additional precision which may be accessed by selecting individual cells.NM = Not meaningful due to large relative standard error or excessive percentage change.Notes: See Glossary for definitions. Values are preliminary. See Technical Notes for a discussion of the sample design for the Form EIA-923.Negative generation denotes that electric power consumed for plant use exceeds gross generation.Totals may not equal sum of components because of independent rounding. Percentage change is calculated before rounding.Source: U.S. Energy Information Administration, Form EIA-923, Power Plant Operations Report.
Electric UtilitiesIndependent
Power Producers
Generation at Utility Scale FacilitiesGeneration at Utility Scale
FacilitiesGeneration at Utility Scale
FacilitiesGeneration at Utility Scale
FacilitiesGeneration at Utility Scale
Facilities
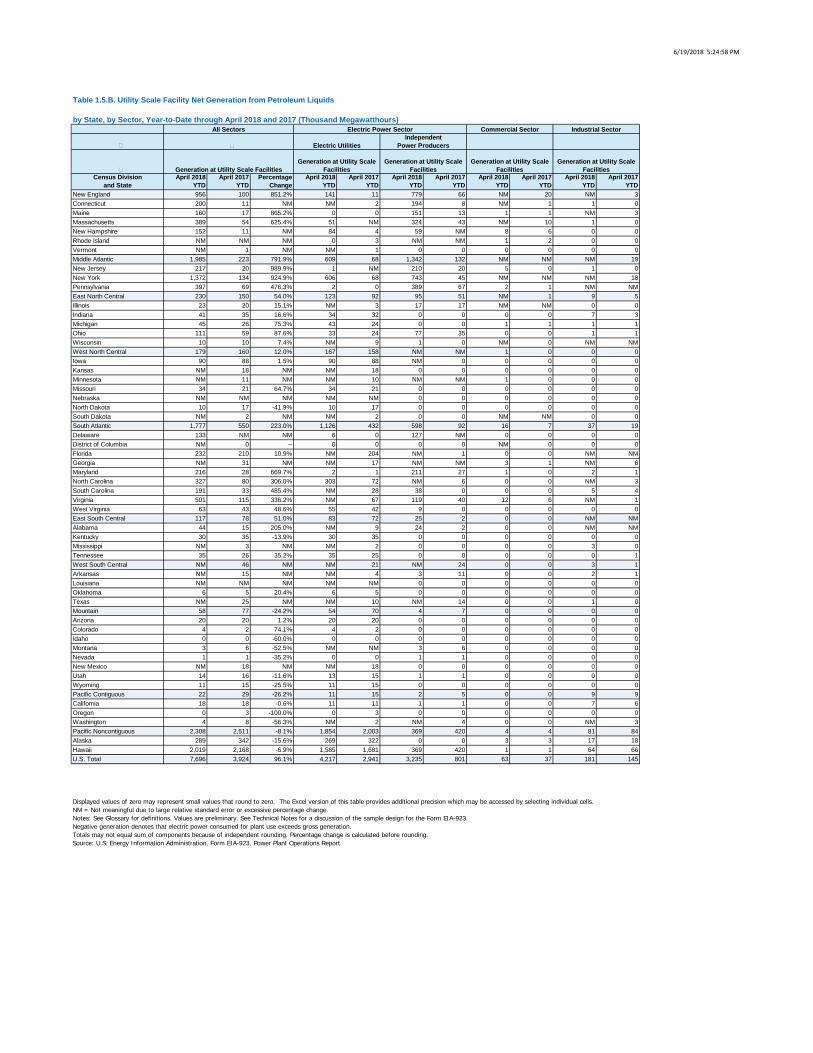
6/19/2018 5:24:58 PM
Census Divisionand State
April 2018 YTD
April 2017 YTD
PercentageChange
April 2018 YTD
April 2017 YTD
April 2018 YTD
April 2017 YTD
April 2018 YTD
April 2017 YTD
April 2018 YTD
April 2017 YTD
New England 956 100 851.2% 141 11 779 66 NM 20 NM 3Connecticut 200 11 NM NM 2 194 8 NM 1 1 0Maine 160 17 865.2% 0 0 151 13 1 1 NM 3Massachusetts 389 54 625.4% 51 NM 324 43 NM 10 1 0New Hampshire 152 11 NM 84 4 59 NM 8 6 0 0Rhode Island NM NM NM 0 3 NM NM 1 2 0 0Vermont NM 1 NM NM 1 0 0 0 0 0 0Middle Atlantic 1,985 223 791.9% 609 68 1,342 132 NM NM NM 19New Jersey 217 20 989.9% 1 NM 210 20 5 0 1 0New York 1,372 134 924.9% 606 68 743 45 NM NM NM 18Pennsylvania 397 69 476.3% 2 0 389 67 2 1 NM NMEast North Central 230 150 54.0% 123 92 95 51 NM 1 9 5Illinois 23 20 15.1% NM 3 17 17 NM NM 0 0Indiana 41 35 16.6% 34 32 0 0 0 0 7 3Michigan 45 26 75.3% 43 24 0 0 1 1 1 1Ohio 111 59 87.6% 33 24 77 35 0 0 1 1Wisconsin 10 10 7.4% NM 9 1 0 NM 0 NM NMWest North Central 179 160 12.0% 167 158 NM NM 1 0 0 0Iowa 90 88 1.5% 90 88 NM 0 0 0 0 0Kansas NM 18 NM NM 18 0 0 0 0 0 0Minnesota NM 11 NM NM 10 NM NM 1 0 0 0Missouri 34 21 64.7% 34 21 0 0 0 0 0 0Nebraska NM NM NM NM NM 0 0 0 0 0 0North Dakota 10 17 -41.9% 10 17 0 0 0 0 0 0South Dakota NM 2 NM NM 2 0 0 NM NM 0 0South Atlantic 1,777 550 223.0% 1,126 432 598 92 16 7 37 19Delaware 133 NM NM 6 0 127 NM 0 0 0 0District of Columbia NM 0 -- 0 0 0 0 NM 0 0 0Florida 232 210 10.9% NM 204 NM 1 0 0 NM NMGeorgia NM 31 NM NM 17 NM NM 3 1 NM 6Maryland 216 28 669.7% 2 1 211 27 1 0 2 1North Carolina 327 80 306.0% 303 72 NM 6 0 0 NM 3South Carolina 191 33 485.4% NM 28 38 0 0 0 5 4Virginia 501 115 336.2% NM 67 119 40 12 6 NM 1West Virginia 63 43 48.6% 55 42 9 0 0 0 0 0East South Central 117 78 51.0% 83 72 25 2 0 0 NM NMAlabama 44 15 205.0% NM 9 24 2 0 0 NM NMKentucky 30 35 -13.9% 30 35 0 0 0 0 0 0Mississippi NM 3 NM NM 2 0 0 0 0 3 0Tennessee 35 26 35.2% 35 25 0 0 0 0 0 1West South Central NM 46 NM NM 21 NM 24 0 0 3 1Arkansas NM 15 NM NM 4 3 11 0 0 2 1Louisiana NM NM NM NM NM 0 0 0 0 0 0Oklahoma 6 5 20.4% 6 5 0 0 0 0 0 0Texas NM 25 NM NM 10 NM 14 0 0 1 0Mountain 58 77 -24.2% 54 70 4 7 0 0 0 0Arizona 20 20 1.2% 20 20 0 0 0 0 0 0Colorado 4 2 74.1% 4 2 0 0 0 0 0 0Idaho 0 0 -60.0% 0 0 0 0 0 0 0 0Montana 3 6 -52.5% NM NM 3 6 0 0 0 0Nevada 1 1 -35.2% 0 0 1 1 0 0 0 0New Mexico NM 18 NM NM 18 0 0 0 0 0 0Utah 14 16 -11.6% 13 15 1 1 0 0 0 0Wyoming 11 15 -25.5% 11 15 0 0 0 0 0 0Pacific Contiguous 22 29 -26.2% 11 15 2 5 0 0 9 9California 18 18 -0.6% 11 11 1 1 0 0 7 6Oregon 0 3 -100.0% 0 3 0 0 0 0 0 0Washington 4 8 -56.3% NM 2 NM 4 0 0 NM 3Pacific Noncontiguous 2,308 2,511 -8.1% 1,854 2,003 369 420 4 4 81 84Alaska 289 342 -15.6% 269 322 0 0 3 3 17 18Hawaii 2,019 2,168 -6.9% 1,585 1,681 369 420 1 1 64 66U.S. Total 7,696 3,924 96.1% 4,217 2,941 3,235 801 63 37 181 145
Table 1.5.B. Utility Scale Facility Net Generation from Petroleum Liquids
by State, by Sector, Year-to-Date through April 2018 and 2017 (Thousand Megawatthours)All Sectors Electric Power Sector Commercial Sector Industrial Sector
Displayed values of zero may represent small values that round to zero. The Excel version of this table provides additional precision which may be accessed by selecting individual cells.NM = Not meaningful due to large relative standard error or excessive percentage change.Notes: See Glossary for definitions. Values are preliminary. See Technical Notes for a discussion of the sample design for the Form EIA-923.Negative generation denotes that electric power consumed for plant use exceeds gross generation.Totals may not equal sum of components because of independent rounding. Percentage change is calculated before rounding.Source: U.S. Energy Information Administration, Form EIA-923, Power Plant Operations Report.
Electric UtilitiesIndependent
Power Producers
Generation at Utility Scale FacilitiesGeneration at Utility Scale
FacilitiesGeneration at Utility Scale
FacilitiesGeneration at Utility Scale
FacilitiesGeneration at Utility Scale
Facilities

6/19/2018 5:25:00 PM
Census Divisionand State April 2018 April 2017
PercentageChange April 2018 April 2017 April 2018 April 2017 April 2018 April 2017 April 2018 April 2017
New England 0 0 -- 0 0 0 0 0 0 0 0Connecticut 0 0 -- 0 0 0 0 0 0 0 0Maine 0 0 -- 0 0 0 0 0 0 0 0Massachusetts 0 0 -- 0 0 0 0 0 0 0 0New Hampshire 0 0 -- 0 0 0 0 0 0 0 0Rhode Island 0 0 -- 0 0 0 0 0 0 0 0Vermont 0 0 -- 0 0 0 0 0 0 0 0Middle Atlantic NM NM NM 0 0 0 0 0 0 NM NMNew Jersey 0 7 -100.0% 0 0 0 0 0 0 0 7New York 0 0 -- 0 0 0 0 0 0 0 0Pennsylvania NM NM NM 0 0 0 0 0 0 NM NMEast North Central 73 137 -46.7% 65 68 0 62 0 0 8 7Illinois 0 0 -- 0 0 0 0 0 0 0 0Indiana 0 0 -- 0 0 0 0 0 0 0 0Michigan 72 75 -3.2% 66 68 0 0 0 0 7 7Ohio 1 62 -98.5% 0 0 0 62 0 0 1 0Wisconsin 0 0 -229.7% 0 0 0 0 0 0 0 0West North Central 8 0 NM 0 0 0 0 0 0 8 0Iowa 8 0 NM 0 0 0 0 0 0 8 0Kansas 0 0 -- 0 0 0 0 0 0 0 0Minnesota 0 0 -- 0 0 0 0 0 0 0 0Missouri 0 0 -- 0 0 0 0 0 0 0 0Nebraska 0 0 -- 0 0 0 0 0 0 0 0North Dakota 0 0 -- 0 0 0 0 0 0 0 0South Dakota 0 0 -- 0 0 0 0 0 0 0 0South Atlantic 94 23 318.1% 74 23 0 0 0 0 NM 0Delaware 0 0 -- 0 0 0 0 0 0 0 0District of Columbia 0 0 -- 0 0 0 0 0 0 0 0Florida 74 23 226.8% 74 23 0 0 0 0 0 0Georgia NM 0 -- 0 0 0 0 0 0 NM 0Maryland 0 0 -- 0 0 0 0 0 0 0 0North Carolina 0 0 -- 0 0 0 0 0 0 0 0South Carolina 0 0 -- 0 0 0 0 0 0 0 0Virginia 0 0 -- 0 0 0 0 0 0 0 0West Virginia 0 0 -- 0 0 0 0 0 0 0 0East South Central 0 48 -100.0% 0 48 0 0 0 0 0 0Alabama 0 0 -- 0 0 0 0 0 0 0 0Kentucky 0 48 -100.0% 0 48 0 0 0 0 0 0Mississippi 0 0 -- 0 0 0 0 0 0 0 0Tennessee 0 0 -- 0 0 0 0 0 0 0 0West South Central 362 154 135.2% 338 121 0 0 0 0 23 33Arkansas 0 0 -- 0 0 0 0 0 0 0 0Louisiana 352 146 142.0% 338 121 0 0 0 0 14 25Oklahoma 0 0 -- 0 0 0 0 0 0 0 0Texas 9 8 13.6% 0 0 0 0 0 0 9 8Mountain 39 34 16.8% 0 0 39 34 0 0 0 0Arizona 0 0 -- 0 0 0 0 0 0 0 0Colorado 0 0 -- 0 0 0 0 0 0 0 0Idaho 0 0 -- 0 0 0 0 0 0 0 0Montana 39 34 16.8% 0 0 39 34 0 0 0 0Nevada 0 0 -- 0 0 0 0 0 0 0 0New Mexico 0 0 -- 0 0 0 0 0 0 0 0Utah 0 0 -- 0 0 0 0 0 0 0 0Wyoming 0 0 -- 0 0 0 0 0 0 0 0Pacific Contiguous 0 0 -- 0 0 0 0 0 0 0 0California 0 0 -- 0 0 0 0 0 0 0 0Oregon 0 0 -- 0 0 0 0 0 0 0 0Washington 0 0 -- 0 0 0 0 0 0 0 0Pacific Noncontiguous 0 0 -- 0 0 0 0 0 0 0 0Alaska 0 0 -- 0 0 0 0 0 0 0 0Hawaii 0 0 -- 0 0 0 0 0 0 0 0U.S. Total 582 404 44.0% 477 260 39 95 0 0 65 48
Table 1.6.A. Utility Scale Facility Net Generation from Petroleum Cokeby State, by Sector, April 2018 and 2017 (Thousand Megawatthours)
All Sectors Electric Power Sector Commercial Sector Industrial Sector
Displayed values of zero may represent small values that round to zero. The Excel version of this table provides additional precision which may be accessed by selecting individual cells.NM = Not meaningful due to large relative standard error or excessive percentage change.Notes: See Glossary for definitions. Values are preliminary. See Technical Notes for a discussion of the sample design for the Form EIA-923.Negative generation denotes that electric power consumed for plant use exceeds gross generation.Totals may not equal sum of components because of independent rounding. Percentage change is calculated before rounding.Source: U.S. Energy Information Administration, Form EIA-923, Power Plant Operations Report.
Electric UtilitiesIndependent
Power Producers
Generation at Utility Scale FacilitiesGeneration at Utility Scale
FacilitiesGeneration at Utility Scale
FacilitiesGeneration at Utility Scale
FacilitiesGeneration at Utility Scale
Facilities
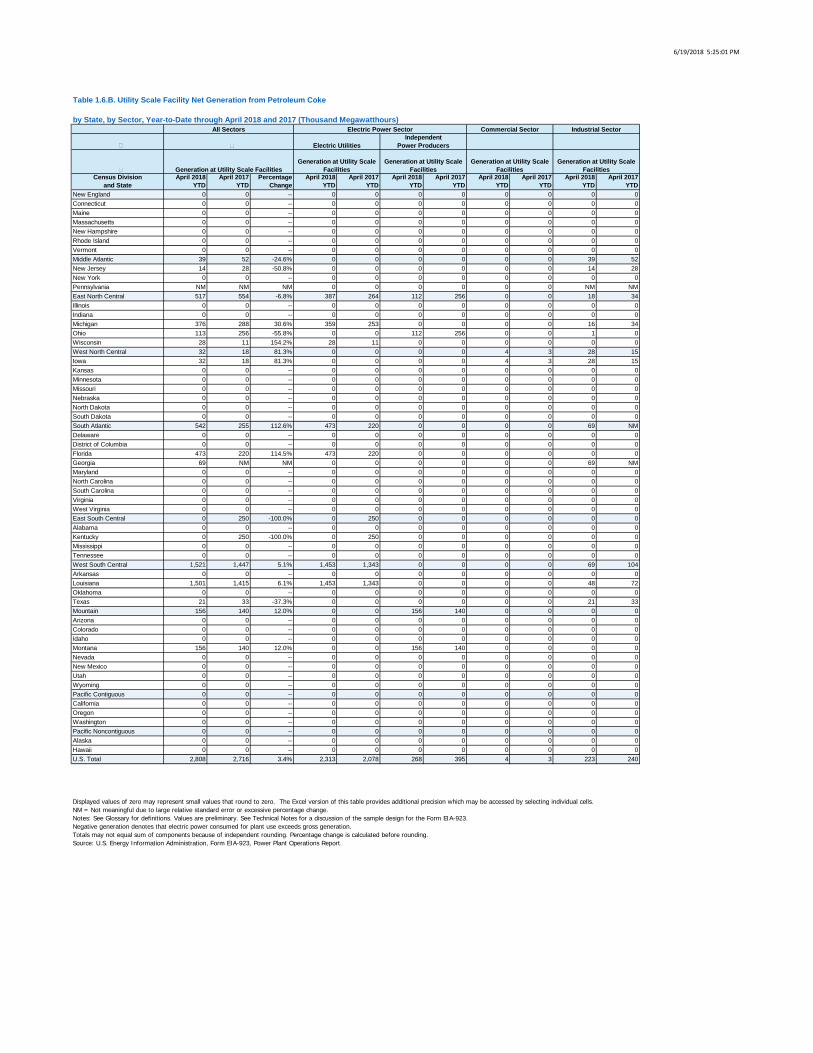
6/19/2018 5:25:01 PM
Census Divisionand State
April 2018 YTD
April 2017 YTD
PercentageChange
April 2018 YTD
April 2017 YTD
April 2018 YTD
April 2017 YTD
April 2018 YTD
April 2017 YTD
April 2018 YTD
April 2017 YTD
New England 0 0 -- 0 0 0 0 0 0 0 0Connecticut 0 0 -- 0 0 0 0 0 0 0 0Maine 0 0 -- 0 0 0 0 0 0 0 0Massachusetts 0 0 -- 0 0 0 0 0 0 0 0New Hampshire 0 0 -- 0 0 0 0 0 0 0 0Rhode Island 0 0 -- 0 0 0 0 0 0 0 0Vermont 0 0 -- 0 0 0 0 0 0 0 0Middle Atlantic 39 52 -24.6% 0 0 0 0 0 0 39 52New Jersey 14 28 -50.8% 0 0 0 0 0 0 14 28New York 0 0 -- 0 0 0 0 0 0 0 0Pennsylvania NM NM NM 0 0 0 0 0 0 NM NMEast North Central 517 554 -6.8% 387 264 112 256 0 0 18 34Illinois 0 0 -- 0 0 0 0 0 0 0 0Indiana 0 0 -- 0 0 0 0 0 0 0 0Michigan 376 288 30.6% 359 253 0 0 0 0 16 34Ohio 113 256 -55.8% 0 0 112 256 0 0 1 0Wisconsin 28 11 154.2% 28 11 0 0 0 0 0 0West North Central 32 18 81.3% 0 0 0 0 4 3 28 15Iowa 32 18 81.3% 0 0 0 0 4 3 28 15Kansas 0 0 -- 0 0 0 0 0 0 0 0Minnesota 0 0 -- 0 0 0 0 0 0 0 0Missouri 0 0 -- 0 0 0 0 0 0 0 0Nebraska 0 0 -- 0 0 0 0 0 0 0 0North Dakota 0 0 -- 0 0 0 0 0 0 0 0South Dakota 0 0 -- 0 0 0 0 0 0 0 0South Atlantic 542 255 112.6% 473 220 0 0 0 0 69 NMDelaware 0 0 -- 0 0 0 0 0 0 0 0District of Columbia 0 0 -- 0 0 0 0 0 0 0 0Florida 473 220 114.5% 473 220 0 0 0 0 0 0Georgia 69 NM NM 0 0 0 0 0 0 69 NMMaryland 0 0 -- 0 0 0 0 0 0 0 0North Carolina 0 0 -- 0 0 0 0 0 0 0 0South Carolina 0 0 -- 0 0 0 0 0 0 0 0Virginia 0 0 -- 0 0 0 0 0 0 0 0West Virginia 0 0 -- 0 0 0 0 0 0 0 0East South Central 0 250 -100.0% 0 250 0 0 0 0 0 0Alabama 0 0 -- 0 0 0 0 0 0 0 0Kentucky 0 250 -100.0% 0 250 0 0 0 0 0 0Mississippi 0 0 -- 0 0 0 0 0 0 0 0Tennessee 0 0 -- 0 0 0 0 0 0 0 0West South Central 1,521 1,447 5.1% 1,453 1,343 0 0 0 0 69 104Arkansas 0 0 -- 0 0 0 0 0 0 0 0Louisiana 1,501 1,415 6.1% 1,453 1,343 0 0 0 0 48 72Oklahoma 0 0 -- 0 0 0 0 0 0 0 0Texas 21 33 -37.3% 0 0 0 0 0 0 21 33Mountain 156 140 12.0% 0 0 156 140 0 0 0 0Arizona 0 0 -- 0 0 0 0 0 0 0 0Colorado 0 0 -- 0 0 0 0 0 0 0 0Idaho 0 0 -- 0 0 0 0 0 0 0 0Montana 156 140 12.0% 0 0 156 140 0 0 0 0Nevada 0 0 -- 0 0 0 0 0 0 0 0New Mexico 0 0 -- 0 0 0 0 0 0 0 0Utah 0 0 -- 0 0 0 0 0 0 0 0Wyoming 0 0 -- 0 0 0 0 0 0 0 0Pacific Contiguous 0 0 -- 0 0 0 0 0 0 0 0California 0 0 -- 0 0 0 0 0 0 0 0Oregon 0 0 -- 0 0 0 0 0 0 0 0Washington 0 0 -- 0 0 0 0 0 0 0 0Pacific Noncontiguous 0 0 -- 0 0 0 0 0 0 0 0Alaska 0 0 -- 0 0 0 0 0 0 0 0Hawaii 0 0 -- 0 0 0 0 0 0 0 0U.S. Total 2,808 2,716 3.4% 2,313 2,078 268 395 4 3 223 240
Table 1.6.B. Utility Scale Facility Net Generation from Petroleum Coke
by State, by Sector, Year-to-Date through April 2018 and 2017 (Thousand Megawatthours)All Sectors Electric Power Sector Commercial Sector Industrial Sector
Displayed values of zero may represent small values that round to zero. The Excel version of this table provides additional precision which may be accessed by selecting individual cells.NM = Not meaningful due to large relative standard error or excessive percentage change.Notes: See Glossary for definitions. Values are preliminary. See Technical Notes for a discussion of the sample design for the Form EIA-923.Negative generation denotes that electric power consumed for plant use exceeds gross generation.Totals may not equal sum of components because of independent rounding. Percentage change is calculated before rounding.Source: U.S. Energy Information Administration, Form EIA-923, Power Plant Operations Report.
Electric UtilitiesIndependent
Power Producers
Generation at Utility Scale FacilitiesGeneration at Utility Scale
FacilitiesGeneration at Utility Scale
FacilitiesGeneration at Utility Scale
FacilitiesGeneration at Utility Scale
Facilities
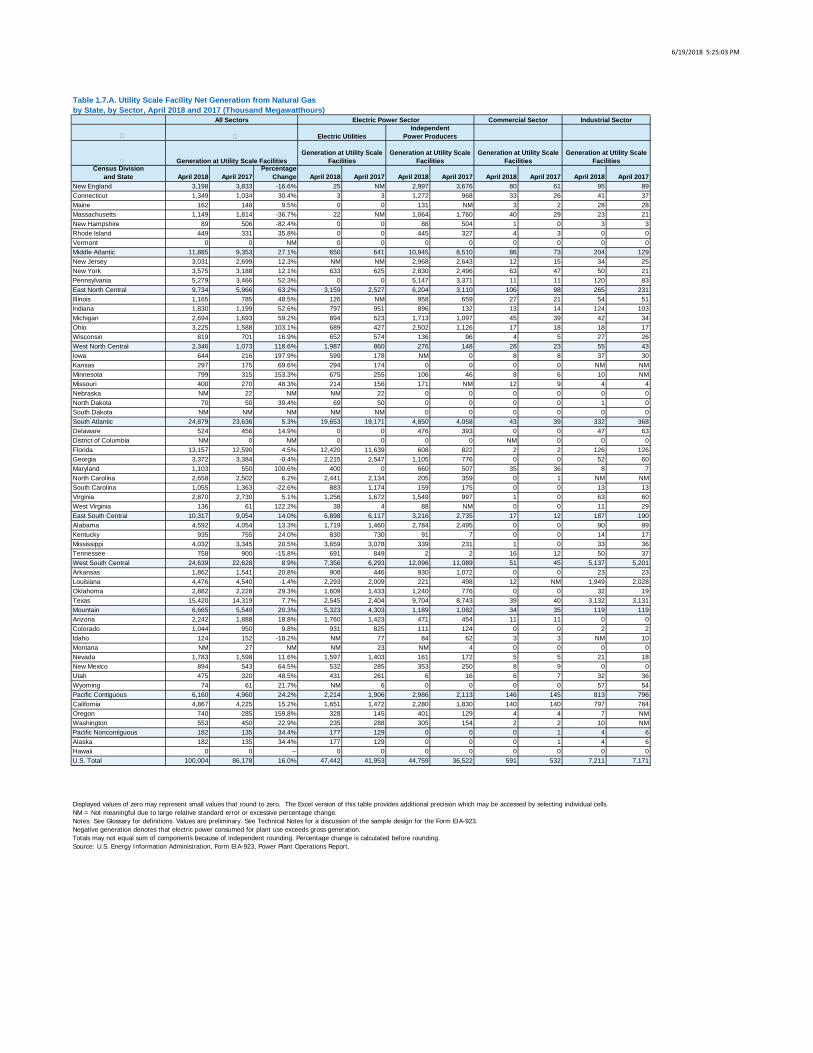
6/19/2018 5:25:03 PM
Census Divisionand State April 2018 April 2017
PercentageChange April 2018 April 2017 April 2018 April 2017 April 2018 April 2017 April 2018 April 2017
New England 3,198 3,833 -16.6% 25 NM 2,997 3,676 80 61 95 89Connecticut 1,349 1,034 30.4% 3 3 1,272 968 33 26 41 37Maine 162 148 9.5% 0 0 131 NM 3 2 28 28Massachusetts 1,149 1,814 -36.7% 22 NM 1,064 1,760 40 29 23 21New Hampshire 89 506 -82.4% 0 0 86 504 1 0 3 3Rhode Island 449 331 35.8% 0 0 445 327 4 3 0 0Vermont 0 0 NM 0 0 0 0 0 0 0 0Middle Atlantic 11,885 9,353 27.1% 650 641 10,945 8,510 86 73 204 129New Jersey 3,031 2,699 12.3% NM NM 2,968 2,643 12 15 34 25New York 3,575 3,188 12.1% 633 625 2,830 2,496 63 47 50 21Pennsylvania 5,279 3,466 52.3% 0 0 5,147 3,371 11 11 120 83East North Central 9,734 5,966 63.2% 3,159 2,527 6,204 3,110 106 98 265 231Illinois 1,165 785 48.5% 126 NM 958 659 27 21 54 51Indiana 1,830 1,199 52.6% 797 951 896 132 13 14 124 103Michigan 2,694 1,693 59.2% 894 523 1,713 1,097 45 39 42 34Ohio 3,225 1,588 103.1% 689 427 2,502 1,126 17 18 18 17Wisconsin 819 701 16.9% 652 574 136 96 4 5 27 26West North Central 2,346 1,073 118.6% 1,987 860 276 148 28 23 55 43Iowa 644 216 197.9% 599 178 NM 0 8 8 37 30Kansas 297 175 69.6% 294 174 0 0 0 0 NM NMMinnesota 799 315 153.3% 675 255 106 46 8 6 10 NMMissouri 400 270 48.3% 214 156 171 NM 12 9 4 4Nebraska NM 22 NM NM 22 0 0 0 0 0 0North Dakota 70 50 39.4% 69 50 0 0 0 0 1 0South Dakota NM NM NM NM NM 0 0 0 0 0 0South Atlantic 24,879 23,636 5.3% 19,653 19,171 4,850 4,058 43 39 332 368Delaware 524 456 14.9% 0 0 476 393 0 0 47 63District of Columbia NM 0 NM 0 0 0 0 NM 0 0 0Florida 13,157 12,590 4.5% 12,420 11,639 608 822 2 2 126 126Georgia 3,372 3,384 -0.4% 2,215 2,547 1,105 776 0 0 52 60Maryland 1,103 550 100.6% 400 0 660 507 35 36 8 7North Carolina 2,658 2,502 6.2% 2,441 2,134 205 359 0 1 NM NMSouth Carolina 1,055 1,363 -22.6% 883 1,174 159 175 0 0 13 13Virginia 2,870 2,730 5.1% 1,256 1,672 1,549 997 1 0 63 60West Virginia 136 61 122.2% 38 4 88 NM 0 0 11 29East South Central 10,317 9,054 14.0% 6,898 6,117 3,216 2,735 17 12 187 190Alabama 4,592 4,054 13.3% 1,719 1,460 2,784 2,495 0 0 90 99Kentucky 935 755 24.0% 830 730 91 7 0 0 14 17Mississippi 4,032 3,345 20.5% 3,659 3,078 339 231 1 0 33 36Tennessee 758 900 -15.8% 691 849 2 2 16 12 50 37West South Central 24,639 22,628 8.9% 7,356 6,293 12,096 11,089 51 45 5,137 5,201Arkansas 1,862 1,541 20.8% 908 446 930 1,072 0 0 23 23Louisiana 4,476 4,540 -1.4% 2,293 2,009 221 498 12 NM 1,949 2,028Oklahoma 2,882 2,228 29.3% 1,609 1,433 1,240 776 0 0 32 19Texas 15,420 14,319 7.7% 2,545 2,404 9,704 8,743 39 40 3,132 3,131Mountain 6,665 5,540 20.3% 5,323 4,303 1,189 1,082 34 35 119 119Arizona 2,242 1,888 18.8% 1,760 1,423 471 454 11 11 0 0Colorado 1,044 950 9.8% 931 825 111 124 0 0 2 2Idaho 124 152 -18.2% NM 77 84 62 3 3 NM 10Montana NM 27 NM NM 23 NM 4 0 0 0 0Nevada 1,783 1,598 11.6% 1,597 1,403 161 172 5 5 21 18New Mexico 894 543 64.5% 532 285 353 250 8 9 0 0Utah 475 320 48.5% 431 261 6 16 6 7 32 36Wyoming 74 61 21.7% NM 6 0 0 0 0 57 54Pacific Contiguous 6,160 4,960 24.2% 2,214 1,906 2,986 2,113 146 145 813 796California 4,867 4,225 15.2% 1,651 1,472 2,280 1,830 140 140 797 784Oregon 740 285 159.8% 328 145 401 129 4 4 7 NMWashington 553 450 22.9% 235 288 305 154 2 2 10 NMPacific Noncontiguous 182 135 34.4% 177 129 0 0 0 1 4 6Alaska 182 135 34.4% 177 129 0 0 0 1 4 6Hawaii 0 0 -- 0 0 0 0 0 0 0 0U.S. Total 100,004 86,178 16.0% 47,442 41,953 44,759 36,522 591 532 7,211 7,171
Table 1.7.A. Utility Scale Facility Net Generation from Natural Gasby State, by Sector, April 2018 and 2017 (Thousand Megawatthours)
All Sectors Electric Power Sector Commercial Sector Industrial Sector
Displayed values of zero may represent small values that round to zero. The Excel version of this table provides additional precision which may be accessed by selecting individual cells.NM = Not meaningful due to large relative standard error or excessive percentage change.Notes: See Glossary for definitions. Values are preliminary. See Technical Notes for a discussion of the sample design for the Form EIA-923.Negative generation denotes that electric power consumed for plant use exceeds gross generation.Totals may not equal sum of components because of independent rounding. Percentage change is calculated before rounding.Source: U.S. Energy Information Administration, Form EIA-923, Power Plant Operations Report.
Electric UtilitiesIndependent
Power Producers
Generation at Utility Scale FacilitiesGeneration at Utility Scale
FacilitiesGeneration at Utility Scale
FacilitiesGeneration at Utility Scale
FacilitiesGeneration at Utility Scale
Facilities
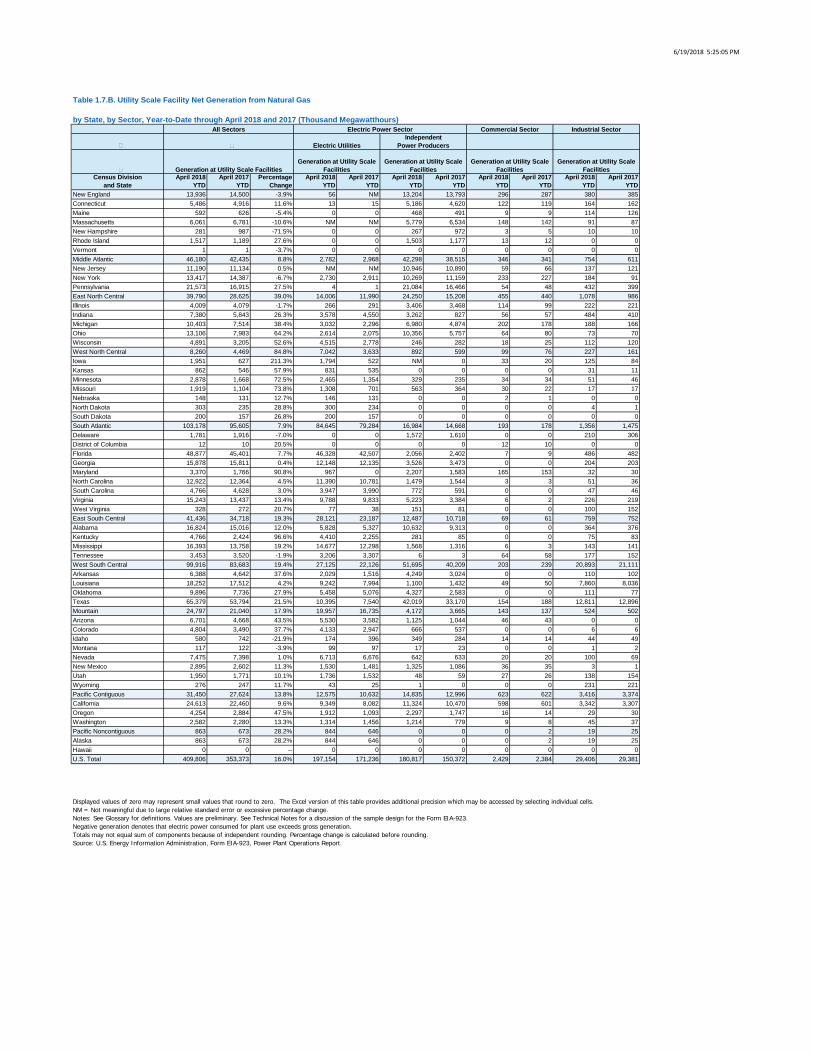
6/19/2018 5:25:05 PM
Census Divisionand State
April 2018 YTD
April 2017 YTD
PercentageChange
April 2018 YTD
April 2017 YTD
April 2018 YTD
April 2017 YTD
April 2018 YTD
April 2017 YTD
April 2018 YTD
April 2017 YTD
New England 13,936 14,500 -3.9% 56 NM 13,204 13,793 296 287 380 385Connecticut 5,486 4,916 11.6% 13 15 5,186 4,620 122 119 164 162Maine 592 626 -5.4% 0 0 468 491 9 9 114 126Massachusetts 6,061 6,781 -10.6% NM NM 5,779 6,534 148 142 91 87New Hampshire 281 987 -71.5% 0 0 267 972 3 5 10 10Rhode Island 1,517 1,189 27.6% 0 0 1,503 1,177 13 12 0 0Vermont 1 1 -3.7% 0 0 0 0 0 0 0 0Middle Atlantic 46,180 42,435 8.8% 2,782 2,968 42,298 38,515 346 341 754 611New Jersey 11,190 11,134 0.5% NM NM 10,946 10,890 59 66 137 121New York 13,417 14,387 -6.7% 2,730 2,911 10,269 11,159 233 227 184 91Pennsylvania 21,573 16,915 27.5% 4 1 21,084 16,466 54 48 432 399East North Central 39,790 28,625 39.0% 14,006 11,990 24,250 15,208 455 440 1,078 986Illinois 4,009 4,079 -1.7% 266 291 3,406 3,468 114 99 222 221Indiana 7,380 5,843 26.3% 3,578 4,550 3,262 827 56 57 484 410Michigan 10,403 7,514 38.4% 3,032 2,296 6,980 4,874 202 178 188 166Ohio 13,106 7,983 64.2% 2,614 2,075 10,356 5,757 64 80 73 70Wisconsin 4,891 3,205 52.6% 4,515 2,778 246 282 18 25 112 120West North Central 8,260 4,469 84.8% 7,042 3,633 892 599 99 76 227 161Iowa 1,951 627 211.3% 1,794 522 NM 0 33 20 125 84Kansas 862 546 57.9% 831 535 0 0 0 0 31 11Minnesota 2,878 1,668 72.5% 2,465 1,354 329 235 34 34 51 46Missouri 1,919 1,104 73.8% 1,308 701 563 364 30 22 17 17Nebraska 148 131 12.7% 146 131 0 0 2 1 0 0North Dakota 303 235 28.8% 300 234 0 0 0 0 4 1South Dakota 200 157 26.8% 200 157 0 0 0 0 0 0South Atlantic 103,178 95,605 7.9% 84,645 79,284 16,984 14,668 193 178 1,356 1,475Delaware 1,781 1,916 -7.0% 0 0 1,572 1,610 0 0 210 306District of Columbia 12 10 20.5% 0 0 0 0 12 10 0 0Florida 48,877 45,401 7.7% 46,328 42,507 2,056 2,402 7 9 486 482Georgia 15,878 15,811 0.4% 12,148 12,135 3,526 3,473 0 0 204 203Maryland 3,370 1,766 90.8% 967 0 2,207 1,583 165 153 32 30North Carolina 12,922 12,364 4.5% 11,390 10,781 1,479 1,544 3 3 51 36South Carolina 4,766 4,628 3.0% 3,947 3,990 772 591 0 0 47 46Virginia 15,243 13,437 13.4% 9,788 9,833 5,223 3,384 6 2 226 219West Virginia 328 272 20.7% 77 38 151 81 0 0 100 152East South Central 41,436 34,718 19.3% 28,121 23,187 12,487 10,718 69 61 759 752Alabama 16,824 15,016 12.0% 5,828 5,327 10,632 9,313 0 0 364 376Kentucky 4,766 2,424 96.6% 4,410 2,255 281 85 0 0 75 83Mississippi 16,393 13,758 19.2% 14,677 12,298 1,568 1,316 6 3 143 141Tennessee 3,453 3,520 -1.9% 3,206 3,307 6 3 64 58 177 152West South Central 99,916 83,683 19.4% 27,125 22,126 51,695 40,209 203 239 20,893 21,111Arkansas 6,388 4,642 37.6% 2,029 1,516 4,249 3,024 0 0 110 102Louisiana 18,252 17,512 4.2% 9,242 7,994 1,100 1,432 49 50 7,860 8,036Oklahoma 9,896 7,736 27.9% 5,458 5,076 4,327 2,583 0 0 111 77Texas 65,379 53,794 21.5% 10,395 7,540 42,019 33,170 154 188 12,811 12,896Mountain 24,797 21,040 17.9% 19,957 16,735 4,172 3,665 143 137 524 502Arizona 6,701 4,668 43.5% 5,530 3,582 1,125 1,044 46 43 0 0Colorado 4,804 3,490 37.7% 4,133 2,947 666 537 0 0 6 6Idaho 580 742 -21.9% 174 396 349 284 14 14 44 49Montana 117 122 -3.9% 99 97 17 23 0 0 1 2Nevada 7,475 7,398 1.0% 6,713 6,676 642 633 20 20 100 69New Mexico 2,895 2,602 11.3% 1,530 1,481 1,325 1,086 36 35 3 1Utah 1,950 1,771 10.1% 1,736 1,532 48 59 27 26 138 154Wyoming 276 247 11.7% 43 25 1 0 0 0 231 221Pacific Contiguous 31,450 27,624 13.8% 12,575 10,632 14,835 12,996 623 622 3,416 3,374California 24,613 22,460 9.6% 9,349 8,082 11,324 10,470 598 601 3,342 3,307Oregon 4,254 2,884 47.5% 1,912 1,093 2,297 1,747 16 14 29 30Washington 2,582 2,280 13.3% 1,314 1,456 1,214 779 9 8 45 37Pacific Noncontiguous 863 673 28.2% 844 646 0 0 0 2 19 25Alaska 863 673 28.2% 844 646 0 0 0 2 19 25Hawaii 0 0 -- 0 0 0 0 0 0 0 0U.S. Total 409,806 353,373 16.0% 197,154 171,236 180,817 150,372 2,429 2,384 29,406 29,381
Table 1.7.B. Utility Scale Facility Net Generation from Natural Gas
by State, by Sector, Year-to-Date through April 2018 and 2017 (Thousand Megawatthours)All Sectors Electric Power Sector Commercial Sector Industrial Sector
Displayed values of zero may represent small values that round to zero. The Excel version of this table provides additional precision which may be accessed by selecting individual cells.NM = Not meaningful due to large relative standard error or excessive percentage change.Notes: See Glossary for definitions. Values are preliminary. See Technical Notes for a discussion of the sample design for the Form EIA-923.Negative generation denotes that electric power consumed for plant use exceeds gross generation.Totals may not equal sum of components because of independent rounding. Percentage change is calculated before rounding.Source: U.S. Energy Information Administration, Form EIA-923, Power Plant Operations Report.
Electric UtilitiesIndependent
Power Producers
Generation at Utility Scale FacilitiesGeneration at Utility Scale
FacilitiesGeneration at Utility Scale
FacilitiesGeneration at Utility Scale
FacilitiesGeneration at Utility Scale
Facilities
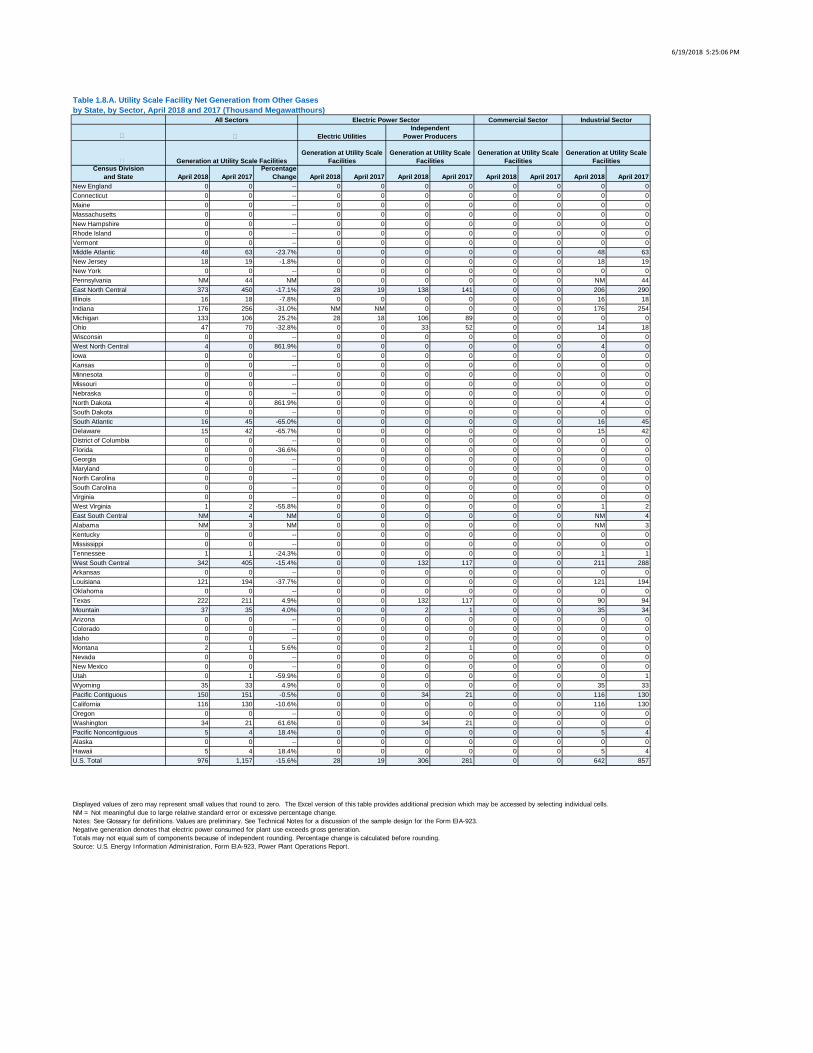
6/19/2018 5:25:06 PM
Census Divisionand State April 2018 April 2017
PercentageChange April 2018 April 2017 April 2018 April 2017 April 2018 April 2017 April 2018 April 2017
New England 0 0 -- 0 0 0 0 0 0 0 0Connecticut 0 0 -- 0 0 0 0 0 0 0 0Maine 0 0 -- 0 0 0 0 0 0 0 0Massachusetts 0 0 -- 0 0 0 0 0 0 0 0New Hampshire 0 0 -- 0 0 0 0 0 0 0 0Rhode Island 0 0 -- 0 0 0 0 0 0 0 0Vermont 0 0 -- 0 0 0 0 0 0 0 0Middle Atlantic 48 63 -23.7% 0 0 0 0 0 0 48 63New Jersey 18 19 -1.8% 0 0 0 0 0 0 18 19New York 0 0 -- 0 0 0 0 0 0 0 0Pennsylvania NM 44 NM 0 0 0 0 0 0 NM 44East North Central 373 450 -17.1% 28 19 138 141 0 0 206 290Illinois 16 18 -7.8% 0 0 0 0 0 0 16 18Indiana 176 256 -31.0% NM NM 0 0 0 0 176 254Michigan 133 106 25.2% 28 18 106 89 0 0 0 0Ohio 47 70 -32.8% 0 0 33 52 0 0 14 18Wisconsin 0 0 -- 0 0 0 0 0 0 0 0West North Central 4 0 861.9% 0 0 0 0 0 0 4 0Iowa 0 0 -- 0 0 0 0 0 0 0 0Kansas 0 0 -- 0 0 0 0 0 0 0 0Minnesota 0 0 -- 0 0 0 0 0 0 0 0Missouri 0 0 -- 0 0 0 0 0 0 0 0Nebraska 0 0 -- 0 0 0 0 0 0 0 0North Dakota 4 0 861.9% 0 0 0 0 0 0 4 0South Dakota 0 0 -- 0 0 0 0 0 0 0 0South Atlantic 16 45 -65.0% 0 0 0 0 0 0 16 45Delaware 15 42 -65.7% 0 0 0 0 0 0 15 42District of Columbia 0 0 -- 0 0 0 0 0 0 0 0Florida 0 0 -36.6% 0 0 0 0 0 0 0 0Georgia 0 0 -- 0 0 0 0 0 0 0 0Maryland 0 0 -- 0 0 0 0 0 0 0 0North Carolina 0 0 -- 0 0 0 0 0 0 0 0South Carolina 0 0 -- 0 0 0 0 0 0 0 0Virginia 0 0 -- 0 0 0 0 0 0 0 0West Virginia 1 2 -55.8% 0 0 0 0 0 0 1 2East South Central NM 4 NM 0 0 0 0 0 0 NM 4Alabama NM 3 NM 0 0 0 0 0 0 NM 3Kentucky 0 0 -- 0 0 0 0 0 0 0 0Mississippi 0 0 -- 0 0 0 0 0 0 0 0Tennessee 1 1 -24.3% 0 0 0 0 0 0 1 1West South Central 342 405 -15.4% 0 0 132 117 0 0 211 288Arkansas 0 0 -- 0 0 0 0 0 0 0 0Louisiana 121 194 -37.7% 0 0 0 0 0 0 121 194Oklahoma 0 0 -- 0 0 0 0 0 0 0 0Texas 222 211 4.9% 0 0 132 117 0 0 90 94Mountain 37 35 4.0% 0 0 2 1 0 0 35 34Arizona 0 0 -- 0 0 0 0 0 0 0 0Colorado 0 0 -- 0 0 0 0 0 0 0 0Idaho 0 0 -- 0 0 0 0 0 0 0 0Montana 2 1 5.6% 0 0 2 1 0 0 0 0Nevada 0 0 -- 0 0 0 0 0 0 0 0New Mexico 0 0 -- 0 0 0 0 0 0 0 0Utah 0 1 -59.9% 0 0 0 0 0 0 0 1Wyoming 35 33 4.9% 0 0 0 0 0 0 35 33Pacific Contiguous 150 151 -0.5% 0 0 34 21 0 0 116 130California 116 130 -10.6% 0 0 0 0 0 0 116 130Oregon 0 0 -- 0 0 0 0 0 0 0 0Washington 34 21 61.6% 0 0 34 21 0 0 0 0Pacific Noncontiguous 5 4 18.4% 0 0 0 0 0 0 5 4Alaska 0 0 -- 0 0 0 0 0 0 0 0Hawaii 5 4 18.4% 0 0 0 0 0 0 5 4U.S. Total 976 1,157 -15.6% 28 19 306 281 0 0 642 857
Table 1.8.A. Utility Scale Facility Net Generation from Other Gasesby State, by Sector, April 2018 and 2017 (Thousand Megawatthours)
All Sectors Electric Power Sector Commercial Sector Industrial Sector
Displayed values of zero may represent small values that round to zero. The Excel version of this table provides additional precision which may be accessed by selecting individual cells.NM = Not meaningful due to large relative standard error or excessive percentage change.Notes: See Glossary for definitions. Values are preliminary. See Technical Notes for a discussion of the sample design for the Form EIA-923.Negative generation denotes that electric power consumed for plant use exceeds gross generation.Totals may not equal sum of components because of independent rounding. Percentage change is calculated before rounding.Source: U.S. Energy Information Administration, Form EIA-923, Power Plant Operations Report.
Electric UtilitiesIndependent
Power Producers
Generation at Utility Scale FacilitiesGeneration at Utility Scale
FacilitiesGeneration at Utility Scale
FacilitiesGeneration at Utility Scale
FacilitiesGeneration at Utility Scale
Facilities

6/19/2018 5:25:08 PM
Census Divisionand State
April 2018 YTD
April 2017 YTD
PercentageChange
April 2018 YTD
April 2017 YTD
April 2018 YTD
April 2017 YTD
April 2018 YTD
April 2017 YTD
April 2018 YTD
April 2017 YTD
New England 0 0 -- 0 0 0 0 0 0 0 0Connecticut 0 0 -- 0 0 0 0 0 0 0 0Maine 0 0 -- 0 0 0 0 0 0 0 0Massachusetts 0 0 -- 0 0 0 0 0 0 0 0New Hampshire 0 0 -- 0 0 0 0 0 0 0 0Rhode Island 0 0 -- 0 0 0 0 0 0 0 0Vermont 0 0 -- 0 0 0 0 0 0 0 0Middle Atlantic 245 281 -12.7% 0 0 0 0 0 0 245 281New Jersey 75 75 -0.1% 0 0 0 0 0 0 75 75New York 0 0 -- 0 0 0 0 0 0 0 0Pennsylvania 170 205 -17.3% 0 0 0 0 0 0 170 205East North Central 1,713 1,980 -13.5% 90 70 665 730 0 0 958 1,181Illinois 52 65 -20.7% 0 0 0 0 0 0 52 65Indiana 870 1,056 -17.7% NM NM 0 0 0 0 866 1,051Michigan 572 560 2.1% 87 64 485 496 0 0 0 0Ohio 219 299 -26.5% 0 0 180 234 0 0 39 65Wisconsin 0 0 -- 0 0 0 0 0 0 0 0West North Central 16 13 28.9% 0 0 0 0 0 0 16 13Iowa 0 0 -- 0 0 0 0 0 0 0 0Kansas 0 0 -- 0 0 0 0 0 0 0 0Minnesota 0 0 -- 0 0 0 0 0 0 0 0Missouri 0 0 -- 0 0 0 0 0 0 0 0Nebraska 0 0 -- 0 0 0 0 0 0 0 0North Dakota 16 13 28.9% 0 0 0 0 0 0 16 13South Dakota 0 0 -- 0 0 0 0 0 0 0 0South Atlantic 72 177 -59.5% 0 0 0 0 0 0 72 177Delaware 64 166 -61.7% 0 0 0 0 0 0 64 166District of Columbia 0 0 -- 0 0 0 0 0 0 0 0Florida 1 2 -23.8% 0 0 0 0 0 0 1 2Georgia 0 0 -- 0 0 0 0 0 0 0 0Maryland 0 0 -- 0 0 0 0 0 0 0 0North Carolina 0 0 -- 0 0 0 0 0 0 0 0South Carolina 0 0 -- 0 0 0 0 0 0 0 0Virginia 0 0 -- 0 0 0 0 0 0 0 0West Virginia 7 9 -26.5% 0 0 0 0 0 0 7 9East South Central 5 13 -63.6% 0 0 0 0 0 0 5 13Alabama NM 8 NM 0 0 0 0 0 0 NM 8Kentucky 0 0 -- 0 0 0 0 0 0 0 0Mississippi 0 0 -- 0 0 0 0 0 0 0 0Tennessee 2 4 -44.5% 0 0 0 0 0 0 2 4West South Central 1,469 1,572 -6.6% 0 0 453 451 0 0 1,016 1,121Arkansas 0 0 -- 0 0 0 0 0 0 0 0Louisiana 643 737 -12.7% 0 0 0 0 0 0 643 737Oklahoma 0 0 -- 0 0 0 0 0 0 0 0Texas 825 835 -1.1% 0 0 453 451 0 0 372 384Mountain 145 146 -0.6% 0 0 4 5 0 0 141 141Arizona 0 0 -- 0 0 0 0 0 0 0 0Colorado 0 0 -- 0 0 0 0 0 0 0 0Idaho 0 0 -- 0 0 0 0 0 0 0 0Montana 4 5 -20.7% 0 0 4 5 0 0 0 0Nevada 0 0 -- 0 0 0 0 0 0 0 0New Mexico 0 0 -- 0 0 0 0 0 0 0 0Utah 0 5 -96.0% 0 0 0 0 0 0 0 5Wyoming 141 135 4.1% 0 0 0 0 0 0 141 135Pacific Contiguous 641 528 21.4% 0 0 135 103 0 0 505 424California 505 424 19.1% 0 0 0 0 0 0 505 424Oregon 0 0 -- 0 0 0 0 0 0 0 0Washington 135 103 31.0% 0 0 135 103 0 0 0 0Pacific Noncontiguous 16 16 0.1% 0 0 0 0 0 0 16 16Alaska 0 0 -- 0 0 0 0 0 0 0 0Hawaii 16 16 0.1% 0 0 0 0 0 0 16 16U.S. Total 4,322 4,725 -8.5% 90 70 1,258 1,290 0 0 2,974 3,366
Table 1.8.B. Utility Scale Facility Net Generation from Other Gases
by State, by Sector, Year-to-Date through April 2018 and 2017 (Thousand Megawatthours)All Sectors Electric Power Sector Commercial Sector Industrial Sector
Displayed values of zero may represent small values that round to zero. The Excel version of this table provides additional precision which may be accessed by selecting individual cells.NM = Not meaningful due to large relative standard error or excessive percentage change.Notes: See Glossary for definitions. Values are preliminary. See Technical Notes for a discussion of the sample design for the Form EIA-923.Negative generation denotes that electric power consumed for plant use exceeds gross generation.Totals may not equal sum of components because of independent rounding. Percentage change is calculated before rounding.Source: U.S. Energy Information Administration, Form EIA-923, Power Plant Operations Report.
Electric UtilitiesIndependent
Power Producers
Generation at Utility Scale FacilitiesGeneration at Utility Scale
FacilitiesGeneration at Utility Scale
FacilitiesGeneration at Utility Scale
FacilitiesGeneration at Utility Scale
Facilities
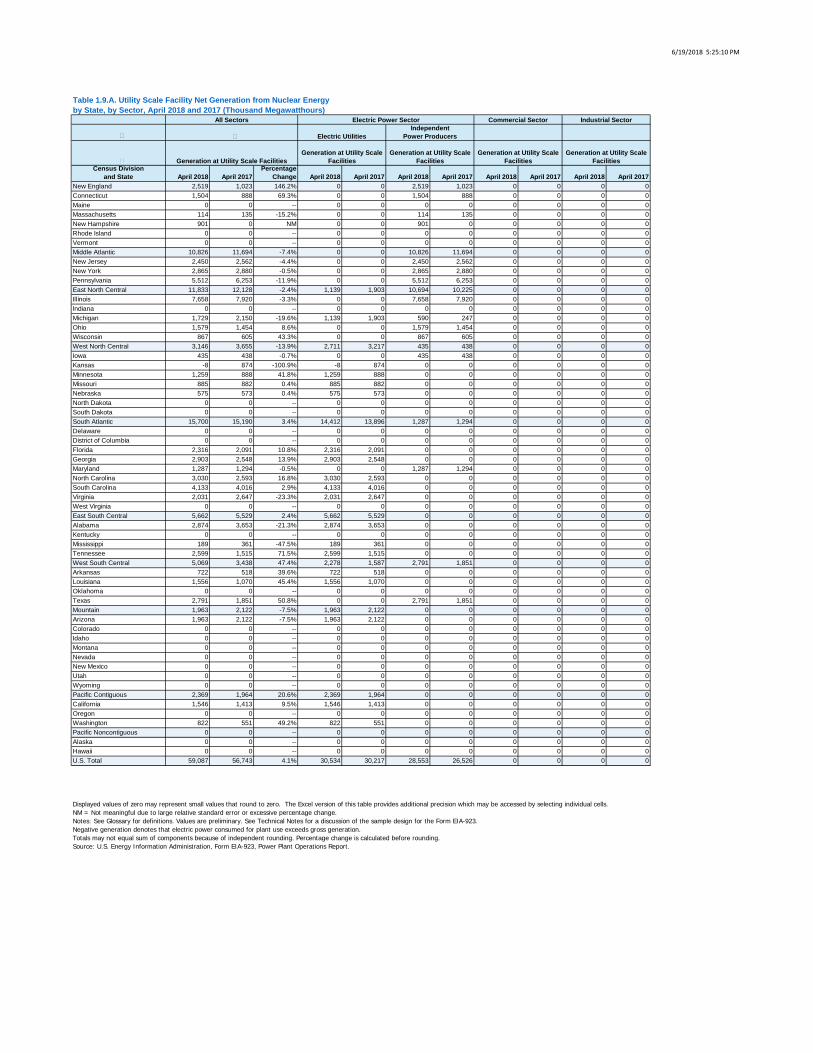
6/19/2018 5:25:10 PM
Census Divisionand State April 2018 April 2017
PercentageChange April 2018 April 2017 April 2018 April 2017 April 2018 April 2017 April 2018 April 2017
New England 2,519 1,023 146.2% 0 0 2,519 1,023 0 0 0 0Connecticut 1,504 888 69.3% 0 0 1,504 888 0 0 0 0Maine 0 0 -- 0 0 0 0 0 0 0 0Massachusetts 114 135 -15.2% 0 0 114 135 0 0 0 0New Hampshire 901 0 NM 0 0 901 0 0 0 0 0Rhode Island 0 0 -- 0 0 0 0 0 0 0 0Vermont 0 0 -- 0 0 0 0 0 0 0 0Middle Atlantic 10,826 11,694 -7.4% 0 0 10,826 11,694 0 0 0 0New Jersey 2,450 2,562 -4.4% 0 0 2,450 2,562 0 0 0 0New York 2,865 2,880 -0.5% 0 0 2,865 2,880 0 0 0 0Pennsylvania 5,512 6,253 -11.9% 0 0 5,512 6,253 0 0 0 0East North Central 11,833 12,128 -2.4% 1,139 1,903 10,694 10,225 0 0 0 0Illinois 7,658 7,920 -3.3% 0 0 7,658 7,920 0 0 0 0Indiana 0 0 -- 0 0 0 0 0 0 0 0Michigan 1,729 2,150 -19.6% 1,139 1,903 590 247 0 0 0 0Ohio 1,579 1,454 8.6% 0 0 1,579 1,454 0 0 0 0Wisconsin 867 605 43.3% 0 0 867 605 0 0 0 0West North Central 3,146 3,655 -13.9% 2,711 3,217 435 438 0 0 0 0Iowa 435 438 -0.7% 0 0 435 438 0 0 0 0Kansas -8 874 -100.9% -8 874 0 0 0 0 0 0Minnesota 1,259 888 41.8% 1,259 888 0 0 0 0 0 0Missouri 885 882 0.4% 885 882 0 0 0 0 0 0Nebraska 575 573 0.4% 575 573 0 0 0 0 0 0North Dakota 0 0 -- 0 0 0 0 0 0 0 0South Dakota 0 0 -- 0 0 0 0 0 0 0 0South Atlantic 15,700 15,190 3.4% 14,412 13,896 1,287 1,294 0 0 0 0Delaware 0 0 -- 0 0 0 0 0 0 0 0District of Columbia 0 0 -- 0 0 0 0 0 0 0 0Florida 2,316 2,091 10.8% 2,316 2,091 0 0 0 0 0 0Georgia 2,903 2,548 13.9% 2,903 2,548 0 0 0 0 0 0Maryland 1,287 1,294 -0.5% 0 0 1,287 1,294 0 0 0 0North Carolina 3,030 2,593 16.8% 3,030 2,593 0 0 0 0 0 0South Carolina 4,133 4,016 2.9% 4,133 4,016 0 0 0 0 0 0Virginia 2,031 2,647 -23.3% 2,031 2,647 0 0 0 0 0 0West Virginia 0 0 -- 0 0 0 0 0 0 0 0East South Central 5,662 5,529 2.4% 5,662 5,529 0 0 0 0 0 0Alabama 2,874 3,653 -21.3% 2,874 3,653 0 0 0 0 0 0Kentucky 0 0 -- 0 0 0 0 0 0 0 0Mississippi 189 361 -47.5% 189 361 0 0 0 0 0 0Tennessee 2,599 1,515 71.5% 2,599 1,515 0 0 0 0 0 0West South Central 5,069 3,438 47.4% 2,278 1,587 2,791 1,851 0 0 0 0Arkansas 722 518 39.6% 722 518 0 0 0 0 0 0Louisiana 1,556 1,070 45.4% 1,556 1,070 0 0 0 0 0 0Oklahoma 0 0 -- 0 0 0 0 0 0 0 0Texas 2,791 1,851 50.8% 0 0 2,791 1,851 0 0 0 0Mountain 1,963 2,122 -7.5% 1,963 2,122 0 0 0 0 0 0Arizona 1,963 2,122 -7.5% 1,963 2,122 0 0 0 0 0 0Colorado 0 0 -- 0 0 0 0 0 0 0 0Idaho 0 0 -- 0 0 0 0 0 0 0 0Montana 0 0 -- 0 0 0 0 0 0 0 0Nevada 0 0 -- 0 0 0 0 0 0 0 0New Mexico 0 0 -- 0 0 0 0 0 0 0 0Utah 0 0 -- 0 0 0 0 0 0 0 0Wyoming 0 0 -- 0 0 0 0 0 0 0 0Pacific Contiguous 2,369 1,964 20.6% 2,369 1,964 0 0 0 0 0 0California 1,546 1,413 9.5% 1,546 1,413 0 0 0 0 0 0Oregon 0 0 -- 0 0 0 0 0 0 0 0Washington 822 551 49.2% 822 551 0 0 0 0 0 0Pacific Noncontiguous 0 0 -- 0 0 0 0 0 0 0 0Alaska 0 0 -- 0 0 0 0 0 0 0 0Hawaii 0 0 -- 0 0 0 0 0 0 0 0U.S. Total 59,087 56,743 4.1% 30,534 30,217 28,553 26,526 0 0 0 0
Table 1.9.A. Utility Scale Facility Net Generation from Nuclear Energyby State, by Sector, April 2018 and 2017 (Thousand Megawatthours)
All Sectors Electric Power Sector Commercial Sector Industrial Sector
Displayed values of zero may represent small values that round to zero. The Excel version of this table provides additional precision which may be accessed by selecting individual cells.NM = Not meaningful due to large relative standard error or excessive percentage change.Notes: See Glossary for definitions. Values are preliminary. See Technical Notes for a discussion of the sample design for the Form EIA-923.Negative generation denotes that electric power consumed for plant use exceeds gross generation.Totals may not equal sum of components because of independent rounding. Percentage change is calculated before rounding.Source: U.S. Energy Information Administration, Form EIA-923, Power Plant Operations Report.
Electric UtilitiesIndependent
Power Producers
Generation at Utility Scale FacilitiesGeneration at Utility Scale
FacilitiesGeneration at Utility Scale
FacilitiesGeneration at Utility Scale
FacilitiesGeneration at Utility Scale
Facilities
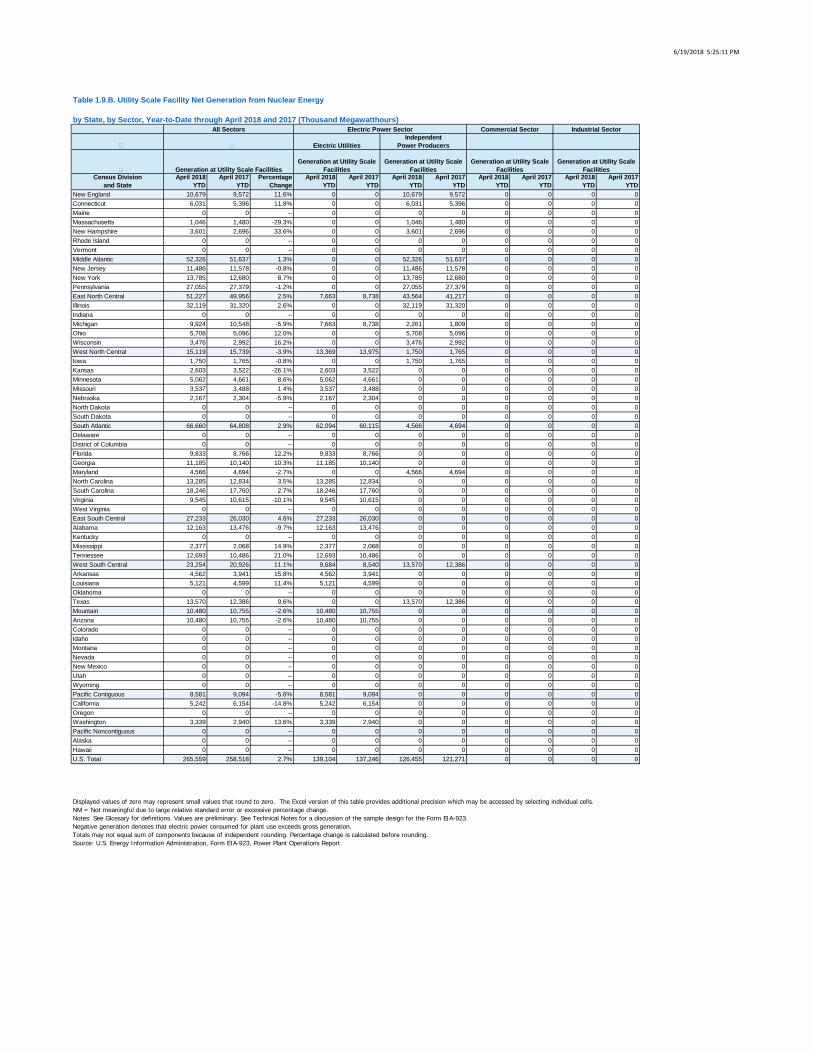
6/19/2018 5:25:11 PM
Census Divisionand State
April 2018 YTD
April 2017 YTD
PercentageChange
April 2018 YTD
April 2017 YTD
April 2018 YTD
April 2017 YTD
April 2018 YTD
April 2017 YTD
April 2018 YTD
April 2017 YTD
New England 10,679 9,572 11.6% 0 0 10,679 9,572 0 0 0 0Connecticut 6,031 5,396 11.8% 0 0 6,031 5,396 0 0 0 0Maine 0 0 -- 0 0 0 0 0 0 0 0Massachusetts 1,046 1,480 -29.3% 0 0 1,046 1,480 0 0 0 0New Hampshire 3,601 2,696 33.6% 0 0 3,601 2,696 0 0 0 0Rhode Island 0 0 -- 0 0 0 0 0 0 0 0Vermont 0 0 -- 0 0 0 0 0 0 0 0Middle Atlantic 52,326 51,637 1.3% 0 0 52,326 51,637 0 0 0 0New Jersey 11,486 11,578 -0.8% 0 0 11,486 11,578 0 0 0 0New York 13,785 12,680 8.7% 0 0 13,785 12,680 0 0 0 0Pennsylvania 27,055 27,379 -1.2% 0 0 27,055 27,379 0 0 0 0East North Central 51,227 49,956 2.5% 7,663 8,738 43,564 41,217 0 0 0 0Illinois 32,119 31,320 2.6% 0 0 32,119 31,320 0 0 0 0Indiana 0 0 -- 0 0 0 0 0 0 0 0Michigan 9,924 10,548 -5.9% 7,663 8,738 2,261 1,809 0 0 0 0Ohio 5,708 5,096 12.0% 0 0 5,708 5,096 0 0 0 0Wisconsin 3,476 2,992 16.2% 0 0 3,476 2,992 0 0 0 0West North Central 15,119 15,739 -3.9% 13,369 13,975 1,750 1,765 0 0 0 0Iowa 1,750 1,765 -0.8% 0 0 1,750 1,765 0 0 0 0Kansas 2,603 3,522 -26.1% 2,603 3,522 0 0 0 0 0 0Minnesota 5,062 4,661 8.6% 5,062 4,661 0 0 0 0 0 0Missouri 3,537 3,488 1.4% 3,537 3,488 0 0 0 0 0 0Nebraska 2,167 2,304 -5.9% 2,167 2,304 0 0 0 0 0 0North Dakota 0 0 -- 0 0 0 0 0 0 0 0South Dakota 0 0 -- 0 0 0 0 0 0 0 0South Atlantic 66,660 64,808 2.9% 62,094 60,115 4,566 4,694 0 0 0 0Delaware 0 0 -- 0 0 0 0 0 0 0 0District of Columbia 0 0 -- 0 0 0 0 0 0 0 0Florida 9,833 8,766 12.2% 9,833 8,766 0 0 0 0 0 0Georgia 11,185 10,140 10.3% 11,185 10,140 0 0 0 0 0 0Maryland 4,566 4,694 -2.7% 0 0 4,566 4,694 0 0 0 0North Carolina 13,285 12,834 3.5% 13,285 12,834 0 0 0 0 0 0South Carolina 18,246 17,760 2.7% 18,246 17,760 0 0 0 0 0 0Virginia 9,545 10,615 -10.1% 9,545 10,615 0 0 0 0 0 0West Virginia 0 0 -- 0 0 0 0 0 0 0 0East South Central 27,233 26,030 4.6% 27,233 26,030 0 0 0 0 0 0Alabama 12,163 13,476 -9.7% 12,163 13,476 0 0 0 0 0 0Kentucky 0 0 -- 0 0 0 0 0 0 0 0Mississippi 2,377 2,068 14.9% 2,377 2,068 0 0 0 0 0 0Tennessee 12,693 10,486 21.0% 12,693 10,486 0 0 0 0 0 0West South Central 23,254 20,926 11.1% 9,684 8,540 13,570 12,386 0 0 0 0Arkansas 4,562 3,941 15.8% 4,562 3,941 0 0 0 0 0 0Louisiana 5,121 4,599 11.4% 5,121 4,599 0 0 0 0 0 0Oklahoma 0 0 -- 0 0 0 0 0 0 0 0Texas 13,570 12,386 9.6% 0 0 13,570 12,386 0 0 0 0Mountain 10,480 10,755 -2.6% 10,480 10,755 0 0 0 0 0 0Arizona 10,480 10,755 -2.6% 10,480 10,755 0 0 0 0 0 0Colorado 0 0 -- 0 0 0 0 0 0 0 0Idaho 0 0 -- 0 0 0 0 0 0 0 0Montana 0 0 -- 0 0 0 0 0 0 0 0Nevada 0 0 -- 0 0 0 0 0 0 0 0New Mexico 0 0 -- 0 0 0 0 0 0 0 0Utah 0 0 -- 0 0 0 0 0 0 0 0Wyoming 0 0 -- 0 0 0 0 0 0 0 0Pacific Contiguous 8,581 9,094 -5.6% 8,581 9,094 0 0 0 0 0 0California 5,242 6,154 -14.8% 5,242 6,154 0 0 0 0 0 0Oregon 0 0 -- 0 0 0 0 0 0 0 0Washington 3,339 2,940 13.6% 3,339 2,940 0 0 0 0 0 0Pacific Noncontiguous 0 0 -- 0 0 0 0 0 0 0 0Alaska 0 0 -- 0 0 0 0 0 0 0 0Hawaii 0 0 -- 0 0 0 0 0 0 0 0U.S. Total 265,559 258,518 2.7% 139,104 137,246 126,455 121,271 0 0 0 0
Table 1.9.B. Utility Scale Facility Net Generation from Nuclear Energy
by State, by Sector, Year-to-Date through April 2018 and 2017 (Thousand Megawatthours)All Sectors Electric Power Sector Commercial Sector Industrial Sector
Displayed values of zero may represent small values that round to zero. The Excel version of this table provides additional precision which may be accessed by selecting individual cells.NM = Not meaningful due to large relative standard error or excessive percentage change.Notes: See Glossary for definitions. Values are preliminary. See Technical Notes for a discussion of the sample design for the Form EIA-923.Negative generation denotes that electric power consumed for plant use exceeds gross generation.Totals may not equal sum of components because of independent rounding. Percentage change is calculated before rounding.Source: U.S. Energy Information Administration, Form EIA-923, Power Plant Operations Report.
Electric UtilitiesIndependent
Power Producers
Generation at Utility Scale FacilitiesGeneration at Utility Scale
FacilitiesGeneration at Utility Scale
FacilitiesGeneration at Utility Scale
FacilitiesGeneration at Utility Scale
Facilities
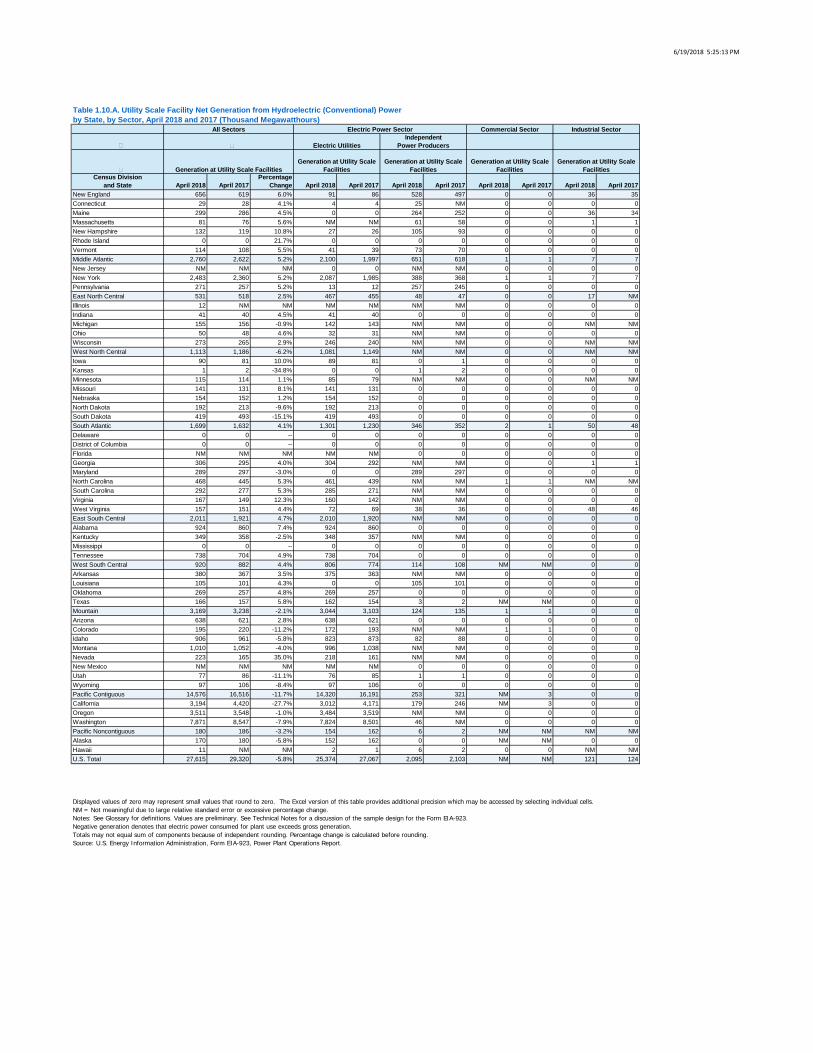
6/19/2018 5:25:13 PM
Census Divisionand State April 2018 April 2017
PercentageChange April 2018 April 2017 April 2018 April 2017 April 2018 April 2017 April 2018 April 2017
New England 656 619 6.0% 91 86 528 497 0 0 36 35Connecticut 29 28 4.1% 4 4 25 NM 0 0 0 0Maine 299 286 4.5% 0 0 264 252 0 0 36 34Massachusetts 81 76 5.6% NM NM 61 58 0 0 1 1New Hampshire 132 119 10.8% 27 26 105 93 0 0 0 0Rhode Island 0 0 21.7% 0 0 0 0 0 0 0 0Vermont 114 108 5.5% 41 39 73 70 0 0 0 0Middle Atlantic 2,760 2,622 5.2% 2,100 1,997 651 618 1 1 7 7New Jersey NM NM NM 0 0 NM NM 0 0 0 0New York 2,483 2,360 5.2% 2,087 1,985 388 368 1 1 7 7Pennsylvania 271 257 5.2% 13 12 257 245 0 0 0 0East North Central 531 518 2.5% 467 455 48 47 0 0 17 NMIllinois 12 NM NM NM NM NM NM 0 0 0 0Indiana 41 40 4.5% 41 40 0 0 0 0 0 0Michigan 155 156 -0.9% 142 143 NM NM 0 0 NM NMOhio 50 48 4.6% 32 31 NM NM 0 0 0 0Wisconsin 273 265 2.9% 246 240 NM NM 0 0 NM NMWest North Central 1,113 1,186 -6.2% 1,081 1,149 NM NM 0 0 NM NMIowa 90 81 10.0% 89 81 0 1 0 0 0 0Kansas 1 2 -34.8% 0 0 1 2 0 0 0 0Minnesota 115 114 1.1% 85 79 NM NM 0 0 NM NMMissouri 141 131 8.1% 141 131 0 0 0 0 0 0Nebraska 154 152 1.2% 154 152 0 0 0 0 0 0North Dakota 192 213 -9.6% 192 213 0 0 0 0 0 0South Dakota 419 493 -15.1% 419 493 0 0 0 0 0 0South Atlantic 1,699 1,632 4.1% 1,301 1,230 346 352 2 1 50 48Delaware 0 0 -- 0 0 0 0 0 0 0 0District of Columbia 0 0 -- 0 0 0 0 0 0 0 0Florida NM NM NM NM NM 0 0 0 0 0 0Georgia 306 295 4.0% 304 292 NM NM 0 0 1 1Maryland 289 297 -3.0% 0 0 289 297 0 0 0 0North Carolina 468 445 5.3% 461 439 NM NM 1 1 NM NMSouth Carolina 292 277 5.3% 285 271 NM NM 0 0 0 0Virginia 167 149 12.3% 160 142 NM NM 0 0 0 0West Virginia 157 151 4.4% 72 69 38 36 0 0 48 46East South Central 2,011 1,921 4.7% 2,010 1,920 NM NM 0 0 0 0Alabama 924 860 7.4% 924 860 0 0 0 0 0 0Kentucky 349 358 -2.5% 348 357 NM NM 0 0 0 0Mississippi 0 0 -- 0 0 0 0 0 0 0 0Tennessee 738 704 4.9% 738 704 0 0 0 0 0 0West South Central 920 882 4.4% 806 774 114 108 NM NM 0 0Arkansas 380 367 3.5% 375 363 NM NM 0 0 0 0Louisiana 105 101 4.3% 0 0 105 101 0 0 0 0Oklahoma 269 257 4.8% 269 257 0 0 0 0 0 0Texas 166 157 5.8% 162 154 3 2 NM NM 0 0Mountain 3,169 3,238 -2.1% 3,044 3,103 124 135 1 1 0 0Arizona 638 621 2.8% 638 621 0 0 0 0 0 0Colorado 195 220 -11.2% 172 193 NM NM 1 1 0 0Idaho 906 961 -5.8% 823 873 82 88 0 0 0 0Montana 1,010 1,052 -4.0% 996 1,038 NM NM 0 0 0 0Nevada 223 165 35.0% 218 161 NM NM 0 0 0 0New Mexico NM NM NM NM NM 0 0 0 0 0 0Utah 77 86 -11.1% 76 85 1 1 0 0 0 0Wyoming 97 106 -8.4% 97 106 0 0 0 0 0 0Pacific Contiguous 14,576 16,516 -11.7% 14,320 16,191 253 321 NM 3 0 0California 3,194 4,420 -27.7% 3,012 4,171 179 246 NM 3 0 0Oregon 3,511 3,548 -1.0% 3,484 3,519 NM NM 0 0 0 0Washington 7,871 8,547 -7.9% 7,824 8,501 46 NM 0 0 0 0Pacific Noncontiguous 180 186 -3.2% 154 162 6 2 NM NM NM NMAlaska 170 180 -5.8% 152 162 0 0 NM NM 0 0Hawaii 11 NM NM 2 1 6 2 0 0 NM NMU.S. Total 27,615 29,320 -5.8% 25,374 27,067 2,095 2,103 NM NM 121 124
Table 1.10.A. Utility Scale Facility Net Generation from Hydroelectric (Conventional) Powerby State, by Sector, April 2018 and 2017 (Thousand Megawatthours)
All Sectors Electric Power Sector Commercial Sector Industrial Sector
Displayed values of zero may represent small values that round to zero. The Excel version of this table provides additional precision which may be accessed by selecting individual cells.NM = Not meaningful due to large relative standard error or excessive percentage change.Notes: See Glossary for definitions. Values are preliminary. See Technical Notes for a discussion of the sample design for the Form EIA-923.Negative generation denotes that electric power consumed for plant use exceeds gross generation.Totals may not equal sum of components because of independent rounding. Percentage change is calculated before rounding.Source: U.S. Energy Information Administration, Form EIA-923, Power Plant Operations Report.
Electric UtilitiesIndependent
Power Producers
Generation at Utility Scale FacilitiesGeneration at Utility Scale
FacilitiesGeneration at Utility Scale
FacilitiesGeneration at Utility Scale
FacilitiesGeneration at Utility Scale
Facilities
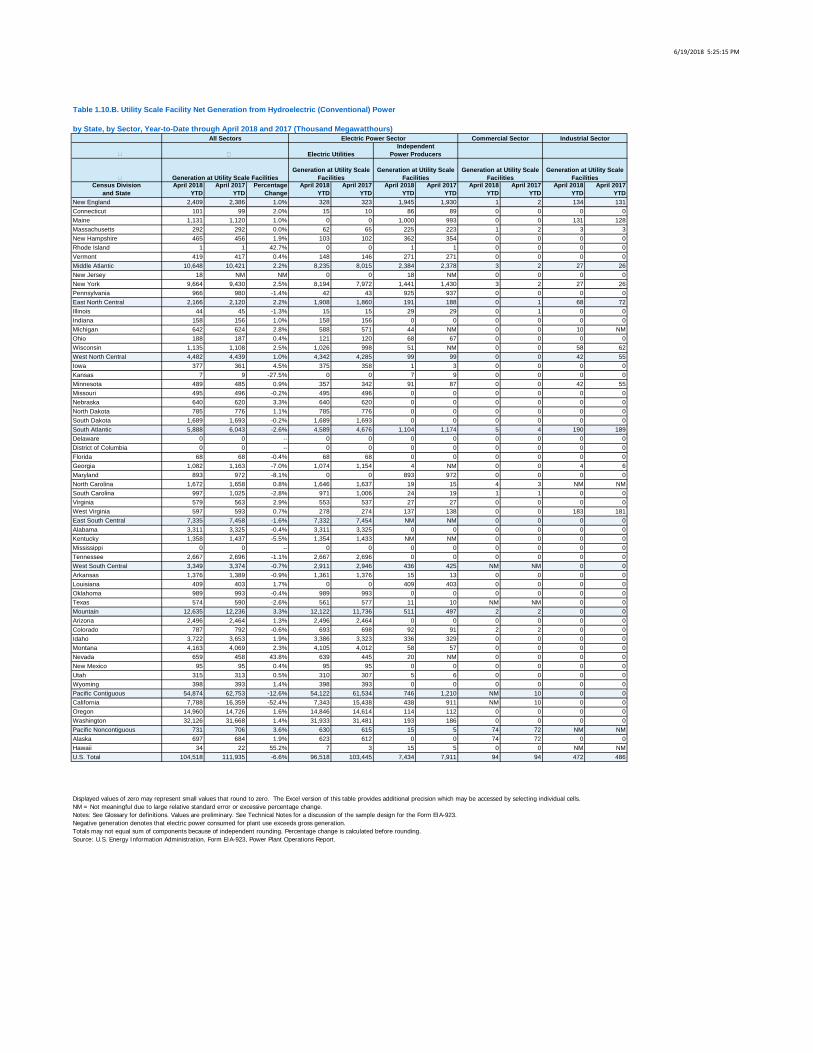
6/19/2018 5:25:15 PM
Census Divisionand State
April 2018 YTD
April 2017 YTD
PercentageChange
April 2018 YTD
April 2017 YTD
April 2018 YTD
April 2017 YTD
April 2018 YTD
April 2017 YTD
April 2018 YTD
April 2017 YTD
New England 2,409 2,386 1.0% 328 323 1,945 1,930 1 2 134 131Connecticut 101 99 2.0% 15 10 86 89 0 0 0 0Maine 1,131 1,120 1.0% 0 0 1,000 993 0 0 131 128Massachusetts 292 292 0.0% 62 65 225 223 1 2 3 3New Hampshire 465 456 1.9% 103 102 362 354 0 0 0 0Rhode Island 1 1 42.7% 0 0 1 1 0 0 0 0Vermont 419 417 0.4% 148 146 271 271 0 0 0 0Middle Atlantic 10,648 10,421 2.2% 8,235 8,015 2,384 2,378 3 2 27 26New Jersey 18 NM NM 0 0 18 NM 0 0 0 0New York 9,664 9,430 2.5% 8,194 7,972 1,441 1,430 3 2 27 26Pennsylvania 966 980 -1.4% 42 43 925 937 0 0 0 0East North Central 2,166 2,120 2.2% 1,908 1,860 191 188 0 1 68 72Illinois 44 45 -1.3% 15 15 29 29 0 1 0 0Indiana 158 156 1.0% 158 156 0 0 0 0 0 0Michigan 642 624 2.8% 588 571 44 NM 0 0 10 NMOhio 188 187 0.4% 121 120 68 67 0 0 0 0Wisconsin 1,135 1,108 2.5% 1,026 998 51 NM 0 0 58 62West North Central 4,482 4,439 1.0% 4,342 4,285 99 99 0 0 42 55Iowa 377 361 4.5% 375 358 1 3 0 0 0 0Kansas 7 9 -27.5% 0 0 7 9 0 0 0 0Minnesota 489 485 0.9% 357 342 91 87 0 0 42 55Missouri 495 496 -0.2% 495 496 0 0 0 0 0 0Nebraska 640 620 3.3% 640 620 0 0 0 0 0 0North Dakota 785 776 1.1% 785 776 0 0 0 0 0 0South Dakota 1,689 1,693 -0.2% 1,689 1,693 0 0 0 0 0 0South Atlantic 5,888 6,043 -2.6% 4,589 4,676 1,104 1,174 5 4 190 189Delaware 0 0 -- 0 0 0 0 0 0 0 0District of Columbia 0 0 -- 0 0 0 0 0 0 0 0Florida 68 68 -0.4% 68 68 0 0 0 0 0 0Georgia 1,082 1,163 -7.0% 1,074 1,154 4 NM 0 0 4 6Maryland 893 972 -8.1% 0 0 893 972 0 0 0 0North Carolina 1,672 1,658 0.8% 1,646 1,637 19 15 4 3 NM NMSouth Carolina 997 1,025 -2.8% 971 1,006 24 19 1 1 0 0Virginia 579 563 2.9% 553 537 27 27 0 0 0 0West Virginia 597 593 0.7% 278 274 137 138 0 0 183 181East South Central 7,335 7,458 -1.6% 7,332 7,454 NM NM 0 0 0 0Alabama 3,311 3,325 -0.4% 3,311 3,325 0 0 0 0 0 0Kentucky 1,358 1,437 -5.5% 1,354 1,433 NM NM 0 0 0 0Mississippi 0 0 -- 0 0 0 0 0 0 0 0Tennessee 2,667 2,696 -1.1% 2,667 2,696 0 0 0 0 0 0West South Central 3,349 3,374 -0.7% 2,911 2,946 436 425 NM NM 0 0Arkansas 1,376 1,389 -0.9% 1,361 1,376 15 13 0 0 0 0Louisiana 409 403 1.7% 0 0 409 403 0 0 0 0Oklahoma 989 993 -0.4% 989 993 0 0 0 0 0 0Texas 574 590 -2.6% 561 577 11 10 NM NM 0 0Mountain 12,635 12,236 3.3% 12,122 11,736 511 497 2 2 0 0Arizona 2,496 2,464 1.3% 2,496 2,464 0 0 0 0 0 0Colorado 787 792 -0.6% 693 698 92 91 2 2 0 0Idaho 3,722 3,653 1.9% 3,386 3,323 336 329 0 0 0 0Montana 4,163 4,069 2.3% 4,105 4,012 58 57 0 0 0 0Nevada 659 458 43.8% 639 445 20 NM 0 0 0 0New Mexico 95 95 0.4% 95 95 0 0 0 0 0 0Utah 315 313 0.5% 310 307 5 6 0 0 0 0Wyoming 398 393 1.4% 398 393 0 0 0 0 0 0Pacific Contiguous 54,874 62,753 -12.6% 54,122 61,534 746 1,210 NM 10 0 0California 7,788 16,359 -52.4% 7,343 15,438 438 911 NM 10 0 0Oregon 14,960 14,726 1.6% 14,846 14,614 114 112 0 0 0 0Washington 32,126 31,668 1.4% 31,933 31,481 193 186 0 0 0 0Pacific Noncontiguous 731 706 3.6% 630 615 15 5 74 72 NM NMAlaska 697 684 1.9% 623 612 0 0 74 72 0 0Hawaii 34 22 55.2% 7 3 15 5 0 0 NM NMU.S. Total 104,518 111,935 -6.6% 96,518 103,445 7,434 7,911 94 94 472 486
Table 1.10.B. Utility Scale Facility Net Generation from Hydroelectric (Conventional) Power
by State, by Sector, Year-to-Date through April 2018 and 2017 (Thousand Megawatthours)All Sectors Electric Power Sector Commercial Sector Industrial Sector
Displayed values of zero may represent small values that round to zero. The Excel version of this table provides additional precision which may be accessed by selecting individual cells.NM = Not meaningful due to large relative standard error or excessive percentage change.Notes: See Glossary for definitions. Values are preliminary. See Technical Notes for a discussion of the sample design for the Form EIA-923.Negative generation denotes that electric power consumed for plant use exceeds gross generation.Totals may not equal sum of components because of independent rounding. Percentage change is calculated before rounding.Source: U.S. Energy Information Administration, Form EIA-923, Power Plant Operations Report.
Electric UtilitiesIndependent
Power Producers
Generation at Utility Scale FacilitiesGeneration at Utility Scale
FacilitiesGeneration at Utility Scale
FacilitiesGeneration at Utility Scale
FacilitiesGeneration at Utility Scale
Facilities
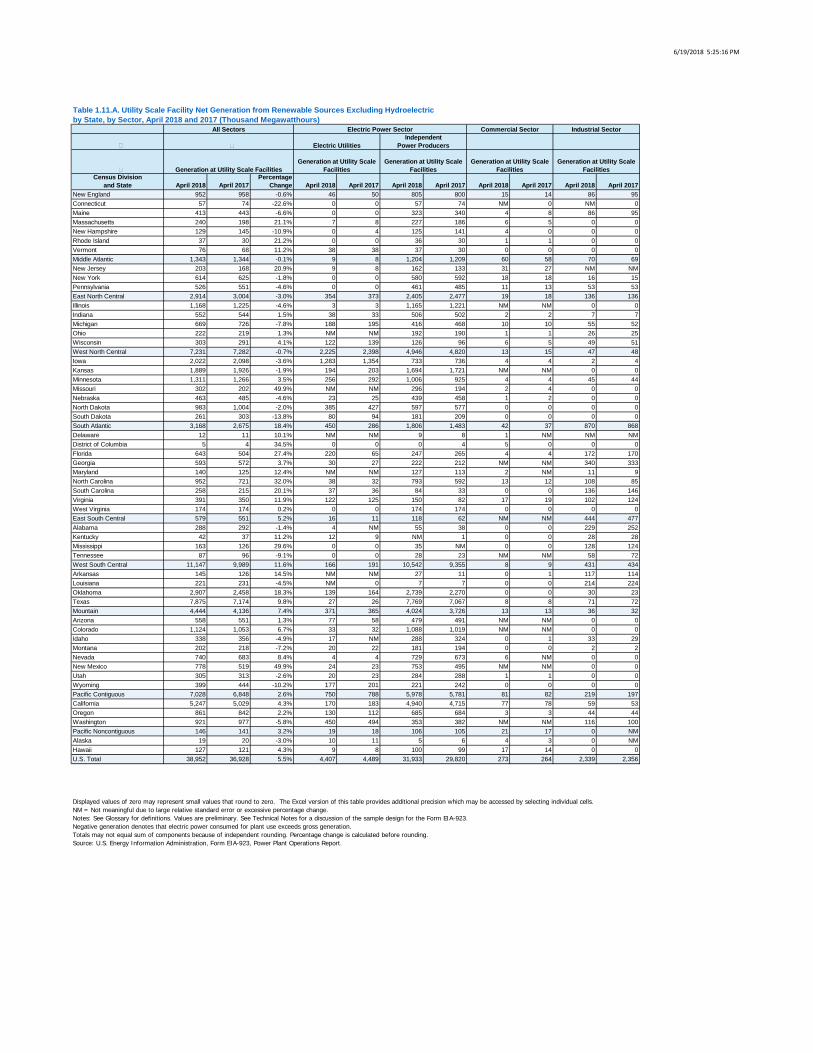
6/19/2018 5:25:16 PM
Census Divisionand State April 2018 April 2017
PercentageChange April 2018 April 2017 April 2018 April 2017 April 2018 April 2017 April 2018 April 2017
New England 952 958 -0.6% 46 50 805 800 15 14 86 95Connecticut 57 74 -22.6% 0 0 57 74 NM 0 NM 0Maine 413 443 -6.6% 0 0 323 340 4 8 86 95Massachusetts 240 198 21.1% 7 8 227 186 6 5 0 0New Hampshire 129 145 -10.9% 0 4 125 141 4 0 0 0Rhode Island 37 30 21.2% 0 0 36 30 1 1 0 0Vermont 76 68 11.2% 38 38 37 30 0 0 0 0Middle Atlantic 1,343 1,344 -0.1% 9 8 1,204 1,209 60 58 70 69New Jersey 203 168 20.9% 9 8 162 133 31 27 NM NMNew York 614 625 -1.8% 0 0 580 592 18 18 16 15Pennsylvania 526 551 -4.6% 0 0 461 485 11 13 53 53East North Central 2,914 3,004 -3.0% 354 373 2,405 2,477 19 18 136 136Illinois 1,168 1,225 -4.6% 3 3 1,165 1,221 NM NM 0 0Indiana 552 544 1.5% 38 33 506 502 2 2 7 7Michigan 669 726 -7.8% 188 195 416 468 10 10 55 52Ohio 222 219 1.3% NM NM 192 190 1 1 26 25Wisconsin 303 291 4.1% 122 139 126 96 6 5 49 51West North Central 7,231 7,282 -0.7% 2,225 2,398 4,946 4,820 13 15 47 48Iowa 2,022 2,098 -3.6% 1,283 1,354 733 736 4 4 2 4Kansas 1,889 1,926 -1.9% 194 203 1,694 1,721 NM NM 0 0Minnesota 1,311 1,266 3.5% 256 292 1,006 925 4 4 45 44Missouri 302 202 49.9% NM NM 296 194 2 4 0 0Nebraska 463 485 -4.6% 23 25 439 458 1 2 0 0North Dakota 983 1,004 -2.0% 385 427 597 577 0 0 0 0South Dakota 261 303 -13.8% 80 94 181 209 0 0 0 0South Atlantic 3,168 2,675 18.4% 450 286 1,806 1,483 42 37 870 868Delaware 12 11 10.1% NM NM 9 8 1 NM NM NMDistrict of Columbia 5 4 34.5% 0 0 0 4 5 0 0 0Florida 643 504 27.4% 220 65 247 265 4 4 172 170Georgia 593 572 3.7% 30 27 222 212 NM NM 340 333Maryland 140 125 12.4% NM NM 127 113 2 NM 11 9North Carolina 952 721 32.0% 38 32 793 592 13 12 108 85South Carolina 258 215 20.1% 37 36 84 33 0 0 136 146Virginia 391 350 11.9% 122 125 150 82 17 19 102 124West Virginia 174 174 0.2% 0 0 174 174 0 0 0 0East South Central 579 551 5.2% 16 11 118 62 NM NM 444 477Alabama 288 292 -1.4% 4 NM 55 38 0 0 229 252Kentucky 42 37 11.2% 12 9 NM 1 0 0 28 28Mississippi 163 126 29.6% 0 0 35 NM 0 0 128 124Tennessee 87 96 -9.1% 0 0 28 23 NM NM 58 72West South Central 11,147 9,989 11.6% 166 191 10,542 9,355 8 9 431 434Arkansas 145 126 14.5% NM NM 27 11 0 1 117 114Louisiana 221 231 -4.5% NM 0 7 7 0 0 214 224Oklahoma 2,907 2,458 18.3% 139 164 2,739 2,270 0 0 30 23Texas 7,875 7,174 9.8% 27 26 7,769 7,067 8 8 71 72Mountain 4,444 4,136 7.4% 371 365 4,024 3,726 13 13 36 32Arizona 558 551 1.3% 77 58 479 491 NM NM 0 0Colorado 1,124 1,053 6.7% 33 32 1,088 1,019 NM NM 0 0Idaho 338 356 -4.9% 17 NM 288 324 0 1 33 29Montana 202 218 -7.2% 20 22 181 194 0 0 2 2Nevada 740 683 8.4% 4 4 729 673 6 NM 0 0New Mexico 778 519 49.9% 24 23 753 495 NM NM 0 0Utah 305 313 -2.6% 20 23 284 288 1 1 0 0Wyoming 399 444 -10.2% 177 201 221 242 0 0 0 0Pacific Contiguous 7,028 6,848 2.6% 750 788 5,978 5,781 81 82 219 197California 5,247 5,029 4.3% 170 183 4,940 4,715 77 78 59 53Oregon 861 842 2.2% 130 112 685 684 3 3 44 44Washington 921 977 -5.8% 450 494 353 382 NM NM 116 100Pacific Noncontiguous 146 141 3.2% 19 18 106 105 21 17 0 NMAlaska 19 20 -3.0% 10 11 5 6 4 3 0 NMHawaii 127 121 4.3% 9 8 100 99 17 14 0 0U.S. Total 38,952 36,928 5.5% 4,407 4,489 31,933 29,820 273 264 2,339 2,356
Table 1.11.A. Utility Scale Facility Net Generation from Renewable Sources Excluding Hydroelectricby State, by Sector, April 2018 and 2017 (Thousand Megawatthours)
All Sectors Electric Power Sector Commercial Sector Industrial Sector
Displayed values of zero may represent small values that round to zero. The Excel version of this table provides additional precision which may be accessed by selecting individual cells.NM = Not meaningful due to large relative standard error or excessive percentage change.Notes: See Glossary for definitions. Values are preliminary. See Technical Notes for a discussion of the sample design for the Form EIA-923.Negative generation denotes that electric power consumed for plant use exceeds gross generation.Totals may not equal sum of components because of independent rounding. Percentage change is calculated before rounding.Source: U.S. Energy Information Administration, Form EIA-923, Power Plant Operations Report.
Electric UtilitiesIndependent
Power Producers
Generation at Utility Scale FacilitiesGeneration at Utility Scale
FacilitiesGeneration at Utility Scale
FacilitiesGeneration at Utility Scale
FacilitiesGeneration at Utility Scale
Facilities
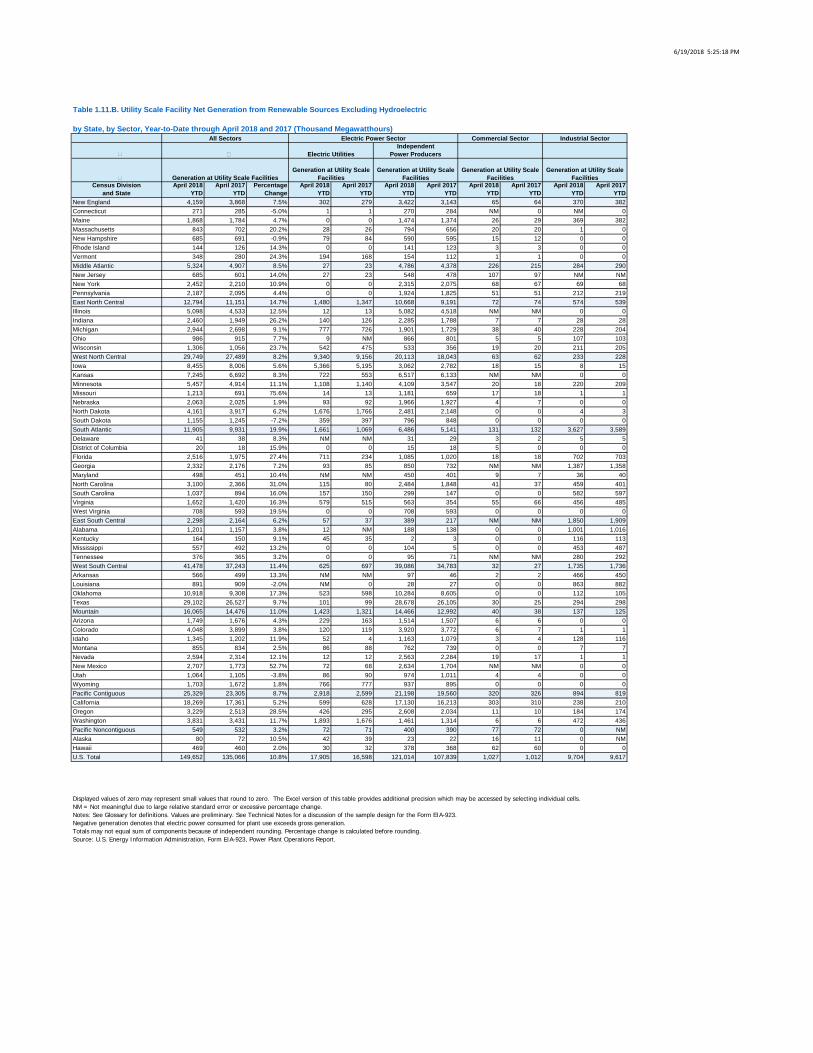
6/19/2018 5:25:18 PM
Census Divisionand State
April 2018 YTD
April 2017 YTD
PercentageChange
April 2018 YTD
April 2017 YTD
April 2018 YTD
April 2017 YTD
April 2018 YTD
April 2017 YTD
April 2018 YTD
April 2017 YTD
New England 4,159 3,868 7.5% 302 279 3,422 3,143 65 64 370 382Connecticut 271 285 -5.0% 1 1 270 284 NM 0 NM 0Maine 1,868 1,784 4.7% 0 0 1,474 1,374 26 29 369 382Massachusetts 843 702 20.2% 28 26 794 656 20 20 1 0New Hampshire 685 691 -0.9% 79 84 590 595 15 12 0 0Rhode Island 144 126 14.3% 0 0 141 123 3 3 0 0Vermont 348 280 24.3% 194 168 154 112 1 1 0 0Middle Atlantic 5,324 4,907 8.5% 27 23 4,786 4,378 226 215 284 290New Jersey 685 601 14.0% 27 23 548 478 107 97 NM NMNew York 2,452 2,210 10.9% 0 0 2,315 2,075 68 67 69 68Pennsylvania 2,187 2,095 4.4% 0 0 1,924 1,825 51 51 212 219East North Central 12,794 11,151 14.7% 1,480 1,347 10,668 9,191 72 74 574 539Illinois 5,098 4,533 12.5% 12 13 5,082 4,518 NM NM 0 0Indiana 2,460 1,949 26.2% 140 126 2,285 1,788 7 7 28 28Michigan 2,944 2,698 9.1% 777 726 1,901 1,729 38 40 228 204Ohio 986 915 7.7% 9 NM 866 801 5 5 107 103Wisconsin 1,306 1,056 23.7% 542 475 533 356 19 20 211 205West North Central 29,749 27,489 8.2% 9,340 9,156 20,113 18,043 63 62 233 228Iowa 8,455 8,006 5.6% 5,366 5,195 3,062 2,782 18 15 8 15Kansas 7,245 6,692 8.3% 722 553 6,517 6,133 NM NM 0 0Minnesota 5,457 4,914 11.1% 1,108 1,140 4,109 3,547 20 18 220 209Missouri 1,213 691 75.6% 14 13 1,181 659 17 18 1 1Nebraska 2,063 2,025 1.9% 93 92 1,966 1,927 4 7 0 0North Dakota 4,161 3,917 6.2% 1,676 1,766 2,481 2,148 0 0 4 3South Dakota 1,155 1,245 -7.2% 359 397 796 848 0 0 0 0South Atlantic 11,905 9,931 19.9% 1,661 1,069 6,486 5,141 131 132 3,627 3,589Delaware 41 38 8.3% NM NM 31 29 3 2 5 5District of Columbia 20 18 15.9% 0 0 15 18 5 0 0 0Florida 2,516 1,975 27.4% 711 234 1,085 1,020 18 18 702 703Georgia 2,332 2,176 7.2% 93 85 850 732 NM NM 1,387 1,358Maryland 498 451 10.4% NM NM 450 401 9 7 36 40North Carolina 3,100 2,366 31.0% 115 80 2,484 1,848 41 37 459 401South Carolina 1,037 894 16.0% 157 150 299 147 0 0 582 597Virginia 1,652 1,420 16.3% 579 515 563 354 55 66 456 485West Virginia 708 593 19.5% 0 0 708 593 0 0 0 0East South Central 2,298 2,164 6.2% 57 37 389 217 NM NM 1,850 1,909Alabama 1,201 1,157 3.8% 12 NM 188 138 0 0 1,001 1,016Kentucky 164 150 9.1% 45 35 2 3 0 0 116 113Mississippi 557 492 13.2% 0 0 104 5 0 0 453 487Tennessee 376 365 3.2% 0 0 95 71 NM NM 280 292West South Central 41,478 37,243 11.4% 625 697 39,086 34,783 32 27 1,735 1,736Arkansas 566 499 13.3% NM NM 97 46 2 2 466 450Louisiana 891 909 -2.0% NM 0 28 27 0 0 863 882Oklahoma 10,918 9,308 17.3% 523 598 10,284 8,605 0 0 112 105Texas 29,102 26,527 9.7% 101 99 28,678 26,105 30 25 294 298Mountain 16,065 14,476 11.0% 1,423 1,321 14,466 12,992 40 38 137 125Arizona 1,749 1,676 4.3% 229 163 1,514 1,507 6 6 0 0Colorado 4,048 3,899 3.8% 120 119 3,920 3,772 6 7 1 1Idaho 1,345 1,202 11.9% 52 4 1,163 1,079 3 4 128 116Montana 855 834 2.5% 86 88 762 739 0 0 7 7Nevada 2,594 2,314 12.1% 12 12 2,563 2,284 19 17 1 1New Mexico 2,707 1,773 52.7% 72 68 2,634 1,704 NM NM 0 0Utah 1,064 1,105 -3.8% 86 90 974 1,011 4 4 0 0Wyoming 1,703 1,672 1.8% 766 777 937 895 0 0 0 0Pacific Contiguous 25,329 23,305 8.7% 2,918 2,599 21,198 19,560 320 326 894 819California 18,269 17,361 5.2% 599 628 17,130 16,213 303 310 238 210Oregon 3,229 2,513 28.5% 426 295 2,608 2,034 11 10 184 174Washington 3,831 3,431 11.7% 1,893 1,676 1,461 1,314 6 6 472 436Pacific Noncontiguous 549 532 3.2% 72 71 400 390 77 72 0 NMAlaska 80 72 10.5% 42 39 23 22 16 11 0 NMHawaii 469 460 2.0% 30 32 378 368 62 60 0 0U.S. Total 149,652 135,066 10.8% 17,905 16,598 121,014 107,839 1,027 1,012 9,704 9,617
Table 1.11.B. Utility Scale Facility Net Generation from Renewable Sources Excluding Hydroelectric
by State, by Sector, Year-to-Date through April 2018 and 2017 (Thousand Megawatthours)All Sectors Electric Power Sector Commercial Sector Industrial Sector
Displayed values of zero may represent small values that round to zero. The Excel version of this table provides additional precision which may be accessed by selecting individual cells.NM = Not meaningful due to large relative standard error or excessive percentage change.Notes: See Glossary for definitions. Values are preliminary. See Technical Notes for a discussion of the sample design for the Form EIA-923.Negative generation denotes that electric power consumed for plant use exceeds gross generation.Totals may not equal sum of components because of independent rounding. Percentage change is calculated before rounding.Source: U.S. Energy Information Administration, Form EIA-923, Power Plant Operations Report.
Electric UtilitiesIndependent
Power Producers
Generation at Utility Scale FacilitiesGeneration at Utility Scale
FacilitiesGeneration at Utility Scale
FacilitiesGeneration at Utility Scale
FacilitiesGeneration at Utility Scale
Facilities
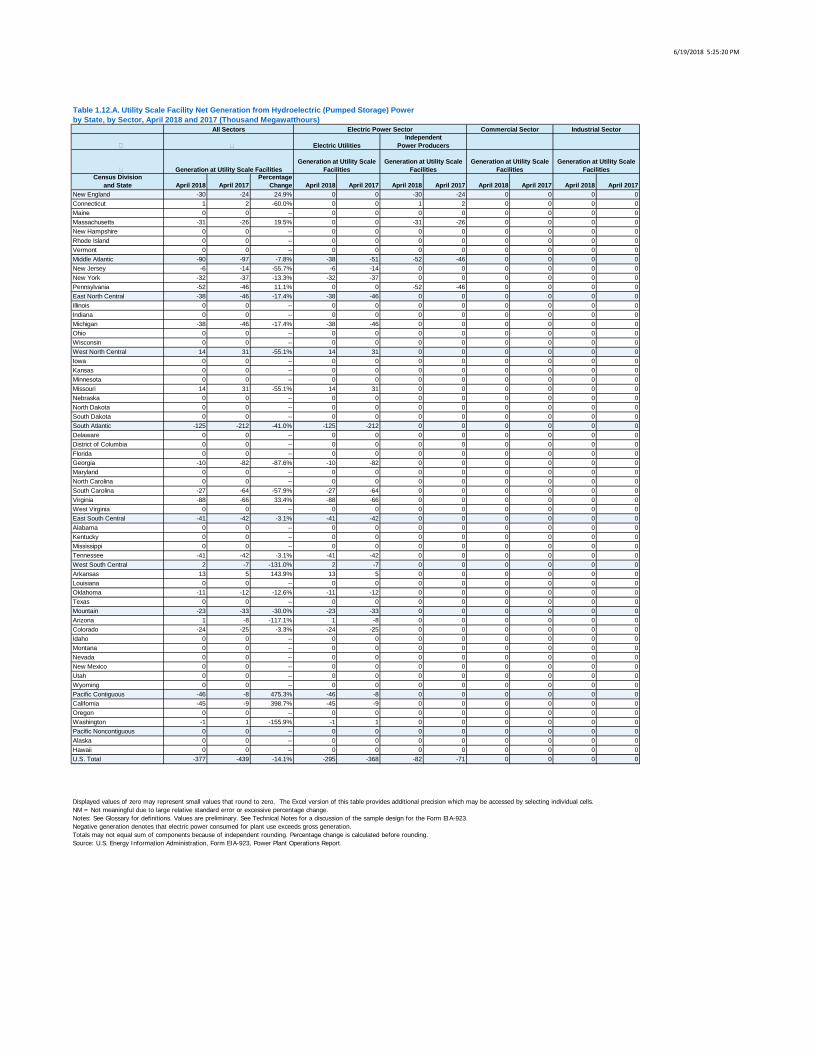
6/19/2018 5:25:20 PM
Census Divisionand State April 2018 April 2017
PercentageChange April 2018 April 2017 April 2018 April 2017 April 2018 April 2017 April 2018 April 2017
New England -30 -24 24.9% 0 0 -30 -24 0 0 0 0Connecticut 1 2 -60.0% 0 0 1 2 0 0 0 0Maine 0 0 -- 0 0 0 0 0 0 0 0Massachusetts -31 -26 19.5% 0 0 -31 -26 0 0 0 0New Hampshire 0 0 -- 0 0 0 0 0 0 0 0Rhode Island 0 0 -- 0 0 0 0 0 0 0 0Vermont 0 0 -- 0 0 0 0 0 0 0 0Middle Atlantic -90 -97 -7.8% -38 -51 -52 -46 0 0 0 0New Jersey -6 -14 -55.7% -6 -14 0 0 0 0 0 0New York -32 -37 -13.3% -32 -37 0 0 0 0 0 0Pennsylvania -52 -46 11.1% 0 0 -52 -46 0 0 0 0East North Central -38 -46 -17.4% -38 -46 0 0 0 0 0 0Illinois 0 0 -- 0 0 0 0 0 0 0 0Indiana 0 0 -- 0 0 0 0 0 0 0 0Michigan -38 -46 -17.4% -38 -46 0 0 0 0 0 0Ohio 0 0 -- 0 0 0 0 0 0 0 0Wisconsin 0 0 -- 0 0 0 0 0 0 0 0West North Central 14 31 -55.1% 14 31 0 0 0 0 0 0Iowa 0 0 -- 0 0 0 0 0 0 0 0Kansas 0 0 -- 0 0 0 0 0 0 0 0Minnesota 0 0 -- 0 0 0 0 0 0 0 0Missouri 14 31 -55.1% 14 31 0 0 0 0 0 0Nebraska 0 0 -- 0 0 0 0 0 0 0 0North Dakota 0 0 -- 0 0 0 0 0 0 0 0South Dakota 0 0 -- 0 0 0 0 0 0 0 0South Atlantic -125 -212 -41.0% -125 -212 0 0 0 0 0 0Delaware 0 0 -- 0 0 0 0 0 0 0 0District of Columbia 0 0 -- 0 0 0 0 0 0 0 0Florida 0 0 -- 0 0 0 0 0 0 0 0Georgia -10 -82 -87.6% -10 -82 0 0 0 0 0 0Maryland 0 0 -- 0 0 0 0 0 0 0 0North Carolina 0 0 -- 0 0 0 0 0 0 0 0South Carolina -27 -64 -57.9% -27 -64 0 0 0 0 0 0Virginia -88 -66 33.4% -88 -66 0 0 0 0 0 0West Virginia 0 0 -- 0 0 0 0 0 0 0 0East South Central -41 -42 -3.1% -41 -42 0 0 0 0 0 0Alabama 0 0 -- 0 0 0 0 0 0 0 0Kentucky 0 0 -- 0 0 0 0 0 0 0 0Mississippi 0 0 -- 0 0 0 0 0 0 0 0Tennessee -41 -42 -3.1% -41 -42 0 0 0 0 0 0West South Central 2 -7 -131.0% 2 -7 0 0 0 0 0 0Arkansas 13 5 143.9% 13 5 0 0 0 0 0 0Louisiana 0 0 -- 0 0 0 0 0 0 0 0Oklahoma -11 -12 -12.6% -11 -12 0 0 0 0 0 0Texas 0 0 -- 0 0 0 0 0 0 0 0Mountain -23 -33 -30.0% -23 -33 0 0 0 0 0 0Arizona 1 -8 -117.1% 1 -8 0 0 0 0 0 0Colorado -24 -25 -3.3% -24 -25 0 0 0 0 0 0Idaho 0 0 -- 0 0 0 0 0 0 0 0Montana 0 0 -- 0 0 0 0 0 0 0 0Nevada 0 0 -- 0 0 0 0 0 0 0 0New Mexico 0 0 -- 0 0 0 0 0 0 0 0Utah 0 0 -- 0 0 0 0 0 0 0 0Wyoming 0 0 -- 0 0 0 0 0 0 0 0Pacific Contiguous -46 -8 475.3% -46 -8 0 0 0 0 0 0California -45 -9 398.7% -45 -9 0 0 0 0 0 0Oregon 0 0 -- 0 0 0 0 0 0 0 0Washington -1 1 -155.9% -1 1 0 0 0 0 0 0Pacific Noncontiguous 0 0 -- 0 0 0 0 0 0 0 0Alaska 0 0 -- 0 0 0 0 0 0 0 0Hawaii 0 0 -- 0 0 0 0 0 0 0 0U.S. Total -377 -439 -14.1% -295 -368 -82 -71 0 0 0 0
Table 1.12.A. Utility Scale Facility Net Generation from Hydroelectric (Pumped Storage) Powerby State, by Sector, April 2018 and 2017 (Thousand Megawatthours)
All Sectors Electric Power Sector Commercial Sector Industrial Sector
Displayed values of zero may represent small values that round to zero. The Excel version of this table provides additional precision which may be accessed by selecting individual cells.NM = Not meaningful due to large relative standard error or excessive percentage change.Notes: See Glossary for definitions. Values are preliminary. See Technical Notes for a discussion of the sample design for the Form EIA-923.Negative generation denotes that electric power consumed for plant use exceeds gross generation.Totals may not equal sum of components because of independent rounding. Percentage change is calculated before rounding.Source: U.S. Energy Information Administration, Form EIA-923, Power Plant Operations Report.
Electric UtilitiesIndependent
Power Producers
Generation at Utility Scale FacilitiesGeneration at Utility Scale
FacilitiesGeneration at Utility Scale
FacilitiesGeneration at Utility Scale
FacilitiesGeneration at Utility Scale
Facilities
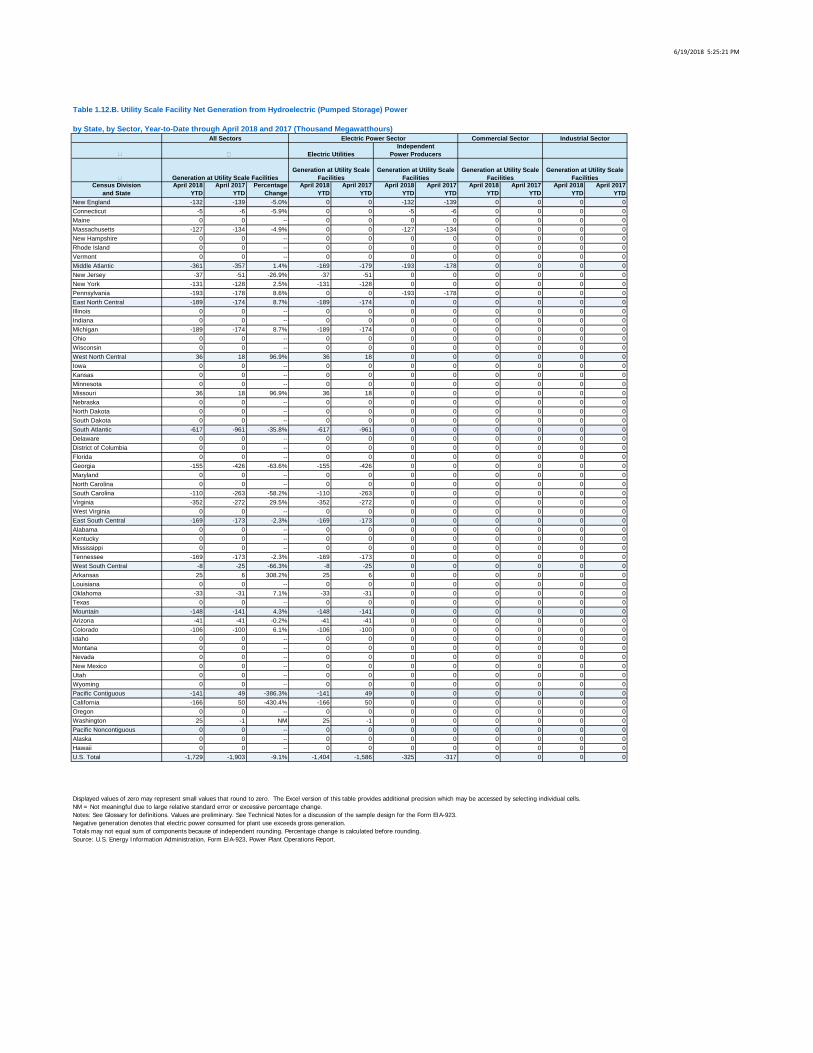
6/19/2018 5:25:21 PM
Census Divisionand State
April 2018 YTD
April 2017 YTD
PercentageChange
April 2018 YTD
April 2017 YTD
April 2018 YTD
April 2017 YTD
April 2018 YTD
April 2017 YTD
April 2018 YTD
April 2017 YTD
New England -132 -139 -5.0% 0 0 -132 -139 0 0 0 0Connecticut -5 -6 -5.9% 0 0 -5 -6 0 0 0 0Maine 0 0 -- 0 0 0 0 0 0 0 0Massachusetts -127 -134 -4.9% 0 0 -127 -134 0 0 0 0New Hampshire 0 0 -- 0 0 0 0 0 0 0 0Rhode Island 0 0 -- 0 0 0 0 0 0 0 0Vermont 0 0 -- 0 0 0 0 0 0 0 0Middle Atlantic -361 -357 1.4% -169 -179 -193 -178 0 0 0 0New Jersey -37 -51 -26.9% -37 -51 0 0 0 0 0 0New York -131 -128 2.5% -131 -128 0 0 0 0 0 0Pennsylvania -193 -178 8.6% 0 0 -193 -178 0 0 0 0East North Central -189 -174 8.7% -189 -174 0 0 0 0 0 0Illinois 0 0 -- 0 0 0 0 0 0 0 0Indiana 0 0 -- 0 0 0 0 0 0 0 0Michigan -189 -174 8.7% -189 -174 0 0 0 0 0 0Ohio 0 0 -- 0 0 0 0 0 0 0 0Wisconsin 0 0 -- 0 0 0 0 0 0 0 0West North Central 36 18 96.9% 36 18 0 0 0 0 0 0Iowa 0 0 -- 0 0 0 0 0 0 0 0Kansas 0 0 -- 0 0 0 0 0 0 0 0Minnesota 0 0 -- 0 0 0 0 0 0 0 0Missouri 36 18 96.9% 36 18 0 0 0 0 0 0Nebraska 0 0 -- 0 0 0 0 0 0 0 0North Dakota 0 0 -- 0 0 0 0 0 0 0 0South Dakota 0 0 -- 0 0 0 0 0 0 0 0South Atlantic -617 -961 -35.8% -617 -961 0 0 0 0 0 0Delaware 0 0 -- 0 0 0 0 0 0 0 0District of Columbia 0 0 -- 0 0 0 0 0 0 0 0Florida 0 0 -- 0 0 0 0 0 0 0 0Georgia -155 -426 -63.6% -155 -426 0 0 0 0 0 0Maryland 0 0 -- 0 0 0 0 0 0 0 0North Carolina 0 0 -- 0 0 0 0 0 0 0 0South Carolina -110 -263 -58.2% -110 -263 0 0 0 0 0 0Virginia -352 -272 29.5% -352 -272 0 0 0 0 0 0West Virginia 0 0 -- 0 0 0 0 0 0 0 0East South Central -169 -173 -2.3% -169 -173 0 0 0 0 0 0Alabama 0 0 -- 0 0 0 0 0 0 0 0Kentucky 0 0 -- 0 0 0 0 0 0 0 0Mississippi 0 0 -- 0 0 0 0 0 0 0 0Tennessee -169 -173 -2.3% -169 -173 0 0 0 0 0 0West South Central -8 -25 -66.3% -8 -25 0 0 0 0 0 0Arkansas 25 6 308.2% 25 6 0 0 0 0 0 0Louisiana 0 0 -- 0 0 0 0 0 0 0 0Oklahoma -33 -31 7.1% -33 -31 0 0 0 0 0 0Texas 0 0 -- 0 0 0 0 0 0 0 0Mountain -148 -141 4.3% -148 -141 0 0 0 0 0 0Arizona -41 -41 -0.2% -41 -41 0 0 0 0 0 0Colorado -106 -100 6.1% -106 -100 0 0 0 0 0 0Idaho 0 0 -- 0 0 0 0 0 0 0 0Montana 0 0 -- 0 0 0 0 0 0 0 0Nevada 0 0 -- 0 0 0 0 0 0 0 0New Mexico 0 0 -- 0 0 0 0 0 0 0 0Utah 0 0 -- 0 0 0 0 0 0 0 0Wyoming 0 0 -- 0 0 0 0 0 0 0 0Pacific Contiguous -141 49 -386.3% -141 49 0 0 0 0 0 0California -166 50 -430.4% -166 50 0 0 0 0 0 0Oregon 0 0 -- 0 0 0 0 0 0 0 0Washington 25 -1 NM 25 -1 0 0 0 0 0 0Pacific Noncontiguous 0 0 -- 0 0 0 0 0 0 0 0Alaska 0 0 -- 0 0 0 0 0 0 0 0Hawaii 0 0 -- 0 0 0 0 0 0 0 0U.S. Total -1,729 -1,903 -9.1% -1,404 -1,586 -325 -317 0 0 0 0
Table 1.12.B. Utility Scale Facility Net Generation from Hydroelectric (Pumped Storage) Power
by State, by Sector, Year-to-Date through April 2018 and 2017 (Thousand Megawatthours)All Sectors Electric Power Sector Commercial Sector Industrial Sector
Displayed values of zero may represent small values that round to zero. The Excel version of this table provides additional precision which may be accessed by selecting individual cells.NM = Not meaningful due to large relative standard error or excessive percentage change.Notes: See Glossary for definitions. Values are preliminary. See Technical Notes for a discussion of the sample design for the Form EIA-923.Negative generation denotes that electric power consumed for plant use exceeds gross generation.Totals may not equal sum of components because of independent rounding. Percentage change is calculated before rounding.Source: U.S. Energy Information Administration, Form EIA-923, Power Plant Operations Report.
Electric UtilitiesIndependent
Power Producers
Generation at Utility Scale FacilitiesGeneration at Utility Scale
FacilitiesGeneration at Utility Scale
FacilitiesGeneration at Utility Scale
FacilitiesGeneration at Utility Scale
Facilities

6/19/2018 5:25:23 PM
Census Divisionand State April 2018 April 2017
PercentageChange April 2018 April 2017 April 2018 April 2017 April 2018 April 2017 April 2018 April 2017
New England 127 149 -14.8% 0 0 113 131 4 7 10 11Connecticut 27 47 -41.5% 0 0 27 47 0 0 0 0Maine 29 32 -9.6% 0 0 15 14 4 7 10 11Massachusetts 66 65 1.1% 0 0 66 65 0 0 0 0New Hampshire 4 4 -2.1% 0 0 4 4 0 0 0 0Rhode Island 0 0 -- 0 0 0 0 0 0 0 0Vermont 0 0 -- 0 0 0 0 0 0 0 0Middle Atlantic 172 171 0.5% 0 0 138 129 34 36 0 6New Jersey 46 44 3.7% 0 0 33 27 13 11 0 6New York 74 72 1.9% 0 0 58 55 16 17 0 0Pennsylvania 53 55 -4.0% 0 0 47 47 5 8 0 0East North Central 56 77 -27.3% 1 1 9 5 11 11 35 60Illinois 15 24 -38.6% 0 0 -2 -2 0 0 16 26Indiana 15 30 -49.1% 0 0 0 0 2 1 14 29Michigan 20 19 6.7% 0 0 10 8 9 10 1 2Ohio 1 0 438.4% 0 0 0 -1 0 0 1 1Wisconsin 5 4 28.4% 2 1 0 0 0 0 NM NMWest North Central 32 39 -17.3% 18 17 7 14 NM NM 5 5Iowa 0 1 -100.0% 0 0 0 0 0 0 0 1Kansas 0 0 -5.9% 0 0 0 0 0 0 0 0Minnesota 29 35 -17.6% 15 14 7 14 NM NM 5 4Missouri 0 0 -- 0 0 0 0 0 0 0 0Nebraska 0 0 -- 0 0 0 0 0 0 0 0North Dakota 3 NM NM 3 NM 0 0 0 0 0 0South Dakota 0 0 -- 0 0 0 0 0 0 0 0South Atlantic 385 358 7.6% 0 0 212 165 15 17 158 176Delaware 0 0 -- 0 0 0 0 0 0 0 0District of Columbia 0 0 -- 0 0 0 0 0 0 0 0Florida 258 258 0.1% 0 0 132 118 0 0 126 139Georgia 5 8 -35.3% 0 0 0 0 0 0 5 8Maryland 27 25 8.3% 0 0 27 25 0 0 0 0North Carolina 53 48 10.0% 0 0 29 22 0 0 25 26South Carolina 4 4 -16.4% 0 0 1 1 0 0 3 4Virginia 40 17 136.9% 0 0 25 0 15 17 0 0West Virginia -1 -1 -11.4% 0 0 -1 -1 0 0 0 0East South Central 6 4 57.5% 5 1 0 0 0 0 NM 2Alabama 0 0 -- 0 0 0 0 0 0 0 0Kentucky 5 1 269.8% 5 1 0 0 0 0 0 0Mississippi 0 0 -100.0% 0 0 0 0 0 0 0 0Tennessee NM 2 NM 0 0 0 0 0 0 NM 2West South Central 82 72 13.3% 0 0 7 7 0 0 75 65Arkansas NM 0 NM 0 0 0 0 0 0 NM 0Louisiana 56 35 62.0% 0 0 0 0 0 0 56 35Oklahoma 2 1 101.1% 0 0 2 2 0 0 0 -1Texas 22 36 -38.1% 0 0 5 5 0 0 18 31Mountain 60 58 3.4% 2 2 25 31 0 0 33 25Arizona 0 0 4.8% 0 0 0 0 0 0 0 0Colorado 5 4 26.0% 0 0 2 1 0 0 3 3Idaho 7 6 21.8% 0 0 0 0 0 0 7 6Montana 23 30 -23.6% 0 0 23 30 0 0 0 0Nevada 2 2 -0.1% 2 2 0 0 0 0 0 0New Mexico 0 0 -113.0% 0 0 0 0 0 0 0 0Utah 16 12 28.4% 0 0 0 0 0 0 16 12Wyoming 8 5 68.6% 0 0 0 0 0 0 8 5Pacific Contiguous 92 86 6.1% 0 0 24 24 0 0 67 63California 84 77 8.4% 0 0 16 15 0 0 67 63Oregon 3 3 8.8% 0 0 4 3 0 0 0 0Washington 4 6 -24.7% 0 0 4 6 0 0 0 0Pacific Noncontiguous 26 30 -11.8% 10 16 0 0 17 14 0 0Alaska 0 0 -20.1% 0 0 0 0 0 0 0 0Hawaii 27 30 -11.8% 10 16 0 0 17 14 0 0U.S. Total 1,038 1,044 -0.6% 37 38 534 506 82 87 384 413
Table 1.13.A. Utility Scale Facility Net Generation from Other Energy Sourcesby State, by Sector, April 2018 and 2017 (Thousand Megawatthours)
All Sectors Electric Power Sector Commercial Sector Industrial Sector
Displayed values of zero may represent small values that round to zero. The Excel version of this table provides additional precision which may be accessed by selecting individual cells.NM = Not meaningful due to large relative standard error or excessive percentage change.Notes: See Glossary for definitions. Values are preliminary. See Technical Notes for a discussion of the sample design for the Form EIA-923.Negative generation denotes that electric power consumed for plant use exceeds gross generation.Totals may not equal sum of components because of independent rounding. Percentage change is calculated before rounding.Source: U.S. Energy Information Administration, Form EIA-923, Power Plant Operations Report.
Electric UtilitiesIndependent
Power Producers
Generation at Utility Scale FacilitiesGeneration at Utility Scale
FacilitiesGeneration at Utility Scale
FacilitiesGeneration at Utility Scale
FacilitiesGeneration at Utility Scale
Facilities
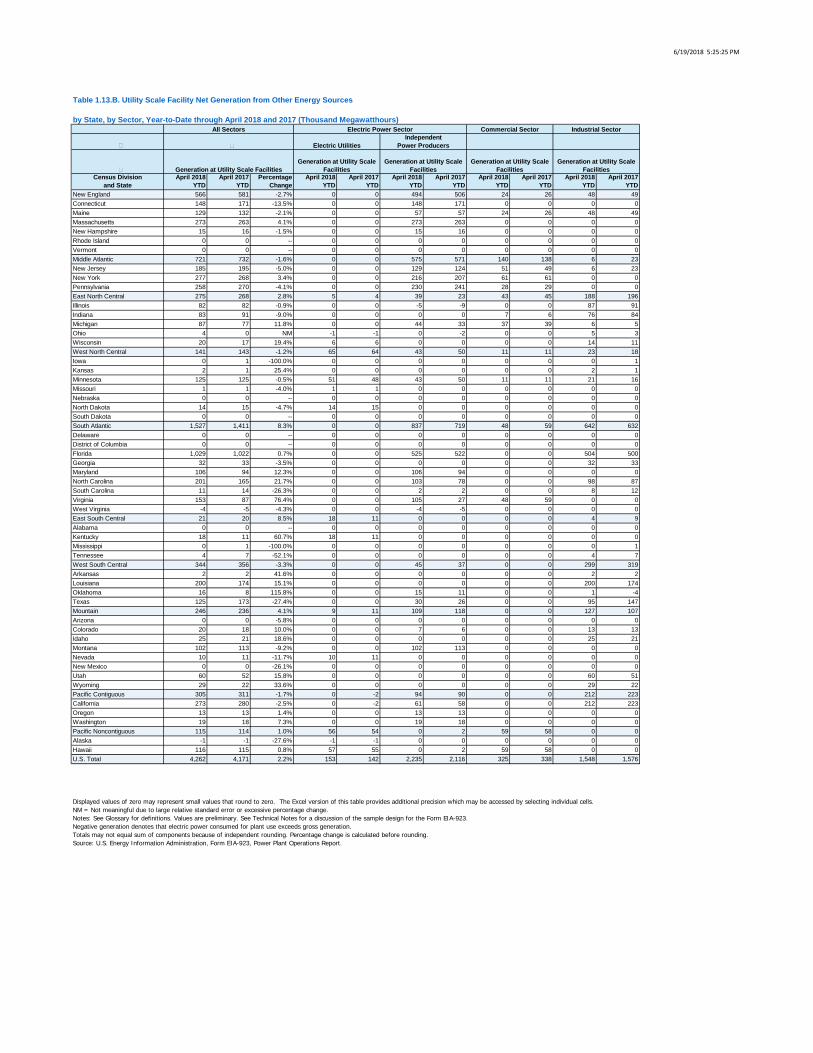
6/19/2018 5:25:25 PM
Census Divisionand State
April 2018 YTD
April 2017 YTD
PercentageChange
April 2018 YTD
April 2017 YTD
April 2018 YTD
April 2017 YTD
April 2018 YTD
April 2017 YTD
April 2018 YTD
April 2017 YTD
New England 566 581 -2.7% 0 0 494 506 24 26 48 49Connecticut 148 171 -13.5% 0 0 148 171 0 0 0 0Maine 129 132 -2.1% 0 0 57 57 24 26 48 49Massachusetts 273 263 4.1% 0 0 273 263 0 0 0 0New Hampshire 15 16 -1.5% 0 0 15 16 0 0 0 0Rhode Island 0 0 -- 0 0 0 0 0 0 0 0Vermont 0 0 -- 0 0 0 0 0 0 0 0Middle Atlantic 721 732 -1.6% 0 0 575 571 140 138 6 23New Jersey 185 195 -5.0% 0 0 129 124 51 49 6 23New York 277 268 3.4% 0 0 216 207 61 61 0 0Pennsylvania 258 270 -4.1% 0 0 230 241 28 29 0 0East North Central 275 268 2.8% 5 4 39 23 43 45 188 196Illinois 82 82 -0.9% 0 0 -5 -9 0 0 87 91Indiana 83 91 -9.0% 0 0 0 0 7 6 76 84Michigan 87 77 11.8% 0 0 44 33 37 39 6 5Ohio 4 0 NM -1 -1 0 -2 0 0 5 3Wisconsin 20 17 19.4% 6 6 0 0 0 0 14 11West North Central 141 143 -1.2% 65 64 43 50 11 11 23 18Iowa 0 1 -100.0% 0 0 0 0 0 0 0 1Kansas 2 1 25.4% 0 0 0 0 0 0 2 1Minnesota 125 125 -0.5% 51 48 43 50 11 11 21 16Missouri 1 1 -4.0% 1 1 0 0 0 0 0 0Nebraska 0 0 -- 0 0 0 0 0 0 0 0North Dakota 14 15 -4.7% 14 15 0 0 0 0 0 0South Dakota 0 0 -- 0 0 0 0 0 0 0 0South Atlantic 1,527 1,411 8.3% 0 0 837 719 48 59 642 632Delaware 0 0 -- 0 0 0 0 0 0 0 0District of Columbia 0 0 -- 0 0 0 0 0 0 0 0Florida 1,029 1,022 0.7% 0 0 525 522 0 0 504 500Georgia 32 33 -3.5% 0 0 0 0 0 0 32 33Maryland 106 94 12.3% 0 0 106 94 0 0 0 0North Carolina 201 165 21.7% 0 0 103 78 0 0 98 87South Carolina 11 14 -26.3% 0 0 2 2 0 0 8 12Virginia 153 87 76.4% 0 0 105 27 48 59 0 0West Virginia -4 -5 -4.3% 0 0 -4 -5 0 0 0 0East South Central 21 20 8.5% 18 11 0 0 0 0 4 9Alabama 0 0 -- 0 0 0 0 0 0 0 0Kentucky 18 11 60.7% 18 11 0 0 0 0 0 0Mississippi 0 1 -100.0% 0 0 0 0 0 0 0 1Tennessee 4 7 -52.1% 0 0 0 0 0 0 4 7West South Central 344 356 -3.3% 0 0 45 37 0 0 299 319Arkansas 2 2 41.6% 0 0 0 0 0 0 2 2Louisiana 200 174 15.1% 0 0 0 0 0 0 200 174Oklahoma 16 8 115.8% 0 0 15 11 0 0 1 -4Texas 125 173 -27.4% 0 0 30 26 0 0 95 147Mountain 246 236 4.1% 9 11 109 118 0 0 127 107Arizona 0 0 -5.8% 0 0 0 0 0 0 0 0Colorado 20 18 10.0% 0 0 7 6 0 0 13 13Idaho 25 21 18.6% 0 0 0 0 0 0 25 21Montana 102 113 -9.2% 0 0 102 113 0 0 0 0Nevada 10 11 -11.7% 10 11 0 0 0 0 0 0New Mexico 0 0 -26.1% 0 0 0 0 0 0 0 0Utah 60 52 15.8% 0 0 0 0 0 0 60 51Wyoming 29 22 33.6% 0 0 0 0 0 0 29 22Pacific Contiguous 305 311 -1.7% 0 -2 94 90 0 0 212 223California 273 280 -2.5% 0 -2 61 58 0 0 212 223Oregon 13 13 1.4% 0 0 13 13 0 0 0 0Washington 19 18 7.3% 0 0 19 18 0 0 0 0Pacific Noncontiguous 115 114 1.0% 56 54 0 2 59 58 0 0Alaska -1 -1 -27.6% -1 -1 0 0 0 0 0 0Hawaii 116 115 0.8% 57 55 0 2 59 58 0 0U.S. Total 4,262 4,171 2.2% 153 142 2,235 2,116 325 338 1,548 1,576
Table 1.13.B. Utility Scale Facility Net Generation from Other Energy Sources
by State, by Sector, Year-to-Date through April 2018 and 2017 (Thousand Megawatthours)All Sectors Electric Power Sector Commercial Sector Industrial Sector
Displayed values of zero may represent small values that round to zero. The Excel version of this table provides additional precision which may be accessed by selecting individual cells.NM = Not meaningful due to large relative standard error or excessive percentage change.Notes: See Glossary for definitions. Values are preliminary. See Technical Notes for a discussion of the sample design for the Form EIA-923.Negative generation denotes that electric power consumed for plant use exceeds gross generation.Totals may not equal sum of components because of independent rounding. Percentage change is calculated before rounding.Source: U.S. Energy Information Administration, Form EIA-923, Power Plant Operations Report.
Electric UtilitiesIndependent
Power Producers
Generation at Utility Scale FacilitiesGeneration at Utility Scale
FacilitiesGeneration at Utility Scale
FacilitiesGeneration at Utility Scale
FacilitiesGeneration at Utility Scale
Facilities
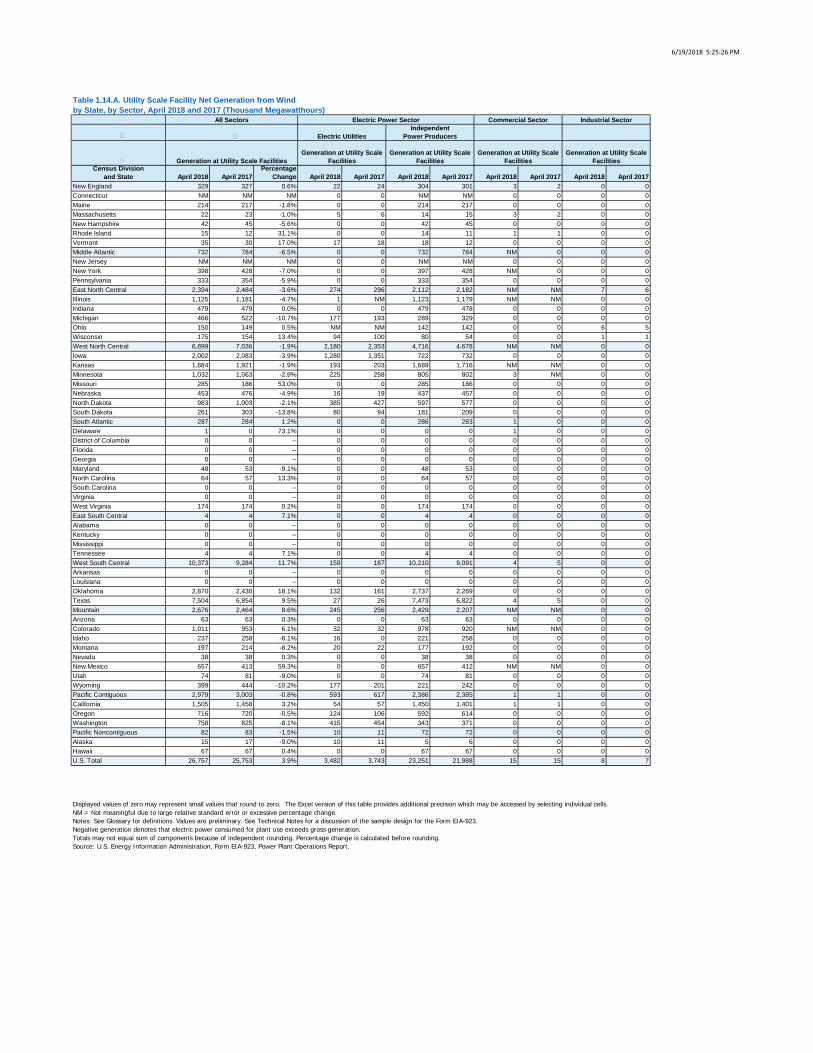
6/19/2018 5:25:26 PM
Census Divisionand State April 2018 April 2017
PercentageChange April 2018 April 2017 April 2018 April 2017 April 2018 April 2017 April 2018 April 2017
New England 329 327 0.6% 22 24 304 301 3 2 0 0Connecticut NM NM NM 0 0 NM NM 0 0 0 0Maine 214 217 -1.8% 0 0 214 217 0 0 0 0Massachusetts 22 23 -1.0% 5 6 14 15 3 2 0 0New Hampshire 42 45 -5.6% 0 0 42 45 0 0 0 0Rhode Island 15 12 31.1% 0 0 14 11 1 1 0 0Vermont 35 30 17.0% 17 18 18 12 0 0 0 0Middle Atlantic 732 784 -6.5% 0 0 732 784 NM 0 0 0New Jersey NM NM NM 0 0 NM NM 0 0 0 0New York 398 428 -7.0% 0 0 397 428 NM 0 0 0Pennsylvania 333 354 -5.9% 0 0 333 354 0 0 0 0East North Central 2,394 2,484 -3.6% 274 296 2,112 2,182 NM NM 7 6Illinois 1,125 1,181 -4.7% 1 NM 1,123 1,179 NM NM 0 0Indiana 479 479 0.0% 0 0 479 478 0 0 0 0Michigan 466 522 -10.7% 177 193 289 329 0 0 0 0Ohio 150 149 0.5% NM NM 142 142 0 0 6 5Wisconsin 175 154 13.4% 94 100 80 54 0 0 1 1West North Central 6,899 7,036 -1.9% 2,180 2,353 4,716 4,678 NM NM 0 0Iowa 2,002 2,083 -3.9% 1,280 1,351 722 732 0 0 0 0Kansas 1,884 1,921 -1.9% 193 203 1,689 1,716 NM NM 0 0Minnesota 1,032 1,063 -2.9% 225 258 805 802 3 NM 0 0Missouri 285 186 53.0% 0 0 285 186 0 0 0 0Nebraska 453 476 -4.9% 16 19 437 457 0 0 0 0North Dakota 983 1,003 -2.1% 385 427 597 577 0 0 0 0South Dakota 261 303 -13.8% 80 94 181 209 0 0 0 0South Atlantic 287 284 1.2% 0 0 286 283 1 0 0 0Delaware 1 0 73.1% 0 0 0 0 1 0 0 0District of Columbia 0 0 -- 0 0 0 0 0 0 0 0Florida 0 0 -- 0 0 0 0 0 0 0 0Georgia 0 0 -- 0 0 0 0 0 0 0 0Maryland 48 53 -9.1% 0 0 48 53 0 0 0 0North Carolina 64 57 13.3% 0 0 64 57 0 0 0 0South Carolina 0 0 -- 0 0 0 0 0 0 0 0Virginia 0 0 -- 0 0 0 0 0 0 0 0West Virginia 174 174 0.2% 0 0 174 174 0 0 0 0East South Central 4 4 7.1% 0 0 4 4 0 0 0 0Alabama 0 0 -- 0 0 0 0 0 0 0 0Kentucky 0 0 -- 0 0 0 0 0 0 0 0Mississippi 0 0 -- 0 0 0 0 0 0 0 0Tennessee 4 4 7.1% 0 0 4 4 0 0 0 0West South Central 10,373 9,284 11.7% 159 187 10,210 9,091 4 5 0 0Arkansas 0 0 -- 0 0 0 0 0 0 0 0Louisiana 0 0 -- 0 0 0 0 0 0 0 0Oklahoma 2,870 2,430 18.1% 132 161 2,737 2,269 0 0 0 0Texas 7,504 6,854 9.5% 27 26 7,473 6,822 4 5 0 0Mountain 2,676 2,464 8.6% 245 256 2,429 2,207 NM NM 0 0Arizona 63 63 0.3% 0 0 63 63 0 0 0 0Colorado 1,011 953 6.1% 32 32 978 920 NM NM 0 0Idaho 237 258 -8.1% 16 0 221 258 0 0 0 0Montana 197 214 -8.2% 20 22 177 192 0 0 0 0Nevada 38 38 0.3% 0 0 38 38 0 0 0 0New Mexico 657 413 59.3% 0 0 657 412 NM NM 0 0Utah 74 81 -9.0% 0 0 74 81 0 0 0 0Wyoming 399 444 -10.2% 177 201 221 242 0 0 0 0Pacific Contiguous 2,979 3,003 -0.8% 593 617 2,386 2,385 1 1 0 0California 1,505 1,458 3.2% 54 57 1,450 1,401 1 1 0 0Oregon 716 720 -0.5% 124 106 592 614 0 0 0 0Washington 758 825 -8.1% 415 454 343 371 0 0 0 0Pacific Noncontiguous 82 83 -1.5% 10 11 72 72 0 0 0 0Alaska 15 17 -9.0% 10 11 5 6 0 0 0 0Hawaii 67 67 0.4% 0 0 67 67 0 0 0 0U.S. Total 26,757 25,753 3.9% 3,482 3,743 23,251 21,988 15 15 8 7
Table 1.14.A. Utility Scale Facility Net Generation from Windby State, by Sector, April 2018 and 2017 (Thousand Megawatthours)
All Sectors Electric Power Sector Commercial Sector Industrial Sector
Displayed values of zero may represent small values that round to zero. The Excel version of this table provides additional precision which may be accessed by selecting individual cells.NM = Not meaningful due to large relative standard error or excessive percentage change.Notes: See Glossary for definitions. Values are preliminary. See Technical Notes for a discussion of the sample design for the Form EIA-923.Negative generation denotes that electric power consumed for plant use exceeds gross generation.Totals may not equal sum of components because of independent rounding. Percentage change is calculated before rounding.Source: U.S. Energy Information Administration, Form EIA-923, Power Plant Operations Report.
Electric UtilitiesIndependent
Power Producers
Generation at Utility Scale FacilitiesGeneration at Utility Scale
FacilitiesGeneration at Utility Scale
FacilitiesGeneration at Utility Scale
FacilitiesGeneration at Utility Scale
Facilities

6/19/2018 5:25:28 PM
Census Divisionand State
April 2018 YTD
April 2017 YTD
PercentageChange
April 2018 YTD
April 2017 YTD
April 2018 YTD
April 2017 YTD
April 2018 YTD
April 2017 YTD
April 2018 YTD
April 2017 YTD
New England 1,418 1,206 17.5% 91 82 1,313 1,113 13 12 1 0Connecticut NM NM NM 0 0 NM NM 0 0 0 0Maine 940 820 14.7% 0 0 940 820 0 0 0 0Massachusetts 91 81 11.9% 22 21 58 52 9 9 1 0New Hampshire 173 149 16.5% 0 0 173 149 0 0 0 0Rhode Island 65 53 22.5% 0 0 62 50 3 3 0 0Vermont 143 99 45.2% 68 60 75 38 0 0 0 0Middle Atlantic 3,015 2,694 11.9% 0 0 3,012 2,693 NM 0 1 1New Jersey NM NM NM 0 0 NM NM 0 0 0 0New York 1,628 1,439 13.1% 0 0 1,626 1,439 NM 0 1 1Pennsylvania 1,379 1,248 10.5% 0 0 1,379 1,248 0 0 0 0East North Central 10,634 9,074 17.2% 1,137 1,048 9,464 8,001 NM NM 30 21Illinois 4,926 4,353 13.2% 5 NM 4,919 4,346 NM NM 0 0Indiana 2,202 1,714 28.5% 0 0 2,202 1,713 0 1 0 0Michigan 2,064 1,862 10.9% 745 720 1,319 1,142 0 0 0 0Ohio 708 636 11.2% NM NM 675 614 1 2 27 18Wisconsin 735 510 44.3% 382 321 350 186 0 0 3 3West North Central 28,520 26,525 7.5% 9,153 8,977 19,350 17,531 17 17 0 0Iowa 8,376 7,950 5.4% 5,355 5,186 3,020 2,763 1 2 0 0Kansas 7,223 6,672 8.3% 722 553 6,496 6,114 NM NM 0 0Minnesota 4,440 4,123 7.7% 974 1,007 3,456 3,105 11 NM 0 0Missouri 1,141 631 81.0% 0 0 1,141 631 0 0 0 0Nebraska 2,027 1,990 1.8% 67 67 1,960 1,923 0 0 0 0North Dakota 4,157 3,914 6.2% 1,676 1,766 2,481 2,148 0 0 0 0South Dakota 1,155 1,245 -7.2% 359 397 795 847 0 0 0 0South Atlantic 1,158 964 20.1% 0 0 1,156 962 2 2 0 0Delaware 2 2 7.4% 0 0 0 0 2 2 0 0District of Columbia 0 0 -- 0 0 0 0 0 0 0 0Florida 0 0 -- 0 0 0 0 0 0 0 0Georgia 0 0 -- 0 0 0 0 0 0 0 0Maryland 202 191 5.7% 0 0 202 191 0 0 0 0North Carolina 245 178 37.7% 0 0 245 178 0 0 0 0South Carolina 0 0 -- 0 0 0 0 0 0 0 0Virginia 0 0 -- 0 0 0 0 0 0 0 0West Virginia 708 593 19.5% 0 0 708 593 0 0 0 0East South Central 16 NM NM 0 0 16 NM 0 0 0 0Alabama 0 0 -- 0 0 0 0 0 0 0 0Kentucky 0 0 -- 0 0 0 0 0 0 0 0Mississippi 0 0 -- 0 0 0 0 0 0 0 0Tennessee 16 NM NM 0 0 16 NM 0 0 0 0West South Central 38,516 34,702 11.0% 603 691 37,894 33,998 18 13 0 0Arkansas 0 0 -- 0 0 0 0 0 0 0 0Louisiana 0 0 -- 0 0 0 0 0 0 0 0Oklahoma 10,784 9,192 17.3% 505 592 10,279 8,600 0 0 0 0Texas 27,732 25,510 8.7% 99 99 27,616 25,398 18 13 0 0Mountain 10,210 9,196 11.0% 1,018 984 9,189 8,207 NM NM 1 1Arizona 213 232 -8.2% 0 0 213 232 0 0 0 0Colorado 3,692 3,590 2.8% 119 119 3,571 3,467 NM NM 1 1Idaho 988 907 8.9% 48 0 940 907 0 0 0 0Montana 836 825 1.3% 86 88 751 738 0 0 0 0Nevada 133 142 -6.2% 0 0 133 142 0 0 0 0New Mexico 2,343 1,457 60.8% 0 0 2,342 1,456 NM NM 0 0Utah 301 370 -18.5% 0 0 301 370 0 0 0 0Wyoming 1,703 1,672 1.8% 766 777 937 895 0 0 0 0Pacific Contiguous 11,004 10,182 8.1% 2,274 1,963 8,727 8,216 2 3 1 1California 5,193 5,356 -3.0% 147 186 5,043 5,166 2 3 1 1Oregon 2,666 2,045 30.4% 404 271 2,263 1,774 0 0 0 0Washington 3,144 2,781 13.1% 1,724 1,505 1,421 1,275 0 0 0 0Pacific Noncontiguous 310 310 0.0% 42 39 269 271 0 0 0 0Alaska 64 61 5.0% 42 39 23 22 0 0 0 0Hawaii 246 249 -1.2% 0 0 246 249 0 0 0 0U.S. Total 104,801 94,862 10.5% 14,318 13,784 90,390 81,000 59 54 34 24
Table 1.14.B. Utility Scale Facility Net Generation from Wind
by State, by Sector, Year-to-Date through April 2018 and 2017 (Thousand Megawatthours)All Sectors Electric Power Sector Commercial Sector Industrial Sector
Displayed values of zero may represent small values that round to zero. The Excel version of this table provides additional precision which may be accessed by selecting individual cells.NM = Not meaningful due to large relative standard error or excessive percentage change.Notes: See Glossary for definitions. Values are preliminary. See Technical Notes for a discussion of the sample design for the Form EIA-923.Negative generation denotes that electric power consumed for plant use exceeds gross generation.Totals may not equal sum of components because of independent rounding. Percentage change is calculated before rounding.Source: U.S. Energy Information Administration, Form EIA-923, Power Plant Operations Report.
Electric UtilitiesIndependent
Power Producers
Generation at Utility Scale FacilitiesGeneration at Utility Scale
FacilitiesGeneration at Utility Scale
FacilitiesGeneration at Utility Scale
FacilitiesGeneration at Utility Scale
Facilities

6/19/2018 5:25:30 PM
Census Divisionand State April 2018 April 2017
PercentageChange April 2018 April 2017 April 2018 April 2017 April 2018 April 2017 April 2018 April 2017
New England 466 528 -11.9% 16 19 352 404 11 11 86 95Connecticut 45 68 -34.4% 0 0 45 68 0 0 0 0Maine 199 224 -11.5% 0 0 109 122 4 8 86 95Massachusetts 91 92 -0.3% 0 0 89 89 2 2 0 0New Hampshire 87 100 -13.4% 0 4 82 96 4 0 0 0Rhode Island 18 17 4.1% 0 0 18 17 0 0 0 0Vermont 27 27 -2.2% 16 15 NM NM 0 0 0 0Middle Atlantic 452 440 2.6% 0 0 343 330 42 44 67 67New Jersey 82 70 17.3% 0 0 68 57 15 13 0 0New York 186 180 3.3% 0 0 154 148 17 18 15 14Pennsylvania 184 190 -3.5% 0 0 122 125 10 13 52 53East North Central 445 470 -5.4% 53 64 245 260 17 17 129 130Illinois 38 40 -4.1% 2 2 37 38 0 0 0 0Indiana 36 35 3.5% 23 23 4 4 2 1 7 7Michigan 189 202 -6.2% 0 0 124 139 10 10 55 52Ohio 58 59 -1.7% NM NM 38 38 0 1 20 20Wisconsin 123 135 -8.6% 28 39 42 40 6 5 48 51West North Central 182 195 -6.6% 43 44 83 91 9 11 47 48Iowa 18 14 33.1% NM NM 10 5 4 3 2 4Kansas 5 5 3.3% 0 0 5 5 0 0 0 0Minnesota 141 157 -10.3% 31 33 64 79 NM NM 45 44Missouri 9 11 -17.7% NM NM NM 4 2 4 0 0Nebraska 8 8 4.1% 7 6 0 0 1 2 0 0North Dakota 0 0 179.6% 0 0 0 0 0 0 0 0South Dakota 0 0 -- 0 0 0 0 0 0 0 0South Atlantic 1,562 1,575 -0.8% 157 156 509 526 27 24 869 868Delaware 5 5 1.7% 0 0 NM 4 0 0 NM NMDistrict of Columbia 5 4 34.5% 0 0 0 4 5 0 0 0Florida 405 440 -7.8% 24 8 206 258 3 4 171 170Georgia 378 369 2.3% 0 0 38 36 0 0 340 333Maryland 46 42 10.5% 0 0 34 32 1 NM 11 9North Carolina 218 184 18.7% 0 0 109 98 NM NM 108 85South Carolina 201 211 -4.7% 37 36 NM 29 0 0 136 146Virginia 303 321 -5.4% 95 113 89 65 17 19 102 124West Virginia 0 0 -- 0 0 0 0 0 0 0 0East South Central 480 513 -6.4% 7 7 30 30 0 0 443 477Alabama 251 274 -8.4% 0 0 21 22 0 0 229 252Kentucky 36 36 1.6% 7 7 1 1 0 0 28 28Mississippi 129 125 3.1% 0 0 NM NM 0 0 128 124Tennessee 64 79 -18.3% 0 0 7 7 0 0 58 72West South Central 492 509 -3.3% 0 0 58 71 3 3 431 434Arkansas 126 123 2.2% 0 0 9 9 0 1 117 114Louisiana 220 231 -4.6% 0 0 7 7 0 0 214 224Oklahoma 31 25 27.0% 0 0 NM NM 0 0 30 23Texas 114 130 -12.0% 0 0 41 55 3 3 71 72Mountain 87 86 0.9% NM NM 50 52 1 2 35 31Arizona NM NM NM 0 0 NM NM 0 0 0 0Colorado 14 14 0.7% 0 0 14 14 0 0 0 0Idaho 44 41 6.0% NM NM 9 10 0 1 33 29Montana 2 2 -1.7% 0 0 0 0 0 0 2 2Nevada 5 5 3.7% 0 0 5 5 0 0 0 0New Mexico 2 1 11.8% 0 0 2 1 0 0 0 0Utah 6 7 -5.1% 0 0 5 5 1 1 0 0Wyoming 0 0 -- 0 0 0 0 0 0 0 0Pacific Contiguous 679 706 -3.7% 46 56 351 383 67 70 215 196California 436 468 -6.9% 6 12 312 339 63 66 55 52Oregon 81 85 -5.1% 5 5 30 33 3 3 44 44Washington 162 152 6.9% 35 39 10 11 NM NM 116 100Pacific Noncontiguous 27 21 28.9% 6 4 0 0 21 17 0 NMAlaska 4 3 30.2% 0 0 0 0 4 3 0 NMHawaii 23 18 28.7% 6 4 0 0 17 14 0 0U.S. Total 4,873 5,044 -3.4% 329 351 2,021 2,148 199 199 2,323 2,346
Table 1.15.A. Utility Scale Facility Net Generation from Biomassby State, by Sector, April 2018 and 2017 (Thousand Megawatthours)
All Sectors Electric Power Sector Commercial Sector Industrial Sector
Displayed values of zero may represent small values that round to zero. The Excel version of this table provides additional precision which may be accessed by selecting individual cells.NM = Not meaningful due to large relative standard error or excessive percentage change.Notes: See Glossary for definitions. Values are preliminary. See Technical Notes for a discussion of the sample design for the Form EIA-923.Negative generation denotes that electric power consumed for plant use exceeds gross generation.Totals may not equal sum of components because of independent rounding. Percentage change is calculated before rounding.Source: U.S. Energy Information Administration, Form EIA-923, Power Plant Operations Report.
Electric UtilitiesIndependent
Power Producers
Generation at Utility Scale FacilitiesGeneration at Utility Scale
FacilitiesGeneration at Utility Scale
FacilitiesGeneration at Utility Scale
FacilitiesGeneration at Utility Scale
Facilities
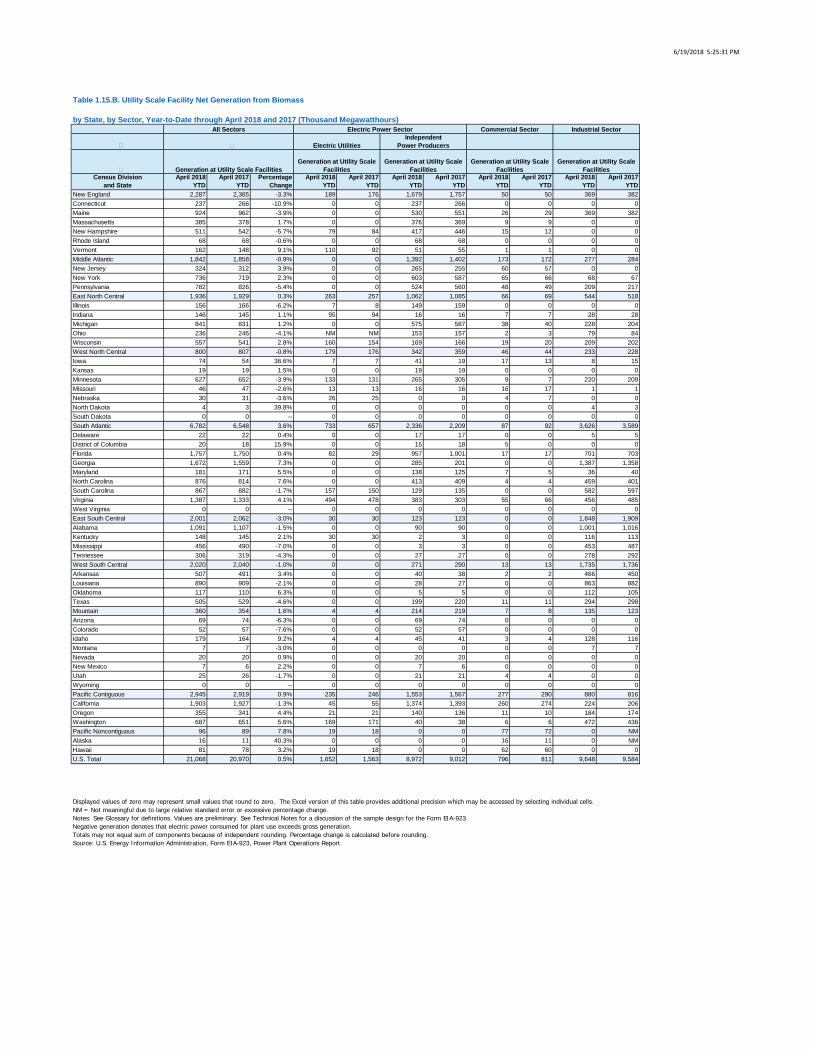
6/19/2018 5:25:31 PM
Census Divisionand State
April 2018 YTD
April 2017 YTD
PercentageChange
April 2018 YTD
April 2017 YTD
April 2018 YTD
April 2017 YTD
April 2018 YTD
April 2017 YTD
April 2018 YTD
April 2017 YTD
New England 2,287 2,365 -3.3% 189 176 1,679 1,757 50 50 369 382Connecticut 237 266 -10.9% 0 0 237 266 0 0 0 0Maine 924 962 -3.9% 0 0 530 551 26 29 369 382Massachusetts 385 378 1.7% 0 0 376 369 9 9 0 0New Hampshire 511 542 -5.7% 79 84 417 446 15 12 0 0Rhode Island 68 68 -0.6% 0 0 68 68 0 0 0 0Vermont 162 148 9.1% 110 92 51 55 1 1 0 0Middle Atlantic 1,842 1,858 -0.9% 0 0 1,392 1,402 173 172 277 284New Jersey 324 312 3.9% 0 0 265 255 60 57 0 0New York 736 719 2.3% 0 0 603 587 65 66 68 67Pennsylvania 782 826 -5.4% 0 0 524 560 48 49 209 217East North Central 1,936 1,929 0.3% 263 257 1,062 1,085 66 69 544 518Illinois 156 166 -6.2% 7 8 149 159 0 0 0 0Indiana 146 145 1.1% 95 94 16 16 7 7 28 28Michigan 841 831 1.2% 0 0 575 587 38 40 228 204Ohio 236 246 -4.1% NM NM 153 157 2 3 79 84Wisconsin 557 541 2.8% 160 154 169 166 19 20 209 202West North Central 800 807 -0.8% 179 176 342 359 46 44 233 228Iowa 74 54 36.6% 7 7 41 19 17 13 8 15Kansas 19 19 1.5% 0 0 19 19 0 0 0 0Minnesota 627 652 -3.9% 133 131 265 305 9 7 220 209Missouri 46 47 -2.6% 13 13 16 16 16 17 1 1Nebraska 30 31 -3.6% 26 25 0 0 4 7 0 0North Dakota 4 3 39.8% 0 0 0 0 0 0 4 3South Dakota 0 0 -- 0 0 0 0 0 0 0 0South Atlantic 6,782 6,548 3.6% 733 657 2,336 2,209 87 92 3,626 3,589Delaware 22 22 0.4% 0 0 17 17 0 0 5 5District of Columbia 20 18 15.9% 0 0 15 18 5 0 0 0Florida 1,757 1,750 0.4% 82 29 957 1,001 17 17 701 703Georgia 1,672 1,559 7.3% 0 0 285 201 0 0 1,387 1,358Maryland 181 171 5.5% 0 0 138 125 7 5 36 40North Carolina 876 814 7.6% 0 0 413 409 4 4 459 401South Carolina 867 882 -1.7% 157 150 129 135 0 0 582 597Virginia 1,387 1,333 4.1% 494 478 383 303 55 66 456 485West Virginia 0 0 -- 0 0 0 0 0 0 0 0East South Central 2,001 2,062 -3.0% 30 30 123 123 0 0 1,848 1,909Alabama 1,091 1,107 -1.5% 0 0 90 90 0 0 1,001 1,016Kentucky 148 145 2.1% 30 30 2 3 0 0 116 113Mississippi 456 490 -7.0% 0 0 3 3 0 0 453 487Tennessee 306 319 -4.3% 0 0 27 27 0 0 278 292West South Central 2,020 2,040 -1.0% 0 0 271 290 13 13 1,735 1,736Arkansas 507 491 3.4% 0 0 40 38 2 2 466 450Louisiana 890 909 -2.1% 0 0 28 27 0 0 863 882Oklahoma 117 110 6.3% 0 0 5 5 0 0 112 105Texas 505 529 -4.6% 0 0 199 220 11 11 294 298Mountain 360 354 1.6% 4 4 214 219 7 8 135 123Arizona 69 74 -6.3% 0 0 69 74 0 0 0 0Colorado 52 57 -7.6% 0 0 52 57 0 0 0 0Idaho 179 164 9.2% 4 4 45 41 3 4 128 116Montana 7 7 -3.0% 0 0 0 0 0 0 7 7Nevada 20 20 0.9% 0 0 20 20 0 0 0 0New Mexico 7 6 2.2% 0 0 7 6 0 0 0 0Utah 25 26 -1.7% 0 0 21 21 4 4 0 0Wyoming 0 0 -- 0 0 0 0 0 0 0 0Pacific Contiguous 2,945 2,919 0.9% 235 246 1,553 1,567 277 290 880 816California 1,903 1,927 -1.3% 45 55 1,374 1,393 260 274 224 206Oregon 355 341 4.4% 21 21 140 136 11 10 184 174Washington 687 651 5.6% 169 171 40 38 6 6 472 436Pacific Noncontiguous 96 89 7.8% 19 18 0 0 77 72 0 NMAlaska 16 11 40.3% 0 0 0 0 16 11 0 NMHawaii 81 78 3.2% 19 18 0 0 62 60 0 0U.S. Total 21,068 20,970 0.5% 1,652 1,563 8,972 9,012 796 811 9,648 9,584
Table 1.15.B. Utility Scale Facility Net Generation from Biomass
by State, by Sector, Year-to-Date through April 2018 and 2017 (Thousand Megawatthours)All Sectors Electric Power Sector Commercial Sector Industrial Sector
Displayed values of zero may represent small values that round to zero. The Excel version of this table provides additional precision which may be accessed by selecting individual cells.NM = Not meaningful due to large relative standard error or excessive percentage change.Notes: See Glossary for definitions. Values are preliminary. See Technical Notes for a discussion of the sample design for the Form EIA-923.Negative generation denotes that electric power consumed for plant use exceeds gross generation.Totals may not equal sum of components because of independent rounding. Percentage change is calculated before rounding.Source: U.S. Energy Information Administration, Form EIA-923, Power Plant Operations Report.
Electric UtilitiesIndependent
Power Producers
Generation at Utility Scale FacilitiesGeneration at Utility Scale
FacilitiesGeneration at Utility Scale
FacilitiesGeneration at Utility Scale
FacilitiesGeneration at Utility Scale
Facilities
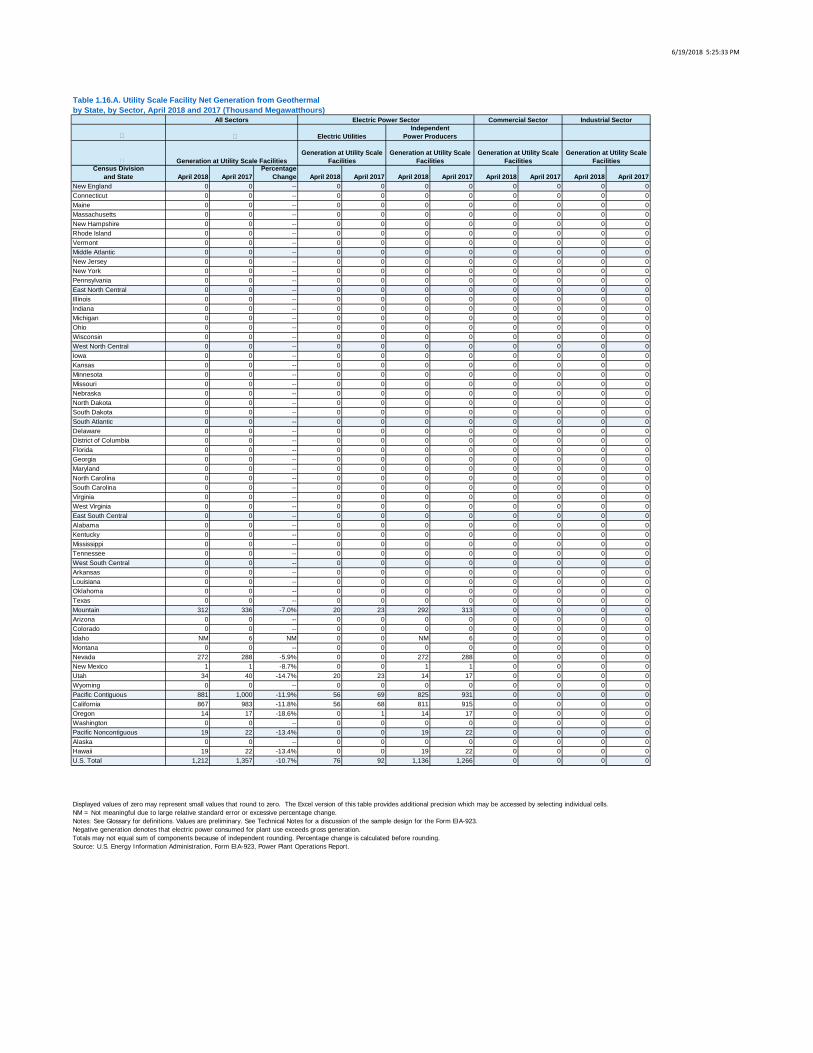
6/19/2018 5:25:33 PM
Census Divisionand State April 2018 April 2017
PercentageChange April 2018 April 2017 April 2018 April 2017 April 2018 April 2017 April 2018 April 2017
New England 0 0 -- 0 0 0 0 0 0 0 0Connecticut 0 0 -- 0 0 0 0 0 0 0 0Maine 0 0 -- 0 0 0 0 0 0 0 0Massachusetts 0 0 -- 0 0 0 0 0 0 0 0New Hampshire 0 0 -- 0 0 0 0 0 0 0 0Rhode Island 0 0 -- 0 0 0 0 0 0 0 0Vermont 0 0 -- 0 0 0 0 0 0 0 0Middle Atlantic 0 0 -- 0 0 0 0 0 0 0 0New Jersey 0 0 -- 0 0 0 0 0 0 0 0New York 0 0 -- 0 0 0 0 0 0 0 0Pennsylvania 0 0 -- 0 0 0 0 0 0 0 0East North Central 0 0 -- 0 0 0 0 0 0 0 0Illinois 0 0 -- 0 0 0 0 0 0 0 0Indiana 0 0 -- 0 0 0 0 0 0 0 0Michigan 0 0 -- 0 0 0 0 0 0 0 0Ohio 0 0 -- 0 0 0 0 0 0 0 0Wisconsin 0 0 -- 0 0 0 0 0 0 0 0West North Central 0 0 -- 0 0 0 0 0 0 0 0Iowa 0 0 -- 0 0 0 0 0 0 0 0Kansas 0 0 -- 0 0 0 0 0 0 0 0Minnesota 0 0 -- 0 0 0 0 0 0 0 0Missouri 0 0 -- 0 0 0 0 0 0 0 0Nebraska 0 0 -- 0 0 0 0 0 0 0 0North Dakota 0 0 -- 0 0 0 0 0 0 0 0South Dakota 0 0 -- 0 0 0 0 0 0 0 0South Atlantic 0 0 -- 0 0 0 0 0 0 0 0Delaware 0 0 -- 0 0 0 0 0 0 0 0District of Columbia 0 0 -- 0 0 0 0 0 0 0 0Florida 0 0 -- 0 0 0 0 0 0 0 0Georgia 0 0 -- 0 0 0 0 0 0 0 0Maryland 0 0 -- 0 0 0 0 0 0 0 0North Carolina 0 0 -- 0 0 0 0 0 0 0 0South Carolina 0 0 -- 0 0 0 0 0 0 0 0Virginia 0 0 -- 0 0 0 0 0 0 0 0West Virginia 0 0 -- 0 0 0 0 0 0 0 0East South Central 0 0 -- 0 0 0 0 0 0 0 0Alabama 0 0 -- 0 0 0 0 0 0 0 0Kentucky 0 0 -- 0 0 0 0 0 0 0 0Mississippi 0 0 -- 0 0 0 0 0 0 0 0Tennessee 0 0 -- 0 0 0 0 0 0 0 0West South Central 0 0 -- 0 0 0 0 0 0 0 0Arkansas 0 0 -- 0 0 0 0 0 0 0 0Louisiana 0 0 -- 0 0 0 0 0 0 0 0Oklahoma 0 0 -- 0 0 0 0 0 0 0 0Texas 0 0 -- 0 0 0 0 0 0 0 0Mountain 312 336 -7.0% 20 23 292 313 0 0 0 0Arizona 0 0 -- 0 0 0 0 0 0 0 0Colorado 0 0 -- 0 0 0 0 0 0 0 0Idaho NM 6 NM 0 0 NM 6 0 0 0 0Montana 0 0 -- 0 0 0 0 0 0 0 0Nevada 272 288 -5.9% 0 0 272 288 0 0 0 0New Mexico 1 1 -8.7% 0 0 1 1 0 0 0 0Utah 34 40 -14.7% 20 23 14 17 0 0 0 0Wyoming 0 0 -- 0 0 0 0 0 0 0 0Pacific Contiguous 881 1,000 -11.9% 56 69 825 931 0 0 0 0California 867 983 -11.8% 56 68 811 915 0 0 0 0Oregon 14 17 -18.6% 0 1 14 17 0 0 0 0Washington 0 0 -- 0 0 0 0 0 0 0 0Pacific Noncontiguous 19 22 -13.4% 0 0 19 22 0 0 0 0Alaska 0 0 -- 0 0 0 0 0 0 0 0Hawaii 19 22 -13.4% 0 0 19 22 0 0 0 0U.S. Total 1,212 1,357 -10.7% 76 92 1,136 1,266 0 0 0 0
Table 1.16.A. Utility Scale Facility Net Generation from Geothermalby State, by Sector, April 2018 and 2017 (Thousand Megawatthours)
All Sectors Electric Power Sector Commercial Sector Industrial Sector
Displayed values of zero may represent small values that round to zero. The Excel version of this table provides additional precision which may be accessed by selecting individual cells.NM = Not meaningful due to large relative standard error or excessive percentage change.Notes: See Glossary for definitions. Values are preliminary. See Technical Notes for a discussion of the sample design for the Form EIA-923.Negative generation denotes that electric power consumed for plant use exceeds gross generation.Totals may not equal sum of components because of independent rounding. Percentage change is calculated before rounding.Source: U.S. Energy Information Administration, Form EIA-923, Power Plant Operations Report.
Electric UtilitiesIndependent
Power Producers
Generation at Utility Scale FacilitiesGeneration at Utility Scale
FacilitiesGeneration at Utility Scale
FacilitiesGeneration at Utility Scale
FacilitiesGeneration at Utility Scale
Facilities

6/19/2018 5:25:34 PM
Census Divisionand State
April 2018 YTD
April 2017 YTD
PercentageChange
April 2018 YTD
April 2017 YTD
April 2018 YTD
April 2017 YTD
April 2018 YTD
April 2017 YTD
April 2018 YTD
April 2017 YTD
New England 0 0 -- 0 0 0 0 0 0 0 0Connecticut 0 0 -- 0 0 0 0 0 0 0 0Maine 0 0 -- 0 0 0 0 0 0 0 0Massachusetts 0 0 -- 0 0 0 0 0 0 0 0New Hampshire 0 0 -- 0 0 0 0 0 0 0 0Rhode Island 0 0 -- 0 0 0 0 0 0 0 0Vermont 0 0 -- 0 0 0 0 0 0 0 0Middle Atlantic 0 0 -- 0 0 0 0 0 0 0 0New Jersey 0 0 -- 0 0 0 0 0 0 0 0New York 0 0 -- 0 0 0 0 0 0 0 0Pennsylvania 0 0 -- 0 0 0 0 0 0 0 0East North Central 0 0 -- 0 0 0 0 0 0 0 0Illinois 0 0 -- 0 0 0 0 0 0 0 0Indiana 0 0 -- 0 0 0 0 0 0 0 0Michigan 0 0 -- 0 0 0 0 0 0 0 0Ohio 0 0 -- 0 0 0 0 0 0 0 0Wisconsin 0 0 -- 0 0 0 0 0 0 0 0West North Central 0 0 -- 0 0 0 0 0 0 0 0Iowa 0 0 -- 0 0 0 0 0 0 0 0Kansas 0 0 -- 0 0 0 0 0 0 0 0Minnesota 0 0 -- 0 0 0 0 0 0 0 0Missouri 0 0 -- 0 0 0 0 0 0 0 0Nebraska 0 0 -- 0 0 0 0 0 0 0 0North Dakota 0 0 -- 0 0 0 0 0 0 0 0South Dakota 0 0 -- 0 0 0 0 0 0 0 0South Atlantic 0 0 -- 0 0 0 0 0 0 0 0Delaware 0 0 -- 0 0 0 0 0 0 0 0District of Columbia 0 0 -- 0 0 0 0 0 0 0 0Florida 0 0 -- 0 0 0 0 0 0 0 0Georgia 0 0 -- 0 0 0 0 0 0 0 0Maryland 0 0 -- 0 0 0 0 0 0 0 0North Carolina 0 0 -- 0 0 0 0 0 0 0 0South Carolina 0 0 -- 0 0 0 0 0 0 0 0Virginia 0 0 -- 0 0 0 0 0 0 0 0West Virginia 0 0 -- 0 0 0 0 0 0 0 0East South Central 0 0 -- 0 0 0 0 0 0 0 0Alabama 0 0 -- 0 0 0 0 0 0 0 0Kentucky 0 0 -- 0 0 0 0 0 0 0 0Mississippi 0 0 -- 0 0 0 0 0 0 0 0Tennessee 0 0 -- 0 0 0 0 0 0 0 0West South Central 0 0 -- 0 0 0 0 0 0 0 0Arkansas 0 0 -- 0 0 0 0 0 0 0 0Louisiana 0 0 -- 0 0 0 0 0 0 0 0Oklahoma 0 0 -- 0 0 0 0 0 0 0 0Texas 0 0 -- 0 0 0 0 0 0 0 0Mountain 1,354 1,317 2.8% 86 90 1,268 1,227 0 0 0 0Arizona 0 0 -- 0 0 0 0 0 0 0 0Colorado 0 0 -- 0 0 0 0 0 0 0 0Idaho 22 23 -3.0% 0 0 22 23 0 0 0 0Montana 0 0 -- 0 0 0 0 0 0 0 0Nevada 1,179 1,133 4.1% 0 0 1,179 1,133 0 0 0 0New Mexico 4 5 -27.0% 0 0 4 5 0 0 0 0Utah 149 157 -4.8% 86 90 63 67 0 0 0 0Wyoming 0 0 -- 0 0 0 0 0 0 0 0Pacific Contiguous 3,837 3,976 -3.5% 244 257 3,593 3,719 0 0 0 0California 3,776 3,910 -3.4% 244 256 3,531 3,653 0 0 0 0Oregon 61 66 -7.9% 0 1 61 65 0 0 0 0Washington 0 0 -- 0 0 0 0 0 0 0 0Pacific Noncontiguous 82 85 -3.7% 0 0 82 85 0 0 0 0Alaska 0 0 -- 0 0 0 0 0 0 0 0Hawaii 82 85 -3.7% 0 0 82 85 0 0 0 0U.S. Total 5,272 5,378 -2.0% 330 347 4,942 5,031 0 0 0 0
Table 1.16.B. Utility Scale Facility Net Generation from Geothermal
by State, by Sector, Year-to-Date through April 2018 and 2017 (Thousand Megawatthours)All Sectors Electric Power Sector Commercial Sector Industrial Sector
Displayed values of zero may represent small values that round to zero. The Excel version of this table provides additional precision which may be accessed by selecting individual cells.NM = Not meaningful due to large relative standard error or excessive percentage change.Notes: See Glossary for definitions. Values are preliminary. See Technical Notes for a discussion of the sample design for the Form EIA-923.Negative generation denotes that electric power consumed for plant use exceeds gross generation.Totals may not equal sum of components because of independent rounding. Percentage change is calculated before rounding.Source: U.S. Energy Information Administration, Form EIA-923, Power Plant Operations Report.
Electric UtilitiesIndependent
Power Producers
Generation at Utility Scale FacilitiesGeneration at Utility Scale
FacilitiesGeneration at Utility Scale
FacilitiesGeneration at Utility Scale
FacilitiesGeneration at Utility Scale
Facilities
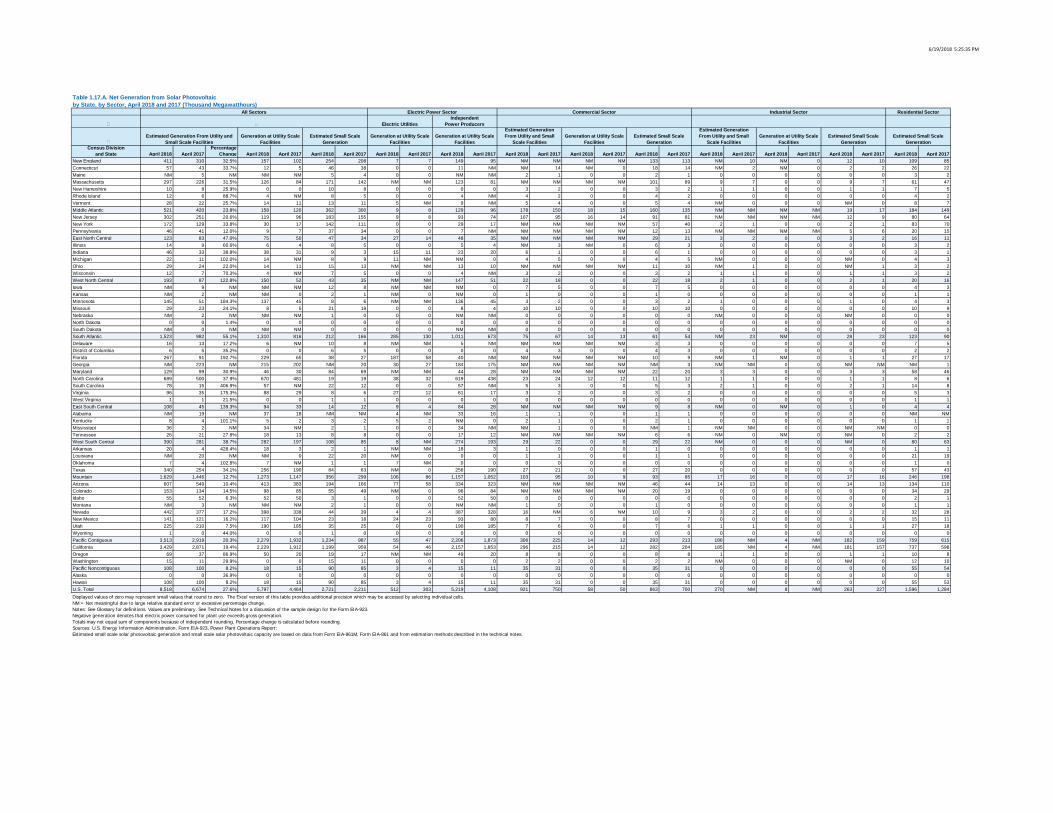
6/19/2018 5:25:35 PM
Census Divisionand State April 2018 April 2017
PercentageChange April 2018 April 2017 April 2018 April 2017 April 2018 April 2017 April 2018 April 2017 April 2018 April 2017 April 2018 April 2017 April 2018 April 2017 April 2018 April 2017 April 2018 April 2017 April 2018 April 2017 April 2018 April 2017
New England 411 310 32.5% 157 102 254 208 7 7 149 95 NM NM NM NM 133 113 NM 10 NM 0 12 10 109 85Connecticut 57 43 33.7% 12 5 46 38 0 0 11 NM NM 14 NM 0 18 14 NM 2 NM 0 2 2 26 22Maine NM 5 NM NM NM 5 4 0 0 NM NM 2 1 0 0 2 1 0 0 0 0 0 0 3 2Massachusetts 297 226 31.5% 126 84 171 142 NM NM 123 81 NM NM NM NM 101 89 9 7 0 0 9 7 61 47New Hampshire 10 8 25.9% 0 0 10 8 0 0 0 0 3 2 0 0 3 2 1 1 0 0 1 1 7 5Rhode Island 12 6 88.7% 4 NM 8 5 0 0 4 NM 4 2 0 0 4 2 0 0 0 0 0 0 4 2Vermont 28 22 25.7% 14 11 13 11 5 NM 9 NM 5 4 0 0 5 4 NM 0 0 0 NM 0 8 7Middle Atlantic 521 420 23.8% 158 120 362 300 9 8 129 96 178 150 18 15 160 135 NM NM NM NM 19 17 184 149New Jersey 302 251 20.6% 119 96 183 155 9 8 93 74 107 95 16 14 91 81 NM NM NM NM 12 9 80 64New York 172 129 33.8% 30 17 142 111 0 0 29 17 NM NM NM NM 57 40 2 1 0 0 2 1 83 70Pennsylvania 46 41 12.0% 9 7 37 34 0 0 7 NM NM NM NM NM 12 13 NM NM NM NM 5 6 20 15East North Central 123 83 47.0% 75 50 47 34 27 14 48 35 NM NM NM NM 29 21 3 2 0 0 3 2 16 11Illinois 14 9 60.6% 6 4 8 5 0 0 5 4 NM 3 NM 0 6 3 0 0 0 0 0 0 3 2Indiana 46 33 38.8% 38 31 9 3 15 11 23 20 6 1 0 0 6 1 0 0 0 0 0 0 3 1Michigan 22 11 102.0% 14 NM 8 9 11 NM NM 0 4 5 0 0 4 5 NM 0 0 0 NM 0 4 3Ohio 29 24 22.0% 14 11 15 13 NM NM 13 10 NM NM NM NM 11 10 NM 1 0 0 NM 1 3 2Wisconsin 12 7 70.3% 4 NM 7 5 0 0 4 NM 3 2 0 0 3 2 1 1 0 0 1 1 3 2West North Central 193 87 122.8% 150 52 43 35 NM NM 147 51 22 18 0 0 22 18 2 1 0 0 2 1 20 16Iowa NM 9 NM NM NM 12 8 NM NM NM 0 7 5 0 0 7 5 0 0 0 0 0 0 4 3Kansas NM 2 NM NM 0 2 1 NM 0 NM 0 1 0 0 0 1 0 0 0 0 0 0 0 1 1Minnesota 145 51 184.3% 137 45 8 6 NM NM 136 45 3 2 0 0 3 2 1 0 0 0 1 0 4 3Missouri 29 23 24.1% 8 5 21 19 0 0 8 4 10 10 0 0 10 10 0 0 0 0 0 0 10 9Nebraska NM 2 NM NM NM 1 0 0 0 NM NM 0 0 0 0 0 0 NM 0 0 0 NM 0 0 0North Dakota 0 0 1.4% 0 0 0 0 0 0 0 0 0 0 0 0 0 0 0 0 0 0 0 0 0 0South Dakota NM 0 NM NM NM 0 0 0 0 NM NM 0 0 0 0 0 0 0 0 0 0 0 0 0 0South Atlantic 1,523 982 55.1% 1,310 816 212 166 285 130 1,011 673 75 67 14 13 61 54 NM 23 NM 0 28 23 123 90Delaware 16 13 17.2% 6 NM 10 8 NM NM 5 NM NM NM NM NM 3 3 0 0 0 0 0 0 7 5District of Columbia 6 5 35.2% 0 0 6 5 0 0 0 0 4 3 0 0 4 3 0 0 0 0 0 0 2 2Florida 267 91 192.7% 229 65 38 27 187 58 40 NM NM NM NM NM 10 9 NM 1 NM 0 1 1 27 17Georgia NM 223 NM 215 202 NM 20 30 27 184 175 NM NM NM NM NM 3 NM NM 0 0 NM NM NM 1Maryland 129 99 30.9% 46 30 84 69 NM NM 44 28 NM NM NM NM 22 20 3 3 0 0 3 3 58 46North Carolina 689 500 37.9% 670 481 19 19 38 32 619 438 23 24 12 12 11 12 1 1 0 0 1 1 8 6South Carolina 78 15 406.9% 57 NM 22 12 0 0 57 NM 5 3 0 0 5 3 2 1 0 0 2 1 14 8Virginia 96 35 175.3% 88 29 8 6 27 12 61 17 3 2 0 0 3 2 0 0 0 0 0 0 5 3West Virginia 1 1 21.5% 0 0 1 1 0 0 0 0 0 0 0 0 0 0 0 0 0 0 0 0 1 1East South Central 108 45 139.3% 94 33 14 12 9 4 84 28 NM NM NM NM 9 8 NM 0 NM 0 1 0 4 4Alabama NM 19 NM 37 18 NM NM 4 NM 33 16 1 1 0 0 1 1 0 0 0 0 0 0 NM NMKentucky 8 4 101.1% 5 2 3 2 5 2 NM 0 2 1 0 0 2 1 0 0 0 0 0 0 1 1Mississippi 36 2 NM 34 NM 2 1 0 0 34 NM NM 1 0 0 NM 1 NM NM 0 0 NM NM 0 0Tennessee 26 21 27.8% 18 13 8 8 0 0 17 12 NM NM NM NM 6 6 NM 0 NM 0 NM 0 2 2West South Central 390 281 38.7% 282 197 108 85 8 NM 274 193 29 22 0 0 29 22 NM 0 0 0 NM 0 80 63Arkansas 20 4 428.4% 18 3 2 1 NM NM 18 3 1 0 0 0 1 0 0 0 0 0 0 0 1 1Louisiana NM 20 NM NM 0 22 20 NM 0 0 0 1 1 0 0 1 1 0 0 0 0 0 0 21 19Oklahoma 7 4 102.8% 7 NM 1 1 7 NM 0 0 0 0 0 0 0 0 0 0 0 0 0 0 1 0Texas 340 254 34.1% 256 190 84 63 NM 0 256 190 27 21 0 0 27 20 0 0 0 0 0 0 57 43Mountain 1,629 1,446 12.7% 1,273 1,147 356 299 106 86 1,157 1,052 103 95 10 9 93 85 17 16 0 0 17 16 246 198Arizona 607 549 10.4% 413 383 194 166 77 58 334 323 NM NM NM NM 46 44 14 13 0 0 14 13 134 110Colorado 153 134 14.5% 98 85 55 49 NM 0 96 84 NM NM NM NM 20 19 0 0 0 0 0 0 34 29Idaho 55 52 6.3% 52 50 3 1 0 0 52 50 0 0 0 0 0 0 0 0 0 0 0 0 2 1Montana NM 3 NM NM NM 2 1 0 0 NM NM 1 0 0 0 1 0 0 0 0 0 0 0 1 1Nevada 442 377 17.2% 398 338 44 39 4 4 387 328 16 NM 6 NM 10 9 3 2 0 0 2 2 32 28New Mexico 141 121 16.2% 117 104 23 18 24 23 93 80 8 7 0 0 8 7 0 0 0 0 0 0 15 11Utah 225 210 7.5% 190 185 35 25 0 0 190 185 7 6 0 0 7 6 1 1 0 0 1 1 27 18Wyoming 1 0 44.0% 0 0 1 0 0 0 0 0 0 0 0 0 0 0 0 0 0 0 0 0 0 0Pacific Contiguous 3,513 2,919 20.3% 2,279 1,932 1,234 987 55 47 2,206 1,873 306 225 14 12 293 213 186 NM 4 NM 182 159 759 615California 3,429 2,871 19.4% 2,229 1,912 1,199 959 54 46 2,157 1,853 296 215 14 12 282 204 185 NM 4 NM 181 157 737 598Oregon 69 37 86.9% 50 20 19 17 NM NM 49 20 8 8 0 0 8 8 1 1 0 0 1 1 10 8Washington 15 11 29.9% 0 0 15 11 0 0 0 0 2 2 0 0 2 2 NM 0 0 0 NM 0 12 10Pacific Noncontiguous 108 100 8.2% 18 15 90 85 3 4 15 11 35 31 0 0 35 31 0 0 0 0 0 0 55 54Alaska 0 0 36.9% 0 0 0 0 0 0 0 0 0 0 0 0 0 0 0 0 0 0 0 0 0 0Hawaii 108 100 8.2% 18 15 90 85 3 4 15 11 35 31 0 0 35 31 0 0 0 0 0 0 55 53U.S. Total 8,518 6,674 27.6% 5,797 4,464 2,721 2,211 512 303 5,219 4,108 921 750 58 50 863 700 270 NM 8 NM 263 227 1,596 1,284
Table 1.17.A. Net Generation from Solar Photovoltaicby State, by Sector, April 2018 and 2017 (Thousand Megawatthours)
All Sectors Electric Power Sector Commercial Sector Industrial Sector Residential Sector
Electric UtilitiesIndependent
Power Producers
Displayed values of zero may represent small values that round to zero. The Excel version of this table provides additional precision which may be accessed by selecting individual cells.NM = Not meaningful due to large relative standard error or excessive percentage change.Notes: See Glossary for definitions. Values are preliminary. See Technical Notes for a discussion of the sample design for the Form EIA-923.Negative generation denotes that electric power consumed for plant use exceeds gross generation.Totals may not equal sum of components because of independent rounding. Percentage change is calculated before rounding.Sources: U.S. Energy Information Administration, Form EIA-923, Power Plant Operations Report;Estimated small scale solar photovoltaic generation and small scale solar photovoltaic capacity are based on data from Form EIA-861M, Form EIA-861 and from estimation methods described in the technical notes.
Generation at Utility Scale Facilities
Estimated Small Scale Generation
Estimated Generation From Utility and Small
Scale FacilitiesGeneration at Utility Scale
FacilitiesEstimated Small Scale
GenerationEstimated Small Scale
GenerationEstimated Generation From Utility and
Small Scale FacilitiesGeneration at Utility Scale
FacilitiesEstimated Small Scale
GenerationGeneration at Utility Scale
FacilitiesGeneration at Utility Scale
Facilities
Estimated Generation From Utility and Small
Scale Facilities
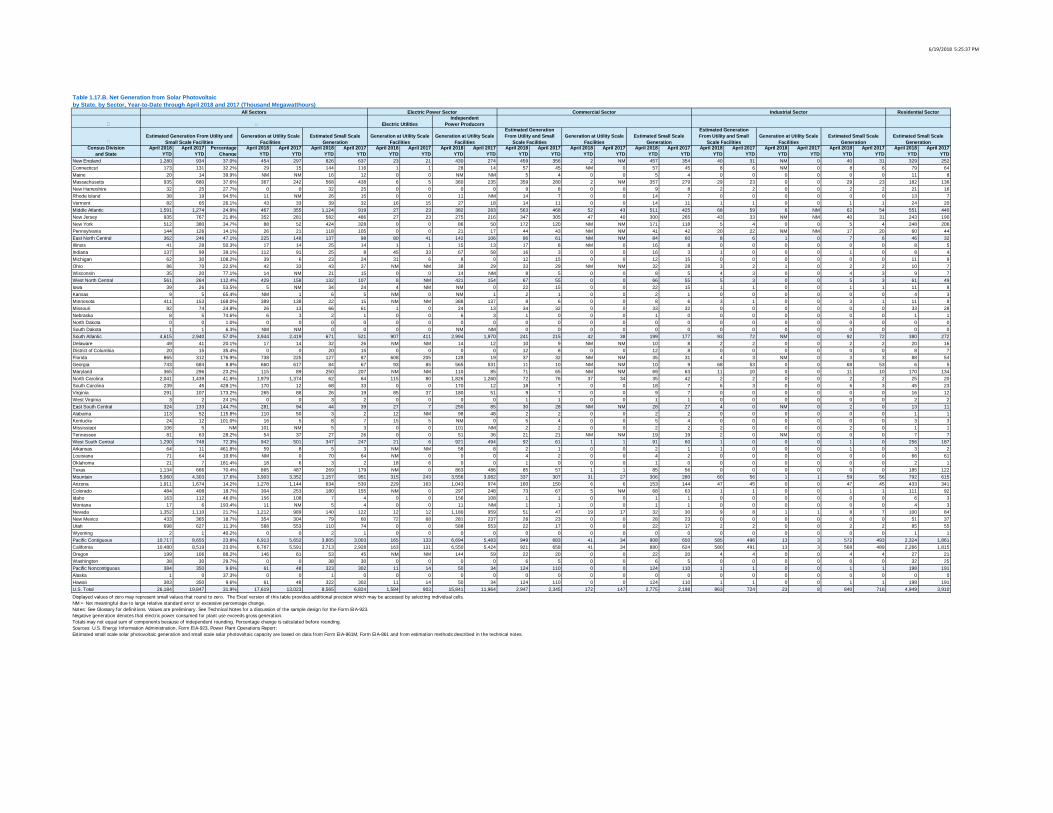
6/19/2018 5:25:37 PM
Census Divisionand State
April 2018 YTD
April 2017 YTD
PercentageChange
April 2018 YTD
April 2017 YTD
April 2018 YTD
April 2017 YTD
April 2018 YTD
April 2017 YTD
April 2018 YTD
April 2017 YTD
April 2018 YTD
April 2017 YTD
April 2018 YTD
April 2017 YTD
April 2018 YTD
April 2017 YTD
April 2018 YTD
April 2017 YTD
April 2018 YTD
April 2017 YTD
April 2018 YTD
April 2017 YTD
April 2018 YTD
April 2017 YTD
New England 1,280 934 37.0% 454 297 826 637 23 21 430 274 459 356 2 NM 457 354 40 31 NM 0 40 31 329 252Connecticut 173 131 32.2% 29 15 144 116 1 1 28 14 57 45 NM 0 57 45 8 6 NM 0 8 6 79 64Maine 20 14 39.9% NM NM 16 12 0 0 NM NM 5 4 0 0 5 4 0 0 0 0 0 0 11 8Massachusetts 935 680 37.6% 367 242 568 438 6 5 360 235 359 280 2 NM 357 279 29 23 0 0 29 23 182 136New Hampshire 32 25 27.7% 0 0 32 25 0 0 0 0 9 8 0 0 9 8 2 2 0 0 2 2 21 16Rhode Island 38 19 94.5% 11 NM 26 15 0 0 11 NM 14 7 0 0 14 7 0 0 0 0 0 0 13 7Vermont 82 65 26.1% 43 33 39 32 16 15 27 18 14 11 0 0 14 11 1 1 0 0 1 1 24 20Middle Atlantic 1,591 1,274 24.9% 467 355 1,124 919 27 23 382 283 563 468 52 43 511 425 68 59 6 NM 62 54 551 440New Jersey 935 767 21.8% 352 281 582 486 27 23 275 216 347 305 47 40 300 265 43 33 NM NM 40 31 243 190New York 512 380 34.7% 88 52 424 328 0 0 86 50 172 120 NM NM 171 118 5 4 0 0 5 4 248 206Pennsylvania 144 126 14.1% 26 21 118 105 0 0 21 17 44 43 NM NM 41 42 20 22 NM NM 17 20 60 44East North Central 362 246 47.1% 225 148 137 98 80 41 142 106 86 61 NM NM 84 60 8 6 1 0 7 6 46 32Illinois 41 28 50.3% 17 14 25 14 1 1 15 13 17 8 NM 0 16 8 0 0 0 0 0 0 8 5Indiana 137 99 39.1% 112 91 25 8 45 33 67 58 16 3 0 0 16 3 1 0 0 0 1 0 8 4Michigan 62 30 108.2% 39 6 23 24 31 6 8 0 12 15 0 0 12 15 0 0 0 0 0 0 11 9Ohio 86 70 22.5% 42 33 43 37 NM NM 38 29 33 29 NM NM 32 28 3 2 1 0 2 2 10 7Wisconsin 35 20 77.1% 14 NM 21 15 0 0 14 NM 8 5 0 0 8 5 4 3 0 0 4 3 9 7West North Central 561 264 112.4% 429 158 132 107 8 NM 421 154 67 55 0 0 66 55 5 3 0 0 5 3 61 49Iowa 39 26 53.5% 5 NM 34 24 4 NM NM 0 22 15 0 0 22 15 1 1 0 0 1 1 11 8Kansas 9 5 65.4% NM 1 6 5 NM 0 NM 1 2 1 0 0 2 1 0 0 0 0 0 0 4 3Minnesota 411 153 168.0% 389 138 22 15 NM NM 388 137 8 6 0 0 8 6 3 1 0 0 3 1 11 8Missouri 92 74 24.8% 26 13 66 61 1 0 24 13 34 32 0 0 33 32 0 0 0 0 0 0 33 28Nebraska 8 5 74.6% 6 3 2 1 0 0 6 3 1 0 0 0 1 0 0 0 0 0 0 0 1 1North Dakota 0 0 1.0% 0 0 0 0 0 0 0 0 0 0 0 0 0 0 0 0 0 0 0 0 0 0South Dakota 1 1 6.3% NM NM 0 0 0 0 NM NM 0 0 0 0 0 0 0 0 0 0 0 0 0 0South Atlantic 4,615 2,940 57.0% 3,944 2,419 671 521 907 411 2,994 1,970 241 215 42 38 199 177 93 72 NM 0 92 72 380 272Delaware 49 41 20.1% 17 14 32 26 NM NM 14 12 10 9 NM NM 10 8 2 2 0 0 2 2 20 16District of Columbia 20 15 35.4% 0 0 20 15 0 0 0 0 12 8 0 0 12 8 0 0 0 0 0 0 8 7Florida 865 312 176.9% 738 225 127 87 608 205 128 19 37 32 NM NM 35 31 4 3 NM 0 3 3 88 54Georgia 743 684 8.8% 660 617 84 67 93 85 565 531 11 10 NM NM 10 9 68 53 0 0 68 53 6 5Maryland 365 296 23.2% 115 89 250 207 NM NM 110 85 71 65 NM NM 69 63 11 10 0 0 11 10 170 134North Carolina 2,041 1,439 41.8% 1,979 1,374 62 64 115 80 1,826 1,260 72 76 37 34 35 42 2 2 0 0 2 2 25 20South Carolina 239 45 428.1% 170 12 68 33 0 0 170 12 18 7 0 0 18 7 6 3 0 0 6 3 45 23Virginia 291 107 173.2% 265 88 26 19 85 37 180 51 9 7 0 0 9 7 0 0 0 0 0 0 16 12West Virginia 3 2 24.1% 0 0 3 2 0 0 0 0 1 1 0 0 1 1 0 0 0 0 0 0 2 2East South Central 324 133 144.7% 281 94 44 39 27 7 250 85 30 28 NM NM 28 27 4 0 NM 0 2 0 13 11Alabama 113 52 115.8% 110 50 3 2 12 NM 98 48 2 2 0 0 2 2 0 0 0 0 0 0 1 1Kentucky 24 12 101.0% 16 5 8 7 15 5 NM 0 5 4 0 0 5 4 0 0 0 0 0 0 3 3Mississippi 106 5 NM 101 NM 5 3 0 0 101 NM 2 2 0 0 2 2 2 0 0 0 2 0 1 1Tennessee 81 63 28.2% 54 37 27 26 0 0 51 36 21 21 NM NM 19 19 2 0 NM 0 0 0 7 7West South Central 1,290 748 72.3% 942 501 347 247 21 6 921 494 92 61 1 1 91 60 1 0 0 0 1 0 256 187Arkansas 64 11 461.8% 59 8 5 3 NM NM 58 8 2 1 0 0 2 1 1 0 0 0 1 0 3 2Louisiana 71 64 10.6% NM 0 70 64 NM 0 0 0 4 2 0 0 4 2 0 0 0 0 0 0 66 61Oklahoma 21 7 181.4% 18 6 3 2 18 6 0 0 1 0 0 0 1 0 0 0 0 0 0 0 2 1Texas 1,134 666 70.4% 865 487 269 179 NM 0 863 486 85 57 1 1 85 56 0 0 0 0 0 0 185 122Mountain 5,060 4,303 17.6% 3,903 3,352 1,157 951 315 243 3,556 3,082 337 307 31 27 306 280 60 56 1 1 59 56 792 615Arizona 1,911 1,674 14.2% 1,278 1,144 634 530 229 163 1,043 974 160 150 6 6 153 144 47 45 0 0 47 45 433 341Colorado 484 408 18.7% 304 253 180 155 NM 0 297 248 73 67 5 NM 68 63 1 1 0 0 1 1 111 92Idaho 163 112 46.0% 156 108 7 4 0 0 156 108 1 1 0 0 1 1 0 0 0 0 0 0 6 3Montana 17 6 193.4% 11 NM 5 4 0 0 11 NM 1 1 0 0 1 1 0 0 0 0 0 0 4 3Nevada 1,352 1,110 21.7% 1,212 989 140 122 12 12 1,180 959 51 47 19 17 32 30 9 8 1 1 8 7 100 84New Mexico 433 365 18.7% 354 304 79 60 72 68 281 237 28 23 0 0 28 23 0 0 0 0 0 0 51 37Utah 698 627 11.3% 588 553 110 74 0 0 588 553 22 17 0 0 22 17 2 2 0 0 2 2 85 55Wyoming 2 1 40.2% 0 0 2 1 0 0 0 0 0 0 0 0 0 0 0 0 0 0 0 0 1 1Pacific Contiguous 10,717 8,655 23.8% 6,913 5,652 3,805 3,003 165 133 6,694 5,483 949 683 41 34 908 650 585 496 13 3 572 493 2,324 1,861California 10,480 8,519 23.0% 6,767 5,591 3,713 2,928 163 131 6,550 5,424 921 658 41 34 880 624 580 491 13 3 568 489 2,266 1,815Oregon 199 106 88.2% 146 61 53 45 NM NM 144 59 22 20 0 0 22 20 4 4 0 0 4 4 27 21Washington 38 30 29.7% 0 0 38 30 0 0 0 0 6 5 0 0 6 5 0 0 0 0 0 0 32 25Pacific Noncontiguous 384 350 9.6% 61 48 323 302 11 14 50 34 124 110 0 0 124 110 1 1 0 0 1 1 198 191Alaska 1 0 37.3% 0 0 1 0 0 0 0 0 0 0 0 0 0 0 0 0 0 0 0 0 0 0Hawaii 383 350 9.6% 61 48 322 302 11 14 50 34 124 110 0 0 124 110 1 1 0 0 1 1 198 191U.S. Total 26,184 19,847 31.9% 17,619 13,023 8,565 6,824 1,584 903 15,841 11,964 2,947 2,345 172 147 2,775 2,198 863 724 23 8 840 716 4,949 3,910
Table 1.17.B. Net Generation from Solar Photovoltaicby State, by Sector, Year-to-Date through April 2018 and 2017 (Thousand Megawatthours)
All Sectors Electric Power Sector Commercial Sector Industrial Sector Residential Sector
Electric UtilitiesIndependent
Power Producers
Displayed values of zero may represent small values that round to zero. The Excel version of this table provides additional precision which may be accessed by selecting individual cells.NM = Not meaningful due to large relative standard error or excessive percentage change.Notes: See Glossary for definitions. Values are preliminary. See Technical Notes for a discussion of the sample design for the Form EIA-923.Negative generation denotes that electric power consumed for plant use exceeds gross generation.Totals may not equal sum of components because of independent rounding. Percentage change is calculated before rounding.Sources: U.S. Energy Information Administration, Form EIA-923, Power Plant Operations Report;Estimated small scale solar photovoltaic generation and small scale solar photovoltaic capacity are based on data from Form EIA-861M, Form EIA-861 and from estimation methods described in the technical notes.
Generation at Utility Scale Facilities
Estimated Small Scale Generation
Estimated Generation From Utility and Small
Scale FacilitiesGeneration at Utility Scale
FacilitiesEstimated Small Scale
GenerationEstimated Small Scale
GenerationEstimated Generation From Utility and
Small Scale FacilitiesGeneration at Utility Scale
FacilitiesEstimated Small Scale
GenerationGeneration at Utility Scale
FacilitiesGeneration at Utility Scale
Facilities
Estimated Generation From Utility and Small
Scale Facilities
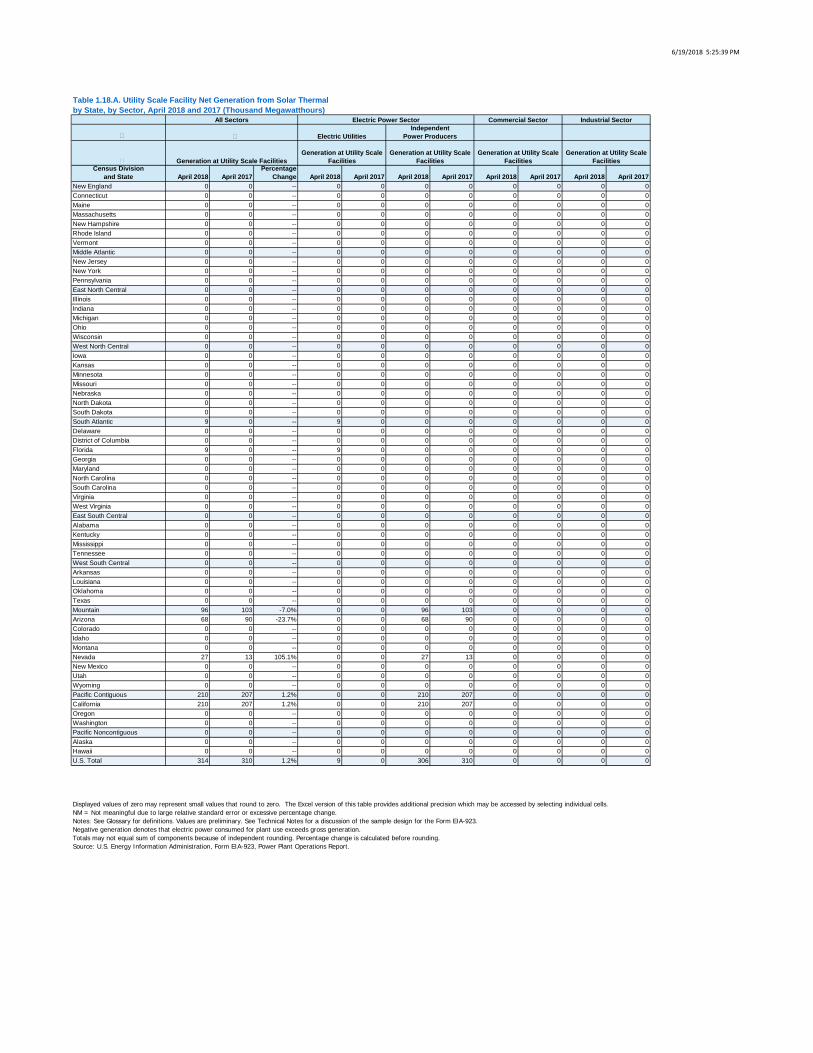
6/19/2018 5:25:39 PM
Census Divisionand State April 2018 April 2017
PercentageChange April 2018 April 2017 April 2018 April 2017 April 2018 April 2017 April 2018 April 2017
New England 0 0 -- 0 0 0 0 0 0 0 0Connecticut 0 0 -- 0 0 0 0 0 0 0 0Maine 0 0 -- 0 0 0 0 0 0 0 0Massachusetts 0 0 -- 0 0 0 0 0 0 0 0New Hampshire 0 0 -- 0 0 0 0 0 0 0 0Rhode Island 0 0 -- 0 0 0 0 0 0 0 0Vermont 0 0 -- 0 0 0 0 0 0 0 0Middle Atlantic 0 0 -- 0 0 0 0 0 0 0 0New Jersey 0 0 -- 0 0 0 0 0 0 0 0New York 0 0 -- 0 0 0 0 0 0 0 0Pennsylvania 0 0 -- 0 0 0 0 0 0 0 0East North Central 0 0 -- 0 0 0 0 0 0 0 0Illinois 0 0 -- 0 0 0 0 0 0 0 0Indiana 0 0 -- 0 0 0 0 0 0 0 0Michigan 0 0 -- 0 0 0 0 0 0 0 0Ohio 0 0 -- 0 0 0 0 0 0 0 0Wisconsin 0 0 -- 0 0 0 0 0 0 0 0West North Central 0 0 -- 0 0 0 0 0 0 0 0Iowa 0 0 -- 0 0 0 0 0 0 0 0Kansas 0 0 -- 0 0 0 0 0 0 0 0Minnesota 0 0 -- 0 0 0 0 0 0 0 0Missouri 0 0 -- 0 0 0 0 0 0 0 0Nebraska 0 0 -- 0 0 0 0 0 0 0 0North Dakota 0 0 -- 0 0 0 0 0 0 0 0South Dakota 0 0 -- 0 0 0 0 0 0 0 0South Atlantic 9 0 -- 9 0 0 0 0 0 0 0Delaware 0 0 -- 0 0 0 0 0 0 0 0District of Columbia 0 0 -- 0 0 0 0 0 0 0 0Florida 9 0 -- 9 0 0 0 0 0 0 0Georgia 0 0 -- 0 0 0 0 0 0 0 0Maryland 0 0 -- 0 0 0 0 0 0 0 0North Carolina 0 0 -- 0 0 0 0 0 0 0 0South Carolina 0 0 -- 0 0 0 0 0 0 0 0Virginia 0 0 -- 0 0 0 0 0 0 0 0West Virginia 0 0 -- 0 0 0 0 0 0 0 0East South Central 0 0 -- 0 0 0 0 0 0 0 0Alabama 0 0 -- 0 0 0 0 0 0 0 0Kentucky 0 0 -- 0 0 0 0 0 0 0 0Mississippi 0 0 -- 0 0 0 0 0 0 0 0Tennessee 0 0 -- 0 0 0 0 0 0 0 0West South Central 0 0 -- 0 0 0 0 0 0 0 0Arkansas 0 0 -- 0 0 0 0 0 0 0 0Louisiana 0 0 -- 0 0 0 0 0 0 0 0Oklahoma 0 0 -- 0 0 0 0 0 0 0 0Texas 0 0 -- 0 0 0 0 0 0 0 0Mountain 96 103 -7.0% 0 0 96 103 0 0 0 0Arizona 68 90 -23.7% 0 0 68 90 0 0 0 0Colorado 0 0 -- 0 0 0 0 0 0 0 0Idaho 0 0 -- 0 0 0 0 0 0 0 0Montana 0 0 -- 0 0 0 0 0 0 0 0Nevada 27 13 105.1% 0 0 27 13 0 0 0 0New Mexico 0 0 -- 0 0 0 0 0 0 0 0Utah 0 0 -- 0 0 0 0 0 0 0 0Wyoming 0 0 -- 0 0 0 0 0 0 0 0Pacific Contiguous 210 207 1.2% 0 0 210 207 0 0 0 0California 210 207 1.2% 0 0 210 207 0 0 0 0Oregon 0 0 -- 0 0 0 0 0 0 0 0Washington 0 0 -- 0 0 0 0 0 0 0 0Pacific Noncontiguous 0 0 -- 0 0 0 0 0 0 0 0Alaska 0 0 -- 0 0 0 0 0 0 0 0Hawaii 0 0 -- 0 0 0 0 0 0 0 0U.S. Total 314 310 1.2% 9 0 306 310 0 0 0 0
Table 1.18.A. Utility Scale Facility Net Generation from Solar Thermalby State, by Sector, April 2018 and 2017 (Thousand Megawatthours)
All Sectors Electric Power Sector Commercial Sector Industrial Sector
Displayed values of zero may represent small values that round to zero. The Excel version of this table provides additional precision which may be accessed by selecting individual cells.NM = Not meaningful due to large relative standard error or excessive percentage change.Notes: See Glossary for definitions. Values are preliminary. See Technical Notes for a discussion of the sample design for the Form EIA-923.Negative generation denotes that electric power consumed for plant use exceeds gross generation.Totals may not equal sum of components because of independent rounding. Percentage change is calculated before rounding.Source: U.S. Energy Information Administration, Form EIA-923, Power Plant Operations Report.
Electric UtilitiesIndependent
Power Producers
Generation at Utility Scale FacilitiesGeneration at Utility Scale
FacilitiesGeneration at Utility Scale
FacilitiesGeneration at Utility Scale
FacilitiesGeneration at Utility Scale
Facilities
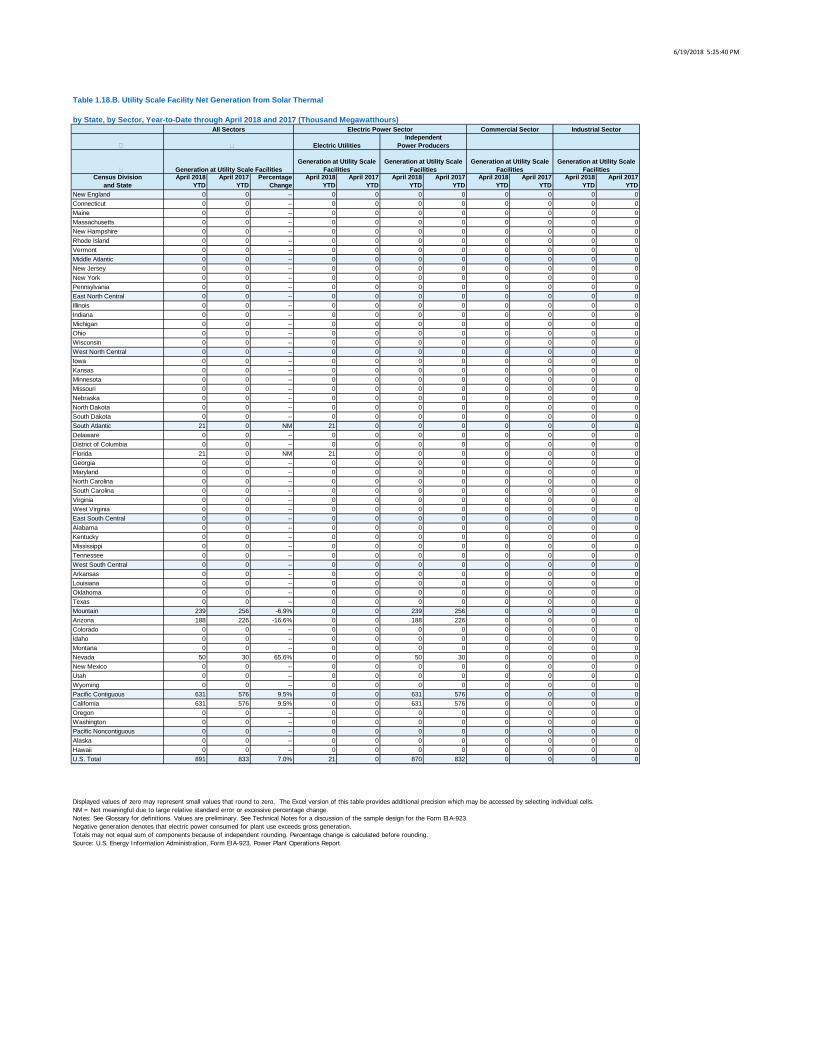
6/19/2018 5:25:40 PM
Census Divisionand State
April 2018 YTD
April 2017 YTD
PercentageChange
April 2018 YTD
April 2017 YTD
April 2018 YTD
April 2017 YTD
April 2018 YTD
April 2017 YTD
April 2018 YTD
April 2017 YTD
New England 0 0 -- 0 0 0 0 0 0 0 0Connecticut 0 0 -- 0 0 0 0 0 0 0 0Maine 0 0 -- 0 0 0 0 0 0 0 0Massachusetts 0 0 -- 0 0 0 0 0 0 0 0New Hampshire 0 0 -- 0 0 0 0 0 0 0 0Rhode Island 0 0 -- 0 0 0 0 0 0 0 0Vermont 0 0 -- 0 0 0 0 0 0 0 0Middle Atlantic 0 0 -- 0 0 0 0 0 0 0 0New Jersey 0 0 -- 0 0 0 0 0 0 0 0New York 0 0 -- 0 0 0 0 0 0 0 0Pennsylvania 0 0 -- 0 0 0 0 0 0 0 0East North Central 0 0 -- 0 0 0 0 0 0 0 0Illinois 0 0 -- 0 0 0 0 0 0 0 0Indiana 0 0 -- 0 0 0 0 0 0 0 0Michigan 0 0 -- 0 0 0 0 0 0 0 0Ohio 0 0 -- 0 0 0 0 0 0 0 0Wisconsin 0 0 -- 0 0 0 0 0 0 0 0West North Central 0 0 -- 0 0 0 0 0 0 0 0Iowa 0 0 -- 0 0 0 0 0 0 0 0Kansas 0 0 -- 0 0 0 0 0 0 0 0Minnesota 0 0 -- 0 0 0 0 0 0 0 0Missouri 0 0 -- 0 0 0 0 0 0 0 0Nebraska 0 0 -- 0 0 0 0 0 0 0 0North Dakota 0 0 -- 0 0 0 0 0 0 0 0South Dakota 0 0 -- 0 0 0 0 0 0 0 0South Atlantic 21 0 NM 21 0 0 0 0 0 0 0Delaware 0 0 -- 0 0 0 0 0 0 0 0District of Columbia 0 0 -- 0 0 0 0 0 0 0 0Florida 21 0 NM 21 0 0 0 0 0 0 0Georgia 0 0 -- 0 0 0 0 0 0 0 0Maryland 0 0 -- 0 0 0 0 0 0 0 0North Carolina 0 0 -- 0 0 0 0 0 0 0 0South Carolina 0 0 -- 0 0 0 0 0 0 0 0Virginia 0 0 -- 0 0 0 0 0 0 0 0West Virginia 0 0 -- 0 0 0 0 0 0 0 0East South Central 0 0 -- 0 0 0 0 0 0 0 0Alabama 0 0 -- 0 0 0 0 0 0 0 0Kentucky 0 0 -- 0 0 0 0 0 0 0 0Mississippi 0 0 -- 0 0 0 0 0 0 0 0Tennessee 0 0 -- 0 0 0 0 0 0 0 0West South Central 0 0 -- 0 0 0 0 0 0 0 0Arkansas 0 0 -- 0 0 0 0 0 0 0 0Louisiana 0 0 -- 0 0 0 0 0 0 0 0Oklahoma 0 0 -- 0 0 0 0 0 0 0 0Texas 0 0 -- 0 0 0 0 0 0 0 0Mountain 239 256 -6.9% 0 0 239 256 0 0 0 0Arizona 188 226 -16.6% 0 0 188 226 0 0 0 0Colorado 0 0 -- 0 0 0 0 0 0 0 0Idaho 0 0 -- 0 0 0 0 0 0 0 0Montana 0 0 -- 0 0 0 0 0 0 0 0Nevada 50 30 65.6% 0 0 50 30 0 0 0 0New Mexico 0 0 -- 0 0 0 0 0 0 0 0Utah 0 0 -- 0 0 0 0 0 0 0 0Wyoming 0 0 -- 0 0 0 0 0 0 0 0Pacific Contiguous 631 576 9.5% 0 0 631 576 0 0 0 0California 631 576 9.5% 0 0 631 576 0 0 0 0Oregon 0 0 -- 0 0 0 0 0 0 0 0Washington 0 0 -- 0 0 0 0 0 0 0 0Pacific Noncontiguous 0 0 -- 0 0 0 0 0 0 0 0Alaska 0 0 -- 0 0 0 0 0 0 0 0Hawaii 0 0 -- 0 0 0 0 0 0 0 0U.S. Total 891 833 7.0% 21 0 870 832 0 0 0 0
Table 1.18.B. Utility Scale Facility Net Generation from Solar Thermal
by State, by Sector, Year-to-Date through April 2018 and 2017 (Thousand Megawatthours)All Sectors Electric Power Sector Commercial Sector Industrial Sector
Displayed values of zero may represent small values that round to zero. The Excel version of this table provides additional precision which may be accessed by selecting individual cells.NM = Not meaningful due to large relative standard error or excessive percentage change.Notes: See Glossary for definitions. Values are preliminary. See Technical Notes for a discussion of the sample design for the Form EIA-923.Negative generation denotes that electric power consumed for plant use exceeds gross generation.Totals may not equal sum of components because of independent rounding. Percentage change is calculated before rounding.Source: U.S. Energy Information Administration, Form EIA-923, Power Plant Operations Report.
Electric UtilitiesIndependent
Power Producers
Generation at Utility Scale FacilitiesGeneration at Utility Scale
FacilitiesGeneration at Utility Scale
FacilitiesGeneration at Utility Scale
FacilitiesGeneration at Utility Scale
Facilities
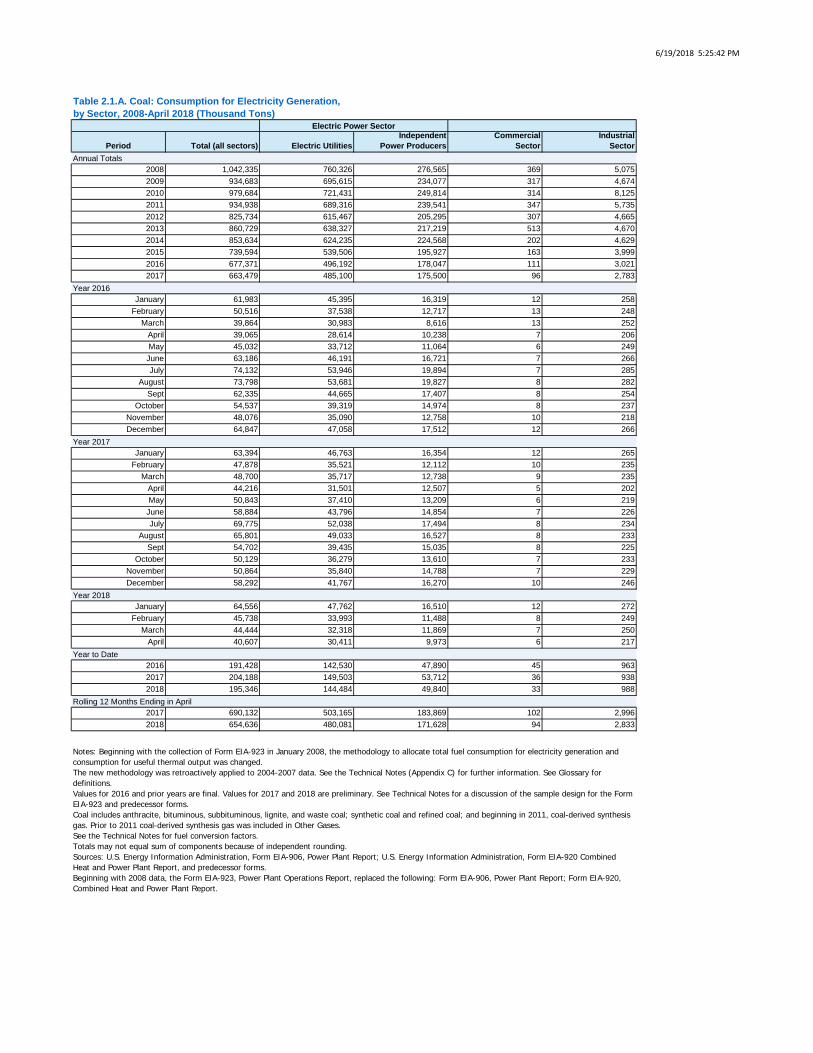
6/19/2018 5:25:42 PM
Period Total (all sectors) Electric UtilitiesIndependent
Power ProducersCommercial
SectorIndustrial
Sector
2008 1,042,335 760,326 276,565 369 5,0752009 934,683 695,615 234,077 317 4,6742010 979,684 721,431 249,814 314 8,1252011 934,938 689,316 239,541 347 5,7352012 825,734 615,467 205,295 307 4,6652013 860,729 638,327 217,219 513 4,6702014 853,634 624,235 224,568 202 4,6292015 739,594 539,506 195,927 163 3,9992016 677,371 496,192 178,047 111 3,0212017 663,479 485,100 175,500 96 2,783
January 61,983 45,395 16,319 12 258February 50,516 37,538 12,717 13 248
March 39,864 30,983 8,616 13 252April 39,065 28,614 10,238 7 206May 45,032 33,712 11,064 6 249June 63,186 46,191 16,721 7 266July 74,132 53,946 19,894 7 285
August 73,798 53,681 19,827 8 282Sept 62,335 44,665 17,407 8 254
October 54,537 39,319 14,974 8 237November 48,076 35,090 12,758 10 218December 64,847 47,058 17,512 12 266
January 63,394 46,763 16,354 12 265February 47,878 35,521 12,112 10 235
March 48,700 35,717 12,738 9 235April 44,216 31,501 12,507 5 202May 50,843 37,410 13,209 6 219June 58,884 43,796 14,854 7 226July 69,775 52,038 17,494 8 234
August 65,801 49,033 16,527 8 233Sept 54,702 39,435 15,035 8 225
October 50,129 36,279 13,610 7 233November 50,864 35,840 14,788 7 229December 58,292 41,767 16,270 10 246
January 64,556 47,762 16,510 12 272February 45,738 33,993 11,488 8 249
March 44,444 32,318 11,869 7 250April 40,607 30,411 9,973 6 217
2016 191,428 142,530 47,890 45 9632017 204,188 149,503 53,712 36 9382018 195,346 144,484 49,840 33 988
2017 690,132 503,165 183,869 102 2,9962018 654,636 480,081 171,628 94 2,833
Notes: Beginning with the collection of Form EIA-923 in January 2008, the methodology to allocate total fuel consumption for electricity generation and consumption for useful thermal output was changed.The new methodology was retroactively applied to 2004-2007 data. See the Technical Notes (Appendix C) for further information. See Glossary for definitions.Values for 2016 and prior years are final. Values for 2017 and 2018 are preliminary. See Technical Notes for a discussion of the sample design for the Form EIA-923 and predecessor forms.Coal includes anthracite, bituminous, subbituminous, lignite, and waste coal; synthetic coal and refined coal; and beginning in 2011, coal-derived synthesis gas. Prior to 2011 coal-derived synthesis gas was included in Other Gases.See the Technical Notes for fuel conversion factors.Totals may not equal sum of components because of independent rounding.Sources: U.S. Energy Information Administration, Form EIA-906, Power Plant Report; U.S. Energy Information Administration, Form EIA-920 Combined Heat and Power Plant Report, and predecessor forms.Beginning with 2008 data, the Form EIA-923, Power Plant Operations Report, replaced the following: Form EIA-906, Power Plant Report; Form EIA-920, Combined Heat and Power Plant Report.
Table 2.1.A. Coal: Consumption for Electricity Generation,by Sector, 2008-April 2018 (Thousand Tons)
Electric Power Sector
Annual Totals
Year 2016
Year 2017
Year 2018
Year to Date
Rolling 12 Months Ending in April
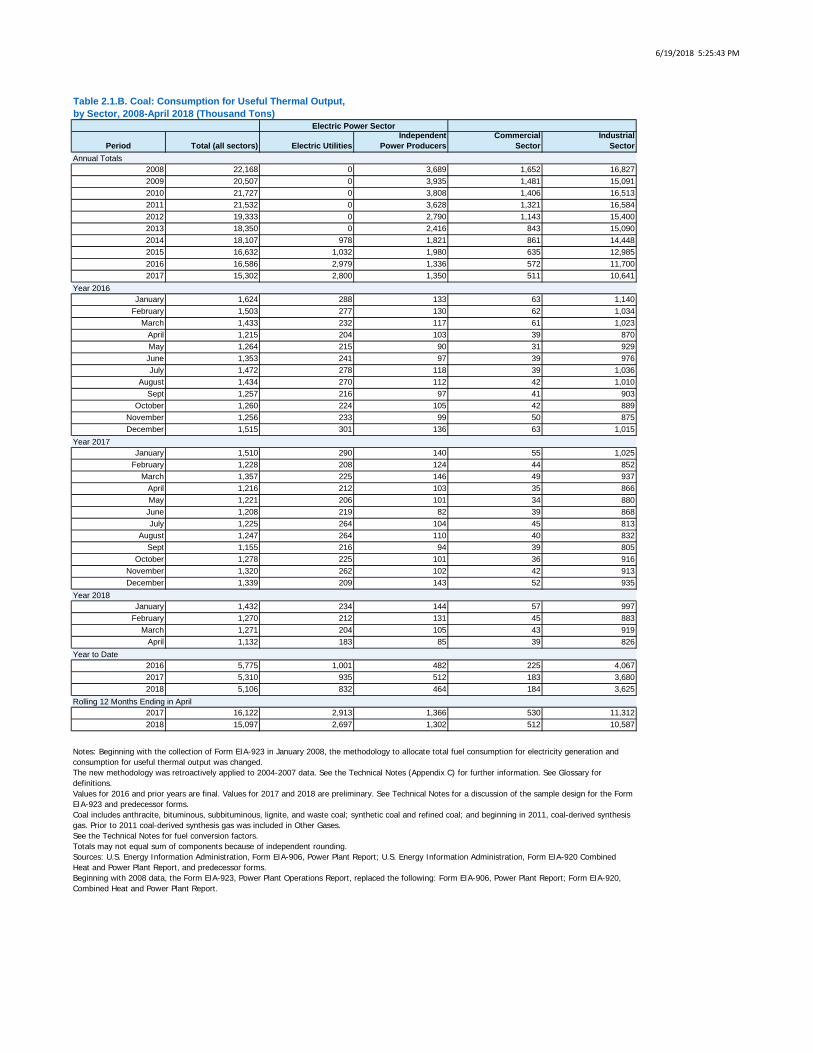
6/19/2018 5:25:43 PM
Period Total (all sectors) Electric UtilitiesIndependent
Power ProducersCommercial
SectorIndustrial
Sector
2008 22,168 0 3,689 1,652 16,8272009 20,507 0 3,935 1,481 15,0912010 21,727 0 3,808 1,406 16,5132011 21,532 0 3,628 1,321 16,5842012 19,333 0 2,790 1,143 15,4002013 18,350 0 2,416 843 15,0902014 18,107 978 1,821 861 14,4482015 16,632 1,032 1,980 635 12,9852016 16,586 2,979 1,336 572 11,7002017 15,302 2,800 1,350 511 10,641
January 1,624 288 133 63 1,140February 1,503 277 130 62 1,034
March 1,433 232 117 61 1,023April 1,215 204 103 39 870May 1,264 215 90 31 929June 1,353 241 97 39 976July 1,472 278 118 39 1,036
August 1,434 270 112 42 1,010Sept 1,257 216 97 41 903
October 1,260 224 105 42 889November 1,256 233 99 50 875December 1,515 301 136 63 1,015
January 1,510 290 140 55 1,025February 1,228 208 124 44 852
March 1,357 225 146 49 937April 1,216 212 103 35 866May 1,221 206 101 34 880June 1,208 219 82 39 868July 1,225 264 104 45 813
August 1,247 264 110 40 832Sept 1,155 216 94 39 805
October 1,278 225 101 36 916November 1,320 262 102 42 913December 1,339 209 143 52 935
January 1,432 234 144 57 997February 1,270 212 131 45 883
March 1,271 204 105 43 919April 1,132 183 85 39 826
2016 5,775 1,001 482 225 4,0672017 5,310 935 512 183 3,6802018 5,106 832 464 184 3,625
2017 16,122 2,913 1,366 530 11,3122018 15,097 2,697 1,302 512 10,587
Notes: Beginning with the collection of Form EIA-923 in January 2008, the methodology to allocate total fuel consumption for electricity generation and consumption for useful thermal output was changed.The new methodology was retroactively applied to 2004-2007 data. See the Technical Notes (Appendix C) for further information. See Glossary for definitions.Values for 2016 and prior years are final. Values for 2017 and 2018 are preliminary. See Technical Notes for a discussion of the sample design for the Form EIA-923 and predecessor forms.Coal includes anthracite, bituminous, subbituminous, lignite, and waste coal; synthetic coal and refined coal; and beginning in 2011, coal-derived synthesis gas. Prior to 2011 coal-derived synthesis gas was included in Other Gases.See the Technical Notes for fuel conversion factors.Totals may not equal sum of components because of independent rounding.Sources: U.S. Energy Information Administration, Form EIA-906, Power Plant Report; U.S. Energy Information Administration, Form EIA-920 Combined Heat and Power Plant Report, and predecessor forms.Beginning with 2008 data, the Form EIA-923, Power Plant Operations Report, replaced the following: Form EIA-906, Power Plant Report; Form EIA-920, Combined Heat and Power Plant Report.
Table 2.1.B. Coal: Consumption for Useful Thermal Output,by Sector, 2008-April 2018 (Thousand Tons)
Electric Power Sector
Annual Totals
Year 2016
Year 2017
Year 2018
Year to Date
Rolling 12 Months Ending in April
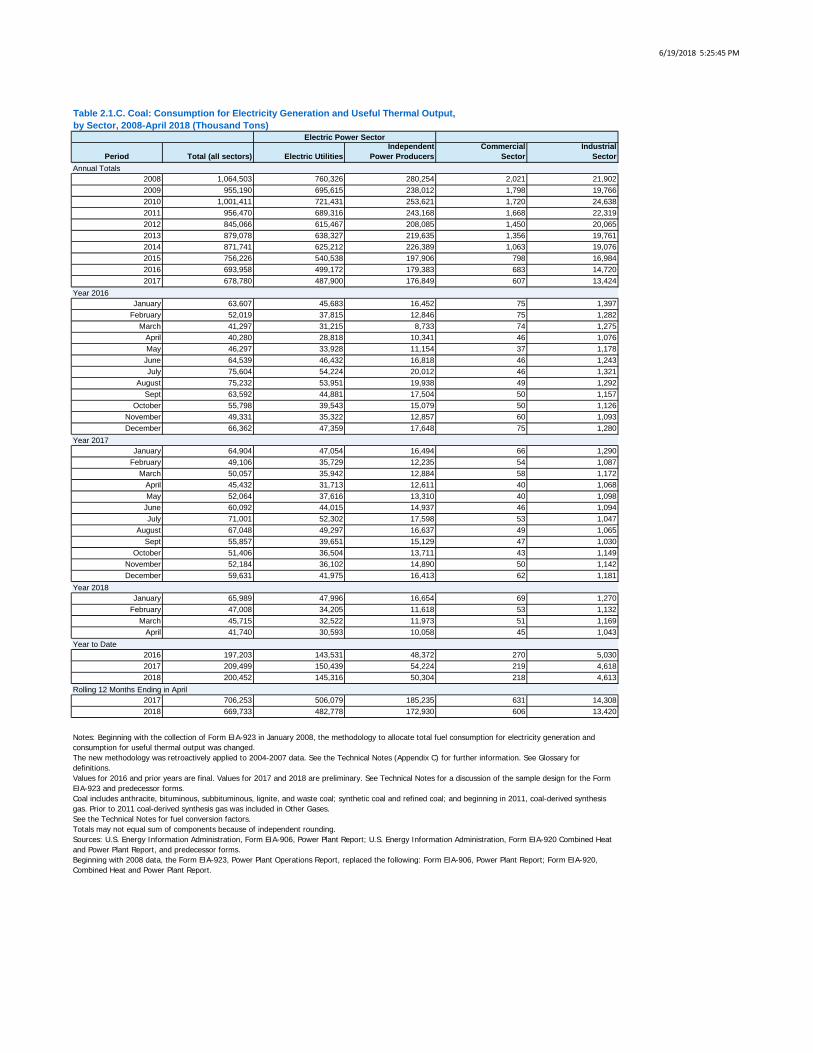
6/19/2018 5:25:45 PM
Period Total (all sectors) Electric UtilitiesIndependent
Power ProducersCommercial
SectorIndustrial
Sector
2008 1,064,503 760,326 280,254 2,021 21,9022009 955,190 695,615 238,012 1,798 19,7662010 1,001,411 721,431 253,621 1,720 24,6382011 956,470 689,316 243,168 1,668 22,3192012 845,066 615,467 208,085 1,450 20,0652013 879,078 638,327 219,635 1,356 19,7612014 871,741 625,212 226,389 1,063 19,0762015 756,226 540,538 197,906 798 16,9842016 693,958 499,172 179,383 683 14,7202017 678,780 487,900 176,849 607 13,424
January 63,607 45,683 16,452 75 1,397February 52,019 37,815 12,846 75 1,282
March 41,297 31,215 8,733 74 1,275April 40,280 28,818 10,341 46 1,076May 46,297 33,928 11,154 37 1,178
June 64,539 46,432 16,818 46 1,243July 75,604 54,224 20,012 46 1,321
August 75,232 53,951 19,938 49 1,292Sept 63,592 44,881 17,504 50 1,157
October 55,798 39,543 15,079 50 1,126November 49,331 35,322 12,857 60 1,093December 66,362 47,359 17,648 75 1,280
January 64,904 47,054 16,494 66 1,290February 49,106 35,729 12,235 54 1,087
March 50,057 35,942 12,884 58 1,172April 45,432 31,713 12,611 40 1,068May 52,064 37,616 13,310 40 1,098
June 60,092 44,015 14,937 46 1,094July 71,001 52,302 17,598 53 1,047
August 67,048 49,297 16,637 49 1,065Sept 55,857 39,651 15,129 47 1,030
October 51,406 36,504 13,711 43 1,149November 52,184 36,102 14,890 50 1,142December 59,631 41,975 16,413 62 1,181
January 65,989 47,996 16,654 69 1,270February 47,008 34,205 11,618 53 1,132
March 45,715 32,522 11,973 51 1,169April 41,740 30,593 10,058 45 1,043
2016 197,203 143,531 48,372 270 5,0302017 209,499 150,439 54,224 219 4,6182018 200,452 145,316 50,304 218 4,613
2017 706,253 506,079 185,235 631 14,3082018 669,733 482,778 172,930 606 13,420
Notes: Beginning with the collection of Form EIA-923 in January 2008, the methodology to allocate total fuel consumption for electricity generation and consumption for useful thermal output was changed.The new methodology was retroactively applied to 2004-2007 data. See the Technical Notes (Appendix C) for further information. See Glossary for definitions.Values for 2016 and prior years are final. Values for 2017 and 2018 are preliminary. See Technical Notes for a discussion of the sample design for the Form EIA-923 and predecessor forms.Coal includes anthracite, bituminous, subbituminous, lignite, and waste coal; synthetic coal and refined coal; and beginning in 2011, coal-derived synthesis gas. Prior to 2011 coal-derived synthesis gas was included in Other Gases.See the Technical Notes for fuel conversion factors.Totals may not equal sum of components because of independent rounding.Sources: U.S. Energy Information Administration, Form EIA-906, Power Plant Report; U.S. Energy Information Administration, Form EIA-920 Combined Heat and Power Plant Report, and predecessor forms.Beginning with 2008 data, the Form EIA-923, Power Plant Operations Report, replaced the following: Form EIA-906, Power Plant Report; Form EIA-920, Combined Heat and Power Plant Report.
Table 2.1.C. Coal: Consumption for Electricity Generation and Useful Thermal Output,by Sector, 2008-April 2018 (Thousand Tons)
Electric Power Sector
Annual Totals
Year 2016
Year 2017
Year 2018
Year to Date
Rolling 12 Months Ending in April
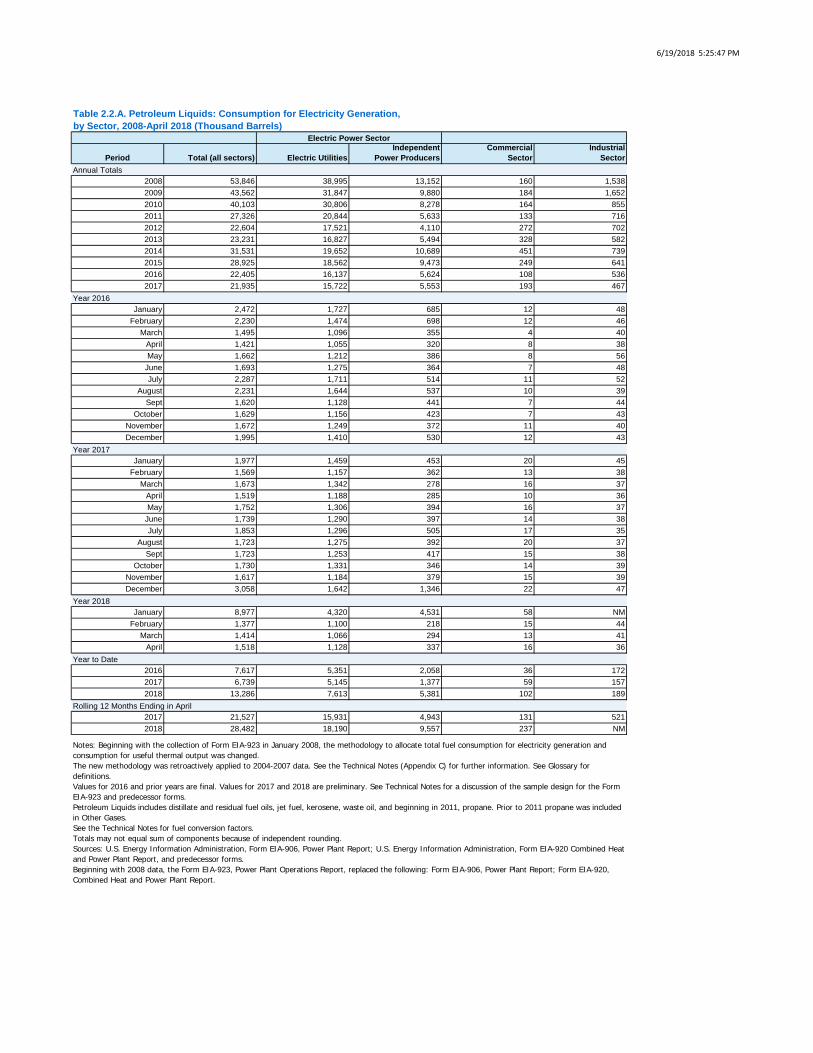
6/19/2018 5:25:47 PM
Period Total (all sectors) Electric UtilitiesIndependent
Power ProducersCommercial
SectorIndustrial
Sector
2008 53,846 38,995 13,152 160 1,5382009 43,562 31,847 9,880 184 1,6522010 40,103 30,806 8,278 164 8552011 27,326 20,844 5,633 133 7162012 22,604 17,521 4,110 272 7022013 23,231 16,827 5,494 328 5822014 31,531 19,652 10,689 451 7392015 28,925 18,562 9,473 249 6412016 22,405 16,137 5,624 108 5362017 21,935 15,722 5,553 193 467
January 2,472 1,727 685 12 48February 2,230 1,474 698 12 46
March 1,495 1,096 355 4 40April 1,421 1,055 320 8 38May 1,662 1,212 386 8 56
June 1,693 1,275 364 7 48July 2,287 1,711 514 11 52
August 2,231 1,644 537 10 39Sept 1,620 1,128 441 7 44
October 1,629 1,156 423 7 43November 1,672 1,249 372 11 40December 1,995 1,410 530 12 43
January 1,977 1,459 453 20 45February 1,569 1,157 362 13 38
March 1,673 1,342 278 16 37April 1,519 1,188 285 10 36May 1,752 1,306 394 16 37
June 1,739 1,290 397 14 38July 1,853 1,296 505 17 35
August 1,723 1,275 392 20 37Sept 1,723 1,253 417 15 38
October 1,730 1,331 346 14 39November 1,617 1,184 379 15 39December 3,058 1,642 1,346 22 47
January 8,977 4,320 4,531 58 NMFebruary 1,377 1,100 218 15 44
March 1,414 1,066 294 13 41April 1,518 1,128 337 16 36
2016 7,617 5,351 2,058 36 1722017 6,739 5,145 1,377 59 1572018 13,286 7,613 5,381 102 189
2017 21,527 15,931 4,943 131 5212018 28,482 18,190 9,557 237 NM
Notes: Beginning with the collection of Form EIA-923 in January 2008, the methodology to allocate total fuel consumption for electricity generation and consumption for useful thermal output was changed.The new methodology was retroactively applied to 2004-2007 data. See the Technical Notes (Appendix C) for further information. See Glossary for definitions.Values for 2016 and prior years are final. Values for 2017 and 2018 are preliminary. See Technical Notes for a discussion of the sample design for the Form EIA-923 and predecessor forms.Petroleum Liquids includes distillate and residual fuel oils, jet fuel, kerosene, waste oil, and beginning in 2011, propane. Prior to 2011 propane was included in Other Gases.See the Technical Notes for fuel conversion factors.Totals may not equal sum of components because of independent rounding.Sources: U.S. Energy Information Administration, Form EIA-906, Power Plant Report; U.S. Energy Information Administration, Form EIA-920 Combined Heat and Power Plant Report, and predecessor forms.Beginning with 2008 data, the Form EIA-923, Power Plant Operations Report, replaced the following: Form EIA-906, Power Plant Report; Form EIA-920, Combined Heat and Power Plant Report.
Table 2.2.A. Petroleum Liquids: Consumption for Electricity Generation,by Sector, 2008-April 2018 (Thousand Barrels)
Electric Power Sector
Annual Totals
Year 2016
Year 2017
Year 2018
Year to Date
Rolling 12 Months Ending in April
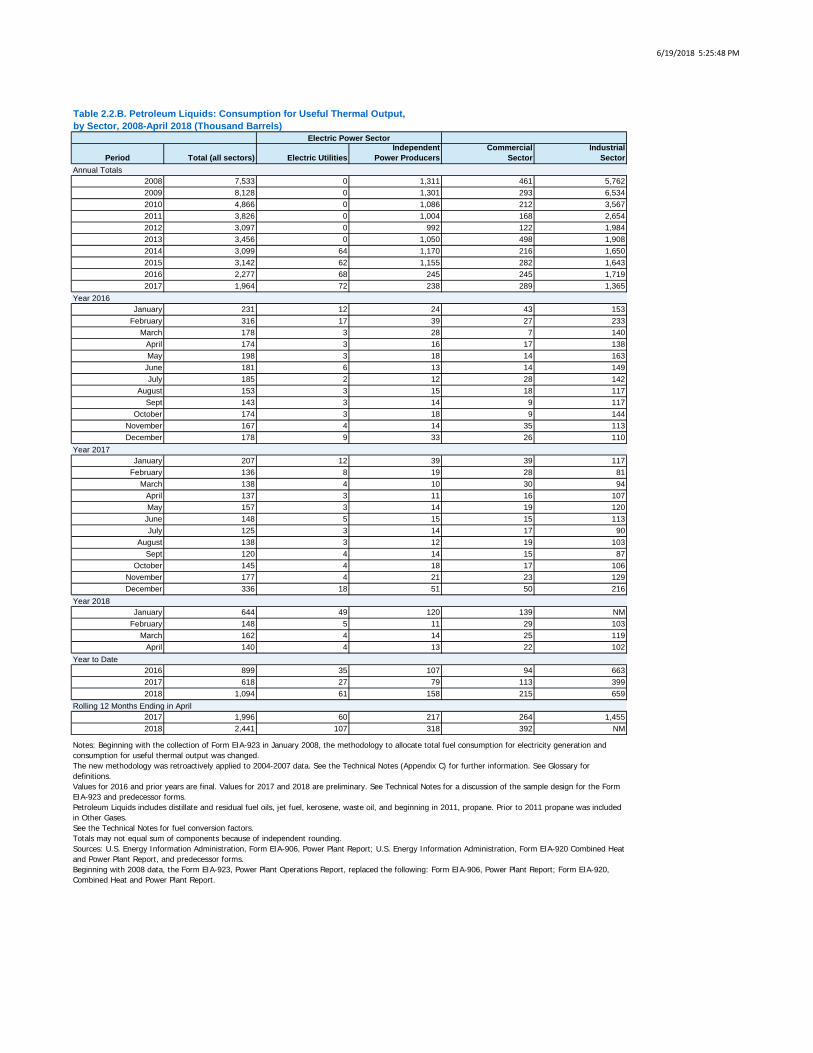
6/19/2018 5:25:48 PM
Period Total (all sectors) Electric UtilitiesIndependent
Power ProducersCommercial
SectorIndustrial
Sector
2008 7,533 0 1,311 461 5,7622009 8,128 0 1,301 293 6,5342010 4,866 0 1,086 212 3,5672011 3,826 0 1,004 168 2,6542012 3,097 0 992 122 1,9842013 3,456 0 1,050 498 1,9082014 3,099 64 1,170 216 1,6502015 3,142 62 1,155 282 1,6432016 2,277 68 245 245 1,7192017 1,964 72 238 289 1,365
January 231 12 24 43 153February 316 17 39 27 233
March 178 3 28 7 140April 174 3 16 17 138May 198 3 18 14 163
June 181 6 13 14 149July 185 2 12 28 142
August 153 3 15 18 117Sept 143 3 14 9 117
October 174 3 18 9 144November 167 4 14 35 113December 178 9 33 26 110
January 207 12 39 39 117February 136 8 19 28 81
March 138 4 10 30 94April 137 3 11 16 107May 157 3 14 19 120
June 148 5 15 15 113July 125 3 14 17 90
August 138 3 12 19 103Sept 120 4 14 15 87
October 145 4 18 17 106November 177 4 21 23 129December 336 18 51 50 216
January 644 49 120 139 NMFebruary 148 5 11 29 103
March 162 4 14 25 119April 140 4 13 22 102
2016 899 35 107 94 6632017 618 27 79 113 3992018 1,094 61 158 215 659
2017 1,996 60 217 264 1,4552018 2,441 107 318 392 NM
Notes: Beginning with the collection of Form EIA-923 in January 2008, the methodology to allocate total fuel consumption for electricity generation and consumption for useful thermal output was changed.The new methodology was retroactively applied to 2004-2007 data. See the Technical Notes (Appendix C) for further information. See Glossary for definitions.Values for 2016 and prior years are final. Values for 2017 and 2018 are preliminary. See Technical Notes for a discussion of the sample design for the Form EIA-923 and predecessor forms.Petroleum Liquids includes distillate and residual fuel oils, jet fuel, kerosene, waste oil, and beginning in 2011, propane. Prior to 2011 propane was included in Other Gases.See the Technical Notes for fuel conversion factors.Totals may not equal sum of components because of independent rounding.Sources: U.S. Energy Information Administration, Form EIA-906, Power Plant Report; U.S. Energy Information Administration, Form EIA-920 Combined Heat and Power Plant Report, and predecessor forms.Beginning with 2008 data, the Form EIA-923, Power Plant Operations Report, replaced the following: Form EIA-906, Power Plant Report; Form EIA-920, Combined Heat and Power Plant Report.
Table 2.2.B. Petroleum Liquids: Consumption for Useful Thermal Output,by Sector, 2008-April 2018 (Thousand Barrels)
Electric Power Sector
Annual Totals
Year 2016
Year 2017
Year 2018
Year to Date
Rolling 12 Months Ending in April
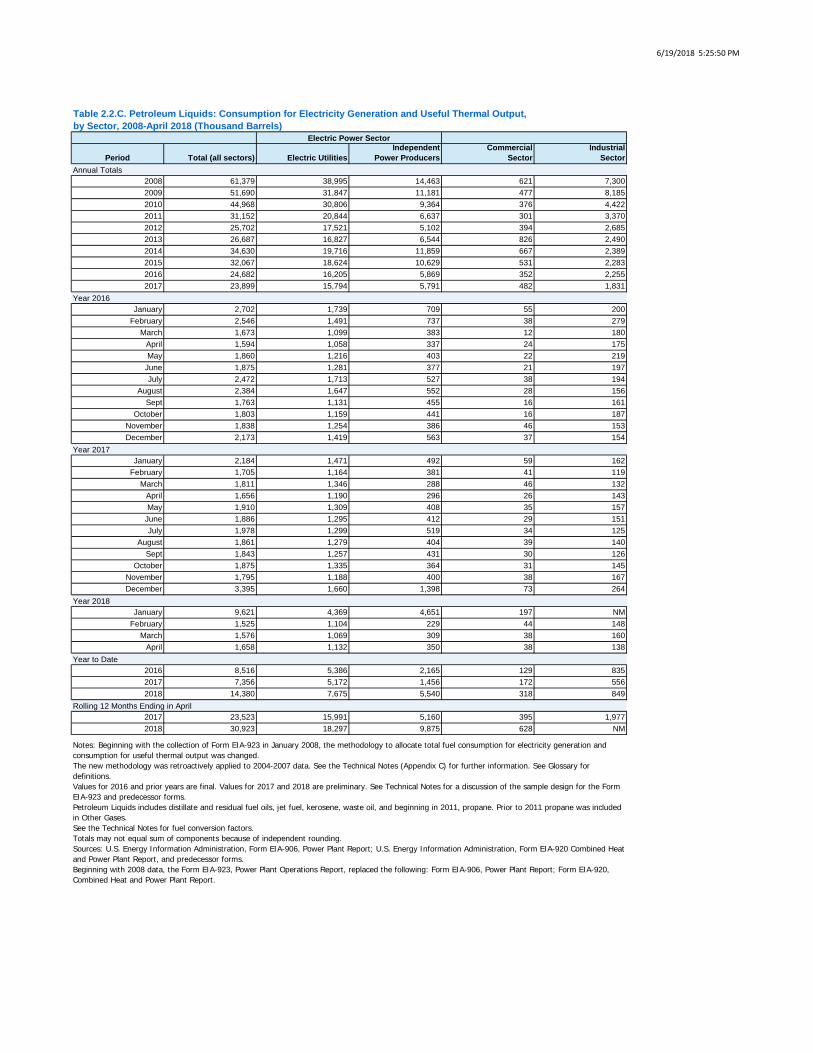
6/19/2018 5:25:50 PM
Period Total (all sectors) Electric UtilitiesIndependent
Power ProducersCommercial
SectorIndustrial
Sector
2008 61,379 38,995 14,463 621 7,3002009 51,690 31,847 11,181 477 8,1852010 44,968 30,806 9,364 376 4,4222011 31,152 20,844 6,637 301 3,3702012 25,702 17,521 5,102 394 2,6852013 26,687 16,827 6,544 826 2,4902014 34,630 19,716 11,859 667 2,3892015 32,067 18,624 10,629 531 2,2832016 24,682 16,205 5,869 352 2,2552017 23,899 15,794 5,791 482 1,831
January 2,702 1,739 709 55 200February 2,546 1,491 737 38 279
March 1,673 1,099 383 12 180April 1,594 1,058 337 24 175May 1,860 1,216 403 22 219
June 1,875 1,281 377 21 197July 2,472 1,713 527 38 194
August 2,384 1,647 552 28 156Sept 1,763 1,131 455 16 161
October 1,803 1,159 441 16 187November 1,838 1,254 386 46 153December 2,173 1,419 563 37 154
January 2,184 1,471 492 59 162February 1,705 1,164 381 41 119
March 1,811 1,346 288 46 132April 1,656 1,190 296 26 143May 1,910 1,309 408 35 157
June 1,886 1,295 412 29 151July 1,978 1,299 519 34 125
August 1,861 1,279 404 39 140Sept 1,843 1,257 431 30 126
October 1,875 1,335 364 31 145November 1,795 1,188 400 38 167December 3,395 1,660 1,398 73 264
January 9,621 4,369 4,651 197 NMFebruary 1,525 1,104 229 44 148
March 1,576 1,069 309 38 160April 1,658 1,132 350 38 138
2016 8,516 5,386 2,165 129 8352017 7,356 5,172 1,456 172 5562018 14,380 7,675 5,540 318 849
2017 23,523 15,991 5,160 395 1,9772018 30,923 18,297 9,875 628 NM
Notes: Beginning with the collection of Form EIA-923 in January 2008, the methodology to allocate total fuel consumption for electricity generation and consumption for useful thermal output was changed.The new methodology was retroactively applied to 2004-2007 data. See the Technical Notes (Appendix C) for further information. See Glossary for definitions.Values for 2016 and prior years are final. Values for 2017 and 2018 are preliminary. See Technical Notes for a discussion of the sample design for the Form EIA-923 and predecessor forms.Petroleum Liquids includes distillate and residual fuel oils, jet fuel, kerosene, waste oil, and beginning in 2011, propane. Prior to 2011 propane was included in Other Gases.See the Technical Notes for fuel conversion factors.Totals may not equal sum of components because of independent rounding.Sources: U.S. Energy Information Administration, Form EIA-906, Power Plant Report; U.S. Energy Information Administration, Form EIA-920 Combined Heat and Power Plant Report, and predecessor forms.Beginning with 2008 data, the Form EIA-923, Power Plant Operations Report, replaced the following: Form EIA-906, Power Plant Report; Form EIA-920, Combined Heat and Power Plant Report.
Table 2.2.C. Petroleum Liquids: Consumption for Electricity Generation and Useful Thermal Output,by Sector, 2008-April 2018 (Thousand Barrels)
Electric Power Sector
Annual Totals
Year 2016
Year 2017
Year 2018
Year to Date
Rolling 12 Months Ending in April

6/19/2018 5:25:51 PM
Period Total (all sectors) Electric UtilitiesIndependent
Power ProducersCommercial
SectorIndustrial
Sector
2008 5,417 2,296 2,704 1 4162009 4,821 2,761 1,724 1 3352010 4,994 3,325 1,354 2 3132011 5,012 3,449 1,277 1 2862012 3,675 2,105 756 1 8122013 4,852 3,409 779 1 6622014 4,412 3,440 599 2 3712015 4,044 3,120 669 2 2532016 4,253 3,427 591 2 2332017 3,349 2,731 415 3 200
January 342 302 16 0 23February 330 271 39 0 19
March 362 283 63 0 17April 382 325 43 0 14May 370 296 52 0 23
June 380 308 52 0 21July 400 324 56 0 20
August 419 337 61 0 21Sept 376 311 49 0 16
October 250 171 61 0 18November 307 239 46 0 21December 336 260 55 0 20
January 355 301 40 0 13February 263 217 32 0 13
March 273 214 40 0 18April 153 110 29 0 13May 320 264 38 0 18
June 341 282 40 0 19July 332 271 39 0 23
August 282 226 38 0 19Sept 262 209 37 0 16
October 221 171 35 0 15November 267 234 13 0 19December 280 231 35 0 14
January 344 296 36 0 11February 272 234 29 0 9
March 226 198 15 0 13April 224 193 14 0 16
2016 1,415 1,181 160 1 732017 1,043 843 142 1 582018 1,066 921 95 1 49
2017 3,881 3,089 573 2 2182018 3,371 2,809 368 3 192
Notes: Beginning with the collection of Form EIA-923 in January 2008, the methodology to allocate total fuel consumption for electricity generation and consumption for useful thermal output was changed.The new methodology was retroactively applied to 2004-2007 data. See the Technical Notes (Appendix C) for further information. See Glossary for definitions.Values for 2016 and prior years are final. Values for 2017 and 2018 are preliminary. See Technical Notes for a discussion of the sample design for the Form EIA-923 and predecessor forms.Petroleum Coke includes petroleum coke-derived synthesis gas. Prior to 2011, petroleum coke-derived synthesis gas was included in Other Gases.See the Technical Notes for fuel conversion factors.Totals may not equal sum of components because of independent rounding.Sources: U.S. Energy Information Administration, Form EIA-906, Power Plant Report; U.S. Energy Information Administration, Form EIA-920 Combined Heat and Power Plant Report, and predecessor forms.Beginning with 2008 data, the Form EIA-923, Power Plant Operations Report, replaced the following: Form EIA-906, Power Plant Report; Form EIA-920, Combined Heat and Power Plant Report.
Table 2.3.A. Petroleum Coke: Consumption for Electricity Generation,by Sector, 2008-April 2018 (Thousand Tons)
Electric Power Sector
Annual Totals
Year 2016
Year 2017
Year 2018
Year to Date
Rolling 12 Months Ending in April
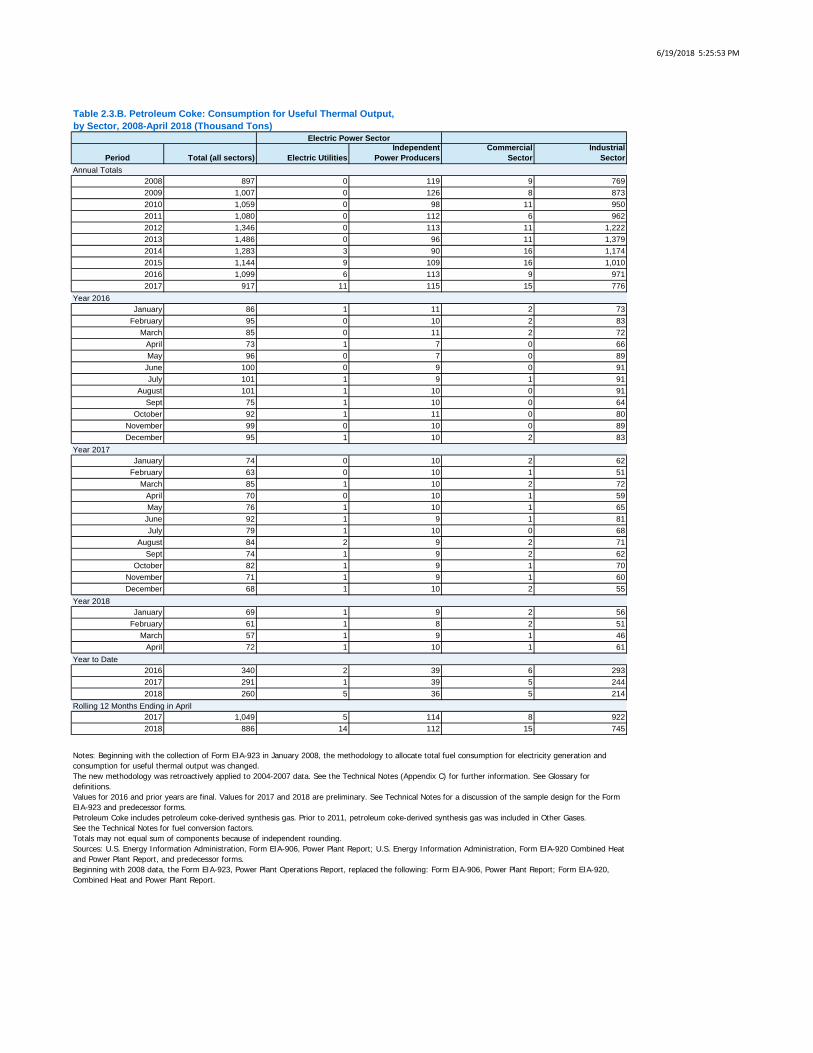
6/19/2018 5:25:53 PM
Period Total (all sectors) Electric UtilitiesIndependent
Power ProducersCommercial
SectorIndustrial
Sector
2008 897 0 119 9 7692009 1,007 0 126 8 8732010 1,059 0 98 11 9502011 1,080 0 112 6 9622012 1,346 0 113 11 1,2222013 1,486 0 96 11 1,3792014 1,283 3 90 16 1,1742015 1,144 9 109 16 1,0102016 1,099 6 113 9 9712017 917 11 115 15 776
January 86 1 11 2 73February 95 0 10 2 83
March 85 0 11 2 72April 73 1 7 0 66May 96 0 7 0 89
June 100 0 9 0 91July 101 1 9 1 91
August 101 1 10 0 91Sept 75 1 10 0 64
October 92 1 11 0 80November 99 0 10 0 89December 95 1 10 2 83
January 74 0 10 2 62February 63 0 10 1 51
March 85 1 10 2 72April 70 0 10 1 59May 76 1 10 1 65
June 92 1 9 1 81July 79 1 10 0 68
August 84 2 9 2 71Sept 74 1 9 2 62
October 82 1 9 1 70November 71 1 9 1 60December 68 1 10 2 55
January 69 1 9 2 56February 61 1 8 2 51
March 57 1 9 1 46April 72 1 10 1 61
2016 340 2 39 6 2932017 291 1 39 5 2442018 260 5 36 5 214
2017 1,049 5 114 8 9222018 886 14 112 15 745
Notes: Beginning with the collection of Form EIA-923 in January 2008, the methodology to allocate total fuel consumption for electricity generation and consumption for useful thermal output was changed.The new methodology was retroactively applied to 2004-2007 data. See the Technical Notes (Appendix C) for further information. See Glossary for definitions.Values for 2016 and prior years are final. Values for 2017 and 2018 are preliminary. See Technical Notes for a discussion of the sample design for the Form EIA-923 and predecessor forms.Petroleum Coke includes petroleum coke-derived synthesis gas. Prior to 2011, petroleum coke-derived synthesis gas was included in Other Gases.See the Technical Notes for fuel conversion factors.Totals may not equal sum of components because of independent rounding.Sources: U.S. Energy Information Administration, Form EIA-906, Power Plant Report; U.S. Energy Information Administration, Form EIA-920 Combined Heat and Power Plant Report, and predecessor forms.Beginning with 2008 data, the Form EIA-923, Power Plant Operations Report, replaced the following: Form EIA-906, Power Plant Report; Form EIA-920, Combined Heat and Power Plant Report.
Table 2.3.B. Petroleum Coke: Consumption for Useful Thermal Output,by Sector, 2008-April 2018 (Thousand Tons)
Electric Power Sector
Annual Totals
Year 2016
Year 2017
Year 2018
Year to Date
Rolling 12 Months Ending in April

6/19/2018 5:25:54 PM
Period Total (all sectors) Electric UtilitiesIndependent
Power ProducersCommercial
SectorIndustrial
Sector
2008 6,314 2,296 2,823 10 1,1842009 5,828 2,761 1,850 9 1,2092010 6,053 3,325 1,452 12 1,2642011 6,092 3,449 1,388 6 1,2482012 5,021 2,105 869 13 2,0342013 6,338 3,409 875 12 2,0412014 5,695 3,443 689 18 1,5452015 5,188 3,128 779 18 1,2632016 5,352 3,433 705 10 1,2042017 4,266 2,742 530 17 976
January 427 302 27 3 96February 425 272 49 2 102
March 447 283 74 2 89April 455 326 50 0 80May 466 296 58 0 112
June 480 308 60 0 111July 502 325 65 1 111
August 520 337 71 0 112Sept 451 311 59 0 80
October 342 172 72 0 99November 406 240 56 0 110December 431 261 65 2 103
January 428 301 50 2 75February 325 218 42 1 65
March 358 215 50 2 90April 222 110 39 1 72May 396 265 48 1 83
June 433 283 49 1 100July 412 272 49 0 91
August 367 228 47 2 89Sept 337 211 46 2 78
October 302 172 44 2 85November 338 235 22 1 79December 348 233 44 2 69
January 412 297 46 2 67February 334 235 37 2 60
March 284 199 24 2 59April 296 195 24 1 76
2016 1,755 1,183 199 7 3662017 1,334 844 181 6 3022018 1,325 926 130 6 263
2017 4,931 3,094 687 10 1,1402018 4,257 2,823 480 17 937
Notes: Beginning with the collection of Form EIA-923 in January 2008, the methodology to allocate total fuel consumption for electricity generation and consumption for useful thermal output was changed.The new methodology was retroactively applied to 2004-2007 data. See the Technical Notes (Appendix C) for further information. See Glossary for definitions.Values for 2016 and prior years are final. Values for 2017 and 2018 are preliminary. See Technical Notes for a discussion of the sample design for the Form EIA-923 and predecessor forms.Petroleum Coke includes petroleum coke-derived synthesis gas. Prior to 2011, petroleum coke-derived synthesis gas was included in Other Gases.See the Technical Notes for fuel conversion factors.Totals may not equal sum of components because of independent rounding.Sources: U.S. Energy Information Administration, Form EIA-906, Power Plant Report; U.S. Energy Information Administration, Form EIA-920 Combined Heat and Power Plant Report, and predecessor forms.Beginning with 2008 data, the Form EIA-923, Power Plant Operations Report, replaced the following: Form EIA-906, Power Plant Report; Form EIA-920, Combined Heat and Power Plant Report.
Table 2.3.C. Petroleum Coke: Consumption for Electricity Generation and Useful Thermal Output,by Sector, 2008-April 2018 (Thousand Tons)
Electric Power Sector
Annual Totals
Year 2016
Year 2017
Year 2018
Year to Date
Rolling 12 Months Ending in April
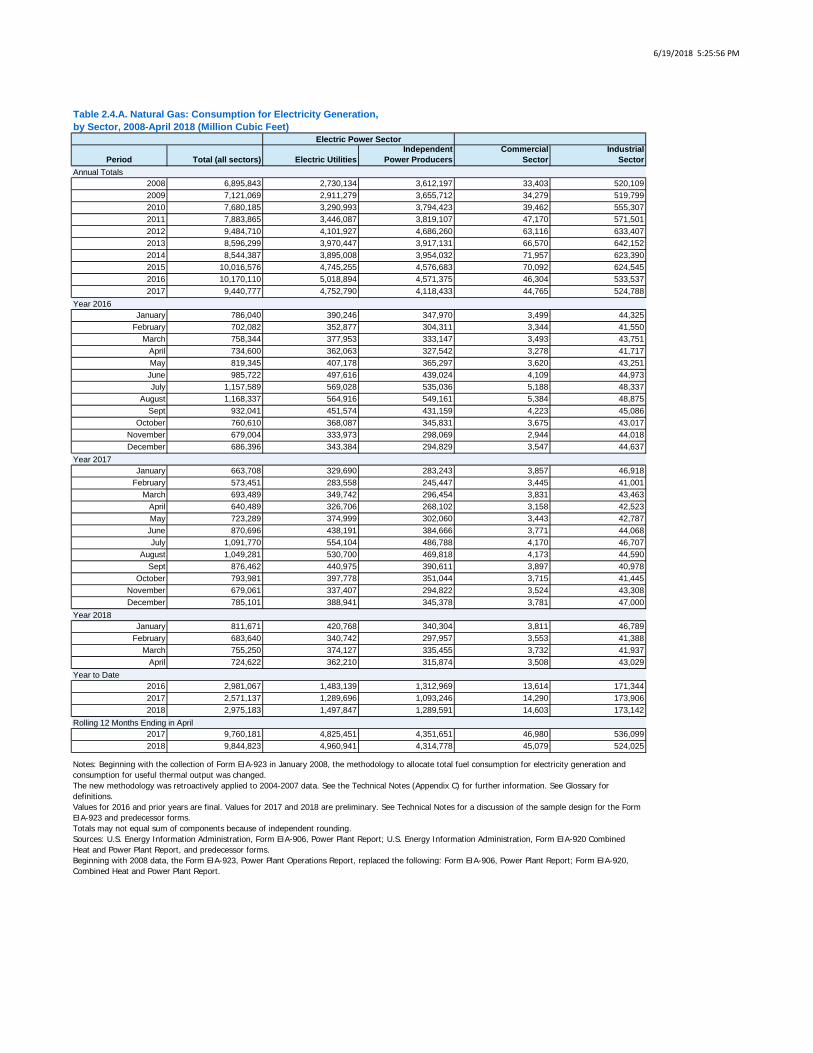
6/19/2018 5:25:56 PM
Period Total (all sectors) Electric UtilitiesIndependent
Power ProducersCommercial
SectorIndustrial
Sector
2008 6,895,843 2,730,134 3,612,197 33,403 520,1092009 7,121,069 2,911,279 3,655,712 34,279 519,7992010 7,680,185 3,290,993 3,794,423 39,462 555,3072011 7,883,865 3,446,087 3,819,107 47,170 571,5012012 9,484,710 4,101,927 4,686,260 63,116 633,4072013 8,596,299 3,970,447 3,917,131 66,570 642,1522014 8,544,387 3,895,008 3,954,032 71,957 623,3902015 10,016,576 4,745,255 4,576,683 70,092 624,5452016 10,170,110 5,018,894 4,571,375 46,304 533,5372017 9,440,777 4,752,790 4,118,433 44,765 524,788
January 786,040 390,246 347,970 3,499 44,325February 702,082 352,877 304,311 3,344 41,550
March 758,344 377,953 333,147 3,493 43,751April 734,600 362,063 327,542 3,278 41,717May 819,345 407,178 365,297 3,620 43,251June 985,722 497,616 439,024 4,109 44,973July 1,157,589 569,028 535,036 5,188 48,337
August 1,168,337 564,916 549,161 5,384 48,875Sept 932,041 451,574 431,159 4,223 45,086
October 760,610 368,087 345,831 3,675 43,017November 679,004 333,973 298,069 2,944 44,018December 686,396 343,384 294,829 3,547 44,637
January 663,708 329,690 283,243 3,857 46,918February 573,451 283,558 245,447 3,445 41,001
March 693,489 349,742 296,454 3,831 43,463April 640,489 326,706 268,102 3,158 42,523May 723,289 374,999 302,060 3,443 42,787June 870,696 438,191 384,666 3,771 44,068July 1,091,770 554,104 486,788 4,170 46,707
August 1,049,281 530,700 469,818 4,173 44,590Sept 876,462 440,975 390,611 3,897 40,978
October 793,981 397,778 351,044 3,715 41,445November 679,061 337,407 294,822 3,524 43,308December 785,101 388,941 345,378 3,781 47,000
January 811,671 420,768 340,304 3,811 46,789February 683,640 340,742 297,957 3,553 41,388
March 755,250 374,127 335,455 3,732 41,937April 724,622 362,210 315,874 3,508 43,029
2016 2,981,067 1,483,139 1,312,969 13,614 171,3442017 2,571,137 1,289,696 1,093,246 14,290 173,9062018 2,975,183 1,497,847 1,289,591 14,603 173,142
2017 9,760,181 4,825,451 4,351,651 46,980 536,0992018 9,844,823 4,960,941 4,314,778 45,079 524,025
Notes: Beginning with the collection of Form EIA-923 in January 2008, the methodology to allocate total fuel consumption for electricity generation and consumption for useful thermal output was changed.The new methodology was retroactively applied to 2004-2007 data. See the Technical Notes (Appendix C) for further information. See Glossary for definitions.Values for 2016 and prior years are final. Values for 2017 and 2018 are preliminary. See Technical Notes for a discussion of the sample design for the Form EIA-923 and predecessor forms.Totals may not equal sum of components because of independent rounding.Sources: U.S. Energy Information Administration, Form EIA-906, Power Plant Report; U.S. Energy Information Administration, Form EIA-920 Combined Heat and Power Plant Report, and predecessor forms.Beginning with 2008 data, the Form EIA-923, Power Plant Operations Report, replaced the following: Form EIA-906, Power Plant Report; Form EIA-920, Combined Heat and Power Plant Report.
Table 2.4.A. Natural Gas: Consumption for Electricity Generation,by Sector, 2008-April 2018 (Million Cubic Feet)
Electric Power Sector
Annual Totals
Year 2016
Year 2017
Year 2018
Year to Date
Rolling 12 Months Ending in April
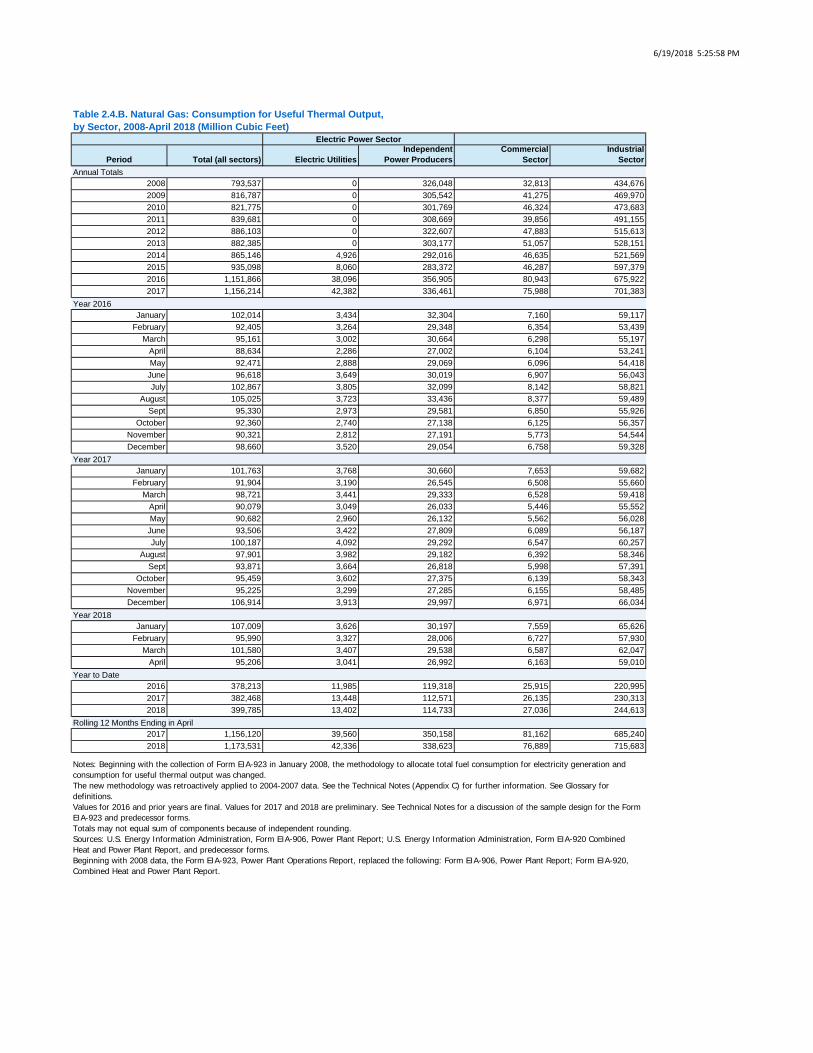
6/19/2018 5:25:58 PM
Period Total (all sectors) Electric UtilitiesIndependent
Power ProducersCommercial
SectorIndustrial
Sector
2008 793,537 0 326,048 32,813 434,6762009 816,787 0 305,542 41,275 469,9702010 821,775 0 301,769 46,324 473,6832011 839,681 0 308,669 39,856 491,1552012 886,103 0 322,607 47,883 515,6132013 882,385 0 303,177 51,057 528,1512014 865,146 4,926 292,016 46,635 521,5692015 935,098 8,060 283,372 46,287 597,3792016 1,151,866 38,096 356,905 80,943 675,9222017 1,156,214 42,382 336,461 75,988 701,383
January 102,014 3,434 32,304 7,160 59,117February 92,405 3,264 29,348 6,354 53,439
March 95,161 3,002 30,664 6,298 55,197April 88,634 2,286 27,002 6,104 53,241May 92,471 2,888 29,069 6,096 54,418June 96,618 3,649 30,019 6,907 56,043July 102,867 3,805 32,099 8,142 58,821
August 105,025 3,723 33,436 8,377 59,489Sept 95,330 2,973 29,581 6,850 55,926
October 92,360 2,740 27,138 6,125 56,357November 90,321 2,812 27,191 5,773 54,544December 98,660 3,520 29,054 6,758 59,328
January 101,763 3,768 30,660 7,653 59,682February 91,904 3,190 26,545 6,508 55,660
March 98,721 3,441 29,333 6,528 59,418April 90,079 3,049 26,033 5,446 55,552May 90,682 2,960 26,132 5,562 56,028June 93,506 3,422 27,809 6,089 56,187July 100,187 4,092 29,292 6,547 60,257
August 97,901 3,982 29,182 6,392 58,346Sept 93,871 3,664 26,818 5,998 57,391
October 95,459 3,602 27,375 6,139 58,343November 95,225 3,299 27,285 6,155 58,485December 106,914 3,913 29,997 6,971 66,034
January 107,009 3,626 30,197 7,559 65,626February 95,990 3,327 28,006 6,727 57,930
March 101,580 3,407 29,538 6,587 62,047April 95,206 3,041 26,992 6,163 59,010
2016 378,213 11,985 119,318 25,915 220,9952017 382,468 13,448 112,571 26,135 230,3132018 399,785 13,402 114,733 27,036 244,613
2017 1,156,120 39,560 350,158 81,162 685,2402018 1,173,531 42,336 338,623 76,889 715,683
Notes: Beginning with the collection of Form EIA-923 in January 2008, the methodology to allocate total fuel consumption for electricity generation and consumption for useful thermal output was changed.The new methodology was retroactively applied to 2004-2007 data. See the Technical Notes (Appendix C) for further information. See Glossary for definitions.Values for 2016 and prior years are final. Values for 2017 and 2018 are preliminary. See Technical Notes for a discussion of the sample design for the Form EIA-923 and predecessor forms.Totals may not equal sum of components because of independent rounding.Sources: U.S. Energy Information Administration, Form EIA-906, Power Plant Report; U.S. Energy Information Administration, Form EIA-920 Combined Heat and Power Plant Report, and predecessor forms.Beginning with 2008 data, the Form EIA-923, Power Plant Operations Report, replaced the following: Form EIA-906, Power Plant Report; Form EIA-920, Combined Heat and Power Plant Report.
Table 2.4.B. Natural Gas: Consumption for Useful Thermal Output,by Sector, 2008-April 2018 (Million Cubic Feet)
Electric Power Sector
Annual Totals
Year 2016
Year 2017
Year 2018
Year to Date
Rolling 12 Months Ending in April
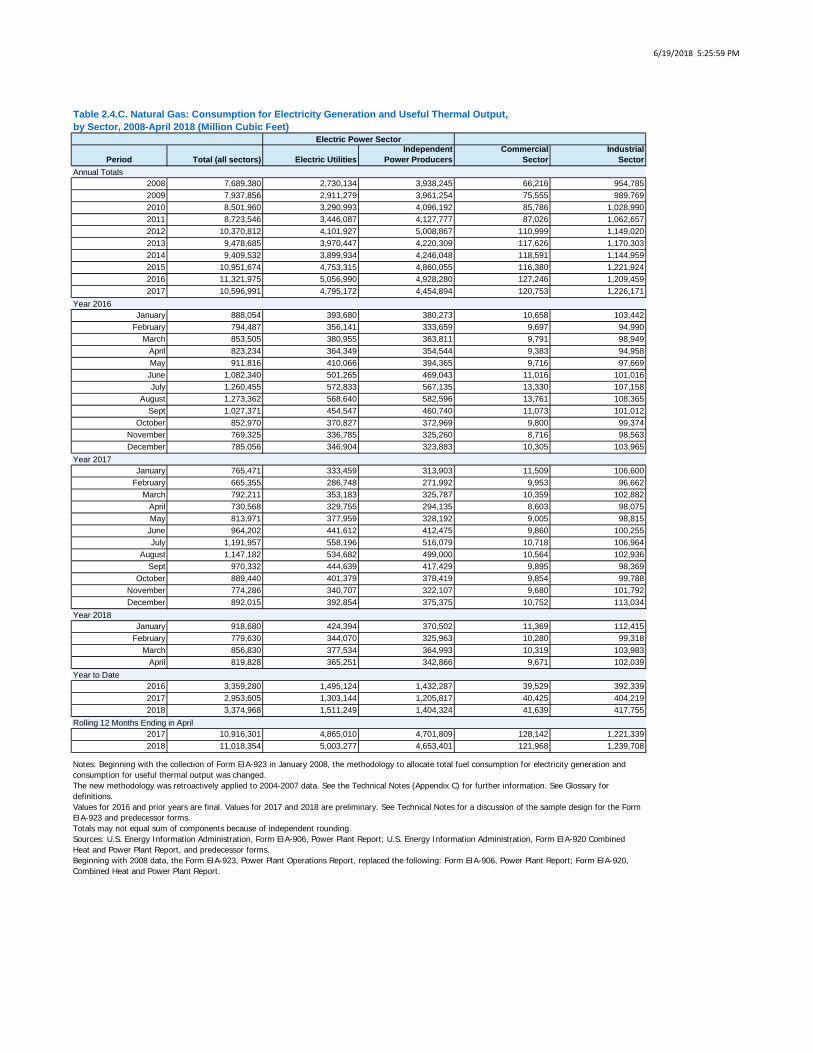
6/19/2018 5:25:59 PM
Period Total (all sectors) Electric UtilitiesIndependent
Power ProducersCommercial
SectorIndustrial
Sector
2008 7,689,380 2,730,134 3,938,245 66,216 954,7852009 7,937,856 2,911,279 3,961,254 75,555 989,7692010 8,501,960 3,290,993 4,096,192 85,786 1,028,9902011 8,723,546 3,446,087 4,127,777 87,026 1,062,6572012 10,370,812 4,101,927 5,008,867 110,999 1,149,0202013 9,478,685 3,970,447 4,220,309 117,626 1,170,3032014 9,409,532 3,899,934 4,246,048 118,591 1,144,9592015 10,951,674 4,753,315 4,860,055 116,380 1,221,9242016 11,321,975 5,056,990 4,928,280 127,246 1,209,4592017 10,596,991 4,795,172 4,454,894 120,753 1,226,171
January 888,054 393,680 380,273 10,658 103,442February 794,487 356,141 333,659 9,697 94,990
March 853,505 380,955 363,811 9,791 98,949April 823,234 364,349 354,544 9,383 94,958May 911,816 410,066 394,365 9,716 97,669June 1,082,340 501,265 469,043 11,016 101,016July 1,260,455 572,833 567,135 13,330 107,158
August 1,273,362 568,640 582,596 13,761 108,365Sept 1,027,371 454,547 460,740 11,073 101,012
October 852,970 370,827 372,969 9,800 99,374November 769,325 336,785 325,260 8,716 98,563December 785,056 346,904 323,883 10,305 103,965
January 765,471 333,459 313,903 11,509 106,600February 665,355 286,748 271,992 9,953 96,662
March 792,211 353,183 325,787 10,359 102,882April 730,568 329,755 294,135 8,603 98,075May 813,971 377,959 328,192 9,005 98,815June 964,202 441,612 412,475 9,860 100,255July 1,191,957 558,196 516,079 10,718 106,964
August 1,147,182 534,682 499,000 10,564 102,936Sept 970,332 444,639 417,429 9,895 98,369
October 889,440 401,379 378,419 9,854 99,788November 774,286 340,707 322,107 9,680 101,792December 892,015 392,854 375,375 10,752 113,034
January 918,680 424,394 370,502 11,369 112,415February 779,630 344,070 325,963 10,280 99,318
March 856,830 377,534 364,993 10,319 103,983April 819,828 365,251 342,866 9,671 102,039
2016 3,359,280 1,495,124 1,432,287 39,529 392,3392017 2,953,605 1,303,144 1,205,817 40,425 404,2192018 3,374,968 1,511,249 1,404,324 41,639 417,755
2017 10,916,301 4,865,010 4,701,809 128,142 1,221,3392018 11,018,354 5,003,277 4,653,401 121,968 1,239,708
Notes: Beginning with the collection of Form EIA-923 in January 2008, the methodology to allocate total fuel consumption for electricity generation and consumption for useful thermal output was changed.The new methodology was retroactively applied to 2004-2007 data. See the Technical Notes (Appendix C) for further information. See Glossary for definitions.Values for 2016 and prior years are final. Values for 2017 and 2018 are preliminary. See Technical Notes for a discussion of the sample design for the Form EIA-923 and predecessor forms.Totals may not equal sum of components because of independent rounding.Sources: U.S. Energy Information Administration, Form EIA-906, Power Plant Report; U.S. Energy Information Administration, Form EIA-920 Combined Heat and Power Plant Report, and predecessor forms.Beginning with 2008 data, the Form EIA-923, Power Plant Operations Report, replaced the following: Form EIA-906, Power Plant Report; Form EIA-920, Combined Heat and Power Plant Report.
Table 2.4.C. Natural Gas: Consumption for Electricity Generation and Useful Thermal Output,by Sector, 2008-April 2018 (Million Cubic Feet)
Electric Power Sector
Annual Totals
Year 2016
Year 2017
Year 2018
Year to Date
Rolling 12 Months Ending in April

6/19/2018 5:26:00 PM
Period Total (all sectors) Electric UtilitiesIndependent
Power ProducersCommercial
SectorIndustrial
Sector
2008 195,777 20,465 169,547 5,235 5302009 206,792 19,583 180,689 5,931 5892010 218,331 19,975 192,428 5,535 3932011 232,795 22,086 180,856 29,469 3842012 256,376 25,193 201,965 26,672 2,5452013 271,967 27,259 211,942 28,143 4,6232014 285,982 25,819 228,447 27,038 4,6782015 282,530 25,257 227,381 25,250 4,6422016 273,557 24,280 224,993 20,445 3,8392017 267,266 25,169 219,253 18,957 3,888
January 22,612 2,036 18,360 1,865 351February 21,859 2,088 17,744 1,705 323
March 23,337 2,187 19,021 1,786 343April 22,556 2,080 18,805 1,340 331May 23,744 2,120 19,554 1,717 354June 22,668 1,896 18,683 1,768 320July 23,052 1,950 19,047 1,734 321
August 23,038 2,011 18,978 1,726 324Sept 21,757 2,010 17,792 1,678 278
October 20,377 1,922 16,583 1,610 263November 24,047 1,941 20,036 1,762 307December 24,510 2,041 20,392 1,753 324
January 23,634 2,207 19,369 1,687 371February 21,208 2,062 17,332 1,463 351
March 23,157 2,249 18,842 1,672 394April 21,387 2,091 17,433 1,516 348May 21,919 2,234 17,939 1,460 286June 21,978 1,939 18,174 1,547 318July 22,785 1,979 18,962 1,583 261
August 22,973 2,081 18,999 1,598 296Sept 21,810 1,990 17,980 1,560 280
October 21,579 2,019 17,839 1,410 311November 21,839 2,108 17,726 1,671 333December 22,997 2,209 18,658 1,791 339
January 23,115 2,263 18,857 1,672 324February 21,740 2,089 17,786 1,536 329
March 23,194 2,250 18,874 1,723 348April 22,126 2,055 18,108 1,629 334
2016 90,364 8,391 73,929 6,696 1,3482017 89,386 8,608 72,977 6,338 1,4642018 90,175 8,657 73,625 6,559 1,334
2017 272,579 24,497 224,041 20,086 3,9552018 268,056 25,218 219,901 19,179 3,758
Notes: Beginning with the collection of Form EIA-923 in January 2008, the methodology to allocate total fuel consumption for electricity generation and consumption for useful thermal output was changed.The new methodology was retroactively applied to 2004-2007 data. See the Technical Notes (Appendix C) for further information. See Glossary for definitions.Values for 2016 and prior years are final. Values for 2017 and 2018 are preliminary. See Technical Notes for a discussion of the sample design for the Form EIA-923 and predecessor forms.Totals may not equal sum of components because of independent rounding.Sources: U.S. Energy Information Administration, Form EIA-906, Power Plant Report; U.S. Energy Information Administration, Form EIA-920 Combined Heat and Power Plant Report, and predecessor forms.Beginning with 2008 data, the Form EIA-923, Power Plant Operations Report, replaced the following: Form EIA-906, Power Plant Report; Form EIA-920, Combined Heat and Power Plant Report.
Table 2.5.A. Landfill Gas: Consumption for Electricity Generation,by Sector, 2008-April 2018 (Million Cubic Feet)
Electric Power Sector
Annual Totals
Year 2016
Year 2017
Year 2018
Year to Date
Rolling 12 Months Ending in April

6/19/2018 5:26:02 PM
Period Total (all sectors) Electric UtilitiesIndependent
Power ProducersCommercial
SectorIndustrial
Sector
2008 1,025 0 454 433 1382009 793 0 545 176 722010 1,623 0 1,195 370 582011 3,195 0 2,753 351 912012 3,189 0 2,788 340 612013 831 0 261 423 1472014 1,710 176 525 674 3352015 1,522 2 644 515 3622016 4,163 3 2,339 1,034 7882017 4,870 6 2,836 1,099 928
January 352 0 202 84 66February 340 0 189 86 65
March 358 0 196 86 75April 355 0 201 88 66May 356 0 194 90 72June 344 0 193 85 66July 335 0 181 87 66
August 332 0 181 82 68Sept 327 0 187 81 59
October 301 0 157 87 56November 378 0 227 86 66December 387 0 230 91 65
January 461 0 292 94 75February 437 0 274 92 70
March 482 1 313 92 76April 409 0 222 107 80May 292 0 133 85 73June 378 1 190 89 98July 365 1 209 85 71
August 409 1 214 98 96Sept 360 1 179 98 82
October 396 1 249 93 54November 428 0 278 85 65December 452 0 282 81 89
January 465 1 330 65 69February 412 0 285 58 69
March 474 0 311 84 78April 432 1 259 85 88
2016 1,404 1 788 344 2712017 1,790 2 1,102 386 3012018 1,784 2 1,184 292 305
2017 4,549 4 2,653 1,075 8172018 4,864 6 2,919 1,006 933
Notes: Beginning with the collection of Form EIA-923 in January 2008, the methodology to allocate total fuel consumption for electricity generation and consumption for useful thermal output was changed.The new methodology was retroactively applied to 2004-2007 data. See the Technical Notes (Appendix C) for further information. See Glossary for definitions.Values for 2016 and prior years are final. Values for 2017 and 2018 are preliminary. See Technical Notes for a discussion of the sample design for the Form EIA-923 and predecessor forms.Totals may not equal sum of components because of independent rounding.Sources: U.S. Energy Information Administration, Form EIA-906, Power Plant Report; U.S. Energy Information Administration, Form EIA-920 Combined Heat and Power Plant Report, and predecessor forms.Beginning with 2008 data, the Form EIA-923, Power Plant Operations Report, replaced the following: Form EIA-906, Power Plant Report; Form EIA-920, Combined Heat and Power Plant Report.
Table 2.5.B. Landfill Gas: Consumption for Useful Thermal Output,by Sector, 2008-April 2018 (Million Cubic Feet)
Electric Power Sector
Annual Totals
Year 2016
Year 2017
Year 2018
Year to Date
Rolling 12 Months Ending in April

6/19/2018 5:26:03 PM
Period Total (all sectors) Electric UtilitiesIndependent
Power ProducersCommercial
SectorIndustrial
Sector
2008 196,802 20,465 170,001 5,668 6682009 207,585 19,583 181,234 6,106 6612010 219,954 19,975 193,623 5,905 4512011 235,990 22,086 183,609 29,820 4742012 259,564 25,193 204,753 27,012 2,6062013 272,798 27,259 212,203 28,566 4,7702014 287,692 25,995 228,971 27,713 5,0132015 284,052 25,259 228,024 25,765 5,0042016 277,720 24,283 227,332 21,479 4,6262017 272,136 25,175 222,089 20,056 4,816
January 22,964 2,036 18,562 1,949 417February 22,200 2,088 17,933 1,791 388
March 23,694 2,187 19,217 1,873 417April 22,911 2,081 19,005 1,428 397May 24,100 2,120 19,748 1,807 425June 23,012 1,896 18,876 1,853 386July 23,387 1,950 19,229 1,822 386
August 23,370 2,011 19,159 1,808 392Sept 22,084 2,010 17,978 1,759 337
October 20,678 1,922 16,740 1,697 319November 24,425 1,941 20,263 1,848 373December 24,897 2,042 20,622 1,845 388
January 24,095 2,207 19,662 1,781 445February 21,645 2,062 17,607 1,555 422
March 23,639 2,250 19,155 1,764 470April 21,796 2,091 17,655 1,623 428May 22,211 2,235 18,072 1,546 359June 22,356 1,940 18,364 1,636 415July 23,150 1,980 19,172 1,667 332
August 23,382 2,082 19,213 1,696 392Sept 22,170 1,991 18,159 1,658 362
October 21,975 2,020 18,088 1,503 365November 22,267 2,109 18,004 1,756 398December 23,449 2,209 18,940 1,872 428
January 23,580 2,264 19,187 1,737 393February 22,153 2,090 18,071 1,594 399
March 23,668 2,250 19,185 1,807 426April 22,558 2,056 18,366 1,714 422
2016 91,768 8,392 74,717 7,040 1,6192017 91,176 8,610 74,078 6,723 1,7642018 91,959 8,659 74,809 6,852 1,639
2017 277,127 24,501 226,693 21,162 4,7712018 272,920 25,224 222,820 20,185 4,691
Notes: Beginning with the collection of Form EIA-923 in January 2008, the methodology to allocate total fuel consumption for electricity generation and consumption for useful thermal output was changed.The new methodology was retroactively applied to 2004-2007 data. See the Technical Notes (Appendix C) for further information. See Glossary for definitions.Values for 2016 and prior years are final. Values for 2017 and 2018 are preliminary. See Technical Notes for a discussion of the sample design for the Form EIA-923 and predecessor forms.Totals may not equal sum of components because of independent rounding.Sources: U.S. Energy Information Administration, Form EIA-906, Power Plant Report; U.S. Energy Information Administration, Form EIA-920 Combined Heat and Power Plant Report, and predecessor forms.Beginning with 2008 data, the Form EIA-923, Power Plant Operations Report, replaced the following: Form EIA-906, Power Plant Report; Form EIA-920, Combined Heat and Power Plant Report.
Table 2.5.C. Landfill Gas: Consumption for Electricity Generation and Useful Thermal Output,by Sector, 2008-April 2018 (Million Cubic Feet)
Electric Power Sector
Annual Totals
Year 2016
Year 2017
Year 2018
Year to Date
Rolling 12 Months Ending in April
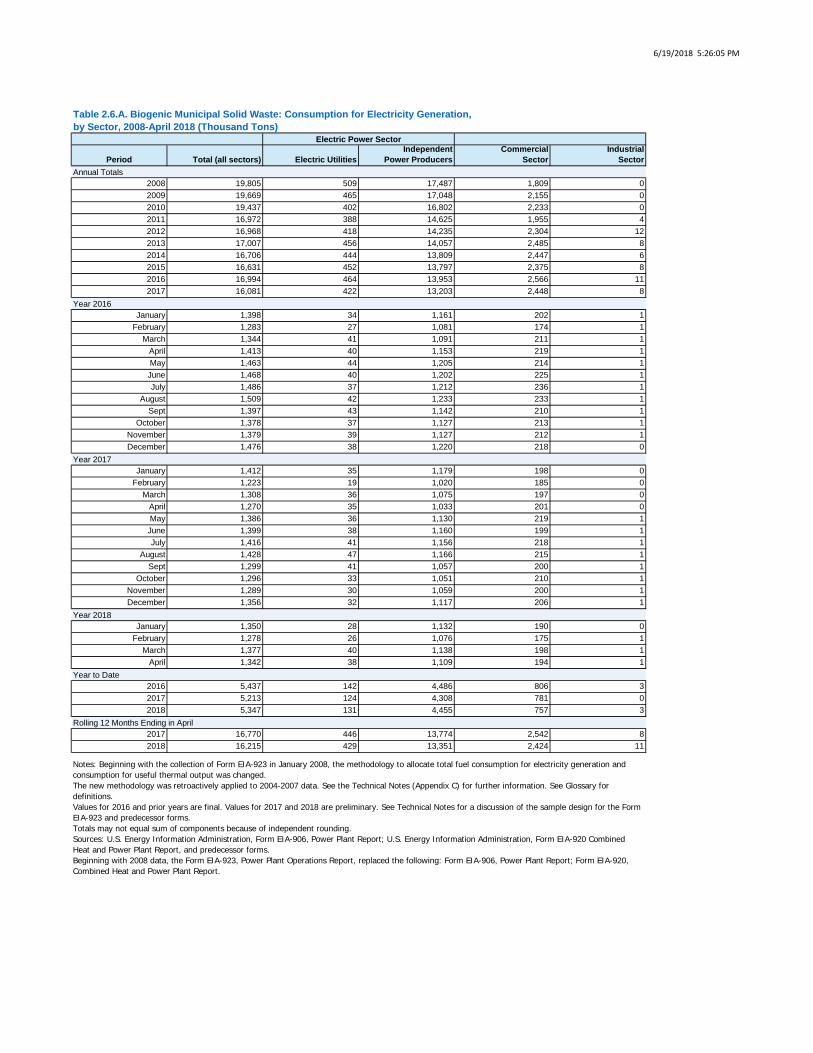
6/19/2018 5:26:05 PM
Period Total (all sectors) Electric UtilitiesIndependent
Power ProducersCommercial
SectorIndustrial
Sector
2008 19,805 509 17,487 1,809 02009 19,669 465 17,048 2,155 02010 19,437 402 16,802 2,233 02011 16,972 388 14,625 1,955 42012 16,968 418 14,235 2,304 122013 17,007 456 14,057 2,485 82014 16,706 444 13,809 2,447 62015 16,631 452 13,797 2,375 82016 16,994 464 13,953 2,566 112017 16,081 422 13,203 2,448 8
January 1,398 34 1,161 202 1February 1,283 27 1,081 174 1
March 1,344 41 1,091 211 1April 1,413 40 1,153 219 1May 1,463 44 1,205 214 1June 1,468 40 1,202 225 1July 1,486 37 1,212 236 1
August 1,509 42 1,233 233 1Sept 1,397 43 1,142 210 1
October 1,378 37 1,127 213 1November 1,379 39 1,127 212 1December 1,476 38 1,220 218 0
January 1,412 35 1,179 198 0February 1,223 19 1,020 185 0
March 1,308 36 1,075 197 0April 1,270 35 1,033 201 0May 1,386 36 1,130 219 1June 1,399 38 1,160 199 1July 1,416 41 1,156 218 1
August 1,428 47 1,166 215 1Sept 1,299 41 1,057 200 1
October 1,296 33 1,051 210 1November 1,289 30 1,059 200 1December 1,356 32 1,117 206 1
January 1,350 28 1,132 190 0February 1,278 26 1,076 175 1
March 1,377 40 1,138 198 1April 1,342 38 1,109 194 1
2016 5,437 142 4,486 806 32017 5,213 124 4,308 781 02018 5,347 131 4,455 757 3
2017 16,770 446 13,774 2,542 82018 16,215 429 13,351 2,424 11
Notes: Beginning with the collection of Form EIA-923 in January 2008, the methodology to allocate total fuel consumption for electricity generation and consumption for useful thermal output was changed.The new methodology was retroactively applied to 2004-2007 data. See the Technical Notes (Appendix C) for further information. See Glossary for definitions.Values for 2016 and prior years are final. Values for 2017 and 2018 are preliminary. See Technical Notes for a discussion of the sample design for the Form EIA-923 and predecessor forms.Totals may not equal sum of components because of independent rounding.Sources: U.S. Energy Information Administration, Form EIA-906, Power Plant Report; U.S. Energy Information Administration, Form EIA-920 Combined Heat and Power Plant Report, and predecessor forms.Beginning with 2008 data, the Form EIA-923, Power Plant Operations Report, replaced the following: Form EIA-906, Power Plant Report; Form EIA-920, Combined Heat and Power Plant Report.
Table 2.6.A. Biogenic Municipal Solid Waste: Consumption for Electricity Generation,by Sector, 2008-April 2018 (Thousand Tons)
Electric Power Sector
Annual Totals
Year 2016
Year 2017
Year 2018
Year to Date
Rolling 12 Months Ending in April
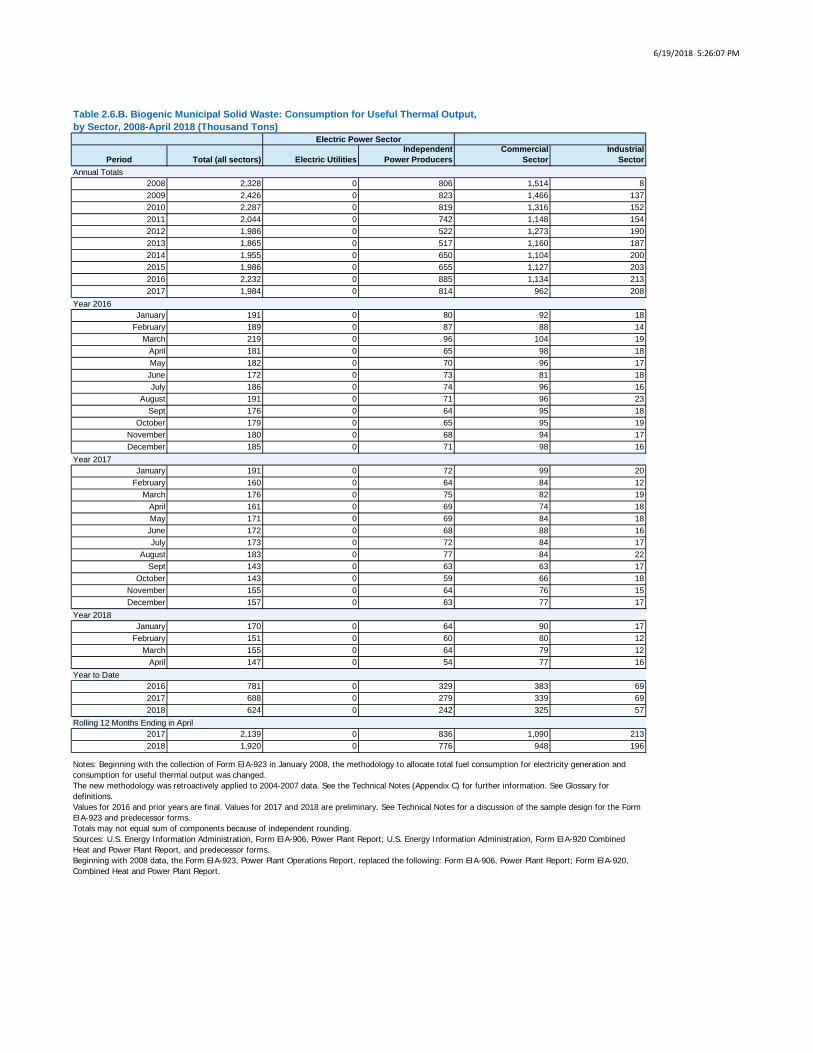
6/19/2018 5:26:07 PM
Period Total (all sectors) Electric UtilitiesIndependent
Power ProducersCommercial
SectorIndustrial
Sector
2008 2,328 0 806 1,514 82009 2,426 0 823 1,466 1372010 2,287 0 819 1,316 1522011 2,044 0 742 1,148 1542012 1,986 0 522 1,273 1902013 1,865 0 517 1,160 1872014 1,955 0 650 1,104 2002015 1,986 0 655 1,127 2032016 2,232 0 885 1,134 2132017 1,984 0 814 962 208
January 191 0 80 92 18February 189 0 87 88 14
March 219 0 96 104 19April 181 0 65 98 18May 182 0 70 96 17June 172 0 73 81 18July 186 0 74 96 16
August 191 0 71 96 23Sept 176 0 64 95 18
October 179 0 65 95 19November 180 0 68 94 17December 185 0 71 98 16
January 191 0 72 99 20February 160 0 64 84 12
March 176 0 75 82 19April 161 0 69 74 18May 171 0 69 84 18June 172 0 68 88 16July 173 0 72 84 17
August 183 0 77 84 22Sept 143 0 63 63 17
October 143 0 59 66 18November 155 0 64 76 15December 157 0 63 77 17
January 170 0 64 90 17February 151 0 60 80 12
March 155 0 64 79 12April 147 0 54 77 16
2016 781 0 329 383 692017 688 0 279 339 692018 624 0 242 325 57
2017 2,139 0 836 1,090 2132018 1,920 0 776 948 196
Notes: Beginning with the collection of Form EIA-923 in January 2008, the methodology to allocate total fuel consumption for electricity generation and consumption for useful thermal output was changed.The new methodology was retroactively applied to 2004-2007 data. See the Technical Notes (Appendix C) for further information. See Glossary for definitions.Values for 2016 and prior years are final. Values for 2017 and 2018 are preliminary. See Technical Notes for a discussion of the sample design for the Form EIA-923 and predecessor forms.Totals may not equal sum of components because of independent rounding.Sources: U.S. Energy Information Administration, Form EIA-906, Power Plant Report; U.S. Energy Information Administration, Form EIA-920 Combined Heat and Power Plant Report, and predecessor forms.Beginning with 2008 data, the Form EIA-923, Power Plant Operations Report, replaced the following: Form EIA-906, Power Plant Report; Form EIA-920, Combined Heat and Power Plant Report.
Table 2.6.B. Biogenic Municipal Solid Waste: Consumption for Useful Thermal Output,by Sector, 2008-April 2018 (Thousand Tons)
Electric Power Sector
Annual Totals
Year 2016
Year 2017
Year 2018
Year to Date
Rolling 12 Months Ending in April
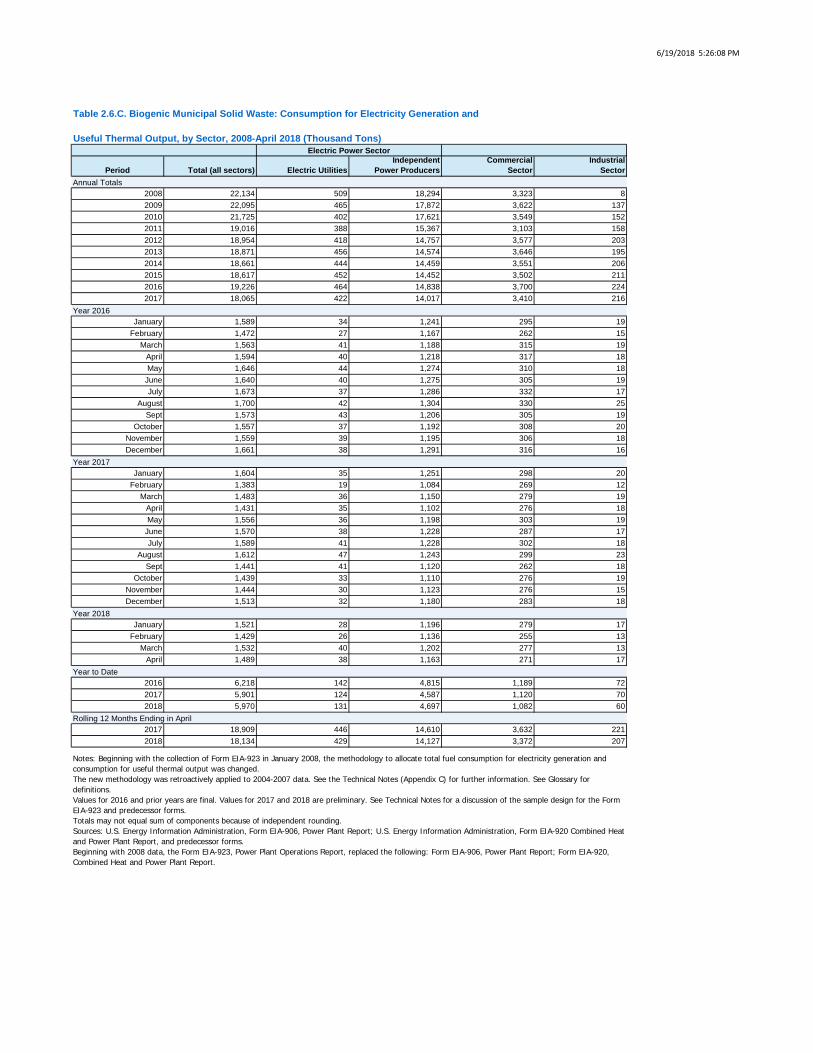
6/19/2018 5:26:08 PM
Period Total (all sectors) Electric UtilitiesIndependent
Power ProducersCommercial
SectorIndustrial
Sector
2008 22,134 509 18,294 3,323 82009 22,095 465 17,872 3,622 1372010 21,725 402 17,621 3,549 1522011 19,016 388 15,367 3,103 1582012 18,954 418 14,757 3,577 2032013 18,871 456 14,574 3,646 1952014 18,661 444 14,459 3,551 2062015 18,617 452 14,452 3,502 2112016 19,226 464 14,838 3,700 2242017 18,065 422 14,017 3,410 216
January 1,589 34 1,241 295 19February 1,472 27 1,167 262 15
March 1,563 41 1,188 315 19April 1,594 40 1,218 317 18May 1,646 44 1,274 310 18
June 1,640 40 1,275 305 19July 1,673 37 1,286 332 17
August 1,700 42 1,304 330 25Sept 1,573 43 1,206 305 19
October 1,557 37 1,192 308 20November 1,559 39 1,195 306 18December 1,661 38 1,291 316 16
January 1,604 35 1,251 298 20February 1,383 19 1,084 269 12
March 1,483 36 1,150 279 19April 1,431 35 1,102 276 18May 1,556 36 1,198 303 19
June 1,570 38 1,228 287 17July 1,589 41 1,228 302 18
August 1,612 47 1,243 299 23Sept 1,441 41 1,120 262 18
October 1,439 33 1,110 276 19November 1,444 30 1,123 276 15December 1,513 32 1,180 283 18
January 1,521 28 1,196 279 17February 1,429 26 1,136 255 13
March 1,532 40 1,202 277 13April 1,489 38 1,163 271 17
2016 6,218 142 4,815 1,189 722017 5,901 124 4,587 1,120 702018 5,970 131 4,697 1,082 60
2017 18,909 446 14,610 3,632 2212018 18,134 429 14,127 3,372 207
Notes: Beginning with the collection of Form EIA-923 in January 2008, the methodology to allocate total fuel consumption for electricity generation and consumption for useful thermal output was changed.The new methodology was retroactively applied to 2004-2007 data. See the Technical Notes (Appendix C) for further information. See Glossary for definitions.Values for 2016 and prior years are final. Values for 2017 and 2018 are preliminary. See Technical Notes for a discussion of the sample design for the Form EIA-923 and predecessor forms.Totals may not equal sum of components because of independent rounding.Sources: U.S. Energy Information Administration, Form EIA-906, Power Plant Report; U.S. Energy Information Administration, Form EIA-920 Combined Heat and Power Plant Report, and predecessor forms.Beginning with 2008 data, the Form EIA-923, Power Plant Operations Report, replaced the following: Form EIA-906, Power Plant Report; Form EIA-920, Combined Heat and Power Plant Report.
Table 2.6.C. Biogenic Municipal Solid Waste: Consumption for Electricity Generation and
Useful Thermal Output, by Sector, 2008-April 2018 (Thousand Tons)Electric Power Sector
Annual Totals
Year 2016
Year 2017
Year 2018
Year to Date
Rolling 12 Months Ending in April
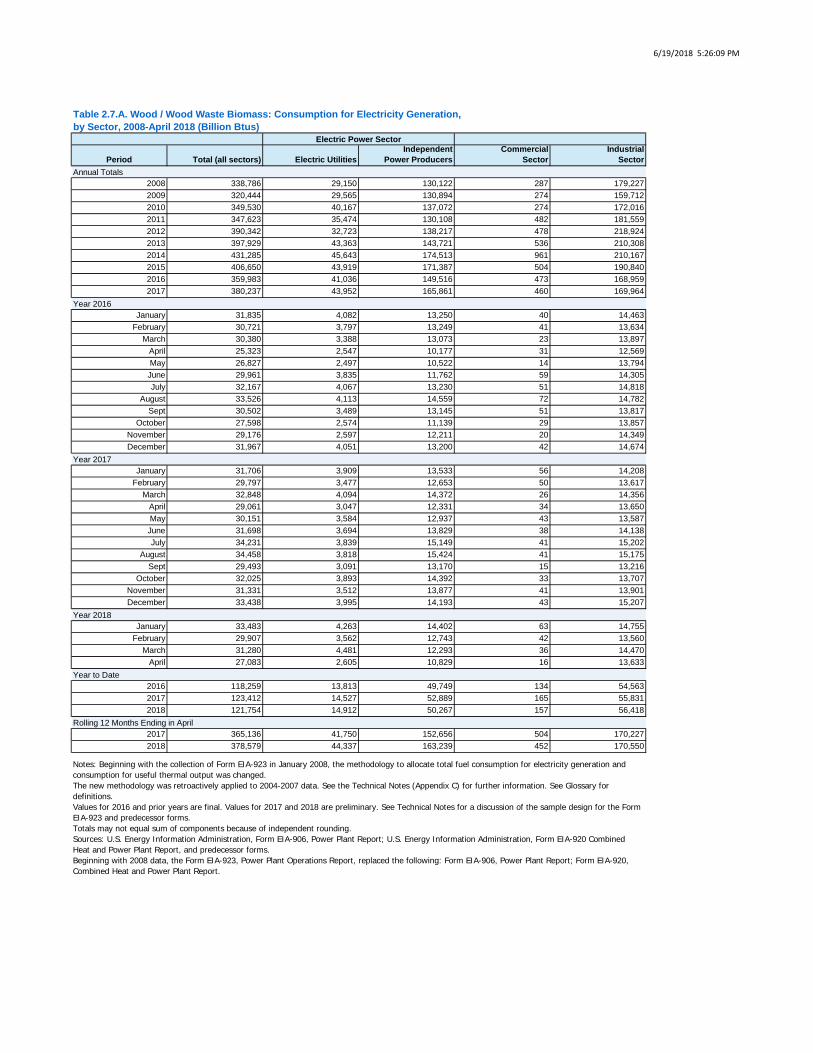
6/19/2018 5:26:09 PM
Period Total (all sectors) Electric UtilitiesIndependent
Power ProducersCommercial
SectorIndustrial
Sector
2008 338,786 29,150 130,122 287 179,2272009 320,444 29,565 130,894 274 159,7122010 349,530 40,167 137,072 274 172,0162011 347,623 35,474 130,108 482 181,5592012 390,342 32,723 138,217 478 218,9242013 397,929 43,363 143,721 536 210,3082014 431,285 45,643 174,513 961 210,1672015 406,650 43,919 171,387 504 190,8402016 359,983 41,036 149,516 473 168,9592017 380,237 43,952 165,861 460 169,964
January 31,835 4,082 13,250 40 14,463February 30,721 3,797 13,249 41 13,634
March 30,380 3,388 13,073 23 13,897April 25,323 2,547 10,177 31 12,569May 26,827 2,497 10,522 14 13,794June 29,961 3,835 11,762 59 14,305July 32,167 4,067 13,230 51 14,818
August 33,526 4,113 14,559 72 14,782Sept 30,502 3,489 13,145 51 13,817
October 27,598 2,574 11,139 29 13,857November 29,176 2,597 12,211 20 14,349December 31,967 4,051 13,200 42 14,674
January 31,706 3,909 13,533 56 14,208February 29,797 3,477 12,653 50 13,617
March 32,848 4,094 14,372 26 14,356April 29,061 3,047 12,331 34 13,650May 30,151 3,584 12,937 43 13,587June 31,698 3,694 13,829 38 14,138July 34,231 3,839 15,149 41 15,202
August 34,458 3,818 15,424 41 15,175Sept 29,493 3,091 13,170 15 13,216
October 32,025 3,893 14,392 33 13,707November 31,331 3,512 13,877 41 13,901December 33,438 3,995 14,193 43 15,207
January 33,483 4,263 14,402 63 14,755February 29,907 3,562 12,743 42 13,560
March 31,280 4,481 12,293 36 14,470April 27,083 2,605 10,829 16 13,633
2016 118,259 13,813 49,749 134 54,5632017 123,412 14,527 52,889 165 55,8312018 121,754 14,912 50,267 157 56,418
2017 365,136 41,750 152,656 504 170,2272018 378,579 44,337 163,239 452 170,550
Notes: Beginning with the collection of Form EIA-923 in January 2008, the methodology to allocate total fuel consumption for electricity generation and consumption for useful thermal output was changed.The new methodology was retroactively applied to 2004-2007 data. See the Technical Notes (Appendix C) for further information. See Glossary for definitions.Values for 2016 and prior years are final. Values for 2017 and 2018 are preliminary. See Technical Notes for a discussion of the sample design for the Form EIA-923 and predecessor forms.Totals may not equal sum of components because of independent rounding.Sources: U.S. Energy Information Administration, Form EIA-906, Power Plant Report; U.S. Energy Information Administration, Form EIA-920 Combined Heat and Power Plant Report, and predecessor forms.Beginning with 2008 data, the Form EIA-923, Power Plant Operations Report, replaced the following: Form EIA-906, Power Plant Report; Form EIA-920, Combined Heat and Power Plant Report.
Table 2.7.A. Wood / Wood Waste Biomass: Consumption for Electricity Generation,by Sector, 2008-April 2018 (Billion Btus)
Electric Power Sector
Annual Totals
Year 2016
Year 2017
Year 2018
Year to Date
Rolling 12 Months Ending in April
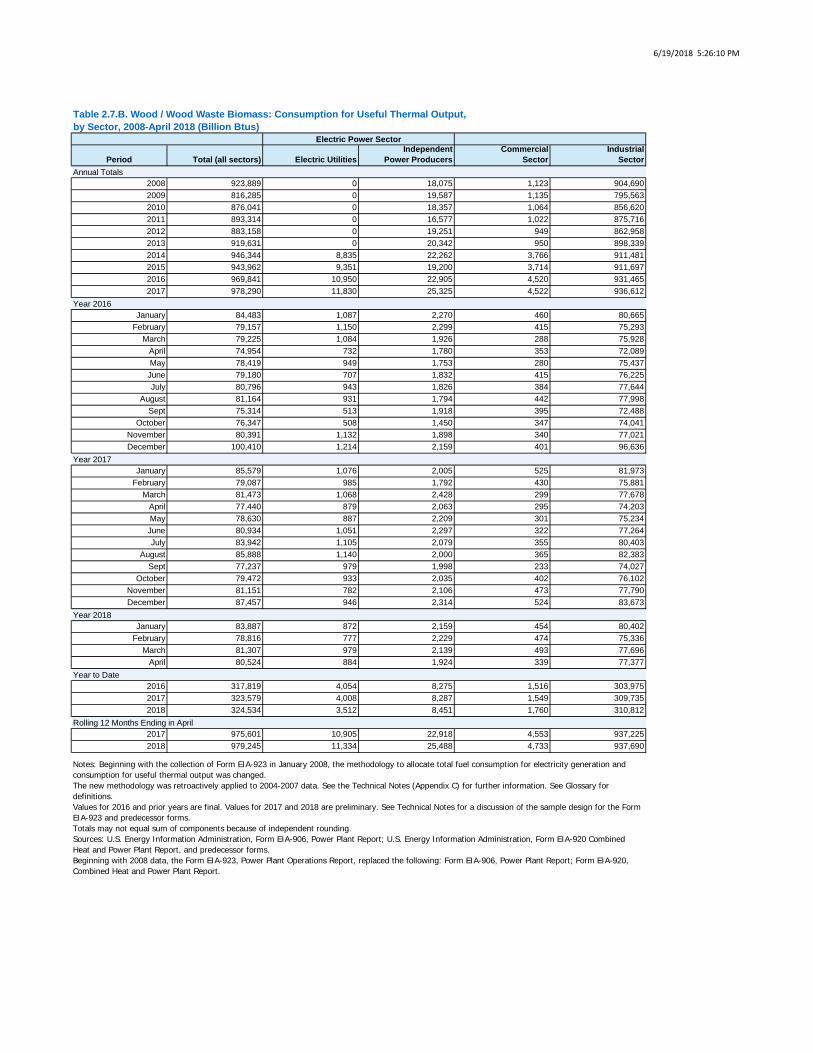
6/19/2018 5:26:10 PM
Period Total (all sectors) Electric UtilitiesIndependent
Power ProducersCommercial
SectorIndustrial
Sector
2008 923,889 0 18,075 1,123 904,6902009 816,285 0 19,587 1,135 795,5632010 876,041 0 18,357 1,064 856,6202011 893,314 0 16,577 1,022 875,7162012 883,158 0 19,251 949 862,9582013 919,631 0 20,342 950 898,3392014 946,344 8,835 22,262 3,766 911,4812015 943,962 9,351 19,200 3,714 911,6972016 969,841 10,950 22,905 4,520 931,4652017 978,290 11,830 25,325 4,522 936,612
January 84,483 1,087 2,270 460 80,665February 79,157 1,150 2,299 415 75,293
March 79,225 1,084 1,926 288 75,928April 74,954 732 1,780 353 72,089May 78,419 949 1,753 280 75,437June 79,180 707 1,832 415 76,225July 80,796 943 1,826 384 77,644
August 81,164 931 1,794 442 77,998Sept 75,314 513 1,918 395 72,488
October 76,347 508 1,450 347 74,041November 80,391 1,132 1,898 340 77,021December 100,410 1,214 2,159 401 96,636
January 85,579 1,076 2,005 525 81,973February 79,087 985 1,792 430 75,881
March 81,473 1,068 2,428 299 77,678April 77,440 879 2,063 295 74,203May 78,630 887 2,209 301 75,234June 80,934 1,051 2,297 322 77,264July 83,942 1,105 2,079 355 80,403
August 85,888 1,140 2,000 365 82,383Sept 77,237 979 1,998 233 74,027
October 79,472 933 2,035 402 76,102November 81,151 782 2,106 473 77,790December 87,457 946 2,314 524 83,673
January 83,887 872 2,159 454 80,402February 78,816 777 2,229 474 75,336
March 81,307 979 2,139 493 77,696April 80,524 884 1,924 339 77,377
2016 317,819 4,054 8,275 1,516 303,9752017 323,579 4,008 8,287 1,549 309,7352018 324,534 3,512 8,451 1,760 310,812
2017 975,601 10,905 22,918 4,553 937,2252018 979,245 11,334 25,488 4,733 937,690
Notes: Beginning with the collection of Form EIA-923 in January 2008, the methodology to allocate total fuel consumption for electricity generation and consumption for useful thermal output was changed.The new methodology was retroactively applied to 2004-2007 data. See the Technical Notes (Appendix C) for further information. See Glossary for definitions.Values for 2016 and prior years are final. Values for 2017 and 2018 are preliminary. See Technical Notes for a discussion of the sample design for the Form EIA-923 and predecessor forms.Totals may not equal sum of components because of independent rounding.Sources: U.S. Energy Information Administration, Form EIA-906, Power Plant Report; U.S. Energy Information Administration, Form EIA-920 Combined Heat and Power Plant Report, and predecessor forms.Beginning with 2008 data, the Form EIA-923, Power Plant Operations Report, replaced the following: Form EIA-906, Power Plant Report; Form EIA-920, Combined Heat and Power Plant Report.
Table 2.7.B. Wood / Wood Waste Biomass: Consumption for Useful Thermal Output,by Sector, 2008-April 2018 (Billion Btus)
Electric Power Sector
Annual Totals
Year 2016
Year 2017
Year 2018
Year to Date
Rolling 12 Months Ending in April
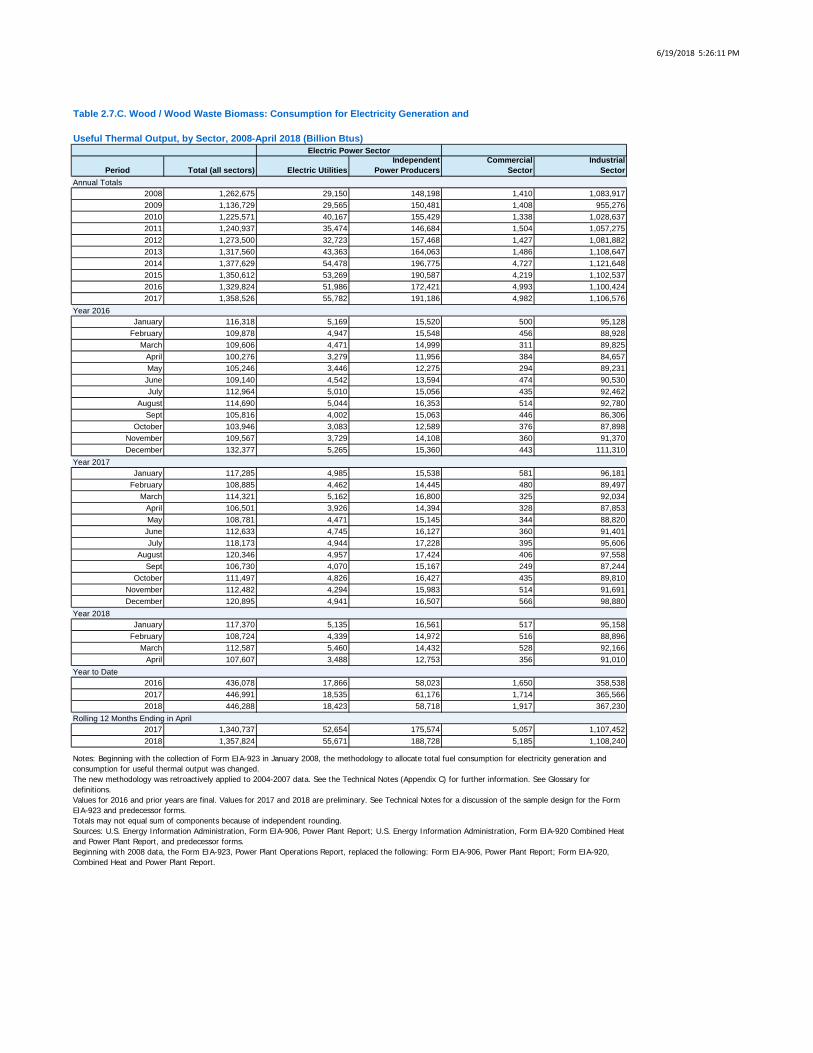
6/19/2018 5:26:11 PM
Period Total (all sectors) Electric UtilitiesIndependent
Power ProducersCommercial
SectorIndustrial
Sector
2008 1,262,675 29,150 148,198 1,410 1,083,9172009 1,136,729 29,565 150,481 1,408 955,2762010 1,225,571 40,167 155,429 1,338 1,028,6372011 1,240,937 35,474 146,684 1,504 1,057,2752012 1,273,500 32,723 157,468 1,427 1,081,8822013 1,317,560 43,363 164,063 1,486 1,108,6472014 1,377,629 54,478 196,775 4,727 1,121,6482015 1,350,612 53,269 190,587 4,219 1,102,5372016 1,329,824 51,986 172,421 4,993 1,100,4242017 1,358,526 55,782 191,186 4,982 1,106,576
January 116,318 5,169 15,520 500 95,128February 109,878 4,947 15,548 456 88,928
March 109,606 4,471 14,999 311 89,825April 100,276 3,279 11,956 384 84,657May 105,246 3,446 12,275 294 89,231
June 109,140 4,542 13,594 474 90,530July 112,964 5,010 15,056 435 92,462
August 114,690 5,044 16,353 514 92,780Sept 105,816 4,002 15,063 446 86,306
October 103,946 3,083 12,589 376 87,898November 109,567 3,729 14,108 360 91,370December 132,377 5,265 15,360 443 111,310
January 117,285 4,985 15,538 581 96,181February 108,885 4,462 14,445 480 89,497
March 114,321 5,162 16,800 325 92,034April 106,501 3,926 14,394 328 87,853May 108,781 4,471 15,145 344 88,820
June 112,633 4,745 16,127 360 91,401July 118,173 4,944 17,228 395 95,606
August 120,346 4,957 17,424 406 97,558Sept 106,730 4,070 15,167 249 87,244
October 111,497 4,826 16,427 435 89,810November 112,482 4,294 15,983 514 91,691December 120,895 4,941 16,507 566 98,880
January 117,370 5,135 16,561 517 95,158February 108,724 4,339 14,972 516 88,896
March 112,587 5,460 14,432 528 92,166April 107,607 3,488 12,753 356 91,010
2016 436,078 17,866 58,023 1,650 358,5382017 446,991 18,535 61,176 1,714 365,5662018 446,288 18,423 58,718 1,917 367,230
2017 1,340,737 52,654 175,574 5,057 1,107,4522018 1,357,824 55,671 188,728 5,185 1,108,240
Notes: Beginning with the collection of Form EIA-923 in January 2008, the methodology to allocate total fuel consumption for electricity generation and consumption for useful thermal output was changed.The new methodology was retroactively applied to 2004-2007 data. See the Technical Notes (Appendix C) for further information. See Glossary for definitions.Values for 2016 and prior years are final. Values for 2017 and 2018 are preliminary. See Technical Notes for a discussion of the sample design for the Form EIA-923 and predecessor forms.Totals may not equal sum of components because of independent rounding.Sources: U.S. Energy Information Administration, Form EIA-906, Power Plant Report; U.S. Energy Information Administration, Form EIA-920 Combined Heat and Power Plant Report, and predecessor forms.Beginning with 2008 data, the Form EIA-923, Power Plant Operations Report, replaced the following: Form EIA-906, Power Plant Report; Form EIA-920, Combined Heat and Power Plant Report.
Table 2.7.C. Wood / Wood Waste Biomass: Consumption for Electricity Generation and
Useful Thermal Output, by Sector, 2008-April 2018 (Billion Btus)Electric Power Sector
Annual Totals
Year 2016
Year 2017
Year 2018
Year to Date
Rolling 12 Months Ending in April
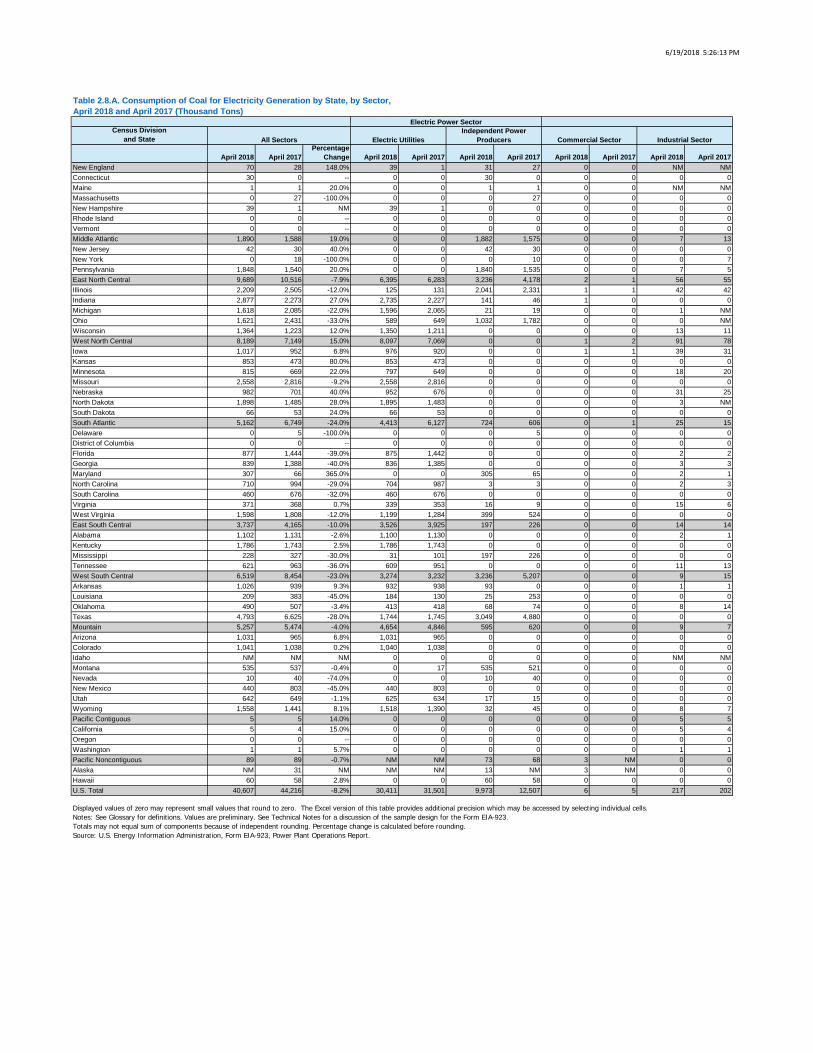
6/19/2018 5:26:13 PM
Census Divisionand State
April 2018 April 2017Percentage
Change April 2018 April 2017 April 2018 April 2017 April 2018 April 2017 April 2018 April 2017New England 70 28 148.0% 39 1 31 27 0 0 NM NMConnecticut 30 0 -- 0 0 30 0 0 0 0 0Maine 1 1 20.0% 0 0 1 1 0 0 NM NMMassachusetts 0 27 -100.0% 0 0 0 27 0 0 0 0New Hampshire 39 1 NM 39 1 0 0 0 0 0 0Rhode Island 0 0 -- 0 0 0 0 0 0 0 0Vermont 0 0 -- 0 0 0 0 0 0 0 0Middle Atlantic 1,890 1,588 19.0% 0 0 1,882 1,575 0 0 7 13New Jersey 42 30 40.0% 0 0 42 30 0 0 0 0New York 0 18 -100.0% 0 0 0 10 0 0 0 7Pennsylvania 1,848 1,540 20.0% 0 0 1,840 1,535 0 0 7 5East North Central 9,689 10,516 -7.9% 6,395 6,283 3,236 4,178 2 1 56 55Illinois 2,209 2,505 -12.0% 125 131 2,041 2,331 1 1 42 42Indiana 2,877 2,273 27.0% 2,735 2,227 141 46 1 0 0 0Michigan 1,618 2,085 -22.0% 1,596 2,065 21 19 0 0 1 NMOhio 1,621 2,431 -33.0% 589 649 1,032 1,782 0 0 0 NMWisconsin 1,364 1,223 12.0% 1,350 1,211 0 0 0 0 13 11West North Central 8,189 7,149 15.0% 8,097 7,069 0 0 1 2 91 78Iowa 1,017 952 6.8% 976 920 0 0 1 1 39 31Kansas 853 473 80.0% 853 473 0 0 0 0 0 0Minnesota 815 669 22.0% 797 649 0 0 0 0 18 20Missouri 2,558 2,816 -9.2% 2,558 2,816 0 0 0 0 0 0Nebraska 982 701 40.0% 952 676 0 0 0 0 31 25North Dakota 1,898 1,485 28.0% 1,895 1,483 0 0 0 0 3 NMSouth Dakota 66 53 24.0% 66 53 0 0 0 0 0 0South Atlantic 5,162 6,749 -24.0% 4,413 6,127 724 606 0 1 25 15Delaware 0 5 -100.0% 0 0 0 5 0 0 0 0District of Columbia 0 0 -- 0 0 0 0 0 0 0 0Florida 877 1,444 -39.0% 875 1,442 0 0 0 0 2 2Georgia 839 1,388 -40.0% 836 1,385 0 0 0 0 3 3Maryland 307 66 365.0% 0 0 305 65 0 0 2 1North Carolina 710 994 -29.0% 704 987 3 3 0 0 2 3South Carolina 460 676 -32.0% 460 676 0 0 0 0 0 0Virginia 371 368 0.7% 339 353 16 9 0 0 15 6West Virginia 1,598 1,808 -12.0% 1,199 1,284 399 524 0 0 0 0East South Central 3,737 4,165 -10.0% 3,526 3,925 197 226 0 0 14 14Alabama 1,102 1,131 -2.6% 1,100 1,130 0 0 0 0 2 1Kentucky 1,786 1,743 2.5% 1,786 1,743 0 0 0 0 0 0Mississippi 228 327 -30.0% 31 101 197 226 0 0 0 0Tennessee 621 963 -36.0% 609 951 0 0 0 0 11 13West South Central 6,519 8,454 -23.0% 3,274 3,232 3,236 5,207 0 0 9 15Arkansas 1,026 939 9.3% 932 938 93 0 0 0 1 1Louisiana 209 383 -45.0% 184 130 25 253 0 0 0 0Oklahoma 490 507 -3.4% 413 418 68 74 0 0 8 14Texas 4,793 6,625 -28.0% 1,744 1,745 3,049 4,880 0 0 0 0Mountain 5,257 5,474 -4.0% 4,654 4,846 595 620 0 0 9 7Arizona 1,031 965 6.8% 1,031 965 0 0 0 0 0 0Colorado 1,041 1,038 0.2% 1,040 1,038 0 0 0 0 0 0Idaho NM NM NM 0 0 0 0 0 0 NM NMMontana 535 537 -0.4% 0 17 535 521 0 0 0 0Nevada 10 40 -74.0% 0 0 10 40 0 0 0 0New Mexico 440 803 -45.0% 440 803 0 0 0 0 0 0Utah 642 649 -1.1% 625 634 17 15 0 0 0 0Wyoming 1,558 1,441 8.1% 1,518 1,390 32 45 0 0 8 7Pacific Contiguous 5 5 14.0% 0 0 0 0 0 0 5 5California 5 4 15.0% 0 0 0 0 0 0 5 4Oregon 0 0 -- 0 0 0 0 0 0 0 0Washington 1 1 5.7% 0 0 0 0 0 0 1 1Pacific Noncontiguous 89 89 -0.7% NM NM 73 68 3 NM 0 0Alaska NM 31 NM NM NM 13 NM 3 NM 0 0Hawaii 60 58 2.8% 0 0 60 58 0 0 0 0U.S. Total 40,607 44,216 -8.2% 30,411 31,501 9,973 12,507 6 5 217 202
Displayed values of zero may represent small values that round to zero. The Excel version of this table provides additional precision which may be accessed by selecting individual cells.Notes: See Glossary for definitions. Values are preliminary. See Technical Notes for a discussion of the sample design for the Form EIA-923.Totals may not equal sum of components because of independent rounding. Percentage change is calculated before rounding.Source: U.S. Energy Information Administration, Form EIA-923, Power Plant Operations Report.
Table 2.8.A. Consumption of Coal for Electricity Generation by State, by Sector,April 2018 and April 2017 (Thousand Tons)
Electric Power Sector
All Sectors Electric UtilitiesIndependent Power
Producers Commercial Sector Industrial Sector
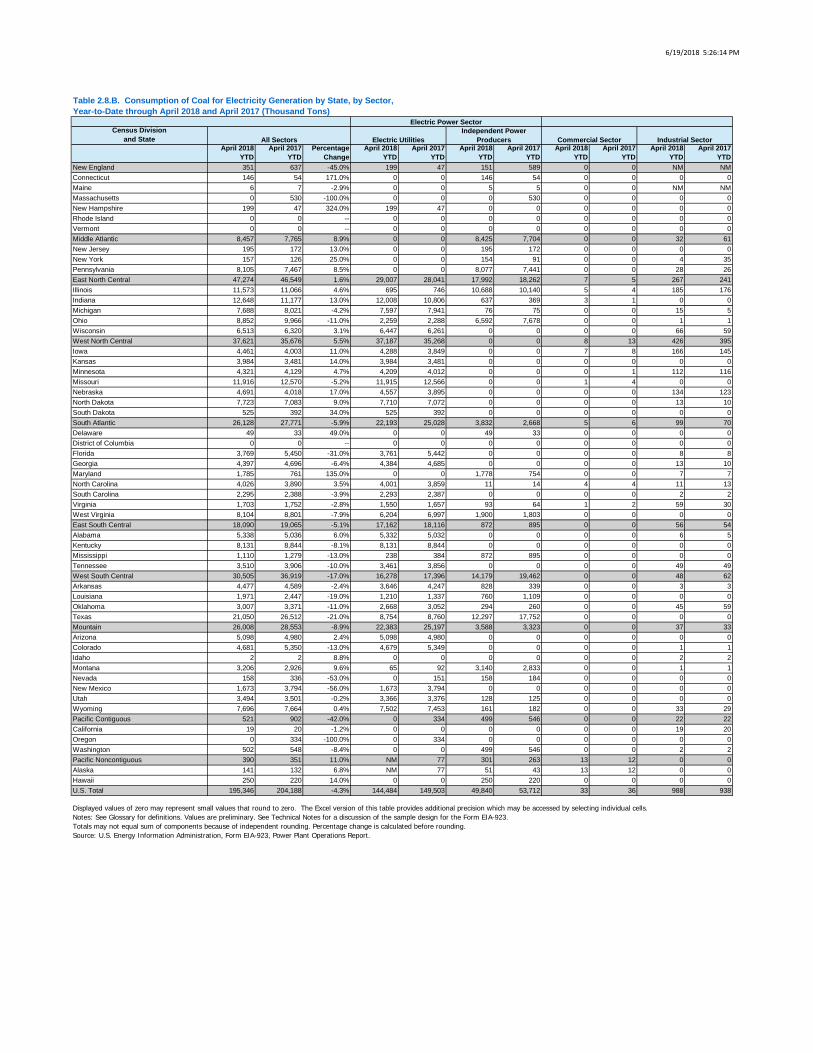
6/19/2018 5:26:14 PM
Census Divisionand State
April 2018 YTD
April 2017 YTD
Percentage Change
April 2018 YTD
April 2017 YTD
April 2018 YTD
April 2017 YTD
April 2018 YTD
April 2017 YTD
April 2018 YTD
April 2017 YTD
New England 351 637 -45.0% 199 47 151 589 0 0 NM NMConnecticut 146 54 171.0% 0 0 146 54 0 0 0 0Maine 6 7 -2.9% 0 0 5 5 0 0 NM NMMassachusetts 0 530 -100.0% 0 0 0 530 0 0 0 0New Hampshire 199 47 324.0% 199 47 0 0 0 0 0 0Rhode Island 0 0 -- 0 0 0 0 0 0 0 0Vermont 0 0 -- 0 0 0 0 0 0 0 0Middle Atlantic 8,457 7,765 8.9% 0 0 8,425 7,704 0 0 32 61New Jersey 195 172 13.0% 0 0 195 172 0 0 0 0New York 157 126 25.0% 0 0 154 91 0 0 4 35Pennsylvania 8,105 7,467 8.5% 0 0 8,077 7,441 0 0 28 26East North Central 47,274 46,549 1.6% 29,007 28,041 17,992 18,262 7 5 267 241Illinois 11,573 11,066 4.6% 695 746 10,688 10,140 5 4 185 176Indiana 12,648 11,177 13.0% 12,008 10,806 637 369 3 1 0 0Michigan 7,688 8,021 -4.2% 7,597 7,941 76 75 0 0 15 5Ohio 8,852 9,966 -11.0% 2,259 2,288 6,592 7,678 0 0 1 1Wisconsin 6,513 6,320 3.1% 6,447 6,261 0 0 0 0 66 59West North Central 37,621 35,676 5.5% 37,187 35,268 0 0 8 13 426 395Iowa 4,461 4,003 11.0% 4,288 3,849 0 0 7 8 166 145Kansas 3,984 3,481 14.0% 3,984 3,481 0 0 0 0 0 0Minnesota 4,321 4,129 4.7% 4,209 4,012 0 0 0 1 112 116Missouri 11,916 12,570 -5.2% 11,915 12,566 0 0 1 4 0 0Nebraska 4,691 4,018 17.0% 4,557 3,895 0 0 0 0 134 123North Dakota 7,723 7,083 9.0% 7,710 7,072 0 0 0 0 13 10South Dakota 525 392 34.0% 525 392 0 0 0 0 0 0South Atlantic 26,128 27,771 -5.9% 22,193 25,028 3,832 2,668 5 6 99 70Delaware 49 33 49.0% 0 0 49 33 0 0 0 0District of Columbia 0 0 -- 0 0 0 0 0 0 0 0Florida 3,769 5,450 -31.0% 3,761 5,442 0 0 0 0 8 8Georgia 4,397 4,696 -6.4% 4,384 4,685 0 0 0 0 13 10Maryland 1,785 761 135.0% 0 0 1,778 754 0 0 7 7North Carolina 4,026 3,890 3.5% 4,001 3,859 11 14 4 4 11 13South Carolina 2,295 2,388 -3.9% 2,293 2,387 0 0 0 0 2 2Virginia 1,703 1,752 -2.8% 1,550 1,657 93 64 1 2 59 30West Virginia 8,104 8,801 -7.9% 6,204 6,997 1,900 1,803 0 0 0 0East South Central 18,090 19,065 -5.1% 17,162 18,116 872 895 0 0 56 54Alabama 5,338 5,036 6.0% 5,332 5,032 0 0 0 0 6 5Kentucky 8,131 8,844 -8.1% 8,131 8,844 0 0 0 0 0 0Mississippi 1,110 1,279 -13.0% 238 384 872 895 0 0 0 0Tennessee 3,510 3,906 -10.0% 3,461 3,856 0 0 0 0 49 49West South Central 30,505 36,919 -17.0% 16,278 17,396 14,179 19,462 0 0 48 62Arkansas 4,477 4,589 -2.4% 3,646 4,247 828 339 0 0 3 3Louisiana 1,971 2,447 -19.0% 1,210 1,337 760 1,109 0 0 0 0Oklahoma 3,007 3,371 -11.0% 2,668 3,052 294 260 0 0 45 59Texas 21,050 26,512 -21.0% 8,754 8,760 12,297 17,752 0 0 0 0Mountain 26,008 28,553 -8.9% 22,383 25,197 3,588 3,323 0 0 37 33Arizona 5,098 4,980 2.4% 5,098 4,980 0 0 0 0 0 0Colorado 4,681 5,350 -13.0% 4,679 5,349 0 0 0 0 1 1Idaho 2 2 8.8% 0 0 0 0 0 0 2 2Montana 3,206 2,926 9.6% 65 92 3,140 2,833 0 0 1 1Nevada 158 336 -53.0% 0 151 158 184 0 0 0 0New Mexico 1,673 3,794 -56.0% 1,673 3,794 0 0 0 0 0 0Utah 3,494 3,501 -0.2% 3,366 3,376 128 125 0 0 0 0Wyoming 7,696 7,664 0.4% 7,502 7,453 161 182 0 0 33 29Pacific Contiguous 521 902 -42.0% 0 334 499 546 0 0 22 22California 19 20 -1.2% 0 0 0 0 0 0 19 20Oregon 0 334 -100.0% 0 334 0 0 0 0 0 0Washington 502 548 -8.4% 0 0 499 546 0 0 2 2Pacific Noncontiguous 390 351 11.0% NM 77 301 263 13 12 0 0Alaska 141 132 6.8% NM 77 51 43 13 12 0 0Hawaii 250 220 14.0% 0 0 250 220 0 0 0 0U.S. Total 195,346 204,188 -4.3% 144,484 149,503 49,840 53,712 33 36 988 938
Displayed values of zero may represent small values that round to zero. The Excel version of this table provides additional precision which may be accessed by selecting individual cells.Notes: See Glossary for definitions. Values are preliminary. See Technical Notes for a discussion of the sample design for the Form EIA-923.Totals may not equal sum of components because of independent rounding. Percentage change is calculated before rounding.Source: U.S. Energy Information Administration, Form EIA-923, Power Plant Operations Report.
Table 2.8.B. Consumption of Coal for Electricity Generation by State, by Sector,Year-to-Date through April 2018 and April 2017 (Thousand Tons)
Electric Power Sector
All Sectors Electric UtilitiesIndependent Power
Producers Commercial Sector Industrial Sector
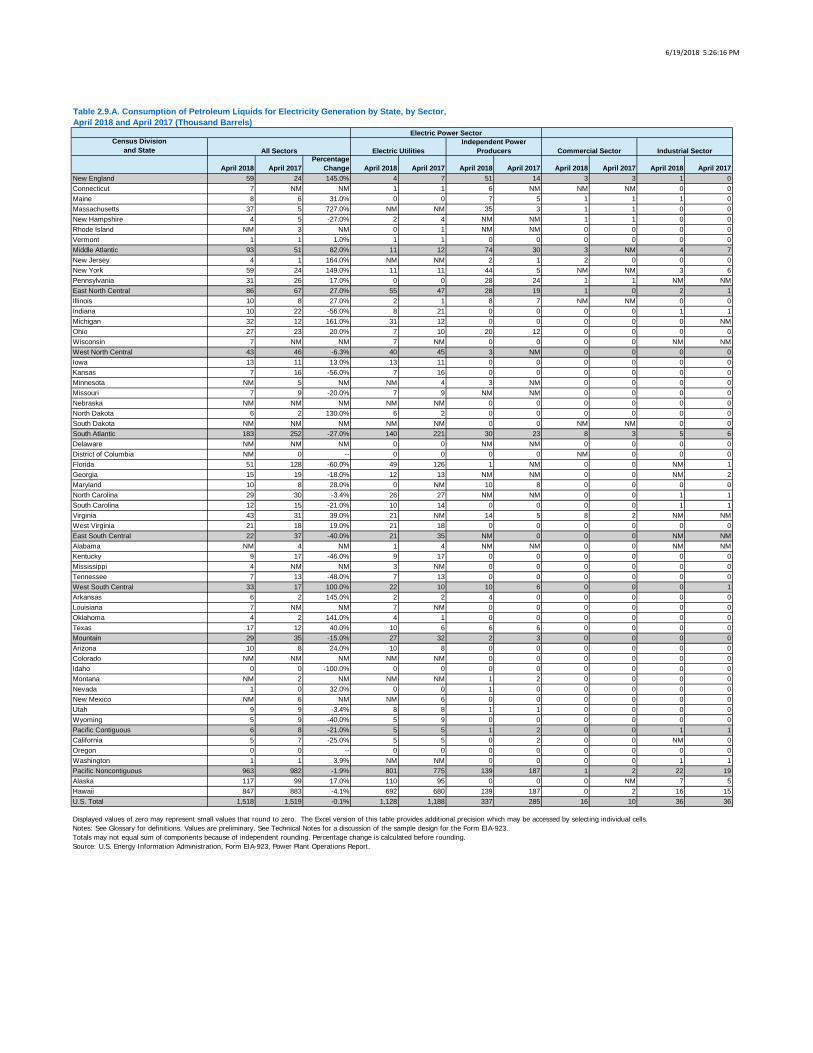
6/19/2018 5:26:16 PM
Census Divisionand State
April 2018 April 2017Percentage
Change April 2018 April 2017 April 2018 April 2017 April 2018 April 2017 April 2018 April 2017New England 59 24 145.0% 4 7 51 14 3 3 1 0Connecticut 7 NM NM 1 1 6 NM NM NM 0 0Maine 8 6 31.0% 0 0 7 5 1 1 1 0Massachusetts 37 5 727.0% NM NM 35 3 1 1 0 0New Hampshire 4 5 -27.0% 2 4 NM NM 1 1 0 0Rhode Island NM 3 NM 0 1 NM NM 0 0 0 0Vermont 1 1 1.0% 1 1 0 0 0 0 0 0Middle Atlantic 93 51 82.0% 11 12 74 30 3 NM 4 7New Jersey 4 1 164.0% NM NM 2 1 2 0 0 0New York 59 24 149.0% 11 11 44 5 NM NM 3 6Pennsylvania 31 26 17.0% 0 0 28 24 1 1 NM NMEast North Central 86 67 27.0% 55 47 28 19 1 0 2 1Illinois 10 8 27.0% 2 1 8 7 NM NM 0 0Indiana 10 22 -56.0% 8 21 0 0 0 0 1 1Michigan 32 12 161.0% 31 12 0 0 0 0 0 NMOhio 27 23 20.0% 7 10 20 12 0 0 0 0Wisconsin 7 NM NM 7 NM 0 0 0 0 NM NMWest North Central 43 46 -6.3% 40 45 3 NM 0 0 0 0Iowa 13 11 13.0% 13 11 0 0 0 0 0 0Kansas 7 16 -56.0% 7 16 0 0 0 0 0 0Minnesota NM 5 NM NM 4 3 NM 0 0 0 0Missouri 7 9 -20.0% 7 9 NM NM 0 0 0 0Nebraska NM NM NM NM NM 0 0 0 0 0 0North Dakota 6 2 130.0% 6 2 0 0 0 0 0 0South Dakota NM NM NM NM NM 0 0 NM NM 0 0South Atlantic 183 252 -27.0% 140 221 30 23 8 3 5 6Delaware NM NM NM 0 0 NM NM 0 0 0 0District of Columbia NM 0 -- 0 0 0 0 NM 0 0 0Florida 51 128 -60.0% 49 126 1 NM 0 0 NM 1Georgia 15 19 -18.0% 12 13 NM NM 0 0 NM 2Maryland 10 8 28.0% 0 NM 10 8 0 0 0 0North Carolina 29 30 -3.4% 26 27 NM NM 0 0 1 1South Carolina 12 15 -21.0% 10 14 0 0 0 0 1 1Virginia 43 31 39.0% 21 NM 14 5 8 2 NM NMWest Virginia 21 18 19.0% 21 18 0 0 0 0 0 0East South Central 22 37 -40.0% 21 35 NM 0 0 0 NM NMAlabama NM 4 NM 1 4 NM NM 0 0 NM NMKentucky 9 17 -46.0% 9 17 0 0 0 0 0 0Mississippi 4 NM NM 3 NM 0 0 0 0 0 0Tennessee 7 13 -48.0% 7 13 0 0 0 0 0 0West South Central 33 17 100.0% 22 10 10 6 0 0 0 1Arkansas 6 2 145.0% 2 2 4 0 0 0 0 0Louisiana 7 NM NM 7 NM 0 0 0 0 0 0Oklahoma 4 2 141.0% 4 1 0 0 0 0 0 0Texas 17 12 40.0% 10 6 6 6 0 0 0 0Mountain 29 35 -15.0% 27 32 2 3 0 0 0 0Arizona 10 8 24.0% 10 8 0 0 0 0 0 0Colorado NM NM NM NM NM 0 0 0 0 0 0Idaho 0 0 -100.0% 0 0 0 0 0 0 0 0Montana NM 2 NM NM NM 1 2 0 0 0 0Nevada 1 0 32.0% 0 0 1 0 0 0 0 0New Mexico NM 6 NM NM 6 0 0 0 0 0 0Utah 9 9 -3.4% 8 8 1 1 0 0 0 0Wyoming 5 9 -40.0% 5 9 0 0 0 0 0 0Pacific Contiguous 6 8 -21.0% 5 5 1 2 0 0 1 1California 5 7 -25.0% 5 5 0 2 0 0 NM 0Oregon 0 0 -- 0 0 0 0 0 0 0 0Washington 1 1 3.9% NM NM 0 0 0 0 1 1Pacific Noncontiguous 963 982 -1.9% 801 775 139 187 1 2 22 19Alaska 117 99 17.0% 110 95 0 0 0 NM 7 5Hawaii 847 883 -4.1% 692 680 139 187 0 2 16 15U.S. Total 1,518 1,519 -0.1% 1,128 1,188 337 285 16 10 36 36
Displayed values of zero may represent small values that round to zero. The Excel version of this table provides additional precision which may be accessed by selecting individual cells.Notes: See Glossary for definitions. Values are preliminary. See Technical Notes for a discussion of the sample design for the Form EIA-923.Totals may not equal sum of components because of independent rounding. Percentage change is calculated before rounding.Source: U.S. Energy Information Administration, Form EIA-923, Power Plant Operations Report.
Table 2.9.A. Consumption of Petroleum Liquids for Electricity Generation by State, by Sector,April 2018 and April 2017 (Thousand Barrels)
Electric Power Sector
All Sectors Electric UtilitiesIndependent Power
Producers Commercial Sector Industrial Sector
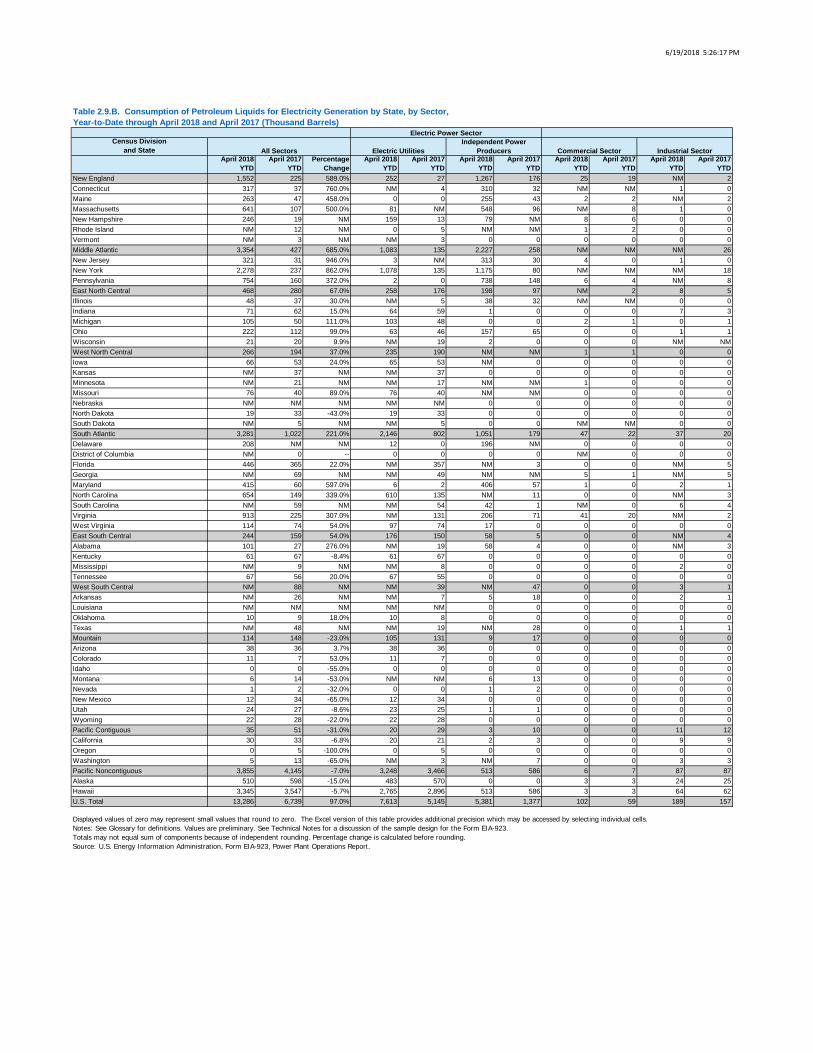
6/19/2018 5:26:17 PM
Census Divisionand State
April 2018 YTD
April 2017 YTD
Percentage Change
April 2018 YTD
April 2017 YTD
April 2018 YTD
April 2017 YTD
April 2018 YTD
April 2017 YTD
April 2018 YTD
April 2017 YTD
New England 1,552 225 589.0% 252 27 1,267 176 25 19 NM 2Connecticut 317 37 760.0% NM 4 310 32 NM NM 1 0Maine 263 47 458.0% 0 0 255 43 2 2 NM 2Massachusetts 641 107 500.0% 81 NM 548 96 NM 8 1 0New Hampshire 246 19 NM 159 13 79 NM 8 6 0 0Rhode Island NM 12 NM 0 5 NM NM 1 2 0 0Vermont NM 3 NM NM 3 0 0 0 0 0 0Middle Atlantic 3,354 427 685.0% 1,083 135 2,227 258 NM NM NM 26New Jersey 321 31 946.0% 3 NM 313 30 4 0 1 0New York 2,278 237 862.0% 1,078 135 1,175 80 NM NM NM 18Pennsylvania 754 160 372.0% 2 0 738 148 6 4 NM 8East North Central 468 280 67.0% 258 176 198 97 NM 2 8 5Illinois 48 37 30.0% NM 5 38 32 NM NM 0 0Indiana 71 62 15.0% 64 59 1 0 0 0 7 3Michigan 105 50 111.0% 103 48 0 0 2 1 0 1Ohio 222 112 99.0% 63 46 157 65 0 0 1 1Wisconsin 21 20 9.9% NM 19 2 0 0 0 NM NMWest North Central 266 194 37.0% 235 190 NM NM 1 1 0 0Iowa 66 53 24.0% 65 53 NM 0 0 0 0 0Kansas NM 37 NM NM 37 0 0 0 0 0 0Minnesota NM 21 NM NM 17 NM NM 1 0 0 0Missouri 76 40 89.0% 76 40 NM NM 0 0 0 0Nebraska NM NM NM NM NM 0 0 0 0 0 0North Dakota 19 33 -43.0% 19 33 0 0 0 0 0 0South Dakota NM 5 NM NM 5 0 0 NM NM 0 0South Atlantic 3,281 1,022 221.0% 2,146 802 1,051 179 47 22 37 20Delaware 208 NM NM 12 0 196 NM 0 0 0 0District of Columbia NM 0 -- 0 0 0 0 NM 0 0 0Florida 446 365 22.0% NM 357 NM 3 0 0 NM 5Georgia NM 69 NM NM 49 NM NM 5 1 NM 5Maryland 415 60 597.0% 6 2 406 57 1 0 2 1North Carolina 654 149 339.0% 610 135 NM 11 0 0 NM 3South Carolina NM 59 NM NM 54 42 1 NM 0 6 4Virginia 913 225 307.0% NM 131 206 71 41 20 NM 2West Virginia 114 74 54.0% 97 74 17 0 0 0 0 0East South Central 244 159 54.0% 176 150 58 5 0 0 NM 4Alabama 101 27 276.0% NM 19 58 4 0 0 NM 3Kentucky 61 67 -8.4% 61 67 0 0 0 0 0 0Mississippi NM 9 NM NM 8 0 0 0 0 2 0Tennessee 67 56 20.0% 67 55 0 0 0 0 0 0West South Central NM 88 NM NM 39 NM 47 0 0 3 1Arkansas NM 26 NM NM 7 5 18 0 0 2 1Louisiana NM NM NM NM NM 0 0 0 0 0 0Oklahoma 10 9 18.0% 10 8 0 0 0 0 0 0Texas NM 48 NM NM 19 NM 28 0 0 1 1Mountain 114 148 -23.0% 105 131 9 17 0 0 0 0Arizona 38 36 3.7% 38 36 0 0 0 0 0 0Colorado 11 7 53.0% 11 7 0 0 0 0 0 0Idaho 0 0 -55.0% 0 0 0 0 0 0 0 0Montana 6 14 -53.0% NM NM 6 13 0 0 0 0Nevada 1 2 -32.0% 0 0 1 2 0 0 0 0New Mexico 12 34 -65.0% 12 34 0 0 0 0 0 0Utah 24 27 -8.6% 23 25 1 1 0 0 0 0Wyoming 22 28 -22.0% 22 28 0 0 0 0 0 0Pacific Contiguous 35 51 -31.0% 20 29 3 10 0 0 11 12California 30 33 -6.8% 20 21 2 3 0 0 9 9Oregon 0 5 -100.0% 0 5 0 0 0 0 0 0Washington 5 13 -65.0% NM 3 NM 7 0 0 3 3Pacific Noncontiguous 3,855 4,145 -7.0% 3,248 3,466 513 586 6 7 87 87Alaska 510 598 -15.0% 483 570 0 0 3 3 24 25Hawaii 3,345 3,547 -5.7% 2,765 2,896 513 586 3 3 64 62U.S. Total 13,286 6,739 97.0% 7,613 5,145 5,381 1,377 102 59 189 157
Displayed values of zero may represent small values that round to zero. The Excel version of this table provides additional precision which may be accessed by selecting individual cells.Notes: See Glossary for definitions. Values are preliminary. See Technical Notes for a discussion of the sample design for the Form EIA-923.Totals may not equal sum of components because of independent rounding. Percentage change is calculated before rounding.Source: U.S. Energy Information Administration, Form EIA-923, Power Plant Operations Report.
Table 2.9.B. Consumption of Petroleum Liquids for Electricity Generation by State, by Sector,Year-to-Date through April 2018 and April 2017 (Thousand Barrels)
Electric Power Sector
All Sectors Electric UtilitiesIndependent Power
Producers Commercial Sector Industrial Sector
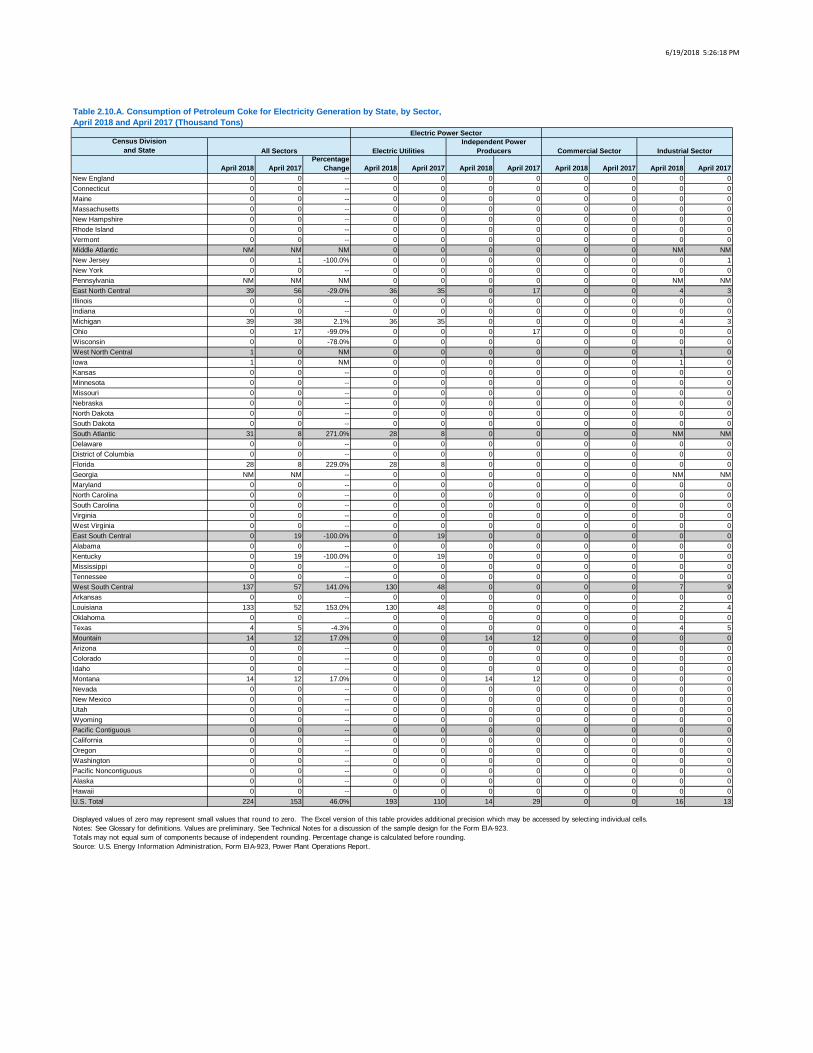
6/19/2018 5:26:18 PM
Census Divisionand State
April 2018 April 2017Percentage
Change April 2018 April 2017 April 2018 April 2017 April 2018 April 2017 April 2018 April 2017New England 0 0 -- 0 0 0 0 0 0 0 0Connecticut 0 0 -- 0 0 0 0 0 0 0 0Maine 0 0 -- 0 0 0 0 0 0 0 0Massachusetts 0 0 -- 0 0 0 0 0 0 0 0New Hampshire 0 0 -- 0 0 0 0 0 0 0 0Rhode Island 0 0 -- 0 0 0 0 0 0 0 0Vermont 0 0 -- 0 0 0 0 0 0 0 0Middle Atlantic NM NM NM 0 0 0 0 0 0 NM NMNew Jersey 0 1 -100.0% 0 0 0 0 0 0 0 1New York 0 0 -- 0 0 0 0 0 0 0 0Pennsylvania NM NM NM 0 0 0 0 0 0 NM NMEast North Central 39 56 -29.0% 36 35 0 17 0 0 4 3Illinois 0 0 -- 0 0 0 0 0 0 0 0Indiana 0 0 -- 0 0 0 0 0 0 0 0Michigan 39 38 2.1% 36 35 0 0 0 0 4 3Ohio 0 17 -99.0% 0 0 0 17 0 0 0 0Wisconsin 0 0 -78.0% 0 0 0 0 0 0 0 0West North Central 1 0 NM 0 0 0 0 0 0 1 0Iowa 1 0 NM 0 0 0 0 0 0 1 0Kansas 0 0 -- 0 0 0 0 0 0 0 0Minnesota 0 0 -- 0 0 0 0 0 0 0 0Missouri 0 0 -- 0 0 0 0 0 0 0 0Nebraska 0 0 -- 0 0 0 0 0 0 0 0North Dakota 0 0 -- 0 0 0 0 0 0 0 0South Dakota 0 0 -- 0 0 0 0 0 0 0 0South Atlantic 31 8 271.0% 28 8 0 0 0 0 NM NMDelaware 0 0 -- 0 0 0 0 0 0 0 0District of Columbia 0 0 -- 0 0 0 0 0 0 0 0Florida 28 8 229.0% 28 8 0 0 0 0 0 0Georgia NM NM -- 0 0 0 0 0 0 NM NMMaryland 0 0 -- 0 0 0 0 0 0 0 0North Carolina 0 0 -- 0 0 0 0 0 0 0 0South Carolina 0 0 -- 0 0 0 0 0 0 0 0Virginia 0 0 -- 0 0 0 0 0 0 0 0West Virginia 0 0 -- 0 0 0 0 0 0 0 0East South Central 0 19 -100.0% 0 19 0 0 0 0 0 0Alabama 0 0 -- 0 0 0 0 0 0 0 0Kentucky 0 19 -100.0% 0 19 0 0 0 0 0 0Mississippi 0 0 -- 0 0 0 0 0 0 0 0Tennessee 0 0 -- 0 0 0 0 0 0 0 0West South Central 137 57 141.0% 130 48 0 0 0 0 7 9Arkansas 0 0 -- 0 0 0 0 0 0 0 0Louisiana 133 52 153.0% 130 48 0 0 0 0 2 4Oklahoma 0 0 -- 0 0 0 0 0 0 0 0Texas 4 5 -4.3% 0 0 0 0 0 0 4 5Mountain 14 12 17.0% 0 0 14 12 0 0 0 0Arizona 0 0 -- 0 0 0 0 0 0 0 0Colorado 0 0 -- 0 0 0 0 0 0 0 0Idaho 0 0 -- 0 0 0 0 0 0 0 0Montana 14 12 17.0% 0 0 14 12 0 0 0 0Nevada 0 0 -- 0 0 0 0 0 0 0 0New Mexico 0 0 -- 0 0 0 0 0 0 0 0Utah 0 0 -- 0 0 0 0 0 0 0 0Wyoming 0 0 -- 0 0 0 0 0 0 0 0Pacific Contiguous 0 0 -- 0 0 0 0 0 0 0 0California 0 0 -- 0 0 0 0 0 0 0 0Oregon 0 0 -- 0 0 0 0 0 0 0 0Washington 0 0 -- 0 0 0 0 0 0 0 0Pacific Noncontiguous 0 0 -- 0 0 0 0 0 0 0 0Alaska 0 0 -- 0 0 0 0 0 0 0 0Hawaii 0 0 -- 0 0 0 0 0 0 0 0U.S. Total 224 153 46.0% 193 110 14 29 0 0 16 13
Displayed values of zero may represent small values that round to zero. The Excel version of this table provides additional precision which may be accessed by selecting individual cells.Notes: See Glossary for definitions. Values are preliminary. See Technical Notes for a discussion of the sample design for the Form EIA-923.Totals may not equal sum of components because of independent rounding. Percentage change is calculated before rounding.Source: U.S. Energy Information Administration, Form EIA-923, Power Plant Operations Report.
Table 2.10.A. Consumption of Petroleum Coke for Electricity Generation by State, by Sector,April 2018 and April 2017 (Thousand Tons)
Electric Power Sector
All Sectors Electric UtilitiesIndependent Power
Producers Commercial Sector Industrial Sector
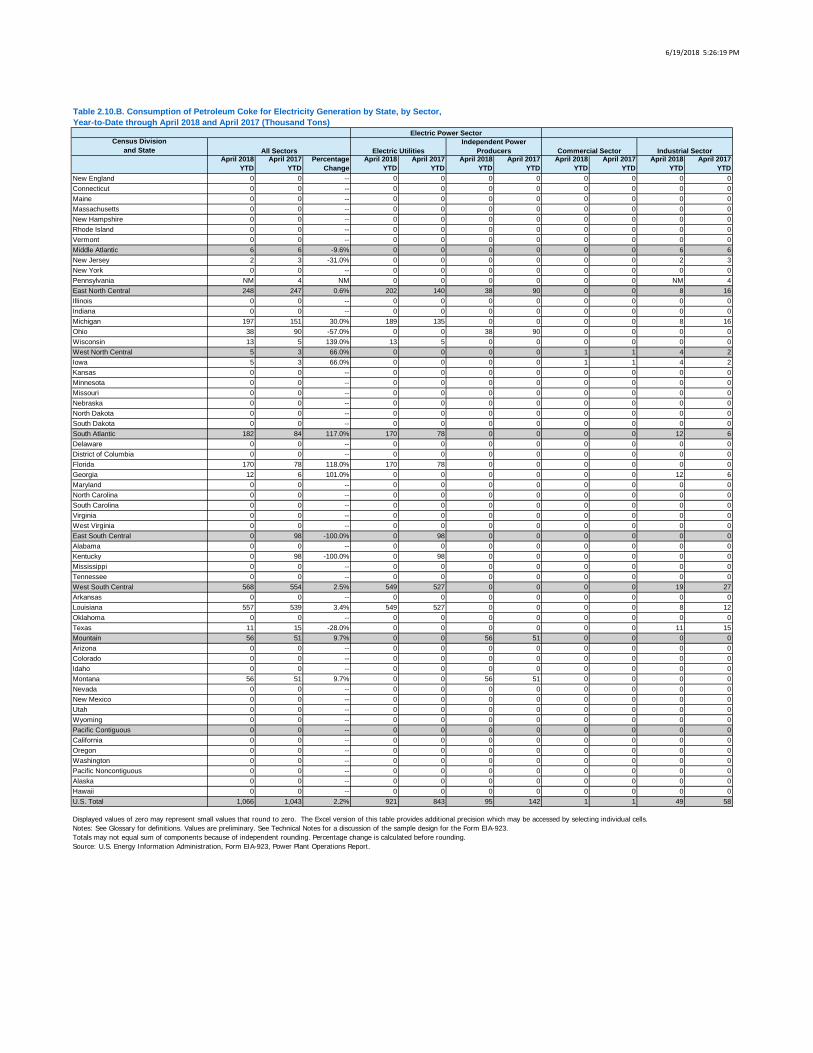
6/19/2018 5:26:19 PM
Census Divisionand State
April 2018 YTD
April 2017 YTD
Percentage Change
April 2018 YTD
April 2017 YTD
April 2018 YTD
April 2017 YTD
April 2018 YTD
April 2017 YTD
April 2018 YTD
April 2017 YTD
New England 0 0 -- 0 0 0 0 0 0 0 0Connecticut 0 0 -- 0 0 0 0 0 0 0 0Maine 0 0 -- 0 0 0 0 0 0 0 0Massachusetts 0 0 -- 0 0 0 0 0 0 0 0New Hampshire 0 0 -- 0 0 0 0 0 0 0 0Rhode Island 0 0 -- 0 0 0 0 0 0 0 0Vermont 0 0 -- 0 0 0 0 0 0 0 0Middle Atlantic 6 6 -9.6% 0 0 0 0 0 0 6 6New Jersey 2 3 -31.0% 0 0 0 0 0 0 2 3New York 0 0 -- 0 0 0 0 0 0 0 0Pennsylvania NM 4 NM 0 0 0 0 0 0 NM 4East North Central 248 247 0.6% 202 140 38 90 0 0 8 16Illinois 0 0 -- 0 0 0 0 0 0 0 0Indiana 0 0 -- 0 0 0 0 0 0 0 0Michigan 197 151 30.0% 189 135 0 0 0 0 8 16Ohio 38 90 -57.0% 0 0 38 90 0 0 0 0Wisconsin 13 5 139.0% 13 5 0 0 0 0 0 0West North Central 5 3 66.0% 0 0 0 0 1 1 4 2Iowa 5 3 66.0% 0 0 0 0 1 1 4 2Kansas 0 0 -- 0 0 0 0 0 0 0 0Minnesota 0 0 -- 0 0 0 0 0 0 0 0Missouri 0 0 -- 0 0 0 0 0 0 0 0Nebraska 0 0 -- 0 0 0 0 0 0 0 0North Dakota 0 0 -- 0 0 0 0 0 0 0 0South Dakota 0 0 -- 0 0 0 0 0 0 0 0South Atlantic 182 84 117.0% 170 78 0 0 0 0 12 6Delaware 0 0 -- 0 0 0 0 0 0 0 0District of Columbia 0 0 -- 0 0 0 0 0 0 0 0Florida 170 78 118.0% 170 78 0 0 0 0 0 0Georgia 12 6 101.0% 0 0 0 0 0 0 12 6Maryland 0 0 -- 0 0 0 0 0 0 0 0North Carolina 0 0 -- 0 0 0 0 0 0 0 0South Carolina 0 0 -- 0 0 0 0 0 0 0 0Virginia 0 0 -- 0 0 0 0 0 0 0 0West Virginia 0 0 -- 0 0 0 0 0 0 0 0East South Central 0 98 -100.0% 0 98 0 0 0 0 0 0Alabama 0 0 -- 0 0 0 0 0 0 0 0Kentucky 0 98 -100.0% 0 98 0 0 0 0 0 0Mississippi 0 0 -- 0 0 0 0 0 0 0 0Tennessee 0 0 -- 0 0 0 0 0 0 0 0West South Central 568 554 2.5% 549 527 0 0 0 0 19 27Arkansas 0 0 -- 0 0 0 0 0 0 0 0Louisiana 557 539 3.4% 549 527 0 0 0 0 8 12Oklahoma 0 0 -- 0 0 0 0 0 0 0 0Texas 11 15 -28.0% 0 0 0 0 0 0 11 15Mountain 56 51 9.7% 0 0 56 51 0 0 0 0Arizona 0 0 -- 0 0 0 0 0 0 0 0Colorado 0 0 -- 0 0 0 0 0 0 0 0Idaho 0 0 -- 0 0 0 0 0 0 0 0Montana 56 51 9.7% 0 0 56 51 0 0 0 0Nevada 0 0 -- 0 0 0 0 0 0 0 0New Mexico 0 0 -- 0 0 0 0 0 0 0 0Utah 0 0 -- 0 0 0 0 0 0 0 0Wyoming 0 0 -- 0 0 0 0 0 0 0 0Pacific Contiguous 0 0 -- 0 0 0 0 0 0 0 0California 0 0 -- 0 0 0 0 0 0 0 0Oregon 0 0 -- 0 0 0 0 0 0 0 0Washington 0 0 -- 0 0 0 0 0 0 0 0Pacific Noncontiguous 0 0 -- 0 0 0 0 0 0 0 0Alaska 0 0 -- 0 0 0 0 0 0 0 0Hawaii 0 0 -- 0 0 0 0 0 0 0 0U.S. Total 1,066 1,043 2.2% 921 843 95 142 1 1 49 58
Displayed values of zero may represent small values that round to zero. The Excel version of this table provides additional precision which may be accessed by selecting individual cells.Notes: See Glossary for definitions. Values are preliminary. See Technical Notes for a discussion of the sample design for the Form EIA-923.Totals may not equal sum of components because of independent rounding. Percentage change is calculated before rounding.Source: U.S. Energy Information Administration, Form EIA-923, Power Plant Operations Report.
Table 2.10.B. Consumption of Petroleum Coke for Electricity Generation by State, by Sector,Year-to-Date through April 2018 and April 2017 (Thousand Tons)
Electric Power Sector
All Sectors Electric UtilitiesIndependent Power
Producers Commercial Sector Industrial Sector
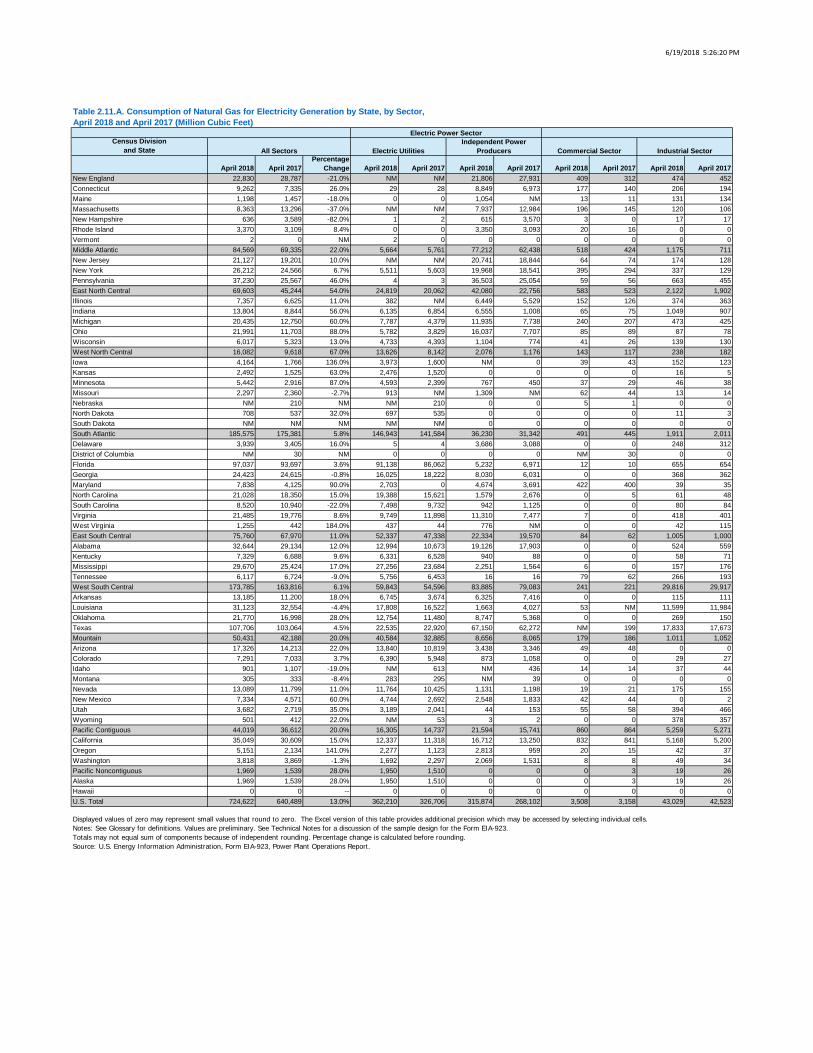
6/19/2018 5:26:20 PM
Census Divisionand State
April 2018 April 2017Percentage
Change April 2018 April 2017 April 2018 April 2017 April 2018 April 2017 April 2018 April 2017New England 22,830 28,787 -21.0% NM NM 21,806 27,931 409 312 474 452Connecticut 9,262 7,335 26.0% 29 28 8,849 6,973 177 140 206 194Maine 1,198 1,457 -18.0% 0 0 1,054 NM 13 11 131 134Massachusetts 8,363 13,296 -37.0% NM NM 7,937 12,984 196 145 120 106New Hampshire 636 3,589 -82.0% 1 2 615 3,570 3 0 17 17Rhode Island 3,370 3,109 8.4% 0 0 3,350 3,093 20 16 0 0Vermont 2 0 NM 2 0 0 0 0 0 0 0Middle Atlantic 84,569 69,335 22.0% 5,664 5,761 77,212 62,438 518 424 1,175 711New Jersey 21,127 19,201 10.0% NM NM 20,741 18,844 64 74 174 128New York 26,212 24,566 6.7% 5,511 5,603 19,968 18,541 395 294 337 129Pennsylvania 37,230 25,567 46.0% 4 3 36,503 25,054 59 56 663 455East North Central 69,603 45,244 54.0% 24,819 20,062 42,080 22,756 583 523 2,122 1,902Illinois 7,357 6,625 11.0% 382 NM 6,449 5,529 152 126 374 363Indiana 13,804 8,844 56.0% 6,135 6,854 6,555 1,008 65 75 1,049 907Michigan 20,435 12,750 60.0% 7,787 4,379 11,935 7,738 240 207 473 425Ohio 21,991 11,703 88.0% 5,782 3,829 16,037 7,707 85 89 87 78Wisconsin 6,017 5,323 13.0% 4,733 4,393 1,104 774 41 26 139 130West North Central 16,082 9,618 67.0% 13,626 8,142 2,076 1,176 143 117 238 182Iowa 4,164 1,766 136.0% 3,973 1,600 NM 0 39 43 152 123Kansas 2,492 1,525 63.0% 2,476 1,520 0 0 0 0 16 5Minnesota 5,442 2,916 87.0% 4,593 2,399 767 450 37 29 46 38Missouri 2,297 2,360 -2.7% 913 NM 1,309 NM 62 44 13 14Nebraska NM 210 NM NM 210 0 0 5 1 0 0North Dakota 708 537 32.0% 697 535 0 0 0 0 11 3South Dakota NM NM NM NM NM 0 0 0 0 0 0South Atlantic 185,575 175,381 5.8% 146,943 141,584 36,230 31,342 491 445 1,911 2,011Delaware 3,939 3,405 16.0% 5 4 3,686 3,088 0 0 248 312District of Columbia NM 30 NM 0 0 0 0 NM 30 0 0Florida 97,037 93,697 3.6% 91,138 86,062 5,232 6,971 12 10 655 654Georgia 24,423 24,615 -0.8% 16,025 18,222 8,030 6,031 0 0 368 362Maryland 7,838 4,125 90.0% 2,703 0 4,674 3,691 422 400 39 35North Carolina 21,028 18,350 15.0% 19,388 15,621 1,579 2,676 0 5 61 48South Carolina 8,520 10,940 -22.0% 7,498 9,732 942 1,125 0 0 80 84Virginia 21,485 19,776 8.6% 9,749 11,898 11,310 7,477 7 0 418 401West Virginia 1,255 442 184.0% 437 44 776 NM 0 0 42 115East South Central 75,760 67,970 11.0% 52,337 47,338 22,334 19,570 84 62 1,005 1,000Alabama 32,644 29,134 12.0% 12,994 10,673 19,126 17,903 0 0 524 559Kentucky 7,329 6,688 9.6% 6,331 6,528 940 88 0 0 58 71Mississippi 29,670 25,424 17.0% 27,256 23,684 2,251 1,564 6 0 157 176Tennessee 6,117 6,724 -9.0% 5,756 6,453 16 16 79 62 266 193West South Central 173,785 163,816 6.1% 59,843 54,596 83,885 79,083 241 221 29,816 29,917Arkansas 13,185 11,200 18.0% 6,745 3,674 6,325 7,416 0 0 115 111Louisiana 31,123 32,554 -4.4% 17,808 16,522 1,663 4,027 53 NM 11,599 11,984Oklahoma 21,770 16,998 28.0% 12,754 11,480 8,747 5,368 0 0 269 150Texas 107,706 103,064 4.5% 22,535 22,920 67,150 62,272 NM 199 17,833 17,673Mountain 50,431 42,188 20.0% 40,584 32,885 8,656 8,065 179 186 1,011 1,052Arizona 17,326 14,213 22.0% 13,840 10,819 3,438 3,346 49 48 0 0Colorado 7,291 7,033 3.7% 6,390 5,948 873 1,058 0 0 29 27Idaho 901 1,107 -19.0% NM 613 NM 436 14 14 37 44Montana 305 333 -8.4% 283 295 NM 39 0 0 0 0Nevada 13,089 11,799 11.0% 11,764 10,425 1,131 1,198 19 21 175 155New Mexico 7,334 4,571 60.0% 4,744 2,692 2,548 1,833 42 44 0 2Utah 3,682 2,719 35.0% 3,189 2,041 44 153 55 58 394 466Wyoming 501 412 22.0% NM 53 3 2 0 0 378 357Pacific Contiguous 44,019 36,612 20.0% 16,305 14,737 21,594 15,741 860 864 5,259 5,271California 35,049 30,609 15.0% 12,337 11,318 16,712 13,250 832 841 5,168 5,200Oregon 5,151 2,134 141.0% 2,277 1,123 2,813 959 20 15 42 37Washington 3,818 3,869 -1.3% 1,692 2,297 2,069 1,531 8 8 49 34Pacific Noncontiguous 1,969 1,539 28.0% 1,950 1,510 0 0 0 3 19 26Alaska 1,969 1,539 28.0% 1,950 1,510 0 0 0 3 19 26Hawaii 0 0 -- 0 0 0 0 0 0 0 0U.S. Total 724,622 640,489 13.0% 362,210 326,706 315,874 268,102 3,508 3,158 43,029 42,523
Displayed values of zero may represent small values that round to zero. The Excel version of this table provides additional precision which may be accessed by selecting individual cells.Notes: See Glossary for definitions. Values are preliminary. See Technical Notes for a discussion of the sample design for the Form EIA-923.Totals may not equal sum of components because of independent rounding. Percentage change is calculated before rounding.Source: U.S. Energy Information Administration, Form EIA-923, Power Plant Operations Report.
Table 2.11.A. Consumption of Natural Gas for Electricity Generation by State, by Sector,April 2018 and April 2017 (Million Cubic Feet)
Electric Power Sector
All Sectors Electric UtilitiesIndependent Power
Producers Commercial Sector Industrial Sector
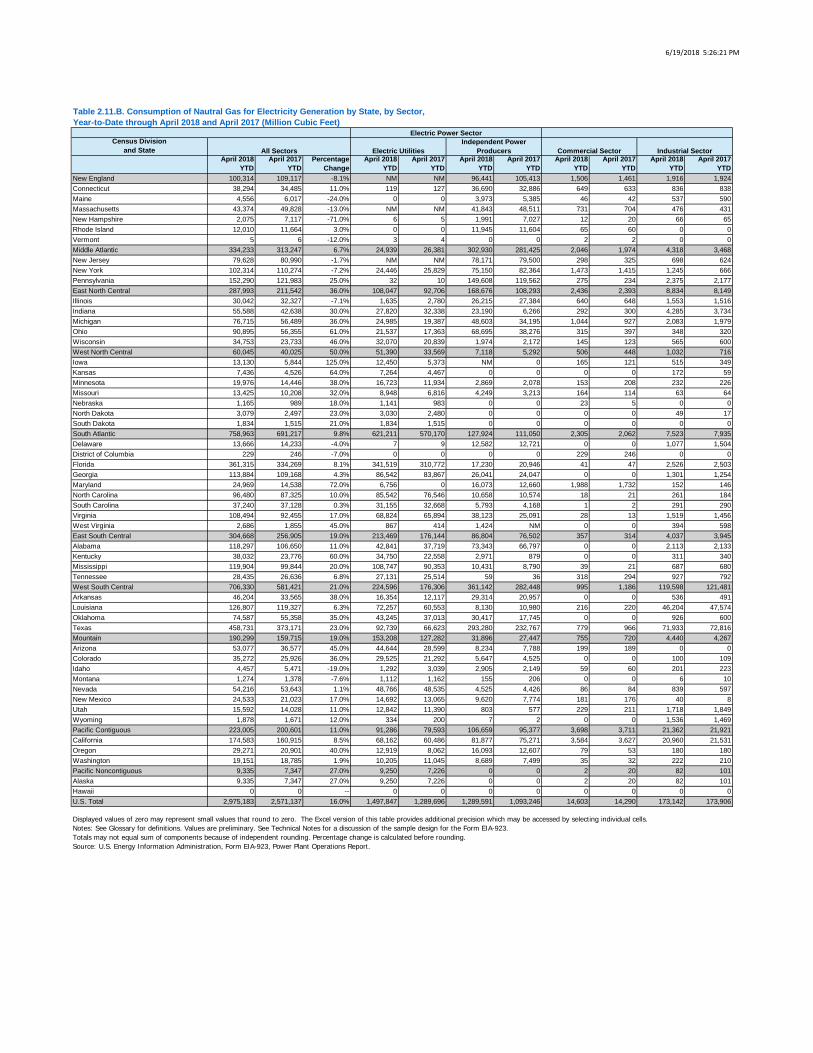
6/19/2018 5:26:21 PM
Census Divisionand State
April 2018 YTD
April 2017 YTD
Percentage Change
April 2018 YTD
April 2017 YTD
April 2018 YTD
April 2017 YTD
April 2018 YTD
April 2017 YTD
April 2018 YTD
April 2017 YTD
New England 100,314 109,117 -8.1% NM NM 96,441 105,413 1,506 1,461 1,916 1,924Connecticut 38,294 34,485 11.0% 119 127 36,690 32,886 649 633 836 838Maine 4,556 6,017 -24.0% 0 0 3,973 5,385 46 42 537 590Massachusetts 43,374 49,828 -13.0% NM NM 41,843 48,511 731 704 476 431New Hampshire 2,075 7,117 -71.0% 6 5 1,991 7,027 12 20 66 65Rhode Island 12,010 11,664 3.0% 0 0 11,945 11,604 65 60 0 0Vermont 5 6 -12.0% 3 4 0 0 2 2 0 0Middle Atlantic 334,233 313,247 6.7% 24,939 26,381 302,930 281,425 2,046 1,974 4,318 3,468New Jersey 79,628 80,990 -1.7% NM NM 78,171 79,500 298 325 698 624New York 102,314 110,274 -7.2% 24,446 25,829 75,150 82,364 1,473 1,415 1,245 666Pennsylvania 152,290 121,983 25.0% 32 10 149,608 119,562 275 234 2,375 2,177East North Central 287,993 211,542 36.0% 108,047 92,706 168,676 108,293 2,436 2,393 8,834 8,149Illinois 30,042 32,327 -7.1% 1,635 2,780 26,215 27,384 640 648 1,553 1,516Indiana 55,588 42,638 30.0% 27,820 32,338 23,190 6,266 292 300 4,285 3,734Michigan 76,715 56,489 36.0% 24,985 19,387 48,603 34,195 1,044 927 2,083 1,979Ohio 90,895 56,355 61.0% 21,537 17,363 68,695 38,276 315 397 348 320Wisconsin 34,753 23,733 46.0% 32,070 20,839 1,974 2,172 145 123 565 600West North Central 60,045 40,025 50.0% 51,390 33,569 7,118 5,292 506 448 1,032 716Iowa 13,130 5,844 125.0% 12,450 5,373 NM 0 165 121 515 349Kansas 7,436 4,526 64.0% 7,264 4,467 0 0 0 0 172 59Minnesota 19,976 14,446 38.0% 16,723 11,934 2,869 2,078 153 208 232 226Missouri 13,425 10,208 32.0% 8,948 6,816 4,249 3,213 164 114 63 64Nebraska 1,165 989 18.0% 1,141 983 0 0 23 5 0 0North Dakota 3,079 2,497 23.0% 3,030 2,480 0 0 0 0 49 17South Dakota 1,834 1,515 21.0% 1,834 1,515 0 0 0 0 0 0South Atlantic 758,963 691,217 9.8% 621,211 570,170 127,924 111,050 2,305 2,062 7,523 7,935Delaware 13,666 14,233 -4.0% 7 9 12,582 12,721 0 0 1,077 1,504District of Columbia 229 246 -7.0% 0 0 0 0 229 246 0 0Florida 361,315 334,269 8.1% 341,519 310,772 17,230 20,946 41 47 2,526 2,503Georgia 113,884 109,168 4.3% 86,542 83,867 26,041 24,047 0 0 1,301 1,254Maryland 24,969 14,538 72.0% 6,756 0 16,073 12,660 1,988 1,732 152 146North Carolina 96,480 87,325 10.0% 85,542 76,546 10,658 10,574 18 21 261 184South Carolina 37,240 37,128 0.3% 31,155 32,668 5,793 4,168 1 2 291 290Virginia 108,494 92,455 17.0% 68,824 65,894 38,123 25,091 28 13 1,519 1,456West Virginia 2,686 1,855 45.0% 867 414 1,424 NM 0 0 394 598East South Central 304,668 256,905 19.0% 213,469 176,144 86,804 76,502 357 314 4,037 3,945Alabama 118,297 106,650 11.0% 42,841 37,719 73,343 66,797 0 0 2,113 2,133Kentucky 38,032 23,776 60.0% 34,750 22,558 2,971 879 0 0 311 340Mississippi 119,904 99,844 20.0% 108,747 90,353 10,431 8,790 39 21 687 680Tennessee 28,435 26,636 6.8% 27,131 25,514 59 36 318 294 927 792West South Central 706,330 581,421 21.0% 224,596 176,306 361,142 282,448 995 1,186 119,598 121,481Arkansas 46,204 33,565 38.0% 16,354 12,117 29,314 20,957 0 0 536 491Louisiana 126,807 119,327 6.3% 72,257 60,553 8,130 10,980 216 220 46,204 47,574Oklahoma 74,587 55,358 35.0% 43,245 37,013 30,417 17,745 0 0 926 600Texas 458,731 373,171 23.0% 92,739 66,623 293,280 232,767 779 966 71,933 72,816Mountain 190,299 159,715 19.0% 153,208 127,282 31,896 27,447 755 720 4,440 4,267Arizona 53,077 36,577 45.0% 44,644 28,599 8,234 7,788 199 189 0 0Colorado 35,272 25,926 36.0% 29,525 21,292 5,647 4,525 0 0 100 109Idaho 4,457 5,471 -19.0% 1,292 3,039 2,905 2,149 59 60 201 223Montana 1,274 1,378 -7.6% 1,112 1,162 155 206 0 0 6 10Nevada 54,216 53,643 1.1% 48,766 48,535 4,525 4,426 86 84 839 597New Mexico 24,533 21,023 17.0% 14,692 13,065 9,620 7,774 181 176 40 8Utah 15,592 14,028 11.0% 12,842 11,390 803 577 229 211 1,718 1,849Wyoming 1,878 1,671 12.0% 334 200 7 2 0 0 1,536 1,469Pacific Contiguous 223,005 200,601 11.0% 91,286 79,593 106,659 95,377 3,698 3,711 21,362 21,921California 174,583 160,915 8.5% 68,162 60,486 81,877 75,271 3,584 3,627 20,960 21,531Oregon 29,271 20,901 40.0% 12,919 8,062 16,093 12,607 79 53 180 180Washington 19,151 18,785 1.9% 10,205 11,045 8,689 7,499 35 32 222 210Pacific Noncontiguous 9,335 7,347 27.0% 9,250 7,226 0 0 2 20 82 101Alaska 9,335 7,347 27.0% 9,250 7,226 0 0 2 20 82 101Hawaii 0 0 -- 0 0 0 0 0 0 0 0U.S. Total 2,975,183 2,571,137 16.0% 1,497,847 1,289,696 1,289,591 1,093,246 14,603 14,290 173,142 173,906
Displayed values of zero may represent small values that round to zero. The Excel version of this table provides additional precision which may be accessed by selecting individual cells.Notes: See Glossary for definitions. Values are preliminary. See Technical Notes for a discussion of the sample design for the Form EIA-923.Totals may not equal sum of components because of independent rounding. Percentage change is calculated before rounding.Source: U.S. Energy Information Administration, Form EIA-923, Power Plant Operations Report.
Table 2.11.B. Consumption of Nautral Gas for Electricity Generation by State, by Sector,Year-to-Date through April 2018 and April 2017 (Million Cubic Feet)
Electric Power Sector
All Sectors Electric UtilitiesIndependent Power
Producers Commercial Sector Industrial Sector
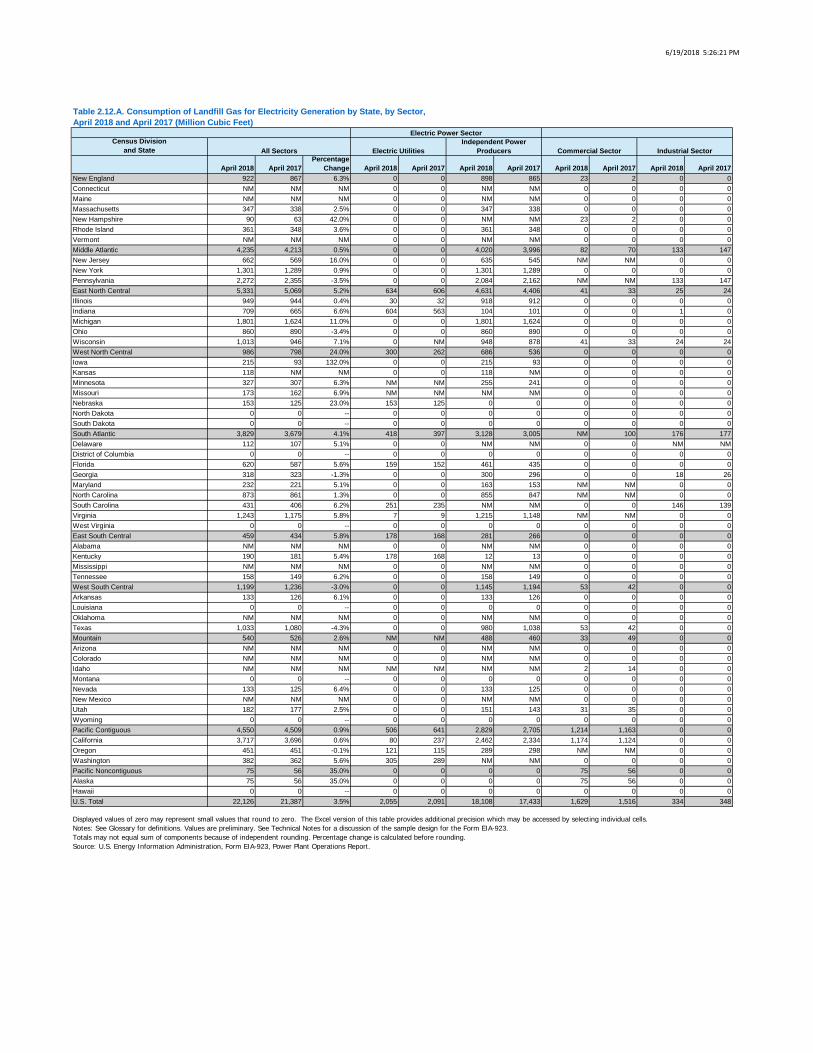
6/19/2018 5:26:21 PM
Census Divisionand State
April 2018 April 2017Percentage
Change April 2018 April 2017 April 2018 April 2017 April 2018 April 2017 April 2018 April 2017New England 922 867 6.3% 0 0 898 865 23 2 0 0Connecticut NM NM NM 0 0 NM NM 0 0 0 0Maine NM NM NM 0 0 NM NM 0 0 0 0Massachusetts 347 338 2.5% 0 0 347 338 0 0 0 0New Hampshire 90 63 42.0% 0 0 NM NM 23 2 0 0Rhode Island 361 348 3.6% 0 0 361 348 0 0 0 0Vermont NM NM NM 0 0 NM NM 0 0 0 0Middle Atlantic 4,235 4,213 0.5% 0 0 4,020 3,996 82 70 133 147New Jersey 662 569 16.0% 0 0 635 545 NM NM 0 0New York 1,301 1,289 0.9% 0 0 1,301 1,289 0 0 0 0Pennsylvania 2,272 2,355 -3.5% 0 0 2,084 2,162 NM NM 133 147East North Central 5,331 5,069 5.2% 634 606 4,631 4,406 41 33 25 24Illinois 949 944 0.4% 30 32 918 912 0 0 0 0Indiana 709 665 6.6% 604 563 104 101 0 0 1 0Michigan 1,801 1,624 11.0% 0 0 1,801 1,624 0 0 0 0Ohio 860 890 -3.4% 0 0 860 890 0 0 0 0Wisconsin 1,013 946 7.1% 0 NM 948 878 41 33 24 24West North Central 986 798 24.0% 300 262 686 536 0 0 0 0Iowa 215 93 132.0% 0 0 215 93 0 0 0 0Kansas 118 NM NM 0 0 118 NM 0 0 0 0Minnesota 327 307 6.3% NM NM 255 241 0 0 0 0Missouri 173 162 6.9% NM NM NM NM 0 0 0 0Nebraska 153 125 23.0% 153 125 0 0 0 0 0 0North Dakota 0 0 -- 0 0 0 0 0 0 0 0South Dakota 0 0 -- 0 0 0 0 0 0 0 0South Atlantic 3,829 3,679 4.1% 418 397 3,128 3,005 NM 100 176 177Delaware 112 107 5.1% 0 0 NM NM 0 0 NM NMDistrict of Columbia 0 0 -- 0 0 0 0 0 0 0 0Florida 620 587 5.6% 159 152 461 435 0 0 0 0Georgia 318 323 -1.3% 0 0 300 296 0 0 18 26Maryland 232 221 5.1% 0 0 163 153 NM NM 0 0North Carolina 873 861 1.3% 0 0 855 847 NM NM 0 0South Carolina 431 406 6.2% 251 235 NM NM 0 0 146 139Virginia 1,243 1,175 5.8% 7 9 1,215 1,148 NM NM 0 0West Virginia 0 0 -- 0 0 0 0 0 0 0 0East South Central 459 434 5.8% 178 168 281 266 0 0 0 0Alabama NM NM NM 0 0 NM NM 0 0 0 0Kentucky 190 181 5.4% 178 168 12 13 0 0 0 0Mississippi NM NM NM 0 0 NM NM 0 0 0 0Tennessee 158 149 6.2% 0 0 158 149 0 0 0 0West South Central 1,199 1,236 -3.0% 0 0 1,145 1,194 53 42 0 0Arkansas 133 126 6.1% 0 0 133 126 0 0 0 0Louisiana 0 0 -- 0 0 0 0 0 0 0 0Oklahoma NM NM NM 0 0 NM NM 0 0 0 0Texas 1,033 1,080 -4.3% 0 0 980 1,038 53 42 0 0Mountain 540 526 2.6% NM NM 488 460 33 49 0 0Arizona NM NM NM 0 0 NM NM 0 0 0 0Colorado NM NM NM 0 0 NM NM 0 0 0 0Idaho NM NM NM NM NM NM NM 2 14 0 0Montana 0 0 -- 0 0 0 0 0 0 0 0Nevada 133 125 6.4% 0 0 133 125 0 0 0 0New Mexico NM NM NM 0 0 NM NM 0 0 0 0Utah 182 177 2.5% 0 0 151 143 31 35 0 0Wyoming 0 0 -- 0 0 0 0 0 0 0 0Pacific Contiguous 4,550 4,509 0.9% 506 641 2,829 2,705 1,214 1,163 0 0California 3,717 3,696 0.6% 80 237 2,462 2,334 1,174 1,124 0 0Oregon 451 451 -0.1% 121 115 289 298 NM NM 0 0Washington 382 362 5.6% 305 289 NM NM 0 0 0 0Pacific Noncontiguous 75 56 35.0% 0 0 0 0 75 56 0 0Alaska 75 56 35.0% 0 0 0 0 75 56 0 0Hawaii 0 0 -- 0 0 0 0 0 0 0 0U.S. Total 22,126 21,387 3.5% 2,055 2,091 18,108 17,433 1,629 1,516 334 348
Displayed values of zero may represent small values that round to zero. The Excel version of this table provides additional precision which may be accessed by selecting individual cells.Notes: See Glossary for definitions. Values are preliminary. See Technical Notes for a discussion of the sample design for the Form EIA-923.Totals may not equal sum of components because of independent rounding. Percentage change is calculated before rounding.Source: U.S. Energy Information Administration, Form EIA-923, Power Plant Operations Report.
Table 2.12.A. Consumption of Landfill Gas for Electricity Generation by State, by Sector,April 2018 and April 2017 (Million Cubic Feet)
Electric Power Sector
All Sectors Electric UtilitiesIndependent Power
Producers Commercial Sector Industrial Sector
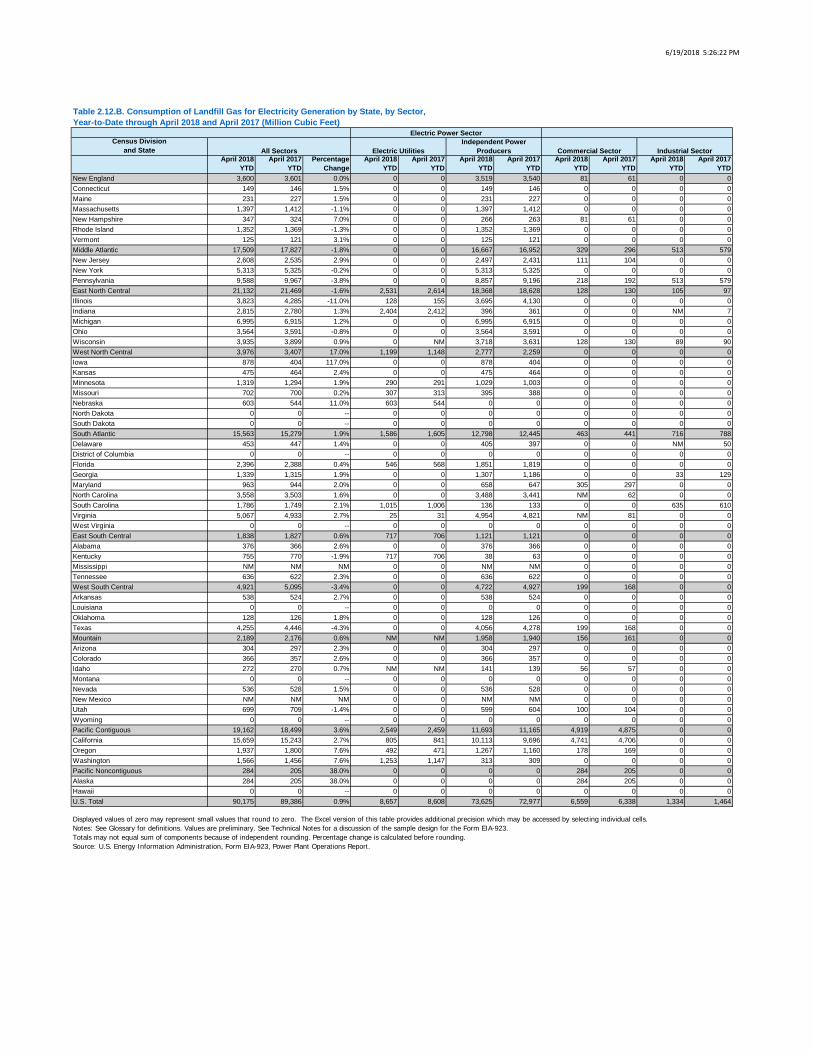
6/19/2018 5:26:22 PM
Census Divisionand State
April 2018 YTD
April 2017 YTD
Percentage Change
April 2018 YTD
April 2017 YTD
April 2018 YTD
April 2017 YTD
April 2018 YTD
April 2017 YTD
April 2018 YTD
April 2017 YTD
New England 3,600 3,601 0.0% 0 0 3,519 3,540 81 61 0 0Connecticut 149 146 1.5% 0 0 149 146 0 0 0 0Maine 231 227 1.5% 0 0 231 227 0 0 0 0Massachusetts 1,397 1,412 -1.1% 0 0 1,397 1,412 0 0 0 0New Hampshire 347 324 7.0% 0 0 266 263 81 61 0 0Rhode Island 1,352 1,369 -1.3% 0 0 1,352 1,369 0 0 0 0Vermont 125 121 3.1% 0 0 125 121 0 0 0 0Middle Atlantic 17,509 17,827 -1.8% 0 0 16,667 16,952 329 296 513 579New Jersey 2,608 2,535 2.9% 0 0 2,497 2,431 111 104 0 0New York 5,313 5,325 -0.2% 0 0 5,313 5,325 0 0 0 0Pennsylvania 9,588 9,967 -3.8% 0 0 8,857 9,196 218 192 513 579East North Central 21,132 21,469 -1.6% 2,531 2,614 18,368 18,628 128 130 105 97Illinois 3,823 4,285 -11.0% 128 155 3,695 4,130 0 0 0 0Indiana 2,815 2,780 1.3% 2,404 2,412 396 361 0 0 NM 7Michigan 6,995 6,915 1.2% 0 0 6,995 6,915 0 0 0 0Ohio 3,564 3,591 -0.8% 0 0 3,564 3,591 0 0 0 0Wisconsin 3,935 3,899 0.9% 0 NM 3,718 3,631 128 130 89 90West North Central 3,976 3,407 17.0% 1,199 1,148 2,777 2,259 0 0 0 0Iowa 878 404 117.0% 0 0 878 404 0 0 0 0Kansas 475 464 2.4% 0 0 475 464 0 0 0 0Minnesota 1,319 1,294 1.9% 290 291 1,029 1,003 0 0 0 0Missouri 702 700 0.2% 307 313 395 388 0 0 0 0Nebraska 603 544 11.0% 603 544 0 0 0 0 0 0North Dakota 0 0 -- 0 0 0 0 0 0 0 0South Dakota 0 0 -- 0 0 0 0 0 0 0 0South Atlantic 15,563 15,279 1.9% 1,586 1,605 12,798 12,445 463 441 716 788Delaware 453 447 1.4% 0 0 405 397 0 0 NM 50District of Columbia 0 0 -- 0 0 0 0 0 0 0 0Florida 2,396 2,388 0.4% 546 568 1,851 1,819 0 0 0 0Georgia 1,339 1,315 1.9% 0 0 1,307 1,186 0 0 33 129Maryland 963 944 2.0% 0 0 658 647 305 297 0 0North Carolina 3,558 3,503 1.6% 0 0 3,488 3,441 NM 62 0 0South Carolina 1,786 1,749 2.1% 1,015 1,006 136 133 0 0 635 610Virginia 5,067 4,933 2.7% 25 31 4,954 4,821 NM 81 0 0West Virginia 0 0 -- 0 0 0 0 0 0 0 0East South Central 1,838 1,827 0.6% 717 706 1,121 1,121 0 0 0 0Alabama 376 366 2.6% 0 0 376 366 0 0 0 0Kentucky 755 770 -1.9% 717 706 38 63 0 0 0 0Mississippi NM NM NM 0 0 NM NM 0 0 0 0Tennessee 636 622 2.3% 0 0 636 622 0 0 0 0West South Central 4,921 5,095 -3.4% 0 0 4,722 4,927 199 168 0 0Arkansas 538 524 2.7% 0 0 538 524 0 0 0 0Louisiana 0 0 -- 0 0 0 0 0 0 0 0Oklahoma 128 126 1.8% 0 0 128 126 0 0 0 0Texas 4,255 4,446 -4.3% 0 0 4,056 4,278 199 168 0 0Mountain 2,189 2,176 0.6% NM NM 1,958 1,940 156 161 0 0Arizona 304 297 2.3% 0 0 304 297 0 0 0 0Colorado 366 357 2.6% 0 0 366 357 0 0 0 0Idaho 272 270 0.7% NM NM 141 139 56 57 0 0Montana 0 0 -- 0 0 0 0 0 0 0 0Nevada 536 528 1.5% 0 0 536 528 0 0 0 0New Mexico NM NM NM 0 0 NM NM 0 0 0 0Utah 699 709 -1.4% 0 0 599 604 100 104 0 0Wyoming 0 0 -- 0 0 0 0 0 0 0 0Pacific Contiguous 19,162 18,499 3.6% 2,549 2,459 11,693 11,165 4,919 4,875 0 0California 15,659 15,243 2.7% 805 841 10,113 9,696 4,741 4,706 0 0Oregon 1,937 1,800 7.6% 492 471 1,267 1,160 178 169 0 0Washington 1,566 1,456 7.6% 1,253 1,147 313 309 0 0 0 0Pacific Noncontiguous 284 205 38.0% 0 0 0 0 284 205 0 0Alaska 284 205 38.0% 0 0 0 0 284 205 0 0Hawaii 0 0 -- 0 0 0 0 0 0 0 0U.S. Total 90,175 89,386 0.9% 8,657 8,608 73,625 72,977 6,559 6,338 1,334 1,464
Displayed values of zero may represent small values that round to zero. The Excel version of this table provides additional precision which may be accessed by selecting individual cells.Notes: See Glossary for definitions. Values are preliminary. See Technical Notes for a discussion of the sample design for the Form EIA-923.Totals may not equal sum of components because of independent rounding. Percentage change is calculated before rounding.Source: U.S. Energy Information Administration, Form EIA-923, Power Plant Operations Report.
Table 2.12.B. Consumption of Landfill Gas for Electricity Generation by State, by Sector,Year-to-Date through April 2018 and April 2017 (Million Cubic Feet)
Electric Power Sector
All Sectors Electric UtilitiesIndependent Power
Producers Commercial Sector Industrial Sector
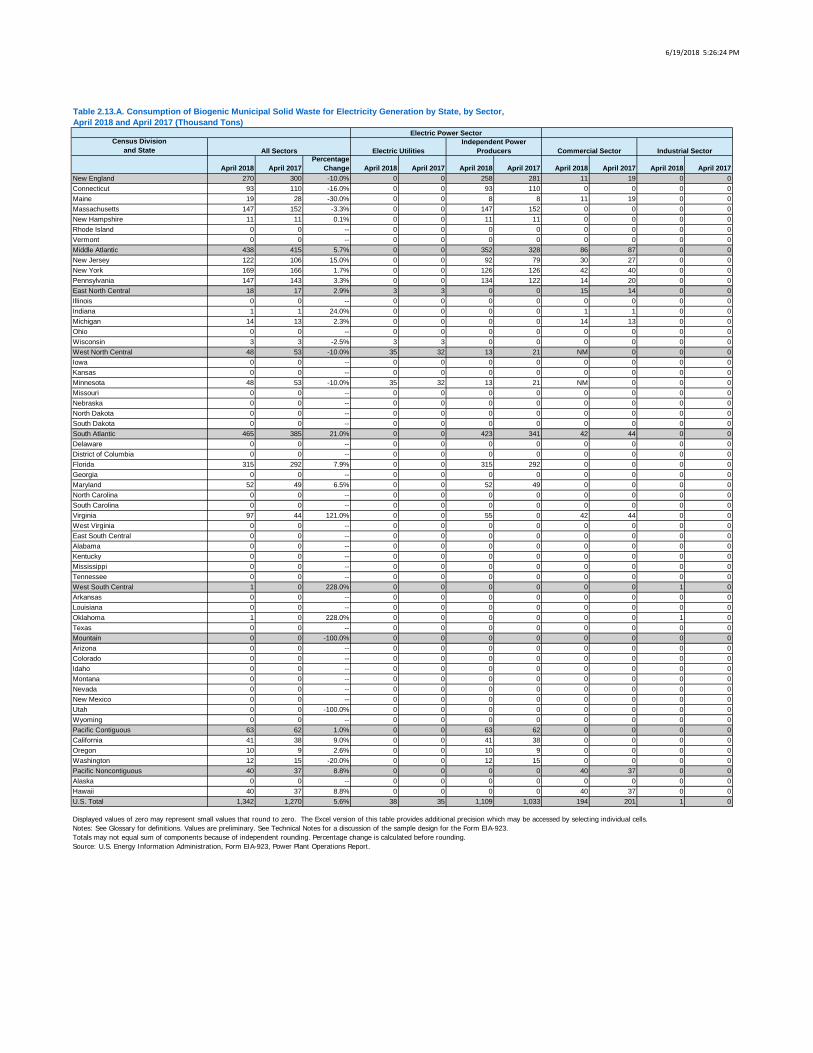
6/19/2018 5:26:24 PM
Census Divisionand State
April 2018 April 2017Percentage
Change April 2018 April 2017 April 2018 April 2017 April 2018 April 2017 April 2018 April 2017New England 270 300 -10.0% 0 0 258 281 11 19 0 0Connecticut 93 110 -16.0% 0 0 93 110 0 0 0 0Maine 19 28 -30.0% 0 0 8 8 11 19 0 0Massachusetts 147 152 -3.3% 0 0 147 152 0 0 0 0New Hampshire 11 11 0.1% 0 0 11 11 0 0 0 0Rhode Island 0 0 -- 0 0 0 0 0 0 0 0Vermont 0 0 -- 0 0 0 0 0 0 0 0Middle Atlantic 438 415 5.7% 0 0 352 328 86 87 0 0New Jersey 122 106 15.0% 0 0 92 79 30 27 0 0New York 169 166 1.7% 0 0 126 126 42 40 0 0Pennsylvania 147 143 3.3% 0 0 134 122 14 20 0 0East North Central 18 17 2.9% 3 3 0 0 15 14 0 0Illinois 0 0 -- 0 0 0 0 0 0 0 0Indiana 1 1 24.0% 0 0 0 0 1 1 0 0Michigan 14 13 2.3% 0 0 0 0 14 13 0 0Ohio 0 0 -- 0 0 0 0 0 0 0 0Wisconsin 3 3 -2.5% 3 3 0 0 0 0 0 0West North Central 48 53 -10.0% 35 32 13 21 NM 0 0 0Iowa 0 0 -- 0 0 0 0 0 0 0 0Kansas 0 0 -- 0 0 0 0 0 0 0 0Minnesota 48 53 -10.0% 35 32 13 21 NM 0 0 0Missouri 0 0 -- 0 0 0 0 0 0 0 0Nebraska 0 0 -- 0 0 0 0 0 0 0 0North Dakota 0 0 -- 0 0 0 0 0 0 0 0South Dakota 0 0 -- 0 0 0 0 0 0 0 0South Atlantic 465 385 21.0% 0 0 423 341 42 44 0 0Delaware 0 0 -- 0 0 0 0 0 0 0 0District of Columbia 0 0 -- 0 0 0 0 0 0 0 0Florida 315 292 7.9% 0 0 315 292 0 0 0 0Georgia 0 0 -- 0 0 0 0 0 0 0 0Maryland 52 49 6.5% 0 0 52 49 0 0 0 0North Carolina 0 0 -- 0 0 0 0 0 0 0 0South Carolina 0 0 -- 0 0 0 0 0 0 0 0Virginia 97 44 121.0% 0 0 55 0 42 44 0 0West Virginia 0 0 -- 0 0 0 0 0 0 0 0East South Central 0 0 -- 0 0 0 0 0 0 0 0Alabama 0 0 -- 0 0 0 0 0 0 0 0Kentucky 0 0 -- 0 0 0 0 0 0 0 0Mississippi 0 0 -- 0 0 0 0 0 0 0 0Tennessee 0 0 -- 0 0 0 0 0 0 0 0West South Central 1 0 228.0% 0 0 0 0 0 0 1 0Arkansas 0 0 -- 0 0 0 0 0 0 0 0Louisiana 0 0 -- 0 0 0 0 0 0 0 0Oklahoma 1 0 228.0% 0 0 0 0 0 0 1 0Texas 0 0 -- 0 0 0 0 0 0 0 0Mountain 0 0 -100.0% 0 0 0 0 0 0 0 0Arizona 0 0 -- 0 0 0 0 0 0 0 0Colorado 0 0 -- 0 0 0 0 0 0 0 0Idaho 0 0 -- 0 0 0 0 0 0 0 0Montana 0 0 -- 0 0 0 0 0 0 0 0Nevada 0 0 -- 0 0 0 0 0 0 0 0New Mexico 0 0 -- 0 0 0 0 0 0 0 0Utah 0 0 -100.0% 0 0 0 0 0 0 0 0Wyoming 0 0 -- 0 0 0 0 0 0 0 0Pacific Contiguous 63 62 1.0% 0 0 63 62 0 0 0 0California 41 38 9.0% 0 0 41 38 0 0 0 0Oregon 10 9 2.6% 0 0 10 9 0 0 0 0Washington 12 15 -20.0% 0 0 12 15 0 0 0 0Pacific Noncontiguous 40 37 8.8% 0 0 0 0 40 37 0 0Alaska 0 0 -- 0 0 0 0 0 0 0 0Hawaii 40 37 8.8% 0 0 0 0 40 37 0 0U.S. Total 1,342 1,270 5.6% 38 35 1,109 1,033 194 201 1 0
Displayed values of zero may represent small values that round to zero. The Excel version of this table provides additional precision which may be accessed by selecting individual cells.Notes: See Glossary for definitions. Values are preliminary. See Technical Notes for a discussion of the sample design for the Form EIA-923.Totals may not equal sum of components because of independent rounding. Percentage change is calculated before rounding.Source: U.S. Energy Information Administration, Form EIA-923, Power Plant Operations Report.
Table 2.13.A. Consumption of Biogenic Municipal Solid Waste for Electricity Generation by State, by Sector,April 2018 and April 2017 (Thousand Tons)
Electric Power Sector
All Sectors Electric UtilitiesIndependent Power
Producers Commercial Sector Industrial Sector
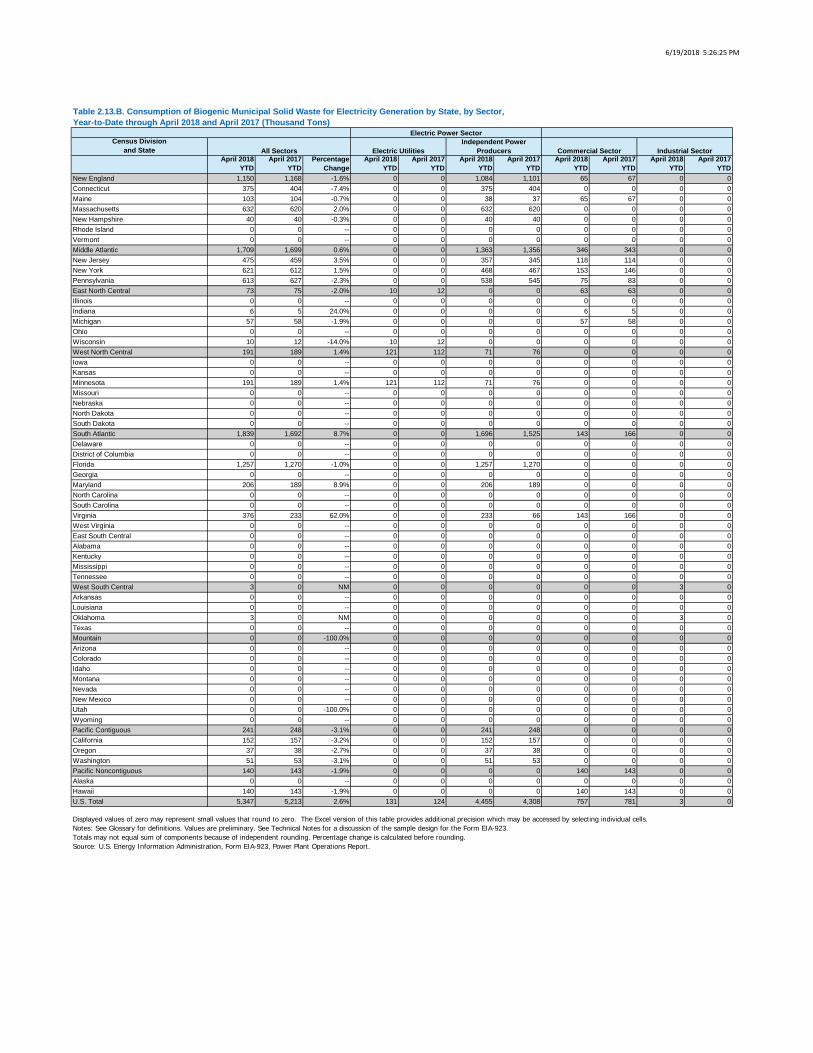
6/19/2018 5:26:25 PM
Census Divisionand State
April 2018 YTD
April 2017 YTD
Percentage Change
April 2018 YTD
April 2017 YTD
April 2018 YTD
April 2017 YTD
April 2018 YTD
April 2017 YTD
April 2018 YTD
April 2017 YTD
New England 1,150 1,168 -1.6% 0 0 1,084 1,101 65 67 0 0Connecticut 375 404 -7.4% 0 0 375 404 0 0 0 0Maine 103 104 -0.7% 0 0 38 37 65 67 0 0Massachusetts 632 620 2.0% 0 0 632 620 0 0 0 0New Hampshire 40 40 -0.3% 0 0 40 40 0 0 0 0Rhode Island 0 0 -- 0 0 0 0 0 0 0 0Vermont 0 0 -- 0 0 0 0 0 0 0 0Middle Atlantic 1,709 1,699 0.6% 0 0 1,363 1,356 346 343 0 0New Jersey 475 459 3.5% 0 0 357 345 118 114 0 0New York 621 612 1.5% 0 0 468 467 153 146 0 0Pennsylvania 613 627 -2.3% 0 0 538 545 75 83 0 0East North Central 73 75 -2.0% 10 12 0 0 63 63 0 0Illinois 0 0 -- 0 0 0 0 0 0 0 0Indiana 6 5 24.0% 0 0 0 0 6 5 0 0Michigan 57 58 -1.9% 0 0 0 0 57 58 0 0Ohio 0 0 -- 0 0 0 0 0 0 0 0Wisconsin 10 12 -14.0% 10 12 0 0 0 0 0 0West North Central 191 189 1.4% 121 112 71 76 0 0 0 0Iowa 0 0 -- 0 0 0 0 0 0 0 0Kansas 0 0 -- 0 0 0 0 0 0 0 0Minnesota 191 189 1.4% 121 112 71 76 0 0 0 0Missouri 0 0 -- 0 0 0 0 0 0 0 0Nebraska 0 0 -- 0 0 0 0 0 0 0 0North Dakota 0 0 -- 0 0 0 0 0 0 0 0South Dakota 0 0 -- 0 0 0 0 0 0 0 0South Atlantic 1,839 1,692 8.7% 0 0 1,696 1,525 143 166 0 0Delaware 0 0 -- 0 0 0 0 0 0 0 0District of Columbia 0 0 -- 0 0 0 0 0 0 0 0Florida 1,257 1,270 -1.0% 0 0 1,257 1,270 0 0 0 0Georgia 0 0 -- 0 0 0 0 0 0 0 0Maryland 206 189 8.9% 0 0 206 189 0 0 0 0North Carolina 0 0 -- 0 0 0 0 0 0 0 0South Carolina 0 0 -- 0 0 0 0 0 0 0 0Virginia 376 233 62.0% 0 0 233 66 143 166 0 0West Virginia 0 0 -- 0 0 0 0 0 0 0 0East South Central 0 0 -- 0 0 0 0 0 0 0 0Alabama 0 0 -- 0 0 0 0 0 0 0 0Kentucky 0 0 -- 0 0 0 0 0 0 0 0Mississippi 0 0 -- 0 0 0 0 0 0 0 0Tennessee 0 0 -- 0 0 0 0 0 0 0 0West South Central 3 0 NM 0 0 0 0 0 0 3 0Arkansas 0 0 -- 0 0 0 0 0 0 0 0Louisiana 0 0 -- 0 0 0 0 0 0 0 0Oklahoma 3 0 NM 0 0 0 0 0 0 3 0Texas 0 0 -- 0 0 0 0 0 0 0 0Mountain 0 0 -100.0% 0 0 0 0 0 0 0 0Arizona 0 0 -- 0 0 0 0 0 0 0 0Colorado 0 0 -- 0 0 0 0 0 0 0 0Idaho 0 0 -- 0 0 0 0 0 0 0 0Montana 0 0 -- 0 0 0 0 0 0 0 0Nevada 0 0 -- 0 0 0 0 0 0 0 0New Mexico 0 0 -- 0 0 0 0 0 0 0 0Utah 0 0 -100.0% 0 0 0 0 0 0 0 0Wyoming 0 0 -- 0 0 0 0 0 0 0 0Pacific Contiguous 241 248 -3.1% 0 0 241 248 0 0 0 0California 152 157 -3.2% 0 0 152 157 0 0 0 0Oregon 37 38 -2.7% 0 0 37 38 0 0 0 0Washington 51 53 -3.1% 0 0 51 53 0 0 0 0Pacific Noncontiguous 140 143 -1.9% 0 0 0 0 140 143 0 0Alaska 0 0 -- 0 0 0 0 0 0 0 0Hawaii 140 143 -1.9% 0 0 0 0 140 143 0 0U.S. Total 5,347 5,213 2.6% 131 124 4,455 4,308 757 781 3 0
Displayed values of zero may represent small values that round to zero. The Excel version of this table provides additional precision which may be accessed by selecting individual cells.Notes: See Glossary for definitions. Values are preliminary. See Technical Notes for a discussion of the sample design for the Form EIA-923.Totals may not equal sum of components because of independent rounding. Percentage change is calculated before rounding.Source: U.S. Energy Information Administration, Form EIA-923, Power Plant Operations Report.
Table 2.13.B. Consumption of Biogenic Municipal Solid Waste for Electricity Generation by State, by Sector,Year-to-Date through April 2018 and April 2017 (Thousand Tons)
Electric Power Sector
All Sectors Electric UtilitiesIndependent Power
Producers Commercial Sector Industrial Sector
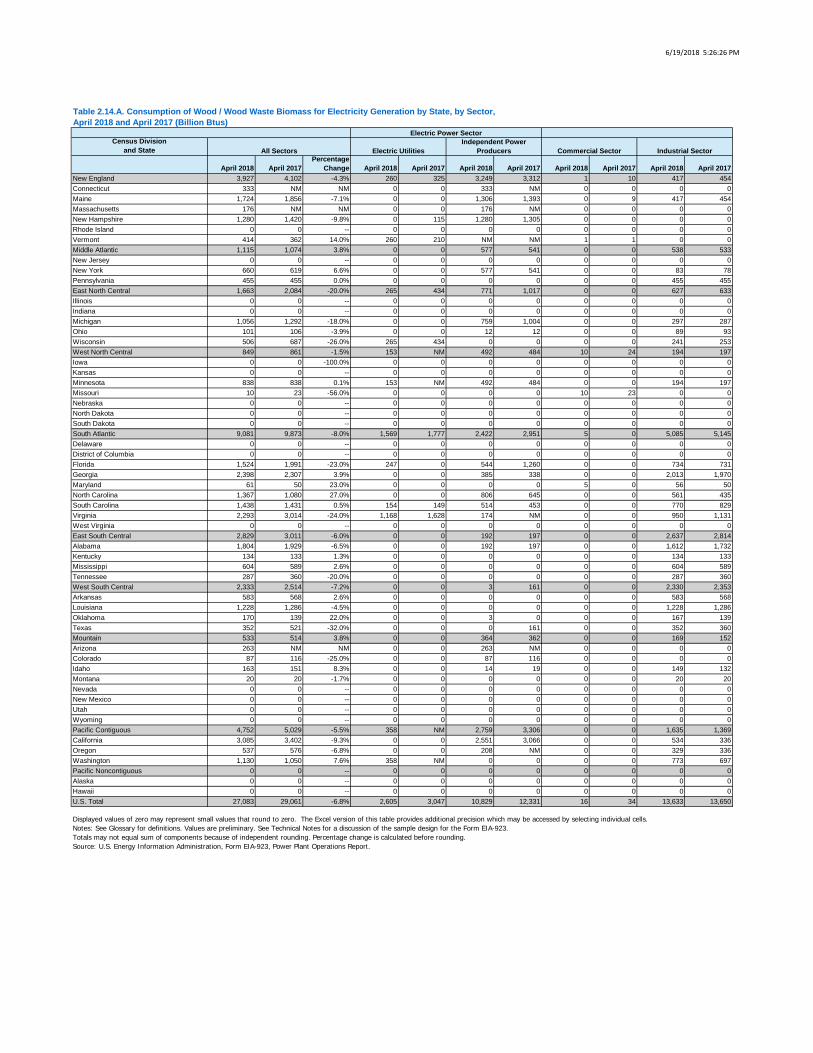
6/19/2018 5:26:26 PM
Census Divisionand State
April 2018 April 2017Percentage
Change April 2018 April 2017 April 2018 April 2017 April 2018 April 2017 April 2018 April 2017New England 3,927 4,102 -4.3% 260 325 3,249 3,312 1 10 417 454Connecticut 333 NM NM 0 0 333 NM 0 0 0 0Maine 1,724 1,856 -7.1% 0 0 1,306 1,393 0 9 417 454Massachusetts 176 NM NM 0 0 176 NM 0 0 0 0New Hampshire 1,280 1,420 -9.8% 0 115 1,280 1,305 0 0 0 0Rhode Island 0 0 -- 0 0 0 0 0 0 0 0Vermont 414 362 14.0% 260 210 NM NM 1 1 0 0Middle Atlantic 1,115 1,074 3.8% 0 0 577 541 0 0 538 533New Jersey 0 0 -- 0 0 0 0 0 0 0 0New York 660 619 6.6% 0 0 577 541 0 0 83 78Pennsylvania 455 455 0.0% 0 0 0 0 0 0 455 455East North Central 1,663 2,084 -20.0% 265 434 771 1,017 0 0 627 633Illinois 0 0 -- 0 0 0 0 0 0 0 0Indiana 0 0 -- 0 0 0 0 0 0 0 0Michigan 1,056 1,292 -18.0% 0 0 759 1,004 0 0 297 287Ohio 101 106 -3.9% 0 0 12 12 0 0 89 93Wisconsin 506 687 -26.0% 265 434 0 0 0 0 241 253West North Central 849 861 -1.5% 153 NM 492 484 10 24 194 197Iowa 0 0 -100.0% 0 0 0 0 0 0 0 0Kansas 0 0 -- 0 0 0 0 0 0 0 0Minnesota 838 838 0.1% 153 NM 492 484 0 0 194 197Missouri 10 23 -56.0% 0 0 0 0 10 23 0 0Nebraska 0 0 -- 0 0 0 0 0 0 0 0North Dakota 0 0 -- 0 0 0 0 0 0 0 0South Dakota 0 0 -- 0 0 0 0 0 0 0 0South Atlantic 9,081 9,873 -8.0% 1,569 1,777 2,422 2,951 5 0 5,085 5,145Delaware 0 0 -- 0 0 0 0 0 0 0 0District of Columbia 0 0 -- 0 0 0 0 0 0 0 0Florida 1,524 1,991 -23.0% 247 0 544 1,260 0 0 734 731Georgia 2,398 2,307 3.9% 0 0 385 338 0 0 2,013 1,970Maryland 61 50 23.0% 0 0 0 0 5 0 56 50North Carolina 1,367 1,080 27.0% 0 0 806 645 0 0 561 435South Carolina 1,438 1,431 0.5% 154 149 514 453 0 0 770 829Virginia 2,293 3,014 -24.0% 1,168 1,628 174 NM 0 0 950 1,131West Virginia 0 0 -- 0 0 0 0 0 0 0 0East South Central 2,829 3,011 -6.0% 0 0 192 197 0 0 2,637 2,814Alabama 1,804 1,929 -6.5% 0 0 192 197 0 0 1,612 1,732Kentucky 134 133 1.3% 0 0 0 0 0 0 134 133Mississippi 604 589 2.6% 0 0 0 0 0 0 604 589Tennessee 287 360 -20.0% 0 0 0 0 0 0 287 360West South Central 2,333 2,514 -7.2% 0 0 3 161 0 0 2,330 2,353Arkansas 583 568 2.6% 0 0 0 0 0 0 583 568Louisiana 1,228 1,286 -4.5% 0 0 0 0 0 0 1,228 1,286Oklahoma 170 139 22.0% 0 0 3 0 0 0 167 139Texas 352 521 -32.0% 0 0 0 161 0 0 352 360Mountain 533 514 3.8% 0 0 364 362 0 0 169 152Arizona 263 NM NM 0 0 263 NM 0 0 0 0Colorado 87 116 -25.0% 0 0 87 116 0 0 0 0Idaho 163 151 8.3% 0 0 14 19 0 0 149 132Montana 20 20 -1.7% 0 0 0 0 0 0 20 20Nevada 0 0 -- 0 0 0 0 0 0 0 0New Mexico 0 0 -- 0 0 0 0 0 0 0 0Utah 0 0 -- 0 0 0 0 0 0 0 0Wyoming 0 0 -- 0 0 0 0 0 0 0 0Pacific Contiguous 4,752 5,029 -5.5% 358 NM 2,759 3,306 0 0 1,635 1,369California 3,085 3,402 -9.3% 0 0 2,551 3,066 0 0 534 336Oregon 537 576 -6.8% 0 0 208 NM 0 0 329 336Washington 1,130 1,050 7.6% 358 NM 0 0 0 0 773 697Pacific Noncontiguous 0 0 -- 0 0 0 0 0 0 0 0Alaska 0 0 -- 0 0 0 0 0 0 0 0Hawaii 0 0 -- 0 0 0 0 0 0 0 0U.S. Total 27,083 29,061 -6.8% 2,605 3,047 10,829 12,331 16 34 13,633 13,650
Displayed values of zero may represent small values that round to zero. The Excel version of this table provides additional precision which may be accessed by selecting individual cells.Notes: See Glossary for definitions. Values are preliminary. See Technical Notes for a discussion of the sample design for the Form EIA-923.Totals may not equal sum of components because of independent rounding. Percentage change is calculated before rounding.Source: U.S. Energy Information Administration, Form EIA-923, Power Plant Operations Report.
Table 2.14.A. Consumption of Wood / Wood Waste Biomass for Electricity Generation by State, by Sector,April 2018 and April 2017 (Billion Btus)
Electric Power Sector
All Sectors Electric UtilitiesIndependent Power
Producers Commercial Sector Industrial Sector
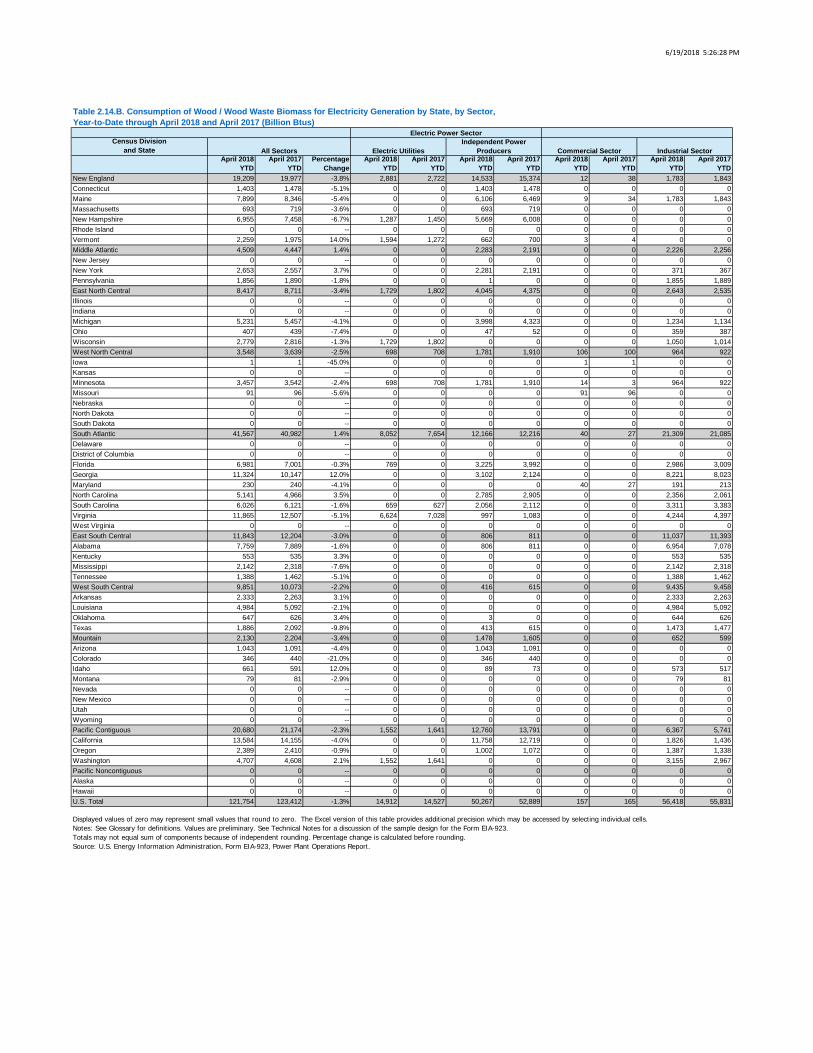
6/19/2018 5:26:28 PM
Census Divisionand State
April 2018 YTD
April 2017 YTD
Percentage Change
April 2018 YTD
April 2017 YTD
April 2018 YTD
April 2017 YTD
April 2018 YTD
April 2017 YTD
April 2018 YTD
April 2017 YTD
New England 19,209 19,977 -3.8% 2,881 2,722 14,533 15,374 12 38 1,783 1,843Connecticut 1,403 1,478 -5.1% 0 0 1,403 1,478 0 0 0 0Maine 7,899 8,346 -5.4% 0 0 6,106 6,469 9 34 1,783 1,843Massachusetts 693 719 -3.6% 0 0 693 719 0 0 0 0New Hampshire 6,955 7,458 -6.7% 1,287 1,450 5,669 6,008 0 0 0 0Rhode Island 0 0 -- 0 0 0 0 0 0 0 0Vermont 2,259 1,975 14.0% 1,594 1,272 662 700 3 4 0 0Middle Atlantic 4,509 4,447 1.4% 0 0 2,283 2,191 0 0 2,226 2,256New Jersey 0 0 -- 0 0 0 0 0 0 0 0New York 2,653 2,557 3.7% 0 0 2,281 2,191 0 0 371 367Pennsylvania 1,856 1,890 -1.8% 0 0 1 0 0 0 1,855 1,889East North Central 8,417 8,711 -3.4% 1,729 1,802 4,045 4,375 0 0 2,643 2,535Illinois 0 0 -- 0 0 0 0 0 0 0 0Indiana 0 0 -- 0 0 0 0 0 0 0 0Michigan 5,231 5,457 -4.1% 0 0 3,998 4,323 0 0 1,234 1,134Ohio 407 439 -7.4% 0 0 47 52 0 0 359 387Wisconsin 2,779 2,816 -1.3% 1,729 1,802 0 0 0 0 1,050 1,014West North Central 3,548 3,639 -2.5% 698 708 1,781 1,910 106 100 964 922Iowa 1 1 -45.0% 0 0 0 0 1 1 0 0Kansas 0 0 -- 0 0 0 0 0 0 0 0Minnesota 3,457 3,542 -2.4% 698 708 1,781 1,910 14 3 964 922Missouri 91 96 -5.6% 0 0 0 0 91 96 0 0Nebraska 0 0 -- 0 0 0 0 0 0 0 0North Dakota 0 0 -- 0 0 0 0 0 0 0 0South Dakota 0 0 -- 0 0 0 0 0 0 0 0South Atlantic 41,567 40,982 1.4% 8,052 7,654 12,166 12,216 40 27 21,309 21,085Delaware 0 0 -- 0 0 0 0 0 0 0 0District of Columbia 0 0 -- 0 0 0 0 0 0 0 0Florida 6,981 7,001 -0.3% 769 0 3,225 3,992 0 0 2,986 3,009Georgia 11,324 10,147 12.0% 0 0 3,102 2,124 0 0 8,221 8,023Maryland 230 240 -4.1% 0 0 0 0 40 27 191 213North Carolina 5,141 4,966 3.5% 0 0 2,785 2,905 0 0 2,356 2,061South Carolina 6,026 6,121 -1.6% 659 627 2,056 2,112 0 0 3,311 3,383Virginia 11,865 12,507 -5.1% 6,624 7,028 997 1,083 0 0 4,244 4,397West Virginia 0 0 -- 0 0 0 0 0 0 0 0East South Central 11,843 12,204 -3.0% 0 0 806 811 0 0 11,037 11,393Alabama 7,759 7,889 -1.6% 0 0 806 811 0 0 6,954 7,078Kentucky 553 535 3.3% 0 0 0 0 0 0 553 535Mississippi 2,142 2,318 -7.6% 0 0 0 0 0 0 2,142 2,318Tennessee 1,388 1,462 -5.1% 0 0 0 0 0 0 1,388 1,462West South Central 9,851 10,073 -2.2% 0 0 416 615 0 0 9,435 9,458Arkansas 2,333 2,263 3.1% 0 0 0 0 0 0 2,333 2,263Louisiana 4,984 5,092 -2.1% 0 0 0 0 0 0 4,984 5,092Oklahoma 647 626 3.4% 0 0 3 0 0 0 644 626Texas 1,886 2,092 -9.8% 0 0 413 615 0 0 1,473 1,477Mountain 2,130 2,204 -3.4% 0 0 1,478 1,605 0 0 652 599Arizona 1,043 1,091 -4.4% 0 0 1,043 1,091 0 0 0 0Colorado 346 440 -21.0% 0 0 346 440 0 0 0 0Idaho 661 591 12.0% 0 0 89 73 0 0 573 517Montana 79 81 -2.9% 0 0 0 0 0 0 79 81Nevada 0 0 -- 0 0 0 0 0 0 0 0New Mexico 0 0 -- 0 0 0 0 0 0 0 0Utah 0 0 -- 0 0 0 0 0 0 0 0Wyoming 0 0 -- 0 0 0 0 0 0 0 0Pacific Contiguous 20,680 21,174 -2.3% 1,552 1,641 12,760 13,791 0 0 6,367 5,741California 13,584 14,155 -4.0% 0 0 11,758 12,719 0 0 1,826 1,436Oregon 2,389 2,410 -0.9% 0 0 1,002 1,072 0 0 1,387 1,338Washington 4,707 4,608 2.1% 1,552 1,641 0 0 0 0 3,155 2,967Pacific Noncontiguous 0 0 -- 0 0 0 0 0 0 0 0Alaska 0 0 -- 0 0 0 0 0 0 0 0Hawaii 0 0 -- 0 0 0 0 0 0 0 0U.S. Total 121,754 123,412 -1.3% 14,912 14,527 50,267 52,889 157 165 56,418 55,831
Displayed values of zero may represent small values that round to zero. The Excel version of this table provides additional precision which may be accessed by selecting individual cells.Notes: See Glossary for definitions. Values are preliminary. See Technical Notes for a discussion of the sample design for the Form EIA-923.Totals may not equal sum of components because of independent rounding. Percentage change is calculated before rounding.Source: U.S. Energy Information Administration, Form EIA-923, Power Plant Operations Report.
Table 2.14.B. Consumption of Wood / Wood Waste Biomass for Electricity Generation by State, by Sector,Year-to-Date through April 2018 and April 2017 (Billion Btus)
Electric Power Sector
All Sectors Electric UtilitiesIndependent Power
Producers Commercial Sector Industrial Sector
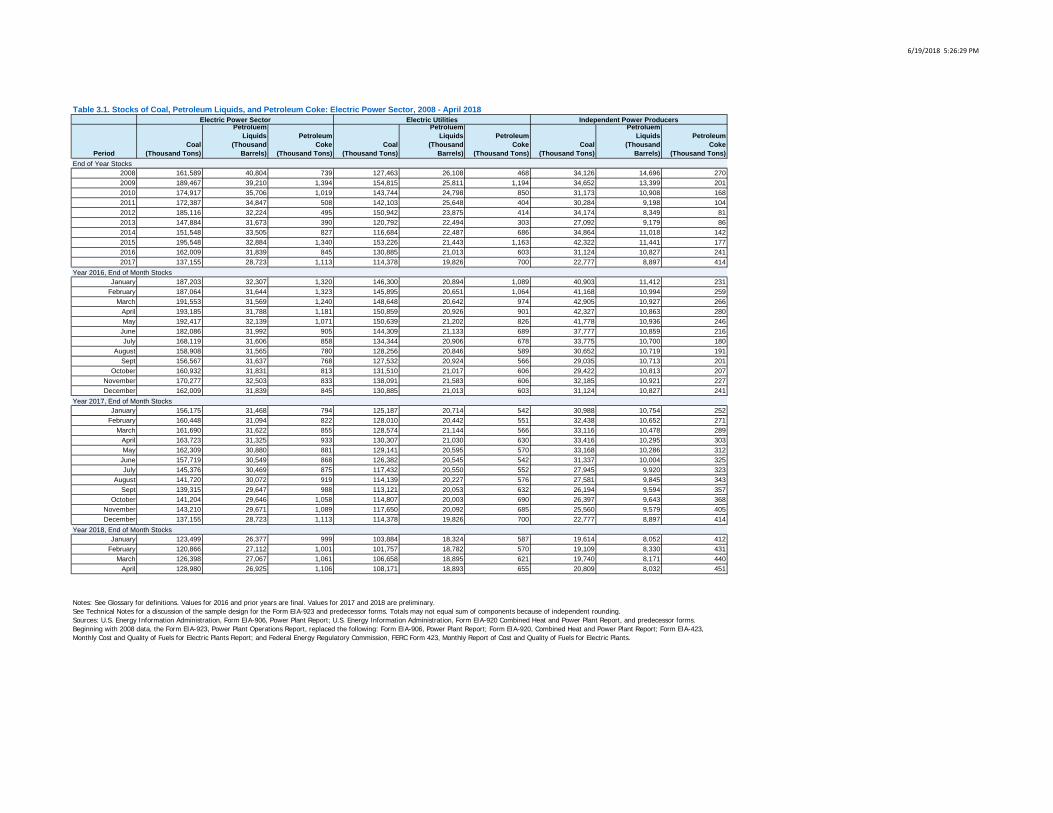
6/19/2018 5:26:29 PM
PeriodCoal
(Thousand Tons)
PetroluemLiquids
(ThousandBarrels)
PetroleumCoke
(Thousand Tons)Coal
(Thousand Tons)
PetroluemLiquids
(ThousandBarrels)
PetroleumCoke
(Thousand Tons)Coal
(Thousand Tons)
PetroluemLiquids
(ThousandBarrels)
PetroleumCoke
(Thousand Tons)
2008 161,589 40,804 739 127,463 26,108 468 34,126 14,696 2702009 189,467 39,210 1,394 154,815 25,811 1,194 34,652 13,399 2012010 174,917 35,706 1,019 143,744 24,798 850 31,173 10,908 1682011 172,387 34,847 508 142,103 25,648 404 30,284 9,198 1042012 185,116 32,224 495 150,942 23,875 414 34,174 8,349 812013 147,884 31,673 390 120,792 22,494 303 27,092 9,179 862014 151,548 33,505 827 116,684 22,487 686 34,864 11,018 1422015 195,548 32,884 1,340 153,226 21,443 1,163 42,322 11,441 1772016 162,009 31,839 845 130,885 21,013 603 31,124 10,827 2412017 137,155 28,723 1,113 114,378 19,826 700 22,777 8,897 414
January 187,203 32,307 1,320 146,300 20,894 1,089 40,903 11,412 231February 187,064 31,644 1,323 145,895 20,651 1,064 41,168 10,994 259
March 191,553 31,569 1,240 148,648 20,642 974 42,905 10,927 266April 193,185 31,788 1,181 150,859 20,926 901 42,327 10,863 280May 192,417 32,139 1,071 150,639 21,202 826 41,778 10,936 246
June 182,086 31,992 905 144,309 21,133 689 37,777 10,859 216July 168,119 31,606 858 134,344 20,906 678 33,775 10,700 180
August 158,908 31,565 780 128,256 20,846 589 30,652 10,719 191Sept 156,567 31,637 768 127,532 20,924 566 29,035 10,713 201
October 160,932 31,831 813 131,510 21,017 606 29,422 10,813 207November 170,277 32,503 833 138,091 21,583 606 32,185 10,921 227December 162,009 31,839 845 130,885 21,013 603 31,124 10,827 241
January 156,175 31,468 794 125,187 20,714 542 30,988 10,754 252February 160,448 31,094 822 128,010 20,442 551 32,438 10,652 271
March 161,690 31,622 855 128,574 21,144 566 33,116 10,478 289April 163,723 31,325 933 130,307 21,030 630 33,416 10,295 303May 162,309 30,880 881 129,141 20,595 570 33,168 10,286 312
June 157,719 30,549 868 126,382 20,545 542 31,337 10,004 325July 145,376 30,469 875 117,432 20,550 552 27,945 9,920 323
August 141,720 30,072 919 114,139 20,227 576 27,581 9,845 343Sept 139,315 29,647 988 113,121 20,053 632 26,194 9,594 357
October 141,204 29,646 1,058 114,807 20,003 690 26,397 9,643 368November 143,210 29,671 1,089 117,650 20,092 685 25,560 9,579 405December 137,155 28,723 1,113 114,378 19,826 700 22,777 8,897 414
January 123,499 26,377 999 103,884 18,324 587 19,614 8,052 412February 120,866 27,112 1,001 101,757 18,782 570 19,109 8,330 431
March 126,398 27,067 1,061 106,658 18,895 621 19,740 8,171 440April 128,980 26,925 1,106 108,171 18,893 655 20,809 8,032 451
Year 2017, End of Month Stocks
Year 2018, End of Month Stocks
Notes: See Glossary for definitions. Values for 2016 and prior years are final. Values for 2017 and 2018 are preliminary.See Technical Notes for a discussion of the sample design for the Form EIA-923 and predecessor forms. Totals may not equal sum of components because of independent rounding.Sources: U.S. Energy Information Administration, Form EIA-906, Power Plant Report; U.S. Energy Information Administration, Form EIA-920 Combined Heat and Power Plant Report, and predecessor forms.Beginning with 2008 data, the Form EIA-923, Power Plant Operations Report, replaced the following: Form EIA-906, Power Plant Report; Form EIA-920, Combined Heat and Power Plant Report; Form EIA-423, Monthly Cost and Quality of Fuels for Electric Plants Report; and Federal Energy Regulatory Commission, FERC Form 423, Monthly Report of Cost and Quality of Fuels for Electric Plants.
Table 3.1. Stocks of Coal, Petroleum Liquids, and Petroleum Coke: Electric Power Sector, 2008 - April 2018Electric Power Sector Electric Utilities Independent Power Producers
End of Year Stocks
Year 2016, End of Month Stocks
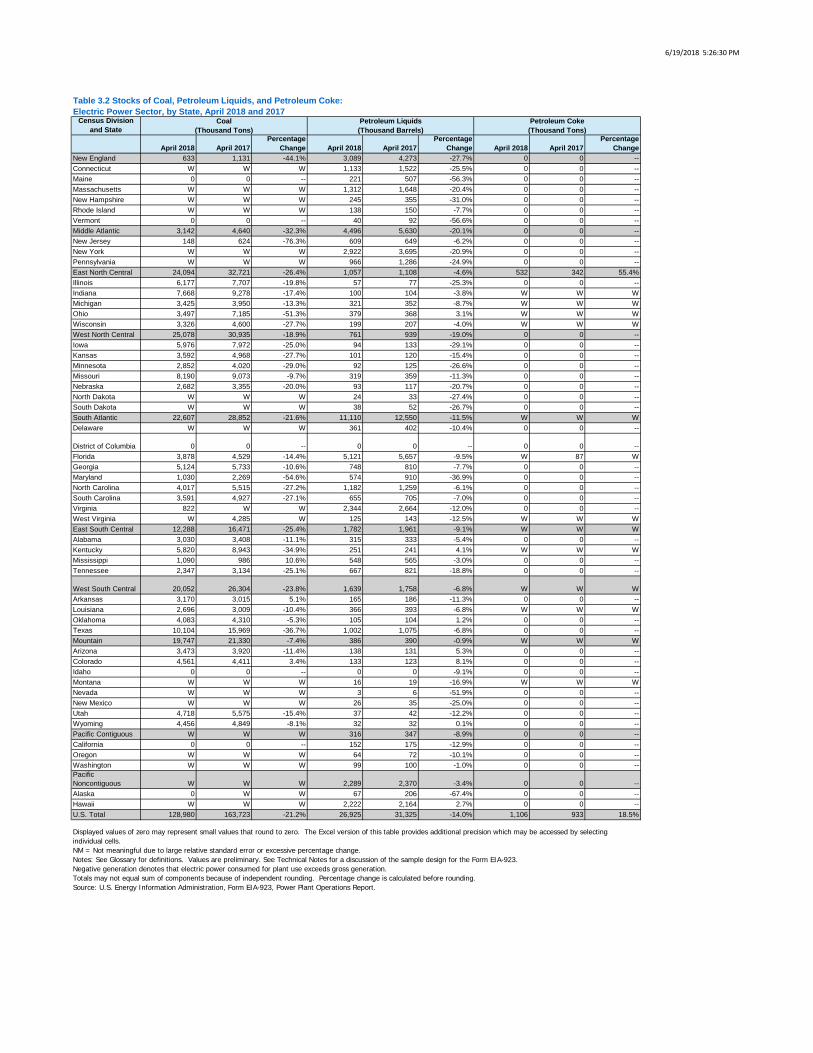
6/19/2018 5:26:30 PM
Census Divisionand State
April 2018 April 2017Percentage
Change April 2018 April 2017Percentage
Change April 2018 April 2017Percentage
ChangeNew England 633 1,131 -44.1% 3,089 4,273 -27.7% 0 0 --Connecticut W W W 1,133 1,522 -25.5% 0 0 --Maine 0 0 -- 221 507 -56.3% 0 0 --Massachusetts W W W 1,312 1,648 -20.4% 0 0 --New Hampshire W W W 245 355 -31.0% 0 0 --Rhode Island W W W 138 150 -7.7% 0 0 --Vermont 0 0 -- 40 92 -56.6% 0 0 --Middle Atlantic 3,142 4,640 -32.3% 4,496 5,630 -20.1% 0 0 --New Jersey 148 624 -76.3% 609 649 -6.2% 0 0 --New York W W W 2,922 3,695 -20.9% 0 0 --Pennsylvania W W W 966 1,286 -24.9% 0 0 --East North Central 24,094 32,721 -26.4% 1,057 1,108 -4.6% 532 342 55.4%Illinois 6,177 7,707 -19.8% 57 77 -25.3% 0 0 --Indiana 7,668 9,278 -17.4% 100 104 -3.8% W W WMichigan 3,425 3,950 -13.3% 321 352 -8.7% W W WOhio 3,497 7,185 -51.3% 379 368 3.1% W W WWisconsin 3,326 4,600 -27.7% 199 207 -4.0% W W WWest North Central 25,078 30,935 -18.9% 761 939 -19.0% 0 0 --Iowa 5,976 7,972 -25.0% 94 133 -29.1% 0 0 --Kansas 3,592 4,968 -27.7% 101 120 -15.4% 0 0 --Minnesota 2,852 4,020 -29.0% 92 125 -26.6% 0 0 --Missouri 8,190 9,073 -9.7% 319 359 -11.3% 0 0 --Nebraska 2,682 3,355 -20.0% 93 117 -20.7% 0 0 --North Dakota W W W 24 33 -27.4% 0 0 --South Dakota W W W 38 52 -26.7% 0 0 --South Atlantic 22,607 28,852 -21.6% 11,110 12,550 -11.5% W W WDelaware W W W 361 402 -10.4% 0 0 --
District of Columbia 0 0 -- 0 0 -- 0 0 --Florida 3,878 4,529 -14.4% 5,121 5,657 -9.5% W 87 WGeorgia 5,124 5,733 -10.6% 748 810 -7.7% 0 0 --Maryland 1,030 2,269 -54.6% 574 910 -36.9% 0 0 --North Carolina 4,017 5,515 -27.2% 1,182 1,259 -6.1% 0 0 --South Carolina 3,591 4,927 -27.1% 655 705 -7.0% 0 0 --Virginia 822 W W 2,344 2,664 -12.0% 0 0 --West Virginia W 4,285 W 125 143 -12.5% W W WEast South Central 12,288 16,471 -25.4% 1,782 1,961 -9.1% W W WAlabama 3,030 3,408 -11.1% 315 333 -5.4% 0 0 --Kentucky 5,820 8,943 -34.9% 251 241 4.1% W W WMississippi 1,090 986 10.6% 548 565 -3.0% 0 0 --Tennessee 2,347 3,134 -25.1% 667 821 -18.8% 0 0 --
West South Central 20,052 26,304 -23.8% 1,639 1,758 -6.8% W W WArkansas 3,170 3,015 5.1% 165 186 -11.3% 0 0 --Louisiana 2,696 3,009 -10.4% 366 393 -6.8% W W WOklahoma 4,083 4,310 -5.3% 105 104 1.2% 0 0 --Texas 10,104 15,969 -36.7% 1,002 1,075 -6.8% 0 0 --Mountain 19,747 21,330 -7.4% 386 390 -0.9% W W WArizona 3,473 3,920 -11.4% 138 131 5.3% 0 0 --Colorado 4,561 4,411 3.4% 133 123 8.1% 0 0 --Idaho 0 0 -- 0 0 -9.1% 0 0 --Montana W W W 16 19 -16.9% W W WNevada W W W 3 6 -51.9% 0 0 --New Mexico W W W 26 35 -25.0% 0 0 --Utah 4,718 5,575 -15.4% 37 42 -12.2% 0 0 --Wyoming 4,456 4,849 -8.1% 32 32 0.1% 0 0 --Pacific Contiguous W W W 316 347 -8.9% 0 0 --California 0 0 -- 152 175 -12.9% 0 0 --Oregon W W W 64 72 -10.1% 0 0 --Washington W W W 99 100 -1.0% 0 0 --Pacific Noncontiguous W W W 2,289 2,370 -3.4% 0 0 --Alaska 0 W W 67 206 -67.4% 0 0 --Hawaii W W W 2,222 2,164 2.7% 0 0 --U.S. Total 128,980 163,723 -21.2% 26,925 31,325 -14.0% 1,106 933 18.5%
Displayed values of zero may represent small values that round to zero. The Excel version of this table provides additional precision which may be accessed by selecting individual cells.NM = Not meaningful due to large relative standard error or excessive percentage change.Notes: See Glossary for definitions. Values are preliminary. See Technical Notes for a discussion of the sample design for the Form EIA-923.Negative generation denotes that electric power consumed for plant use exceeds gross generation.Totals may not equal sum of components because of independent rounding. Percentage change is calculated before rounding.Source: U.S. Energy Information Administration, Form EIA-923, Power Plant Operations Report.
Table 3.2 Stocks of Coal, Petroleum Liquids, and Petroleum Coke:Electric Power Sector, by State, April 2018 and 2017
Coal(Thousand Tons)
Petroleum Liquids(Thousand Barrels)
Petroleum Coke(Thousand Tons)
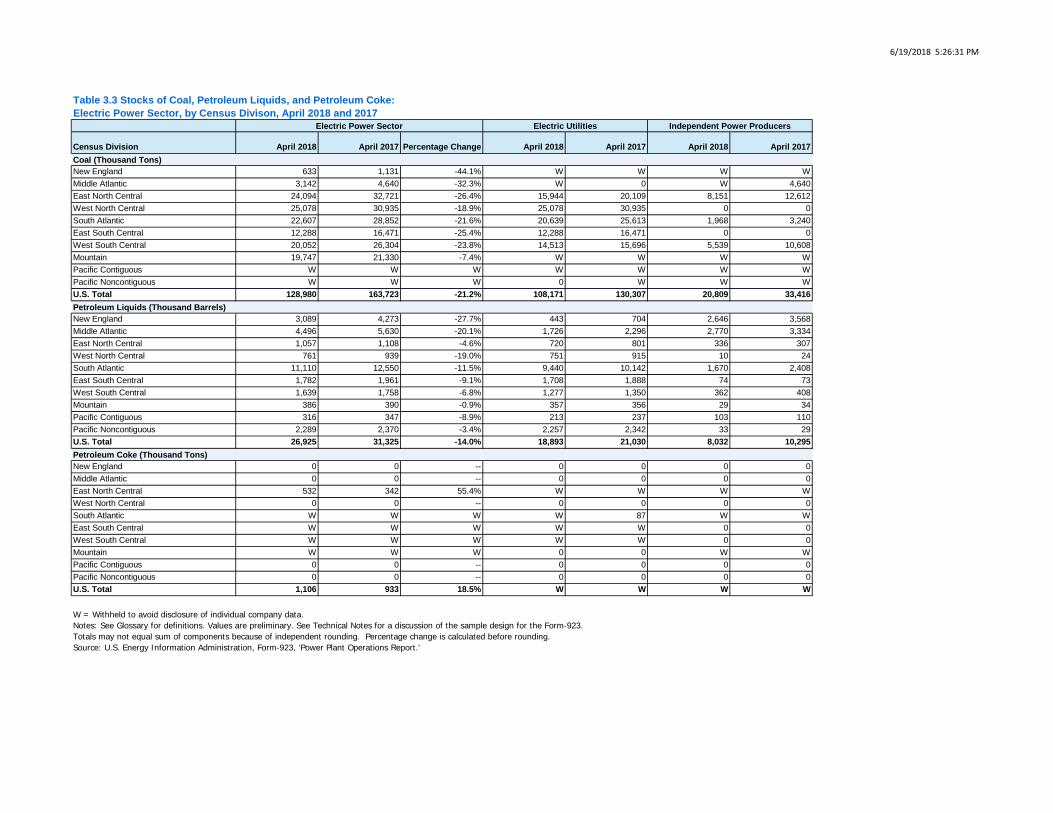
6/19/2018 5:26:31 PM
Census Division April 2018 April 2017 Percentage Change April 2018 April 2017 April 2018 April 2017
New England 633 1,131 -44.1% W W W WMiddle Atlantic 3,142 4,640 -32.3% W 0 W 4,640East North Central 24,094 32,721 -26.4% 15,944 20,109 8,151 12,612West North Central 25,078 30,935 -18.9% 25,078 30,935 0 0South Atlantic 22,607 28,852 -21.6% 20,639 25,613 1,968 3,240East South Central 12,288 16,471 -25.4% 12,288 16,471 0 0West South Central 20,052 26,304 -23.8% 14,513 15,696 5,539 10,608Mountain 19,747 21,330 -7.4% W W W WPacific Contiguous W W W W W W WPacific Noncontiguous W W W 0 W W WU.S. Total 128,980 163,723 -21.2% 108,171 130,307 20,809 33,416
New England 3,089 4,273 -27.7% 443 704 2,646 3,568Middle Atlantic 4,496 5,630 -20.1% 1,726 2,296 2,770 3,334East North Central 1,057 1,108 -4.6% 720 801 336 307West North Central 761 939 -19.0% 751 915 10 24South Atlantic 11,110 12,550 -11.5% 9,440 10,142 1,670 2,408East South Central 1,782 1,961 -9.1% 1,708 1,888 74 73West South Central 1,639 1,758 -6.8% 1,277 1,350 362 408Mountain 386 390 -0.9% 357 356 29 34Pacific Contiguous 316 347 -8.9% 213 237 103 110Pacific Noncontiguous 2,289 2,370 -3.4% 2,257 2,342 33 29U.S. Total 26,925 31,325 -14.0% 18,893 21,030 8,032 10,295
New England 0 0 -- 0 0 0 0Middle Atlantic 0 0 -- 0 0 0 0East North Central 532 342 55.4% W W W WWest North Central 0 0 -- 0 0 0 0South Atlantic W W W W 87 W WEast South Central W W W W W 0 0West South Central W W W W W 0 0Mountain W W W 0 0 W WPacific Contiguous 0 0 -- 0 0 0 0Pacific Noncontiguous 0 0 -- 0 0 0 0U.S. Total 1,106 933 18.5% W W W W
Petroleum Liquids (Thousand Barrels)
Petroleum Coke (Thousand Tons)
W = Withheld to avoid disclosure of individual company data.Notes: See Glossary for definitions. Values are preliminary. See Technical Notes for a discussion of the sample design for the Form-923.Totals may not equal sum of components because of independent rounding. Percentage change is calculated before rounding.Source: U.S. Energy Information Administration, Form-923, 'Power Plant Operations Report.'
Table 3.3 Stocks of Coal, Petroleum Liquids, and Petroleum Coke:Electric Power Sector, by Census Divison, April 2018 and 2017
Electric Power Sector Electric Utilities Independent Power Producers
Coal (Thousand Tons)
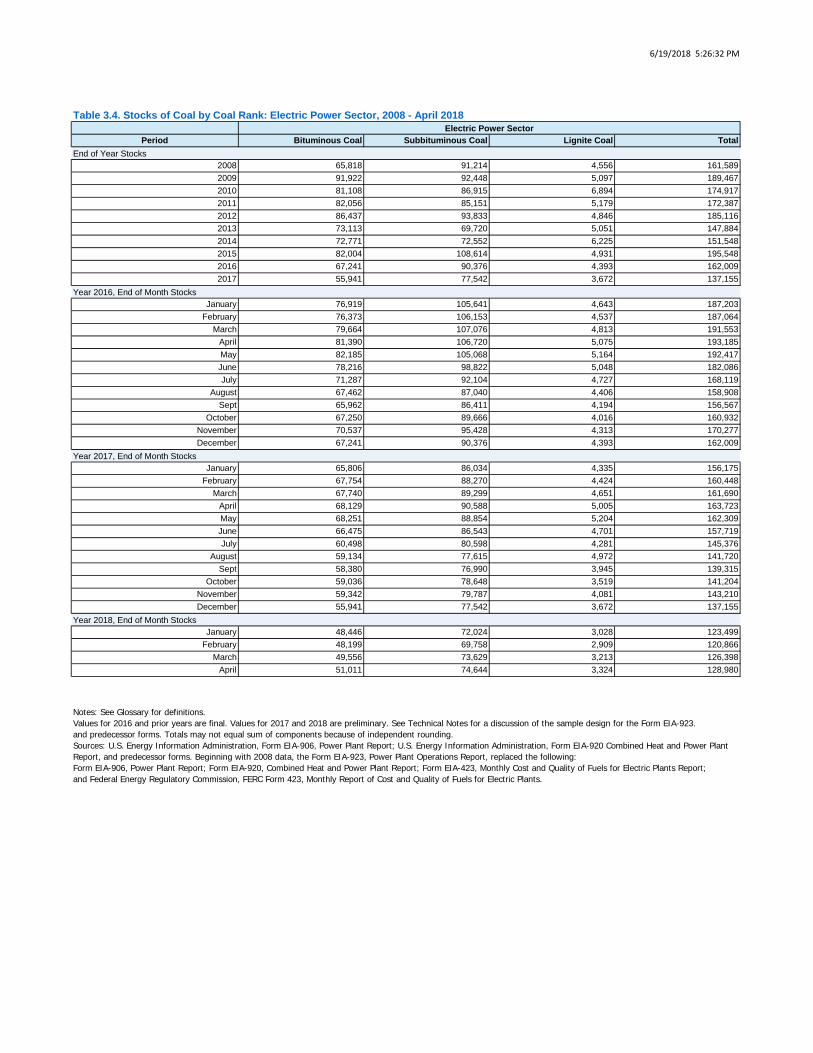
6/19/2018 5:26:32 PM
Period Bituminous Coal Subbituminous Coal Lignite Coal Total
2008 65,818 91,214 4,556 161,5892009 91,922 92,448 5,097 189,4672010 81,108 86,915 6,894 174,9172011 82,056 85,151 5,179 172,3872012 86,437 93,833 4,846 185,1162013 73,113 69,720 5,051 147,8842014 72,771 72,552 6,225 151,5482015 82,004 108,614 4,931 195,5482016 67,241 90,376 4,393 162,0092017 55,941 77,542 3,672 137,155
January 76,919 105,641 4,643 187,203February 76,373 106,153 4,537 187,064
March 79,664 107,076 4,813 191,553April 81,390 106,720 5,075 193,185May 82,185 105,068 5,164 192,417June 78,216 98,822 5,048 182,086July 71,287 92,104 4,727 168,119
August 67,462 87,040 4,406 158,908Sept 65,962 86,411 4,194 156,567
October 67,250 89,666 4,016 160,932November 70,537 95,428 4,313 170,277December 67,241 90,376 4,393 162,009
January 65,806 86,034 4,335 156,175February 67,754 88,270 4,424 160,448
March 67,740 89,299 4,651 161,690April 68,129 90,588 5,005 163,723May 68,251 88,854 5,204 162,309June 66,475 86,543 4,701 157,719July 60,498 80,598 4,281 145,376
August 59,134 77,615 4,972 141,720Sept 58,380 76,990 3,945 139,315
October 59,036 78,648 3,519 141,204November 59,342 79,787 4,081 143,210December 55,941 77,542 3,672 137,155
January 48,446 72,024 3,028 123,499February 48,199 69,758 2,909 120,866
March 49,556 73,629 3,213 126,398April 51,011 74,644 3,324 128,980
Notes: See Glossary for definitions.Values for 2016 and prior years are final. Values for 2017 and 2018 are preliminary. See Technical Notes for a discussion of the sample design for the Form EIA-923.and predecessor forms. Totals may not equal sum of components because of independent rounding.Sources: U.S. Energy Information Administration, Form EIA-906, Power Plant Report; U.S. Energy Information Administration, Form EIA-920 Combined Heat and Power Plant Report, and predecessor forms. Beginning with 2008 data, the Form EIA-923, Power Plant Operations Report, replaced the following:Form EIA-906, Power Plant Report; Form EIA-920, Combined Heat and Power Plant Report; Form EIA-423, Monthly Cost and Quality of Fuels for Electric Plants Report;and Federal Energy Regulatory Commission, FERC Form 423, Monthly Report of Cost and Quality of Fuels for Electric Plants.
Table 3.4. Stocks of Coal by Coal Rank: Electric Power Sector, 2008 - April 2018Electric Power Sector
End of Year Stocks
Year 2016, End of Month Stocks
Year 2017, End of Month Stocks
Year 2018, End of Month Stocks

6/19/2018 5:26:33 PM
Period
(BillionBtu)
(ThousandTons)
(Dollarsper
MMBtu)
(Dollarsper
Ton)
Average Sulfur Percent by
WeightPercentage ofConsumption
(BillionBtu)
(ThousandBarrels)
(Dollarsper
MMBtu)
(Dollarsper
Barrel)
Average Sulfur Percent by
WeightPercentage ofConsumption
2008 21,280,258 1,069,709 2.07 41.14 0.97 100.5 375,684 61,139 15.52 95.38 0.61 99.62009 19,437,966 981,477 2.21 43.74 1.01 102.8 330,043 54,181 10.25 62.47 0.54 104.82010 19,289,661 979,918 2.27 44.64 1.16 97.9 275,058 45,472 14.02 84.80 0.51 101.12011 18,675,843 956,538 2.39 46.65 1.19 100.0 216,752 36,158 19.94 119.54 0.60 116.12012 16,265,578 841,183 2.38 46.09 1.25 99.5 116,937 19,464 21.85 131.28 0.51 75.72013 15,906,809 823,222 2.34 45.33 1.29 93.7 123,964 20,413 20.56 124.90 0.46 76.52014 16,594,722 854,560 2.37 45.96 1.32 98.0 172,421 28,514 19.87 120.26 0.46 82.32015 15,086,208 782,929 2.22 42.86 1.29 103.5 147,647 24,320 11.49 69.79 0.48 75.82016 12,516,272 650,770 2.11 40.64 1.34 93.8 101,810 16,807 9.39 56.89 0.49 68.12017 12,142,749 634,118 2.08 39.75 1.29 93.4 94,007 15,619 11.82 71.15 0.49 65.4
January 1,035,315 54,397 2.12 40.35 1.32 85.5 9,096 1,519 7.96 47.76 0.48 56.2February 981,062 50,919 2.11 40.62 1.40 97.9 8,023 1,323 7.00 42.51 0.47 52.0
March 896,983 45,720 2.17 42.66 1.46 110.7 6,912 1,140 6.92 41.99 0.45 68.2April 807,001 41,015 2.16 42.44 1.45 101.8 8,592 1,414 8.37 50.85 0.42 88.7May 871,890 44,729 2.16 42.13 1.44 96.6 9,231 1,536 9.82 59.07 0.45 82.6
June 1,022,903 53,300 2.10 40.25 1.35 82.6 7,612 1,262 10.41 62.76 0.50 67.3July 1,155,747 60,545 2.11 40.30 1.28 80.1 9,030 1,466 11.83 72.83 0.51 59.3
August 1,254,473 65,150 2.11 40.61 1.32 86.6 9,118 1,492 9.46 57.81 0.51 62.6Sept 1,156,705 60,441 2.12 40.58 1.30 95.0 8,154 1,342 9.40 57.14 0.51 76.1
October 1,141,983 59,814 2.07 39.59 1.28 107.2 8,387 1,390 10.01 60.48 0.54 77.1November 1,097,110 57,377 2.08 39.83 1.29 116.3 9,715 1,599 10.09 61.31 0.50 87.0December 1,095,100 57,362 2.08 39.64 1.32 86.4 7,939 1,323 10.78 64.72 0.48 60.9
January 1,099,948 57,463 2.09 40.08 1.26 88.5 9,304 1,546 11.91 71.72 0.46 70.8February 997,916 52,098 2.07 39.58 1.30 106.1 6,122 1,015 11.61 70.06 0.49 59.5
March 966,998 50,174 2.08 40.17 1.35 100.2 11,990 2,018 11.62 69.01 0.54 111.4April 893,611 46,168 2.11 40.85 1.34 101.6 6,223 1,033 11.59 69.85 0.48 62.4May 948,234 49,206 2.13 41.01 1.33 94.5 6,485 1,082 W W 0.48 56.7
June 1,032,209 53,498 2.11 40.71 1.31 89.0 7,209 1,196 W W 0.47 63.4July 1,084,862 56,876 2.09 39.82 1.22 80.1 6,490 1,086 W W 0.48 54.9
August 1,174,972 61,268 2.08 39.85 1.29 91.4 6,872 1,137 W W 0.47 61.1Sept 1,005,155 52,845 2.03 38.55 1.24 94.6 6,394 1,061 W W 0.49 57.6
October 990,301 51,848 2.03 38.86 1.27 100.9 7,328 1,212 11.87 71.73 0.52 64.7November 976,444 51,520 2.04 38.67 1.26 98.7 9,313 1,541 12.29 74.29 0.47 85.9December 972,098 51,155 2.05 38.91 1.27 85.8 10,277 1,693 13.95 84.69 0.47 49.9
January 951,773 50,275 2.07 39.17 1.24 76.2 29,698 4,948 13.68 82.50 0.48 51.4February 850,365 44,662 2.07 39.43 1.26 95.0 10,931 1,797 12.60 76.83 0.47 117.8
March 940,506 48,770 2.04 39.42 1.33 106.7 7,265 1,210 W W 0.42 76.8April 819,193 42,660 2.07 39.76 1.32 102.2 6,190 1,020 13.71 83.21 0.41 61.5
2016 3,720,362 192,051 2.14 41.42 1.40 97.4 32,623 5,396 7.61 46.06 0.45 63.42017 3,958,473 205,902 2.09 40.15 1.31 98.3 33,639 5,612 11.69 70.10 0.50 76.32018 3,561,838 186,367 2.06 39.43 1.29 93.0 54,084 8,975 13.42 81.13 0.46 62.4
2017 12,754,384 664,621 2.10 40.27 1.32 94.1 102,826 17,023 10.70 64.67 0.50 72.42018 11,746,114 614,583 2.07 39.52 1.28 91.8 114,452 18,982 W W 0.47 61.4
Table 4.1. Receipts, Average Cost, and Quality of Fossil Fuels: Total (All Sectors), 2008 - April 2018Coal Petroleum Liquids
Receipts Average Cost Receipts Average Cost
Displayed values of zero may represent small values that round to zero.NM = Not meaningful due to large relative standard error or excessive percentage change.W = Withheld to avoid disclosure of individual company data.
Notes:Beginning in January 2013, the threshold for reporting fuel receipts data was changed from 50 megawatts to 200 megawatts of nameplate capacity for plants primarily fueled by natural gas, petroleum coke, distillate fuel oil, and residual fuel oil. In addition, the requirement to report self-produced and minor fuels, i.e., blast furnace gas, other manufactured gases, kerosene, jet fuel, propane, and waste oils was eliminated. The threshold for coal plants remained at 50 megawatts. The following caveats for each fuel type should be noted:COAL - includes anthracite, bituminous, subbituminous, lignite, waste coal, and coal-derived synthesis gas. Prior to 2011, synthesis gas was included in the category of Other Gases.PETROLEUM LIQUIDS - includes distillate fuel oil and residual fuel oil. Prior to 2013, petroleum liquids included distillate fuel oil, residual fuel oil, kerosene, jet fuel, waste oil, and, beginning in 2011, propane. Prior to 2011, propane was included in the category of Other Gases.
- Values for 2016 and prior years are final. Values for 2017 and 2018 are preliminary.- See Glossary for definitions.- Starting in January 2013, there may have been a shift in the continuity of Chapter 4 tables due to changes in the sample design of Form EIA-923 and the imputation process.- See the EIA-923 section of the Technical Notes for a discussion of the sample design for the Form EIA-923 and predecessor forms.- See the Technical Notes for fuel conversion factors.- Totals may not equal the sum of components because of independent rounding.
Sources: U.S. Energy Information Administration (EIA), Form EIA-923, "Power Plant Operations Report" and predecessor forms including Form EIA-423, "Monthly Cost and Quality of Fuels for Electric Plants Report" and Federal Energy Regulatory Commission (FERC), FERC Form 423, "Monthly Report of Cost and Quality of Fuels for Electric Plants."
Annual Totals
Year 2016
Year 2017
Year 2018
Year to Date
Rolling 12 Months Ending in April

6/19/2018 5:26:34 PM
All Fossil FuelsAverage Cost
Period
(BillionBtu)
(ThousandTons)
(Dollarsper
MMbtu)
(Dollarsper
Ton)
Average Sulfur Percent by
WeightPercentage ofConsumption
(BillionBtu)
(ThousandMcf)
(Dollarsper
MMBtu)
(Dollarsper
Mcf)Percentage ofConsumption
(Dollars per MMBtu)
2008 199,724 7,040 2.11 59.72 4.98 111.5 8,089,467 7,879,046 9.01 9.26 102.5 4.122009 197,921 6,954 1.61 45.89 4.63 119.3 8,319,329 8,118,550 4.74 4.86 102.3 3.042010 169,508 5,963 2.28 64.85 4.79 98.5 8,867,396 8,673,070 5.09 5.20 102.0 3.262011 171,100 5,980 3.03 86.78 5.01 98.2 9,250,652 9,056,164 4.72 4.83 103.8 3.292012 119,667 4,180 2.24 64.14 5.55 83.3 9,746,691 9,531,389 3.42 3.50 91.9 2.832013 132,474 4,660 2.18 61.95 5.41 73.5 8,721,114 8,503,424 4.33 4.44 89.7 3.092014 147,310 5,195 1.98 56.23 5.56 91.2 8,679,286 8,431,423 5.00 5.14 89.6 3.312015 138,668 4,897 1.84 52.11 5.25 94.4 10,173,502 9,842,581 3.23 3.34 89.9 2.652016 116,942 4,166 1.65 46.30 5.40 77.9 10,619,105 10,271,180 2.87 2.97 90.7 2.472017 92,837 3,309 W W 5.56 77.6 8,320,427 8,050,520 3.39 3.51 76.0 W
January 9,640 341 1.38 38.93 5.68 79.8 826,179 798,251 3.02 3.13 89.9 2.52February 11,273 408 1.30 35.80 5.53 96.1 736,278 711,506 2.70 2.79 89.6 2.36
March 10,313 363 1.41 40.14 5.33 81.1 797,607 771,918 2.23 2.30 90.4 2.21April 10,308 369 1.35 37.75 5.56 81.0 773,337 748,523 2.42 2.50 90.9 2.31May 8,554 307 1.32 36.76 5.35 65.8 857,644 830,896 2.39 2.47 91.1 2.31
June 6,895 240 1.41 40.48 4.67 50.1 1,020,410 988,673 2.67 2.75 91.4 2.39July 10,032 355 1.47 41.45 5.14 70.8 1,189,145 1,151,122 2.97 3.07 91.3 2.55
August 11,033 398 1.75 48.48 5.42 76.5 1,205,876 1,163,920 2.95 3.06 91.4 2.52Sept 10,741 381 2.07 58.30 5.17 84.6 968,648 935,630 3.07 3.18 91.1 2.55
October 8,844 317 1.98 55.43 5.69 92.5 795,915 770,111 3.13 3.23 90.3 2.51November 9,365 333 2.26 63.59 5.69 82.0 718,522 695,273 3.02 3.12 90.4 2.47December 9,945 355 2.07 57.94 5.43 82.3 729,545 705,358 3.96 4.10 89.9 2.82
January 7,058 251 2.14 60.16 5.67 58.6 605,951 585,551 4.13 4.28 76.5 2.82February 7,593 271 2.00 56.03 5.85 83.2 532,100 514,989 3.58 3.70 77.4 2.60
March 8,628 309 2.06 57.51 5.29 86.5 616,876 597,207 3.36 3.47 75.4 2.62April 5,835 208 2.00 55.96 5.34 93.7 576,199 557,617 3.38 3.49 76.3 2.62May 6,776 242 2.05 57.46 5.57 61.1 646,012 625,854 3.49 3.60 76.9 W
June 8,657 308 W W 5.55 71.2 762,486 737,993 3.30 3.41 76.5 WJuly 8,498 302 W W 5.50 73.3 928,993 898,085 3.22 3.33 75.4 W
August 7,972 284 W W 5.47 77.5 900,262 870,598 3.16 3.27 75.9 WSept 7,915 284 W W 5.43 84.2 759,416 733,714 3.20 3.31 75.6 W
October 8,347 297 W W 5.61 98.3 692,139 670,324 3.16 3.27 75.4 WNovember 7,469 266 W W 5.67 78.7 600,304 581,428 3.36 3.47 75.1 WDecember 8,088 287 2.17 60.99 5.74 82.6 699,688 677,158 3.63 3.75 75.9 2.75
January 7,009 248 2.38 67.41 5.31 60.1 778,041 753,163 5.03 5.19 82.0 3.50February 7,769 277 2.43 68.09 5.49 83.0 688,537 667,090 3.61 3.72 85.6 2.79
March 7,841 281 2.54 70.89 5.54 99.3 748,917 724,656 3.18 3.29 84.6 WApril 6,564 232 2.56 72.38 6.09 78.4 705,836 684,139 3.13 3.23 83.5 2.58
2016 41,534 1,481 1.36 38.07 5.52 84.4 3,133,401 3,030,198 2.60 2.68 90.2 2.362017 29,115 1,039 2.05 57.45 5.54 77.9 2,331,127 2,255,365 3.61 3.74 76.4 2.672018 29,182 1,038 2.48 69.65 5.60 78.3 2,921,331 2,829,047 3.77 3.89 83.8 2.88
2017 104,523 3,725 1.88 52.68 5.39 75.5 9,816,832 9,496,346 3.14 3.25 87.0 2.562018 92,904 3,308 W W 5.58 77.7 8,910,631 8,624,203 3.45 3.57 78.3 W
Table 4.1. Receipts, Average Cost, and Quality of Fossil Fuels: Total (All Sectors), 2008 - April 2018 (continued)
Petroleum Coke Natural GasReceipts Average Cost Receipts Average Cost
Displayed values of zero may represent small values that round to zero.NM = Not meaningful due to large relative standard error or excessive percentage change.W = Withheld to avoid disclosure of individual company data.
Notes:Beginning in January 2013, the threshold for reporting fuel receipts data was changed from 50 megawatts to 200 megawatts of nameplate capacity for plants primarily fueled by natural gas, petroleum coke, distillate fuel oil, and residual fuel oil. In addition, the requirement to report self-produced and minor fuels, i.e., blast furnace gas, other manufactured gases, kerosene, jet fuel, propane, and waste oils was eliminated. The threshold for coal plants remained at 50 megawatts. The following caveats for each fuel type should be noted:PETROLEUM COKE - includes petroleum coke-derived synthesis gas. Prior to 2011, petroleum coke-derived synthesis gas was included in Other Gases.NATURAL GAS - includes natural gas only. Prior to 2011, includes Other Gases.
- Values for 2016 and prior years are final. Values for 2017 and 2018 are preliminary.- See Glossary for definitions.- Starting in January 2013, there may have been a shift in the continuity of Chapter 4 tables due to changes in the sample design of Form EIA-923 and the imputation process.- See the EIA-923 section of the Technical Notes for a discussion of the sample design for the Form EIA-923 and predecessor forms.- See the Technical Notes for fuel conversion factors.- Totals may not equal the sum of components because of independent rounding.
Sources: U.S. Energy Information Administration (EIA), Form EIA-923, "Power Plant Operations Report" and predecessor forms including Form EIA-423, "Monthly Cost and Quality of Fuels for Electric Plants Report" and Federal Energy Regulatory Commission (FERC), FERC Form 423, "Monthly Report of Cost and Quality of Fuels for Electric Plants."
Annual Totals
Year 2016
Year 2017
Year 2018
Year to Date
Rolling 12 Months Ending in April
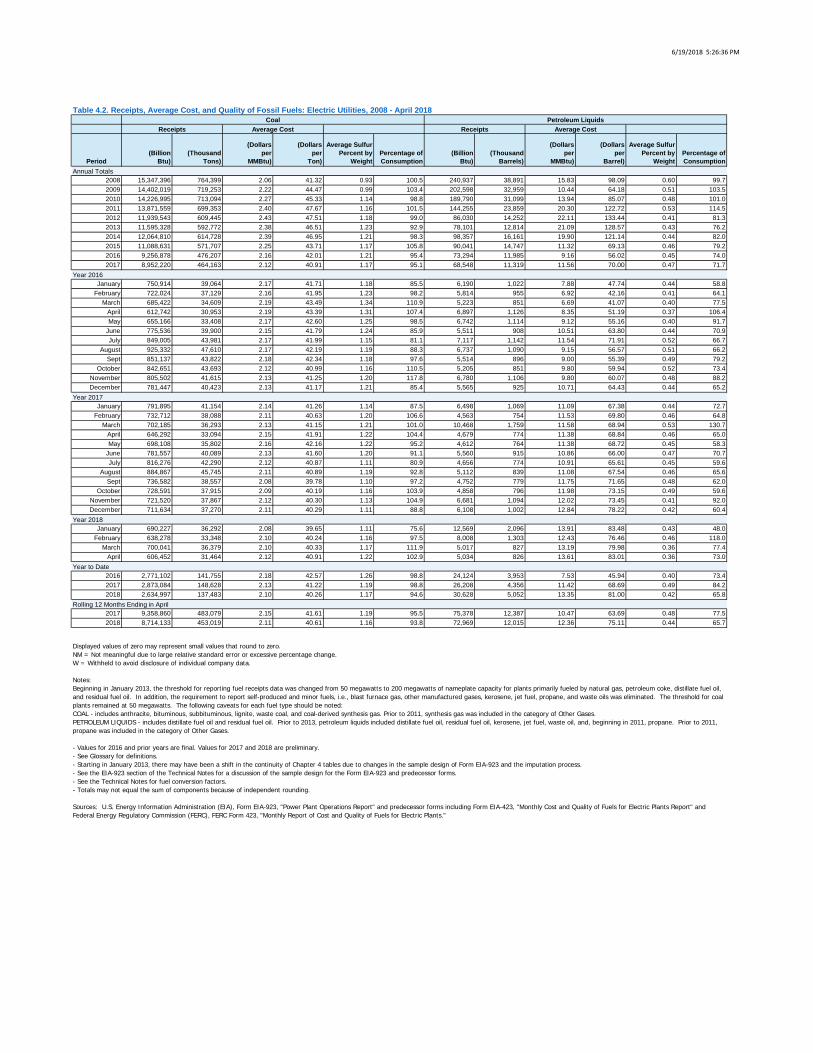
6/19/2018 5:26:36 PM
Period
(BillionBtu)
(ThousandTons)
(Dollarsper
MMBtu)
(Dollarsper
Ton)
Average Sulfur Percent by
WeightPercentage ofConsumption
(BillionBtu)
(ThousandBarrels)
(Dollarsper
MMBtu)
(Dollarsper
Barrel)
Average Sulfur Percent by
WeightPercentage ofConsumption
2008 15,347,396 764,399 2.06 41.32 0.93 100.5 240,937 38,891 15.83 98.09 0.60 99.72009 14,402,019 719,253 2.22 44.47 0.99 103.4 202,598 32,959 10.44 64.18 0.51 103.52010 14,226,995 713,094 2.27 45.33 1.14 98.8 189,790 31,099 13.94 85.07 0.48 101.02011 13,871,559 699,353 2.40 47.67 1.16 101.5 144,255 23,859 20.30 122.72 0.53 114.52012 11,939,543 609,445 2.43 47.51 1.18 99.0 86,030 14,252 22.11 133.44 0.41 81.32013 11,595,328 592,772 2.38 46.51 1.23 92.9 78,101 12,814 21.09 128.57 0.43 76.22014 12,064,810 614,728 2.39 46.95 1.21 98.3 98,357 16,161 19.90 121.14 0.44 82.02015 11,088,631 571,707 2.25 43.71 1.17 105.8 90,041 14,747 11.32 69.13 0.46 79.22016 9,256,878 476,207 2.16 42.01 1.21 95.4 73,294 11,985 9.16 56.02 0.45 74.02017 8,952,220 464,163 2.12 40.91 1.17 95.1 68,548 11,319 11.56 70.00 0.47 71.7
January 750,914 39,064 2.17 41.71 1.18 85.5 6,190 1,022 7.88 47.74 0.44 58.8February 722,024 37,129 2.16 41.95 1.23 98.2 5,814 955 6.92 42.16 0.41 64.1
March 685,422 34,609 2.19 43.49 1.34 110.9 5,223 851 6.69 41.07 0.40 77.5April 612,742 30,953 2.19 43.39 1.31 107.4 6,897 1,126 8.35 51.19 0.37 106.4May 655,166 33,408 2.17 42.60 1.25 98.5 6,742 1,114 9.12 55.16 0.40 91.7
June 775,536 39,900 2.15 41.79 1.24 85.9 5,511 908 10.51 63.80 0.44 70.9July 849,005 43,981 2.17 41.99 1.15 81.1 7,117 1,142 11.54 71.91 0.52 66.7
August 925,332 47,610 2.17 42.19 1.19 88.3 6,737 1,090 9.15 56.57 0.51 66.2Sept 851,137 43,822 2.18 42.34 1.18 97.6 5,514 896 9.00 55.39 0.49 79.2
October 842,651 43,693 2.12 40.99 1.16 110.5 5,205 851 9.80 59.94 0.52 73.4November 805,502 41,615 2.13 41.25 1.20 117.8 6,780 1,106 9.80 60.07 0.48 88.2December 781,447 40,423 2.13 41.17 1.21 85.4 5,565 925 10.71 64.43 0.44 65.2
January 791,895 41,154 2.14 41.26 1.14 87.5 6,498 1,069 11.09 67.38 0.44 72.7February 732,712 38,088 2.11 40.63 1.20 106.6 4,563 754 11.53 69.80 0.46 64.8
March 702,185 36,293 2.13 41.15 1.21 101.0 10,468 1,759 11.58 68.94 0.53 130.7April 646,292 33,094 2.15 41.91 1.22 104.4 4,679 774 11.38 68.84 0.46 65.0May 698,108 35,802 2.16 42.16 1.22 95.2 4,612 764 11.38 68.72 0.45 58.3
June 781,557 40,089 2.13 41.60 1.20 91.1 5,560 915 10.86 66.00 0.47 70.7July 816,276 42,290 2.12 40.87 1.11 80.9 4,656 774 10.91 65.61 0.45 59.6
August 884,867 45,745 2.11 40.89 1.19 92.8 5,112 839 11.08 67.54 0.46 65.6Sept 736,582 38,557 2.08 39.78 1.10 97.2 4,752 779 11.75 71.65 0.48 62.0
October 728,591 37,915 2.09 40.19 1.16 103.9 4,858 796 11.98 73.15 0.49 59.6November 721,520 37,867 2.12 40.30 1.13 104.9 6,681 1,094 12.02 73.45 0.41 92.0December 711,634 37,270 2.11 40.29 1.11 88.8 6,108 1,002 12.84 78.22 0.42 60.4
January 690,227 36,292 2.08 39.65 1.11 75.6 12,569 2,096 13.91 83.48 0.43 48.0February 638,278 33,348 2.10 40.24 1.16 97.5 8,008 1,303 12.43 76.46 0.46 118.0
March 700,041 36,379 2.10 40.33 1.17 111.9 5,017 827 13.19 79.98 0.36 77.4April 606,452 31,464 2.12 40.91 1.22 102.9 5,034 826 13.61 83.01 0.36 73.0
2016 2,771,102 141,755 2.18 42.57 1.26 98.8 24,124 3,953 7.53 45.94 0.40 73.42017 2,873,084 148,628 2.13 41.22 1.19 98.8 26,208 4,356 11.42 68.69 0.49 84.22018 2,634,997 137,483 2.10 40.26 1.17 94.6 30,628 5,052 13.35 81.00 0.42 65.8
2017 9,358,860 483,079 2.15 41.61 1.19 95.5 75,378 12,387 10.47 63.69 0.48 77.52018 8,714,133 453,019 2.11 40.61 1.16 93.8 72,969 12,015 12.36 75.11 0.44 65.7
Table 4.2. Receipts, Average Cost, and Quality of Fossil Fuels: Electric Utilities, 2008 - April 2018Coal Petroleum Liquids
Receipts Average Cost Receipts Average Cost
Displayed values of zero may represent small values that round to zero.NM = Not meaningful due to large relative standard error or excessive percentage change.W = Withheld to avoid disclosure of individual company data.
Notes:Beginning in January 2013, the threshold for reporting fuel receipts data was changed from 50 megawatts to 200 megawatts of nameplate capacity for plants primarily fueled by natural gas, petroleum coke, distillate fuel oil, and residual fuel oil. In addition, the requirement to report self-produced and minor fuels, i.e., blast furnace gas, other manufactured gases, kerosene, jet fuel, propane, and waste oils was eliminated. The threshold for coal plants remained at 50 megawatts. The following caveats for each fuel type should be noted:COAL - includes anthracite, bituminous, subbituminous, lignite, waste coal, and coal-derived synthesis gas. Prior to 2011, synthesis gas was included in the category of Other Gases.PETROLEUM LIQUIDS - includes distillate fuel oil and residual fuel oil. Prior to 2013, petroleum liquids included distillate fuel oil, residual fuel oil, kerosene, jet fuel, waste oil, and, beginning in 2011, propane. Prior to 2011, propane was included in the category of Other Gases.
- Values for 2016 and prior years are final. Values for 2017 and 2018 are preliminary.- See Glossary for definitions.- Starting in January 2013, there may have been a shift in the continuity of Chapter 4 tables due to changes in the sample design of Form EIA-923 and the imputation process.- See the EIA-923 section of the Technical Notes for a discussion of the sample design for the Form EIA-923 and predecessor forms.- See the Technical Notes for fuel conversion factors.- Totals may not equal the sum of components because of independent rounding.
Sources: U.S. Energy Information Administration (EIA), Form EIA-923, "Power Plant Operations Report" and predecessor forms including Form EIA-423, "Monthly Cost and Quality of Fuels for Electric Plants Report" and Federal Energy Regulatory Commission (FERC), FERC Form 423, "Monthly Report of Cost and Quality of Fuels for Electric Plants."
Annual Totals
Year 2016
Year 2017
Year 2018
Year to Date
Rolling 12 Months Ending in April
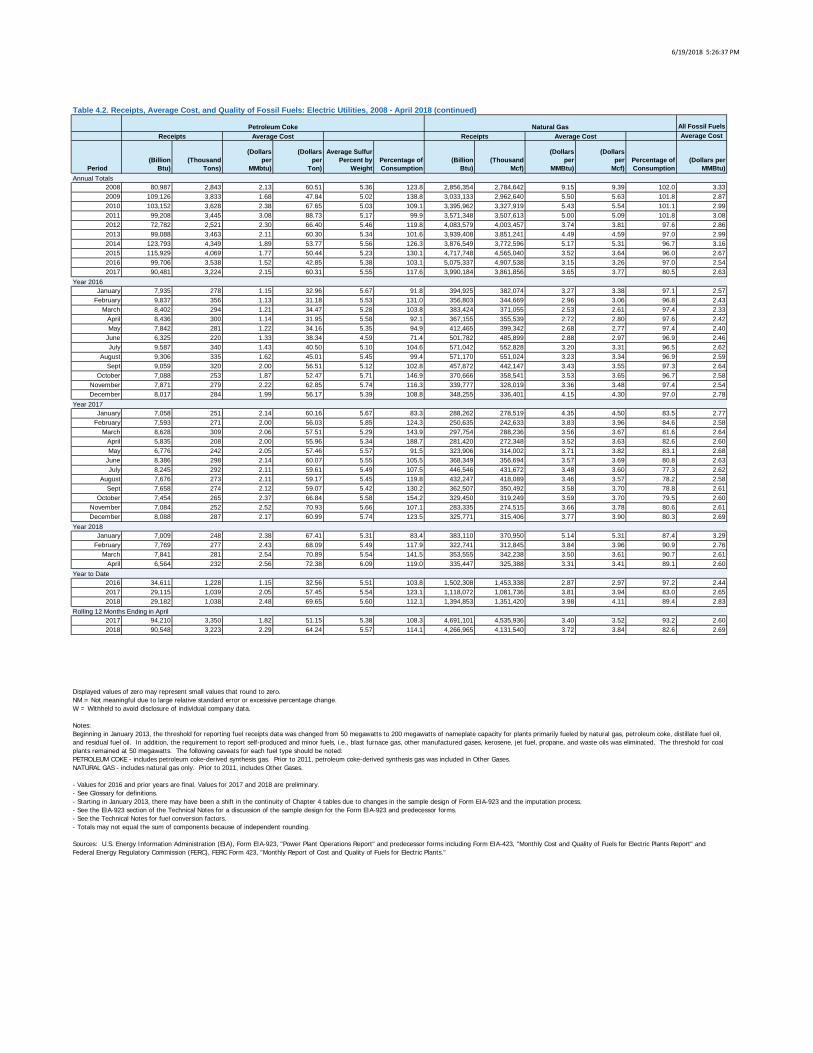
6/19/2018 5:26:37 PM
All Fossil FuelsAverage Cost
Period
(BillionBtu)
(ThousandTons)
(Dollarsper
MMbtu)
(Dollarsper
Ton)
Average Sulfur Percent by
WeightPercentage ofConsumption
(BillionBtu)
(ThousandMcf)
(Dollarsper
MMBtu)
(Dollarsper
Mcf)Percentage ofConsumption
(Dollars per MMBtu)
2008 80,987 2,843 2.13 60.51 5.36 123.8 2,856,354 2,784,642 9.15 9.39 102.0 3.332009 109,126 3,833 1.68 47.84 5.02 138.8 3,033,133 2,962,640 5.50 5.63 101.8 2.872010 103,152 3,628 2.38 67.65 5.03 109.1 3,395,962 3,327,919 5.43 5.54 101.1 2.992011 99,208 3,445 3.08 88.73 5.17 99.9 3,571,348 3,507,613 5.00 5.09 101.8 3.082012 72,782 2,521 2.30 66.40 5.46 119.8 4,083,579 4,003,457 3.74 3.81 97.6 2.862013 99,088 3,463 2.11 60.30 5.34 101.6 3,939,408 3,851,241 4.49 4.59 97.0 2.992014 123,793 4,349 1.89 53.77 5.56 126.3 3,876,549 3,772,596 5.17 5.31 96.7 3.162015 115,929 4,069 1.77 50.44 5.23 130.1 4,717,748 4,565,040 3.52 3.64 96.0 2.672016 99,706 3,538 1.52 42.85 5.38 103.1 5,075,337 4,907,538 3.15 3.26 97.0 2.542017 90,481 3,224 2.15 60.31 5.55 117.6 3,990,184 3,861,856 3.65 3.77 80.5 2.63
January 7,935 278 1.15 32.96 5.67 91.8 394,925 382,074 3.27 3.38 97.1 2.57February 9,837 356 1.13 31.18 5.53 131.0 356,803 344,669 2.96 3.06 96.8 2.43
March 8,402 294 1.21 34.47 5.28 103.8 383,424 371,055 2.53 2.61 97.4 2.33April 8,436 300 1.14 31.95 5.58 92.1 367,155 355,539 2.72 2.80 97.6 2.42May 7,842 281 1.22 34.16 5.35 94.9 412,465 399,342 2.68 2.77 97.4 2.40
June 6,325 220 1.33 38.34 4.59 71.4 501,782 485,899 2.88 2.97 96.9 2.46July 9,587 340 1.43 40.50 5.10 104.6 571,042 552,828 3.20 3.31 96.5 2.62
August 9,306 335 1.62 45.01 5.45 99.4 571,170 551,024 3.23 3.34 96.9 2.59Sept 9,059 320 2.00 56.51 5.12 102.8 457,872 442,147 3.43 3.55 97.3 2.64
October 7,088 253 1.87 52.47 5.71 146.9 370,666 358,541 3.53 3.65 96.7 2.58November 7,871 279 2.22 62.85 5.74 116.3 339,777 328,019 3.36 3.48 97.4 2.54December 8,017 284 1.99 56.17 5.39 108.8 348,255 336,401 4.15 4.30 97.0 2.78
January 7,058 251 2.14 60.16 5.67 83.3 288,262 278,519 4.35 4.50 83.5 2.77February 7,593 271 2.00 56.03 5.85 124.3 250,635 242,633 3.83 3.96 84.6 2.58
March 8,628 309 2.06 57.51 5.29 143.9 297,754 288,236 3.56 3.67 81.6 2.64April 5,835 208 2.00 55.96 5.34 188.7 281,420 272,348 3.52 3.63 82.6 2.60May 6,776 242 2.05 57.46 5.57 91.5 323,906 314,002 3.71 3.82 83.1 2.68
June 8,386 298 2.14 60.07 5.55 105.5 368,349 356,694 3.57 3.69 80.8 2.63July 8,245 292 2.11 59.61 5.49 107.5 446,546 431,672 3.48 3.60 77.3 2.62
August 7,676 273 2.11 59.17 5.45 119.8 432,247 418,089 3.46 3.57 78.2 2.58Sept 7,658 274 2.12 59.07 5.42 130.2 362,507 350,492 3.58 3.70 78.8 2.61
October 7,454 265 2.37 66.84 5.58 154.2 329,450 319,249 3.59 3.70 79.5 2.60November 7,084 252 2.52 70.93 5.66 107.1 283,335 274,515 3.66 3.78 80.6 2.61December 8,088 287 2.17 60.99 5.74 123.5 325,771 315,406 3.77 3.90 80.3 2.69
January 7,009 248 2.38 67.41 5.31 83.4 383,110 370,950 5.14 5.31 87.4 3.29February 7,769 277 2.43 68.09 5.49 117.9 322,741 312,845 3.84 3.96 90.9 2.76
March 7,841 281 2.54 70.89 5.54 141.5 353,555 342,238 3.50 3.61 90.7 2.61April 6,564 232 2.56 72.38 6.09 119.0 335,447 325,388 3.31 3.41 89.1 2.60
2016 34,611 1,228 1.15 32.56 5.51 103.8 1,502,308 1,453,338 2.87 2.97 97.2 2.442017 29,115 1,039 2.05 57.45 5.54 123.1 1,118,072 1,081,736 3.81 3.94 83.0 2.652018 29,182 1,038 2.48 69.65 5.60 112.1 1,394,853 1,351,420 3.98 4.11 89.4 2.83
2017 94,210 3,350 1.82 51.15 5.38 108.3 4,691,101 4,535,936 3.40 3.52 93.2 2.602018 90,548 3,223 2.29 64.24 5.57 114.1 4,266,965 4,131,540 3.72 3.84 82.6 2.69
Table 4.2. Receipts, Average Cost, and Quality of Fossil Fuels: Electric Utilities, 2008 - April 2018 (continued)
Petroleum Coke Natural GasReceipts Average Cost Receipts Average Cost
Displayed values of zero may represent small values that round to zero.NM = Not meaningful due to large relative standard error or excessive percentage change.W = Withheld to avoid disclosure of individual company data.
Notes:Beginning in January 2013, the threshold for reporting fuel receipts data was changed from 50 megawatts to 200 megawatts of nameplate capacity for plants primarily fueled by natural gas, petroleum coke, distillate fuel oil, and residual fuel oil. In addition, the requirement to report self-produced and minor fuels, i.e., blast furnace gas, other manufactured gases, kerosene, jet fuel, propane, and waste oils was eliminated. The threshold for coal plants remained at 50 megawatts. The following caveats for each fuel type should be noted:PETROLEUM COKE - includes petroleum coke-derived synthesis gas. Prior to 2011, petroleum coke-derived synthesis gas was included in Other Gases.NATURAL GAS - includes natural gas only. Prior to 2011, includes Other Gases.
- Values for 2016 and prior years are final. Values for 2017 and 2018 are preliminary.- See Glossary for definitions.- Starting in January 2013, there may have been a shift in the continuity of Chapter 4 tables due to changes in the sample design of Form EIA-923 and the imputation process.- See the EIA-923 section of the Technical Notes for a discussion of the sample design for the Form EIA-923 and predecessor forms.- See the Technical Notes for fuel conversion factors.- Totals may not equal the sum of components because of independent rounding.
Sources: U.S. Energy Information Administration (EIA), Form EIA-923, "Power Plant Operations Report" and predecessor forms including Form EIA-423, "Monthly Cost and Quality of Fuels for Electric Plants Report" and Federal Energy Regulatory Commission (FERC), FERC Form 423, "Monthly Report of Cost and Quality of Fuels for Electric Plants."
Annual Totals
Year 2016
Year 2017
Year 2018
Year to Date
Rolling 12 Months Ending in April
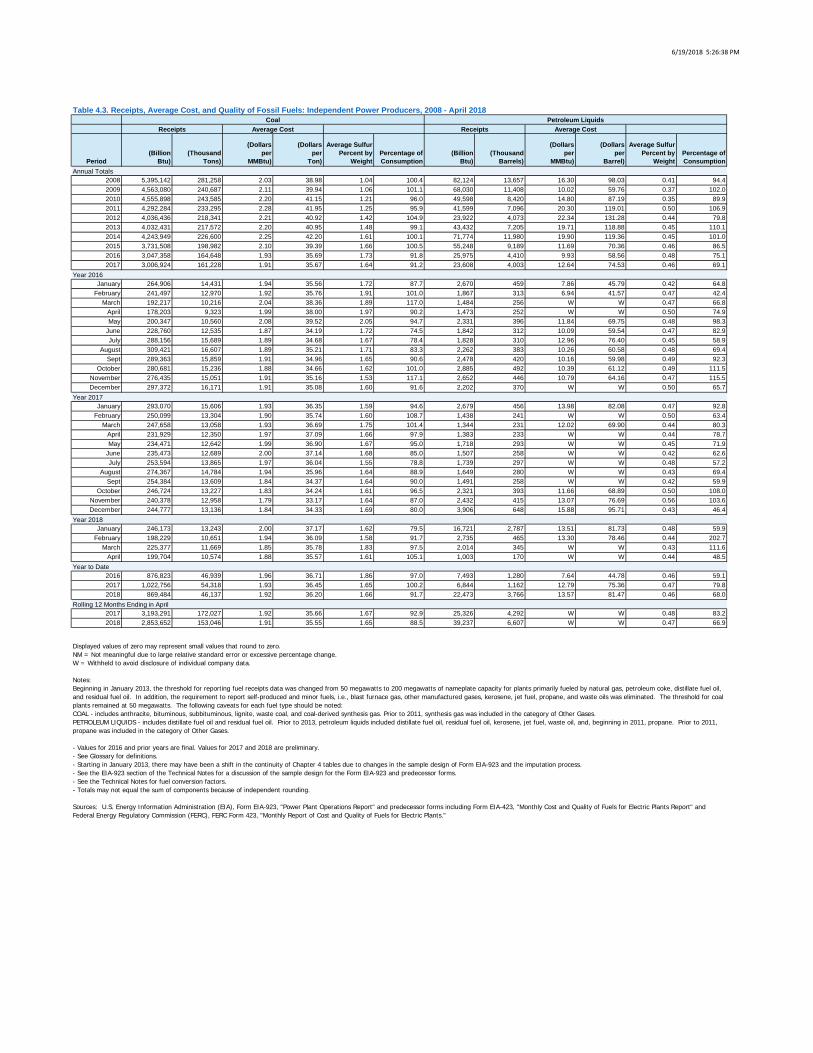
6/19/2018 5:26:38 PM
Period
(BillionBtu)
(ThousandTons)
(Dollarsper
MMBtu)
(Dollarsper
Ton)
Average Sulfur Percent by
WeightPercentage ofConsumption
(BillionBtu)
(ThousandBarrels)
(Dollarsper
MMBtu)
(Dollarsper
Barrel)
Average Sulfur Percent by
WeightPercentage ofConsumption
2008 5,395,142 281,258 2.03 38.98 1.04 100.4 82,124 13,657 16.30 98.03 0.41 94.42009 4,563,080 240,687 2.11 39.94 1.06 101.1 68,030 11,408 10.02 59.76 0.37 102.02010 4,555,898 243,585 2.20 41.15 1.21 96.0 49,598 8,420 14.80 87.19 0.35 89.92011 4,292,284 233,295 2.28 41.95 1.25 95.9 41,599 7,096 20.30 119.01 0.50 106.92012 4,036,436 218,341 2.21 40.92 1.42 104.9 23,922 4,073 22.34 131.28 0.44 79.82013 4,032,431 217,572 2.20 40.95 1.48 99.1 43,432 7,205 19.71 118.88 0.45 110.12014 4,243,949 226,600 2.25 42.20 1.61 100.1 71,774 11,980 19.90 119.36 0.45 101.02015 3,731,508 198,982 2.10 39.39 1.66 100.5 55,248 9,189 11.69 70.36 0.46 86.52016 3,047,358 164,648 1.93 35.69 1.73 91.8 25,975 4,410 9.93 58.56 0.48 75.12017 3,006,924 161,228 1.91 35.67 1.64 91.2 23,608 4,003 12.64 74.53 0.46 69.1
January 264,906 14,431 1.94 35.56 1.72 87.7 2,670 459 7.86 45.79 0.42 64.8February 241,497 12,970 1.92 35.76 1.91 101.0 1,867 313 6.94 41.57 0.47 42.4
March 192,217 10,216 2.04 38.36 1.89 117.0 1,484 256 W W 0.47 66.8April 178,203 9,323 1.99 38.00 1.97 90.2 1,473 252 W W 0.50 74.9May 200,347 10,560 2.08 39.52 2.05 94.7 2,331 396 11.84 69.75 0.48 98.3
June 228,760 12,535 1.87 34.19 1.72 74.5 1,842 312 10.09 59.54 0.47 82.9July 288,156 15,689 1.89 34.68 1.67 78.4 1,828 310 12.96 76.40 0.45 58.9
August 309,421 16,607 1.89 35.21 1.71 83.3 2,262 383 10.26 60.58 0.48 69.4Sept 289,363 15,859 1.91 34.96 1.65 90.6 2,478 420 10.16 59.98 0.49 92.3
October 280,681 15,236 1.88 34.66 1.62 101.0 2,885 492 10.39 61.12 0.49 111.5November 276,435 15,051 1.91 35.16 1.53 117.1 2,652 446 10.79 64.16 0.47 115.5December 297,372 16,171 1.91 35.08 1.60 91.6 2,202 370 W W 0.50 65.7
January 293,070 15,606 1.93 36.35 1.59 94.6 2,679 456 13.98 82.08 0.47 92.8February 250,099 13,304 1.90 35.74 1.60 108.7 1,438 241 W W 0.50 63.4
March 247,658 13,058 1.93 36.69 1.75 101.4 1,344 231 12.02 69.90 0.44 80.3April 231,929 12,350 1.97 37.09 1.66 97.9 1,383 233 W W 0.44 78.7May 234,471 12,642 1.99 36.90 1.67 95.0 1,718 293 W W 0.45 71.9
June 235,473 12,689 2.00 37.14 1.68 85.0 1,507 258 W W 0.42 62.6July 253,594 13,865 1.97 36.04 1.55 78.8 1,739 297 W W 0.48 57.2
August 274,367 14,784 1.94 35.96 1.64 88.9 1,649 280 W W 0.43 69.4Sept 254,384 13,609 1.84 34.37 1.64 90.0 1,491 258 W W 0.42 59.9
October 246,724 13,227 1.83 34.24 1.61 96.5 2,321 393 11.66 68.89 0.50 108.0November 240,378 12,958 1.79 33.17 1.64 87.0 2,432 415 13.07 76.69 0.56 103.6December 244,777 13,136 1.84 34.33 1.69 80.0 3,906 648 15.88 95.71 0.43 46.4
January 246,173 13,243 2.00 37.17 1.62 79.5 16,721 2,787 13.51 81.73 0.48 59.9February 198,229 10,651 1.94 36.09 1.58 91.7 2,735 465 13.30 78.46 0.44 202.7
March 225,377 11,669 1.85 35.78 1.83 97.5 2,014 345 W W 0.43 111.6April 199,704 10,574 1.88 35.57 1.61 105.1 1,003 170 W W 0.44 48.5
2016 876,823 46,939 1.96 36.71 1.86 97.0 7,493 1,280 7.64 44.78 0.46 59.12017 1,022,756 54,318 1.93 36.45 1.65 100.2 6,844 1,162 12.79 75.36 0.47 79.82018 869,484 46,137 1.92 36.20 1.66 91.7 22,473 3,766 13.57 81.47 0.46 68.0
2017 3,193,291 172,027 1.92 35.66 1.67 92.9 25,326 4,292 W W 0.48 83.22018 2,853,652 153,046 1.91 35.55 1.65 88.5 39,237 6,607 W W 0.47 66.9
Table 4.3. Receipts, Average Cost, and Quality of Fossil Fuels: Independent Power Producers, 2008 - April 2018Coal Petroleum Liquids
Receipts Average Cost Receipts Average Cost
Displayed values of zero may represent small values that round to zero.NM = Not meaningful due to large relative standard error or excessive percentage change.W = Withheld to avoid disclosure of individual company data.
Notes:Beginning in January 2013, the threshold for reporting fuel receipts data was changed from 50 megawatts to 200 megawatts of nameplate capacity for plants primarily fueled by natural gas, petroleum coke, distillate fuel oil, and residual fuel oil. In addition, the requirement to report self-produced and minor fuels, i.e., blast furnace gas, other manufactured gases, kerosene, jet fuel, propane, and waste oils was eliminated. The threshold for coal plants remained at 50 megawatts. The following caveats for each fuel type should be noted:COAL - includes anthracite, bituminous, subbituminous, lignite, waste coal, and coal-derived synthesis gas. Prior to 2011, synthesis gas was included in the category of Other Gases.PETROLEUM LIQUIDS - includes distillate fuel oil and residual fuel oil. Prior to 2013, petroleum liquids included distillate fuel oil, residual fuel oil, kerosene, jet fuel, waste oil, and, beginning in 2011, propane. Prior to 2011, propane was included in the category of Other Gases.
- Values for 2016 and prior years are final. Values for 2017 and 2018 are preliminary.- See Glossary for definitions.- Starting in January 2013, there may have been a shift in the continuity of Chapter 4 tables due to changes in the sample design of Form EIA-923 and the imputation process.- See the EIA-923 section of the Technical Notes for a discussion of the sample design for the Form EIA-923 and predecessor forms.- See the Technical Notes for fuel conversion factors.- Totals may not equal the sum of components because of independent rounding.
Sources: U.S. Energy Information Administration (EIA), Form EIA-923, "Power Plant Operations Report" and predecessor forms including Form EIA-423, "Monthly Cost and Quality of Fuels for Electric Plants Report" and Federal Energy Regulatory Commission (FERC), FERC Form 423, "Monthly Report of Cost and Quality of Fuels for Electric Plants."
Annual Totals
Year 2016
Year 2017
Year 2018
Year to Date
Rolling 12 Months Ending in April
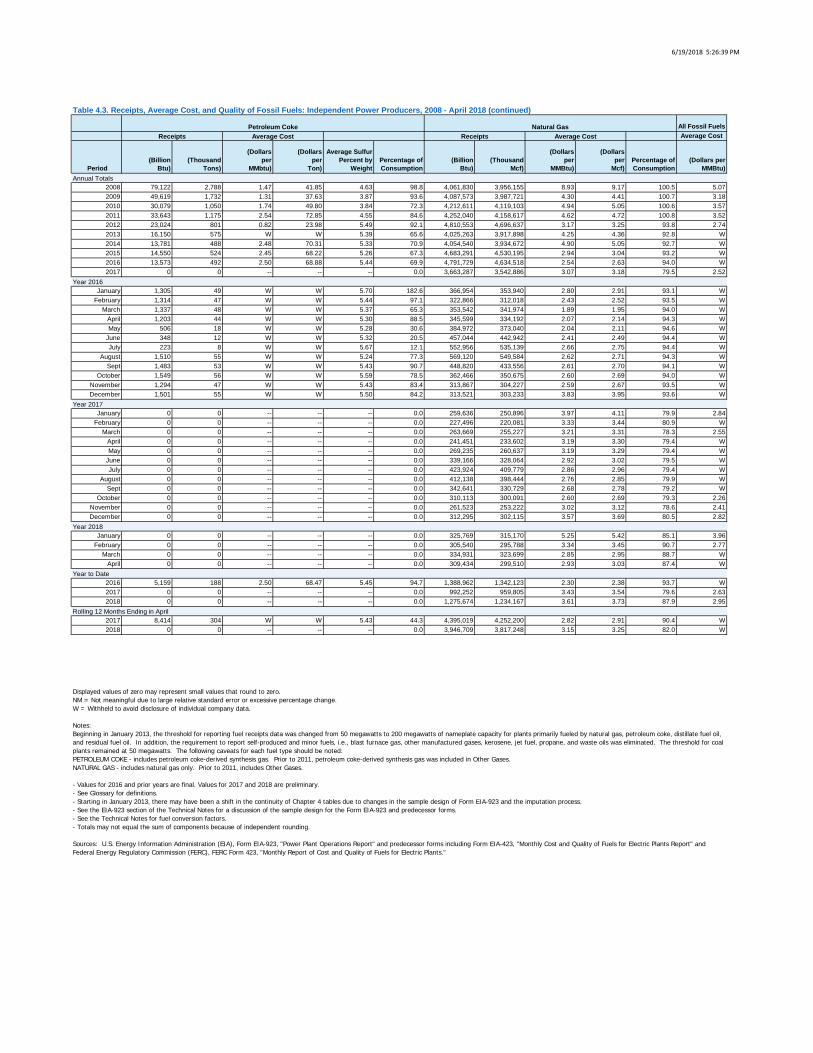
6/19/2018 5:26:39 PM
All Fossil FuelsAverage Cost
Period
(BillionBtu)
(ThousandTons)
(Dollarsper
MMbtu)
(Dollarsper
Ton)
Average Sulfur Percent by
WeightPercentage ofConsumption
(BillionBtu)
(ThousandMcf)
(Dollarsper
MMBtu)
(Dollarsper
Mcf)Percentage ofConsumption
(Dollars per MMBtu)
2008 79,122 2,788 1.47 41.85 4.63 98.8 4,061,830 3,956,155 8.93 9.17 100.5 5.072009 49,619 1,732 1.31 37.63 3.87 93.6 4,087,573 3,987,721 4.30 4.41 100.7 3.182010 30,079 1,050 1.74 49.80 3.84 72.3 4,212,611 4,119,103 4.94 5.05 100.6 3.572011 33,643 1,175 2.54 72.85 4.55 84.6 4,252,040 4,158,617 4.62 4.72 100.8 3.522012 23,024 801 0.82 23.98 5.49 92.1 4,810,553 4,696,637 3.17 3.25 93.8 2.742013 16,150 575 W W 5.39 65.6 4,025,263 3,917,898 4.25 4.36 92.8 W2014 13,781 488 2.48 70.31 5.33 70.9 4,054,540 3,934,672 4.90 5.05 92.7 W2015 14,550 524 2.45 68.22 5.26 67.3 4,683,291 4,530,195 2.94 3.04 93.2 W2016 13,573 492 2.50 68.88 5.44 69.9 4,791,729 4,634,518 2.54 2.63 94.0 W2017 0 0 -- -- -- 0.0 3,663,287 3,542,886 3.07 3.18 79.5 2.52
January 1,305 49 W W 5.70 182.6 366,954 353,940 2.80 2.91 93.1 WFebruary 1,314 47 W W 5.44 97.1 322,866 312,018 2.43 2.52 93.5 W
March 1,337 48 W W 5.37 65.3 353,542 341,974 1.89 1.95 94.0 WApril 1,203 44 W W 5.30 88.5 345,599 334,192 2.07 2.14 94.3 WMay 506 18 W W 5.28 30.6 384,972 373,040 2.04 2.11 94.6 W
June 348 12 W W 5.32 20.5 457,044 442,942 2.41 2.49 94.4 WJuly 223 8 W W 5.67 12.1 552,956 535,139 2.66 2.75 94.4 W
August 1,510 55 W W 5.24 77.3 569,120 549,584 2.62 2.71 94.3 WSept 1,483 53 W W 5.43 90.7 448,820 433,556 2.61 2.70 94.1 W
October 1,549 56 W W 5.59 78.5 362,466 350,675 2.60 2.69 94.0 WNovember 1,294 47 W W 5.43 83.4 313,867 304,227 2.59 2.67 93.5 WDecember 1,501 55 W W 5.50 84.2 313,521 303,233 3.83 3.95 93.6 W
January 0 0 -- -- -- 0.0 259,636 250,896 3.97 4.11 79.9 2.84February 0 0 -- -- -- 0.0 227,496 220,081 3.33 3.44 80.9 W
March 0 0 -- -- -- 0.0 263,669 255,227 3.21 3.31 78.3 2.55April 0 0 -- -- -- 0.0 241,451 233,602 3.19 3.30 79.4 WMay 0 0 -- -- -- 0.0 269,235 260,637 3.19 3.29 79.4 W
June 0 0 -- -- -- 0.0 339,166 328,064 2.92 3.02 79.5 WJuly 0 0 -- -- -- 0.0 423,924 409,779 2.86 2.96 79.4 W
August 0 0 -- -- -- 0.0 412,138 398,444 2.76 2.85 79.9 WSept 0 0 -- -- -- 0.0 342,641 330,729 2.68 2.78 79.2 W
October 0 0 -- -- -- 0.0 310,113 300,091 2.60 2.69 79.3 2.26November 0 0 -- -- -- 0.0 261,523 253,222 3.02 3.12 78.6 2.41December 0 0 -- -- -- 0.0 312,295 302,115 3.57 3.69 80.5 2.82
January 0 0 -- -- -- 0.0 325,769 315,170 5.25 5.42 85.1 3.96February 0 0 -- -- -- 0.0 305,540 295,788 3.34 3.45 90.7 2.77
March 0 0 -- -- -- 0.0 334,931 323,699 2.85 2.95 88.7 WApril 0 0 -- -- -- 0.0 309,434 299,510 2.93 3.03 87.4 W
2016 5,159 188 2.50 68.47 5.45 94.7 1,388,962 1,342,123 2.30 2.38 93.7 W2017 0 0 -- -- -- 0.0 992,252 959,805 3.43 3.54 79.6 2.632018 0 0 -- -- -- 0.0 1,275,674 1,234,167 3.61 3.73 87.9 2.95
2017 8,414 304 W W 5.43 44.3 4,395,019 4,252,200 2.82 2.91 90.4 W2018 0 0 -- -- -- 0.0 3,946,709 3,817,248 3.15 3.25 82.0 W
Table 4.3. Receipts, Average Cost, and Quality of Fossil Fuels: Independent Power Producers, 2008 - April 2018 (continued)
Petroleum Coke Natural GasReceipts Average Cost Receipts Average Cost
Displayed values of zero may represent small values that round to zero.NM = Not meaningful due to large relative standard error or excessive percentage change.W = Withheld to avoid disclosure of individual company data.
Notes:Beginning in January 2013, the threshold for reporting fuel receipts data was changed from 50 megawatts to 200 megawatts of nameplate capacity for plants primarily fueled by natural gas, petroleum coke, distillate fuel oil, and residual fuel oil. In addition, the requirement to report self-produced and minor fuels, i.e., blast furnace gas, other manufactured gases, kerosene, jet fuel, propane, and waste oils was eliminated. The threshold for coal plants remained at 50 megawatts. The following caveats for each fuel type should be noted:PETROLEUM COKE - includes petroleum coke-derived synthesis gas. Prior to 2011, petroleum coke-derived synthesis gas was included in Other Gases.NATURAL GAS - includes natural gas only. Prior to 2011, includes Other Gases.
- Values for 2016 and prior years are final. Values for 2017 and 2018 are preliminary.- See Glossary for definitions.- Starting in January 2013, there may have been a shift in the continuity of Chapter 4 tables due to changes in the sample design of Form EIA-923 and the imputation process.- See the EIA-923 section of the Technical Notes for a discussion of the sample design for the Form EIA-923 and predecessor forms.- See the Technical Notes for fuel conversion factors.- Totals may not equal the sum of components because of independent rounding.
Sources: U.S. Energy Information Administration (EIA), Form EIA-923, "Power Plant Operations Report" and predecessor forms including Form EIA-423, "Monthly Cost and Quality of Fuels for Electric Plants Report" and Federal Energy Regulatory Commission (FERC), FERC Form 423, "Monthly Report of Cost and Quality of Fuels for Electric Plants."
Annual Totals
Year 2016
Year 2017
Year 2018
Year to Date
Rolling 12 Months Ending in April
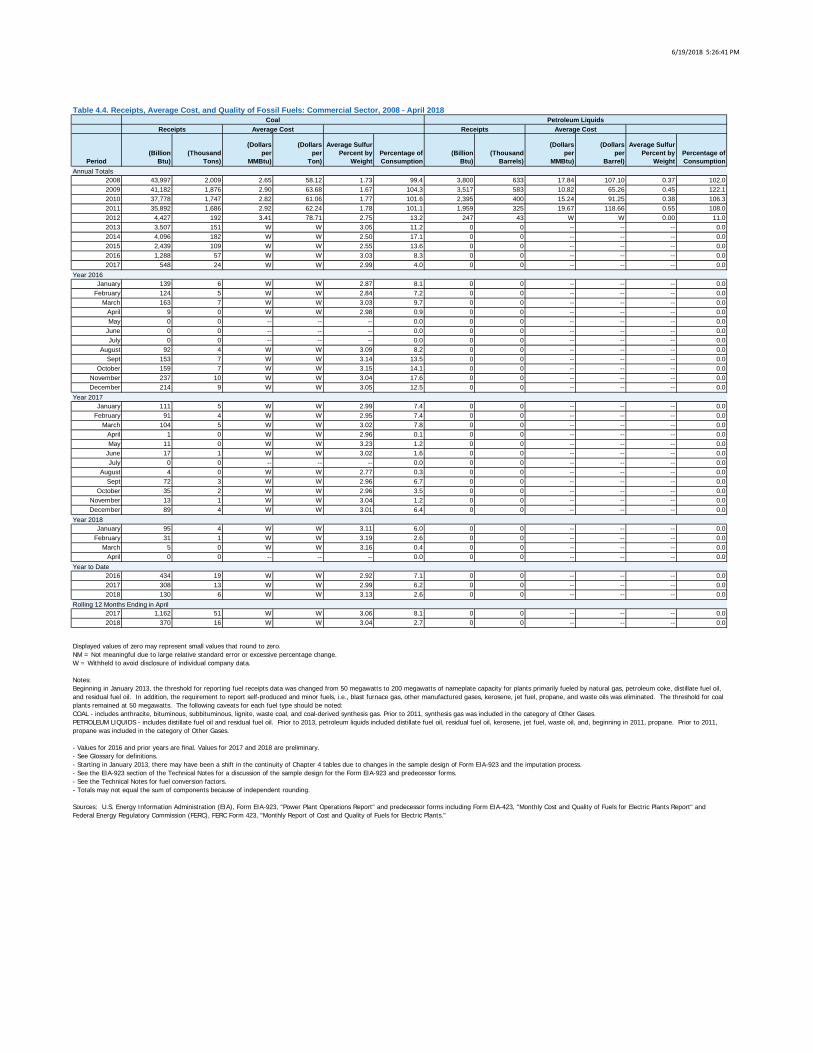
6/19/2018 5:26:41 PM
Period
(BillionBtu)
(ThousandTons)
(Dollarsper
MMBtu)
(Dollarsper
Ton)
Average Sulfur Percent by
WeightPercentage ofConsumption
(BillionBtu)
(ThousandBarrels)
(Dollarsper
MMBtu)
(Dollarsper
Barrel)
Average Sulfur Percent by
WeightPercentage ofConsumption
2008 43,997 2,009 2.65 58.12 1.73 99.4 3,800 633 17.84 107.10 0.37 102.02009 41,182 1,876 2.90 63.68 1.67 104.3 3,517 583 10.82 65.26 0.45 122.12010 37,778 1,747 2.82 61.06 1.77 101.6 2,395 400 15.24 91.25 0.38 106.32011 35,892 1,686 2.92 62.24 1.78 101.1 1,959 325 19.67 118.66 0.55 108.02012 4,427 192 3.41 78.71 2.75 13.2 247 43 W W 0.00 11.02013 3,507 151 W W 3.05 11.2 0 0 -- -- -- 0.02014 4,096 182 W W 2.50 17.1 0 0 -- -- -- 0.02015 2,439 109 W W 2.55 13.6 0 0 -- -- -- 0.02016 1,288 57 W W 3.03 8.3 0 0 -- -- -- 0.02017 548 24 W W 2.99 4.0 0 0 -- -- -- 0.0
January 139 6 W W 2.87 8.1 0 0 -- -- -- 0.0February 124 5 W W 2.84 7.2 0 0 -- -- -- 0.0
March 163 7 W W 3.03 9.7 0 0 -- -- -- 0.0April 9 0 W W 2.98 0.9 0 0 -- -- -- 0.0May 0 0 -- -- -- 0.0 0 0 -- -- -- 0.0
June 0 0 -- -- -- 0.0 0 0 -- -- -- 0.0July 0 0 -- -- -- 0.0 0 0 -- -- -- 0.0
August 92 4 W W 3.09 8.2 0 0 -- -- -- 0.0Sept 153 7 W W 3.14 13.5 0 0 -- -- -- 0.0
October 159 7 W W 3.15 14.1 0 0 -- -- -- 0.0November 237 10 W W 3.04 17.6 0 0 -- -- -- 0.0December 214 9 W W 3.05 12.5 0 0 -- -- -- 0.0
January 111 5 W W 2.99 7.4 0 0 -- -- -- 0.0February 91 4 W W 2.95 7.4 0 0 -- -- -- 0.0
March 104 5 W W 3.02 7.8 0 0 -- -- -- 0.0April 1 0 W W 2.96 0.1 0 0 -- -- -- 0.0May 11 0 W W 3.23 1.2 0 0 -- -- -- 0.0
June 17 1 W W 3.02 1.6 0 0 -- -- -- 0.0July 0 0 -- -- -- 0.0 0 0 -- -- -- 0.0
August 4 0 W W 2.77 0.3 0 0 -- -- -- 0.0Sept 72 3 W W 2.96 6.7 0 0 -- -- -- 0.0
October 35 2 W W 2.96 3.5 0 0 -- -- -- 0.0November 13 1 W W 3.04 1.2 0 0 -- -- -- 0.0December 89 4 W W 3.01 6.4 0 0 -- -- -- 0.0
January 95 4 W W 3.11 6.0 0 0 -- -- -- 0.0February 31 1 W W 3.19 2.6 0 0 -- -- -- 0.0
March 5 0 W W 3.16 0.4 0 0 -- -- -- 0.0April 0 0 -- -- -- 0.0 0 0 -- -- -- 0.0
2016 434 19 W W 2.92 7.1 0 0 -- -- -- 0.02017 308 13 W W 2.99 6.2 0 0 -- -- -- 0.02018 130 6 W W 3.13 2.6 0 0 -- -- -- 0.0
2017 1,162 51 W W 3.06 8.1 0 0 -- -- -- 0.02018 370 16 W W 3.04 2.7 0 0 -- -- -- 0.0
Table 4.4. Receipts, Average Cost, and Quality of Fossil Fuels: Commercial Sector, 2008 - April 2018Coal Petroleum Liquids
Receipts Average Cost Receipts Average Cost
Displayed values of zero may represent small values that round to zero.NM = Not meaningful due to large relative standard error or excessive percentage change.W = Withheld to avoid disclosure of individual company data.
Notes:Beginning in January 2013, the threshold for reporting fuel receipts data was changed from 50 megawatts to 200 megawatts of nameplate capacity for plants primarily fueled by natural gas, petroleum coke, distillate fuel oil, and residual fuel oil. In addition, the requirement to report self-produced and minor fuels, i.e., blast furnace gas, other manufactured gases, kerosene, jet fuel, propane, and waste oils was eliminated. The threshold for coal plants remained at 50 megawatts. The following caveats for each fuel type should be noted:COAL - includes anthracite, bituminous, subbituminous, lignite, waste coal, and coal-derived synthesis gas. Prior to 2011, synthesis gas was included in the category of Other Gases.PETROLEUM LIQUIDS - includes distillate fuel oil and residual fuel oil. Prior to 2013, petroleum liquids included distillate fuel oil, residual fuel oil, kerosene, jet fuel, waste oil, and, beginning in 2011, propane. Prior to 2011, propane was included in the category of Other Gases.
- Values for 2016 and prior years are final. Values for 2017 and 2018 are preliminary.- See Glossary for definitions.- Starting in January 2013, there may have been a shift in the continuity of Chapter 4 tables due to changes in the sample design of Form EIA-923 and the imputation process.- See the EIA-923 section of the Technical Notes for a discussion of the sample design for the Form EIA-923 and predecessor forms.- See the Technical Notes for fuel conversion factors.- Totals may not equal the sum of components because of independent rounding.
Sources: U.S. Energy Information Administration (EIA), Form EIA-923, "Power Plant Operations Report" and predecessor forms including Form EIA-423, "Monthly Cost and Quality of Fuels for Electric Plants Report" and Federal Energy Regulatory Commission (FERC), FERC Form 423, "Monthly Report of Cost and Quality of Fuels for Electric Plants."
Annual Totals
Year 2016
Year 2017
Year 2018
Year to Date
Rolling 12 Months Ending in April
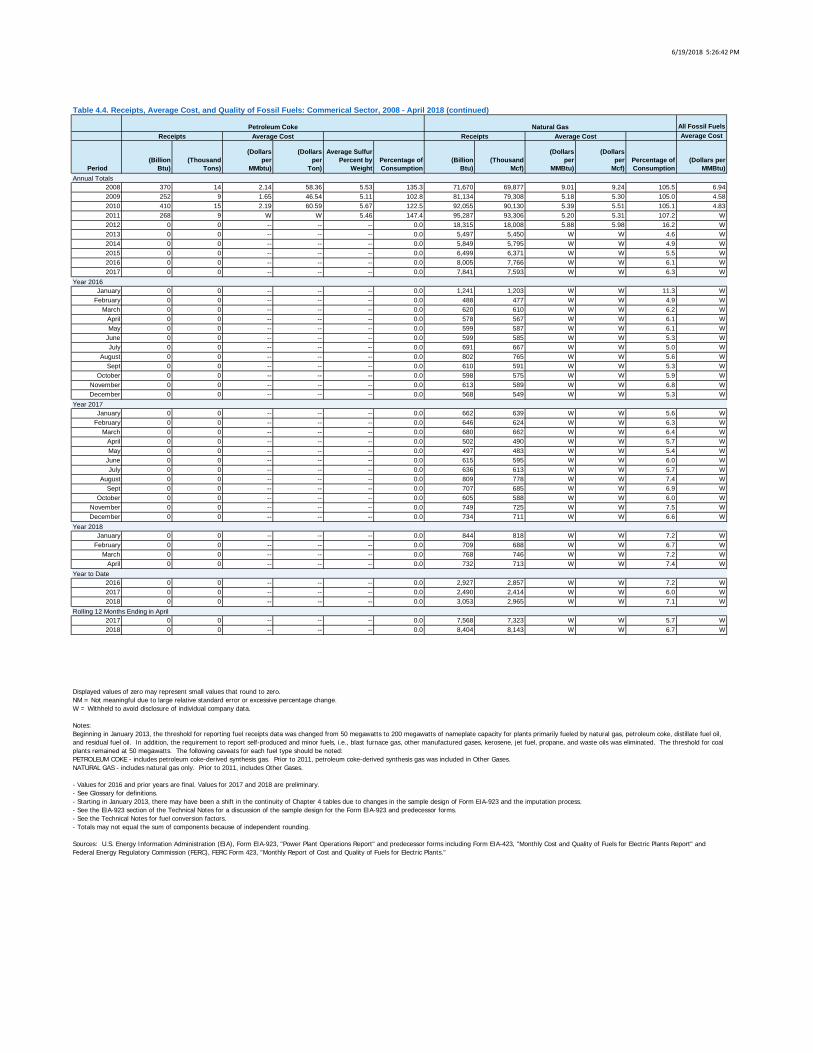
6/19/2018 5:26:42 PM
All Fossil FuelsAverage Cost
Period
(BillionBtu)
(ThousandTons)
(Dollarsper
MMbtu)
(Dollarsper
Ton)
Average Sulfur Percent by
WeightPercentage ofConsumption
(BillionBtu)
(ThousandMcf)
(Dollarsper
MMBtu)
(Dollarsper
Mcf)Percentage ofConsumption
(Dollars per MMBtu)
2008 370 14 2.14 58.36 5.53 135.3 71,670 69,877 9.01 9.24 105.5 6.942009 252 9 1.65 46.54 5.11 102.8 81,134 79,308 5.18 5.30 105.0 4.582010 410 15 2.19 60.59 5.67 122.5 92,055 90,130 5.39 5.51 105.1 4.832011 268 9 W W 5.46 147.4 95,287 93,306 5.20 5.31 107.2 W2012 0 0 -- -- -- 0.0 18,315 18,008 5.88 5.98 16.2 W2013 0 0 -- -- -- 0.0 5,497 5,450 W W 4.6 W2014 0 0 -- -- -- 0.0 5,849 5,795 W W 4.9 W2015 0 0 -- -- -- 0.0 6,499 6,371 W W 5.5 W2016 0 0 -- -- -- 0.0 8,005 7,766 W W 6.1 W2017 0 0 -- -- -- 0.0 7,841 7,593 W W 6.3 W
January 0 0 -- -- -- 0.0 1,241 1,203 W W 11.3 WFebruary 0 0 -- -- -- 0.0 488 477 W W 4.9 W
March 0 0 -- -- -- 0.0 620 610 W W 6.2 WApril 0 0 -- -- -- 0.0 578 567 W W 6.1 WMay 0 0 -- -- -- 0.0 599 587 W W 6.1 W
June 0 0 -- -- -- 0.0 599 585 W W 5.3 WJuly 0 0 -- -- -- 0.0 691 667 W W 5.0 W
August 0 0 -- -- -- 0.0 802 765 W W 5.6 WSept 0 0 -- -- -- 0.0 610 591 W W 5.3 W
October 0 0 -- -- -- 0.0 598 575 W W 5.9 WNovember 0 0 -- -- -- 0.0 613 589 W W 6.8 WDecember 0 0 -- -- -- 0.0 568 549 W W 5.3 W
January 0 0 -- -- -- 0.0 662 639 W W 5.6 WFebruary 0 0 -- -- -- 0.0 646 624 W W 6.3 W
March 0 0 -- -- -- 0.0 680 662 W W 6.4 WApril 0 0 -- -- -- 0.0 502 490 W W 5.7 WMay 0 0 -- -- -- 0.0 497 483 W W 5.4 W
June 0 0 -- -- -- 0.0 615 595 W W 6.0 WJuly 0 0 -- -- -- 0.0 636 613 W W 5.7 W
August 0 0 -- -- -- 0.0 809 778 W W 7.4 WSept 0 0 -- -- -- 0.0 707 685 W W 6.9 W
October 0 0 -- -- -- 0.0 605 588 W W 6.0 WNovember 0 0 -- -- -- 0.0 749 725 W W 7.5 WDecember 0 0 -- -- -- 0.0 734 711 W W 6.6 W
January 0 0 -- -- -- 0.0 844 818 W W 7.2 WFebruary 0 0 -- -- -- 0.0 709 688 W W 6.7 W
March 0 0 -- -- -- 0.0 768 746 W W 7.2 WApril 0 0 -- -- -- 0.0 732 713 W W 7.4 W
2016 0 0 -- -- -- 0.0 2,927 2,857 W W 7.2 W2017 0 0 -- -- -- 0.0 2,490 2,414 W W 6.0 W2018 0 0 -- -- -- 0.0 3,053 2,965 W W 7.1 W
2017 0 0 -- -- -- 0.0 7,568 7,323 W W 5.7 W2018 0 0 -- -- -- 0.0 8,404 8,143 W W 6.7 W
Table 4.4. Receipts, Average Cost, and Quality of Fossil Fuels: Commerical Sector, 2008 - April 2018 (continued)
Petroleum Coke Natural GasReceipts Average Cost Receipts Average Cost
Displayed values of zero may represent small values that round to zero.NM = Not meaningful due to large relative standard error or excessive percentage change.W = Withheld to avoid disclosure of individual company data.
Notes:Beginning in January 2013, the threshold for reporting fuel receipts data was changed from 50 megawatts to 200 megawatts of nameplate capacity for plants primarily fueled by natural gas, petroleum coke, distillate fuel oil, and residual fuel oil. In addition, the requirement to report self-produced and minor fuels, i.e., blast furnace gas, other manufactured gases, kerosene, jet fuel, propane, and waste oils was eliminated. The threshold for coal plants remained at 50 megawatts. The following caveats for each fuel type should be noted:PETROLEUM COKE - includes petroleum coke-derived synthesis gas. Prior to 2011, petroleum coke-derived synthesis gas was included in Other Gases.NATURAL GAS - includes natural gas only. Prior to 2011, includes Other Gases.
- Values for 2016 and prior years are final. Values for 2017 and 2018 are preliminary.- See Glossary for definitions.- Starting in January 2013, there may have been a shift in the continuity of Chapter 4 tables due to changes in the sample design of Form EIA-923 and the imputation process.- See the EIA-923 section of the Technical Notes for a discussion of the sample design for the Form EIA-923 and predecessor forms.- See the Technical Notes for fuel conversion factors.- Totals may not equal the sum of components because of independent rounding.
Sources: U.S. Energy Information Administration (EIA), Form EIA-923, "Power Plant Operations Report" and predecessor forms including Form EIA-423, "Monthly Cost and Quality of Fuels for Electric Plants Report" and Federal Energy Regulatory Commission (FERC), FERC Form 423, "Monthly Report of Cost and Quality of Fuels for Electric Plants."
Annual Totals
Year 2016
Year 2017
Year 2018
Year to Date
Rolling 12 Months Ending in April

6/19/2018 5:26:43 PM
Period
(BillionBtu)
(ThousandTons)
(Dollarsper
MMBtu)
(Dollarsper
Ton)
Average Sulfur Percent by
WeightPercentage ofConsumption
(BillionBtu)
(ThousandBarrels)
(Dollarsper
MMBtu)
(Dollarsper
Barrel)
Average Sulfur Percent by
WeightPercentage ofConsumption
2008 493,724 22,044 2.72 60.96 1.28 100.7 48,822 7,958 12.50 76.69 1.01 109.02009 431,686 19,661 2.81 61.68 1.22 99.5 55,899 9,232 9.83 59.52 0.83 112.82010 468,991 21,492 2.75 60.08 1.26 87.2 33,276 5,554 13.21 79.15 0.93 125.62011 476,108 22,204 2.93 62.86 1.33 99.5 28,939 4,878 17.67 104.83 1.08 144.82012 285,172 13,206 3.02 65.24 1.33 65.8 6,739 1,095 W W 1.52 40.82013 275,543 12,727 W W 1.32 64.4 2,431 394 18.20 112.29 1.43 15.82014 281,867 13,050 W W 1.33 68.4 2,290 373 17.91 109.99 1.43 15.62015 263,630 12,132 W W 1.35 71.4 2,359 385 13.45 82.47 1.42 16.92016 210,749 9,859 W W 1.30 67.0 2,541 412 10.51 64.79 1.27 18.32017 183,058 8,703 W W 1.29 64.8 1,850 297 11.18 69.57 1.42 16.2
January 19,357 897 W W 1.36 64.2 237 38 11.34 71.47 1.49 18.7February 17,418 814 W W 1.42 63.5 342 55 8.70 53.76 1.16 19.8
March 19,181 888 W W 1.29 69.7 205 33 W W 1.18 18.5April 16,048 739 W W 1.43 68.7 222 36 W W 1.36 20.8May 16,376 761 2.67 57.42 1.39 64.6 158 26 11.79 72.81 1.49 11.7
June 18,607 865 2.66 57.25 1.25 69.6 259 42 10.38 64.15 1.45 21.3July 18,586 875 2.64 56.18 1.23 66.2 85 14 11.10 68.65 1.14 7.1
August 19,629 929 W W 1.16 71.9 119 19 11.84 73.14 1.11 12.4Sept 16,052 753 W W 1.20 65.1 162 27 11.67 71.25 1.12 16.5
October 18,491 879 W W 1.25 78.1 297 48 10.34 63.78 1.20 25.7November 14,936 701 W W 1.27 64.1 283 47 10.57 63.80 1.30 30.7December 16,067 759 W W 1.33 59.3 172 28 W W 1.12 18.0
January 14,872 698 W W 1.31 54.1 128 21 11.64 72.27 1.06 12.7February 15,014 702 W W 1.10 64.5 121 19 W W 1.36 16.3
March 17,051 819 W W 1.28 69.8 178 29 10.66 66.36 1.22 21.7April 15,389 724 W W 1.17 67.9 160 26 W W 1.27 17.8May 15,645 762 W W 1.10 69.4 155 25 W W 1.21 16.0
June 15,163 720 W W 1.32 65.8 142 23 W W 1.11 15.0July 14,992 721 2.47 51.34 1.23 68.8 95 15 W W 1.30 12.2
August 15,734 738 W W 1.30 69.3 110 18 W W 1.55 12.6Sept 14,117 677 W W 1.10 65.7 151 24 W W 1.51 19.3
October 14,951 704 W W 1.30 61.3 149 24 11.43 71.09 1.58 16.4November 14,533 694 W W 1.38 60.8 199 32 11.67 72.03 1.71 19.3December 15,598 744 W W 1.87 63.1 263 42 11.14 69.14 1.79 16.1
January 15,278 735 W W 1.12 57.9 408 65 12.64 79.32 1.32 16.1February 13,828 662 W W 1.26 58.5 187 30 11.38 71.32 1.20 20.2
March 15,083 722 W W 1.24 61.8 234 38 W W 1.32 23.5April 13,037 622 2.53 53.03 1.29 59.7 153 24 W W 1.23 17.6
2016 72,003 3,338 W W 1.37 66.4 1,005 162 9.48 58.69 1.28 19.52017 62,325 2,943 W W 1.22 63.7 586 94 11.37 70.97 1.23 16.92018 57,226 2,742 W W 1.22 59.4 982 157 12.48 78.29 1.28 18.5
2017 201,070 9,463 W W 1.24 66.1 2,122 344 W W 1.25 17.42018 177,959 8,502 W W 1.29 63.4 2,246 360 W W 1.41 16.9
Table 4.5. Receipts, Average Cost, and Quality of Fossil Fuels: Industrial Sector, 2008 - April 2018Coal Petroleum Liquids
Receipts Average Cost Receipts Average Cost
Displayed values of zero may represent small values that round to zero.NM = Not meaningful due to large relative standard error or excessive percentage change.W = Withheld to avoid disclosure of individual company data.
Notes:Beginning in January 2013, the threshold for reporting fuel receipts data was changed from 50 megawatts to 200 megawatts of nameplate capacity for plants primarily fueled by natural gas, petroleum coke, distillate fuel oil, and residual fuel oil. In addition, the requirement to report self-produced and minor fuels, i.e., blast furnace gas, other manufactured gases, kerosene, jet fuel, propane, and waste oils was eliminated. The threshold for coal plants remained at 50 megawatts. The following caveats for each fuel type should be noted:COAL - includes anthracite, bituminous, subbituminous, lignite, waste coal, and coal-derived synthesis gas. Prior to 2011, synthesis gas was included in the category of Other Gases.PETROLEUM LIQUIDS - includes distillate fuel oil and residual fuel oil. Prior to 2013, petroleum liquids included distillate fuel oil, residual fuel oil, kerosene, jet fuel, waste oil, and, beginning in 2011, propane. Prior to 2011, propane was included in the category of Other Gases.
- Values for 2016 and prior years are final. Values for 2017 and 2018 are preliminary.- See Glossary for definitions.- Starting in January 2013, there may have been a shift in the continuity of Chapter 4 tables due to changes in the sample design of Form EIA-923 and the imputation process.- See the EIA-923 section of the Technical Notes for a discussion of the sample design for the Form EIA-923 and predecessor forms.- See the Technical Notes for fuel conversion factors.- Totals may not equal the sum of components because of independent rounding.
Sources: U.S. Energy Information Administration (EIA), Form EIA-923, "Power Plant Operations Report" and predecessor forms including Form EIA-423, "Monthly Cost and Quality of Fuels for Electric Plants Report" and Federal Energy Regulatory Commission (FERC), FERC Form 423, "Monthly Report of Cost and Quality of Fuels for Electric Plants."
Annual Totals
Year 2016
Year 2017
Year 2018
Year to Date
Rolling 12 Months Ending in April
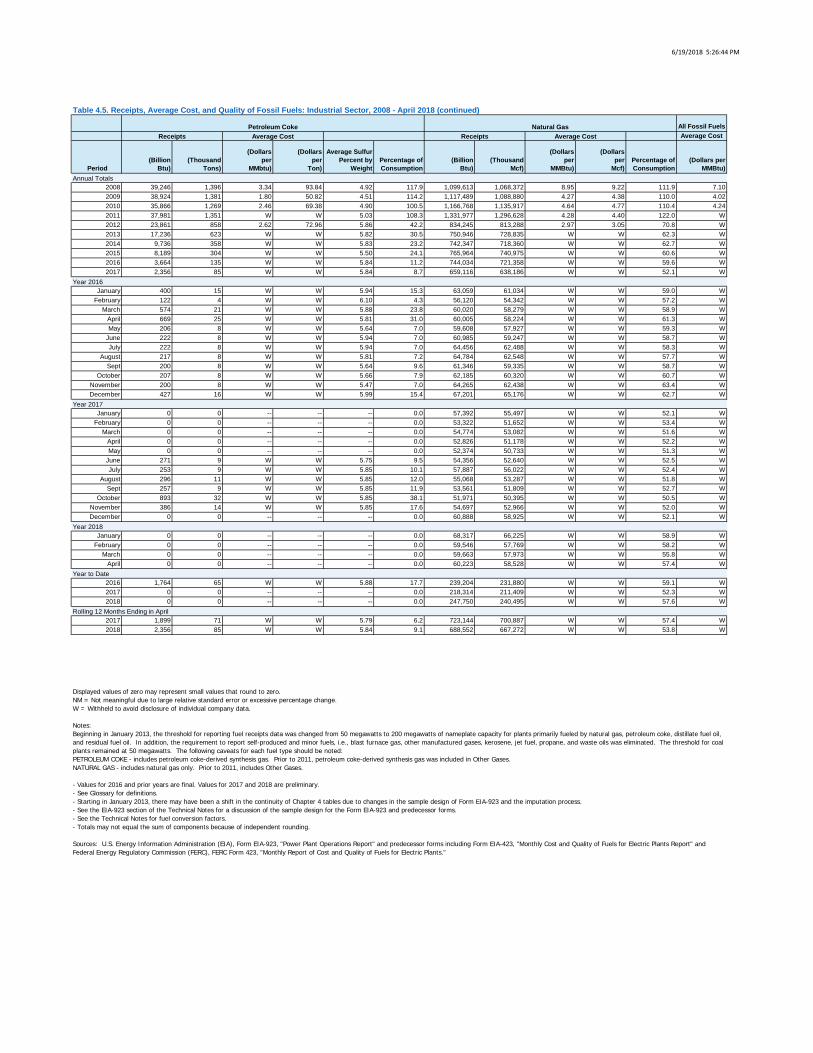
6/19/2018 5:26:44 PM
All Fossil FuelsAverage Cost
Period
(BillionBtu)
(ThousandTons)
(Dollarsper
MMbtu)
(Dollarsper
Ton)
Average Sulfur Percent by
WeightPercentage ofConsumption
(BillionBtu)
(ThousandMcf)
(Dollarsper
MMBtu)
(Dollarsper
Mcf)Percentage ofConsumption
(Dollars per MMBtu)
2008 39,246 1,396 3.34 93.84 4.92 117.9 1,099,613 1,068,372 8.95 9.22 111.9 7.102009 38,924 1,381 1.80 50.82 4.51 114.2 1,117,489 1,088,880 4.27 4.38 110.0 4.022010 35,866 1,269 2.46 69.38 4.90 100.5 1,166,768 1,135,917 4.64 4.77 110.4 4.242011 37,981 1,351 W W 5.03 108.3 1,331,977 1,296,628 4.28 4.40 122.0 W2012 23,861 858 2.62 72.96 5.86 42.2 834,245 813,288 2.97 3.05 70.8 W2013 17,236 623 W W 5.82 30.5 750,946 728,835 W W 62.3 W2014 9,736 358 W W 5.83 23.2 742,347 718,360 W W 62.7 W2015 8,189 304 W W 5.50 24.1 765,964 740,975 W W 60.6 W2016 3,664 135 W W 5.84 11.2 744,034 721,358 W W 59.6 W2017 2,356 85 W W 5.84 8.7 659,116 638,186 W W 52.1 W
January 400 15 W W 5.94 15.3 63,059 61,034 W W 59.0 WFebruary 122 4 W W 6.10 4.3 56,120 54,342 W W 57.2 W
March 574 21 W W 5.88 23.8 60,020 58,279 W W 58.9 WApril 669 25 W W 5.81 31.0 60,005 58,224 W W 61.3 WMay 206 8 W W 5.64 7.0 59,608 57,927 W W 59.3 W
June 222 8 W W 5.94 7.0 60,985 59,247 W W 58.7 WJuly 222 8 W W 5.94 7.0 64,456 62,488 W W 58.3 W
August 217 8 W W 5.81 7.2 64,784 62,548 W W 57.7 WSept 200 8 W W 5.64 9.6 61,346 59,335 W W 58.7 W
October 207 8 W W 5.66 7.9 62,185 60,320 W W 60.7 WNovember 200 8 W W 5.47 7.0 64,265 62,438 W W 63.4 WDecember 427 16 W W 5.99 15.4 67,201 65,176 W W 62.7 W
January 0 0 -- -- -- 0.0 57,392 55,497 W W 52.1 WFebruary 0 0 -- -- -- 0.0 53,322 51,652 W W 53.4 W
March 0 0 -- -- -- 0.0 54,774 53,082 W W 51.6 WApril 0 0 -- -- -- 0.0 52,826 51,178 W W 52.2 WMay 0 0 -- -- -- 0.0 52,374 50,733 W W 51.3 W
June 271 9 W W 5.75 9.5 54,356 52,640 W W 52.5 WJuly 253 9 W W 5.85 10.1 57,887 56,022 W W 52.4 W
August 296 11 W W 5.85 12.0 55,068 53,287 W W 51.8 WSept 257 9 W W 5.85 11.9 53,561 51,809 W W 52.7 W
October 893 32 W W 5.85 38.1 51,971 50,395 W W 50.5 WNovember 386 14 W W 5.85 17.6 54,697 52,966 W W 52.0 WDecember 0 0 -- -- -- 0.0 60,888 58,925 W W 52.1 W
January 0 0 -- -- -- 0.0 68,317 66,225 W W 58.9 WFebruary 0 0 -- -- -- 0.0 59,546 57,769 W W 58.2 W
March 0 0 -- -- -- 0.0 59,663 57,973 W W 55.8 WApril 0 0 -- -- -- 0.0 60,223 58,528 W W 57.4 W
2016 1,764 65 W W 5.88 17.7 239,204 231,880 W W 59.1 W2017 0 0 -- -- -- 0.0 218,314 211,409 W W 52.3 W2018 0 0 -- -- -- 0.0 247,750 240,495 W W 57.6 W
2017 1,899 71 W W 5.79 6.2 723,144 700,887 W W 57.4 W2018 2,356 85 W W 5.84 9.1 688,552 667,272 W W 53.8 W
Table 4.5. Receipts, Average Cost, and Quality of Fossil Fuels: Industrial Sector, 2008 - April 2018 (continued)
Petroleum Coke Natural GasReceipts Average Cost Receipts Average Cost
Displayed values of zero may represent small values that round to zero.NM = Not meaningful due to large relative standard error or excessive percentage change.W = Withheld to avoid disclosure of individual company data.
Notes:Beginning in January 2013, the threshold for reporting fuel receipts data was changed from 50 megawatts to 200 megawatts of nameplate capacity for plants primarily fueled by natural gas, petroleum coke, distillate fuel oil, and residual fuel oil. In addition, the requirement to report self-produced and minor fuels, i.e., blast furnace gas, other manufactured gases, kerosene, jet fuel, propane, and waste oils was eliminated. The threshold for coal plants remained at 50 megawatts. The following caveats for each fuel type should be noted:PETROLEUM COKE - includes petroleum coke-derived synthesis gas. Prior to 2011, petroleum coke-derived synthesis gas was included in Other Gases.NATURAL GAS - includes natural gas only. Prior to 2011, includes Other Gases.
- Values for 2016 and prior years are final. Values for 2017 and 2018 are preliminary.- See Glossary for definitions.- Starting in January 2013, there may have been a shift in the continuity of Chapter 4 tables due to changes in the sample design of Form EIA-923 and the imputation process.- See the EIA-923 section of the Technical Notes for a discussion of the sample design for the Form EIA-923 and predecessor forms.- See the Technical Notes for fuel conversion factors.- Totals may not equal the sum of components because of independent rounding.
Sources: U.S. Energy Information Administration (EIA), Form EIA-923, "Power Plant Operations Report" and predecessor forms including Form EIA-423, "Monthly Cost and Quality of Fuels for Electric Plants Report" and Federal Energy Regulatory Commission (FERC), FERC Form 423, "Monthly Report of Cost and Quality of Fuels for Electric Plants."
Annual Totals
Year 2016
Year 2017
Year 2018
Year to Date
Rolling 12 Months Ending in April
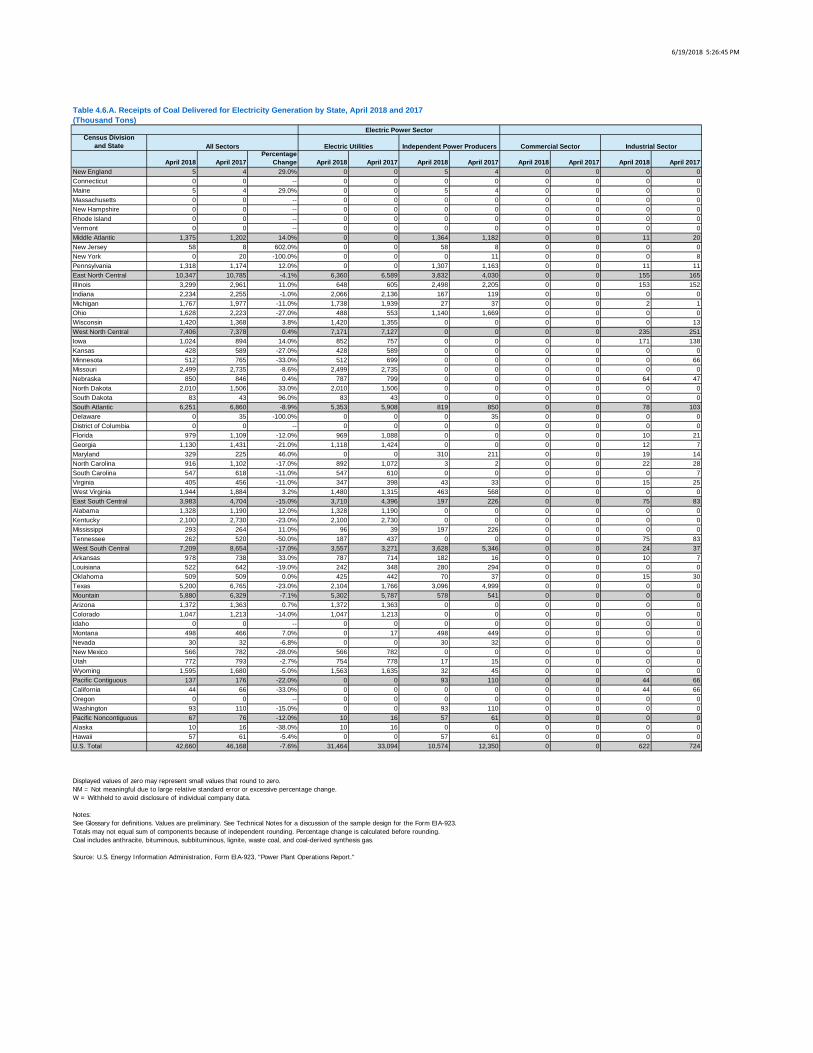
6/19/2018 5:26:45 PM
Census Divisionand State
April 2018 April 2017Percentage
Change April 2018 April 2017 April 2018 April 2017 April 2018 April 2017 April 2018 April 2017New England 5 4 29.0% 0 0 5 4 0 0 0 0Connecticut 0 0 -- 0 0 0 0 0 0 0 0Maine 5 4 29.0% 0 0 5 4 0 0 0 0Massachusetts 0 0 -- 0 0 0 0 0 0 0 0New Hampshire 0 0 -- 0 0 0 0 0 0 0 0Rhode Island 0 0 -- 0 0 0 0 0 0 0 0Vermont 0 0 -- 0 0 0 0 0 0 0 0Middle Atlantic 1,375 1,202 14.0% 0 0 1,364 1,182 0 0 11 20New Jersey 58 8 602.0% 0 0 58 8 0 0 0 0New York 0 20 -100.0% 0 0 0 11 0 0 0 8Pennsylvania 1,318 1,174 12.0% 0 0 1,307 1,163 0 0 11 11East North Central 10,347 10,785 -4.1% 6,360 6,589 3,832 4,030 0 0 155 165Illinois 3,299 2,961 11.0% 648 605 2,498 2,205 0 0 153 152Indiana 2,234 2,255 -1.0% 2,066 2,136 167 119 0 0 0 0Michigan 1,767 1,977 -11.0% 1,738 1,939 27 37 0 0 2 1Ohio 1,628 2,223 -27.0% 488 553 1,140 1,669 0 0 0 0Wisconsin 1,420 1,368 3.8% 1,420 1,355 0 0 0 0 0 13West North Central 7,406 7,378 0.4% 7,171 7,127 0 0 0 0 235 251Iowa 1,024 894 14.0% 852 757 0 0 0 0 171 138Kansas 428 589 -27.0% 428 589 0 0 0 0 0 0Minnesota 512 765 -33.0% 512 699 0 0 0 0 0 66Missouri 2,499 2,735 -8.6% 2,499 2,735 0 0 0 0 0 0Nebraska 850 846 0.4% 787 799 0 0 0 0 64 47North Dakota 2,010 1,506 33.0% 2,010 1,506 0 0 0 0 0 0South Dakota 83 43 96.0% 83 43 0 0 0 0 0 0South Atlantic 6,251 6,860 -8.9% 5,353 5,908 819 850 0 0 78 103Delaware 0 35 -100.0% 0 0 0 35 0 0 0 0District of Columbia 0 0 -- 0 0 0 0 0 0 0 0Florida 979 1,109 -12.0% 969 1,088 0 0 0 0 10 21Georgia 1,130 1,431 -21.0% 1,118 1,424 0 0 0 0 12 7Maryland 329 225 46.0% 0 0 310 211 0 0 19 14North Carolina 916 1,102 -17.0% 892 1,072 3 2 0 0 22 28South Carolina 547 618 -11.0% 547 610 0 0 0 0 0 7Virginia 405 456 -11.0% 347 398 43 33 0 0 15 25West Virginia 1,944 1,884 3.2% 1,480 1,315 463 568 0 0 0 0East South Central 3,983 4,704 -15.0% 3,710 4,396 197 226 0 0 75 83Alabama 1,328 1,190 12.0% 1,328 1,190 0 0 0 0 0 0Kentucky 2,100 2,730 -23.0% 2,100 2,730 0 0 0 0 0 0Mississippi 293 264 11.0% 96 39 197 226 0 0 0 0Tennessee 262 520 -50.0% 187 437 0 0 0 0 75 83West South Central 7,209 8,654 -17.0% 3,557 3,271 3,628 5,346 0 0 24 37Arkansas 978 738 33.0% 787 714 182 16 0 0 10 7Louisiana 522 642 -19.0% 242 348 280 294 0 0 0 0Oklahoma 509 509 0.0% 425 442 70 37 0 0 15 30Texas 5,200 6,765 -23.0% 2,104 1,766 3,096 4,999 0 0 0 0Mountain 5,880 6,329 -7.1% 5,302 5,787 578 541 0 0 0 0Arizona 1,372 1,363 0.7% 1,372 1,363 0 0 0 0 0 0Colorado 1,047 1,213 -14.0% 1,047 1,213 0 0 0 0 0 0Idaho 0 0 -- 0 0 0 0 0 0 0 0Montana 498 466 7.0% 0 17 498 449 0 0 0 0Nevada 30 32 -6.8% 0 0 30 32 0 0 0 0New Mexico 566 782 -28.0% 566 782 0 0 0 0 0 0Utah 772 793 -2.7% 754 778 17 15 0 0 0 0Wyoming 1,595 1,680 -5.0% 1,563 1,635 32 45 0 0 0 0Pacific Contiguous 137 176 -22.0% 0 0 93 110 0 0 44 66California 44 66 -33.0% 0 0 0 0 0 0 44 66Oregon 0 0 -- 0 0 0 0 0 0 0 0Washington 93 110 -15.0% 0 0 93 110 0 0 0 0Pacific Noncontiguous 67 76 -12.0% 10 16 57 61 0 0 0 0Alaska 10 16 -38.0% 10 16 0 0 0 0 0 0Hawaii 57 61 -5.4% 0 0 57 61 0 0 0 0U.S. Total 42,660 46,168 -7.6% 31,464 33,094 10,574 12,350 0 0 622 724
Displayed values of zero may represent small values that round to zero.NM = Not meaningful due to large relative standard error or excessive percentage change.W = Withheld to avoid disclosure of individual company data.
Notes:See Glossary for definitions. Values are preliminary. See Technical Notes for a discussion of the sample design for the Form EIA-923.Totals may not equal sum of components because of independent rounding. Percentage change is calculated before rounding.Coal includes anthracite, bituminous, subbituminous, lignite, waste coal, and coal-derived synthesis gas.
Source: U.S. Energy Information Administration, Form EIA-923, "Power Plant Operations Report."
Table 4.6.A. Receipts of Coal Delivered for Electricity Generation by State, April 2018 and 2017(Thousand Tons)
Electric Power Sector
All Sectors Electric Utilities Independent Power Producers Commercial Sector Industrial Sector
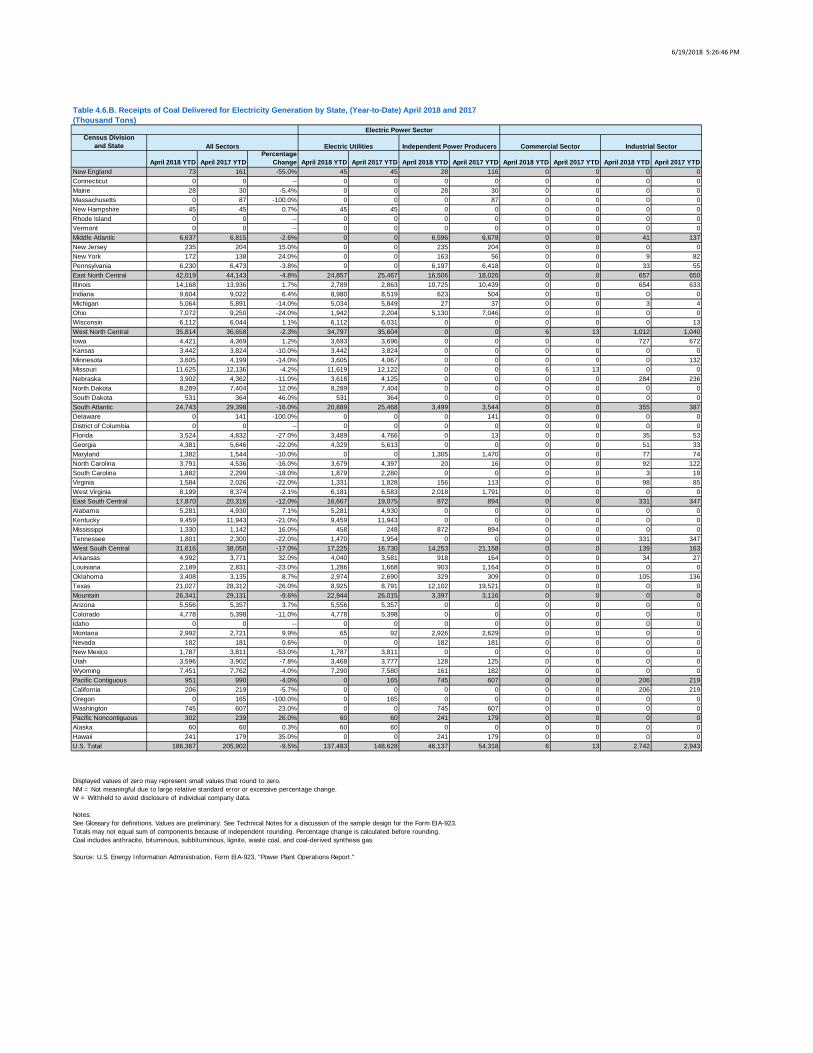
6/19/2018 5:26:46 PM
Census Divisionand State
April 2018 YTD April 2017 YTDPercentage
Change April 2018 YTD April 2017 YTD April 2018 YTD April 2017 YTD April 2018 YTD April 2017 YTD April 2018 YTD April 2017 YTDNew England 73 161 -55.0% 45 45 28 116 0 0 0 0Connecticut 0 0 -- 0 0 0 0 0 0 0 0Maine 28 30 -5.4% 0 0 28 30 0 0 0 0Massachusetts 0 87 -100.0% 0 0 0 87 0 0 0 0New Hampshire 45 45 0.7% 45 45 0 0 0 0 0 0Rhode Island 0 0 -- 0 0 0 0 0 0 0 0Vermont 0 0 -- 0 0 0 0 0 0 0 0Middle Atlantic 6,637 6,815 -2.6% 0 0 6,596 6,678 0 0 41 137New Jersey 235 204 15.0% 0 0 235 204 0 0 0 0New York 172 138 24.0% 0 0 163 56 0 0 9 82Pennsylvania 6,230 6,473 -3.8% 0 0 6,197 6,418 0 0 33 55East North Central 42,019 44,143 -4.8% 24,857 25,467 16,506 18,026 0 0 657 650Illinois 14,168 13,936 1.7% 2,789 2,863 10,725 10,439 0 0 654 633Indiana 9,604 9,022 6.4% 8,980 8,519 623 504 0 0 0 0Michigan 5,064 5,891 -14.0% 5,034 5,849 27 37 0 0 3 4Ohio 7,072 9,250 -24.0% 1,942 2,204 5,130 7,046 0 0 0 0Wisconsin 6,112 6,044 1.1% 6,112 6,031 0 0 0 0 0 13West North Central 35,814 36,658 -2.3% 34,797 35,604 0 0 6 13 1,012 1,040Iowa 4,421 4,369 1.2% 3,693 3,696 0 0 0 0 727 672Kansas 3,442 3,824 -10.0% 3,442 3,824 0 0 0 0 0 0Minnesota 3,605 4,199 -14.0% 3,605 4,067 0 0 0 0 0 132Missouri 11,625 12,136 -4.2% 11,619 12,122 0 0 6 13 0 0Nebraska 3,902 4,362 -11.0% 3,618 4,125 0 0 0 0 284 236North Dakota 8,289 7,404 12.0% 8,289 7,404 0 0 0 0 0 0South Dakota 531 364 46.0% 531 364 0 0 0 0 0 0South Atlantic 24,743 29,398 -16.0% 20,889 25,468 3,499 3,544 0 0 355 387Delaware 0 141 -100.0% 0 0 0 141 0 0 0 0District of Columbia 0 0 -- 0 0 0 0 0 0 0 0Florida 3,524 4,832 -27.0% 3,489 4,766 0 13 0 0 35 53Georgia 4,381 5,646 -22.0% 4,329 5,613 0 0 0 0 51 33Maryland 1,382 1,544 -10.0% 0 0 1,305 1,470 0 0 77 74North Carolina 3,791 4,536 -16.0% 3,679 4,397 20 16 0 0 92 122South Carolina 1,882 2,299 -18.0% 1,879 2,280 0 0 0 0 3 19Virginia 1,584 2,026 -22.0% 1,331 1,828 156 113 0 0 98 85West Virginia 8,199 8,374 -2.1% 6,181 6,583 2,018 1,791 0 0 0 0East South Central 17,870 20,316 -12.0% 16,667 19,075 872 894 0 0 331 347Alabama 5,281 4,930 7.1% 5,281 4,930 0 0 0 0 0 0Kentucky 9,459 11,943 -21.0% 9,459 11,943 0 0 0 0 0 0Mississippi 1,330 1,142 16.0% 458 248 872 894 0 0 0 0Tennessee 1,801 2,300 -22.0% 1,470 1,954 0 0 0 0 331 347West South Central 31,616 38,050 -17.0% 17,225 16,730 14,253 21,158 0 0 139 163Arkansas 4,992 3,771 32.0% 4,040 3,581 918 164 0 0 34 27Louisiana 2,189 2,831 -23.0% 1,286 1,668 903 1,164 0 0 0 0Oklahoma 3,408 3,135 8.7% 2,974 2,690 329 309 0 0 105 136Texas 21,027 28,312 -26.0% 8,925 8,791 12,102 19,521 0 0 0 0Mountain 26,341 29,131 -9.6% 22,944 26,015 3,397 3,116 0 0 0 0Arizona 5,556 5,357 3.7% 5,556 5,357 0 0 0 0 0 0Colorado 4,778 5,398 -11.0% 4,778 5,398 0 0 0 0 0 0Idaho 0 0 -- 0 0 0 0 0 0 0 0Montana 2,992 2,721 9.9% 65 92 2,926 2,629 0 0 0 0Nevada 182 181 0.6% 0 0 182 181 0 0 0 0New Mexico 1,787 3,811 -53.0% 1,787 3,811 0 0 0 0 0 0Utah 3,596 3,902 -7.8% 3,468 3,777 128 125 0 0 0 0Wyoming 7,451 7,762 -4.0% 7,290 7,580 161 182 0 0 0 0Pacific Contiguous 951 990 -4.0% 0 165 745 607 0 0 206 219California 206 219 -5.7% 0 0 0 0 0 0 206 219Oregon 0 165 -100.0% 0 165 0 0 0 0 0 0Washington 745 607 23.0% 0 0 745 607 0 0 0 0Pacific Noncontiguous 302 239 26.0% 60 60 241 179 0 0 0 0Alaska 60 60 0.3% 60 60 0 0 0 0 0 0Hawaii 241 179 35.0% 0 0 241 179 0 0 0 0U.S. Total 186,367 205,902 -9.5% 137,483 148,628 46,137 54,318 6 13 2,742 2,943
Displayed values of zero may represent small values that round to zero.NM = Not meaningful due to large relative standard error or excessive percentage change.W = Withheld to avoid disclosure of individual company data.
Notes:See Glossary for definitions. Values are preliminary. See Technical Notes for a discussion of the sample design for the Form EIA-923.Totals may not equal sum of components because of independent rounding. Percentage change is calculated before rounding.Coal includes anthracite, bituminous, subbituminous, lignite, waste coal, and coal-derived synthesis gas.
Source: U.S. Energy Information Administration, Form EIA-923, "Power Plant Operations Report."
Table 4.6.B. Receipts of Coal Delivered for Electricity Generation by State, (Year-to-Date) April 2018 and 2017(Thousand Tons)
Electric Power Sector
All Sectors Electric Utilities Independent Power Producers Commercial Sector Industrial Sector

6/19/2018 5:26:47 PM
Census Divisionand State
April 2018 April 2017Percentage
Change April 2018 April 2017 April 2018 April 2017 April 2018 April 2017 April 2018 April 2017New England 3 0 501.0% 0 0 2 0 0 0 0 0Connecticut 2 0 -- 0 0 2 0 0 0 0 0Maine 1 0 88.0% 0 0 1 0 0 0 0 0Massachusetts 0 0 -100.0% 0 0 0 0 0 0 0 0New Hampshire 0 0 -- 0 0 0 0 0 0 0 0Rhode Island 0 0 -- 0 0 0 0 0 0 0 0Vermont 0 0 -- 0 0 0 0 0 0 0 0Middle Atlantic 15 55 -73.0% 0 0 9 40 0 0 6 15New Jersey 1 0 289.0% 0 0 1 0 0 0 0 0New York 0 36 -100.0% 0 0 0 28 0 0 0 9Pennsylvania 14 19 -23.0% 0 0 8 13 0 0 6 6East North Central 54 48 12.0% 39 36 11 10 0 0 4 2Illinois 8 5 55.0% 1 0 8 5 0 0 0 0Indiana 4 18 -76.0% 4 18 0 0 0 0 0 0Michigan 26 6 301.0% 24 6 0 0 0 0 2 0Ohio 8 15 -45.0% 3 9 3 5 0 0 2 1Wisconsin 7 3 143.0% 7 3 0 0 0 0 0 0West North Central 30 30 -1.2% 30 30 0 0 0 0 0 0Iowa 13 7 98.0% 13 7 0 0 0 0 0 0Kansas 10 13 -26.0% 10 13 0 0 0 0 0 0Minnesota 1 1 -0.3% 1 1 0 0 0 0 0 0Missouri 4 5 -11.0% 4 5 0 0 0 0 0 0Nebraska 1 0 -- 1 0 0 0 0 0 0 0North Dakota 0 4 -90.0% 0 4 0 0 0 0 0 0South Dakota 0 0 -- 0 0 0 0 0 0 0 0South Atlantic 117 119 -1.1% 97 104 6 6 0 0 14 9Delaware 0 2 -100.0% 0 0 0 2 0 0 0 0District of Columbia 0 0 -- 0 0 0 0 0 0 0 0Florida 39 47 -17.0% 37 43 0 0 0 0 3 4Georgia 13 8 52.0% 12 7 0 0 0 0 1 1Maryland 5 3 98.0% 0 0 5 3 0 0 0 0North Carolina 17 24 -31.0% 9 20 0 0 0 0 8 4South Carolina 6 14 -58.0% 5 14 0 0 0 0 1 0Virginia 31 4 781.0% 29 2 1 1 0 0 2 1West Virginia 7 17 -60.0% 7 17 0 0 0 0 0 0East South Central 17 27 -37.0% 16 27 0 0 0 0 1 0Alabama 1 3 -63.0% 1 3 0 0 0 0 0 0Kentucky 11 13 -10.0% 11 13 0 0 0 0 0 0Mississippi 2 1 50.0% 2 1 0 0 0 0 0 0Tennessee 2 9 -73.0% 2 9 0 0 0 0 1 0West South Central 26 25 3.9% 18 13 8 12 0 0 0 0Arkansas 5 5 -3.1% 0 4 5 1 0 0 0 0Louisiana 0 0 -- 0 0 0 0 0 0 0 0Oklahoma 14 1 NM 14 1 0 0 0 0 0 0Texas 7 19 -61.0% 4 8 3 10 0 0 0 0Mountain 31 37 -16.0% 30 34 2 4 0 0 0 0Arizona 13 4 187.0% 13 4 0 0 0 0 0 0Colorado 1 0 -- 1 0 0 0 0 0 0 0Idaho 0 0 -- 0 0 0 0 0 0 0 0Montana 0 2 -86.0% 0 0 0 2 0 0 0 0Nevada 1 1 42.0% 0 0 1 1 0 0 0 0New Mexico 0 6 -95.0% 0 6 0 0 0 0 0 0Utah 14 13 10.0% 13 12 1 1 0 0 0 0Wyoming 2 12 -80.0% 2 12 0 0 0 0 0 0Pacific Contiguous 0 0 -- 0 0 0 0 0 0 0 0California 0 0 -- 0 0 0 0 0 0 0 0Oregon 0 0 -- 0 0 0 0 0 0 0 0Washington 0 0 -- 0 0 0 0 0 0 0 0Pacific Noncontiguous 728 692 5.2% 596 531 132 161 0 0 0 0Alaska 0 0 -- 0 0 0 0 0 0 0 0Hawaii 728 692 5.2% 596 531 132 161 0 0 0 0U.S. Total 1,020 1,033 -1.2% 826 774 170 233 0 0 24 26
Displayed values of zero may represent small values that round to zero.NM = Not meaningful due to large relative standard error or excessive percentage change.W = Withheld to avoid disclosure of individual company data.
Notes:See Glossary for definitions. Values are preliminary. See Technical Notes for a discussion of the sample design for the Form EIA-923.Totals may not equal sum of components because of independent rounding. Percentage change is calculated before rounding.Petroleum Liquids includes distillate and residual fuel oils.See the Technical Notes for fuel conversion factors.
Source: U.S. Energy Information Administration, Form EIA-923, "Power Plant Operations Report."
Table 4.7.A. Receipts of Petroleum Liquids Delivered for Electricity Generation by State, April 2018 and 2017(Thousand Barrels)
Electric Power Sector
All Sectors Electric Utilities Independent Power Producers Commercial Sector Industrial Sector
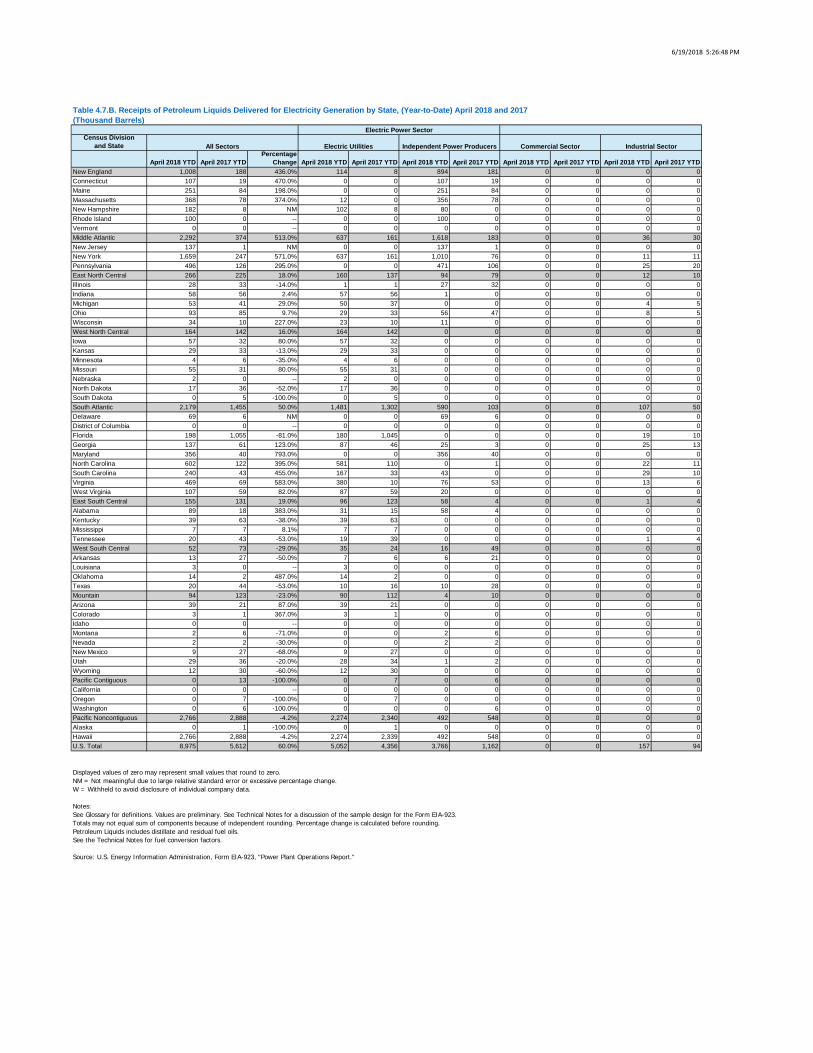
6/19/2018 5:26:48 PM
Census Divisionand State
April 2018 YTD April 2017 YTDPercentage
Change April 2018 YTD April 2017 YTD April 2018 YTD April 2017 YTD April 2018 YTD April 2017 YTD April 2018 YTD April 2017 YTDNew England 1,008 188 436.0% 114 8 894 181 0 0 0 0Connecticut 107 19 470.0% 0 0 107 19 0 0 0 0Maine 251 84 198.0% 0 0 251 84 0 0 0 0Massachusetts 368 78 374.0% 12 0 356 78 0 0 0 0New Hampshire 182 8 NM 102 8 80 0 0 0 0 0Rhode Island 100 0 -- 0 0 100 0 0 0 0 0Vermont 0 0 -- 0 0 0 0 0 0 0 0Middle Atlantic 2,292 374 513.0% 637 161 1,618 183 0 0 36 30New Jersey 137 1 NM 0 0 137 1 0 0 0 0New York 1,659 247 571.0% 637 161 1,010 76 0 0 11 11Pennsylvania 496 126 295.0% 0 0 471 106 0 0 25 20East North Central 266 225 18.0% 160 137 94 79 0 0 12 10Illinois 28 33 -14.0% 1 1 27 32 0 0 0 0Indiana 58 56 2.4% 57 56 1 0 0 0 0 0Michigan 53 41 29.0% 50 37 0 0 0 0 4 5Ohio 93 85 9.7% 29 33 56 47 0 0 8 5Wisconsin 34 10 227.0% 23 10 11 0 0 0 0 0West North Central 164 142 16.0% 164 142 0 0 0 0 0 0Iowa 57 32 80.0% 57 32 0 0 0 0 0 0Kansas 29 33 -13.0% 29 33 0 0 0 0 0 0Minnesota 4 6 -35.0% 4 6 0 0 0 0 0 0Missouri 55 31 80.0% 55 31 0 0 0 0 0 0Nebraska 2 0 -- 2 0 0 0 0 0 0 0North Dakota 17 36 -52.0% 17 36 0 0 0 0 0 0South Dakota 0 5 -100.0% 0 5 0 0 0 0 0 0South Atlantic 2,179 1,455 50.0% 1,481 1,302 590 103 0 0 107 50Delaware 69 6 NM 0 0 69 6 0 0 0 0District of Columbia 0 0 -- 0 0 0 0 0 0 0 0Florida 198 1,055 -81.0% 180 1,045 0 0 0 0 19 10Georgia 137 61 123.0% 87 46 25 3 0 0 25 13Maryland 356 40 793.0% 0 0 356 40 0 0 0 0North Carolina 602 122 395.0% 581 110 0 1 0 0 22 11South Carolina 240 43 455.0% 167 33 43 0 0 0 29 10Virginia 469 69 583.0% 380 10 76 53 0 0 13 6West Virginia 107 59 82.0% 87 59 20 0 0 0 0 0East South Central 155 131 19.0% 96 123 58 4 0 0 1 4Alabama 89 18 383.0% 31 15 58 4 0 0 0 0Kentucky 39 63 -38.0% 39 63 0 0 0 0 0 0Mississippi 7 7 8.1% 7 7 0 0 0 0 0 0Tennessee 20 43 -53.0% 19 39 0 0 0 0 1 4West South Central 52 73 -29.0% 35 24 16 49 0 0 0 0Arkansas 13 27 -50.0% 7 6 6 21 0 0 0 0Louisiana 3 0 -- 3 0 0 0 0 0 0 0Oklahoma 14 2 487.0% 14 2 0 0 0 0 0 0Texas 20 44 -53.0% 10 16 10 28 0 0 0 0Mountain 94 123 -23.0% 90 112 4 10 0 0 0 0Arizona 39 21 87.0% 39 21 0 0 0 0 0 0Colorado 3 1 367.0% 3 1 0 0 0 0 0 0Idaho 0 0 -- 0 0 0 0 0 0 0 0Montana 2 6 -71.0% 0 0 2 6 0 0 0 0Nevada 2 2 -30.0% 0 0 2 2 0 0 0 0New Mexico 9 27 -68.0% 9 27 0 0 0 0 0 0Utah 29 36 -20.0% 28 34 1 2 0 0 0 0Wyoming 12 30 -60.0% 12 30 0 0 0 0 0 0Pacific Contiguous 0 13 -100.0% 0 7 0 6 0 0 0 0California 0 0 -- 0 0 0 0 0 0 0 0Oregon 0 7 -100.0% 0 7 0 0 0 0 0 0Washington 0 6 -100.0% 0 0 0 6 0 0 0 0Pacific Noncontiguous 2,766 2,888 -4.2% 2,274 2,340 492 548 0 0 0 0Alaska 0 1 -100.0% 0 1 0 0 0 0 0 0Hawaii 2,766 2,888 -4.2% 2,274 2,339 492 548 0 0 0 0U.S. Total 8,975 5,612 60.0% 5,052 4,356 3,766 1,162 0 0 157 94
Displayed values of zero may represent small values that round to zero.NM = Not meaningful due to large relative standard error or excessive percentage change.W = Withheld to avoid disclosure of individual company data.
Notes:See Glossary for definitions. Values are preliminary. See Technical Notes for a discussion of the sample design for the Form EIA-923.Totals may not equal sum of components because of independent rounding. Percentage change is calculated before rounding.Petroleum Liquids includes distillate and residual fuel oils.See the Technical Notes for fuel conversion factors.
Source: U.S. Energy Information Administration, Form EIA-923, "Power Plant Operations Report."
Table 4.7.B. Receipts of Petroleum Liquids Delivered for Electricity Generation by State, (Year-to-Date) April 2018 and 2017(Thousand Barrels)
Electric Power Sector
All Sectors Electric Utilities Independent Power Producers Commercial Sector Industrial Sector
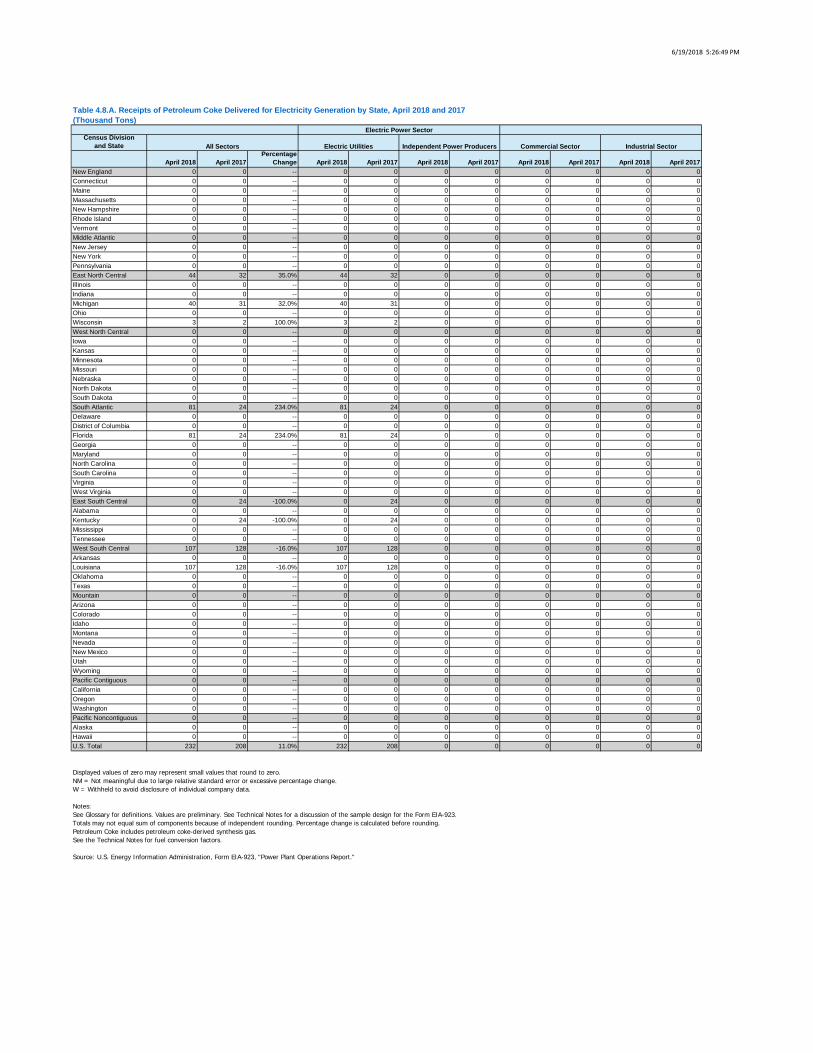
6/19/2018 5:26:49 PM
Census Divisionand State
April 2018 April 2017Percentage
Change April 2018 April 2017 April 2018 April 2017 April 2018 April 2017 April 2018 April 2017New England 0 0 -- 0 0 0 0 0 0 0 0Connecticut 0 0 -- 0 0 0 0 0 0 0 0Maine 0 0 -- 0 0 0 0 0 0 0 0Massachusetts 0 0 -- 0 0 0 0 0 0 0 0New Hampshire 0 0 -- 0 0 0 0 0 0 0 0Rhode Island 0 0 -- 0 0 0 0 0 0 0 0Vermont 0 0 -- 0 0 0 0 0 0 0 0Middle Atlantic 0 0 -- 0 0 0 0 0 0 0 0New Jersey 0 0 -- 0 0 0 0 0 0 0 0New York 0 0 -- 0 0 0 0 0 0 0 0Pennsylvania 0 0 -- 0 0 0 0 0 0 0 0East North Central 44 32 35.0% 44 32 0 0 0 0 0 0Illinois 0 0 -- 0 0 0 0 0 0 0 0Indiana 0 0 -- 0 0 0 0 0 0 0 0Michigan 40 31 32.0% 40 31 0 0 0 0 0 0Ohio 0 0 -- 0 0 0 0 0 0 0 0Wisconsin 3 2 100.0% 3 2 0 0 0 0 0 0West North Central 0 0 -- 0 0 0 0 0 0 0 0Iowa 0 0 -- 0 0 0 0 0 0 0 0Kansas 0 0 -- 0 0 0 0 0 0 0 0Minnesota 0 0 -- 0 0 0 0 0 0 0 0Missouri 0 0 -- 0 0 0 0 0 0 0 0Nebraska 0 0 -- 0 0 0 0 0 0 0 0North Dakota 0 0 -- 0 0 0 0 0 0 0 0South Dakota 0 0 -- 0 0 0 0 0 0 0 0South Atlantic 81 24 234.0% 81 24 0 0 0 0 0 0Delaware 0 0 -- 0 0 0 0 0 0 0 0District of Columbia 0 0 -- 0 0 0 0 0 0 0 0Florida 81 24 234.0% 81 24 0 0 0 0 0 0Georgia 0 0 -- 0 0 0 0 0 0 0 0Maryland 0 0 -- 0 0 0 0 0 0 0 0North Carolina 0 0 -- 0 0 0 0 0 0 0 0South Carolina 0 0 -- 0 0 0 0 0 0 0 0Virginia 0 0 -- 0 0 0 0 0 0 0 0West Virginia 0 0 -- 0 0 0 0 0 0 0 0East South Central 0 24 -100.0% 0 24 0 0 0 0 0 0Alabama 0 0 -- 0 0 0 0 0 0 0 0Kentucky 0 24 -100.0% 0 24 0 0 0 0 0 0Mississippi 0 0 -- 0 0 0 0 0 0 0 0Tennessee 0 0 -- 0 0 0 0 0 0 0 0West South Central 107 128 -16.0% 107 128 0 0 0 0 0 0Arkansas 0 0 -- 0 0 0 0 0 0 0 0Louisiana 107 128 -16.0% 107 128 0 0 0 0 0 0Oklahoma 0 0 -- 0 0 0 0 0 0 0 0Texas 0 0 -- 0 0 0 0 0 0 0 0Mountain 0 0 -- 0 0 0 0 0 0 0 0Arizona 0 0 -- 0 0 0 0 0 0 0 0Colorado 0 0 -- 0 0 0 0 0 0 0 0Idaho 0 0 -- 0 0 0 0 0 0 0 0Montana 0 0 -- 0 0 0 0 0 0 0 0Nevada 0 0 -- 0 0 0 0 0 0 0 0New Mexico 0 0 -- 0 0 0 0 0 0 0 0Utah 0 0 -- 0 0 0 0 0 0 0 0Wyoming 0 0 -- 0 0 0 0 0 0 0 0Pacific Contiguous 0 0 -- 0 0 0 0 0 0 0 0California 0 0 -- 0 0 0 0 0 0 0 0Oregon 0 0 -- 0 0 0 0 0 0 0 0Washington 0 0 -- 0 0 0 0 0 0 0 0Pacific Noncontiguous 0 0 -- 0 0 0 0 0 0 0 0Alaska 0 0 -- 0 0 0 0 0 0 0 0Hawaii 0 0 -- 0 0 0 0 0 0 0 0U.S. Total 232 208 11.0% 232 208 0 0 0 0 0 0
Displayed values of zero may represent small values that round to zero.NM = Not meaningful due to large relative standard error or excessive percentage change.W = Withheld to avoid disclosure of individual company data.
Notes:See Glossary for definitions. Values are preliminary. See Technical Notes for a discussion of the sample design for the Form EIA-923.Totals may not equal sum of components because of independent rounding. Percentage change is calculated before rounding.Petroleum Coke includes petroleum coke-derived synthesis gas.See the Technical Notes for fuel conversion factors.
Source: U.S. Energy Information Administration, Form EIA-923, "Power Plant Operations Report."
Table 4.8.A. Receipts of Petroleum Coke Delivered for Electricity Generation by State, April 2018 and 2017(Thousand Tons)
Electric Power Sector
All Sectors Electric Utilities Independent Power Producers Commercial Sector Industrial Sector
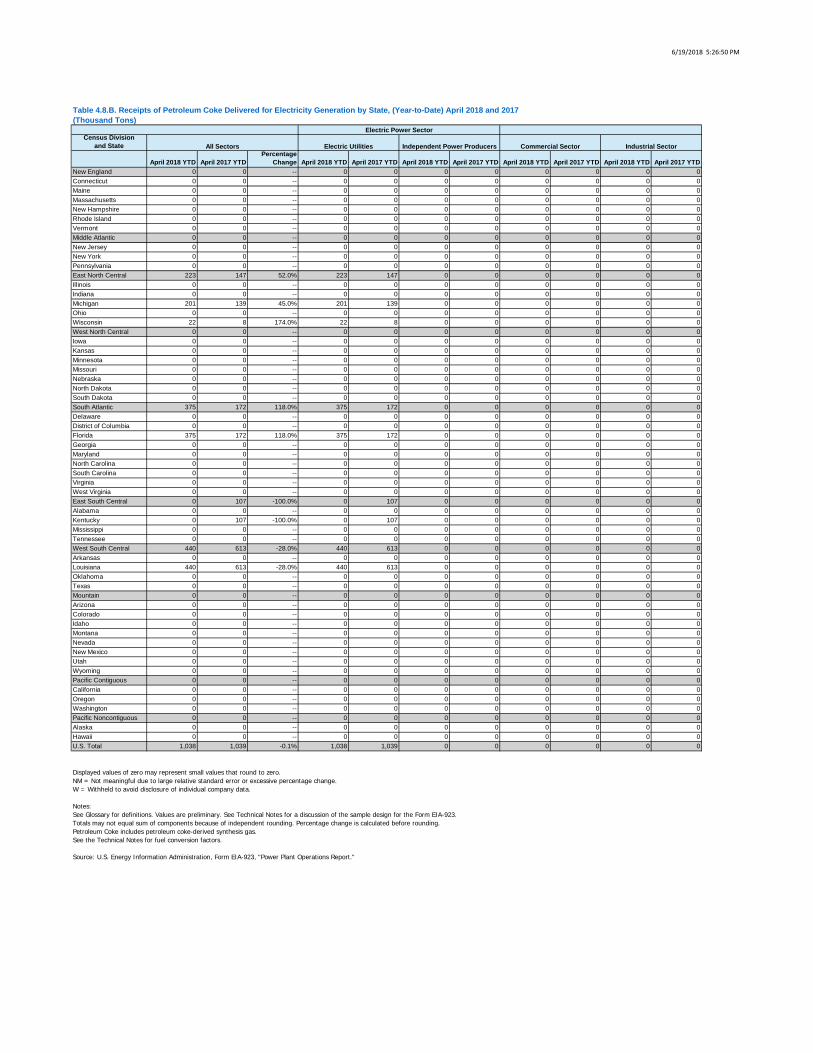
6/19/2018 5:26:50 PM
Census Divisionand State
April 2018 YTD April 2017 YTDPercentage
Change April 2018 YTD April 2017 YTD April 2018 YTD April 2017 YTD April 2018 YTD April 2017 YTD April 2018 YTD April 2017 YTDNew England 0 0 -- 0 0 0 0 0 0 0 0Connecticut 0 0 -- 0 0 0 0 0 0 0 0Maine 0 0 -- 0 0 0 0 0 0 0 0Massachusetts 0 0 -- 0 0 0 0 0 0 0 0New Hampshire 0 0 -- 0 0 0 0 0 0 0 0Rhode Island 0 0 -- 0 0 0 0 0 0 0 0Vermont 0 0 -- 0 0 0 0 0 0 0 0Middle Atlantic 0 0 -- 0 0 0 0 0 0 0 0New Jersey 0 0 -- 0 0 0 0 0 0 0 0New York 0 0 -- 0 0 0 0 0 0 0 0Pennsylvania 0 0 -- 0 0 0 0 0 0 0 0East North Central 223 147 52.0% 223 147 0 0 0 0 0 0Illinois 0 0 -- 0 0 0 0 0 0 0 0Indiana 0 0 -- 0 0 0 0 0 0 0 0Michigan 201 139 45.0% 201 139 0 0 0 0 0 0Ohio 0 0 -- 0 0 0 0 0 0 0 0Wisconsin 22 8 174.0% 22 8 0 0 0 0 0 0West North Central 0 0 -- 0 0 0 0 0 0 0 0Iowa 0 0 -- 0 0 0 0 0 0 0 0Kansas 0 0 -- 0 0 0 0 0 0 0 0Minnesota 0 0 -- 0 0 0 0 0 0 0 0Missouri 0 0 -- 0 0 0 0 0 0 0 0Nebraska 0 0 -- 0 0 0 0 0 0 0 0North Dakota 0 0 -- 0 0 0 0 0 0 0 0South Dakota 0 0 -- 0 0 0 0 0 0 0 0South Atlantic 375 172 118.0% 375 172 0 0 0 0 0 0Delaware 0 0 -- 0 0 0 0 0 0 0 0District of Columbia 0 0 -- 0 0 0 0 0 0 0 0Florida 375 172 118.0% 375 172 0 0 0 0 0 0Georgia 0 0 -- 0 0 0 0 0 0 0 0Maryland 0 0 -- 0 0 0 0 0 0 0 0North Carolina 0 0 -- 0 0 0 0 0 0 0 0South Carolina 0 0 -- 0 0 0 0 0 0 0 0Virginia 0 0 -- 0 0 0 0 0 0 0 0West Virginia 0 0 -- 0 0 0 0 0 0 0 0East South Central 0 107 -100.0% 0 107 0 0 0 0 0 0Alabama 0 0 -- 0 0 0 0 0 0 0 0Kentucky 0 107 -100.0% 0 107 0 0 0 0 0 0Mississippi 0 0 -- 0 0 0 0 0 0 0 0Tennessee 0 0 -- 0 0 0 0 0 0 0 0West South Central 440 613 -28.0% 440 613 0 0 0 0 0 0Arkansas 0 0 -- 0 0 0 0 0 0 0 0Louisiana 440 613 -28.0% 440 613 0 0 0 0 0 0Oklahoma 0 0 -- 0 0 0 0 0 0 0 0Texas 0 0 -- 0 0 0 0 0 0 0 0Mountain 0 0 -- 0 0 0 0 0 0 0 0Arizona 0 0 -- 0 0 0 0 0 0 0 0Colorado 0 0 -- 0 0 0 0 0 0 0 0Idaho 0 0 -- 0 0 0 0 0 0 0 0Montana 0 0 -- 0 0 0 0 0 0 0 0Nevada 0 0 -- 0 0 0 0 0 0 0 0New Mexico 0 0 -- 0 0 0 0 0 0 0 0Utah 0 0 -- 0 0 0 0 0 0 0 0Wyoming 0 0 -- 0 0 0 0 0 0 0 0Pacific Contiguous 0 0 -- 0 0 0 0 0 0 0 0California 0 0 -- 0 0 0 0 0 0 0 0Oregon 0 0 -- 0 0 0 0 0 0 0 0Washington 0 0 -- 0 0 0 0 0 0 0 0Pacific Noncontiguous 0 0 -- 0 0 0 0 0 0 0 0Alaska 0 0 -- 0 0 0 0 0 0 0 0Hawaii 0 0 -- 0 0 0 0 0 0 0 0U.S. Total 1,038 1,039 -0.1% 1,038 1,039 0 0 0 0 0 0
Displayed values of zero may represent small values that round to zero.NM = Not meaningful due to large relative standard error or excessive percentage change.W = Withheld to avoid disclosure of individual company data.
Notes:See Glossary for definitions. Values are preliminary. See Technical Notes for a discussion of the sample design for the Form EIA-923.Totals may not equal sum of components because of independent rounding. Percentage change is calculated before rounding.Petroleum Coke includes petroleum coke-derived synthesis gas.See the Technical Notes for fuel conversion factors.
Source: U.S. Energy Information Administration, Form EIA-923, "Power Plant Operations Report."
Table 4.8.B. Receipts of Petroleum Coke Delivered for Electricity Generation by State, (Year-to-Date) April 2018 and 2017(Thousand Tons)
Electric Power Sector
All Sectors Electric Utilities Independent Power Producers Commercial Sector Industrial Sector
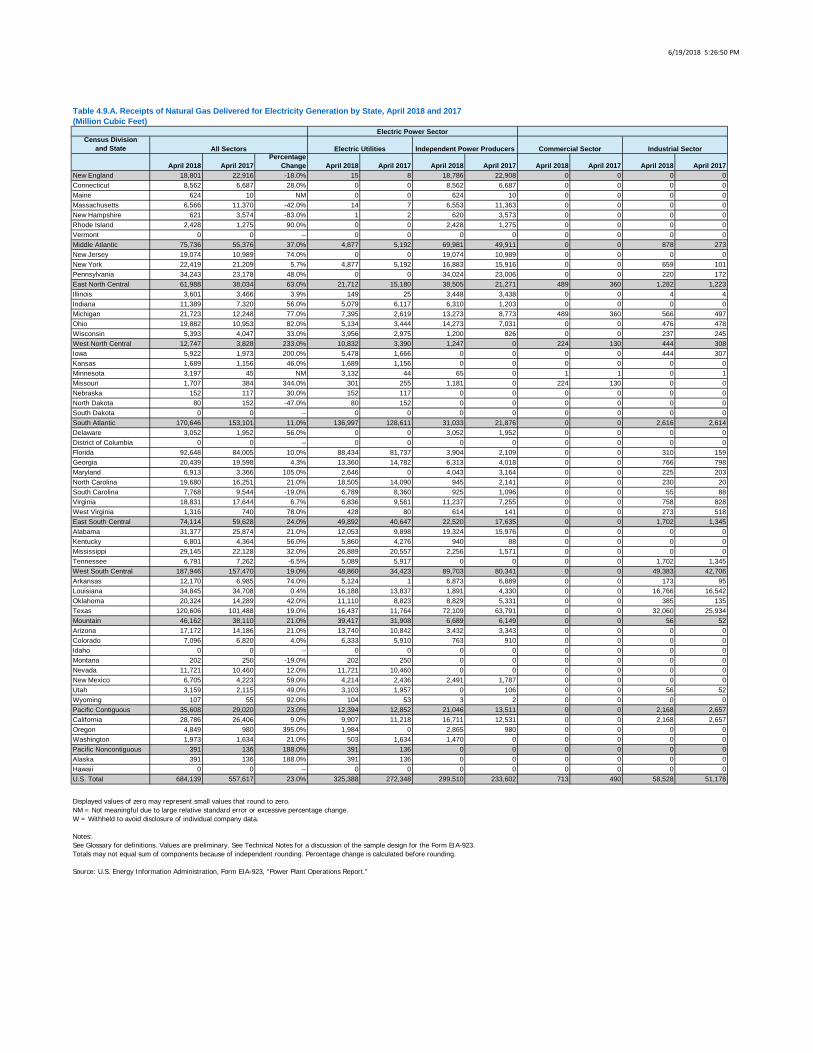
6/19/2018 5:26:50 PM
Census Divisionand State
April 2018 April 2017Percentage
Change April 2018 April 2017 April 2018 April 2017 April 2018 April 2017 April 2018 April 2017New England 18,801 22,916 -18.0% 15 8 18,786 22,908 0 0 0 0Connecticut 8,562 6,687 28.0% 0 0 8,562 6,687 0 0 0 0Maine 624 10 NM 0 0 624 10 0 0 0 0Massachusetts 6,566 11,370 -42.0% 14 7 6,553 11,363 0 0 0 0New Hampshire 621 3,574 -83.0% 1 2 620 3,573 0 0 0 0Rhode Island 2,428 1,275 90.0% 0 0 2,428 1,275 0 0 0 0Vermont 0 0 -- 0 0 0 0 0 0 0 0Middle Atlantic 75,736 55,376 37.0% 4,877 5,192 69,981 49,911 0 0 878 273New Jersey 19,074 10,989 74.0% 0 0 19,074 10,989 0 0 0 0New York 22,419 21,209 5.7% 4,877 5,192 16,883 15,916 0 0 659 101Pennsylvania 34,243 23,178 48.0% 0 0 34,024 23,006 0 0 220 172East North Central 61,988 38,034 63.0% 21,712 15,180 38,505 21,271 489 360 1,282 1,223Illinois 3,601 3,466 3.9% 149 25 3,448 3,438 0 0 4 4Indiana 11,389 7,320 56.0% 5,079 6,117 6,310 1,203 0 0 0 0Michigan 21,723 12,248 77.0% 7,395 2,619 13,273 8,773 489 360 566 497Ohio 19,882 10,953 82.0% 5,134 3,444 14,273 7,031 0 0 476 478Wisconsin 5,393 4,047 33.0% 3,956 2,975 1,200 826 0 0 237 245West North Central 12,747 3,828 233.0% 10,832 3,390 1,247 0 224 130 444 308Iowa 5,922 1,973 200.0% 5,478 1,666 0 0 0 0 444 307Kansas 1,689 1,156 46.0% 1,689 1,156 0 0 0 0 0 0Minnesota 3,197 45 NM 3,132 44 65 0 1 1 0 1Missouri 1,707 384 344.0% 301 255 1,181 0 224 130 0 0Nebraska 152 117 30.0% 152 117 0 0 0 0 0 0North Dakota 80 152 -47.0% 80 152 0 0 0 0 0 0South Dakota 0 0 -- 0 0 0 0 0 0 0 0South Atlantic 170,646 153,101 11.0% 136,997 128,611 31,033 21,876 0 0 2,616 2,614Delaware 3,052 1,952 56.0% 0 0 3,052 1,952 0 0 0 0District of Columbia 0 0 -- 0 0 0 0 0 0 0 0Florida 92,648 84,005 10.0% 88,434 81,737 3,904 2,109 0 0 310 159Georgia 20,439 19,598 4.3% 13,360 14,782 6,313 4,018 0 0 766 798Maryland 6,913 3,366 105.0% 2,646 0 4,043 3,164 0 0 225 203North Carolina 19,680 16,251 21.0% 18,505 14,090 945 2,141 0 0 230 20South Carolina 7,768 9,544 -19.0% 6,789 8,360 925 1,096 0 0 55 88Virginia 18,831 17,644 6.7% 6,836 9,561 11,237 7,255 0 0 758 828West Virginia 1,316 740 78.0% 428 80 614 141 0 0 273 518East South Central 74,114 59,628 24.0% 49,892 40,647 22,520 17,635 0 0 1,702 1,345Alabama 31,377 25,874 21.0% 12,053 9,898 19,324 15,976 0 0 0 0Kentucky 6,801 4,364 56.0% 5,860 4,276 940 88 0 0 0 0Mississippi 29,145 22,128 32.0% 26,889 20,557 2,256 1,571 0 0 0 0Tennessee 6,791 7,262 -6.5% 5,089 5,917 0 0 0 0 1,702 1,345West South Central 187,946 157,470 19.0% 48,860 34,423 89,703 80,341 0 0 49,383 42,706Arkansas 12,170 6,985 74.0% 5,124 1 6,873 6,889 0 0 173 95Louisiana 34,845 34,708 0.4% 16,188 13,837 1,891 4,330 0 0 16,766 16,542Oklahoma 20,324 14,289 42.0% 11,110 8,823 8,829 5,331 0 0 385 135Texas 120,606 101,488 19.0% 16,437 11,764 72,109 63,791 0 0 32,060 25,934Mountain 46,162 38,110 21.0% 39,417 31,908 6,689 6,149 0 0 56 52Arizona 17,172 14,186 21.0% 13,740 10,842 3,432 3,343 0 0 0 0Colorado 7,096 6,820 4.0% 6,333 5,910 763 910 0 0 0 0Idaho 0 0 -- 0 0 0 0 0 0 0 0Montana 202 250 -19.0% 202 250 0 0 0 0 0 0Nevada 11,721 10,460 12.0% 11,721 10,460 0 0 0 0 0 0New Mexico 6,705 4,223 59.0% 4,214 2,436 2,491 1,787 0 0 0 0Utah 3,159 2,115 49.0% 3,103 1,957 0 106 0 0 56 52Wyoming 107 55 92.0% 104 53 3 2 0 0 0 0Pacific Contiguous 35,608 29,020 23.0% 12,394 12,852 21,046 13,511 0 0 2,168 2,657California 28,786 26,406 9.0% 9,907 11,218 16,711 12,531 0 0 2,168 2,657Oregon 4,849 980 395.0% 1,984 0 2,865 980 0 0 0 0Washington 1,973 1,634 21.0% 503 1,634 1,470 0 0 0 0 0Pacific Noncontiguous 391 136 188.0% 391 136 0 0 0 0 0 0Alaska 391 136 188.0% 391 136 0 0 0 0 0 0Hawaii 0 0 -- 0 0 0 0 0 0 0 0U.S. Total 684,139 557,617 23.0% 325,388 272,348 299,510 233,602 713 490 58,528 51,178
Displayed values of zero may represent small values that round to zero.NM = Not meaningful due to large relative standard error or excessive percentage change.W = Withheld to avoid disclosure of individual company data.
Notes:See Glossary for definitions. Values are preliminary. See Technical Notes for a discussion of the sample design for the Form EIA-923.Totals may not equal sum of components because of independent rounding. Percentage change is calculated before rounding.
Source: U.S. Energy Information Administration, Form EIA-923, "Power Plant Operations Report."
Table 4.9.A. Receipts of Natural Gas Delivered for Electricity Generation by State, April 2018 and 2017(Million Cubic Feet)
Electric Power Sector
All Sectors Electric Utilities Independent Power Producers Commercial Sector Industrial Sector
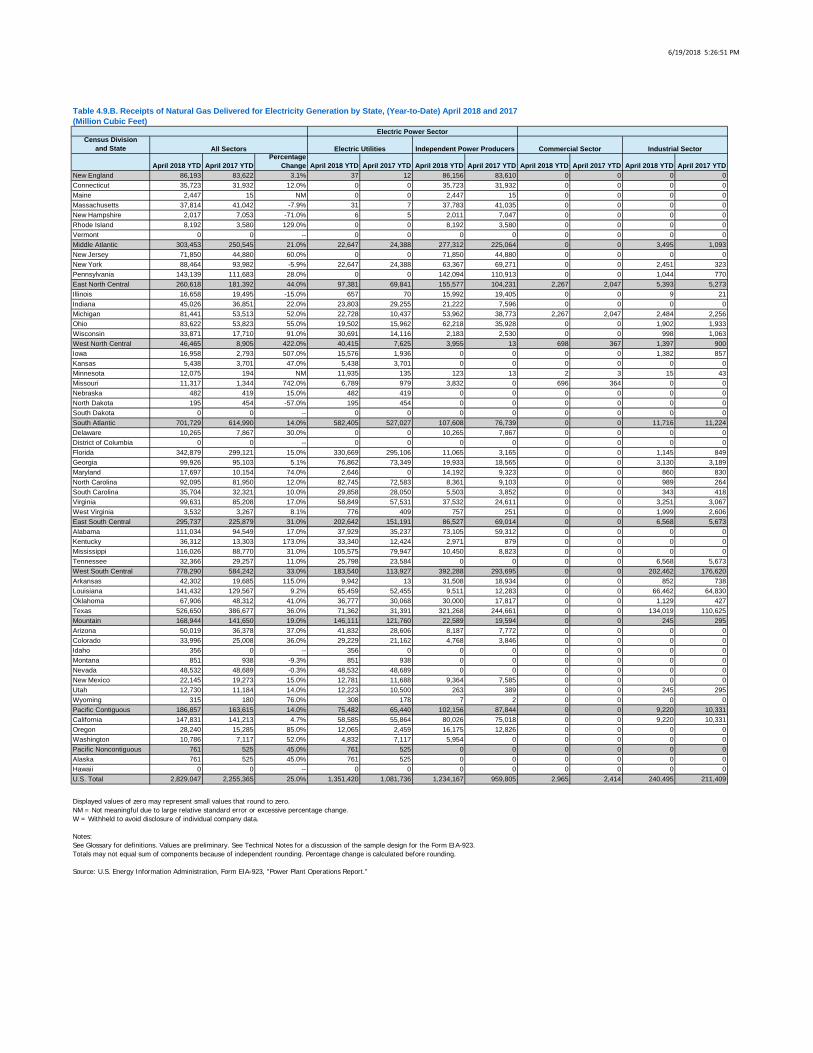
6/19/2018 5:26:51 PM
Census Divisionand State
April 2018 YTD April 2017 YTDPercentage
Change April 2018 YTD April 2017 YTD April 2018 YTD April 2017 YTD April 2018 YTD April 2017 YTD April 2018 YTD April 2017 YTDNew England 86,193 83,622 3.1% 37 12 86,156 83,610 0 0 0 0Connecticut 35,723 31,932 12.0% 0 0 35,723 31,932 0 0 0 0Maine 2,447 15 NM 0 0 2,447 15 0 0 0 0Massachusetts 37,814 41,042 -7.9% 31 7 37,783 41,035 0 0 0 0New Hampshire 2,017 7,053 -71.0% 6 5 2,011 7,047 0 0 0 0Rhode Island 8,192 3,580 129.0% 0 0 8,192 3,580 0 0 0 0Vermont 0 0 -- 0 0 0 0 0 0 0 0Middle Atlantic 303,453 250,545 21.0% 22,647 24,388 277,312 225,064 0 0 3,495 1,093New Jersey 71,850 44,880 60.0% 0 0 71,850 44,880 0 0 0 0New York 88,464 93,982 -5.9% 22,647 24,388 63,367 69,271 0 0 2,451 323Pennsylvania 143,139 111,683 28.0% 0 0 142,094 110,913 0 0 1,044 770East North Central 260,618 181,392 44.0% 97,381 69,841 155,577 104,231 2,267 2,047 5,393 5,273Illinois 16,658 19,495 -15.0% 657 70 15,992 19,405 0 0 9 21Indiana 45,026 36,851 22.0% 23,803 29,255 21,222 7,596 0 0 0 0Michigan 81,441 53,513 52.0% 22,728 10,437 53,962 38,773 2,267 2,047 2,484 2,256Ohio 83,622 53,823 55.0% 19,502 15,962 62,218 35,928 0 0 1,902 1,933Wisconsin 33,871 17,710 91.0% 30,691 14,116 2,183 2,530 0 0 998 1,063West North Central 46,465 8,905 422.0% 40,415 7,625 3,955 13 698 367 1,397 900Iowa 16,958 2,793 507.0% 15,576 1,936 0 0 0 0 1,382 857Kansas 5,438 3,701 47.0% 5,438 3,701 0 0 0 0 0 0Minnesota 12,075 194 NM 11,935 135 123 13 2 3 15 43Missouri 11,317 1,344 742.0% 6,789 979 3,832 0 696 364 0 0Nebraska 482 419 15.0% 482 419 0 0 0 0 0 0North Dakota 195 454 -57.0% 195 454 0 0 0 0 0 0South Dakota 0 0 -- 0 0 0 0 0 0 0 0South Atlantic 701,729 614,990 14.0% 582,405 527,027 107,608 76,739 0 0 11,716 11,224Delaware 10,265 7,867 30.0% 0 0 10,265 7,867 0 0 0 0District of Columbia 0 0 -- 0 0 0 0 0 0 0 0Florida 342,879 299,121 15.0% 330,669 295,106 11,065 3,165 0 0 1,145 849Georgia 99,926 95,103 5.1% 76,862 73,349 19,933 18,565 0 0 3,130 3,189Maryland 17,697 10,154 74.0% 2,646 0 14,192 9,323 0 0 860 830North Carolina 92,095 81,950 12.0% 82,745 72,583 8,361 9,103 0 0 989 264South Carolina 35,704 32,321 10.0% 29,858 28,050 5,503 3,852 0 0 343 418Virginia 99,631 85,208 17.0% 58,849 57,531 37,532 24,611 0 0 3,251 3,067West Virginia 3,532 3,267 8.1% 776 409 757 251 0 0 1,999 2,606East South Central 295,737 225,879 31.0% 202,642 151,191 86,527 69,014 0 0 6,568 5,673Alabama 111,034 94,549 17.0% 37,929 35,237 73,105 59,312 0 0 0 0Kentucky 36,312 13,303 173.0% 33,340 12,424 2,971 879 0 0 0 0Mississippi 116,026 88,770 31.0% 105,575 79,947 10,450 8,823 0 0 0 0Tennessee 32,366 29,257 11.0% 25,798 23,584 0 0 0 0 6,568 5,673West South Central 778,290 584,242 33.0% 183,540 113,927 392,288 293,695 0 0 202,462 176,620Arkansas 42,302 19,685 115.0% 9,942 13 31,508 18,934 0 0 852 738Louisiana 141,432 129,567 9.2% 65,459 52,455 9,511 12,283 0 0 66,462 64,830Oklahoma 67,906 48,312 41.0% 36,777 30,068 30,000 17,817 0 0 1,129 427Texas 526,650 386,677 36.0% 71,362 31,391 321,268 244,661 0 0 134,019 110,625Mountain 168,944 141,650 19.0% 146,111 121,760 22,589 19,594 0 0 245 295Arizona 50,019 36,378 37.0% 41,832 28,606 8,187 7,772 0 0 0 0Colorado 33,996 25,008 36.0% 29,229 21,162 4,768 3,846 0 0 0 0Idaho 356 0 -- 356 0 0 0 0 0 0 0Montana 851 938 -9.3% 851 938 0 0 0 0 0 0Nevada 48,532 48,689 -0.3% 48,532 48,689 0 0 0 0 0 0New Mexico 22,145 19,273 15.0% 12,781 11,688 9,364 7,585 0 0 0 0Utah 12,730 11,184 14.0% 12,223 10,500 263 389 0 0 245 295Wyoming 315 180 76.0% 308 178 7 2 0 0 0 0Pacific Contiguous 186,857 163,615 14.0% 75,482 65,440 102,156 87,844 0 0 9,220 10,331California 147,831 141,213 4.7% 58,585 55,864 80,026 75,018 0 0 9,220 10,331Oregon 28,240 15,285 85.0% 12,065 2,459 16,175 12,826 0 0 0 0Washington 10,786 7,117 52.0% 4,832 7,117 5,954 0 0 0 0 0Pacific Noncontiguous 761 525 45.0% 761 525 0 0 0 0 0 0Alaska 761 525 45.0% 761 525 0 0 0 0 0 0Hawaii 0 0 -- 0 0 0 0 0 0 0 0U.S. Total 2,829,047 2,255,365 25.0% 1,351,420 1,081,736 1,234,167 959,805 2,965 2,414 240,495 211,409
Displayed values of zero may represent small values that round to zero.NM = Not meaningful due to large relative standard error or excessive percentage change.W = Withheld to avoid disclosure of individual company data.
Notes:See Glossary for definitions. Values are preliminary. See Technical Notes for a discussion of the sample design for the Form EIA-923.Totals may not equal sum of components because of independent rounding. Percentage change is calculated before rounding.
Source: U.S. Energy Information Administration, Form EIA-923, "Power Plant Operations Report."
Table 4.9.B. Receipts of Natural Gas Delivered for Electricity Generation by State, (Year-to-Date) April 2018 and 2017(Million Cubic Feet)
Electric Power Sector
All Sectors Electric Utilities Independent Power Producers Commercial Sector Industrial Sector

6/19/2018 5:26:52 PM
Census Divisionand State
April 2018 April 2017Percentage
Change April 2018 April 2017 April 2018 April 2017New England W W W -- -- W WConnecticut -- -- -- -- -- -- --Maine W W W -- -- W WMassachusetts -- -- -- -- -- -- --New Hampshire -- -- -- -- -- -- --Rhode Island -- -- -- -- -- -- --Vermont -- -- -- -- -- -- --Middle Atlantic 2.28 1.99 15.0% -- -- 2.28 1.99New Jersey W W W -- -- W WNew York -- W W -- -- -- WPennsylvania W W W -- -- W WEast North Central 2.00 2.03 -1.5% 2.11 2.11 1.82 1.89Illinois 1.79 W W 1.89 1.82 1.76 WIndiana W W W 2.11 2.18 W WMichigan W W W 2.16 2.18 W WOhio W 1.90 W 1.77 1.72 W 1.96Wisconsin 2.30 2.24 2.7% 2.30 2.24 -- --West North Central 1.72 1.80 -4.4% 1.72 1.80 -- --Iowa 1.79 1.73 3.5% 1.79 1.73 -- --Kansas 1.73 1.84 -6.0% 1.73 1.84 -- --Minnesota 2.20 2.11 4.3% 2.20 2.11 -- --Missouri 1.81 1.86 -2.7% 1.81 1.86 -- --Nebraska 1.30 1.37 -5.1% 1.30 1.37 -- --North Dakota 1.54 1.76 -13.0% 1.54 1.76 -- --South Dakota 2.02 2.34 -14.0% 2.02 2.34 -- --South Atlantic 2.65 2.69 -1.5% 2.71 2.73 2.30 2.41Delaware -- W W -- -- -- WDistrict of Columbia -- -- -- -- -- -- --Florida 2.85 2.85 0.0% 2.85 2.85 -- --Georgia 2.79 2.77 0.7% 2.79 2.77 -- --Maryland 2.64 2.85 -7.4% -- -- 2.64 2.85North Carolina W W W 3.08 2.97 W WSouth Carolina 3.35 3.26 2.8% 3.35 3.26 -- --Virginia W W W 2.64 2.75 W WWest Virginia W W W 2.14 2.18 W WEast South Central W W W 2.09 2.04 W WAlabama 2.36 2.14 10.0% 2.36 2.14 -- --Kentucky 1.92 1.95 -1.5% 1.92 1.95 -- --Mississippi W W W 2.61 2.04 W WTennessee 2.10 2.37 -11.0% 2.10 2.37 -- --West South Central 1.78 2.02 -12.0% 1.92 2.12 1.63 1.95Arkansas W W W 1.95 2.02 W WLouisiana W W W 2.05 2.51 W WOklahoma W W W 1.77 1.93 W WTexas 1.70 W W 1.92 2.15 1.55 WMountain W W W 2.02 1.91 W WArizona 2.40 2.25 6.7% 2.40 2.25 -- --Colorado 1.59 1.88 -15.0% 1.59 1.88 -- --Idaho -- -- -- -- -- -- --Montana W W W -- 1.60 W WNevada W W W -- -- W WNew Mexico 2.37 1.83 30.0% 2.37 1.83 -- --Utah 2.06 1.95 5.6% 2.06 1.95 -- --Wyoming W W W 1.78 1.66 W WPacific Contiguous W W W -- -- W WCalifornia -- -- -- -- -- -- --Oregon -- -- -- -- -- -- --Washington W W W -- -- W WPacific Noncontiguous W W W 3.32 3.01 W WAlaska 3.32 3.01 10.0% 3.32 3.01 -- --Hawaii W W W -- -- W WU.S. Total 2.06 2.10 -1.9% 2.12 2.15 1.88 1.97
Displayed values of zero may represent small values that round to zero.NM = Not meaningful due to large relative standard error or excessive percentage change.W = Withheld to avoid disclosure of individual company data.
Notes:See Glossary for definitions. Values are preliminary.See Technical Notes for a discussion of the sample design for the Form EIA-923.Totals may not equal sum of components because of independent rounding. Percentage change is calculated before rounding.Coal includes anthracite, bituminous, subbituminous, lignite, waste coal, and coal-derived synthesis gas.
Source: U.S. Energy Information Administration, Form EIA-923, "Power Plant Operations Report."
Table 4.10.A. Average Cost of Coal Delivered for Electricity Generation by State, April 2018 and 2017(Dollars per MMBtu)
Electric Power Sector Electric Utilities Independent Power Producers
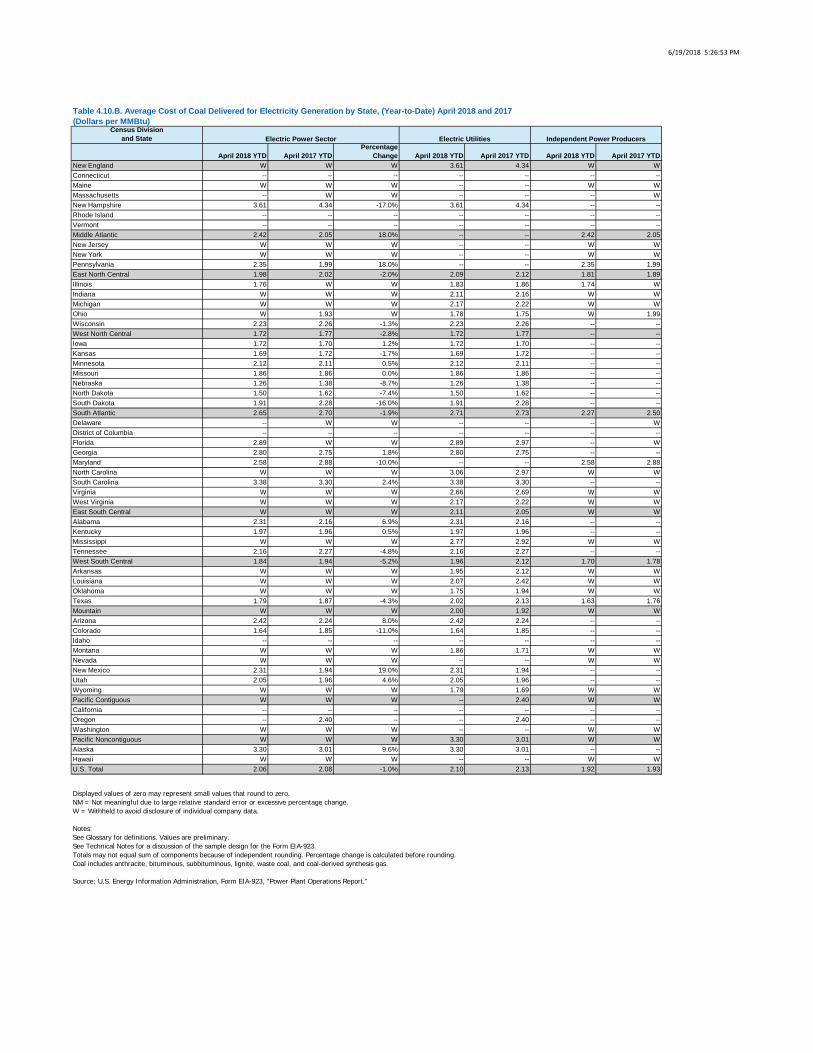
6/19/2018 5:26:53 PM
Census Divisionand State
April 2018 YTD April 2017 YTDPercentage
Change April 2018 YTD April 2017 YTD April 2018 YTD April 2017 YTDNew England W W W 3.61 4.34 W WConnecticut -- -- -- -- -- -- --Maine W W W -- -- W WMassachusetts -- W W -- -- -- WNew Hampshire 3.61 4.34 -17.0% 3.61 4.34 -- --Rhode Island -- -- -- -- -- -- --Vermont -- -- -- -- -- -- --Middle Atlantic 2.42 2.05 18.0% -- -- 2.42 2.05New Jersey W W W -- -- W WNew York W W W -- -- W WPennsylvania 2.35 1.99 18.0% -- -- 2.35 1.99East North Central 1.98 2.02 -2.0% 2.09 2.12 1.81 1.89Illinois 1.76 W W 1.83 1.86 1.74 WIndiana W W W 2.11 2.16 W WMichigan W W W 2.17 2.22 W WOhio W 1.93 W 1.78 1.75 W 1.99Wisconsin 2.23 2.26 -1.3% 2.23 2.26 -- --West North Central 1.72 1.77 -2.8% 1.72 1.77 -- --Iowa 1.72 1.70 1.2% 1.72 1.70 -- --Kansas 1.69 1.72 -1.7% 1.69 1.72 -- --Minnesota 2.12 2.11 0.5% 2.12 2.11 -- --Missouri 1.86 1.86 0.0% 1.86 1.86 -- --Nebraska 1.26 1.38 -8.7% 1.26 1.38 -- --North Dakota 1.50 1.62 -7.4% 1.50 1.62 -- --South Dakota 1.91 2.28 -16.0% 1.91 2.28 -- --South Atlantic 2.65 2.70 -1.9% 2.71 2.73 2.27 2.50Delaware -- W W -- -- -- WDistrict of Columbia -- -- -- -- -- -- --Florida 2.89 W W 2.89 2.97 -- WGeorgia 2.80 2.75 1.8% 2.80 2.75 -- --Maryland 2.58 2.88 -10.0% -- -- 2.58 2.88North Carolina W W W 3.06 2.97 W WSouth Carolina 3.38 3.30 2.4% 3.38 3.30 -- --Virginia W W W 2.66 2.69 W WWest Virginia W W W 2.17 2.22 W WEast South Central W W W 2.11 2.05 W WAlabama 2.31 2.16 6.9% 2.31 2.16 -- --Kentucky 1.97 1.96 0.5% 1.97 1.96 -- --Mississippi W W W 2.77 2.92 W WTennessee 2.16 2.27 -4.8% 2.16 2.27 -- --West South Central 1.84 1.94 -5.2% 1.96 2.12 1.70 1.78Arkansas W W W 1.95 2.12 W WLouisiana W W W 2.07 2.42 W WOklahoma W W W 1.75 1.94 W WTexas 1.79 1.87 -4.3% 2.02 2.13 1.63 1.76Mountain W W W 2.00 1.92 W WArizona 2.42 2.24 8.0% 2.42 2.24 -- --Colorado 1.64 1.85 -11.0% 1.64 1.85 -- --Idaho -- -- -- -- -- -- --Montana W W W 1.86 1.71 W WNevada W W W -- -- W WNew Mexico 2.31 1.94 19.0% 2.31 1.94 -- --Utah 2.05 1.96 4.6% 2.05 1.96 -- --Wyoming W W W 1.79 1.69 W WPacific Contiguous W W W -- 2.40 W WCalifornia -- -- -- -- -- -- --Oregon -- 2.40 -- -- 2.40 -- --Washington W W W -- -- W WPacific Noncontiguous W W W 3.30 3.01 W WAlaska 3.30 3.01 9.6% 3.30 3.01 -- --Hawaii W W W -- -- W WU.S. Total 2.06 2.08 -1.0% 2.10 2.13 1.92 1.93
Displayed values of zero may represent small values that round to zero.NM = Not meaningful due to large relative standard error or excessive percentage change.W = Withheld to avoid disclosure of individual company data.
Notes:See Glossary for definitions. Values are preliminary.See Technical Notes for a discussion of the sample design for the Form EIA-923.Totals may not equal sum of components because of independent rounding. Percentage change is calculated before rounding.Coal includes anthracite, bituminous, subbituminous, lignite, waste coal, and coal-derived synthesis gas.
Source: U.S. Energy Information Administration, Form EIA-923, "Power Plant Operations Report."
Table 4.10.B. Average Cost of Coal Delivered for Electricity Generation by State, (Year-to-Date) April 2018 and 2017(Dollars per MMBtu)
Electric Power Sector Electric Utilities Independent Power Producers
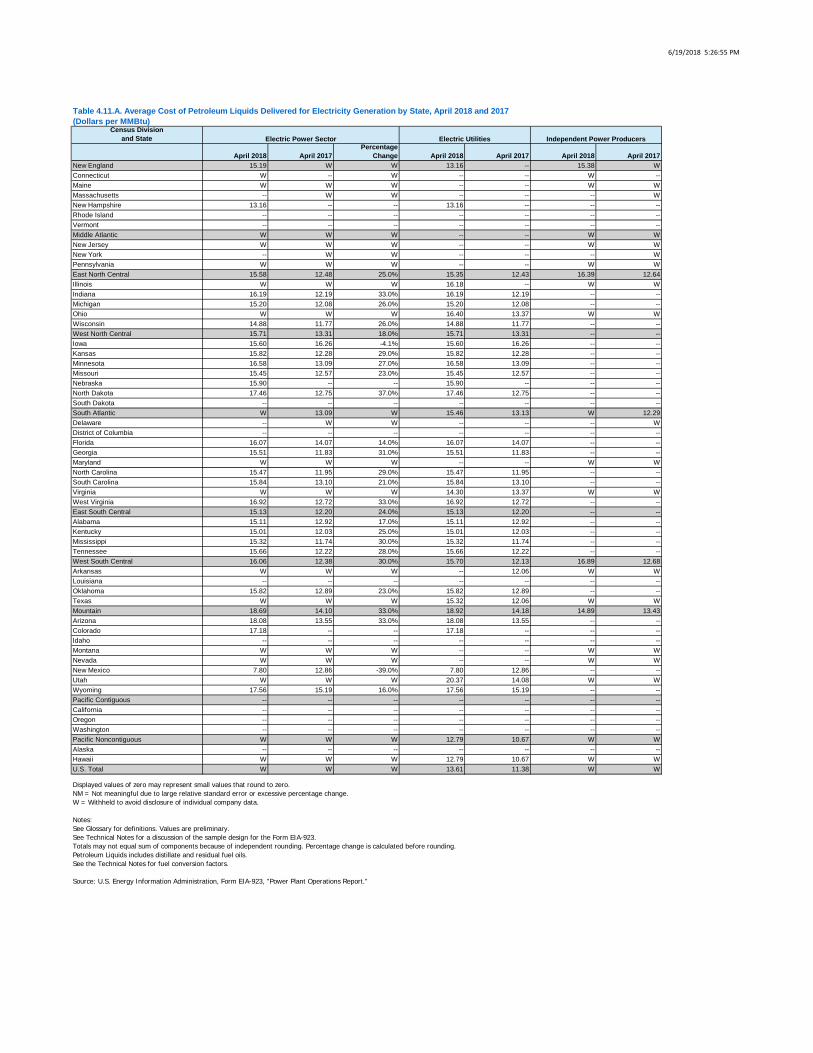
6/19/2018 5:26:55 PM
Census Divisionand State
April 2018 April 2017Percentage
Change April 2018 April 2017 April 2018 April 2017New England 15.19 W W 13.16 -- 15.38 WConnecticut W -- W -- -- W --Maine W W W -- -- W WMassachusetts -- W W -- -- -- WNew Hampshire 13.16 -- -- 13.16 -- -- --Rhode Island -- -- -- -- -- -- --Vermont -- -- -- -- -- -- --Middle Atlantic W W W -- -- W WNew Jersey W W W -- -- W WNew York -- W W -- -- -- WPennsylvania W W W -- -- W WEast North Central 15.58 12.48 25.0% 15.35 12.43 16.39 12.64Illinois W W W 16.18 -- W WIndiana 16.19 12.19 33.0% 16.19 12.19 -- --Michigan 15.20 12.08 26.0% 15.20 12.08 -- --Ohio W W W 16.40 13.37 W WWisconsin 14.88 11.77 26.0% 14.88 11.77 -- --West North Central 15.71 13.31 18.0% 15.71 13.31 -- --Iowa 15.60 16.26 -4.1% 15.60 16.26 -- --Kansas 15.82 12.28 29.0% 15.82 12.28 -- --Minnesota 16.58 13.09 27.0% 16.58 13.09 -- --Missouri 15.45 12.57 23.0% 15.45 12.57 -- --Nebraska 15.90 -- -- 15.90 -- -- --North Dakota 17.46 12.75 37.0% 17.46 12.75 -- --South Dakota -- -- -- -- -- -- --South Atlantic W 13.09 W 15.46 13.13 W 12.29Delaware -- W W -- -- -- WDistrict of Columbia -- -- -- -- -- -- --Florida 16.07 14.07 14.0% 16.07 14.07 -- --Georgia 15.51 11.83 31.0% 15.51 11.83 -- --Maryland W W W -- -- W WNorth Carolina 15.47 11.95 29.0% 15.47 11.95 -- --South Carolina 15.84 13.10 21.0% 15.84 13.10 -- --Virginia W W W 14.30 13.37 W WWest Virginia 16.92 12.72 33.0% 16.92 12.72 -- --East South Central 15.13 12.20 24.0% 15.13 12.20 -- --Alabama 15.11 12.92 17.0% 15.11 12.92 -- --Kentucky 15.01 12.03 25.0% 15.01 12.03 -- --Mississippi 15.32 11.74 30.0% 15.32 11.74 -- --Tennessee 15.66 12.22 28.0% 15.66 12.22 -- --West South Central 16.06 12.38 30.0% 15.70 12.13 16.89 12.68Arkansas W W W -- 12.06 W WLouisiana -- -- -- -- -- -- --Oklahoma 15.82 12.89 23.0% 15.82 12.89 -- --Texas W W W 15.32 12.06 W WMountain 18.69 14.10 33.0% 18.92 14.18 14.89 13.43Arizona 18.08 13.55 33.0% 18.08 13.55 -- --Colorado 17.18 -- -- 17.18 -- -- --Idaho -- -- -- -- -- -- --Montana W W W -- -- W WNevada W W W -- -- W WNew Mexico 7.80 12.86 -39.0% 7.80 12.86 -- --Utah W W W 20.37 14.08 W WWyoming 17.56 15.19 16.0% 17.56 15.19 -- --Pacific Contiguous -- -- -- -- -- -- --California -- -- -- -- -- -- --Oregon -- -- -- -- -- -- --Washington -- -- -- -- -- -- --Pacific Noncontiguous W W W 12.79 10.67 W WAlaska -- -- -- -- -- -- --Hawaii W W W 12.79 10.67 W WU.S. Total W W W 13.61 11.38 W W
Displayed values of zero may represent small values that round to zero.NM = Not meaningful due to large relative standard error or excessive percentage change.W = Withheld to avoid disclosure of individual company data.
Notes:See Glossary for definitions. Values are preliminary.See Technical Notes for a discussion of the sample design for the Form EIA-923.Totals may not equal sum of components because of independent rounding. Percentage change is calculated before rounding.Petroleum Liquids includes distillate and residual fuel oils.See the Technical Notes for fuel conversion factors.
Source: U.S. Energy Information Administration, Form EIA-923, "Power Plant Operations Report."
Table 4.11.A. Average Cost of Petroleum Liquids Delivered for Electricity Generation by State, April 2018 and 2017(Dollars per MMBtu)
Electric Power Sector Electric Utilities Independent Power Producers
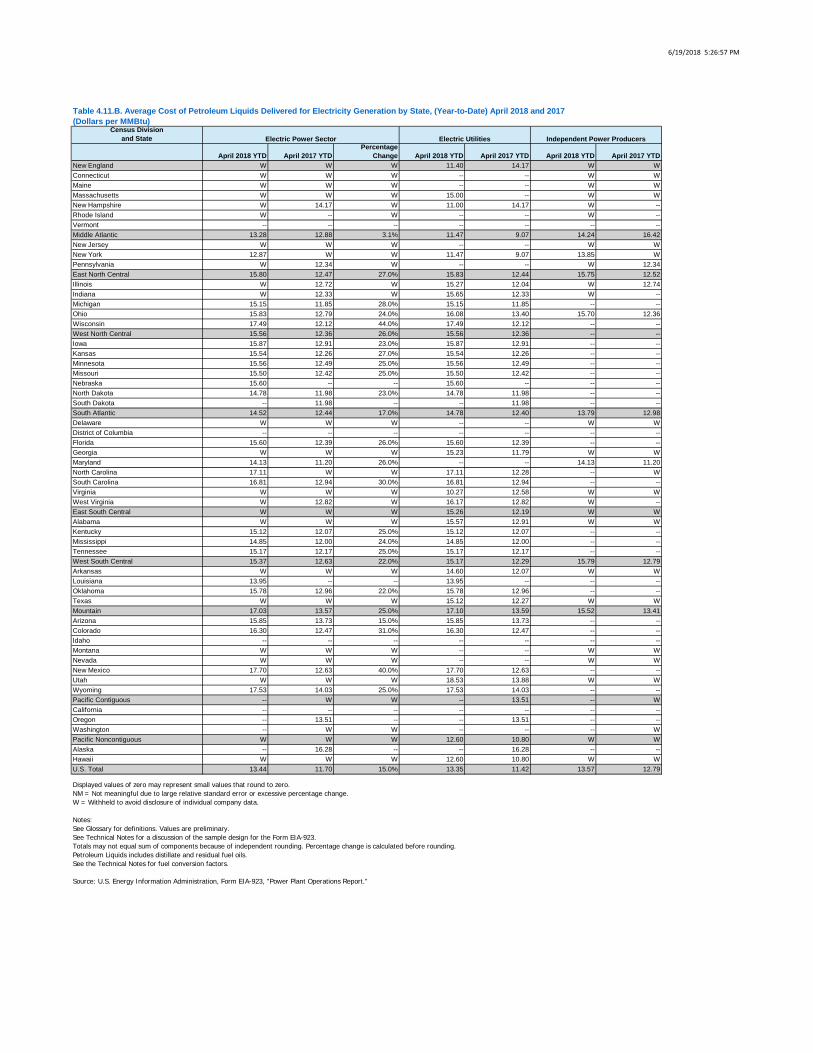
6/19/2018 5:26:57 PM
Census Divisionand State
April 2018 YTD April 2017 YTDPercentage
Change April 2018 YTD April 2017 YTD April 2018 YTD April 2017 YTDNew England W W W 11.40 14.17 W WConnecticut W W W -- -- W WMaine W W W -- -- W WMassachusetts W W W 15.00 -- W WNew Hampshire W 14.17 W 11.00 14.17 W --Rhode Island W -- W -- -- W --Vermont -- -- -- -- -- -- --Middle Atlantic 13.28 12.88 3.1% 11.47 9.07 14.24 16.42New Jersey W W W -- -- W WNew York 12.87 W W 11.47 9.07 13.85 WPennsylvania W 12.34 W -- -- W 12.34East North Central 15.80 12.47 27.0% 15.83 12.44 15.75 12.52Illinois W 12.72 W 15.27 12.04 W 12.74Indiana W 12.33 W 15.65 12.33 W --Michigan 15.15 11.85 28.0% 15.15 11.85 -- --Ohio 15.83 12.79 24.0% 16.08 13.40 15.70 12.36Wisconsin 17.49 12.12 44.0% 17.49 12.12 -- --West North Central 15.56 12.36 26.0% 15.56 12.36 -- --Iowa 15.87 12.91 23.0% 15.87 12.91 -- --Kansas 15.54 12.26 27.0% 15.54 12.26 -- --Minnesota 15.56 12.49 25.0% 15.56 12.49 -- --Missouri 15.50 12.42 25.0% 15.50 12.42 -- --Nebraska 15.60 -- -- 15.60 -- -- --North Dakota 14.78 11.98 23.0% 14.78 11.98 -- --South Dakota -- 11.98 -- -- 11.98 -- --South Atlantic 14.52 12.44 17.0% 14.78 12.40 13.79 12.98Delaware W W W -- -- W WDistrict of Columbia -- -- -- -- -- -- --Florida 15.60 12.39 26.0% 15.60 12.39 -- --Georgia W W W 15.23 11.79 W WMaryland 14.13 11.20 26.0% -- -- 14.13 11.20North Carolina 17.11 W W 17.11 12.28 -- WSouth Carolina 16.81 12.94 30.0% 16.81 12.94 -- --Virginia W W W 10.27 12.58 W WWest Virginia W 12.82 W 16.17 12.82 W --East South Central W W W 15.26 12.19 W WAlabama W W W 15.57 12.91 W WKentucky 15.12 12.07 25.0% 15.12 12.07 -- --Mississippi 14.85 12.00 24.0% 14.85 12.00 -- --Tennessee 15.17 12.17 25.0% 15.17 12.17 -- --West South Central 15.37 12.63 22.0% 15.17 12.29 15.79 12.79Arkansas W W W 14.60 12.07 W WLouisiana 13.95 -- -- 13.95 -- -- --Oklahoma 15.78 12.96 22.0% 15.78 12.96 -- --Texas W W W 15.12 12.27 W WMountain 17.03 13.57 25.0% 17.10 13.59 15.52 13.41Arizona 15.85 13.73 15.0% 15.85 13.73 -- --Colorado 16.30 12.47 31.0% 16.30 12.47 -- --Idaho -- -- -- -- -- -- --Montana W W W -- -- W WNevada W W W -- -- W WNew Mexico 17.70 12.63 40.0% 17.70 12.63 -- --Utah W W W 18.53 13.88 W WWyoming 17.53 14.03 25.0% 17.53 14.03 -- --Pacific Contiguous -- W W -- 13.51 -- WCalifornia -- -- -- -- -- -- --Oregon -- 13.51 -- -- 13.51 -- --Washington -- W W -- -- -- WPacific Noncontiguous W W W 12.60 10.80 W WAlaska -- 16.28 -- -- 16.28 -- --Hawaii W W W 12.60 10.80 W WU.S. Total 13.44 11.70 15.0% 13.35 11.42 13.57 12.79
Displayed values of zero may represent small values that round to zero.NM = Not meaningful due to large relative standard error or excessive percentage change.W = Withheld to avoid disclosure of individual company data.
Notes:See Glossary for definitions. Values are preliminary.See Technical Notes for a discussion of the sample design for the Form EIA-923.Totals may not equal sum of components because of independent rounding. Percentage change is calculated before rounding.Petroleum Liquids includes distillate and residual fuel oils.See the Technical Notes for fuel conversion factors.
Source: U.S. Energy Information Administration, Form EIA-923, "Power Plant Operations Report."
Table 4.11.B. Average Cost of Petroleum Liquids Delivered for Electricity Generation by State, (Year-to-Date) April 2018 and 2017(Dollars per MMBtu)
Electric Power Sector Electric Utilities Independent Power Producers

6/19/2018 5:26:58 PM
Census Divisionand State
April 2018 April 2017Percentage
Change April 2018 April 2017 April 2018 April 2017New England -- -- -- -- -- -- --Connecticut -- -- -- -- -- -- --Maine -- -- -- -- -- -- --Massachusetts -- -- -- -- -- -- --New Hampshire -- -- -- -- -- -- --Rhode Island -- -- -- -- -- -- --Vermont -- -- -- -- -- -- --Middle Atlantic -- -- -- -- -- -- --New Jersey -- -- -- -- -- -- --New York -- -- -- -- -- -- --Pennsylvania -- -- -- -- -- -- --East North Central 1.50 1.49 0.7% 1.50 1.49 -- --Illinois -- -- -- -- -- -- --Indiana -- -- -- -- -- -- --Michigan 1.48 1.47 0.7% 1.48 1.47 -- --Ohio -- -- -- -- -- -- --Wisconsin 1.79 1.81 -1.1% 1.79 1.81 -- --West North Central -- -- -- -- -- -- --Iowa -- -- -- -- -- -- --Kansas -- -- -- -- -- -- --Minnesota -- -- -- -- -- -- --Missouri -- -- -- -- -- -- --Nebraska -- -- -- -- -- -- --North Dakota -- -- -- -- -- -- --South Dakota -- -- -- -- -- -- --South Atlantic 2.96 2.27 30.0% 2.96 2.27 -- --Delaware -- -- -- -- -- -- --District of Columbia -- -- -- -- -- -- --Florida 2.96 2.27 30.0% 2.96 2.27 -- --Georgia -- -- -- -- -- -- --Maryland -- -- -- -- -- -- --North Carolina -- -- -- -- -- -- --South Carolina -- -- -- -- -- -- --Virginia -- -- -- -- -- -- --West Virginia -- -- -- -- -- -- --East South Central -- 1.52 -- -- 1.52 -- --Alabama -- -- -- -- -- -- --Kentucky -- 1.52 -- -- 1.52 -- --Mississippi -- -- -- -- -- -- --Tennessee -- -- -- -- -- -- --West South Central 2.67 2.16 24.0% 2.67 2.16 -- --Arkansas -- -- -- -- -- -- --Louisiana 2.67 2.16 24.0% 2.67 2.16 -- --Oklahoma -- -- -- -- -- -- --Texas -- -- -- -- -- -- --Mountain -- -- -- -- -- -- --Arizona -- -- -- -- -- -- --Colorado -- -- -- -- -- -- --Idaho -- -- -- -- -- -- --Montana -- -- -- -- -- -- --Nevada -- -- -- -- -- -- --New Mexico -- -- -- -- -- -- --Utah -- -- -- -- -- -- --Wyoming -- -- -- -- -- -- --Pacific Contiguous -- -- -- -- -- -- --California -- -- -- -- -- -- --Oregon -- -- -- -- -- -- --Washington -- -- -- -- -- -- --Pacific Noncontiguous -- -- -- -- -- -- --Alaska -- -- -- -- -- -- --Hawaii -- -- -- -- -- -- --U.S. Total 2.56 2.00 28.0% 2.56 2.00 -- --
Displayed values of zero may represent small values that round to zero.NM = Not meaningful due to large relative standard error or excessive percentage change.W = Withheld to avoid disclosure of individual company data.
Notes:See Glossary for definitions. Values are preliminary.See Technical Notes for a discussion of the sample design for the Form EIA-923.Totals may not equal sum of components because of independent rounding. Percentage change is calculated before rounding.Petroleum Coke includes petroleum coke-derived synthesis gas.See the Technical Notes for fuel conversion factors.
Source: U.S. Energy Information Administration, Form EIA-923, "Power Plant Operations Report."
Table 4.12.A. Average Cost of Petroleum Coke Delivered for Electricity Generation by State, April 2018 and 2017(Dollars per MMBtu)
Electric Power Sector Electric Utilities Independent Power Producers
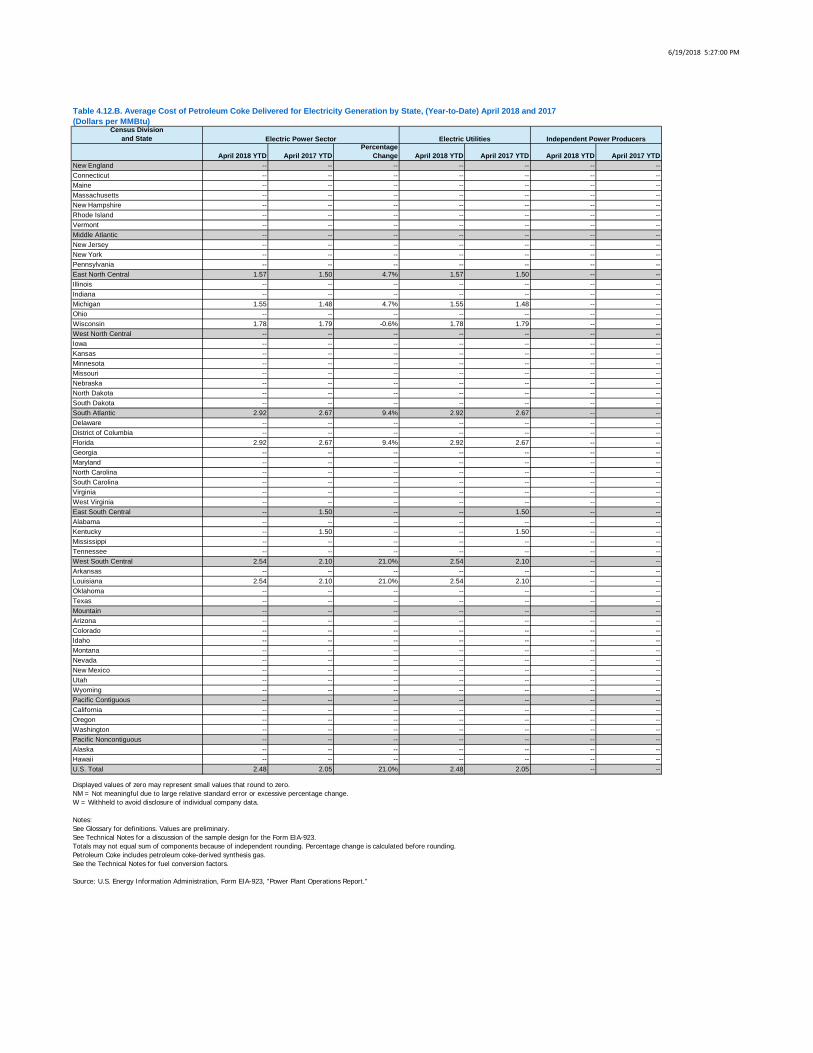
6/19/2018 5:27:00 PM
Census Divisionand State
April 2018 YTD April 2017 YTDPercentage
Change April 2018 YTD April 2017 YTD April 2018 YTD April 2017 YTDNew England -- -- -- -- -- -- --Connecticut -- -- -- -- -- -- --Maine -- -- -- -- -- -- --Massachusetts -- -- -- -- -- -- --New Hampshire -- -- -- -- -- -- --Rhode Island -- -- -- -- -- -- --Vermont -- -- -- -- -- -- --Middle Atlantic -- -- -- -- -- -- --New Jersey -- -- -- -- -- -- --New York -- -- -- -- -- -- --Pennsylvania -- -- -- -- -- -- --East North Central 1.57 1.50 4.7% 1.57 1.50 -- --Illinois -- -- -- -- -- -- --Indiana -- -- -- -- -- -- --Michigan 1.55 1.48 4.7% 1.55 1.48 -- --Ohio -- -- -- -- -- -- --Wisconsin 1.78 1.79 -0.6% 1.78 1.79 -- --West North Central -- -- -- -- -- -- --Iowa -- -- -- -- -- -- --Kansas -- -- -- -- -- -- --Minnesota -- -- -- -- -- -- --Missouri -- -- -- -- -- -- --Nebraska -- -- -- -- -- -- --North Dakota -- -- -- -- -- -- --South Dakota -- -- -- -- -- -- --South Atlantic 2.92 2.67 9.4% 2.92 2.67 -- --Delaware -- -- -- -- -- -- --District of Columbia -- -- -- -- -- -- --Florida 2.92 2.67 9.4% 2.92 2.67 -- --Georgia -- -- -- -- -- -- --Maryland -- -- -- -- -- -- --North Carolina -- -- -- -- -- -- --South Carolina -- -- -- -- -- -- --Virginia -- -- -- -- -- -- --West Virginia -- -- -- -- -- -- --East South Central -- 1.50 -- -- 1.50 -- --Alabama -- -- -- -- -- -- --Kentucky -- 1.50 -- -- 1.50 -- --Mississippi -- -- -- -- -- -- --Tennessee -- -- -- -- -- -- --West South Central 2.54 2.10 21.0% 2.54 2.10 -- --Arkansas -- -- -- -- -- -- --Louisiana 2.54 2.10 21.0% 2.54 2.10 -- --Oklahoma -- -- -- -- -- -- --Texas -- -- -- -- -- -- --Mountain -- -- -- -- -- -- --Arizona -- -- -- -- -- -- --Colorado -- -- -- -- -- -- --Idaho -- -- -- -- -- -- --Montana -- -- -- -- -- -- --Nevada -- -- -- -- -- -- --New Mexico -- -- -- -- -- -- --Utah -- -- -- -- -- -- --Wyoming -- -- -- -- -- -- --Pacific Contiguous -- -- -- -- -- -- --California -- -- -- -- -- -- --Oregon -- -- -- -- -- -- --Washington -- -- -- -- -- -- --Pacific Noncontiguous -- -- -- -- -- -- --Alaska -- -- -- -- -- -- --Hawaii -- -- -- -- -- -- --U.S. Total 2.48 2.05 21.0% 2.48 2.05 -- --
Displayed values of zero may represent small values that round to zero.NM = Not meaningful due to large relative standard error or excessive percentage change.W = Withheld to avoid disclosure of individual company data.
Notes:See Glossary for definitions. Values are preliminary.See Technical Notes for a discussion of the sample design for the Form EIA-923.Totals may not equal sum of components because of independent rounding. Percentage change is calculated before rounding.Petroleum Coke includes petroleum coke-derived synthesis gas.See the Technical Notes for fuel conversion factors.
Source: U.S. Energy Information Administration, Form EIA-923, "Power Plant Operations Report."
Table 4.12.B. Average Cost of Petroleum Coke Delivered for Electricity Generation by State, (Year-to-Date) April 2018 and 2017(Dollars per MMBtu)
Electric Power Sector Electric Utilities Independent Power Producers

6/19/2018 5:27:02 PM
Census Divisionand State
April 2018 April 2017 Percentage Change April 2018 April 2017 April 2018 April 2017New England 4.54 3.38 34.0% 3.28 5.33 4.54 3.38Connecticut 3.81 W W -- -- 3.81 WMaine W W W -- -- W WMassachusetts 5.37 3.36 60.0% 3.01 4.64 5.38 3.36New Hampshire W W W 7.05 7.97 W WRhode Island W W W -- -- W WVermont -- -- -- -- -- -- --Middle Atlantic 2.78 3.11 -11.0% 3.08 2.98 2.76 3.13New Jersey 2.81 3.23 -13.0% -- -- 2.81 3.23New York 3.09 3.29 -6.1% 3.08 2.98 3.10 3.42Pennsylvania 2.56 2.90 -12.0% -- -- 2.56 2.90East North Central 2.91 3.20 -9.1% 3.03 3.22 2.84 3.18Illinois W W W 3.05 3.85 W WIndiana W W W 3.13 2.99 W WMichigan 3.00 3.34 -10.0% 3.10 3.51 2.94 3.29Ohio 2.71 3.09 -12.0% 2.77 3.13 2.69 3.08Wisconsin 3.13 W W 3.13 3.54 -- WWest North Central W 3.20 W 2.95 3.20 W --Iowa 2.64 2.69 -1.9% 2.64 2.69 -- --Kansas 2.99 3.74 -20.0% 2.99 3.74 -- --Minnesota W 3.32 W 3.41 3.32 W --Missouri W 2.98 W 2.38 2.98 W --Nebraska 3.73 4.09 -8.8% 3.73 4.09 -- --North Dakota 5.50 4.41 25.0% 5.50 4.41 -- --South Dakota -- -- -- -- -- -- --South Atlantic 3.80 3.62 5.0% 3.92 3.65 3.09 3.38Delaware -- -- -- -- -- -- --District of Columbia -- -- -- -- -- -- --Florida W 3.52 W 4.09 3.52 W --Georgia W W W 3.67 3.98 W WMaryland 3.10 3.21 -3.4% 3.25 -- 3.01 3.21North Carolina W W W 3.65 4.21 W WSouth Carolina W W W 3.39 3.50 W WVirginia 3.33 3.45 -3.5% 3.72 3.52 2.95 3.26West Virginia W 3.12 W 2.84 2.87 W 3.27East South Central 2.91 3.29 -12.0% 2.88 3.26 3.01 3.34Alabama W W W 3.01 3.36 W WKentucky W W W 3.14 3.55 W WMississippi W W W 2.81 3.23 W WTennessee 2.59 3.03 -15.0% 2.59 3.03 -- --West South Central 2.76 3.17 -13.0% 2.73 3.30 2.77 3.10Arkansas W W W 3.07 3.08 W WLouisiana W W W 2.97 3.39 W WOklahoma W W W 2.34 3.26 W WTexas 2.76 3.13 -12.0% 2.67 3.24 2.79 3.10Mountain 2.73 3.68 -26.0% 2.71 3.68 3.25 3.64Arizona W W W 2.72 3.90 W WColorado W W W 3.45 3.47 W WIdaho -- -- -- -- -- -- --Montana 1.21 2.17 -44.0% 1.21 2.17 -- --Nevada 2.66 3.60 -26.0% 2.66 3.60 -- --New Mexico 1.95 3.69 -47.0% 1.95 3.69 -- --Utah 2.45 W W 2.45 3.70 -- WWyoming W W W 2.66 3.59 W WPacific Contiguous W 3.55 W 3.27 3.87 W 3.14California 2.98 W W 3.55 3.97 2.49 WOregon W W W 2.01 -- W WWashington W 3.36 W 3.50 3.36 W --Pacific Noncontiguous 7.76 8.09 -4.1% 7.76 8.09 -- --Alaska 7.76 8.09 -4.1% 7.76 8.09 -- --Hawaii -- -- -- -- -- -- --U.S. Total 3.15 3.38 -6.8% 3.31 3.52 2.93 3.19
Displayed values of zero may represent small values that round to zero.NM = Not meaningful due to large relative standard error or excessive percentage change.W = Withheld to avoid disclosure of individual company data.
Notes:See Glossary for definitions. Values are preliminary.See Technical Notes for a discussion of the sample design for the Form EIA-923.Totals may not equal sum of components because of independent rounding. Percentage change is calculated before rounding.
Source: U.S. Energy Information Administration, Form EIA-923, "Power Plant Operations Report."
Table 4.13.A. Average Cost of Natural Gas Delivered for Electricity Generation by State, April 2018 and 2017(Dollars per MMBtu)
Electric Power Sector Electric Utilities Independent Power Producers
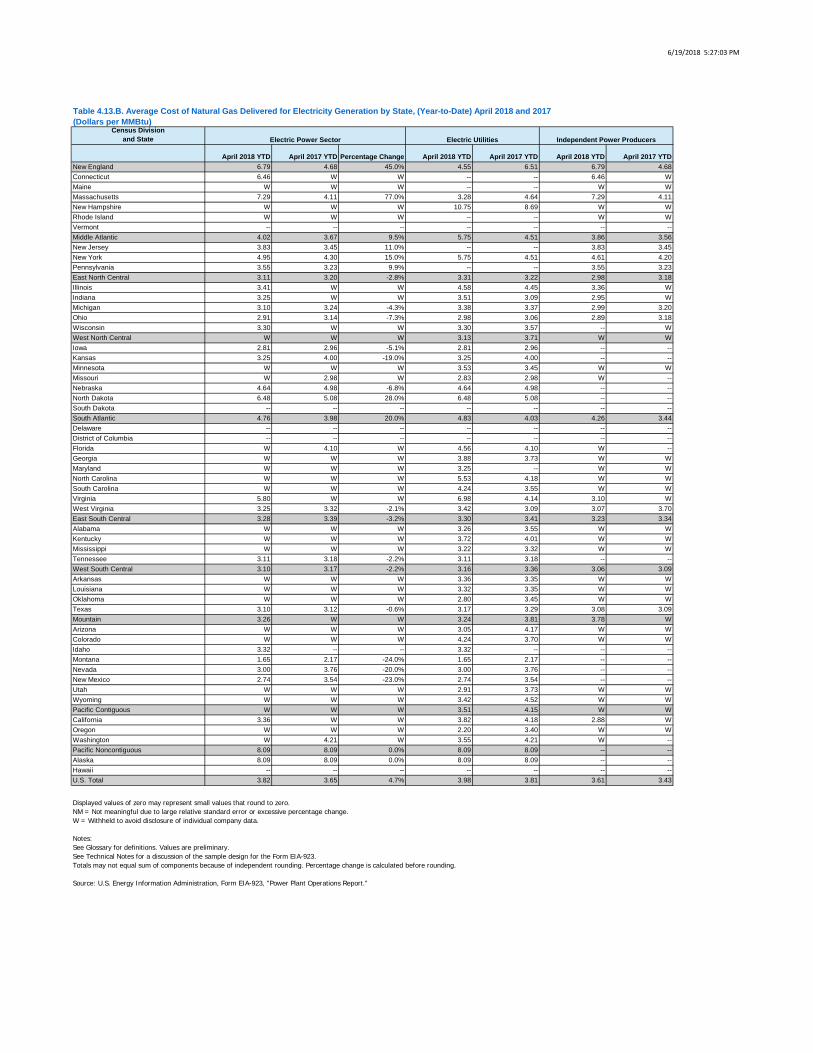
6/19/2018 5:27:03 PM
Census Divisionand State
April 2018 YTD April 2017 YTD Percentage Change April 2018 YTD April 2017 YTD April 2018 YTD April 2017 YTDNew England 6.79 4.68 45.0% 4.55 6.51 6.79 4.68Connecticut 6.46 W W -- -- 6.46 WMaine W W W -- -- W WMassachusetts 7.29 4.11 77.0% 3.28 4.64 7.29 4.11New Hampshire W W W 10.75 8.69 W WRhode Island W W W -- -- W WVermont -- -- -- -- -- -- --Middle Atlantic 4.02 3.67 9.5% 5.75 4.51 3.86 3.56New Jersey 3.83 3.45 11.0% -- -- 3.83 3.45New York 4.95 4.30 15.0% 5.75 4.51 4.61 4.20Pennsylvania 3.55 3.23 9.9% -- -- 3.55 3.23East North Central 3.11 3.20 -2.8% 3.31 3.22 2.98 3.18Illinois 3.41 W W 4.58 4.45 3.36 WIndiana 3.25 W W 3.51 3.09 2.95 WMichigan 3.10 3.24 -4.3% 3.38 3.37 2.99 3.20Ohio 2.91 3.14 -7.3% 2.98 3.06 2.89 3.18Wisconsin 3.30 W W 3.30 3.57 -- WWest North Central W W W 3.13 3.71 W WIowa 2.81 2.96 -5.1% 2.81 2.96 -- --Kansas 3.25 4.00 -19.0% 3.25 4.00 -- --Minnesota W W W 3.53 3.45 W WMissouri W 2.98 W 2.83 2.98 W --Nebraska 4.64 4.98 -6.8% 4.64 4.98 -- --North Dakota 6.48 5.08 28.0% 6.48 5.08 -- --South Dakota -- -- -- -- -- -- --South Atlantic 4.76 3.98 20.0% 4.83 4.03 4.26 3.44Delaware -- -- -- -- -- -- --District of Columbia -- -- -- -- -- -- --Florida W 4.10 W 4.56 4.10 W --Georgia W W W 3.88 3.73 W WMaryland W W W 3.25 -- W WNorth Carolina W W W 5.53 4.18 W WSouth Carolina W W W 4.24 3.55 W WVirginia 5.80 W W 6.98 4.14 3.10 WWest Virginia 3.25 3.32 -2.1% 3.42 3.09 3.07 3.70East South Central 3.28 3.39 -3.2% 3.30 3.41 3.23 3.34Alabama W W W 3.26 3.55 W WKentucky W W W 3.72 4.01 W WMississippi W W W 3.22 3.32 W WTennessee 3.11 3.18 -2.2% 3.11 3.18 -- --West South Central 3.10 3.17 -2.2% 3.16 3.36 3.06 3.09Arkansas W W W 3.36 3.35 W WLouisiana W W W 3.32 3.35 W WOklahoma W W W 2.80 3.45 W WTexas 3.10 3.12 -0.6% 3.17 3.29 3.08 3.09Mountain 3.26 W W 3.24 3.81 3.78 WArizona W W W 3.05 4.17 W WColorado W W W 4.24 3.70 W WIdaho 3.32 -- -- 3.32 -- -- --Montana 1.65 2.17 -24.0% 1.65 2.17 -- --Nevada 3.00 3.76 -20.0% 3.00 3.76 -- --New Mexico 2.74 3.54 -23.0% 2.74 3.54 -- --Utah W W W 2.91 3.73 W WWyoming W W W 3.42 4.52 W WPacific Contiguous W W W 3.51 4.15 W WCalifornia 3.36 W W 3.82 4.18 2.88 WOregon W W W 2.20 3.40 W WWashington W 4.21 W 3.55 4.21 W --Pacific Noncontiguous 8.09 8.09 0.0% 8.09 8.09 -- --Alaska 8.09 8.09 0.0% 8.09 8.09 -- --Hawaii -- -- -- -- -- -- --U.S. Total 3.82 3.65 4.7% 3.98 3.81 3.61 3.43
Displayed values of zero may represent small values that round to zero.NM = Not meaningful due to large relative standard error or excessive percentage change.W = Withheld to avoid disclosure of individual company data.
Notes:See Glossary for definitions. Values are preliminary.See Technical Notes for a discussion of the sample design for the Form EIA-923.Totals may not equal sum of components because of independent rounding. Percentage change is calculated before rounding.
Source: U.S. Energy Information Administration, Form EIA-923, "Power Plant Operations Report."
Table 4.13.B. Average Cost of Natural Gas Delivered for Electricity Generation by State, (Year-to-Date) April 2018 and 2017(Dollars per MMBtu)
Electric Power Sector Electric Utilities Independent Power Producers
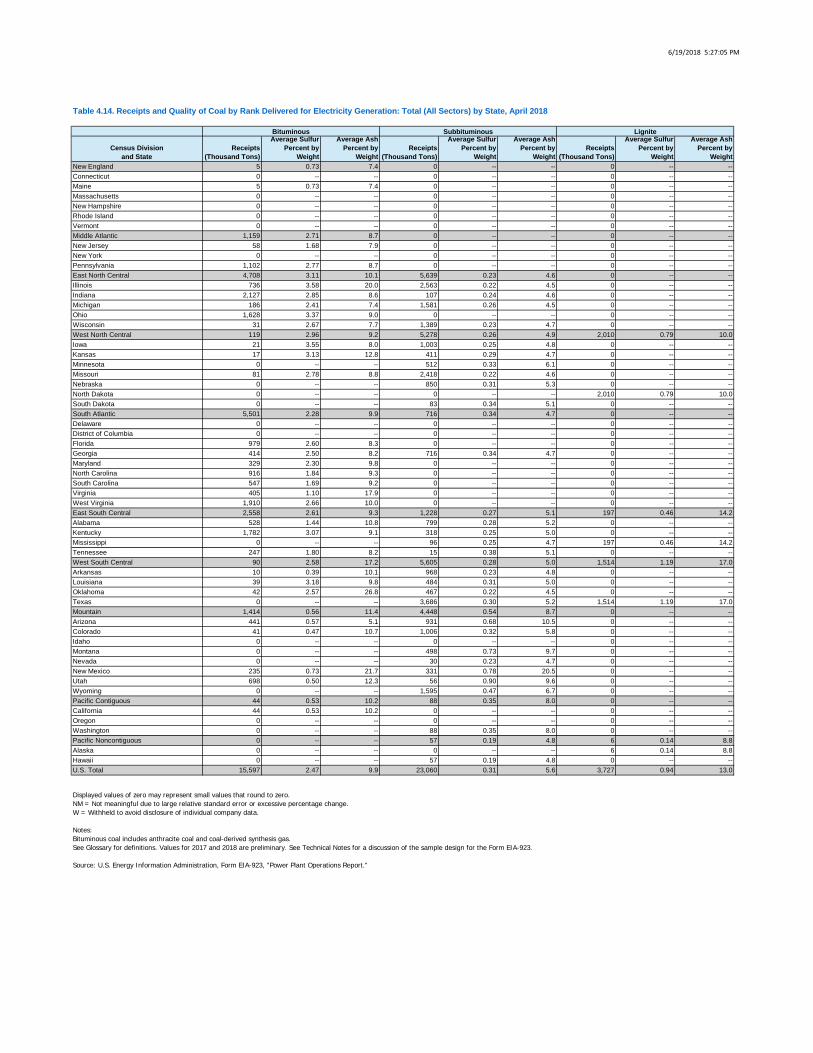
6/19/2018 5:27:05 PM
Census Divisionand State
Receipts (Thousand Tons)
Average Sulfur Percent by
Weight
Average Ash Percent by
WeightReceipts
(Thousand Tons)
Average Sulfur Percent by
Weight
Average Ash Percent by
WeightReceipts
(Thousand Tons)
Average Sulfur Percent by
Weight
Average Ash Percent by
WeightNew England 5 0.73 7.4 0 -- -- 0 -- --Connecticut 0 -- -- 0 -- -- 0 -- --Maine 5 0.73 7.4 0 -- -- 0 -- --Massachusetts 0 -- -- 0 -- -- 0 -- --New Hampshire 0 -- -- 0 -- -- 0 -- --Rhode Island 0 -- -- 0 -- -- 0 -- --Vermont 0 -- -- 0 -- -- 0 -- --Middle Atlantic 1,159 2.71 8.7 0 -- -- 0 -- --New Jersey 58 1.68 7.9 0 -- -- 0 -- --New York 0 -- -- 0 -- -- 0 -- --Pennsylvania 1,102 2.77 8.7 0 -- -- 0 -- --East North Central 4,708 3.11 10.1 5,639 0.23 4.6 0 -- --Illinois 736 3.58 20.0 2,563 0.22 4.5 0 -- --Indiana 2,127 2.85 8.6 107 0.24 4.6 0 -- --Michigan 186 2.41 7.4 1,581 0.26 4.5 0 -- --Ohio 1,628 3.37 9.0 0 -- -- 0 -- --Wisconsin 31 2.67 7.7 1,389 0.23 4.7 0 -- --West North Central 119 2.96 9.2 5,278 0.26 4.9 2,010 0.79 10.0Iowa 21 3.55 8.0 1,003 0.25 4.8 0 -- --Kansas 17 3.13 12.8 411 0.29 4.7 0 -- --Minnesota 0 -- -- 512 0.33 6.1 0 -- --Missouri 81 2.78 8.8 2,418 0.22 4.6 0 -- --Nebraska 0 -- -- 850 0.31 5.3 0 -- --North Dakota 0 -- -- 0 -- -- 2,010 0.79 10.0South Dakota 0 -- -- 83 0.34 5.1 0 -- --South Atlantic 5,501 2.28 9.9 716 0.34 4.7 0 -- --Delaware 0 -- -- 0 -- -- 0 -- --District of Columbia 0 -- -- 0 -- -- 0 -- --Florida 979 2.60 8.3 0 -- -- 0 -- --Georgia 414 2.50 8.2 716 0.34 4.7 0 -- --Maryland 329 2.30 9.8 0 -- -- 0 -- --North Carolina 916 1.84 9.3 0 -- -- 0 -- --South Carolina 547 1.69 9.2 0 -- -- 0 -- --Virginia 405 1.10 17.9 0 -- -- 0 -- --West Virginia 1,910 2.66 10.0 0 -- -- 0 -- --East South Central 2,558 2.61 9.3 1,228 0.27 5.1 197 0.46 14.2Alabama 528 1.44 10.8 799 0.28 5.2 0 -- --Kentucky 1,782 3.07 9.1 318 0.25 5.0 0 -- --Mississippi 0 -- -- 96 0.25 4.7 197 0.46 14.2Tennessee 247 1.80 8.2 15 0.38 5.1 0 -- --West South Central 90 2.58 17.2 5,605 0.28 5.0 1,514 1.19 17.0Arkansas 10 0.39 10.1 968 0.23 4.8 0 -- --Louisiana 39 3.18 9.8 484 0.31 5.0 0 -- --Oklahoma 42 2.57 26.8 467 0.22 4.5 0 -- --Texas 0 -- -- 3,686 0.30 5.2 1,514 1.19 17.0Mountain 1,414 0.56 11.4 4,448 0.54 8.7 0 -- --Arizona 441 0.57 5.1 931 0.68 10.5 0 -- --Colorado 41 0.47 10.7 1,006 0.32 5.8 0 -- --Idaho 0 -- -- 0 -- -- 0 -- --Montana 0 -- -- 498 0.73 9.7 0 -- --Nevada 0 -- -- 30 0.23 4.7 0 -- --New Mexico 235 0.73 21.7 331 0.78 20.5 0 -- --Utah 698 0.50 12.3 56 0.90 9.6 0 -- --Wyoming 0 -- -- 1,595 0.47 6.7 0 -- --Pacific Contiguous 44 0.53 10.2 88 0.35 8.0 0 -- --California 44 0.53 10.2 0 -- -- 0 -- --Oregon 0 -- -- 0 -- -- 0 -- --Washington 0 -- -- 88 0.35 8.0 0 -- --Pacific Noncontiguous 0 -- -- 57 0.19 4.8 6 0.14 8.8Alaska 0 -- -- 0 -- -- 6 0.14 8.8Hawaii 0 -- -- 57 0.19 4.8 0 -- --U.S. Total 15,597 2.47 9.9 23,060 0.31 5.6 3,727 0.94 13.0
Displayed values of zero may represent small values that round to zero.NM = Not meaningful due to large relative standard error or excessive percentage change.W = Withheld to avoid disclosure of individual company data.
Notes:Bituminous coal includes anthracite coal and coal-derived synthesis gas.See Glossary for definitions. Values for 2017 and 2018 are preliminary. See Technical Notes for a discussion of the sample design for the Form EIA-923.
Source: U.S. Energy Information Administration, Form EIA-923, "Power Plant Operations Report."
Table 4.14. Receipts and Quality of Coal by Rank Delivered for Electricity Generation: Total (All Sectors) by State, April 2018
Bituminous Subbituminous Lignite
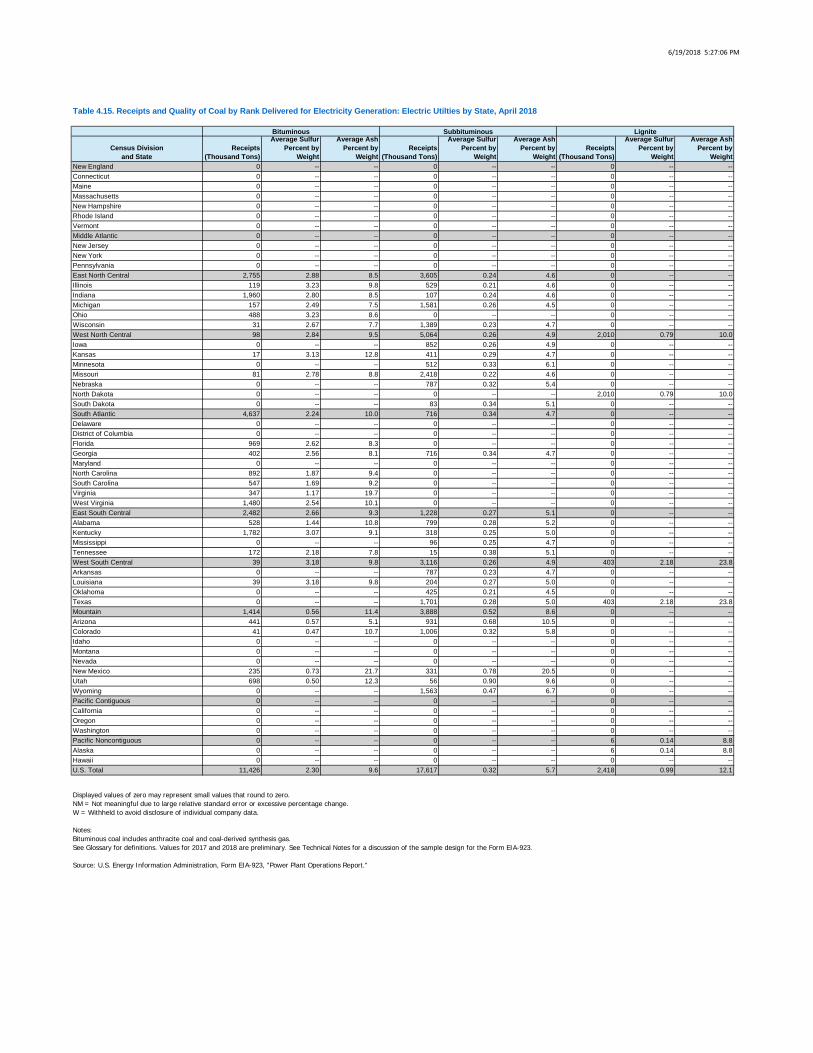
6/19/2018 5:27:06 PM
Census Divisionand State
Receipts (Thousand Tons)
Average Sulfur Percent by
Weight
Average Ash Percent by
WeightReceipts
(Thousand Tons)
Average Sulfur Percent by
Weight
Average Ash Percent by
WeightReceipts
(Thousand Tons)
Average Sulfur Percent by
Weight
Average Ash Percent by
WeightNew England 0 -- -- 0 -- -- 0 -- --Connecticut 0 -- -- 0 -- -- 0 -- --Maine 0 -- -- 0 -- -- 0 -- --Massachusetts 0 -- -- 0 -- -- 0 -- --New Hampshire 0 -- -- 0 -- -- 0 -- --Rhode Island 0 -- -- 0 -- -- 0 -- --Vermont 0 -- -- 0 -- -- 0 -- --Middle Atlantic 0 -- -- 0 -- -- 0 -- --New Jersey 0 -- -- 0 -- -- 0 -- --New York 0 -- -- 0 -- -- 0 -- --Pennsylvania 0 -- -- 0 -- -- 0 -- --East North Central 2,755 2.88 8.5 3,605 0.24 4.6 0 -- --Illinois 119 3.23 9.8 529 0.21 4.6 0 -- --Indiana 1,960 2.80 8.5 107 0.24 4.6 0 -- --Michigan 157 2.49 7.5 1,581 0.26 4.5 0 -- --Ohio 488 3.23 8.6 0 -- -- 0 -- --Wisconsin 31 2.67 7.7 1,389 0.23 4.7 0 -- --West North Central 98 2.84 9.5 5,064 0.26 4.9 2,010 0.79 10.0Iowa 0 -- -- 852 0.26 4.9 0 -- --Kansas 17 3.13 12.8 411 0.29 4.7 0 -- --Minnesota 0 -- -- 512 0.33 6.1 0 -- --Missouri 81 2.78 8.8 2,418 0.22 4.6 0 -- --Nebraska 0 -- -- 787 0.32 5.4 0 -- --North Dakota 0 -- -- 0 -- -- 2,010 0.79 10.0South Dakota 0 -- -- 83 0.34 5.1 0 -- --South Atlantic 4,637 2.24 10.0 716 0.34 4.7 0 -- --Delaware 0 -- -- 0 -- -- 0 -- --District of Columbia 0 -- -- 0 -- -- 0 -- --Florida 969 2.62 8.3 0 -- -- 0 -- --Georgia 402 2.56 8.1 716 0.34 4.7 0 -- --Maryland 0 -- -- 0 -- -- 0 -- --North Carolina 892 1.87 9.4 0 -- -- 0 -- --South Carolina 547 1.69 9.2 0 -- -- 0 -- --Virginia 347 1.17 19.7 0 -- -- 0 -- --West Virginia 1,480 2.54 10.1 0 -- -- 0 -- --East South Central 2,482 2.66 9.3 1,228 0.27 5.1 0 -- --Alabama 528 1.44 10.8 799 0.28 5.2 0 -- --Kentucky 1,782 3.07 9.1 318 0.25 5.0 0 -- --Mississippi 0 -- -- 96 0.25 4.7 0 -- --Tennessee 172 2.18 7.8 15 0.38 5.1 0 -- --West South Central 39 3.18 9.8 3,116 0.26 4.9 403 2.18 23.8Arkansas 0 -- -- 787 0.23 4.7 0 -- --Louisiana 39 3.18 9.8 204 0.27 5.0 0 -- --Oklahoma 0 -- -- 425 0.21 4.5 0 -- --Texas 0 -- -- 1,701 0.28 5.0 403 2.18 23.8Mountain 1,414 0.56 11.4 3,888 0.52 8.6 0 -- --Arizona 441 0.57 5.1 931 0.68 10.5 0 -- --Colorado 41 0.47 10.7 1,006 0.32 5.8 0 -- --Idaho 0 -- -- 0 -- -- 0 -- --Montana 0 -- -- 0 -- -- 0 -- --Nevada 0 -- -- 0 -- -- 0 -- --New Mexico 235 0.73 21.7 331 0.78 20.5 0 -- --Utah 698 0.50 12.3 56 0.90 9.6 0 -- --Wyoming 0 -- -- 1,563 0.47 6.7 0 -- --Pacific Contiguous 0 -- -- 0 -- -- 0 -- --California 0 -- -- 0 -- -- 0 -- --Oregon 0 -- -- 0 -- -- 0 -- --Washington 0 -- -- 0 -- -- 0 -- --Pacific Noncontiguous 0 -- -- 0 -- -- 6 0.14 8.8Alaska 0 -- -- 0 -- -- 6 0.14 8.8Hawaii 0 -- -- 0 -- -- 0 -- --U.S. Total 11,426 2.30 9.6 17,617 0.32 5.7 2,418 0.99 12.1
Displayed values of zero may represent small values that round to zero.NM = Not meaningful due to large relative standard error or excessive percentage change.W = Withheld to avoid disclosure of individual company data.
Notes:Bituminous coal includes anthracite coal and coal-derived synthesis gas.See Glossary for definitions. Values for 2017 and 2018 are preliminary. See Technical Notes for a discussion of the sample design for the Form EIA-923.
Source: U.S. Energy Information Administration, Form EIA-923, "Power Plant Operations Report."
Table 4.15. Receipts and Quality of Coal by Rank Delivered for Electricity Generation: Electric Utilties by State, April 2018
Bituminous Subbituminous Lignite
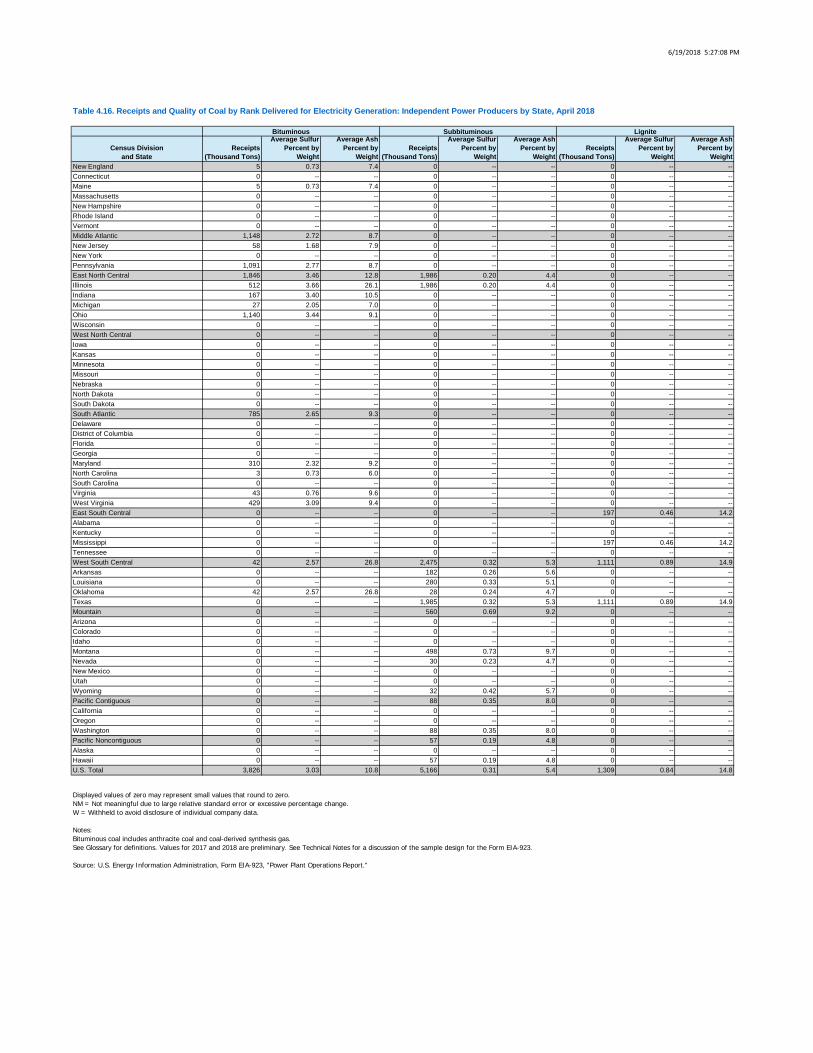
6/19/2018 5:27:08 PM
Census Divisionand State
Receipts (Thousand Tons)
Average Sulfur Percent by
Weight
Average Ash Percent by
WeightReceipts
(Thousand Tons)
Average Sulfur Percent by
Weight
Average Ash Percent by
WeightReceipts
(Thousand Tons)
Average Sulfur Percent by
Weight
Average Ash Percent by
WeightNew England 5 0.73 7.4 0 -- -- 0 -- --Connecticut 0 -- -- 0 -- -- 0 -- --Maine 5 0.73 7.4 0 -- -- 0 -- --Massachusetts 0 -- -- 0 -- -- 0 -- --New Hampshire 0 -- -- 0 -- -- 0 -- --Rhode Island 0 -- -- 0 -- -- 0 -- --Vermont 0 -- -- 0 -- -- 0 -- --Middle Atlantic 1,148 2.72 8.7 0 -- -- 0 -- --New Jersey 58 1.68 7.9 0 -- -- 0 -- --New York 0 -- -- 0 -- -- 0 -- --Pennsylvania 1,091 2.77 8.7 0 -- -- 0 -- --East North Central 1,846 3.46 12.8 1,986 0.20 4.4 0 -- --Illinois 512 3.66 26.1 1,986 0.20 4.4 0 -- --Indiana 167 3.40 10.5 0 -- -- 0 -- --Michigan 27 2.05 7.0 0 -- -- 0 -- --Ohio 1,140 3.44 9.1 0 -- -- 0 -- --Wisconsin 0 -- -- 0 -- -- 0 -- --West North Central 0 -- -- 0 -- -- 0 -- --Iowa 0 -- -- 0 -- -- 0 -- --Kansas 0 -- -- 0 -- -- 0 -- --Minnesota 0 -- -- 0 -- -- 0 -- --Missouri 0 -- -- 0 -- -- 0 -- --Nebraska 0 -- -- 0 -- -- 0 -- --North Dakota 0 -- -- 0 -- -- 0 -- --South Dakota 0 -- -- 0 -- -- 0 -- --South Atlantic 785 2.65 9.3 0 -- -- 0 -- --Delaware 0 -- -- 0 -- -- 0 -- --District of Columbia 0 -- -- 0 -- -- 0 -- --Florida 0 -- -- 0 -- -- 0 -- --Georgia 0 -- -- 0 -- -- 0 -- --Maryland 310 2.32 9.2 0 -- -- 0 -- --North Carolina 3 0.73 6.0 0 -- -- 0 -- --South Carolina 0 -- -- 0 -- -- 0 -- --Virginia 43 0.76 9.6 0 -- -- 0 -- --West Virginia 429 3.09 9.4 0 -- -- 0 -- --East South Central 0 -- -- 0 -- -- 197 0.46 14.2Alabama 0 -- -- 0 -- -- 0 -- --Kentucky 0 -- -- 0 -- -- 0 -- --Mississippi 0 -- -- 0 -- -- 197 0.46 14.2Tennessee 0 -- -- 0 -- -- 0 -- --West South Central 42 2.57 26.8 2,475 0.32 5.3 1,111 0.89 14.9Arkansas 0 -- -- 182 0.26 5.6 0 -- --Louisiana 0 -- -- 280 0.33 5.1 0 -- --Oklahoma 42 2.57 26.8 28 0.24 4.7 0 -- --Texas 0 -- -- 1,985 0.32 5.3 1,111 0.89 14.9Mountain 0 -- -- 560 0.69 9.2 0 -- --Arizona 0 -- -- 0 -- -- 0 -- --Colorado 0 -- -- 0 -- -- 0 -- --Idaho 0 -- -- 0 -- -- 0 -- --Montana 0 -- -- 498 0.73 9.7 0 -- --Nevada 0 -- -- 30 0.23 4.7 0 -- --New Mexico 0 -- -- 0 -- -- 0 -- --Utah 0 -- -- 0 -- -- 0 -- --Wyoming 0 -- -- 32 0.42 5.7 0 -- --Pacific Contiguous 0 -- -- 88 0.35 8.0 0 -- --California 0 -- -- 0 -- -- 0 -- --Oregon 0 -- -- 0 -- -- 0 -- --Washington 0 -- -- 88 0.35 8.0 0 -- --Pacific Noncontiguous 0 -- -- 57 0.19 4.8 0 -- --Alaska 0 -- -- 0 -- -- 0 -- --Hawaii 0 -- -- 57 0.19 4.8 0 -- --U.S. Total 3,826 3.03 10.8 5,166 0.31 5.4 1,309 0.84 14.8
Displayed values of zero may represent small values that round to zero.NM = Not meaningful due to large relative standard error or excessive percentage change.W = Withheld to avoid disclosure of individual company data.
Notes:Bituminous coal includes anthracite coal and coal-derived synthesis gas.See Glossary for definitions. Values for 2017 and 2018 are preliminary. See Technical Notes for a discussion of the sample design for the Form EIA-923.
Source: U.S. Energy Information Administration, Form EIA-923, "Power Plant Operations Report."
Table 4.16. Receipts and Quality of Coal by Rank Delivered for Electricity Generation: Independent Power Producers by State, April 2018
Bituminous Subbituminous Lignite
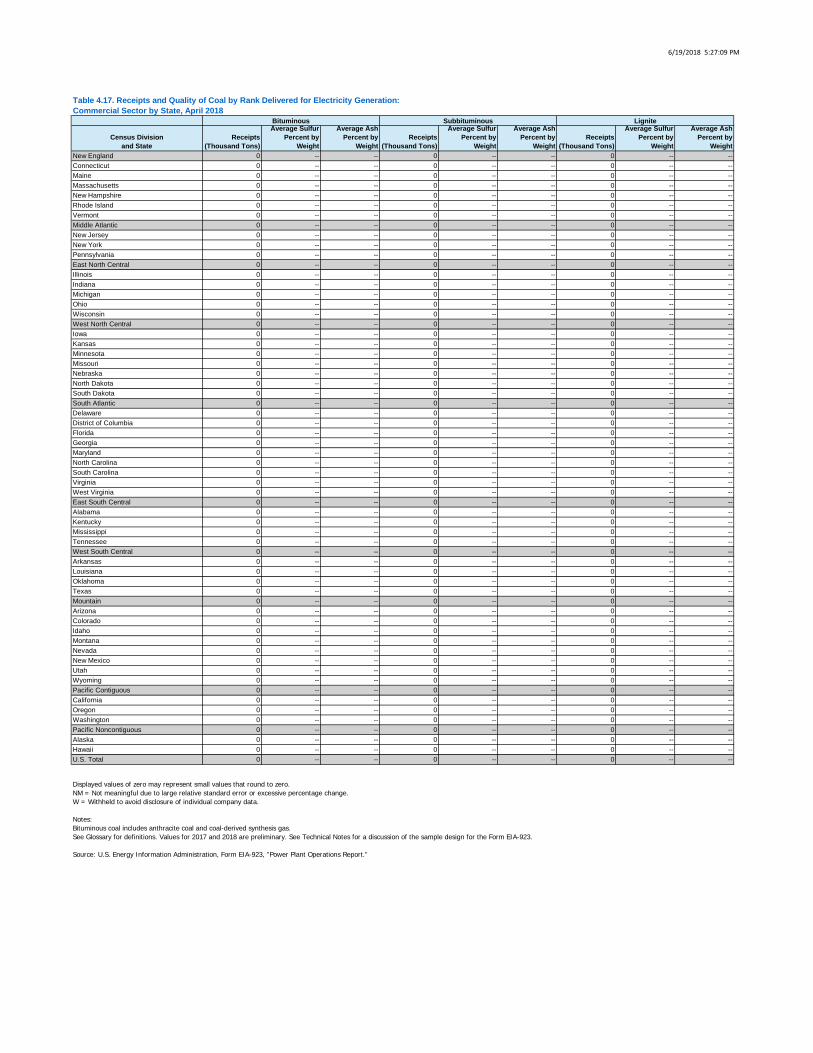
6/19/2018 5:27:09 PM
Census Divisionand State
Receipts (Thousand Tons)
Average Sulfur Percent by
Weight
Average Ash Percent by
WeightReceipts
(Thousand Tons)
Average Sulfur Percent by
Weight
Average Ash Percent by
WeightReceipts
(Thousand Tons)
Average Sulfur Percent by
Weight
Average Ash Percent by
WeightNew England 0 -- -- 0 -- -- 0 -- --Connecticut 0 -- -- 0 -- -- 0 -- --Maine 0 -- -- 0 -- -- 0 -- --Massachusetts 0 -- -- 0 -- -- 0 -- --New Hampshire 0 -- -- 0 -- -- 0 -- --Rhode Island 0 -- -- 0 -- -- 0 -- --Vermont 0 -- -- 0 -- -- 0 -- --Middle Atlantic 0 -- -- 0 -- -- 0 -- --New Jersey 0 -- -- 0 -- -- 0 -- --New York 0 -- -- 0 -- -- 0 -- --Pennsylvania 0 -- -- 0 -- -- 0 -- --East North Central 0 -- -- 0 -- -- 0 -- --Illinois 0 -- -- 0 -- -- 0 -- --Indiana 0 -- -- 0 -- -- 0 -- --Michigan 0 -- -- 0 -- -- 0 -- --Ohio 0 -- -- 0 -- -- 0 -- --Wisconsin 0 -- -- 0 -- -- 0 -- --West North Central 0 -- -- 0 -- -- 0 -- --Iowa 0 -- -- 0 -- -- 0 -- --Kansas 0 -- -- 0 -- -- 0 -- --Minnesota 0 -- -- 0 -- -- 0 -- --Missouri 0 -- -- 0 -- -- 0 -- --Nebraska 0 -- -- 0 -- -- 0 -- --North Dakota 0 -- -- 0 -- -- 0 -- --South Dakota 0 -- -- 0 -- -- 0 -- --South Atlantic 0 -- -- 0 -- -- 0 -- --Delaware 0 -- -- 0 -- -- 0 -- --District of Columbia 0 -- -- 0 -- -- 0 -- --Florida 0 -- -- 0 -- -- 0 -- --Georgia 0 -- -- 0 -- -- 0 -- --Maryland 0 -- -- 0 -- -- 0 -- --North Carolina 0 -- -- 0 -- -- 0 -- --South Carolina 0 -- -- 0 -- -- 0 -- --Virginia 0 -- -- 0 -- -- 0 -- --West Virginia 0 -- -- 0 -- -- 0 -- --East South Central 0 -- -- 0 -- -- 0 -- --Alabama 0 -- -- 0 -- -- 0 -- --Kentucky 0 -- -- 0 -- -- 0 -- --Mississippi 0 -- -- 0 -- -- 0 -- --Tennessee 0 -- -- 0 -- -- 0 -- --West South Central 0 -- -- 0 -- -- 0 -- --Arkansas 0 -- -- 0 -- -- 0 -- --Louisiana 0 -- -- 0 -- -- 0 -- --Oklahoma 0 -- -- 0 -- -- 0 -- --Texas 0 -- -- 0 -- -- 0 -- --Mountain 0 -- -- 0 -- -- 0 -- --Arizona 0 -- -- 0 -- -- 0 -- --Colorado 0 -- -- 0 -- -- 0 -- --Idaho 0 -- -- 0 -- -- 0 -- --Montana 0 -- -- 0 -- -- 0 -- --Nevada 0 -- -- 0 -- -- 0 -- --New Mexico 0 -- -- 0 -- -- 0 -- --Utah 0 -- -- 0 -- -- 0 -- --Wyoming 0 -- -- 0 -- -- 0 -- --Pacific Contiguous 0 -- -- 0 -- -- 0 -- --California 0 -- -- 0 -- -- 0 -- --Oregon 0 -- -- 0 -- -- 0 -- --Washington 0 -- -- 0 -- -- 0 -- --Pacific Noncontiguous 0 -- -- 0 -- -- 0 -- --Alaska 0 -- -- 0 -- -- 0 -- --Hawaii 0 -- -- 0 -- -- 0 -- --U.S. Total 0 -- -- 0 -- -- 0 -- --
Displayed values of zero may represent small values that round to zero.NM = Not meaningful due to large relative standard error or excessive percentage change.W = Withheld to avoid disclosure of individual company data.
Notes:Bituminous coal includes anthracite coal and coal-derived synthesis gas.See Glossary for definitions. Values for 2017 and 2018 are preliminary. See Technical Notes for a discussion of the sample design for the Form EIA-923.
Source: U.S. Energy Information Administration, Form EIA-923, "Power Plant Operations Report."
Table 4.17. Receipts and Quality of Coal by Rank Delivered for Electricity Generation:Commercial Sector by State, April 2018
Bituminous Subbituminous Lignite
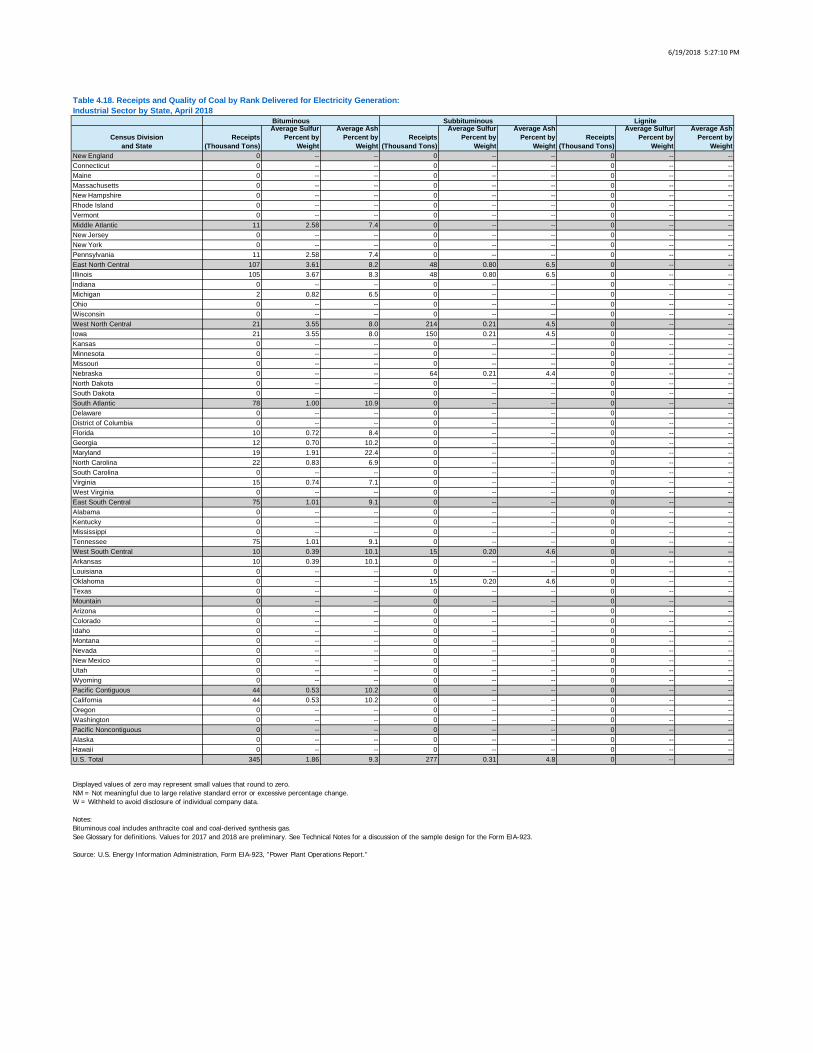
6/19/2018 5:27:10 PM
Census Divisionand State
Receipts (Thousand Tons)
Average Sulfur Percent by
Weight
Average Ash Percent by
WeightReceipts
(Thousand Tons)
Average Sulfur Percent by
Weight
Average Ash Percent by
WeightReceipts
(Thousand Tons)
Average Sulfur Percent by
Weight
Average Ash Percent by
WeightNew England 0 -- -- 0 -- -- 0 -- --Connecticut 0 -- -- 0 -- -- 0 -- --Maine 0 -- -- 0 -- -- 0 -- --Massachusetts 0 -- -- 0 -- -- 0 -- --New Hampshire 0 -- -- 0 -- -- 0 -- --Rhode Island 0 -- -- 0 -- -- 0 -- --Vermont 0 -- -- 0 -- -- 0 -- --Middle Atlantic 11 2.58 7.4 0 -- -- 0 -- --New Jersey 0 -- -- 0 -- -- 0 -- --New York 0 -- -- 0 -- -- 0 -- --Pennsylvania 11 2.58 7.4 0 -- -- 0 -- --East North Central 107 3.61 8.2 48 0.80 6.5 0 -- --Illinois 105 3.67 8.3 48 0.80 6.5 0 -- --Indiana 0 -- -- 0 -- -- 0 -- --Michigan 2 0.82 6.5 0 -- -- 0 -- --Ohio 0 -- -- 0 -- -- 0 -- --Wisconsin 0 -- -- 0 -- -- 0 -- --West North Central 21 3.55 8.0 214 0.21 4.5 0 -- --Iowa 21 3.55 8.0 150 0.21 4.5 0 -- --Kansas 0 -- -- 0 -- -- 0 -- --Minnesota 0 -- -- 0 -- -- 0 -- --Missouri 0 -- -- 0 -- -- 0 -- --Nebraska 0 -- -- 64 0.21 4.4 0 -- --North Dakota 0 -- -- 0 -- -- 0 -- --South Dakota 0 -- -- 0 -- -- 0 -- --South Atlantic 78 1.00 10.9 0 -- -- 0 -- --Delaware 0 -- -- 0 -- -- 0 -- --District of Columbia 0 -- -- 0 -- -- 0 -- --Florida 10 0.72 8.4 0 -- -- 0 -- --Georgia 12 0.70 10.2 0 -- -- 0 -- --Maryland 19 1.91 22.4 0 -- -- 0 -- --North Carolina 22 0.83 6.9 0 -- -- 0 -- --South Carolina 0 -- -- 0 -- -- 0 -- --Virginia 15 0.74 7.1 0 -- -- 0 -- --West Virginia 0 -- -- 0 -- -- 0 -- --East South Central 75 1.01 9.1 0 -- -- 0 -- --Alabama 0 -- -- 0 -- -- 0 -- --Kentucky 0 -- -- 0 -- -- 0 -- --Mississippi 0 -- -- 0 -- -- 0 -- --Tennessee 75 1.01 9.1 0 -- -- 0 -- --West South Central 10 0.39 10.1 15 0.20 4.6 0 -- --Arkansas 10 0.39 10.1 0 -- -- 0 -- --Louisiana 0 -- -- 0 -- -- 0 -- --Oklahoma 0 -- -- 15 0.20 4.6 0 -- --Texas 0 -- -- 0 -- -- 0 -- --Mountain 0 -- -- 0 -- -- 0 -- --Arizona 0 -- -- 0 -- -- 0 -- --Colorado 0 -- -- 0 -- -- 0 -- --Idaho 0 -- -- 0 -- -- 0 -- --Montana 0 -- -- 0 -- -- 0 -- --Nevada 0 -- -- 0 -- -- 0 -- --New Mexico 0 -- -- 0 -- -- 0 -- --Utah 0 -- -- 0 -- -- 0 -- --Wyoming 0 -- -- 0 -- -- 0 -- --Pacific Contiguous 44 0.53 10.2 0 -- -- 0 -- --California 44 0.53 10.2 0 -- -- 0 -- --Oregon 0 -- -- 0 -- -- 0 -- --Washington 0 -- -- 0 -- -- 0 -- --Pacific Noncontiguous 0 -- -- 0 -- -- 0 -- --Alaska 0 -- -- 0 -- -- 0 -- --Hawaii 0 -- -- 0 -- -- 0 -- --U.S. Total 345 1.86 9.3 277 0.31 4.8 0 -- --
Displayed values of zero may represent small values that round to zero.NM = Not meaningful due to large relative standard error or excessive percentage change.W = Withheld to avoid disclosure of individual company data.
Notes:Bituminous coal includes anthracite coal and coal-derived synthesis gas.See Glossary for definitions. Values for 2017 and 2018 are preliminary. See Technical Notes for a discussion of the sample design for the Form EIA-923.
Source: U.S. Energy Information Administration, Form EIA-923, "Power Plant Operations Report."
Table 4.18. Receipts and Quality of Coal by Rank Delivered for Electricity Generation:Industrial Sector by State, April 2018
Bituminous Subbituminous Lignite
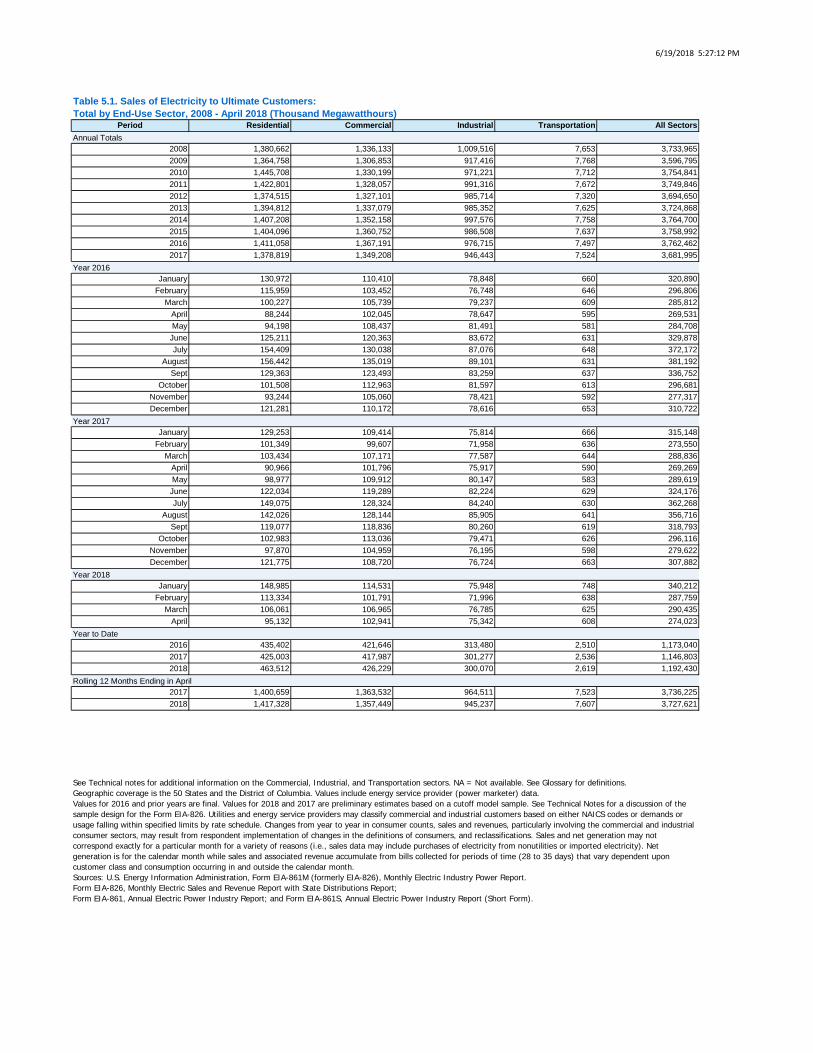
6/19/2018 5:27:12 PM
Period Residential Commercial Industrial Transportation All Sectors
2008 1,380,662 1,336,133 1,009,516 7,653 3,733,9652009 1,364,758 1,306,853 917,416 7,768 3,596,7952010 1,445,708 1,330,199 971,221 7,712 3,754,8412011 1,422,801 1,328,057 991,316 7,672 3,749,8462012 1,374,515 1,327,101 985,714 7,320 3,694,6502013 1,394,812 1,337,079 985,352 7,625 3,724,8682014 1,407,208 1,352,158 997,576 7,758 3,764,7002015 1,404,096 1,360,752 986,508 7,637 3,758,9922016 1,411,058 1,367,191 976,715 7,497 3,762,4622017 1,378,819 1,349,208 946,443 7,524 3,681,995
January 130,972 110,410 78,848 660 320,890February 115,959 103,452 76,748 646 296,806
March 100,227 105,739 79,237 609 285,812April 88,244 102,045 78,647 595 269,531May 94,198 108,437 81,491 581 284,708June 125,211 120,363 83,672 631 329,878July 154,409 130,038 87,076 648 372,172
August 156,442 135,019 89,101 631 381,192Sept 129,363 123,493 83,259 637 336,752
October 101,508 112,963 81,597 613 296,681November 93,244 105,060 78,421 592 277,317December 121,281 110,172 78,616 653 310,722
January 129,253 109,414 75,814 666 315,148February 101,349 99,607 71,958 636 273,550
March 103,434 107,171 77,587 644 288,836April 90,966 101,796 75,917 590 269,269May 98,977 109,912 80,147 583 289,619June 122,034 119,289 82,224 629 324,176July 149,075 128,324 84,240 630 362,268
August 142,026 128,144 85,905 641 356,716Sept 119,077 118,836 80,260 619 318,793
October 102,983 113,036 79,471 626 296,116November 97,870 104,959 76,195 598 279,622December 121,775 108,720 76,724 663 307,882
January 148,985 114,531 75,948 748 340,212February 113,334 101,791 71,996 638 287,759
March 106,061 106,965 76,785 625 290,435April 95,132 102,941 75,342 608 274,023
2016 435,402 421,646 313,480 2,510 1,173,0402017 425,003 417,987 301,277 2,536 1,146,8032018 463,512 426,229 300,070 2,619 1,192,430
2017 1,400,659 1,363,532 964,511 7,523 3,736,2252018 1,417,328 1,357,449 945,237 7,607 3,727,621
Year to Date
Rolling 12 Months Ending in April
See Technical notes for additional information on the Commercial, Industrial, and Transportation sectors. NA = Not available. See Glossary for definitions.Geographic coverage is the 50 States and the District of Columbia. Values include energy service provider (power marketer) data.Values for 2016 and prior years are final. Values for 2018 and 2017 are preliminary estimates based on a cutoff model sample. See Technical Notes for a discussion of the sample design for the Form EIA-826. Utilities and energy service providers may classify commercial and industrial customers based on either NAICS codes or demands or usage falling within specified limits by rate schedule. Changes from year to year in consumer counts, sales and revenues, particularly involving the commercial and industrial consumer sectors, may result from respondent implementation of changes in the definitions of consumers, and reclassifications. Sales and net generation may not correspond exactly for a particular month for a variety of reasons (i.e., sales data may include purchases of electricity from nonutilities or imported electricity). Net generation is for the calendar month while sales and associated revenue accumulate from bills collected for periods of time (28 to 35 days) that vary dependent upon customer class and consumption occurring in and outside the calendar month.Sources: U.S. Energy Information Administration, Form EIA-861M (formerly EIA-826), Monthly Electric Industry Power Report.Form EIA-826, Monthly Electric Sales and Revenue Report with State Distributions Report; Form EIA-861, Annual Electric Power Industry Report; and Form EIA-861S, Annual Electric Power Industry Report (Short Form).
Table 5.1. Sales of Electricity to Ultimate Customers:Total by End-Use Sector, 2008 - April 2018 (Thousand Megawatthours)
Annual Totals
Year 2016
Year 2017
Year 2018
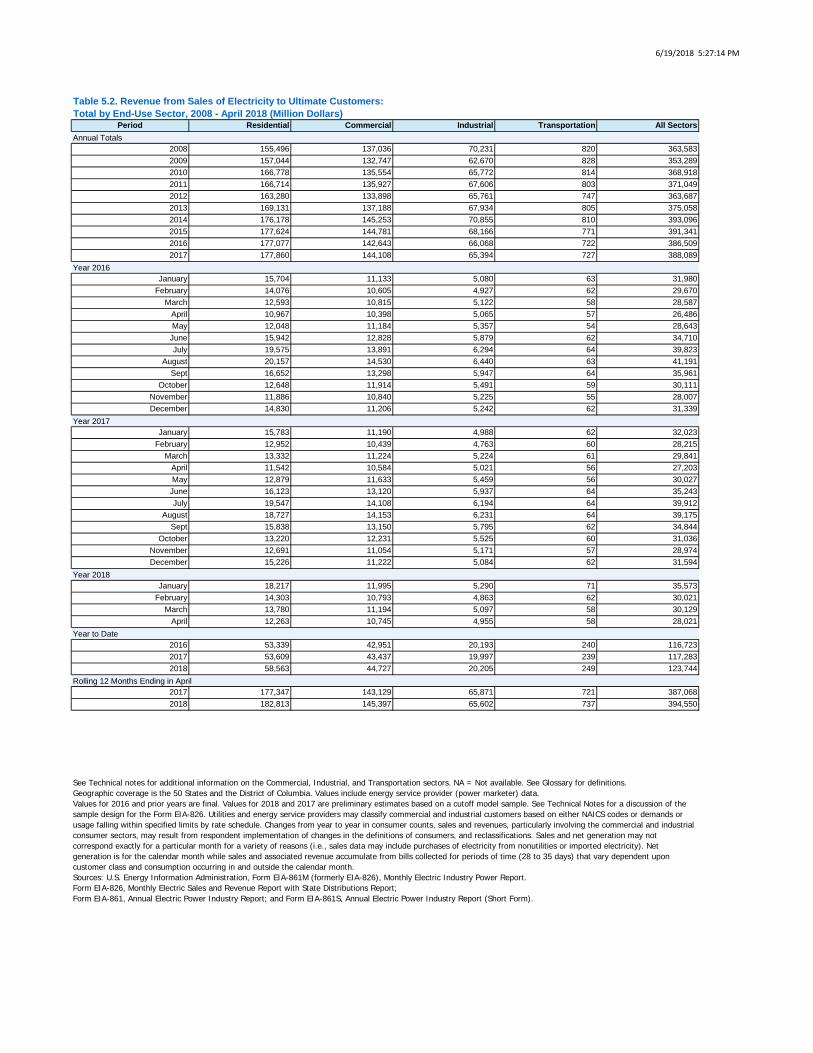
6/19/2018 5:27:14 PM
Period Residential Commercial Industrial Transportation All Sectors
2008 155,496 137,036 70,231 820 363,5832009 157,044 132,747 62,670 828 353,2892010 166,778 135,554 65,772 814 368,9182011 166,714 135,927 67,606 803 371,0492012 163,280 133,898 65,761 747 363,6872013 169,131 137,188 67,934 805 375,0582014 176,178 145,253 70,855 810 393,0962015 177,624 144,781 68,166 771 391,3412016 177,077 142,643 66,068 722 386,5092017 177,860 144,108 65,394 727 388,089
January 15,704 11,133 5,080 63 31,980February 14,076 10,605 4,927 62 29,670
March 12,593 10,815 5,122 58 28,587April 10,967 10,398 5,065 57 26,486May 12,048 11,184 5,357 54 28,643June 15,942 12,828 5,879 62 34,710July 19,575 13,891 6,294 64 39,823
August 20,157 14,530 6,440 63 41,191Sept 16,652 13,298 5,947 64 35,961
October 12,648 11,914 5,491 59 30,111November 11,886 10,840 5,225 55 28,007December 14,830 11,206 5,242 62 31,339
January 15,783 11,190 4,988 62 32,023February 12,952 10,439 4,763 60 28,215
March 13,332 11,224 5,224 61 29,841April 11,542 10,584 5,021 56 27,203May 12,879 11,633 5,459 56 30,027June 16,123 13,120 5,937 64 35,243July 19,547 14,108 6,194 64 39,912
August 18,727 14,153 6,231 64 39,175Sept 15,838 13,150 5,795 62 34,844
October 13,220 12,231 5,525 60 31,036November 12,691 11,054 5,171 57 28,974December 15,226 11,222 5,084 62 31,594
January 18,217 11,995 5,290 71 35,573February 14,303 10,793 4,863 62 30,021
March 13,780 11,194 5,097 58 30,129April 12,263 10,745 4,955 58 28,021
2016 53,339 42,951 20,193 240 116,7232017 53,609 43,437 19,997 239 117,2832018 58,563 44,727 20,205 249 123,744
2017 177,347 143,129 65,871 721 387,0682018 182,813 145,397 65,602 737 394,550
Year to Date
Rolling 12 Months Ending in April
See Technical notes for additional information on the Commercial, Industrial, and Transportation sectors. NA = Not available. See Glossary for definitions.Geographic coverage is the 50 States and the District of Columbia. Values include energy service provider (power marketer) data.Values for 2016 and prior years are final. Values for 2018 and 2017 are preliminary estimates based on a cutoff model sample. See Technical Notes for a discussion of the sample design for the Form EIA-826. Utilities and energy service providers may classify commercial and industrial customers based on either NAICS codes or demands or usage falling within specified limits by rate schedule. Changes from year to year in consumer counts, sales and revenues, particularly involving the commercial and industrial consumer sectors, may result from respondent implementation of changes in the definitions of consumers, and reclassifications. Sales and net generation may not correspond exactly for a particular month for a variety of reasons (i.e., sales data may include purchases of electricity from nonutilities or imported electricity). Net generation is for the calendar month while sales and associated revenue accumulate from bills collected for periods of time (28 to 35 days) that vary dependent upon customer class and consumption occurring in and outside the calendar month.Sources: U.S. Energy Information Administration, Form EIA-861M (formerly EIA-826), Monthly Electric Industry Power Report.Form EIA-826, Monthly Electric Sales and Revenue Report with State Distributions Report; Form EIA-861, Annual Electric Power Industry Report; and Form EIA-861S, Annual Electric Power Industry Report (Short Form).
Table 5.2. Revenue from Sales of Electricity to Ultimate Customers:Total by End-Use Sector, 2008 - April 2018 (Million Dollars)
Annual Totals
Year 2016
Year 2017
Year 2018

6/19/2018 5:27:15 PM
Period Residential Commercial Industrial Transportation All Sectors
2008 11.26 10.26 6.96 10.71 9.742009 11.51 10.16 6.83 10.66 9.822010 11.54 10.19 6.77 10.56 9.832011 11.72 10.24 6.82 10.46 9.902012 11.88 10.09 6.67 10.21 9.842013 12.13 10.26 6.89 10.55 10.072014 12.52 10.74 7.10 10.45 10.442015 12.65 10.64 6.91 10.09 10.412016 12.55 10.43 6.76 9.63 10.272017 12.90 10.68 6.91 9.67 10.54
January 11.99 10.08 6.44 9.52 9.97February 12.14 10.25 6.42 9.61 10.00
March 12.56 10.23 6.46 9.56 10.00April 12.43 10.19 6.44 9.53 9.83May 12.79 10.31 6.57 9.28 10.06June 12.73 10.66 7.03 9.75 10.52July 12.68 10.68 7.23 9.84 10.70
August 12.88 10.76 7.23 10.04 10.81Sept 12.87 10.77 7.14 10.00 10.68
October 12.46 10.55 6.73 9.62 10.15November 12.75 10.32 6.66 9.22 10.10December 12.23 10.17 6.67 9.49 10.09
January 12.21 10.23 6.58 9.38 10.16February 12.78 10.48 6.62 9.47 10.31
March 12.89 10.47 6.73 9.47 10.33April 12.69 10.40 6.61 9.44 10.10May 13.01 10.58 6.81 9.58 10.37June 13.21 11.00 7.22 10.14 10.87July 13.11 10.99 7.35 10.11 11.02
August 13.19 11.04 7.25 10.05 10.98Sept 13.30 11.07 7.22 9.99 10.93
October 12.84 10.82 6.95 9.55 10.48November 12.97 10.53 6.79 9.49 10.36December 12.50 10.32 6.63 9.32 10.26
January 12.23 10.47 6.97 9.46 10.46February 12.62 10.60 6.75 9.74 10.43
March 12.99 10.47 6.64 9.33 10.37April 12.89 10.44 6.58 9.53 10.23
2016 12.25 10.19 6.44 9.56 9.952017 12.61 10.39 6.64 9.44 10.232018 12.63 10.49 6.73 9.51 10.38
2017 12.66 10.50 6.83 9.59 10.362018 12.90 10.71 6.94 9.69 10.58
Year to Date
Rolling 12 Months Ending in April
See Technical notes for additional information on the Commercial, Industrial, and Transportation sectors. NA = Not available. See Glossary for definitions.Geographic coverage is the 50 States and the District of Columbia. Values include energy service provider (power marketer) data.Values for 2016 and prior years are final. Values for 2018 and 2017 are preliminary estimates based on a cutoff model sample. See Technical Notes for a discussion of the sample design for the Form EIA-826. Utilities and energy service providers may classify commercial and industrial customers based on either NAICS codes or demands or usage falling within specified limits by rate schedule. Changes from year to year in consumer counts, sales and revenues, particularly involving the commercial and industrial consumer sectors, may result from respondent implementation of changes in the definitions of consumers, and reclassifications. Sales and net generation may not correspond exactly for a particular month for a variety of reasons (i.e., sales data may include purchases of electricity from nonutilities or imported electricity). Net generation is for the calendar month while sales and associated revenue accumulate from bills collected for periods of time (28 to 35 days) that vary dependent upon customer class and consumption occurring in and outside the calendar month.Sources: U.S. Energy Information Administration, Form EIA-861M (formerly EIA-826), Monthly Electric Industry Power Report.Form EIA-826, Monthly Electric Sales and Revenue Report with State Distributions Report; Form EIA-861, Annual Electric Power Industry Report; and Form EIA-861S, Annual Electric Power Industry Report (Short Form).
Table 5.3. Average Price of Electricity to Ultimate Customers:Total by End-Use Sector, 2008 - April 2018 (Cents per Kilowatthour)
Annual Totals
Year 2016
Year 2017
Year 2018
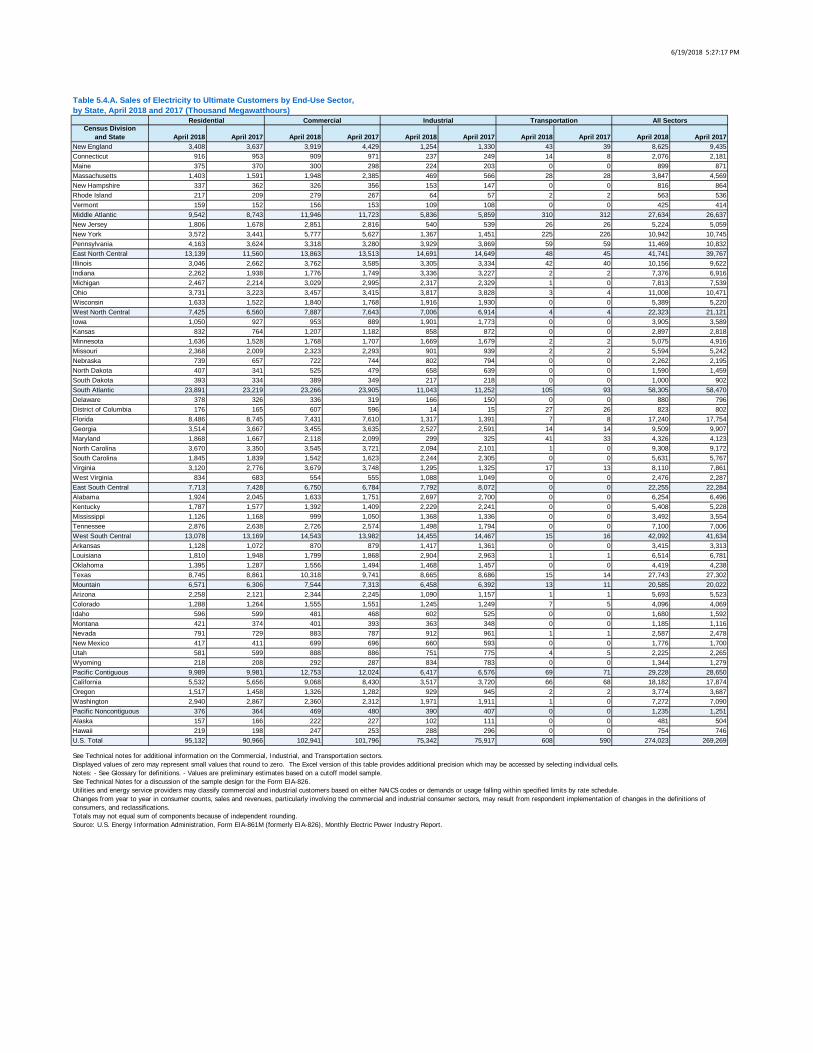
6/19/2018 5:27:17 PM
Census Divisionand State April 2018 April 2017 April 2018 April 2017 April 2018 April 2017 April 2018 April 2017 April 2018 April 2017
New England 3,408 3,637 3,919 4,429 1,254 1,330 43 39 8,625 9,435Connecticut 916 953 909 971 237 249 14 8 2,076 2,181Maine 375 370 300 298 224 203 0 0 899 871Massachusetts 1,403 1,591 1,948 2,385 469 566 28 28 3,847 4,569New Hampshire 337 362 326 356 153 147 0 0 816 864Rhode Island 217 209 279 267 64 57 2 2 563 536Vermont 159 152 156 153 109 108 0 0 425 414Middle Atlantic 9,542 8,743 11,946 11,723 5,836 5,859 310 312 27,634 26,637New Jersey 1,806 1,678 2,851 2,816 540 539 26 26 5,224 5,059New York 3,572 3,441 5,777 5,627 1,367 1,451 225 226 10,942 10,745Pennsylvania 4,163 3,624 3,318 3,280 3,929 3,869 59 59 11,469 10,832East North Central 13,139 11,560 13,863 13,513 14,691 14,649 48 45 41,741 39,767Illinois 3,046 2,662 3,762 3,585 3,305 3,334 42 40 10,156 9,622Indiana 2,262 1,938 1,776 1,749 3,336 3,227 2 2 7,376 6,916Michigan 2,467 2,214 3,029 2,995 2,317 2,329 1 0 7,813 7,539Ohio 3,731 3,223 3,457 3,415 3,817 3,828 3 4 11,008 10,471Wisconsin 1,633 1,522 1,840 1,768 1,916 1,930 0 0 5,389 5,220West North Central 7,425 6,560 7,887 7,643 7,006 6,914 4 4 22,323 21,121Iowa 1,050 927 953 889 1,901 1,773 0 0 3,905 3,589Kansas 832 764 1,207 1,182 858 872 0 0 2,897 2,818Minnesota 1,636 1,528 1,768 1,707 1,669 1,679 2 2 5,075 4,916Missouri 2,368 2,009 2,323 2,293 901 939 2 2 5,594 5,242Nebraska 739 657 722 744 802 794 0 0 2,262 2,195North Dakota 407 341 525 479 658 639 0 0 1,590 1,459South Dakota 393 334 389 349 217 218 0 0 1,000 902South Atlantic 23,891 23,219 23,266 23,905 11,043 11,252 105 93 58,305 58,470Delaware 378 326 336 319 166 150 0 0 880 796District of Columbia 176 165 607 596 14 15 27 26 823 802Florida 8,486 8,745 7,431 7,610 1,317 1,391 7 8 17,240 17,754Georgia 3,514 3,667 3,455 3,635 2,527 2,591 14 14 9,509 9,907Maryland 1,868 1,667 2,118 2,099 299 325 41 33 4,326 4,123North Carolina 3,670 3,350 3,545 3,721 2,094 2,101 1 0 9,308 9,172South Carolina 1,845 1,839 1,542 1,623 2,244 2,305 0 0 5,631 5,767Virginia 3,120 2,776 3,679 3,748 1,295 1,325 17 13 8,110 7,861West Virginia 834 683 554 555 1,088 1,049 0 0 2,476 2,287East South Central 7,713 7,428 6,750 6,784 7,792 8,072 0 0 22,255 22,284Alabama 1,924 2,045 1,633 1,751 2,697 2,700 0 0 6,254 6,496Kentucky 1,787 1,577 1,392 1,409 2,229 2,241 0 0 5,408 5,228Mississippi 1,126 1,168 999 1,050 1,368 1,336 0 0 3,492 3,554Tennessee 2,876 2,638 2,726 2,574 1,498 1,794 0 0 7,100 7,006West South Central 13,078 13,169 14,543 13,982 14,455 14,467 15 16 42,092 41,634Arkansas 1,128 1,072 870 879 1,417 1,361 0 0 3,415 3,313Louisiana 1,810 1,948 1,799 1,868 2,904 2,963 1 1 6,514 6,781Oklahoma 1,395 1,287 1,556 1,494 1,468 1,457 0 0 4,419 4,238Texas 8,745 8,861 10,318 9,741 8,665 8,686 15 14 27,743 27,302Mountain 6,571 6,306 7,544 7,313 6,458 6,392 13 11 20,585 20,022Arizona 2,258 2,121 2,344 2,245 1,090 1,157 1 1 5,693 5,523Colorado 1,288 1,264 1,555 1,551 1,245 1,249 7 5 4,096 4,069Idaho 596 599 481 468 602 525 0 0 1,680 1,592Montana 421 374 401 393 363 348 0 0 1,185 1,116Nevada 791 729 883 787 912 961 1 1 2,587 2,478New Mexico 417 411 699 696 660 593 0 0 1,776 1,700Utah 581 599 888 886 751 775 4 5 2,225 2,265Wyoming 218 208 292 287 834 783 0 0 1,344 1,279Pacific Contiguous 9,989 9,981 12,753 12,024 6,417 6,576 69 71 29,228 28,650California 5,532 5,656 9,068 8,430 3,517 3,720 66 68 18,182 17,874Oregon 1,517 1,458 1,326 1,282 929 945 2 2 3,774 3,687Washington 2,940 2,867 2,360 2,312 1,971 1,911 1 0 7,272 7,090Pacific Noncontiguous 376 364 469 480 390 407 0 0 1,235 1,251Alaska 157 166 222 227 102 111 0 0 481 504Hawaii 219 198 247 253 288 296 0 0 754 746U.S. Total 95,132 90,966 102,941 101,796 75,342 75,917 608 590 274,023 269,269
See Technical notes for additional information on the Commercial, Industrial, and Transportation sectors.Displayed values of zero may represent small values that round to zero. The Excel version of this table provides additional precision which may be accessed by selecting individual cells.Notes: - See Glossary for definitions. - Values are preliminary estimates based on a cutoff model sample.See Technical Notes for a discussion of the sample design for the Form EIA-826.Utilities and energy service providers may classify commercial and industrial customers based on either NAICS codes or demands or usage falling within specified limits by rate schedule.Changes from year to year in consumer counts, sales and revenues, particularly involving the commercial and industrial consumer sectors, may result from respondent implementation of changes in the definitions of consumers, and reclassifications.Totals may not equal sum of components because of independent rounding.Source: U.S. Energy Information Administration, Form EIA-861M (formerly EIA-826), Monthly Electric Power Industry Report.
Table 5.4.A. Sales of Electricity to Ultimate Customers by End-Use Sector,by State, April 2018 and 2017 (Thousand Megawatthours)
Residential Commercial Industrial Transportation All Sectors
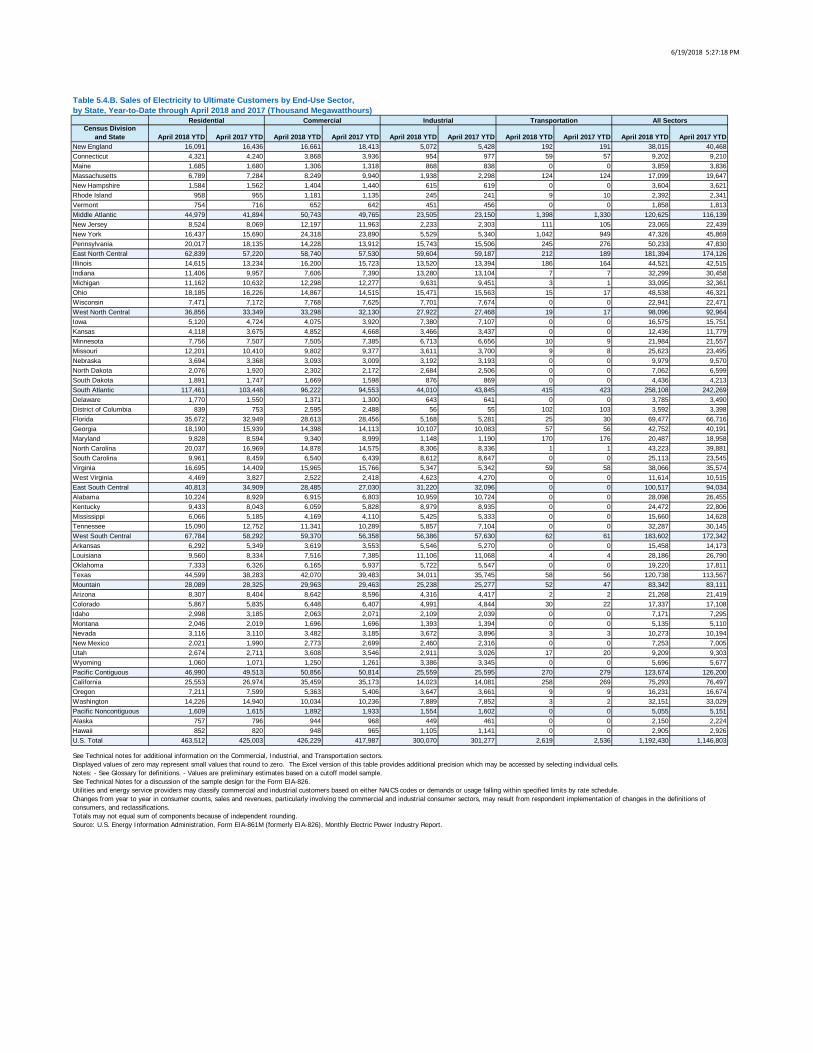
6/19/2018 5:27:18 PM
Census Divisionand State April 2018 YTD April 2017 YTD April 2018 YTD April 2017 YTD April 2018 YTD April 2017 YTD April 2018 YTD April 2017 YTD April 2018 YTD April 2017 YTD
New England 16,091 16,436 16,661 18,413 5,072 5,428 192 191 38,015 40,468Connecticut 4,321 4,240 3,868 3,936 954 977 59 57 9,202 9,210Maine 1,685 1,680 1,306 1,318 868 838 0 0 3,859 3,836Massachusetts 6,789 7,284 8,249 9,940 1,938 2,298 124 124 17,099 19,647New Hampshire 1,584 1,562 1,404 1,440 615 619 0 0 3,604 3,621Rhode Island 958 955 1,181 1,135 245 241 9 10 2,392 2,341Vermont 754 716 652 642 451 456 0 0 1,858 1,813Middle Atlantic 44,979 41,894 50,743 49,765 23,505 23,150 1,398 1,330 120,625 116,139New Jersey 8,524 8,069 12,197 11,963 2,233 2,303 111 105 23,065 22,439New York 16,437 15,690 24,318 23,890 5,529 5,340 1,042 949 47,326 45,869Pennsylvania 20,017 18,135 14,228 13,912 15,743 15,506 245 276 50,233 47,830East North Central 62,839 57,220 58,740 57,530 59,604 59,187 212 189 181,394 174,126Illinois 14,615 13,234 16,200 15,723 13,520 13,394 186 164 44,521 42,515Indiana 11,406 9,957 7,606 7,390 13,280 13,104 7 7 32,299 30,458Michigan 11,162 10,632 12,298 12,277 9,631 9,451 3 1 33,095 32,361Ohio 18,185 16,226 14,867 14,515 15,471 15,563 15 17 48,538 46,321Wisconsin 7,471 7,172 7,768 7,625 7,701 7,674 0 0 22,941 22,471West North Central 36,856 33,349 33,298 32,130 27,922 27,468 19 17 98,096 92,964Iowa 5,120 4,724 4,075 3,920 7,380 7,107 0 0 16,575 15,751Kansas 4,118 3,675 4,852 4,668 3,466 3,437 0 0 12,436 11,779Minnesota 7,756 7,507 7,505 7,385 6,713 6,656 10 9 21,984 21,557Missouri 12,201 10,410 9,802 9,377 3,611 3,700 9 8 25,623 23,495Nebraska 3,694 3,368 3,093 3,009 3,192 3,193 0 0 9,979 9,570North Dakota 2,076 1,920 2,302 2,172 2,684 2,506 0 0 7,062 6,599South Dakota 1,891 1,747 1,669 1,598 876 869 0 0 4,436 4,213South Atlantic 117,461 103,448 96,222 94,553 44,010 43,845 415 423 258,108 242,269Delaware 1,770 1,550 1,371 1,300 643 641 0 0 3,785 3,490District of Columbia 839 753 2,595 2,488 56 55 102 103 3,592 3,398Florida 35,672 32,949 28,613 28,456 5,168 5,281 25 30 69,477 66,716Georgia 18,190 15,939 14,398 14,113 10,107 10,083 57 56 42,752 40,191Maryland 9,828 8,594 9,340 8,999 1,148 1,190 170 176 20,487 18,958North Carolina 20,037 16,969 14,878 14,575 8,306 8,336 1 1 43,223 39,881South Carolina 9,961 8,459 6,540 6,439 8,612 8,647 0 0 25,113 23,545Virginia 16,695 14,409 15,965 15,766 5,347 5,342 59 58 38,066 35,574West Virginia 4,469 3,827 2,522 2,418 4,623 4,270 0 0 11,614 10,515East South Central 40,813 34,909 28,485 27,030 31,220 32,096 0 0 100,517 94,034Alabama 10,224 8,929 6,915 6,803 10,959 10,724 0 0 28,098 26,455Kentucky 9,433 8,043 6,059 5,828 8,979 8,935 0 0 24,472 22,806Mississippi 6,066 5,185 4,169 4,110 5,425 5,333 0 0 15,660 14,628Tennessee 15,090 12,752 11,341 10,289 5,857 7,104 0 0 32,287 30,145West South Central 67,784 58,292 59,370 56,358 56,386 57,630 62 61 183,602 172,342Arkansas 6,292 5,349 3,619 3,553 5,546 5,270 0 0 15,458 14,173Louisiana 9,560 8,334 7,516 7,385 11,106 11,068 4 4 28,186 26,790Oklahoma 7,333 6,326 6,165 5,937 5,722 5,547 0 0 19,220 17,811Texas 44,599 38,283 42,070 39,483 34,011 35,745 58 56 120,738 113,567Mountain 28,089 28,325 29,963 29,463 25,238 25,277 52 47 83,342 83,111Arizona 8,307 8,404 8,642 8,596 4,316 4,417 2 2 21,268 21,419Colorado 5,867 5,835 6,448 6,407 4,991 4,844 30 22 17,337 17,108Idaho 2,998 3,185 2,063 2,071 2,109 2,039 0 0 7,171 7,295Montana 2,046 2,019 1,696 1,696 1,393 1,394 0 0 5,135 5,110Nevada 3,116 3,110 3,482 3,185 3,672 3,896 3 3 10,273 10,194New Mexico 2,021 1,990 2,773 2,699 2,460 2,316 0 0 7,253 7,005Utah 2,674 2,711 3,608 3,546 2,911 3,026 17 20 9,209 9,303Wyoming 1,060 1,071 1,250 1,261 3,386 3,345 0 0 5,696 5,677Pacific Contiguous 46,990 49,513 50,856 50,814 25,559 25,595 270 279 123,674 126,200California 25,553 26,974 35,459 35,173 14,023 14,081 258 269 75,293 76,497Oregon 7,211 7,599 5,363 5,406 3,647 3,661 9 9 16,231 16,674Washington 14,226 14,940 10,034 10,236 7,889 7,852 3 2 32,151 33,029Pacific Noncontiguous 1,609 1,615 1,892 1,933 1,554 1,602 0 0 5,055 5,151Alaska 757 796 944 968 449 461 0 0 2,150 2,224Hawaii 852 820 948 965 1,105 1,141 0 0 2,905 2,926U.S. Total 463,512 425,003 426,229 417,987 300,070 301,277 2,619 2,536 1,192,430 1,146,803
See Technical notes for additional information on the Commercial, Industrial, and Transportation sectors.Displayed values of zero may represent small values that round to zero. The Excel version of this table provides additional precision which may be accessed by selecting individual cells.Notes: - See Glossary for definitions. - Values are preliminary estimates based on a cutoff model sample.See Technical Notes for a discussion of the sample design for the Form EIA-826.Utilities and energy service providers may classify commercial and industrial customers based on either NAICS codes or demands or usage falling within specified limits by rate schedule.Changes from year to year in consumer counts, sales and revenues, particularly involving the commercial and industrial consumer sectors, may result from respondent implementation of changes in the definitions of consumers, and reclassifications.Totals may not equal sum of components because of independent rounding.Source: U.S. Energy Information Administration, Form EIA-861M (formerly EIA-826), Monthly Electric Power Industry Report.
Table 5.4.B. Sales of Electricity to Ultimate Customers by End-Use Sector,by State, Year-to-Date through April 2018 and 2017 (Thousand Megawatthours)
Residential Commercial Industrial Transportation All Sectors

6/19/2018 5:27:20 PM
Census Divisionand State April 2018 April 2017 April 2018 April 2017 April 2018 April 2017 April 2018 April 2017 April 2018 April 2017
New England 709 698 627 641 160 162 4 3 1,499 1,504Connecticut 196 192 152 153 32 32 2 1 382 379Maine 59 59 36 35 19 19 0 0 114 114Massachusetts 313 310 319 337 68 74 2 2 701 722New Hampshire 67 69 51 52 20 18 0 0 139 138Rhode Island 45 41 45 41 9 8 0 0 99 91Vermont 29 27 24 23 11 11 0 0 63 60Middle Atlantic 1,511 1,382 1,396 1,420 386 405 34 34 3,327 3,241New Jersey 282 264 334 344 51 54 2 2 669 665New York 643 595 770 776 76 85 27 27 1,516 1,484Pennsylvania 587 523 291 300 259 266 4 4 1,141 1,093East North Central 1,774 1,564 1,411 1,373 1,023 1,019 3 3 4,212 3,959Illinois 397 351 337 324 214 211 3 2 950 889Indiana 278 244 185 182 239 241 0 0 702 667Michigan 387 341 340 324 169 170 0 0 896 834Ohio 472 404 349 351 257 250 0 0 1,078 1,005Wisconsin 240 224 201 192 145 148 0 0 585 565West North Central 860 779 733 723 477 484 0 0 2,071 1,987Iowa 129 113 88 80 111 95 0 0 327 288Kansas 113 104 128 124 60 66 0 0 300 294Minnesota 211 199 175 181 117 129 0 0 502 509Missouri 245 219 198 196 57 61 0 0 500 476Nebraska 78 70 63 65 60 60 0 0 201 195North Dakota 41 35 47 44 56 56 0 0 144 135South Dakota 44 39 36 34 16 17 0 0 96 89South Atlantic 2,825 2,764 2,175 2,251 694 712 8 7 5,703 5,734Delaware 49 44 32 32 12 12 0 0 93 88District of Columbia 24 22 77 71 1 1 3 3 105 96Florida 964 1,013 686 726 99 107 1 1 1,749 1,847Georgia 393 421 330 365 139 147 1 1 862 934Maryland 250 239 222 232 25 27 3 2 500 500North Carolina 436 383 307 305 127 125 0 0 870 813South Carolina 244 242 162 170 131 136 0 0 536 547Virginia 370 319 306 295 88 85 1 1 765 700West Virginia 96 81 53 55 72 71 0 0 221 207East South Central 884 847 714 712 443 473 0 0 2,041 2,032Alabama 246 260 186 200 159 163 0 0 591 623Kentucky 190 170 137 137 120 124 0 0 447 431Mississippi 137 136 109 110 80 81 0 0 326 327Tennessee 311 282 282 264 84 104 0 0 677 650West South Central 1,463 1,444 1,191 1,176 751 784 1 1 3,407 3,406Arkansas 113 111 65 75 72 77 0 0 250 263Louisiana 177 182 166 166 155 150 0 0 499 498Oklahoma 154 152 118 120 73 76 0 0 345 348Texas 1,019 998 842 815 450 481 1 1 2,312 2,296Mountain 794 746 718 693 392 385 1 1 1,905 1,824Arizona 296 265 245 230 65 70 0 0 606 565Colorado 155 151 156 149 89 88 1 1 401 389Idaho 60 59 39 37 37 31 0 0 136 127Montana 46 41 41 40 17 16 0 0 104 97Nevada 98 90 68 63 48 49 0 0 214 202New Mexico 52 52 68 69 38 36 0 0 159 157Utah 61 65 73 75 40 40 0 1 175 180Wyoming 25 24 29 29 57 54 0 0 110 106Pacific Contiguous 1,340 1,223 1,667 1,483 537 512 6 6 3,551 3,224California 889 797 1,343 1,175 388 368 6 6 2,626 2,345Oregon 165 156 120 114 56 55 0 0 341 325Washington 286 271 204 193 94 90 0 0 584 554Pacific Noncontiguous 102 96 112 113 91 84 0 0 305 293Alaska 34 36 41 46 19 18 0 0 94 99Hawaii 68 60 71 67 72 67 0 0 211 194U.S. Total 12,263 11,542 10,745 10,584 4,955 5,021 58 56 28,021 27,203
See Technical notes for additional information on the Commercial, Industrial, and Transportation sectors.Displayed values of zero may represent small values that round to zero. The Excel version of this table provides additional precision which may be accessed by selecting individual cells.Notes: - See Glossary for definitions. - Values are preliminary estimates based on a cutoff model sample.See Technical Notes for a discussion of the sample design for the Form EIA-826.Utilities and energy service providers may classify commercial and industrial customers based on either NAICS codes or demands or usage falling within specified limits by rate schedule.Changes from year to year in consumer counts, sales and revenues, particularly involving the commercial and industrial consumer sectors, may result from respondent implementation of changes in the definitions of consumers, and reclassifications.Totals may not equal sum of components because of independent rounding.Source: U.S. Energy Information Administration, Form EIA-861M (formerly EIA-826), Monthly Electric Power Industry Report.
Table 5.5.A. Revenue from Sales of Electricity to Ultimate Customers by End-Use Sector,by State, April 2018 and 2017 (Million Dollars)
Residential Commercial Industrial Transportation All Sectors
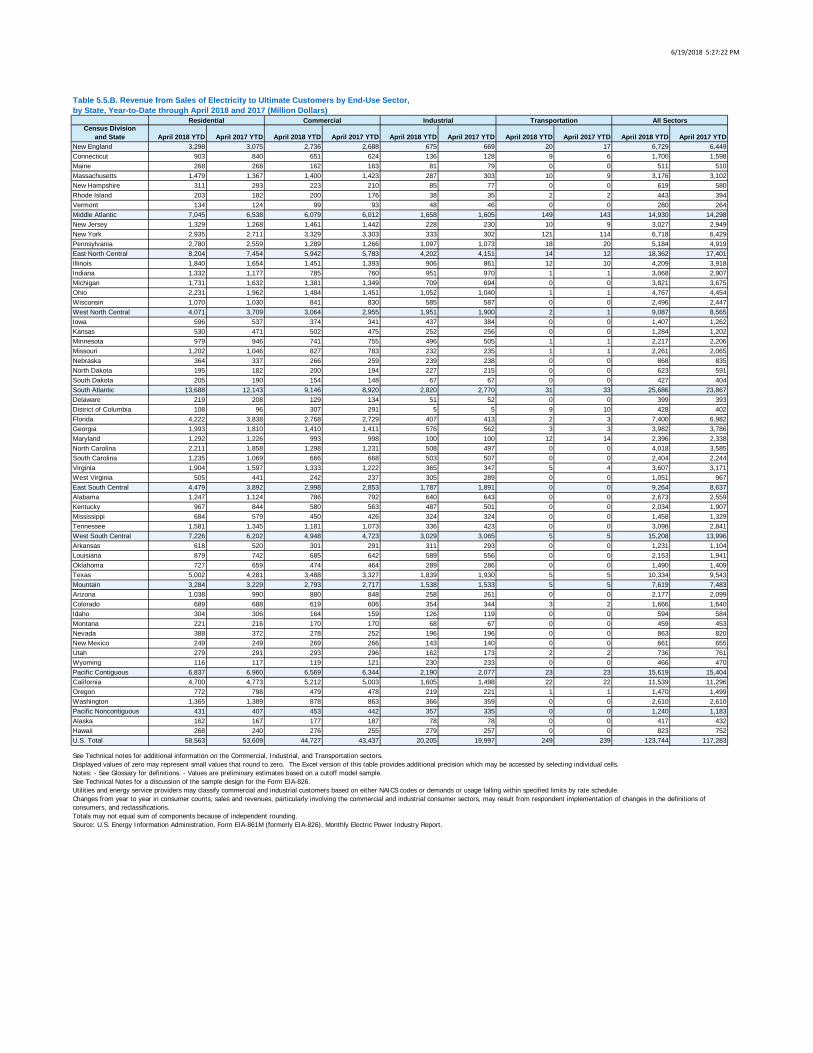
6/19/2018 5:27:22 PM
Census Divisionand State April 2018 YTD April 2017 YTD April 2018 YTD April 2017 YTD April 2018 YTD April 2017 YTD April 2018 YTD April 2017 YTD April 2018 YTD April 2017 YTD
New England 3,298 3,075 2,736 2,688 675 669 20 17 6,729 6,449Connecticut 903 840 651 624 136 128 9 6 1,700 1,598Maine 268 268 162 163 81 79 0 0 511 510Massachusetts 1,479 1,367 1,400 1,423 287 303 10 9 3,176 3,102New Hampshire 311 293 223 210 85 77 0 0 619 580Rhode Island 203 182 200 176 38 35 2 2 443 394Vermont 134 124 99 93 48 46 0 0 280 264Middle Atlantic 7,045 6,538 6,079 6,012 1,658 1,605 149 143 14,930 14,298New Jersey 1,329 1,268 1,461 1,442 228 230 10 9 3,027 2,949New York 2,935 2,711 3,329 3,303 333 302 121 114 6,718 6,429Pennsylvania 2,780 2,559 1,289 1,266 1,097 1,073 18 20 5,184 4,919East North Central 8,204 7,454 5,942 5,783 4,202 4,151 14 12 18,362 17,401Illinois 1,840 1,654 1,451 1,393 906 861 12 10 4,209 3,918Indiana 1,332 1,177 785 760 951 970 1 1 3,068 2,907Michigan 1,731 1,632 1,381 1,349 709 694 0 0 3,821 3,675Ohio 2,231 1,962 1,484 1,451 1,052 1,040 1 1 4,767 4,454Wisconsin 1,070 1,030 841 830 585 587 0 0 2,496 2,447West North Central 4,071 3,709 3,064 2,955 1,951 1,900 2 1 9,087 8,565Iowa 596 537 374 341 437 384 0 0 1,407 1,262Kansas 530 471 502 475 252 256 0 0 1,284 1,202Minnesota 979 946 741 755 496 505 1 1 2,217 2,206Missouri 1,202 1,046 827 783 232 235 1 1 2,261 2,065Nebraska 364 337 266 259 239 238 0 0 868 835North Dakota 195 182 200 194 227 215 0 0 623 591South Dakota 205 190 154 148 67 67 0 0 427 404South Atlantic 13,688 12,143 9,146 8,920 2,820 2,770 31 33 25,686 23,867Delaware 219 208 129 134 51 52 0 0 399 393District of Columbia 108 96 307 291 5 5 9 10 428 402Florida 4,222 3,838 2,768 2,729 407 413 2 3 7,400 6,982Georgia 1,993 1,810 1,410 1,411 576 562 3 3 3,982 3,786Maryland 1,292 1,226 993 998 100 100 12 14 2,396 2,338North Carolina 2,211 1,858 1,298 1,231 508 497 0 0 4,018 3,585South Carolina 1,235 1,069 666 668 503 507 0 0 2,404 2,244Virginia 1,904 1,597 1,333 1,222 365 347 5 4 3,607 3,171West Virginia 505 441 242 237 305 289 0 0 1,051 967East South Central 4,479 3,892 2,998 2,853 1,787 1,891 0 0 9,264 8,637Alabama 1,247 1,124 786 792 640 643 0 0 2,673 2,559Kentucky 967 844 580 563 487 501 0 0 2,034 1,907Mississippi 684 579 450 426 324 324 0 0 1,458 1,329Tennessee 1,581 1,345 1,181 1,073 336 423 0 0 3,098 2,841West South Central 7,226 6,202 4,948 4,723 3,029 3,065 5 5 15,208 13,996Arkansas 618 520 301 291 311 293 0 0 1,231 1,104Louisiana 879 742 685 642 589 556 0 0 2,153 1,941Oklahoma 727 659 474 464 289 286 0 0 1,490 1,409Texas 5,002 4,281 3,488 3,327 1,839 1,930 5 5 10,334 9,543Mountain 3,284 3,229 2,793 2,717 1,538 1,533 5 5 7,619 7,483Arizona 1,038 990 880 848 258 261 0 0 2,177 2,099Colorado 689 688 619 606 354 344 3 2 1,666 1,640Idaho 304 306 164 159 126 119 0 0 594 584Montana 221 216 170 170 68 67 0 0 459 453Nevada 388 372 278 252 196 196 0 0 863 820New Mexico 249 249 269 266 143 140 0 0 661 655Utah 279 291 293 296 162 173 2 2 736 761Wyoming 116 117 119 121 230 233 0 0 466 470Pacific Contiguous 6,837 6,960 6,569 6,344 2,190 2,077 23 23 15,619 15,404California 4,700 4,773 5,212 5,003 1,605 1,498 22 22 11,539 11,296Oregon 772 798 479 478 219 221 1 1 1,470 1,499Washington 1,365 1,389 878 863 366 359 0 0 2,610 2,610Pacific Noncontiguous 431 407 453 442 357 335 0 0 1,240 1,183Alaska 162 167 177 187 78 78 0 0 417 432Hawaii 268 240 276 255 279 257 0 0 823 752U.S. Total 58,563 53,609 44,727 43,437 20,205 19,997 249 239 123,744 117,283
See Technical notes for additional information on the Commercial, Industrial, and Transportation sectors.Displayed values of zero may represent small values that round to zero. The Excel version of this table provides additional precision which may be accessed by selecting individual cells.Notes: - See Glossary for definitions. - Values are preliminary estimates based on a cutoff model sample.See Technical Notes for a discussion of the sample design for the Form EIA-826.Utilities and energy service providers may classify commercial and industrial customers based on either NAICS codes or demands or usage falling within specified limits by rate schedule.Changes from year to year in consumer counts, sales and revenues, particularly involving the commercial and industrial consumer sectors, may result from respondent implementation of changes in the definitions of consumers, and reclassifications.Totals may not equal sum of components because of independent rounding.Source: U.S. Energy Information Administration, Form EIA-861M (formerly EIA-826), Monthly Electric Power Industry Report.
Table 5.5.B. Revenue from Sales of Electricity to Ultimate Customers by End-Use Sector,by State, Year-to-Date through April 2018 and 2017 (Million Dollars)
Residential Commercial Industrial Transportation All Sectors
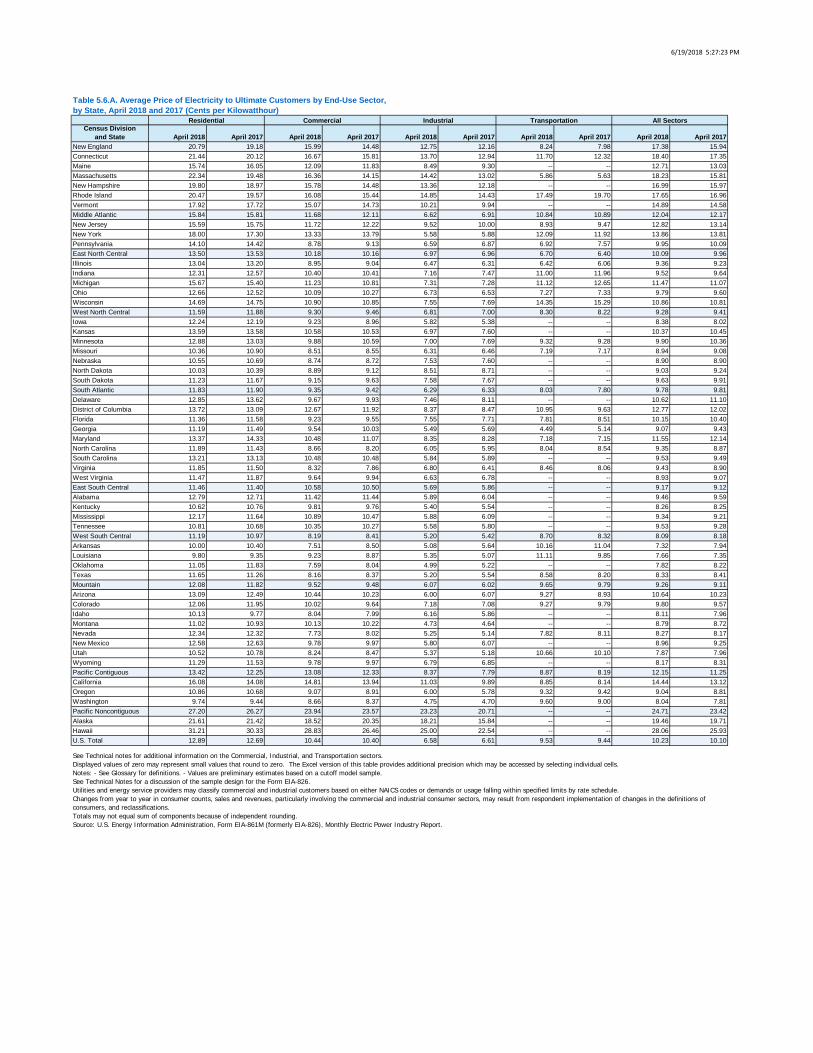
6/19/2018 5:27:23 PM
Census Divisionand State April 2018 April 2017 April 2018 April 2017 April 2018 April 2017 April 2018 April 2017 April 2018 April 2017
New England 20.79 19.18 15.99 14.48 12.75 12.16 8.24 7.98 17.38 15.94Connecticut 21.44 20.12 16.67 15.81 13.70 12.94 11.70 12.32 18.40 17.35Maine 15.74 16.05 12.09 11.83 8.49 9.30 -- -- 12.71 13.03Massachusetts 22.34 19.48 16.36 14.15 14.42 13.02 5.86 5.63 18.23 15.81New Hampshire 19.80 18.97 15.78 14.48 13.36 12.18 -- -- 16.99 15.97Rhode Island 20.47 19.57 16.08 15.44 14.85 14.43 17.49 19.70 17.65 16.96Vermont 17.92 17.72 15.07 14.73 10.21 9.94 -- -- 14.89 14.58Middle Atlantic 15.84 15.81 11.68 12.11 6.62 6.91 10.84 10.89 12.04 12.17New Jersey 15.59 15.75 11.72 12.22 9.52 10.00 8.93 9.47 12.82 13.14New York 18.00 17.30 13.33 13.79 5.58 5.88 12.09 11.92 13.86 13.81Pennsylvania 14.10 14.42 8.78 9.13 6.59 6.87 6.92 7.57 9.95 10.09East North Central 13.50 13.53 10.18 10.16 6.97 6.96 6.70 6.40 10.09 9.96Illinois 13.04 13.20 8.95 9.04 6.47 6.31 6.42 6.06 9.36 9.23Indiana 12.31 12.57 10.40 10.41 7.16 7.47 11.00 11.96 9.52 9.64Michigan 15.67 15.40 11.23 10.81 7.31 7.28 11.12 12.65 11.47 11.07Ohio 12.66 12.52 10.09 10.27 6.73 6.53 7.27 7.33 9.79 9.60Wisconsin 14.69 14.75 10.90 10.85 7.55 7.69 14.35 15.29 10.86 10.81West North Central 11.59 11.88 9.30 9.46 6.81 7.00 8.30 8.22 9.28 9.41Iowa 12.24 12.19 9.23 8.96 5.82 5.38 -- -- 8.38 8.02Kansas 13.59 13.58 10.58 10.53 6.97 7.60 -- -- 10.37 10.45Minnesota 12.88 13.03 9.88 10.59 7.00 7.69 9.32 9.28 9.90 10.36Missouri 10.36 10.90 8.51 8.55 6.31 6.46 7.19 7.17 8.94 9.08Nebraska 10.55 10.69 8.74 8.72 7.53 7.60 -- -- 8.90 8.90North Dakota 10.03 10.39 8.89 9.12 8.51 8.71 -- -- 9.03 9.24South Dakota 11.23 11.67 9.15 9.63 7.58 7.67 -- -- 9.63 9.91South Atlantic 11.83 11.90 9.35 9.42 6.29 6.33 8.03 7.80 9.78 9.81Delaware 12.85 13.62 9.67 9.93 7.46 8.11 -- -- 10.62 11.10District of Columbia 13.72 13.09 12.67 11.92 8.37 8.47 10.95 9.63 12.77 12.02Florida 11.36 11.58 9.23 9.55 7.55 7.71 7.81 8.51 10.15 10.40Georgia 11.19 11.49 9.54 10.03 5.49 5.69 4.49 5.14 9.07 9.43Maryland 13.37 14.33 10.48 11.07 8.35 8.28 7.18 7.15 11.55 12.14North Carolina 11.89 11.43 8.66 8.20 6.05 5.95 8.04 8.54 9.35 8.87South Carolina 13.21 13.13 10.48 10.48 5.84 5.89 -- -- 9.53 9.49Virginia 11.85 11.50 8.32 7.86 6.80 6.41 8.46 8.06 9.43 8.90West Virginia 11.47 11.87 9.64 9.94 6.63 6.78 -- -- 8.93 9.07East South Central 11.46 11.40 10.58 10.50 5.69 5.86 -- -- 9.17 9.12Alabama 12.79 12.71 11.42 11.44 5.89 6.04 -- -- 9.46 9.59Kentucky 10.62 10.76 9.81 9.76 5.40 5.54 -- -- 8.26 8.25Mississippi 12.17 11.64 10.89 10.47 5.88 6.09 -- -- 9.34 9.21Tennessee 10.81 10.68 10.35 10.27 5.58 5.80 -- -- 9.53 9.28West South Central 11.19 10.97 8.19 8.41 5.20 5.42 8.70 8.32 8.09 8.18Arkansas 10.00 10.40 7.51 8.50 5.08 5.64 10.16 11.04 7.32 7.94Louisiana 9.80 9.35 9.23 8.87 5.35 5.07 11.11 9.85 7.66 7.35Oklahoma 11.05 11.83 7.59 8.04 4.99 5.22 -- -- 7.82 8.22Texas 11.65 11.26 8.16 8.37 5.20 5.54 8.58 8.20 8.33 8.41Mountain 12.08 11.82 9.52 9.48 6.07 6.02 9.65 9.79 9.26 9.11Arizona 13.09 12.49 10.44 10.23 6.00 6.07 9.27 8.93 10.64 10.23Colorado 12.06 11.95 10.02 9.64 7.18 7.08 9.27 9.79 9.80 9.57Idaho 10.13 9.77 8.04 7.99 6.16 5.86 -- -- 8.11 7.96Montana 11.02 10.93 10.13 10.22 4.73 4.64 -- -- 8.79 8.72Nevada 12.34 12.32 7.73 8.02 5.25 5.14 7.82 8.11 8.27 8.17New Mexico 12.58 12.63 9.78 9.97 5.80 6.07 -- -- 8.96 9.25Utah 10.52 10.78 8.24 8.47 5.37 5.18 10.66 10.10 7.87 7.96Wyoming 11.29 11.53 9.78 9.97 6.79 6.85 -- -- 8.17 8.31Pacific Contiguous 13.42 12.25 13.08 12.33 8.37 7.79 8.87 8.19 12.15 11.25California 16.08 14.08 14.81 13.94 11.03 9.89 8.85 8.14 14.44 13.12Oregon 10.86 10.68 9.07 8.91 6.00 5.78 9.32 9.42 9.04 8.81Washington 9.74 9.44 8.66 8.37 4.75 4.70 9.60 9.00 8.04 7.81Pacific Noncontiguous 27.20 26.27 23.94 23.57 23.23 20.71 -- -- 24.71 23.42Alaska 21.61 21.42 18.52 20.35 18.21 15.84 -- -- 19.46 19.71Hawaii 31.21 30.33 28.83 26.46 25.00 22.54 -- -- 28.06 25.93U.S. Total 12.89 12.69 10.44 10.40 6.58 6.61 9.53 9.44 10.23 10.10
See Technical notes for additional information on the Commercial, Industrial, and Transportation sectors.Displayed values of zero may represent small values that round to zero. The Excel version of this table provides additional precision which may be accessed by selecting individual cells.Notes: - See Glossary for definitions. - Values are preliminary estimates based on a cutoff model sample.See Technical Notes for a discussion of the sample design for the Form EIA-826.Utilities and energy service providers may classify commercial and industrial customers based on either NAICS codes or demands or usage falling within specified limits by rate schedule.Changes from year to year in consumer counts, sales and revenues, particularly involving the commercial and industrial consumer sectors, may result from respondent implementation of changes in the definitions of consumers, and reclassifications.Totals may not equal sum of components because of independent rounding.Source: U.S. Energy Information Administration, Form EIA-861M (formerly EIA-826), Monthly Electric Power Industry Report.
Table 5.6.A. Average Price of Electricity to Ultimate Customers by End-Use Sector,by State, April 2018 and 2017 (Cents per Kilowatthour)
Residential Commercial Industrial Transportation All Sectors

6/19/2018 5:27:25 PM
Census Divisionand State April 2018 YTD April 2017 YTD April 2018 YTD April 2017 YTD April 2018 YTD April 2017 YTD April 2018 YTD April 2017 YTD April 2018 YTD April 2017 YTD
New England 20.50 18.71 16.42 14.60 13.31 12.33 10.30 8.80 17.70 15.94Connecticut 20.91 19.81 16.84 15.85 14.27 13.14 14.79 10.93 18.47 17.36Maine 15.90 15.98 12.44 12.33 9.31 9.47 -- -- 13.25 13.30Massachusetts 21.78 18.77 16.98 14.32 14.82 13.21 7.70 7.01 18.57 15.79New Hampshire 19.66 18.78 15.90 14.59 13.76 12.45 -- -- 17.19 16.03Rhode Island 21.21 19.01 16.93 15.48 15.69 14.40 16.70 19.24 18.51 16.83Vermont 17.70 17.39 15.10 14.48 10.56 10.12 -- -- 15.05 14.53Middle Atlantic 15.66 15.61 11.98 12.08 7.05 6.93 10.64 10.74 12.38 12.31New Jersey 15.59 15.71 11.98 12.06 10.21 9.99 8.58 8.94 13.13 13.14New York 17.86 17.28 13.69 13.83 6.03 5.65 11.64 11.97 14.20 14.02Pennsylvania 13.89 14.11 9.06 9.10 6.97 6.92 7.28 7.22 10.32 10.28East North Central 13.06 13.03 10.12 10.05 7.05 7.01 6.81 6.59 10.12 9.99Illinois 12.59 12.49 8.95 8.86 6.70 6.43 6.58 6.24 9.45 9.22Indiana 11.68 11.82 10.32 10.28 7.16 7.40 10.57 11.52 9.50 9.55Michigan 15.51 15.35 11.23 10.99 7.36 7.35 10.92 12.26 11.55 11.36Ohio 12.27 12.09 9.98 10.00 6.80 6.68 7.01 7.57 9.82 9.62Wisconsin 14.32 14.36 10.83 10.89 7.59 7.64 13.77 14.26 10.88 10.89West North Central 11.04 11.12 9.20 9.20 6.99 6.92 8.13 8.08 9.26 9.21Iowa 11.64 11.36 9.18 8.69 5.92 5.41 -- -- 8.49 8.01Kansas 12.87 12.82 10.34 10.19 7.27 7.44 -- -- 10.32 10.21Minnesota 12.62 12.60 9.87 10.22 7.39 7.58 9.20 9.34 10.08 10.23Missouri 9.85 10.05 8.44 8.35 6.43 6.36 6.93 6.79 8.83 8.79Nebraska 9.85 10.01 8.59 8.62 7.48 7.45 -- -- 8.70 8.72North Dakota 9.40 9.49 8.71 8.91 8.48 8.59 -- -- 8.82 8.96South Dakota 10.86 10.86 9.22 9.27 7.71 7.66 -- -- 9.62 9.60South Atlantic 11.65 11.74 9.51 9.43 6.41 6.32 7.51 7.89 9.95 9.85Delaware 12.38 13.39 9.44 10.28 7.91 8.04 -- -- 10.55 11.25District of Columbia 12.82 12.80 11.82 11.70 8.23 8.26 8.84 9.54 11.92 11.83Florida 11.84 11.65 9.67 9.59 7.88 7.81 8.17 8.51 10.65 10.46Georgia 10.96 11.36 9.79 10.00 5.70 5.57 5.37 4.95 9.31 9.42Maryland 13.15 14.27 10.63 11.09 8.67 8.42 7.00 7.79 11.70 12.33North Carolina 11.04 10.95 8.72 8.45 6.12 5.96 8.40 8.93 9.30 8.99South Carolina 12.39 12.63 10.19 10.38 5.84 5.86 -- -- 9.57 9.53Virginia 11.40 11.09 8.35 7.75 6.83 6.50 8.43 7.80 9.48 8.91West Virginia 11.29 11.53 9.58 9.78 6.60 6.77 -- -- 9.05 9.19East South Central 10.97 11.15 10.53 10.56 5.72 5.89 -- -- 9.22 9.18Alabama 12.20 12.59 11.37 11.64 5.84 6.00 -- -- 9.51 9.67Kentucky 10.25 10.49 9.58 9.65 5.42 5.60 -- -- 8.31 8.36Mississippi 11.27 11.17 10.80 10.36 5.97 6.08 -- -- 9.31 9.09Tennessee 10.48 10.55 10.41 10.43 5.74 5.95 -- -- 9.60 9.42West South Central 10.66 10.64 8.33 8.38 5.37 5.32 8.56 8.46 8.28 8.12Arkansas 9.83 9.72 8.32 8.18 5.61 5.56 11.46 11.60 7.96 7.79Louisiana 9.19 8.90 9.11 8.69 5.30 5.03 10.19 10.02 7.64 7.24Oklahoma 9.91 10.42 7.68 7.81 5.05 5.16 -- -- 7.75 7.91Texas 11.22 11.18 8.29 8.43 5.41 5.40 8.44 8.34 8.56 8.40Mountain 11.69 11.40 9.32 9.22 6.09 6.06 9.48 9.81 9.14 9.00Arizona 12.49 11.78 10.19 9.86 5.99 5.91 9.07 8.70 10.23 9.80Colorado 11.75 11.80 9.61 9.45 7.10 7.10 8.98 9.97 9.61 9.59Idaho 10.14 9.60 7.94 7.68 5.95 5.84 -- -- 8.28 8.00Montana 10.80 10.70 10.00 10.02 4.88 4.84 -- -- 8.93 8.87Nevada 12.45 11.96 8.00 7.90 5.34 5.03 7.93 7.84 8.40 8.04New Mexico 12.30 12.52 9.69 9.86 5.83 6.04 -- -- 9.11 9.35Utah 10.42 10.73 8.13 8.34 5.57 5.70 10.68 10.01 7.99 8.18Wyoming 10.99 10.89 9.54 9.56 6.80 6.97 -- -- 8.18 8.29Pacific Contiguous 14.55 14.06 12.92 12.48 8.57 8.12 8.67 8.16 12.63 12.21California 18.39 17.70 14.70 14.22 11.44 10.64 8.64 8.12 15.33 14.77Oregon 10.70 10.51 8.92 8.85 5.99 6.04 9.24 9.25 9.06 8.99Washington 9.60 9.29 8.75 8.43 4.64 4.57 9.74 9.48 8.12 7.90Pacific Noncontiguous 26.77 25.19 23.92 22.87 22.96 20.88 -- -- 24.53 22.98Alaska 21.46 21.01 18.74 19.29 17.34 16.88 -- -- 19.41 19.41Hawaii 31.48 29.24 29.08 26.45 25.24 22.49 -- -- 28.33 25.69U.S. Total 12.63 12.61 10.49 10.39 6.73 6.64 9.51 9.44 10.38 10.23
See Technical notes for additional information on the Commercial, Industrial, and Transportation sectors.Displayed values of zero may represent small values that round to zero. The Excel version of this table provides additional precision which may be accessed by selecting individual cells.Notes: - See Glossary for definitions. - Values are preliminary estimates based on a cutoff model sample.See Technical Notes for a discussion of the sample design for the Form EIA-826.Utilities and energy service providers may classify commercial and industrial customers based on either NAICS codes or demands or usage falling within specified limits by rate schedule.Changes from year to year in consumer counts, sales and revenues, particularly involving the commercial and industrial consumer sectors, may result from respondent implementation of changes in the definitions of consumers, and reclassifications.Totals may not equal sum of components because of independent rounding.Source: U.S. Energy Information Administration, Form EIA-861M (formerly EIA-826), Monthly Electric Power Industry Report.
Table 5.6.B. Average Price of Electricity to Ultimate Customers by End-Use Sector,by State, Year-to-Date through April 2018 and 2017 (Cents per Kilowatthour)
Residential Commercial Industrial Transportation All Sectors
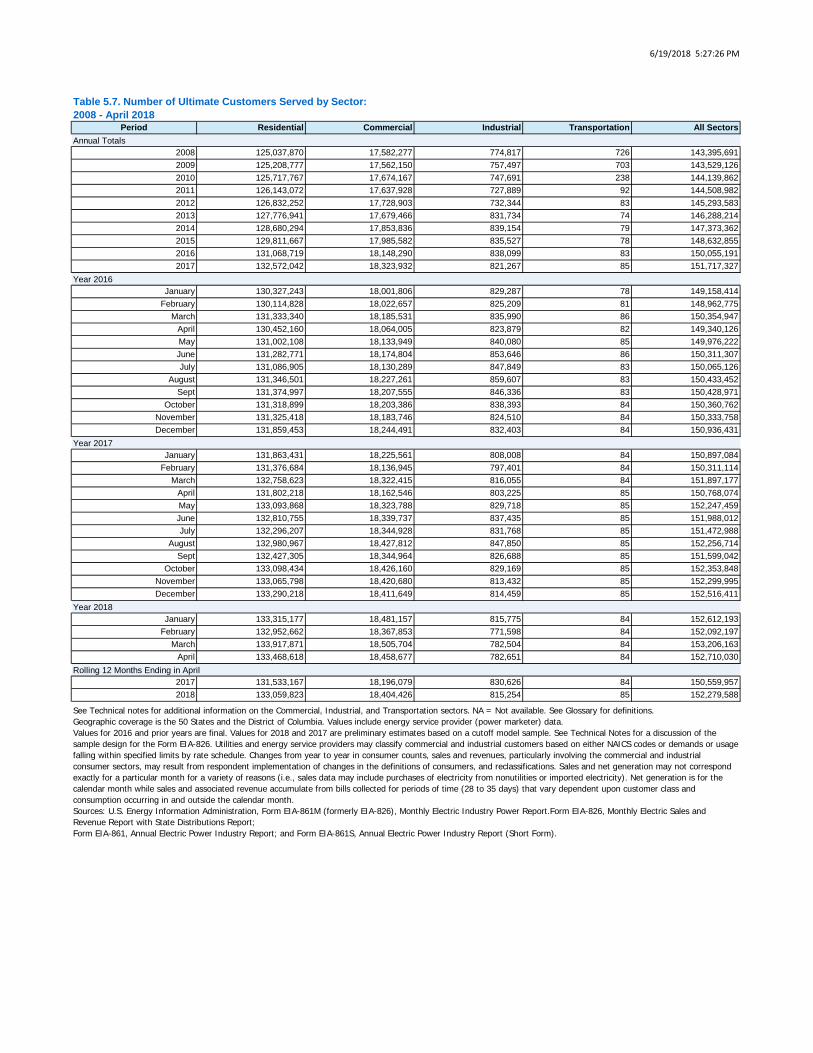
6/19/2018 5:27:26 PM
Period Residential Commercial Industrial Transportation All Sectors
2008 125,037,870 17,582,277 774,817 726 143,395,6912009 125,208,777 17,562,150 757,497 703 143,529,1262010 125,717,767 17,674,167 747,691 238 144,139,8622011 126,143,072 17,637,928 727,889 92 144,508,9822012 126,832,252 17,728,903 732,344 83 145,293,5832013 127,776,941 17,679,466 831,734 74 146,288,2142014 128,680,294 17,853,836 839,154 79 147,373,3622015 129,811,667 17,985,582 835,527 78 148,632,8552016 131,068,719 18,148,290 838,099 83 150,055,1912017 132,572,042 18,323,932 821,267 85 151,717,327
January 130,327,243 18,001,806 829,287 78 149,158,414February 130,114,828 18,022,657 825,209 81 148,962,775
March 131,333,340 18,185,531 835,990 86 150,354,947April 130,452,160 18,064,005 823,879 82 149,340,126May 131,002,108 18,133,949 840,080 85 149,976,222June 131,282,771 18,174,804 853,646 86 150,311,307July 131,086,905 18,130,289 847,849 83 150,065,126
August 131,346,501 18,227,261 859,607 83 150,433,452Sept 131,374,997 18,207,555 846,336 83 150,428,971
October 131,318,899 18,203,386 838,393 84 150,360,762November 131,325,418 18,183,746 824,510 84 150,333,758December 131,859,453 18,244,491 832,403 84 150,936,431
January 131,863,431 18,225,561 808,008 84 150,897,084February 131,376,684 18,136,945 797,401 84 150,311,114
March 132,758,623 18,322,415 816,055 84 151,897,177April 131,802,218 18,162,546 803,225 85 150,768,074May 133,093,868 18,323,788 829,718 85 152,247,459June 132,810,755 18,339,737 837,435 85 151,988,012July 132,296,207 18,344,928 831,768 85 151,472,988
August 132,980,967 18,427,812 847,850 85 152,256,714Sept 132,427,305 18,344,964 826,688 85 151,599,042
October 133,098,434 18,426,160 829,169 85 152,353,848November 133,065,798 18,420,680 813,432 85 152,299,995December 133,290,218 18,411,649 814,459 85 152,516,411
January 133,315,177 18,481,157 815,775 84 152,612,193February 132,952,662 18,367,853 771,598 84 152,092,197
March 133,917,871 18,505,704 782,504 84 153,206,163April 133,468,618 18,458,677 782,651 84 152,710,030
2017 131,533,167 18,196,079 830,626 84 150,559,9572018 133,059,823 18,404,426 815,254 85 152,279,588
Rolling 12 Months Ending in April
See Technical notes for additional information on the Commercial, Industrial, and Transportation sectors. NA = Not available. See Glossary for definitions.Geographic coverage is the 50 States and the District of Columbia. Values include energy service provider (power marketer) data.Values for 2016 and prior years are final. Values for 2018 and 2017 are preliminary estimates based on a cutoff model sample. See Technical Notes for a discussion of the sample design for the Form EIA-826. Utilities and energy service providers may classify commercial and industrial customers based on either NAICS codes or demands or usage falling within specified limits by rate schedule. Changes from year to year in consumer counts, sales and revenues, particularly involving the commercial and industrial consumer sectors, may result from respondent implementation of changes in the definitions of consumers, and reclassifications. Sales and net generation may not correspond exactly for a particular month for a variety of reasons (i.e., sales data may include purchases of electricity from nonutilities or imported electricity). Net generation is for the calendar month while sales and associated revenue accumulate from bills collected for periods of time (28 to 35 days) that vary dependent upon customer class and consumption occurring in and outside the calendar month.Sources: U.S. Energy Information Administration, Form EIA-861M (formerly EIA-826), Monthly Electric Industry Power Report.Form EIA-826, Monthly Electric Sales and Revenue Report with State Distributions Report; Form EIA-861, Annual Electric Power Industry Report; and Form EIA-861S, Annual Electric Power Industry Report (Short Form).
Table 5.7. Number of Ultimate Customers Served by Sector:2008 - April 2018
Annual Totals
Year 2016
Year 2017
Year 2018
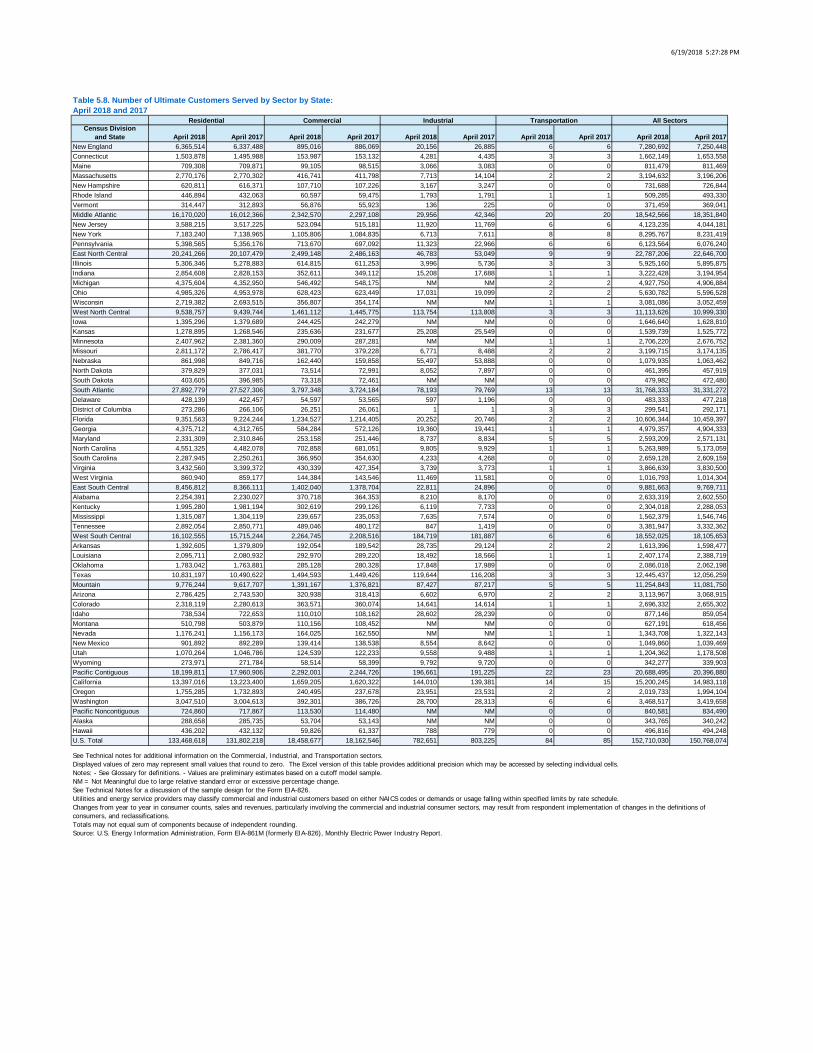
6/19/2018 5:27:28 PM
Census Divisionand State April 2018 April 2017 April 2018 April 2017 April 2018 April 2017 April 2018 April 2017 April 2018 April 2017
New England 6,365,514 6,337,488 895,016 886,069 20,156 26,885 6 6 7,280,692 7,250,448Connecticut 1,503,878 1,495,988 153,987 153,132 4,281 4,435 3 3 1,662,149 1,653,558Maine 709,308 709,871 99,105 98,515 3,066 3,083 0 0 811,479 811,469Massachusetts 2,770,176 2,770,302 416,741 411,798 7,713 14,104 2 2 3,194,632 3,196,206New Hampshire 620,811 616,371 107,710 107,226 3,167 3,247 0 0 731,688 726,844Rhode Island 446,894 432,063 60,597 59,475 1,793 1,791 1 1 509,285 493,330Vermont 314,447 312,893 56,876 55,923 136 225 0 0 371,459 369,041Middle Atlantic 16,170,020 16,012,366 2,342,570 2,297,108 29,956 42,346 20 20 18,542,566 18,351,840New Jersey 3,588,215 3,517,225 523,094 515,181 11,920 11,769 6 6 4,123,235 4,044,181New York 7,183,240 7,138,965 1,105,806 1,084,835 6,713 7,611 8 8 8,295,767 8,231,419Pennsylvania 5,398,565 5,356,176 713,670 697,092 11,323 22,966 6 6 6,123,564 6,076,240East North Central 20,241,266 20,107,479 2,499,148 2,486,163 46,783 53,049 9 9 22,787,206 22,646,700Illinois 5,306,346 5,278,883 614,815 611,253 3,996 5,736 3 3 5,925,160 5,895,875Indiana 2,854,608 2,828,153 352,611 349,112 15,208 17,688 1 1 3,222,428 3,194,954Michigan 4,375,604 4,352,950 546,492 548,175 NM NM 2 2 4,927,750 4,906,884Ohio 4,985,326 4,953,978 628,423 623,449 17,031 19,099 2 2 5,630,782 5,596,528Wisconsin 2,719,382 2,693,515 356,807 354,174 NM NM 1 1 3,081,086 3,052,459West North Central 9,538,757 9,439,744 1,461,112 1,445,775 113,754 113,808 3 3 11,113,626 10,999,330Iowa 1,395,296 1,379,689 244,425 242,279 NM NM 0 0 1,646,640 1,628,810Kansas 1,278,895 1,268,546 235,636 231,677 25,208 25,549 0 0 1,539,739 1,525,772Minnesota 2,407,962 2,381,360 290,009 287,281 NM NM 1 1 2,706,220 2,676,752Missouri 2,811,172 2,786,417 381,770 379,228 6,771 8,488 2 2 3,199,715 3,174,135Nebraska 861,998 849,716 162,440 159,858 55,497 53,888 0 0 1,079,935 1,063,462North Dakota 379,829 377,031 73,514 72,991 8,052 7,897 0 0 461,395 457,919South Dakota 403,605 396,985 73,318 72,461 NM NM 0 0 479,982 472,480South Atlantic 27,892,779 27,527,306 3,797,348 3,724,184 78,193 79,769 13 13 31,768,333 31,331,272Delaware 428,139 422,457 54,597 53,565 597 1,196 0 0 483,333 477,218District of Columbia 273,286 266,106 26,251 26,061 1 1 3 3 299,541 292,171Florida 9,351,563 9,224,244 1,234,527 1,214,405 20,252 20,746 2 2 10,606,344 10,459,397Georgia 4,375,712 4,312,765 584,284 572,126 19,360 19,441 1 1 4,979,357 4,904,333Maryland 2,331,309 2,310,846 253,158 251,446 8,737 8,834 5 5 2,593,209 2,571,131North Carolina 4,551,325 4,482,078 702,858 681,051 9,805 9,929 1 1 5,263,989 5,173,059South Carolina 2,287,945 2,250,261 366,950 354,630 4,233 4,268 0 0 2,659,128 2,609,159Virginia 3,432,560 3,399,372 430,339 427,354 3,739 3,773 1 1 3,866,639 3,830,500West Virginia 860,940 859,177 144,384 143,546 11,469 11,581 0 0 1,016,793 1,014,304East South Central 8,456,812 8,366,111 1,402,040 1,378,704 22,811 24,896 0 0 9,881,663 9,769,711Alabama 2,254,391 2,230,027 370,718 364,353 8,210 8,170 0 0 2,633,319 2,602,550Kentucky 1,995,280 1,981,194 302,619 299,126 6,119 7,733 0 0 2,304,018 2,288,053Mississippi 1,315,087 1,304,119 239,657 235,053 7,635 7,574 0 0 1,562,379 1,546,746Tennessee 2,892,054 2,850,771 489,046 480,172 847 1,419 0 0 3,381,947 3,332,362West South Central 16,102,555 15,715,244 2,264,745 2,208,516 184,719 181,887 6 6 18,552,025 18,105,653Arkansas 1,392,605 1,379,809 192,054 189,542 28,735 29,124 2 2 1,613,396 1,598,477Louisiana 2,095,711 2,080,932 292,970 289,220 18,492 18,566 1 1 2,407,174 2,388,719Oklahoma 1,783,042 1,763,881 285,128 280,328 17,848 17,989 0 0 2,086,018 2,062,198Texas 10,831,197 10,490,622 1,494,593 1,449,426 119,644 116,208 3 3 12,445,437 12,056,259Mountain 9,776,244 9,617,707 1,391,167 1,376,821 87,427 87,217 5 5 11,254,843 11,081,750Arizona 2,786,425 2,743,530 320,938 318,413 6,602 6,970 2 2 3,113,967 3,068,915Colorado 2,318,119 2,280,613 363,571 360,074 14,641 14,614 1 1 2,696,332 2,655,302Idaho 738,534 722,653 110,010 108,162 28,602 28,239 0 0 877,146 859,054Montana 510,798 503,879 110,156 108,452 NM NM 0 0 627,191 618,456Nevada 1,176,241 1,156,173 164,025 162,550 NM NM 1 1 1,343,708 1,322,143New Mexico 901,892 892,289 139,414 138,538 8,554 8,642 0 0 1,049,860 1,039,469Utah 1,070,264 1,046,786 124,539 122,233 9,558 9,488 1 1 1,204,362 1,178,508Wyoming 273,971 271,784 58,514 58,399 9,792 9,720 0 0 342,277 339,903Pacific Contiguous 18,199,811 17,960,906 2,292,001 2,244,726 196,661 191,225 22 23 20,688,495 20,396,880California 13,397,016 13,223,400 1,659,205 1,620,322 144,010 139,381 14 15 15,200,245 14,983,118Oregon 1,755,285 1,732,893 240,495 237,678 23,951 23,531 2 2 2,019,733 1,994,104Washington 3,047,510 3,004,613 392,301 386,726 28,700 28,313 6 6 3,468,517 3,419,658Pacific Noncontiguous 724,860 717,867 113,530 114,480 NM NM 0 0 840,581 834,490Alaska 288,658 285,735 53,704 53,143 NM NM 0 0 343,765 340,242Hawaii 436,202 432,132 59,826 61,337 788 779 0 0 496,816 494,248U.S. Total 133,468,618 131,802,218 18,458,677 18,162,546 782,651 803,225 84 85 152,710,030 150,768,074
See Technical notes for additional information on the Commercial, Industrial, and Transportation sectors.Displayed values of zero may represent small values that round to zero. The Excel version of this table provides additional precision which may be accessed by selecting individual cells.Notes: - See Glossary for definitions. - Values are preliminary estimates based on a cutoff model sample.NM = Not Meaningful due to large relative standard error or excessive percentage change.See Technical Notes for a discussion of the sample design for the Form EIA-826.Utilities and energy service providers may classify commercial and industrial customers based on either NAICS codes or demands or usage falling within specified limits by rate schedule.Changes from year to year in consumer counts, sales and revenues, particularly involving the commercial and industrial consumer sectors, may result from respondent implementation of changes in the definitions of consumers, and reclassifications.Totals may not equal sum of components because of independent rounding.Source: U.S. Energy Information Administration, Form EIA-861M (formerly EIA-826), Monthly Electric Power Industry Report.
Table 5.8. Number of Ultimate Customers Served by Sector by State:April 2018 and 2017
Residential Commercial Industrial Transportation All Sectors
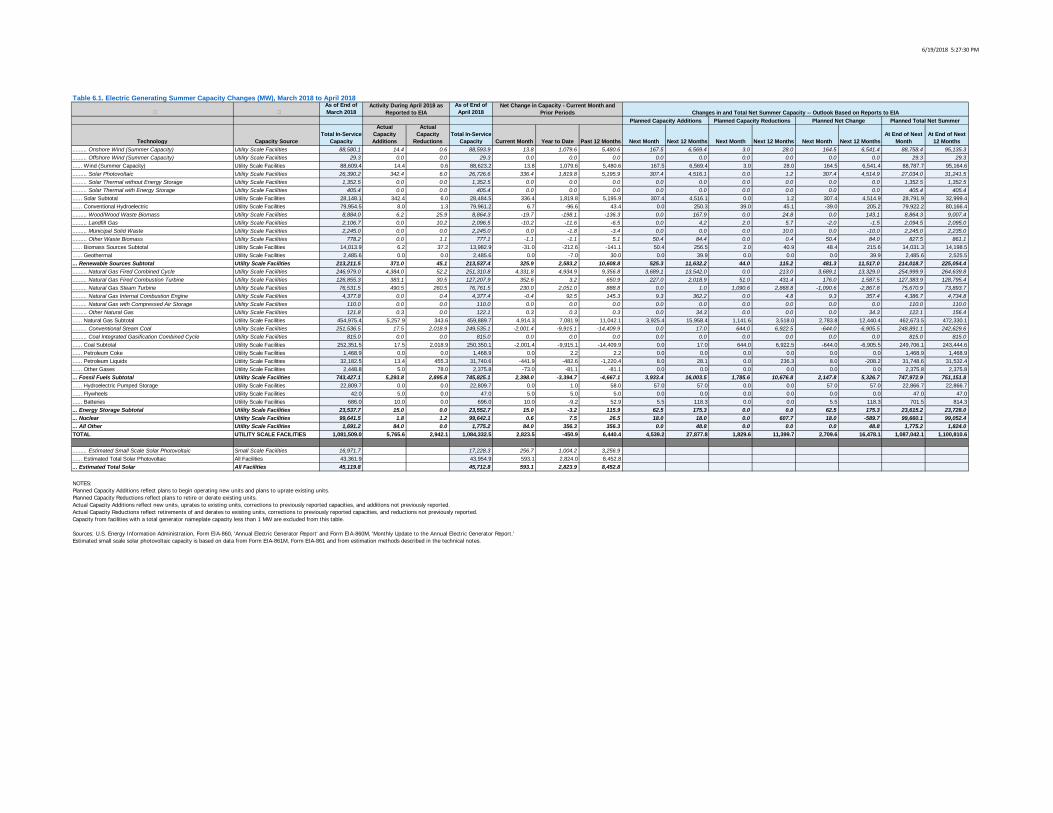
6/19/2018 5:27:30 PM
As of End of March 2018
As of End of April 2018
Technology Capacity SourceTotal In-Service
Capacity
Actual Capacity Additions
Actual Capacity
ReductionsTotal In-Service
Capacity Current Month Year to Date Past 12 Months Next Month Next 12 Months Next Month Next 12 Months Next Month Next 12 MonthsAt End of Next
MonthAt End of Next
12 Months......... Onshore Wind (Summer Capacity) Utility Scale Facilities 88,580.1 14.4 0.6 88,593.9 13.8 1,079.6 5,480.6 167.5 6,569.4 3.0 28.0 164.5 6,541.4 88,758.4 95,135.3......... Offshore Wind (Summer Capacity) Utility Scale Facilities 29.3 0.0 0.0 29.3 0.0 0.0 0.0 0.0 0.0 0.0 0.0 0.0 0.0 29.3 29.3...... Wind (Summer Capacity) Utility Scale Facilities 88,609.4 14.4 0.6 88,623.2 13.8 1,079.6 5,480.6 167.5 6,569.4 3.0 28.0 164.5 6,541.4 88,787.7 95,164.6......... Solar Photovoltaic Utility Scale Facilities 26,390.2 342.4 6.0 26,726.6 336.4 1,819.8 5,195.9 307.4 4,516.1 0.0 1.2 307.4 4,514.9 27,034.0 31,241.5......... Solar Thermal without Energy Storage Utility Scale Facilities 1,352.5 0.0 0.0 1,352.5 0.0 0.0 0.0 0.0 0.0 0.0 0.0 0.0 0.0 1,352.5 1,352.5......... Solar Thermal with Energy Storage Utility Scale Facilities 405.4 0.0 0.0 405.4 0.0 0.0 0.0 0.0 0.0 0.0 0.0 0.0 0.0 405.4 405.4...... Solar Subtotal Utility Scale Facilities 28,148.1 342.4 6.0 28,484.5 336.4 1,819.8 5,195.9 307.4 4,516.1 0.0 1.2 307.4 4,514.9 28,791.9 32,999.4...... Conventional Hydroelectric Utility Scale Facilities 79,954.5 8.0 1.3 79,961.2 6.7 -96.6 43.4 0.0 250.3 39.0 45.1 -39.0 205.2 79,922.2 80,166.4......... Wood/Wood Waste Biomass Utility Scale Facilities 8,884.0 6.2 25.9 8,864.3 -19.7 -198.1 -136.3 0.0 167.9 0.0 24.8 0.0 143.1 8,864.3 9,007.4......... Landfill Gas Utility Scale Facilities 2,106.7 0.0 10.2 2,096.5 -10.2 -11.6 -6.5 0.0 4.2 2.0 5.7 -2.0 -1.5 2,094.5 2,095.0......... Municipal Solid Waste Utility Scale Facilities 2,245.0 0.0 0.0 2,245.0 0.0 -1.8 -3.4 0.0 0.0 0.0 10.0 0.0 -10.0 2,245.0 2,235.0......... Other Waste Biomass Utility Scale Facilities 778.2 0.0 1.1 777.1 -1.1 -1.1 5.1 50.4 84.4 0.0 0.4 50.4 84.0 827.5 861.1...... Biomass Sources Subtotal Utility Scale Facilities 14,013.9 6.2 37.2 13,982.9 -31.0 -212.6 -141.1 50.4 256.5 2.0 40.9 48.4 215.6 14,031.3 14,198.5...... Geothermal Utility Scale Facilities 2,485.6 0.0 0.0 2,485.6 0.0 -7.0 30.0 0.0 39.9 0.0 0.0 0.0 39.9 2,485.6 2,525.5... Renewable Sources Subtotal Utility Scale Facilities 213,211.5 371.0 45.1 213,537.4 325.9 2,583.2 10,608.8 525.3 11,632.2 44.0 115.2 481.3 11,517.0 214,018.7 225,054.4......... Natural Gas Fired Combined Cycle Utility Scale Facilities 246,979.0 4,384.0 52.2 251,310.8 4,331.8 4,934.9 9,356.8 3,689.1 13,542.0 0.0 213.0 3,689.1 13,329.0 254,999.9 264,639.8......... Natural Gas Fired Combustion Turbine Utility Scale Facilities 126,855.3 383.1 30.5 127,207.9 352.6 3.2 650.9 227.0 2,018.9 51.0 431.4 176.0 1,587.5 127,383.9 128,795.4......... Natural Gas Steam Turbine Utility Scale Facilities 76,531.5 490.5 260.5 76,761.5 230.0 2,051.0 888.8 0.0 1.0 1,090.6 2,868.8 -1,090.6 -2,867.8 75,670.9 73,893.7......... Natural Gas Internal Combustion Engine Utility Scale Facilities 4,377.8 0.0 0.4 4,377.4 -0.4 92.5 145.3 9.3 362.2 0.0 4.8 9.3 357.4 4,386.7 4,734.8......... Natural Gas with Compressed Air Storage Utility Scale Facilities 110.0 0.0 0.0 110.0 0.0 0.0 0.0 0.0 0.0 0.0 0.0 0.0 0.0 110.0 110.0......... Other Natural Gas Utility Scale Facilities 121.8 0.3 0.0 122.1 0.3 0.3 0.3 0.0 34.3 0.0 0.0 0.0 34.3 122.1 156.4...... Natural Gas Subtotal Utility Scale Facilities 454,975.4 5,257.9 343.6 459,889.7 4,914.3 7,081.9 11,042.1 3,925.4 15,958.4 1,141.6 3,518.0 2,783.8 12,440.4 462,673.5 472,330.1......... Conventional Steam Coal Utility Scale Facilities 251,536.5 17.5 2,018.9 249,535.1 -2,001.4 -9,915.1 -14,409.9 0.0 17.0 644.0 6,922.5 -644.0 -6,905.5 248,891.1 242,629.6......... Coal Integrated Gasification Combined Cycle Utility Scale Facilities 815.0 0.0 0.0 815.0 0.0 0.0 0.0 0.0 0.0 0.0 0.0 0.0 0.0 815.0 815.0...... Coal Subtotal Utility Scale Facilities 252,351.5 17.5 2,018.9 250,350.1 -2,001.4 -9,915.1 -14,409.9 0.0 17.0 644.0 6,922.5 -644.0 -6,905.5 249,706.1 243,444.6...... Petroleum Coke Utility Scale Facilities 1,468.9 0.0 0.0 1,468.9 0.0 2.2 2.2 0.0 0.0 0.0 0.0 0.0 0.0 1,468.9 1,468.9...... Petroleum Liquids Utility Scale Facilities 32,182.5 13.4 455.3 31,740.6 -441.9 -482.6 -1,220.4 8.0 28.1 0.0 236.3 8.0 -208.2 31,748.6 31,532.4...... Other Gases Utility Scale Facilities 2,448.8 5.0 78.0 2,375.8 -73.0 -81.1 -81.1 0.0 0.0 0.0 0.0 0.0 0.0 2,375.8 2,375.8... Fossil Fuels Subtotal Utility Scale Facilities 743,427.1 5,293.8 2,895.8 745,825.1 2,398.0 -3,394.7 -4,667.1 3,933.4 16,003.5 1,785.6 10,676.8 2,147.8 5,326.7 747,972.9 751,151.8...... Hydroelectric Pumped Storage Utility Scale Facilities 22,809.7 0.0 0.0 22,809.7 0.0 1.0 58.0 57.0 57.0 0.0 0.0 57.0 57.0 22,866.7 22,866.7...... Flywheels Utility Scale Facilities 42.0 5.0 0.0 47.0 5.0 5.0 5.0 0.0 0.0 0.0 0.0 0.0 0.0 47.0 47.0...... Batteries Utility Scale Facilities 686.0 10.0 0.0 696.0 10.0 -9.2 52.9 5.5 118.3 0.0 0.0 5.5 118.3 701.5 814.3... Energy Storage Subtotal Utility Scale Facilities 23,537.7 15.0 0.0 23,552.7 15.0 -3.2 115.9 62.5 175.3 0.0 0.0 62.5 175.3 23,615.2 23,728.0... Nuclear Utility Scale Facilities 99,641.5 1.8 1.2 99,642.1 0.6 7.5 26.5 18.0 18.0 0.0 607.7 18.0 -589.7 99,660.1 99,052.4... All Other Utility Scale Facilities 1,691.2 84.0 0.0 1,775.2 84.0 356.3 356.3 0.0 48.8 0.0 0.0 0.0 48.8 1,775.2 1,824.0TOTAL UTILITY SCALE FACILITIES 1,081,509.0 5,765.6 2,942.1 1,084,332.5 2,823.5 -450.9 6,440.4 4,539.2 27,877.8 1,829.6 11,399.7 2,709.6 16,478.1 1,087,042.1 1,100,810.6
......... Estimated Small Scale Solar Photovoltaic Small Scale Facilities 16,971.7 17,228.3 256.7 1,004.2 3,256.9 ...... Estimated Total Solar Photovoltaic All Facilities 43,361.9 43,954.9 593.1 2,824.0 8,452.8 ... Estimated Total Solar All Facilities 45,119.8 45,712.8 593.1 2,823.9 8,452.8
NOTES:Planned Capacity Additions reflect plans to begin operating new units and plans to uprate existing units.Planned Capacity Reductions reflect plans to retire or derate existing units.Actual Capacity Additions reflect new units, uprates to existing units, corrections to previously reported capacities, and additions not previously reported.Actual Capacity Reductions reflect retirements of and derates to existing units, corrections to previously reported capacities, and reductions not previously reported.Capacity from facilities with a total generator nameplate capacity less than 1 MW are excluded from this table.
Sources: U.S. Energy Information Administration, Form EIA-860, 'Annual Electric Generator Report' and Form EIA-860M, 'Monthly Update to the Annual Electric Generator Report.'Estimated small scale solar photovoltaic capacity is based on data from Form EIA-861M, Form EIA-861 and from estimation methods described in the technical notes.
Table 6.1. Electric Generating Summer Capacity Changes (MW), March 2018 to April 2018Activity During April 2018 as
Reported to EIANet Change in Capacity - Current Month and
Prior Periods Changes in and Total Net Summer Capacity -- Outlook Based on Reports to EIAPlanned Capacity Additions Planned Capacity Reductions Planned Net Change Planned Total Net Summer
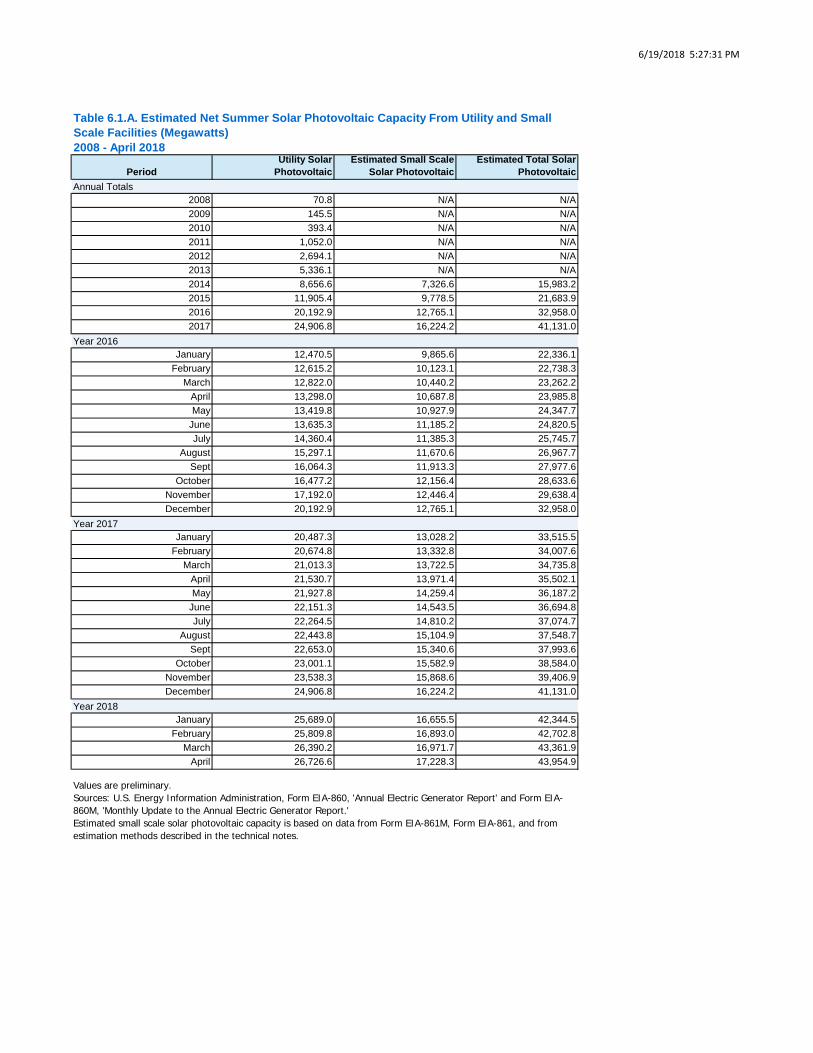
6/19/2018 5:27:31 PM
PeriodUtility Solar
PhotovoltaicEstimated Small Scale
Solar PhotovoltaicEstimated Total Solar
Photovoltaic
2008 70.8 N/A N/A2009 145.5 N/A N/A2010 393.4 N/A N/A2011 1,052.0 N/A N/A2012 2,694.1 N/A N/A2013 5,336.1 N/A N/A2014 8,656.6 7,326.6 15,983.22015 11,905.4 9,778.5 21,683.92016 20,192.9 12,765.1 32,958.02017 24,906.8 16,224.2 41,131.0
January 12,470.5 9,865.6 22,336.1February 12,615.2 10,123.1 22,738.3
March 12,822.0 10,440.2 23,262.2April 13,298.0 10,687.8 23,985.8May 13,419.8 10,927.9 24,347.7
June 13,635.3 11,185.2 24,820.5July 14,360.4 11,385.3 25,745.7
August 15,297.1 11,670.6 26,967.7Sept 16,064.3 11,913.3 27,977.6
October 16,477.2 12,156.4 28,633.6November 17,192.0 12,446.4 29,638.4December 20,192.9 12,765.1 32,958.0
January 20,487.3 13,028.2 33,515.5February 20,674.8 13,332.8 34,007.6
March 21,013.3 13,722.5 34,735.8April 21,530.7 13,971.4 35,502.1May 21,927.8 14,259.4 36,187.2
June 22,151.3 14,543.5 36,694.8July 22,264.5 14,810.2 37,074.7
August 22,443.8 15,104.9 37,548.7Sept 22,653.0 15,340.6 37,993.6
October 23,001.1 15,582.9 38,584.0November 23,538.3 15,868.6 39,406.9December 24,906.8 16,224.2 41,131.0
January 25,689.0 16,655.5 42,344.5February 25,809.8 16,893.0 42,702.8
March 26,390.2 16,971.7 43,361.9April 26,726.6 17,228.3 43,954.9
Values are preliminary.Sources: U.S. Energy Information Administration, Form EIA-860, 'Annual Electric Generator Report' and Form EIA-860M, 'Monthly Update to the Annual Electric Generator Report.'Estimated small scale solar photovoltaic capacity is based on data from Form EIA-861M, Form EIA-861, and from estimation methods described in the technical notes.
Table 6.1.A. Estimated Net Summer Solar Photovoltaic Capacity From Utility and Small Scale Facilities (Megawatts)2008 - April 2018
Annual Totals
Year 2016
Year 2017
Year 2018
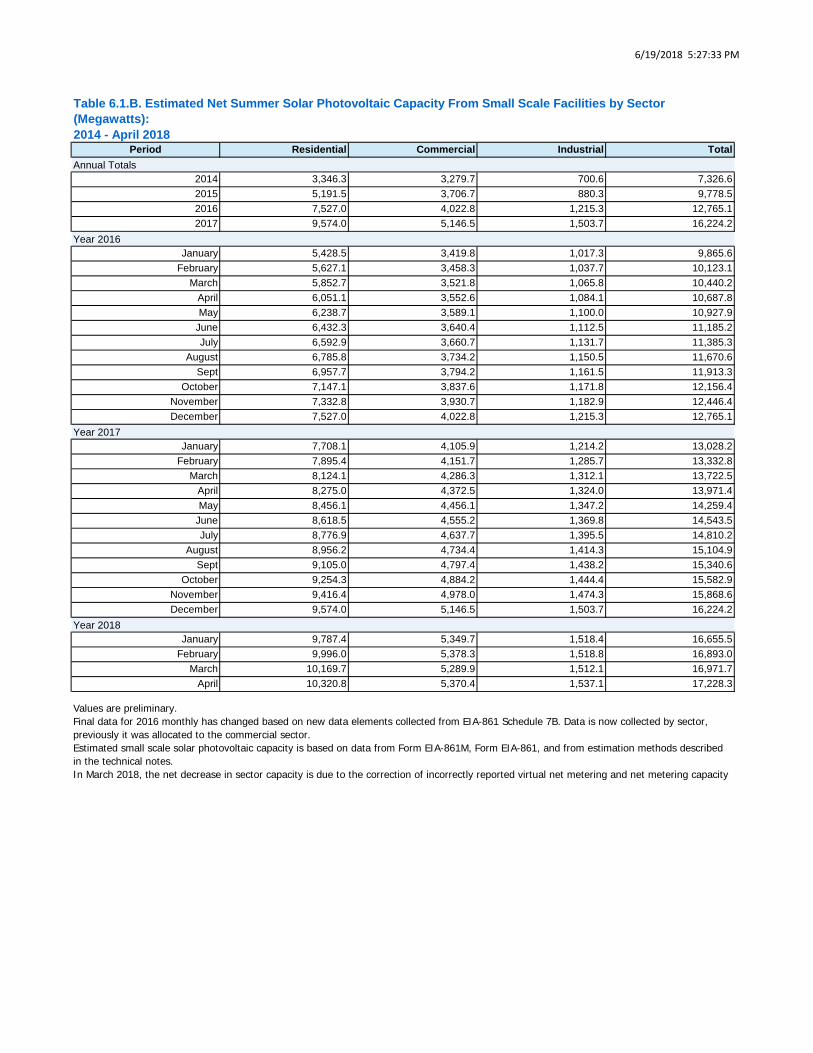
6/19/2018 5:27:33 PM
Period Residential Commercial Industrial Total
2014 3,346.3 3,279.7 700.6 7,326.62015 5,191.5 3,706.7 880.3 9,778.52016 7,527.0 4,022.8 1,215.3 12,765.12017 9,574.0 5,146.5 1,503.7 16,224.2
January 5,428.5 3,419.8 1,017.3 9,865.6February 5,627.1 3,458.3 1,037.7 10,123.1
March 5,852.7 3,521.8 1,065.8 10,440.2April 6,051.1 3,552.6 1,084.1 10,687.8May 6,238.7 3,589.1 1,100.0 10,927.9
June 6,432.3 3,640.4 1,112.5 11,185.2July 6,592.9 3,660.7 1,131.7 11,385.3
August 6,785.8 3,734.2 1,150.5 11,670.6Sept 6,957.7 3,794.2 1,161.5 11,913.3
October 7,147.1 3,837.6 1,171.8 12,156.4November 7,332.8 3,930.7 1,182.9 12,446.4December 7,527.0 4,022.8 1,215.3 12,765.1
January 7,708.1 4,105.9 1,214.2 13,028.2February 7,895.4 4,151.7 1,285.7 13,332.8
March 8,124.1 4,286.3 1,312.1 13,722.5April 8,275.0 4,372.5 1,324.0 13,971.4May 8,456.1 4,456.1 1,347.2 14,259.4
June 8,618.5 4,555.2 1,369.8 14,543.5July 8,776.9 4,637.7 1,395.5 14,810.2
August 8,956.2 4,734.4 1,414.3 15,104.9Sept 9,105.0 4,797.4 1,438.2 15,340.6
October 9,254.3 4,884.2 1,444.4 15,582.9November 9,416.4 4,978.0 1,474.3 15,868.6December 9,574.0 5,146.5 1,503.7 16,224.2
January 9,787.4 5,349.7 1,518.4 16,655.5February 9,996.0 5,378.3 1,518.8 16,893.0
March 10,169.7 5,289.9 1,512.1 16,971.7April 10,320.8 5,370.4 1,537.1 17,228.3
Values are preliminary.Final data for 2016 monthly has changed based on new data elements collected from EIA-861 Schedule 7B. Data is now collected by sector, previously it was allocated to the commercial sector.Estimated small scale solar photovoltaic capacity is based on data from Form EIA-861M, Form EIA-861, and from estimation methods described in the technical notes.In March 2018, the net decrease in sector capacity is due to the correction of incorrectly reported virtual net metering and net metering capacity
Table 6.1.B. Estimated Net Summer Solar Photovoltaic Capacity From Small Scale Facilities by Sector (Megawatts):2014 - April 2018
Annual Totals
Year 2016
Year 2017
Year 2018
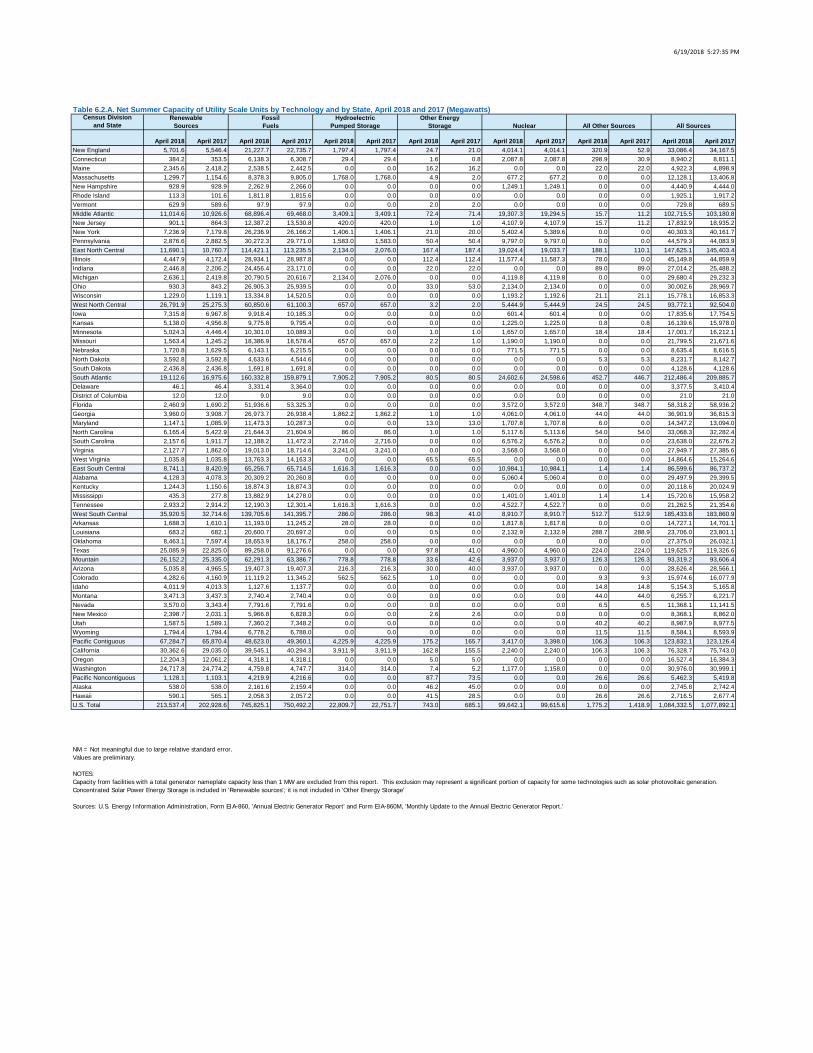
6/19/2018 5:27:35 PM
Census Divisionand State
April 2018 April 2017 April 2018 April 2017 April 2018 April 2017 April 2018 April 2017 April 2018 April 2017 April 2018 April 2017 April 2018 April 2017New England 5,701.6 5,546.4 21,227.7 22,735.7 1,797.4 1,797.4 24.7 21.0 4,014.1 4,014.1 320.9 52.9 33,086.4 34,167.5Connecticut 384.2 353.5 6,138.3 6,308.7 29.4 29.4 1.6 0.8 2,087.8 2,087.8 298.9 30.9 8,940.2 8,811.1Maine 2,345.6 2,418.2 2,538.5 2,442.5 0.0 0.0 16.2 16.2 0.0 0.0 22.0 22.0 4,922.3 4,898.9Massachusetts 1,299.7 1,154.6 8,378.3 9,805.0 1,768.0 1,768.0 4.9 2.0 677.2 677.2 0.0 0.0 12,128.1 13,406.8New Hampshire 928.9 928.9 2,262.9 2,266.0 0.0 0.0 0.0 0.0 1,249.1 1,249.1 0.0 0.0 4,440.9 4,444.0Rhode Island 113.3 101.6 1,811.8 1,815.6 0.0 0.0 0.0 0.0 0.0 0.0 0.0 0.0 1,925.1 1,917.2Vermont 629.9 589.6 97.9 97.9 0.0 0.0 2.0 2.0 0.0 0.0 0.0 0.0 729.8 689.5Middle Atlantic 11,014.6 10,926.6 68,896.4 69,468.0 3,409.1 3,409.1 72.4 71.4 19,307.3 19,294.5 15.7 11.2 102,715.5 103,180.8New Jersey 901.1 864.3 12,387.2 13,530.8 420.0 420.0 1.0 1.0 4,107.9 4,107.9 15.7 11.2 17,832.9 18,935.2New York 7,236.9 7,179.8 26,236.9 26,166.2 1,406.1 1,406.1 21.0 20.0 5,402.4 5,389.6 0.0 0.0 40,303.3 40,161.7Pennsylvania 2,876.6 2,882.5 30,272.3 29,771.0 1,583.0 1,583.0 50.4 50.4 9,797.0 9,797.0 0.0 0.0 44,579.3 44,083.9East North Central 11,690.1 10,760.7 114,421.1 113,235.5 2,134.0 2,076.0 167.4 187.4 19,024.4 19,033.7 188.1 110.1 147,625.1 145,403.4Illinois 4,447.9 4,172.4 28,934.1 28,987.8 0.0 0.0 112.4 112.4 11,577.4 11,587.3 78.0 0.0 45,149.8 44,859.9Indiana 2,446.8 2,206.2 24,456.4 23,171.0 0.0 0.0 22.0 22.0 0.0 0.0 89.0 89.0 27,014.2 25,488.2Michigan 2,636.1 2,419.8 20,790.5 20,616.7 2,134.0 2,076.0 0.0 0.0 4,119.8 4,119.8 0.0 0.0 29,680.4 29,232.3Ohio 930.3 843.2 26,905.3 25,939.5 0.0 0.0 33.0 53.0 2,134.0 2,134.0 0.0 0.0 30,002.6 28,969.7Wisconsin 1,229.0 1,119.1 13,334.8 14,520.5 0.0 0.0 0.0 0.0 1,193.2 1,192.6 21.1 21.1 15,778.1 16,853.3West North Central 26,791.9 25,275.3 60,850.6 61,100.3 657.0 657.0 3.2 2.0 5,444.9 5,444.9 24.5 24.5 93,772.1 92,504.0Iowa 7,315.8 6,967.8 9,918.4 10,185.3 0.0 0.0 0.0 0.0 601.4 601.4 0.0 0.0 17,835.6 17,754.5Kansas 5,138.0 4,956.8 9,775.8 9,795.4 0.0 0.0 0.0 0.0 1,225.0 1,225.0 0.8 0.8 16,139.6 15,978.0Minnesota 5,024.3 4,446.4 10,301.0 10,089.3 0.0 0.0 1.0 1.0 1,657.0 1,657.0 18.4 18.4 17,001.7 16,212.1Missouri 1,563.4 1,245.2 18,386.9 18,578.4 657.0 657.0 2.2 1.0 1,190.0 1,190.0 0.0 0.0 21,799.5 21,671.6Nebraska 1,720.8 1,629.5 6,143.1 6,215.5 0.0 0.0 0.0 0.0 771.5 771.5 0.0 0.0 8,635.4 8,616.5North Dakota 3,592.8 3,592.8 4,633.6 4,544.6 0.0 0.0 0.0 0.0 0.0 0.0 5.3 5.3 8,231.7 8,142.7South Dakota 2,436.8 2,436.8 1,691.8 1,691.8 0.0 0.0 0.0 0.0 0.0 0.0 0.0 0.0 4,128.6 4,128.6South Atlantic 19,112.6 16,975.6 160,332.8 159,879.1 7,905.2 7,905.2 80.5 80.5 24,602.6 24,598.6 452.7 446.7 212,486.4 209,885.7Delaware 46.1 46.4 3,331.4 3,364.0 0.0 0.0 0.0 0.0 0.0 0.0 0.0 0.0 3,377.5 3,410.4District of Columbia 12.0 12.0 9.0 9.0 0.0 0.0 0.0 0.0 0.0 0.0 0.0 0.0 21.0 21.0Florida 2,460.9 1,690.2 51,936.6 53,325.3 0.0 0.0 0.0 0.0 3,572.0 3,572.0 348.7 348.7 58,318.2 58,936.2Georgia 3,960.0 3,908.7 26,973.7 26,938.4 1,862.2 1,862.2 1.0 1.0 4,061.0 4,061.0 44.0 44.0 36,901.9 36,815.3Maryland 1,147.1 1,085.9 11,473.3 10,287.3 0.0 0.0 13.0 13.0 1,707.8 1,707.8 6.0 0.0 14,347.2 13,094.0North Carolina 6,165.4 5,422.9 21,644.3 21,604.9 86.0 86.0 1.0 1.0 5,117.6 5,113.6 54.0 54.0 33,068.3 32,282.4South Carolina 2,157.6 1,911.7 12,188.2 11,472.3 2,716.0 2,716.0 0.0 0.0 6,576.2 6,576.2 0.0 0.0 23,638.0 22,676.2Virginia 2,127.7 1,862.0 19,013.0 18,714.6 3,241.0 3,241.0 0.0 0.0 3,568.0 3,568.0 0.0 0.0 27,949.7 27,385.6West Virginia 1,035.8 1,035.8 13,763.3 14,163.3 0.0 0.0 65.5 65.5 0.0 0.0 0.0 0.0 14,864.6 15,264.6East South Central 8,741.1 8,420.9 65,256.7 65,714.5 1,616.3 1,616.3 0.0 0.0 10,984.1 10,984.1 1.4 1.4 86,599.6 86,737.2Alabama 4,128.3 4,078.3 20,309.2 20,260.8 0.0 0.0 0.0 0.0 5,060.4 5,060.4 0.0 0.0 29,497.9 29,399.5Kentucky 1,244.3 1,150.6 18,874.3 18,874.3 0.0 0.0 0.0 0.0 0.0 0.0 0.0 0.0 20,118.6 20,024.9Mississippi 435.3 277.8 13,882.9 14,278.0 0.0 0.0 0.0 0.0 1,401.0 1,401.0 1.4 1.4 15,720.6 15,958.2Tennessee 2,933.2 2,914.2 12,190.3 12,301.4 1,616.3 1,616.3 0.0 0.0 4,522.7 4,522.7 0.0 0.0 21,262.5 21,354.6West South Central 35,920.5 32,714.6 139,705.6 141,395.7 286.0 286.0 98.3 41.0 8,910.7 8,910.7 512.7 512.9 185,433.8 183,860.9Arkansas 1,688.3 1,610.1 11,193.0 11,245.2 28.0 28.0 0.0 0.0 1,817.8 1,817.8 0.0 0.0 14,727.1 14,701.1Louisiana 683.2 682.1 20,600.7 20,697.2 0.0 0.0 0.5 0.0 2,132.9 2,132.9 288.7 288.9 23,706.0 23,801.1Oklahoma 8,463.1 7,597.4 18,653.9 18,176.7 258.0 258.0 0.0 0.0 0.0 0.0 0.0 0.0 27,375.0 26,032.1Texas 25,085.9 22,825.0 89,258.0 91,276.6 0.0 0.0 97.8 41.0 4,960.0 4,960.0 224.0 224.0 119,625.7 119,326.6Mountain 26,152.2 25,335.0 62,291.3 63,386.7 778.8 778.8 33.6 42.6 3,937.0 3,937.0 126.3 126.3 93,319.2 93,606.4Arizona 5,035.8 4,965.5 19,407.3 19,407.3 216.3 216.3 30.0 40.0 3,937.0 3,937.0 0.0 0.0 28,626.4 28,566.1Colorado 4,282.6 4,160.9 11,119.2 11,345.2 562.5 562.5 1.0 0.0 0.0 0.0 9.3 9.3 15,974.6 16,077.9Idaho 4,011.9 4,013.3 1,127.6 1,137.7 0.0 0.0 0.0 0.0 0.0 0.0 14.8 14.8 5,154.3 5,165.8Montana 3,471.3 3,437.3 2,740.4 2,740.4 0.0 0.0 0.0 0.0 0.0 0.0 44.0 44.0 6,255.7 6,221.7Nevada 3,570.0 3,343.4 7,791.6 7,791.6 0.0 0.0 0.0 0.0 0.0 0.0 6.5 6.5 11,368.1 11,141.5New Mexico 2,398.7 2,031.1 5,966.8 6,828.3 0.0 0.0 2.6 2.6 0.0 0.0 0.0 0.0 8,368.1 8,862.0Utah 1,587.5 1,589.1 7,360.2 7,348.2 0.0 0.0 0.0 0.0 0.0 0.0 40.2 40.2 8,987.9 8,977.5Wyoming 1,794.4 1,794.4 6,778.2 6,788.0 0.0 0.0 0.0 0.0 0.0 0.0 11.5 11.5 8,584.1 8,593.9Pacific Contiguous 67,284.7 65,870.4 48,623.0 49,360.1 4,225.9 4,225.9 175.2 165.7 3,417.0 3,398.0 106.3 106.3 123,832.1 123,126.4California 30,362.6 29,035.0 39,545.1 40,294.3 3,911.9 3,911.9 162.8 155.5 2,240.0 2,240.0 106.3 106.3 76,328.7 75,743.0Oregon 12,204.3 12,061.2 4,318.1 4,318.1 0.0 0.0 5.0 5.0 0.0 0.0 0.0 0.0 16,527.4 16,384.3Washington 24,717.8 24,774.2 4,759.8 4,747.7 314.0 314.0 7.4 5.2 1,177.0 1,158.0 0.0 0.0 30,976.0 30,999.1Pacific Noncontiguous 1,128.1 1,103.1 4,219.9 4,216.6 0.0 0.0 87.7 73.5 0.0 0.0 26.6 26.6 5,462.3 5,419.8Alaska 538.0 538.0 2,161.6 2,159.4 0.0 0.0 46.2 45.0 0.0 0.0 0.0 0.0 2,745.8 2,742.4Hawaii 590.1 565.1 2,058.3 2,057.2 0.0 0.0 41.5 28.5 0.0 0.0 26.6 26.6 2,716.5 2,677.4U.S. Total 213,537.4 202,928.6 745,825.1 750,492.2 22,809.7 22,751.7 743.0 685.1 99,642.1 99,615.6 1,775.2 1,418.9 1,084,332.5 1,077,892.1
NM = Not meaningful due to large relative standard error.Values are preliminary.
NOTES:Capacity from facilities with a total generator nameplate capacity less than 1 MW are excluded from this report. This exclusion may represent a significant portion of capacity for some technologies such as solar photovoltaic generation.Concentrated Solar Power Energy Storage is included in 'Renewable sources'; it is not included in 'Other Energy Storage'
Sources: U.S. Energy Information Administration, Form EIA-860, 'Annual Electric Generator Report' and Form EIA-860M, 'Monthly Update to the Annual Electric Generator Report.'
Table 6.2.A. Net Summer Capacity of Utility Scale Units by Technology and by State, April 2018 and 2017 (Megawatts)Renewable
SourcesFossilFuels
HydroelectricPumped Storage
Other EnergyStorage Nuclear All Other Sources All Sources
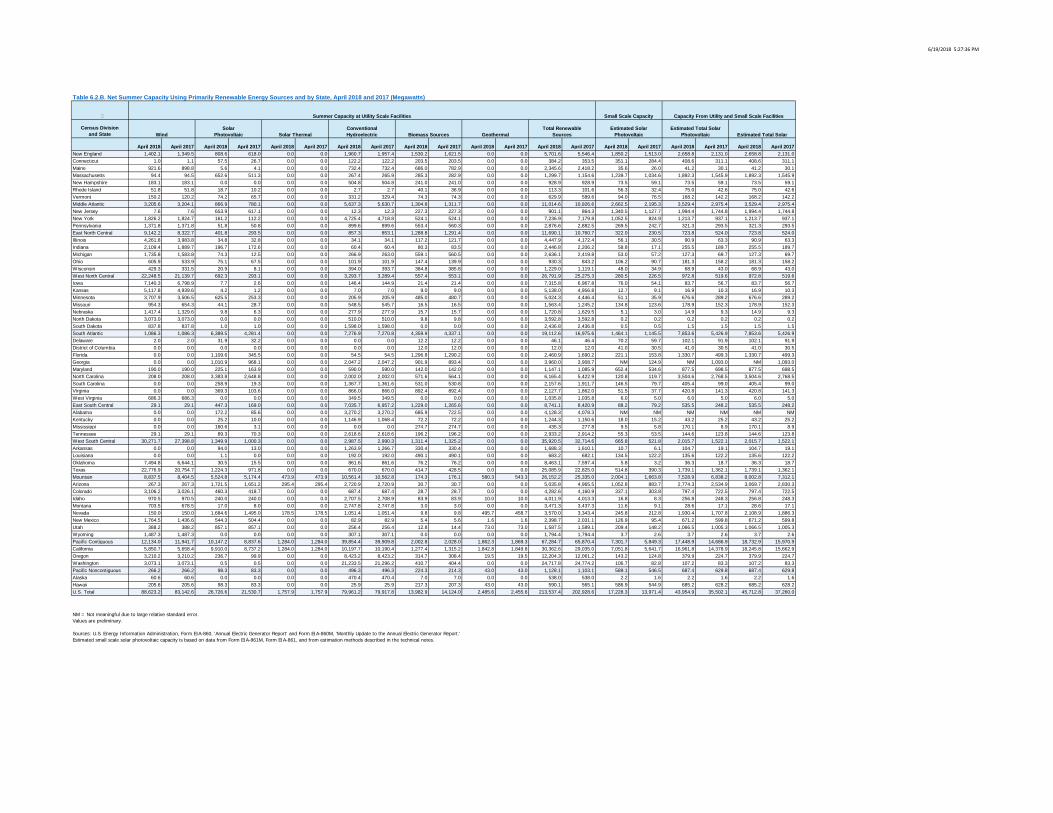
6/19/2018 5:27:36 PM
Census Divisionand State
April 2018 April 2017 April 2018 April 2017 April 2018 April 2017 April 2018 April 2017 April 2018 April 2017 April 2018 April 2017 April 2018 April 2017 April 2018 April 2017 April 2018 April 2017 April 2018 April 2017New England 1,402.1 1,349.5 808.6 618.0 0.0 0.0 1,960.7 1,957.4 1,530.2 1,621.5 0.0 0.0 5,701.6 5,546.4 1,850.2 1,513.0 2,658.8 2,131.0 2,658.8 2,131.0Connecticut 1.0 1.1 57.5 26.7 0.0 0.0 122.2 122.2 203.5 203.5 0.0 0.0 384.2 353.5 351.1 284.4 408.6 311.1 408.6 311.1Maine 921.6 898.8 5.6 4.1 0.0 0.0 732.4 732.4 686.0 782.9 0.0 0.0 2,345.6 2,418.2 35.6 26.0 41.2 30.1 41.2 30.1Massachusetts 94.4 94.5 652.6 511.3 0.0 0.0 267.4 265.9 285.3 282.9 0.0 0.0 1,299.7 1,154.6 1,239.7 1,034.6 1,892.3 1,545.9 1,892.3 1,545.9New Hampshire 183.1 183.1 0.0 0.0 0.0 0.0 504.8 504.8 241.0 241.0 0.0 0.0 928.9 928.9 73.5 59.1 73.5 59.1 73.5 59.1Rhode Island 51.8 51.8 18.7 10.2 0.0 0.0 2.7 2.7 40.1 36.9 0.0 0.0 113.3 101.6 56.3 32.4 75.0 42.6 75.0 42.6Vermont 150.2 120.2 74.2 65.7 0.0 0.0 331.2 329.4 74.3 74.3 0.0 0.0 629.9 589.6 94.0 76.5 168.2 142.2 168.2 142.2Middle Atlantic 3,205.6 3,204.1 866.9 780.1 0.0 0.0 5,637.3 5,630.7 1,304.8 1,311.7 0.0 0.0 11,014.6 10,926.6 2,662.5 2,195.3 3,529.4 2,975.4 3,529.4 2,975.4New Jersey 7.6 7.6 653.9 617.1 0.0 0.0 12.3 12.3 227.3 227.3 0.0 0.0 901.1 864.3 1,340.5 1,127.7 1,994.4 1,744.8 1,994.4 1,744.8New York 1,826.2 1,824.7 161.2 112.2 0.0 0.0 4,725.4 4,718.8 524.1 524.1 0.0 0.0 7,236.9 7,179.8 1,052.5 824.9 1,213.7 937.1 1,213.7 937.1Pennsylvania 1,371.8 1,371.8 51.8 50.8 0.0 0.0 899.6 899.6 553.4 560.3 0.0 0.0 2,876.6 2,882.5 269.5 242.7 321.3 293.5 321.3 293.5East North Central 9,142.2 8,322.7 401.8 293.5 0.0 0.0 857.3 853.1 1,288.8 1,291.4 0.0 0.0 11,690.1 10,760.7 322.0 230.5 723.8 524.0 723.8 524.0Illinois 4,261.8 3,983.8 34.8 32.8 0.0 0.0 34.1 34.1 117.2 121.7 0.0 0.0 4,447.9 4,172.4 56.1 30.5 90.9 63.3 90.9 63.3Indiana 2,109.4 1,889.7 196.7 172.6 0.0 0.0 60.4 60.4 80.3 83.5 0.0 0.0 2,446.8 2,206.2 58.8 17.1 255.5 189.7 255.5 189.7Michigan 1,735.8 1,583.8 74.3 12.5 0.0 0.0 266.9 263.0 559.1 560.5 0.0 0.0 2,636.1 2,419.8 53.0 57.2 127.3 69.7 127.3 69.7Ohio 605.9 533.9 75.1 67.5 0.0 0.0 101.9 101.9 147.4 139.9 0.0 0.0 930.3 843.2 106.2 90.7 181.3 158.2 181.3 158.2Wisconsin 429.3 331.5 20.9 8.1 0.0 0.0 394.0 393.7 384.8 385.8 0.0 0.0 1,229.0 1,119.1 48.0 34.9 68.9 43.0 68.9 43.0West North Central 22,248.5 21,139.7 692.3 293.1 0.0 0.0 3,293.7 3,289.4 557.4 553.1 0.0 0.0 26,791.9 25,275.3 280.5 226.5 972.8 519.6 972.8 519.6Iowa 7,140.3 6,798.9 7.7 2.6 0.0 0.0 146.4 144.9 21.4 21.4 0.0 0.0 7,315.8 6,967.8 76.0 54.1 83.7 56.7 83.7 56.7Kansas 5,117.8 4,939.6 4.2 1.2 0.0 0.0 7.0 7.0 9.0 9.0 0.0 0.0 5,138.0 4,956.8 12.7 9.1 16.9 10.3 16.9 10.3Minnesota 3,707.9 3,506.5 625.5 253.3 0.0 0.0 205.9 205.9 485.0 480.7 0.0 0.0 5,024.3 4,446.4 51.1 35.9 676.6 289.2 676.6 289.2Missouri 954.3 654.3 44.1 28.7 0.0 0.0 548.5 545.7 16.5 16.5 0.0 0.0 1,563.4 1,245.2 134.8 123.6 178.9 152.3 178.9 152.3Nebraska 1,417.4 1,329.6 9.8 6.3 0.0 0.0 277.9 277.9 15.7 15.7 0.0 0.0 1,720.8 1,629.5 5.1 3.0 14.9 9.3 14.9 9.3North Dakota 3,073.0 3,073.0 0.0 0.0 0.0 0.0 510.0 510.0 9.8 9.8 0.0 0.0 3,592.8 3,592.8 0.2 0.2 0.2 0.2 0.2 0.2South Dakota 837.8 837.8 1.0 1.0 0.0 0.0 1,598.0 1,598.0 0.0 0.0 0.0 0.0 2,436.8 2,436.8 0.5 0.5 1.5 1.5 1.5 1.5South Atlantic 1,086.3 1,086.3 6,389.5 4,281.4 0.0 0.0 7,276.9 7,270.8 4,359.9 4,337.1 0.0 0.0 19,112.6 16,975.6 1,464.1 1,145.5 7,853.6 5,426.9 7,853.6 5,426.9Delaware 2.0 2.0 31.9 32.2 0.0 0.0 0.0 0.0 12.2 12.2 0.0 0.0 46.1 46.4 70.2 59.7 102.1 91.9 102.1 91.9District of Columbia 0.0 0.0 0.0 0.0 0.0 0.0 0.0 0.0 12.0 12.0 0.0 0.0 12.0 12.0 41.0 30.5 41.0 30.5 41.0 30.5Florida 0.0 0.0 1,109.6 345.5 0.0 0.0 54.5 54.5 1,296.8 1,290.2 0.0 0.0 2,460.9 1,690.2 221.1 153.8 1,330.7 499.3 1,330.7 499.3Georgia 0.0 0.0 1,010.9 968.1 0.0 0.0 2,047.2 2,047.2 901.9 893.4 0.0 0.0 3,960.0 3,908.7 NM 124.9 NM 1,093.0 NM 1,093.0Maryland 190.0 190.0 225.1 163.9 0.0 0.0 590.0 590.0 142.0 142.0 0.0 0.0 1,147.1 1,085.9 652.4 534.6 877.5 698.5 877.5 698.5North Carolina 208.0 208.0 3,383.8 2,648.8 0.0 0.0 2,002.0 2,002.0 571.6 564.1 0.0 0.0 6,165.4 5,422.9 120.8 119.7 3,504.6 2,768.5 3,504.6 2,768.5South Carolina 0.0 0.0 258.9 19.3 0.0 0.0 1,367.7 1,361.6 531.0 530.8 0.0 0.0 2,157.6 1,911.7 146.5 79.7 405.4 99.0 405.4 99.0Virginia 0.0 0.0 369.3 103.6 0.0 0.0 866.0 866.0 892.4 892.4 0.0 0.0 2,127.7 1,862.0 51.5 37.7 420.8 141.3 420.8 141.3West Virginia 686.3 686.3 0.0 0.0 0.0 0.0 349.5 349.5 0.0 0.0 0.0 0.0 1,035.8 1,035.8 6.0 5.0 6.0 5.0 6.0 5.0East South Central 29.1 29.1 447.3 169.0 0.0 0.0 7,035.7 6,957.2 1,229.0 1,265.6 0.0 0.0 8,741.1 8,420.9 88.2 79.2 535.5 248.2 535.5 248.2Alabama 0.0 0.0 172.2 85.6 0.0 0.0 3,270.2 3,270.2 685.9 722.5 0.0 0.0 4,128.3 4,078.3 NM NM NM NM NM NMKentucky 0.0 0.0 25.2 10.0 0.0 0.0 1,146.9 1,068.4 72.2 72.2 0.0 0.0 1,244.3 1,150.6 18.0 15.2 43.2 25.2 43.2 25.2Mississippi 0.0 0.0 160.6 3.1 0.0 0.0 0.0 0.0 274.7 274.7 0.0 0.0 435.3 277.8 9.5 5.8 170.1 8.9 170.1 8.9Tennessee 29.1 29.1 89.3 70.3 0.0 0.0 2,618.6 2,618.6 196.2 196.2 0.0 0.0 2,933.2 2,914.2 55.3 53.5 144.6 123.8 144.6 123.8West South Central 30,271.7 27,398.8 1,349.9 1,000.3 0.0 0.0 2,987.5 2,990.3 1,311.4 1,325.2 0.0 0.0 35,920.5 32,714.6 665.8 521.8 2,015.7 1,522.1 2,015.7 1,522.1Arkansas 0.0 0.0 94.0 13.0 0.0 0.0 1,263.9 1,266.7 330.4 330.4 0.0 0.0 1,688.3 1,610.1 10.7 6.1 104.7 19.1 104.7 19.1Louisiana 0.0 0.0 1.1 0.0 0.0 0.0 192.0 192.0 490.1 490.1 0.0 0.0 683.2 682.1 134.5 122.2 135.6 122.2 135.6 122.2Oklahoma 7,494.8 6,644.1 30.5 15.5 0.0 0.0 861.6 861.6 76.2 76.2 0.0 0.0 8,463.1 7,597.4 5.8 3.2 36.3 18.7 36.3 18.7Texas 22,776.9 20,754.7 1,224.3 971.8 0.0 0.0 670.0 670.0 414.7 428.5 0.0 0.0 25,085.9 22,825.0 514.8 390.3 1,739.1 1,362.1 1,739.1 1,362.1Mountain 8,837.5 8,404.5 5,524.8 5,174.4 473.9 473.9 10,561.4 10,562.8 174.3 176.1 580.3 543.3 26,152.2 25,335.0 2,004.1 1,663.8 7,528.9 6,838.2 8,002.8 7,312.1Arizona 267.3 267.3 1,721.5 1,651.2 295.4 295.4 2,720.9 2,720.9 30.7 30.7 0.0 0.0 5,035.8 4,965.5 1,052.8 883.7 2,774.3 2,534.9 3,069.7 2,830.3Colorado 3,106.2 3,026.1 460.3 418.7 0.0 0.0 687.4 687.4 28.7 28.7 0.0 0.0 4,282.6 4,160.9 337.1 303.8 797.4 722.5 797.4 722.5Idaho 970.5 970.5 240.0 240.0 0.0 0.0 2,707.5 2,708.9 83.9 83.9 10.0 10.0 4,011.9 4,013.3 16.8 8.3 256.8 248.3 256.8 248.3Montana 703.5 678.5 17.0 8.0 0.0 0.0 2,747.8 2,747.8 3.0 3.0 0.0 0.0 3,471.3 3,437.3 11.6 9.1 28.6 17.1 28.6 17.1Nevada 150.0 150.0 1,684.6 1,495.0 178.5 178.5 1,051.4 1,051.4 9.8 9.8 495.7 458.7 3,570.0 3,343.4 245.8 212.8 1,930.4 1,707.8 2,108.9 1,886.3New Mexico 1,764.5 1,436.6 544.3 504.4 0.0 0.0 82.9 82.9 5.4 5.6 1.6 1.6 2,398.7 2,031.1 126.9 95.4 671.2 599.8 671.2 599.8Utah 388.2 388.2 857.1 857.1 0.0 0.0 256.4 256.4 12.8 14.4 73.0 73.0 1,587.5 1,589.1 209.4 148.2 1,066.5 1,005.3 1,066.5 1,005.3Wyoming 1,487.3 1,487.3 0.0 0.0 0.0 0.0 307.1 307.1 0.0 0.0 0.0 0.0 1,794.4 1,794.4 3.7 2.6 3.7 2.6 3.7 2.6Pacific Contiguous 12,134.0 11,941.7 10,147.2 8,837.6 1,284.0 1,284.0 39,854.4 39,909.8 2,002.8 2,028.0 1,862.3 1,869.3 67,284.7 65,870.4 7,301.7 5,849.3 17,448.9 14,686.9 18,732.9 15,970.9California 5,850.7 5,658.4 9,910.0 8,737.2 1,284.0 1,284.0 10,197.7 10,190.4 1,277.4 1,315.2 1,842.8 1,849.8 30,362.6 29,035.0 7,051.8 5,641.7 16,961.8 14,378.9 18,245.8 15,662.9Oregon 3,210.2 3,210.2 236.7 99.9 0.0 0.0 8,423.2 8,423.2 314.7 308.4 19.5 19.5 12,204.3 12,061.2 143.2 124.8 379.9 224.7 379.9 224.7Washington 3,073.1 3,073.1 0.5 0.5 0.0 0.0 21,233.5 21,296.2 410.7 404.4 0.0 0.0 24,717.8 24,774.2 106.7 82.8 107.2 83.3 107.2 83.3Pacific Noncontiguous 266.2 266.2 98.3 83.3 0.0 0.0 496.3 496.3 224.3 214.3 43.0 43.0 1,128.1 1,103.1 589.1 546.5 687.4 629.8 687.4 629.8Alaska 60.6 60.6 0.0 0.0 0.0 0.0 470.4 470.4 7.0 7.0 0.0 0.0 538.0 538.0 2.2 1.6 2.2 1.6 2.2 1.6Hawaii 205.6 205.6 98.3 83.3 0.0 0.0 25.9 25.9 217.3 207.3 43.0 43.0 590.1 565.1 586.9 544.9 685.2 628.2 685.2 628.2U.S. Total 88,623.2 83,142.6 26,726.6 21,530.7 1,757.9 1,757.9 79,961.2 79,917.8 13,982.9 14,124.0 2,485.6 2,455.6 213,537.4 202,928.6 17,228.3 13,971.4 43,954.9 35,502.1 45,712.8 37,260.0
Table 6.2.B. Net Summer Capacity Using Primarily Renewable Energy Sources and by State, April 2018 and 2017 (Megawatts)
Summer Capacity at Utility Scale Facilities Small Scale Capacity Capacity From Utility and Small Scale Facilities
WindSolar
Photovoltaic Solar ThermalConventionalHydroelectric Biomass Sources Geothermal
Total RenewableSources
Estimated Solar Photovoltaic
Estimated Total Solar Photovoltaic Estimated Total Solar
NM = Not meaningful due to large relative standard error.Values are preliminary.
Sources: U.S. Energy Information Administration, Form EIA-860, 'Annual Electric Generator Report' and Form EIA-860M, 'Monthly Update to the Annual Electric Generator Report.'Estimated small scale solar photovoltaic capacity is based on data from Form EIA-861M, Form EIA-861, and from estimation methods described in the technical notes.
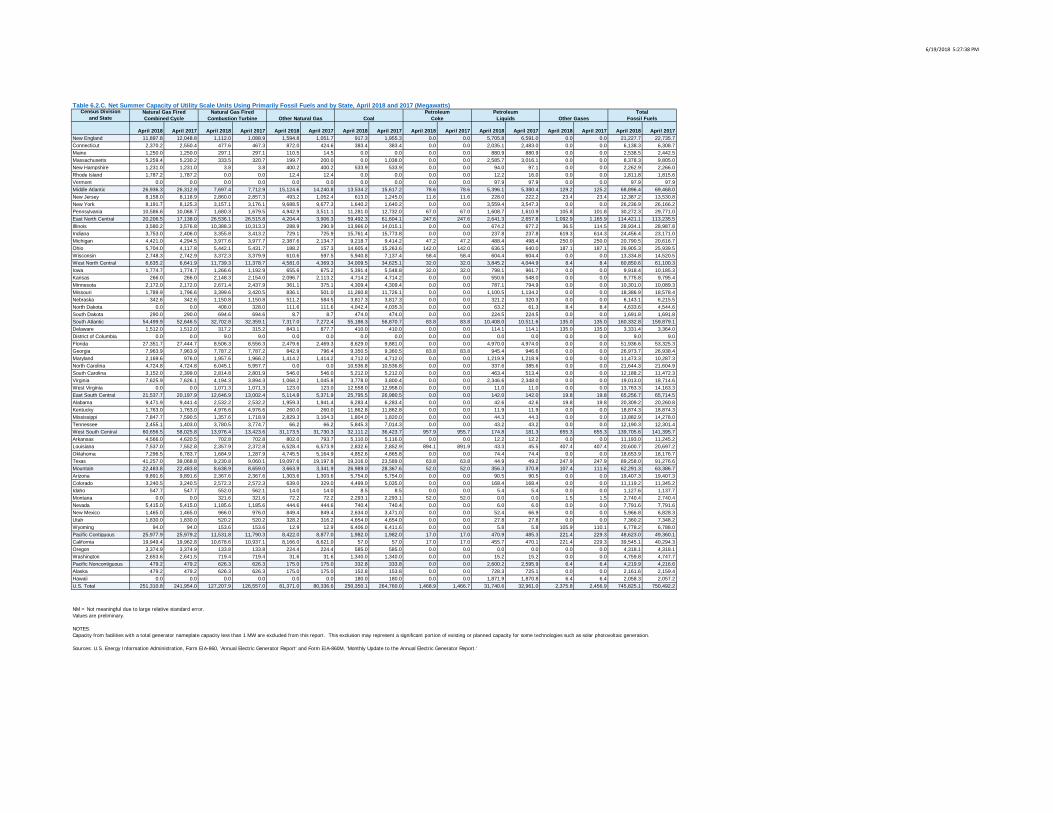
6/19/2018 5:27:38 PM
Census Divisionand State
April 2018 April 2017 April 2018 April 2017 April 2018 April 2017 April 2018 April 2017 April 2018 April 2017 April 2018 April 2017 April 2018 April 2017 April 2018 April 2017New England 11,897.8 12,048.8 1,112.0 1,088.9 1,594.8 1,051.7 917.3 1,955.3 0.0 0.0 5,705.8 6,591.0 0.0 0.0 21,227.7 22,735.7Connecticut 2,370.2 2,550.4 477.6 467.3 872.0 424.6 383.4 383.4 0.0 0.0 2,035.1 2,483.0 0.0 0.0 6,138.3 6,308.7Maine 1,250.0 1,250.0 297.1 297.1 110.5 14.5 0.0 0.0 0.0 0.0 880.9 880.9 0.0 0.0 2,538.5 2,442.5Massachusetts 5,259.4 5,230.2 333.5 320.7 199.7 200.0 0.0 1,038.0 0.0 0.0 2,585.7 3,016.1 0.0 0.0 8,378.3 9,805.0New Hampshire 1,231.0 1,231.0 3.8 3.8 400.2 400.2 533.9 533.9 0.0 0.0 94.0 97.1 0.0 0.0 2,262.9 2,266.0Rhode Island 1,787.2 1,787.2 0.0 0.0 12.4 12.4 0.0 0.0 0.0 0.0 12.2 16.0 0.0 0.0 1,811.8 1,815.6Vermont 0.0 0.0 0.0 0.0 0.0 0.0 0.0 0.0 0.0 0.0 97.9 97.9 0.0 0.0 97.9 97.9Middle Atlantic 26,936.3 26,312.9 7,697.4 7,712.9 15,124.6 14,240.8 13,534.2 15,617.2 78.6 78.6 5,396.1 5,380.4 129.2 125.2 68,896.4 69,468.0New Jersey 8,158.0 8,118.9 2,860.0 2,857.3 493.2 1,052.4 613.0 1,245.0 11.6 11.6 228.0 222.2 23.4 23.4 12,387.2 13,530.8New York 8,191.7 8,125.3 3,157.1 3,176.1 9,688.5 9,677.3 1,640.2 1,640.2 0.0 0.0 3,559.4 3,547.3 0.0 0.0 26,236.9 26,166.2Pennsylvania 10,586.6 10,068.7 1,680.3 1,679.5 4,942.9 3,511.1 11,281.0 12,732.0 67.0 67.0 1,608.7 1,610.9 105.8 101.8 30,272.3 29,771.0East North Central 20,206.5 17,138.0 26,536.1 26,515.8 4,204.4 3,906.3 59,492.3 61,604.1 247.6 247.6 2,641.3 2,657.8 1,092.9 1,165.9 114,421.1 113,235.5Illinois 3,580.2 3,576.8 10,388.3 10,313.3 288.9 290.9 13,966.0 14,015.1 0.0 0.0 674.2 677.2 36.5 114.5 28,934.1 28,987.8Indiana 3,753.0 2,406.0 3,355.8 3,413.2 729.1 725.9 15,761.4 15,773.8 0.0 0.0 237.8 237.8 619.3 614.3 24,456.4 23,171.0Michigan 4,421.0 4,294.5 3,977.6 3,977.7 2,387.6 2,134.7 9,218.7 9,414.2 47.2 47.2 488.4 498.4 250.0 250.0 20,790.5 20,616.7Ohio 5,704.0 4,117.8 5,442.1 5,431.7 188.2 157.3 14,605.4 15,263.6 142.0 142.0 636.5 640.0 187.1 187.1 26,905.3 25,939.5Wisconsin 2,748.3 2,742.9 3,372.3 3,379.9 610.6 597.5 5,940.8 7,137.4 58.4 58.4 604.4 604.4 0.0 0.0 13,334.8 14,520.5West North Central 6,635.2 6,641.9 11,739.3 11,378.7 4,581.0 4,369.3 34,009.5 34,625.1 32.0 32.0 3,845.2 4,044.9 8.4 8.4 60,850.6 61,100.3Iowa 1,774.7 1,774.7 1,266.6 1,192.9 655.6 675.2 5,391.4 5,548.8 32.0 32.0 798.1 961.7 0.0 0.0 9,918.4 10,185.3Kansas 266.0 266.0 2,148.3 2,154.0 2,096.7 2,113.2 4,714.2 4,714.2 0.0 0.0 550.6 548.0 0.0 0.0 9,775.8 9,795.4Minnesota 2,172.0 2,172.0 2,671.4 2,437.9 361.1 375.1 4,309.4 4,309.4 0.0 0.0 787.1 794.9 0.0 0.0 10,301.0 10,089.3Missouri 1,789.9 1,796.6 3,399.6 3,420.5 836.1 501.0 11,260.8 11,726.1 0.0 0.0 1,100.5 1,134.2 0.0 0.0 18,386.9 18,578.4Nebraska 342.6 342.6 1,150.8 1,150.8 511.2 584.5 3,817.3 3,817.3 0.0 0.0 321.2 320.3 0.0 0.0 6,143.1 6,215.5North Dakota 0.0 0.0 408.0 328.0 111.6 111.6 4,042.4 4,035.3 0.0 0.0 63.2 61.3 8.4 8.4 4,633.6 4,544.6South Dakota 290.0 290.0 694.6 694.6 8.7 8.7 474.0 474.0 0.0 0.0 224.5 224.5 0.0 0.0 1,691.8 1,691.8South Atlantic 54,499.9 52,646.5 32,702.8 32,359.1 7,317.0 7,272.4 55,186.3 56,870.7 83.8 83.8 10,408.0 10,511.6 135.0 135.0 160,332.8 159,879.1Delaware 1,512.0 1,512.0 317.2 315.2 843.1 877.7 410.0 410.0 0.0 0.0 114.1 114.1 135.0 135.0 3,331.4 3,364.0District of Columbia 0.0 0.0 9.0 9.0 0.0 0.0 0.0 0.0 0.0 0.0 0.0 0.0 0.0 0.0 9.0 9.0Florida 27,351.7 27,444.7 8,506.3 8,556.3 2,479.6 2,469.3 8,629.0 9,881.0 0.0 0.0 4,970.0 4,974.0 0.0 0.0 51,936.6 53,325.3Georgia 7,963.9 7,963.9 7,787.2 7,787.2 842.9 796.4 9,350.5 9,360.5 83.8 83.8 945.4 946.6 0.0 0.0 26,973.7 26,938.4Maryland 2,169.6 976.0 1,957.6 1,966.2 1,414.2 1,414.2 4,712.0 4,712.0 0.0 0.0 1,219.9 1,218.9 0.0 0.0 11,473.3 10,287.3North Carolina 4,724.8 4,724.8 6,045.1 5,957.7 0.0 0.0 10,536.8 10,536.8 0.0 0.0 337.6 385.6 0.0 0.0 21,644.3 21,604.9South Carolina 3,152.0 2,399.0 2,814.8 2,801.9 546.0 546.0 5,212.0 5,212.0 0.0 0.0 463.4 513.4 0.0 0.0 12,188.2 11,472.3Virginia 7,625.9 7,626.1 4,194.3 3,894.3 1,068.2 1,045.8 3,778.0 3,800.4 0.0 0.0 2,346.6 2,348.0 0.0 0.0 19,013.0 18,714.6West Virginia 0.0 0.0 1,071.3 1,071.3 123.0 123.0 12,558.0 12,958.0 0.0 0.0 11.0 11.0 0.0 0.0 13,763.3 14,163.3East South Central 21,537.7 20,197.9 12,646.9 13,002.4 5,114.8 5,371.9 25,795.5 26,980.5 0.0 0.0 142.0 142.0 19.8 19.8 65,256.7 65,714.5Alabama 9,471.9 9,441.4 2,532.2 2,532.2 1,959.3 1,941.4 6,283.4 6,283.4 0.0 0.0 42.6 42.6 19.8 19.8 20,309.2 20,260.8Kentucky 1,763.0 1,763.0 4,976.6 4,976.6 260.0 260.0 11,862.8 11,862.8 0.0 0.0 11.9 11.9 0.0 0.0 18,874.3 18,874.3Mississippi 7,847.7 7,590.5 1,357.6 1,718.9 2,829.3 3,104.3 1,804.0 1,820.0 0.0 0.0 44.3 44.3 0.0 0.0 13,882.9 14,278.0Tennessee 2,455.1 1,403.0 3,780.5 3,774.7 66.2 66.2 5,845.3 7,014.3 0.0 0.0 43.2 43.2 0.0 0.0 12,190.3 12,301.4West South Central 60,656.5 58,025.8 13,976.4 13,423.6 31,173.5 31,730.3 32,111.2 36,423.7 957.9 955.7 174.8 181.3 655.3 655.3 139,705.6 141,395.7Arkansas 4,566.0 4,620.5 702.8 702.8 802.0 793.7 5,110.0 5,116.0 0.0 0.0 12.2 12.2 0.0 0.0 11,193.0 11,245.2Louisiana 7,537.0 7,552.8 2,357.9 2,372.8 6,528.4 6,573.9 2,832.6 2,852.9 894.1 891.9 43.3 45.5 407.4 407.4 20,600.7 20,697.2Oklahoma 7,296.5 6,783.7 1,684.9 1,287.9 4,745.5 5,164.9 4,852.6 4,865.8 0.0 0.0 74.4 74.4 0.0 0.0 18,653.9 18,176.7Texas 41,257.0 39,068.8 9,230.8 9,060.1 19,097.6 19,197.8 19,316.0 23,589.0 63.8 63.8 44.9 49.2 247.9 247.9 89,258.0 91,276.6Mountain 22,483.8 22,483.8 8,638.9 8,659.0 3,663.9 3,341.9 26,989.0 28,367.6 52.0 52.0 356.3 370.8 107.4 111.6 62,291.3 63,386.7Arizona 9,891.6 9,891.6 2,367.6 2,367.6 1,303.6 1,303.6 5,754.0 5,754.0 0.0 0.0 90.5 90.5 0.0 0.0 19,407.3 19,407.3Colorado 3,240.5 3,240.5 2,572.3 2,572.3 639.0 329.0 4,499.0 5,035.0 0.0 0.0 168.4 168.4 0.0 0.0 11,119.2 11,345.2Idaho 547.7 547.7 552.0 562.1 14.0 14.0 8.5 8.5 0.0 0.0 5.4 5.4 0.0 0.0 1,127.6 1,137.7Montana 0.0 0.0 321.6 321.6 72.2 72.2 2,293.1 2,293.1 52.0 52.0 0.0 0.0 1.5 1.5 2,740.4 2,740.4Nevada 5,415.0 5,415.0 1,185.6 1,185.6 444.6 444.6 740.4 740.4 0.0 0.0 6.0 6.0 0.0 0.0 7,791.6 7,791.6New Mexico 1,465.0 1,465.0 966.0 976.0 849.4 849.4 2,634.0 3,471.0 0.0 0.0 52.4 66.9 0.0 0.0 5,966.8 6,828.3Utah 1,830.0 1,830.0 520.2 520.2 328.2 316.2 4,654.0 4,654.0 0.0 0.0 27.8 27.8 0.0 0.0 7,360.2 7,348.2Wyoming 94.0 94.0 153.6 153.6 12.9 12.9 6,406.0 6,411.6 0.0 0.0 5.8 5.8 105.9 110.1 6,778.2 6,788.0Pacific Contiguous 25,977.9 25,979.2 11,531.8 11,790.3 8,422.0 8,877.0 1,982.0 1,982.0 17.0 17.0 470.9 485.3 221.4 229.3 48,623.0 49,360.1California 19,949.4 19,962.8 10,678.6 10,937.1 8,166.0 8,621.0 57.0 57.0 17.0 17.0 455.7 470.1 221.4 229.3 39,545.1 40,294.3Oregon 3,374.9 3,374.9 133.8 133.8 224.4 224.4 585.0 585.0 0.0 0.0 0.0 0.0 0.0 0.0 4,318.1 4,318.1Washington 2,653.6 2,641.5 719.4 719.4 31.6 31.6 1,340.0 1,340.0 0.0 0.0 15.2 15.2 0.0 0.0 4,759.8 4,747.7Pacific Noncontiguous 479.2 479.2 626.3 626.3 175.0 175.0 332.8 333.8 0.0 0.0 2,600.2 2,595.9 6.4 6.4 4,219.9 4,216.6Alaska 479.2 479.2 626.3 626.3 175.0 175.0 152.8 153.8 0.0 0.0 728.3 725.1 0.0 0.0 2,161.6 2,159.4Hawaii 0.0 0.0 0.0 0.0 0.0 0.0 180.0 180.0 0.0 0.0 1,871.9 1,870.8 6.4 6.4 2,058.3 2,057.2U.S. Total 251,310.8 241,954.0 127,207.9 126,557.0 81,371.0 80,336.6 250,350.1 264,760.0 1,468.9 1,466.7 31,740.6 32,961.0 2,375.8 2,456.9 745,825.1 750,492.2
NM = Not meaningful due to large relative standard error.Values are preliminary.
NOTES:Capacity from facilities with a total generator nameplate capacity less than 1 MW are excluded from this report. This exclusion may represent a significant portion of existing or planned capacity for some technologies such as solar photovoltaic generation.
Sources: U.S. Energy Information Administration, Form EIA-860, 'Annual Electric Generator Report' and Form EIA-860M, 'Monthly Update to the Annual Electric Generator Report.'
Table 6.2.C. Net Summer Capacity of Utility Scale Units Using Primarily Fossil Fuels and by State, April 2018 and 2017 (Megawatts)Natural Gas FiredCombined Cycle
Natural Gas FiredCombustion Turbine Other Natural Gas Coal
PetroleumCoke
PetroleumLiquids Other Gases
TotalFossil Fuels
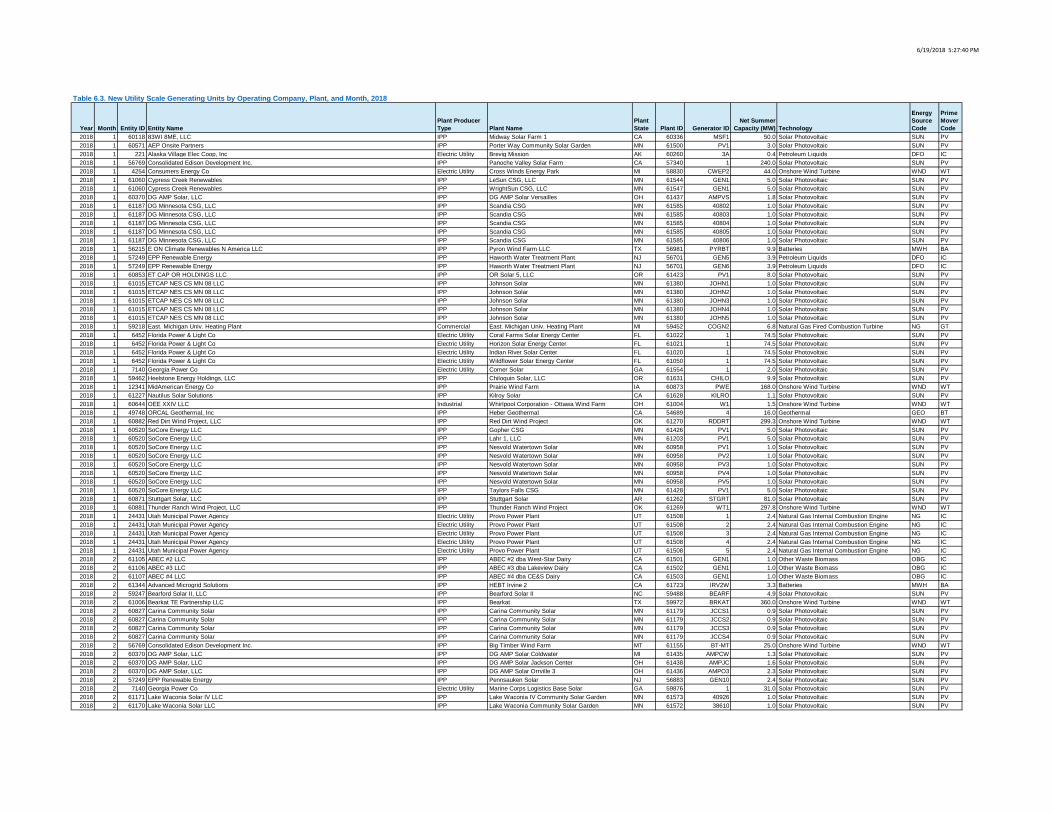
6/19/2018 5:27:40 PM
Year Month Entity ID Entity NamePlant Producer Type Plant Name
Plant State Plant ID Generator ID
Net Summer Capacity (MW) Technology
Energy Source Code
Prime Mover Code
2018 1 60118 83WI 8ME, LLC IPP Midway Solar Farm 1 CA 60336 MSF1 50.0 Solar Photovoltaic SUN PV2018 1 60571 AEP Onsite Partners IPP Porter Way Community Solar Garden MN 61500 PV1 3.0 Solar Photovoltaic SUN PV2018 1 221 Alaska Village Elec Coop, Inc Electric Utility Brevig Mission AK 60260 3A 0.4 Petroleum Liquids DFO IC2018 1 56769 Consolidated Edison Development Inc. IPP Panoche Valley Solar Farm CA 57340 1 240.0 Solar Photovoltaic SUN PV2018 1 4254 Consumers Energy Co Electric Utility Cross Winds Energy Park MI 58830 CWEP2 44.0 Onshore Wind Turbine WND WT2018 1 61060 Cypress Creek Renewables IPP LeSun CSG, LLC MN 61544 GEN1 5.0 Solar Photovoltaic SUN PV2018 1 61060 Cypress Creek Renewables IPP WrightSun CSG, LLC MN 61547 GEN1 5.0 Solar Photovoltaic SUN PV2018 1 60370 DG AMP Solar, LLC IPP DG AMP Solar Versailles OH 61437 AMPVS 1.8 Solar Photovoltaic SUN PV2018 1 61187 DG Minnesota CSG, LLC IPP Scandia CSG MN 61585 40802 1.0 Solar Photovoltaic SUN PV2018 1 61187 DG Minnesota CSG, LLC IPP Scandia CSG MN 61585 40803 1.0 Solar Photovoltaic SUN PV2018 1 61187 DG Minnesota CSG, LLC IPP Scandia CSG MN 61585 40804 1.0 Solar Photovoltaic SUN PV2018 1 61187 DG Minnesota CSG, LLC IPP Scandia CSG MN 61585 40805 1.0 Solar Photovoltaic SUN PV2018 1 61187 DG Minnesota CSG, LLC IPP Scandia CSG MN 61585 40806 1.0 Solar Photovoltaic SUN PV2018 1 56215 E ON Climate Renewables N America LLC IPP Pyron Wind Farm LLC TX 56981 PYRBT 9.9 Batteries MWH BA2018 1 57249 EPP Renewable Energy IPP Haworth Water Treatment Plant NJ 56701 GEN5 3.9 Petroleum Liquids DFO IC2018 1 57249 EPP Renewable Energy IPP Haworth Water Treatment Plant NJ 56701 GEN6 3.9 Petroleum Liquids DFO IC2018 1 60853 ET CAP OR HOLDINGS LLC IPP OR Solar 5, LLC OR 61423 PV1 8.0 Solar Photovoltaic SUN PV2018 1 61015 ETCAP NES CS MN 08 LLC IPP Johnson Solar MN 61380 JOHN1 1.0 Solar Photovoltaic SUN PV2018 1 61015 ETCAP NES CS MN 08 LLC IPP Johnson Solar MN 61380 JOHN2 1.0 Solar Photovoltaic SUN PV2018 1 61015 ETCAP NES CS MN 08 LLC IPP Johnson Solar MN 61380 JOHN3 1.0 Solar Photovoltaic SUN PV2018 1 61015 ETCAP NES CS MN 08 LLC IPP Johnson Solar MN 61380 JOHN4 1.0 Solar Photovoltaic SUN PV2018 1 61015 ETCAP NES CS MN 08 LLC IPP Johnson Solar MN 61380 JOHN5 1.0 Solar Photovoltaic SUN PV2018 1 59218 East. Michigan Univ. Heating Plant Commercial East. Michigan Univ. Heating Plant MI 59452 COGN2 6.8 Natural Gas Fired Combustion Turbine NG GT2018 1 6452 Florida Power & Light Co Electric Utility Coral Farms Solar Energy Center FL 61022 1 74.5 Solar Photovoltaic SUN PV2018 1 6452 Florida Power & Light Co Electric Utility Horizon Solar Energy Center FL 61021 1 74.5 Solar Photovoltaic SUN PV2018 1 6452 Florida Power & Light Co Electric Utility Indian River Solar Center FL 61020 1 74.5 Solar Photovoltaic SUN PV2018 1 6452 Florida Power & Light Co Electric Utility Wildflower Solar Energy Center FL 61050 1 74.5 Solar Photovoltaic SUN PV2018 1 7140 Georgia Power Co Electric Utility Comer Solar GA 61554 1 2.0 Solar Photovoltaic SUN PV2018 1 59462 Heelstone Energy Holdings, LLC IPP Chiloquin Solar, LLC OR 61631 CHILO 9.9 Solar Photovoltaic SUN PV2018 1 12341 MidAmerican Energy Co IPP Prairie Wind Farm IA 60873 PWE 168.0 Onshore Wind Turbine WND WT2018 1 61227 Nautilus Solar Solutions IPP Kilroy Solar CA 61628 KILRO 1.1 Solar Photovoltaic SUN PV2018 1 60644 OEE XXIV LLC Industrial Whirlpool Corporation - Ottawa Wind Farm OH 61004 W1 1.5 Onshore Wind Turbine WND WT2018 1 49748 ORCAL Geothermal, Inc IPP Heber Geothermal CA 54689 4 16.0 Geothermal GEO BT2018 1 60882 Red Dirt Wind Project, LLC IPP Red Dirt Wind Project OK 61270 RDDRT 299.3 Onshore Wind Turbine WND WT2018 1 60520 SoCore Energy LLC IPP Gopher CSG MN 61426 PV1 5.0 Solar Photovoltaic SUN PV2018 1 60520 SoCore Energy LLC IPP Lahr 1, LLC MN 61203 PV1 5.0 Solar Photovoltaic SUN PV2018 1 60520 SoCore Energy LLC IPP Nesvold Watertown Solar MN 60958 PV1 1.0 Solar Photovoltaic SUN PV2018 1 60520 SoCore Energy LLC IPP Nesvold Watertown Solar MN 60958 PV2 1.0 Solar Photovoltaic SUN PV2018 1 60520 SoCore Energy LLC IPP Nesvold Watertown Solar MN 60958 PV3 1.0 Solar Photovoltaic SUN PV2018 1 60520 SoCore Energy LLC IPP Nesvold Watertown Solar MN 60958 PV4 1.0 Solar Photovoltaic SUN PV2018 1 60520 SoCore Energy LLC IPP Nesvold Watertown Solar MN 60958 PV5 1.0 Solar Photovoltaic SUN PV2018 1 60520 SoCore Energy LLC IPP Taylors Falls CSG MN 61428 PV1 5.0 Solar Photovoltaic SUN PV2018 1 60871 Stuttgart Solar, LLC IPP Stuttgart Solar AR 61262 STGRT 81.0 Solar Photovoltaic SUN PV2018 1 60881 Thunder Ranch Wind Project, LLC IPP Thunder Ranch Wind Project OK 61269 WT1 297.8 Onshore Wind Turbine WND WT2018 1 24431 Utah Municipal Power Agency Electric Utility Provo Power Plant UT 61508 1 2.4 Natural Gas Internal Combustion Engine NG IC2018 1 24431 Utah Municipal Power Agency Electric Utility Provo Power Plant UT 61508 2 2.4 Natural Gas Internal Combustion Engine NG IC2018 1 24431 Utah Municipal Power Agency Electric Utility Provo Power Plant UT 61508 3 2.4 Natural Gas Internal Combustion Engine NG IC2018 1 24431 Utah Municipal Power Agency Electric Utility Provo Power Plant UT 61508 4 2.4 Natural Gas Internal Combustion Engine NG IC2018 1 24431 Utah Municipal Power Agency Electric Utility Provo Power Plant UT 61508 5 2.4 Natural Gas Internal Combustion Engine NG IC2018 2 61105 ABEC #2 LLC IPP ABEC #2 dba West-Star Dairy CA 61501 GEN1 1.0 Other Waste Biomass OBG IC2018 2 61106 ABEC #3 LLC IPP ABEC #3 dba Lakeview Dairy CA 61502 GEN1 1.0 Other Waste Biomass OBG IC2018 2 61107 ABEC #4 LLC IPP ABEC #4 dba CE&S Dairy CA 61503 GEN1 1.0 Other Waste Biomass OBG IC2018 2 61344 Advanced Microgrid Solutions IPP HEBT Irvine 2 CA 61723 IRV2W 3.3 Batteries MWH BA2018 2 59247 Bearford Solar II, LLC IPP Bearford Solar II NC 59488 BEARF 4.9 Solar Photovoltaic SUN PV2018 2 61006 Bearkat TE Partnership LLC IPP Bearkat TX 59972 BRKAT 360.0 Onshore Wind Turbine WND WT2018 2 60827 Carina Community Solar IPP Carina Community Solar MN 61179 JCCS1 0.9 Solar Photovoltaic SUN PV2018 2 60827 Carina Community Solar IPP Carina Community Solar MN 61179 JCCS2 0.9 Solar Photovoltaic SUN PV2018 2 60827 Carina Community Solar IPP Carina Community Solar MN 61179 JCCS3 0.9 Solar Photovoltaic SUN PV2018 2 60827 Carina Community Solar IPP Carina Community Solar MN 61179 JCCS4 0.9 Solar Photovoltaic SUN PV2018 2 56769 Consolidated Edison Development Inc. IPP Big Timber Wind Farm MT 61155 BT-MT 25.0 Onshore Wind Turbine WND WT2018 2 60370 DG AMP Solar, LLC IPP DG AMP Solar Coldwater MI 61435 AMPCW 1.3 Solar Photovoltaic SUN PV2018 2 60370 DG AMP Solar, LLC IPP DG AMP Solar Jackson Center OH 61438 AMPJC 1.6 Solar Photovoltaic SUN PV2018 2 60370 DG AMP Solar, LLC IPP DG AMP Solar Orrville 3 OH 61436 AMPO3 2.3 Solar Photovoltaic SUN PV2018 2 57249 EPP Renewable Energy IPP Pennsauken Solar NJ 56883 GEN10 2.4 Solar Photovoltaic SUN PV2018 2 7140 Georgia Power Co Electric Utility Marine Corps Logistics Base Solar GA 59876 1 31.0 Solar Photovoltaic SUN PV2018 2 61171 Lake Waconia Solar IV LLC IPP Lake Waconia IV Community Solar Garden MN 61573 40926 1.0 Solar Photovoltaic SUN PV2018 2 61170 Lake Waconia Solar LLC IPP Lake Waconia Community Solar Garden MN 61572 38610 1.0 Solar Photovoltaic SUN PV
Table 6.3. New Utility Scale Generating Units by Operating Company, Plant, and Month, 2018
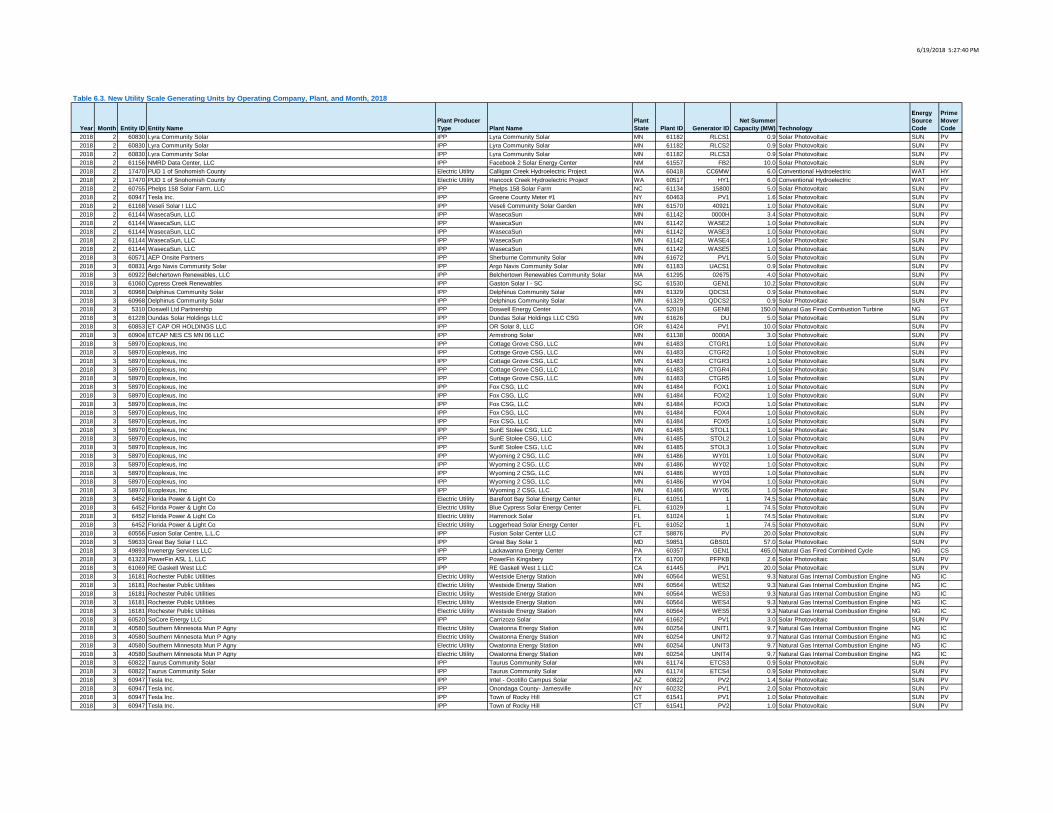
6/19/2018 5:27:40 PM
Year Month Entity ID Entity NamePlant Producer Type Plant Name
Plant State Plant ID Generator ID
Net Summer Capacity (MW) Technology
Energy Source Code
Prime Mover Code
Table 6.3. New Utility Scale Generating Units by Operating Company, Plant, and Month, 2018
2018 2 60830 Lyra Community Solar IPP Lyra Community Solar MN 61182 RLCS1 0.9 Solar Photovoltaic SUN PV2018 2 60830 Lyra Community Solar IPP Lyra Community Solar MN 61182 RLCS2 0.9 Solar Photovoltaic SUN PV2018 2 60830 Lyra Community Solar IPP Lyra Community Solar MN 61182 RLCS3 0.9 Solar Photovoltaic SUN PV2018 2 61156 NMRD Data Center, LLC IPP Facebook 2 Solar Energy Center NM 61557 FB2 10.0 Solar Photovoltaic SUN PV2018 2 17470 PUD 1 of Snohomish County Electric Utility Calligan Creek Hydroelectric Project WA 60418 CC6MW 6.0 Conventional Hydroelectric WAT HY2018 2 17470 PUD 1 of Snohomish County Electric Utility Hancock Creek Hydroelectric Project WA 60517 HY1 6.0 Conventional Hydroelectric WAT HY2018 2 60755 Phelps 158 Solar Farm, LLC IPP Phelps 158 Solar Farm NC 61134 15800 5.0 Solar Photovoltaic SUN PV2018 2 60947 Tesla Inc. IPP Greene County Meter #1 NY 60463 PV1 1.6 Solar Photovoltaic SUN PV2018 2 61168 Veseli Solar I LLC IPP Veseli Community Solar Garden MN 61570 40921 1.0 Solar Photovoltaic SUN PV2018 2 61144 WasecaSun, LLC IPP WasecaSun MN 61142 0000H 3.4 Solar Photovoltaic SUN PV2018 2 61144 WasecaSun, LLC IPP WasecaSun MN 61142 WASE2 1.0 Solar Photovoltaic SUN PV2018 2 61144 WasecaSun, LLC IPP WasecaSun MN 61142 WASE3 1.0 Solar Photovoltaic SUN PV2018 2 61144 WasecaSun, LLC IPP WasecaSun MN 61142 WASE4 1.0 Solar Photovoltaic SUN PV2018 2 61144 WasecaSun, LLC IPP WasecaSun MN 61142 WASE5 1.0 Solar Photovoltaic SUN PV2018 3 60571 AEP Onsite Partners IPP Sherburne Community Solar MN 61672 PV1 5.0 Solar Photovoltaic SUN PV2018 3 60831 Argo Navis Community Solar IPP Argo Navis Community Solar MN 61183 UACS1 0.9 Solar Photovoltaic SUN PV2018 3 60922 Belchertown Renewables, LLC IPP Belchertown Renewables Community Solar MA 61295 02675 4.0 Solar Photovoltaic SUN PV2018 3 61060 Cypress Creek Renewables IPP Gaston Solar I - SC SC 61530 GEN1 10.2 Solar Photovoltaic SUN PV2018 3 60968 Delphinus Community Solar IPP Delphinus Community Solar MN 61329 QDCS1 0.9 Solar Photovoltaic SUN PV2018 3 60968 Delphinus Community Solar IPP Delphinus Community Solar MN 61329 QDCS2 0.9 Solar Photovoltaic SUN PV2018 3 5310 Doswell Ltd Partnership IPP Doswell Energy Center VA 52019 GEN8 150.0 Natural Gas Fired Combustion Turbine NG GT2018 3 61228 Dundas Solar Holdings LLC IPP Dundas Solar Holdings LLC CSG MN 61626 DU 5.0 Solar Photovoltaic SUN PV2018 3 60853 ET CAP OR HOLDINGS LLC IPP OR Solar 8, LLC OR 61424 PV1 10.0 Solar Photovoltaic SUN PV2018 3 60904 ETCAP NES CS MN 06 LLC IPP Armstrong Solar MN 61138 0000A 3.0 Solar Photovoltaic SUN PV2018 3 58970 Ecoplexus, Inc IPP Cottage Grove CSG, LLC MN 61483 CTGR1 1.0 Solar Photovoltaic SUN PV2018 3 58970 Ecoplexus, Inc IPP Cottage Grove CSG, LLC MN 61483 CTGR2 1.0 Solar Photovoltaic SUN PV2018 3 58970 Ecoplexus, Inc IPP Cottage Grove CSG, LLC MN 61483 CTGR3 1.0 Solar Photovoltaic SUN PV2018 3 58970 Ecoplexus, Inc IPP Cottage Grove CSG, LLC MN 61483 CTGR4 1.0 Solar Photovoltaic SUN PV2018 3 58970 Ecoplexus, Inc IPP Cottage Grove CSG, LLC MN 61483 CTGR5 1.0 Solar Photovoltaic SUN PV2018 3 58970 Ecoplexus, Inc IPP Fox CSG, LLC MN 61484 FOX1 1.0 Solar Photovoltaic SUN PV2018 3 58970 Ecoplexus, Inc IPP Fox CSG, LLC MN 61484 FOX2 1.0 Solar Photovoltaic SUN PV2018 3 58970 Ecoplexus, Inc IPP Fox CSG, LLC MN 61484 FOX3 1.0 Solar Photovoltaic SUN PV2018 3 58970 Ecoplexus, Inc IPP Fox CSG, LLC MN 61484 FOX4 1.0 Solar Photovoltaic SUN PV2018 3 58970 Ecoplexus, Inc IPP Fox CSG, LLC MN 61484 FOX5 1.0 Solar Photovoltaic SUN PV2018 3 58970 Ecoplexus, Inc IPP SunE Stolee CSG, LLC MN 61485 STOL1 1.0 Solar Photovoltaic SUN PV2018 3 58970 Ecoplexus, Inc IPP SunE Stolee CSG, LLC MN 61485 STOL2 1.0 Solar Photovoltaic SUN PV2018 3 58970 Ecoplexus, Inc IPP SunE Stolee CSG, LLC MN 61485 STOL3 1.0 Solar Photovoltaic SUN PV2018 3 58970 Ecoplexus, Inc IPP Wyoming 2 CSG, LLC MN 61486 WY01 1.0 Solar Photovoltaic SUN PV2018 3 58970 Ecoplexus, Inc IPP Wyoming 2 CSG, LLC MN 61486 WY02 1.0 Solar Photovoltaic SUN PV2018 3 58970 Ecoplexus, Inc IPP Wyoming 2 CSG, LLC MN 61486 WY03 1.0 Solar Photovoltaic SUN PV2018 3 58970 Ecoplexus, Inc IPP Wyoming 2 CSG, LLC MN 61486 WY04 1.0 Solar Photovoltaic SUN PV2018 3 58970 Ecoplexus, Inc IPP Wyoming 2 CSG, LLC MN 61486 WY05 1.0 Solar Photovoltaic SUN PV2018 3 6452 Florida Power & Light Co Electric Utility Barefoot Bay Solar Energy Center FL 61051 1 74.5 Solar Photovoltaic SUN PV2018 3 6452 Florida Power & Light Co Electric Utility Blue Cypress Solar Energy Center FL 61029 1 74.5 Solar Photovoltaic SUN PV2018 3 6452 Florida Power & Light Co Electric Utility Hammock Solar FL 61024 1 74.5 Solar Photovoltaic SUN PV2018 3 6452 Florida Power & Light Co Electric Utility Loggerhead Solar Energy Center FL 61052 1 74.5 Solar Photovoltaic SUN PV2018 3 60556 Fusion Solar Centre, L.L.C IPP Fusion Solar Center LLC CT 58876 PV 20.0 Solar Photovoltaic SUN PV2018 3 59633 Great Bay Solar I LLC IPP Great Bay Solar 1 MD 59851 GBS01 57.0 Solar Photovoltaic SUN PV2018 3 49893 Invenergy Services LLC IPP Lackawanna Energy Center PA 60357 GEN1 465.0 Natural Gas Fired Combined Cycle NG CS2018 3 61323 PowerFin ASL 1, LLC IPP PowerFin Kingsbery TX 61700 PFPKB 2.6 Solar Photovoltaic SUN PV2018 3 61069 RE Gaskell West LLC IPP RE Gaskell West 1 LLC CA 61445 PV1 20.0 Solar Photovoltaic SUN PV2018 3 16181 Rochester Public Utilities Electric Utility Westside Energy Station MN 60564 WES1 9.3 Natural Gas Internal Combustion Engine NG IC2018 3 16181 Rochester Public Utilities Electric Utility Westside Energy Station MN 60564 WES2 9.3 Natural Gas Internal Combustion Engine NG IC2018 3 16181 Rochester Public Utilities Electric Utility Westside Energy Station MN 60564 WES3 9.3 Natural Gas Internal Combustion Engine NG IC2018 3 16181 Rochester Public Utilities Electric Utility Westside Energy Station MN 60564 WES4 9.3 Natural Gas Internal Combustion Engine NG IC2018 3 16181 Rochester Public Utilities Electric Utility Westside Energy Station MN 60564 WES5 9.3 Natural Gas Internal Combustion Engine NG IC2018 3 60520 SoCore Energy LLC IPP Carrizozo Solar NM 61662 PV1 3.0 Solar Photovoltaic SUN PV2018 3 40580 Southern Minnesota Mun P Agny Electric Utility Owatonna Energy Station MN 60254 UNIT1 9.7 Natural Gas Internal Combustion Engine NG IC2018 3 40580 Southern Minnesota Mun P Agny Electric Utility Owatonna Energy Station MN 60254 UNIT2 9.7 Natural Gas Internal Combustion Engine NG IC2018 3 40580 Southern Minnesota Mun P Agny Electric Utility Owatonna Energy Station MN 60254 UNIT3 9.7 Natural Gas Internal Combustion Engine NG IC2018 3 40580 Southern Minnesota Mun P Agny Electric Utility Owatonna Energy Station MN 60254 UNIT4 9.7 Natural Gas Internal Combustion Engine NG IC2018 3 60822 Taurus Community Solar IPP Taurus Community Solar MN 61174 ETCS3 0.9 Solar Photovoltaic SUN PV2018 3 60822 Taurus Community Solar IPP Taurus Community Solar MN 61174 ETCS4 0.9 Solar Photovoltaic SUN PV2018 3 60947 Tesla Inc. IPP Intel - Ocotillo Campus Solar AZ 60822 PV2 1.4 Solar Photovoltaic SUN PV2018 3 60947 Tesla Inc. IPP Onondaga County- Jamesville NY 60232 PV1 2.0 Solar Photovoltaic SUN PV2018 3 60947 Tesla Inc. IPP Town of Rocky Hill CT 61541 PV1 1.0 Solar Photovoltaic SUN PV2018 3 60947 Tesla Inc. IPP Town of Rocky Hill CT 61541 PV2 1.0 Solar Photovoltaic SUN PV
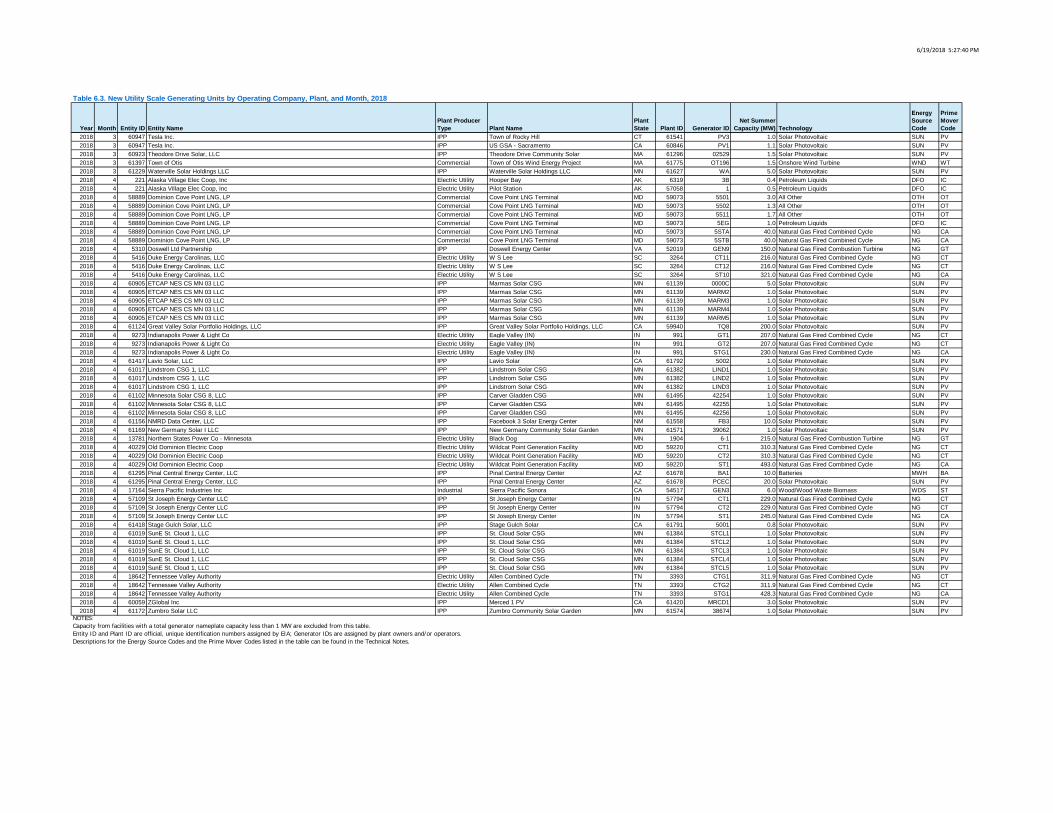
6/19/2018 5:27:40 PM
Year Month Entity ID Entity NamePlant Producer Type Plant Name
Plant State Plant ID Generator ID
Net Summer Capacity (MW) Technology
Energy Source Code
Prime Mover Code
Table 6.3. New Utility Scale Generating Units by Operating Company, Plant, and Month, 2018
2018 3 60947 Tesla Inc. IPP Town of Rocky Hill CT 61541 PV3 1.0 Solar Photovoltaic SUN PV2018 3 60947 Tesla Inc. IPP US GSA - Sacramento CA 60846 PV1 1.1 Solar Photovoltaic SUN PV2018 3 60923 Theodore Drive Solar, LLC IPP Theodore Drive Community Solar MA 61296 02529 1.5 Solar Photovoltaic SUN PV2018 3 61397 Town of Otis Commercial Town of Otis Wind Energy Project MA 61775 OT196 1.5 Onshore Wind Turbine WND WT2018 3 61229 Waterville Solar Holdings LLC IPP Waterville Solar Holdings LLC MN 61627 WA 5.0 Solar Photovoltaic SUN PV2018 4 221 Alaska Village Elec Coop, Inc Electric Utility Hooper Bay AK 6319 3B 0.4 Petroleum Liquids DFO IC2018 4 221 Alaska Village Elec Coop, Inc Electric Utility Pilot Station AK 57058 1 0.5 Petroleum Liquids DFO IC2018 4 58889 Dominion Cove Point LNG, LP Commercial Cove Point LNG Terminal MD 59073 5501 3.0 All Other OTH OT2018 4 58889 Dominion Cove Point LNG, LP Commercial Cove Point LNG Terminal MD 59073 5502 1.3 All Other OTH OT2018 4 58889 Dominion Cove Point LNG, LP Commercial Cove Point LNG Terminal MD 59073 5511 1.7 All Other OTH OT2018 4 58889 Dominion Cove Point LNG, LP Commercial Cove Point LNG Terminal MD 59073 5EG 1.0 Petroleum Liquids DFO IC2018 4 58889 Dominion Cove Point LNG, LP Commercial Cove Point LNG Terminal MD 59073 5STA 40.0 Natural Gas Fired Combined Cycle NG CA2018 4 58889 Dominion Cove Point LNG, LP Commercial Cove Point LNG Terminal MD 59073 5STB 40.0 Natural Gas Fired Combined Cycle NG CA2018 4 5310 Doswell Ltd Partnership IPP Doswell Energy Center VA 52019 GEN9 150.0 Natural Gas Fired Combustion Turbine NG GT2018 4 5416 Duke Energy Carolinas, LLC Electric Utility W S Lee SC 3264 CT11 216.0 Natural Gas Fired Combined Cycle NG CT2018 4 5416 Duke Energy Carolinas, LLC Electric Utility W S Lee SC 3264 CT12 216.0 Natural Gas Fired Combined Cycle NG CT2018 4 5416 Duke Energy Carolinas, LLC Electric Utility W S Lee SC 3264 ST10 321.0 Natural Gas Fired Combined Cycle NG CA2018 4 60905 ETCAP NES CS MN 03 LLC IPP Marmas Solar CSG MN 61139 0000C 5.0 Solar Photovoltaic SUN PV2018 4 60905 ETCAP NES CS MN 03 LLC IPP Marmas Solar CSG MN 61139 MARM2 1.0 Solar Photovoltaic SUN PV2018 4 60905 ETCAP NES CS MN 03 LLC IPP Marmas Solar CSG MN 61139 MARM3 1.0 Solar Photovoltaic SUN PV2018 4 60905 ETCAP NES CS MN 03 LLC IPP Marmas Solar CSG MN 61139 MARM4 1.0 Solar Photovoltaic SUN PV2018 4 60905 ETCAP NES CS MN 03 LLC IPP Marmas Solar CSG MN 61139 MARM5 1.0 Solar Photovoltaic SUN PV2018 4 61124 Great Valley Solar Portfolio Holdings, LLC IPP Great Valley Solar Portfolio Holdings, LLC CA 59940 TQ8 200.0 Solar Photovoltaic SUN PV2018 4 9273 Indianapolis Power & Light Co Electric Utility Eagle Valley (IN) IN 991 GT1 207.0 Natural Gas Fired Combined Cycle NG CT2018 4 9273 Indianapolis Power & Light Co Electric Utility Eagle Valley (IN) IN 991 GT2 207.0 Natural Gas Fired Combined Cycle NG CT2018 4 9273 Indianapolis Power & Light Co Electric Utility Eagle Valley (IN) IN 991 STG1 230.0 Natural Gas Fired Combined Cycle NG CA2018 4 61417 Lavio Solar, LLC IPP Lavio Solar CA 61792 5002 1.0 Solar Photovoltaic SUN PV2018 4 61017 Lindstrom CSG 1, LLC IPP Lindstrom Solar CSG MN 61382 LIND1 1.0 Solar Photovoltaic SUN PV2018 4 61017 Lindstrom CSG 1, LLC IPP Lindstrom Solar CSG MN 61382 LIND2 1.0 Solar Photovoltaic SUN PV2018 4 61017 Lindstrom CSG 1, LLC IPP Lindstrom Solar CSG MN 61382 LIND3 1.0 Solar Photovoltaic SUN PV2018 4 61102 Minnesota Solar CSG 8, LLC IPP Carver Gladden CSG MN 61495 42254 1.0 Solar Photovoltaic SUN PV2018 4 61102 Minnesota Solar CSG 8, LLC IPP Carver Gladden CSG MN 61495 42255 1.0 Solar Photovoltaic SUN PV2018 4 61102 Minnesota Solar CSG 8, LLC IPP Carver Gladden CSG MN 61495 42256 1.0 Solar Photovoltaic SUN PV2018 4 61156 NMRD Data Center, LLC IPP Facebook 3 Solar Energy Center NM 61558 FB3 10.0 Solar Photovoltaic SUN PV2018 4 61169 New Germany Solar I LLC IPP New Germany Community Solar Garden MN 61571 39062 1.0 Solar Photovoltaic SUN PV2018 4 13781 Northern States Power Co - Minnesota Electric Utility Black Dog MN 1904 6-1 215.0 Natural Gas Fired Combustion Turbine NG GT2018 4 40229 Old Dominion Electric Coop Electric Utility Wildcat Point Generation Facility MD 59220 CT1 310.3 Natural Gas Fired Combined Cycle NG CT2018 4 40229 Old Dominion Electric Coop Electric Utility Wildcat Point Generation Facility MD 59220 CT2 310.3 Natural Gas Fired Combined Cycle NG CT2018 4 40229 Old Dominion Electric Coop Electric Utility Wildcat Point Generation Facility MD 59220 ST1 493.0 Natural Gas Fired Combined Cycle NG CA2018 4 61295 Pinal Central Energy Center, LLC IPP Pinal Central Energy Center AZ 61678 BA1 10.0 Batteries MWH BA2018 4 61295 Pinal Central Energy Center, LLC IPP Pinal Central Energy Center AZ 61678 PCEC 20.0 Solar Photovoltaic SUN PV2018 4 17164 Sierra Pacific Industries Inc Industrial Sierra Pacific Sonora CA 54517 GEN3 6.0 Wood/Wood Waste Biomass WDS ST2018 4 57109 St Joseph Energy Center LLC IPP St Joseph Energy Center IN 57794 CT1 229.0 Natural Gas Fired Combined Cycle NG CT2018 4 57109 St Joseph Energy Center LLC IPP St Joseph Energy Center IN 57794 CT2 229.0 Natural Gas Fired Combined Cycle NG CT2018 4 57109 St Joseph Energy Center LLC IPP St Joseph Energy Center IN 57794 ST1 245.0 Natural Gas Fired Combined Cycle NG CA2018 4 61418 Stage Gulch Solar, LLC IPP Stage Gulch Solar CA 61791 5001 0.8 Solar Photovoltaic SUN PV2018 4 61019 SunE St. Cloud 1, LLC IPP St. Cloud Solar CSG MN 61384 STCL1 1.0 Solar Photovoltaic SUN PV2018 4 61019 SunE St. Cloud 1, LLC IPP St. Cloud Solar CSG MN 61384 STCL2 1.0 Solar Photovoltaic SUN PV2018 4 61019 SunE St. Cloud 1, LLC IPP St. Cloud Solar CSG MN 61384 STCL3 1.0 Solar Photovoltaic SUN PV2018 4 61019 SunE St. Cloud 1, LLC IPP St. Cloud Solar CSG MN 61384 STCL4 1.0 Solar Photovoltaic SUN PV2018 4 61019 SunE St. Cloud 1, LLC IPP St. Cloud Solar CSG MN 61384 STCL5 1.0 Solar Photovoltaic SUN PV2018 4 18642 Tennessee Valley Authority Electric Utility Allen Combined Cycle TN 3393 CTG1 311.9 Natural Gas Fired Combined Cycle NG CT2018 4 18642 Tennessee Valley Authority Electric Utility Allen Combined Cycle TN 3393 CTG2 311.9 Natural Gas Fired Combined Cycle NG CT2018 4 18642 Tennessee Valley Authority Electric Utility Allen Combined Cycle TN 3393 STG1 428.3 Natural Gas Fired Combined Cycle NG CA2018 4 60059 ZGlobal Inc IPP Merced 1 PV CA 61420 MRCD1 3.0 Solar Photovoltaic SUN PV2018 4 61172 Zumbro Solar LLC IPP Zumbro Community Solar Garden MN 61574 38674 1.0 Solar Photovoltaic SUN PV
NOTES:Capacity from facilities with a total generator nameplate capacity less than 1 MW are excluded from this table.Entity ID and Plant ID are official, unique identification numbers assigned by EIA; Generator IDs are assigned by plant owners and/or operators.Descriptions for the Energy Source Codes and the Prime Mover Codes listed in the table can be found in the Technical Notes.
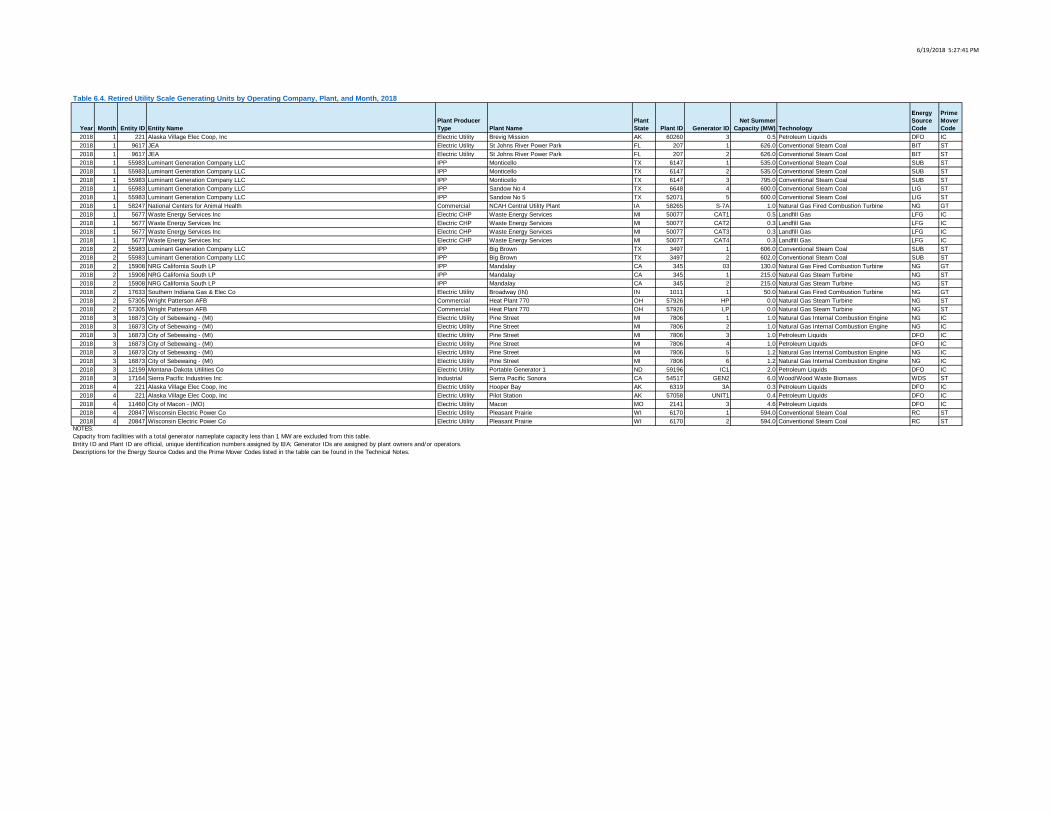
6/19/2018 5:27:41 PM
Year Month Entity ID Entity NamePlant Producer Type Plant Name
Plant State Plant ID Generator ID
Net Summer Capacity (MW) Technology
Energy Source Code
Prime Mover Code
2018 1 221 Alaska Village Elec Coop, Inc Electric Utility Brevig Mission AK 60260 3 0.5 Petroleum Liquids DFO IC2018 1 9617 JEA Electric Utility St Johns River Power Park FL 207 1 626.0 Conventional Steam Coal BIT ST2018 1 9617 JEA Electric Utility St Johns River Power Park FL 207 2 626.0 Conventional Steam Coal BIT ST2018 1 55983 Luminant Generation Company LLC IPP Monticello TX 6147 1 535.0 Conventional Steam Coal SUB ST2018 1 55983 Luminant Generation Company LLC IPP Monticello TX 6147 2 535.0 Conventional Steam Coal SUB ST2018 1 55983 Luminant Generation Company LLC IPP Monticello TX 6147 3 795.0 Conventional Steam Coal SUB ST2018 1 55983 Luminant Generation Company LLC IPP Sandow No 4 TX 6648 4 600.0 Conventional Steam Coal LIG ST2018 1 55983 Luminant Generation Company LLC IPP Sandow No 5 TX 52071 5 600.0 Conventional Steam Coal LIG ST2018 1 58247 National Centers for Animal Health Commercial NCAH Central Utility Plant IA 58265 S-7A 1.0 Natural Gas Fired Combustion Turbine NG GT2018 1 5677 Waste Energy Services Inc Electric CHP Waste Energy Services MI 50077 CAT1 0.5 Landfill Gas LFG IC2018 1 5677 Waste Energy Services Inc Electric CHP Waste Energy Services MI 50077 CAT2 0.3 Landfill Gas LFG IC2018 1 5677 Waste Energy Services Inc Electric CHP Waste Energy Services MI 50077 CAT3 0.3 Landfill Gas LFG IC2018 1 5677 Waste Energy Services Inc Electric CHP Waste Energy Services MI 50077 CAT4 0.3 Landfill Gas LFG IC2018 2 55983 Luminant Generation Company LLC IPP Big Brown TX 3497 1 606.0 Conventional Steam Coal SUB ST2018 2 55983 Luminant Generation Company LLC IPP Big Brown TX 3497 2 602.0 Conventional Steam Coal SUB ST2018 2 15908 NRG California South LP IPP Mandalay CA 345 03 130.0 Natural Gas Fired Combustion Turbine NG GT2018 2 15908 NRG California South LP IPP Mandalay CA 345 1 215.0 Natural Gas Steam Turbine NG ST2018 2 15908 NRG California South LP IPP Mandalay CA 345 2 215.0 Natural Gas Steam Turbine NG ST2018 2 17633 Southern Indiana Gas & Elec Co Electric Utility Broadway (IN) IN 1011 1 50.0 Natural Gas Fired Combustion Turbine NG GT2018 2 57305 Wright Patterson AFB Commercial Heat Plant 770 OH 57926 HP 0.0 Natural Gas Steam Turbine NG ST2018 2 57305 Wright Patterson AFB Commercial Heat Plant 770 OH 57926 LP 0.0 Natural Gas Steam Turbine NG ST2018 3 16873 City of Sebewaing - (MI) Electric Utility Pine Street MI 7806 1 1.0 Natural Gas Internal Combustion Engine NG IC2018 3 16873 City of Sebewaing - (MI) Electric Utility Pine Street MI 7806 2 1.0 Natural Gas Internal Combustion Engine NG IC2018 3 16873 City of Sebewaing - (MI) Electric Utility Pine Street MI 7806 3 1.0 Petroleum Liquids DFO IC2018 3 16873 City of Sebewaing - (MI) Electric Utility Pine Street MI 7806 4 1.0 Petroleum Liquids DFO IC2018 3 16873 City of Sebewaing - (MI) Electric Utility Pine Street MI 7806 5 1.2 Natural Gas Internal Combustion Engine NG IC2018 3 16873 City of Sebewaing - (MI) Electric Utility Pine Street MI 7806 6 1.2 Natural Gas Internal Combustion Engine NG IC2018 3 12199 Montana-Dakota Utilities Co Electric Utility Portable Generator 1 ND 59196 IC1 2.0 Petroleum Liquids DFO IC2018 3 17164 Sierra Pacific Industries Inc Industrial Sierra Pacific Sonora CA 54517 GEN2 6.0 Wood/Wood Waste Biomass WDS ST2018 4 221 Alaska Village Elec Coop, Inc Electric Utility Hooper Bay AK 6319 3A 0.3 Petroleum Liquids DFO IC2018 4 221 Alaska Village Elec Coop, Inc Electric Utility Pilot Station AK 57058 UNIT1 0.4 Petroleum Liquids DFO IC2018 4 11460 City of Macon - (MO) Electric Utility Macon MO 2141 3 4.6 Petroleum Liquids DFO IC2018 4 20847 Wisconsin Electric Power Co Electric Utility Pleasant Prairie WI 6170 1 594.0 Conventional Steam Coal RC ST2018 4 20847 Wisconsin Electric Power Co Electric Utility Pleasant Prairie WI 6170 2 594.0 Conventional Steam Coal RC ST
Table 6.4. Retired Utility Scale Generating Units by Operating Company, Plant, and Month, 2018
NOTES:Capacity from facilities with a total generator nameplate capacity less than 1 MW are excluded from this table.Entity ID and Plant ID are official, unique identification numbers assigned by EIA; Generator IDs are assigned by plant owners and/or operators.Descriptions for the Energy Source Codes and the Prime Mover Codes listed in the table can be found in the Technical Notes.
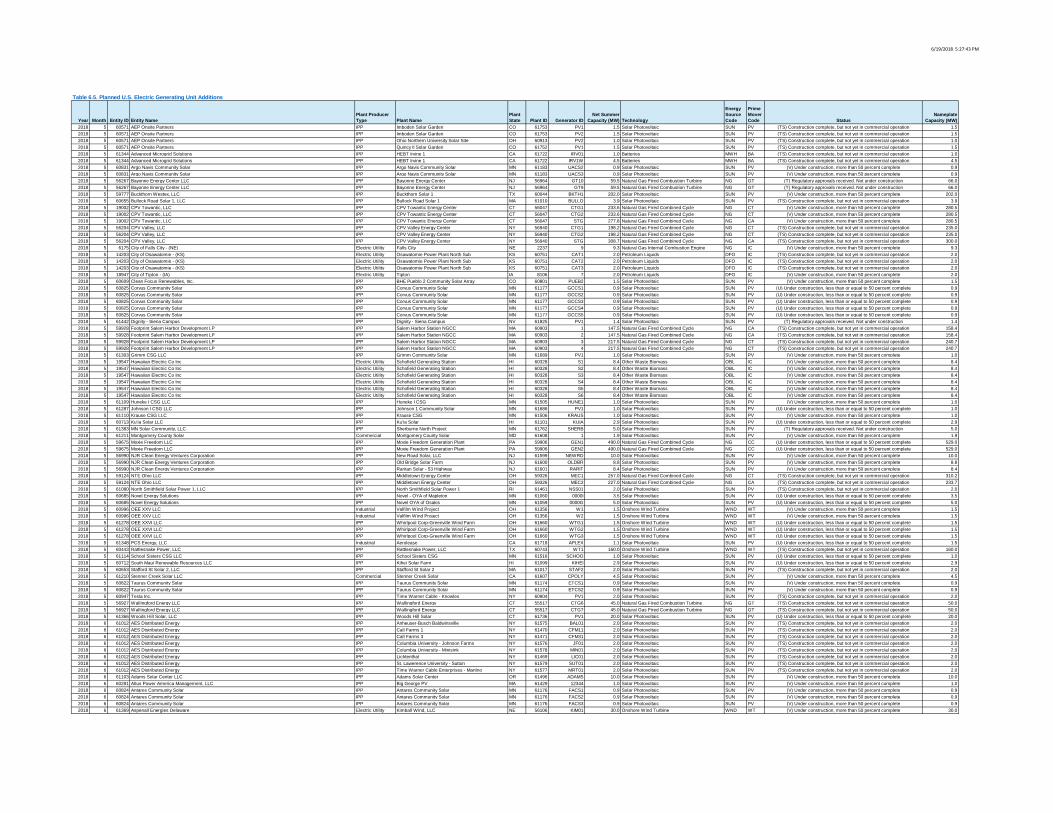
6/19/2018 5:27:43 PM
Year Month Entity ID Entity NamePlant Producer Type Plant Name
Plant State Plant ID Generator ID
Net Summer Capacity (MW) Technology
Energy Source Code
Prime Mover Code Status
Nameplate Capacity (MW)
2018 5 60571 AEP Onsite Partners IPP Imboden Solar Garden CO 61753 PV1 1.5 Solar Photovoltaic SUN PV (TS) Construction complete, but not yet in commercial operation 1.52018 5 60571 AEP Onsite Partners IPP Imboden Solar Garden CO 61753 PV2 1.5 Solar Photovoltaic SUN PV (TS) Construction complete, but not yet in commercial operation 1.52018 5 60571 AEP Onsite Partners IPP Ohio Northern University Solar Site OH 60913 PV2 1.0 Solar Photovoltaic SUN PV (TS) Construction complete, but not yet in commercial operation 1.02018 5 60571 AEP Onsite Partners IPP Quincy II Solar Garden CO 61752 PV1 1.5 Solar Photovoltaic SUN PV (TS) Construction complete, but not yet in commercial operation 1.52018 5 61344 Advanced Microgrid Solutions IPP HEBT Irvine 1 CA 61722 IRV01 1.0 Batteries MWH BA (TS) Construction complete, but not yet in commercial operation 1.02018 5 61344 Advanced Microgrid Solutions IPP HEBT Irvine 1 CA 61722 IRV1W 4.5 Batteries MWH BA (TS) Construction complete, but not yet in commercial operation 4.52018 5 60831 Argo Navis Community Solar IPP Argo Navis Community Solar MN 61183 UACS2 0.9 Solar Photovoltaic SUN PV (V) Under construction, more than 50 percent complete 0.92018 5 60831 Argo Navis Community Solar IPP Argo Navis Community Solar MN 61183 UACS3 0.9 Solar Photovoltaic SUN PV (V) Under construction, more than 50 percent complete 0.92018 5 56267 Bayonne Energy Center LLC IPP Bayonne Energy Center NJ 56964 GT10 59.5 Natural Gas Fired Combustion Turbine NG GT (T) Regulatory approvals received. Not under construction 66.02018 5 56267 Bayonne Energy Center LLC IPP Bayonne Energy Center NJ 56964 GT9 59.5 Natural Gas Fired Combustion Turbine NG GT (T) Regulatory approvals received. Not under construction 66.02018 5 59777 Buckthorn Westex, LLC IPP Buckthorn Solar 1 TX 60044 BKTH1 202.0 Solar Photovoltaic SUN PV (V) Under construction, more than 50 percent complete 202.02018 5 60655 Bullock Road Solar 1, LLC IPP Bullock Road Solar 1 MA 61010 BULLO 3.9 Solar Photovoltaic SUN PV (TS) Construction complete, but not yet in commercial operation 3.92018 5 19002 CPV Towantic, LLC IPP CPV Towantic Energy Center CT 56047 CTG1 233.6 Natural Gas Fired Combined Cycle NG CT (V) Under construction, more than 50 percent complete 280.52018 5 19002 CPV Towantic, LLC IPP CPV Towantic Energy Center CT 56047 CTG2 233.6 Natural Gas Fired Combined Cycle NG CT (V) Under construction, more than 50 percent complete 280.52018 5 19002 CPV Towantic, LLC IPP CPV Towantic Energy Center CT 56047 STG 277.8 Natural Gas Fired Combined Cycle NG CA (V) Under construction, more than 50 percent complete 280.52018 5 56204 CPV Valley, LLC IPP CPV Valley Energy Center NY 56940 CTG1 198.2 Natural Gas Fired Combined Cycle NG CT (TS) Construction complete, but not yet in commercial operation 235.02018 5 56204 CPV Valley, LLC IPP CPV Valley Energy Center NY 56940 CTG2 198.2 Natural Gas Fired Combined Cycle NG CT (TS) Construction complete, but not yet in commercial operation 235.02018 5 56204 CPV Valley, LLC IPP CPV Valley Energy Center NY 56940 STG 308.7 Natural Gas Fired Combined Cycle NG CA (TS) Construction complete, but not yet in commercial operation 300.02018 5 6175 City of Falls City - (NE) Electric Utility Falls City NE 2237 9 9.3 Natural Gas Internal Combustion Engine NG IC (V) Under construction, more than 50 percent complete 9.32018 5 14203 City of Osawatomie - (KS) Electric Utility Osawatomie Power Plant North Sub KS 60751 CAT1 2.0 Petroleum Liquids DFO IC (TS) Construction complete, but not yet in commercial operation 2.02018 5 14203 City of Osawatomie - (KS) Electric Utility Osawatomie Power Plant North Sub KS 60751 CAT2 2.0 Petroleum Liquids DFO IC (TS) Construction complete, but not yet in commercial operation 2.02018 5 14203 City of Osawatomie - (KS) Electric Utility Osawatomie Power Plant North Sub KS 60751 CAT3 2.0 Petroleum Liquids DFO IC (TS) Construction complete, but not yet in commercial operation 2.02018 5 18947 City of Tipton - (IA) Electric Utility Tipton IA 8106 7 2.0 Petroleum Liquids DFO IC (V) Under construction, more than 50 percent complete 2.02018 5 60609 Clean Focus Renewables, Inc. IPP BHE Pueblo 2 Community Solar Array CO 60801 PUEB2 1.5 Solar Photovoltaic SUN PV (V) Under construction, more than 50 percent complete 1.52018 5 60825 Corvus Community Solar IPP Corvus Community Solar MN 61177 GCCS1 0.9 Solar Photovoltaic SUN PV (U) Under construction, less than or equal to 50 percent complete 0.92018 5 60825 Corvus Community Solar IPP Corvus Community Solar MN 61177 GCCS2 0.9 Solar Photovoltaic SUN PV (U) Under construction, less than or equal to 50 percent complete 0.92018 5 60825 Corvus Community Solar IPP Corvus Community Solar MN 61177 GCCS3 0.9 Solar Photovoltaic SUN PV (U) Under construction, less than or equal to 50 percent complete 0.92018 5 60825 Corvus Community Solar IPP Corvus Community Solar MN 61177 GCCS4 0.9 Solar Photovoltaic SUN PV (U) Under construction, less than or equal to 50 percent complete 0.92018 5 60825 Corvus Community Solar IPP Corvus Community Solar MN 61177 GCCS5 0.9 Solar Photovoltaic SUN PV (U) Under construction, less than or equal to 50 percent complete 0.92018 5 61442 Dignity - Siena Campus IPP Dignity - Siena Campus NV 61825 PV1 1.4 Solar Photovoltaic SUN PV (T) Regulatory approvals received. Not under construction 1.42018 5 59928 Footprint Salem Harbor Development LP IPP Salem Harbor Station NGCC MA 60903 1 147.5 Natural Gas Fired Combined Cycle NG CA (TS) Construction complete, but not yet in commercial operation 158.42018 5 59928 Footprint Salem Harbor Development LP IPP Salem Harbor Station NGCC MA 60903 2 147.5 Natural Gas Fired Combined Cycle NG CA (TS) Construction complete, but not yet in commercial operation 158.42018 5 59928 Footprint Salem Harbor Development LP IPP Salem Harbor Station NGCC MA 60903 3 217.5 Natural Gas Fired Combined Cycle NG CT (TS) Construction complete, but not yet in commercial operation 240.72018 5 59928 Footprint Salem Harbor Development LP IPP Salem Harbor Station NGCC MA 60903 4 217.5 Natural Gas Fired Combined Cycle NG CT (TS) Construction complete, but not yet in commercial operation 240.72018 5 61303 Grimm CSG LLC IPP Grimm Community Solar MN 61689 PV1 1.0 Solar Photovoltaic SUN PV (V) Under construction, more than 50 percent complete 1.02018 5 19547 Hawaiian Electric Co Inc Electric Utility Schofield Generating Station HI 60328 S1 8.4 Other Waste Biomass OBL IC (V) Under construction, more than 50 percent complete 8.42018 5 19547 Hawaiian Electric Co Inc Electric Utility Schofield Generating Station HI 60328 S2 8.4 Other Waste Biomass OBL IC (V) Under construction, more than 50 percent complete 8.42018 5 19547 Hawaiian Electric Co Inc Electric Utility Schofield Generating Station HI 60328 S3 8.4 Other Waste Biomass OBL IC (V) Under construction, more than 50 percent complete 8.42018 5 19547 Hawaiian Electric Co Inc Electric Utility Schofield Generating Station HI 60328 S4 8.4 Other Waste Biomass OBL IC (V) Under construction, more than 50 percent complete 8.42018 5 19547 Hawaiian Electric Co Inc Electric Utility Schofield Generating Station HI 60328 S5 8.4 Other Waste Biomass OBL IC (V) Under construction, more than 50 percent complete 8.42018 5 19547 Hawaiian Electric Co Inc Electric Utility Schofield Generating Station HI 60328 S6 8.4 Other Waste Biomass OBL IC (V) Under construction, more than 50 percent complete 8.42018 5 61109 Huneke I CSG LLC IPP Huneke I CSG MN 61505 HUNE1 1.0 Solar Photovoltaic SUN PV (V) Under construction, more than 50 percent complete 1.02018 5 61287 Johnson I CSG LLC IPP Johnson 1 Community Solar MN 61686 PV1 1.0 Solar Photovoltaic SUN PV (U) Under construction, less than or equal to 50 percent complete 1.02018 5 61110 Krause CSG LLC IPP Krause CSG MN 61506 KRAUS 1.0 Solar Photovoltaic SUN PV (V) Under construction, more than 50 percent complete 1.02018 5 60713 Ku'ia Solar LLC IPP Ku'ia Solar HI 61101 KUIA 2.9 Solar Photovoltaic SUN PV (U) Under construction, less than or equal to 50 percent complete 2.92018 5 61383 MN Solar Community, LLC IPP Sherburne North Project MN 61762 SHERB 5.0 Solar Photovoltaic SUN PV (T) Regulatory approvals received. Not under construction 5.02018 5 61211 Montgomery County Solar Commercial Montgomery County Solar MD 61608 1 1.9 Solar Photovoltaic SUN PV (V) Under construction, more than 50 percent complete 1.92018 5 59675 Moxie Freedom LLC IPP Moxie Freedom Generation Plant PA 59906 GEN1 490.0 Natural Gas Fired Combined Cycle NG CC (U) Under construction, less than or equal to 50 percent complete 529.02018 5 59675 Moxie Freedom LLC IPP Moxie Freedom Generation Plant PA 59906 GEN2 490.0 Natural Gas Fired Combined Cycle NG CC (U) Under construction, less than or equal to 50 percent complete 529.02018 5 56990 NJR Clean Energy Ventures Corporation IPP New Road Solar, LLC NJ 61599 NEWRD 10.0 Solar Photovoltaic SUN PV (V) Under construction, more than 50 percent complete 10.02018 5 56990 NJR Clean Energy Ventures Corporation IPP Old Bridge Solar Farm NJ 61600 OLDBR 8.8 Solar Photovoltaic SUN PV (V) Under construction, more than 50 percent complete 8.82018 5 56990 NJR Clean Energy Ventures Corporation IPP Raritan Solar - 53 Highway NJ 61601 RARIT 8.4 Solar Photovoltaic SUN PV (V) Under construction, more than 50 percent complete 8.42018 5 59124 NTE Ohio LLC IPP Middletown Energy Center OH 59326 MEC1 257.0 Natural Gas Fired Combined Cycle NG CT (TS) Construction complete, but not yet in commercial operation 310.22018 5 59124 NTE Ohio LLC IPP Middletown Energy Center OH 59326 MEC2 227.0 Natural Gas Fired Combined Cycle NG CA (TS) Construction complete, but not yet in commercial operation 233.72018 5 61080 North Smithfield Solar Power 1, LLC IPP North Smithfield Solar Power 1 RI 61461 NSS01 2.0 Solar Photovoltaic SUN PV (TS) Construction complete, but not yet in commercial operation 2.02018 5 60685 Novel Energy Solutions IPP Novel - OYA of Mapleton MN 61060 0000I 3.5 Solar Photovoltaic SUN PV (U) Under construction, less than or equal to 50 percent complete 3.52018 5 60685 Novel Energy Solutions IPP Novel OYA of Osakis MN 61059 0000G 5.0 Solar Photovoltaic SUN PV (U) Under construction, less than or equal to 50 percent complete 5.02018 5 60996 OEE XXV LLC Industrial Valfilm Wind Project OH 61356 W1 1.5 Onshore Wind Turbine WND WT (V) Under construction, more than 50 percent complete 1.52018 5 60996 OEE XXV LLC Industrial Valfilm Wind Project OH 61356 W2 1.5 Onshore Wind Turbine WND WT (V) Under construction, more than 50 percent complete 1.52018 5 61278 OEE XXVI LLC IPP Whirlpool Corp-Greenville Wind Farm OH 61660 WTG1 1.5 Onshore Wind Turbine WND WT (U) Under construction, less than or equal to 50 percent complete 1.52018 5 61278 OEE XXVI LLC IPP Whirlpool Corp-Greenville Wind Farm OH 61660 WTG2 1.5 Onshore Wind Turbine WND WT (U) Under construction, less than or equal to 50 percent complete 1.52018 5 61278 OEE XXVI LLC IPP Whirlpool Corp-Greenville Wind Farm OH 61660 WTG3 1.5 Onshore Wind Turbine WND WT (U) Under construction, less than or equal to 50 percent complete 1.52018 5 61348 PCS Energy, LLC Industrial Aerolease CA 61718 APLEX 1.1 Solar Photovoltaic SUN PV (U) Under construction, less than or equal to 50 percent complete 1.52018 5 60443 Rattlesnake Power, LLC IPP Rattlesnake Power, LLC TX 60743 WT1 160.0 Onshore Wind Turbine WND WT (TS) Construction complete, but not yet in commercial operation 160.02018 5 61114 School Sisters CSG LLC IPP School Sisters CSG MN 61516 SCHOO 1.0 Solar Photovoltaic SUN PV (U) Under construction, less than or equal to 50 percent complete 1.02018 5 60712 South Maui Renewable Resources LLC IPP Kihei Solar Farm HI 61099 KIHEI 2.9 Solar Photovoltaic SUN PV (U) Under construction, less than or equal to 50 percent complete 2.92018 5 60653 Stafford St Solar 2, LLC IPP Stafford St Solar 2 MA 61017 STAF2 2.0 Solar Photovoltaic SUN PV (TS) Construction complete, but not yet in commercial operation 2.02018 5 61210 Stenner Creek Solar LLC Commercial Stenner Creek Solar CA 61607 CPOLY 4.5 Solar Photovoltaic SUN PV (V) Under construction, more than 50 percent complete 4.52018 5 60822 Taurus Community Solar IPP Taurus Community Solar MN 61174 ETCS1 0.9 Solar Photovoltaic SUN PV (V) Under construction, more than 50 percent complete 0.92018 5 60822 Taurus Community Solar IPP Taurus Community Solar MN 61174 ETCS2 0.9 Solar Photovoltaic SUN PV (V) Under construction, more than 50 percent complete 0.92018 5 60947 Tesla Inc. IPP Time Warner Cable - Knowles NY 60904 PV1 2.0 Solar Photovoltaic SUN PV (TS) Construction complete, but not yet in commercial operation 2.02018 5 56927 Wallingford Energy LLC IPP Wallingford Energy CT 55517 CTG6 45.0 Natural Gas Fired Combustion Turbine NG GT (TS) Construction complete, but not yet in commercial operation 50.02018 5 56927 Wallingford Energy LLC IPP Wallingford Energy CT 55517 CTG7 45.0 Natural Gas Fired Combustion Turbine NG GT (TS) Construction complete, but not yet in commercial operation 50.02018 5 61366 Woods Hill Solar, LLC IPP Woods Hill Solar CT 61736 PV1 20.0 Solar Photovoltaic SUN PV (U) Under construction, less than or equal to 50 percent complete 20.02018 6 61012 AES Distributed Energy IPP Anheuser-Busch Baldwinsville NY 61575 BAL01 2.0 Solar Photovoltaic SUN PV (TS) Construction complete, but not yet in commercial operation 2.02018 6 61012 AES Distributed Energy IPP Call Farms 1 NY 61470 CFM11 2.0 Solar Photovoltaic SUN PV (TS) Construction complete, but not yet in commercial operation 2.02018 6 61012 AES Distributed Energy IPP Call Farms 3 NY 61471 CFM31 2.0 Solar Photovoltaic SUN PV (TS) Construction complete, but not yet in commercial operation 2.02018 6 61012 AES Distributed Energy IPP Columbia University - Johnson Farms NY 61576 JF01 2.0 Solar Photovoltaic SUN PV (TS) Construction complete, but not yet in commercial operation 2.02018 6 61012 AES Distributed Energy IPP Columbia University - Minisink NY 61578 MIN01 2.0 Solar Photovoltaic SUN PV (TS) Construction complete, but not yet in commercial operation 2.02018 6 61012 AES Distributed Energy IPP Lichtenthal NY 61469 LIC01 2.0 Solar Photovoltaic SUN PV (TS) Construction complete, but not yet in commercial operation 2.02018 6 61012 AES Distributed Energy IPP St. Lawerence University - Sutton NY 61579 SUT01 2.0 Solar Photovoltaic SUN PV (TS) Construction complete, but not yet in commercial operation 2.02018 6 61012 AES Distributed Energy IPP Time Warner Cable Enterprises - Martino NY 61577 MRT01 2.0 Solar Photovoltaic SUN PV (TS) Construction complete, but not yet in commercial operation 2.02018 6 61103 Adams Solar Center LLC IPP Adams Solar Center OR 61496 ADAMS 10.0 Solar Photovoltaic SUN PV (V) Under construction, more than 50 percent complete 10.02018 6 60281 Altus Power America Management, LLC IPP Big George PV MA 61429 12344 1.0 Solar Photovoltaic SUN PV (V) Under construction, more than 50 percent complete 1.02018 6 60824 Antares Community Solar IPP Antares Community Solar MN 61176 FACS1 0.9 Solar Photovoltaic SUN PV (V) Under construction, more than 50 percent complete 0.92018 6 60824 Antares Community Solar IPP Antares Community Solar MN 61176 FACS2 0.9 Solar Photovoltaic SUN PV (V) Under construction, more than 50 percent complete 0.92018 6 60824 Antares Community Solar IPP Antares Community Solar MN 61176 FACS3 0.9 Solar Photovoltaic SUN PV (V) Under construction, more than 50 percent complete 0.92018 6 61369 Aspenall Energies Delaware Electric Utility Kimball Wind, LLC NE 56106 KIM01 30.0 Onshore Wind Turbine WND WT (V) Under construction, more than 50 percent complete 30.0
Table 6.5. Planned U.S. Electric Generating Unit Additions
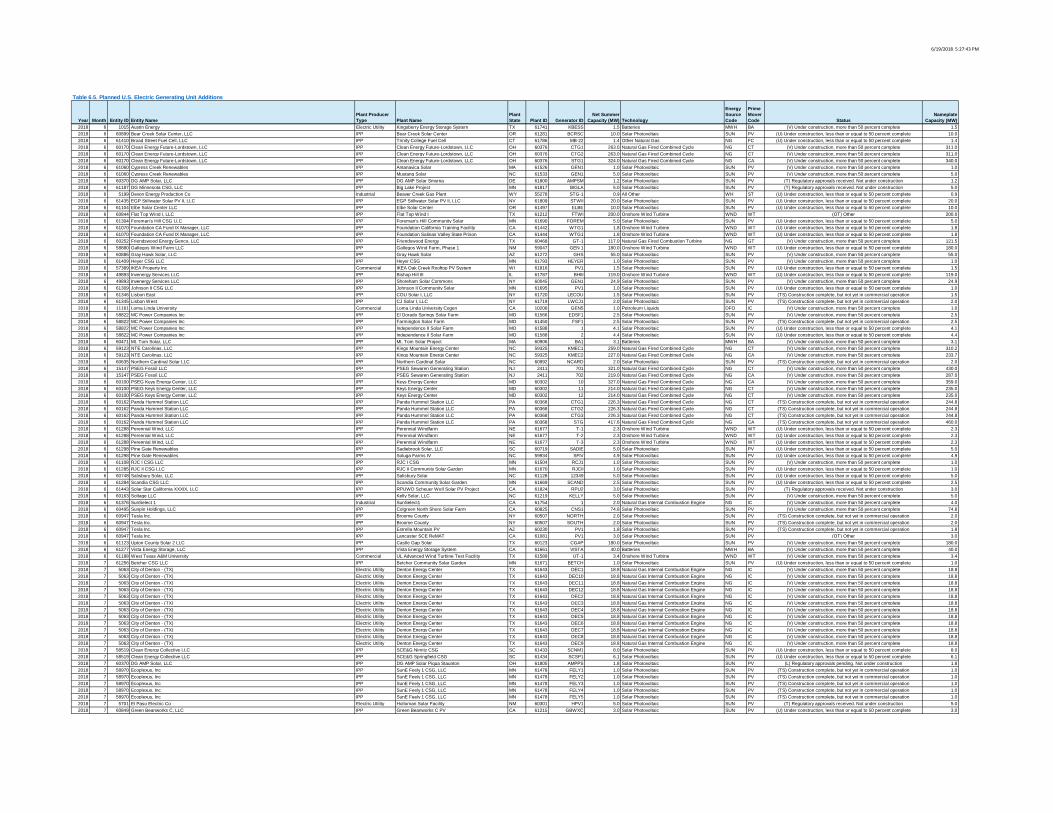
6/19/2018 5:27:43 PM
Year Month Entity ID Entity NamePlant Producer Type Plant Name
Plant State Plant ID Generator ID
Net Summer Capacity (MW) Technology
Energy Source Code
Prime Mover Code Status
Nameplate Capacity (MW)
Table 6.5. Planned U.S. Electric Generating Unit Additions
2018 6 1015 Austin Energy Electric Utility Kingsberry Energy Storage System TX 61741 KBESS 1.5 Batteries MWH BA (V) Under construction, more than 50 percent complete 1.52018 6 60899 Bear Creek Solar Center, LLC IPP Bear Creek Solar Center OR 61281 BCRSC 10.0 Solar Photovoltaic SUN PV (U) Under construction, less than or equal to 50 percent complete 10.02018 6 61410 Broad Street Fuel Cell, LLC IPP Trinity College Fuel Cell CT 61786 MB-22 1.4 Other Natural Gas NG FC (U) Under construction, less than or equal to 50 percent complete 1.42018 6 60170 Clean Energy Future-Lordstown, LLC IPP Clean Energy Future-Lordstown, LLC OH 60376 CTG1 263.0 Natural Gas Fired Combined Cycle NG CT (V) Under construction, more than 50 percent complete 311.02018 6 60170 Clean Energy Future-Lordstown, LLC IPP Clean Energy Future-Lordstown, LLC OH 60376 CTG2 263.0 Natural Gas Fired Combined Cycle NG CT (V) Under construction, more than 50 percent complete 311.02018 6 60170 Clean Energy Future-Lordstown, LLC IPP Clean Energy Future-Lordstown, LLC OH 60376 STG1 324.0 Natural Gas Fired Combined Cycle NG CA (V) Under construction, more than 50 percent complete 340.02018 6 61060 Cypress Creek Renewables IPP Antanavica Solar MA 61526 GEN1 1.0 Solar Photovoltaic SUN PV (V) Under construction, more than 50 percent complete 1.02018 6 61060 Cypress Creek Renewables IPP Mustang Solar NC 61533 GEN1 5.0 Solar Photovoltaic SUN PV (V) Under construction, more than 50 percent complete 5.02018 6 60370 DG AMP Solar, LLC IPP DG AMP Solar Smyrna DE 61800 AMPSM 1.2 Solar Photovoltaic SUN PV (T) Regulatory approvals received. Not under construction 1.22018 6 61187 DG Minnesota CSG, LLC IPP Big Lake Project MN 61817 BIGLA 5.0 Solar Photovoltaic SUN PV (T) Regulatory approvals received. Not under construction 5.02018 6 5199 Devon Energy Production Co Industrial Beaver Creek Gas Plant WY 55278 STG-1 0.9 All Other WH ST (U) Under construction, less than or equal to 50 percent complete 0.92018 6 61435 EGP Stillwater Solar PV II, LLC IPP EGP Stillwater Solar PV II, LLC NV 61809 STWII 20.0 Solar Photovoltaic SUN PV (U) Under construction, less than or equal to 50 percent complete 20.02018 6 61104 Elbe Solar Center LLC IPP Elbe Solar Center OR 61497 ELBE 10.0 Solar Photovoltaic SUN PV (U) Under construction, less than or equal to 50 percent complete 10.02018 6 60844 Flat Top Wind I, LLC IPP Flat Top Wind I TX 61212 FTWI 200.0 Onshore Wind Turbine WND WT (OT) Other 200.02018 6 61304 Foreman's Hill CSG LLC IPP Foreman's Hill Community Solar MN 61690 FOREM 5.0 Solar Photovoltaic SUN PV (U) Under construction, less than or equal to 50 percent complete 5.02018 6 61070 Foundation CA Fund IX Manager, LLC IPP Foundation California Training Facility CA 61442 WTG1 1.8 Onshore Wind Turbine WND WT (U) Under construction, less than or equal to 50 percent complete 1.82018 6 61070 Foundation CA Fund IX Manager, LLC IPP Foundation SaIinas Valley State Prison CA 61444 WTG1 1.8 Onshore Wind Turbine WND WT (U) Under construction, less than or equal to 50 percent complete 1.82018 6 60252 Friendswood Energy Genco, LLC IPP Friendswood Energy TX 60468 GT-1 117.0 Natural Gas Fired Combustion Turbine NG GT (V) Under construction, more than 50 percent complete 121.52018 6 58880 Gallegos Wind Farm LLC IPP Gallegos Wind Farm, Phase 1 NM 59047 GEN 1 180.0 Onshore Wind Turbine WND WT (U) Under construction, less than or equal to 50 percent complete 180.02018 6 60886 Gray Hawk Solar, LLC IPP Gray Hawk Solar AZ 61272 GHS 55.0 Solar Photovoltaic SUN PV (V) Under construction, more than 50 percent complete 55.02018 6 61409 Heyer CSG LLC IPP Heyer CSG MN 61793 HEYER 1.0 Solar Photovoltaic SUN PV (V) Under construction, more than 50 percent complete 1.02018 6 57389 IKEA Property Inc Commercial IKEA Oak Creek Rooftop PV System WI 61816 PV1 1.5 Solar Photovoltaic SUN PV (U) Under construction, less than or equal to 50 percent complete 1.52018 6 49893 Invenergy Services LLC IPP Bishop Hill III IL 61787 BHIII 119.0 Onshore Wind Turbine WND WT (U) Under construction, less than or equal to 50 percent complete 119.02018 6 49893 Invenergy Services LLC IPP Shoreham Solar Commons NY 60045 GEN1 24.9 Solar Photovoltaic SUN PV (V) Under construction, more than 50 percent complete 24.92018 6 61309 Johnson II CSG LLC IPP Johnson II Community Solar MN 61695 PV1 1.0 Solar Photovoltaic SUN PV (U) Under construction, less than or equal to 50 percent complete 1.02018 6 61346 Lisbon East IPP COU Solar I, LLC NY 61720 LECOU 1.5 Solar Photovoltaic SUN PV (TS) Construction complete, but not yet in commercial operation 1.52018 6 61345 Lisbon West IPP CJ Solar I, LLC NY 61719 LWCJ1 2.0 Solar Photovoltaic SUN PV (TS) Construction complete, but not yet in commercial operation 2.02018 6 11161 Loma Linda University Commercial Loma Linda University Cogen CA 10206 GEN5 1.0 Petroleum Liquids DFO IC (V) Under construction, more than 50 percent complete 1.02018 6 58822 MC Power Companies Inc IPP El Dorado Springs Solar Farm MO 61566 EDSF1 2.5 Solar Photovoltaic SUN PV (V) Under construction, more than 50 percent complete 2.52018 6 58822 MC Power Companies Inc IPP Farmington Solar Farm MO 61450 FSF1 2.5 Solar Photovoltaic SUN PV (TS) Construction complete, but not yet in commercial operation 2.52018 6 58822 MC Power Companies Inc IPP Independence II Solar Farm MO 61588 1 4.1 Solar Photovoltaic SUN PV (U) Under construction, less than or equal to 50 percent complete 4.12018 6 58822 MC Power Companies Inc IPP Independence II Solar Farm MO 61588 2 4.4 Solar Photovoltaic SUN PV (U) Under construction, less than or equal to 50 percent complete 4.42018 6 60471 Mt. Tom Solar, LLC IPP Mt. Tom Solar Project MA 60906 BA1 3.1 Batteries MWH BA (V) Under construction, more than 50 percent complete 3.12018 6 59123 NTE Carolinas, LLC IPP Kings Mountain Energy Center NC 59325 KMEC1 259.0 Natural Gas Fired Combined Cycle NG CT (V) Under construction, more than 50 percent complete 310.22018 6 59123 NTE Carolinas, LLC IPP Kings Mountain Energy Center NC 59325 KMEC2 227.0 Natural Gas Fired Combined Cycle NG CA (V) Under construction, more than 50 percent complete 233.72018 6 60635 Northern Cardinal Solar LLC IPP Northern Cardinal Solar NC 60992 NCARD 2.0 Solar Photovoltaic SUN PV (TS) Construction complete, but not yet in commercial operation 2.02018 6 15147 PSEG Fossil LLC IPP PSEG Sewaren Generating Station NJ 2411 701 321.0 Natural Gas Fired Combined Cycle NG CT (V) Under construction, more than 50 percent complete 430.02018 6 15147 PSEG Fossil LLC IPP PSEG Sewaren Generating Station NJ 2411 702 219.0 Natural Gas Fired Combined Cycle NG CA (V) Under construction, more than 50 percent complete 287.02018 6 60100 PSEG Keys Energy Center, LLC IPP Keys Energy Center MD 60302 10 327.0 Natural Gas Fired Combined Cycle NG CA (V) Under construction, more than 50 percent complete 359.02018 6 60100 PSEG Keys Energy Center, LLC IPP Keys Energy Center MD 60302 11 214.0 Natural Gas Fired Combined Cycle NG CT (V) Under construction, more than 50 percent complete 235.02018 6 60100 PSEG Keys Energy Center, LLC IPP Keys Energy Center MD 60302 12 214.0 Natural Gas Fired Combined Cycle NG CT (V) Under construction, more than 50 percent complete 235.02018 6 60162 Panda Hummel Station LLC IPP Panda Hummel Station LLC PA 60368 CTG1 226.3 Natural Gas Fired Combined Cycle NG CT (TS) Construction complete, but not yet in commercial operation 244.82018 6 60162 Panda Hummel Station LLC IPP Panda Hummel Station LLC PA 60368 CTG2 226.3 Natural Gas Fired Combined Cycle NG CT (TS) Construction complete, but not yet in commercial operation 244.82018 6 60162 Panda Hummel Station LLC IPP Panda Hummel Station LLC PA 60368 CTG3 226.3 Natural Gas Fired Combined Cycle NG CT (TS) Construction complete, but not yet in commercial operation 244.82018 6 60162 Panda Hummel Station LLC IPP Panda Hummel Station LLC PA 60368 STG 417.6 Natural Gas Fired Combined Cycle NG CA (TS) Construction complete, but not yet in commercial operation 460.02018 6 61288 Perennial Wind, LLC IPP Perennial Windfarm NE 61677 T-1 2.3 Onshore Wind Turbine WND WT (U) Under construction, less than or equal to 50 percent complete 2.32018 6 61288 Perennial Wind, LLC IPP Perennial Windfarm NE 61677 T-2 2.3 Onshore Wind Turbine WND WT (U) Under construction, less than or equal to 50 percent complete 2.32018 6 61288 Perennial Wind, LLC IPP Perennial Windfarm NE 61677 T-3 2.3 Onshore Wind Turbine WND WT (U) Under construction, less than or equal to 50 percent complete 2.32018 6 61298 Pine Gate Renewables IPP Sadiebrook Solar, LLC SC 60719 SADIE 5.0 Solar Photovoltaic SUN PV (U) Under construction, less than or equal to 50 percent complete 5.02018 6 61298 Pine Gate Renewables IPP Soluga Farms IV NC 59934 SFIV 4.9 Solar Photovoltaic SUN PV (U) Under construction, less than or equal to 50 percent complete 4.92018 6 61108 RJC I CSG LLC IPP RJC I CSG MN 61504 RCJ1 1.0 Solar Photovoltaic SUN PV (V) Under construction, more than 50 percent complete 1.02018 6 61285 RJC II CSG LLC IPP RJC II Community Solar Garden MN 61670 RJCII 1.0 Solar Photovoltaic SUN PV (U) Under construction, less than or equal to 50 percent complete 1.02018 6 60748 Salisbury Solar, LLC IPP Salisbury Solar NC 61128 12349 5.0 Solar Photovoltaic SUN PV (U) Under construction, less than or equal to 50 percent complete 5.02018 6 61284 Scandia CSG LLC IPP Scandia Community Solar Garden MN 61669 SCAND 2.5 Solar Photovoltaic SUN PV (U) Under construction, less than or equal to 50 percent complete 2.52018 6 61443 Solar Star California XXXIX, LLC IPP RPUWD Scheuer Well Solar PV Project CA 61824 RPU2 3.0 Solar Photovoltaic SUN PV (T) Regulatory approvals received. Not under construction 3.02018 6 60163 Soltage LLC IPP Kelly Solar, LLC NC 61219 KELLY 5.0 Solar Photovoltaic SUN PV (V) Under construction, more than 50 percent complete 5.02018 6 61376 SunSelect 1 Industrial SunSelect1 CA 61754 1 2.0 Natural Gas Internal Combustion Engine NG IC (V) Under construction, more than 50 percent complete 4.02018 6 60495 Sunpin Holdings, LLC IPP Colgreen North Shore Solar Farm CA 60825 CNS1 74.8 Solar Photovoltaic SUN PV (V) Under construction, more than 50 percent complete 74.82018 6 60947 Tesla Inc. IPP Broome County NY 60507 NORTH 2.0 Solar Photovoltaic SUN PV (TS) Construction complete, but not yet in commercial operation 2.02018 6 60947 Tesla Inc. IPP Broome County NY 60507 SOUTH 2.0 Solar Photovoltaic SUN PV (TS) Construction complete, but not yet in commercial operation 2.02018 6 60947 Tesla Inc. IPP Estrella Mountain PV AZ 60230 PV1 1.8 Solar Photovoltaic SUN PV (TS) Construction complete, but not yet in commercial operation 1.82018 6 60947 Tesla Inc. IPP Lancaster SCE ReMAT CA 61081 PV1 3.0 Solar Photovoltaic SUN PV (OT) Other 3.02018 6 61123 Upton County Solar 2 LLC IPP Castle Gap Solar TX 60123 CGAP 180.0 Solar Photovoltaic SUN PV (V) Under construction, more than 50 percent complete 180.02018 6 61277 Vista Energy Storage, LLC IPP Vista Energy Storage System CA 61661 VISTA 40.0 Batteries MWH BA (V) Under construction, more than 50 percent complete 40.02018 6 61188 West Texas A&M University Commercial UL Advanced Wind Turbine Test Facility TX 61589 UT-1 3.4 Onshore Wind Turbine WND WT (V) Under construction, more than 50 percent complete 3.42018 7 61256 Betcher CSG LLC IPP Betcher Community Solar Garden MN 61671 BETCH 1.0 Solar Photovoltaic SUN PV (U) Under construction, less than or equal to 50 percent complete 1.02018 7 5063 City of Denton - (TX) Electric Utility Denton Energy Center TX 61643 DEC1 18.8 Natural Gas Internal Combustion Engine NG IC (V) Under construction, more than 50 percent complete 18.82018 7 5063 City of Denton - (TX) Electric Utility Denton Energy Center TX 61643 DEC10 18.8 Natural Gas Internal Combustion Engine NG IC (V) Under construction, more than 50 percent complete 18.82018 7 5063 City of Denton - (TX) Electric Utility Denton Energy Center TX 61643 DEC11 18.8 Natural Gas Internal Combustion Engine NG IC (V) Under construction, more than 50 percent complete 18.82018 7 5063 City of Denton - (TX) Electric Utility Denton Energy Center TX 61643 DEC12 18.8 Natural Gas Internal Combustion Engine NG IC (V) Under construction, more than 50 percent complete 18.82018 7 5063 City of Denton - (TX) Electric Utility Denton Energy Center TX 61643 DEC2 18.8 Natural Gas Internal Combustion Engine NG IC (V) Under construction, more than 50 percent complete 18.82018 7 5063 City of Denton - (TX) Electric Utility Denton Energy Center TX 61643 DEC3 18.8 Natural Gas Internal Combustion Engine NG IC (V) Under construction, more than 50 percent complete 18.82018 7 5063 City of Denton - (TX) Electric Utility Denton Energy Center TX 61643 DEC4 18.8 Natural Gas Internal Combustion Engine NG IC (V) Under construction, more than 50 percent complete 18.82018 7 5063 City of Denton - (TX) Electric Utility Denton Energy Center TX 61643 DEC5 18.8 Natural Gas Internal Combustion Engine NG IC (V) Under construction, more than 50 percent complete 18.82018 7 5063 City of Denton - (TX) Electric Utility Denton Energy Center TX 61643 DEC6 18.8 Natural Gas Internal Combustion Engine NG IC (V) Under construction, more than 50 percent complete 18.82018 7 5063 City of Denton - (TX) Electric Utility Denton Energy Center TX 61643 DEC7 18.8 Natural Gas Internal Combustion Engine NG IC (V) Under construction, more than 50 percent complete 18.82018 7 5063 City of Denton - (TX) Electric Utility Denton Energy Center TX 61643 DEC8 18.8 Natural Gas Internal Combustion Engine NG IC (V) Under construction, more than 50 percent complete 18.82018 7 5063 City of Denton - (TX) Electric Utility Denton Energy Center TX 61643 DEC9 18.8 Natural Gas Internal Combustion Engine NG IC (V) Under construction, more than 50 percent complete 18.82018 7 58519 Clean Energy Collective LLC IPP SCE&G Nimitz CSG SC 61433 SCNM1 8.0 Solar Photovoltaic SUN PV (U) Under construction, less than or equal to 50 percent complete 8.02018 7 58519 Clean Energy Collective LLC IPP SCE&G Springfield CSG SC 61434 SCSP1 6.1 Solar Photovoltaic SUN PV (U) Under construction, less than or equal to 50 percent complete 6.12018 7 60370 DG AMP Solar, LLC IPP DG AMP Solar Piqua Staunton OH 61805 AMPPS 1.8 Solar Photovoltaic SUN PV (L) Regulatory approvals pending. Not under construction 1.82018 7 58970 Ecoplexus, Inc IPP SunE Feely 1 CSG, LLC MN 61478 FELY1 1.0 Solar Photovoltaic SUN PV (TS) Construction complete, but not yet in commercial operation 1.02018 7 58970 Ecoplexus, Inc IPP SunE Feely 1 CSG, LLC MN 61478 FELY2 1.0 Solar Photovoltaic SUN PV (TS) Construction complete, but not yet in commercial operation 1.02018 7 58970 Ecoplexus, Inc IPP SunE Feely 1 CSG, LLC MN 61478 FELY3 1.0 Solar Photovoltaic SUN PV (TS) Construction complete, but not yet in commercial operation 1.02018 7 58970 Ecoplexus, Inc IPP SunE Feely 1 CSG, LLC MN 61478 FELY4 1.0 Solar Photovoltaic SUN PV (TS) Construction complete, but not yet in commercial operation 1.02018 7 58970 Ecoplexus, Inc IPP SunE Feely 1 CSG, LLC MN 61478 FELY5 1.0 Solar Photovoltaic SUN PV (TS) Construction complete, but not yet in commercial operation 1.02018 7 5701 El Paso Electric Co Electric Utility Holloman Solar Facility NM 60301 HPV1 5.0 Solar Photovoltaic SUN PV (T) Regulatory approvals received. Not under construction 5.02018 7 60849 Green Beanworks C, LLC IPP Green Beanworks C PV CA 61215 GBWXC 3.0 Solar Photovoltaic SUN PV (U) Under construction, less than or equal to 50 percent complete 3.0
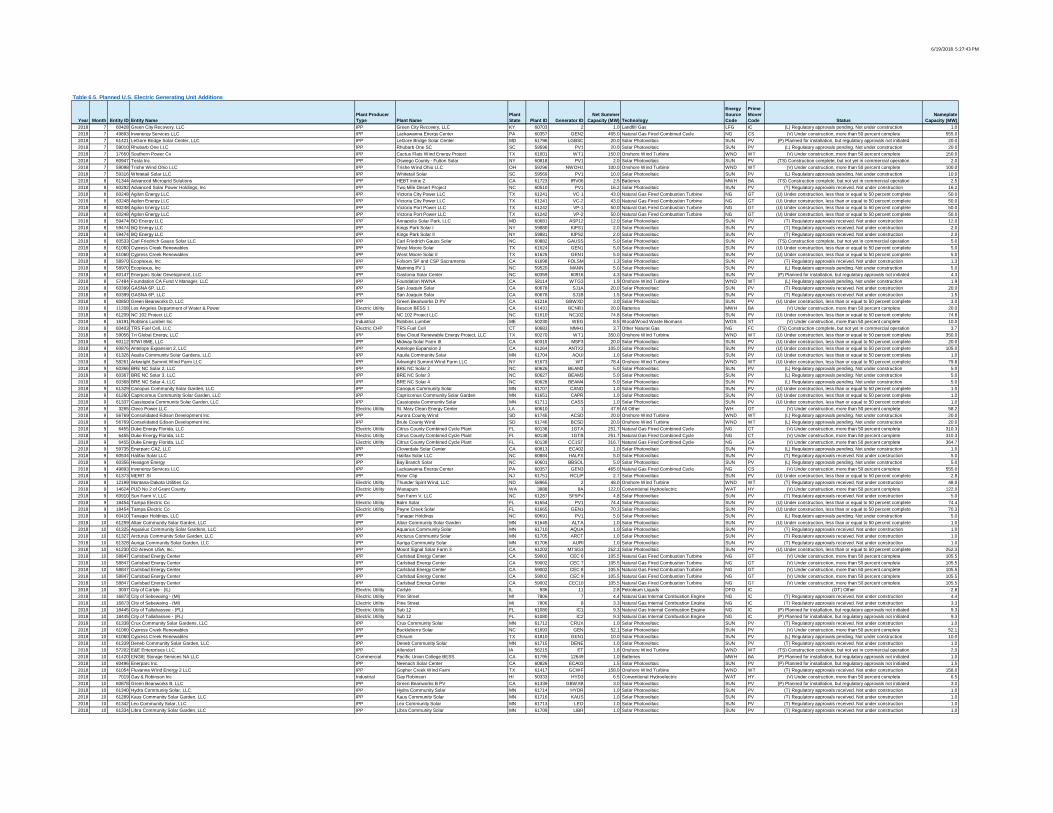
6/19/2018 5:27:43 PM
Year Month Entity ID Entity NamePlant Producer Type Plant Name
Plant State Plant ID Generator ID
Net Summer Capacity (MW) Technology
Energy Source Code
Prime Mover Code Status
Nameplate Capacity (MW)
Table 6.5. Planned U.S. Electric Generating Unit Additions
2018 7 60428 Green City Recovery, LLC IPP Green City Recovery, LLC KY 60703 2 1.0 Landfill Gas LFG IC (L) Regulatory approvals pending. Not under construction 1.02018 7 49893 Invenergy Services LLC IPP Lackawanna Energy Center PA 60357 GEN2 465.0 Natural Gas Fired Combined Cycle NG CS (V) Under construction, more than 50 percent complete 555.02018 7 61421 LeGore Bridge Solar Center, LLC IPP LeGore Bridge Solar Center MD 61796 LGBSC 20.0 Solar Photovoltaic SUN PV (P) Planned for installation, but regulatory approvals not initiated 20.02018 7 59010 Rhubarb One LLC IPP Rhubarb One SC SC 59596 PV1 20.0 Solar Photovoltaic SUN PV (L) Regulatory approvals pending. Not under construction 20.02018 7 17650 Southern Power Co IPP Cactus Flats Wind Energy Project TX 61001 WT1 150.0 Onshore Wind Turbine WND WT (V) Under construction, more than 50 percent complete 150.02018 7 60947 Tesla Inc. IPP Oswego County - Fulton Solar NY 60818 PV1 2.0 Solar Photovoltaic SUN PV (TS) Construction complete, but not yet in commercial operation 2.02018 7 59098 Trishe Wind Ohio LLC IPP Trishe Wind Ohio LLC OH 59296 NWOH1 100.0 Onshore Wind Turbine WND WT (V) Under construction, more than 50 percent complete 100.02018 7 59316 Whitetail Solar LLC IPP Whitetail Solar SC 59569 PV1 10.0 Solar Photovoltaic SUN PV (L) Regulatory approvals pending. Not under construction 10.02018 8 61344 Advanced Microgrid Solutions IPP HEBT Irvine 2 CA 61723 IRV06 2.5 Batteries MWH BA (TS) Construction complete, but not yet in commercial operation 2.52018 8 60292 Advanced Solar Power Holdings, Inc IPP Two Mile Desert Project NC 60510 PV1 16.2 Solar Photovoltaic SUN PV (T) Regulatory approvals received. Not under construction 16.22018 8 60248 Agilon Energy LLC IPP Victoria City Power LLC TX 61241 VC-1 43.0 Natural Gas Fired Combustion Turbine NG GT (U) Under construction, less than or equal to 50 percent complete 50.02018 8 60248 Agilon Energy LLC IPP Victoria City Power LLC TX 61241 VC-2 43.0 Natural Gas Fired Combustion Turbine NG GT (U) Under construction, less than or equal to 50 percent complete 50.02018 8 60248 Agilon Energy LLC IPP Victoria Port Power LLC TX 61242 VP-1 50.0 Natural Gas Fired Combustion Turbine NG GT (U) Under construction, less than or equal to 50 percent complete 50.02018 8 60248 Agilon Energy LLC IPP Victoria Port Power LLC TX 61242 VP-2 50.0 Natural Gas Fired Combustion Turbine NG GT (U) Under construction, less than or equal to 50 percent complete 50.02018 8 59474 BQ Energy LLC IPP Annapolis Solar Park, LLC MD 60681 ASP12 12.0 Solar Photovoltaic SUN PV (T) Regulatory approvals received. Not under construction 12.02018 8 59474 BQ Energy LLC IPP Kings Park Solar I NY 59880 KIPS1 2.0 Solar Photovoltaic SUN PV (T) Regulatory approvals received. Not under construction 2.02018 8 59474 BQ Energy LLC IPP Kings Park Solar II NY 59881 KIPS2 2.0 Solar Photovoltaic SUN PV (T) Regulatory approvals received. Not under construction 2.02018 8 60533 Carl Friedrich Gauss Solar LLC IPP Carl Friedrich Gauss Solar NC 60882 GAUSS 5.0 Solar Photovoltaic SUN PV (TS) Construction complete, but not yet in commercial operation 5.02018 8 61060 Cypress Creek Renewables IPP West Moore Solar TX 61624 GEN1 5.0 Solar Photovoltaic SUN PV (U) Under construction, less than or equal to 50 percent complete 5.02018 8 61060 Cypress Creek Renewables IPP West Moore Solar II TX 61625 GEN1 5.0 Solar Photovoltaic SUN PV (U) Under construction, less than or equal to 50 percent complete 5.02018 8 58970 Ecoplexus, Inc IPP Folsom SP and CSP Sacramento CA 61698 FOLSM 1.3 Solar Photovoltaic SUN PV (T) Regulatory approvals received. Not under construction 1.32018 8 58970 Ecoplexus, Inc IPP Manning PV 1 NC 59520 MANN 5.0 Solar Photovoltaic SUN PV (L) Regulatory approvals pending. Not under construction 5.02018 8 60147 Enerparc Solar Development, LLC IPP Gastonia Solar Center NC 60359 60916 4.3 Solar Photovoltaic SUN PV (P) Planned for installation, but regulatory approvals not initiated 4.32018 8 57484 Foundation CA Fund V Manager, LLC IPP Foundation NWNA CA 58114 WTG3 1.9 Onshore Wind Turbine WND WT (L) Regulatory approvals pending. Not under construction 1.92018 8 60399 GASNA 6P, LLC IPP San Joaquin Solar CA 60678 SJ1A 20.0 Solar Photovoltaic SUN PV (T) Regulatory approvals received. Not under construction 20.02018 8 60399 GASNA 6P, LLC IPP San Joaquin Solar CA 60678 SJ1B 1.5 Solar Photovoltaic SUN PV (T) Regulatory approvals received. Not under construction 1.52018 8 60850 Green Beanworks D, LLC IPP Green Beanworks D PV CA 61216 GBWXD 3.0 Solar Photovoltaic SUN PV (U) Under construction, less than or equal to 50 percent complete 3.02018 8 11208 Los Angeles Department of Water & Power Electric Utility Beacon BESS 1 CA 61431 BCNB1 20.0 Batteries MWH BA (V) Under construction, more than 50 percent complete 20.02018 8 61209 NC 102 Project LLC IPP NC 102 Project LLC NC 61610 NC102 74.8 Solar Photovoltaic SUN PV (U) Under construction, less than or equal to 50 percent complete 74.82018 8 16191 Robbins Lumber Inc Industrial Robbins Lumber ME 50230 WEG 8.5 Wood/Wood Waste Biomass WDS ST (V) Under construction, more than 50 percent complete 10.02018 8 60403 TRS Fuel Cell, LLC Electric CHP TRS Fuel Cell CT 60683 MMH1 3.7 Other Natural Gas NG FC (TS) Construction complete, but not yet in commercial operation 3.72018 8 59056 Tri Global Energy, LLC IPP Blue Cloud Renewable Energy Project, LLC TX 60270 WT1 350.0 Onshore Wind Turbine WND WT (U) Under construction, less than or equal to 50 percent complete 350.02018 9 60112 97WI 8ME, LLC IPP Midway Solar Farm III CA 60315 MSF3 20.0 Solar Photovoltaic SUN PV (U) Under construction, less than or equal to 50 percent complete 20.02018 9 60876 Antelope Expansion 2, LLC IPP Antelope Expansion 2 CA 61264 ANTX2 105.0 Solar Photovoltaic SUN PV (U) Under construction, less than or equal to 50 percent complete 105.02018 9 61326 Aquila Community Solar Gardens, LLC IPP Aquila Community Solar MN 61704 AQUI 1.0 Solar Photovoltaic SUN PV (U) Under construction, less than or equal to 50 percent complete 1.02018 9 58261 Arkwright Summit Wind Farm LLC IPP Arkwright Summit Wind Farm LLC NY 61673 WT 78.4 Onshore Wind Turbine WND WT (U) Under construction, less than or equal to 50 percent complete 79.82018 9 60366 BRE NC Solar 2, LLC IPP BRE NC Solar 2 NC 60626 BEAM2 5.0 Solar Photovoltaic SUN PV (L) Regulatory approvals pending. Not under construction 5.02018 9 60367 BRE NC Solar 3, LLC IPP BRE NC Solar 3 NC 60627 BEAM3 5.0 Solar Photovoltaic SUN PV (L) Regulatory approvals pending. Not under construction 5.02018 9 60368 BRE NC Solar 4, LLC IPP BRE NC Solar 4 NC 60628 BEAM4 5.0 Solar Photovoltaic SUN PV (L) Regulatory approvals pending. Not under construction 5.02018 9 61329 Canopus Community Solar Garden, LLC IPP Canopus Community Solar MN 61707 CANO 1.0 Solar Photovoltaic SUN PV (U) Under construction, less than or equal to 50 percent complete 1.02018 9 61260 Capricornus Community Solar Garden, LLC IPP Capricornus Community Solar Garden MN 61651 CAPR 1.0 Solar Photovoltaic SUN PV (U) Under construction, less than or equal to 50 percent complete 1.02018 9 61337 Cassiopeia Community Solar Garden, LLC IPP Cassiopeia Community Solar MN 61711 CASS 1.0 Solar Photovoltaic SUN PV (U) Under construction, less than or equal to 50 percent complete 1.02018 9 3265 Cleco Power LLC Electric Utility St. Mary Clean Energy Center LA 60610 1 47.9 All Other WH OT (V) Under construction, more than 50 percent complete 58.22018 9 56769 Consolidated Edison Development Inc. IPP Aurora County Wind SD 61745 ACSD 20.0 Onshore Wind Turbine WND WT (L) Regulatory approvals pending. Not under construction 20.02018 9 56769 Consolidated Edison Development Inc. IPP Brule County Wind SD 61746 BCSD 20.0 Onshore Wind Turbine WND WT (L) Regulatory approvals pending. Not under construction 20.02018 9 6455 Duke Energy Florida, LLC Electric Utility Citrus County Combined Cycle Plant FL 60138 1GTA 251.7 Natural Gas Fired Combined Cycle NG CT (V) Under construction, more than 50 percent complete 310.32018 9 6455 Duke Energy Florida, LLC Electric Utility Citrus County Combined Cycle Plant FL 60138 1GTB 251.7 Natural Gas Fired Combined Cycle NG CT (V) Under construction, more than 50 percent complete 310.32018 9 6455 Duke Energy Florida, LLC Electric Utility Citrus County Combined Cycle Plant FL 60138 CC1ST 316.7 Natural Gas Fired Combined Cycle NG CA (V) Under construction, more than 50 percent complete 364.72018 9 59735 Enerparc CA2, LLC IPP Cloverdale Solar Center CA 60813 ECA02 1.0 Solar Photovoltaic SUN PV (L) Regulatory approvals pending. Not under construction 1.02018 9 60534 Halifax Solar LLC IPP Halifax Solar LLC NC 60884 HALFX 5.0 Solar Photovoltaic SUN PV (T) Regulatory approvals received. Not under construction 5.02018 9 60356 Hexagon Energy IPP Bay Branch Solar NC 60601 BBSOL 5.0 Solar Photovoltaic SUN PV (L) Regulatory approvals pending. Not under construction 5.02018 9 49893 Invenergy Services LLC IPP Lackawanna Energy Center PA 60357 GEN3 465.0 Natural Gas Fired Combined Cycle NG CS (V) Under construction, more than 50 percent complete 555.02018 9 61373 MERIT SI IPP Rotor Clip NJ 61751 RCLIP 2.7 Solar Photovoltaic SUN PV (U) Under construction, less than or equal to 50 percent complete 2.82018 9 12199 Montana-Dakota Utilities Co Electric Utility Thunder Spirit Wind, LLC ND 58965 2 48.0 Onshore Wind Turbine WND WT (T) Regulatory approvals received. Not under construction 48.02018 9 14624 PUD No 2 of Grant County Electric Utility Wanapum WA 3888 8A 122.0 Conventional Hydroelectric WAT HY (V) Under construction, more than 50 percent complete 122.02018 9 60910 Sun Farm V, LLC IPP Sun Farm V, LLC NC 61287 SF5PV 4.8 Solar Photovoltaic SUN PV (T) Regulatory approvals received. Not under construction 5.02018 9 18454 Tampa Electric Co Electric Utility Balm Solar FL 61654 PV1 74.4 Solar Photovoltaic SUN PV (U) Under construction, less than or equal to 50 percent complete 74.42018 9 18454 Tampa Electric Co Electric Utility Payne Creek Solar FL 61665 GEN1 70.3 Solar Photovoltaic SUN PV (U) Under construction, less than or equal to 50 percent complete 70.32018 9 60410 Tanager Holdings, LLC IPP Tanager Holdings NC 60691 PV1 5.0 Solar Photovoltaic SUN PV (L) Regulatory approvals pending. Not under construction 5.02018 10 61259 Altair Community Solar Garden, LLC IPP Altair Community Solar Garden MN 61645 ALTA 1.0 Solar Photovoltaic SUN PV (U) Under construction, less than or equal to 50 percent complete 1.02018 10 61325 Aquarius Community Solar Gardens, LLC IPP Aquarius Community Solar MN 61710 AQUA 1.0 Solar Photovoltaic SUN PV (T) Regulatory approvals received. Not under construction 1.02018 10 61327 Arcturus Community Solar Garden, LLC IPP Arcturus Community Solar MN 61705 ARCT 1.0 Solar Photovoltaic SUN PV (T) Regulatory approvals received. Not under construction 1.02018 10 61328 Auriga Community Solar Garden, LLC IPP Auriga Community Solar MN 61706 AURI 1.0 Solar Photovoltaic SUN PV (T) Regulatory approvals received. Not under construction 1.02018 10 61230 CD Arevon USA, Inc. IPP Mount Signal Solar Farm 3 CA 61202 MTSG3 252.3 Solar Photovoltaic SUN PV (U) Under construction, less than or equal to 50 percent complete 252.32018 10 58847 Carlsbad Energy Center IPP Carlsbad Energy Center CA 59002 CEC 6 105.5 Natural Gas Fired Combustion Turbine NG GT (V) Under construction, more than 50 percent complete 105.52018 10 58847 Carlsbad Energy Center IPP Carlsbad Energy Center CA 59002 CEC 7 105.5 Natural Gas Fired Combustion Turbine NG GT (V) Under construction, more than 50 percent complete 105.52018 10 58847 Carlsbad Energy Center IPP Carlsbad Energy Center CA 59002 CEC 8 105.5 Natural Gas Fired Combustion Turbine NG GT (V) Under construction, more than 50 percent complete 105.52018 10 58847 Carlsbad Energy Center IPP Carlsbad Energy Center CA 59002 CEC 9 105.5 Natural Gas Fired Combustion Turbine NG GT (V) Under construction, more than 50 percent complete 105.52018 10 58847 Carlsbad Energy Center IPP Carlsbad Energy Center CA 59002 CEC10 105.5 Natural Gas Fired Combustion Turbine NG GT (V) Under construction, more than 50 percent complete 105.52018 10 3037 City of Carlyle - (IL) Electric Utility Carlyle IL 936 11 2.8 Petroleum Liquids DFO IC (OT) Other 2.82018 10 16873 City of Sebewaing - (MI) Electric Utility Pine Street MI 7806 7 4.4 Natural Gas Internal Combustion Engine NG IC (T) Regulatory approvals received. Not under construction 4.42018 10 16873 City of Sebewaing - (MI) Electric Utility Pine Street MI 7806 8 3.3 Natural Gas Internal Combustion Engine NG IC (T) Regulatory approvals received. Not under construction 3.32018 10 18445 City of Tallahassee - (FL) Electric Utility Sub 12 FL 61080 IC1 9.3 Natural Gas Internal Combustion Engine NG IC (P) Planned for installation, but regulatory approvals not initiated 9.32018 10 18445 City of Tallahassee - (FL) Electric Utility Sub 12 FL 61080 IC2 9.3 Natural Gas Internal Combustion Engine NG IC (P) Planned for installation, but regulatory approvals not initiated 9.32018 10 61338 Crux Community Solar Gardens, LLC IPP Crux Community Solar MN 61712 CRUX 1.0 Solar Photovoltaic SUN PV (T) Regulatory approvals received. Not under construction 1.02018 10 61060 Cypress Creek Renewables IPP Buckleberry Solar NC 61693 GEN 52.1 Solar Photovoltaic SUN PV (V) Under construction, more than 50 percent complete 52.12018 10 61060 Cypress Creek Renewables IPP Chisum TX 61810 GEN1 10.0 Solar Photovoltaic SUN PV (L) Regulatory approvals pending. Not under construction 10.02018 10 61339 Deneb Community Solar Garden, LLC IPP Deneb Community Solar MN 61715 DENE 1.0 Solar Photovoltaic SUN PV (T) Regulatory approvals received. Not under construction 1.02018 10 57202 E&E Enterprises LLC IPP Allendorf IA 56215 ET 1.8 Onshore Wind Turbine WND WT (TS) Construction complete, but not yet in commercial operation 2.02018 10 61420 ENGIE Storage Services NA LLC Commercial Pacific Union College BESS CA 61795 12649 1.0 Batteries MWH BA (P) Planned for installation, but regulatory approvals not initiated 1.02018 10 60496 Enerparc Inc. IPP Neenach Solar Center CA 60826 ECA03 1.5 Solar Photovoltaic SUN PV (P) Planned for installation, but regulatory approvals not initiated 1.52018 10 61054 Fluvanna Wind Energy 2 LLC IPP Gopher Creek Wind Farm TX 61417 GCWF 158.0 Onshore Wind Turbine WND WT (T) Regulatory approvals received. Not under construction 158.02018 10 7019 Gay & Robinson Inc Industrial Gay Robinson HI 50333 HYD3 6.5 Conventional Hydroelectric WAT HY (V) Under construction, more than 50 percent complete 6.52018 10 60878 Green Beanworks B, LLC IPP Green Beanworks B PV CA 61339 GBWXB 3.0 Solar Photovoltaic SUN PV (P) Planned for installation, but regulatory approvals not initiated 3.02018 10 61340 Hydra Community Solar, LLC IPP Hydra Community Solar MN 61714 HYDR 1.0 Solar Photovoltaic SUN PV (T) Regulatory approvals received. Not under construction 1.02018 10 61289 Kaus Community Solar Garden, LLC IPP Kaus Community Solar MN 61716 KAUS 1.0 Solar Photovoltaic SUN PV (T) Regulatory approvals received. Not under construction 1.02018 10 61342 Leo Community Solar, LLC IPP Leo Community Solar MN 61713 LEO 1.0 Solar Photovoltaic SUN PV (T) Regulatory approvals received. Not under construction 1.02018 10 61334 Libra Community Solar Garden, LLC IPP Libra Community Solar MN 61709 LIBR 1.0 Solar Photovoltaic SUN PV (T) Regulatory approvals received. Not under construction 1.0
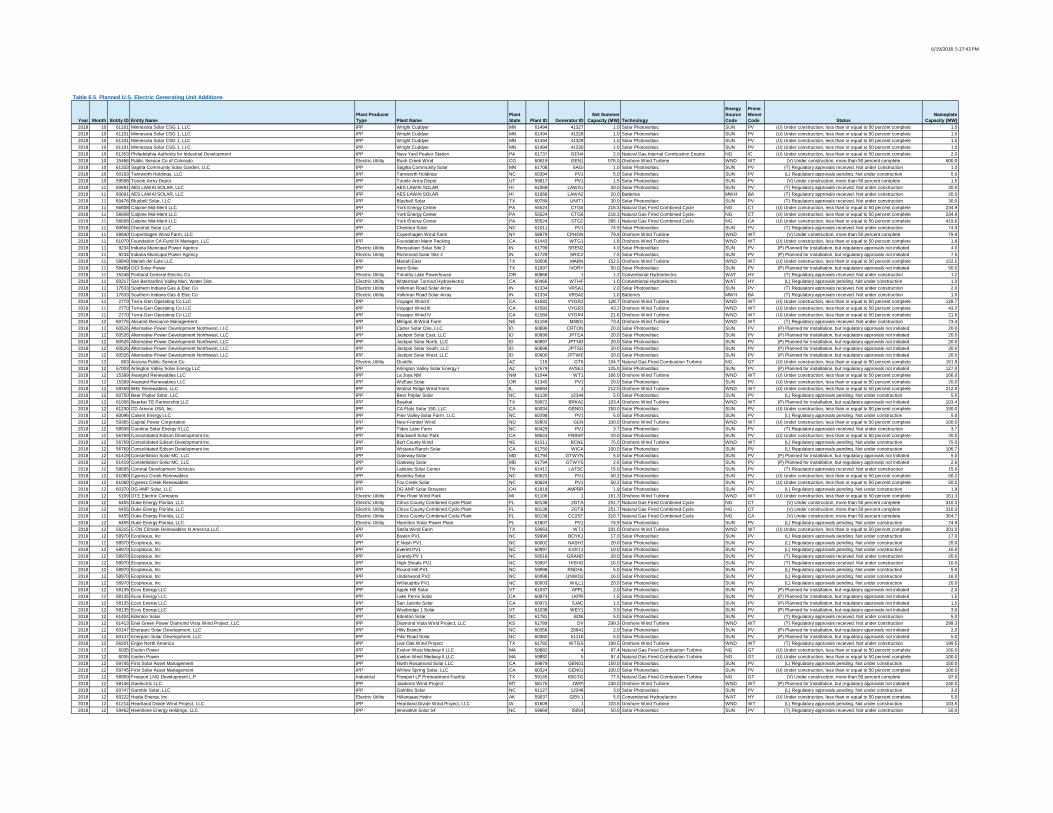
6/19/2018 5:27:43 PM
Year Month Entity ID Entity NamePlant Producer Type Plant Name
Plant State Plant ID Generator ID
Net Summer Capacity (MW) Technology
Energy Source Code
Prime Mover Code Status
Nameplate Capacity (MW)
Table 6.5. Planned U.S. Electric Generating Unit Additions
2018 10 61101 Minnesota Solar CSG 1, LLC IPP Wright Cuddyer MN 61494 41327 1.0 Solar Photovoltaic SUN PV (U) Under construction, less than or equal to 50 percent complete 1.02018 10 61101 Minnesota Solar CSG 1, LLC IPP Wright Cuddyer MN 61494 41328 1.0 Solar Photovoltaic SUN PV (U) Under construction, less than or equal to 50 percent complete 1.02018 10 61101 Minnesota Solar CSG 1, LLC IPP Wright Cuddyer MN 61494 41329 1.0 Solar Photovoltaic SUN PV (U) Under construction, less than or equal to 50 percent complete 1.02018 10 61101 Minnesota Solar CSG 1, LLC IPP Wright Cuddyer MN 61494 41330 1.0 Solar Photovoltaic SUN PV (U) Under construction, less than or equal to 50 percent complete 1.02018 10 61353 Philadelphia Authority for Industrial Development IPP Navy Yard Peaker Station PA 61737 GEN4 2.0 Natural Gas Internal Combustion Engine NG IC (U) Under construction, less than or equal to 50 percent complete 2.02018 10 15466 Public Service Co of Colorado Electric Utility Rush Creek Wind CO 60619 GEN1 576.0 Onshore Wind Turbine WND WT (V) Under construction, more than 50 percent complete 600.02018 10 61333 Sagitta Community Solar Garden, LLC IPP Sagitta Community Solar MN 61708 SAGI 1.0 Solar Photovoltaic SUN PV (T) Regulatory approvals received. Not under construction 1.02018 10 60193 Tamworth Holdings, LLC IPP Tamworth Holdings NC 60394 PV1 5.0 Solar Photovoltaic SUN PV (L) Regulatory approvals pending. Not under construction 5.02018 10 59598 Tooele Army Depot IPP Tooele Army Depot UT 59817 PV1 1.5 Solar Photovoltaic SUN PV (V) Under construction, more than 50 percent complete 1.52018 11 60691 AES LAWAI SOLAR, LLC IPP AES LAWAI SOLAR HI 61068 LAWA1 20.0 Solar Photovoltaic SUN PV (T) Regulatory approvals received. Not under construction 20.02018 11 60691 AES LAWAI SOLAR, LLC IPP AES LAWAI SOLAR HI 61068 LAWA2 20.0 Batteries MWH BA (T) Regulatory approvals received. Not under construction 20.02018 11 60476 Bluebell Solar, LLC IPP Bluebell Solar TX 60789 UNIT1 30.0 Solar Photovoltaic SUN PV (T) Regulatory approvals received. Not under construction 30.02018 11 56608 Calpine Mid-Merit LLC IPP York Energy Center PA 55524 CTG5 216.3 Natural Gas Fired Combined Cycle NG CT (U) Under construction, less than or equal to 50 percent complete 234.92018 11 56608 Calpine Mid-Merit LLC IPP York Energy Center PA 55524 CTG6 216.3 Natural Gas Fired Combined Cycle NG CT (U) Under construction, less than or equal to 50 percent complete 234.92018 11 56608 Calpine Mid-Merit LLC IPP York Energy Center PA 55524 STG2 395.1 Natural Gas Fired Combined Cycle NG CA (U) Under construction, less than or equal to 50 percent complete 419.62018 11 60656 Chestnut Solar LLC IPP Chestnut Solar NC 61011 PV1 74.9 Solar Photovoltaic SUN PV (T) Regulatory approvals received. Not under construction 74.92018 11 58840 Copenhagen Wind Farm, LLC IPP Copenhagen Wind Farm NY 58979 CPHGN 79.9 Onshore Wind Turbine WND WT (V) Under construction, more than 50 percent complete 79.92018 11 61070 Foundation CA Fund IX Manager, LLC IPP Foundation Mann Packing CA 61443 WTG1 1.8 Onshore Wind Turbine WND WT (U) Under construction, less than or equal to 50 percent complete 1.82018 11 9234 Indiana Municipal Power Agency Electric Utility Rensselaer Solar Site 2 IN 61799 SREN2 4.0 Solar Photovoltaic SUN PV (P) Planned for installation, but regulatory approvals not initiated 4.02018 11 9234 Indiana Municipal Power Agency Electric Utility Richmond Solar Site 2 IN 61729 SRIC2 7.5 Solar Photovoltaic SUN PV (P) Planned for installation, but regulatory approvals not initiated 7.52018 11 58849 Mariah del Este LLC IPP Mariah East TX 59006 MARN 152.5 Onshore Wind Turbine WND WT (U) Under construction, less than or equal to 50 percent complete 152.52018 11 58489 OCI Solar Power IPP Ivory Solar TX 61697 IVORY 50.0 Solar Photovoltaic SUN PV (P) Planned for installation, but regulatory approvals not initiated 50.02018 11 15248 Portland General Electric Co Electric Utility Timothy Lake Powerhouse OR 60868 1 1.2 Conventional Hydroelectric WAT HY (T) Regulatory approvals received. Not under construction 1.22018 11 60217 San Bernardino Valley Mun. Water Dist. Electric Utility Waterman Turnout Hydroelectric CA 60466 WTHF 1.0 Conventional Hydroelectric WAT HY (L) Regulatory approvals pending. Not under construction 1.02018 11 17633 Southern Indiana Gas & Elec Co Electric Utility Volkman Road Solar Array IN 61334 VRSA1 2.0 Solar Photovoltaic SUN PV (T) Regulatory approvals received. Not under construction 2.02018 11 17633 Southern Indiana Gas & Elec Co Electric Utility Volkman Road Solar Array IN 61334 VRSA2 1.0 Batteries MWH BA (T) Regulatory approvals received. Not under construction 1.02018 11 2770 Terra-Gen Operating Co LLC IPP Voyager Wind II CA 61582 VYGR2 128.7 Onshore Wind Turbine WND WT (U) Under construction, less than or equal to 50 percent complete 128.72018 11 2770 Terra-Gen Operating Co LLC IPP Voyager Wind III CA 61583 VYGR3 43.2 Onshore Wind Turbine WND WT (U) Under construction, less than or equal to 50 percent complete 43.22018 11 2770 Terra-Gen Operating Co LLC IPP Voyager Wind IV CA 61584 VYGR4 21.6 Onshore Wind Turbine WND WT (U) Under construction, less than or equal to 50 percent complete 21.62018 12 60776 Aksamit Resource Management IPP Milligan III Wind Farm NE 61159 M3001 73.4 Onshore Wind Turbine WND WT (T) Regulatory approvals received. Not under construction 73.42018 12 60526 Alternative Power Development Northwest, LLC IPP Carter Solar One, LLC ID 60896 CRTON 20.0 Solar Photovoltaic SUN PV (P) Planned for installation, but regulatory approvals not initiated 20.02018 12 60526 Alternative Power Development Northwest, LLC IPP Jackpot Solar East, LLC ID 60899 JPTEA 20.0 Solar Photovoltaic SUN PV (P) Planned for installation, but regulatory approvals not initiated 20.02018 12 60526 Alternative Power Development Northwest, LLC IPP Jackpot Solar North, LLC ID 60897 JPTNO 20.0 Solar Photovoltaic SUN PV (P) Planned for installation, but regulatory approvals not initiated 20.02018 12 60526 Alternative Power Development Northwest, LLC IPP Jackpot Solar South, LLC ID 60898 JPTSO 20.0 Solar Photovoltaic SUN PV (P) Planned for installation, but regulatory approvals not initiated 20.02018 12 60526 Alternative Power Development Northwest, LLC IPP Jackpot Solar West, LLC ID 60900 JPTWE 20.0 Solar Photovoltaic SUN PV (P) Planned for installation, but regulatory approvals not initiated 20.02018 12 803 Arizona Public Service Co Electric Utility Ocotillo AZ 116 GT6 104.7 Natural Gas Fired Combustion Turbine NG GT (U) Under construction, less than or equal to 50 percent complete 161.92018 12 57003 Arlington Valley Solar Energy LLC IPP Arlington Valley Solar Energy I AZ 57679 AVSE1 125.0 Solar Photovoltaic SUN PV (P) Planned for installation, but regulatory approvals not initiated 127.02018 12 15399 Avangrid Renewables LLC IPP La Joya NM NM 61044 WT1 166.0 Onshore Wind Turbine WND WT (U) Under construction, less than or equal to 50 percent complete 166.02018 12 15399 Avangrid Renewables LLC IPP WyEast Solar OR 61345 PV1 20.0 Solar Photovoltaic SUN PV (U) Under construction, less than or equal to 50 percent complete 20.02018 12 59359 BHE Renewables, LLC IPP Walnut Ridge Wind Farm IL 58694 1 212.0 Onshore Wind Turbine WND WT (U) Under construction, less than or equal to 50 percent complete 212.02018 12 60750 Bear Poplar Solar, LLC IPP Bear Poplar Solar NC 61130 12344 5.0 Solar Photovoltaic SUN PV (L) Regulatory approvals pending. Not under construction 5.02018 12 61006 Bearkat TE Partnership LLC IPP Bearkat TX 59972 BRKA2 103.4 Onshore Wind Turbine WND WT (P) Planned for installation, but regulatory approvals not initiated 103.42018 12 61230 CD Arevon USA, Inc. IPP CA Flats Solar 150, LLC CA 60034 GEN01 150.0 Solar Photovoltaic SUN PV (U) Under construction, less than or equal to 50 percent complete 150.02018 12 60096 Calvert Energy LLC IPP Pine Valley Solar Farm, LLC NC 60298 PV1 5.0 Solar Photovoltaic SUN PV (L) Regulatory approvals pending. Not under construction 5.02018 12 59365 Capital Power Corporation IPP New Frontier Wind ND 59903 GEN 100.0 Onshore Wind Turbine WND WT (U) Under construction, less than or equal to 50 percent complete 100.02018 12 58508 Carolina Solar Energy II LLC IPP Tides Lane Farm NC 60429 PV1 3.7 Solar Photovoltaic SUN PV (T) Regulatory approvals received. Not under construction 3.72018 12 56769 Consolidated Edison Development Inc. IPP Blackwell Solar Park CA 59524 FRBSP 20.0 Solar Photovoltaic SUN PV (U) Under construction, less than or equal to 50 percent complete 20.02018 12 56769 Consolidated Edison Development Inc. IPP Burt County Wind NE 61511 BCNE 75.0 Onshore Wind Turbine WND WT (L) Regulatory approvals pending. Not under construction 75.02018 12 56769 Consolidated Edison Development Inc. IPP Wistaria Ranch Solar CA 61750 WICA 100.0 Solar Photovoltaic SUN PV (L) Regulatory approvals pending. Not under construction 106.72018 12 61419 Constellation Solar MC, LLC IPP Gateway Solar MD 61794 GTWYN 5.0 Solar Photovoltaic SUN PV (P) Planned for installation, but regulatory approvals not initiated 5.02018 12 61419 Constellation Solar MC, LLC IPP Gateway Solar MD 61794 GTWYS 2.6 Solar Photovoltaic SUN PV (P) Planned for installation, but regulatory approvals not initiated 2.62018 12 58695 Coronal Development Services IPP Latitude Solar Center TN 61412 LATSC 15.0 Solar Photovoltaic SUN PV (T) Regulatory approvals received. Not under construction 15.02018 12 61060 Cypress Creek Renewables IPP Brantley Solar NC 60623 PV1 50.2 Solar Photovoltaic SUN PV (U) Under construction, less than or equal to 50 percent complete 50.22018 12 61060 Cypress Creek Renewables IPP Fox Creek Solar NC 60624 PV1 50.2 Solar Photovoltaic SUN PV (U) Under construction, less than or equal to 50 percent complete 50.22018 12 60370 DG AMP Solar, LLC IPP DG AMP Solar Brewster OH 61818 AMPBR 1.9 Solar Photovoltaic SUN PV (L) Regulatory approvals pending. Not under construction 1.92018 12 5109 DTE Electric Company Electric Utility Pine River Wind Park MI 61106 1 161.3 Onshore Wind Turbine WND WT (U) Under construction, less than or equal to 50 percent complete 161.32018 12 6455 Duke Energy Florida, LLC Electric Utility Citrus County Combined Cycle Plant FL 60138 2GTA 251.7 Natural Gas Fired Combined Cycle NG CT (V) Under construction, more than 50 percent complete 310.32018 12 6455 Duke Energy Florida, LLC Electric Utility Citrus County Combined Cycle Plant FL 60138 2GTB 251.7 Natural Gas Fired Combined Cycle NG CT (V) Under construction, more than 50 percent complete 310.32018 12 6455 Duke Energy Florida, LLC Electric Utility Citrus County Combined Cycle Plant FL 60138 CC2ST 316.7 Natural Gas Fired Combined Cycle NG CA (V) Under construction, more than 50 percent complete 364.72018 12 6455 Duke Energy Florida, LLC Electric Utility Hamilton Solar Power Plant FL 61807 PV1 74.9 Solar Photovoltaic SUN PV (L) Regulatory approvals pending. Not under construction 74.92018 12 56215 E ON Climate Renewables N America LLC IPP Stella Wind Farm TX 59063 WT1 201.0 Onshore Wind Turbine WND WT (U) Under construction, less than or equal to 50 percent complete 201.02018 12 58970 Ecoplexus, Inc IPP Boykin PV1 NC 59996 BOYK1 17.0 Solar Photovoltaic SUN PV (L) Regulatory approvals pending. Not under construction 17.02018 12 58970 Ecoplexus, Inc IPP E Nash PV1 NC 60002 NASH1 20.0 Solar Photovoltaic SUN PV (L) Regulatory approvals pending. Not under construction 20.02018 12 58970 Ecoplexus, Inc IPP Everett PV1 NC 60997 EVRT1 10.0 Solar Photovoltaic SUN PV (L) Regulatory approvals pending. Not under construction 10.02018 12 58970 Ecoplexus, Inc IPP Grandy PV 1 NC 59518 GRAND 20.0 Solar Photovoltaic SUN PV (T) Regulatory approvals received. Not under construction 20.02018 12 58970 Ecoplexus, Inc IPP High Shoals PV1 NC 59997 HISHO 16.0 Solar Photovoltaic SUN PV (T) Regulatory approvals received. Not under construction 16.02018 12 58970 Ecoplexus, Inc IPP Round Hill PV1 NC 59998 RNDHL 5.0 Solar Photovoltaic SUN PV (L) Regulatory approvals pending. Not under construction 5.02018 12 58970 Ecoplexus, Inc IPP Underwood PV2 NC 60998 UNWD2 16.0 Solar Photovoltaic SUN PV (L) Regulatory approvals pending. Not under construction 16.02018 12 58970 Ecoplexus, Inc IPP Willoughby PV1 NC 60003 WILL1 20.0 Solar Photovoltaic SUN PV (L) Regulatory approvals pending. Not under construction 20.02018 12 58135 Ecos Energy LLC IPP Apple Hill Solar VT 61037 APPL 2.0 Solar Photovoltaic SUN PV (P) Planned for installation, but regulatory approvals not initiated 2.02018 12 58135 Ecos Energy LLC IPP Lake Perris Solar CA 60973 LKPR 1.5 Solar Photovoltaic SUN PV (P) Planned for installation, but regulatory approvals not initiated 1.52018 12 58135 Ecos Energy LLC IPP San Jacinto Solar CA 60972 SJAC 1.5 Solar Photovoltaic SUN PV (P) Planned for installation, but regulatory approvals not initiated 1.52018 12 58135 Ecos Energy LLC IPP Weybridge 1 Solar VT 61038 WEY1 3.0 Solar Photovoltaic SUN PV (P) Planned for installation, but regulatory approvals not initiated 3.02018 12 61404 Edenton Solar IPP Edenton Solar NC 61781 EDE 5.0 Solar Photovoltaic SUN PV (T) Regulatory approvals received. Not under construction 5.02018 12 61413 Enel Green Power Diamond Vista Wind Project, LLC IPP Diamond Vista Wind Project, LLC KS 61789 DV 299.3 Onshore Wind Turbine WND WT (T) Regulatory approvals received. Not under construction 299.32018 12 60147 Enerparc Solar Development, LLC IPP Hilly Branch NC 60358 28941 2.0 Solar Photovoltaic SUN PV (P) Planned for installation, but regulatory approvals not initiated 2.02018 12 60147 Enerparc Solar Development, LLC IPP Pike Road Solar NC 60360 51116 5.0 Solar Photovoltaic SUN PV (P) Planned for installation, but regulatory approvals not initiated 5.02018 12 56201 Engie North America IPP Live Oak Wind Project TX 61782 WTGS 199.5 Onshore Wind Turbine WND WT (T) Regulatory approvals received. Not under construction 199.52018 12 6035 Exelon Power IPP Exelon West Medway II LLC MA 59882 4 97.4 Natural Gas Fired Combustion Turbine NG GT (U) Under construction, less than or equal to 50 percent complete 100.02018 12 6035 Exelon Power IPP Exelon West Medway II LLC MA 59882 5 97.4 Natural Gas Fired Combustion Turbine NG GT (U) Under construction, less than or equal to 50 percent complete 100.02018 12 59745 First Solar Asset Management IPP North Rosamond Solar LLC CA 59879 GEN01 150.0 Solar Photovoltaic SUN PV (L) Regulatory approvals pending. Not under construction 150.02018 12 59745 First Solar Asset Management IPP Willow Spring Solar, LLC CA 60324 GEN01 100.0 Solar Photovoltaic SUN PV (U) Under construction, less than or equal to 50 percent complete 100.02018 12 58959 Freeport LNG Development L.P Industrial Freeport LP Pretreatment Facility TX 59145 65GTG 77.5 Natural Gas Fired Combustion Turbine NG GT (V) Under construction, more than 50 percent complete 97.02018 12 58146 Gaelectric LLC IPP Jawbone Wind Project MT 58175 JWPI 240.0 Onshore Wind Turbine WND WT (P) Planned for installation, but regulatory approvals not initiated 240.02018 12 60747 Gamble Solar, LLC IPP Gamble Solar NC 61127 12348 3.0 Solar Photovoltaic SUN PV (L) Regulatory approvals pending. Not under construction 3.02018 12 60222 Haida Energy, Inc. Electric Utility Hiilangaay Hydro AK 59037 GEN 1 5.0 Conventional Hydroelectric WAT HY (U) Under construction, less than or equal to 50 percent complete 5.02018 12 61214 Heartland Divide Wind Project, LLC IPP Heartland Divide Wind Project, LLC IA 61609 1 103.5 Onshore Wind Turbine WND WT (L) Regulatory approvals pending. Not under construction 103.52018 12 59462 Heelstone Energy Holdings, LLC IPP Innovative Solar 54 NC 59669 IS054 50.0 Solar Photovoltaic SUN PV (T) Regulatory approvals received. Not under construction 50.0
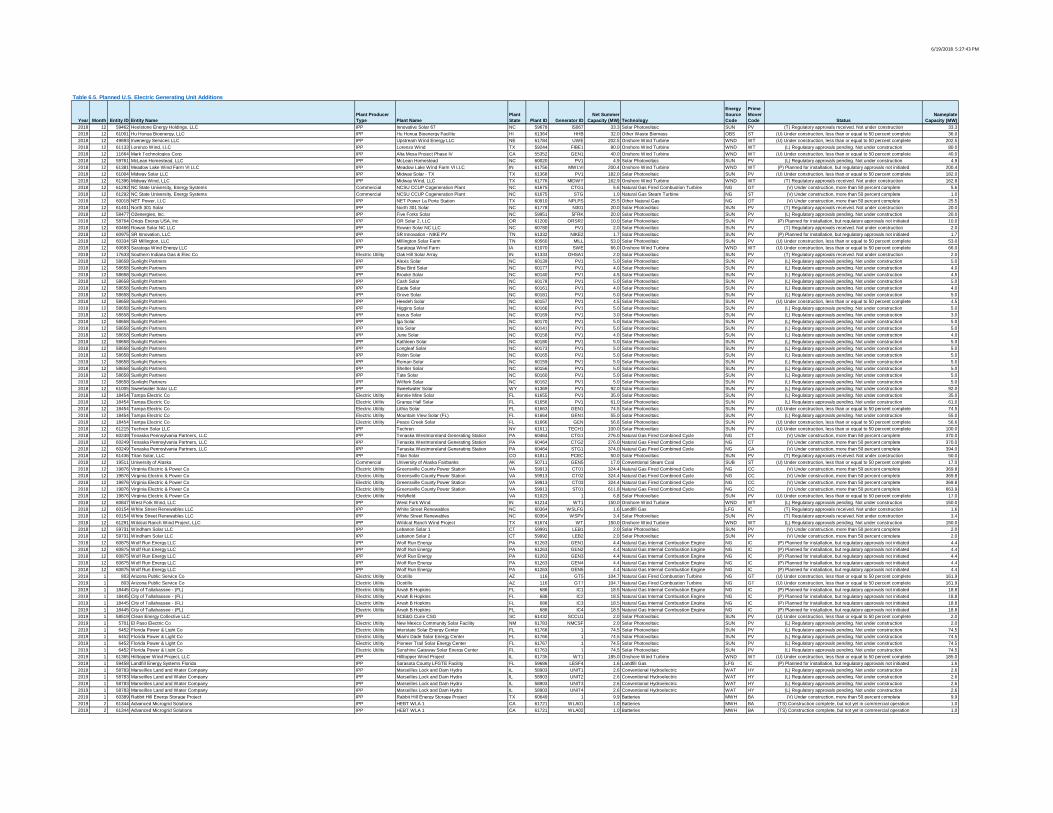
6/19/2018 5:27:43 PM
Year Month Entity ID Entity NamePlant Producer Type Plant Name
Plant State Plant ID Generator ID
Net Summer Capacity (MW) Technology
Energy Source Code
Prime Mover Code Status
Nameplate Capacity (MW)
Table 6.5. Planned U.S. Electric Generating Unit Additions
2018 12 59462 Heelstone Energy Holdings, LLC IPP Innovative Solar 67 NC 59678 IS067 33.3 Solar Photovoltaic SUN PV (T) Regulatory approvals received. Not under construction 33.32018 12 61001 Hu Honua Bioenergy, LLC IPP Hu Honua Bioenergy Facility HI 61364 HHB 32.0 Other Waste Biomass OBS ST (U) Under construction, less than or equal to 50 percent complete 36.02018 12 49893 Invenergy Services LLC IPP Upstream Wind Energy LLC NE 61784 UWE 202.5 Onshore Wind Turbine WND WT (U) Under construction, less than or equal to 50 percent complete 202.52018 12 61133 Lorenzo Wind, LLC IPP Lorenzo Wind TX 59244 FIBE1 80.0 Onshore Wind Turbine WND WT (L) Regulatory approvals pending. Not under construction 80.02018 12 11664 Mark Technologies Corp IPP Alta Mesa Project Phase IV CA 55352 GEN1 40.0 Onshore Wind Turbine WND WT (U) Under construction, less than or equal to 50 percent complete 40.02018 12 59761 McLean Homestead, LLC IPP McLean Homestead NC 60020 PV1 4.9 Solar Photovoltaic SUN PV (L) Regulatory approvals pending. Not under construction 4.92018 12 61381 Meadow Lake Wind Farm VI LLC IPP Meadow Lake Wind Farm VI LLC IN 61756 MWLVI 200.4 Onshore Wind Turbine WND WT (P) Planned for installation, but regulatory approvals not initiated 200.42018 12 61004 Midway Solar LLC IPP Midway Solar - TX TX 61368 PV1 182.0 Solar Photovoltaic SUN PV (U) Under construction, less than or equal to 50 percent complete 182.02018 12 61396 Midway Wind, LLC IPP Midway Wind, LLC TX 61776 MIDWY 162.9 Onshore Wind Turbine WND WT (T) Regulatory approvals received. Not under construction 162.82018 12 61292 NC State University, Energy Systems Commercial NCSU CCUP Cogeneration Plant NC 61675 CTG1 5.6 Natural Gas Fired Combustion Turbine NG GT (V) Under construction, more than 50 percent complete 5.62018 12 61292 NC State University, Energy Systems Commercial NCSU CCUP Cogeneration Plant NC 61675 STG 1.0 Natural Gas Steam Turbine NG ST (V) Under construction, more than 50 percent complete 1.02018 12 60018 NET Power, LLC IPP NET Power La Porte Station TX 60910 NPLPS 25.5 Other Natural Gas NG OT (V) Under construction, more than 50 percent complete 25.52018 12 61401 North 301 Solar IPP North 301 Solar NC 61778 N301 20.0 Solar Photovoltaic SUN PV (T) Regulatory approvals received. Not under construction 20.02018 12 58477 O2energies, Inc. IPP Five Forks Solar NC 59951 5FRK 20.0 Solar Photovoltaic SUN PV (L) Regulatory approvals pending. Not under construction 20.02018 12 58764 Origis Energy USA, Inc IPP OR Solar 2, LLC OR 61200 ORSR2 10.0 Solar Photovoltaic SUN PV (P) Planned for installation, but regulatory approvals not initiated 10.02018 12 60466 Rowan Solar NC LLC IPP Rowan Solar NC LLC NC 60780 PV1 2.0 Solar Photovoltaic SUN PV (T) Regulatory approvals received. Not under construction 2.02018 12 60975 SR Innovation, LLC IPP SR Innovation - NIKE PV TN 61332 NIKE2 1.7 Solar Photovoltaic SUN PV (P) Planned for installation, but regulatory approvals not initiated 1.72018 12 60334 SR Millington, LLC IPP Millington Solar Farm TN 60560 MILL 53.0 Solar Photovoltaic SUN PV (U) Under construction, less than or equal to 50 percent complete 53.02018 12 60693 Saratoga Wind Energy LLC IPP Saratoga Wind Farm IA 61070 SWE 66.0 Onshore Wind Turbine WND WT (U) Under construction, less than or equal to 50 percent complete 66.02018 12 17633 Southern Indiana Gas & Elec Co Electric Utility Oak Hill Solar Array IN 61333 OHSA1 2.0 Solar Photovoltaic SUN PV (T) Regulatory approvals received. Not under construction 2.02018 12 58658 Sunlight Partners IPP Alexis Solar NC 60139 PV1 5.0 Solar Photovoltaic SUN PV (L) Regulatory approvals pending. Not under construction 5.02018 12 58658 Sunlight Partners IPP Blue Bird Solar NC 60177 PV1 4.0 Solar Photovoltaic SUN PV (L) Regulatory approvals pending. Not under construction 4.02018 12 58658 Sunlight Partners IPP Brooke Solar NC 60140 PV1 4.5 Solar Photovoltaic SUN PV (L) Regulatory approvals pending. Not under construction 4.52018 12 58658 Sunlight Partners IPP Cash Solar NC 60178 PV1 5.0 Solar Photovoltaic SUN PV (L) Regulatory approvals pending. Not under construction 5.02018 12 58658 Sunlight Partners IPP Eagle Solar NC 60161 PV1 4.0 Solar Photovoltaic SUN PV (L) Regulatory approvals pending. Not under construction 4.02018 12 58658 Sunlight Partners IPP Grove Solar NC 60181 PV1 5.0 Solar Photovoltaic SUN PV (L) Regulatory approvals pending. Not under construction 5.02018 12 58658 Sunlight Partners IPP Heedeh Solar NC 60157 PV1 4.5 Solar Photovoltaic SUN PV (U) Under construction, less than or equal to 50 percent complete 4.52018 12 58658 Sunlight Partners IPP Higgins Solar NC 60166 PV1 5.0 Solar Photovoltaic SUN PV (L) Regulatory approvals pending. Not under construction 5.02018 12 58658 Sunlight Partners IPP Icarus Solar NC 60169 PV1 3.0 Solar Photovoltaic SUN PV (L) Regulatory approvals pending. Not under construction 3.02018 12 58658 Sunlight Partners IPP Iga Solar NC 60170 PV1 5.0 Solar Photovoltaic SUN PV (L) Regulatory approvals pending. Not under construction 5.02018 12 58658 Sunlight Partners IPP Izia Solar NC 60141 PV1 5.0 Solar Photovoltaic SUN PV (L) Regulatory approvals pending. Not under construction 5.02018 12 58658 Sunlight Partners IPP June Solar NC 60158 PV1 4.0 Solar Photovoltaic SUN PV (L) Regulatory approvals pending. Not under construction 4.02018 12 58658 Sunlight Partners IPP Kathleen Solar NC 60180 PV1 5.0 Solar Photovoltaic SUN PV (L) Regulatory approvals pending. Not under construction 5.02018 12 58658 Sunlight Partners IPP Longleaf Solar NC 60173 PV1 5.0 Solar Photovoltaic SUN PV (L) Regulatory approvals pending. Not under construction 5.02018 12 58658 Sunlight Partners IPP Robin Solar NC 60165 PV1 5.0 Solar Photovoltaic SUN PV (L) Regulatory approvals pending. Not under construction 5.02018 12 58658 Sunlight Partners IPP Roman Solar NC 60159 PV1 5.0 Solar Photovoltaic SUN PV (L) Regulatory approvals pending. Not under construction 5.02018 12 58658 Sunlight Partners IPP Shelter Solar NC 60156 PV1 5.0 Solar Photovoltaic SUN PV (L) Regulatory approvals pending. Not under construction 5.02018 12 58658 Sunlight Partners IPP Tate Solar NC 60160 PV1 5.0 Solar Photovoltaic SUN PV (L) Regulatory approvals pending. Not under construction 5.02018 12 58658 Sunlight Partners IPP Wilfork Solar NC 60162 PV1 5.0 Solar Photovoltaic SUN PV (L) Regulatory approvals pending. Not under construction 5.02018 12 61005 Sweetwater Solar LLC IPP Sweetwater Solar WY 61369 PV1 92.0 Solar Photovoltaic SUN PV (L) Regulatory approvals pending. Not under construction 92.02018 12 18454 Tampa Electric Co Electric Utility Bonnie Mine Solar FL 61655 PV1 35.0 Solar Photovoltaic SUN PV (L) Regulatory approvals pending. Not under construction 35.02018 12 18454 Tampa Electric Co Electric Utility Grange Hall Solar FL 61656 PV1 61.0 Solar Photovoltaic SUN PV (L) Regulatory approvals pending. Not under construction 61.02018 12 18454 Tampa Electric Co Electric Utility Lithia Solar FL 61663 GEN1 74.5 Solar Photovoltaic SUN PV (U) Under construction, less than or equal to 50 percent complete 74.52018 12 18454 Tampa Electric Co Electric Utility Mountain View Solar (FL) FL 61664 GEN1 55.0 Solar Photovoltaic SUN PV (L) Regulatory approvals pending. Not under construction 55.02018 12 18454 Tampa Electric Co Electric Utility Peace Creek Solar FL 61666 GEN 56.6 Solar Photovoltaic SUN PV (U) Under construction, less than or equal to 50 percent complete 56.62018 12 61215 Techren Solar LLC IPP Techren NV 61611 TECH1 100.0 Solar Photovoltaic SUN PV (U) Under construction, less than or equal to 50 percent complete 100.02018 12 60249 Tenaska Pennsylvania Partners, LLC IPP Tenaska Westmoreland Generating Station PA 60464 CTG1 276.0 Natural Gas Fired Combined Cycle NG CT (V) Under construction, more than 50 percent complete 370.02018 12 60249 Tenaska Pennsylvania Partners, LLC IPP Tenaska Westmoreland Generating Station PA 60464 CTG2 276.0 Natural Gas Fired Combined Cycle NG CT (V) Under construction, more than 50 percent complete 370.02018 12 60249 Tenaska Pennsylvania Partners, LLC IPP Tenaska Westmoreland Generating Station PA 60464 STG1 374.0 Natural Gas Fired Combined Cycle NG CA (V) Under construction, more than 50 percent complete 394.02018 12 61436 Titan Solar, LLC IPP Titan Solar CO 61811 PCEC 50.0 Solar Photovoltaic SUN PV (T) Regulatory approvals received. Not under construction 50.02018 12 19511 University of Alaska Commercial University of Alaska Fairbanks AK 50711 GEN5 17.0 Conventional Steam Coal SUB ST (U) Under construction, less than or equal to 50 percent complete 17.02018 12 19876 Virginia Electric & Power Co Electric Utility Greensville County Power Station VA 59913 CT01 324.4 Natural Gas Fired Combined Cycle NG CC (V) Under construction, more than 50 percent complete 369.82018 12 19876 Virginia Electric & Power Co Electric Utility Greensville County Power Station VA 59913 CT02 324.4 Natural Gas Fired Combined Cycle NG CC (V) Under construction, more than 50 percent complete 369.82018 12 19876 Virginia Electric & Power Co Electric Utility Greensville County Power Station VA 59913 CT03 324.4 Natural Gas Fired Combined Cycle NG CC (V) Under construction, more than 50 percent complete 369.82018 12 19876 Virginia Electric & Power Co Electric Utility Greensville County Power Station VA 59913 ST01 611.8 Natural Gas Fired Combined Cycle NG CC (V) Under construction, more than 50 percent complete 663.92018 12 19876 Virginia Electric & Power Co Electric Utility Hollyfield VA 61023 1 6.8 Solar Photovoltaic SUN PV (U) Under construction, less than or equal to 50 percent complete 17.02018 12 60847 West Fork Wind, LLC IPP West Fork Wind IN 61214 WT1 150.0 Onshore Wind Turbine WND WT (L) Regulatory approvals pending. Not under construction 150.02018 12 60154 White Street Renewables LLC IPP White Street Renewables NC 60364 WSLFG 1.6 Landfill Gas LFG IC (T) Regulatory approvals received. Not under construction 1.62018 12 60154 White Street Renewables LLC IPP White Street Renewables NC 60364 WSPV 3.4 Solar Photovoltaic SUN PV (T) Regulatory approvals received. Not under construction 3.42018 12 61291 Wildcat Ranch Wind Project, LLC IPP Wildcat Ranch Wind Project TX 61674 WT 150.0 Onshore Wind Turbine WND WT (L) Regulatory approvals pending. Not under construction 150.02018 12 59731 Windham Solar LLC IPP Lebanon Solar 1 CT 59991 LEB1 2.0 Solar Photovoltaic SUN PV (V) Under construction, more than 50 percent complete 2.02018 12 59731 Windham Solar LLC IPP Lebanon Solar 2 CT 59992 LEB2 2.0 Solar Photovoltaic SUN PV (V) Under construction, more than 50 percent complete 2.02018 12 60875 Wolf Run Energy LLC IPP Wolf Run Energy PA 61263 GEN1 4.4 Natural Gas Internal Combustion Engine NG IC (P) Planned for installation, but regulatory approvals not initiated 4.42018 12 60875 Wolf Run Energy LLC IPP Wolf Run Energy PA 61263 GEN2 4.4 Natural Gas Internal Combustion Engine NG IC (P) Planned for installation, but regulatory approvals not initiated 4.42018 12 60875 Wolf Run Energy LLC IPP Wolf Run Energy PA 61263 GEN3 4.4 Natural Gas Internal Combustion Engine NG IC (P) Planned for installation, but regulatory approvals not initiated 4.42018 12 60875 Wolf Run Energy LLC IPP Wolf Run Energy PA 61263 GEN4 4.4 Natural Gas Internal Combustion Engine NG IC (P) Planned for installation, but regulatory approvals not initiated 4.42018 12 60875 Wolf Run Energy LLC IPP Wolf Run Energy PA 61263 GEN5 4.4 Natural Gas Internal Combustion Engine NG IC (P) Planned for installation, but regulatory approvals not initiated 4.42019 1 803 Arizona Public Service Co Electric Utility Ocotillo AZ 116 GT5 104.7 Natural Gas Fired Combustion Turbine NG GT (U) Under construction, less than or equal to 50 percent complete 161.92019 1 803 Arizona Public Service Co Electric Utility Ocotillo AZ 116 GT7 104.7 Natural Gas Fired Combustion Turbine NG GT (U) Under construction, less than or equal to 50 percent complete 161.92019 1 18445 City of Tallahassee - (FL) Electric Utility Arvah B Hopkins FL 688 IC1 18.5 Natural Gas Internal Combustion Engine NG IC (P) Planned for installation, but regulatory approvals not initiated 18.82019 1 18445 City of Tallahassee - (FL) Electric Utility Arvah B Hopkins FL 688 IC2 18.5 Natural Gas Internal Combustion Engine NG IC (P) Planned for installation, but regulatory approvals not initiated 18.82019 1 18445 City of Tallahassee - (FL) Electric Utility Arvah B Hopkins FL 688 IC3 18.5 Natural Gas Internal Combustion Engine NG IC (P) Planned for installation, but regulatory approvals not initiated 18.82019 1 18445 City of Tallahassee - (FL) Electric Utility Arvah B Hopkins FL 688 IC4 18.5 Natural Gas Internal Combustion Engine NG IC (P) Planned for installation, but regulatory approvals not initiated 18.82019 1 58519 Clean Energy Collective LLC IPP SCE&G Curie CSG SC 61432 SCCU1 2.0 Solar Photovoltaic SUN PV (U) Under construction, less than or equal to 50 percent complete 2.02019 1 5701 El Paso Electric Co Electric Utility New Mexico Community Solar Facility NM 61783 NMCSF 2.0 Solar Photovoltaic SUN PV (L) Regulatory approvals pending. Not under construction 2.02019 1 6452 Florida Power & Light Co Electric Utility Interstate Solar Energy Center FL 61768 1 74.5 Solar Photovoltaic SUN PV (L) Regulatory approvals pending. Not under construction 74.52019 1 6452 Florida Power & Light Co Electric Utility Miami Dade Solar Energy Center FL 61766 1 74.5 Solar Photovoltaic SUN PV (L) Regulatory approvals pending. Not under construction 74.52019 1 6452 Florida Power & Light Co Electric Utility Pioneer Trail Solar Energy Center FL 61767 1 74.5 Solar Photovoltaic SUN PV (L) Regulatory approvals pending. Not under construction 74.52019 1 6452 Florida Power & Light Co Electric Utility Sunshine Gateway Solar Energy Center FL 61763 1 74.5 Solar Photovoltaic SUN PV (L) Regulatory approvals pending. Not under construction 74.52019 1 61365 Hilltopper Wind Project, LLC IPP Hilltopper Wind Project IL 61735 WT1 185.0 Onshore Wind Turbine WND WT (U) Under construction, less than or equal to 50 percent complete 185.02019 1 59458 Landfill Energy Systems Florida IPP Sarasota County LFGTE Facility FL 59686 LESF4 1.6 Landfill Gas LFG IC (P) Planned for installation, but regulatory approvals not initiated 1.62019 1 58783 Marseilles Land and Water Company IPP Marseilles Lock and Dam Hydro IL 58903 UNIT1 2.6 Conventional Hydroelectric WAT HY (L) Regulatory approvals pending. Not under construction 2.62019 1 58783 Marseilles Land and Water Company IPP Marseilles Lock and Dam Hydro IL 58903 UNIT2 2.6 Conventional Hydroelectric WAT HY (L) Regulatory approvals pending. Not under construction 2.62019 1 58783 Marseilles Land and Water Company IPP Marseilles Lock and Dam Hydro IL 58903 UNIT3 2.6 Conventional Hydroelectric WAT HY (L) Regulatory approvals pending. Not under construction 2.62019 1 58783 Marseilles Land and Water Company IPP Marseilles Lock and Dam Hydro IL 58903 UNIT4 2.6 Conventional Hydroelectric WAT HY (L) Regulatory approvals pending. Not under construction 2.62019 1 60389 Rabbit Hill Energy Storage Project IPP Rabbit Hill Energy Storage Project TX 60649 1 9.9 Batteries MWH BA (V) Under construction, more than 50 percent complete 9.92019 2 61344 Advanced Microgrid Solutions IPP HEBT WLA 1 CA 61721 WLA01 1.0 Batteries MWH BA (TS) Construction complete, but not yet in commercial operation 1.02019 2 61344 Advanced Microgrid Solutions IPP HEBT WLA 1 CA 61721 WLA02 1.0 Batteries MWH BA (TS) Construction complete, but not yet in commercial operation 1.0
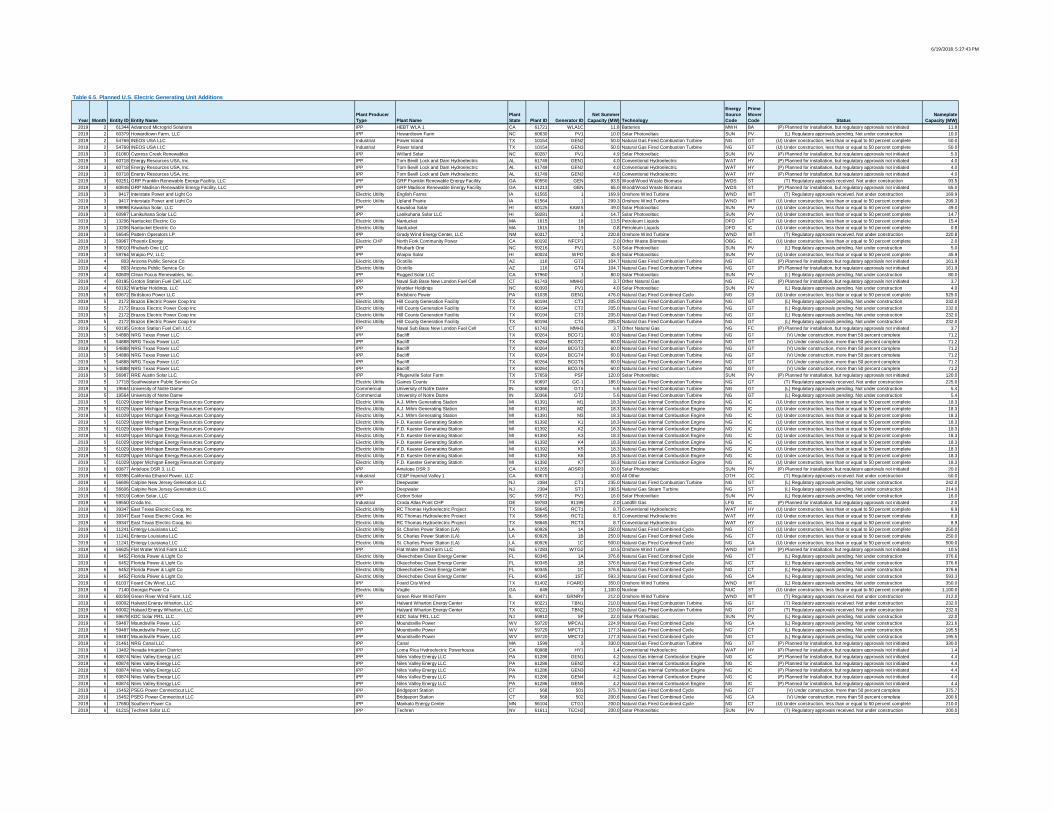
6/19/2018 5:27:43 PM
Year Month Entity ID Entity NamePlant Producer Type Plant Name
Plant State Plant ID Generator ID
Net Summer Capacity (MW) Technology
Energy Source Code
Prime Mover Code Status
Nameplate Capacity (MW)
Table 6.5. Planned U.S. Electric Generating Unit Additions
2019 2 61344 Advanced Microgrid Solutions IPP HEBT WLA 1 CA 61721 WLA1C 11.8 Batteries MWH BA (P) Planned for installation, but regulatory approvals not initiated 11.82019 2 60379 Howardtown Farm, LLC IPP Howardtown Farm NC 60630 PV1 10.0 Solar Photovoltaic SUN PV (L) Regulatory approvals pending. Not under construction 10.02019 2 54769 INEOS USA LLC Industrial Power Island TX 10154 GEN2 50.0 Natural Gas Fired Combustion Turbine NG GT (U) Under construction, less than or equal to 50 percent complete 50.02019 2 54769 INEOS USA LLC Industrial Power Island TX 10154 GEN3 50.0 Natural Gas Fired Combustion Turbine NG GT (U) Under construction, less than or equal to 50 percent complete 50.02019 3 61060 Cypress Creek Renewables IPP Willard Solar NC 60287 PV1 4.9 Solar Photovoltaic SUN PV (P) Planned for installation, but regulatory approvals not initiated 5.02019 3 60718 Energy Resources USA, Inc. IPP Tom Bevill Lock and Dam Hydroelectric AL 61749 GEN1 4.0 Conventional Hydroelectric WAT HY (P) Planned for installation, but regulatory approvals not initiated 4.02019 3 60718 Energy Resources USA, Inc. IPP Tom Bevill Lock and Dam Hydroelectric AL 61749 GEN2 4.0 Conventional Hydroelectric WAT HY (P) Planned for installation, but regulatory approvals not initiated 4.02019 3 60718 Energy Resources USA, Inc. IPP Tom Bevill Lock and Dam Hydroelectric AL 61749 GEN3 4.0 Conventional Hydroelectric WAT HY (P) Planned for installation, but regulatory approvals not initiated 4.02019 3 60251 GRP Franklin Renewable Energy Facility, LLC IPP GRP Franklin Renewable Energy Facility GA 60550 GEN 93.5 Wood/Wood Waste Biomass WDS ST (T) Regulatory approvals received. Not under construction 93.52019 3 60846 GRP Madison Renewable Energy Facility, LLC IPP GRP Madison Renewable Energy Facility GA 61213 GEN 65.0 Wood/Wood Waste Biomass WDS ST (P) Planned for installation, but regulatory approvals not initiated 65.02019 3 9417 Interstate Power and Light Co Electric Utility English Farms IA 61565 1 169.9 Onshore Wind Turbine WND WT (T) Regulatory approvals received. Not under construction 169.92019 3 9417 Interstate Power and Light Co Electric Utility Upland Prairie IA 61564 1 299.3 Onshore Wind Turbine WND WT (U) Under construction, less than or equal to 50 percent complete 299.32019 3 59898 Kawailoa Solar, LLC IPP Kawailoa Solar HI 60125 KAWS 49.0 Solar Photovoltaic SUN PV (U) Under construction, less than or equal to 50 percent complete 49.02019 3 60987 Lanikuhana Solar LLC IPP Lanikuhana Solar LLC HI 58281 1 14.7 Solar Photovoltaic SUN PV (U) Under construction, less than or equal to 50 percent complete 14.72019 3 13206 Nantucket Electric Co Electric Utility Nantucket MA 1615 18 13.5 Petroleum Liquids DFO GT (U) Under construction, less than or equal to 50 percent complete 15.42019 3 13206 Nantucket Electric Co Electric Utility Nantucket MA 1615 19 0.8 Petroleum Liquids DFO IC (U) Under construction, less than or equal to 50 percent complete 0.82019 3 56545 Pattern Operators LP IPP Grady Wind Energy Center, LLC NM 60317 1 220.8 Onshore Wind Turbine WND WT (T) Regulatory approvals received. Not under construction 220.82019 3 59967 Phoenix Energy Electric CHP North Fork Community Power CA 60192 NFCP1 2.0 Other Waste Biomass OBG IC (U) Under construction, less than or equal to 50 percent complete 2.02019 3 59010 Rhubarb One LLC IPP Rhubarb One NC 59216 PV1 5.0 Solar Photovoltaic SUN PV (L) Regulatory approvals pending. Not under construction 5.02019 3 59764 Waipio PV, LLC IPP Waipio Solar HI 60024 WPO 45.9 Solar Photovoltaic SUN PV (U) Under construction, less than or equal to 50 percent complete 45.92019 4 803 Arizona Public Service Co Electric Utility Ocotillo AZ 116 GT3 104.7 Natural Gas Fired Combustion Turbine NG GT (P) Planned for installation, but regulatory approvals not initiated 161.92019 4 803 Arizona Public Service Co Electric Utility Ocotillo AZ 116 GT4 104.7 Natural Gas Fired Combustion Turbine NG GT (P) Planned for installation, but regulatory approvals not initiated 161.92019 4 60609 Clean Focus Renewables, Inc. IPP Rugged Solar LLC CA 57960 1 80.0 Solar Photovoltaic SUN PV (L) Regulatory approvals pending. Not under construction 80.02019 4 60195 Groton Station Fuel Cell, LLC IPP Naval Sub Base New London Fuel Cell CT 61743 MMH2 3.7 Other Natural Gas NG FC (P) Planned for installation, but regulatory approvals not initiated 3.72019 4 60192 Warbler Holdings, LLC IPP Warbler Holdings NC 60393 PV1 4.0 Solar Photovoltaic SUN PV (L) Regulatory approvals pending. Not under construction 4.02019 5 60672 Birdsboro Power LLC IPP Birdsboro Power PA 61035 GEN1 476.0 Natural Gas Fired Combined Cycle NG CS (U) Under construction, less than or equal to 50 percent complete 525.02019 5 2172 Brazos Electric Power Coop Inc Electric Utility Hill County Generation Facility TX 60194 CT1 205.0 Natural Gas Fired Combustion Turbine NG GT (L) Regulatory approvals pending. Not under construction 232.02019 5 2172 Brazos Electric Power Coop Inc Electric Utility Hill County Generation Facility TX 60194 CT2 205.0 Natural Gas Fired Combustion Turbine NG GT (L) Regulatory approvals pending. Not under construction 232.02019 5 2172 Brazos Electric Power Coop Inc Electric Utility Hill County Generation Facility TX 60194 CT3 205.0 Natural Gas Fired Combustion Turbine NG GT (L) Regulatory approvals pending. Not under construction 232.02019 5 2172 Brazos Electric Power Coop Inc Electric Utility Hill County Generation Facility TX 60194 CT4 205.0 Natural Gas Fired Combustion Turbine NG GT (L) Regulatory approvals pending. Not under construction 232.02019 5 60195 Groton Station Fuel Cell, LLC IPP Naval Sub Base New London Fuel Cell CT 61743 MMH3 3.7 Other Natural Gas NG FC (P) Planned for installation, but regulatory approvals not initiated 3.72019 5 54888 NRG Texas Power LLC IPP Bacliff TX 60264 BCGT1 60.0 Natural Gas Fired Combustion Turbine NG GT (V) Under construction, more than 50 percent complete 71.22019 5 54888 NRG Texas Power LLC IPP Bacliff TX 60264 BCGT2 60.0 Natural Gas Fired Combustion Turbine NG GT (V) Under construction, more than 50 percent complete 71.22019 5 54888 NRG Texas Power LLC IPP Bacliff TX 60264 BCGT3 60.0 Natural Gas Fired Combustion Turbine NG GT (V) Under construction, more than 50 percent complete 71.22019 5 54888 NRG Texas Power LLC IPP Bacliff TX 60264 BCGT4 60.0 Natural Gas Fired Combustion Turbine NG GT (V) Under construction, more than 50 percent complete 71.22019 5 54888 NRG Texas Power LLC IPP Bacliff TX 60264 BCGT5 60.0 Natural Gas Fired Combustion Turbine NG GT (V) Under construction, more than 50 percent complete 71.22019 5 54888 NRG Texas Power LLC IPP Bacliff TX 60264 BCGT6 60.0 Natural Gas Fired Combustion Turbine NG GT (V) Under construction, more than 50 percent complete 71.22019 5 56987 RRE Austin Solar LLC IPP Pflugerville Solar Farm TX 57659 PSF 120.0 Solar Photovoltaic SUN PV (P) Planned for installation, but regulatory approvals not initiated 120.02019 5 17718 Southwestern Public Service Co Electric Utility Gaines County TX 60697 GC-1 186.0 Natural Gas Fired Combustion Turbine NG GT (T) Regulatory approvals received. Not under construction 225.02019 5 19564 University of Notre Dame Commercial University of Notre Dame IN 50366 GT1 5.6 Natural Gas Fired Combustion Turbine NG GT (L) Regulatory approvals pending. Not under construction 5.42019 5 19564 University of Notre Dame Commercial University of Notre Dame IN 50366 GT2 5.6 Natural Gas Fired Combustion Turbine NG GT (L) Regulatory approvals pending. Not under construction 5.42019 5 61029 Upper Michigan Energy Resources Company Electric Utility A.J. Mihm Generating Station MI 61391 M1 18.3 Natural Gas Internal Combustion Engine NG IC (U) Under construction, less than or equal to 50 percent complete 18.32019 5 61029 Upper Michigan Energy Resources Company Electric Utility A.J. Mihm Generating Station MI 61391 M2 18.3 Natural Gas Internal Combustion Engine NG IC (U) Under construction, less than or equal to 50 percent complete 18.32019 5 61029 Upper Michigan Energy Resources Company Electric Utility A.J. Mihm Generating Station MI 61391 M3 18.3 Natural Gas Internal Combustion Engine NG IC (U) Under construction, less than or equal to 50 percent complete 18.32019 5 61029 Upper Michigan Energy Resources Company Electric Utility F.D. Kuester Generating Station MI 61392 K1 18.3 Natural Gas Internal Combustion Engine NG IC (U) Under construction, less than or equal to 50 percent complete 18.32019 5 61029 Upper Michigan Energy Resources Company Electric Utility F.D. Kuester Generating Station MI 61392 K2 18.3 Natural Gas Internal Combustion Engine NG IC (U) Under construction, less than or equal to 50 percent complete 18.32019 5 61029 Upper Michigan Energy Resources Company Electric Utility F.D. Kuester Generating Station MI 61392 K3 18.3 Natural Gas Internal Combustion Engine NG IC (U) Under construction, less than or equal to 50 percent complete 18.32019 5 61029 Upper Michigan Energy Resources Company Electric Utility F.D. Kuester Generating Station MI 61392 K4 18.3 Natural Gas Internal Combustion Engine NG IC (U) Under construction, less than or equal to 50 percent complete 18.32019 5 61029 Upper Michigan Energy Resources Company Electric Utility F.D. Kuester Generating Station MI 61392 K5 18.3 Natural Gas Internal Combustion Engine NG IC (U) Under construction, less than or equal to 50 percent complete 18.32019 5 61029 Upper Michigan Energy Resources Company Electric Utility F.D. Kuester Generating Station MI 61392 K6 18.3 Natural Gas Internal Combustion Engine NG IC (U) Under construction, less than or equal to 50 percent complete 18.32019 5 61029 Upper Michigan Energy Resources Company Electric Utility F.D. Kuester Generating Station MI 61392 K7 18.3 Natural Gas Internal Combustion Engine NG IC (U) Under construction, less than or equal to 50 percent complete 18.32019 6 60877 Antelope DSR 3, LLC IPP Antelope DSR 3 CA 61265 ADSR3 20.0 Solar Photovoltaic SUN PV (P) Planned for installation, but regulatory approvals not initiated 20.02019 6 60395 California Ethanol Power, LLC Industrial CE&P Imperial Valley 1 CA 60670 1 50.0 All Other OTH CC (T) Regulatory approvals received. Not under construction 50.02019 6 56606 Calpine New Jersey Generation LLC IPP Deepwater NJ 2384 CT1 235.0 Natural Gas Fired Combustion Turbine NG GT (L) Regulatory approvals pending. Not under construction 242.02019 6 56606 Calpine New Jersey Generation LLC IPP Deepwater NJ 2384 ST1 198.5 Natural Gas Steam Turbine NG ST (L) Regulatory approvals pending. Not under construction 214.02019 6 59319 Cotton Solar, LLC IPP Cotton Solar SC 59572 PV1 16.0 Solar Photovoltaic SUN PV (L) Regulatory approvals pending. Not under construction 16.02019 6 59550 Croda Inc. Industrial Croda Atlas Point CHP DE 59783 91199 2.0 Landfill Gas LFG IC (P) Planned for installation, but regulatory approvals not initiated 2.02019 6 39347 East Texas Electric Coop, Inc Electric Utility RC Thomas Hydroelectric Project TX 58645 RCT1 8.7 Conventional Hydroelectric WAT HY (U) Under construction, less than or equal to 50 percent complete 8.92019 6 39347 East Texas Electric Coop, Inc Electric Utility RC Thomas Hydroelectric Project TX 58645 RCT2 8.7 Conventional Hydroelectric WAT HY (U) Under construction, less than or equal to 50 percent complete 8.92019 6 39347 East Texas Electric Coop, Inc Electric Utility RC Thomas Hydroelectric Project TX 58645 RCT3 8.7 Conventional Hydroelectric WAT HY (U) Under construction, less than or equal to 50 percent complete 8.92019 6 11241 Entergy Louisiana LLC Electric Utility St. Charles Power Station (LA) LA 60926 1A 250.0 Natural Gas Fired Combined Cycle NG CT (U) Under construction, less than or equal to 50 percent complete 250.02019 6 11241 Entergy Louisiana LLC Electric Utility St. Charles Power Station (LA) LA 60926 1B 250.0 Natural Gas Fired Combined Cycle NG CT (U) Under construction, less than or equal to 50 percent complete 250.02019 6 11241 Entergy Louisiana LLC Electric Utility St. Charles Power Station (LA) LA 60926 1C 500.0 Natural Gas Fired Combined Cycle NG CA (U) Under construction, less than or equal to 50 percent complete 500.02019 6 56625 Flat Water Wind Farm LLC IPP Flat Water Wind Farm LLC NE 57283 WTG2 10.5 Onshore Wind Turbine WND WT (P) Planned for installation, but regulatory approvals not initiated 10.52019 6 6452 Florida Power & Light Co Electric Utility Okeechobee Clean Energy Center FL 60345 1A 376.6 Natural Gas Fired Combined Cycle NG CT (L) Regulatory approvals pending. Not under construction 376.62019 6 6452 Florida Power & Light Co Electric Utility Okeechobee Clean Energy Center FL 60345 1B 376.6 Natural Gas Fired Combined Cycle NG CT (L) Regulatory approvals pending. Not under construction 376.62019 6 6452 Florida Power & Light Co Electric Utility Okeechobee Clean Energy Center FL 60345 1C 376.6 Natural Gas Fired Combined Cycle NG CT (L) Regulatory approvals pending. Not under construction 376.62019 6 6452 Florida Power & Light Co Electric Utility Okeechobee Clean Energy Center FL 60345 1ST 593.3 Natural Gas Fired Combined Cycle NG CA (L) Regulatory approvals pending. Not under construction 593.32019 6 61037 Foard City Wind, LLC IPP Foard City Wind TX 61402 FOARD 350.0 Onshore Wind Turbine WND WT (L) Regulatory approvals pending. Not under construction 350.02019 6 7140 Georgia Power Co Electric Utility Vogtle GA 649 3 1,100.0 Nuclear NUC ST (U) Under construction, less than or equal to 50 percent complete 1,100.02019 6 60259 Green River Wind Farm, LLC IPP Green River Wind Farm IL 60471 GRNRV 212.0 Onshore Wind Turbine WND WT (T) Regulatory approvals received. Not under construction 212.02019 6 60002 Halyard Energy Wharton, LLC IPP Halyard Wharton Energy Center TX 60221 TBN1 210.0 Natural Gas Fired Combustion Turbine NG GT (T) Regulatory approvals received. Not under construction 232.02019 6 60002 Halyard Energy Wharton, LLC IPP Halyard Wharton Energy Center TX 60221 TBN2 210.0 Natural Gas Fired Combustion Turbine NG GT (T) Regulatory approvals received. Not under construction 232.02019 6 59678 KDC Solar PR1, LLC IPP KDC Solar PR1, LLC NJ 59910 SF 22.0 Solar Photovoltaic SUN PV (L) Regulatory approvals pending. Not under construction 22.02019 6 59487 Moundsville Power, LLC IPP Moundsville Power WV 59720 MPCA1 224.9 Natural Gas Fired Combined Cycle NG CA (L) Regulatory approvals pending. Not under construction 321.62019 6 59487 Moundsville Power, LLC IPP Moundsville Power WV 59720 MPCT1 177.3 Natural Gas Fired Combined Cycle NG CT (L) Regulatory approvals pending. Not under construction 195.52019 6 59487 Moundsville Power, LLC IPP Moundsville Power WV 59720 MPCT2 177.3 Natural Gas Fired Combined Cycle NG CT (L) Regulatory approvals pending. Not under construction 195.52019 6 21461 NRG Canal LLC IPP Canal MA 1599 3 330.0 Natural Gas Fired Combustion Turbine NG GT (P) Planned for installation, but regulatory approvals not initiated 330.02019 6 13402 Nevada Irrigation District IPP Loma Rica Hydroelectric Powerhouse CA 60988 HY1 1.4 Conventional Hydroelectric WAT HY (P) Planned for installation, but regulatory approvals not initiated 1.42019 6 60874 Niles Valley Energy LLC IPP Niles Valley Energy LLC PA 61286 GEN1 4.2 Natural Gas Internal Combustion Engine NG IC (P) Planned for installation, but regulatory approvals not initiated 4.42019 6 60874 Niles Valley Energy LLC IPP Niles Valley Energy LLC PA 61286 GEN2 4.2 Natural Gas Internal Combustion Engine NG IC (P) Planned for installation, but regulatory approvals not initiated 4.42019 6 60874 Niles Valley Energy LLC IPP Niles Valley Energy LLC PA 61286 GEN3 4.2 Natural Gas Internal Combustion Engine NG IC (P) Planned for installation, but regulatory approvals not initiated 4.42019 6 60874 Niles Valley Energy LLC IPP Niles Valley Energy LLC PA 61286 GEN4 4.2 Natural Gas Internal Combustion Engine NG IC (P) Planned for installation, but regulatory approvals not initiated 4.42019 6 60874 Niles Valley Energy LLC IPP Niles Valley Energy LLC PA 61286 GEN5 4.2 Natural Gas Internal Combustion Engine NG IC (P) Planned for installation, but regulatory approvals not initiated 4.42019 6 15452 PSEG Power Connecticut LLC IPP Bridgeport Station CT 568 501 375.7 Natural Gas Fired Combined Cycle NG CT (V) Under construction, more than 50 percent complete 375.72019 6 15452 PSEG Power Connecticut LLC IPP Bridgeport Station CT 568 502 200.6 Natural Gas Fired Combined Cycle NG CA (V) Under construction, more than 50 percent complete 200.62019 6 17650 Southern Power Co IPP Mankato Energy Center MN 56104 CTG1 200.0 Natural Gas Fired Combined Cycle NG CT (U) Under construction, less than or equal to 50 percent complete 210.02019 6 61215 Techren Solar LLC IPP Techren NV 61611 TECH2 200.0 Solar Photovoltaic SUN PV (T) Regulatory approvals received. Not under construction 200.0
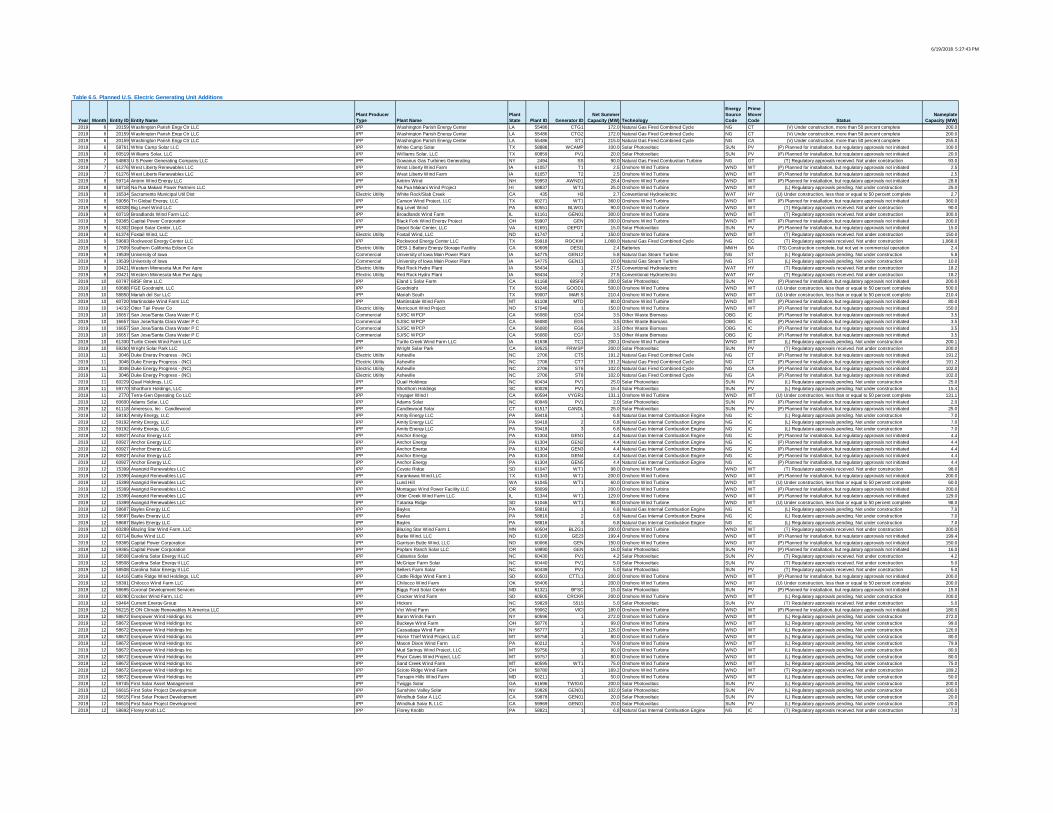
6/19/2018 5:27:43 PM
Year Month Entity ID Entity NamePlant Producer Type Plant Name
Plant State Plant ID Generator ID
Net Summer Capacity (MW) Technology
Energy Source Code
Prime Mover Code Status
Nameplate Capacity (MW)
Table 6.5. Planned U.S. Electric Generating Unit Additions
2019 6 20159 Washington Parish Engy Ctr LLC IPP Washington Parish Energy Center LA 55486 CTG1 172.0 Natural Gas Fired Combined Cycle NG CT (V) Under construction, more than 50 percent complete 200.02019 6 20159 Washington Parish Engy Ctr LLC IPP Washington Parish Energy Center LA 55486 CTG2 172.0 Natural Gas Fired Combined Cycle NG CT (V) Under construction, more than 50 percent complete 200.02019 6 20159 Washington Parish Engy Ctr LLC IPP Washington Parish Energy Center LA 55486 ST1 215.0 Natural Gas Fired Combined Cycle NG CA (V) Under construction, more than 50 percent complete 255.02019 6 58761 White Camp Solar LLC IPP White Camp Solar TX 58888 WCAMP 100.0 Solar Photovoltaic SUN PV (P) Planned for installation, but regulatory approvals not initiated 100.02019 6 60519 Williams Solar, LLC IPP Williams Solar, LLC TX 60859 PV1 20.0 Solar Photovoltaic SUN PV (P) Planned for installation, but regulatory approvals not initiated 20.02019 7 54863 U S Power Generating Company LLC IPP Gowanus Gas Turbines Generating NY 2494 SS 90.0 Natural Gas Fired Combustion Turbine NG GT (T) Regulatory approvals received. Not under construction 93.02019 7 61276 West Liberty Renewables LLC IPP West Liberty Wind Farm IA 61057 T1 2.5 Onshore Wind Turbine WND WT (P) Planned for installation, but regulatory approvals not initiated 2.52019 7 61276 West Liberty Renewables LLC IPP West Liberty Wind Farm IA 61057 T2 2.5 Onshore Wind Turbine WND WT (P) Planned for installation, but regulatory approvals not initiated 2.52019 8 59714 Antrim Wind Energy LLC IPP Antrim Wind NH 59953 AWND1 28.4 Onshore Wind Turbine WND WT (P) Planned for installation, but regulatory approvals not initiated 28.82019 8 58718 Na Pua Makani Power Partners LLC IPP Na Pua Makani Wind Project HI 58837 WT1 25.0 Onshore Wind Turbine WND WT (L) Regulatory approvals pending. Not under construction 25.02019 8 16534 Sacramento Municipal Util Dist Electric Utility White Rock/Slab Creek CA 435 H3 2.7 Conventional Hydroelectric WAT HY (U) Under construction, less than or equal to 50 percent complete 2.72019 8 59056 Tri Global Energy, LLC IPP Canyon Wind Project, LLC TX 60271 WT1 360.0 Onshore Wind Turbine WND WT (P) Planned for installation, but regulatory approvals not initiated 360.02019 9 60328 Big Level Wind LLC IPP Big Level Wind PA 60551 BLW01 90.0 Onshore Wind Turbine WND WT (T) Regulatory approvals received. Not under construction 90.02019 9 60719 Broadlands Wind Farm LLC IPP Broadlands Wind Farm IL 61161 GEN01 300.0 Onshore Wind Turbine WND WT (T) Regulatory approvals received. Not under construction 300.02019 9 59365 Capital Power Corporation IPP Black Fork Wind Energy Project OH 59907 GEN 200.0 Onshore Wind Turbine WND WT (P) Planned for installation, but regulatory approvals not initiated 200.02019 9 61302 Depot Solar Center, LLC IPP Depot Solar Center, LLC VA 61691 DEPOT 15.0 Solar Photovoltaic SUN PV (P) Planned for installation, but regulatory approvals not initiated 15.02019 9 61374 Foxtail Wind, LLC Electric Utility Foxtail Wind, LLC ND 61747 1 150.0 Onshore Wind Turbine WND WT (T) Regulatory approvals received. Not under construction 150.02019 9 59683 Rockwood Energy Center LLC IPP Rockwood Energy Center LLC TX 59918 ROCKW 1,068.0 Natural Gas Fired Combined Cycle NG CC (T) Regulatory approvals received. Not under construction 1,068.02019 9 17609 Southern California Edison Co Electric Utility DESI-1 Battery Energy Storage Facility CA 60699 DESI1 2.4 Batteries MWH BA (TS) Construction complete, but not yet in commercial operation 2.42019 9 19539 University of Iowa Commercial University of Iowa Main Power Plant IA 54775 GEN12 5.8 Natural Gas Steam Turbine NG ST (L) Regulatory approvals pending. Not under construction 5.82019 9 19539 University of Iowa Commercial University of Iowa Main Power Plant IA 54775 GEN13 10.0 Natural Gas Steam Turbine NG ST (L) Regulatory approvals pending. Not under construction 10.02019 9 20421 Western Minnesota Mun Pwr Agny Electric Utility Red Rock Hydro Plant IA 58434 1 27.5 Conventional Hydroelectric WAT HY (T) Regulatory approvals received. Not under construction 18.22019 9 20421 Western Minnesota Mun Pwr Agny Electric Utility Red Rock Hydro Plant IA 58434 2 27.5 Conventional Hydroelectric WAT HY (T) Regulatory approvals received. Not under construction 18.22019 10 60797 68SF 8me LLC IPP Eland 1 Solar Farm CA 61168 68SF8 200.0 Solar Photovoltaic SUN PV (P) Planned for installation, but regulatory approvals not initiated 200.02019 10 60688 FGE Goodnight, LLC IPP Goodnight TX 59246 GOOD1 500.0 Onshore Wind Turbine WND WT (U) Under construction, less than or equal to 50 percent complete 500.02019 10 58850 Mariah del Sur LLC IPP Mariah South TX 59007 MAR S 210.4 Onshore Wind Turbine WND WT (U) Under construction, less than or equal to 50 percent complete 210.42019 10 60720 Martinsdale Wind Farm LLC IPP Martinsdale Wind Farm MT 61108 MTD 80.0 Onshore Wind Turbine WND WT (P) Planned for installation, but regulatory approvals not initiated 80.02019 10 14232 Otter Tail Power Co Electric Utility Merricourt Wind Project ND 57048 1 150.0 Onshore Wind Turbine WND WT (P) Planned for installation, but regulatory approvals not initiated 150.02019 10 16657 San Jose/Santa Clara Water P C Commercial SJ/SC WPCP CA 56080 EG4 3.5 Other Waste Biomass OBG IC (P) Planned for installation, but regulatory approvals not initiated 3.52019 10 16657 San Jose/Santa Clara Water P C Commercial SJ/SC WPCP CA 56080 EG5 3.5 Other Waste Biomass OBG IC (P) Planned for installation, but regulatory approvals not initiated 3.52019 10 16657 San Jose/Santa Clara Water P C Commercial SJ/SC WPCP CA 56080 EG6 3.5 Other Waste Biomass OBG IC (P) Planned for installation, but regulatory approvals not initiated 3.52019 10 16657 San Jose/Santa Clara Water P C Commercial SJ/SC WPCP CA 56080 EG7 3.5 Other Waste Biomass OBG IC (P) Planned for installation, but regulatory approvals not initiated 3.52019 10 61330 Turtle Creek Wind Farm LLC IPP Turtle Creek Wind Farm LLC IA 61638 TC1 200.1 Onshore Wind Turbine WND WT (L) Regulatory approvals pending. Not under construction 200.12019 10 59260 Wright Solar Park LLC IPP Wright Solar Park CA 59525 FRWSP 200.0 Solar Photovoltaic SUN PV (T) Regulatory approvals received. Not under construction 200.02019 11 3046 Duke Energy Progress - (NC) Electric Utility Asheville NC 2706 CT5 191.2 Natural Gas Fired Combined Cycle NG CT (P) Planned for installation, but regulatory approvals not initiated 191.22019 11 3046 Duke Energy Progress - (NC) Electric Utility Asheville NC 2706 CT7 191.2 Natural Gas Fired Combined Cycle NG CT (P) Planned for installation, but regulatory approvals not initiated 191.22019 11 3046 Duke Energy Progress - (NC) Electric Utility Asheville NC 2706 ST6 102.0 Natural Gas Fired Combined Cycle NG CA (P) Planned for installation, but regulatory approvals not initiated 102.02019 11 3046 Duke Energy Progress - (NC) Electric Utility Asheville NC 2706 ST8 102.0 Natural Gas Fired Combined Cycle NG CA (P) Planned for installation, but regulatory approvals not initiated 102.02019 11 60229 Quail Holdings, LLC IPP Quail Holdings NC 60434 PV1 25.0 Solar Photovoltaic SUN PV (L) Regulatory approvals pending. Not under construction 25.02019 11 59770 Shorthorn Holdings, LLC IPP Shorthorn Holdings SC 60028 PV1 15.4 Solar Photovoltaic SUN PV (L) Regulatory approvals pending. Not under construction 15.42019 11 2770 Terra-Gen Operating Co LLC IPP Voyager Wind I CA 60594 VYGR1 131.1 Onshore Wind Turbine WND WT (U) Under construction, less than or equal to 50 percent complete 131.12019 12 60600 Adams Solar, LLC IPP Adams Solar NC 60949 PV1 2.0 Solar Photovoltaic SUN PV (P) Planned for installation, but regulatory approvals not initiated 2.02019 12 61118 Ameresco, Inc - Candlewood IPP Candlewood Solar CT 61517 CANDL 25.0 Solar Photovoltaic SUN PV (P) Planned for installation, but regulatory approvals not initiated 25.02019 12 59192 Amity Energy, LLC IPP Amity Energy LLC PA 59418 1 6.8 Natural Gas Internal Combustion Engine NG IC (L) Regulatory approvals pending. Not under construction 7.02019 12 59192 Amity Energy, LLC IPP Amity Energy LLC PA 59418 2 6.8 Natural Gas Internal Combustion Engine NG IC (L) Regulatory approvals pending. Not under construction 7.02019 12 59192 Amity Energy, LLC IPP Amity Energy LLC PA 59418 3 6.8 Natural Gas Internal Combustion Engine NG IC (L) Regulatory approvals pending. Not under construction 7.02019 12 60927 Anchor Energy LLC IPP Anchor Energy PA 61304 GEN1 4.4 Natural Gas Internal Combustion Engine NG IC (P) Planned for installation, but regulatory approvals not initiated 4.42019 12 60927 Anchor Energy LLC IPP Anchor Energy PA 61304 GEN2 4.4 Natural Gas Internal Combustion Engine NG IC (P) Planned for installation, but regulatory approvals not initiated 4.42019 12 60927 Anchor Energy LLC IPP Anchor Energy PA 61304 GEN3 4.4 Natural Gas Internal Combustion Engine NG IC (P) Planned for installation, but regulatory approvals not initiated 4.42019 12 60927 Anchor Energy LLC IPP Anchor Energy PA 61304 GEN4 4.4 Natural Gas Internal Combustion Engine NG IC (P) Planned for installation, but regulatory approvals not initiated 4.42019 12 60927 Anchor Energy LLC IPP Anchor Energy PA 61304 GEN5 4.4 Natural Gas Internal Combustion Engine NG IC (P) Planned for installation, but regulatory approvals not initiated 4.42019 12 15399 Avangrid Renewables LLC IPP Coyote Ridge SD 61047 WT1 98.0 Onshore Wind Turbine WND WT (T) Regulatory approvals received. Not under construction 98.02019 12 15399 Avangrid Renewables LLC IPP Karankawa Wind LLC TX 61343 WT1 200.0 Onshore Wind Turbine WND WT (P) Planned for installation, but regulatory approvals not initiated 200.02019 12 15399 Avangrid Renewables LLC IPP Lund Hill WA 61045 WT1 60.0 Onshore Wind Turbine WND WT (U) Under construction, less than or equal to 50 percent complete 60.02019 12 15399 Avangrid Renewables LLC IPP Montague Wind Power Facility LLC OR 58099 1 200.0 Onshore Wind Turbine WND WT (P) Planned for installation, but regulatory approvals not initiated 200.02019 12 15399 Avangrid Renewables LLC IPP Otter Creek Wind Farm LLC IL 61344 WT1 129.0 Onshore Wind Turbine WND WT (P) Planned for installation, but regulatory approvals not initiated 129.02019 12 15399 Avangrid Renewables LLC IPP Tatanka Ridge SD 61046 WT1 98.0 Onshore Wind Turbine WND WT (U) Under construction, less than or equal to 50 percent complete 98.02019 12 58687 Bayles Energy LLC IPP Bayles PA 58816 1 6.8 Natural Gas Internal Combustion Engine NG IC (L) Regulatory approvals pending. Not under construction 7.02019 12 58687 Bayles Energy LLC IPP Bayles PA 58816 2 6.8 Natural Gas Internal Combustion Engine NG IC (L) Regulatory approvals pending. Not under construction 7.02019 12 58687 Bayles Energy LLC IPP Bayles PA 58816 3 6.8 Natural Gas Internal Combustion Engine NG IC (L) Regulatory approvals pending. Not under construction 7.02019 12 60289 Blazing Star Wind Farm, LLC IPP Blazing Star Wind Farm 1 MN 60504 BLZG1 200.0 Onshore Wind Turbine WND WT (T) Regulatory approvals received. Not under construction 200.02019 12 60714 Burke Wind LLC IPP Burke Wind, LLC ND 61100 GE23 199.4 Onshore Wind Turbine WND WT (P) Planned for installation, but regulatory approvals not initiated 199.42019 12 59365 Capital Power Corporation IPP Garrison Butte Wind, LLC ND 60066 GEN 150.0 Onshore Wind Turbine WND WT (P) Planned for installation, but regulatory approvals not initiated 150.02019 12 59365 Capital Power Corporation IPP Poplars Ranch Solar LLC OR 59890 GEN 16.0 Solar Photovoltaic SUN PV (P) Planned for installation, but regulatory approvals not initiated 16.02019 12 58508 Carolina Solar Energy II LLC IPP Cabaniss Solar NC 60430 PV1 4.2 Solar Photovoltaic SUN PV (T) Regulatory approvals received. Not under construction 4.22019 12 58508 Carolina Solar Energy II LLC IPP McGrigor Farm Solar NC 60440 PV1 5.0 Solar Photovoltaic SUN PV (T) Regulatory approvals received. Not under construction 5.02019 12 58508 Carolina Solar Energy II LLC IPP Sellers Farm Solar NC 60439 PV1 5.0 Solar Photovoltaic SUN PV (T) Regulatory approvals received. Not under construction 5.02019 12 61416 Cattle Ridge Wind Holdings, LLC IPP Cattle Ridge Wind Farm 1 SD 60503 CTTL1 200.0 Onshore Wind Turbine WND WT (P) Planned for installation, but regulatory approvals not initiated 200.02019 12 58391 Chilocco Wind Farm LLC IPP Chilocco Wind Farm OK 58406 1 200.0 Onshore Wind Turbine WND WT (U) Under construction, less than or equal to 50 percent complete 200.02019 12 58695 Coronal Development Services IPP Biggs Ford Solar Center MD 61321 BFSC 15.0 Solar Photovoltaic SUN PV (P) Planned for installation, but regulatory approvals not initiated 15.02019 12 60290 Crocker Wind Farm, LLC IPP Crocker Wind Farm SD 60505 CRCKR 200.0 Onshore Wind Turbine WND WT (L) Regulatory approvals pending. Not under construction 200.02019 12 59464 Current Energy Group IPP Hickory NC 59829 5515 5.0 Solar Photovoltaic SUN PV (T) Regulatory approvals received. Not under construction 5.02019 12 56215 E ON Climate Renewables N America LLC IPP Vici Wind Farm OK 59062 VICI 180.0 Onshore Wind Turbine WND WT (P) Planned for installation, but regulatory approvals not initiated 180.02019 12 58672 Everpower Wind Holdings Inc IPP Baron Winds Farm NY 60596 1 272.0 Onshore Wind Turbine WND WT (L) Regulatory approvals pending. Not under construction 272.02019 12 58672 Everpower Wind Holdings Inc IPP Buckeye Wind Farm OH 58776 1 99.0 Onshore Wind Turbine WND WT (L) Regulatory approvals pending. Not under construction 99.02019 12 58672 Everpower Wind Holdings Inc IPP Cassadaga Wind Farm NY 58777 1 126.0 Onshore Wind Turbine WND WT (L) Regulatory approvals pending. Not under construction 126.02019 12 58672 Everpower Wind Holdings Inc IPP Horse Thief Wind Project, LLC MT 59758 1 80.0 Onshore Wind Turbine WND WT (L) Regulatory approvals pending. Not under construction 80.02019 12 58672 Everpower Wind Holdings Inc IPP Mason Dixon Wind Farm PA 60212 1 79.9 Onshore Wind Turbine WND WT (L) Regulatory approvals pending. Not under construction 79.92019 12 58672 Everpower Wind Holdings Inc IPP Mud Springs Wind Project, LLC MT 59756 1 80.0 Onshore Wind Turbine WND WT (L) Regulatory approvals pending. Not under construction 80.02019 12 58672 Everpower Wind Holdings Inc IPP Pryor Caves Wind Project, LLC MT 59757 1 80.0 Onshore Wind Turbine WND WT (L) Regulatory approvals pending. Not under construction 80.02019 12 58672 Everpower Wind Holdings Inc IPP Sand Creek Wind Farm MT 60595 WT1 75.0 Onshore Wind Turbine WND WT (L) Regulatory approvals pending. Not under construction 75.02019 12 58672 Everpower Wind Holdings Inc IPP Scioto Ridge Wind Farm OH 58780 1 189.2 Onshore Wind Turbine WND WT (T) Regulatory approvals received. Not under construction 189.22019 12 58672 Everpower Wind Holdings Inc IPP Terrapin Hills Wind Farm MD 60211 1 50.0 Onshore Wind Turbine WND WT (L) Regulatory approvals pending. Not under construction 50.02019 12 59745 First Solar Asset Management IPP Twiggs Solar GA 61696 TWIGG 200.0 Solar Photovoltaic SUN PV (L) Regulatory approvals pending. Not under construction 200.02019 12 56615 First Solar Project Development IPP Sunshine Valley Solar NV 59826 GEN01 102.0 Solar Photovoltaic SUN PV (L) Regulatory approvals pending. Not under construction 100.02019 12 56615 First Solar Project Development IPP Windhub Solar A LLC CA 59878 GEN01 20.0 Solar Photovoltaic SUN PV (L) Regulatory approvals pending. Not under construction 20.02019 12 56615 First Solar Project Development IPP Windhub Solar B, LLC CA 59969 GEN01 20.0 Solar Photovoltaic SUN PV (L) Regulatory approvals pending. Not under construction 20.02019 12 58692 Florey Knob LLC IPP Florey Knobb PA 58821 1 6.8 Natural Gas Internal Combustion Engine NG IC (T) Regulatory approvals received. Not under construction 7.0
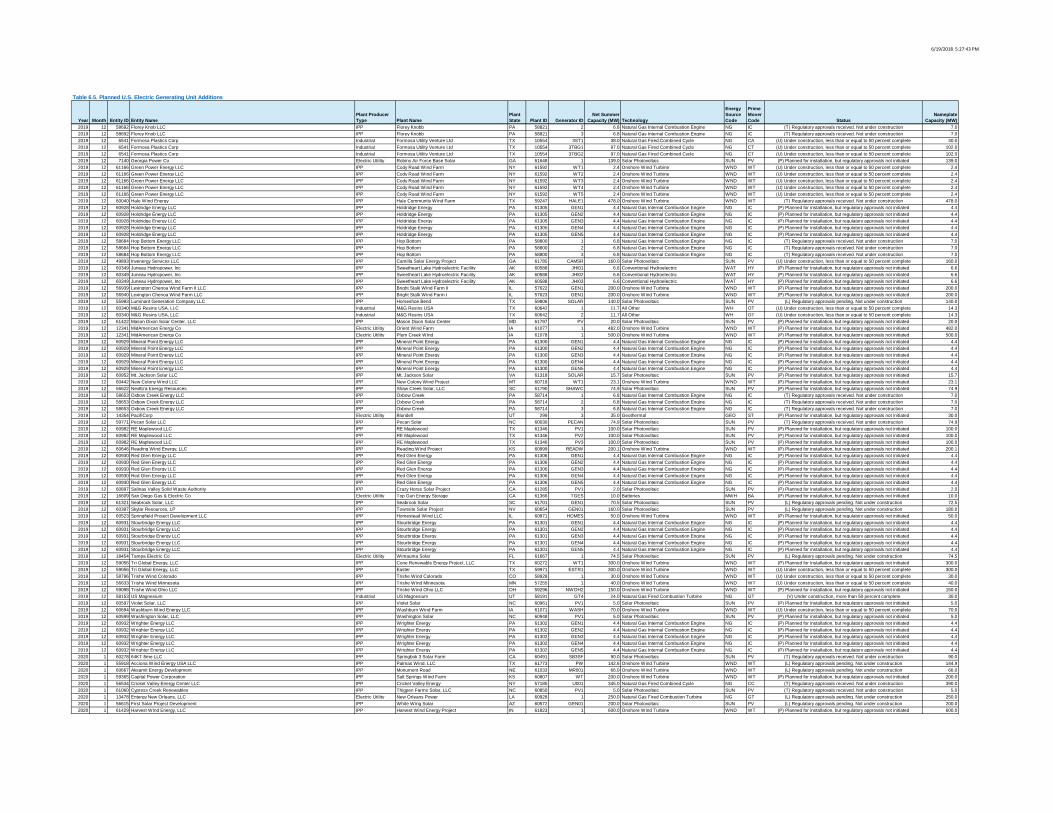
6/19/2018 5:27:43 PM
Year Month Entity ID Entity NamePlant Producer Type Plant Name
Plant State Plant ID Generator ID
Net Summer Capacity (MW) Technology
Energy Source Code
Prime Mover Code Status
Nameplate Capacity (MW)
Table 6.5. Planned U.S. Electric Generating Unit Additions
2019 12 58692 Florey Knob LLC IPP Florey Knobb PA 58821 2 6.8 Natural Gas Internal Combustion Engine NG IC (T) Regulatory approvals received. Not under construction 7.02019 12 58692 Florey Knob LLC IPP Florey Knobb PA 58821 3 6.8 Natural Gas Internal Combustion Engine NG IC (T) Regulatory approvals received. Not under construction 7.02019 12 6541 Formosa Plastics Corp Industrial Formosa Utility Venture Ltd TX 10554 3ST1 38.0 Natural Gas Fired Combined Cycle NG CA (U) Under construction, less than or equal to 50 percent complete 40.02019 12 6541 Formosa Plastics Corp Industrial Formosa Utility Venture Ltd TX 10554 3TBG1 97.0 Natural Gas Fired Combined Cycle NG CT (U) Under construction, less than or equal to 50 percent complete 102.02019 12 6541 Formosa Plastics Corp Industrial Formosa Utility Venture Ltd TX 10554 3TBG2 97.0 Natural Gas Fired Combined Cycle NG CT (U) Under construction, less than or equal to 50 percent complete 102.02019 12 7140 Georgia Power Co Electric Utility Robins Air Force Base Solar GA 61648 1 139.0 Solar Photovoltaic SUN PV (P) Planned for installation, but regulatory approvals not initiated 139.02019 12 61166 Green Power Energy LLC IPP Cody Road Wind Farm NY 61592 WT1 2.4 Onshore Wind Turbine WND WT (U) Under construction, less than or equal to 50 percent complete 2.42019 12 61166 Green Power Energy LLC IPP Cody Road Wind Farm NY 61592 WT2 2.4 Onshore Wind Turbine WND WT (U) Under construction, less than or equal to 50 percent complete 2.42019 12 61166 Green Power Energy LLC IPP Cody Road Wind Farm NY 61592 WT3 2.4 Onshore Wind Turbine WND WT (U) Under construction, less than or equal to 50 percent complete 2.42019 12 61166 Green Power Energy LLC IPP Cody Road Wind Farm NY 61592 WT4 2.4 Onshore Wind Turbine WND WT (U) Under construction, less than or equal to 50 percent complete 2.42019 12 61166 Green Power Energy LLC IPP Cody Road Wind Farm NY 61592 WT5 2.4 Onshore Wind Turbine WND WT (U) Under construction, less than or equal to 50 percent complete 2.42019 12 60040 Hale Wind Energy IPP Hale Community Wind Farm TX 59247 HALE1 478.0 Onshore Wind Turbine WND WT (T) Regulatory approvals received. Not under construction 478.02019 12 60928 Holdridge Energy LLC IPP Holdridge Energy PA 61305 GEN1 4.4 Natural Gas Internal Combustion Engine NG IC (P) Planned for installation, but regulatory approvals not initiated 4.42019 12 60928 Holdridge Energy LLC IPP Holdridge Energy PA 61305 GEN2 4.4 Natural Gas Internal Combustion Engine NG IC (P) Planned for installation, but regulatory approvals not initiated 4.42019 12 60928 Holdridge Energy LLC IPP Holdridge Energy PA 61305 GEN3 4.4 Natural Gas Internal Combustion Engine NG IC (P) Planned for installation, but regulatory approvals not initiated 4.42019 12 60928 Holdridge Energy LLC IPP Holdridge Energy PA 61305 GEN4 4.4 Natural Gas Internal Combustion Engine NG IC (P) Planned for installation, but regulatory approvals not initiated 4.42019 12 60928 Holdridge Energy LLC IPP Holdridge Energy PA 61305 GEN5 4.4 Natural Gas Internal Combustion Engine NG IC (P) Planned for installation, but regulatory approvals not initiated 4.42019 12 58684 Hop Bottom Energy LLC IPP Hop Bottom PA 58800 1 6.8 Natural Gas Internal Combustion Engine NG IC (T) Regulatory approvals received. Not under construction 7.02019 12 58684 Hop Bottom Energy LLC IPP Hop Bottom PA 58800 2 6.8 Natural Gas Internal Combustion Engine NG IC (T) Regulatory approvals received. Not under construction 7.02019 12 58684 Hop Bottom Energy LLC IPP Hop Bottom PA 58800 3 6.8 Natural Gas Internal Combustion Engine NG IC (T) Regulatory approvals received. Not under construction 7.02019 12 49893 Invenergy Services LLC IPP Camilla Solar Energy Project GA 61785 CAMSR 160.0 Solar Photovoltaic SUN PV (U) Under construction, less than or equal to 50 percent complete 160.02019 12 60349 Juneau Hydropower, Inc IPP Sweetheart Lake Hydroelectric Facility AK 60588 JHI01 6.6 Conventional Hydroelectric WAT HY (P) Planned for installation, but regulatory approvals not initiated 6.62019 12 60349 Juneau Hydropower, Inc IPP Sweetheart Lake Hydroelectric Facility AK 60588 JHI02 6.6 Conventional Hydroelectric WAT HY (P) Planned for installation, but regulatory approvals not initiated 6.62019 12 60349 Juneau Hydropower, Inc IPP Sweetheart Lake Hydroelectric Facility AK 60588 JHI03 6.6 Conventional Hydroelectric WAT HY (P) Planned for installation, but regulatory approvals not initiated 6.62019 12 56939 Lexington Chenoa Wind Farm II LLC IPP Bright Stalk Wind Farm II IL 57622 GEN1 200.0 Onshore Wind Turbine WND WT (P) Planned for installation, but regulatory approvals not initiated 200.02019 12 56940 Lexington Chenoa Wind Farm LLC IPP Bright Stalk Wind Farm I IL 57623 GEN1 200.0 Onshore Wind Turbine WND WT (P) Planned for installation, but regulatory approvals not initiated 200.02019 12 55983 Luminant Generation Company LLC IPP Horseshoe Bend TX 59806 SOLAR 140.0 Solar Photovoltaic SUN PV (L) Regulatory approvals pending. Not under construction 140.02019 12 60340 M&G Resins USA, LLC Industrial M&G Resins USA TX 60642 1 11.7 All Other WH OT (U) Under construction, less than or equal to 50 percent complete 14.32019 12 60340 M&G Resins USA, LLC Industrial M&G Resins USA TX 60642 2 11.7 All Other WH OT (U) Under construction, less than or equal to 50 percent complete 14.32019 12 61422 Mason Dixon Solar Center, LLC IPP Mason Dixon Solar Center MD 61797 PV 20.0 Solar Photovoltaic SUN PV (P) Planned for installation, but regulatory approvals not initiated 20.02019 12 12341 MidAmerican Energy Co Electric Utility Orient Wind Farm IA 61077 1 482.0 Onshore Wind Turbine WND WT (P) Planned for installation, but regulatory approvals not initiated 482.02019 12 12341 MidAmerican Energy Co Electric Utility Plum Creek Wind IA 61078 1 500.0 Onshore Wind Turbine WND WT (P) Planned for installation, but regulatory approvals not initiated 500.02019 12 60929 Mineral Point Energy LLC IPP Mineral Point Energy PA 61300 GEN1 4.4 Natural Gas Internal Combustion Engine NG IC (P) Planned for installation, but regulatory approvals not initiated 4.42019 12 60929 Mineral Point Energy LLC IPP Mineral Point Energy PA 61300 GEN2 4.4 Natural Gas Internal Combustion Engine NG IC (P) Planned for installation, but regulatory approvals not initiated 4.42019 12 60929 Mineral Point Energy LLC IPP Mineral Point Energy PA 61300 GEN3 4.4 Natural Gas Internal Combustion Engine NG IC (P) Planned for installation, but regulatory approvals not initiated 4.42019 12 60929 Mineral Point Energy LLC IPP Mineral Point Energy PA 61300 GEN4 4.4 Natural Gas Internal Combustion Engine NG IC (P) Planned for installation, but regulatory approvals not initiated 4.42019 12 60929 Mineral Point Energy LLC IPP Mineral Point Energy PA 61300 GEN5 4.4 Natural Gas Internal Combustion Engine NG IC (P) Planned for installation, but regulatory approvals not initiated 4.42019 12 60952 Mt. Jackson Solar LLC IPP Mt. Jackson Solar VA 61318 SOLAR 15.7 Solar Photovoltaic SUN PV (P) Planned for installation, but regulatory approvals not initiated 15.72019 12 60442 New Colony Wind LLC IPP New Colony Wind Project MT 60718 WT1 23.1 Onshore Wind Turbine WND WT (P) Planned for installation, but regulatory approvals not initiated 23.12019 12 56622 NextEra Energy Resources IPP Shaw Creek Solar, LLC SC 61790 SHAWC 74.9 Solar Photovoltaic SUN PV (P) Planned for installation, but regulatory approvals not initiated 74.92019 12 58653 Oxbow Creek Energy LLC IPP Oxbow Creek PA 58714 1 6.8 Natural Gas Internal Combustion Engine NG IC (T) Regulatory approvals received. Not under construction 7.02019 12 58653 Oxbow Creek Energy LLC IPP Oxbow Creek PA 58714 2 6.8 Natural Gas Internal Combustion Engine NG IC (T) Regulatory approvals received. Not under construction 7.02019 12 58653 Oxbow Creek Energy LLC IPP Oxbow Creek PA 58714 3 6.8 Natural Gas Internal Combustion Engine NG IC (T) Regulatory approvals received. Not under construction 7.02019 12 14354 PacifiCorp Electric Utility Blundell UT 299 3 35.0 Geothermal GEO ST (P) Planned for installation, but regulatory approvals not initiated 30.02019 12 59771 Pecan Solar LLC IPP Pecan Solar NC 60030 PECAN 74.9 Solar Photovoltaic SUN PV (T) Regulatory approvals received. Not under construction 74.92019 12 60982 RE Maplewood LLC IPP RE Maplewood TX 61346 PV1 100.0 Solar Photovoltaic SUN PV (P) Planned for installation, but regulatory approvals not initiated 100.02019 12 60982 RE Maplewood LLC IPP RE Maplewood TX 61346 PV2 100.0 Solar Photovoltaic SUN PV (P) Planned for installation, but regulatory approvals not initiated 100.02019 12 60982 RE Maplewood LLC IPP RE Maplewood TX 61346 PV3 100.0 Solar Photovoltaic SUN PV (P) Planned for installation, but regulatory approvals not initiated 100.02019 12 60646 Reading Wind Energy, LLC IPP Reading Wind Project KS 60999 READW 200.1 Onshore Wind Turbine WND WT (P) Planned for installation, but regulatory approvals not initiated 200.12019 12 60930 Red Glen Energy LLC IPP Red Glen Energy PA 61306 GEN1 4.4 Natural Gas Internal Combustion Engine NG IC (P) Planned for installation, but regulatory approvals not initiated 4.42019 12 60930 Red Glen Energy LLC IPP Red Glen Energy PA 61306 GEN2 4.4 Natural Gas Internal Combustion Engine NG IC (P) Planned for installation, but regulatory approvals not initiated 4.42019 12 60930 Red Glen Energy LLC IPP Red Glen Energy PA 61306 GEN3 4.4 Natural Gas Internal Combustion Engine NG IC (P) Planned for installation, but regulatory approvals not initiated 4.42019 12 60930 Red Glen Energy LLC IPP Red Glen Energy PA 61306 GEN4 4.4 Natural Gas Internal Combustion Engine NG IC (P) Planned for installation, but regulatory approvals not initiated 4.42019 12 60930 Red Glen Energy LLC IPP Red Glen Energy PA 61306 GEN5 4.4 Natural Gas Internal Combustion Engine NG IC (P) Planned for installation, but regulatory approvals not initiated 4.42019 12 60897 Salinas Valley Solid Waste Authority IPP Crazy Horse Solar Project CA 61285 PV1 2.0 Solar Photovoltaic SUN PV (P) Planned for installation, but regulatory approvals not initiated 2.02019 12 16609 San Diego Gas & Electric Co Electric Utility Top Gun Energy Storage CA 61366 TGES 10.0 Batteries MWH BA (P) Planned for installation, but regulatory approvals not initiated 10.02019 12 61321 Seabrook Solar, LLC IPP Seabrook Solar SC 61701 GEN1 70.5 Solar Photovoltaic SUN PV (L) Regulatory approvals pending. Not under construction 72.52019 12 60387 Skylar Resources, LP IPP Townsite Solar Project NV 60654 GEN01 160.0 Solar Photovoltaic SUN PV (L) Regulatory approvals pending. Not under construction 180.02019 12 60523 Springfield Project Development LLC IPP Homestead Wind LLC IL 60871 HOMES 50.0 Onshore Wind Turbine WND WT (P) Planned for installation, but regulatory approvals not initiated 50.02019 12 60931 Stourbridge Energy LLC IPP Stourbridge Energy PA 61301 GEN1 4.4 Natural Gas Internal Combustion Engine NG IC (P) Planned for installation, but regulatory approvals not initiated 4.42019 12 60931 Stourbridge Energy LLC IPP Stourbridge Energy PA 61301 GEN2 4.4 Natural Gas Internal Combustion Engine NG IC (P) Planned for installation, but regulatory approvals not initiated 4.42019 12 60931 Stourbridge Energy LLC IPP Stourbridge Energy PA 61301 GEN3 4.4 Natural Gas Internal Combustion Engine NG IC (P) Planned for installation, but regulatory approvals not initiated 4.42019 12 60931 Stourbridge Energy LLC IPP Stourbridge Energy PA 61301 GEN4 4.4 Natural Gas Internal Combustion Engine NG IC (P) Planned for installation, but regulatory approvals not initiated 4.42019 12 60931 Stourbridge Energy LLC IPP Stourbridge Energy PA 61301 GEN5 4.4 Natural Gas Internal Combustion Engine NG IC (P) Planned for installation, but regulatory approvals not initiated 4.42019 12 18454 Tampa Electric Co Electric Utility Wimauma Solar FL 61667 1 74.5 Solar Photovoltaic SUN PV (L) Regulatory approvals pending. Not under construction 74.52019 12 59056 Tri Global Energy, LLC IPP Cone Renewable Energy Project, LLC TX 60272 WT1 300.0 Onshore Wind Turbine WND WT (P) Planned for installation, but regulatory approvals not initiated 300.02019 12 59056 Tri Global Energy, LLC IPP Easter TX 59971 ESTR1 300.0 Onshore Wind Turbine WND WT (U) Under construction, less than or equal to 50 percent complete 300.02019 12 58796 Trishe Wind Colorado IPP Trishe Wind Colorado CO 58928 1 30.0 Onshore Wind Turbine WND WT (U) Under construction, less than or equal to 50 percent complete 30.02019 12 56633 Trishe Wind Minnesota IPP Trishe Wind Minnesota MN 57255 1 40.0 Onshore Wind Turbine WND WT (U) Under construction, less than or equal to 50 percent complete 40.02019 12 59098 Trishe Wind Ohio LLC IPP Trishe Wind Ohio LLC OH 59296 NWOH2 150.0 Onshore Wind Turbine WND WT (P) Planned for installation, but regulatory approvals not initiated 150.02019 12 58153 US Magnesium Industrial US Magnesium UT 58191 GT4 24.0 Natural Gas Fired Combustion Turbine NG GT (V) Under construction, more than 50 percent complete 30.02019 12 60597 Violet Solar, LLC IPP Violet Solar NC 60961 PV1 5.0 Solar Photovoltaic SUN PV (P) Planned for installation, but regulatory approvals not initiated 5.02019 12 60694 Washburn Wind Energy LLC IPP Washburn Wind Farm IA 61071 WASH 70.0 Onshore Wind Turbine WND WT (U) Under construction, less than or equal to 50 percent complete 70.02019 12 60599 Washington Solar, LLC IPP Washington Solar NC 60948 PV1 5.0 Solar Photovoltaic SUN PV (P) Planned for installation, but regulatory approvals not initiated 5.02019 12 60932 Wrighter Energy LLC IPP Wrighter Energy PA 61302 GEN1 4.4 Natural Gas Internal Combustion Engine NG IC (P) Planned for installation, but regulatory approvals not initiated 4.42019 12 60932 Wrighter Energy LLC IPP Wrighter Energy PA 61302 GEN2 4.4 Natural Gas Internal Combustion Engine NG IC (P) Planned for installation, but regulatory approvals not initiated 4.42019 12 60932 Wrighter Energy LLC IPP Wrighter Energy PA 61302 GEN3 4.4 Natural Gas Internal Combustion Engine NG IC (P) Planned for installation, but regulatory approvals not initiated 4.42019 12 60932 Wrighter Energy LLC IPP Wrighter Energy PA 61302 GEN4 4.4 Natural Gas Internal Combustion Engine NG IC (P) Planned for installation, but regulatory approvals not initiated 4.42019 12 60932 Wrighter Energy LLC IPP Wrighter Energy PA 61302 GEN5 4.4 Natural Gas Internal Combustion Engine NG IC (P) Planned for installation, but regulatory approvals not initiated 4.42020 1 60278 64KT 8me LLC IPP Springbok 3 Solar Farm CA 60491 SB3SF 90.0 Solar Photovoltaic SUN PV (T) Regulatory approvals received. Not under construction 90.02020 1 55918 Acciona Wind Energy USA LLC IPP Palmas Wind, LLC TX 61773 PW 142.6 Onshore Wind Turbine WND WT (L) Regulatory approvals pending. Not under construction 144.92020 1 60667 Aksamit Energy Development IPP Monument Road NE 61033 MR001 66.0 Onshore Wind Turbine WND WT (L) Regulatory approvals pending. Not under construction 66.02020 1 59365 Capital Power Corporation IPP Salt Springs Wind Farm KS 60807 WT 200.0 Onshore Wind Turbine WND WT (P) Planned for installation, but regulatory approvals not initiated 200.02020 1 56534 Cricket Valley Energy Center LLC IPP Cricket Valley Energy NY 57185 U001 345.0 Natural Gas Fired Combined Cycle NG CC (T) Regulatory approvals received. Not under construction 390.02020 1 61060 Cypress Creek Renewables IPP Thigpen Farms Solar, LLC NC 60850 PV1 5.0 Solar Photovoltaic SUN PV (T) Regulatory approvals received. Not under construction 5.02020 1 13478 Entergy New Orleans, LLC Electric Utility New Orleans Power LA 60928 1 250.0 Natural Gas Fired Combustion Turbine NG GT (L) Regulatory approvals pending. Not under construction 250.02020 1 56615 First Solar Project Development IPP White Wing Solar AZ 60572 GEN01 200.0 Solar Photovoltaic SUN PV (L) Regulatory approvals pending. Not under construction 200.02020 1 61429 Harvest Wind Energy, LLC IPP Harvest Wind Energy Project IN 61823 1 600.0 Onshore Wind Turbine WND WT (P) Planned for installation, but regulatory approvals not initiated 600.0
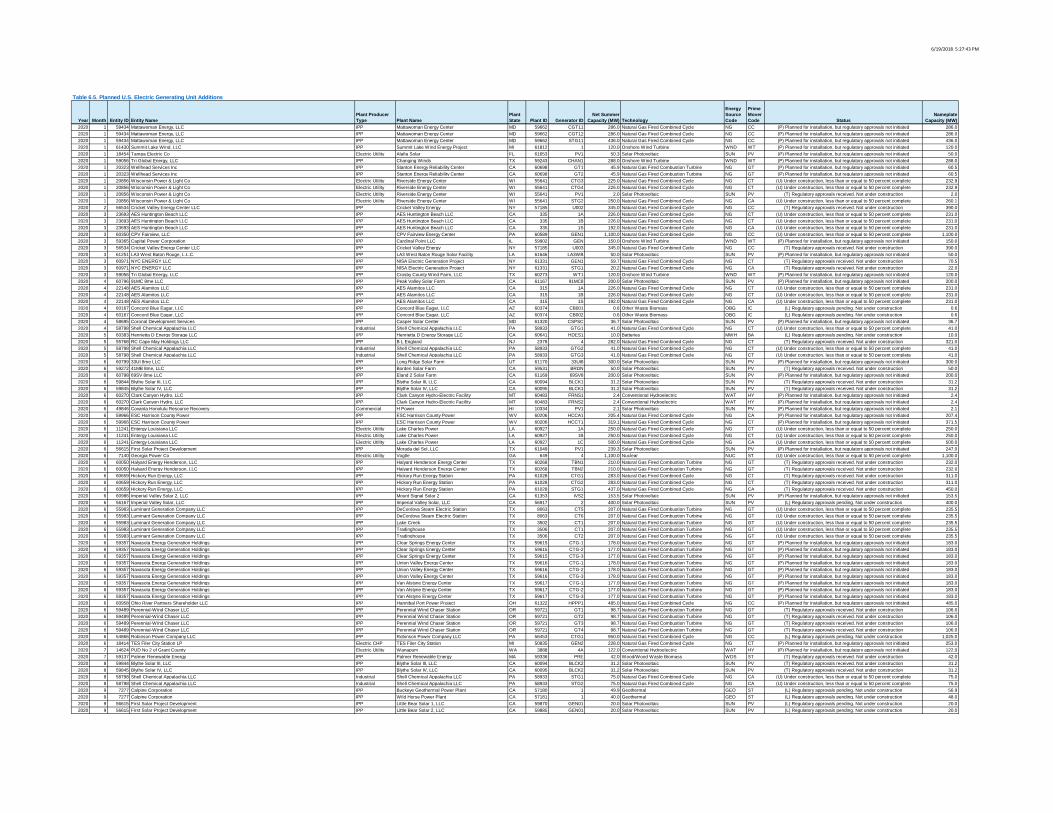
6/19/2018 5:27:43 PM
Year Month Entity ID Entity NamePlant Producer Type Plant Name
Plant State Plant ID Generator ID
Net Summer Capacity (MW) Technology
Energy Source Code
Prime Mover Code Status
Nameplate Capacity (MW)
Table 6.5. Planned U.S. Electric Generating Unit Additions
2020 1 59434 Mattawoman Energy, LLC IPP Mattawoman Energy Center MD 59662 CGT11 286.0 Natural Gas Fired Combined Cycle NG CC (P) Planned for installation, but regulatory approvals not initiated 286.02020 1 59434 Mattawoman Energy, LLC IPP Mattawoman Energy Center MD 59662 CGT12 286.0 Natural Gas Fired Combined Cycle NG CC (P) Planned for installation, but regulatory approvals not initiated 286.02020 1 59434 Mattawoman Energy, LLC IPP Mattawoman Energy Center MD 59662 STG11 436.0 Natural Gas Fired Combined Cycle NG CC (P) Planned for installation, but regulatory approvals not initiated 436.02020 1 61430 Summit Lake Wind, LLC IPP Summit Lake Wind Energy Project MI 61812 1 120.0 Onshore Wind Turbine WND WT (P) Planned for installation, but regulatory approvals not initiated 120.02020 1 18454 Tampa Electric Co Electric Utility Alafia Solar FL 61653 PV1 50.3 Solar Photovoltaic SUN PV (P) Planned for installation, but regulatory approvals not initiated 50.02020 1 59056 Tri Global Energy, LLC IPP Changing Winds TX 59243 CHAN1 288.0 Onshore Wind Turbine WND WT (P) Planned for installation, but regulatory approvals not initiated 288.02020 1 20323 Wellhead Services Inc IPP Stanton Energy Reliability Center CA 60698 GT1 45.9 Natural Gas Fired Combustion Turbine NG GT (P) Planned for installation, but regulatory approvals not initiated 60.52020 1 20323 Wellhead Services Inc IPP Stanton Energy Reliability Center CA 60698 GT2 45.9 Natural Gas Fired Combustion Turbine NG GT (P) Planned for installation, but regulatory approvals not initiated 60.52020 1 20856 Wisconsin Power & Light Co Electric Utility Riverside Energy Center WI 55641 CTG3 225.0 Natural Gas Fired Combined Cycle NG CT (U) Under construction, less than or equal to 50 percent complete 232.92020 1 20856 Wisconsin Power & Light Co Electric Utility Riverside Energy Center WI 55641 CTG4 225.0 Natural Gas Fired Combined Cycle NG CT (U) Under construction, less than or equal to 50 percent complete 232.92020 1 20856 Wisconsin Power & Light Co Electric Utility Riverside Energy Center WI 55641 PV1 2.0 Solar Photovoltaic SUN PV (T) Regulatory approvals received. Not under construction 2.02020 1 20856 Wisconsin Power & Light Co Electric Utility Riverside Energy Center WI 55641 STG2 250.0 Natural Gas Fired Combined Cycle NG CA (U) Under construction, less than or equal to 50 percent complete 260.12020 2 56534 Cricket Valley Energy Center LLC IPP Cricket Valley Energy NY 57185 U002 345.0 Natural Gas Fired Combined Cycle NG CC (T) Regulatory approvals received. Not under construction 390.02020 3 23693 AES Huntington Beach LLC IPP AES Huntington Beach LLC CA 335 1A 226.0 Natural Gas Fired Combined Cycle NG CT (U) Under construction, less than or equal to 50 percent complete 231.02020 3 23693 AES Huntington Beach LLC IPP AES Huntington Beach LLC CA 335 1B 226.0 Natural Gas Fired Combined Cycle NG CT (U) Under construction, less than or equal to 50 percent complete 231.02020 3 23693 AES Huntington Beach LLC IPP AES Huntington Beach LLC CA 335 1S 192.0 Natural Gas Fired Combined Cycle NG CA (U) Under construction, less than or equal to 50 percent complete 231.02020 3 60350 CPV Fairview, LLC IPP CPV Fairview Energy Center PA 60589 GEN1 1,100.0 Natural Gas Fired Combined Cycle NG CC (U) Under construction, less than or equal to 50 percent complete 1,100.02020 3 59365 Capital Power Corporation IPP Cardinal Point LLC IL 59902 GEN 150.0 Onshore Wind Turbine WND WT (P) Planned for installation, but regulatory approvals not initiated 150.02020 3 56534 Cricket Valley Energy Center LLC IPP Cricket Valley Energy NY 57185 U003 345.0 Natural Gas Fired Combined Cycle NG CC (T) Regulatory approvals received. Not under construction 390.02020 3 61251 LA3 West Baton Rouge, L.L.C. IPP LA3 West Baton Rouge Solar Facility LA 61646 LA3WB 50.0 Solar Photovoltaic SUN PV (P) Planned for installation, but regulatory approvals not initiated 50.02020 3 60971 NYC ENERGY LLC IPP NISA Electric Generation Project NY 61331 GEN1 59.7 Natural Gas Fired Combined Cycle NG CT (T) Regulatory approvals received. Not under construction 70.52020 3 60971 NYC ENERGY LLC IPP NISA Electric Generation Project NY 61331 STG1 20.2 Natural Gas Fired Combined Cycle NG CA (T) Regulatory approvals received. Not under construction 22.02020 3 59056 Tri Global Energy, LLC IPP Crosby County Wind Farm, LLC TX 60273 WT1 120.0 Onshore Wind Turbine WND WT (P) Planned for installation, but regulatory approvals not initiated 120.02020 4 60796 91MC 8me LLC IPP Peak Valley Solar Farm CA 61167 91MC8 200.0 Solar Photovoltaic SUN PV (P) Planned for installation, but regulatory approvals not initiated 200.02020 4 22148 AES Alamitos LLC IPP AES Alamitos LLC CA 315 1A 226.0 Natural Gas Fired Combined Cycle NG CT (U) Under construction, less than or equal to 50 percent complete 231.02020 4 22148 AES Alamitos LLC IPP AES Alamitos LLC CA 315 1B 226.0 Natural Gas Fired Combined Cycle NG CT (U) Under construction, less than or equal to 50 percent complete 231.02020 4 22148 AES Alamitos LLC IPP AES Alamitos LLC CA 315 1S 192.0 Natural Gas Fired Combined Cycle NG CA (U) Under construction, less than or equal to 50 percent complete 231.02020 4 60167 Concord Blue Eagar, LLC IPP Concord Blue Eagar, LLC AZ 60374 CB001 0.6 Other Waste Biomass OBG IC (L) Regulatory approvals pending. Not under construction 0.62020 4 60167 Concord Blue Eagar, LLC IPP Concord Blue Eagar, LLC AZ 60374 CB002 0.6 Other Waste Biomass OBG IC (L) Regulatory approvals pending. Not under construction 0.62020 4 58695 Coronal Development Services IPP Casper Solar Center MD 61320 CSPSC 36.7 Solar Photovoltaic SUN PV (P) Planned for installation, but regulatory approvals not initiated 36.72020 4 58798 Shell Chemical Appalachia LLC Industrial Shell Chemical Appalachia LLC PA 58933 GTG1 41.0 Natural Gas Fired Combined Cycle NG CT (U) Under construction, less than or equal to 50 percent complete 41.02020 5 60383 Henrietta D Energy Storage LLC IPP Henrietta D Energy Storage LLC CA 60641 HDES1 10.0 Batteries MWH BA (L) Regulatory approvals pending. Not under construction 10.02020 5 55768 RC Cape May Holdings LLC IPP B L England NJ 2378 4 282.0 Natural Gas Fired Combined Cycle NG CT (T) Regulatory approvals received. Not under construction 321.02020 5 58798 Shell Chemical Appalachia LLC Industrial Shell Chemical Appalachia LLC PA 58933 GTG2 41.0 Natural Gas Fired Combined Cycle NG CT (U) Under construction, less than or equal to 50 percent complete 41.02020 5 58798 Shell Chemical Appalachia LLC Industrial Shell Chemical Appalachia LLC PA 58933 GTG3 41.0 Natural Gas Fired Combined Cycle NG CT (U) Under construction, less than or equal to 50 percent complete 41.02020 6 60799 33UI 8me LLC IPP Long Ridge Solar Farm UT 61170 33UI8 300.0 Solar Photovoltaic SUN PV (P) Planned for installation, but regulatory approvals not initiated 300.02020 6 59272 41MB 8me, LLC IPP Borden Solar Farm CA 59531 BRDN 50.0 Solar Photovoltaic SUN PV (T) Regulatory approvals received. Not under construction 50.02020 6 60798 69SV 8me LLC IPP Eland 2 Solar Farm CA 61169 69SV8 200.0 Solar Photovoltaic SUN PV (P) Planned for installation, but regulatory approvals not initiated 200.02020 6 59844 Blythe Solar III, LLC IPP Blythe Solar III, LLC CA 60094 BLCK1 31.2 Solar Photovoltaic SUN PV (T) Regulatory approvals received. Not under construction 31.22020 6 59845 Blythe Solar IV, LLC IPP Blythe Solar IV, LLC CA 60095 BLCK1 31.2 Solar Photovoltaic SUN PV (T) Regulatory approvals received. Not under construction 31.22020 6 60270 Clark Canyon Hydro, LLC IPP Clark Canyon Hydro-Electric Facility MT 60483 FRNS1 2.4 Conventional Hydroelectric WAT HY (P) Planned for installation, but regulatory approvals not initiated 2.42020 6 60270 Clark Canyon Hydro, LLC IPP Clark Canyon Hydro-Electric Facility MT 60483 FRNS2 2.4 Conventional Hydroelectric WAT HY (P) Planned for installation, but regulatory approvals not initiated 2.42020 6 49846 Covanta Honolulu Resource Recovery Commercial H Power HI 10334 PV1 2.1 Solar Photovoltaic SUN PV (P) Planned for installation, but regulatory approvals not initiated 2.12020 6 59966 ESC Harrison County Power IPP ESC Harrison County Power WV 60206 HCCA1 205.4 Natural Gas Fired Combined Cycle NG CA (P) Planned for installation, but regulatory approvals not initiated 207.42020 6 59966 ESC Harrison County Power IPP ESC Harrison County Power WV 60206 HCCT1 319.1 Natural Gas Fired Combined Cycle NG CT (P) Planned for installation, but regulatory approvals not initiated 371.52020 6 11241 Entergy Louisiana LLC Electric Utility Lake Charles Power LA 60927 1A 250.0 Natural Gas Fired Combined Cycle NG CT (U) Under construction, less than or equal to 50 percent complete 250.02020 6 11241 Entergy Louisiana LLC Electric Utility Lake Charles Power LA 60927 1B 250.0 Natural Gas Fired Combined Cycle NG CT (U) Under construction, less than or equal to 50 percent complete 250.02020 6 11241 Entergy Louisiana LLC Electric Utility Lake Charles Power LA 60927 1C 500.0 Natural Gas Fired Combined Cycle NG CA (U) Under construction, less than or equal to 50 percent complete 500.02020 6 56615 First Solar Project Development IPP Morada del Sol, LLC TX 61049 PV1 239.3 Solar Photovoltaic SUN PV (P) Planned for installation, but regulatory approvals not initiated 247.02020 6 7140 Georgia Power Co Electric Utility Vogtle GA 649 4 1,100.0 Nuclear NUC ST (U) Under construction, less than or equal to 50 percent complete 1,100.02020 6 60050 Halyard Energy Henderson, LLC IPP Halyard Henderson Energy Center TX 60268 TBN1 210.0 Natural Gas Fired Combustion Turbine NG GT (T) Regulatory approvals received. Not under construction 232.02020 6 60050 Halyard Energy Henderson, LLC IPP Halyard Henderson Energy Center TX 60268 TBN2 210.0 Natural Gas Fired Combustion Turbine NG GT (T) Regulatory approvals received. Not under construction 232.02020 6 60659 Hickory Run Energy, LLC IPP Hickory Run Energy Station PA 61028 CTG1 283.0 Natural Gas Fired Combined Cycle NG CT (T) Regulatory approvals received. Not under construction 311.02020 6 60659 Hickory Run Energy, LLC IPP Hickory Run Energy Station PA 61028 CTG2 283.0 Natural Gas Fired Combined Cycle NG CT (T) Regulatory approvals received. Not under construction 311.02020 6 60659 Hickory Run Energy, LLC IPP Hickory Run Energy Station PA 61028 STG1 437.0 Natural Gas Fired Combined Cycle NG CA (T) Regulatory approvals received. Not under construction 450.02020 6 60986 Imperial Valley Solar 2, LLC IPP Mount Signal Solar 2 CA 61353 IVS2 153.5 Solar Photovoltaic SUN PV (P) Planned for installation, but regulatory approvals not initiated 153.52020 6 56167 Imperial Valley Solar, LLC IPP Imperial Valley Solar, LLC CA 56917 2 400.0 Solar Photovoltaic SUN PV (L) Regulatory approvals pending. Not under construction 400.02020 6 55983 Luminant Generation Company LLC IPP DeCordova Steam Electric Station TX 8063 CT5 207.0 Natural Gas Fired Combustion Turbine NG GT (U) Under construction, less than or equal to 50 percent complete 235.52020 6 55983 Luminant Generation Company LLC IPP DeCordova Steam Electric Station TX 8063 CT6 207.0 Natural Gas Fired Combustion Turbine NG GT (U) Under construction, less than or equal to 50 percent complete 235.52020 6 55983 Luminant Generation Company LLC IPP Lake Creek TX 3502 CT1 207.0 Natural Gas Fired Combustion Turbine NG GT (U) Under construction, less than or equal to 50 percent complete 235.52020 6 55983 Luminant Generation Company LLC IPP Tradinghouse TX 3506 CT1 207.0 Natural Gas Fired Combustion Turbine NG GT (U) Under construction, less than or equal to 50 percent complete 235.52020 6 55983 Luminant Generation Company LLC IPP Tradinghouse TX 3506 CT2 207.0 Natural Gas Fired Combustion Turbine NG GT (U) Under construction, less than or equal to 50 percent complete 235.52020 6 59357 Navasota Energy Generation Holdings IPP Clear Springs Energy Center TX 59615 CTG-1 178.0 Natural Gas Fired Combustion Turbine NG GT (P) Planned for installation, but regulatory approvals not initiated 183.02020 6 59357 Navasota Energy Generation Holdings IPP Clear Springs Energy Center TX 59615 CTG-2 177.0 Natural Gas Fired Combustion Turbine NG GT (P) Planned for installation, but regulatory approvals not initiated 183.02020 6 59357 Navasota Energy Generation Holdings IPP Clear Springs Energy Center TX 59615 CTG-3 177.0 Natural Gas Fired Combustion Turbine NG GT (P) Planned for installation, but regulatory approvals not initiated 183.02020 6 59357 Navasota Energy Generation Holdings IPP Union Valley Energy Center TX 59616 CTG-1 178.0 Natural Gas Fired Combustion Turbine NG GT (P) Planned for installation, but regulatory approvals not initiated 183.02020 6 59357 Navasota Energy Generation Holdings IPP Union Valley Energy Center TX 59616 CTG-2 178.0 Natural Gas Fired Combustion Turbine NG GT (P) Planned for installation, but regulatory approvals not initiated 183.02020 6 59357 Navasota Energy Generation Holdings IPP Union Valley Energy Center TX 59616 CTG-3 178.0 Natural Gas Fired Combustion Turbine NG GT (P) Planned for installation, but regulatory approvals not initiated 183.02020 6 59357 Navasota Energy Generation Holdings IPP Van Alstyne Energy Center TX 59617 CTG-1 177.0 Natural Gas Fired Combustion Turbine NG GT (P) Planned for installation, but regulatory approvals not initiated 183.02020 6 59357 Navasota Energy Generation Holdings IPP Van Alstyne Energy Center TX 59617 CTG-2 177.0 Natural Gas Fired Combustion Turbine NG GT (P) Planned for installation, but regulatory approvals not initiated 183.02020 6 59357 Navasota Energy Generation Holdings IPP Van Alstyne Energy Center TX 59617 CTG-3 177.0 Natural Gas Fired Combustion Turbine NG GT (P) Planned for installation, but regulatory approvals not initiated 183.02020 6 60958 Ohio River Partners Shareholder LLC IPP Hannibal Port Power Project OH 61322 HPPP1 485.0 Natural Gas Fired Combined Cycle NG CC (P) Planned for installation, but regulatory approvals not initiated 485.02020 6 59489 Perennial-Wind Chaser LLC IPP Perennial Wind Chaser Station OR 59721 GT1 98.7 Natural Gas Fired Combustion Turbine NG GT (T) Regulatory approvals received. Not under construction 106.02020 6 59489 Perennial-Wind Chaser LLC IPP Perennial Wind Chaser Station OR 59721 GT2 98.7 Natural Gas Fired Combustion Turbine NG GT (T) Regulatory approvals received. Not under construction 106.02020 6 59489 Perennial-Wind Chaser LLC IPP Perennial Wind Chaser Station OR 59721 GT3 98.7 Natural Gas Fired Combustion Turbine NG GT (T) Regulatory approvals received. Not under construction 106.02020 6 59489 Perennial-Wind Chaser LLC IPP Perennial Wind Chaser Station OR 59721 GT4 98.7 Natural Gas Fired Combustion Turbine NG GT (T) Regulatory approvals received. Not under construction 106.02020 6 54866 Robinson Power Company LLC IPP Robinson Power Company LLC PA 56453 CTG1 950.0 Natural Gas Fired Combined Cycle NG CC (L) Regulatory approvals pending. Not under construction 1,025.02020 6 18414 TES Filer City Station LP Electric CHP TES Filer City Station MI 50835 GEN2 228.0 Natural Gas Fired Combined Cycle NG CT (P) Planned for installation, but regulatory approvals not initiated 253.02020 7 14624 PUD No 2 of Grant County Electric Utility Wanapum WA 3888 4A 122.0 Conventional Hydroelectric WAT HY (P) Planned for installation, but regulatory approvals not initiated 122.02020 7 59137 Palmer Renewable Energy IPP Palmer Renewable Energy MA 59336 PRE 42.0 Wood/Wood Waste Biomass WDS ST (T) Regulatory approvals received. Not under construction 42.02020 8 59844 Blythe Solar III, LLC IPP Blythe Solar III, LLC CA 60094 BLCK2 31.2 Solar Photovoltaic SUN PV (T) Regulatory approvals received. Not under construction 31.22020 8 59845 Blythe Solar IV, LLC IPP Blythe Solar IV, LLC CA 60095 BLCK2 31.2 Solar Photovoltaic SUN PV (T) Regulatory approvals received. Not under construction 31.22020 8 58798 Shell Chemical Appalachia LLC Industrial Shell Chemical Appalachia LLC PA 58933 STG1 75.0 Natural Gas Fired Combined Cycle NG CA (U) Under construction, less than or equal to 50 percent complete 75.02020 8 58798 Shell Chemical Appalachia LLC Industrial Shell Chemical Appalachia LLC PA 58933 STG2 75.0 Natural Gas Fired Combined Cycle NG CA (U) Under construction, less than or equal to 50 percent complete 75.02020 9 7277 Calpine Corporation IPP Buckeye Geothermal Power Plant CA 57180 1 49.9 Geothermal GEO ST (L) Regulatory approvals pending. Not under construction 56.92020 9 7277 Calpine Corporation IPP Wild Horse Power Plant CA 57181 1 40.0 Geothermal GEO ST (L) Regulatory approvals pending. Not under construction 48.02020 9 56615 First Solar Project Development IPP Little Bear Solar 1, LLC CA 59870 GEN01 20.0 Solar Photovoltaic SUN PV (L) Regulatory approvals pending. Not under construction 20.02020 9 56615 First Solar Project Development IPP Little Bear Solar 2, LLC CA 59885 GEN01 20.0 Solar Photovoltaic SUN PV (L) Regulatory approvals pending. Not under construction 20.0
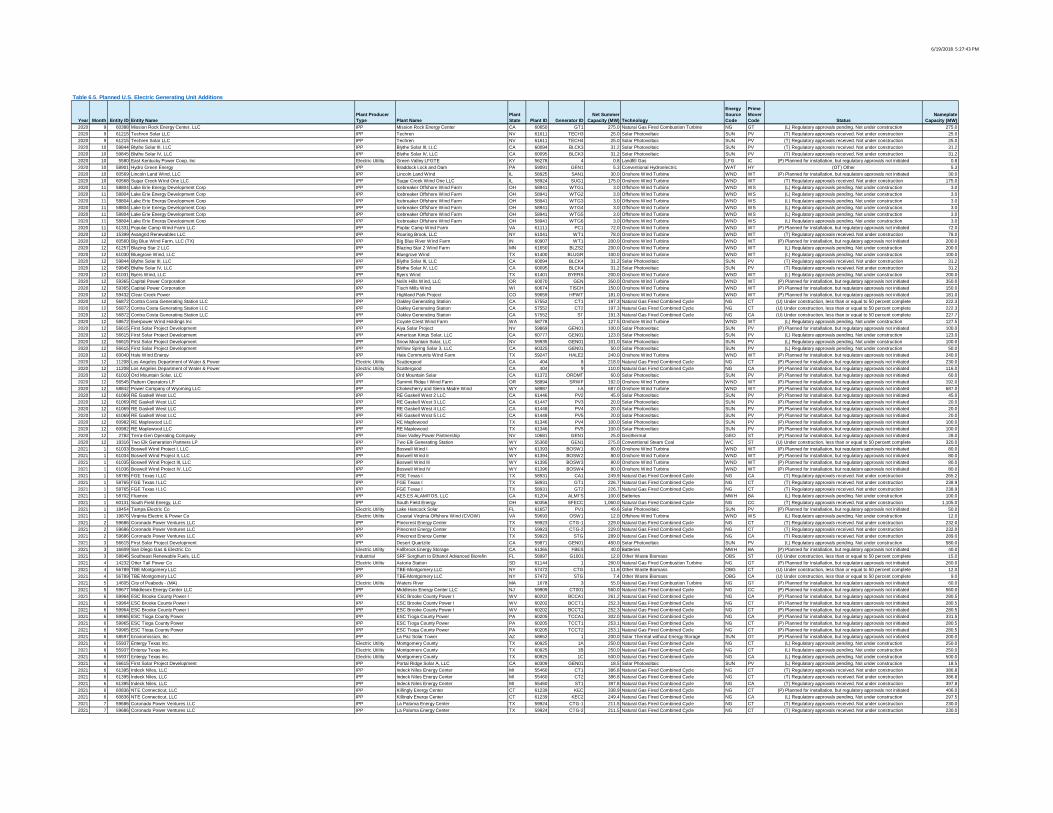
6/19/2018 5:27:43 PM
Year Month Entity ID Entity NamePlant Producer Type Plant Name
Plant State Plant ID Generator ID
Net Summer Capacity (MW) Technology
Energy Source Code
Prime Mover Code Status
Nameplate Capacity (MW)
Table 6.5. Planned U.S. Electric Generating Unit Additions
2020 9 60388 Mission Rock Energy Center, LLC IPP Mission Rock Energy Center CA 60650 GT1 275.0 Natural Gas Fired Combustion Turbine NG GT (L) Regulatory approvals pending. Not under construction 275.02020 9 61215 Techren Solar LLC IPP Techren NV 61611 TECH3 25.0 Solar Photovoltaic SUN PV (T) Regulatory approvals received. Not under construction 25.02020 9 61215 Techren Solar LLC IPP Techren NV 61611 TECH4 25.0 Solar Photovoltaic SUN PV (T) Regulatory approvals received. Not under construction 25.02020 10 59844 Blythe Solar III, LLC IPP Blythe Solar III, LLC CA 60094 BLCK3 31.2 Solar Photovoltaic SUN PV (T) Regulatory approvals received. Not under construction 31.22020 10 59845 Blythe Solar IV, LLC IPP Blythe Solar IV, LLC CA 60095 BLCK3 31.2 Solar Photovoltaic SUN PV (T) Regulatory approvals received. Not under construction 31.22020 10 5580 East Kentucky Power Coop, Inc Electric Utility Green Valley LFGTE KY 56278 4 0.8 Landfill Gas LFG IC (P) Planned for installation, but regulatory approvals not initiated 0.82020 10 58901 Hydro Green Energy IPP Braddock Lock and Dam PA 59091 GEN1 5.3 Conventional Hydroelectric WAT HY (OT) Other 5.32020 10 60569 Lincoln Land Wind, LLC IPP Lincoln Land Wind IL 58925 SAN1 30.0 Onshore Wind Turbine WND WT (P) Planned for installation, but regulatory approvals not initiated 30.02020 10 60568 Sugar Creek Wind One LLC IPP Sugar Creek Wind One LLC IL 58924 SUG1 175.0 Onshore Wind Turbine WND WT (T) Regulatory approvals received. Not under construction 175.02020 11 58804 Lake Erie Energy Development Corp IPP Icebreaker Offshore Wind Farm OH 58941 WTG1 3.0 Offshore Wind Turbine WND WS (L) Regulatory approvals pending. Not under construction 3.02020 11 58804 Lake Erie Energy Development Corp IPP Icebreaker Offshore Wind Farm OH 58941 WTG2 3.0 Offshore Wind Turbine WND WS (L) Regulatory approvals pending. Not under construction 3.02020 11 58804 Lake Erie Energy Development Corp IPP Icebreaker Offshore Wind Farm OH 58941 WTG3 3.0 Offshore Wind Turbine WND WS (L) Regulatory approvals pending. Not under construction 3.02020 11 58804 Lake Erie Energy Development Corp IPP Icebreaker Offshore Wind Farm OH 58941 WTG4 3.0 Offshore Wind Turbine WND WS (L) Regulatory approvals pending. Not under construction 3.02020 11 58804 Lake Erie Energy Development Corp IPP Icebreaker Offshore Wind Farm OH 58941 WTG5 3.0 Offshore Wind Turbine WND WS (L) Regulatory approvals pending. Not under construction 3.02020 11 58804 Lake Erie Energy Development Corp IPP Icebreaker Offshore Wind Farm OH 58941 WTG6 3.0 Offshore Wind Turbine WND WS (L) Regulatory approvals pending. Not under construction 3.02020 11 61331 Popular Camp Wind Farm LLC IPP Poplar Camp Wind Farm VA 61111 PC1 72.0 Onshore Wind Turbine WND WT (P) Planned for installation, but regulatory approvals not initiated 72.02020 12 15399 Avangrid Renewables LLC IPP Roaring Brook, LLC NY 61041 WT1 78.0 Onshore Wind Turbine WND WT (T) Regulatory approvals received. Not under construction 78.02020 12 60560 Big Blue Wind Farm, LLC (TX) IPP Big Blue River Wind Farm IN 60907 WT1 200.0 Onshore Wind Turbine WND WT (P) Planned for installation, but regulatory approvals not initiated 200.02020 12 61257 Blazing Star 2 LLC IPP Blazing Star 2 Wind Farm MN 61650 BLZS2 200.0 Onshore Wind Turbine WND WT (L) Regulatory approvals pending. Not under construction 200.02020 12 61030 Bluegrove Wind, LLC IPP Bluegrove Wind TX 61400 BLUGR 100.0 Onshore Wind Turbine WND WT (L) Regulatory approvals pending. Not under construction 100.02020 12 59844 Blythe Solar III, LLC IPP Blythe Solar III, LLC CA 60094 BLCK4 31.2 Solar Photovoltaic SUN PV (T) Regulatory approvals received. Not under construction 31.22020 12 59845 Blythe Solar IV, LLC IPP Blythe Solar IV, LLC CA 60095 BLCK4 31.2 Solar Photovoltaic SUN PV (T) Regulatory approvals received. Not under construction 31.22020 12 61031 Byers Wind, LLC IPP Byers Wind TX 61401 BYERS 200.0 Onshore Wind Turbine WND WT (L) Regulatory approvals pending. Not under construction 200.02020 12 59365 Capital Power Corporation IPP Nolin Hills Wind, LLC OR 60070 GEN 350.0 Onshore Wind Turbine WND WT (P) Planned for installation, but regulatory approvals not initiated 350.02020 12 59365 Capital Power Corporation IPP Tisch Mills Wind WI 60674 TISCH 150.0 Onshore Wind Turbine WND WT (P) Planned for installation, but regulatory approvals not initiated 150.02020 12 59432 Clear Creek Power IPP Highland Park Project CO 59659 HPWT 181.0 Onshore Wind Turbine WND WT (P) Planned for installation, but regulatory approvals not initiated 181.02020 12 56872 Contra Costa Generating Station LLC IPP Oakley Generating Station CA 57552 CT1 197.3 Natural Gas Fired Combined Cycle NG CT (U) Under construction, less than or equal to 50 percent complete 222.32020 12 56872 Contra Costa Generating Station LLC IPP Oakley Generating Station CA 57552 CT2 197.3 Natural Gas Fired Combined Cycle NG CT (U) Under construction, less than or equal to 50 percent complete 222.32020 12 56872 Contra Costa Generating Station LLC IPP Oakley Generating Station CA 57552 ST 191.3 Natural Gas Fired Combined Cycle NG CA (U) Under construction, less than or equal to 50 percent complete 227.72020 12 58672 Everpower Wind Holdings Inc IPP Coyote Crest Wind Farm WA 58778 1 127.5 Onshore Wind Turbine WND WT (L) Regulatory approvals pending. Not under construction 127.52020 12 56615 First Solar Project Development IPP Aiya Solar Project NV 59869 GEN01 100.0 Solar Photovoltaic SUN PV (P) Planned for installation, but regulatory approvals not initiated 100.02020 12 56615 First Solar Project Development IPP American Kings Solar, LLC CA 60777 GEN01 123.0 Solar Photovoltaic SUN PV (L) Regulatory approvals pending. Not under construction 123.02020 12 56615 First Solar Project Development IPP Snow Mountain Solar, LLC NV 59935 GEN01 101.0 Solar Photovoltaic SUN PV (L) Regulatory approvals pending. Not under construction 100.02020 12 56615 First Solar Project Development IPP Willow Spring Solar 3, LLC CA 60325 GEN01 50.0 Solar Photovoltaic SUN PV (L) Regulatory approvals pending. Not under construction 50.02020 12 60040 Hale Wind Energy IPP Hale Community Wind Farm TX 59247 HALE2 240.0 Onshore Wind Turbine WND WT (P) Planned for installation, but regulatory approvals not initiated 240.02020 12 11208 Los Angeles Department of Water & Power Electric Utility Scattergood CA 404 8 218.0 Natural Gas Fired Combined Cycle NG CT (P) Planned for installation, but regulatory approvals not initiated 230.02020 12 11208 Los Angeles Department of Water & Power Electric Utility Scattergood CA 404 9 110.0 Natural Gas Fired Combined Cycle NG CA (P) Planned for installation, but regulatory approvals not initiated 116.02020 12 61010 Ord Mountain Solar, LLC IPP Ord Mountain Solar CA 61372 ORDMT 60.0 Solar Photovoltaic SUN PV (P) Planned for installation, but regulatory approvals not initiated 60.02020 12 56545 Pattern Operators LP IPP Summit Ridge I Wind Farm OR 58894 SRWF 192.0 Onshore Wind Turbine WND WT (P) Planned for installation, but regulatory approvals not initiated 192.02020 12 58842 Power Company of Wyoming LLC IPP Chokecherry and Sierra Madre Wind WY 58987 I-A 687.0 Onshore Wind Turbine WND WT (P) Planned for installation, but regulatory approvals not initiated 687.02020 12 61069 RE Gaskell West LLC IPP RE Gaskell West 2 LLC CA 61446 PV2 45.0 Solar Photovoltaic SUN PV (P) Planned for installation, but regulatory approvals not initiated 45.02020 12 61069 RE Gaskell West LLC IPP RE Gaskell West 3 LLC CA 61447 PV3 20.0 Solar Photovoltaic SUN PV (P) Planned for installation, but regulatory approvals not initiated 20.02020 12 61069 RE Gaskell West LLC IPP RE Gaskell West 4 LLC CA 61448 PV4 20.0 Solar Photovoltaic SUN PV (P) Planned for installation, but regulatory approvals not initiated 20.02020 12 61069 RE Gaskell West LLC IPP RE Gaskell West 5 LLC CA 61449 PV5 20.0 Solar Photovoltaic SUN PV (P) Planned for installation, but regulatory approvals not initiated 20.02020 12 60982 RE Maplewood LLC IPP RE Maplewood TX 61346 PV4 100.0 Solar Photovoltaic SUN PV (P) Planned for installation, but regulatory approvals not initiated 100.02020 12 60982 RE Maplewood LLC IPP RE Maplewood TX 61346 PV5 100.0 Solar Photovoltaic SUN PV (P) Planned for installation, but regulatory approvals not initiated 100.02020 12 2782 Terra-Gen Operating Company IPP Dixie Valley Power Partnership NV 10681 GEN1 25.0 Geothermal GEO ST (P) Planned for installation, but regulatory approvals not initiated 28.02020 12 19316 Two Elk Generation Partners LP IPP Two Elk Generating Station WY 55360 GEN1 275.0 Conventional Steam Coal WC ST (U) Under construction, less than or equal to 50 percent complete 320.02021 1 61033 Boswell Wind Project I, LLC IPP Boswell Wind I WY 61393 BOSW1 80.0 Onshore Wind Turbine WND WT (P) Planned for installation, but regulatory approvals not initiated 80.02021 1 61034 Boswell Wind Project II, LLC IPP Boswell Wind II WY 61394 BOSW2 80.0 Onshore Wind Turbine WND WT (P) Planned for installation, but regulatory approvals not initiated 80.02021 1 61035 Boswell Wind Project III, LLC IPP Boswell Wind III WY 61395 BOSW3 80.0 Onshore Wind Turbine WND WT (P) Planned for installation, but regulatory approvals not initiated 80.02021 1 61036 Boswell Wind Project IV, LLC IPP Boswell Wind IV WY 61396 BOSW4 80.0 Onshore Wind Turbine WND WT (P) Planned for installation, but regulatory approvals not initiated 80.02021 1 58765 FGE Texas I LLC IPP FGE Texas I TX 58931 CA1 249.9 Natural Gas Fired Combined Cycle NG CA (T) Regulatory approvals received. Not under construction 265.22021 1 58765 FGE Texas I LLC IPP FGE Texas I TX 58931 GT1 226.7 Natural Gas Fired Combined Cycle NG CT (T) Regulatory approvals received. Not under construction 238.92021 1 58765 FGE Texas I LLC IPP FGE Texas I TX 58931 GT2 226.7 Natural Gas Fired Combined Cycle NG CT (T) Regulatory approvals received. Not under construction 238.92021 1 58702 Fluence IPP AES ES ALAMITOS, LLC CA 61204 ALMTS 100.0 Batteries MWH BA (L) Regulatory approvals pending. Not under construction 100.02021 1 60131 South Field Energy, LLC IPP South Field Energy OH 60356 SFECC 1,060.0 Natural Gas Fired Combined Cycle NG CC (T) Regulatory approvals received. Not under construction 1,105.02021 1 18454 Tampa Electric Co Electric Utility Lake Hancock Solar FL 61657 PV1 49.6 Solar Photovoltaic SUN PV (P) Planned for installation, but regulatory approvals not initiated 50.02021 1 19876 Virginia Electric & Power Co Electric Utility Coastal Virginia Offshore Wind (CVOW) VA 59693 OSW1 12.0 Offshore Wind Turbine WND WS (L) Regulatory approvals pending. Not under construction 12.02021 2 59686 Coronado Power Ventures LLC IPP Pinecrest Energy Center TX 59923 CTG-1 229.0 Natural Gas Fired Combined Cycle NG CT (T) Regulatory approvals received. Not under construction 232.02021 2 59686 Coronado Power Ventures LLC IPP Pinecrest Energy Center TX 59923 CTG-2 229.0 Natural Gas Fired Combined Cycle NG CT (T) Regulatory approvals received. Not under construction 232.02021 2 59686 Coronado Power Ventures LLC IPP Pinecrest Energy Center TX 59923 STG 289.0 Natural Gas Fired Combined Cycle NG CA (T) Regulatory approvals received. Not under construction 289.02021 3 56615 First Solar Project Development IPP Desert Quartzite CA 59871 GEN01 450.0 Solar Photovoltaic SUN PV (L) Regulatory approvals pending. Not under construction 580.02021 3 16609 San Diego Gas & Electric Co Electric Utility Fallbrook Energy Storage CA 61365 FBES 40.0 Batteries MWH BA (P) Planned for installation, but regulatory approvals not initiated 40.02021 3 58846 Southeast Renewable Fuels, LLC Industrial SRF Sorghum to Ethanol Advanced Biorefin FL 58997 G1001 12.0 Other Waste Biomass OBS ST (U) Under construction, less than or equal to 50 percent complete 15.02021 4 14232 Otter Tail Power Co Electric Utility Astoria Station SD 61144 1 260.0 Natural Gas Fired Combustion Turbine NG GT (P) Planned for installation, but regulatory approvals not initiated 260.02021 4 56789 TBE Montgomery LLC IPP TBE-Montgomery LLC NY 57472 CTG 11.6 Other Waste Biomass OBG CT (U) Under construction, less than or equal to 50 percent complete 12.02021 4 56789 TBE Montgomery LLC IPP TBE-Montgomery LLC NY 57472 STG 7.4 Other Waste Biomass OBG CA (U) Under construction, less than or equal to 50 percent complete 9.02021 5 14605 City of Peabody - (MA) Electric Utility Waters River MA 1678 3 55.0 Natural Gas Fired Combustion Turbine NG GT (P) Planned for installation, but regulatory approvals not initiated 60.02021 5 59677 Middlesex Energy Center LLC IPP Middlesex Energy Center LLC NJ 59909 CT001 560.0 Natural Gas Fired Combined Cycle NG CC (P) Planned for installation, but regulatory approvals not initiated 560.02021 6 59964 ESC Brooke County Power I IPP ESC Brooke County Power I WV 60202 BCCA1 261.2 Natural Gas Fired Combined Cycle NG CA (P) Planned for installation, but regulatory approvals not initiated 280.52021 6 59964 ESC Brooke County Power I IPP ESC Brooke County Power I WV 60202 BCCT1 252.3 Natural Gas Fired Combined Cycle NG CT (P) Planned for installation, but regulatory approvals not initiated 280.52021 6 59964 ESC Brooke County Power I IPP ESC Brooke County Power I WV 60202 BCCT2 252.3 Natural Gas Fired Combined Cycle NG CT (P) Planned for installation, but regulatory approvals not initiated 280.52021 6 59965 ESC Tioga County Power IPP ESC Tioga County Power PA 60205 TCCA1 302.0 Natural Gas Fired Combined Cycle NG CA (P) Planned for installation, but regulatory approvals not initiated 331.52021 6 59965 ESC Tioga County Power IPP ESC Tioga County Power PA 60205 TCCT1 253.1 Natural Gas Fired Combined Cycle NG CT (P) Planned for installation, but regulatory approvals not initiated 280.52021 6 59965 ESC Tioga County Power IPP ESC Tioga County Power PA 60205 TCCT2 253.1 Natural Gas Fired Combined Cycle NG CT (P) Planned for installation, but regulatory approvals not initiated 280.52021 6 58597 Enivromission, Inc IPP La Paz Solar Tower AZ 58652 1 200.0 Solar Thermal without Energy Storage SUN OT (P) Planned for installation, but regulatory approvals not initiated 200.02021 6 55937 Entergy Texas Inc. Electric Utility Montgomery County TX 60925 1A 250.0 Natural Gas Fired Combined Cycle NG CT (L) Regulatory approvals pending. Not under construction 250.02021 6 55937 Entergy Texas Inc. Electric Utility Montgomery County TX 60925 1B 250.0 Natural Gas Fired Combined Cycle NG CT (L) Regulatory approvals pending. Not under construction 250.02021 6 55937 Entergy Texas Inc. Electric Utility Montgomery County TX 60925 1C 500.0 Natural Gas Fired Combined Cycle NG CA (L) Regulatory approvals pending. Not under construction 500.02021 6 56615 First Solar Project Development IPP Portal Ridge Solar A, LLC CA 60309 GEN01 18.5 Solar Photovoltaic SUN PV (L) Regulatory approvals pending. Not under construction 18.52021 6 61395 Indeck Niles, LLC IPP Indeck Niles Energy Center MI 55460 CT1 386.8 Natural Gas Fired Combined Cycle NG CT (T) Regulatory approvals received. Not under construction 386.82021 6 61395 Indeck Niles, LLC IPP Indeck Niles Energy Center MI 55460 CT2 386.8 Natural Gas Fired Combined Cycle NG CT (T) Regulatory approvals received. Not under construction 386.82021 6 61395 Indeck Niles, LLC IPP Indeck Niles Energy Center MI 55460 ST1 397.8 Natural Gas Fired Combined Cycle NG CA (T) Regulatory approvals received. Not under construction 397.82021 6 60836 NTE Connecticut, LLC IPP Killingly Energy Center CT 61239 KEC 338.9 Natural Gas Fired Combined Cycle NG CT (P) Planned for installation, but regulatory approvals not initiated 406.02021 6 60836 NTE Connecticut, LLC IPP Killingly Energy Center CT 61239 KEC2 249.4 Natural Gas Fired Combined Cycle NG CA (L) Regulatory approvals pending. Not under construction 297.52021 7 59686 Coronado Power Ventures LLC IPP La Paloma Energy Center TX 59924 CTG-1 211.5 Natural Gas Fired Combined Cycle NG CT (T) Regulatory approvals received. Not under construction 230.02021 7 59686 Coronado Power Ventures LLC IPP La Paloma Energy Center TX 59924 CTG-2 211.5 Natural Gas Fired Combined Cycle NG CT (T) Regulatory approvals received. Not under construction 230.0
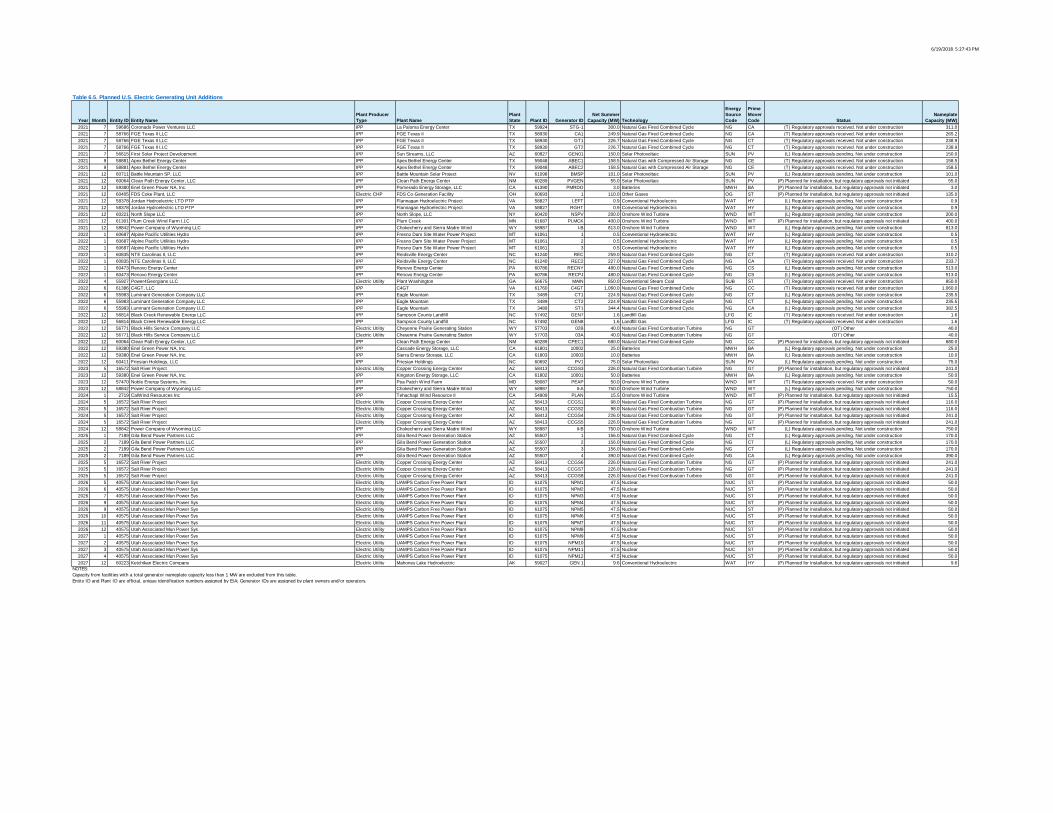
6/19/2018 5:27:43 PM
Year Month Entity ID Entity NamePlant Producer Type Plant Name
Plant State Plant ID Generator ID
Net Summer Capacity (MW) Technology
Energy Source Code
Prime Mover Code Status
Nameplate Capacity (MW)
Table 6.5. Planned U.S. Electric Generating Unit Additions
2021 7 59686 Coronado Power Ventures LLC IPP La Paloma Energy Center TX 59924 STG-1 300.0 Natural Gas Fired Combined Cycle NG CA (T) Regulatory approvals received. Not under construction 311.02021 7 58766 FGE Texas II LLC IPP FGE Texas II TX 58930 CA1 249.9 Natural Gas Fired Combined Cycle NG CA (T) Regulatory approvals received. Not under construction 265.22021 7 58766 FGE Texas II LLC IPP FGE Texas II TX 58930 GT1 226.7 Natural Gas Fired Combined Cycle NG CT (T) Regulatory approvals received. Not under construction 238.92021 7 58766 FGE Texas II LLC IPP FGE Texas II TX 58930 GT2 226.7 Natural Gas Fired Combined Cycle NG CT (T) Regulatory approvals received. Not under construction 238.92021 7 56615 First Solar Project Development IPP Sun Streams, LLC AZ 60827 GEN01 150.0 Solar Photovoltaic SUN PV (L) Regulatory approvals pending. Not under construction 150.02021 9 58881 Apex Bethel Energy Center IPP Apex Bethel Energy Center TX 59048 ABEC1 158.5 Natural Gas with Compressed Air Storage NG CE (T) Regulatory approvals received. Not under construction 158.52021 9 58881 Apex Bethel Energy Center IPP Apex Bethel Energy Center TX 59048 ABEC2 158.5 Natural Gas with Compressed Air Storage NG CE (T) Regulatory approvals received. Not under construction 158.52021 12 60711 Battle Mountain SP, LLC IPP Battle Mountain Solar Project NV 61098 BMSP 101.0 Solar Photovoltaic SUN PV (L) Regulatory approvals pending. Not under construction 101.02021 12 60064 Clean Path Energy Center, LLC IPP Clean Path Energy Center NM 60289 PVGEN 55.0 Solar Photovoltaic SUN PV (P) Planned for installation, but regulatory approvals not initiated 55.02021 12 59380 Enel Green Power NA, Inc. IPP Pomerado Energy Storage, LLC CA 61390 PMRDO 3.0 Batteries MWH BA (P) Planned for installation, but regulatory approvals not initiated 3.02021 12 60405 FDS Coke Plant, LLC Electric CHP FDS Co-Generation Facility OH 60693 1 110.0 Other Gases OG ST (P) Planned for installation, but regulatory approvals not initiated 135.02021 12 58378 Jordan Hydroelectric LTD PTP IPP Flannagan Hydroelectric Project VA 58827 LEFT 0.9 Conventional Hydroelectric WAT HY (L) Regulatory approvals pending. Not under construction 0.92021 12 58378 Jordan Hydroelectric LTD PTP IPP Flannagan Hydroelectric Project VA 58827 RGHT 0.9 Conventional Hydroelectric WAT HY (L) Regulatory approvals pending. Not under construction 0.92021 12 60221 North Slope LLC IPP North Slope, LLC NY 60420 NSPV 200.0 Onshore Wind Turbine WND WT (L) Regulatory approvals pending. Not under construction 200.02021 12 61301 Plum Creek Wind Farm LLC IPP Plum Creek MN 61687 PLMCK 400.0 Onshore Wind Turbine WND WT (P) Planned for installation, but regulatory approvals not initiated 400.02021 12 58842 Power Company of Wyoming LLC IPP Chokecherry and Sierra Madre Wind WY 58987 I-B 813.0 Onshore Wind Turbine WND WT (L) Regulatory approvals pending. Not under construction 813.02022 1 60687 Alpine Pacific Utilities Hydro IPP Fresno Dam Site Water Power Project MT 61061 1 0.5 Conventional Hydroelectric WAT HY (L) Regulatory approvals pending. Not under construction 0.52022 1 60687 Alpine Pacific Utilities Hydro IPP Fresno Dam Site Water Power Project MT 61061 2 0.5 Conventional Hydroelectric WAT HY (L) Regulatory approvals pending. Not under construction 0.52022 1 60687 Alpine Pacific Utilities Hydro IPP Fresno Dam Site Water Power Project MT 61061 3 0.5 Conventional Hydroelectric WAT HY (L) Regulatory approvals pending. Not under construction 0.52022 1 60835 NTE Carolinas II, LLC IPP Reidsville Energy Center NC 61240 REC 259.0 Natural Gas Fired Combined Cycle NG CT (T) Regulatory approvals received. Not under construction 310.22022 1 60835 NTE Carolinas II, LLC IPP Reidsville Energy Center NC 61240 REC2 227.0 Natural Gas Fired Combined Cycle NG CA (T) Regulatory approvals received. Not under construction 233.72022 1 60473 Renovo Energy Center IPP Renovo Energy Center PA 60786 RECNY 480.0 Natural Gas Fired Combined Cycle NG CS (L) Regulatory approvals pending. Not under construction 513.02022 1 60473 Renovo Energy Center IPP Renovo Energy Center PA 60786 RECPJ 480.0 Natural Gas Fired Combined Cycle NG CS (L) Regulatory approvals pending. Not under construction 513.02022 4 55927 Power4Georgians LLC Electric Utility Plant Washington GA 56675 MAIN 850.0 Conventional Steam Coal SUB ST (T) Regulatory approvals received. Not under construction 850.02022 6 61386 C4GT, LLC IPP C4GT VA 61760 C4GT 1,060.0 Natural Gas Fired Combined Cycle NG CC (T) Regulatory approvals received. Not under construction 1,060.02022 6 55983 Luminant Generation Company LLC IPP Eagle Mountain TX 3489 CT1 224.9 Natural Gas Fired Combined Cycle NG CT (L) Regulatory approvals pending. Not under construction 235.52022 6 55983 Luminant Generation Company LLC IPP Eagle Mountain TX 3489 CT2 224.9 Natural Gas Fired Combined Cycle NG CT (L) Regulatory approvals pending. Not under construction 235.52022 6 55983 Luminant Generation Company LLC IPP Eagle Mountain TX 3489 ST1 344.4 Natural Gas Fired Combined Cycle NG CA (L) Regulatory approvals pending. Not under construction 382.52022 12 56814 Black Creek Renewable Energy LLC IPP Sampson County Landfill NC 57492 GEN7 1.6 Landfill Gas LFG IC (T) Regulatory approvals received. Not under construction 1.62022 12 56814 Black Creek Renewable Energy LLC IPP Sampson County Landfill NC 57492 GEN8 1.6 Landfill Gas LFG IC (T) Regulatory approvals received. Not under construction 1.62022 12 56771 Black Hills Service Company LLC Electric Utility Cheyenne Prairie Generating Station WY 57703 02B 40.0 Natural Gas Fired Combustion Turbine NG GT (OT) Other 40.02022 12 56771 Black Hills Service Company LLC Electric Utility Cheyenne Prairie Generating Station WY 57703 03A 40.0 Natural Gas Fired Combustion Turbine NG GT (OT) Other 40.02022 12 60064 Clean Path Energy Center, LLC IPP Clean Path Energy Center NM 60289 CPEC1 680.0 Natural Gas Fired Combined Cycle NG CC (P) Planned for installation, but regulatory approvals not initiated 680.02022 12 59380 Enel Green Power NA, Inc. IPP Cascade Energy Storage, LLC CA 61801 10002 25.0 Batteries MWH BA (L) Regulatory approvals pending. Not under construction 25.02022 12 59380 Enel Green Power NA, Inc. IPP Sierra Energy Storage, LLC CA 61803 10003 10.0 Batteries MWH BA (L) Regulatory approvals pending. Not under construction 10.02022 12 60411 Friesian Holdings, LLC IPP Friesian Holdings NC 60692 PV1 75.0 Solar Photovoltaic SUN PV (L) Regulatory approvals pending. Not under construction 75.02023 5 16572 Salt River Project Electric Utility Copper Crossing Energy Center AZ 58413 CCGS3 226.0 Natural Gas Fired Combustion Turbine NG GT (P) Planned for installation, but regulatory approvals not initiated 241.02023 12 59380 Enel Green Power NA, Inc. IPP Kingston Energy Storage, LLC CA 61802 10001 50.0 Batteries MWH BA (L) Regulatory approvals pending. Not under construction 50.02023 12 57470 Noble Energy Systems, Inc. IPP Pea Patch Wind Farm MD 58087 PEAP 50.0 Onshore Wind Turbine WND WT (T) Regulatory approvals received. Not under construction 50.02023 12 58842 Power Company of Wyoming LLC IPP Chokecherry and Sierra Madre Wind WY 58987 II-A 750.0 Onshore Wind Turbine WND WT (L) Regulatory approvals pending. Not under construction 750.02024 1 2719 CalWind Resources Inc IPP Tehachapi Wind Resource II CA 54909 PLAN 15.5 Onshore Wind Turbine WND WT (P) Planned for installation, but regulatory approvals not initiated 15.52024 5 16572 Salt River Project Electric Utility Copper Crossing Energy Center AZ 58413 CCGS1 98.0 Natural Gas Fired Combustion Turbine NG GT (P) Planned for installation, but regulatory approvals not initiated 116.02024 5 16572 Salt River Project Electric Utility Copper Crossing Energy Center AZ 58413 CCGS2 98.0 Natural Gas Fired Combustion Turbine NG GT (P) Planned for installation, but regulatory approvals not initiated 116.02024 5 16572 Salt River Project Electric Utility Copper Crossing Energy Center AZ 58413 CCGS4 226.0 Natural Gas Fired Combustion Turbine NG GT (P) Planned for installation, but regulatory approvals not initiated 241.02024 5 16572 Salt River Project Electric Utility Copper Crossing Energy Center AZ 58413 CCGS5 226.0 Natural Gas Fired Combustion Turbine NG GT (P) Planned for installation, but regulatory approvals not initiated 241.02024 12 58842 Power Company of Wyoming LLC IPP Chokecherry and Sierra Madre Wind WY 58987 II-B 750.0 Onshore Wind Turbine WND WT (L) Regulatory approvals pending. Not under construction 750.02025 1 7189 Gila Bend Power Partners LLC IPP Gila Bend Power Generation Station AZ 55507 1 156.0 Natural Gas Fired Combined Cycle NG CT (L) Regulatory approvals pending. Not under construction 170.02025 2 7189 Gila Bend Power Partners LLC IPP Gila Bend Power Generation Station AZ 55507 2 156.0 Natural Gas Fired Combined Cycle NG CT (L) Regulatory approvals pending. Not under construction 170.02025 2 7189 Gila Bend Power Partners LLC IPP Gila Bend Power Generation Station AZ 55507 3 156.0 Natural Gas Fired Combined Cycle NG CT (L) Regulatory approvals pending. Not under construction 170.02025 2 7189 Gila Bend Power Partners LLC IPP Gila Bend Power Generation Station AZ 55507 4 390.0 Natural Gas Fired Combined Cycle NG CA (L) Regulatory approvals pending. Not under construction 390.02025 5 16572 Salt River Project Electric Utility Copper Crossing Energy Center AZ 58413 CCGS6 226.0 Natural Gas Fired Combustion Turbine NG GT (P) Planned for installation, but regulatory approvals not initiated 241.02025 5 16572 Salt River Project Electric Utility Copper Crossing Energy Center AZ 58413 CCGS7 226.0 Natural Gas Fired Combustion Turbine NG GT (P) Planned for installation, but regulatory approvals not initiated 241.02025 5 16572 Salt River Project Electric Utility Copper Crossing Energy Center AZ 58413 CCGS8 226.0 Natural Gas Fired Combustion Turbine NG GT (P) Planned for installation, but regulatory approvals not initiated 241.02026 5 40575 Utah Associated Mun Power Sys Electric Utility UAMPS Carbon Free Power Plant ID 61075 NPM1 47.5 Nuclear NUC ST (P) Planned for installation, but regulatory approvals not initiated 50.02026 6 40575 Utah Associated Mun Power Sys Electric Utility UAMPS Carbon Free Power Plant ID 61075 NPM2 47.5 Nuclear NUC ST (P) Planned for installation, but regulatory approvals not initiated 50.02026 7 40575 Utah Associated Mun Power Sys Electric Utility UAMPS Carbon Free Power Plant ID 61075 NPM3 47.5 Nuclear NUC ST (P) Planned for installation, but regulatory approvals not initiated 50.02026 9 40575 Utah Associated Mun Power Sys Electric Utility UAMPS Carbon Free Power Plant ID 61075 NPM4 47.5 Nuclear NUC ST (P) Planned for installation, but regulatory approvals not initiated 50.02026 9 40575 Utah Associated Mun Power Sys Electric Utility UAMPS Carbon Free Power Plant ID 61075 NPM5 47.5 Nuclear NUC ST (P) Planned for installation, but regulatory approvals not initiated 50.02026 10 40575 Utah Associated Mun Power Sys Electric Utility UAMPS Carbon Free Power Plant ID 61075 NPM6 47.5 Nuclear NUC ST (P) Planned for installation, but regulatory approvals not initiated 50.02026 11 40575 Utah Associated Mun Power Sys Electric Utility UAMPS Carbon Free Power Plant ID 61075 NPM7 47.5 Nuclear NUC ST (P) Planned for installation, but regulatory approvals not initiated 50.02026 12 40575 Utah Associated Mun Power Sys Electric Utility UAMPS Carbon Free Power Plant ID 61075 NPM8 47.5 Nuclear NUC ST (P) Planned for installation, but regulatory approvals not initiated 50.02027 1 40575 Utah Associated Mun Power Sys Electric Utility UAMPS Carbon Free Power Plant ID 61075 NPM9 47.5 Nuclear NUC ST (P) Planned for installation, but regulatory approvals not initiated 50.02027 2 40575 Utah Associated Mun Power Sys Electric Utility UAMPS Carbon Free Power Plant ID 61075 NPM10 47.5 Nuclear NUC ST (P) Planned for installation, but regulatory approvals not initiated 50.02027 3 40575 Utah Associated Mun Power Sys Electric Utility UAMPS Carbon Free Power Plant ID 61075 NPM11 47.5 Nuclear NUC ST (P) Planned for installation, but regulatory approvals not initiated 50.02027 4 40575 Utah Associated Mun Power Sys Electric Utility UAMPS Carbon Free Power Plant ID 61075 NPM12 47.5 Nuclear NUC ST (P) Planned for installation, but regulatory approvals not initiated 50.02027 12 60223 Ketchikan Electric Company Electric Utility Mahoney Lake Hydroelectric AK 59027 GEN 1 9.6 Conventional Hydroelectric WAT HY (P) Planned for installation, but regulatory approvals not initiated 9.6
NOTES:Capacity from facilities with a total generator nameplate capacity less than 1 MW are excluded from this table.Entity ID and Plant ID are official, unique identification numbers assigned by EIA; Generator IDs are assigned by plant owners and/or operators.
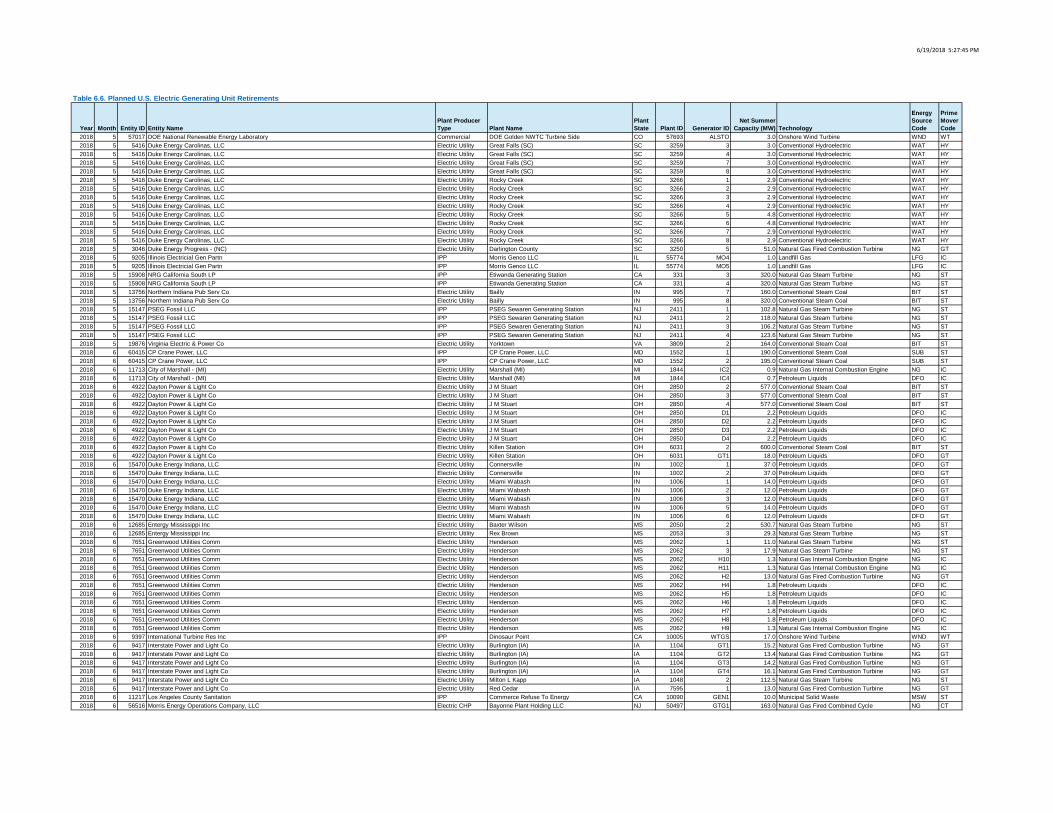
6/19/2018 5:27:45 PM
Year Month Entity ID Entity NamePlant Producer Type Plant Name
Plant State Plant ID Generator ID
Net Summer Capacity (MW) Technology
Energy Source Code
Prime Mover Code
2018 5 57017 DOE National Renewable Energy Laboratory Commercial DOE Golden NWTC Turbine Side CO 57693 ALSTO 3.0 Onshore Wind Turbine WND WT2018 5 5416 Duke Energy Carolinas, LLC Electric Utility Great Falls (SC) SC 3259 3 3.0 Conventional Hydroelectric WAT HY2018 5 5416 Duke Energy Carolinas, LLC Electric Utility Great Falls (SC) SC 3259 4 3.0 Conventional Hydroelectric WAT HY2018 5 5416 Duke Energy Carolinas, LLC Electric Utility Great Falls (SC) SC 3259 7 3.0 Conventional Hydroelectric WAT HY2018 5 5416 Duke Energy Carolinas, LLC Electric Utility Great Falls (SC) SC 3259 8 3.0 Conventional Hydroelectric WAT HY2018 5 5416 Duke Energy Carolinas, LLC Electric Utility Rocky Creek SC 3266 1 2.9 Conventional Hydroelectric WAT HY2018 5 5416 Duke Energy Carolinas, LLC Electric Utility Rocky Creek SC 3266 2 2.9 Conventional Hydroelectric WAT HY2018 5 5416 Duke Energy Carolinas, LLC Electric Utility Rocky Creek SC 3266 3 2.9 Conventional Hydroelectric WAT HY2018 5 5416 Duke Energy Carolinas, LLC Electric Utility Rocky Creek SC 3266 4 2.9 Conventional Hydroelectric WAT HY2018 5 5416 Duke Energy Carolinas, LLC Electric Utility Rocky Creek SC 3266 5 4.8 Conventional Hydroelectric WAT HY2018 5 5416 Duke Energy Carolinas, LLC Electric Utility Rocky Creek SC 3266 6 4.8 Conventional Hydroelectric WAT HY2018 5 5416 Duke Energy Carolinas, LLC Electric Utility Rocky Creek SC 3266 7 2.9 Conventional Hydroelectric WAT HY2018 5 5416 Duke Energy Carolinas, LLC Electric Utility Rocky Creek SC 3266 8 2.9 Conventional Hydroelectric WAT HY2018 5 3046 Duke Energy Progress - (NC) Electric Utility Darlington County SC 3250 5 51.0 Natural Gas Fired Combustion Turbine NG GT2018 5 9205 Illinois Electricial Gen Partn IPP Morris Genco LLC IL 55774 MO4 1.0 Landfill Gas LFG IC2018 5 9205 Illinois Electricial Gen Partn IPP Morris Genco LLC IL 55774 MO5 1.0 Landfill Gas LFG IC2018 5 15908 NRG California South LP IPP Etiwanda Generating Station CA 331 3 320.0 Natural Gas Steam Turbine NG ST2018 5 15908 NRG California South LP IPP Etiwanda Generating Station CA 331 4 320.0 Natural Gas Steam Turbine NG ST2018 5 13756 Northern Indiana Pub Serv Co Electric Utility Bailly IN 995 7 160.0 Conventional Steam Coal BIT ST2018 5 13756 Northern Indiana Pub Serv Co Electric Utility Bailly IN 995 8 320.0 Conventional Steam Coal BIT ST2018 5 15147 PSEG Fossil LLC IPP PSEG Sewaren Generating Station NJ 2411 1 102.8 Natural Gas Steam Turbine NG ST2018 5 15147 PSEG Fossil LLC IPP PSEG Sewaren Generating Station NJ 2411 2 118.0 Natural Gas Steam Turbine NG ST2018 5 15147 PSEG Fossil LLC IPP PSEG Sewaren Generating Station NJ 2411 3 106.2 Natural Gas Steam Turbine NG ST2018 5 15147 PSEG Fossil LLC IPP PSEG Sewaren Generating Station NJ 2411 4 123.6 Natural Gas Steam Turbine NG ST2018 5 19876 Virginia Electric & Power Co Electric Utility Yorktown VA 3809 2 164.0 Conventional Steam Coal BIT ST2018 6 60415 CP Crane Power, LLC IPP CP Crane Power, LLC MD 1552 1 190.0 Conventional Steam Coal SUB ST2018 6 60415 CP Crane Power, LLC IPP CP Crane Power, LLC MD 1552 2 195.0 Conventional Steam Coal SUB ST2018 6 11713 City of Marshall - (MI) Electric Utility Marshall (MI) MI 1844 IC2 0.9 Natural Gas Internal Combustion Engine NG IC2018 6 11713 City of Marshall - (MI) Electric Utility Marshall (MI) MI 1844 IC4 0.7 Petroleum Liquids DFO IC2018 6 4922 Dayton Power & Light Co Electric Utility J M Stuart OH 2850 2 577.0 Conventional Steam Coal BIT ST2018 6 4922 Dayton Power & Light Co Electric Utility J M Stuart OH 2850 3 577.0 Conventional Steam Coal BIT ST2018 6 4922 Dayton Power & Light Co Electric Utility J M Stuart OH 2850 4 577.0 Conventional Steam Coal BIT ST2018 6 4922 Dayton Power & Light Co Electric Utility J M Stuart OH 2850 D1 2.2 Petroleum Liquids DFO IC2018 6 4922 Dayton Power & Light Co Electric Utility J M Stuart OH 2850 D2 2.2 Petroleum Liquids DFO IC2018 6 4922 Dayton Power & Light Co Electric Utility J M Stuart OH 2850 D3 2.2 Petroleum Liquids DFO IC2018 6 4922 Dayton Power & Light Co Electric Utility J M Stuart OH 2850 D4 2.2 Petroleum Liquids DFO IC2018 6 4922 Dayton Power & Light Co Electric Utility Killen Station OH 6031 2 600.0 Conventional Steam Coal BIT ST2018 6 4922 Dayton Power & Light Co Electric Utility Killen Station OH 6031 GT1 18.0 Petroleum Liquids DFO GT2018 6 15470 Duke Energy Indiana, LLC Electric Utility Connersville IN 1002 1 37.0 Petroleum Liquids DFO GT2018 6 15470 Duke Energy Indiana, LLC Electric Utility Connersville IN 1002 2 37.0 Petroleum Liquids DFO GT2018 6 15470 Duke Energy Indiana, LLC Electric Utility Miami Wabash IN 1006 1 14.0 Petroleum Liquids DFO GT2018 6 15470 Duke Energy Indiana, LLC Electric Utility Miami Wabash IN 1006 2 12.0 Petroleum Liquids DFO GT2018 6 15470 Duke Energy Indiana, LLC Electric Utility Miami Wabash IN 1006 3 12.0 Petroleum Liquids DFO GT2018 6 15470 Duke Energy Indiana, LLC Electric Utility Miami Wabash IN 1006 5 14.0 Petroleum Liquids DFO GT2018 6 15470 Duke Energy Indiana, LLC Electric Utility Miami Wabash IN 1006 6 12.0 Petroleum Liquids DFO GT2018 6 12685 Entergy Mississippi Inc Electric Utility Baxter Wilson MS 2050 2 530.7 Natural Gas Steam Turbine NG ST2018 6 12685 Entergy Mississippi Inc Electric Utility Rex Brown MS 2053 3 29.3 Natural Gas Steam Turbine NG ST2018 6 7651 Greenwood Utilities Comm Electric Utility Henderson MS 2062 1 11.0 Natural Gas Steam Turbine NG ST2018 6 7651 Greenwood Utilities Comm Electric Utility Henderson MS 2062 3 17.9 Natural Gas Steam Turbine NG ST2018 6 7651 Greenwood Utilities Comm Electric Utility Henderson MS 2062 H10 1.3 Natural Gas Internal Combustion Engine NG IC2018 6 7651 Greenwood Utilities Comm Electric Utility Henderson MS 2062 H11 1.3 Natural Gas Internal Combustion Engine NG IC2018 6 7651 Greenwood Utilities Comm Electric Utility Henderson MS 2062 H2 13.0 Natural Gas Fired Combustion Turbine NG GT2018 6 7651 Greenwood Utilities Comm Electric Utility Henderson MS 2062 H4 1.8 Petroleum Liquids DFO IC2018 6 7651 Greenwood Utilities Comm Electric Utility Henderson MS 2062 H5 1.8 Petroleum Liquids DFO IC2018 6 7651 Greenwood Utilities Comm Electric Utility Henderson MS 2062 H6 1.8 Petroleum Liquids DFO IC2018 6 7651 Greenwood Utilities Comm Electric Utility Henderson MS 2062 H7 1.8 Petroleum Liquids DFO IC2018 6 7651 Greenwood Utilities Comm Electric Utility Henderson MS 2062 H8 1.8 Petroleum Liquids DFO IC2018 6 7651 Greenwood Utilities Comm Electric Utility Henderson MS 2062 H9 1.3 Natural Gas Internal Combustion Engine NG IC2018 6 9397 International Turbine Res Inc IPP Dinosaur Point CA 10005 WTGS 17.0 Onshore Wind Turbine WND WT2018 6 9417 Interstate Power and Light Co Electric Utility Burlington (IA) IA 1104 GT1 15.2 Natural Gas Fired Combustion Turbine NG GT2018 6 9417 Interstate Power and Light Co Electric Utility Burlington (IA) IA 1104 GT2 13.4 Natural Gas Fired Combustion Turbine NG GT2018 6 9417 Interstate Power and Light Co Electric Utility Burlington (IA) IA 1104 GT3 14.2 Natural Gas Fired Combustion Turbine NG GT2018 6 9417 Interstate Power and Light Co Electric Utility Burlington (IA) IA 1104 GT4 16.1 Natural Gas Fired Combustion Turbine NG GT2018 6 9417 Interstate Power and Light Co Electric Utility Milton L Kapp IA 1048 2 112.5 Natural Gas Steam Turbine NG ST2018 6 9417 Interstate Power and Light Co Electric Utility Red Cedar IA 7595 1 13.0 Natural Gas Fired Combustion Turbine NG GT2018 6 11217 Los Angeles County Sanitation IPP Commerce Refuse To Energy CA 10090 GEN1 10.0 Municipal Solid Waste MSW ST2018 6 56516 Morris Energy Operations Company, LLC Electric CHP Bayonne Plant Holding LLC NJ 50497 GTG1 163.0 Natural Gas Fired Combined Cycle NG CT
Table 6.6. Planned U.S. Electric Generating Unit Retirements
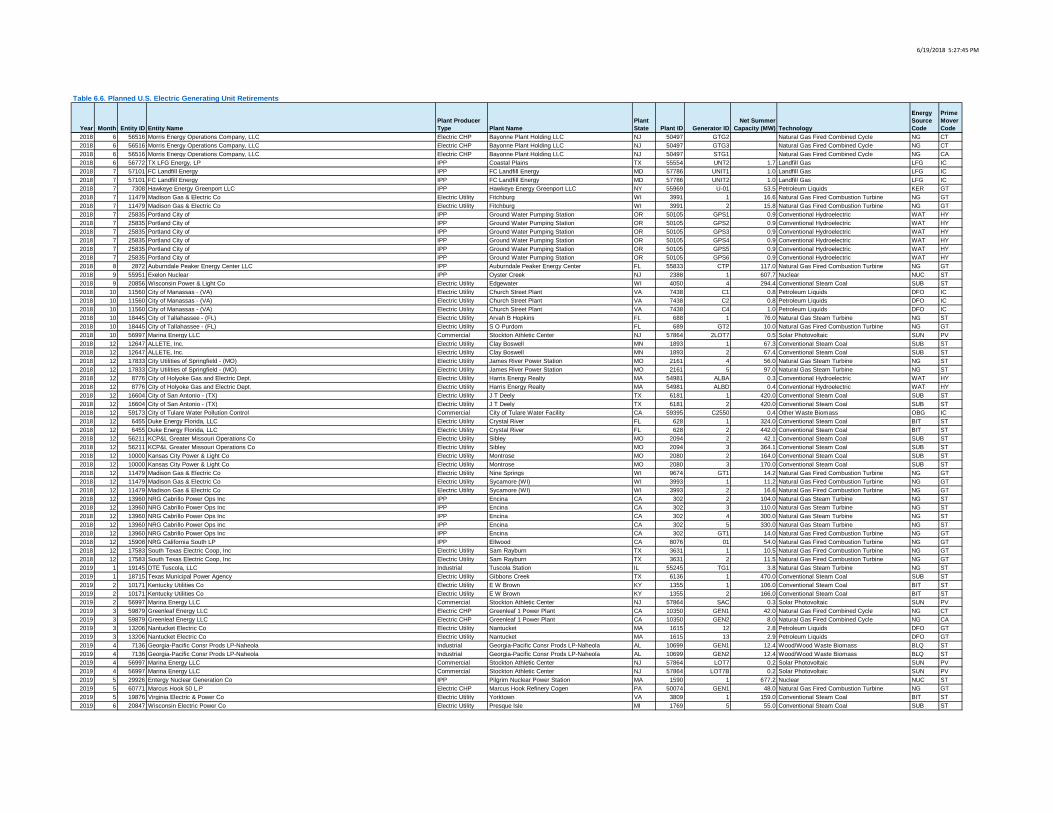
6/19/2018 5:27:45 PM
Year Month Entity ID Entity NamePlant Producer Type Plant Name
Plant State Plant ID Generator ID
Net Summer Capacity (MW) Technology
Energy Source Code
Prime Mover Code
Table 6.6. Planned U.S. Electric Generating Unit Retirements
2018 6 56516 Morris Energy Operations Company, LLC Electric CHP Bayonne Plant Holding LLC NJ 50497 GTG2 Natural Gas Fired Combined Cycle NG CT2018 6 56516 Morris Energy Operations Company, LLC Electric CHP Bayonne Plant Holding LLC NJ 50497 GTG3 Natural Gas Fired Combined Cycle NG CT2018 6 56516 Morris Energy Operations Company, LLC Electric CHP Bayonne Plant Holding LLC NJ 50497 STG1 Natural Gas Fired Combined Cycle NG CA2018 6 56772 TX LFG Energy, LP IPP Coastal Plains TX 55554 UNT2 1.7 Landfill Gas LFG IC2018 7 57101 FC Landfill Energy IPP FC Landfill Energy MD 57786 UNIT1 1.0 Landfill Gas LFG IC2018 7 57101 FC Landfill Energy IPP FC Landfill Energy MD 57786 UNIT2 1.0 Landfill Gas LFG IC2018 7 7308 Hawkeye Energy Greenport LLC IPP Hawkeye Energy Greenport LLC NY 55969 U-01 53.5 Petroleum Liquids KER GT2018 7 11479 Madison Gas & Electric Co Electric Utility Fitchburg WI 3991 1 16.6 Natural Gas Fired Combustion Turbine NG GT2018 7 11479 Madison Gas & Electric Co Electric Utility Fitchburg WI 3991 2 15.8 Natural Gas Fired Combustion Turbine NG GT2018 7 25835 Portland City of IPP Ground Water Pumping Station OR 50105 GPS1 0.9 Conventional Hydroelectric WAT HY2018 7 25835 Portland City of IPP Ground Water Pumping Station OR 50105 GPS2 0.9 Conventional Hydroelectric WAT HY2018 7 25835 Portland City of IPP Ground Water Pumping Station OR 50105 GPS3 0.9 Conventional Hydroelectric WAT HY2018 7 25835 Portland City of IPP Ground Water Pumping Station OR 50105 GPS4 0.9 Conventional Hydroelectric WAT HY2018 7 25835 Portland City of IPP Ground Water Pumping Station OR 50105 GPS5 0.9 Conventional Hydroelectric WAT HY2018 7 25835 Portland City of IPP Ground Water Pumping Station OR 50105 GPS6 0.9 Conventional Hydroelectric WAT HY2018 8 2872 Auburndale Peaker Energy Center LLC IPP Auburndale Peaker Energy Center FL 55833 CTP 117.0 Natural Gas Fired Combustion Turbine NG GT2018 9 55951 Exelon Nuclear IPP Oyster Creek NJ 2388 1 607.7 Nuclear NUC ST2018 9 20856 Wisconsin Power & Light Co Electric Utility Edgewater WI 4050 4 294.4 Conventional Steam Coal SUB ST2018 10 11560 City of Manassas - (VA) Electric Utility Church Street Plant VA 7438 C1 0.8 Petroleum Liquids DFO IC2018 10 11560 City of Manassas - (VA) Electric Utility Church Street Plant VA 7438 C2 0.8 Petroleum Liquids DFO IC2018 10 11560 City of Manassas - (VA) Electric Utility Church Street Plant VA 7438 C4 1.0 Petroleum Liquids DFO IC2018 10 18445 City of Tallahassee - (FL) Electric Utility Arvah B Hopkins FL 688 1 76.0 Natural Gas Steam Turbine NG ST2018 10 18445 City of Tallahassee - (FL) Electric Utility S O Purdom FL 689 GT2 10.0 Natural Gas Fired Combustion Turbine NG GT2018 10 56997 Marina Energy LLC Commercial Stockton Athletic Center NJ 57864 2LOT7 0.5 Solar Photovoltaic SUN PV2018 12 12647 ALLETE, Inc. Electric Utility Clay Boswell MN 1893 1 67.3 Conventional Steam Coal SUB ST2018 12 12647 ALLETE, Inc. Electric Utility Clay Boswell MN 1893 2 67.4 Conventional Steam Coal SUB ST2018 12 17833 City Utilities of Springfield - (MO) Electric Utility James River Power Station MO 2161 4 56.0 Natural Gas Steam Turbine NG ST2018 12 17833 City Utilities of Springfield - (MO) Electric Utility James River Power Station MO 2161 5 97.0 Natural Gas Steam Turbine NG ST2018 12 8776 City of Holyoke Gas and Electric Dept. Electric Utility Harris Energy Realty MA 54981 ALBA 0.3 Conventional Hydroelectric WAT HY2018 12 8776 City of Holyoke Gas and Electric Dept. Electric Utility Harris Energy Realty MA 54981 ALBD 0.4 Conventional Hydroelectric WAT HY2018 12 16604 City of San Antonio - (TX) Electric Utility J T Deely TX 6181 1 420.0 Conventional Steam Coal SUB ST2018 12 16604 City of San Antonio - (TX) Electric Utility J T Deely TX 6181 2 420.0 Conventional Steam Coal SUB ST2018 12 59173 City of Tulare Water Pollution Control Commercial City of Tulare Water Facility CA 59395 C2550 0.4 Other Waste Biomass OBG IC2018 12 6455 Duke Energy Florida, LLC Electric Utility Crystal River FL 628 1 324.0 Conventional Steam Coal BIT ST2018 12 6455 Duke Energy Florida, LLC Electric Utility Crystal River FL 628 2 442.0 Conventional Steam Coal BIT ST2018 12 56211 KCP&L Greater Missouri Operations Co Electric Utility Sibley MO 2094 2 42.1 Conventional Steam Coal SUB ST2018 12 56211 KCP&L Greater Missouri Operations Co Electric Utility Sibley MO 2094 3 364.1 Conventional Steam Coal SUB ST2018 12 10000 Kansas City Power & Light Co Electric Utility Montrose MO 2080 2 164.0 Conventional Steam Coal SUB ST2018 12 10000 Kansas City Power & Light Co Electric Utility Montrose MO 2080 3 170.0 Conventional Steam Coal SUB ST2018 12 11479 Madison Gas & Electric Co Electric Utility Nine Springs WI 9674 GT1 14.2 Natural Gas Fired Combustion Turbine NG GT2018 12 11479 Madison Gas & Electric Co Electric Utility Sycamore (WI) WI 3993 1 11.2 Natural Gas Fired Combustion Turbine NG GT2018 12 11479 Madison Gas & Electric Co Electric Utility Sycamore (WI) WI 3993 2 16.6 Natural Gas Fired Combustion Turbine NG GT2018 12 13960 NRG Cabrillo Power Ops Inc IPP Encina CA 302 2 104.0 Natural Gas Steam Turbine NG ST2018 12 13960 NRG Cabrillo Power Ops Inc IPP Encina CA 302 3 110.0 Natural Gas Steam Turbine NG ST2018 12 13960 NRG Cabrillo Power Ops Inc IPP Encina CA 302 4 300.0 Natural Gas Steam Turbine NG ST2018 12 13960 NRG Cabrillo Power Ops Inc IPP Encina CA 302 5 330.0 Natural Gas Steam Turbine NG ST2018 12 13960 NRG Cabrillo Power Ops Inc IPP Encina CA 302 GT1 14.0 Natural Gas Fired Combustion Turbine NG GT2018 12 15908 NRG California South LP IPP Ellwood CA 8076 01 54.0 Natural Gas Fired Combustion Turbine NG GT2018 12 17583 South Texas Electric Coop, Inc Electric Utility Sam Rayburn TX 3631 1 10.5 Natural Gas Fired Combustion Turbine NG GT2018 12 17583 South Texas Electric Coop, Inc Electric Utility Sam Rayburn TX 3631 2 11.5 Natural Gas Fired Combustion Turbine NG GT2019 1 19145 DTE Tuscola, LLC Industrial Tuscola Station IL 55245 TG1 3.8 Natural Gas Steam Turbine NG ST2019 1 18715 Texas Municipal Power Agency Electric Utility Gibbons Creek TX 6136 1 470.0 Conventional Steam Coal SUB ST2019 2 10171 Kentucky Utilities Co Electric Utility E W Brown KY 1355 1 106.0 Conventional Steam Coal BIT ST2019 2 10171 Kentucky Utilities Co Electric Utility E W Brown KY 1355 2 166.0 Conventional Steam Coal BIT ST2019 2 56997 Marina Energy LLC Commercial Stockton Athletic Center NJ 57864 SAC 0.3 Solar Photovoltaic SUN PV2019 3 59879 Greenleaf Energy LLC Electric CHP Greenleaf 1 Power Plant CA 10350 GEN1 42.0 Natural Gas Fired Combined Cycle NG CT2019 3 59879 Greenleaf Energy LLC Electric CHP Greenleaf 1 Power Plant CA 10350 GEN2 8.0 Natural Gas Fired Combined Cycle NG CA2019 3 13206 Nantucket Electric Co Electric Utility Nantucket MA 1615 12 2.8 Petroleum Liquids DFO GT2019 3 13206 Nantucket Electric Co Electric Utility Nantucket MA 1615 13 2.9 Petroleum Liquids DFO GT2019 4 7136 Georgia-Pacific Consr Prods LP-Naheola Industrial Georgia-Pacific Consr Prods LP-Naheola AL 10699 GEN1 12.4 Wood/Wood Waste Biomass BLQ ST2019 4 7136 Georgia-Pacific Consr Prods LP-Naheola Industrial Georgia-Pacific Consr Prods LP-Naheola AL 10699 GEN2 12.4 Wood/Wood Waste Biomass BLQ ST2019 4 56997 Marina Energy LLC Commercial Stockton Athletic Center NJ 57864 LOT7 0.2 Solar Photovoltaic SUN PV2019 4 56997 Marina Energy LLC Commercial Stockton Athletic Center NJ 57864 LOT7B 0.2 Solar Photovoltaic SUN PV2019 5 29926 Entergy Nuclear Generation Co IPP Pilgrim Nuclear Power Station MA 1590 1 677.2 Nuclear NUC ST2019 5 60771 Marcus Hook 50 L.P Electric CHP Marcus Hook Refinery Cogen PA 50074 GEN1 48.0 Natural Gas Fired Combustion Turbine NG GT2019 5 19876 Virginia Electric & Power Co Electric Utility Yorktown VA 3809 1 159.0 Conventional Steam Coal BIT ST2019 6 20847 Wisconsin Electric Power Co Electric Utility Presque Isle MI 1769 5 55.0 Conventional Steam Coal SUB ST
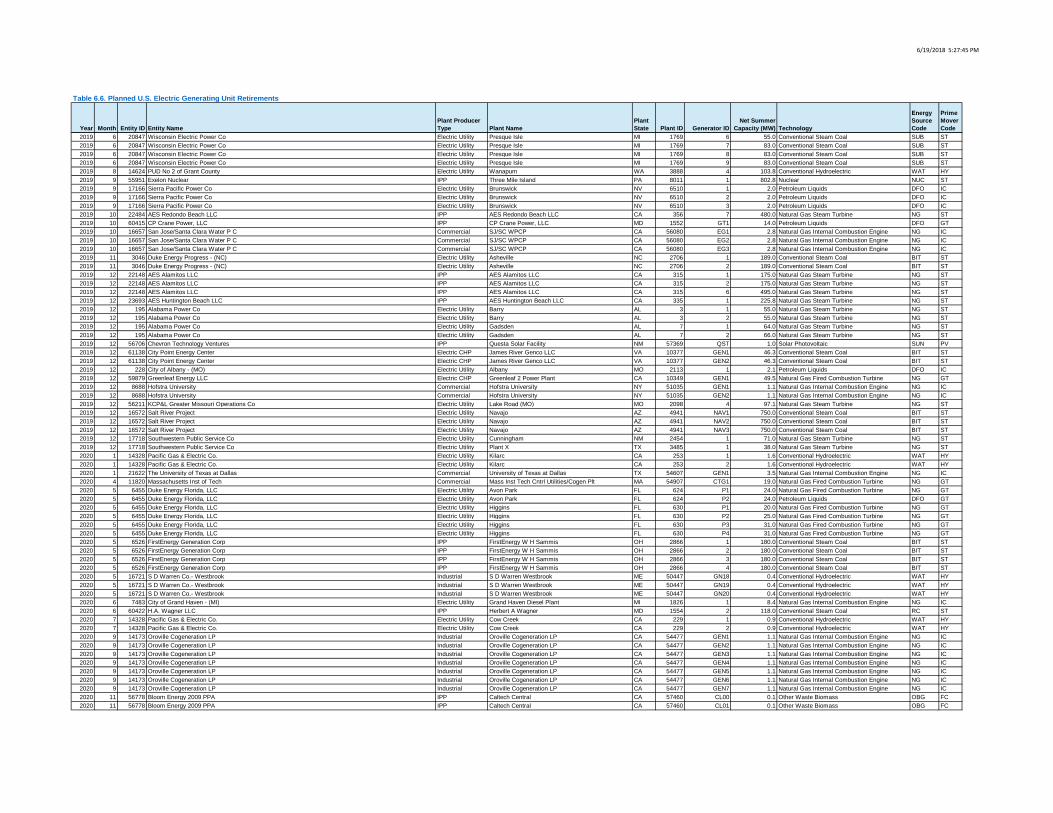
6/19/2018 5:27:45 PM
Year Month Entity ID Entity NamePlant Producer Type Plant Name
Plant State Plant ID Generator ID
Net Summer Capacity (MW) Technology
Energy Source Code
Prime Mover Code
Table 6.6. Planned U.S. Electric Generating Unit Retirements
2019 6 20847 Wisconsin Electric Power Co Electric Utility Presque Isle MI 1769 6 55.0 Conventional Steam Coal SUB ST2019 6 20847 Wisconsin Electric Power Co Electric Utility Presque Isle MI 1769 7 83.0 Conventional Steam Coal SUB ST2019 6 20847 Wisconsin Electric Power Co Electric Utility Presque Isle MI 1769 8 83.0 Conventional Steam Coal SUB ST2019 6 20847 Wisconsin Electric Power Co Electric Utility Presque Isle MI 1769 9 83.0 Conventional Steam Coal SUB ST2019 8 14624 PUD No 2 of Grant County Electric Utility Wanapum WA 3888 4 103.8 Conventional Hydroelectric WAT HY2019 9 55951 Exelon Nuclear IPP Three Mile Island PA 8011 1 802.8 Nuclear NUC ST2019 9 17166 Sierra Pacific Power Co Electric Utility Brunswick NV 6510 1 2.0 Petroleum Liquids DFO IC2019 9 17166 Sierra Pacific Power Co Electric Utility Brunswick NV 6510 2 2.0 Petroleum Liquids DFO IC2019 9 17166 Sierra Pacific Power Co Electric Utility Brunswick NV 6510 3 2.0 Petroleum Liquids DFO IC2019 10 22484 AES Redondo Beach LLC IPP AES Redondo Beach LLC CA 356 7 480.0 Natural Gas Steam Turbine NG ST2019 10 60415 CP Crane Power, LLC IPP CP Crane Power, LLC MD 1552 GT1 14.0 Petroleum Liquids DFO GT2019 10 16657 San Jose/Santa Clara Water P C Commercial SJ/SC WPCP CA 56080 EG1 2.8 Natural Gas Internal Combustion Engine NG IC2019 10 16657 San Jose/Santa Clara Water P C Commercial SJ/SC WPCP CA 56080 EG2 2.8 Natural Gas Internal Combustion Engine NG IC2019 10 16657 San Jose/Santa Clara Water P C Commercial SJ/SC WPCP CA 56080 EG3 2.8 Natural Gas Internal Combustion Engine NG IC2019 11 3046 Duke Energy Progress - (NC) Electric Utility Asheville NC 2706 1 189.0 Conventional Steam Coal BIT ST2019 11 3046 Duke Energy Progress - (NC) Electric Utility Asheville NC 2706 2 189.0 Conventional Steam Coal BIT ST2019 12 22148 AES Alamitos LLC IPP AES Alamitos LLC CA 315 1 175.0 Natural Gas Steam Turbine NG ST2019 12 22148 AES Alamitos LLC IPP AES Alamitos LLC CA 315 2 175.0 Natural Gas Steam Turbine NG ST2019 12 22148 AES Alamitos LLC IPP AES Alamitos LLC CA 315 6 495.0 Natural Gas Steam Turbine NG ST2019 12 23693 AES Huntington Beach LLC IPP AES Huntington Beach LLC CA 335 1 225.8 Natural Gas Steam Turbine NG ST2019 12 195 Alabama Power Co Electric Utility Barry AL 3 1 55.0 Natural Gas Steam Turbine NG ST2019 12 195 Alabama Power Co Electric Utility Barry AL 3 2 55.0 Natural Gas Steam Turbine NG ST2019 12 195 Alabama Power Co Electric Utility Gadsden AL 7 1 64.0 Natural Gas Steam Turbine NG ST2019 12 195 Alabama Power Co Electric Utility Gadsden AL 7 2 66.0 Natural Gas Steam Turbine NG ST2019 12 56706 Chevron Technology Ventures IPP Questa Solar Facility NM 57369 QST 1.0 Solar Photovoltaic SUN PV2019 12 61138 City Point Energy Center Electric CHP James River Genco LLC VA 10377 GEN1 46.3 Conventional Steam Coal BIT ST2019 12 61138 City Point Energy Center Electric CHP James River Genco LLC VA 10377 GEN2 46.3 Conventional Steam Coal BIT ST2019 12 228 City of Albany - (MO) Electric Utility Albany MO 2113 1 2.1 Petroleum Liquids DFO IC2019 12 59879 Greenleaf Energy LLC Electric CHP Greenleaf 2 Power Plant CA 10349 GEN1 49.5 Natural Gas Fired Combustion Turbine NG GT2019 12 8688 Hofstra University Commercial Hofstra University NY 51035 GEN1 1.1 Natural Gas Internal Combustion Engine NG IC2019 12 8688 Hofstra University Commercial Hofstra University NY 51035 GEN2 1.1 Natural Gas Internal Combustion Engine NG IC2019 12 56211 KCP&L Greater Missouri Operations Co Electric Utility Lake Road (MO) MO 2098 4 97.1 Natural Gas Steam Turbine NG ST2019 12 16572 Salt River Project Electric Utility Navajo AZ 4941 NAV1 750.0 Conventional Steam Coal BIT ST2019 12 16572 Salt River Project Electric Utility Navajo AZ 4941 NAV2 750.0 Conventional Steam Coal BIT ST2019 12 16572 Salt River Project Electric Utility Navajo AZ 4941 NAV3 750.0 Conventional Steam Coal BIT ST2019 12 17718 Southwestern Public Service Co Electric Utility Cunningham NM 2454 1 71.0 Natural Gas Steam Turbine NG ST2019 12 17718 Southwestern Public Service Co Electric Utility Plant X TX 3485 1 38.0 Natural Gas Steam Turbine NG ST2020 1 14328 Pacific Gas & Electric Co. Electric Utility Kilarc CA 253 1 1.6 Conventional Hydroelectric WAT HY2020 1 14328 Pacific Gas & Electric Co. Electric Utility Kilarc CA 253 2 1.6 Conventional Hydroelectric WAT HY2020 1 21622 The University of Texas at Dallas Commercial University of Texas at Dallas TX 54607 GEN1 3.5 Natural Gas Internal Combustion Engine NG IC2020 4 11820 Massachusetts Inst of Tech Commercial Mass Inst Tech Cntrl Utilities/Cogen Plt MA 54907 CTG1 19.0 Natural Gas Fired Combustion Turbine NG GT2020 5 6455 Duke Energy Florida, LLC Electric Utility Avon Park FL 624 P1 24.0 Natural Gas Fired Combustion Turbine NG GT2020 5 6455 Duke Energy Florida, LLC Electric Utility Avon Park FL 624 P2 24.0 Petroleum Liquids DFO GT2020 5 6455 Duke Energy Florida, LLC Electric Utility Higgins FL 630 P1 20.0 Natural Gas Fired Combustion Turbine NG GT2020 5 6455 Duke Energy Florida, LLC Electric Utility Higgins FL 630 P2 25.0 Natural Gas Fired Combustion Turbine NG GT2020 5 6455 Duke Energy Florida, LLC Electric Utility Higgins FL 630 P3 31.0 Natural Gas Fired Combustion Turbine NG GT2020 5 6455 Duke Energy Florida, LLC Electric Utility Higgins FL 630 P4 31.0 Natural Gas Fired Combustion Turbine NG GT2020 5 6526 FirstEnergy Generation Corp IPP FirstEnergy W H Sammis OH 2866 1 180.0 Conventional Steam Coal BIT ST2020 5 6526 FirstEnergy Generation Corp IPP FirstEnergy W H Sammis OH 2866 2 180.0 Conventional Steam Coal BIT ST2020 5 6526 FirstEnergy Generation Corp IPP FirstEnergy W H Sammis OH 2866 3 180.0 Conventional Steam Coal BIT ST2020 5 6526 FirstEnergy Generation Corp IPP FirstEnergy W H Sammis OH 2866 4 180.0 Conventional Steam Coal BIT ST2020 5 16721 S D Warren Co.- Westbrook Industrial S D Warren Westbrook ME 50447 GN18 0.4 Conventional Hydroelectric WAT HY2020 5 16721 S D Warren Co.- Westbrook Industrial S D Warren Westbrook ME 50447 GN19 0.4 Conventional Hydroelectric WAT HY2020 5 16721 S D Warren Co.- Westbrook Industrial S D Warren Westbrook ME 50447 GN20 0.4 Conventional Hydroelectric WAT HY2020 6 7483 City of Grand Haven - (MI) Electric Utility Grand Haven Diesel Plant MI 1826 1 8.4 Natural Gas Internal Combustion Engine NG IC2020 6 60422 H.A. Wagner LLC IPP Herbert A Wagner MD 1554 2 118.0 Conventional Steam Coal RC ST2020 7 14328 Pacific Gas & Electric Co. Electric Utility Cow Creek CA 229 1 0.9 Conventional Hydroelectric WAT HY2020 7 14328 Pacific Gas & Electric Co. Electric Utility Cow Creek CA 229 2 0.9 Conventional Hydroelectric WAT HY2020 9 14173 Oroville Cogeneration LP Industrial Oroville Cogeneration LP CA 54477 GEN1 1.1 Natural Gas Internal Combustion Engine NG IC2020 9 14173 Oroville Cogeneration LP Industrial Oroville Cogeneration LP CA 54477 GEN2 1.1 Natural Gas Internal Combustion Engine NG IC2020 9 14173 Oroville Cogeneration LP Industrial Oroville Cogeneration LP CA 54477 GEN3 1.1 Natural Gas Internal Combustion Engine NG IC2020 9 14173 Oroville Cogeneration LP Industrial Oroville Cogeneration LP CA 54477 GEN4 1.1 Natural Gas Internal Combustion Engine NG IC2020 9 14173 Oroville Cogeneration LP Industrial Oroville Cogeneration LP CA 54477 GEN5 1.1 Natural Gas Internal Combustion Engine NG IC2020 9 14173 Oroville Cogeneration LP Industrial Oroville Cogeneration LP CA 54477 GEN6 1.1 Natural Gas Internal Combustion Engine NG IC2020 9 14173 Oroville Cogeneration LP Industrial Oroville Cogeneration LP CA 54477 GEN7 1.1 Natural Gas Internal Combustion Engine NG IC2020 11 56778 Bloom Energy 2009 PPA IPP Caltech Central CA 57460 CL00 0.1 Other Waste Biomass OBG FC2020 11 56778 Bloom Energy 2009 PPA IPP Caltech Central CA 57460 CL01 0.1 Other Waste Biomass OBG FC
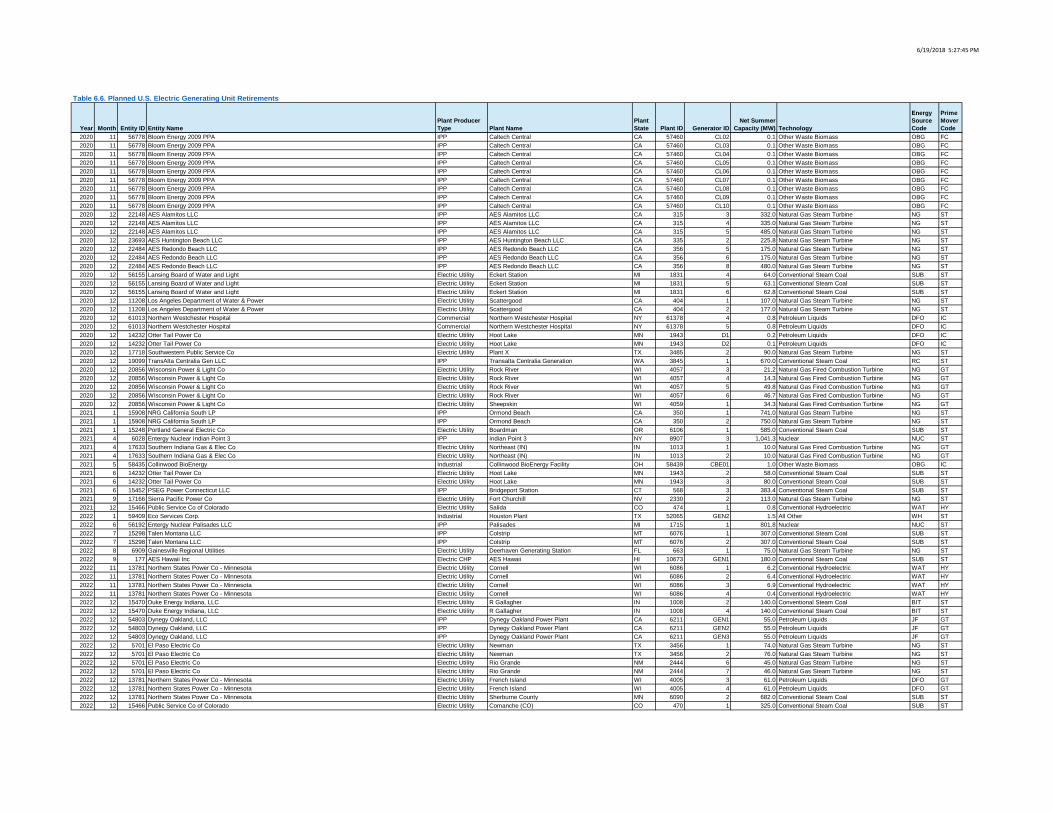
6/19/2018 5:27:45 PM
Year Month Entity ID Entity NamePlant Producer Type Plant Name
Plant State Plant ID Generator ID
Net Summer Capacity (MW) Technology
Energy Source Code
Prime Mover Code
Table 6.6. Planned U.S. Electric Generating Unit Retirements
2020 11 56778 Bloom Energy 2009 PPA IPP Caltech Central CA 57460 CL02 0.1 Other Waste Biomass OBG FC2020 11 56778 Bloom Energy 2009 PPA IPP Caltech Central CA 57460 CL03 0.1 Other Waste Biomass OBG FC2020 11 56778 Bloom Energy 2009 PPA IPP Caltech Central CA 57460 CL04 0.1 Other Waste Biomass OBG FC2020 11 56778 Bloom Energy 2009 PPA IPP Caltech Central CA 57460 CL05 0.1 Other Waste Biomass OBG FC2020 11 56778 Bloom Energy 2009 PPA IPP Caltech Central CA 57460 CL06 0.1 Other Waste Biomass OBG FC2020 11 56778 Bloom Energy 2009 PPA IPP Caltech Central CA 57460 CL07 0.1 Other Waste Biomass OBG FC2020 11 56778 Bloom Energy 2009 PPA IPP Caltech Central CA 57460 CL08 0.1 Other Waste Biomass OBG FC2020 11 56778 Bloom Energy 2009 PPA IPP Caltech Central CA 57460 CL09 0.1 Other Waste Biomass OBG FC2020 11 56778 Bloom Energy 2009 PPA IPP Caltech Central CA 57460 CL10 0.1 Other Waste Biomass OBG FC2020 12 22148 AES Alamitos LLC IPP AES Alamitos LLC CA 315 3 332.0 Natural Gas Steam Turbine NG ST2020 12 22148 AES Alamitos LLC IPP AES Alamitos LLC CA 315 4 335.0 Natural Gas Steam Turbine NG ST2020 12 22148 AES Alamitos LLC IPP AES Alamitos LLC CA 315 5 485.0 Natural Gas Steam Turbine NG ST2020 12 23693 AES Huntington Beach LLC IPP AES Huntington Beach LLC CA 335 2 225.8 Natural Gas Steam Turbine NG ST2020 12 22484 AES Redondo Beach LLC IPP AES Redondo Beach LLC CA 356 5 175.0 Natural Gas Steam Turbine NG ST2020 12 22484 AES Redondo Beach LLC IPP AES Redondo Beach LLC CA 356 6 175.0 Natural Gas Steam Turbine NG ST2020 12 22484 AES Redondo Beach LLC IPP AES Redondo Beach LLC CA 356 8 480.0 Natural Gas Steam Turbine NG ST2020 12 56155 Lansing Board of Water and Light Electric Utility Eckert Station MI 1831 4 64.0 Conventional Steam Coal SUB ST2020 12 56155 Lansing Board of Water and Light Electric Utility Eckert Station MI 1831 5 63.1 Conventional Steam Coal SUB ST2020 12 56155 Lansing Board of Water and Light Electric Utility Eckert Station MI 1831 6 62.8 Conventional Steam Coal SUB ST2020 12 11208 Los Angeles Department of Water & Power Electric Utility Scattergood CA 404 1 107.0 Natural Gas Steam Turbine NG ST2020 12 11208 Los Angeles Department of Water & Power Electric Utility Scattergood CA 404 2 177.0 Natural Gas Steam Turbine NG ST2020 12 61013 Northern Westchester Hospital Commercial Northern Westchester Hospital NY 61378 4 0.8 Petroleum Liquids DFO IC2020 12 61013 Northern Westchester Hospital Commercial Northern Westchester Hospital NY 61378 5 0.8 Petroleum Liquids DFO IC2020 12 14232 Otter Tail Power Co Electric Utility Hoot Lake MN 1943 D1 0.2 Petroleum Liquids DFO IC2020 12 14232 Otter Tail Power Co Electric Utility Hoot Lake MN 1943 D2 0.1 Petroleum Liquids DFO IC2020 12 17718 Southwestern Public Service Co Electric Utility Plant X TX 3485 2 90.0 Natural Gas Steam Turbine NG ST2020 12 19099 TransAlta Centralia Gen LLC IPP Transalta Centralia Generation WA 3845 1 670.0 Conventional Steam Coal RC ST2020 12 20856 Wisconsin Power & Light Co Electric Utility Rock River WI 4057 3 21.2 Natural Gas Fired Combustion Turbine NG GT2020 12 20856 Wisconsin Power & Light Co Electric Utility Rock River WI 4057 4 14.3 Natural Gas Fired Combustion Turbine NG GT2020 12 20856 Wisconsin Power & Light Co Electric Utility Rock River WI 4057 5 49.8 Natural Gas Fired Combustion Turbine NG GT2020 12 20856 Wisconsin Power & Light Co Electric Utility Rock River WI 4057 6 46.7 Natural Gas Fired Combustion Turbine NG GT2020 12 20856 Wisconsin Power & Light Co Electric Utility Sheepskin WI 4059 1 34.3 Natural Gas Fired Combustion Turbine NG GT2021 1 15908 NRG California South LP IPP Ormond Beach CA 350 1 741.0 Natural Gas Steam Turbine NG ST2021 1 15908 NRG California South LP IPP Ormond Beach CA 350 2 750.0 Natural Gas Steam Turbine NG ST2021 1 15248 Portland General Electric Co Electric Utility Boardman OR 6106 1 585.0 Conventional Steam Coal SUB ST2021 4 6028 Entergy Nuclear Indian Point 3 IPP Indian Point 3 NY 8907 3 1,041.3 Nuclear NUC ST2021 4 17633 Southern Indiana Gas & Elec Co Electric Utility Northeast (IN) IN 1013 1 10.0 Natural Gas Fired Combustion Turbine NG GT2021 4 17633 Southern Indiana Gas & Elec Co Electric Utility Northeast (IN) IN 1013 2 10.0 Natural Gas Fired Combustion Turbine NG GT2021 5 58435 Collinwood BioEnergy Industrial Collinwood BioEnergy Facility OH 58439 CBE01 1.0 Other Waste Biomass OBG IC2021 6 14232 Otter Tail Power Co Electric Utility Hoot Lake MN 1943 2 58.0 Conventional Steam Coal SUB ST2021 6 14232 Otter Tail Power Co Electric Utility Hoot Lake MN 1943 3 80.0 Conventional Steam Coal SUB ST2021 6 15452 PSEG Power Connecticut LLC IPP Bridgeport Station CT 568 3 383.4 Conventional Steam Coal SUB ST2021 9 17166 Sierra Pacific Power Co Electric Utility Fort Churchill NV 2330 2 113.0 Natural Gas Steam Turbine NG ST2021 12 15466 Public Service Co of Colorado Electric Utility Salida CO 474 1 0.8 Conventional Hydroelectric WAT HY2022 1 59409 Eco Services Corp. Industrial Houston Plant TX 52065 GEN2 1.5 All Other WH ST2022 6 56192 Entergy Nuclear Palisades LLC IPP Palisades MI 1715 1 801.8 Nuclear NUC ST2022 7 15298 Talen Montana LLC IPP Colstrip MT 6076 1 307.0 Conventional Steam Coal SUB ST2022 7 15298 Talen Montana LLC IPP Colstrip MT 6076 2 307.0 Conventional Steam Coal SUB ST2022 8 6909 Gainesville Regional Utilities Electric Utility Deerhaven Generating Station FL 663 1 75.0 Natural Gas Steam Turbine NG ST2022 9 177 AES Hawaii Inc Electric CHP AES Hawaii HI 10673 GEN1 180.0 Conventional Steam Coal SUB ST2022 11 13781 Northern States Power Co - Minnesota Electric Utility Cornell WI 6086 1 6.2 Conventional Hydroelectric WAT HY2022 11 13781 Northern States Power Co - Minnesota Electric Utility Cornell WI 6086 2 6.4 Conventional Hydroelectric WAT HY2022 11 13781 Northern States Power Co - Minnesota Electric Utility Cornell WI 6086 3 6.9 Conventional Hydroelectric WAT HY2022 11 13781 Northern States Power Co - Minnesota Electric Utility Cornell WI 6086 4 0.4 Conventional Hydroelectric WAT HY2022 12 15470 Duke Energy Indiana, LLC Electric Utility R Gallagher IN 1008 2 140.0 Conventional Steam Coal BIT ST2022 12 15470 Duke Energy Indiana, LLC Electric Utility R Gallagher IN 1008 4 140.0 Conventional Steam Coal BIT ST2022 12 54803 Dynegy Oakland, LLC IPP Dynegy Oakland Power Plant CA 6211 GEN1 55.0 Petroleum Liquids JF GT2022 12 54803 Dynegy Oakland, LLC IPP Dynegy Oakland Power Plant CA 6211 GEN2 55.0 Petroleum Liquids JF GT2022 12 54803 Dynegy Oakland, LLC IPP Dynegy Oakland Power Plant CA 6211 GEN3 55.0 Petroleum Liquids JF GT2022 12 5701 El Paso Electric Co Electric Utility Newman TX 3456 1 74.0 Natural Gas Steam Turbine NG ST2022 12 5701 El Paso Electric Co Electric Utility Newman TX 3456 2 76.0 Natural Gas Steam Turbine NG ST2022 12 5701 El Paso Electric Co Electric Utility Rio Grande NM 2444 6 45.0 Natural Gas Steam Turbine NG ST2022 12 5701 El Paso Electric Co Electric Utility Rio Grande NM 2444 7 46.0 Natural Gas Steam Turbine NG ST2022 12 13781 Northern States Power Co - Minnesota Electric Utility French Island WI 4005 3 61.0 Petroleum Liquids DFO GT2022 12 13781 Northern States Power Co - Minnesota Electric Utility French Island WI 4005 4 61.0 Petroleum Liquids DFO GT2022 12 13781 Northern States Power Co - Minnesota Electric Utility Sherburne County MN 6090 2 682.0 Conventional Steam Coal SUB ST2022 12 15466 Public Service Co of Colorado Electric Utility Comanche (CO) CO 470 1 325.0 Conventional Steam Coal SUB ST
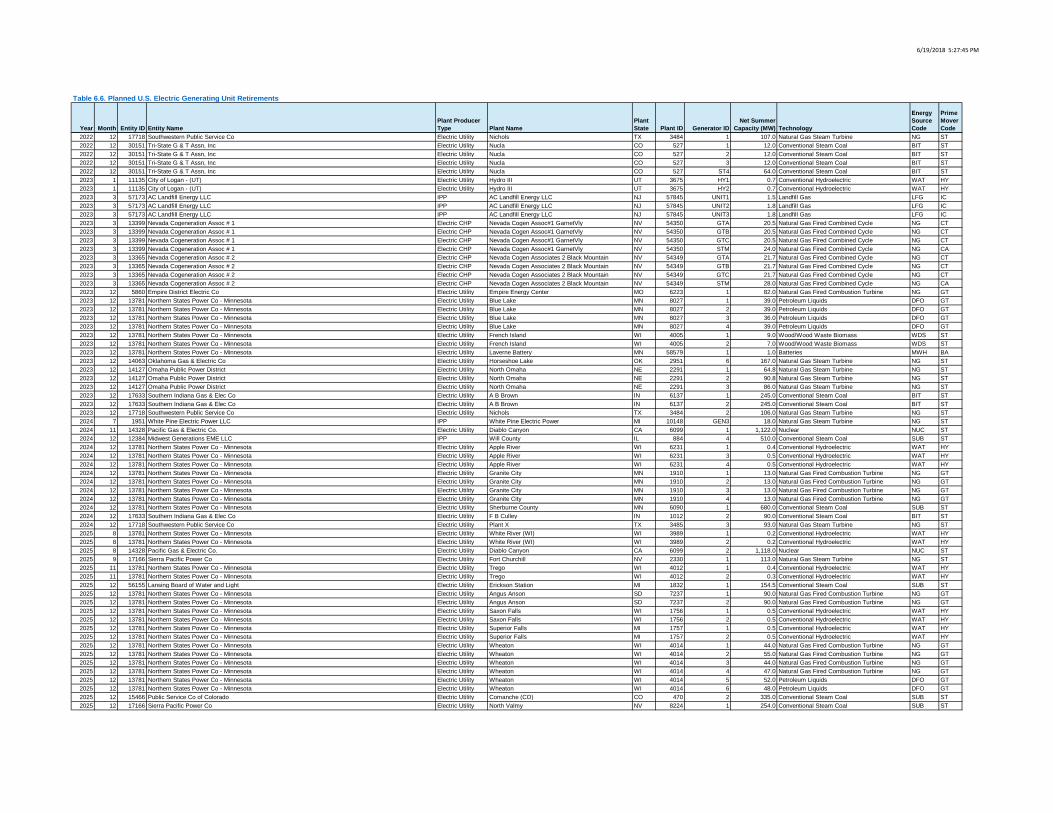
6/19/2018 5:27:45 PM
Year Month Entity ID Entity NamePlant Producer Type Plant Name
Plant State Plant ID Generator ID
Net Summer Capacity (MW) Technology
Energy Source Code
Prime Mover Code
Table 6.6. Planned U.S. Electric Generating Unit Retirements
2022 12 17718 Southwestern Public Service Co Electric Utility Nichols TX 3484 1 107.0 Natural Gas Steam Turbine NG ST2022 12 30151 Tri-State G & T Assn, Inc Electric Utility Nucla CO 527 1 12.0 Conventional Steam Coal BIT ST2022 12 30151 Tri-State G & T Assn, Inc Electric Utility Nucla CO 527 2 12.0 Conventional Steam Coal BIT ST2022 12 30151 Tri-State G & T Assn, Inc Electric Utility Nucla CO 527 3 12.0 Conventional Steam Coal BIT ST2022 12 30151 Tri-State G & T Assn, Inc Electric Utility Nucla CO 527 ST4 64.0 Conventional Steam Coal BIT ST2023 1 11135 City of Logan - (UT) Electric Utility Hydro III UT 3675 HY1 0.7 Conventional Hydroelectric WAT HY2023 1 11135 City of Logan - (UT) Electric Utility Hydro III UT 3675 HY2 0.7 Conventional Hydroelectric WAT HY2023 3 57173 AC Landfill Energy LLC IPP AC Landfill Energy LLC NJ 57845 UNIT1 1.5 Landfill Gas LFG IC2023 3 57173 AC Landfill Energy LLC IPP AC Landfill Energy LLC NJ 57845 UNIT2 1.8 Landfill Gas LFG IC2023 3 57173 AC Landfill Energy LLC IPP AC Landfill Energy LLC NJ 57845 UNIT3 1.8 Landfill Gas LFG IC2023 3 13399 Nevada Cogeneration Assoc # 1 Electric CHP Nevada Cogen Assoc#1 GarnetVly NV 54350 GTA 20.5 Natural Gas Fired Combined Cycle NG CT2023 3 13399 Nevada Cogeneration Assoc # 1 Electric CHP Nevada Cogen Assoc#1 GarnetVly NV 54350 GTB 20.5 Natural Gas Fired Combined Cycle NG CT2023 3 13399 Nevada Cogeneration Assoc # 1 Electric CHP Nevada Cogen Assoc#1 GarnetVly NV 54350 GTC 20.5 Natural Gas Fired Combined Cycle NG CT2023 3 13399 Nevada Cogeneration Assoc # 1 Electric CHP Nevada Cogen Assoc#1 GarnetVly NV 54350 STM 24.0 Natural Gas Fired Combined Cycle NG CA2023 3 13365 Nevada Cogeneration Assoc # 2 Electric CHP Nevada Cogen Associates 2 Black Mountain NV 54349 GTA 21.7 Natural Gas Fired Combined Cycle NG CT2023 3 13365 Nevada Cogeneration Assoc # 2 Electric CHP Nevada Cogen Associates 2 Black Mountain NV 54349 GTB 21.7 Natural Gas Fired Combined Cycle NG CT2023 3 13365 Nevada Cogeneration Assoc # 2 Electric CHP Nevada Cogen Associates 2 Black Mountain NV 54349 GTC 21.7 Natural Gas Fired Combined Cycle NG CT2023 3 13365 Nevada Cogeneration Assoc # 2 Electric CHP Nevada Cogen Associates 2 Black Mountain NV 54349 STM 28.0 Natural Gas Fired Combined Cycle NG CA2023 12 5860 Empire District Electric Co Electric Utility Empire Energy Center MO 6223 1 82.0 Natural Gas Fired Combustion Turbine NG GT2023 12 13781 Northern States Power Co - Minnesota Electric Utility Blue Lake MN 8027 1 39.0 Petroleum Liquids DFO GT2023 12 13781 Northern States Power Co - Minnesota Electric Utility Blue Lake MN 8027 2 39.0 Petroleum Liquids DFO GT2023 12 13781 Northern States Power Co - Minnesota Electric Utility Blue Lake MN 8027 3 36.0 Petroleum Liquids DFO GT2023 12 13781 Northern States Power Co - Minnesota Electric Utility Blue Lake MN 8027 4 39.0 Petroleum Liquids DFO GT2023 12 13781 Northern States Power Co - Minnesota Electric Utility French Island WI 4005 1 9.0 Wood/Wood Waste Biomass WDS ST2023 12 13781 Northern States Power Co - Minnesota Electric Utility French Island WI 4005 2 7.0 Wood/Wood Waste Biomass WDS ST2023 12 13781 Northern States Power Co - Minnesota Electric Utility Laverne Battery MN 58579 1 1.0 Batteries MWH BA2023 12 14063 Oklahoma Gas & Electric Co Electric Utility Horseshoe Lake OK 2951 6 167.0 Natural Gas Steam Turbine NG ST2023 12 14127 Omaha Public Power District Electric Utility North Omaha NE 2291 1 64.8 Natural Gas Steam Turbine NG ST2023 12 14127 Omaha Public Power District Electric Utility North Omaha NE 2291 2 90.8 Natural Gas Steam Turbine NG ST2023 12 14127 Omaha Public Power District Electric Utility North Omaha NE 2291 3 86.0 Natural Gas Steam Turbine NG ST2023 12 17633 Southern Indiana Gas & Elec Co Electric Utility A B Brown IN 6137 1 245.0 Conventional Steam Coal BIT ST2023 12 17633 Southern Indiana Gas & Elec Co Electric Utility A B Brown IN 6137 2 245.0 Conventional Steam Coal BIT ST2023 12 17718 Southwestern Public Service Co Electric Utility Nichols TX 3484 2 106.0 Natural Gas Steam Turbine NG ST2024 7 1951 White Pine Electric Power LLC IPP White Pine Electric Power MI 10148 GEN3 18.0 Natural Gas Steam Turbine NG ST2024 11 14328 Pacific Gas & Electric Co. Electric Utility Diablo Canyon CA 6099 1 1,122.0 Nuclear NUC ST2024 12 12384 Midwest Generations EME LLC IPP Will County IL 884 4 510.0 Conventional Steam Coal SUB ST2024 12 13781 Northern States Power Co - Minnesota Electric Utility Apple River WI 6231 1 0.4 Conventional Hydroelectric WAT HY2024 12 13781 Northern States Power Co - Minnesota Electric Utility Apple River WI 6231 3 0.5 Conventional Hydroelectric WAT HY2024 12 13781 Northern States Power Co - Minnesota Electric Utility Apple River WI 6231 4 0.5 Conventional Hydroelectric WAT HY2024 12 13781 Northern States Power Co - Minnesota Electric Utility Granite City MN 1910 1 13.0 Natural Gas Fired Combustion Turbine NG GT2024 12 13781 Northern States Power Co - Minnesota Electric Utility Granite City MN 1910 2 13.0 Natural Gas Fired Combustion Turbine NG GT2024 12 13781 Northern States Power Co - Minnesota Electric Utility Granite City MN 1910 3 13.0 Natural Gas Fired Combustion Turbine NG GT2024 12 13781 Northern States Power Co - Minnesota Electric Utility Granite City MN 1910 4 13.0 Natural Gas Fired Combustion Turbine NG GT2024 12 13781 Northern States Power Co - Minnesota Electric Utility Sherburne County MN 6090 1 680.0 Conventional Steam Coal SUB ST2024 12 17633 Southern Indiana Gas & Elec Co Electric Utility F B Culley IN 1012 2 90.0 Conventional Steam Coal BIT ST2024 12 17718 Southwestern Public Service Co Electric Utility Plant X TX 3485 3 93.0 Natural Gas Steam Turbine NG ST2025 8 13781 Northern States Power Co - Minnesota Electric Utility White River (WI) WI 3989 1 0.2 Conventional Hydroelectric WAT HY2025 8 13781 Northern States Power Co - Minnesota Electric Utility White River (WI) WI 3989 2 0.2 Conventional Hydroelectric WAT HY2025 8 14328 Pacific Gas & Electric Co. Electric Utility Diablo Canyon CA 6099 2 1,118.0 Nuclear NUC ST2025 9 17166 Sierra Pacific Power Co Electric Utility Fort Churchill NV 2330 1 113.0 Natural Gas Steam Turbine NG ST2025 11 13781 Northern States Power Co - Minnesota Electric Utility Trego WI 4012 1 0.4 Conventional Hydroelectric WAT HY2025 11 13781 Northern States Power Co - Minnesota Electric Utility Trego WI 4012 2 0.3 Conventional Hydroelectric WAT HY2025 12 56155 Lansing Board of Water and Light Electric Utility Erickson Station MI 1832 1 154.5 Conventional Steam Coal SUB ST2025 12 13781 Northern States Power Co - Minnesota Electric Utility Angus Anson SD 7237 1 90.0 Natural Gas Fired Combustion Turbine NG GT2025 12 13781 Northern States Power Co - Minnesota Electric Utility Angus Anson SD 7237 2 90.0 Natural Gas Fired Combustion Turbine NG GT2025 12 13781 Northern States Power Co - Minnesota Electric Utility Saxon Falls WI 1756 1 0.5 Conventional Hydroelectric WAT HY2025 12 13781 Northern States Power Co - Minnesota Electric Utility Saxon Falls WI 1756 2 0.5 Conventional Hydroelectric WAT HY2025 12 13781 Northern States Power Co - Minnesota Electric Utility Superior Falls MI 1757 1 0.5 Conventional Hydroelectric WAT HY2025 12 13781 Northern States Power Co - Minnesota Electric Utility Superior Falls MI 1757 2 0.5 Conventional Hydroelectric WAT HY2025 12 13781 Northern States Power Co - Minnesota Electric Utility Wheaton WI 4014 1 44.0 Natural Gas Fired Combustion Turbine NG GT2025 12 13781 Northern States Power Co - Minnesota Electric Utility Wheaton WI 4014 2 55.0 Natural Gas Fired Combustion Turbine NG GT2025 12 13781 Northern States Power Co - Minnesota Electric Utility Wheaton WI 4014 3 44.0 Natural Gas Fired Combustion Turbine NG GT2025 12 13781 Northern States Power Co - Minnesota Electric Utility Wheaton WI 4014 4 47.0 Natural Gas Fired Combustion Turbine NG GT2025 12 13781 Northern States Power Co - Minnesota Electric Utility Wheaton WI 4014 5 52.0 Petroleum Liquids DFO GT2025 12 13781 Northern States Power Co - Minnesota Electric Utility Wheaton WI 4014 6 48.0 Petroleum Liquids DFO GT2025 12 15466 Public Service Co of Colorado Electric Utility Comanche (CO) CO 470 2 335.0 Conventional Steam Coal SUB ST2025 12 17166 Sierra Pacific Power Co Electric Utility North Valmy NV 8224 1 254.0 Conventional Steam Coal SUB ST
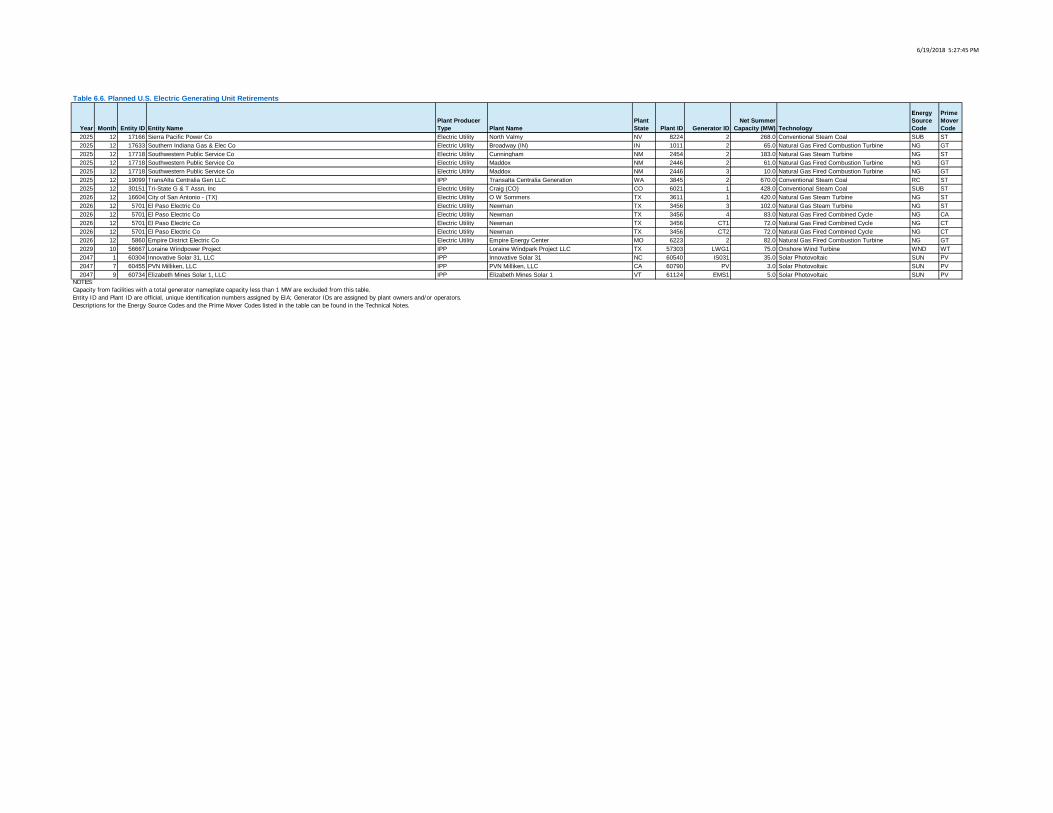
6/19/2018 5:27:45 PM
Year Month Entity ID Entity NamePlant Producer Type Plant Name
Plant State Plant ID Generator ID
Net Summer Capacity (MW) Technology
Energy Source Code
Prime Mover Code
Table 6.6. Planned U.S. Electric Generating Unit Retirements
2025 12 17166 Sierra Pacific Power Co Electric Utility North Valmy NV 8224 2 268.0 Conventional Steam Coal SUB ST2025 12 17633 Southern Indiana Gas & Elec Co Electric Utility Broadway (IN) IN 1011 2 65.0 Natural Gas Fired Combustion Turbine NG GT2025 12 17718 Southwestern Public Service Co Electric Utility Cunningham NM 2454 2 183.0 Natural Gas Steam Turbine NG ST2025 12 17718 Southwestern Public Service Co Electric Utility Maddox NM 2446 2 61.0 Natural Gas Fired Combustion Turbine NG GT2025 12 17718 Southwestern Public Service Co Electric Utility Maddox NM 2446 3 10.0 Natural Gas Fired Combustion Turbine NG GT2025 12 19099 TransAlta Centralia Gen LLC IPP Transalta Centralia Generation WA 3845 2 670.0 Conventional Steam Coal RC ST2025 12 30151 Tri-State G & T Assn, Inc Electric Utility Craig (CO) CO 6021 1 428.0 Conventional Steam Coal SUB ST2026 12 16604 City of San Antonio - (TX) Electric Utility O W Sommers TX 3611 1 420.0 Natural Gas Steam Turbine NG ST2026 12 5701 El Paso Electric Co Electric Utility Newman TX 3456 3 102.0 Natural Gas Steam Turbine NG ST2026 12 5701 El Paso Electric Co Electric Utility Newman TX 3456 4 83.0 Natural Gas Fired Combined Cycle NG CA2026 12 5701 El Paso Electric Co Electric Utility Newman TX 3456 CT1 72.0 Natural Gas Fired Combined Cycle NG CT2026 12 5701 El Paso Electric Co Electric Utility Newman TX 3456 CT2 72.0 Natural Gas Fired Combined Cycle NG CT2026 12 5860 Empire District Electric Co Electric Utility Empire Energy Center MO 6223 2 82.0 Natural Gas Fired Combustion Turbine NG GT2029 10 56667 Loraine Windpower Project IPP Loraine Windpark Project LLC TX 57303 LWG1 75.0 Onshore Wind Turbine WND WT2047 1 60304 Innovative Solar 31, LLC IPP Innovative Solar 31 NC 60540 IS031 35.0 Solar Photovoltaic SUN PV2047 7 60455 PVN Milliken, LLC IPP PVN Milliken, LLC CA 60790 PV 3.0 Solar Photovoltaic SUN PV2047 9 60734 Elizabeth Mines Solar 1, LLC IPP Elizabeth Mines Solar 1 VT 61124 EMS1 5.0 Solar Photovoltaic SUN PV
NOTES:Capacity from facilities with a total generator nameplate capacity less than 1 MW are excluded from this table.Entity ID and Plant ID are official, unique identification numbers assigned by EIA; Generator IDs are assigned by plant owners and/or operators.Descriptions for the Energy Source Codes and the Prime Mover Codes listed in the table can be found in the Technical Notes.
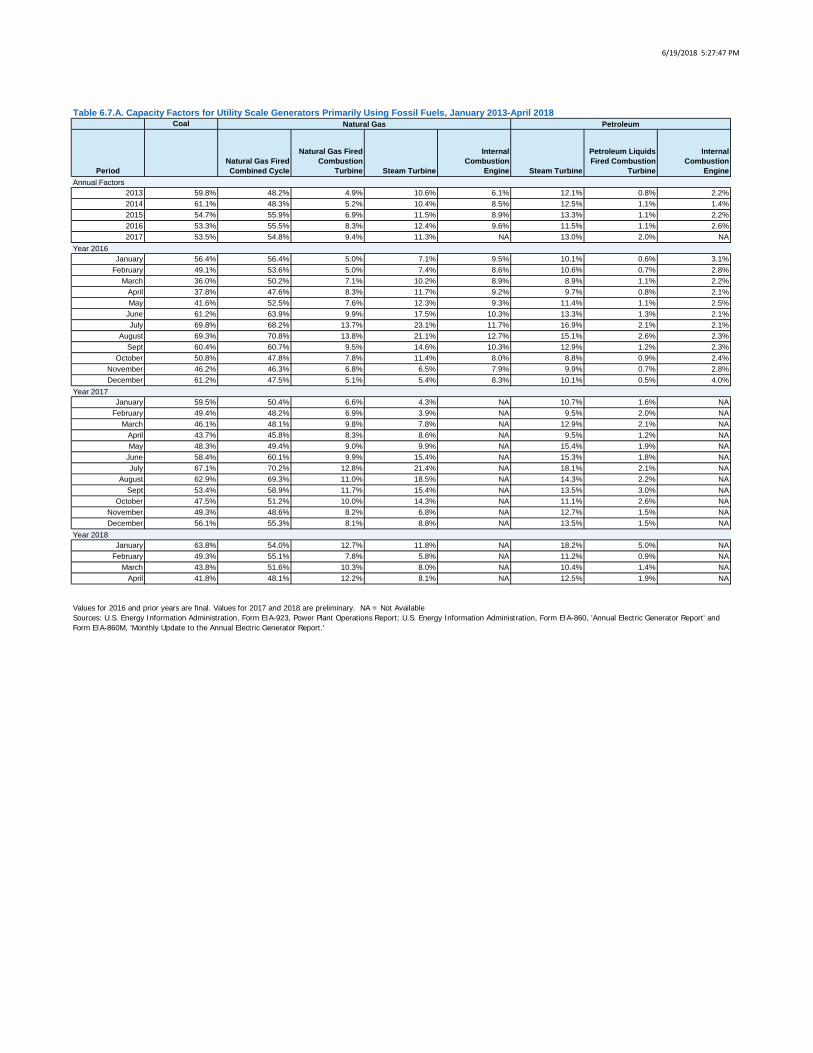
6/19/2018 5:27:47 PM
Coal
PeriodNatural Gas Fired Combined Cycle
Natural Gas Fired Combustion
Turbine Steam Turbine
Internal Combustion
Engine Steam Turbine
Petroleum Liquids Fired Combustion
Turbine
Internal Combustion
Engine
2013 59.8% 48.2% 4.9% 10.6% 6.1% 12.1% 0.8% 2.2%2014 61.1% 48.3% 5.2% 10.4% 8.5% 12.5% 1.1% 1.4%2015 54.7% 55.9% 6.9% 11.5% 8.9% 13.3% 1.1% 2.2%2016 53.3% 55.5% 8.3% 12.4% 9.6% 11.5% 1.1% 2.6%2017 53.5% 54.8% 9.4% 11.3% NA 13.0% 2.0% NA
January 56.4% 56.4% 5.0% 7.1% 9.5% 10.1% 0.6% 3.1%February 49.1% 53.6% 5.0% 7.4% 8.6% 10.6% 0.7% 2.8%
March 36.0% 50.2% 7.1% 10.2% 8.9% 8.9% 1.1% 2.2%April 37.8% 47.6% 8.3% 11.7% 9.2% 9.7% 0.8% 2.1%May 41.6% 52.5% 7.6% 12.3% 9.3% 11.4% 1.1% 2.5%
June 61.2% 63.9% 9.9% 17.5% 10.3% 13.3% 1.3% 2.1%July 69.8% 68.2% 13.7% 23.1% 11.7% 16.9% 2.1% 2.1%
August 69.3% 70.8% 13.8% 21.1% 12.7% 15.1% 2.6% 2.3%Sept 60.4% 60.7% 9.5% 14.6% 10.3% 12.9% 1.2% 2.3%
October 50.8% 47.8% 7.8% 11.4% 8.0% 8.8% 0.9% 2.4%November 46.2% 46.3% 6.8% 6.5% 7.9% 9.9% 0.7% 2.8%December 61.2% 47.5% 5.1% 5.4% 8.3% 10.1% 0.5% 4.0%
January 59.5% 50.4% 6.6% 4.3% NA 10.7% 1.6% NAFebruary 49.4% 48.2% 6.9% 3.9% NA 9.5% 2.0% NA
March 46.1% 48.1% 9.8% 7.8% NA 12.9% 2.1% NAApril 43.7% 45.8% 8.3% 8.6% NA 9.5% 1.2% NAMay 48.3% 49.4% 9.0% 9.9% NA 15.4% 1.9% NA
June 58.4% 60.1% 9.9% 15.4% NA 15.3% 1.8% NAJuly 67.1% 70.2% 12.8% 21.4% NA 18.1% 2.1% NA
August 62.9% 69.3% 11.0% 18.5% NA 14.3% 2.2% NASept 53.4% 58.9% 11.7% 15.4% NA 13.5% 3.0% NA
October 47.5% 51.2% 10.0% 14.3% NA 11.1% 2.6% NANovember 49.3% 48.6% 8.2% 6.8% NA 12.7% 1.5% NADecember 56.1% 55.3% 8.1% 8.8% NA 13.5% 1.5% NA
January 63.8% 54.0% 12.7% 11.8% NA 18.2% 5.0% NAFebruary 49.3% 55.1% 7.8% 5.8% NA 11.2% 0.9% NA
March 43.8% 51.6% 10.3% 8.0% NA 10.4% 1.4% NAApril 41.8% 48.1% 12.2% 8.1% NA 12.5% 1.9% NA
Year 2018
Values for 2016 and prior years are final. Values for 2017 and 2018 are preliminary. NA = Not AvailableSources: U.S. Energy Information Administration, Form EIA-923, Power Plant Operations Report; U.S. Energy Information Administration, Form EIA-860, 'Annual Electric Generator Report' and Form EIA-860M, 'Monthly Update to the Annual Electric Generator Report.'
Table 6.7.A. Capacity Factors for Utility Scale Generators Primarily Using Fossil Fuels, January 2013-April 2018Natural Gas Petroleum
Annual Factors
Year 2016
Year 2017
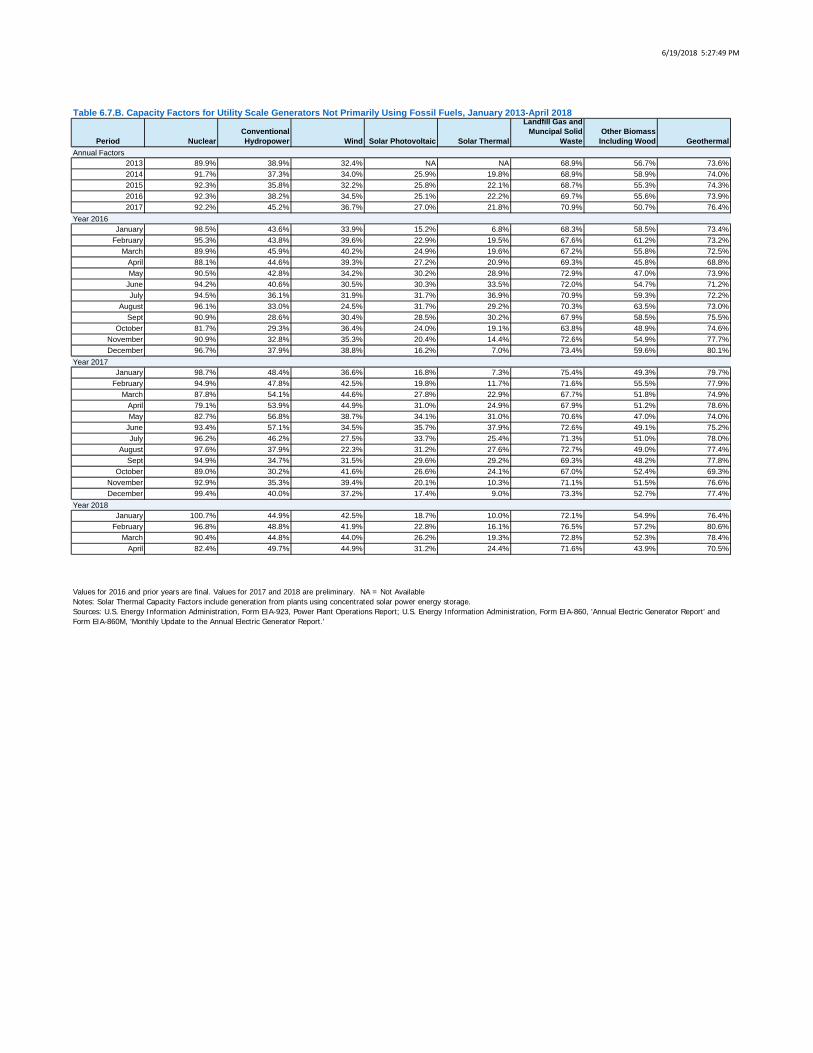
6/19/2018 5:27:49 PM
Period NuclearConventional Hydropower Wind Solar Photovoltaic Solar Thermal
Landfill Gas and Muncipal Solid
WasteOther Biomass
Including Wood Geothermal
2013 89.9% 38.9% 32.4% NA NA 68.9% 56.7% 73.6%2014 91.7% 37.3% 34.0% 25.9% 19.8% 68.9% 58.9% 74.0%2015 92.3% 35.8% 32.2% 25.8% 22.1% 68.7% 55.3% 74.3%2016 92.3% 38.2% 34.5% 25.1% 22.2% 69.7% 55.6% 73.9%2017 92.2% 45.2% 36.7% 27.0% 21.8% 70.9% 50.7% 76.4%
January 98.5% 43.6% 33.9% 15.2% 6.8% 68.3% 58.5% 73.4%February 95.3% 43.8% 39.6% 22.9% 19.5% 67.6% 61.2% 73.2%
March 89.9% 45.9% 40.2% 24.9% 19.6% 67.2% 55.8% 72.5%April 88.1% 44.6% 39.3% 27.2% 20.9% 69.3% 45.8% 68.8%May 90.5% 42.8% 34.2% 30.2% 28.9% 72.9% 47.0% 73.9%
June 94.2% 40.6% 30.5% 30.3% 33.5% 72.0% 54.7% 71.2%July 94.5% 36.1% 31.9% 31.7% 36.9% 70.9% 59.3% 72.2%
August 96.1% 33.0% 24.5% 31.7% 29.2% 70.3% 63.5% 73.0%Sept 90.9% 28.6% 30.4% 28.5% 30.2% 67.9% 58.5% 75.5%
October 81.7% 29.3% 36.4% 24.0% 19.1% 63.8% 48.9% 74.6%November 90.9% 32.8% 35.3% 20.4% 14.4% 72.6% 54.9% 77.7%December 96.7% 37.9% 38.8% 16.2% 7.0% 73.4% 59.6% 80.1%
January 98.7% 48.4% 36.6% 16.8% 7.3% 75.4% 49.3% 79.7%February 94.9% 47.8% 42.5% 19.8% 11.7% 71.6% 55.5% 77.9%
March 87.8% 54.1% 44.6% 27.8% 22.9% 67.7% 51.8% 74.9%April 79.1% 53.9% 44.9% 31.0% 24.9% 67.9% 51.2% 78.6%May 82.7% 56.8% 38.7% 34.1% 31.0% 70.6% 47.0% 74.0%
June 93.4% 57.1% 34.5% 35.7% 37.9% 72.6% 49.1% 75.2%July 96.2% 46.2% 27.5% 33.7% 25.4% 71.3% 51.0% 78.0%
August 97.6% 37.9% 22.3% 31.2% 27.6% 72.7% 49.0% 77.4%Sept 94.9% 34.7% 31.5% 29.6% 29.2% 69.3% 48.2% 77.8%
October 89.0% 30.2% 41.6% 26.6% 24.1% 67.0% 52.4% 69.3%November 92.9% 35.3% 39.4% 20.1% 10.3% 71.1% 51.5% 76.6%December 99.4% 40.0% 37.2% 17.4% 9.0% 73.3% 52.7% 77.4%
January 100.7% 44.9% 42.5% 18.7% 10.0% 72.1% 54.9% 76.4%February 96.8% 48.8% 41.9% 22.8% 16.1% 76.5% 57.2% 80.6%
March 90.4% 44.8% 44.0% 26.2% 19.3% 72.8% 52.3% 78.4%April 82.4% 49.7% 44.9% 31.2% 24.4% 71.6% 43.9% 70.5%
Values for 2016 and prior years are final. Values for 2017 and 2018 are preliminary. NA = Not AvailableNotes: Solar Thermal Capacity Factors include generation from plants using concentrated solar power energy storage.Sources: U.S. Energy Information Administration, Form EIA-923, Power Plant Operations Report; U.S. Energy Information Administration, Form EIA-860, 'Annual Electric Generator Report' and Form EIA-860M, 'Monthly Update to the Annual Electric Generator Report.'
Table 6.7.B. Capacity Factors for Utility Scale Generators Not Primarily Using Fossil Fuels, January 2013-April 2018
Annual Factors
Year 2016
Year 2017
Year 2018
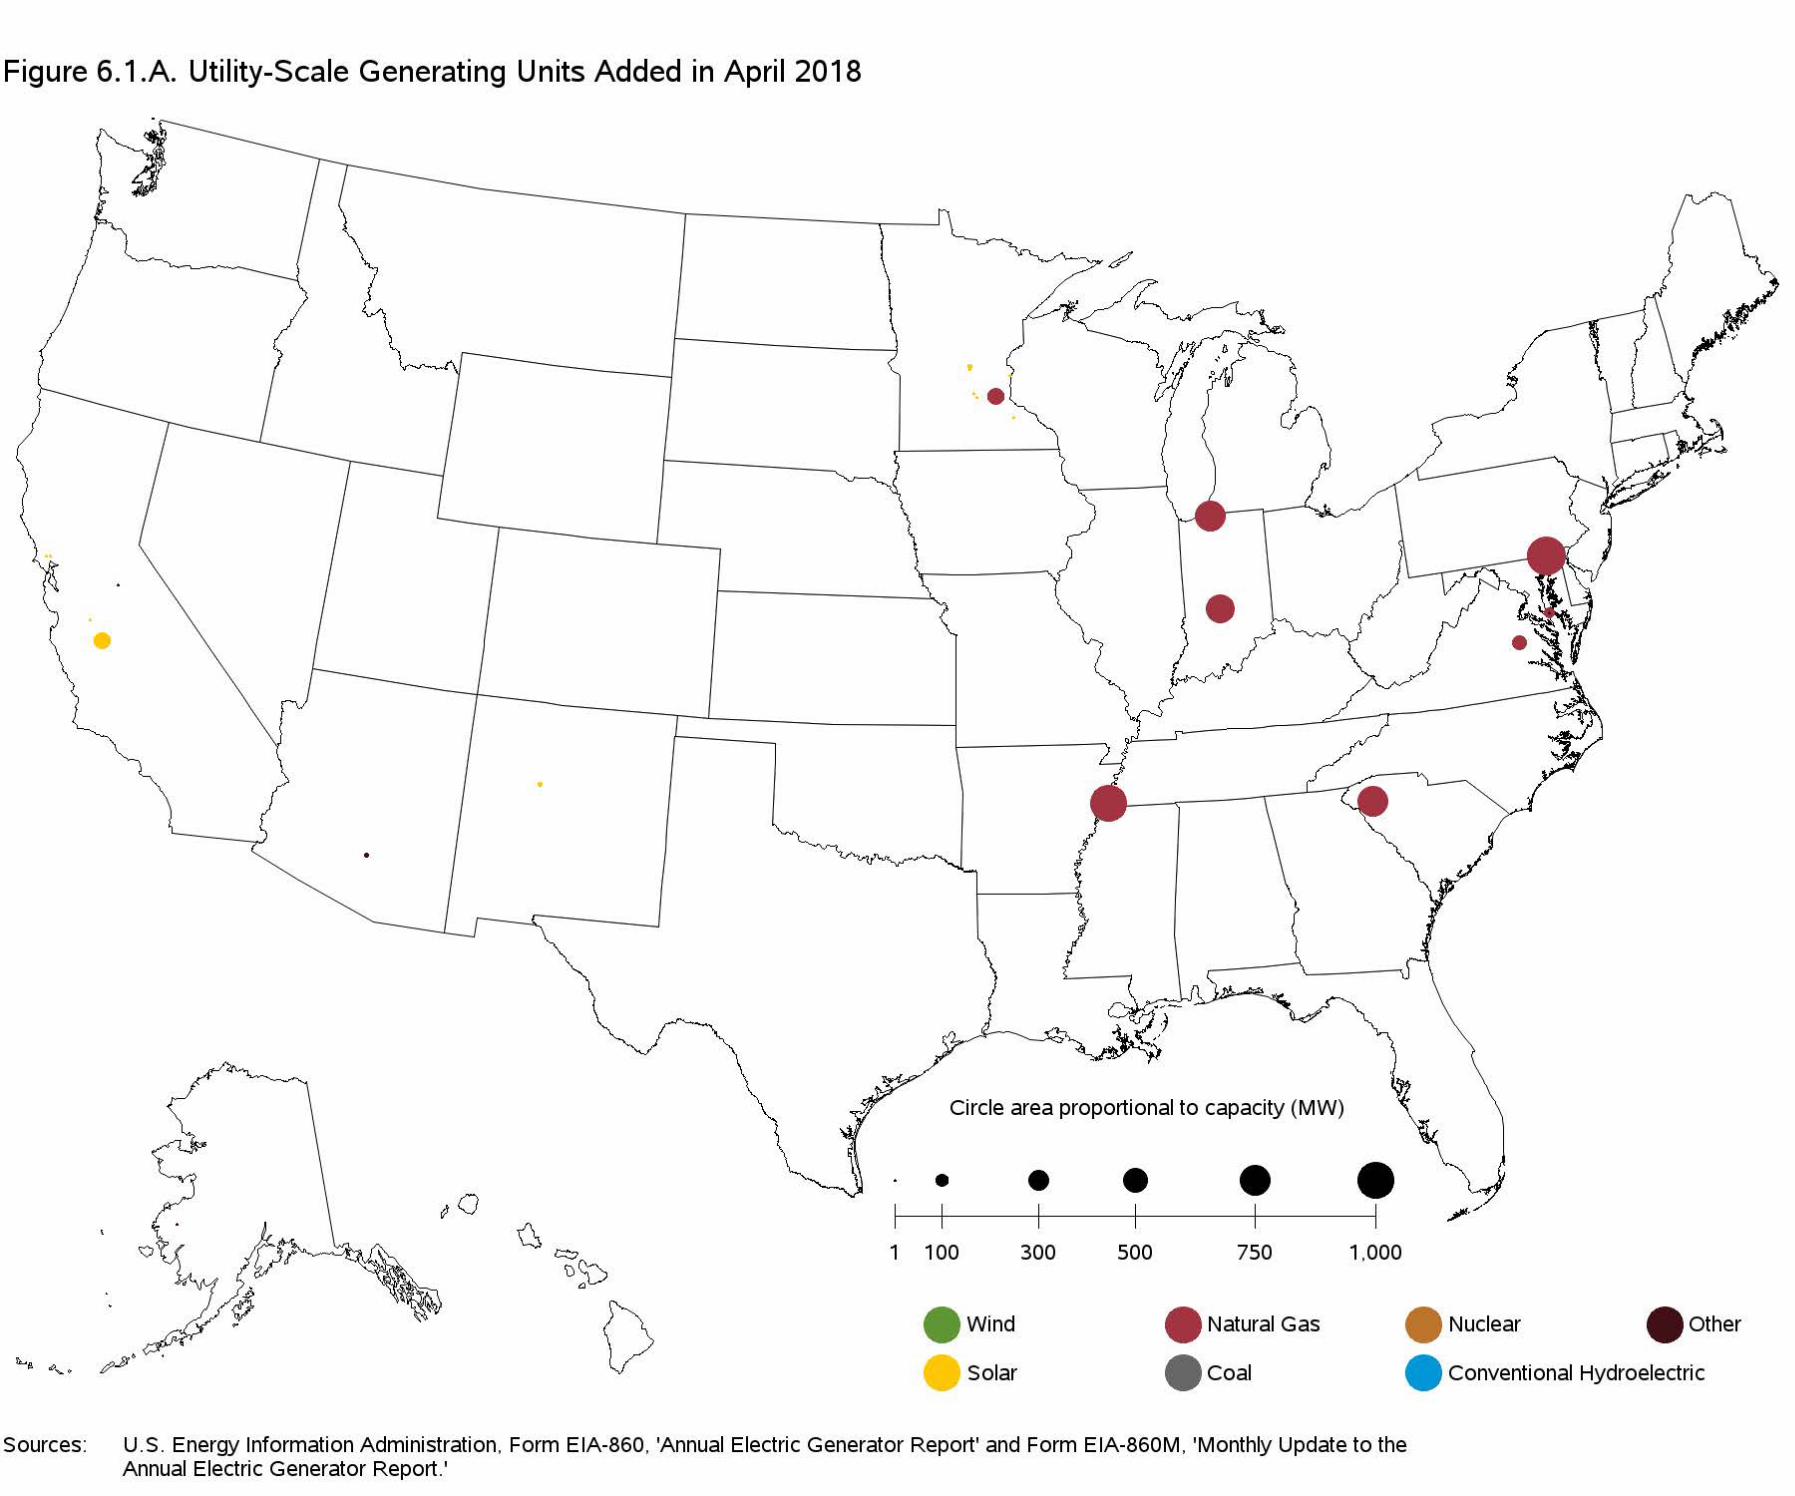
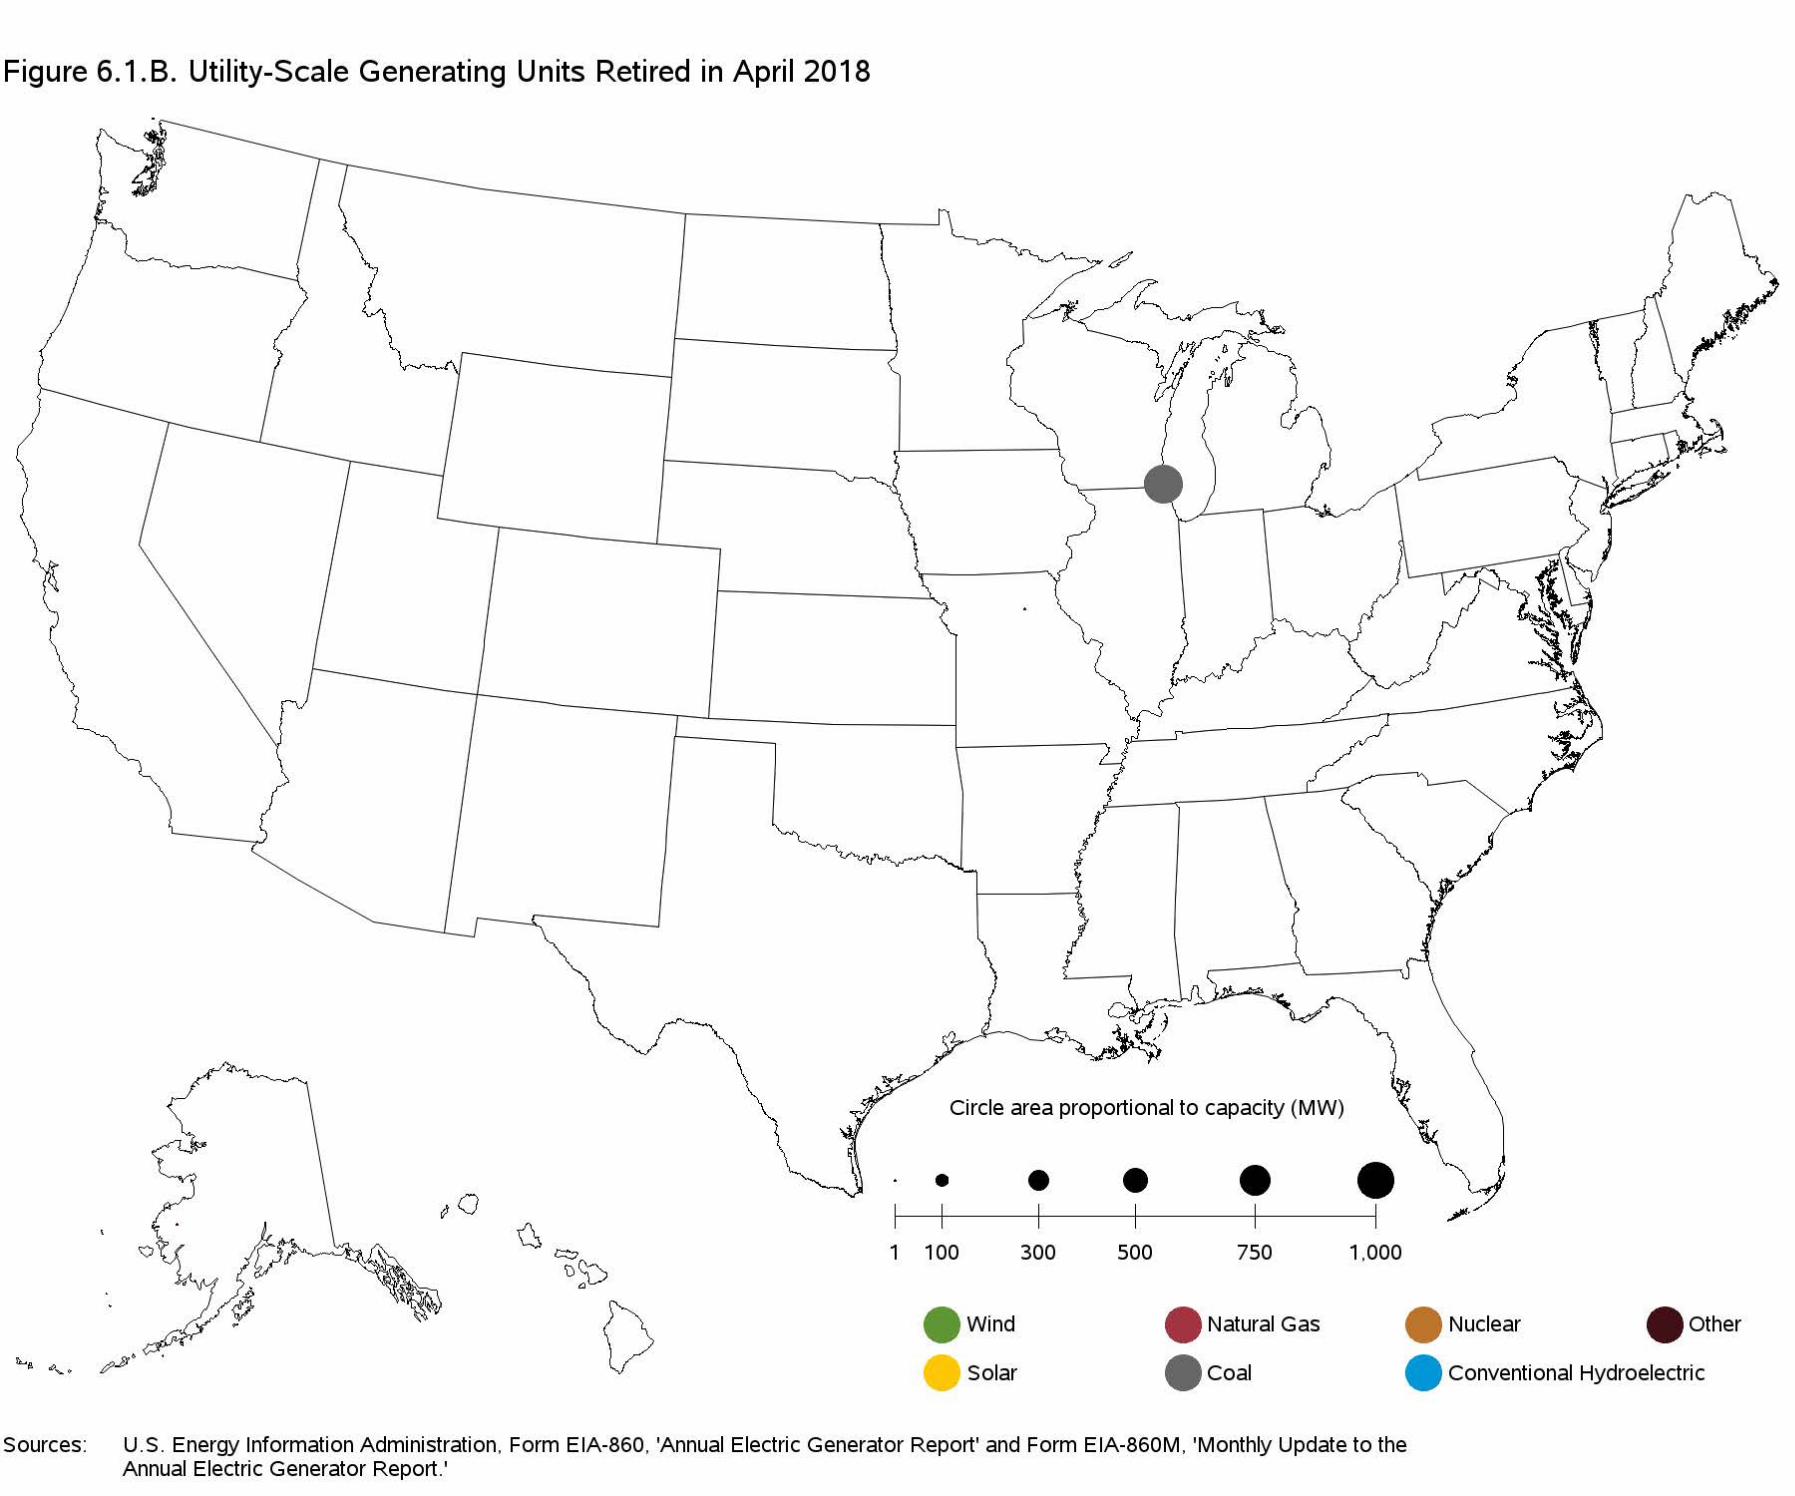
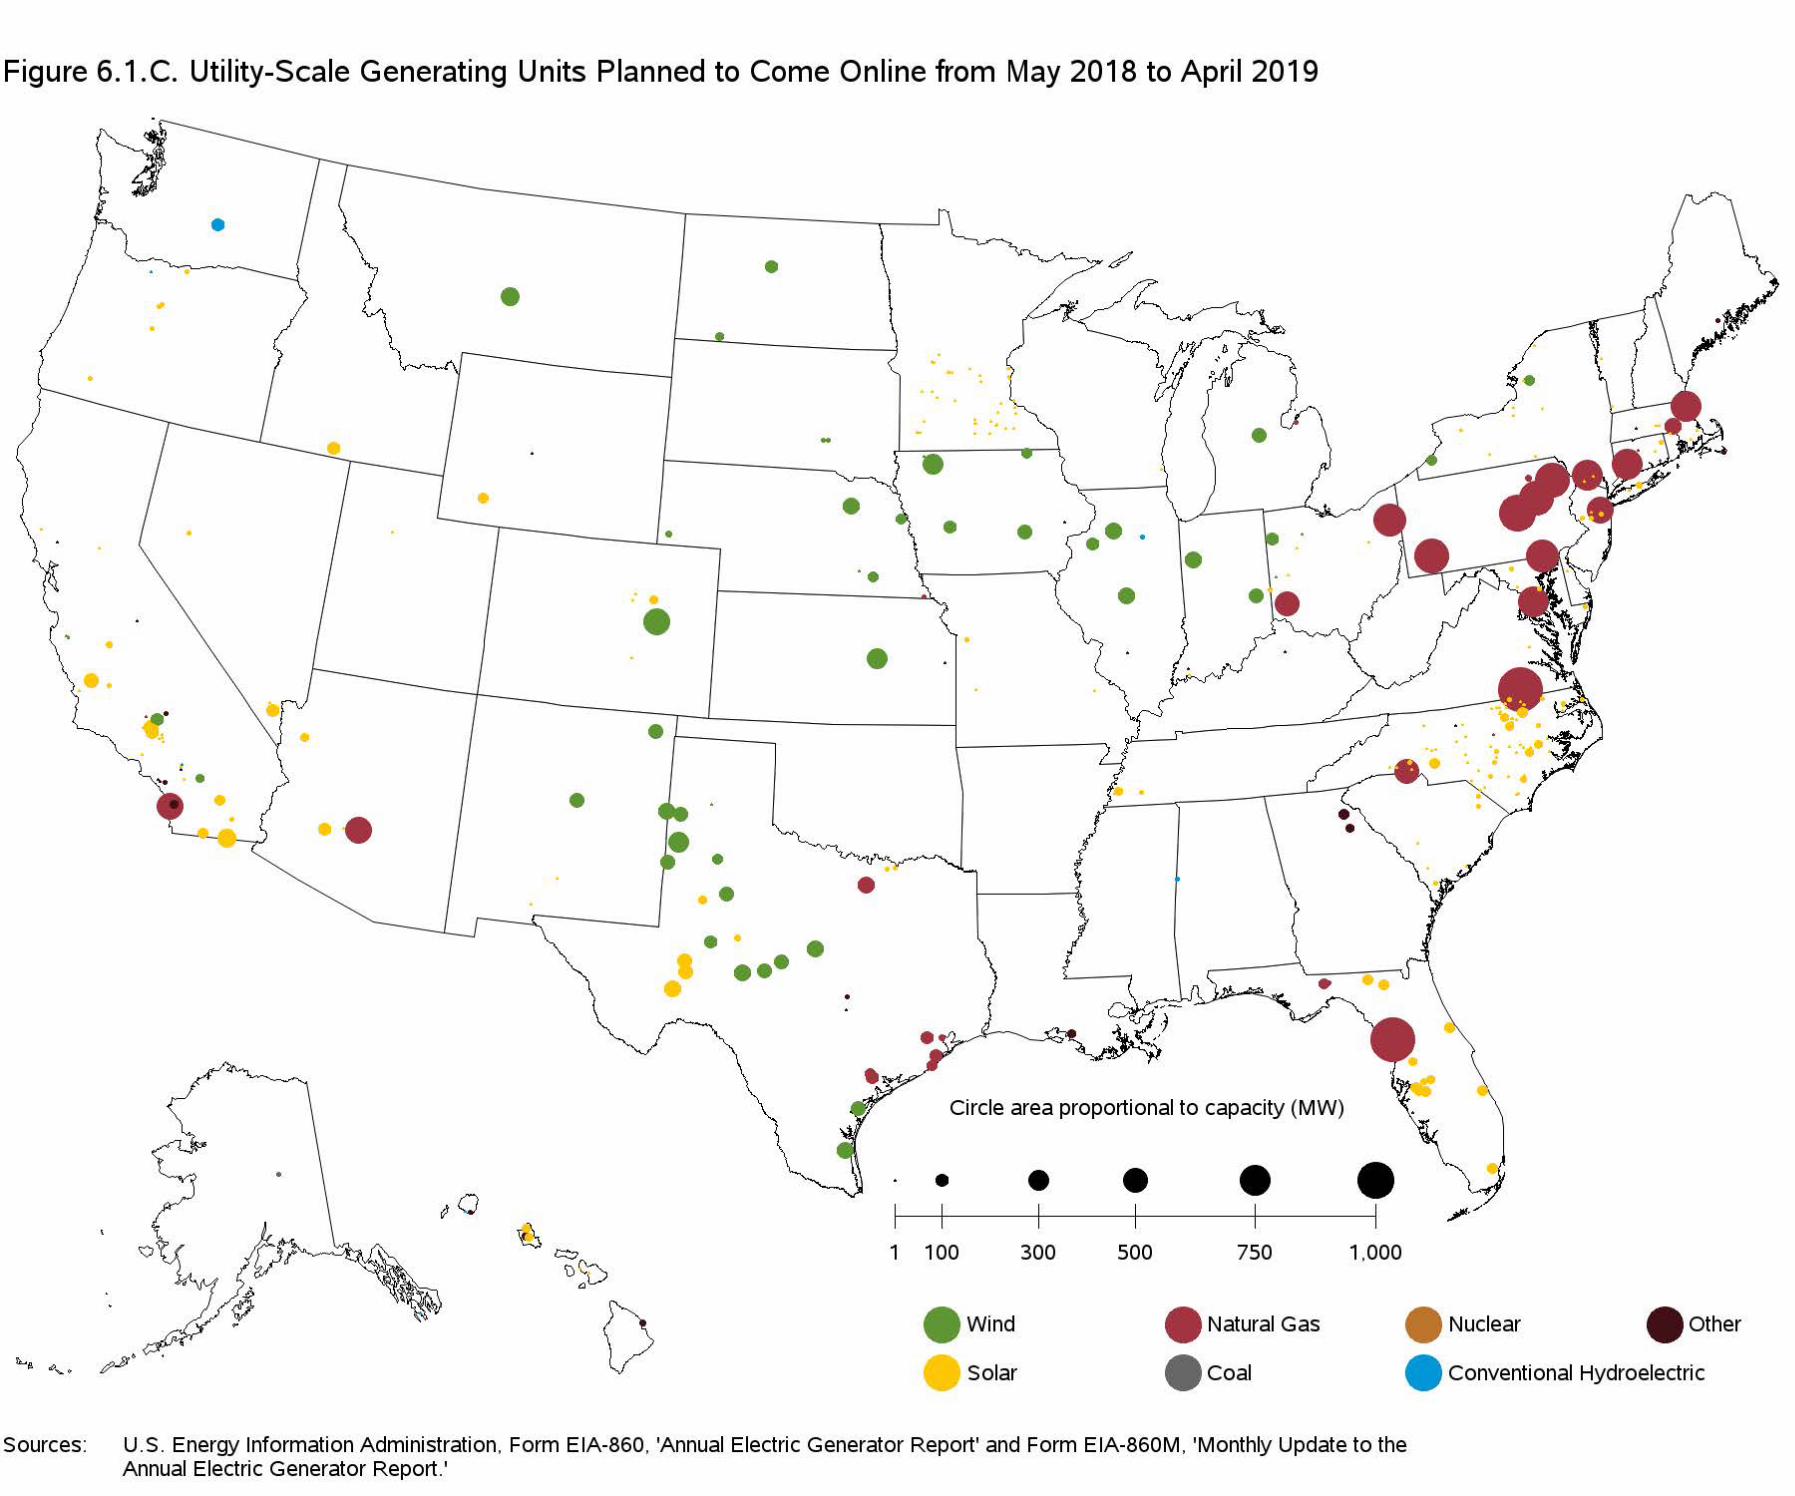
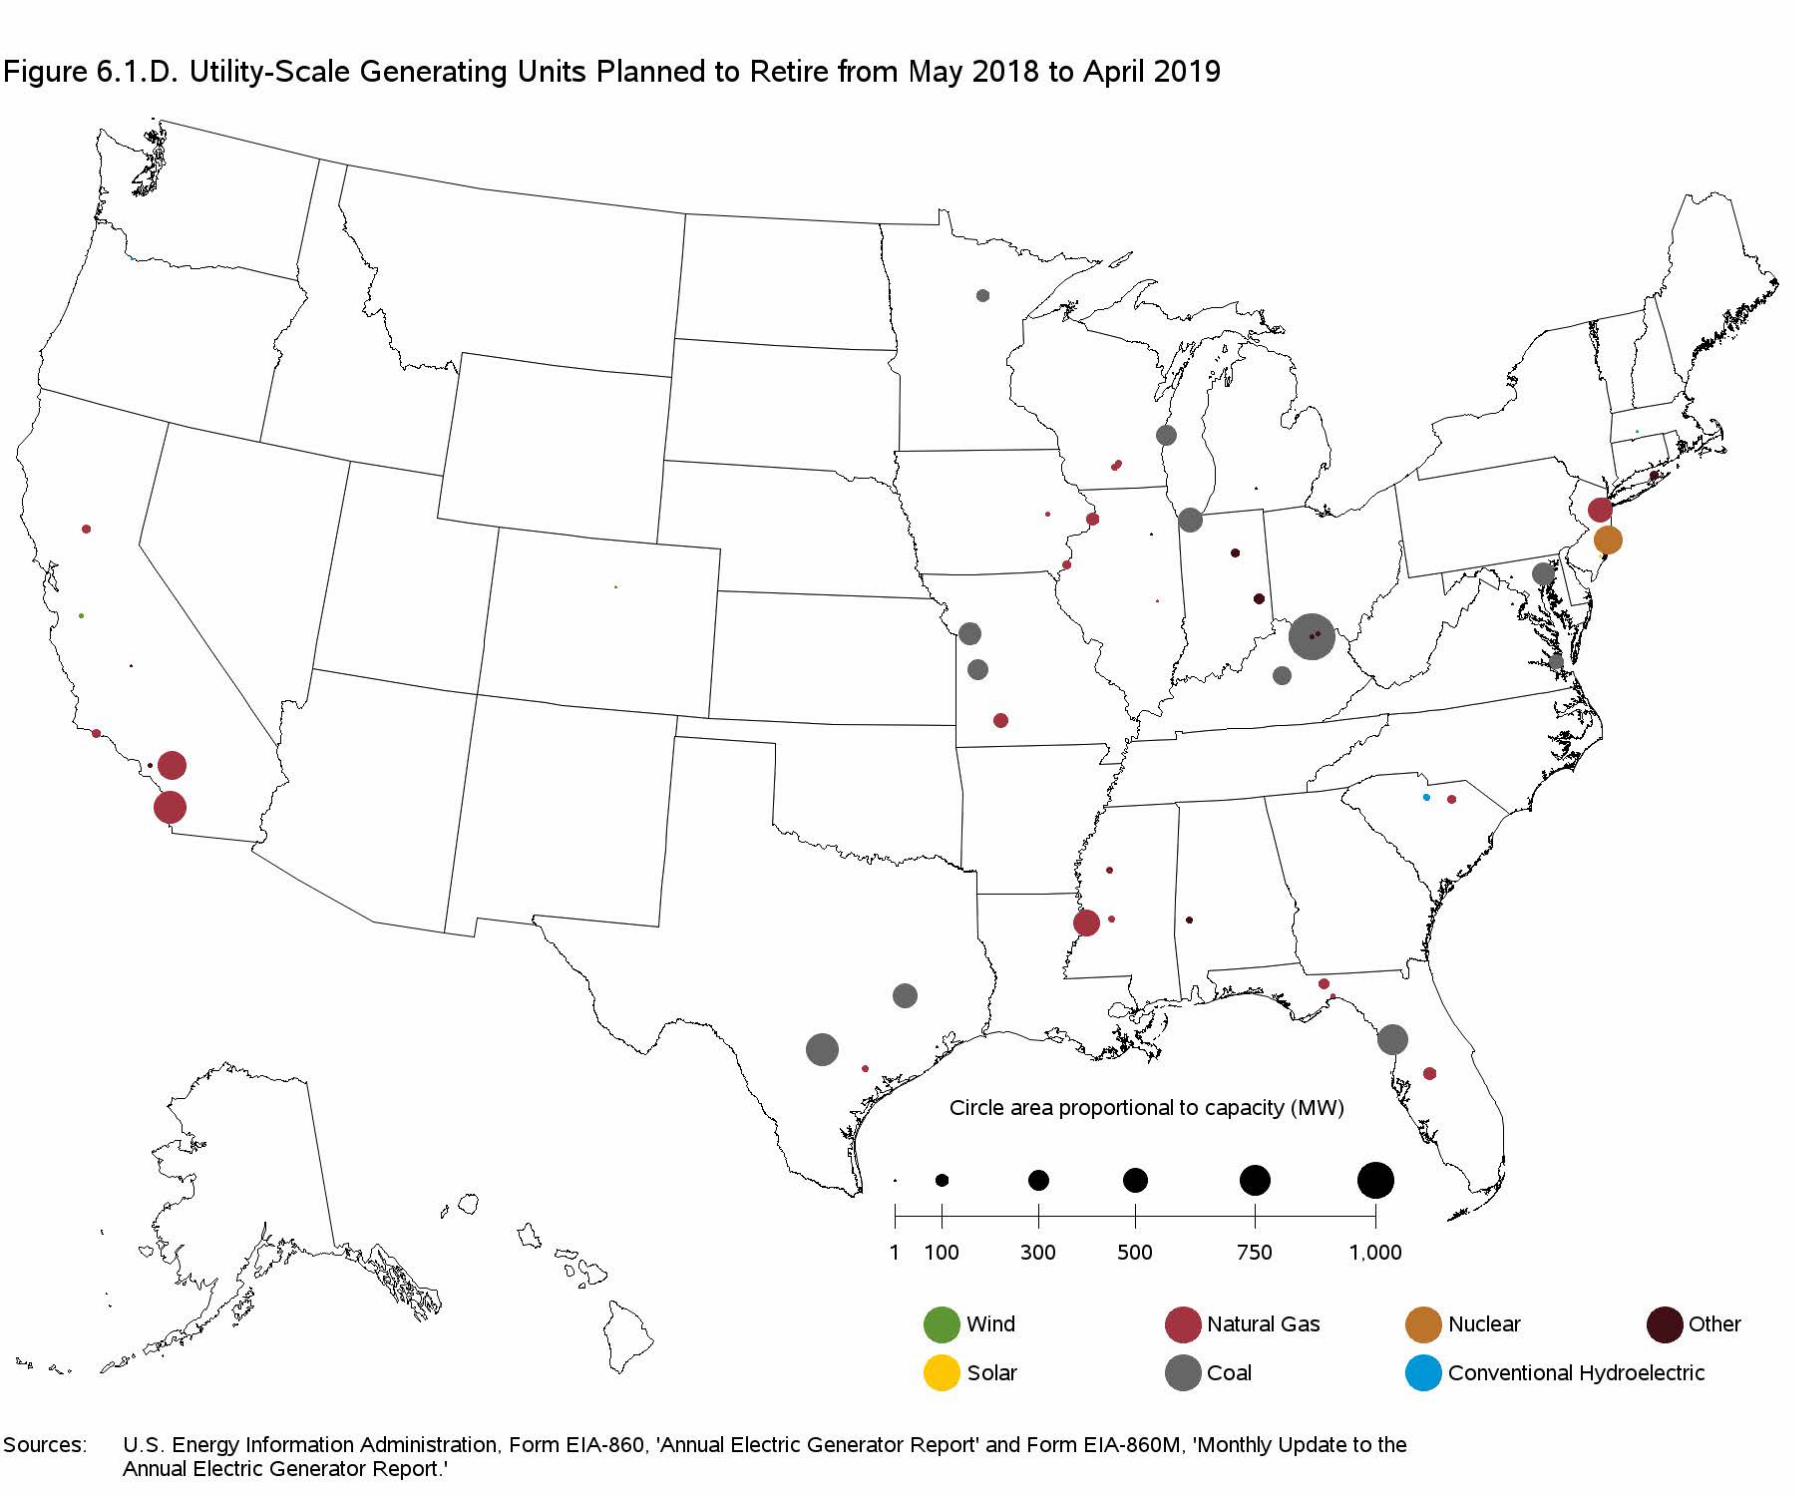
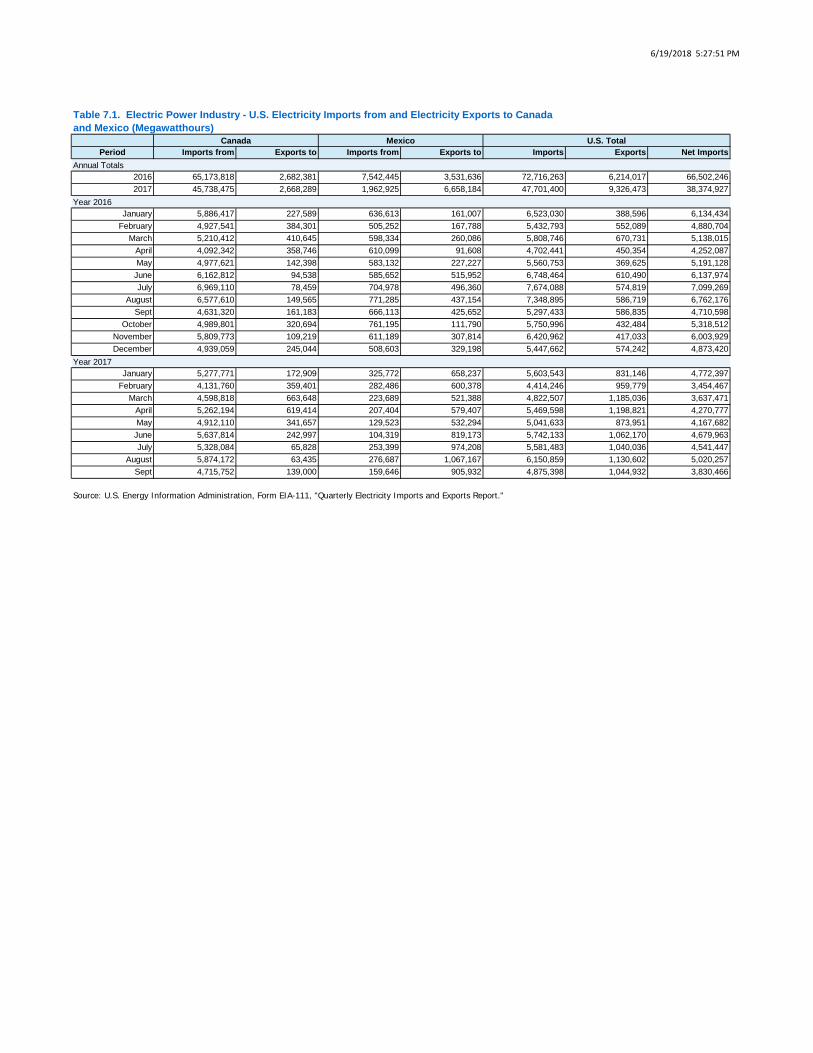
6/19/2018 5:27:51 PM
Period Imports from Exports to Imports from Exports to Imports Exports Net Imports
2016 65,173,818 2,682,381 7,542,445 3,531,636 72,716,263 6,214,017 66,502,2462017 45,738,475 2,668,289 1,962,925 6,658,184 47,701,400 9,326,473 38,374,927
January 5,886,417 227,589 636,613 161,007 6,523,030 388,596 6,134,434February 4,927,541 384,301 505,252 167,788 5,432,793 552,089 4,880,704
March 5,210,412 410,645 598,334 260,086 5,808,746 670,731 5,138,015April 4,092,342 358,746 610,099 91,608 4,702,441 450,354 4,252,087May 4,977,621 142,398 583,132 227,227 5,560,753 369,625 5,191,128
June 6,162,812 94,538 585,652 515,952 6,748,464 610,490 6,137,974July 6,969,110 78,459 704,978 496,360 7,674,088 574,819 7,099,269
August 6,577,610 149,565 771,285 437,154 7,348,895 586,719 6,762,176Sept 4,631,320 161,183 666,113 425,652 5,297,433 586,835 4,710,598
October 4,989,801 320,694 761,195 111,790 5,750,996 432,484 5,318,512November 5,809,773 109,219 611,189 307,814 6,420,962 417,033 6,003,929December 4,939,059 245,044 508,603 329,198 5,447,662 574,242 4,873,420
January 5,277,771 172,909 325,772 658,237 5,603,543 831,146 4,772,397February 4,131,760 359,401 282,486 600,378 4,414,246 959,779 3,454,467
March 4,598,818 663,648 223,689 521,388 4,822,507 1,185,036 3,637,471April 5,262,194 619,414 207,404 579,407 5,469,598 1,198,821 4,270,777May 4,912,110 341,657 129,523 532,294 5,041,633 873,951 4,167,682
June 5,637,814 242,997 104,319 819,173 5,742,133 1,062,170 4,679,963July 5,328,084 65,828 253,399 974,208 5,581,483 1,040,036 4,541,447
August 5,874,172 63,435 276,687 1,067,167 6,150,859 1,130,602 5,020,257Sept 4,715,752 139,000 159,646 905,932 4,875,398 1,044,932 3,830,466
Year 2016
Year 2017
Source: U.S. Energy Information Administration, Form EIA-111, "Quarterly Electricity Imports and Exports Report."
Table 7.1. Electric Power Industry - U.S. Electricity Imports from and Electricity Exports to Canadaand Mexico (Megawatthours)
Canada Mexico U.S. Total
Annual Totals
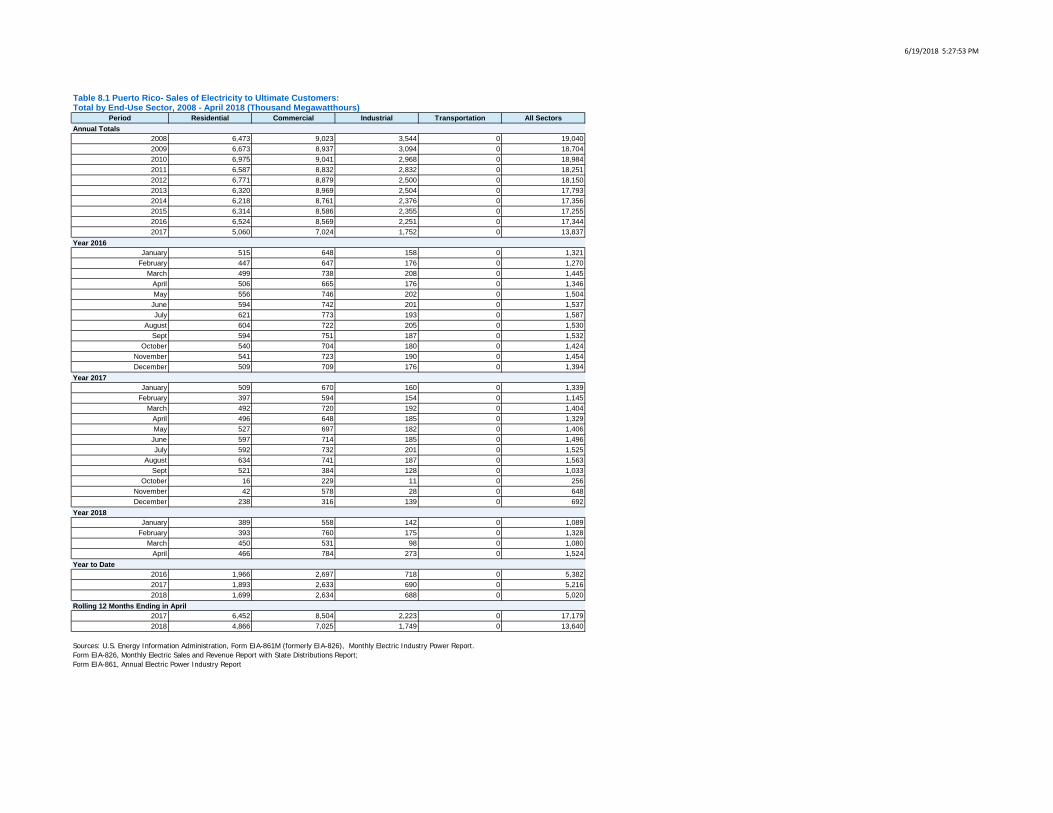
6/19/2018 5:27:53 PM
Period Residential Commercial Industrial Transportation All Sectors
2008 6,473 9,023 3,544 0 19,0402009 6,673 8,937 3,094 0 18,7042010 6,975 9,041 2,968 0 18,9842011 6,587 8,832 2,832 0 18,2512012 6,771 8,879 2,500 0 18,1502013 6,320 8,969 2,504 0 17,7932014 6,218 8,761 2,376 0 17,3562015 6,314 8,586 2,355 0 17,2552016 6,524 8,569 2,251 0 17,3442017 5,060 7,024 1,752 0 13,837
January 515 648 158 0 1,321February 447 647 176 0 1,270
March 499 738 208 0 1,445April 506 665 176 0 1,346May 556 746 202 0 1,504
June 594 742 201 0 1,537July 621 773 193 0 1,587
August 604 722 205 0 1,530Sept 594 751 187 0 1,532
October 540 704 180 0 1,424November 541 723 190 0 1,454December 509 709 176 0 1,394
January 509 670 160 0 1,339February 397 594 154 0 1,145
March 492 720 192 0 1,404April 496 648 185 0 1,329May 527 697 182 0 1,406
June 597 714 185 0 1,496July 592 732 201 0 1,525
August 634 741 187 0 1,563Sept 521 384 128 0 1,033
October 16 229 11 0 256November 42 578 28 0 648December 238 316 139 0 692
January 389 558 142 0 1,089February 393 760 175 0 1,328
March 450 531 98 0 1,080April 466 784 273 0 1,524
2016 1,966 2,697 718 0 5,3822017 1,893 2,633 690 0 5,2162018 1,699 2,634 688 0 5,020
2017 6,452 8,504 2,223 0 17,1792018 4,866 7,025 1,749 0 13,640
Year to Date
Rolling 12 Months Ending in April
Sources: U.S. Energy Information Administration, Form EIA-861M (formerly EIA-826), Monthly Electric Industry Power Report.Form EIA-826, Monthly Electric Sales and Revenue Report with State Distributions Report; Form EIA-861, Annual Electric Power Industry Report
Table 8.1 Puerto Rico- Sales of Electricity to Ultimate Customers:Total by End-Use Sector, 2008 - April 2018 (Thousand Megawatthours)
Annual Totals
Year 2016
Year 2017
Year 2018
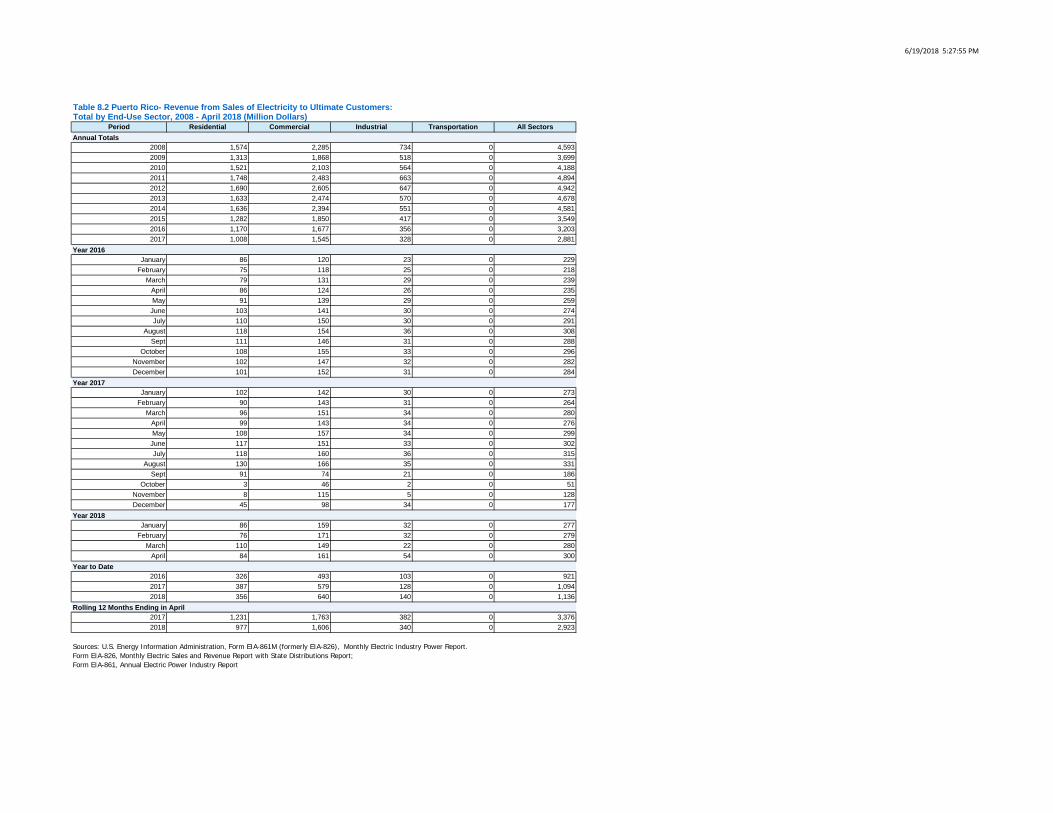
6/19/2018 5:27:55 PM
Period Residential Commercial Industrial Transportation All Sectors
2008 1,574 2,285 734 0 4,5932009 1,313 1,868 518 0 3,6992010 1,521 2,103 564 0 4,1882011 1,748 2,483 663 0 4,8942012 1,690 2,605 647 0 4,9422013 1,633 2,474 570 0 4,6782014 1,636 2,394 551 0 4,5812015 1,282 1,850 417 0 3,5492016 1,170 1,677 356 0 3,2032017 1,008 1,545 328 0 2,881
January 86 120 23 0 229February 75 118 25 0 218
March 79 131 29 0 239April 86 124 26 0 235May 91 139 29 0 259June 103 141 30 0 274July 110 150 30 0 291
August 118 154 36 0 308Sept 111 146 31 0 288
October 108 155 33 0 296November 102 147 32 0 282December 101 152 31 0 284
January 102 142 30 0 273February 90 143 31 0 264
March 96 151 34 0 280April 99 143 34 0 276May 108 157 34 0 299June 117 151 33 0 302July 118 160 36 0 315
August 130 166 35 0 331Sept 91 74 21 0 186
October 3 46 2 0 51November 8 115 5 0 128December 45 98 34 0 177
January 86 159 32 0 277February 76 171 32 0 279
March 110 149 22 0 280April 84 161 54 0 300
2016 326 493 103 0 9212017 387 579 128 0 1,0942018 356 640 140 0 1,136
2017 1,231 1,763 382 0 3,3762018 977 1,606 340 0 2,923
Year to Date
Rolling 12 Months Ending in April
Sources: U.S. Energy Information Administration, Form EIA-861M (formerly EIA-826), Monthly Electric Industry Power Report.Form EIA-826, Monthly Electric Sales and Revenue Report with State Distributions Report; Form EIA-861, Annual Electric Power Industry Report
Table 8.2 Puerto Rico- Revenue from Sales of Electricity to Ultimate Customers:Total by End-Use Sector, 2008 - April 2018 (Million Dollars)
Annual Totals
Year 2016
Year 2017
Year 2018
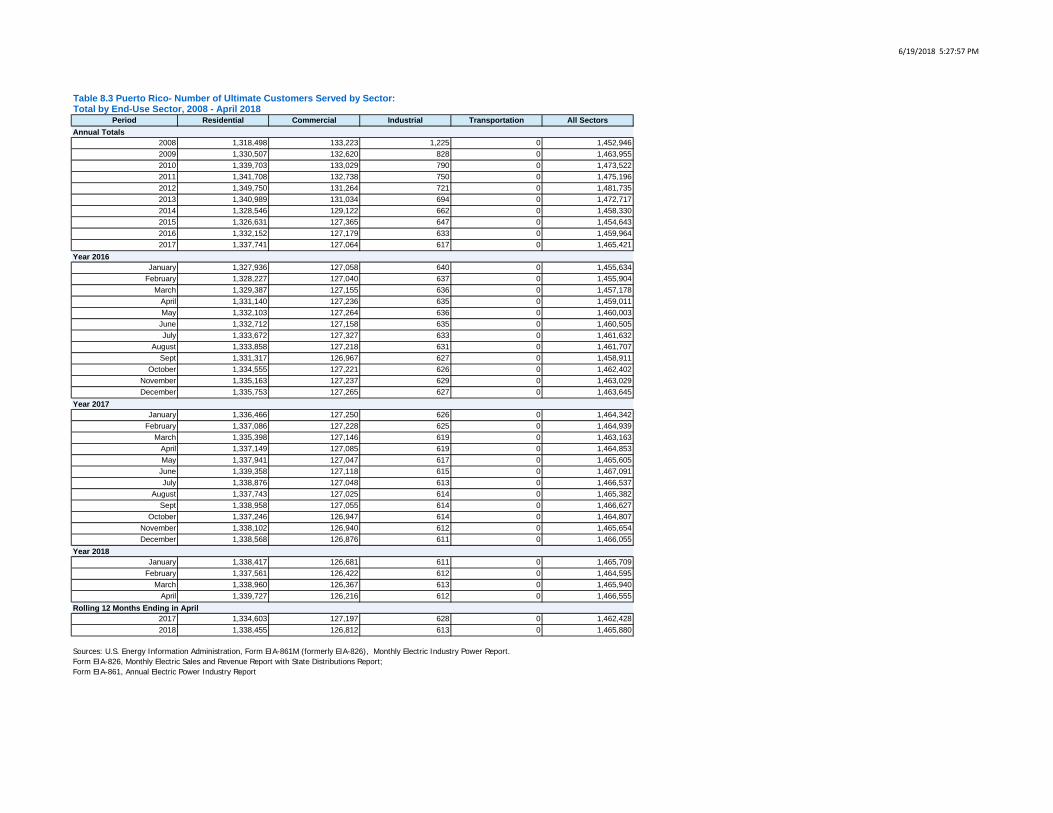
6/19/2018 5:27:57 PM
Period Residential Commercial Industrial Transportation All Sectors
2008 1,318,498 133,223 1,225 0 1,452,9462009 1,330,507 132,620 828 0 1,463,9552010 1,339,703 133,029 790 0 1,473,5222011 1,341,708 132,738 750 0 1,475,1962012 1,349,750 131,264 721 0 1,481,7352013 1,340,989 131,034 694 0 1,472,7172014 1,328,546 129,122 662 0 1,458,3302015 1,326,631 127,365 647 0 1,454,6432016 1,332,152 127,179 633 0 1,459,9642017 1,337,741 127,064 617 0 1,465,421
January 1,327,936 127,058 640 0 1,455,634February 1,328,227 127,040 637 0 1,455,904
March 1,329,387 127,155 636 0 1,457,178April 1,331,140 127,236 635 0 1,459,011May 1,332,103 127,264 636 0 1,460,003
June 1,332,712 127,158 635 0 1,460,505July 1,333,672 127,327 633 0 1,461,632
August 1,333,858 127,218 631 0 1,461,707Sept 1,331,317 126,967 627 0 1,458,911
October 1,334,555 127,221 626 0 1,462,402November 1,335,163 127,237 629 0 1,463,029December 1,335,753 127,265 627 0 1,463,645
January 1,336,466 127,250 626 0 1,464,342February 1,337,086 127,228 625 0 1,464,939
March 1,335,398 127,146 619 0 1,463,163April 1,337,149 127,085 619 0 1,464,853May 1,337,941 127,047 617 0 1,465,605
June 1,339,358 127,118 615 0 1,467,091July 1,338,876 127,048 613 0 1,466,537
August 1,337,743 127,025 614 0 1,465,382Sept 1,338,958 127,055 614 0 1,466,627
October 1,337,246 126,947 614 0 1,464,807November 1,338,102 126,940 612 0 1,465,654December 1,338,568 126,876 611 0 1,466,055
January 1,338,417 126,681 611 0 1,465,709February 1,337,561 126,422 612 0 1,464,595
March 1,338,960 126,367 613 0 1,465,940April 1,339,727 126,216 612 0 1,466,555
2017 1,334,603 127,197 628 0 1,462,4282018 1,338,455 126,812 613 0 1,465,880
Rolling 12 Months Ending in April
Sources: U.S. Energy Information Administration, Form EIA-861M (formerly EIA-826), Monthly Electric Industry Power Report.Form EIA-826, Monthly Electric Sales and Revenue Report with State Distributions Report; Form EIA-861, Annual Electric Power Industry Report
Table 8.3 Puerto Rico- Number of Ultimate Customers Served by Sector:Total by End-Use Sector, 2008 - April 2018
Annual Totals
Year 2016
Year 2017
Year 2018
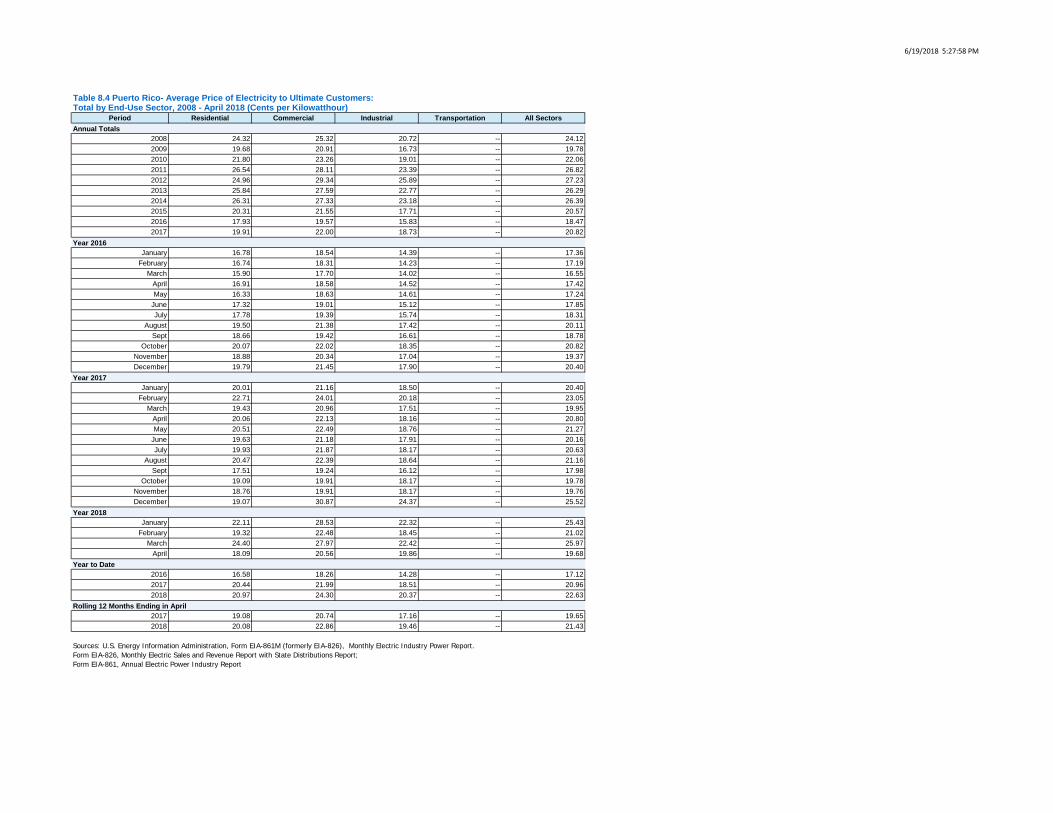
6/19/2018 5:27:58 PM
Period Residential Commercial Industrial Transportation All Sectors
2008 24.32 25.32 20.72 -- 24.122009 19.68 20.91 16.73 -- 19.782010 21.80 23.26 19.01 -- 22.062011 26.54 28.11 23.39 -- 26.822012 24.96 29.34 25.89 -- 27.232013 25.84 27.59 22.77 -- 26.292014 26.31 27.33 23.18 -- 26.392015 20.31 21.55 17.71 -- 20.572016 17.93 19.57 15.83 -- 18.472017 19.91 22.00 18.73 -- 20.82
January 16.78 18.54 14.39 -- 17.36February 16.74 18.31 14.23 -- 17.19
March 15.90 17.70 14.02 -- 16.55April 16.91 18.58 14.52 -- 17.42May 16.33 18.63 14.61 -- 17.24
June 17.32 19.01 15.12 -- 17.85July 17.78 19.39 15.74 -- 18.31
August 19.50 21.38 17.42 -- 20.11Sept 18.66 19.42 16.61 -- 18.78
October 20.07 22.02 18.35 -- 20.82November 18.88 20.34 17.04 -- 19.37December 19.79 21.45 17.90 -- 20.40
January 20.01 21.16 18.50 -- 20.40February 22.71 24.01 20.18 -- 23.05
March 19.43 20.96 17.51 -- 19.95April 20.06 22.13 18.16 -- 20.80May 20.51 22.49 18.76 -- 21.27
June 19.63 21.18 17.91 -- 20.16July 19.93 21.87 18.17 -- 20.63
August 20.47 22.39 18.64 -- 21.16Sept 17.51 19.24 16.12 -- 17.98
October 19.09 19.91 18.17 -- 19.78November 18.76 19.91 18.17 -- 19.76December 19.07 30.87 24.37 -- 25.52
January 22.11 28.53 22.32 -- 25.43February 19.32 22.48 18.45 -- 21.02
March 24.40 27.97 22.42 -- 25.97April 18.09 20.56 19.86 -- 19.68
2016 16.58 18.26 14.28 -- 17.122017 20.44 21.99 18.51 -- 20.962018 20.97 24.30 20.37 -- 22.63
2017 19.08 20.74 17.16 -- 19.652018 20.08 22.86 19.46 -- 21.43
Year to Date
Rolling 12 Months Ending in April
Sources: U.S. Energy Information Administration, Form EIA-861M (formerly EIA-826), Monthly Electric Industry Power Report.Form EIA-826, Monthly Electric Sales and Revenue Report with State Distributions Report; Form EIA-861, Annual Electric Power Industry Report
Table 8.4 Puerto Rico- Average Price of Electricity to Ultimate Customers:Total by End-Use Sector, 2008 - April 2018 (Cents per Kilowatthour)
Annual Totals
Year 2016
Year 2017
Year 2018
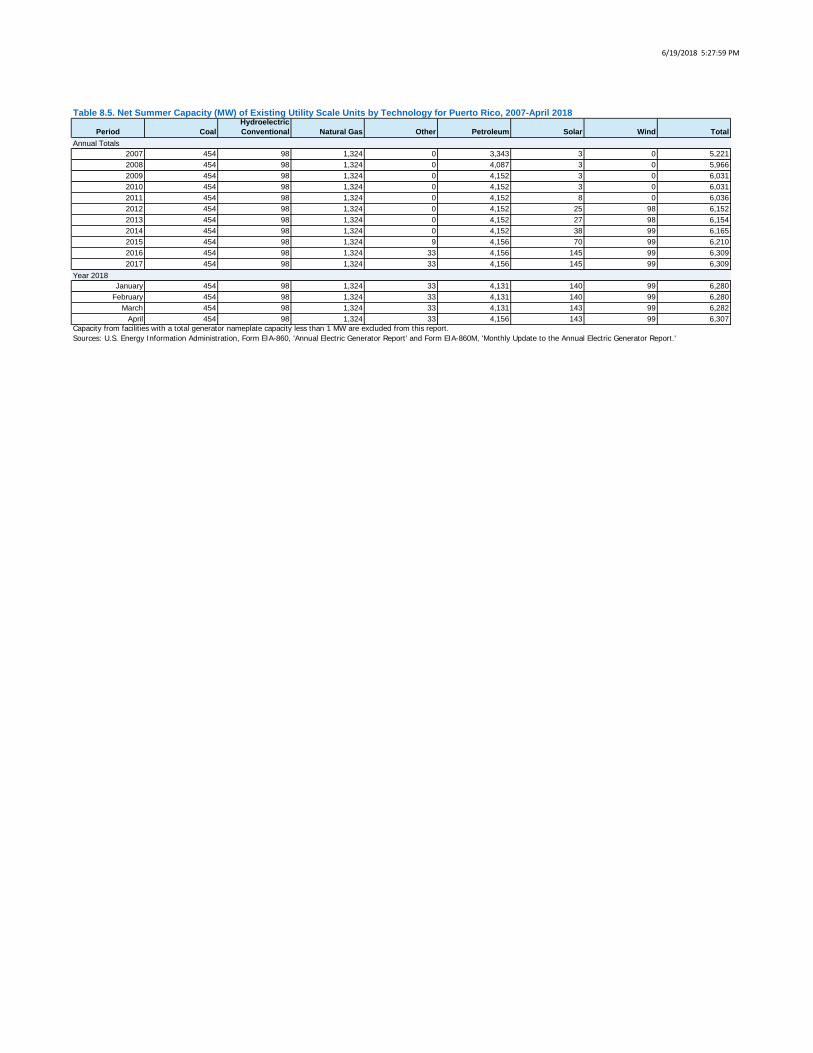
6/19/2018 5:27:59 PM
Period CoalHydroelectricConventional Natural Gas Other Petroleum Solar Wind Total
2007 454 98 1,324 0 3,343 3 0 5,2212008 454 98 1,324 0 4,087 3 0 5,9662009 454 98 1,324 0 4,152 3 0 6,0312010 454 98 1,324 0 4,152 3 0 6,0312011 454 98 1,324 0 4,152 8 0 6,0362012 454 98 1,324 0 4,152 25 98 6,1522013 454 98 1,324 0 4,152 27 98 6,1542014 454 98 1,324 0 4,152 38 99 6,1652015 454 98 1,324 9 4,156 70 99 6,2102016 454 98 1,324 33 4,156 145 99 6,3092017 454 98 1,324 33 4,156 145 99 6,309
January 454 98 1,324 33 4,131 140 99 6,280February 454 98 1,324 33 4,131 140 99 6,280
March 454 98 1,324 33 4,131 143 99 6,282April 454 98 1,324 33 4,156 143 99 6,307
Table 8.5. Net Summer Capacity (MW) of Existing Utility Scale Units by Technology for Puerto Rico, 2007-April 2018
Annual Totals
Year 2018
Capacity from facilities with a total generator nameplate capacity less than 1 MW are excluded from this report.Sources: U.S. Energy Information Administration, Form EIA-860, 'Annual Electric Generator Report' and Form EIA-860M, 'Monthly Update to the Annual Electric Generator Report.'

6/19/2018 5:28:01 PM
Census Region and State CoalPetroleum
LiquidsPetroleum
Coke Natural Gas Other Gases NuclearHydroelectric Conventional
New England 1 6 0 3 0 0 11Connecticut 0 27 0 2 0 0 41
Maine 28 23 0 21 0 0 13Massachusetts 0 4 0 6 0 0 26
New Hampshire 0 12 0 0 0 0 24Rhode Island 0 60 0 13 0 0 0
Vermont 0 37 0 0 0 0 21Middle Atlantic 3 6 134 1 31 0 3
New Jersey 0 12 0 3 0 0 61New York 0 7 0 3 0 0 2
Pennsylvania 3 10 134 1 50 0 15East North Central 1 4 0 2 10 0 12
Illinois 0 5 0 7 0 0 41Indiana 1 3 0 3 18 0 33
Michigan 4 7 0 2 0 0 23Ohio 1 2 0 1 30 0 31
Wisconsin 1 31 0 9 0 0 17West North Central 1 10 0 8 0 0 9
Iowa 1 14 0 8 0 0 31Kansas 3 7 0 27 0 0 0
Minnesota 5 48 0 12 0 0 27Missouri 0 4 0 12 0 0 19
Nebraska 5 97 0 76 0 0 23North Dakota 0 10 0 49 0 0 20South Dakota 0 66 0 57 0 0 13
South Atlantic 1 4 14 1 0 0 8Delaware 0 108 0 8 0 0 0
District of Columbia 0 278 0 89 0 0 0Florida 0 7 0 1 0 0 52
Georgia 1 22 65 5 0 0 14Maryland 0 7 0 4 0 0 2
North Carolina 4 12 0 4 0 0 13South Carolina 0 10 0 7 0 0 17
Virginia 5 8 0 5 0 0 18West Virginia 1 0 0 16 0 0 19
East South Central 0 11 0 1 63 0 6Alabama 0 86 0 2 97 0 8Kentucky 0 1 0 4 0 0 13
Mississippi 0 8 0 2 0 0 0Tennessee 0 0 0 5 0 0 9
West South Central 0 3 1 2 5 0 9Arkansas 0 6 0 5 0 0 12Louisiana 0 5 0 2 12 0 21Oklahoma 0 1 0 4 0 0 14
Texas 0 6 41 2 4 0 19Mountain 2 7 0 1 0 0 5
Arizona 0 3 0 1 0 0 5Colorado 0 37 0 2 0 0 19
Idaho 104 0 0 37 0 0 10Montana 8 52 0 54 0 0 9Nevada 0 0 0 0 0 0 2
New Mexico 0 75 0 3 0 0 75Utah 0 1 0 4 0 0 32
Wyoming 5 1 0 16 0 0 28Pacific Contiguous 0 22 0 2 2 0 2
California 0 24 0 1 3 0 5Oregon 0 0 0 4 0 0 4
Washington 0 53 0 11 0 0 1Pacific Noncontiguous 19 1 0 31 0 0 21
Alaska 68 4 0 31 0 0 22Hawaii 0 1 0 0 0 0 27
U.S. Total 0 1 3 1 5 0 2
Table A.1.A. Relative Standard Error (Percent) for Net Generation by Fuel Type:Total (All Sectors) by Census Division and State, April 2018
Displayed values of zero may represent small values that round to zero. The Excel version of this table provides additional precision which may be accessed by selecting individual cells.

6/19/2018 5:28:02 PM
Census Region and State Wind Geothermal Biomass
Solar Thermal and
PhotovoltaicOther
Renewables
Hydroelectric Pumped Storage
Other Energy Sources
All Energy Sources
New England 0 0 0 7 7 0 1 2Connecticut 0 0 0 27 21 0 0 1
Maine 0 0 0 89 8 0 0 7Massachusetts 0 0 0 8 6 0 2 4
New Hampshire 0 0 0 0 27 0 0 3Rhode Island 0 0 0 48 8 0 0 12
Vermont 0 0 0 24 15 0 0 14Middle Atlantic 0 0 0 7 2 0 1 1
New Jersey 0 0 0 8 5 0 0 2New York 0 0 0 16 3 0 2 1
Pennsylvania 0 0 0 28 3 0 0 1East North Central 0 0 0 10 2 0 4 0
Illinois 0 0 0 24 2 0 0 1Indiana 0 0 0 14 3 0 0 1
Michigan 0 0 0 19 5 0 11 2Ohio 0 0 0 24 3 0 0 1
Wisconsin 0 0 0 46 6 0 45 2West North Central 0 0 0 7 2 0 6 1
Iowa 0 0 0 76 2 0 0 2Kansas 0 0 0 90 2 0 0 3
Minnesota 0 0 0 7 3 0 4 3Missouri 0 0 0 29 3 0 0 1
Nebraska 0 0 0 57 4 0 0 4North Dakota 0 0 0 0 3 0 49 2South Dakota 0 0 0 210 6 0 0 8
South Atlantic 0 0 0 2 2 0 1 1Delaware 0 0 0 34 26 0 0 8
District of Columbia 0 0 0 0 0 0 0 38Florida 0 0 0 2 3 0 1 1
Georgia 0 0 0 5 3 0 33 2Maryland 0 0 0 10 5 0 0 1
North Carolina 0 0 0 3 2 0 0 2South Carolina 0 0 0 11 6 0 0 1
Virginia 0 0 0 9 8 0 0 2West Virginia 0 0 0 0 5 0 0 1
East South Central 0 0 0 7 3 0 10 1Alabama 0 0 0 12 4 0 0 1Kentucky 0 0 0 35 14 0 0 1
Mississippi 0 0 0 3 3 0 0 2Tennessee 0 0 0 21 7 0 148 1
West South Central 0 0 0 3 1 0 3 1Arkansas 0 0 0 2 4 0 60 2Louisiana 0 0 0 200 5 0 3 2Oklahoma 0 0 0 37 2 0 0 2
Texas 0 0 0 3 1 0 6 1Mountain 0 14 0 2 2 0 0 1
Arizona 0 0 0 3 4 0 0 1Colorado 0 0 0 9 3 0 0 1
Idaho 0 62 0 11 4 0 0 7Montana 0 0 0 51 6 0 0 5Nevada 0 14 0 3 6 0 0 2
New Mexico 0 0 0 8 3 0 0 1Utah 0 27 0 6 6 0 0 2
Wyoming 0 0 0 0 4 0 0 4Pacific Contiguous 0 5 0 2 2 0 2 1
California 0 5 0 2 2 0 2 1Oregon 0 38 0 12 3 0 0 3
Washington 0 0 0 0 3 0 0 1Pacific Noncontiguous 0 36 0 16 9 0 0 6
Alaska 0 0 0 0 15 0 0 15Hawaii 0 36 0 16 10 0 0 2
U.S. Total 0 7 0 2 1 0 1 0
Table A.1.A. Relative Standard Error (Percent) for Net Generation by Fuel Type:
Total (All Sectors) by Census Division and State, April 2018 (Continued)
Displayed values of zero may represent small values that round to zero. The Excel version of this table provides additional precision which may be accessed by selecting individual cells.
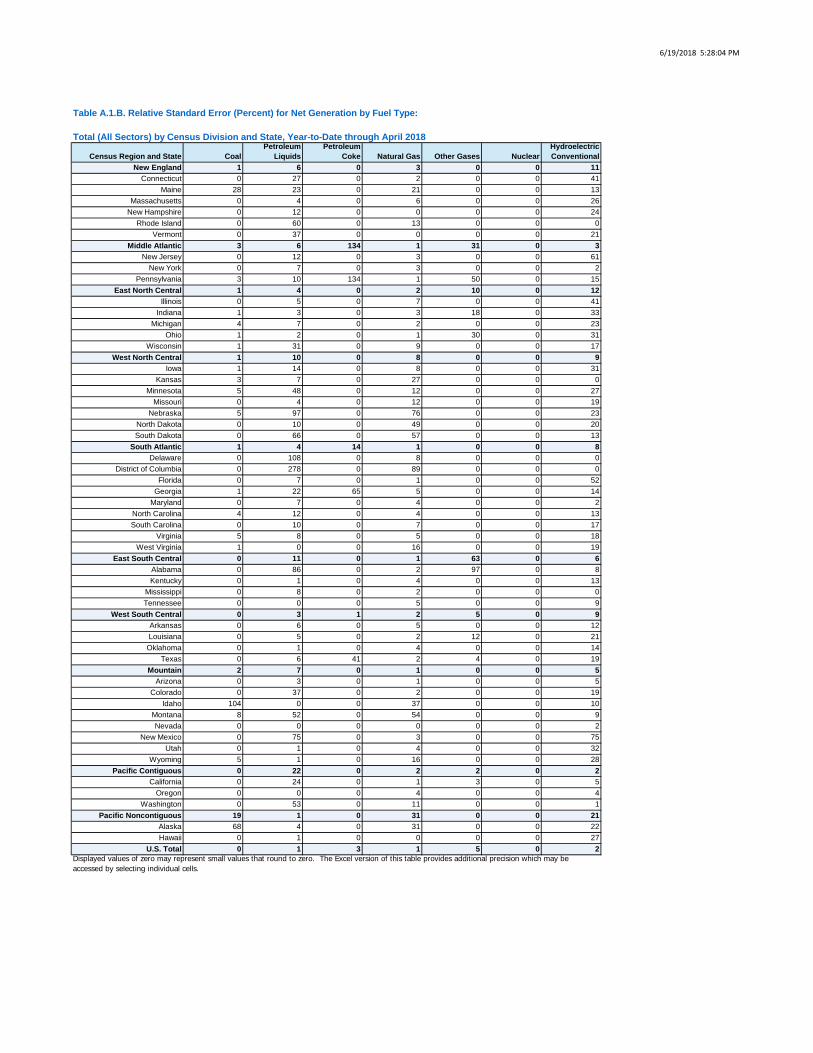
6/19/2018 5:28:04 PM
Census Region and State CoalPetroleum
LiquidsPetroleum
Coke Natural Gas Other Gases NuclearHydroelectric Conventional
New England 1 6 0 3 0 0 11Connecticut 0 27 0 2 0 0 41
Maine 28 23 0 21 0 0 13Massachusetts 0 4 0 6 0 0 26
New Hampshire 0 12 0 0 0 0 24Rhode Island 0 60 0 13 0 0 0
Vermont 0 37 0 0 0 0 21Middle Atlantic 3 6 134 1 31 0 3
New Jersey 0 12 0 3 0 0 61New York 0 7 0 3 0 0 2
Pennsylvania 3 10 134 1 50 0 15East North Central 1 4 0 2 10 0 12
Illinois 0 5 0 7 0 0 41Indiana 1 3 0 3 18 0 33
Michigan 4 7 0 2 0 0 23Ohio 1 2 0 1 30 0 31
Wisconsin 1 31 0 9 0 0 17West North Central 1 10 0 8 0 0 9
Iowa 1 14 0 8 0 0 31Kansas 3 7 0 27 0 0 0
Minnesota 5 48 0 12 0 0 27Missouri 0 4 0 12 0 0 19
Nebraska 5 97 0 76 0 0 23North Dakota 0 10 0 49 0 0 20South Dakota 0 66 0 57 0 0 13
South Atlantic 1 4 14 1 0 0 8Delaware 0 108 0 8 0 0 0
District of Columbia 0 278 0 89 0 0 0Florida 0 7 0 1 0 0 52
Georgia 1 22 65 5 0 0 14Maryland 0 7 0 4 0 0 2
North Carolina 4 12 0 4 0 0 13South Carolina 0 10 0 7 0 0 17
Virginia 5 8 0 5 0 0 18West Virginia 1 0 0 16 0 0 19
East South Central 0 11 0 1 63 0 6Alabama 0 86 0 2 97 0 8Kentucky 0 1 0 4 0 0 13
Mississippi 0 8 0 2 0 0 0Tennessee 0 0 0 5 0 0 9
West South Central 0 3 1 2 5 0 9Arkansas 0 6 0 5 0 0 12Louisiana 0 5 0 2 12 0 21Oklahoma 0 1 0 4 0 0 14
Texas 0 6 41 2 4 0 19Mountain 2 7 0 1 0 0 5
Arizona 0 3 0 1 0 0 5Colorado 0 37 0 2 0 0 19
Idaho 104 0 0 37 0 0 10Montana 8 52 0 54 0 0 9Nevada 0 0 0 0 0 0 2
New Mexico 0 75 0 3 0 0 75Utah 0 1 0 4 0 0 32
Wyoming 5 1 0 16 0 0 28Pacific Contiguous 0 22 0 2 2 0 2
California 0 24 0 1 3 0 5Oregon 0 0 0 4 0 0 4
Washington 0 53 0 11 0 0 1Pacific Noncontiguous 19 1 0 31 0 0 21
Alaska 68 4 0 31 0 0 22Hawaii 0 1 0 0 0 0 27
U.S. Total 0 1 3 1 5 0 2
Table A.1.B. Relative Standard Error (Percent) for Net Generation by Fuel Type:
Total (All Sectors) by Census Division and State, Year-to-Date through April 2018
Displayed values of zero may represent small values that round to zero. The Excel version of this table provides additional precision which may be accessed by selecting individual cells.

6/19/2018 5:28:05 PM
Census Region and State Wind Geothermal Biomass
Solar Thermal and
PhotovoltaicOther
Renewables
Hydroelectric Pumped Storage
Other Energy Sources
All Energy Sources
New England 0 0 0 7 7 0 1 2Connecticut 0 0 0 27 21 0 0 1
Maine 0 0 0 89 8 0 0 7Massachusetts 0 0 0 8 6 0 2 4
New Hampshire 0 0 0 0 27 0 0 3Rhode Island 0 0 0 48 8 0 0 12
Vermont 0 0 0 24 15 0 0 14Middle Atlantic 0 0 0 7 2 0 1 1
New Jersey 0 0 0 8 5 0 0 2New York 0 0 0 16 3 0 2 1
Pennsylvania 0 0 0 28 3 0 0 1East North Central 0 0 0 10 2 0 4 0
Illinois 0 0 0 24 2 0 0 1Indiana 0 0 0 14 3 0 0 1
Michigan 0 0 0 19 5 0 11 2Ohio 0 0 0 24 3 0 0 1
Wisconsin 0 0 0 46 6 0 45 2West North Central 0 0 0 7 2 0 6 1
Iowa 0 0 0 76 2 0 0 2Kansas 0 0 0 90 2 0 0 3
Minnesota 0 0 0 7 3 0 4 3Missouri 0 0 0 29 3 0 0 1
Nebraska 0 0 0 57 4 0 0 4North Dakota 0 0 0 0 3 0 49 2South Dakota 0 0 0 210 6 0 0 8
South Atlantic 0 0 0 2 2 0 1 1Delaware 0 0 0 34 26 0 0 8
District of Columbia 0 0 0 0 0 0 0 38Florida 0 0 0 2 3 0 1 1
Georgia 0 0 0 5 3 0 33 2Maryland 0 0 0 10 5 0 0 1
North Carolina 0 0 0 3 2 0 0 2South Carolina 0 0 0 11 6 0 0 1
Virginia 0 0 0 9 8 0 0 2West Virginia 0 0 0 0 5 0 0 1
East South Central 0 0 0 7 3 0 10 1Alabama 0 0 0 12 4 0 0 1Kentucky 0 0 0 35 14 0 0 1
Mississippi 0 0 0 3 3 0 0 2Tennessee 0 0 0 21 7 0 148 1
West South Central 0 0 0 3 1 0 3 1Arkansas 0 0 0 2 4 0 60 2Louisiana 0 0 0 200 5 0 3 2Oklahoma 0 0 0 37 2 0 0 2
Texas 0 0 0 3 1 0 6 1Mountain 0 14 0 2 2 0 0 1
Arizona 0 0 0 3 4 0 0 1Colorado 0 0 0 9 3 0 0 1
Idaho 0 62 0 11 4 0 0 7Montana 0 0 0 51 6 0 0 5Nevada 0 14 0 3 6 0 0 2
New Mexico 0 0 0 8 3 0 0 1Utah 0 27 0 6 6 0 0 2
Wyoming 0 0 0 0 4 0 0 4Pacific Contiguous 0 5 0 2 2 0 2 1
California 0 5 0 2 2 0 2 1Oregon 0 38 0 12 3 0 0 3
Washington 0 0 0 0 3 0 0 1Pacific Noncontiguous 0 36 0 16 9 0 0 6
Alaska 0 0 0 0 15 0 0 15Hawaii 0 36 0 16 10 0 0 2
U.S. Total 0 7 0 2 1 0 1 0
Table A.1.B. Relative Standard Error (Percent) for Net Generation by Fuel Type:
Total (All Sectors) by Census Division and State, Year-to-Date through April 2018 (Continued)
Displayed values of zero may represent small values that round to zero. The Excel version of this table provides additional precision which may be accessed by selecting individual cells.
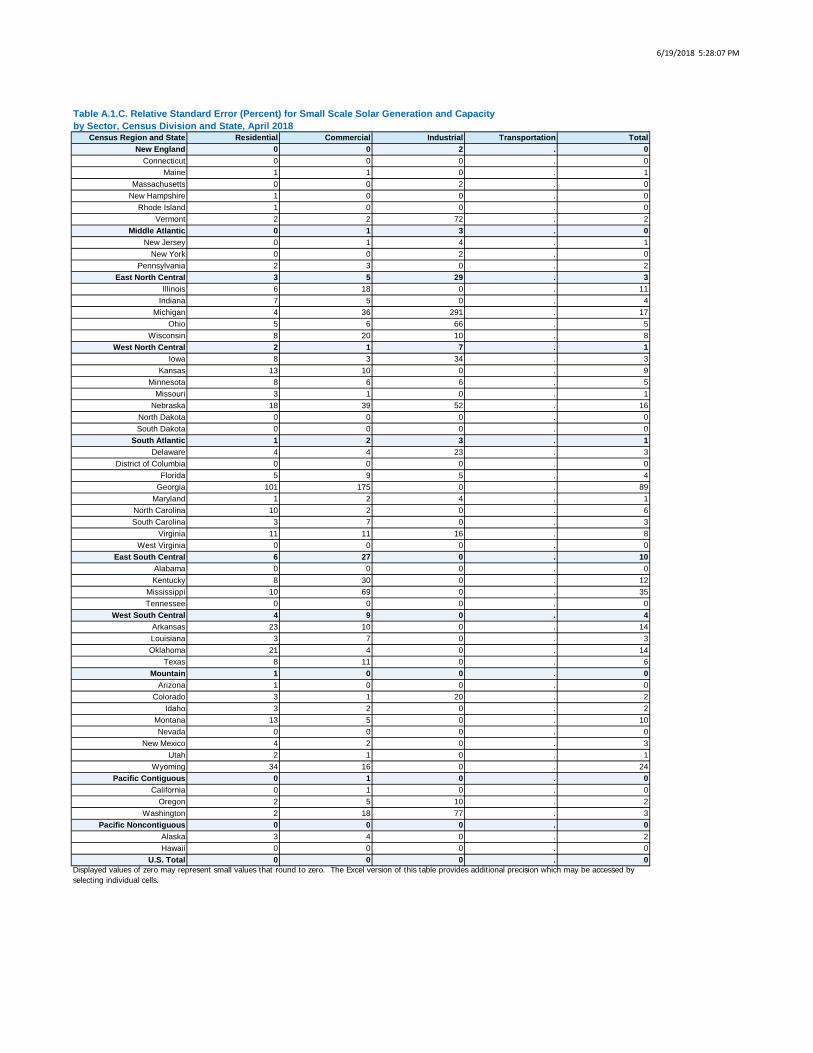
6/19/2018 5:28:07 PM
Census Region and State Residential Commercial Industrial Transportation TotalNew England 0 0 2 . 0
Connecticut 0 0 0 . 0Maine 1 1 0 . 1
Massachusetts 0 0 2 . 0New Hampshire 1 0 0 . 0
Rhode Island 1 0 0 . 0Vermont 2 2 72 . 2
Middle Atlantic 0 1 3 . 0New Jersey 0 1 4 . 1
New York 0 0 2 . 0Pennsylvania 2 3 0 . 2
East North Central 3 5 29 . 3Illinois 6 18 0 . 11
Indiana 7 5 0 . 4Michigan 4 36 291 . 17
Ohio 5 6 66 . 5Wisconsin 8 20 10 . 8
West North Central 2 1 7 . 1Iowa 8 3 34 . 3
Kansas 13 10 0 . 9Minnesota 8 6 6 . 5
Missouri 3 1 0 . 1Nebraska 18 39 52 . 16
North Dakota 0 0 0 . 0South Dakota 0 0 0 . 0
South Atlantic 1 2 3 . 1Delaware 4 4 23 . 3
District of Columbia 0 0 0 . 0Florida 5 9 5 . 4
Georgia 101 175 0 . 89Maryland 1 2 4 . 1
North Carolina 10 2 0 . 6South Carolina 3 7 0 . 3
Virginia 11 11 16 . 8West Virginia 0 0 0 . 0
East South Central 6 27 0 . 10Alabama 0 0 0 . 0Kentucky 8 30 0 . 12
Mississippi 10 69 0 . 35Tennessee 0 0 0 . 0
West South Central 4 9 0 . 4Arkansas 23 10 0 . 14Louisiana 3 7 0 . 3Oklahoma 21 4 0 . 14
Texas 8 11 0 . 6Mountain 1 0 0 . 0
Arizona 1 0 0 . 0Colorado 3 1 20 . 2
Idaho 3 2 0 . 2Montana 13 5 0 . 10Nevada 0 0 0 . 0
New Mexico 4 2 0 . 3Utah 2 1 0 . 1
Wyoming 34 16 0 . 24Pacific Contiguous 0 1 0 . 0
California 0 1 0 . 0Oregon 2 5 10 . 2
Washington 2 18 77 . 3Pacific Noncontiguous 0 0 0 . 0
Alaska 3 4 0 . 2Hawaii 0 0 0 . 0
U.S. Total 0 0 0 . 0
Table A.1.C. Relative Standard Error (Percent) for Small Scale Solar Generation and Capacityby Sector, Census Division and State, April 2018
Displayed values of zero may represent small values that round to zero. The Excel version of this table provides additional precision which may be accessed by selecting individual cells.
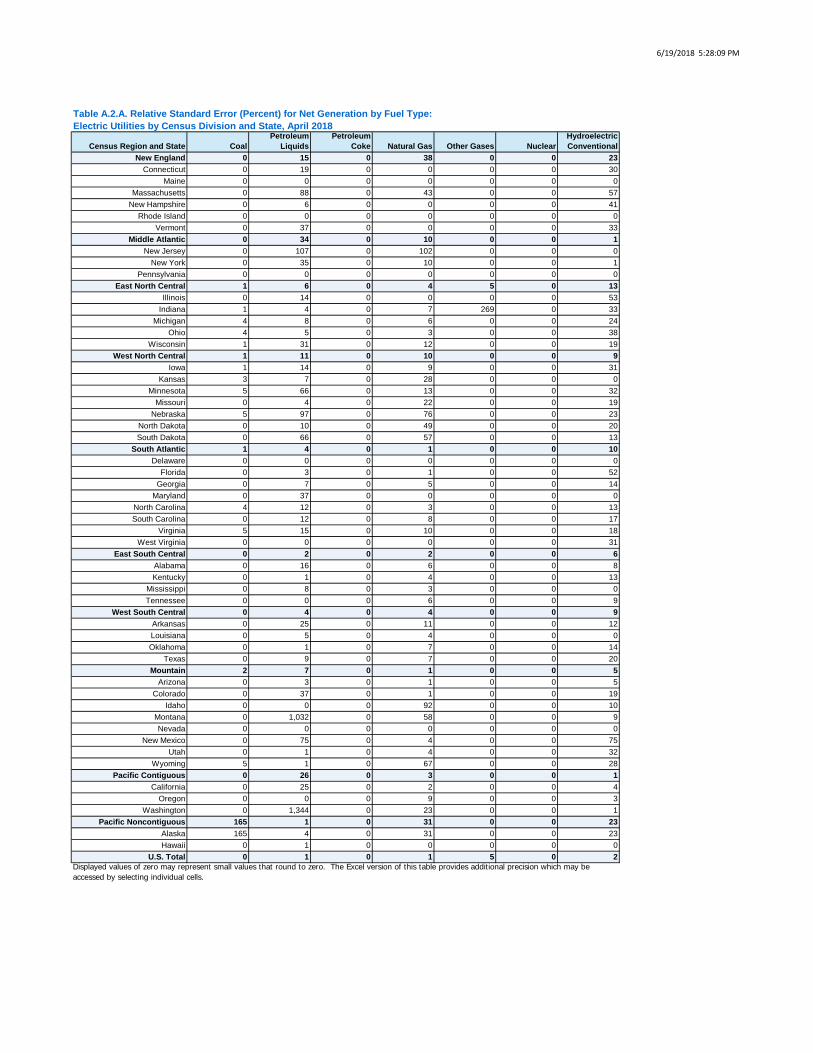
6/19/2018 5:28:09 PM
Census Region and State CoalPetroleum
LiquidsPetroleum
Coke Natural Gas Other Gases NuclearHydroelectric Conventional
New England 0 15 0 38 0 0 23Connecticut 0 19 0 0 0 0 30
Maine 0 0 0 0 0 0 0Massachusetts 0 88 0 43 0 0 57
New Hampshire 0 6 0 0 0 0 41Rhode Island 0 0 0 0 0 0 0
Vermont 0 37 0 0 0 0 33Middle Atlantic 0 34 0 10 0 0 1
New Jersey 0 107 0 102 0 0 0New York 0 35 0 10 0 0 1
Pennsylvania 0 0 0 0 0 0 0East North Central 1 6 0 4 5 0 13
Illinois 0 14 0 0 0 0 53Indiana 1 4 0 7 269 0 33
Michigan 4 8 0 6 0 0 24Ohio 4 5 0 3 0 0 38
Wisconsin 1 31 0 12 0 0 19West North Central 1 11 0 10 0 0 9
Iowa 1 14 0 9 0 0 31Kansas 3 7 0 28 0 0 0
Minnesota 5 66 0 13 0 0 32Missouri 0 4 0 22 0 0 19
Nebraska 5 97 0 76 0 0 23North Dakota 0 10 0 49 0 0 20South Dakota 0 66 0 57 0 0 13
South Atlantic 1 4 0 1 0 0 10Delaware 0 0 0 0 0 0 0
Florida 0 3 0 1 0 0 52Georgia 0 7 0 5 0 0 14
Maryland 0 37 0 0 0 0 0North Carolina 4 12 0 3 0 0 13South Carolina 0 12 0 8 0 0 17
Virginia 5 15 0 10 0 0 18West Virginia 0 0 0 0 0 0 31
East South Central 0 2 0 2 0 0 6Alabama 0 16 0 6 0 0 8Kentucky 0 1 0 4 0 0 13
Mississippi 0 8 0 3 0 0 0Tennessee 0 0 0 6 0 0 9
West South Central 0 4 0 4 0 0 9Arkansas 0 25 0 11 0 0 12Louisiana 0 5 0 4 0 0 0Oklahoma 0 1 0 7 0 0 14
Texas 0 9 0 7 0 0 20Mountain 2 7 0 1 0 0 5
Arizona 0 3 0 1 0 0 5Colorado 0 37 0 1 0 0 19
Idaho 0 0 0 92 0 0 10Montana 0 1,032 0 58 0 0 9Nevada 0 0 0 0 0 0 0
New Mexico 0 75 0 4 0 0 75Utah 0 1 0 4 0 0 32
Wyoming 5 1 0 67 0 0 28Pacific Contiguous 0 26 0 3 0 0 1
California 0 25 0 2 0 0 4Oregon 0 0 0 9 0 0 3
Washington 0 1,344 0 23 0 0 1Pacific Noncontiguous 165 1 0 31 0 0 23
Alaska 165 4 0 31 0 0 23Hawaii 0 1 0 0 0 0 0
U.S. Total 0 1 0 1 5 0 2
Table A.2.A. Relative Standard Error (Percent) for Net Generation by Fuel Type:Electric Utilities by Census Division and State, April 2018
Displayed values of zero may represent small values that round to zero. The Excel version of this table provides additional precision which may be accessed by selecting individual cells.

6/19/2018 5:28:10 PM
Census Region and State Wind Geothermal Biomass
Solar Thermal and
PhotovoltaicOther
Renewables
Hydroelectric Pumped Storage
Other Energy Sources
All Energy Sources
New England 0 0 0 33 9 0 0 9Connecticut 0 0 0 0 0 0 0 15
Maine 0 0 0 0 0 0 0 0Massachusetts 0 0 0 56 28 0 0 30
New Hampshire 0 0 0 0 0 0 0 10Rhode Island 0 0 0 0 0 0 0 0
Vermont 0 0 0 43 10 0 0 17Middle Atlantic 0 0 0 27 27 0 0 2
New Jersey 0 0 0 27 27 0 0 38New York 0 0 0 0 0 0 0 2
Pennsylvania 0 0 0 0 0 0 0 0East North Central 0 0 0 15 6 0 7 1
Illinois 0 0 0 0 20 0 0 1Indiana 0 0 0 24 16 0 0 1
Michigan 0 0 0 19 6 0 0 2Ohio 0 0 0 82 54 0 0 3
Wisconsin 0 0 0 0 13 0 42 3West North Central 0 0 0 55 2 0 8 1
Iowa 0 0 0 83 2 0 0 2Kansas 0 0 0 210 6 0 0 5
Minnesota 0 0 0 138 6 0 0 3Missouri 0 0 0 0 55 0 0 1
Nebraska 0 0 0 0 16 0 0 4North Dakota 0 0 0 0 4 0 49 2South Dakota 0 0 0 0 9 0 0 10
South Atlantic 0 0 0 3 6 0 0 1Delaware 0 0 0 94 94 0 0 77
Florida 0 0 0 2 2 0 0 1Georgia 0 0 0 13 13 0 0 2
Maryland 0 0 0 84 84 0 0 0North Carolina 0 0 0 13 13 0 0 2South Carolina 0 0 0 0 9 0 0 1
Virginia 0 0 0 19 22 0 0 3West Virginia 0 0 0 0 0 0 0 1
East South Central 0 0 0 29 24 0 0 1Alabama 0 0 0 49 49 0 0 2Kentucky 0 0 0 35 27 0 0 1
Mississippi 0 0 0 0 0 0 0 2Tennessee 0 0 0 0 0 0 0 1
West South Central 0 0 0 34 8 0 0 2Arkansas 0 0 0 210 210 0 0 3Louisiana 0 0 0 200 200 0 0 2Oklahoma 0 0 0 37 8 0 0 4
Texas 0 0 0 121 24 0 0 4Mountain 0 36 0 7 5 0 0 1
Arizona 0 0 0 9 9 0 0 1Colorado 0 0 0 125 29 0 0 1
Idaho 0 0 0 0 19 0 0 10Montana 0 0 0 0 17 0 0 9Nevada 0 0 0 0 0 0 0 0
New Mexico 0 0 0 16 16 0 0 2Utah 0 36 0 0 36 0 0 2
Wyoming 0 0 0 0 6 0 0 5Pacific Contiguous 0 0 0 11 3 0 0 1
California 0 0 0 11 5 0 0 2Oregon 0 0 0 102 3 0 0 3
Washington 0 0 0 0 4 0 0 1Pacific Noncontiguous 0 0 0 0 13 0 0 9
Alaska 0 0 0 0 24 0 0 17Hawaii 0 0 0 0 0 0 0 1
U.S. Total 0 9 0 3 2 0 3 0
Table A.2.A. Relative Standard Error (Percent) for Net Generation by Fuel Type:
Electric Utilities by Census Division and State, April 2018 (Continued)
Displayed values of zero may represent small values that round to zero. The Excel version of this table provides additional precision which may be accessed by selecting individual cells.
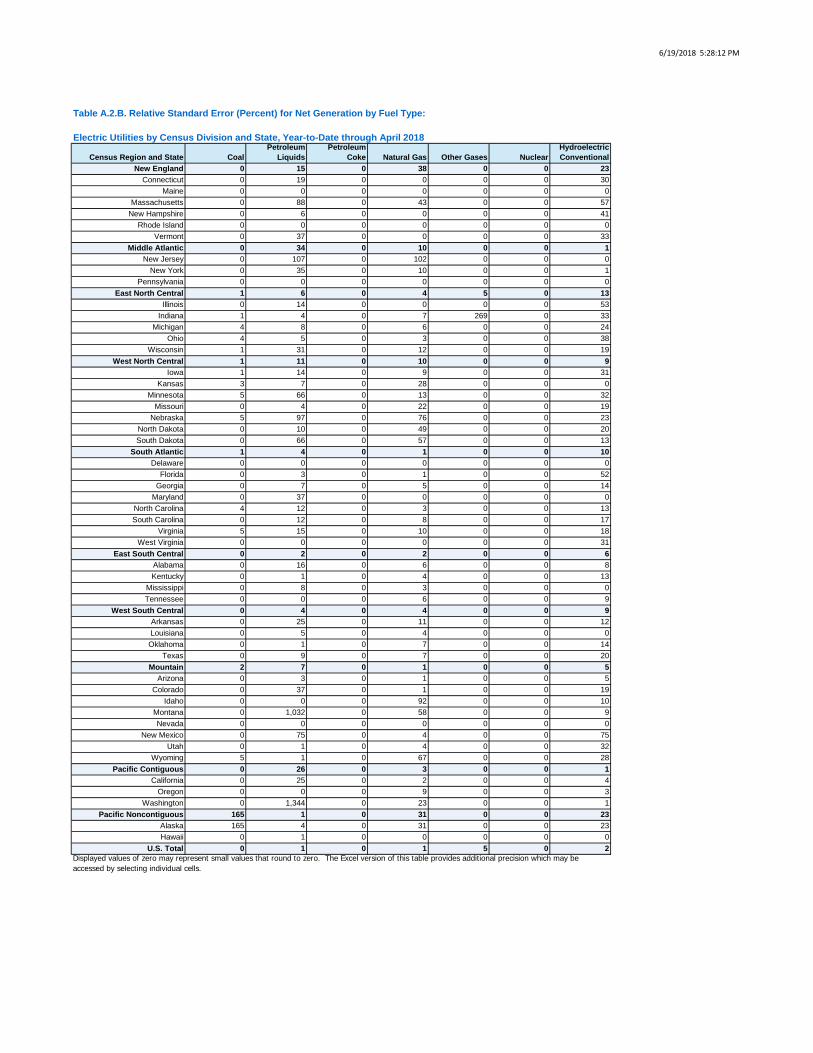
6/19/2018 5:28:12 PM
Census Region and State CoalPetroleum
LiquidsPetroleum
Coke Natural Gas Other Gases NuclearHydroelectric Conventional
New England 0 15 0 38 0 0 23Connecticut 0 19 0 0 0 0 30
Maine 0 0 0 0 0 0 0Massachusetts 0 88 0 43 0 0 57
New Hampshire 0 6 0 0 0 0 41Rhode Island 0 0 0 0 0 0 0
Vermont 0 37 0 0 0 0 33Middle Atlantic 0 34 0 10 0 0 1
New Jersey 0 107 0 102 0 0 0New York 0 35 0 10 0 0 1
Pennsylvania 0 0 0 0 0 0 0East North Central 1 6 0 4 5 0 13
Illinois 0 14 0 0 0 0 53Indiana 1 4 0 7 269 0 33
Michigan 4 8 0 6 0 0 24Ohio 4 5 0 3 0 0 38
Wisconsin 1 31 0 12 0 0 19West North Central 1 11 0 10 0 0 9
Iowa 1 14 0 9 0 0 31Kansas 3 7 0 28 0 0 0
Minnesota 5 66 0 13 0 0 32Missouri 0 4 0 22 0 0 19
Nebraska 5 97 0 76 0 0 23North Dakota 0 10 0 49 0 0 20South Dakota 0 66 0 57 0 0 13
South Atlantic 1 4 0 1 0 0 10Delaware 0 0 0 0 0 0 0
Florida 0 3 0 1 0 0 52Georgia 0 7 0 5 0 0 14
Maryland 0 37 0 0 0 0 0North Carolina 4 12 0 3 0 0 13South Carolina 0 12 0 8 0 0 17
Virginia 5 15 0 10 0 0 18West Virginia 0 0 0 0 0 0 31
East South Central 0 2 0 2 0 0 6Alabama 0 16 0 6 0 0 8Kentucky 0 1 0 4 0 0 13
Mississippi 0 8 0 3 0 0 0Tennessee 0 0 0 6 0 0 9
West South Central 0 4 0 4 0 0 9Arkansas 0 25 0 11 0 0 12Louisiana 0 5 0 4 0 0 0Oklahoma 0 1 0 7 0 0 14
Texas 0 9 0 7 0 0 20Mountain 2 7 0 1 0 0 5
Arizona 0 3 0 1 0 0 5Colorado 0 37 0 1 0 0 19
Idaho 0 0 0 92 0 0 10Montana 0 1,032 0 58 0 0 9Nevada 0 0 0 0 0 0 0
New Mexico 0 75 0 4 0 0 75Utah 0 1 0 4 0 0 32
Wyoming 5 1 0 67 0 0 28Pacific Contiguous 0 26 0 3 0 0 1
California 0 25 0 2 0 0 4Oregon 0 0 0 9 0 0 3
Washington 0 1,344 0 23 0 0 1Pacific Noncontiguous 165 1 0 31 0 0 23
Alaska 165 4 0 31 0 0 23Hawaii 0 1 0 0 0 0 0
U.S. Total 0 1 0 1 5 0 2
Table A.2.B. Relative Standard Error (Percent) for Net Generation by Fuel Type:
Electric Utilities by Census Division and State, Year-to-Date through April 2018
Displayed values of zero may represent small values that round to zero. The Excel version of this table provides additional precision which may be accessed by selecting individual cells.

6/19/2018 5:28:14 PM
Census Region and State Wind Geothermal Biomass
Solar Thermal and
PhotovoltaicOther
Renewables
Hydroelectric Pumped Storage
Other Energy Sources
All Energy Sources
New England 0 0 0 33 9 0 0 9Connecticut 0 0 0 0 0 0 0 15
Maine 0 0 0 0 0 0 0 0Massachusetts 0 0 0 56 28 0 0 30
New Hampshire 0 0 0 0 0 0 0 10Rhode Island 0 0 0 0 0 0 0 0
Vermont 0 0 0 43 10 0 0 17Middle Atlantic 0 0 0 27 27 0 0 2
New Jersey 0 0 0 27 27 0 0 38New York 0 0 0 0 0 0 0 2
Pennsylvania 0 0 0 0 0 0 0 0East North Central 0 0 0 15 6 0 7 1
Illinois 0 0 0 0 20 0 0 1Indiana 0 0 0 24 16 0 0 1
Michigan 0 0 0 19 6 0 0 2Ohio 0 0 0 82 54 0 0 3
Wisconsin 0 0 0 0 13 0 42 3West North Central 0 0 0 55 2 0 8 1
Iowa 0 0 0 83 2 0 0 2Kansas 0 0 0 210 6 0 0 5
Minnesota 0 0 0 138 6 0 0 3Missouri 0 0 0 0 55 0 0 1
Nebraska 0 0 0 0 16 0 0 4North Dakota 0 0 0 0 4 0 49 2South Dakota 0 0 0 0 9 0 0 10
South Atlantic 0 0 0 3 6 0 0 1Delaware 0 0 0 94 94 0 0 77
Florida 0 0 0 2 2 0 0 1Georgia 0 0 0 13 13 0 0 2
Maryland 0 0 0 84 84 0 0 0North Carolina 0 0 0 13 13 0 0 2South Carolina 0 0 0 0 9 0 0 1
Virginia 0 0 0 19 22 0 0 3West Virginia 0 0 0 0 0 0 0 1
East South Central 0 0 0 29 24 0 0 1Alabama 0 0 0 49 49 0 0 2Kentucky 0 0 0 35 27 0 0 1
Mississippi 0 0 0 0 0 0 0 2Tennessee 0 0 0 0 0 0 0 1
West South Central 0 0 0 34 8 0 0 2Arkansas 0 0 0 210 210 0 0 3Louisiana 0 0 0 200 200 0 0 2Oklahoma 0 0 0 37 8 0 0 4
Texas 0 0 0 121 24 0 0 4Mountain 0 36 0 7 5 0 0 1
Arizona 0 0 0 9 9 0 0 1Colorado 0 0 0 125 29 0 0 1
Idaho 0 0 0 0 19 0 0 10Montana 0 0 0 0 17 0 0 9Nevada 0 0 0 0 0 0 0 0
New Mexico 0 0 0 16 16 0 0 2Utah 0 36 0 0 36 0 0 2
Wyoming 0 0 0 0 6 0 0 5Pacific Contiguous 0 0 0 11 3 0 0 1
California 0 0 0 11 5 0 0 2Oregon 0 0 0 102 3 0 0 3
Washington 0 0 0 0 4 0 0 1Pacific Noncontiguous 0 0 0 0 13 0 0 9
Alaska 0 0 0 0 24 0 0 17Hawaii 0 0 0 0 0 0 0 1
U.S. Total 0 9 0 3 2 0 3 0
Table A.2.B. Relative Standard Error (Percent) for Net Generation by Fuel Type:
Electric Utilities by Census Division and State, Year-to-Date through April 2018 (Continued)
Displayed values of zero may represent small values that round to zero. The Excel version of this table provides additional precision which may be accessed by selecting individual cells.
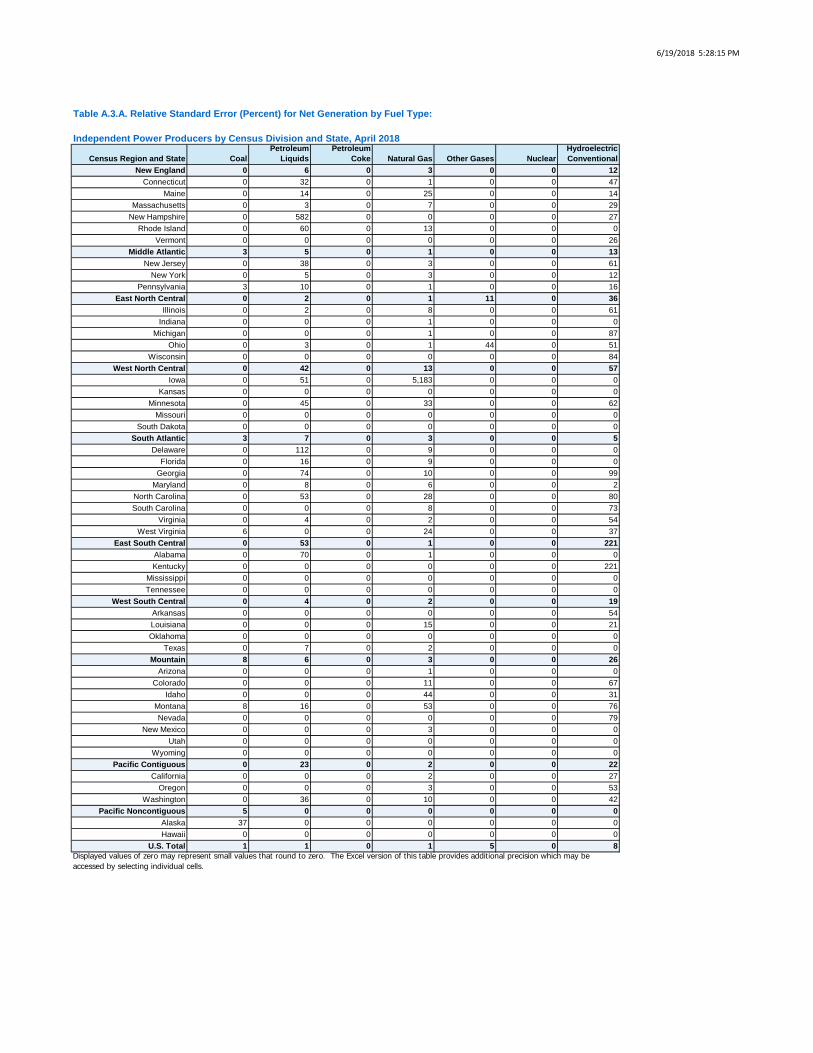
6/19/2018 5:28:15 PM
Census Region and State CoalPetroleum
LiquidsPetroleum
Coke Natural Gas Other Gases NuclearHydroelectric Conventional
New England 0 6 0 3 0 0 12Connecticut 0 32 0 1 0 0 47
Maine 0 14 0 25 0 0 14Massachusetts 0 3 0 7 0 0 29
New Hampshire 0 582 0 0 0 0 27Rhode Island 0 60 0 13 0 0 0
Vermont 0 0 0 0 0 0 26Middle Atlantic 3 5 0 1 0 0 13
New Jersey 0 38 0 3 0 0 61New York 0 5 0 3 0 0 12
Pennsylvania 3 10 0 1 0 0 16East North Central 0 2 0 1 11 0 36
Illinois 0 2 0 8 0 0 61Indiana 0 0 0 1 0 0 0
Michigan 0 0 0 1 0 0 87Ohio 0 3 0 1 44 0 51
Wisconsin 0 0 0 0 0 0 84West North Central 0 42 0 13 0 0 57
Iowa 0 51 0 5,183 0 0 0Kansas 0 0 0 0 0 0 0
Minnesota 0 45 0 33 0 0 62Missouri 0 0 0 0 0 0 0
South Dakota 0 0 0 0 0 0 0South Atlantic 3 7 0 3 0 0 5
Delaware 0 112 0 9 0 0 0Florida 0 16 0 9 0 0 0
Georgia 0 74 0 10 0 0 99Maryland 0 8 0 6 0 0 2
North Carolina 0 53 0 28 0 0 80South Carolina 0 0 0 8 0 0 73
Virginia 0 4 0 2 0 0 54West Virginia 6 0 0 24 0 0 37
East South Central 0 53 0 1 0 0 221Alabama 0 70 0 1 0 0 0Kentucky 0 0 0 0 0 0 221
Mississippi 0 0 0 0 0 0 0Tennessee 0 0 0 0 0 0 0
West South Central 0 4 0 2 0 0 19Arkansas 0 0 0 0 0 0 54Louisiana 0 0 0 15 0 0 21Oklahoma 0 0 0 0 0 0 0
Texas 0 7 0 2 0 0 0Mountain 8 6 0 3 0 0 26
Arizona 0 0 0 1 0 0 0Colorado 0 0 0 11 0 0 67
Idaho 0 0 0 44 0 0 31Montana 8 16 0 53 0 0 76Nevada 0 0 0 0 0 0 79
New Mexico 0 0 0 3 0 0 0Utah 0 0 0 0 0 0 0
Wyoming 0 0 0 0 0 0 0Pacific Contiguous 0 23 0 2 0 0 22
California 0 0 0 2 0 0 27Oregon 0 0 0 3 0 0 53
Washington 0 36 0 10 0 0 42Pacific Noncontiguous 5 0 0 0 0 0 0
Alaska 37 0 0 0 0 0 0Hawaii 0 0 0 0 0 0 0
U.S. Total 1 1 0 1 5 0 8
Table A.3.A. Relative Standard Error (Percent) for Net Generation by Fuel Type:
Independent Power Producers by Census Division and State, April 2018
Displayed values of zero may represent small values that round to zero. The Excel version of this table provides additional precision which may be accessed by selecting individual cells.
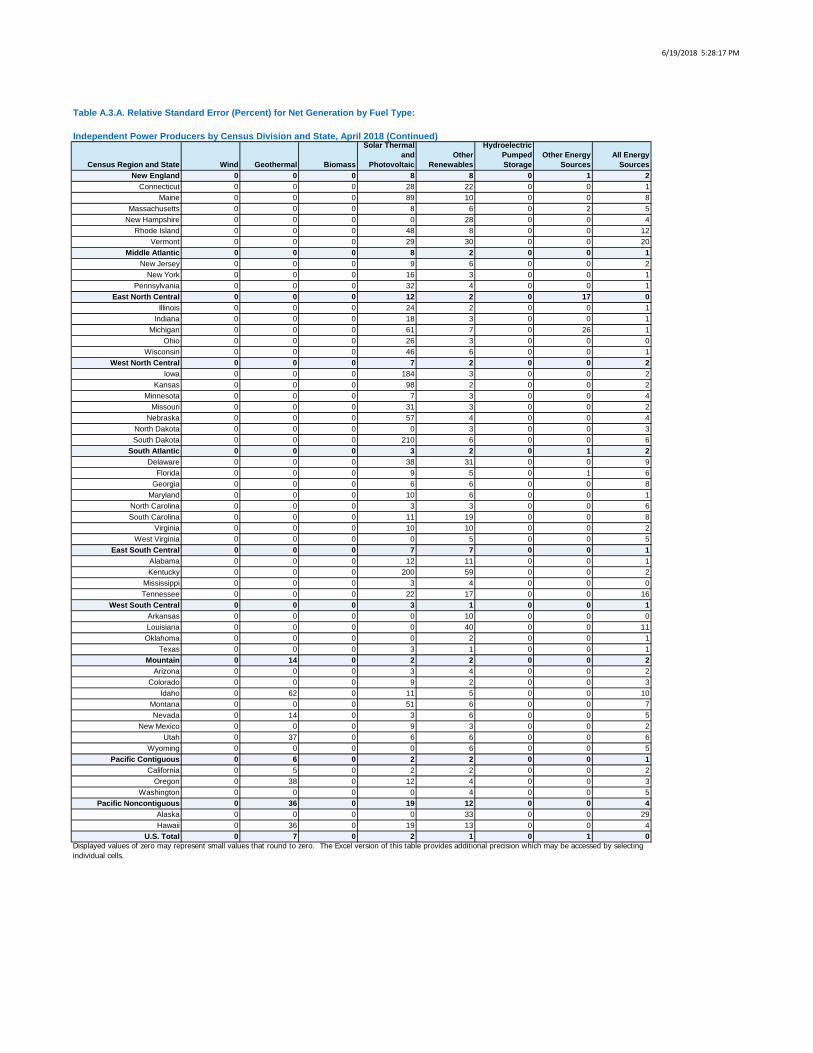
6/19/2018 5:28:17 PM
Census Region and State Wind Geothermal Biomass
Solar Thermal and
PhotovoltaicOther
Renewables
Hydroelectric Pumped Storage
Other Energy Sources
All Energy Sources
New England 0 0 0 8 8 0 1 2Connecticut 0 0 0 28 22 0 0 1
Maine 0 0 0 89 10 0 0 8Massachusetts 0 0 0 8 6 0 2 5
New Hampshire 0 0 0 0 28 0 0 4Rhode Island 0 0 0 48 8 0 0 12
Vermont 0 0 0 29 30 0 0 20Middle Atlantic 0 0 0 8 2 0 0 1
New Jersey 0 0 0 9 6 0 0 2New York 0 0 0 16 3 0 0 1
Pennsylvania 0 0 0 32 4 0 0 1East North Central 0 0 0 12 2 0 17 0
Illinois 0 0 0 24 2 0 0 1Indiana 0 0 0 18 3 0 0 1
Michigan 0 0 0 61 7 0 26 1Ohio 0 0 0 26 3 0 0 0
Wisconsin 0 0 0 46 6 0 0 1West North Central 0 0 0 7 2 0 0 2
Iowa 0 0 0 184 3 0 0 2Kansas 0 0 0 98 2 0 0 2
Minnesota 0 0 0 7 3 0 0 4Missouri 0 0 0 31 3 0 0 2
Nebraska 0 0 0 57 4 0 0 4North Dakota 0 0 0 0 3 0 0 3South Dakota 0 0 0 210 6 0 0 6
South Atlantic 0 0 0 3 2 0 1 2Delaware 0 0 0 38 31 0 0 9
Florida 0 0 0 9 5 0 1 6Georgia 0 0 0 6 6 0 0 8
Maryland 0 0 0 10 6 0 0 1North Carolina 0 0 0 3 3 0 0 6South Carolina 0 0 0 11 19 0 0 8
Virginia 0 0 0 10 10 0 0 2West Virginia 0 0 0 0 5 0 0 5
East South Central 0 0 0 7 7 0 0 1Alabama 0 0 0 12 11 0 0 1Kentucky 0 0 0 200 59 0 0 2
Mississippi 0 0 0 3 4 0 0 0Tennessee 0 0 0 22 17 0 0 16
West South Central 0 0 0 3 1 0 0 1Arkansas 0 0 0 0 10 0 0 0Louisiana 0 0 0 0 40 0 0 11Oklahoma 0 0 0 0 2 0 0 1
Texas 0 0 0 3 1 0 0 1Mountain 0 14 0 2 2 0 0 2
Arizona 0 0 0 3 4 0 0 2Colorado 0 0 0 9 2 0 0 3
Idaho 0 62 0 11 5 0 0 10Montana 0 0 0 51 6 0 0 7Nevada 0 14 0 3 6 0 0 5
New Mexico 0 0 0 9 3 0 0 2Utah 0 37 0 6 6 0 0 6
Wyoming 0 0 0 0 6 0 0 5Pacific Contiguous 0 6 0 2 2 0 0 1
California 0 5 0 2 2 0 0 2Oregon 0 38 0 12 4 0 0 3
Washington 0 0 0 0 4 0 0 5Pacific Noncontiguous 0 36 0 19 12 0 0 4
Alaska 0 0 0 0 33 0 0 29Hawaii 0 36 0 19 13 0 0 4
U.S. Total 0 7 0 2 1 0 1 0
Table A.3.A. Relative Standard Error (Percent) for Net Generation by Fuel Type:
Independent Power Producers by Census Division and State, April 2018 (Continued)
Displayed values of zero may represent small values that round to zero. The Excel version of this table provides additional precision which may be accessed by selecting individual cells.

6/19/2018 5:28:18 PM
Census Region and State CoalPetroleum
LiquidsPetroleum
Coke Natural Gas Other Gases NuclearHydroelectric Conventional
New England 0 6 0 3 0 0 12Connecticut 0 32 0 1 0 0 47
Maine 0 14 0 25 0 0 14Massachusetts 0 3 0 7 0 0 29
New Hampshire 0 582 0 0 0 0 27Rhode Island 0 60 0 13 0 0 0
Vermont 0 0 0 0 0 0 26Middle Atlantic 3 5 0 1 0 0 13
New Jersey 0 38 0 3 0 0 61New York 0 5 0 3 0 0 12
Pennsylvania 3 10 0 1 0 0 16East North Central 0 2 0 1 11 0 36
Illinois 0 2 0 8 0 0 61Indiana 0 0 0 1 0 0 0
Michigan 0 0 0 1 0 0 87Ohio 0 3 0 1 44 0 51
Wisconsin 0 0 0 0 0 0 84West North Central 0 42 0 13 0 0 57
Iowa 0 51 0 5,183 0 0 0Kansas 0 0 0 0 0 0 0
Minnesota 0 45 0 33 0 0 62Missouri 0 0 0 0 0 0 0
South Dakota 0 0 0 0 0 0 0South Atlantic 3 7 0 3 0 0 5
Delaware 0 112 0 9 0 0 0Florida 0 16 0 9 0 0 0
Georgia 0 74 0 10 0 0 99Maryland 0 8 0 6 0 0 2
North Carolina 0 53 0 28 0 0 80South Carolina 0 0 0 8 0 0 73
Virginia 0 4 0 2 0 0 54West Virginia 6 0 0 24 0 0 37
East South Central 0 53 0 1 0 0 221Alabama 0 70 0 1 0 0 0Kentucky 0 0 0 0 0 0 221
Mississippi 0 0 0 0 0 0 0Tennessee 0 0 0 0 0 0 0
West South Central 0 4 0 2 0 0 19Arkansas 0 0 0 0 0 0 54Louisiana 0 0 0 15 0 0 21Oklahoma 0 0 0 0 0 0 0
Texas 0 7 0 2 0 0 0Mountain 8 6 0 3 0 0 26
Arizona 0 0 0 1 0 0 0Colorado 0 0 0 11 0 0 67
Idaho 0 0 0 44 0 0 31Montana 8 16 0 53 0 0 76Nevada 0 0 0 0 0 0 79
New Mexico 0 0 0 3 0 0 0Utah 0 0 0 0 0 0 0
Wyoming 0 0 0 0 0 0 0Pacific Contiguous 0 23 0 2 0 0 22
California 0 0 0 2 0 0 27Oregon 0 0 0 3 0 0 53
Washington 0 36 0 10 0 0 42Pacific Noncontiguous 5 0 0 0 0 0 0
Alaska 37 0 0 0 0 0 0Hawaii 0 0 0 0 0 0 0
U.S. Total 1 1 0 1 5 0 8
Table A.3.B. Relative Standard Error (Percent) for Net Generation by Fuel Type:
Independent Power Producers by Census Division and State, Year-to-Date through April 2018
Displayed values of zero may represent small values that round to zero. The Excel version of this table provides additional precision which may be accessed by selecting individual cells.
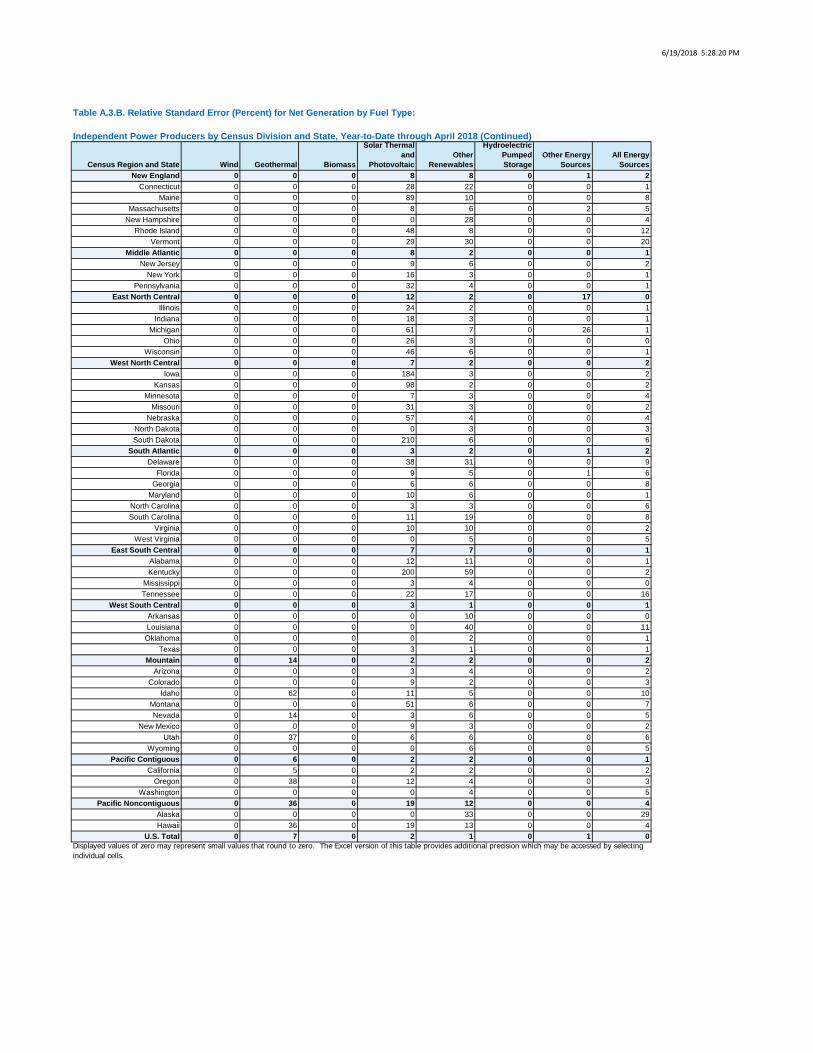
6/19/2018 5:28:20 PM
Census Region and State Wind Geothermal Biomass
Solar Thermal and
PhotovoltaicOther
Renewables
Hydroelectric Pumped Storage
Other Energy Sources
All Energy Sources
New England 0 0 0 8 8 0 1 2Connecticut 0 0 0 28 22 0 0 1
Maine 0 0 0 89 10 0 0 8Massachusetts 0 0 0 8 6 0 2 5
New Hampshire 0 0 0 0 28 0 0 4Rhode Island 0 0 0 48 8 0 0 12
Vermont 0 0 0 29 30 0 0 20Middle Atlantic 0 0 0 8 2 0 0 1
New Jersey 0 0 0 9 6 0 0 2New York 0 0 0 16 3 0 0 1
Pennsylvania 0 0 0 32 4 0 0 1East North Central 0 0 0 12 2 0 17 0
Illinois 0 0 0 24 2 0 0 1Indiana 0 0 0 18 3 0 0 1
Michigan 0 0 0 61 7 0 26 1Ohio 0 0 0 26 3 0 0 0
Wisconsin 0 0 0 46 6 0 0 1West North Central 0 0 0 7 2 0 0 2
Iowa 0 0 0 184 3 0 0 2Kansas 0 0 0 98 2 0 0 2
Minnesota 0 0 0 7 3 0 0 4Missouri 0 0 0 31 3 0 0 2
Nebraska 0 0 0 57 4 0 0 4North Dakota 0 0 0 0 3 0 0 3South Dakota 0 0 0 210 6 0 0 6
South Atlantic 0 0 0 3 2 0 1 2Delaware 0 0 0 38 31 0 0 9
Florida 0 0 0 9 5 0 1 6Georgia 0 0 0 6 6 0 0 8
Maryland 0 0 0 10 6 0 0 1North Carolina 0 0 0 3 3 0 0 6South Carolina 0 0 0 11 19 0 0 8
Virginia 0 0 0 10 10 0 0 2West Virginia 0 0 0 0 5 0 0 5
East South Central 0 0 0 7 7 0 0 1Alabama 0 0 0 12 11 0 0 1Kentucky 0 0 0 200 59 0 0 2
Mississippi 0 0 0 3 4 0 0 0Tennessee 0 0 0 22 17 0 0 16
West South Central 0 0 0 3 1 0 0 1Arkansas 0 0 0 0 10 0 0 0Louisiana 0 0 0 0 40 0 0 11Oklahoma 0 0 0 0 2 0 0 1
Texas 0 0 0 3 1 0 0 1Mountain 0 14 0 2 2 0 0 2
Arizona 0 0 0 3 4 0 0 2Colorado 0 0 0 9 2 0 0 3
Idaho 0 62 0 11 5 0 0 10Montana 0 0 0 51 6 0 0 7Nevada 0 14 0 3 6 0 0 5
New Mexico 0 0 0 9 3 0 0 2Utah 0 37 0 6 6 0 0 6
Wyoming 0 0 0 0 6 0 0 5Pacific Contiguous 0 6 0 2 2 0 0 1
California 0 5 0 2 2 0 0 2Oregon 0 38 0 12 4 0 0 3
Washington 0 0 0 0 4 0 0 5Pacific Noncontiguous 0 36 0 19 12 0 0 4
Alaska 0 0 0 0 33 0 0 29Hawaii 0 36 0 19 13 0 0 4
U.S. Total 0 7 0 2 1 0 1 0
Table A.3.B. Relative Standard Error (Percent) for Net Generation by Fuel Type:
Independent Power Producers by Census Division and State, Year-to-Date through April 2018 (Continued)
Displayed values of zero may represent small values that round to zero. The Excel version of this table provides additional precision which may be accessed by selecting individual cells.
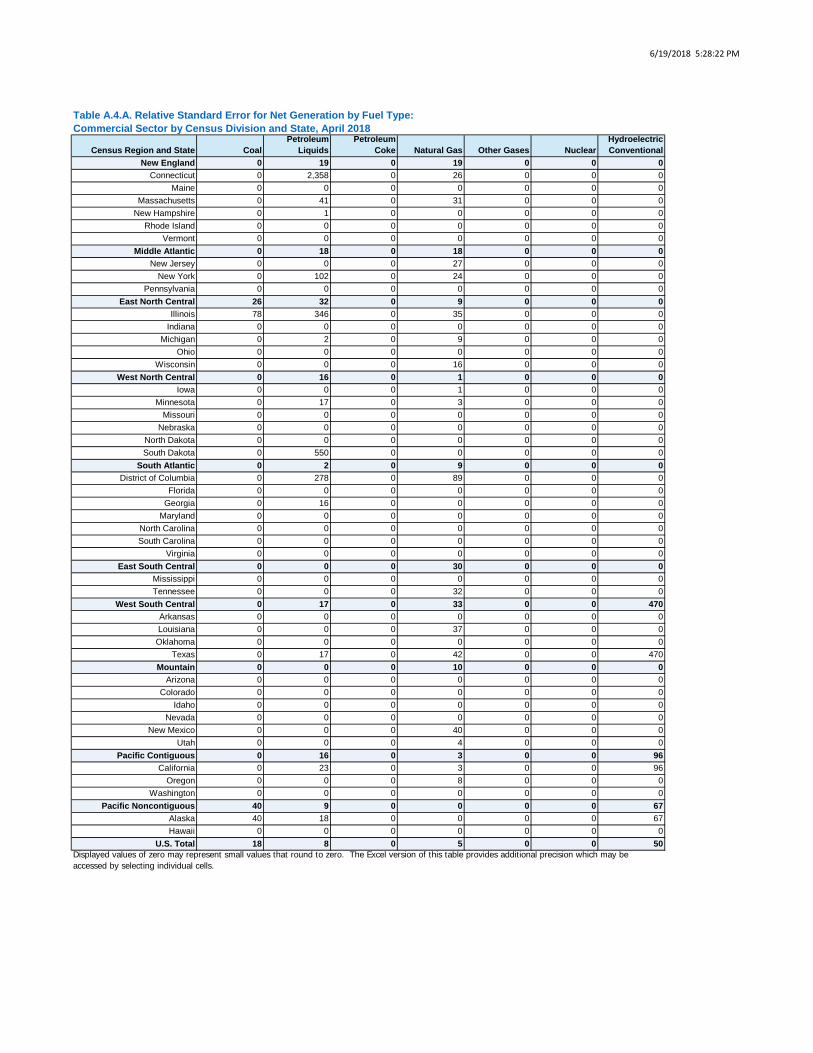
6/19/2018 5:28:22 PM
Census Region and State CoalPetroleum
LiquidsPetroleum
Coke Natural Gas Other Gases NuclearHydroelectric Conventional
New England 0 19 0 19 0 0 0Connecticut 0 2,358 0 26 0 0 0
Maine 0 0 0 0 0 0 0Massachusetts 0 41 0 31 0 0 0
New Hampshire 0 1 0 0 0 0 0Rhode Island 0 0 0 0 0 0 0
Vermont 0 0 0 0 0 0 0Middle Atlantic 0 18 0 18 0 0 0
New Jersey 0 0 0 27 0 0 0New York 0 102 0 24 0 0 0
Pennsylvania 0 0 0 0 0 0 0East North Central 26 32 0 9 0 0 0
Illinois 78 346 0 35 0 0 0Indiana 0 0 0 0 0 0 0
Michigan 0 2 0 9 0 0 0Ohio 0 0 0 0 0 0 0
Wisconsin 0 0 0 16 0 0 0West North Central 0 16 0 1 0 0 0
Iowa 0 0 0 1 0 0 0Minnesota 0 17 0 3 0 0 0
Missouri 0 0 0 0 0 0 0Nebraska 0 0 0 0 0 0 0
North Dakota 0 0 0 0 0 0 0South Dakota 0 550 0 0 0 0 0
South Atlantic 0 2 0 9 0 0 0District of Columbia 0 278 0 89 0 0 0
Florida 0 0 0 0 0 0 0Georgia 0 16 0 0 0 0 0
Maryland 0 0 0 0 0 0 0North Carolina 0 0 0 0 0 0 0South Carolina 0 0 0 0 0 0 0
Virginia 0 0 0 0 0 0 0East South Central 0 0 0 30 0 0 0
Mississippi 0 0 0 0 0 0 0Tennessee 0 0 0 32 0 0 0
West South Central 0 17 0 33 0 0 470Arkansas 0 0 0 0 0 0 0Louisiana 0 0 0 37 0 0 0Oklahoma 0 0 0 0 0 0 0
Texas 0 17 0 42 0 0 470Mountain 0 0 0 10 0 0 0
Arizona 0 0 0 0 0 0 0Colorado 0 0 0 0 0 0 0
Idaho 0 0 0 0 0 0 0Nevada 0 0 0 0 0 0 0
New Mexico 0 0 0 40 0 0 0Utah 0 0 0 4 0 0 0
Pacific Contiguous 0 16 0 3 0 0 96California 0 23 0 3 0 0 96
Oregon 0 0 0 8 0 0 0Washington 0 0 0 0 0 0 0
Pacific Noncontiguous 40 9 0 0 0 0 67Alaska 40 18 0 0 0 0 67Hawaii 0 0 0 0 0 0 0
U.S. Total 18 8 0 5 0 0 50
Table A.4.A. Relative Standard Error for Net Generation by Fuel Type:Commercial Sector by Census Division and State, April 2018
Displayed values of zero may represent small values that round to zero. The Excel version of this table provides additional precision which may be accessed by selecting individual cells.
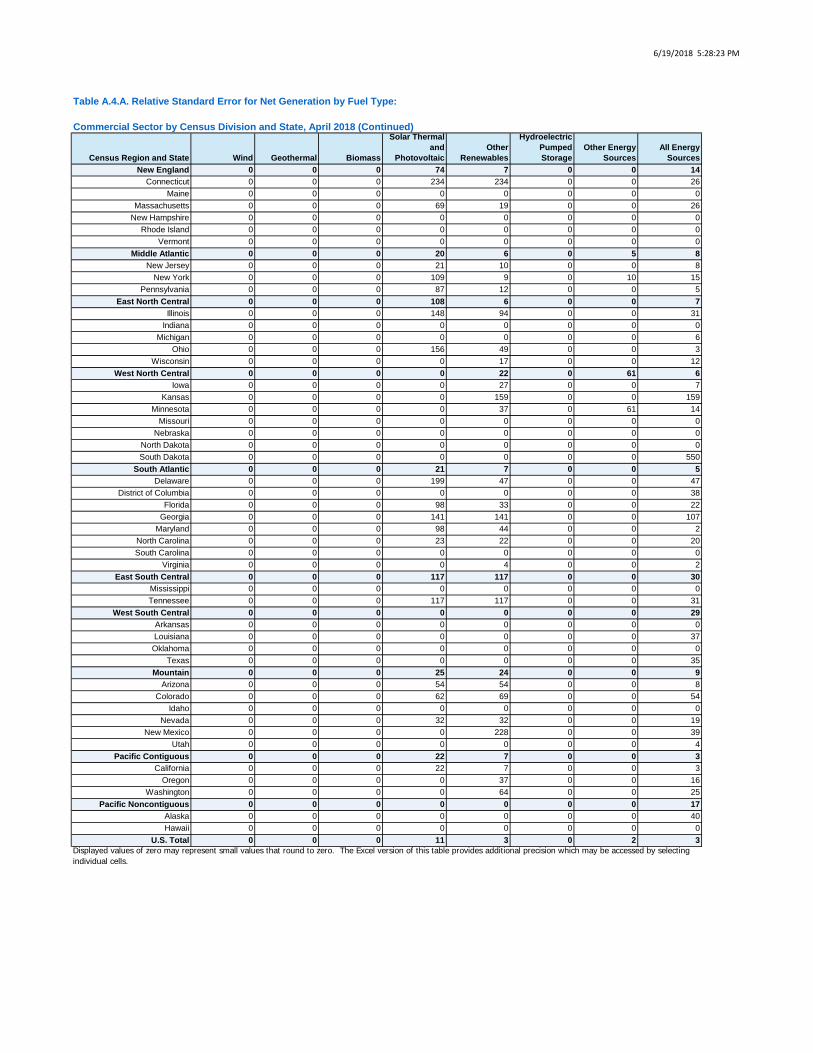
6/19/2018 5:28:23 PM
Census Region and State Wind Geothermal Biomass
Solar Thermal and
PhotovoltaicOther
Renewables
Hydroelectric Pumped Storage
Other Energy Sources
All Energy Sources
New England 0 0 0 74 7 0 0 14Connecticut 0 0 0 234 234 0 0 26
Maine 0 0 0 0 0 0 0 0Massachusetts 0 0 0 69 19 0 0 26
New Hampshire 0 0 0 0 0 0 0 0Rhode Island 0 0 0 0 0 0 0 0
Vermont 0 0 0 0 0 0 0 0Middle Atlantic 0 0 0 20 6 0 5 8
New Jersey 0 0 0 21 10 0 0 8New York 0 0 0 109 9 0 10 15
Pennsylvania 0 0 0 87 12 0 0 5East North Central 0 0 0 108 6 0 0 7
Illinois 0 0 0 148 94 0 0 31Indiana 0 0 0 0 0 0 0 0
Michigan 0 0 0 0 0 0 0 6Ohio 0 0 0 156 49 0 0 3
Wisconsin 0 0 0 0 17 0 0 12West North Central 0 0 0 0 22 0 61 6
Iowa 0 0 0 0 27 0 0 7Kansas 0 0 0 0 159 0 0 159
Minnesota 0 0 0 0 37 0 61 14Missouri 0 0 0 0 0 0 0 0
Nebraska 0 0 0 0 0 0 0 0North Dakota 0 0 0 0 0 0 0 0South Dakota 0 0 0 0 0 0 0 550
South Atlantic 0 0 0 21 7 0 0 5Delaware 0 0 0 199 47 0 0 47
District of Columbia 0 0 0 0 0 0 0 38Florida 0 0 0 98 33 0 0 22
Georgia 0 0 0 141 141 0 0 107Maryland 0 0 0 98 44 0 0 2
North Carolina 0 0 0 23 22 0 0 20South Carolina 0 0 0 0 0 0 0 0
Virginia 0 0 0 0 4 0 0 2East South Central 0 0 0 117 117 0 0 30
Mississippi 0 0 0 0 0 0 0 0Tennessee 0 0 0 117 117 0 0 31
West South Central 0 0 0 0 0 0 0 29Arkansas 0 0 0 0 0 0 0 0Louisiana 0 0 0 0 0 0 0 37Oklahoma 0 0 0 0 0 0 0 0
Texas 0 0 0 0 0 0 0 35Mountain 0 0 0 25 24 0 0 9
Arizona 0 0 0 54 54 0 0 8Colorado 0 0 0 62 69 0 0 54
Idaho 0 0 0 0 0 0 0 0Nevada 0 0 0 32 32 0 0 19
New Mexico 0 0 0 0 228 0 0 39Utah 0 0 0 0 0 0 0 4
Pacific Contiguous 0 0 0 22 7 0 0 3California 0 0 0 22 7 0 0 3
Oregon 0 0 0 0 37 0 0 16Washington 0 0 0 0 64 0 0 25
Pacific Noncontiguous 0 0 0 0 0 0 0 17Alaska 0 0 0 0 0 0 0 40Hawaii 0 0 0 0 0 0 0 0
U.S. Total 0 0 0 11 3 0 2 3
Table A.4.A. Relative Standard Error for Net Generation by Fuel Type:
Commercial Sector by Census Division and State, April 2018 (Continued)
Displayed values of zero may represent small values that round to zero. The Excel version of this table provides additional precision which may be accessed by selecting individual cells.

6/19/2018 5:28:25 PM
Census Region and State CoalPetroleum
LiquidsPetroleum
Coke Natural Gas Other Gases NuclearHydroelectric Conventional
New England 0 19 0 19 0 0 0Connecticut 0 2,358 0 26 0 0 0
Maine 0 0 0 0 0 0 0Massachusetts 0 41 0 31 0 0 0
New Hampshire 0 1 0 0 0 0 0Rhode Island 0 0 0 0 0 0 0
Vermont 0 0 0 0 0 0 0Middle Atlantic 0 18 0 18 0 0 0
New Jersey 0 0 0 27 0 0 0New York 0 102 0 24 0 0 0
Pennsylvania 0 0 0 0 0 0 0East North Central 26 32 0 9 0 0 0
Illinois 78 346 0 35 0 0 0Indiana 0 0 0 0 0 0 0
Michigan 0 2 0 9 0 0 0Ohio 0 0 0 0 0 0 0
Wisconsin 0 0 0 16 0 0 0West North Central 0 16 0 1 0 0 0
Iowa 0 0 0 1 0 0 0Minnesota 0 17 0 3 0 0 0
Missouri 0 0 0 0 0 0 0Nebraska 0 0 0 0 0 0 0
North Dakota 0 0 0 0 0 0 0South Dakota 0 550 0 0 0 0 0
South Atlantic 0 2 0 9 0 0 0District of Columbia 0 278 0 89 0 0 0
Florida 0 0 0 0 0 0 0Georgia 0 16 0 0 0 0 0
Maryland 0 0 0 0 0 0 0North Carolina 0 0 0 0 0 0 0South Carolina 0 0 0 0 0 0 0
Virginia 0 0 0 0 0 0 0East South Central 0 0 0 30 0 0 0
Mississippi 0 0 0 0 0 0 0Tennessee 0 0 0 32 0 0 0
West South Central 0 17 0 33 0 0 470Arkansas 0 0 0 0 0 0 0Louisiana 0 0 0 37 0 0 0
Oklahoma 0 0 0 0 0 0 0Texas 0 17 0 42 0 0 470
Mountain 0 0 0 10 0 0 0Arizona 0 0 0 0 0 0 0
Colorado 0 0 0 0 0 0 0Idaho 0 0 0 0 0 0 0
Nevada 0 0 0 0 0 0 0New Mexico 0 0 0 40 0 0 0
Utah 0 0 0 4 0 0 0Pacific Contiguous 0 16 0 3 0 0 96
California 0 23 0 3 0 0 96Oregon 0 0 0 8 0 0 0
Washington 0 0 0 0 0 0 0Pacific Noncontiguous 40 9 0 0 0 0 67
Alaska 40 18 0 0 0 0 67Hawaii 0 0 0 0 0 0 0
U.S. Total 18 8 0 5 0 0 50
Table A.4.B. Relative Standard Error for Net Generation by Fuel Type:
Commercial Sector by Census Division and State, Year-to-Date through April 2018
Displayed values of zero may represent small values that round to zero. The Excel version of this table provides additional precision which may be accessed by selecting individual cells.
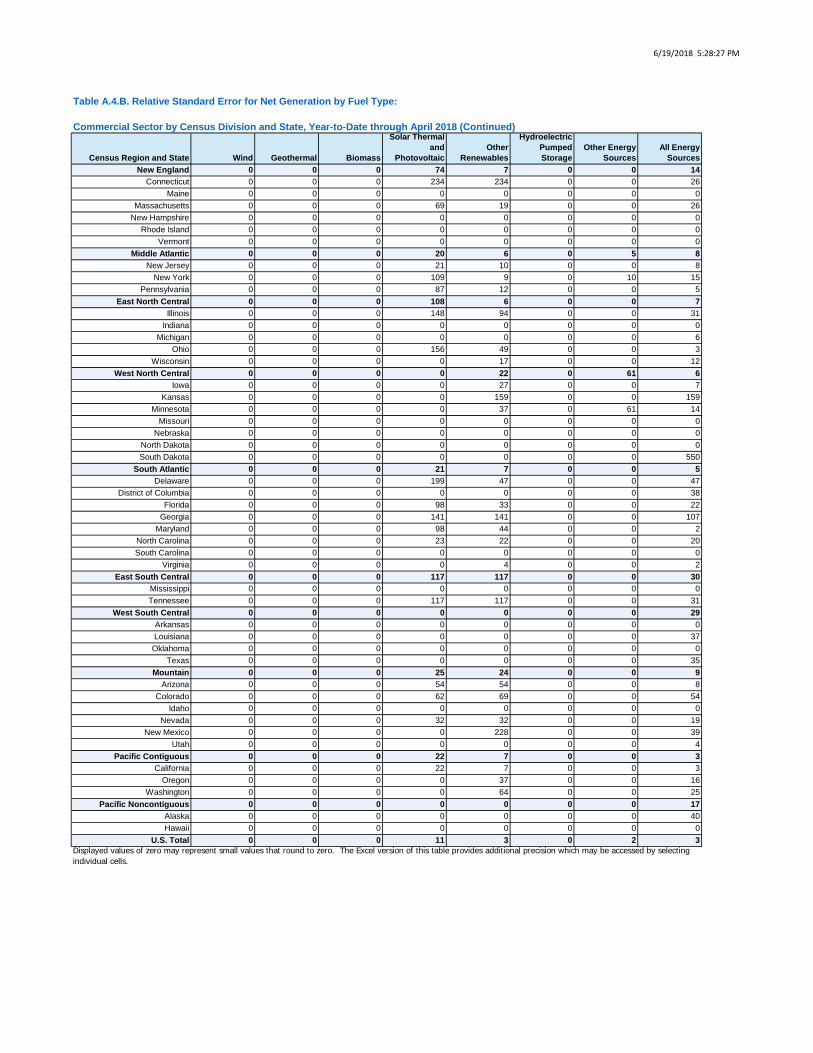
6/19/2018 5:28:27 PM
Census Region and State Wind Geothermal Biomass
Solar Thermal and
PhotovoltaicOther
Renewables
Hydroelectric Pumped Storage
Other Energy Sources
All Energy Sources
New England 0 0 0 74 7 0 0 14Connecticut 0 0 0 234 234 0 0 26
Maine 0 0 0 0 0 0 0 0Massachusetts 0 0 0 69 19 0 0 26
New Hampshire 0 0 0 0 0 0 0 0Rhode Island 0 0 0 0 0 0 0 0
Vermont 0 0 0 0 0 0 0 0Middle Atlantic 0 0 0 20 6 0 5 8
New Jersey 0 0 0 21 10 0 0 8New York 0 0 0 109 9 0 10 15
Pennsylvania 0 0 0 87 12 0 0 5East North Central 0 0 0 108 6 0 0 7
Illinois 0 0 0 148 94 0 0 31Indiana 0 0 0 0 0 0 0 0
Michigan 0 0 0 0 0 0 0 6Ohio 0 0 0 156 49 0 0 3
Wisconsin 0 0 0 0 17 0 0 12West North Central 0 0 0 0 22 0 61 6
Iowa 0 0 0 0 27 0 0 7Kansas 0 0 0 0 159 0 0 159
Minnesota 0 0 0 0 37 0 61 14Missouri 0 0 0 0 0 0 0 0
Nebraska 0 0 0 0 0 0 0 0North Dakota 0 0 0 0 0 0 0 0South Dakota 0 0 0 0 0 0 0 550
South Atlantic 0 0 0 21 7 0 0 5Delaware 0 0 0 199 47 0 0 47
District of Columbia 0 0 0 0 0 0 0 38Florida 0 0 0 98 33 0 0 22
Georgia 0 0 0 141 141 0 0 107Maryland 0 0 0 98 44 0 0 2
North Carolina 0 0 0 23 22 0 0 20South Carolina 0 0 0 0 0 0 0 0
Virginia 0 0 0 0 4 0 0 2East South Central 0 0 0 117 117 0 0 30
Mississippi 0 0 0 0 0 0 0 0Tennessee 0 0 0 117 117 0 0 31
West South Central 0 0 0 0 0 0 0 29Arkansas 0 0 0 0 0 0 0 0Louisiana 0 0 0 0 0 0 0 37Oklahoma 0 0 0 0 0 0 0 0
Texas 0 0 0 0 0 0 0 35Mountain 0 0 0 25 24 0 0 9
Arizona 0 0 0 54 54 0 0 8Colorado 0 0 0 62 69 0 0 54
Idaho 0 0 0 0 0 0 0 0Nevada 0 0 0 32 32 0 0 19
New Mexico 0 0 0 0 228 0 0 39Utah 0 0 0 0 0 0 0 4
Pacific Contiguous 0 0 0 22 7 0 0 3California 0 0 0 22 7 0 0 3
Oregon 0 0 0 0 37 0 0 16Washington 0 0 0 0 64 0 0 25
Pacific Noncontiguous 0 0 0 0 0 0 0 17Alaska 0 0 0 0 0 0 0 40Hawaii 0 0 0 0 0 0 0 0
U.S. Total 0 0 0 11 3 0 2 3
Table A.4.B. Relative Standard Error for Net Generation by Fuel Type:
Commercial Sector by Census Division and State, Year-to-Date through April 2018 (Continued)
Displayed values of zero may represent small values that round to zero. The Excel version of this table provides additional precision which may be accessed by selecting individual cells.
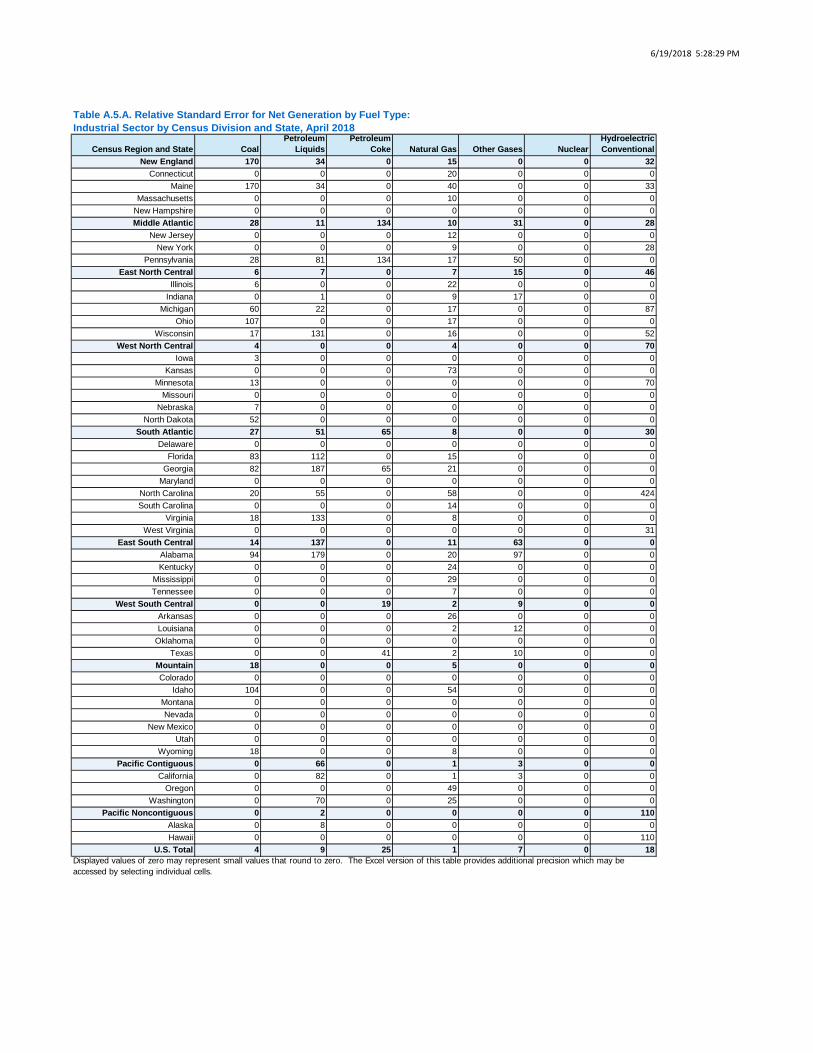
6/19/2018 5:28:29 PM
Census Region and State CoalPetroleum
LiquidsPetroleum
Coke Natural Gas Other Gases NuclearHydroelectric Conventional
New England 170 34 0 15 0 0 32Connecticut 0 0 0 20 0 0 0
Maine 170 34 0 40 0 0 33Massachusetts 0 0 0 10 0 0 0
New Hampshire 0 0 0 0 0 0 0Middle Atlantic 28 11 134 10 31 0 28
New Jersey 0 0 0 12 0 0 0New York 0 0 0 9 0 0 28
Pennsylvania 28 81 134 17 50 0 0East North Central 6 7 0 7 15 0 46
Illinois 6 0 0 22 0 0 0Indiana 0 1 0 9 17 0 0
Michigan 60 22 0 17 0 0 87Ohio 107 0 0 17 0 0 0
Wisconsin 17 131 0 16 0 0 52West North Central 4 0 0 4 0 0 70
Iowa 3 0 0 0 0 0 0Kansas 0 0 0 73 0 0 0
Minnesota 13 0 0 0 0 0 70Missouri 0 0 0 0 0 0 0
Nebraska 7 0 0 0 0 0 0North Dakota 52 0 0 0 0 0 0
South Atlantic 27 51 65 8 0 0 30Delaware 0 0 0 0 0 0 0
Florida 83 112 0 15 0 0 0Georgia 82 187 65 21 0 0 0
Maryland 0 0 0 0 0 0 0North Carolina 20 55 0 58 0 0 424South Carolina 0 0 0 14 0 0 0
Virginia 18 133 0 8 0 0 0West Virginia 0 0 0 0 0 0 31
East South Central 14 137 0 11 63 0 0Alabama 94 179 0 20 97 0 0Kentucky 0 0 0 24 0 0 0
Mississippi 0 0 0 29 0 0 0Tennessee 0 0 0 7 0 0 0
West South Central 0 0 19 2 9 0 0Arkansas 0 0 0 26 0 0 0Louisiana 0 0 0 2 12 0 0
Oklahoma 0 0 0 0 0 0 0Texas 0 0 41 2 10 0 0
Mountain 18 0 0 5 0 0 0Colorado 0 0 0 0 0 0 0
Idaho 104 0 0 54 0 0 0Montana 0 0 0 0 0 0 0Nevada 0 0 0 0 0 0 0
New Mexico 0 0 0 0 0 0 0Utah 0 0 0 0 0 0 0
Wyoming 18 0 0 8 0 0 0Pacific Contiguous 0 66 0 1 3 0 0
California 0 82 0 1 3 0 0Oregon 0 0 0 49 0 0 0
Washington 0 70 0 25 0 0 0Pacific Noncontiguous 0 2 0 0 0 0 110
Alaska 0 8 0 0 0 0 0Hawaii 0 0 0 0 0 0 110
U.S. Total 4 9 25 1 7 0 18
Table A.5.A. Relative Standard Error for Net Generation by Fuel Type:Industrial Sector by Census Division and State, April 2018
Displayed values of zero may represent small values that round to zero. The Excel version of this table provides additional precision which may be accessed by selecting individual cells.
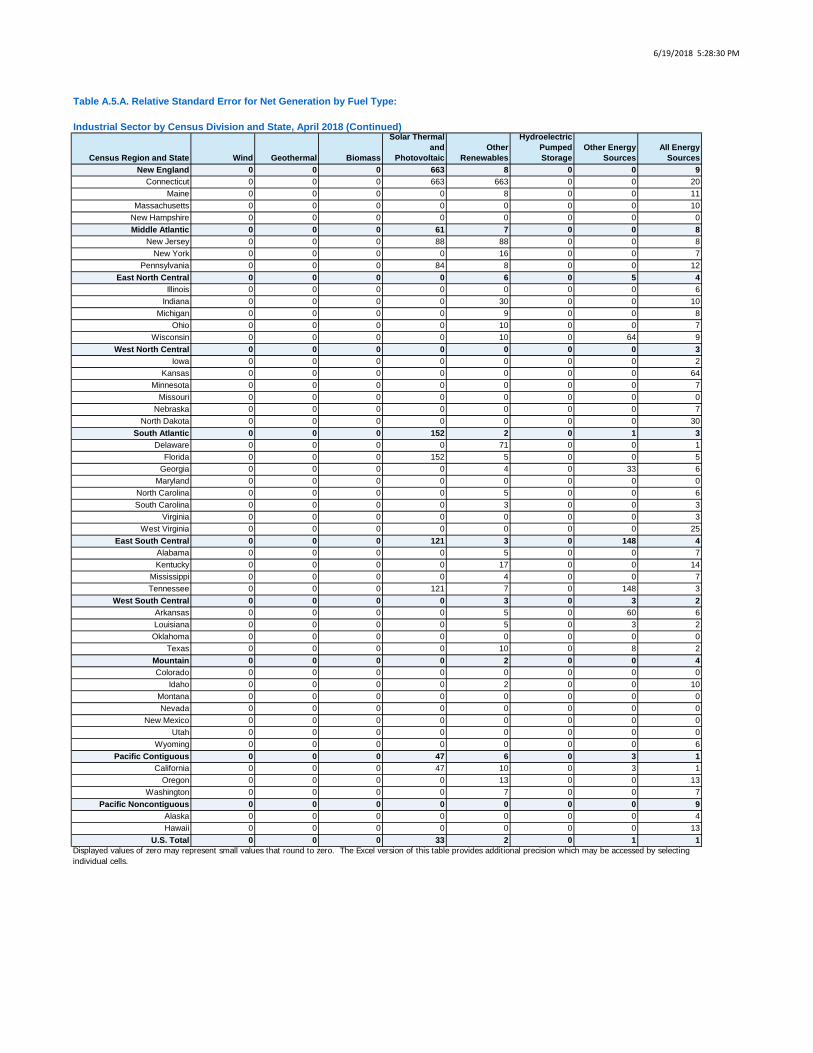
6/19/2018 5:28:30 PM
Census Region and State Wind Geothermal Biomass
Solar Thermal and
PhotovoltaicOther
Renewables
Hydroelectric Pumped Storage
Other Energy Sources
All Energy Sources
New England 0 0 0 663 8 0 0 9Connecticut 0 0 0 663 663 0 0 20
Maine 0 0 0 0 8 0 0 11Massachusetts 0 0 0 0 0 0 0 10
New Hampshire 0 0 0 0 0 0 0 0Middle Atlantic 0 0 0 61 7 0 0 8
New Jersey 0 0 0 88 88 0 0 8New York 0 0 0 0 16 0 0 7
Pennsylvania 0 0 0 84 8 0 0 12East North Central 0 0 0 0 6 0 5 4
Illinois 0 0 0 0 0 0 0 6Indiana 0 0 0 0 30 0 0 10
Michigan 0 0 0 0 9 0 0 8Ohio 0 0 0 0 10 0 0 7
Wisconsin 0 0 0 0 10 0 64 9West North Central 0 0 0 0 0 0 0 3
Iowa 0 0 0 0 0 0 0 2Kansas 0 0 0 0 0 0 0 64
Minnesota 0 0 0 0 0 0 0 7Missouri 0 0 0 0 0 0 0 0
Nebraska 0 0 0 0 0 0 0 7North Dakota 0 0 0 0 0 0 0 30
South Atlantic 0 0 0 152 2 0 1 3Delaware 0 0 0 0 71 0 0 1
Florida 0 0 0 152 5 0 0 5Georgia 0 0 0 0 4 0 33 6
Maryland 0 0 0 0 0 0 0 0North Carolina 0 0 0 0 5 0 0 6South Carolina 0 0 0 0 3 0 0 3
Virginia 0 0 0 0 0 0 0 3West Virginia 0 0 0 0 0 0 0 25
East South Central 0 0 0 121 3 0 148 4Alabama 0 0 0 0 5 0 0 7Kentucky 0 0 0 0 17 0 0 14
Mississippi 0 0 0 0 4 0 0 7Tennessee 0 0 0 121 7 0 148 3
West South Central 0 0 0 0 3 0 3 2Arkansas 0 0 0 0 5 0 60 6Louisiana 0 0 0 0 5 0 3 2Oklahoma 0 0 0 0 0 0 0 0
Texas 0 0 0 0 10 0 8 2Mountain 0 0 0 0 2 0 0 4Colorado 0 0 0 0 0 0 0 0
Idaho 0 0 0 0 2 0 0 10Montana 0 0 0 0 0 0 0 0Nevada 0 0 0 0 0 0 0 0
New Mexico 0 0 0 0 0 0 0 0Utah 0 0 0 0 0 0 0 0
Wyoming 0 0 0 0 0 0 0 6Pacific Contiguous 0 0 0 47 6 0 3 1
California 0 0 0 47 10 0 3 1Oregon 0 0 0 0 13 0 0 13
Washington 0 0 0 0 7 0 0 7Pacific Noncontiguous 0 0 0 0 0 0 0 9
Alaska 0 0 0 0 0 0 0 4Hawaii 0 0 0 0 0 0 0 13
U.S. Total 0 0 0 33 2 0 1 1
Table A.5.A. Relative Standard Error for Net Generation by Fuel Type:
Industrial Sector by Census Division and State, April 2018 (Continued)
Displayed values of zero may represent small values that round to zero. The Excel version of this table provides additional precision which may be accessed by selecting individual cells.
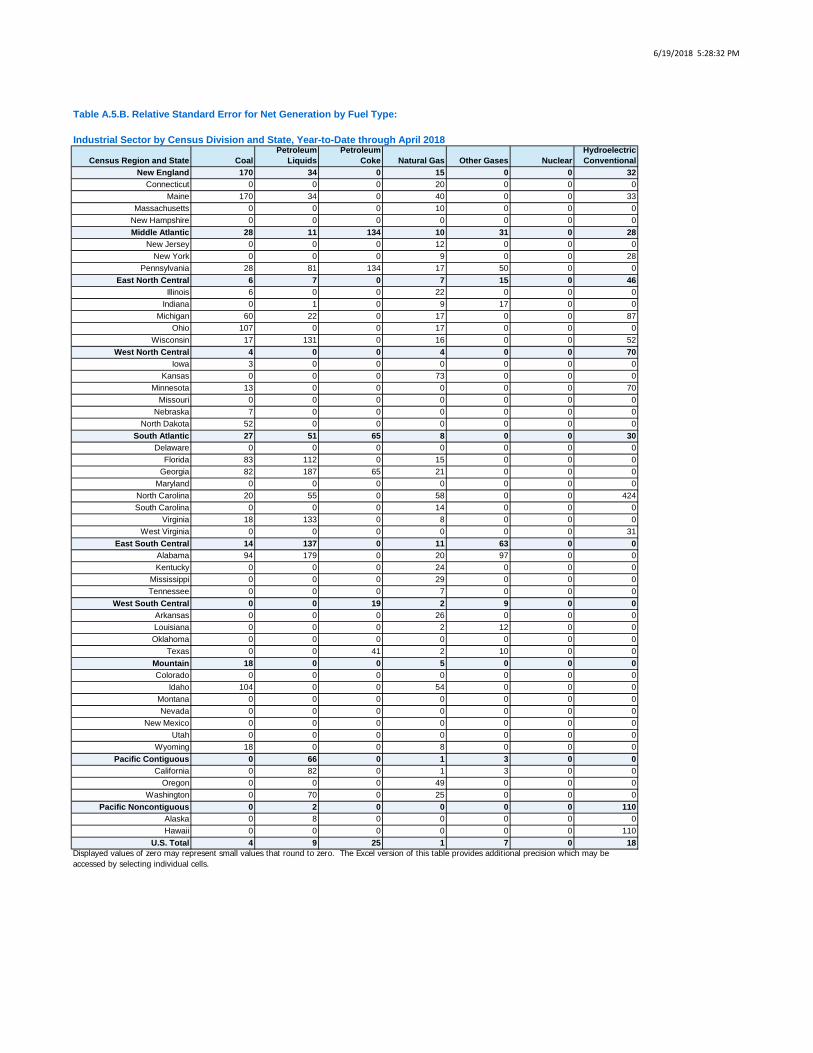
6/19/2018 5:28:32 PM
Census Region and State CoalPetroleum
LiquidsPetroleum
Coke Natural Gas Other Gases NuclearHydroelectric Conventional
New England 170 34 0 15 0 0 32Connecticut 0 0 0 20 0 0 0
Maine 170 34 0 40 0 0 33Massachusetts 0 0 0 10 0 0 0
New Hampshire 0 0 0 0 0 0 0Middle Atlantic 28 11 134 10 31 0 28
New Jersey 0 0 0 12 0 0 0New York 0 0 0 9 0 0 28
Pennsylvania 28 81 134 17 50 0 0East North Central 6 7 0 7 15 0 46
Illinois 6 0 0 22 0 0 0Indiana 0 1 0 9 17 0 0
Michigan 60 22 0 17 0 0 87Ohio 107 0 0 17 0 0 0
Wisconsin 17 131 0 16 0 0 52West North Central 4 0 0 4 0 0 70
Iowa 3 0 0 0 0 0 0Kansas 0 0 0 73 0 0 0
Minnesota 13 0 0 0 0 0 70Missouri 0 0 0 0 0 0 0
Nebraska 7 0 0 0 0 0 0North Dakota 52 0 0 0 0 0 0
South Atlantic 27 51 65 8 0 0 30Delaware 0 0 0 0 0 0 0
Florida 83 112 0 15 0 0 0Georgia 82 187 65 21 0 0 0
Maryland 0 0 0 0 0 0 0North Carolina 20 55 0 58 0 0 424South Carolina 0 0 0 14 0 0 0
Virginia 18 133 0 8 0 0 0West Virginia 0 0 0 0 0 0 31
East South Central 14 137 0 11 63 0 0Alabama 94 179 0 20 97 0 0Kentucky 0 0 0 24 0 0 0
Mississippi 0 0 0 29 0 0 0Tennessee 0 0 0 7 0 0 0
West South Central 0 0 19 2 9 0 0Arkansas 0 0 0 26 0 0 0Louisiana 0 0 0 2 12 0 0Oklahoma 0 0 0 0 0 0 0
Texas 0 0 41 2 10 0 0Mountain 18 0 0 5 0 0 0Colorado 0 0 0 0 0 0 0
Idaho 104 0 0 54 0 0 0Montana 0 0 0 0 0 0 0Nevada 0 0 0 0 0 0 0
New Mexico 0 0 0 0 0 0 0Utah 0 0 0 0 0 0 0
Wyoming 18 0 0 8 0 0 0Pacific Contiguous 0 66 0 1 3 0 0
California 0 82 0 1 3 0 0Oregon 0 0 0 49 0 0 0
Washington 0 70 0 25 0 0 0Pacific Noncontiguous 0 2 0 0 0 0 110
Alaska 0 8 0 0 0 0 0Hawaii 0 0 0 0 0 0 110
U.S. Total 4 9 25 1 7 0 18
Table A.5.B. Relative Standard Error for Net Generation by Fuel Type:
Industrial Sector by Census Division and State, Year-to-Date through April 2018
Displayed values of zero may represent small values that round to zero. The Excel version of this table provides additional precision which may be accessed by selecting individual cells.
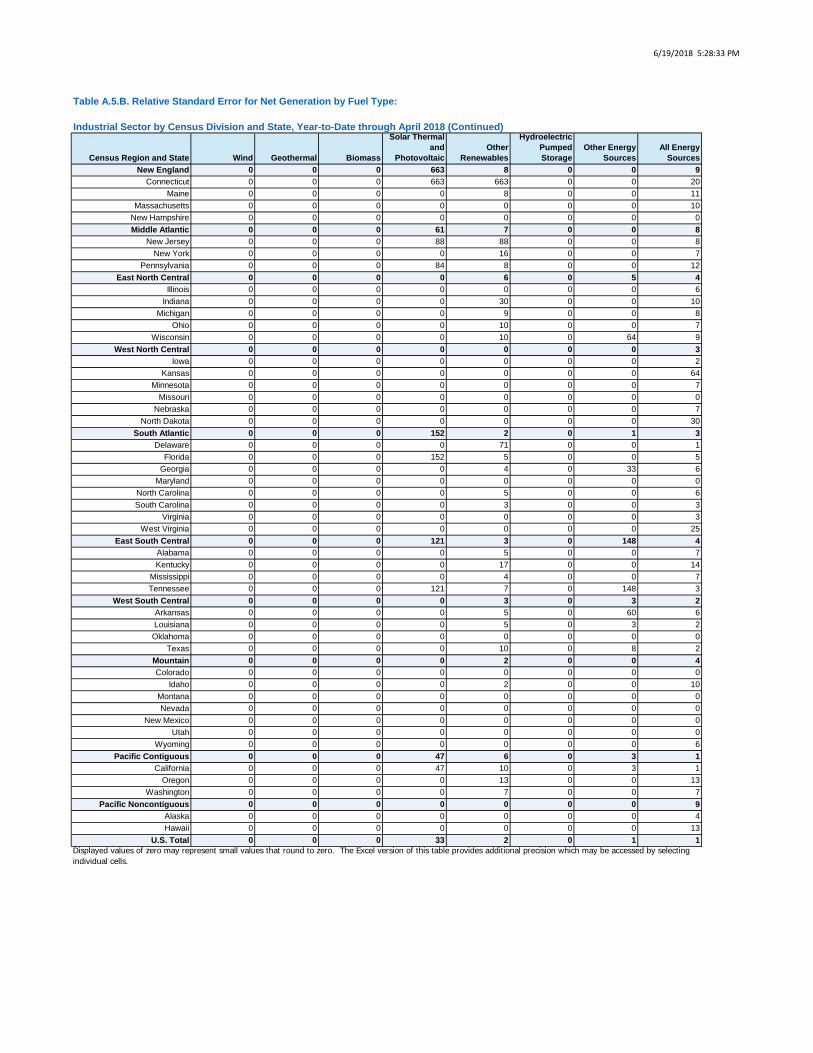
6/19/2018 5:28:33 PM
Census Region and State Wind Geothermal Biomass
Solar Thermal and
PhotovoltaicOther
Renewables
Hydroelectric Pumped Storage
Other Energy Sources
All Energy Sources
New England 0 0 0 663 8 0 0 9Connecticut 0 0 0 663 663 0 0 20
Maine 0 0 0 0 8 0 0 11Massachusetts 0 0 0 0 0 0 0 10
New Hampshire 0 0 0 0 0 0 0 0Middle Atlantic 0 0 0 61 7 0 0 8
New Jersey 0 0 0 88 88 0 0 8New York 0 0 0 0 16 0 0 7
Pennsylvania 0 0 0 84 8 0 0 12East North Central 0 0 0 0 6 0 5 4
Illinois 0 0 0 0 0 0 0 6Indiana 0 0 0 0 30 0 0 10
Michigan 0 0 0 0 9 0 0 8Ohio 0 0 0 0 10 0 0 7
Wisconsin 0 0 0 0 10 0 64 9West North Central 0 0 0 0 0 0 0 3
Iowa 0 0 0 0 0 0 0 2Kansas 0 0 0 0 0 0 0 64
Minnesota 0 0 0 0 0 0 0 7Missouri 0 0 0 0 0 0 0 0
Nebraska 0 0 0 0 0 0 0 7North Dakota 0 0 0 0 0 0 0 30
South Atlantic 0 0 0 152 2 0 1 3Delaware 0 0 0 0 71 0 0 1
Florida 0 0 0 152 5 0 0 5Georgia 0 0 0 0 4 0 33 6
Maryland 0 0 0 0 0 0 0 0North Carolina 0 0 0 0 5 0 0 6South Carolina 0 0 0 0 3 0 0 3
Virginia 0 0 0 0 0 0 0 3West Virginia 0 0 0 0 0 0 0 25
East South Central 0 0 0 121 3 0 148 4Alabama 0 0 0 0 5 0 0 7Kentucky 0 0 0 0 17 0 0 14
Mississippi 0 0 0 0 4 0 0 7Tennessee 0 0 0 121 7 0 148 3
West South Central 0 0 0 0 3 0 3 2Arkansas 0 0 0 0 5 0 60 6Louisiana 0 0 0 0 5 0 3 2Oklahoma 0 0 0 0 0 0 0 0
Texas 0 0 0 0 10 0 8 2Mountain 0 0 0 0 2 0 0 4Colorado 0 0 0 0 0 0 0 0
Idaho 0 0 0 0 2 0 0 10Montana 0 0 0 0 0 0 0 0Nevada 0 0 0 0 0 0 0 0
New Mexico 0 0 0 0 0 0 0 0Utah 0 0 0 0 0 0 0 0
Wyoming 0 0 0 0 0 0 0 6Pacific Contiguous 0 0 0 47 6 0 3 1
California 0 0 0 47 10 0 3 1Oregon 0 0 0 0 13 0 0 13
Washington 0 0 0 0 7 0 0 7Pacific Noncontiguous 0 0 0 0 0 0 0 9
Alaska 0 0 0 0 0 0 0 4Hawaii 0 0 0 0 0 0 0 13
U.S. Total 0 0 0 33 2 0 1 1
Table A.5.B. Relative Standard Error for Net Generation by Fuel Type:
Industrial Sector by Census Division and State, Year-to-Date through April 2018 (Continued)
Displayed values of zero may represent small values that round to zero. The Excel version of this table provides additional precision which may be accessed by selecting individual cells.

6/19/2018 5:28:35 PM
Census Region and State Residential Commercial Industrial Transportation TotalNew England 1 1 4 0 1
Connecticut 1 2 5 0 1Maine 1 2 2 0 1
Massachusetts 1 2 9 0 2New Hampshire 1 2 5 0 1
Rhode Island 0 0 0 0 0Vermont 3 7 7 0 4
Middle Atlantic 0 0 1 0 0New Jersey 0 1 3 0 0
New York 0 1 2 0 0Pennsylvania 0 1 1 0 0
East North Central 1 1 1 0 1Illinois 1 2 1 0 1
Indiana 2 4 2 0 1Michigan 1 2 3 0 1
Ohio 1 2 2 0 1Wisconsin 1 4 5 0 2
West North Central 1 2 3 0 1Iowa 2 8 5 0 3
Kansas 2 1 7 0 2Minnesota 2 5 6 0 3
Missouri 2 3 7 0 2Nebraska 2 8 9 0 4
North Dakota 2 4 9 0 4South Dakota 2 10 12 0 5
South Atlantic 0 0 2 0 0Delaware 1 4 8 0 2
District of Columbia 0 0 0 0 0Florida 1 0 5 0 1
Georgia 1 1 4 0 1Maryland 1 1 4 0 1
North Carolina 1 1 3 0 1South Carolina 2 1 3 0 1
Virginia 1 0 4 0 1West Virginia 0 1 0 0 0
East South Central 1 2 2 0 1Alabama 2 1 2 0 1Kentucky 2 4 4 0 2
Mississippi 2 1 5 0 2Tennessee 1 4 5 0 2
West South Central 1 1 1 0 1Arkansas 2 1 4 0 2Louisiana 2 1 1 0 1Oklahoma 2 1 4 0 2
Texas 2 1 2 0 1Mountain 0 2 2 0 1
Arizona 0 2 4 0 1Colorado 1 5 7 0 3
Idaho 1 5 4 0 2Montana 2 8 8 0 4Nevada 0 3 1 0 1
New Mexico 2 8 8 0 4Utah 1 5 3 0 2
Wyoming 2 8 4 0 3Pacific Contiguous 0 1 3 0 1
California 0 1 2 0 1Oregon 1 4 9 0 3
Washington 1 4 7 0 2Pacific Noncontiguous 1 5 4 0 2
Alaska 3 10 15 0 6Hawaii 0 0 0 0 0
U.S. Total 0 0 1 0 0
Table A.6.A. Relative Standard Error for Sales of Electricity to Ultimate Customersby End-Use Sector, Census Division, and State, April 2018
Displayed values of zero may represent small values that round to zero. The Excel version of this table provides additional precision which may be accessed by selecting individual cells.
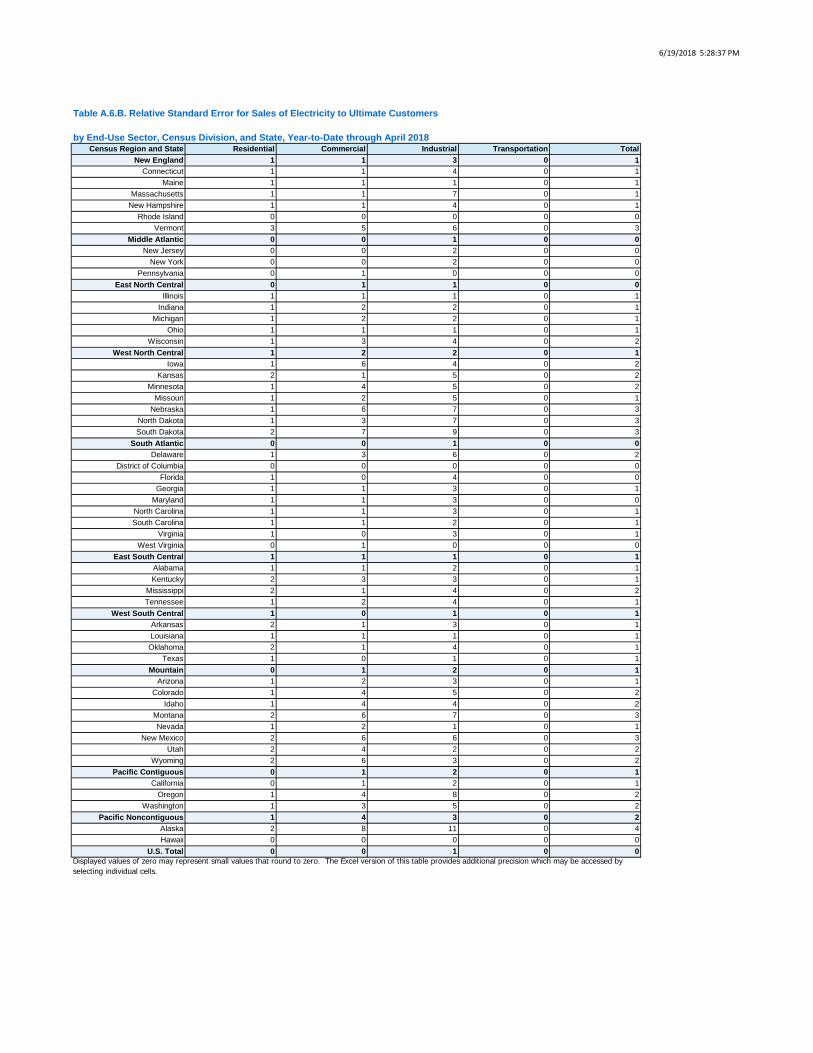
6/19/2018 5:28:37 PM
Census Region and State Residential Commercial Industrial Transportation TotalNew England 1 1 3 0 1
Connecticut 1 1 4 0 1Maine 1 1 1 0 1
Massachusetts 1 1 7 0 1New Hampshire 1 1 4 0 1
Rhode Island 0 0 0 0 0Vermont 3 5 6 0 3
Middle Atlantic 0 0 1 0 0New Jersey 0 0 2 0 0
New York 0 0 2 0 0Pennsylvania 0 1 0 0 0
East North Central 0 1 1 0 0Illinois 1 1 1 0 1
Indiana 1 2 2 0 1Michigan 1 2 2 0 1
Ohio 1 1 1 0 1Wisconsin 1 3 4 0 2
West North Central 1 2 2 0 1Iowa 1 6 4 0 2
Kansas 2 1 5 0 2Minnesota 1 4 5 0 2
Missouri 1 2 5 0 1Nebraska 1 6 7 0 3
North Dakota 1 3 7 0 3South Dakota 2 7 9 0 3
South Atlantic 0 0 1 0 0Delaware 1 3 6 0 2
District of Columbia 0 0 0 0 0Florida 1 0 4 0 0
Georgia 1 1 3 0 1Maryland 1 1 3 0 0
North Carolina 1 1 3 0 1South Carolina 1 1 2 0 1
Virginia 1 0 3 0 1West Virginia 0 1 0 0 0
East South Central 1 1 1 0 1Alabama 1 1 2 0 1Kentucky 2 3 3 0 1
Mississippi 2 1 4 0 2Tennessee 1 2 4 0 1
West South Central 1 0 1 0 1Arkansas 2 1 3 0 1Louisiana 1 1 1 0 1Oklahoma 2 1 4 0 1
Texas 1 0 1 0 1Mountain 0 1 2 0 1
Arizona 1 2 3 0 1Colorado 1 4 5 0 2
Idaho 1 4 4 0 2Montana 2 6 7 0 3Nevada 1 2 1 0 1
New Mexico 2 6 6 0 3Utah 2 4 2 0 2
Wyoming 2 6 3 0 2Pacific Contiguous 0 1 2 0 1
California 0 1 2 0 1Oregon 1 4 8 0 2
Washington 1 3 5 0 2Pacific Noncontiguous 1 4 3 0 2
Alaska 2 8 11 0 4Hawaii 0 0 0 0 0
U.S. Total 0 0 1 0 0
Table A.6.B. Relative Standard Error for Sales of Electricity to Ultimate Customers
by End-Use Sector, Census Division, and State, Year-to-Date through April 2018
Displayed values of zero may represent small values that round to zero. The Excel version of this table provides additional precision which may be accessed by selecting individual cells.
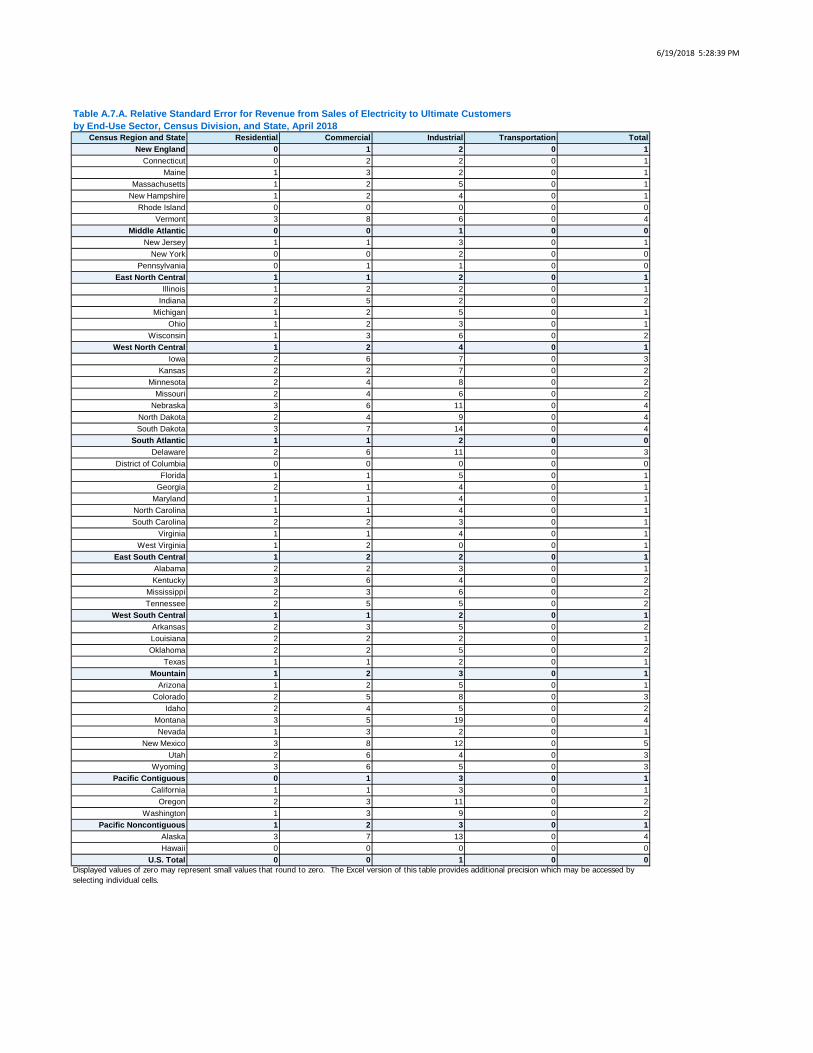
6/19/2018 5:28:39 PM
Census Region and State Residential Commercial Industrial Transportation TotalNew England 0 1 2 0 1
Connecticut 0 2 2 0 1Maine 1 3 2 0 1
Massachusetts 1 2 5 0 1New Hampshire 1 2 4 0 1
Rhode Island 0 0 0 0 0Vermont 3 8 6 0 4
Middle Atlantic 0 0 1 0 0New Jersey 1 1 3 0 1
New York 0 0 2 0 0Pennsylvania 0 1 1 0 0
East North Central 1 1 2 0 1Illinois 1 2 2 0 1
Indiana 2 5 2 0 2Michigan 1 2 5 0 1
Ohio 1 2 3 0 1Wisconsin 1 3 6 0 2
West North Central 1 2 4 0 1Iowa 2 6 7 0 3
Kansas 2 2 7 0 2Minnesota 2 4 8 0 2
Missouri 2 4 6 0 2Nebraska 3 6 11 0 4
North Dakota 2 4 9 0 4South Dakota 3 7 14 0 4
South Atlantic 1 1 2 0 0Delaware 2 6 11 0 3
District of Columbia 0 0 0 0 0Florida 1 1 5 0 1
Georgia 2 1 4 0 1Maryland 1 1 4 0 1
North Carolina 1 1 4 0 1South Carolina 2 2 3 0 1
Virginia 1 1 4 0 1West Virginia 1 2 0 0 1
East South Central 1 2 2 0 1Alabama 2 2 3 0 1Kentucky 3 6 4 0 2
Mississippi 2 3 6 0 2Tennessee 2 5 5 0 2
West South Central 1 1 2 0 1Arkansas 2 3 5 0 2Louisiana 2 2 2 0 1Oklahoma 2 2 5 0 2
Texas 1 1 2 0 1Mountain 1 2 3 0 1
Arizona 1 2 5 0 1Colorado 2 5 8 0 3
Idaho 2 4 5 0 2Montana 3 5 19 0 4Nevada 1 3 2 0 1
New Mexico 3 8 12 0 5Utah 2 6 4 0 3
Wyoming 3 6 5 0 3Pacific Contiguous 0 1 3 0 1
California 1 1 3 0 1Oregon 2 3 11 0 2
Washington 1 3 9 0 2Pacific Noncontiguous 1 2 3 0 1
Alaska 3 7 13 0 4Hawaii 0 0 0 0 0
U.S. Total 0 0 1 0 0
Table A.7.A. Relative Standard Error for Revenue from Sales of Electricity to Ultimate Customersby End-Use Sector, Census Division, and State, April 2018
Displayed values of zero may represent small values that round to zero. The Excel version of this table provides additional precision which may be accessed by selecting individual cells.

6/19/2018 5:28:40 PM
Census Region and State Residential Commercial Industrial Transportation TotalNew England 0 1 2 0 0
Connecticut 0 1 2 0 1Maine 1 1 1 0 1
Massachusetts 1 1 4 0 1New Hampshire 1 1 3 0 1
Rhode Island 0 0 0 0 0Vermont 3 5 5 0 2
Middle Atlantic 0 0 1 0 0New Jersey 1 1 2 0 0
New York 0 0 1 0 0Pennsylvania 0 1 1 0 0
East North Central 1 1 1 0 0Illinois 1 1 2 0 1
Indiana 2 3 1 0 1Michigan 1 1 3 0 1
Ohio 1 1 2 0 1Wisconsin 1 2 5 0 1
West North Central 1 1 3 0 1Iowa 2 5 6 0 2
Kansas 2 2 5 0 1Minnesota 2 3 6 0 2
Missouri 2 3 5 0 2Nebraska 2 5 9 0 3
North Dakota 2 3 7 0 3South Dakota 2 6 11 0 3
South Atlantic 1 0 1 0 0Delaware 2 4 8 0 2
District of Columbia 0 0 0 0 0Florida 1 1 4 0 1
Georgia 2 1 3 0 1Maryland 1 1 3 0 0
North Carolina 1 1 3 0 1South Carolina 1 1 3 0 1
Virginia 1 1 3 0 1West Virginia 0 1 0 0 0
East South Central 1 2 2 0 1Alabama 1 1 2 0 1Kentucky 2 4 3 0 2
Mississippi 2 2 4 0 2Tennessee 2 3 4 0 1
West South Central 1 1 1 0 1Arkansas 2 2 3 0 1Louisiana 2 1 1 0 1Oklahoma 2 2 4 0 1
Texas 1 1 2 0 1Mountain 1 1 2 0 1
Arizona 1 2 4 0 1Colorado 2 4 6 0 2
Idaho 1 3 5 0 1Montana 2 4 15 0 3Nevada 1 3 2 0 1
New Mexico 3 6 10 0 4Utah 2 5 3 0 2
Wyoming 2 5 4 0 2Pacific Contiguous 0 1 2 0 0
California 0 1 2 0 0Oregon 1 3 9 0 2
Washington 1 2 8 0 1Pacific Noncontiguous 1 2 2 0 1
Alaska 2 5 10 0 3Hawaii 0 0 0 0 0
U.S. Total 0 0 1 0 0
Table A.7.B. Relative Standard Error for Revenue from Sales of Electricity to Ultimate Customers
by End-Use Sector, Census Division, and State, Year-to-Date through April 2018
Displayed values of zero may represent small values that round to zero. The Excel version of this table provides additional precision which may be accessed by selecting individual cells.

6/19/2018 5:28:42 PM
Census Region and State Residential Commercial Industrial Transportation TotalNew England 0 0 2 0 0
Connecticut 0 1 3 0 1Maine 1 1 1 0 0
Massachusetts 1 0 4 0 1New Hampshire 1 0 1 0 1
Rhode Island 0 0 0 0 0Vermont 2 2 3 0 2
Middle Atlantic 0 0 1 0 0New Jersey 0 0 1 0 0
New York 0 0 1 0 0Pennsylvania 0 0 1 0 0
East North Central 0 0 1 0 0Illinois 1 1 1 0 1
Indiana 1 1 1 0 1Michigan 0 1 2 0 1
Ohio 1 0 1 0 1Wisconsin 1 1 3 0 1
West North Central 1 1 2 0 1Iowa 1 3 3 0 1
Kansas 2 2 4 0 1Minnesota 1 2 4 0 1
Missouri 1 2 2 0 1Nebraska 2 2 5 0 2
North Dakota 1 1 3 0 1South Dakota 2 3 5 0 2
South Atlantic 0 0 1 0 0Delaware 1 3 4 0 1
District of Columbia 0 0 0 0 0Florida 1 1 3 0 0
Georgia 1 1 2 0 1Maryland 0 0 1 0 0
North Carolina 1 1 2 0 1South Carolina 1 1 2 0 1
Virginia 1 1 2 0 1West Virginia 0 1 0 0 0
East South Central 1 1 1 0 1Alabama 1 2 1 0 1Kentucky 2 2 1 0 1
Mississippi 2 2 3 0 1Tennessee 1 2 2 0 1
West South Central 1 1 1 0 0Arkansas 2 3 2 0 1Louisiana 1 1 1 0 1Oklahoma 1 2 3 0 1
Texas 1 1 1 0 1Mountain 0 1 1 0 0
Arizona 0 1 2 0 0Colorado 1 1 3 0 1
Idaho 1 2 2 0 1Montana 2 3 12 0 2Nevada 0 1 1 0 1
New Mexico 2 2 6 0 2Utah 2 2 2 0 1
Wyoming 2 3 2 0 1Pacific Contiguous 0 1 1 0 0
California 0 0 1 0 0Oregon 1 2 4 0 1
Washington 1 2 3 0 1Pacific Noncontiguous 1 3 2 0 1
Alaska 2 5 6 0 3Hawaii 0 0 0 0 0
U.S. Total 0 0 0 0 0
Table A.8.A. Relative Standard Error for Average Price of Electricity to Ultimate Customersby End-Use Sector, Census Division, and State, April 2018
Displayed values of zero may represent small values that round to zero. The Excel version of this table provides additional precision which may be accessed by selecting individual cells.
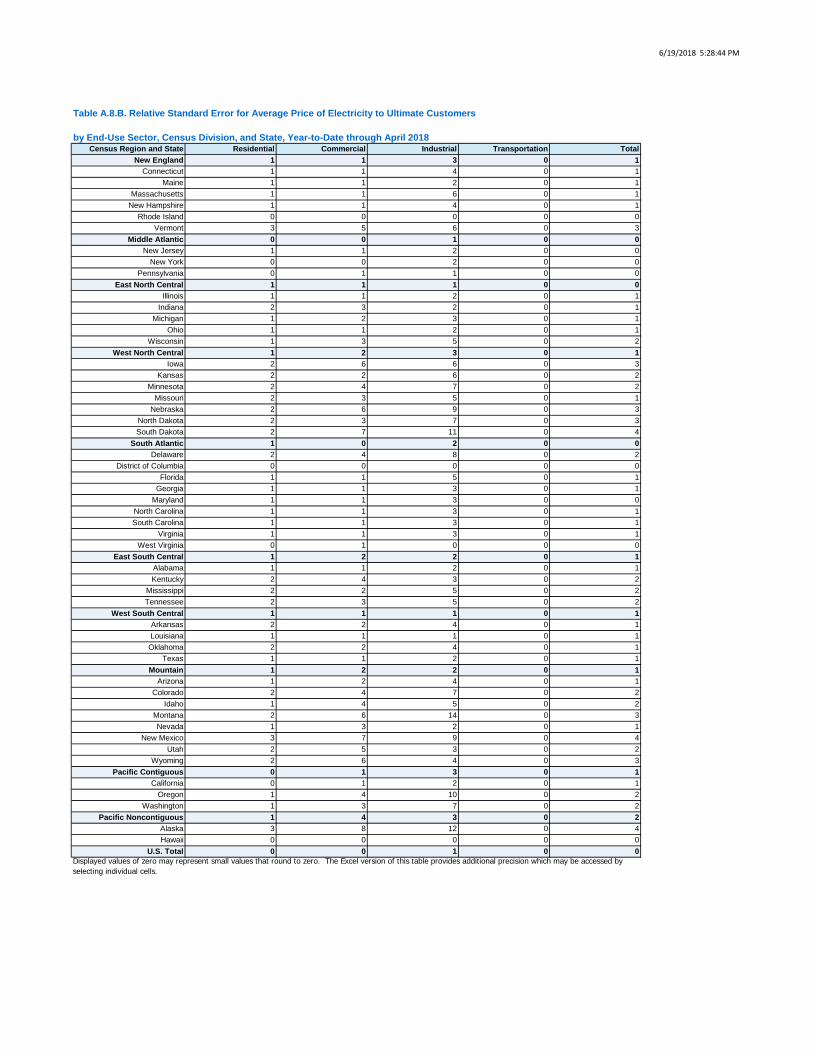
6/19/2018 5:28:44 PM
Census Region and State Residential Commercial Industrial Transportation TotalNew England 1 1 3 0 1
Connecticut 1 1 4 0 1Maine 1 1 2 0 1
Massachusetts 1 1 6 0 1New Hampshire 1 1 4 0 1
Rhode Island 0 0 0 0 0Vermont 3 5 6 0 3
Middle Atlantic 0 0 1 0 0New Jersey 1 1 2 0 0
New York 0 0 2 0 0Pennsylvania 0 1 1 0 0
East North Central 1 1 1 0 0Illinois 1 1 2 0 1
Indiana 2 3 2 0 1Michigan 1 2 3 0 1
Ohio 1 1 2 0 1Wisconsin 1 3 5 0 2
West North Central 1 2 3 0 1Iowa 2 6 6 0 3
Kansas 2 2 6 0 2Minnesota 2 4 7 0 2
Missouri 2 3 5 0 1Nebraska 2 6 9 0 3
North Dakota 2 3 7 0 3South Dakota 2 7 11 0 4
South Atlantic 1 0 2 0 0Delaware 2 4 8 0 2
District of Columbia 0 0 0 0 0Florida 1 1 5 0 1
Georgia 1 1 3 0 1Maryland 1 1 3 0 0
North Carolina 1 1 3 0 1South Carolina 1 1 3 0 1
Virginia 1 1 3 0 1West Virginia 0 1 0 0 0
East South Central 1 2 2 0 1Alabama 1 1 2 0 1Kentucky 2 4 3 0 2
Mississippi 2 2 5 0 2Tennessee 2 3 5 0 2
West South Central 1 1 1 0 1Arkansas 2 2 4 0 1Louisiana 1 1 1 0 1Oklahoma 2 2 4 0 1
Texas 1 1 2 0 1Mountain 1 2 2 0 1
Arizona 1 2 4 0 1Colorado 2 4 7 0 2
Idaho 1 4 5 0 2Montana 2 6 14 0 3Nevada 1 3 2 0 1
New Mexico 3 7 9 0 4Utah 2 5 3 0 2
Wyoming 2 6 4 0 3Pacific Contiguous 0 1 3 0 1
California 0 1 2 0 1Oregon 1 4 10 0 2
Washington 1 3 7 0 2Pacific Noncontiguous 1 4 3 0 2
Alaska 3 8 12 0 4Hawaii 0 0 0 0 0
U.S. Total 0 0 1 0 0
Table A.8.B. Relative Standard Error for Average Price of Electricity to Ultimate Customers
by End-Use Sector, Census Division, and State, Year-to-Date through April 2018
Displayed values of zero may represent small values that round to zero. The Excel version of this table provides additional precision which may be accessed by selecting individual cells.
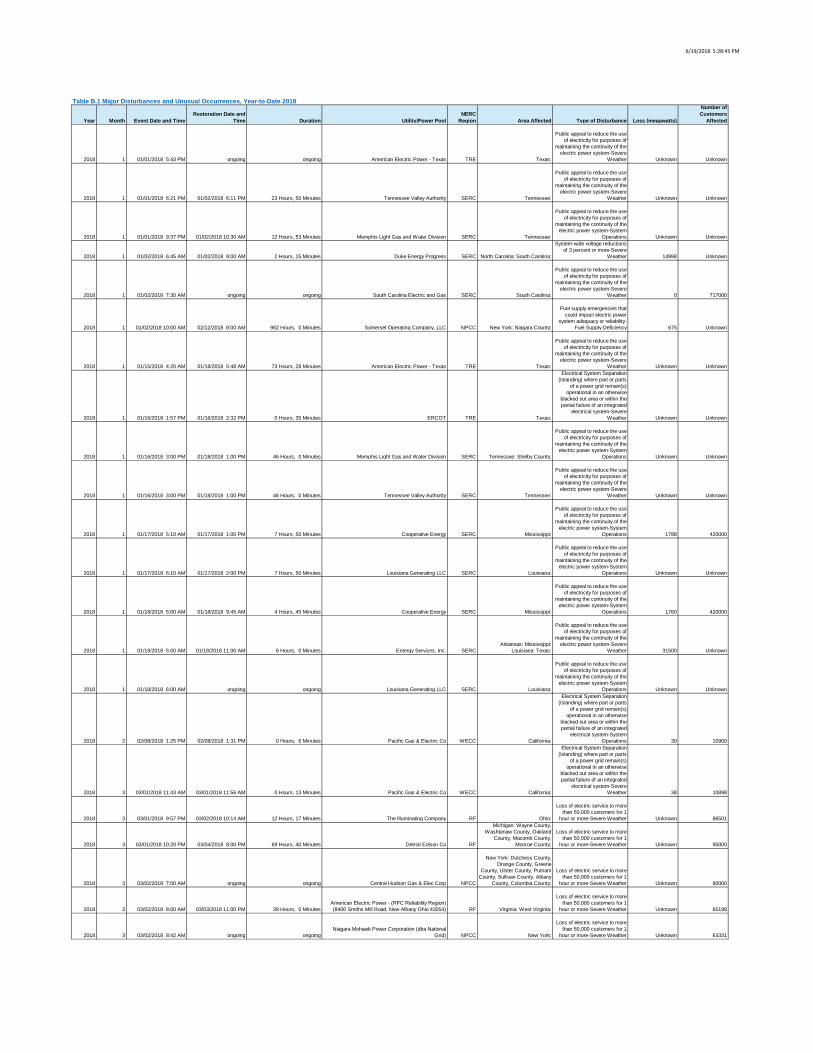
6/19/2018 5:28:45 PM
Table B.1 Major Disturbances and Unusual Occurrences, Year-to-Date 2018
Year Month Event Date and TimeRestoration Date and
Time Duration Utility/Power PoolNERC
Region Area Affected Type of Disturbance Loss (megawatts)
Number of Customers
Affected
2018 1 01/01/2018 5:43 PM ongoing ongoing American Electric Power - Texas TRE Texas:
Public appeal to reduce the use of electricity for purposes of
maintaining the continuity of the electric power system-Severe
Weather Unknown Unknown
2018 1 01/01/2018 6:21 PM 01/02/2018 6:11 PM 23 Hours, 50 Minutes Tennessee Valley Authority SERC Tennessee:
Public appeal to reduce the use of electricity for purposes of
maintaining the continuity of the electric power system-Severe
Weather Unknown Unknown
2018 1 01/01/2018 9:37 PM 01/02/2018 10:30 AM 12 Hours, 53 Minutes Memphis Light Gas and Water Division SERC Tennessee:
Public appeal to reduce the use of electricity for purposes of
maintaining the continuity of the electric power system-System
Operations Unknown Unknown
2018 1 01/02/2018 6:45 AM 01/02/2018 9:00 AM 2 Hours, 15 Minutes Duke Energy Progress SERC North Carolina: South Carolina:
System-wide voltage reductions of 3 percent or more-Severe
Weather 14998 Unknown
2018 1 01/02/2018 7:30 AM ongoing ongoing South Carolina Electric and Gas SERC South Carolina:
Public appeal to reduce the use of electricity for purposes of
maintaining the continuity of the electric power system-Severe
Weather 0 717000
2018 1 01/02/2018 10:00 AM 02/12/2018 8:00 AM 982 Hours, 0 Minutes Somerset Operating Company, LLC NPCC New York: Niagara County;
Fuel supply emergencies that could impact electric power
system adequacy or reliability-Fuel Supply Deficiency 675 Unknown
2018 1 01/15/2018 4:20 AM 01/18/2018 5:48 AM 73 Hours, 28 Minutes American Electric Power - Texas TRE Texas:
Public appeal to reduce the use of electricity for purposes of
maintaining the continuity of the electric power system-Severe
Weather Unknown Unknown
2018 1 01/16/2018 1:57 PM 01/16/2018 2:32 PM 0 Hours, 35 Minutes ERCOT TRE Texas:
Electrical System Separation (Islanding) where part or parts
of a power grid remain(s) operational in an otherwise
blacked out area or within the partial failure of an integrated
electrical system-Severe Weather Unknown Unknown
2018 1 01/16/2018 3:00 PM 01/18/2018 1:00 PM 46 Hours, 0 Minutes Memphis Light Gas and Water Division SERC Tennessee: Shelby County;
Public appeal to reduce the use of electricity for purposes of
maintaining the continuity of the electric power system-System
Operations Unknown Unknown
2018 1 01/16/2018 3:00 PM 01/18/2018 1:00 PM 46 Hours, 0 Minutes Tennessee Valley Authority SERC Tennessee:
Public appeal to reduce the use of electricity for purposes of
maintaining the continuity of the electric power system-Severe
Weather Unknown Unknown
2018 1 01/17/2018 5:10 AM 01/17/2018 1:00 PM 7 Hours, 50 Minutes Cooperative Energy SERC Mississippi:
Public appeal to reduce the use of electricity for purposes of
maintaining the continuity of the electric power system-System
Operations 1788 420000
2018 1 01/17/2018 6:10 AM 01/17/2018 2:00 PM 7 Hours, 50 Minutes Louisiana Generating LLC SERC Louisiana:
Public appeal to reduce the use of electricity for purposes of
maintaining the continuity of the electric power system-System
Operations Unknown Unknown
2018 1 01/18/2018 5:00 AM 01/18/2018 9:45 AM 4 Hours, 45 Minutes Cooperative Energy SERC Mississippi:
Public appeal to reduce the use of electricity for purposes of
maintaining the continuity of the electric power system-System
Operations 1760 420000
2018 1 01/18/2018 5:00 AM 01/18/2018 11:00 AM 6 Hours, 0 Minutes Entergy Services, Inc. SERCArkansas: Mississippi:
Louisiana: Texas:
Public appeal to reduce the use of electricity for purposes of
maintaining the continuity of the electric power system-Severe
Weather 31500 Unknown
2018 1 01/18/2018 6:00 AM ongoing ongoing Louisiana Generating LLC SERC Louisiana:
Public appeal to reduce the use of electricity for purposes of
maintaining the continuity of the electric power system-System
Operations Unknown Unknown
2018 2 02/08/2018 1:25 PM 02/08/2018 1:31 PM 0 Hours, 6 Minutes Pacific Gas & Electric Co WECC California:
Electrical System Separation (Islanding) where part or parts
of a power grid remain(s) operational in an otherwise
blacked out area or within the partial failure of an integrated
electrical system-System Operations 30 10900
2018 3 03/01/2018 11:43 AM 03/01/2018 11:56 AM 0 Hours, 13 Minutes Pacific Gas & Electric Co WECC California:
Electrical System Separation (Islanding) where part or parts
of a power grid remain(s) operational in an otherwise
blacked out area or within the partial failure of an integrated
electrical system-Severe Weather 38 10898
2018 3 03/01/2018 9:57 PM 03/02/2018 10:14 AM 12 Hours, 17 Minutes The Illuminating Company RF Ohio:
Loss of electric service to more than 50,000 customers for 1
hour or more-Severe Weather Unknown 86501
2018 3 03/01/2018 10:20 PM 03/04/2018 8:00 PM 69 Hours, 40 Minutes Detroit Edison Co RF
Michigan: Wayne County, Washtenaw County, Oakland
County, Macomb County, Monroe County;
Loss of electric service to more than 50,000 customers for 1
hour or more-Severe Weather Unknown 95000
2018 3 03/02/2018 7:00 AM ongoing ongoing Central Hudson Gas & Elec Corp NPCC
New York: Dutchess County, Orange County, Greene
County, Ulster County, Putnam County, Sullivan County, Albany
County, Columbia County;
Loss of electric service to more than 50,000 customers for 1
hour or more-Severe Weather Unknown 90000
2018 3 03/02/2018 8:00 AM 03/03/2018 11:00 PM 39 Hours, 0 MinutesAmerican Electric Power - (RFC Reliability Region) (8400 Smiths Mill Road, New Albany Ohio 43054) RF Virginia: West Virginia:
Loss of electric service to more than 50,000 customers for 1
hour or more-Severe Weather Unknown 65198
2018 3 03/02/2018 8:42 AM ongoing ongoingNiagara Mohawk Power Corporation (dba National
Grid) NPCC New York:
Loss of electric service to more than 50,000 customers for 1
hour or more-Severe Weather Unknown 63331
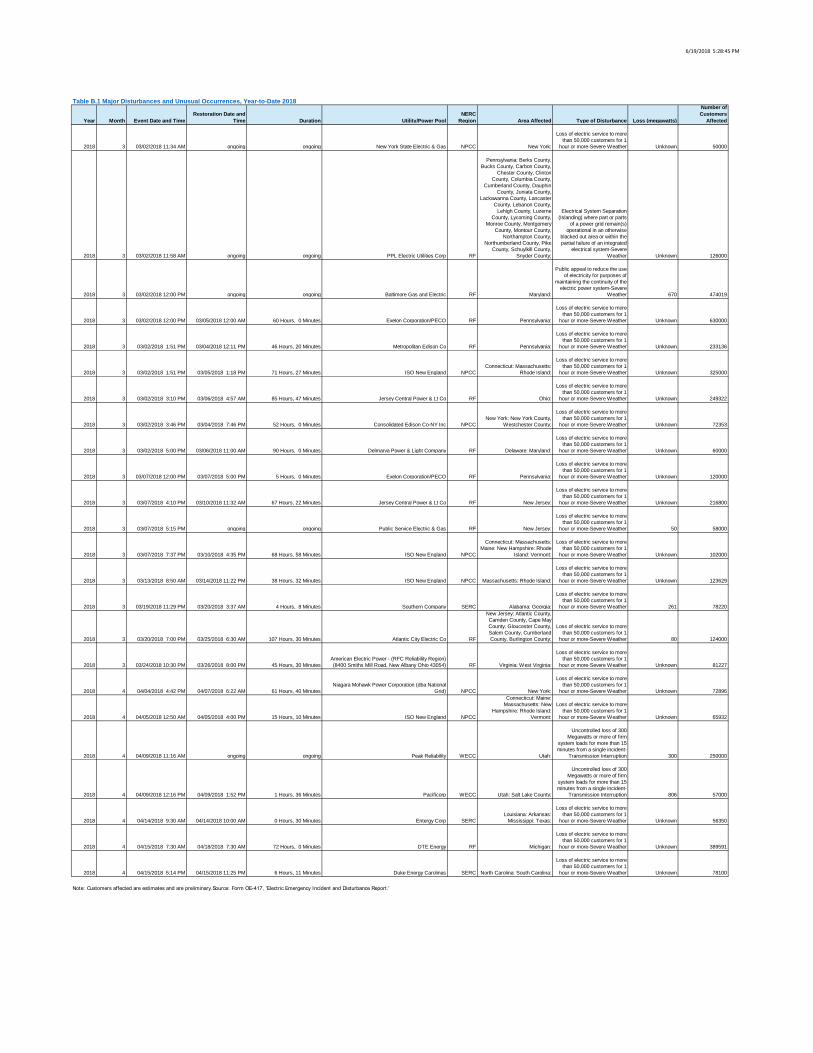
6/19/2018 5:28:45 PM
Table B.1 Major Disturbances and Unusual Occurrences, Year-to-Date 2018
Year Month Event Date and TimeRestoration Date and
Time Duration Utility/Power PoolNERC
Region Area Affected Type of Disturbance Loss (megawatts)
Number of Customers
Affected
2018 3 03/02/2018 11:34 AM ongoing ongoing New York State Electric & Gas NPCC New York:
Loss of electric service to more than 50,000 customers for 1
hour or more-Severe Weather Unknown 50000
2018 3 03/02/2018 11:58 AM ongoing ongoing PPL Electric Utilities Corp RF
Pennsylvania: Berks County, Bucks County, Carbon County,
Chester County, Clinton County, Columbia County,
Cumberland County, Dauphin County, Juniata County,
Lackawanna County, Lancaster County, Lebanon County,
Lehigh County, Luzerne County, Lycoming County,
Monroe County, Montgomery County, Montour County,
Northampton County, Northumberland County, Pike
County, Schuylkill County, Snyder County;
Electrical System Separation (Islanding) where part or parts
of a power grid remain(s) operational in an otherwise
blacked out area or within the partial failure of an integrated
electrical system-Severe Weather Unknown 126000
2018 3 03/02/2018 12:00 PM ongoing ongoing Baltimore Gas and Electric RF Maryland:
Public appeal to reduce the use of electricity for purposes of
maintaining the continuity of the electric power system-Severe
Weather 670 474019
2018 3 03/02/2018 12:00 PM 03/05/2018 12:00 AM 60 Hours, 0 Minutes Exelon Corporation/PECO RF Pennsylvania:
Loss of electric service to more than 50,000 customers for 1
hour or more-Severe Weather Unknown 630000
2018 3 03/02/2018 1:51 PM 03/04/2018 12:11 PM 46 Hours, 20 Minutes Metropolitan Edison Co RF Pennsylvania:
Loss of electric service to more than 50,000 customers for 1
hour or more-Severe Weather Unknown 233136
2018 3 03/02/2018 1:51 PM 03/05/2018 1:18 PM 71 Hours, 27 Minutes ISO New England NPCCConnecticut: Massachusetts:
Rhode Island:
Loss of electric service to more than 50,000 customers for 1
hour or more-Severe Weather Unknown 325000
2018 3 03/02/2018 3:10 PM 03/06/2018 4:57 AM 85 Hours, 47 Minutes Jersey Central Power & Lt Co RF Ohio:
Loss of electric service to more than 50,000 customers for 1
hour or more-Severe Weather Unknown 249322
2018 3 03/02/2018 3:46 PM 03/04/2018 7:46 PM 52 Hours, 0 Minutes Consolidated Edison Co-NY Inc NPCCNew York: New York County,
Westchester County;
Loss of electric service to more than 50,000 customers for 1
hour or more-Severe Weather Unknown 72353
2018 3 03/02/2018 5:00 PM 03/06/2018 11:00 AM 90 Hours, 0 Minutes Delmarva Power & Light Company RF Delaware: Maryland:
Loss of electric service to more than 50,000 customers for 1
hour or more-Severe Weather Unknown 60000
2018 3 03/07/2018 12:00 PM 03/07/2018 5:00 PM 5 Hours, 0 Minutes Exelon Corporation/PECO RF Pennsylvania:
Loss of electric service to more than 50,000 customers for 1
hour or more-Severe Weather Unknown 120000
2018 3 03/07/2018 4:10 PM 03/10/2018 11:32 AM 67 Hours, 22 Minutes Jersey Central Power & Lt Co RF New Jersey:
Loss of electric service to more than 50,000 customers for 1
hour or more-Severe Weather Unknown 216800
2018 3 03/07/2018 5:15 PM ongoing ongoing Public Service Electric & Gas RF New Jersey:
Loss of electric service to more than 50,000 customers for 1
hour or more-Severe Weather 50 58000
2018 3 03/07/2018 7:37 PM 03/10/2018 4:35 PM 68 Hours, 58 Minutes ISO New England NPCC
Connecticut: Massachusetts: Maine: New Hampshire: Rhode
Island: Vermont:
Loss of electric service to more than 50,000 customers for 1
hour or more-Severe Weather Unknown 102000
2018 3 03/13/2018 8:50 AM 03/14/2018 11:22 PM 38 Hours, 32 Minutes ISO New England NPCC Massachusetts: Rhode Island:
Loss of electric service to more than 50,000 customers for 1
hour or more-Severe Weather Unknown 123629
2018 3 03/19/2018 11:29 PM 03/20/2018 3:37 AM 4 Hours, 8 Minutes Southern Company SERC Alabama: Georgia:
Loss of electric service to more than 50,000 customers for 1
hour or more-Severe Weather 261 78220
2018 3 03/20/2018 7:00 PM 03/25/2018 6:30 AM 107 Hours, 30 Minutes Atlantic City Electric Co RF
New Jersey: Atlantic County, Camden County, Cape May County, Gloucester County, Salem County, Cumberland County, Burlington County;
Loss of electric service to more than 50,000 customers for 1
hour or more-Severe Weather 80 124000
2018 3 03/24/2018 10:30 PM 03/26/2018 8:00 PM 45 Hours, 30 MinutesAmerican Electric Power - (RFC Reliability Region) (8400 Smiths Mill Road, New Albany Ohio 43054) RF Virginia: West Virginia:
Loss of electric service to more than 50,000 customers for 1
hour or more-Severe Weather Unknown 81227
2018 4 04/04/2018 4:42 PM 04/07/2018 6:22 AM 61 Hours, 40 MinutesNiagara Mohawk Power Corporation (dba National
Grid) NPCC New York:
Loss of electric service to more than 50,000 customers for 1
hour or more-Severe Weather Unknown 72896
2018 4 04/05/2018 12:50 AM 04/05/2018 4:00 PM 15 Hours, 10 Minutes ISO New England NPCC
Connecticut: Maine: Massachusetts: New
Hampshire: Rhode Island: Vermont:
Loss of electric service to more than 50,000 customers for 1
hour or more-Severe Weather Unknown 65932
2018 4 04/09/2018 11:16 AM ongoing ongoing Peak Reliability WECC Utah:
Uncontrolled loss of 300 Megawatts or more of firm
system loads for more than 15 minutes from a single incident-
Transmission Interruption 300 250000
2018 4 04/09/2018 12:16 PM 04/09/2018 1:52 PM 1 Hours, 36 Minutes Pacificorp WECC Utah: Salt Lake County;
Uncontrolled loss of 300 Megawatts or more of firm
system loads for more than 15 minutes from a single incident-
Transmission Interruption 806 57000
2018 4 04/14/2018 9:30 AM 04/14/2018 10:00 AM 0 Hours, 30 Minutes Entergy Corp SERCLouisiana: Arkansas:
Mississippi: Texas:
Loss of electric service to more than 50,000 customers for 1
hour or more-Severe Weather Unknown 56350
2018 4 04/15/2018 7:30 AM 04/18/2018 7:30 AM 72 Hours, 0 Minutes DTE Energy RF Michigan:
Loss of electric service to more than 50,000 customers for 1
hour or more-Severe Weather Unknown 389591
2018 4 04/15/2018 5:14 PM 04/15/2018 11:25 PM 6 Hours, 11 Minutes Duke Energy Carolinas SERC North Carolina: South Carolina:
Loss of electric service to more than 50,000 customers for 1
hour or more-Severe Weather Unknown 78100
Note: Customers affected are estimates and are preliminary.Source: Form OE-417, 'Electric Emergency Incident and Disturbance Report.'
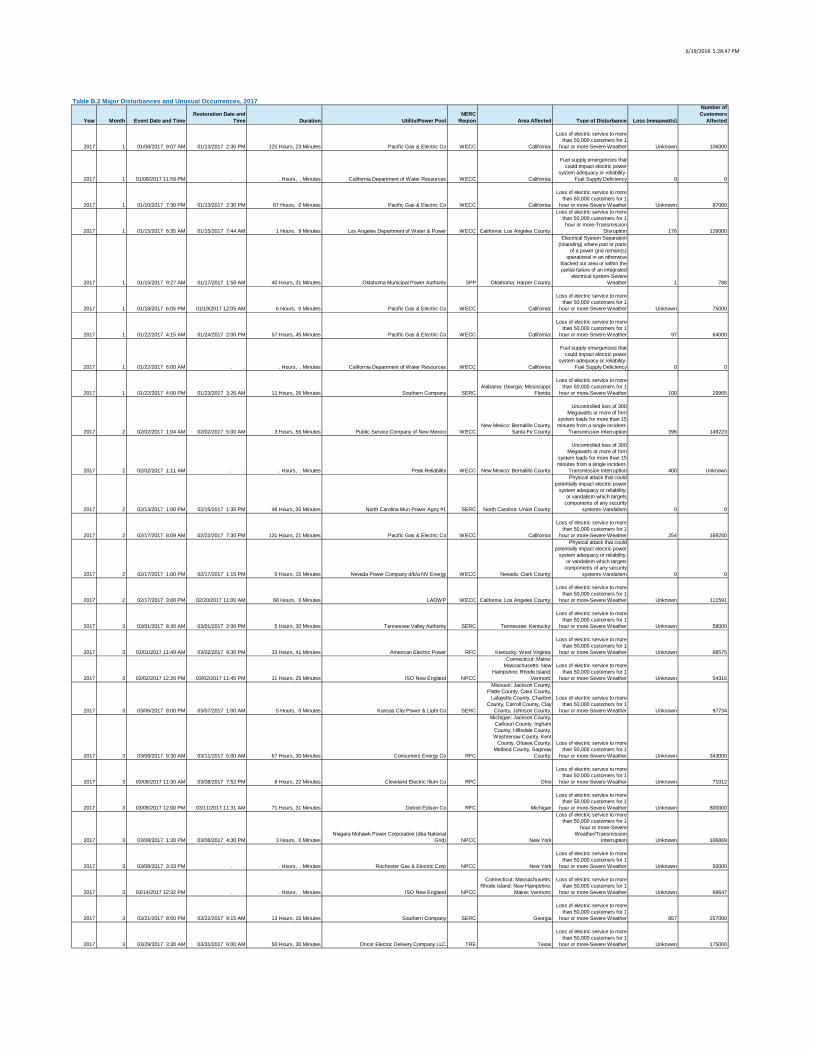
6/19/2018 5:28:47 PM
Table B.2 Major Disturbances and Unusual Occurrences, 2017
Year Month Event Date and TimeRestoration Date and
Time Duration Utility/Power PoolNERC
Region Area Affected Type of Disturbance Loss (megawatts)
Number of Customers
Affected
2017 1 01/08/2017 9:07 AM 01/13/2017 2:30 PM 125 Hours, 23 Minutes Pacific Gas & Electric Co WECC California:
Loss of electric service to more than 50,000 customers for 1
hour or more-Severe Weather Unknown 106000
2017 1 01/08/2017 11:59 PM . . . Hours, . Minutes California Department of Water Resources WECC California:
Fuel supply emergencies that could impact electric power
system adequacy or reliability-Fuel Supply Deficiency 0 0
2017 1 01/10/2017 7:30 PM 01/13/2017 2:30 PM 67 Hours, 0 Minutes Pacific Gas & Electric Co WECC California:
Loss of electric service to more than 50,000 customers for 1
hour or more-Severe Weather Unknown 87000
2017 1 01/15/2017 6:35 AM 01/15/2017 7:44 AM 1 Hours, 9 Minutes Los Angeles Department of Water & Power WECC California: Los Angeles County;
Loss of electric service to more than 50,000 customers for 1 hour or more-Transmission
Disruption 176 126000
2017 1 01/15/2017 9:27 AM 01/17/2017 1:58 AM 40 Hours, 31 Minutes Oklahoma Municipal Power Authority SPP Oklahoma: Harper County;
Electrical System Separation (Islanding) where part or parts
of a power grid remain(s) operational in an otherwise
blacked out area or within the partial failure of an integrated
electrical system-Severe Weather 1 788
2017 1 01/18/2017 6:05 PM 01/19/2017 12:05 AM 6 Hours, 0 Minutes Pacific Gas & Electric Co WECC California:
Loss of electric service to more than 50,000 customers for 1
hour or more-Severe Weather Unknown 75000
2017 1 01/22/2017 4:15 AM 01/24/2017 2:00 PM 57 Hours, 45 Minutes Pacific Gas & Electric Co WECC California:
Loss of electric service to more than 50,000 customers for 1
hour or more-Severe Weather 97 64000
2017 1 01/22/2017 6:00 AM . . . Hours, . Minutes California Department of Water Resources WECC California:
Fuel supply emergencies that could impact electric power
system adequacy or reliability-Fuel Supply Deficiency 0 0
2017 1 01/22/2017 4:00 PM 01/23/2017 3:26 AM 11 Hours, 26 Minutes Southern Company SERCAlabama: Georgia: Mississippi:
Florida:
Loss of electric service to more than 50,000 customers for 1
hour or more-Severe Weather 100 29965
2017 2 02/02/2017 1:04 AM 02/02/2017 5:00 AM 3 Hours, 56 Minutes Public Service Company of New Mexico WECCNew Mexico: Bernalillo County,
Santa Fe County;
Uncontrolled loss of 300 Megawatts or more of firm
system loads for more than 15 minutes from a single incident-
Transmission Interruption 396 149223
2017 2 02/02/2017 1:11 AM . . . Hours, . Minutes Peak Reliability WECC New Mexico: Bernalillo County;
Uncontrolled loss of 300 Megawatts or more of firm
system loads for more than 15 minutes from a single incident-
Transmission Interruption 400 Unknown
2017 2 02/13/2017 1:00 PM 02/15/2017 1:35 PM 48 Hours, 35 Minutes North Carolina Mun Power Agny #1 SERC North Carolina: Union County;
Physical attack that could potentially impact electric power
system adequacy or reliability; or vandalism which targets
components of any security systems-Vandalism 0 0
2017 2 02/17/2017 8:09 AM 02/22/2017 7:30 PM 131 Hours, 21 Minutes Pacific Gas & Electric Co WECC California:
Loss of electric service to more than 50,000 customers for 1
hour or more-Severe Weather 254 169250
2017 2 02/17/2017 1:00 PM 02/17/2017 1:15 PM 0 Hours, 15 Minutes Nevada Power Company d/b/a NV Energy WECC Nevada: Clark County;
Physical attack that could potentially impact electric power
system adequacy or reliability; or vandalism which targets
components of any security systems-Vandalism 0 0
2017 2 02/17/2017 3:00 PM 02/20/2017 11:00 AM 68 Hours, 0 Minutes LADWP WECC California: Los Angeles County;
Loss of electric service to more than 50,000 customers for 1
hour or more-Severe Weather Unknown 111591
2017 3 03/01/2017 8:30 AM 03/01/2017 2:00 PM 5 Hours, 30 Minutes Tennessee Valley Authority SERC Tennessee: Kentucky:
Loss of electric service to more than 50,000 customers for 1
hour or more-Severe Weather Unknown 58000
2017 3 03/01/2017 11:49 AM 03/02/2017 9:30 PM 33 Hours, 41 Minutes American Electric Power RFC Kentucky: West Virginia:
Loss of electric service to more than 50,000 customers for 1
hour or more-Severe Weather Unknown 98575
2017 3 03/02/2017 12:20 PM 03/02/2017 11:45 PM 11 Hours, 25 Minutes ISO New England NPCC
Connecticut: Maine: Massachusetts: New
Hampshire: Rhode Island: Vermont:
Loss of electric service to more than 50,000 customers for 1
hour or more-Severe Weather Unknown 54316
2017 3 03/06/2017 8:00 PM 03/07/2017 1:00 AM 5 Hours, 0 Minutes Kansas City Power & Light Co SERC
Missouri: Jackson County, Platte County, Cass County,
Lafayette County, Chariton County, Carroll County, Clay
County, Johnson County;
Loss of electric service to more than 50,000 customers for 1
hour or more-Severe Weather Unknown 97734
2017 3 03/08/2017 9:30 AM 03/11/2017 5:00 AM 67 Hours, 30 Minutes Consumers Energy Co RFC
Michigan: Jackson County, Calhoun County, Ingham County, Hillsdale County, Washtenaw County, Kent
County, Ottawa County, Midland County, Saginaw
County;
Loss of electric service to more than 50,000 customers for 1
hour or more-Severe Weather Unknown 343000
2017 3 03/08/2017 11:30 AM 03/08/2017 7:52 PM 8 Hours, 22 Minutes Cleveland Electric Illum Co RFC Ohio
Loss of electric service to more than 50,000 customers for 1
hour or more-Severe Weather Unknown 71012
2017 3 03/08/2017 12:00 PM 03/11/2017 11:31 AM 71 Hours, 31 Minutes Detroit Edison Co RFC Michigan
Loss of electric service to more than 50,000 customers for 1
hour or more-Severe Weather Unknown 800000
2017 3 03/08/2017 1:30 PM 03/08/2017 4:30 PM 3 Hours, 0 MinutesNiagara Mohawk Power Corporation (dba National
Grid) NPCC New York
Loss of electric service to more than 50,000 customers for 1
hour or more-Severe Weather/Transmission
Interruption Unknown 106869
2017 3 03/08/2017 3:33 PM . . . Hours, . Minutes Rochester Gas & Electric Corp NPCC New York
Loss of electric service to more than 50,000 customers for 1
hour or more-Severe Weather Unknown 50000
2017 3 03/14/2017 12:32 PM . . . Hours, . Minutes ISO New England NPCC
Connecticut: Massachusetts: Rhode Island: New Hampshire:
Maine: Vermont:
Loss of electric service to more than 50,000 customers for 1
hour or more-Severe Weather Unknown 69647
2017 3 03/21/2017 8:00 PM 03/22/2017 9:15 AM 13 Hours, 15 Minutes Southern Company SERC Georgia
Loss of electric service to more than 50,000 customers for 1
hour or more-Severe Weather 857 257000
2017 3 03/29/2017 3:30 AM 03/31/2017 6:00 AM 50 Hours, 30 Minutes Oncor Electric Delivery Company LLC TRE Texas
Loss of electric service to more than 50,000 customers for 1
hour or more-Severe Weather Unknown 175000
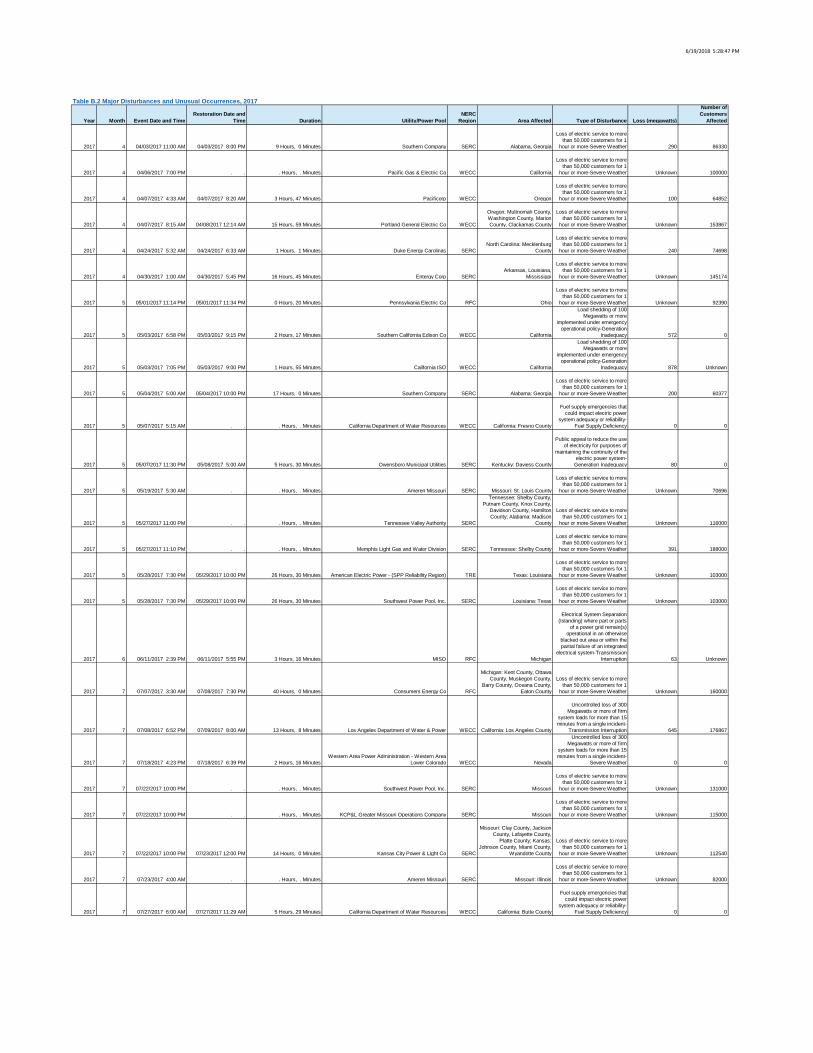
6/19/2018 5:28:47 PM
Table B.2 Major Disturbances and Unusual Occurrences, 2017
Year Month Event Date and TimeRestoration Date and
Time Duration Utility/Power PoolNERC
Region Area Affected Type of Disturbance Loss (megawatts)
Number of Customers
Affected
2017 4 04/03/2017 11:00 AM 04/03/2017 8:00 PM 9 Hours, 0 Minutes Southern Company SERC Alabama, Georgia
Loss of electric service to more than 50,000 customers for 1
hour or more-Severe Weather 290 86330
2017 4 04/06/2017 7:00 PM . . . Hours, . Minutes Pacific Gas & Electric Co WECC California
Loss of electric service to more than 50,000 customers for 1
hour or more-Severe Weather Unknown 100000
2017 4 04/07/2017 4:33 AM 04/07/2017 8:20 AM 3 Hours, 47 Minutes Pacificorp WECC Oregon
Loss of electric service to more than 50,000 customers for 1
hour or more-Severe Weather 100 64852
2017 4 04/07/2017 8:15 AM 04/08/2017 12:14 AM 15 Hours, 59 Minutes Portland General Electric Co WECC
Oregon: Multnomah County, Washington County, Marion County, Clackamas County
Loss of electric service to more than 50,000 customers for 1
hour or more-Severe Weather Unknown 153867
2017 4 04/24/2017 5:32 AM 04/24/2017 6:33 AM 1 Hours, 1 Minutes Duke Energy Carolinas SERCNorth Carolina: Mecklenburg
County
Loss of electric service to more than 50,000 customers for 1
hour or more-Severe Weather 240 74698
2017 4 04/30/2017 1:00 AM 04/30/2017 5:45 PM 16 Hours, 45 Minutes Entergy Corp SERCArkansas, Louisiana,
Mississippi
Loss of electric service to more than 50,000 customers for 1
hour or more-Severe Weather Unknown 145174
2017 5 05/01/2017 11:14 PM 05/01/2017 11:34 PM 0 Hours, 20 Minutes Pennsylvania Electric Co RFC Ohio
Loss of electric service to more than 50,000 customers for 1
hour or more-Severe Weather Unknown 92390
2017 5 05/03/2017 6:58 PM 05/03/2017 9:15 PM 2 Hours, 17 Minutes Southern California Edison Co WECC California
Load shedding of 100 Megawatts or more
implemented under emergency operational policy-Generation
Inadequacy 572 0
2017 5 05/03/2017 7:05 PM 05/03/2017 9:00 PM 1 Hours, 55 Minutes California ISO WECC California
Load shedding of 100 Megawatts or more
implemented under emergency operational policy-Generation
Inadequacy 878 Unknown
2017 5 05/04/2017 5:00 AM 05/04/2017 10:00 PM 17 Hours, 0 Minutes Southern Company SERC Alabama: Georgia
Loss of electric service to more than 50,000 customers for 1
hour or more-Severe Weather 200 60377
2017 5 05/07/2017 5:15 AM . . . Hours, . Minutes California Department of Water Resources WECC California: Fresno County
Fuel supply emergencies that could impact electric power
system adequacy or reliability-Fuel Supply Deficiency 0 0
2017 5 05/07/2017 11:30 PM 05/08/2017 5:00 AM 5 Hours, 30 Minutes Owensboro Municipal Utilities SERC Kentucky: Daviess County
Public appeal to reduce the use of electricity for purposes of
maintaining the continuity of the electric power system-
Generation Inadequacy 80 0
2017 5 05/19/2017 5:30 AM . . . Hours, . Minutes Ameren Missouri SERC Missouri: St. Louis County
Loss of electric service to more than 50,000 customers for 1
hour or more-Severe Weather Unknown 70696
2017 5 05/27/2017 11:00 PM . . . Hours, . Minutes Tennessee Valley Authority SERC
Tennessee: Shelby County, Putnam County, Knox County,
Davidson County, Hamilton County; Alabama: Madison
County
Loss of electric service to more than 50,000 customers for 1
hour or more-Severe Weather Unknown 116000
2017 5 05/27/2017 11:10 PM . . . Hours, . Minutes Memphis Light Gas and Water Division SERC Tennessee: Shelby County
Loss of electric service to more than 50,000 customers for 1
hour or more-Severe Weather 391 188000
2017 5 05/28/2017 7:30 PM 05/29/2017 10:00 PM 26 Hours, 30 Minutes American Electric Power - (SPP Reliability Region) TRE Texas: Louisiana
Loss of electric service to more than 50,000 customers for 1
hour or more-Severe Weather Unknown 103000
2017 5 05/28/2017 7:30 PM 05/29/2017 10:00 PM 26 Hours, 30 Minutes Southwest Power Pool, Inc. SERC Louisiana: Texas
Loss of electric service to more than 50,000 customers for 1
hour or more-Severe Weather Unknown 103000
2017 6 06/11/2017 2:39 PM 06/11/2017 5:55 PM 3 Hours, 16 Minutes MISO RFC Michigan
Electrical System Separation (Islanding) where part or parts
of a power grid remain(s) operational in an otherwise
blacked out area or within the partial failure of an integrated
electrical system-Transmission Interruption 63 Unknown
2017 7 07/07/2017 3:30 AM 07/08/2017 7:30 PM 40 Hours, 0 Minutes Consumers Energy Co RFC
Michigan: Kent County, Ottawa County, Muskegon County,
Barry County, Oceana County, Eaton County
Loss of electric service to more than 50,000 customers for 1
hour or more-Severe Weather Unknown 160000
2017 7 07/08/2017 6:52 PM 07/09/2017 8:00 AM 13 Hours, 8 Minutes Los Angeles Department of Water & Power WECC California: Los Angeles County
Uncontrolled loss of 300 Megawatts or more of firm
system loads for more than 15 minutes from a single incident-
Transmission Interruption 645 176867
2017 7 07/18/2017 4:23 PM 07/18/2017 6:39 PM 2 Hours, 16 MinutesWestern Area Power Administration - Western Area
Lower Colorado WECC Nevada
Uncontrolled loss of 300 Megawatts or more of firm
system loads for more than 15 minutes from a single incident-
Severe Weather 0 0
2017 7 07/22/2017 10:00 PM . . . Hours, . Minutes Southwest Power Pool, Inc. SERC Missouri
Loss of electric service to more than 50,000 customers for 1
hour or more-Severe Weather Unknown 131000
2017 7 07/22/2017 10:00 PM . . . Hours, . Minutes KCP&L Greater Missouri Operations Company SERC Missouri
Loss of electric service to more than 50,000 customers for 1
hour or more-Severe Weather Unknown 115000
2017 7 07/22/2017 10:00 PM 07/23/2017 12:00 PM 14 Hours, 0 Minutes Kansas City Power & Light Co SERC
Missouri: Clay County, Jackson County, Lafayette County,
Platte County; Kansas: Johnson County, Miami County,
Wyandotte County
Loss of electric service to more than 50,000 customers for 1
hour or more-Severe Weather Unknown 112540
2017 7 07/23/2017 4:00 AM . . . Hours, . Minutes Ameren Missouri SERC Missouri: Illinois
Loss of electric service to more than 50,000 customers for 1
hour or more-Severe Weather Unknown 82000
2017 7 07/27/2017 6:00 AM 07/27/2017 11:29 AM 5 Hours, 29 Minutes California Department of Water Resources WECC California: Butte County
Fuel supply emergencies that could impact electric power
system adequacy or reliability-Fuel Supply Deficiency 0 0
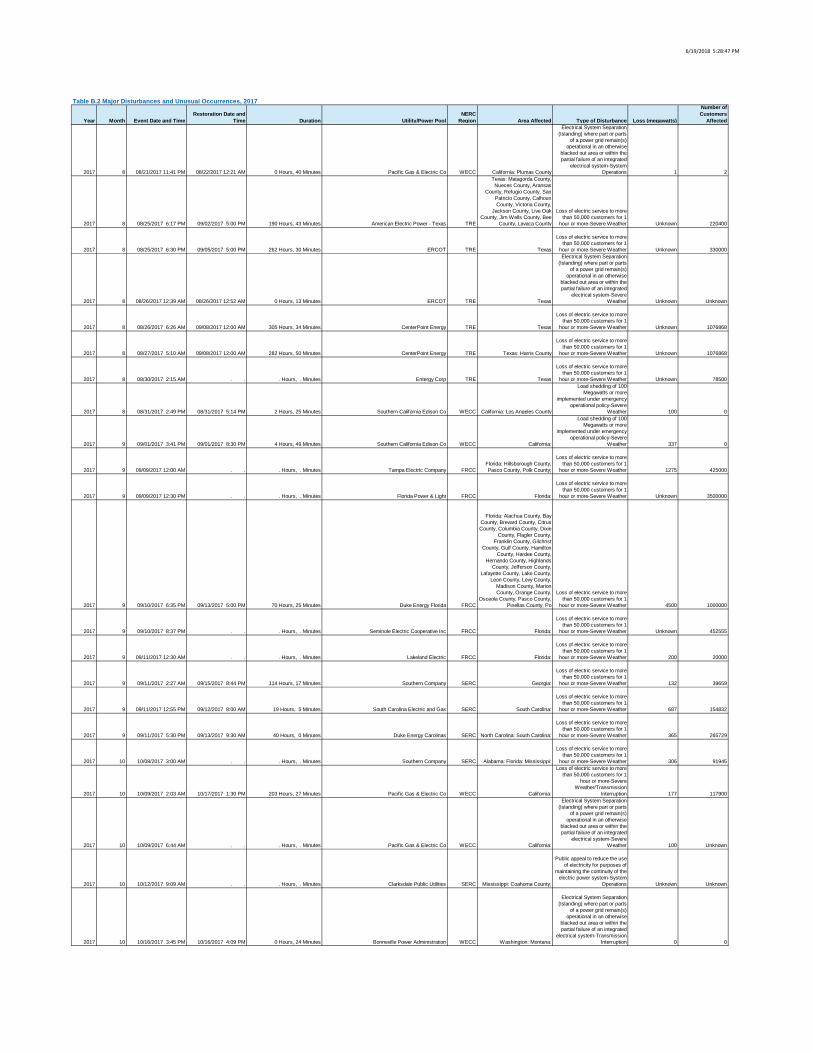
6/19/2018 5:28:47 PM
Table B.2 Major Disturbances and Unusual Occurrences, 2017
Year Month Event Date and TimeRestoration Date and
Time Duration Utility/Power PoolNERC
Region Area Affected Type of Disturbance Loss (megawatts)
Number of Customers
Affected
2017 8 08/21/2017 11:41 PM 08/22/2017 12:21 AM 0 Hours, 40 Minutes Pacific Gas & Electric Co WECC California: Plumas County
Electrical System Separation (Islanding) where part or parts
of a power grid remain(s) operational in an otherwise
blacked out area or within the partial failure of an integrated
electrical system-System Operations 1 2
2017 8 08/25/2017 6:17 PM 09/02/2017 5:00 PM 190 Hours, 43 Minutes American Electric Power - Texas TRE
Texas: Matagorda County, Nueces County, Aransas
County, Refugio County, San Patricio County, Calhoun County, Victoria County,
Jackson County, Live Oak County, Jim Wells County, Bee
County, Lavaca County
Loss of electric service to more than 50,000 customers for 1
hour or more-Severe Weather Unknown 220400
2017 8 08/25/2017 6:30 PM 09/05/2017 5:00 PM 262 Hours, 30 Minutes ERCOT TRE Texas
Loss of electric service to more than 50,000 customers for 1
hour or more-Severe Weather Unknown 330000
2017 8 08/26/2017 12:39 AM 08/26/2017 12:52 AM 0 Hours, 13 Minutes ERCOT TRE Texas
Electrical System Separation (Islanding) where part or parts
of a power grid remain(s) operational in an otherwise
blacked out area or within the partial failure of an integrated
electrical system-Severe Weather Unknown Unknown
2017 8 08/26/2017 6:26 AM 09/08/2017 12:00 AM 305 Hours, 34 Minutes CenterPoint Energy TRE Texas
Loss of electric service to more than 50,000 customers for 1
hour or more-Severe Weather Unknown 1076868
2017 8 08/27/2017 5:10 AM 09/08/2017 12:00 AM 282 Hours, 50 Minutes CenterPoint Energy TRE Texas: Harris County
Loss of electric service to more than 50,000 customers for 1
hour or more-Severe Weather Unknown 1076868
2017 8 08/30/2017 2:15 AM . . . Hours, . Minutes Entergy Corp TRE Texas
Loss of electric service to more than 50,000 customers for 1
hour or more-Severe Weather Unknown 78500
2017 8 08/31/2017 2:49 PM 08/31/2017 5:14 PM 2 Hours, 25 Minutes Southern California Edison Co WECC California: Los Angeles County
Load shedding of 100 Megawatts or more
implemented under emergency operational policy-Severe
Weather 100 0
2017 9 09/01/2017 3:41 PM 09/01/2017 8:30 PM 4 Hours, 49 Minutes Southern California Edison Co WECC California:
Load shedding of 100 Megawatts or more
implemented under emergency operational policy-Severe
Weather 337 0
2017 9 09/09/2017 12:00 AM . . . Hours, . Minutes Tampa Electric Company FRCCFlorida: Hillsborough County, Pasco County, Polk County;
Loss of electric service to more than 50,000 customers for 1
hour or more-Severe Weather 1275 425000
2017 9 09/09/2017 12:30 PM . . . Hours, . Minutes Florida Power & Light FRCC Florida:
Loss of electric service to more than 50,000 customers for 1
hour or more-Severe Weather Unknown 3500000
2017 9 09/10/2017 6:35 PM 09/13/2017 5:00 PM 70 Hours, 25 Minutes Duke Energy Florida FRCC
Florida: Alachua County, Bay County, Brevard County, Citrus County, Columbia County, Dixie
County, Flagler County, Franklin County, Gilchrist
County, Gulf County, Hamilton County, Hardee County,
Hernando County, Highlands County, Jefferson County,
Lafayette County, Lake County, Leon County, Levy County,
Madison County, Marion County, Orange County,
Osceola County, Pasco County, Pinellas County, Po
Loss of electric service to more than 50,000 customers for 1
hour or more-Severe Weather 4500 1000000
2017 9 09/10/2017 8:37 PM . . . Hours, . Minutes Seminole Electric Cooperative Inc FRCC Florida:
Loss of electric service to more than 50,000 customers for 1
hour or more-Severe Weather Unknown 452555
2017 9 09/11/2017 12:30 AM . . . Hours, . Minutes Lakeland Electric FRCC Florida:
Loss of electric service to more than 50,000 customers for 1
hour or more-Severe Weather 200 20000
2017 9 09/11/2017 2:27 AM 09/15/2017 8:44 PM 114 Hours, 17 Minutes Southern Company SERC Georgia:
Loss of electric service to more than 50,000 customers for 1
hour or more-Severe Weather 132 39659
2017 9 09/11/2017 12:55 PM 09/12/2017 8:00 AM 19 Hours, 5 Minutes South Carolina Electric and Gas SERC South Carolina:
Loss of electric service to more than 50,000 customers for 1
hour or more-Severe Weather 687 154832
2017 9 09/11/2017 5:30 PM 09/13/2017 9:30 AM 40 Hours, 0 Minutes Duke Energy Carolinas SERC North Carolina: South Carolina:
Loss of electric service to more than 50,000 customers for 1
hour or more-Severe Weather 365 265729
2017 10 10/08/2017 3:00 AM . . . Hours, . Minutes Southern Company SERC Alabama: Florida: Mississippi:
Loss of electric service to more than 50,000 customers for 1
hour or more-Severe Weather 306 91945
2017 10 10/09/2017 2:03 AM 10/17/2017 1:30 PM 203 Hours, 27 Minutes Pacific Gas & Electric Co WECC California:
Loss of electric service to more than 50,000 customers for 1
hour or more-Severe Weather/Transmission
Interruption 177 117900
2017 10 10/09/2017 6:44 AM . . . Hours, . Minutes Pacific Gas & Electric Co WECC California:
Electrical System Separation (Islanding) where part or parts
of a power grid remain(s) operational in an otherwise
blacked out area or within the partial failure of an integrated
electrical system-Severe Weather 100 Unknown
2017 10 10/12/2017 9:09 AM . . . Hours, . Minutes Clarksdale Public Utilities SERC Mississippi: Coahoma County;
Public appeal to reduce the use of electricity for purposes of
maintaining the continuity of the electric power system-System
Operations Unknown Unknown
2017 10 10/16/2017 3:45 PM 10/16/2017 4:09 PM 0 Hours, 24 Minutes Bonneville Power Administration WECC Washington: Montana:
Electrical System Separation (Islanding) where part or parts
of a power grid remain(s) operational in an otherwise
blacked out area or within the partial failure of an integrated
electrical system-Transmission Interruption 0 0
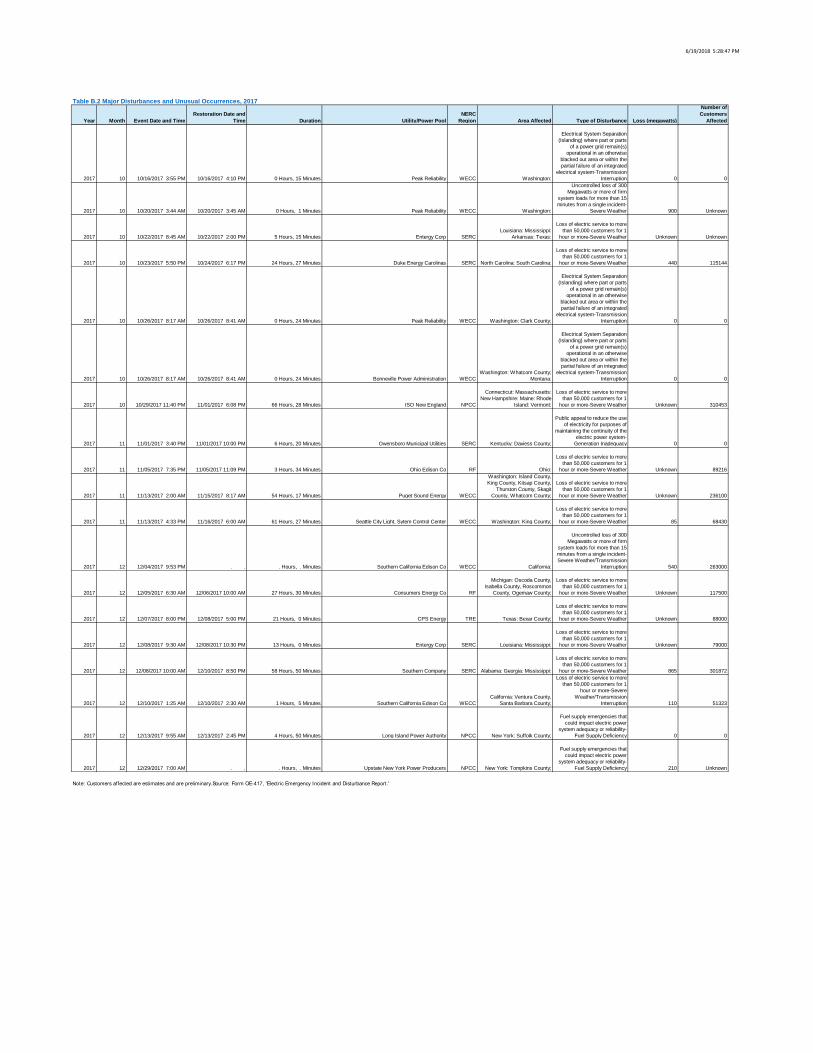
6/19/2018 5:28:47 PM
Table B.2 Major Disturbances and Unusual Occurrences, 2017
Year Month Event Date and TimeRestoration Date and
Time Duration Utility/Power PoolNERC
Region Area Affected Type of Disturbance Loss (megawatts)
Number of Customers
Affected
2017 10 10/16/2017 3:55 PM 10/16/2017 4:10 PM 0 Hours, 15 Minutes Peak Reliability WECC Washington:
Electrical System Separation (Islanding) where part or parts
of a power grid remain(s) operational in an otherwise
blacked out area or within the partial failure of an integrated
electrical system-Transmission Interruption 0 0
2017 10 10/20/2017 3:44 AM 10/20/2017 3:45 AM 0 Hours, 1 Minutes Peak Reliability WECC Washington:
Uncontrolled loss of 300 Megawatts or more of firm
system loads for more than 15 minutes from a single incident-
Severe Weather 900 Unknown
2017 10 10/22/2017 8:45 AM 10/22/2017 2:00 PM 5 Hours, 15 Minutes Entergy Corp SERCLouisiana: Mississippi:
Arkansas: Texas:
Loss of electric service to more than 50,000 customers for 1
hour or more-Severe Weather Unknown Unknown
2017 10 10/23/2017 5:50 PM 10/24/2017 6:17 PM 24 Hours, 27 Minutes Duke Energy Carolinas SERC North Carolina: South Carolina:
Loss of electric service to more than 50,000 customers for 1
hour or more-Severe Weather 440 115144
2017 10 10/26/2017 8:17 AM 10/26/2017 8:41 AM 0 Hours, 24 Minutes Peak Reliability WECC Washington: Clark County;
Electrical System Separation (Islanding) where part or parts
of a power grid remain(s) operational in an otherwise
blacked out area or within the partial failure of an integrated
electrical system-Transmission Interruption 0 0
2017 10 10/26/2017 8:17 AM 10/26/2017 8:41 AM 0 Hours, 24 Minutes Bonneville Power Administration WECCWashington: Whatcom County;
Montana:
Electrical System Separation (Islanding) where part or parts
of a power grid remain(s) operational in an otherwise
blacked out area or within the partial failure of an integrated
electrical system-Transmission Interruption 0 0
2017 10 10/29/2017 11:40 PM 11/01/2017 6:08 PM 66 Hours, 28 Minutes ISO New England NPCC
Connecticut: Massachusetts: New Hampshire: Maine: Rhode
Island: Vermont:
Loss of electric service to more than 50,000 customers for 1
hour or more-Severe Weather Unknown 310453
2017 11 11/01/2017 3:40 PM 11/01/2017 10:00 PM 6 Hours, 20 Minutes Owensboro Municipal Utilities SERC Kentucky: Daviess County;
Public appeal to reduce the use of electricity for purposes of
maintaining the continuity of the electric power system-
Generation Inadequacy 0 0
2017 11 11/05/2017 7:35 PM 11/05/2017 11:09 PM 3 Hours, 34 Minutes Ohio Edison Co RF Ohio:
Loss of electric service to more than 50,000 customers for 1
hour or more-Severe Weather Unknown 89216
2017 11 11/13/2017 2:00 AM 11/15/2017 8:17 AM 54 Hours, 17 Minutes Puget Sound Energy WECC
Washington: Island County, King County, Kitsap County,
Thurston County, Skagit County, Whatcom County;
Loss of electric service to more than 50,000 customers for 1
hour or more-Severe Weather Unknown 236100
2017 11 11/13/2017 4:33 PM 11/16/2017 6:00 AM 61 Hours, 27 Minutes Seattle City Light, Sytem Control Center WECC Washington: King County;
Loss of electric service to more than 50,000 customers for 1
hour or more-Severe Weather 85 68430
2017 12 12/04/2017 9:53 PM . . . Hours, . Minutes Southern California Edison Co WECC California:
Uncontrolled loss of 300 Megawatts or more of firm
system loads for more than 15 minutes from a single incident-Severe Weather/Transmission
Interruption 540 263000
2017 12 12/05/2017 6:30 AM 12/06/2017 10:00 AM 27 Hours, 30 Minutes Consumers Energy Co RF
Michigan: Oscoda County, Isabella County, Roscommon
County, Ogemaw County;
Loss of electric service to more than 50,000 customers for 1
hour or more-Severe Weather Unknown 117500
2017 12 12/07/2017 8:00 PM 12/08/2017 5:00 PM 21 Hours, 0 Minutes CPS Energy TRE Texas: Bexar County;
Loss of electric service to more than 50,000 customers for 1
hour or more-Severe Weather Unknown 88000
2017 12 12/08/2017 9:30 AM 12/08/2017 10:30 PM 13 Hours, 0 Minutes Entergy Corp SERC Louisiana: Mississippi:
Loss of electric service to more than 50,000 customers for 1
hour or more-Severe Weather Unknown 79000
2017 12 12/08/2017 10:00 AM 12/10/2017 8:50 PM 58 Hours, 50 Minutes Southern Company SERC Alabama: Georgia: Mississippi:
Loss of electric service to more than 50,000 customers for 1
hour or more-Severe Weather 865 301872
2017 12 12/10/2017 1:25 AM 12/10/2017 2:30 AM 1 Hours, 5 Minutes Southern California Edison Co WECCCalifornia: Ventura County,
Santa Barbara County;
Loss of electric service to more than 50,000 customers for 1
hour or more-Severe Weather/Transmission
Interruption 110 51323
2017 12 12/13/2017 9:55 AM 12/13/2017 2:45 PM 4 Hours, 50 Minutes Long Island Power Authority NPCC New York: Suffolk County;
Fuel supply emergencies that could impact electric power
system adequacy or reliability-Fuel Supply Deficiency 0 0
2017 12 12/29/2017 7:00 AM . . . Hours, . Minutes Upstate New York Power Producers NPCC New York: Tompkins County;
Fuel supply emergencies that could impact electric power
system adequacy or reliability-Fuel Supply Deficiency 210 Unknown
Note: Customers affected are estimates and are preliminary.Source: Form OE-417, 'Electric Emergency Incident and Disturbance Report.'
June 2018
U.S. Energy Information Administration | Electric Power Monthly
Appendix C
Technical notes This appendix describes how the U. S. Energy Information Administration (EIA) collects, estimates, and reports electric power data in the EPM.
Data quality The EPM is prepared by the Office of Electricity, Renewables & Uranium Statistics (ERUS), Energy Information Administration (EIA), U. S. Department of Energy. Quality statistics begin with the collection of the correct data. To assure this, ERUS performs routine reviews of the data collected and the forms on which it is collected. Additionally, to assure that the data are collected from the correct parties, ERUS routinely reviews the frames for each data collection.
Automatic, computerized verification of keyed input, review by subject matter specialists, and follow-up with nonrespondents assure quality statistics. To ensure the quality standards established by the EIA, formulas that use the past history of data values in the database have been designed and implemented to check data input for errors automatically. Data values that fall outside the ranges prescribed in the formulas are verified by telephoning respondents to resolve any discrepancies. All survey nonrespondents are identified and contacted.
Reliability of data There are two types of errors possible in an estimate based on a sample survey: sampling and non-sampling. Sampling errors occur because observations are made only on a sample, not on the entire population. Non-sampling errors can be attributed to many sources in the collection and processing of data. The accuracy of survey results is determined by the joint effects of sampling and non-sampling errors. Monthly sample survey data have both sampling and non-sampling error. Annual survey data are collected by a census and are not subject to sampling error.
Non-sampling errors can be attributed to many sources: (1) inability to obtain complete information about all cases in the sample (i.e., nonresponse); (2) response errors; (3) definitional difficulties; (4) differences in the interpretation of questions; (5) mistakes in recording or coding the data obtained; and (6) other errors of collection, response, coverage, and estimation for missing data. Note that for the cutoff sampling and model-based regression (ratio) estimation that we use, data ‘missing’ due to nonresponse, and data ‘missing’ due to being out-of-sample are treated in the same manner. Therefore missing data may be considered to result in sampling error, and variance estimates reflect all missing data.
Although no direct measurement of the biases due to non-sampling errors can be obtained, precautionary steps were taken in all phases of the frame development and data collection, processing, and tabulation processes, in an effort to minimize their influence. See the Data Processing and Data System Editing section for each EIA form for an in-depth discussion of how the sampling and non-sampling errors are handled in each case.
June 2018
U.S. Energy Information Administration | Electric Power Monthly
Relative Standard Error: The relative standard error (RSE) statistic, usually given as a percentage, describes the magnitude of sampling error that might reasonably be incurred. The RSE is the square root of the estimated variance, divided by the variable of interest. The variable of interest may be the ratio of two variables, or a single variable.
The sampling error may be less than the non-sampling error. In fact, large RSE estimates found in preliminary work with these data have often indicated non-sampling errors, which were then identified and corrected. Non-sampling errors may be attributed to many sources, including the response errors, definitional difficulties, differences in the interpretation of questions, mistakes in recording or coding data obtained, and other errors of collection, response, or coverage. These non-sampling errors also occur in complete censuses.
Using the Central Limit Theorem, which applies to sums and means such as are applicable here, there is approxi-mately a 68 percent chance that the true total or mean is within one RSE of the estimated total or mean. Note that reported RSEs are always estimates themselves, and are usually, as here, reported as percentages. As an example, suppose that a net generation from coal value is estimated to be 1,507 million kilowatthours with an estimated RSE of 4.9 percent. This means that, ignoring any non-sampling error, there is approximately a 68 percent chance that the true million kilowatthour value is within approximately 4.9 percent of 1,507 million kilowatthours (that is, between 1,433 and 1,581 million kilowatthours). Also under the Central Limit Theorem, there is approxi-mately a 95 percent chance that the true mean or total is within 2 RSEs of the estimated mean or total.
Note that there are times when a model may not apply, such as in the case of a substantial reclassification of sales, when the relationship between the variable of interest and the regressor data does not hold. In such a case, the new information may represent only itself, and such numbers are added to model results when estimating totals. Further, there are times when sample data may be known to be in error, or are not reported. Such cases are treated as if they were never part of the model-based sample, and values are imputed. Experiments were done to see if nonresponse should be treated differently, but it was decided to treat those cases the same as out-of-sample cases.
Relative Standard Error With Respect to a Superpopulation: The RSESP statistic is similar to the RSE (described above). Like the RSE, it is a statistic designed to estimate the variability of data and is usually given as a percentage. However, where the RSE is only designed to estimate the magnitude of sampling error, the RSESP more fully reflects the impact of variability from sampling and non-sampling errors. This is a more complete measure than RSE in that it can measure statistical variability in a complete census in addition to a sample21,24. In addition to being a measure of data variability, the RSESP can also be useful in comparing different models that are applied to the same set of data22. This capability is used to test different regression models for imputation and prediction. This testing may include considerations such as comparing different regressors, the comparative reliability of different monthly samples, or the use of different geographical strata or groupings for a given model. For testing purposes, ERUS typically uses recent historical data that have been finalized. Typically, time-series graphics showing two or more models or samples are generated showing the RSESP values over time. In selecting models, consideration is given to total survey error as well as any apparent differences in robustness.
June 2018
U.S. Energy Information Administration | Electric Power Monthly
Imputation: For monthly data, if the reported values appeared to be in error and the data issue could not be resolved with the respondent, or if the facility was a nonrespondent, a regression methodology is used to impute for the facility. The same procedure is used to estimate ("predict") data for facilities not in the monthly sample. The regression methodology relies on other data to make estimates for erroneous or missing responses.
Estimation for missing monthly data is accomplished by relating the observed data each month to one or more other data elements (regressors) for which we generally have an annual census. Each year, when new annual regressor data are available, recent monthly relationships are updated, causing slight revisions to estimated monthly results. These revisions are made as soon as the annual data are released.
The basic technique employed is described in the paper “Model-Based Sampling and Inference16,” on the EIA website. Additional references can be found on the InterStat website (http://interstat.statjournals.net/). The basis for the current methodology involves a 'borrowing of strength' technique for small domains.
Data revision procedure ERUS has adopted the following policy with respect to the revision and correction of recurrent data in energy publications:
• Annual survey data are disseminated either as preliminary or final when first appearing in a data product. Data initially released as preliminary will be so noted in the data product. These data are typically released as final by the next dissemination of the same product; however, if final data are available at an earlier interval they may be released in another product.
• All monthly survey data are first disseminated as preliminary. These data are revised after the prior year’s data are finalized and are disseminated as revised preliminary. No revisions are made to the published data before this or subsequent to these data being finalized unless significant errors are discovered.
• After data are disseminated as final, further revisions will be considered if they make a difference of 1 percent or greater at the national level. Revisions for differences that do not meet the 1 percent or greater threshold will be determined by the Office Director. In either case, the proposed revision will be subject to the EIA revision policy concerning how it affects other EIA products.
• The magnitudes of changes due to revisions experienced in the past will be included periodically in the data products, so that the reader can assess the accuracy of the data.
Data sources for Electric Power Monthly Data published in the EPM are compiled from the following sources:
• Form EIA-923, “Power Plant Operations Report,” • Form EIA 826, “Monthly Electric Utility Sales and Revenues with State Distributions Report,” • Form EIA 860, “Annual Electric Generator Report,” • Form EIA-860M, “Monthly Update to the Annual Electric Generator Report,” and
June 2018
U.S. Energy Information Administration | Electric Power Monthly
100, x )t( x
)t( x - )t( x1
12
||
• Form EIA 861, “Annual Electric Power Industry Report.”
For access to these forms and their instructions, please see: http://www.eia.gov/cneaf/electricity/page/forms.html.
In addition to the above-named forms, the historical data published in the EPM for periods prior to 2008 are compiled from the following sources:
• FERC Form 423, “Monthly Report of Cost and Quality of Fuels for Electric Plants,” • Form EIA-423, “Monthly Cost and Quality of Fuels for Electric Plants Report,” • Form EIA-759, “Monthly Power Plant Report,” • Form EIA-860A, “Annual Electric Generator Report–Utility,” • Form EIA-860B, “Annual Electric Generator Report–Nonutility,” • Form EIA-900, “Monthly Nonutility Power Report,” • Form EIA-906, “Power Plant Report,” and • Form EIA-920, “Combined Heat and Power Plant Report.”
See Appendix A of the historical Electric Power Annual reports to find descriptions of forms that are no longer in use. The publications can be found from the top of the current EPA under previous issues: http://www.eia.gov/electricity/annual.
Rounding rules for data: To round a number to n digits (decimal places), add one unit to the nth digit if the (n+1) digit is 5 or larger and keep the nth digit unchanged if the (n+1) digit is less than 5. The symbol for a number rounded to zero is (*).
Percent difference: The following formula is used to calculate percent differences:
Percent Difference =
where x (t1) and x (t2) denote the quantity at year t1 and subsequent year t2.
Meanings of symbols appearing in tables: The following symbols have the meaning described below:
P Indicates a preliminary value.
NM Data value is not meaningful, either (1) when compared to the same value for the previous time period, or (2) when a data value is not meaningful due to having a high Relative Standard Error (RSE).
June 2018
U.S. Energy Information Administration | Electric Power Monthly
Form EIA-826 The Form EIA 826, “Monthly Electric Utility Sales and Revenues with State Distributions Report,” is a monthly collection of data from a sample of approximately 500 of the largest electric utilities (primarily investor owned and publicly owned) as well as a census of energy service providers with sales to ultimate consumers in deregulated States. Form EIA-861, with approximately 3,300 respondents, serves as a frame from which the Form 826 sample is drawn. Based on this sample, a model is used to estimate for the entire universe of U.S. electric utilities.
Instrument and design history: The collection of electric power sales data and related information began in the early 1940’s and was established as FPC Form 5 by FPC Order 141 in 1947. In 1980, the report was revised with only selected income items remaining and became the FERC Form 5. The Form EIA 826, “Electric Utility Company Monthly Statement,” replaced the FERC Form 5 in January 1983. In January 1987, the “Electric Utility Company Monthly Statement” was changed to the “Monthly Electric Utility Sales and Revenue Report with State Distributions.” The title was changed again in January 2002 to “Monthly Electric Utility Sales and Revenues with State Distributions Report” to become consistent with other EIA report titles. The Form EIA 826 was revised in January 1990, and some data elements were eliminated.
In 1993, EIA for the first time used a model sample for the Form EIA 826. A stratified random sample, employing auxiliary data, was used for each of the four previous years. The sample for the Form EIA 826 was designed to obtain estimates of electricity sales and average price of electricity to ultimate consumers at the State level by end use sector.
Starting with data for January 2001, the restructuring of the electric power industry was taken into account by forming three schedules on the Form EIA-826. Schedule 1, Part A is for full service utilities that operate as in the past. Schedule 1, Part B is for electric service providers only, and Schedule 1, Part C is for those utilities providing distribution service for those on Schedule 1, Part B. In addition, Schedule 1 Part D is for those energy providers to ultimate consumers or power marketers that provide bundled service. Also, the Form EIA-826 frame was modified to include all investor-owned electric utilities and a sample of companies from other ownership classes. A new method of estimation was implemented at this same time. (See EPM April 2001, p.1.)
With the October 2004 issue of the EPM, EIA published for the first time preliminary electricity sales data for the Transportation Sector. These data are for electricity delivered to and consumed by local, regional, and metropolitan transportation systems. The data being published for the first time in the October EPM included July 2004 data as well as year-to-date. EIA’s efforts to develop these new data have identified anomalies in several States and the District of Columbia. Some of these anomalies are caused by issues such as: 1) Some respondents have classified themselves as outside the realm of the survey. The Form EIA-826 collects data from those respondents providing electricity and other services to the ultimate end users. EIA has experienced specific situations where, although the respondents’ customers are the ultimate end users, particular end users qualify under wholesale rate schedules. 2) The Form EIA-826 is a cutoff sample and not intended to be a census.
June 2018
U.S. Energy Information Administration | Electric Power Monthly
Beginning with 2008 data and some annual 2007 data, the Form EIA-923 replaced Forms EIA-906, EIA-920, EIA-423, and FERC 423. In addition, several sections of the discontinued Form EIA-767 have been included in either the Form EIA-860 or Form EIA-923. See the following link for a detailed explanation. http://www.eia.gov/cneaf/electricity/2008forms/consolidate.html
The legislative authority to collect these data is defined in the Federal Energy Administration Act of 1974 (Public Law 93-275, Sec. 13(b), 5(a), 5(b), 52).
Data processing and data system editing: Monthly Form EIA-826 submission is available via an Internet Data Collection (IDC) system. The completed data are due to EIA by the last calendar day of the month following the reporting month. Nonrespondents are contacted to obtain the data. The data are edited and additional checks are completed. Following verification, imputation is run, and tables and text of the aggregated data are produced for inclusion in the EPM.
Imputation: Regression prediction, or imputation, is done for entities not in the monthly sample and for any nonrespondents. Regressor data for Schedule 1, Part A is the average monthly sales or revenue from the most recent finalized data from survey Form EIA-861. Beginning with January 2008 data and the finalized 2007 data, the regressor data for Schedule 1 Parts B and C is the prior month’s data.
Formulas and methodologies: The Form EIA 826 data are collected by end-use sector (residential, commercial, industrial, and transportation) and State. Form EIA 861 data are used as the frame from which the sample is selected and in some instances also as regressor data. Updates are made to the frame to reflect mergers that affect data processing.
With the revised definitions for the commercial and industrial sectors to include all data previously reported as ‘other’ data except transportation, and a separate transportation sector, all responses that would formerly have been reported under the “other” sector are now to be reported under one of the sectors that currently exist. This means there is probably a lower correlation, in general, between, say, commercial Form EIA-826 data for 2004 and commercial Form EIA-861 data for 2003 than there was between commercial Form EIA-826 data for 2003 and commercial Form EIA-861 data for 2002 or earlier years, although commercial and industrial definitions have always been somewhat nebulous due to power companies not having complete information on all customers.
Data submitted for January 2004 represent the first time respondents were to provide data specifically for the transportation end-use sector.
During 2003 transportation data were collected annually through Form EIA-861. Beginning in 2004 the transportation data were collected on a monthly basis via Form EIA-826. In order to develop an estimate of the monthly transportation data for 2003, values for both sales of electricity to ultimate customers and revenue from sales of electricity to ultimate customers were estimated using the 2004 monthly profile for the sales and revenues from the data collected via Form EIA-826. All monthly non-transportation data for 2003 (i.e. street lighting, etc.), which were previously reported in the “other” end-use sector on the Form EIA-826 have been prorated into the Commercial and Industrial end-use sectors based on the 2003 Form EIA-861 profile.
June 2018
U.S. Energy Information Administration | Electric Power Monthly
A monthly distribution factor was developed for the monthly data collected in 2004 (for the months of January through November). The transportation sales and revenues for December 2004 were assumed to be equivalent to the transportation sales and revenues for November 2004. The monthly distribution factors for January through November were applied to the annual values for transportation sales and revenues collected via Form EIA-861 to develop corresponding 2003 monthly values. The eleven month estimated totals from January through November 2003 were subtracted from the annual values obtained from Form EIA-861 in order to obtain the December 2003 values.
Data from the Form EIA-826 are used to determine estimates by sector at the State, Census division, and national level. State level sales and revenues estimates are first calculated. Then the ratio of revenue divided by sales is calculated to estimate the price of electricity to ultimate consumers at the State level. The estimates are accumulated separately to produce the Census division and U.S. level estimates1.
Some electric utilities provide service in more than one State. To facilitate the estimation, the State service area is actually used as the sampling unit. For each State served by each utility, there is a utility State part, or “State service area.” This approach allows for an explicit calculation of estimates for sales, revenue, and average price of electricity to ultimate consumers by end use sector at State, Census division, and national level. Estimation procedures include imputation to account for nonresponse. Non-sampling error must also be considered. The non-sampling error is not estimated directly, although attempts are made to minimize the non-sampling error.
Average price of electricity to ultimate consumers represents the cost per unit of electricity sold and is calculated by dividing electric revenue from ultimate consumers by the corresponding sales of electricity. The average price of electricity to ultimate consumers is calculated for all consumers and for each end-use sector.
The electric revenue used to calculate the average price of electricity to ultimate consumers is the operating revenue reported by the electric utility. Operating revenue includes energy charges, demand charges, consumer service charges, environmental surcharges, fuel adjustments, and other miscellaneous charges. Electric utility operating revenues also include State and Federal income taxes and taxes other than income taxes paid by the utility.
The average price of electricity to ultimate consumers reported in this publication by sector represents a weighted average of consumer revenue and sales within sectors and across sectors for all consumers, and does not reflect the per kWh rate charged by the electric utility to the individual consumers. Electric utilities typically employ a number of rate schedules within a single sector. These alternative rate schedules reflect the varying consumption levels and patterns of consumers and their associated impact on the costs to the electric utility for providing electrical service.
Adjusting monthly data to annual data: As a final adjustment based on our most complete data, use is made of final Form EIA-861 data, when available. The annual totals for Form EIA-826 data by State and end-use sector are compared to the corresponding Form EIA-861 values for sales and revenue. The ratio of these two values in each case is then used to adjust each corresponding monthly value.
June 2018
U.S. Energy Information Administration | Electric Power Monthly
Sensitive data: Most of the data collected on the Form EIA-826 are not considered business sensitive. However, revenue, sales, and customer data collected from energy service providers (Schedule 1, Part B), which do not also provide energy delivery, are considered business sensitive and must adhere to EIA's “Policy on the Disclosure of Individually Identifiable Energy Information in the Possession of the EIA” (45Federal Register 59812 (1980)).
Form EIA-860 The Form EIA 860, “Annual Electric Generator Report,” is a mandatory annual census of all existing and planned electric generating facilities in the United States with a total generator nameplate capacity of 1 or more megawatts. The survey is used to collect data on existing power plants and 10 year plans for constructing new plants, as well as generating unit additions, modifications, and retirements in existing plants. Data on the survey are collected at the generator level. Certain power plant environmental-related data are collected at the boiler level. These data include environmental equipment design parameters, boiler air emission standards, and boiler emission controls The Form EIA-860 is made available in January to collect data related to the previous year.
Instrument and design history: The Form EIA-860 was originally implemented in January 1985 to collect data as of year-end 1984. It was preceded by several Federal Power Commission (FPC) forms including the FPC Form 4, Form 12 and 12E, Form 67, and Form EIA-411. In January 1999, the Form EIA-860 was renamed the Form EIA-860A, “Annual Electric Generator Report – Utility” and was implemented to collect data from electric utilities as of January 1, 1999.
In 1989, the Form EIA-867, "Annual Nonutility Power Producer Report," was initiated to collect plant data on unregulated entities with a total generator nameplate capacity of 5 or more megawatts. In 1992, the reporting threshold of the Form EIA-867 was lowered to include all facilities with a combined nameplate capacity of 1 or more megawatts. Previously, data were collected every 3 years from facilities with a nameplate capacity between 1 and 5 megawatts. In 1998, the Form EIA-867, was renamed Form EIA-860B, "Annual Electric Generator Report – Nonutility." The Form EIA-860B was a mandatory survey of all existing and planned nonutility electric generating facilities in the United States with a total generator nameplate capacity of 1 or more megawatts.
Beginning with data collected for the year 2001, the infrastructure data collected on the Form EIA-860A and the Form EIA-860B were combined into the new Form EIA-860 and the monthly and annual versions of the Form EIA-906.
Starting with 2007, design parameters data formerly collected on Form EIA-767 were collected on Form EIA-860. These include design parameters associated with certain steam-electric plants’ boilers, cooling systems, flue gas particulate collectors, flue gas desulfurization units, and stacks and flues.
The Federal Energy Administration Act of 1974 (Public Law 93-275) defines the legislative authority to collect these data.
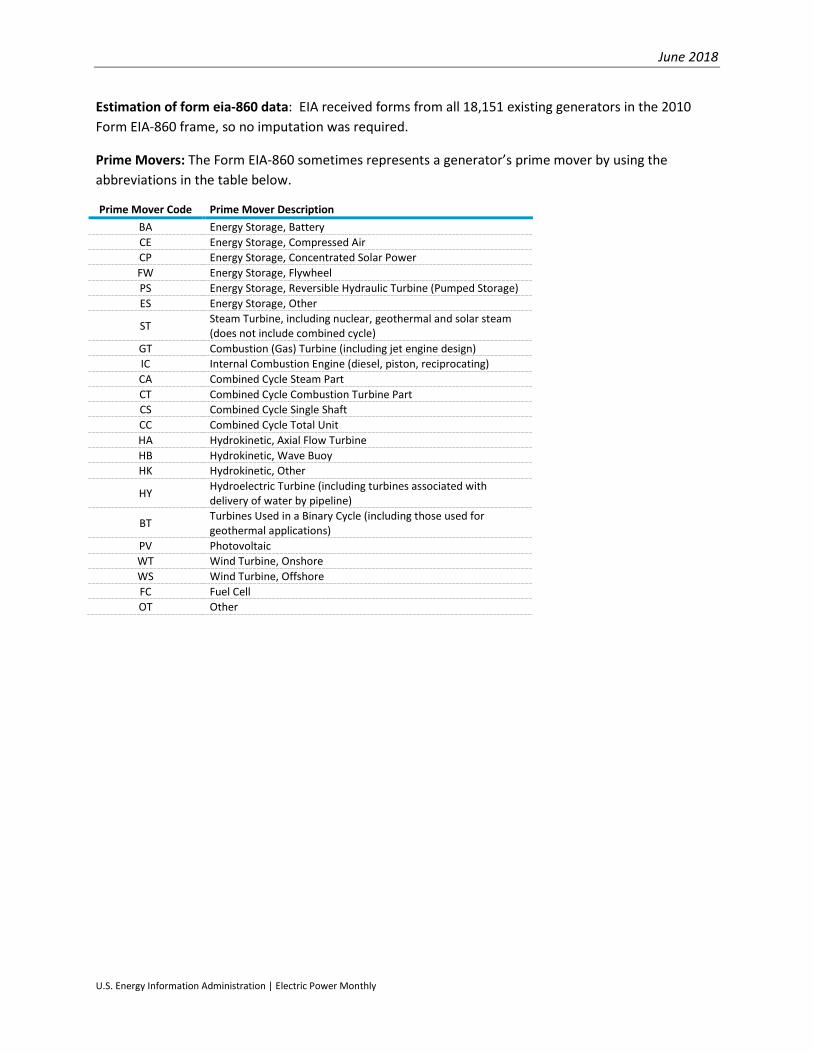
June 2018
U.S. Energy Information Administration | Electric Power Monthly
Estimation of form eia-860 data: EIA received forms from all 18,151 existing generators in the 2010 Form EIA-860 frame, so no imputation was required.
Prime Movers: The Form EIA-860 sometimes represents a generator’s prime mover by using the abbreviations in the table below.
Prime Mover Code Prime Mover Description BA Energy Storage, Battery CE Energy Storage, Compressed Air CP Energy Storage, Concentrated Solar Power FW Energy Storage, Flywheel PS Energy Storage, Reversible Hydraulic Turbine (Pumped Storage) ES Energy Storage, Other
ST Steam Turbine, including nuclear, geothermal and solar steam (does not include combined cycle)
GT Combustion (Gas) Turbine (including jet engine design) IC Internal Combustion Engine (diesel, piston, reciprocating) CA Combined Cycle Steam Part CT Combined Cycle Combustion Turbine Part CS Combined Cycle Single Shaft CC Combined Cycle Total Unit HA Hydrokinetic, Axial Flow Turbine HB Hydrokinetic, Wave Buoy HK Hydrokinetic, Other
HY Hydroelectric Turbine (including turbines associated with delivery of water by pipeline)
BT Turbines Used in a Binary Cycle (including those used for geothermal applications)
PV Photovoltaic WT Wind Turbine, Onshore WS Wind Turbine, Offshore FC Fuel Cell OT Other
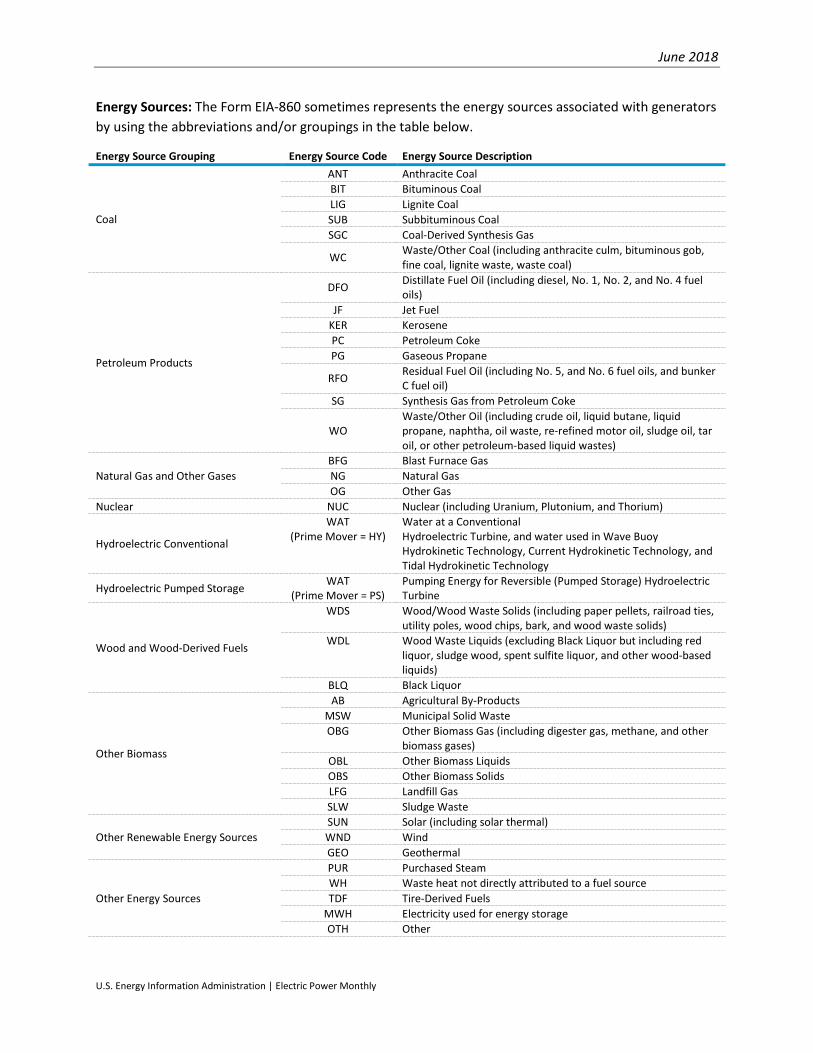
June 2018
U.S. Energy Information Administration | Electric Power Monthly
Energy Sources: The Form EIA-860 sometimes represents the energy sources associated with generators by using the abbreviations and/or groupings in the table below.
Energy Source Grouping Energy Source Code Energy Source Description
Coal
ANT Anthracite Coal BIT Bituminous Coal LIG Lignite Coal SUB Subbituminous Coal SGC Coal-Derived Synthesis Gas
WC Waste/Other Coal (including anthracite culm, bituminous gob, fine coal, lignite waste, waste coal)
Petroleum Products
DFO Distillate Fuel Oil (including diesel, No. 1, No. 2, and No. 4 fuel oils)
JF Jet Fuel KER Kerosene PC Petroleum Coke PG Gaseous Propane
RFO Residual Fuel Oil (including No. 5, and No. 6 fuel oils, and bunker C fuel oil)
SG Synthesis Gas from Petroleum Coke
WO Waste/Other Oil (including crude oil, liquid butane, liquid propane, naphtha, oil waste, re-refined motor oil, sludge oil, tar oil, or other petroleum-based liquid wastes)
Natural Gas and Other Gases BFG Blast Furnace Gas NG Natural Gas OG Other Gas
Nuclear NUC Nuclear (including Uranium, Plutonium, and Thorium)
Hydroelectric Conventional
WAT (Prime Mover = HY)
Water at a Conventional Hydroelectric Turbine, and water used in Wave Buoy Hydrokinetic Technology, Current Hydrokinetic Technology, and Tidal Hydrokinetic Technology
Hydroelectric Pumped Storage WAT (Prime Mover = PS)
Pumping Energy for Reversible (Pumped Storage) Hydroelectric Turbine
Wood and Wood-Derived Fuels
WDS Wood/Wood Waste Solids (including paper pellets, railroad ties, utility poles, wood chips, bark, and wood waste solids)
WDL Wood Waste Liquids (excluding Black Liquor but including red liquor, sludge wood, spent sulfite liquor, and other wood-based liquids)
BLQ Black Liquor
Other Biomass
AB Agricultural By-Products MSW Municipal Solid Waste OBG Other Biomass Gas (including digester gas, methane, and other
biomass gases) OBL Other Biomass Liquids OBS Other Biomass Solids LFG Landfill Gas SLW Sludge Waste
Other Renewable Energy Sources SUN Solar (including solar thermal) WND Wind GEO Geothermal
Other Energy Sources
PUR Purchased Steam WH Waste heat not directly attributed to a fuel source TDF Tire-Derived Fuels
MWH Electricity used for energy storage OTH Other
June 2018
U.S. Energy Information Administration | Electric Power Monthly
Sensitive data: The tested heat rate data collected on the Form EIA-860 are considered business sensitive.
Form EIA-860M The Form EIA 860M, “Monthly Update to the Annual Electric Generator Report,” is a mandatory monthly survey that collects data on the status of proposed new generators or changes to existing generators for plants that report on Form EIA-860.
The Form EIA-860M has a rolling frame based upon planned changes to capacity as reported on the previous Form EIA-860. Respondents are added to the frame 12 months prior to the expected effective date for all new units or expected retirement date for existing units. For all other types of capacity changes (including retirements, uprates, derates, repowering, or other modifications), respondents are added 1 month prior to the anticipated modification change date. Respondents are removed from the frame at the completion of the changes or if the change date is moved back so that the plant no longer qualifies to be in the frame. Typically, 150 to 200 utilities per month are required to report for 175 to 250 plants (including 250 to 400 generating units) on this form. The unit characteristics of interest are changes to the previously reported planned operating month and year, prime mover type, capacity, and energy sources.
Instrument and design history: The data collected on Form EIA-860M was originally collected via phone calls at the end of each month. During 2005, the Form EIA-860M was introduced as a mandatory form using the Internet Data Collection (IDC) system.
The legislative authority to collect these data is defined in the Federal Energy Administration Act of 1974 (Public Law 93-275, Sec. 13(b), 5(a), 5(b), 52).
Data processing and data system editing: Approximately 150 to 200 utilities are requested to provide data each month on the Form EIA 860M. These data are collected via the IDC system and automatically checked for certain errors. Most of the quality assurance issues are addressed by the respondents as part of the automatic edit check process. In some cases, respondents are subsequently contacted about their explanatory overrides to the edit checks.
Sensitive data: Data collected on the Form EIA-860M are not considered to be sensitive.
Form EIA-861 The Form EIA 861, “Annual Electric Power Industry Report,” is a mandatory census of electric power industry participants in the United States. The survey is used to collect information on power sales and revenue data from approximately 3,300 respondents. About 3,200 are electric utilities and the remainder are nontraditional utilities such as energy service providers or the unregulated subsidiaries of electric utilities and power marketers.
June 2018
U.S. Energy Information Administration | Electric Power Monthly
Instrument and design history: The Form EIA 861 was implemented in January 1985 for collection of data as of year end 1984. The Federal Energy Administration Act of 1974 (Public Law 93 275) defines the legislative authority to collect these data.
Data processing and data system editing: The Form EIA 861 is made available to the respondents in January of each year to collect data as of the end of the preceding calendar year. The data are edited when entered into the interactive on line system. Internal edit checks are per-formed to verify that current data total across and between schedules, and are comparable to data reported the previous year. Edit checks are also performed to compare data reported on the Form EIA 861 and similar data reported on the Form EIA 826. Respondents are telephoned to obtain clarification of reported data and to obtain missing data.
Data for the Form EIA 861 are collected at the owner level from all electric utilities including energy service providers in the United States, its territories, and Puerto Rico. Form EIA 861 data in this report are for the United States only.
Average price of electricity to ultimate consumers represents the cost per unit of electricity sold and is calculated by dividing electric revenue from ultimate consumers by the corresponding sales of electricity. The average price of electricity to ultimate consumers is calculated for all consumers and for each end-use sector.
The electric revenue used to calculate the average price of electricity to ultimate consumers is the operating revenue reported by the electric power industry participant. Operating revenue includes energy charges, demand charges, consumer service charges, environmental surcharges, fuel adjustments, and other miscellaneous charges. Electric power industry participant operating revenues also include State and Federal income taxes and other taxes paid by the utility.
The average price of electricity to ultimate consumers reported in this publication by sector represents a weighted average of consumer revenue and sales, and does not equal the per kWh rate charged by the electric power industry participant to the individual consumers. Electric utilities typically employ a number of rate schedules within a single sector. These alternative rate schedules reflect the varying consumption levels and patterns of consumers and their associated impact on the costs to the electric power industry participant for providing electrical service.
Sensitive data: Data collected on the Form EIA-861 are not considered to be sensitive.
Form EIA-923 Form EIA-923, “Power Plant Operations Report,” is a monthly collection of data on receipts and cost of fossil fuels, fuel stocks, generation, consumption of fuel for generation, and environmental data (e.g. emission controls and cooling systems). Data are collected from a monthly sample of approximately 1,900 plants, which includes a census of nuclear and pumped-storage hydroelectric plants. In addition approximately 4,050 plants, representing all other generators 1 MW or greater, are collected annually. In addition to electric power generating plants, respondents include fuel storage terminals without
June 2018
U.S. Energy Information Administration | Electric Power Monthly
generating capacity that receive shipments of fossil fuels for eventual use in electric power generation. The monthly data are due by the last day of the month following the reporting period. Receipts of fossil fuels, fuel cost and quality information, and fuel stocks at the end of the reporting period are all reported at the plant level. Plants that burn organic fuels and have a steam turbine capacity of at least 10 megawatts report consumption at the boiler level and generation at the generator level. For all other plants, consumption is reported at the prime-mover level. For these plants, generation is reported either at the prime-mover level or, for noncombustible sources (e.g. wind, nuclear), at the prime-mover and energy source level. The source and disposition of electricity is reported annually for nonutilities at the plant level as is revenue from sales for resale. Environmental data are collected annually from facilities that have a steam turbine capacity of at least 10 megawatts.
Instrument and design history:
Receipts and cost and quality of fossil fuels On July 7, 1972, the Federal Power Commission (FPC) issued Order Number 453 enacting the New Code of Federal Regulations, Section 141.61, legally creating the FPC Form 423. Originally, the form was used to collect data only on fossil steam plants, but was amended in 1974 to include data on internal- combustion and combustion-turbine units. The FERC Form 423 replaced the FPC Form 423 in January 1983. The FERC Form 423 eliminated peaking units, for which data were previously collected on the FPC Form 423. In addition, the generator nameplate capacity threshold was changed from 25 megawatts to 50 megawatts. This reduction in coverage eliminated approximately 50 utilities and 250 plants. All historical FPC Form 423 data in this publication were revised to reflect the new generator-nameplate- capacity threshold of 50 or more megawatts reported on the FERC Form 423. In January 1991, the collection of data on the FERC Form 423 was extended to include combined cycle units. Historical data have not been revised to include these units. Starting with the January 1993 data, the FERC began to collect the data directly from the respondents. The Form EIA-423 was originally implemented in January 2002 to collect monthly cost and quality data for fossil fuel receipts from owners or operators of nonutility electricity generating plants. Due to the restructuring of the electric power industry, many plants which had historically submitted this information for utility plants on the FERC Form 423 (see above) were being transferred to the nonutility sector. As a result, a large percentage of fossil fuel receipts were no longer being reported. The Form EIA-423 was implemented to fill this void and to capture the data associated with existing non-regulated power producers. Its design closely followed that of the FERC Form 423.
Both the Form EIA-423 and FERC Form 423 were superseded by Schedule 2 of the Form EIA-923 in January of 2008. A t t h e t i m e , t he Form EIA-923 maintained the 50-megawatt threshold for these data. In January 2013, the threshold was changed to 200 megawatts for plants primarily fueled by natural gas, petroleum coke, distillate fuel oil, and residual fuel oil. The requirement to report self-produced and minor fuels, i.e., blast furnace gas, other manufactured gases, kerosene, jet fuel, propane, and waste oils was eliminated. The threshold for coal plants remained at 50 megawatts.
June 2018
U.S. Energy Information Administration | Electric Power Monthly
Not all data are collected monthly on the Form EIA-923. Beginning with 2008 data, a sample of the respondents report monthly, with the remainder reporting annually. Until January 2013, monthly fuel receipts values for the annual surveys were imputed via regression. P r i o r t o 2008, Schedule 2 annual data were not collected or imputed.
Generation, consumption, and stocks
The Bureau of Census and the U.S. Geological Survey collected, compiled, and published data on the electric power industry prior to 1936. After 1936, the Federal Power Commission (FPC) assumed all data collection and publication responsibilities for the electric power industry and implemented the Form FPC-4. The Federal Power Act, Section 311 and 312, and FPC Order 141 defined the legislative authority to collect power production data. The Form EIA-759 replaced the Form FPC-4 in January 1982. In 1996, the Form EIA-900 was initiated to collect sales for resale data from unregulated entities14. In 1998, the form was modified to collect sales for resale, gross generation, and sales to end user data. In 1999, the form was modified to collect net generation, consumption, and ending stock data15. In 2000, the form was modified to include the production of useful thermal output data. In January 2001, Form EIA-906 superseded Forms EIA-759 and EIA-900. In January 2004, Form EIA-920 superseded Form EIA-906 for those plants defined as combined heat and power plants; all other plants that generate electricity continue to report on Form EIA-906. The Federal Energy Administration Act of 1974 (Public Law 93-275) defines the legislative authority to collect these data. Forms EIA-906 and EIA-920 were superseded by survey Form EIA-923 beginning in January 2008 with the collection of annual 2007 data and monthly 2008 data.
Data processing and data system editing: Respondents are encouraged to enter data directly into a computerized database via the Internet Data Collection (IDC) system. A variety of automated quality control mechanisms are run during this process, such as range checks and comparisons with historical data. These edit checks are performed as the data are provided, and many problems that are encountered are resolved during the reporting process. Those plants that are unable to use the electronic reporting medium provide the data in hard copy, typically via fax. These data are manually entered into the computerized database. The data are subjected to the same edits as those that are electronically submitted. If the reported data appear to be in error and the data issue cannot be resolved by follow up contact with the respondent, or if a facility is a nonrespondent, a regression methodology is used to impute for the facility. Beginning in January 2013, imputation is not performed for fuel receipts data reported on Schedule 2. Imputation: For select survey data elements collected monthly, regression prediction, or imputation, is done for missing data, including non-sampled units and any non-respondents. For data collected annually, imputation is performed for non-respondents. For gross generation and total fuel
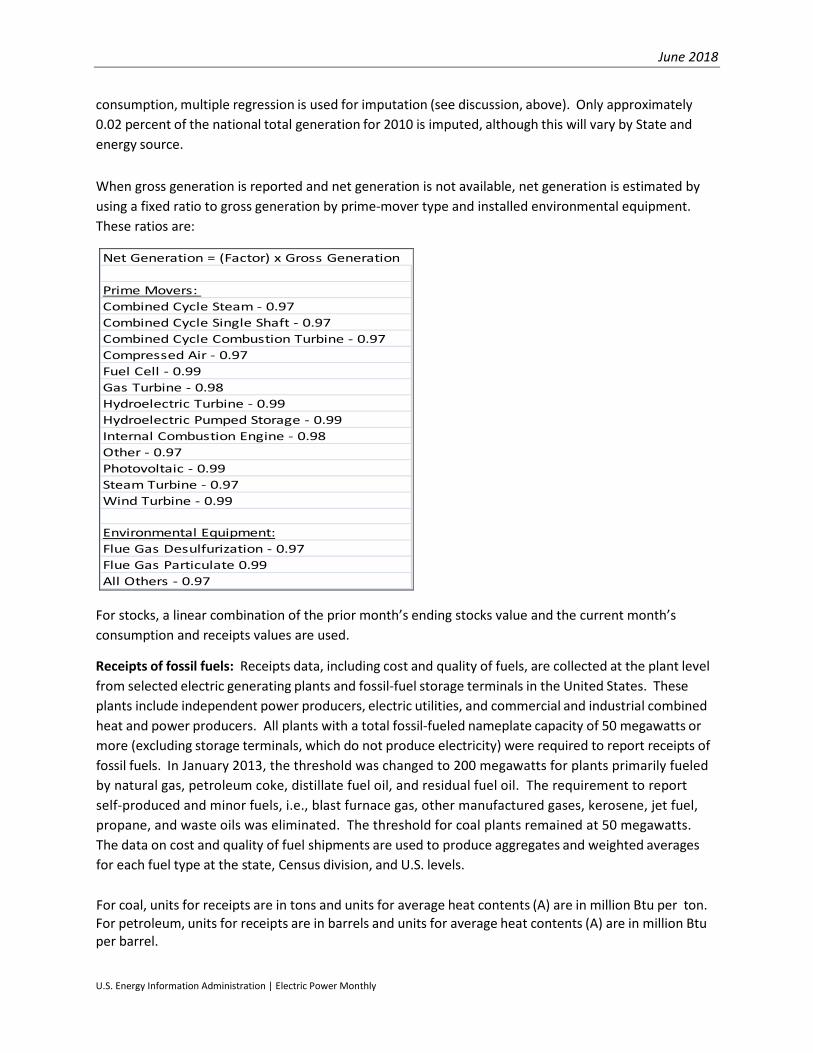
June 2018
U.S. Energy Information Administration | Electric Power Monthly
consumption, multiple regression is used for imputation (see discussion, above). Only approximately 0.02 percent of the national total generation for 2010 is imputed, although this will vary by State and energy source.
When gross generation is reported and net generation is not available, net generation is estimated by using a fixed ratio to gross generation by prime-mover type and installed environmental equipment. These ratios are:
Prime Movers: Combined Cycle Steam - 0.97Combined Cycle Single Shaft - 0.97Combined Cycle Combustion Turbine - 0.97Compressed Air - 0.97Fuel Cell - 0.99Gas Turbine - 0.98Hydroelectric Turbine - 0.99Hydroelectric Pumped Storage - 0.99Internal Combustion Engine - 0.98Other - 0.97Photovoltaic - 0.99Steam Turbine - 0.97Wind Turbine - 0.99
Environmental Equipment:Flue Gas Desulfurization - 0.97Flue Gas Particulate 0.99All Others - 0.97
Net Generation = (Factor) x Gross Generation
For stocks, a linear combination of the prior month’s ending stocks value and the current month’s consumption and receipts values are used.
Receipts of fossil fuels: Receipts data, including cost and quality of fuels, are collected at the plant level from selected electric generating plants and fossil-fuel storage terminals in the United States. These plants include independent power producers, electric utilities, and commercial and industrial combined heat and power producers. All plants with a total fossil-fueled nameplate capacity of 50 megawatts or more (excluding storage terminals, which do not produce electricity) were required to report receipts of fossil fuels. In January 2013, the threshold was changed to 200 megawatts for plants primarily fueled by natural gas, petroleum coke, distillate fuel oil, and residual fuel oil. The requirement to report self-produced and minor fuels, i.e., blast furnace gas, other manufactured gases, kerosene, jet fuel, propane, and waste oils was eliminated. The threshold for coal plants remained at 50 megawatts. The data on cost and quality of fuel shipments are used to produce aggregates and weighted averages for each fuel type at the state, Census division, and U.S. levels.
For coal, units for receipts are in tons and units for average heat contents (A) are in million Btu per ton. For petroleum, units for receipts are in barrels and units for average heat contents (A) are in million Btu per barrel.
June 2018
U.S. Energy Information Administration | Electric Power Monthly
For gas, units for receipts are in thousand cubic feet (Mcf) and units for average heat contents (A) are in million Btu per thousand cubic foot. Power production, fuel stocks, and fuel consumption data: The Bureau of Census and the U.S. Geological Survey collected, compiled, and published data on the electric power industry prior to 1936. After 1936, the Federal Power Commission (FPC) assumed all data collection and publication responsibilities for the electric power industry and implemented the Form FPC-4. The Federal Power Act, Section 311 and 312, and FPC Order 141 defined the legislative authority to collect power production data. The Form EIA-759 replaced the Form FPC-4 in January 1982.
In 1996, the Form EIA-900 was initiated to collect sales for resale data from unregulated entities. In 1998, the form was modified to collect sales for resale, gross generation, and sales to end user data. In 1999, the form was modified to collect net generation, consumption, and ending stock data. In 2000, the form was modified to include the production of useful thermal output data.
In January 2001, Form EIA-906 superseded Forms EIA-759 and EIA-900. In January 2004, Form EIA-920 superseded Form EIA-906 for those plants defined as combined heat and power plants; all other plants that generate electricity continue to report on Form EIA-906. The Federal Energy Administration Act of 1974 (Public Law 93 275) defines the legislative authority to collect these data.
In January 2004, Form EIA-920 superseded Form EIA-906 for those plants defined as combined heat and power plants; all other plants that generate electricity continue to report on Form EIA-906.
In January 2008, Form EIA-923 superseded both the Forms EIA-906 and EIA-920 for the collection of these data.
Methodology to estimate biogenic and non-biogenic municipal solid waste2: Municipal solid waste (MSW) consumption for generation of electric power is split into its biogenic and non-biogenic components beginning with 2001 data by the following methodology:
The tonnage of MSW consumed is reported on the Form EIA-923. The composition of MSW and categorization of the components were obtained from the Environmental Protection Agency publication, Municipal Solid Waste in the United States: 2005 Facts and Figures. The Btu contents of the components of MSW were obtained from various sources.
The potential quantities of combustible MSW discards (which include all MSW material available for combustion with energy recovery, discards to landfill, and other disposal) were multiplied by their respective Btu contents. The EPA-based categories of MSW were then classified into renewable and non-renewable groupings. From this, EIA calculated how much of the energy potentially consumed from MSW was attributed to biogenic components and how much to non-biogenic components (see Tables 1 and 2, below). 3
These values are used to allocate net generation published in the Electric Power Monthly generation tables. The tons of biogenic and non-biogenic components were estimated with the assumption that glass and metals were removed prior to combustion. The average Btu/ton for the biogenic and non-
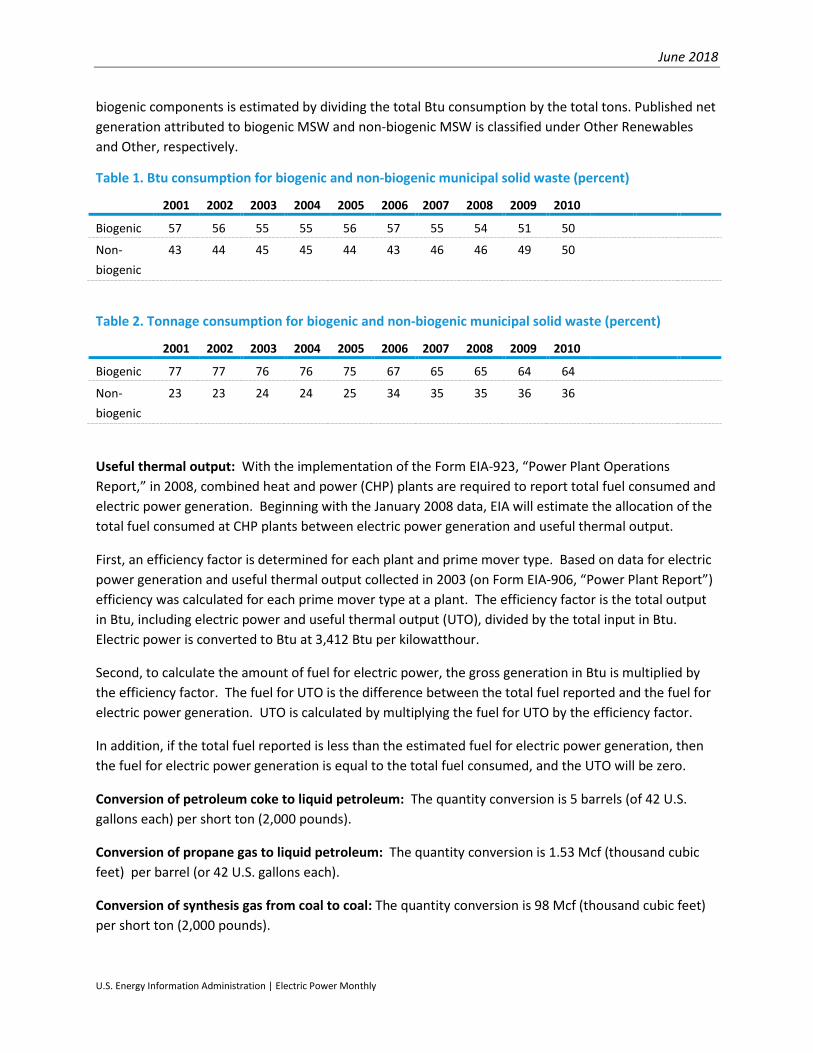
June 2018
U.S. Energy Information Administration | Electric Power Monthly
biogenic components is estimated by dividing the total Btu consumption by the total tons. Published net generation attributed to biogenic MSW and non-biogenic MSW is classified under Other Renewables and Other, respectively.
Table 1. Btu consumption for biogenic and non-biogenic municipal solid waste (percent)
2001 2002 2003 2004 2005 2006 2007 2008 2009 2010
Biogenic 57 56 55 55 56 57 55 54 51 50
Non-biogenic
43 44 45 45 44 43 46 46 49 50
Table 2. Tonnage consumption for biogenic and non-biogenic municipal solid waste (percent)
2001 2002 2003 2004 2005 2006 2007 2008 2009 2010
Biogenic 77 77 76 76 75 67 65 65 64 64
Non-biogenic
23 23 24 24 25 34 35 35 36 36
Useful thermal output: With the implementation of the Form EIA-923, “Power Plant Operations Report,” in 2008, combined heat and power (CHP) plants are required to report total fuel consumed and electric power generation. Beginning with the January 2008 data, EIA will estimate the allocation of the total fuel consumed at CHP plants between electric power generation and useful thermal output.
First, an efficiency factor is determined for each plant and prime mover type. Based on data for electric power generation and useful thermal output collected in 2003 (on Form EIA-906, “Power Plant Report”) efficiency was calculated for each prime mover type at a plant. The efficiency factor is the total output in Btu, including electric power and useful thermal output (UTO), divided by the total input in Btu. Electric power is converted to Btu at 3,412 Btu per kilowatthour.
Second, to calculate the amount of fuel for electric power, the gross generation in Btu is multiplied by the efficiency factor. The fuel for UTO is the difference between the total fuel reported and the fuel for electric power generation. UTO is calculated by multiplying the fuel for UTO by the efficiency factor.
In addition, if the total fuel reported is less than the estimated fuel for electric power generation, then the fuel for electric power generation is equal to the total fuel consumed, and the UTO will be zero.
Conversion of petroleum coke to liquid petroleum: The quantity conversion is 5 barrels (of 42 U.S. gallons each) per short ton (2,000 pounds).
Conversion of propane gas to liquid petroleum: The quantity conversion is 1.53 Mcf (thousand cubic feet) per barrel (or 42 U.S. gallons each).
Conversion of synthesis gas from coal to coal: The quantity conversion is 98 Mcf (thousand cubic feet) per short ton (2,000 pounds).
June 2018
U.S. Energy Information Administration | Electric Power Monthly
Conversion of synthesis gas from petroleum coke to petroleum coke: The quantity conversion is 107.42 Mcf (thousand cubic feet) per short ton (2,000 pounds).
Issues within historical data series:
Receipts and cost and quality of fossil fuels Values for receipts of natural gas for 2001 forward do not include blast furnace gas or other gas.
Historical data collected on FERC Form 423 and published by EIA have been reviewed for consistency between volumes and prices and for their consistency over time. However, these data were collected by FERC for regulatory rather than statistical and publication purposes. EIA did not attempt to resolve any late filing issues in the FERC Form 423 data. In 2003, EIA introduced a procedure to estimate for late or non-responding entities due to report on the FERC Form 423. Due to the introduction of this procedure, 2003 and later data cannot be directly compared to previous years’ data. In January 2013, this estimation procedure was dropped.
Prior to 2008, regulated plants reported receipts data on the FERC Form 423. These plants, along with unregulated plants, now report receipts data on Schedule 2 of Form EIA-923. Because FERC issued waivers to the FERC Form 423 filing requirements to some plants who met certain criteria, and because not all types of generators were required to report (only steam turbines and combined-cycle units reported), a significant number of plants either did not submit fossil fuel receipts data or submitted only a portion of their fossil fuel receipts. Since Form EIA-923 does not have exemptions based on generator type or reporting waivers, receipts data from 2008 and later cannot be directly compared to previous years’ data for the regulated sector. Furthermore, there may be a notable increase in fuel receipts beginning with January 2008 data.
Starting with the revised data for 2008, tables for total receipts begin to reflect estimation for all plants with capacity over 1 megawatt, to be consistent with other electric power data. Previous receipts data published have been a legacy of their original collection as information for a regulatory agency, not as a survey to provide more meaningful estimates of totals for statistical purposes. Totals appeared to become smaller as more electric production came from unregulated plants, until the Form EIA-423 was created to help fill that gap. As a further improvement, estimation of all receipts for the universe normally depicted in the EPM (i.e., 1 megawatt and above), with associated relative standard errors, provides a more complete assessment of the market.
Generation and consumption Beginning in 2008, a new method of allocating fuel consumption between electric power generation and useful thermal output (UTO) was implemented. This new methodology evenly distributes a combined heat and power (CHP) plant’s losses between the two output products (electric power and UTO). In the historical data, UTO was consistently assumed to be 80 percent efficient and all other losses at the plant were allocated to electric power. This change causes the fuel for electric power to be decreased while the fuel for UTO is increased as both are given the same efficiency. This results in the appearance of an increase in efficiency of production of electric power between periods.
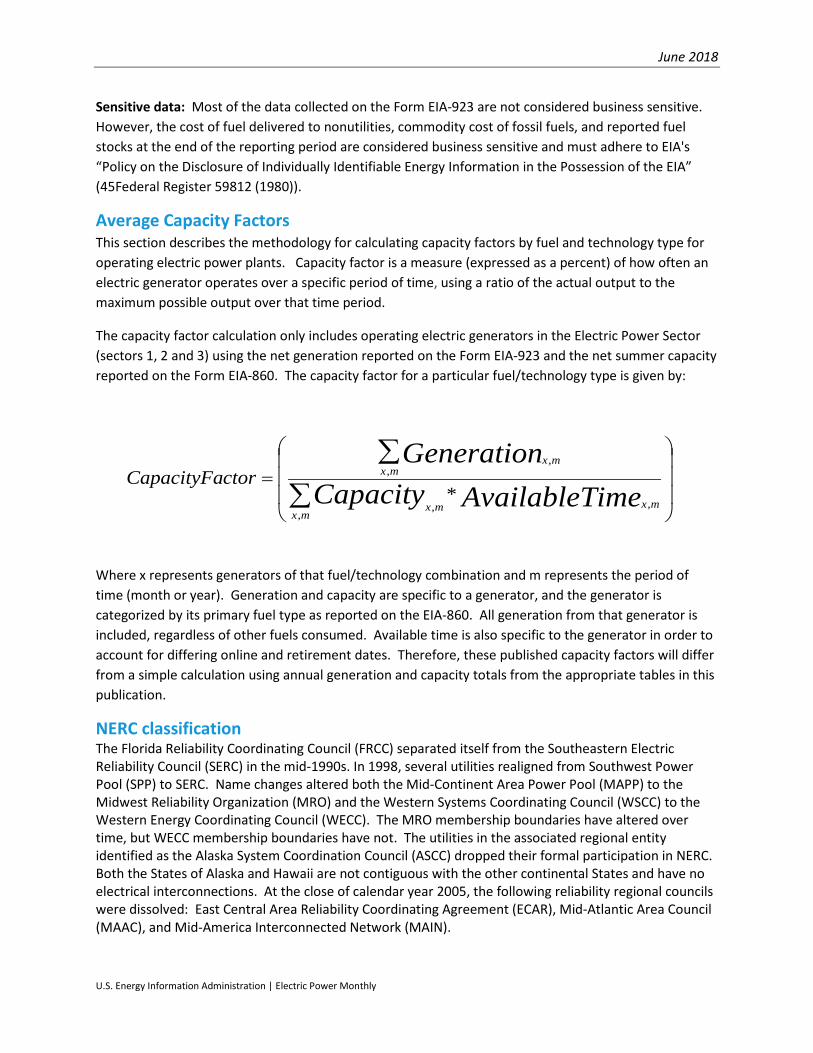
June 2018
U.S. Energy Information Administration | Electric Power Monthly
ctorCapacityFa
mxmxmx
mxmx
imeAvailableTCapacityGeneration
=∑
∑
,,,
,,
*
Sensitive data: Most of the data collected on the Form EIA-923 are not considered business sensitive. However, the cost of fuel delivered to nonutilities, commodity cost of fossil fuels, and reported fuel stocks at the end of the reporting period are considered business sensitive and must adhere to EIA's “Policy on the Disclosure of Individually Identifiable Energy Information in the Possession of the EIA” (45Federal Register 59812 (1980)).
Average Capacity Factors This section describes the methodology for calculating capacity factors by fuel and technology type for operating electric power plants. Capacity factor is a measure (expressed as a percent) of how often an electric generator operates over a specific period of time, using a ratio of the actual output to the maximum possible output over that time period.
The capacity factor calculation only includes operating electric generators in the Electric Power Sector (sectors 1, 2 and 3) using the net generation reported on the Form EIA-923 and the net summer capacity reported on the Form EIA-860. The capacity factor for a particular fuel/technology type is given by:
Where x represents generators of that fuel/technology combination and m represents the period of time (month or year). Generation and capacity are specific to a generator, and the generator is categorized by its primary fuel type as reported on the EIA-860. All generation from that generator is included, regardless of other fuels consumed. Available time is also specific to the generator in order to account for differing online and retirement dates. Therefore, these published capacity factors will differ from a simple calculation using annual generation and capacity totals from the appropriate tables in this publication.
NERC classification The Florida Reliability Coordinating Council (FRCC) separated itself from the Southeastern Electric Reliability Council (SERC) in the mid-1990s. In 1998, several utilities realigned from Southwest Power Pool (SPP) to SERC. Name changes altered both the Mid-Continent Area Power Pool (MAPP) to the Midwest Reliability Organization (MRO) and the Western Systems Coordinating Council (WSCC) to the Western Energy Coordinating Council (WECC). The MRO membership boundaries have altered over time, but WECC membership boundaries have not. The utilities in the associated regional entity identified as the Alaska System Coordination Council (ASCC) dropped their formal participation in NERC. Both the States of Alaska and Hawaii are not contiguous with the other continental States and have no electrical interconnections. At the close of calendar year 2005, the following reliability regional councils were dissolved: East Central Area Reliability Coordinating Agreement (ECAR), Mid-Atlantic Area Council (MAAC), and Mid-America Interconnected Network (MAIN).
June 2018
U.S. Energy Information Administration | Electric Power Monthly
On January 1, 2006, the ReliabilityFirst Corporation (RFC) came into existence as a new regional reliability council. Individual utility membership in the former ECAR, MAAC, and MAIN councils mostly shifted to RFC. However, adjustments in membership as utilities joined or left various reliability councils impacted MRO, SERC, and SPP. The Texas Regional Entity (TRE) was formed from a delegation of authority from NERC to handle the regional responsibilities of the Electric Reliability Council of Texas (ERCOT). The revised delegation agreements covering all the regions were approved by the Federal Energy Regulatory Commission on March 21, 2008. Reliability Councils that are unchanged include: Florida Reliability Coordinating Council (FRCC), Northeast Power Coordinating Council (NPCC), and the Western Energy Coordinating Council (WECC
The new NERC Regional Council names are as follows:
• Florida Reliability Coordinating Council (FRCC), • Midwest Reliability Organization (MRO), • Northeast Power Coordinating Council (NPCC), • ReliabilityFirst Corporation (RFC), • Southeastern Electric Reliability Council (SERC), • Southwest Power Pool (SPP), • Texas Regional Entity (TRE), and • Western Energy Coordinating Council (WECC).
Business classification Nonutility power producers consist of corporations, persons, agencies, authorities, or other legal entities that own or operate facilities for electric generation but are not electric utilities. This includes qualifying cogenerators, small power producer, and independent power producers. Furthermore, nonutility power producers do not have a designated franchised service area. In addition to entities whose primary business is the production and sale of electric power, entities with other primary business classifications can and do sell electric power. These can consist of manufacturing, agricultural, forestry, transportation, finance, service and administrative industries, based on the Office of Management and Budget's Standard Industrial Classification (SIC) Manual. In 1997, the SIC Manual name was changed to North American Industry Classification System (NAICS). The following is a list of the main classifications and the category of primary business activity within each classification.
Agriculture, Forestry, and Fishing
111 Agriculture production-crops 112 Agriculture production, livestock and animal specialties 113 Forestry 114 Fishing, hunting, and trapping 115 Agricultural services
Mining
211 Oil and gas extraction 2121 Coal mining 2122 Metal mining
June 2018
U.S. Energy Information Administration | Electric Power Monthly
2123 Mining and quarrying of nonmetallic minerals except fuels Construction
23
Manufacturing
311 Food and kindred products 3122 Tobacco products 314 Textile and mill products 315 Apparel and other finished products made from fabrics and similar materials 316 Leather and leather products 321 Lumber and wood products, except furniture 322 Paper and allied products (other than 322122
or 32213) 322122 Paper mills, except building paper 32213 Paperboard mills 323 Printing and publishing 324 Petroleum refining and related industries (other than 32411) 32411 Petroleum refining 325 Chemicals and allied products (other than
325188, 325211, 32512, or 325311) 32512 Industrial organic chemicals 325188 Industrial Inorganic Chemicals 325211 Plastics materials and resins 325311 Nitrogenous fertilizers 326 Rubber and miscellaneous plastic products 327 Stone, clay, glass, and concrete products (other than 32731) 32731 Cement, hydraulic 331 Primary metal industries (other than 331111 or 331312) 331111 Blast furnaces and steel mills 331312 Primary aluminum 332 Fabricated metal products, except machinery and transportation equipment 333 Industrial and commercial equipment and components except computer equipment 3345 Measuring, analyzing, and controlling instruments, photographic, medical, and optical goods,
watches and clocks 335 Electronic and other electrical equipment and components except computer equipment 336 Transportation equipment 337 Furniture and fixtures 339 Miscellaneous manufacturing industries
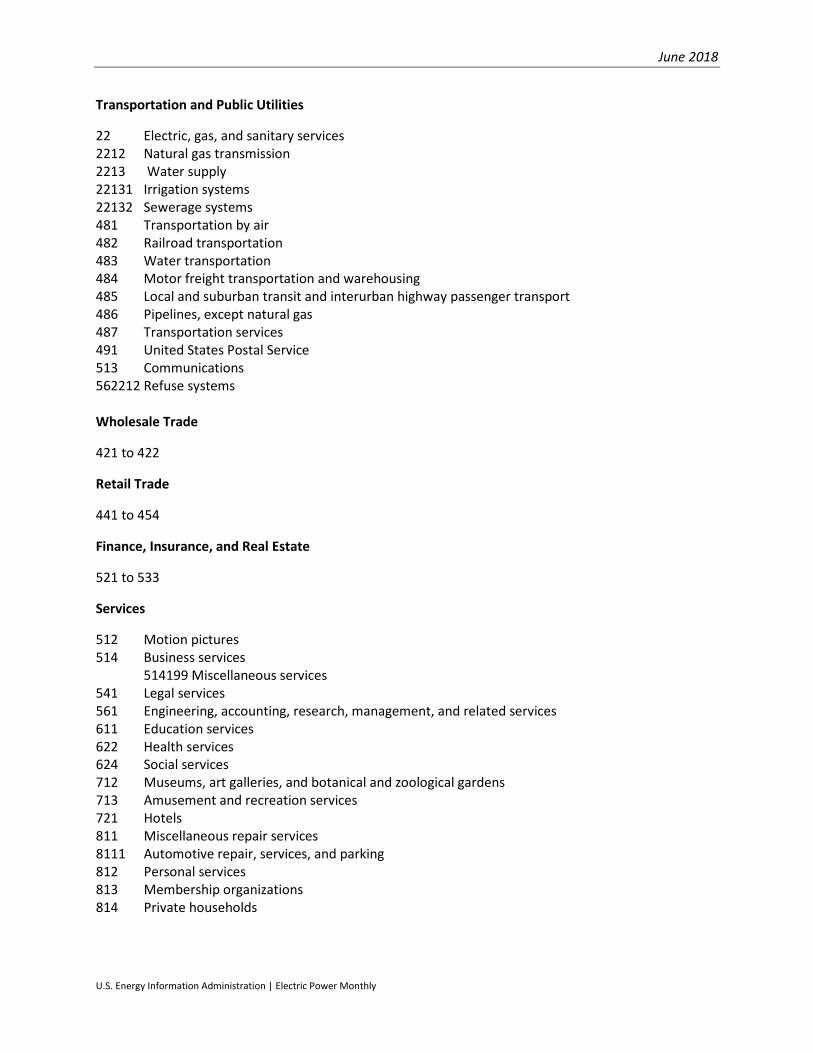
June 2018
U.S. Energy Information Administration | Electric Power Monthly
Transportation and Public Utilities
22 Electric, gas, and sanitary services 2212 Natural gas transmission 2213 Water supply 22131 Irrigation systems 22132 Sewerage systems 481 Transportation by air 482 Railroad transportation 483 Water transportation 484 Motor freight transportation and warehousing 485 Local and suburban transit and interurban highway passenger transport 486 Pipelines, except natural gas 487 Transportation services 491 United States Postal Service 513 Communications 562212 Refuse systems Wholesale Trade
421 to 422
Retail Trade
441 to 454
Finance, Insurance, and Real Estate
521 to 533
Services
512 Motion pictures 514 Business services
514199 Miscellaneous services 541 Legal services 561 Engineering, accounting, research, management, and related services 611 Education services 622 Health services 624 Social services 712 Museums, art galleries, and botanical and zoological gardens 713 Amusement and recreation services 721 Hotels 811 Miscellaneous repair services 8111 Automotive repair, services, and parking 812 Personal services 813 Membership organizations 814 Private households
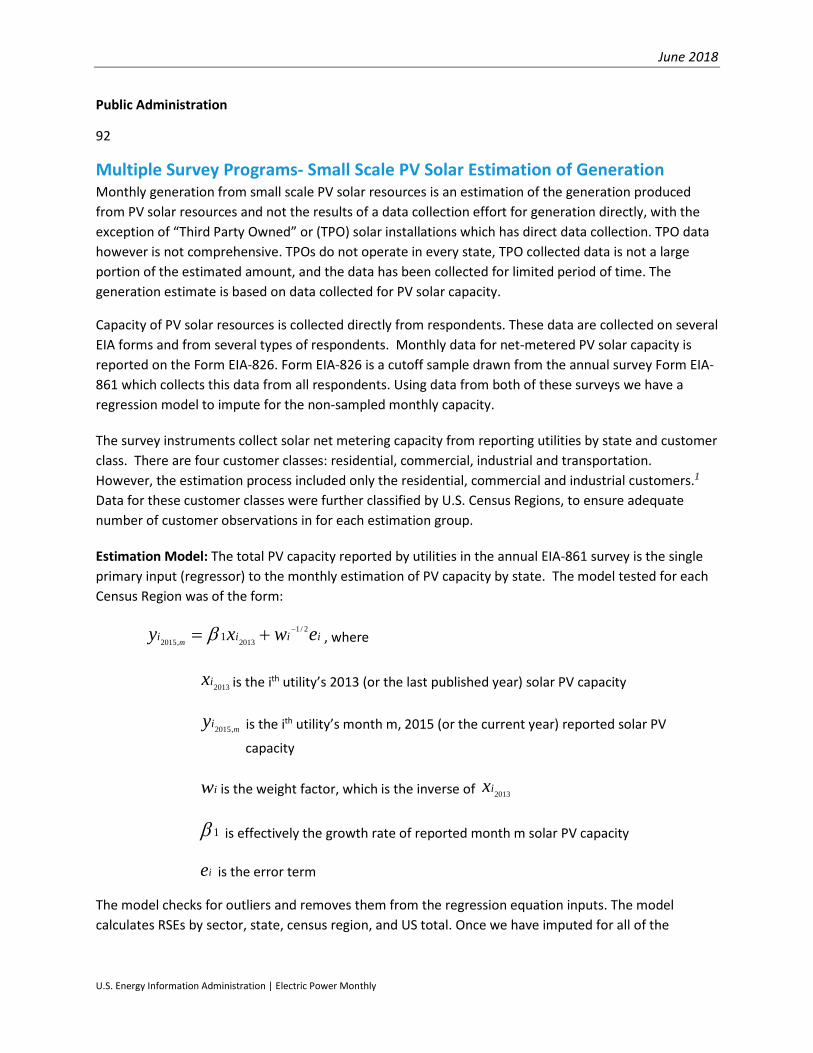
June 2018
U.S. Energy Information Administration | Electric Power Monthly
Public Administration
92
Multiple Survey Programs- Small Scale PV Solar Estimation of Generation Monthly generation from small scale PV solar resources is an estimation of the generation produced from PV solar resources and not the results of a data collection effort for generation directly, with the exception of “Third Party Owned” or (TPO) solar installations which has direct data collection. TPO data however is not comprehensive. TPOs do not operate in every state, TPO collected data is not a large portion of the estimated amount, and the data has been collected for limited period of time. The generation estimate is based on data collected for PV solar capacity.
Capacity of PV solar resources is collected directly from respondents. These data are collected on several EIA forms and from several types of respondents. Monthly data for net-metered PV solar capacity is reported on the Form EIA-826. Form EIA-826 is a cutoff sample drawn from the annual survey Form EIA-861 which collects this data from all respondents. Using data from both of these surveys we have a regression model to impute for the non-sampled monthly capacity.
The survey instruments collect solar net metering capacity from reporting utilities by state and customer class. There are four customer classes: residential, commercial, industrial and transportation. However, the estimation process included only the residential, commercial and industrial customers.1 Data for these customer classes were further classified by U.S. Census Regions, to ensure adequate number of customer observations in for each estimation group.
Estimation Model: The total PV capacity reported by utilities in the annual EIA-861 survey is the single primary input (regressor) to the monthly estimation of PV capacity by state. The model tested for each Census Region was of the form:
iiii ewxy m
2/1
2013,2015 1−+= β , where
2013ix is the ith utility’s 2013 (or the last published year) solar PV capacity
miy ,2015 is the ith utility’s month m, 2015 (or the current year) reported solar PV
capacity
iw is the weight factor, which is the inverse of 2013ix
1β is effectively the growth rate of reported month m solar PV capacity
ie is the error term
The model checks for outliers and removes them from the regression equation inputs. The model calculates RSEs by sector, state, census region, and US total. Once we have imputed for all of the
June 2018
U.S. Energy Information Administration | Electric Power Monthly
monthly net-metered PV solar capacity we add to total net metered capacity, the PV solar capacity collected on the Form EIA-861 for distributed and dispersed resources that are not net metered.
We use a second model to estimate the generation using this capacity as an input. The original methodology was developed for the “Annual Energy Outlook” based on our “NEMS” modelled projections several years ago. The original method underwent a calibration project designed to develop PV production levels for the NEMS projections consistent with simulations of a National Renewable Energy Laboratory model called PVWatts, which is itself embedded in PC software under the umbrella of the NREL’s System Advisor Model (SAM).
The PVWatts simulations require, panel azimuth orientations and tilts, something that the NEMS projections do not include. Call the combinations of azimuths and tilts “orientations.” The orientation and solar insolation (specific to a location) have a direct effect on the PV production level. The calibration project selected the 100 largest population Metropolitan Statistical Areas (MSAs) and relied on weights derived from orientation data from California Solar Initiative dataset to develop typical outputs for each of the 100 MSAs. It then was expanded from an annual estimate to a monthly estimate. A further description of this model is located here. A listing of the MSAs are included in Appendix 1.
Using Form EIA-861 data for service territories, which lists the counties that each electric distribution company (EDC) provides service, and NREL solar insolation data by county a simple average of insolation values by EDC is calculated.
Using the estimation model, we produce by utility, by state and by sector an estimate of generation. All the utilities’’ capacity and generation estimates are summed by state and sector and a KWh/KW rate by state and sector is calculated.
Capacity from the Form EIA-860 that is net metered is subtracted from the total capacity by state and sector as well as the capacity reported on the EIA-826 from TPOs, resulting in a new “net” capacity amount. This capacity amount is multiplied by the KWh/KW rate to produce the non-TPO generation estimate and then it is added to the TPO reported sales to ultimate customers from the EIA-826 to obtain a final estimate for generation and a blended KWh/KW rate is calculated. The estimate for generation is aggregated by US census regions and US totals. The RSEs for capacity are checked for level of error and if they pass, the summary data by state, US census region and US total are reported in the EPM.
Appendix 2 contains a flow diagram of the data inputs, data quality control checks and data analysis required to perform this estimation.
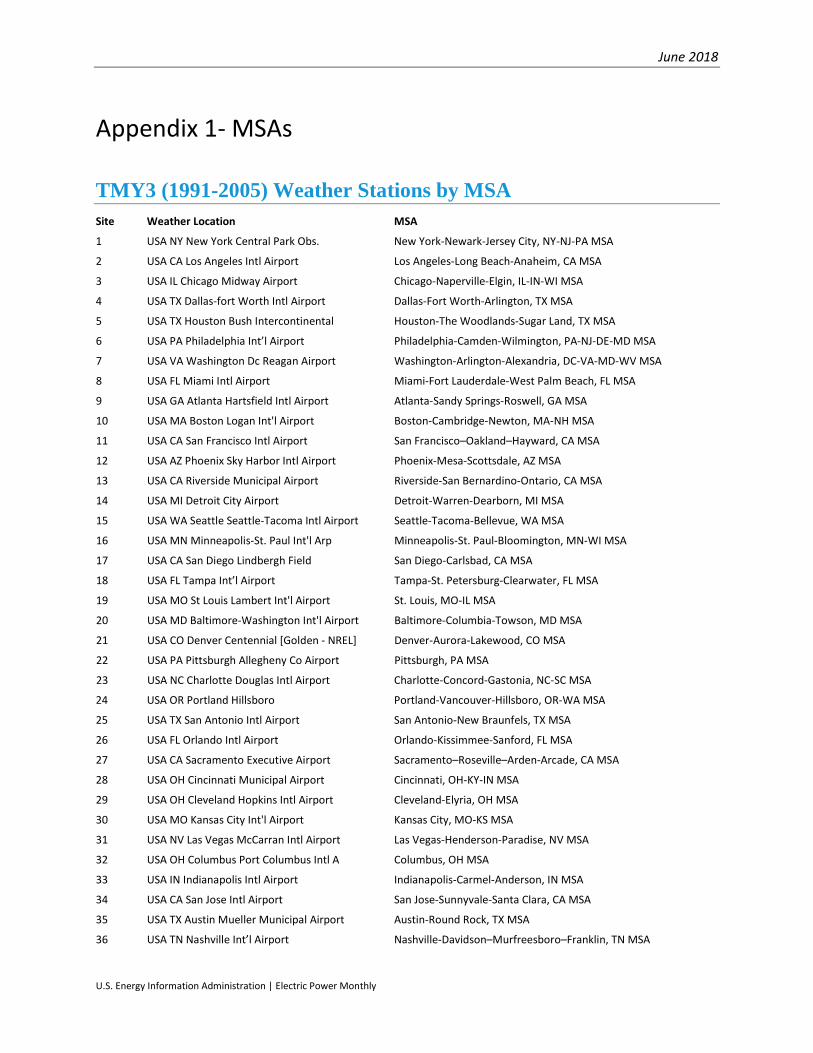
June 2018
U.S. Energy Information Administration | Electric Power Monthly
Appendix 1- MSAs TMY3 (1991-2005) Weather Stations by MSA Site Weather Location MSA
1 USA NY New York Central Park Obs. New York-Newark-Jersey City, NY-NJ-PA MSA
2 USA CA Los Angeles Intl Airport Los Angeles-Long Beach-Anaheim, CA MSA
3 USA IL Chicago Midway Airport Chicago-Naperville-Elgin, IL-IN-WI MSA
4 USA TX Dallas-fort Worth Intl Airport Dallas-Fort Worth-Arlington, TX MSA
5 USA TX Houston Bush Intercontinental Houston-The Woodlands-Sugar Land, TX MSA
6 USA PA Philadelphia Int’l Airport Philadelphia-Camden-Wilmington, PA-NJ-DE-MD MSA
7 USA VA Washington Dc Reagan Airport Washington-Arlington-Alexandria, DC-VA-MD-WV MSA
8 USA FL Miami Intl Airport Miami-Fort Lauderdale-West Palm Beach, FL MSA
9 USA GA Atlanta Hartsfield Intl Airport Atlanta-Sandy Springs-Roswell, GA MSA
10 USA MA Boston Logan Int'l Airport Boston-Cambridge-Newton, MA-NH MSA
11 USA CA San Francisco Intl Airport San Francisco–Oakland–Hayward, CA MSA
12 USA AZ Phoenix Sky Harbor Intl Airport Phoenix-Mesa-Scottsdale, AZ MSA
13 USA CA Riverside Municipal Airport Riverside-San Bernardino-Ontario, CA MSA
14 USA MI Detroit City Airport Detroit-Warren-Dearborn, MI MSA
15 USA WA Seattle Seattle-Tacoma Intl Airport Seattle-Tacoma-Bellevue, WA MSA
16 USA MN Minneapolis-St. Paul Int'l Arp Minneapolis-St. Paul-Bloomington, MN-WI MSA
17 USA CA San Diego Lindbergh Field San Diego-Carlsbad, CA MSA
18 USA FL Tampa Int’l Airport Tampa-St. Petersburg-Clearwater, FL MSA
19 USA MO St Louis Lambert Int'l Airport St. Louis, MO-IL MSA
20 USA MD Baltimore-Washington Int'l Airport Baltimore-Columbia-Towson, MD MSA
21 USA CO Denver Centennial [Golden - NREL] Denver-Aurora-Lakewood, CO MSA
22 USA PA Pittsburgh Allegheny Co Airport Pittsburgh, PA MSA
23 USA NC Charlotte Douglas Intl Airport Charlotte-Concord-Gastonia, NC-SC MSA
24 USA OR Portland Hillsboro Portland-Vancouver-Hillsboro, OR-WA MSA
25 USA TX San Antonio Intl Airport San Antonio-New Braunfels, TX MSA
26 USA FL Orlando Intl Airport Orlando-Kissimmee-Sanford, FL MSA
27 USA CA Sacramento Executive Airport Sacramento–Roseville–Arden-Arcade, CA MSA
28 USA OH Cincinnati Municipal Airport Cincinnati, OH-KY-IN MSA
29 USA OH Cleveland Hopkins Intl Airport Cleveland-Elyria, OH MSA
30 USA MO Kansas City Int'l Airport Kansas City, MO-KS MSA
31 USA NV Las Vegas McCarran Intl Airport Las Vegas-Henderson-Paradise, NV MSA
32 USA OH Columbus Port Columbus Intl A Columbus, OH MSA
33 USA IN Indianapolis Intl Airport Indianapolis-Carmel-Anderson, IN MSA
34 USA CA San Jose Intl Airport San Jose-Sunnyvale-Santa Clara, CA MSA
35 USA TX Austin Mueller Municipal Airport Austin-Round Rock, TX MSA
36 USA TN Nashville Int’l Airport Nashville-Davidson–Murfreesboro–Franklin, TN MSA
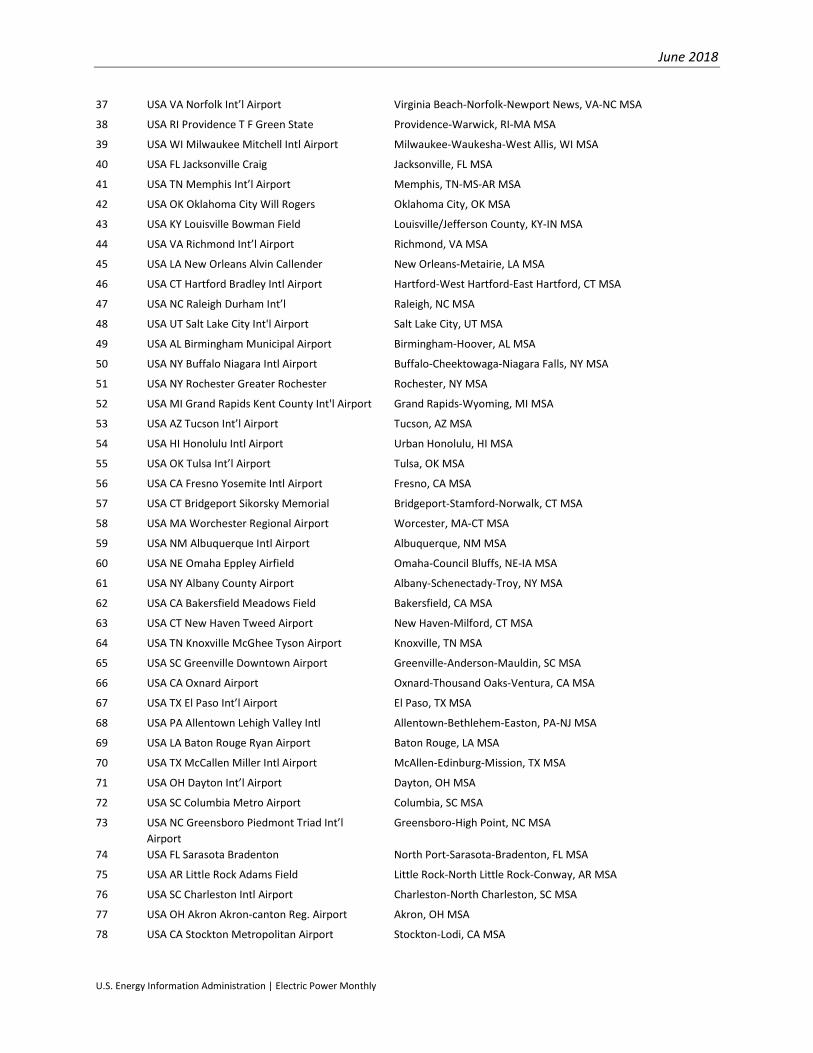
June 2018
U.S. Energy Information Administration | Electric Power Monthly
37 USA VA Norfolk Int’l Airport Virginia Beach-Norfolk-Newport News, VA-NC MSA
38 USA RI Providence T F Green State Providence-Warwick, RI-MA MSA
39 USA WI Milwaukee Mitchell Intl Airport Milwaukee-Waukesha-West Allis, WI MSA
40 USA FL Jacksonville Craig Jacksonville, FL MSA
41 USA TN Memphis Int’l Airport Memphis, TN-MS-AR MSA
42 USA OK Oklahoma City Will Rogers Oklahoma City, OK MSA
43 USA KY Louisville Bowman Field Louisville/Jefferson County, KY-IN MSA
44 USA VA Richmond Int’l Airport Richmond, VA MSA
45 USA LA New Orleans Alvin Callender New Orleans-Metairie, LA MSA
46 USA CT Hartford Bradley Intl Airport Hartford-West Hartford-East Hartford, CT MSA
47 USA NC Raleigh Durham Int’l Raleigh, NC MSA
48 USA UT Salt Lake City Int'l Airport Salt Lake City, UT MSA
49 USA AL Birmingham Municipal Airport Birmingham-Hoover, AL MSA
50 USA NY Buffalo Niagara Intl Airport Buffalo-Cheektowaga-Niagara Falls, NY MSA
51 USA NY Rochester Greater Rochester Rochester, NY MSA
52 USA MI Grand Rapids Kent County Int'l Airport Grand Rapids-Wyoming, MI MSA
53 USA AZ Tucson Int’l Airport Tucson, AZ MSA
54 USA HI Honolulu Intl Airport Urban Honolulu, HI MSA
55 USA OK Tulsa Int’l Airport Tulsa, OK MSA
56 USA CA Fresno Yosemite Intl Airport Fresno, CA MSA
57 USA CT Bridgeport Sikorsky Memorial Bridgeport-Stamford-Norwalk, CT MSA
58 USA MA Worchester Regional Airport Worcester, MA-CT MSA
59 USA NM Albuquerque Intl Airport Albuquerque, NM MSA
60 USA NE Omaha Eppley Airfield Omaha-Council Bluffs, NE-IA MSA
61 USA NY Albany County Airport Albany-Schenectady-Troy, NY MSA
62 USA CA Bakersfield Meadows Field Bakersfield, CA MSA
63 USA CT New Haven Tweed Airport New Haven-Milford, CT MSA
64 USA TN Knoxville McGhee Tyson Airport Knoxville, TN MSA
65 USA SC Greenville Downtown Airport Greenville-Anderson-Mauldin, SC MSA
66 USA CA Oxnard Airport Oxnard-Thousand Oaks-Ventura, CA MSA
67 USA TX El Paso Int’l Airport El Paso, TX MSA
68 USA PA Allentown Lehigh Valley Intl Allentown-Bethlehem-Easton, PA-NJ MSA
69 USA LA Baton Rouge Ryan Airport Baton Rouge, LA MSA
70 USA TX McCallen Miller Intl Airport McAllen-Edinburg-Mission, TX MSA
71 USA OH Dayton Int’l Airport Dayton, OH MSA
72 USA SC Columbia Metro Airport Columbia, SC MSA
73 USA NC Greensboro Piedmont Triad Int’l Airport
Greensboro-High Point, NC MSA
74 USA FL Sarasota Bradenton North Port-Sarasota-Bradenton, FL MSA
75 USA AR Little Rock Adams Field Little Rock-North Little Rock-Conway, AR MSA
76 USA SC Charleston Intl Airport Charleston-North Charleston, SC MSA
77 USA OH Akron Akron-canton Reg. Airport Akron, OH MSA
78 USA CA Stockton Metropolitan Airport Stockton-Lodi, CA MSA
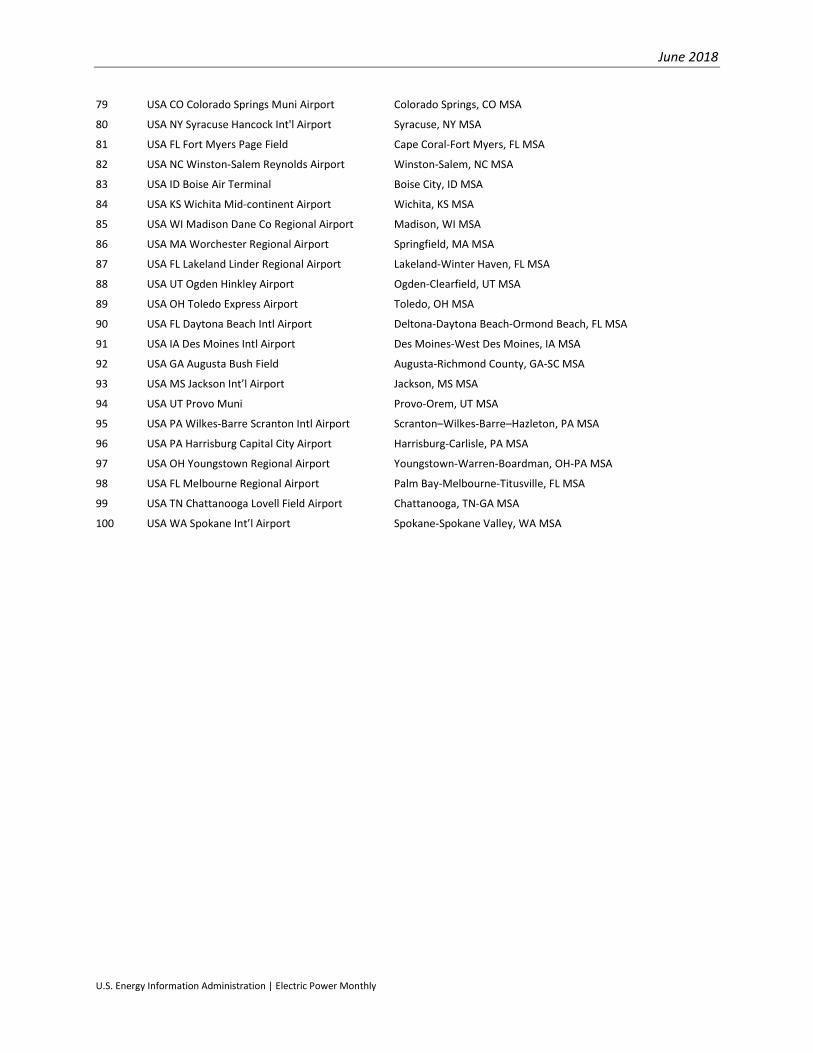
June 2018
U.S. Energy Information Administration | Electric Power Monthly
79 USA CO Colorado Springs Muni Airport Colorado Springs, CO MSA
80 USA NY Syracuse Hancock Int'l Airport Syracuse, NY MSA
81 USA FL Fort Myers Page Field Cape Coral-Fort Myers, FL MSA
82 USA NC Winston-Salem Reynolds Airport Winston-Salem, NC MSA
83 USA ID Boise Air Terminal Boise City, ID MSA
84 USA KS Wichita Mid-continent Airport Wichita, KS MSA
85 USA WI Madison Dane Co Regional Airport Madison, WI MSA
86 USA MA Worchester Regional Airport Springfield, MA MSA
87 USA FL Lakeland Linder Regional Airport Lakeland-Winter Haven, FL MSA
88 USA UT Ogden Hinkley Airport Ogden-Clearfield, UT MSA
89 USA OH Toledo Express Airport Toledo, OH MSA
90 USA FL Daytona Beach Intl Airport Deltona-Daytona Beach-Ormond Beach, FL MSA
91 USA IA Des Moines Intl Airport Des Moines-West Des Moines, IA MSA
92 USA GA Augusta Bush Field Augusta-Richmond County, GA-SC MSA
93 USA MS Jackson Int’l Airport Jackson, MS MSA
94 USA UT Provo Muni Provo-Orem, UT MSA
95 USA PA Wilkes-Barre Scranton Intl Airport Scranton–Wilkes-Barre–Hazleton, PA MSA
96 USA PA Harrisburg Capital City Airport Harrisburg-Carlisle, PA MSA
97 USA OH Youngstown Regional Airport Youngstown-Warren-Boardman, OH-PA MSA
98 USA FL Melbourne Regional Airport Palm Bay-Melbourne-Titusville, FL MSA
99 USA TN Chattanooga Lovell Field Airport Chattanooga, TN-GA MSA
100 USA WA Spokane Int’l Airport Spokane-Spokane Valley, WA MSA
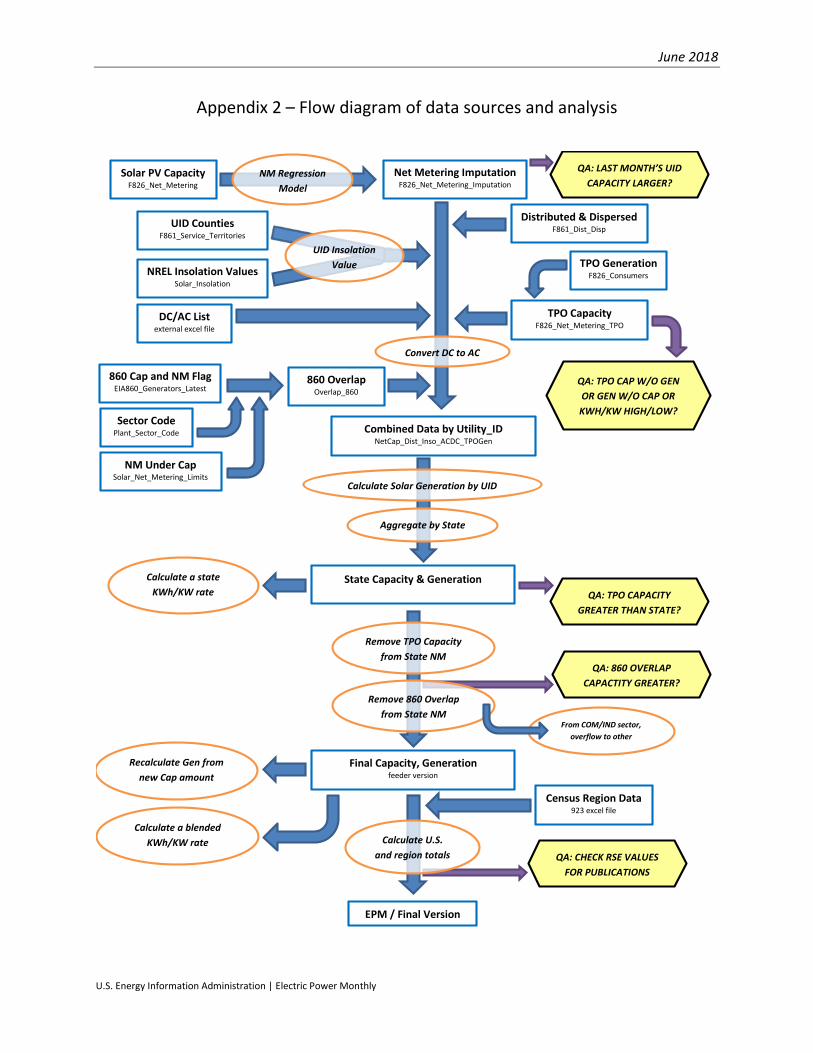
June 2018
U.S. Energy Information Administration | Electric Power Monthly
Appendix 2 – Flow diagram of data sources and analysis
Solar PV Capacity F826_Net_Metering
Net Metering Imputation F826_Net_Metering_Imputation
NM Regression Model
DC/AC List external excel file
UID Counties F861_Service_Territories
NREL Insolation Values Solar_Insolation
UID Insolation Value
Distributed & Dispersed F861_Dist_Disp
Combined Data by Utility_ID NetCap_Dist_Inso_ACDC_TPOGen
TPO Generation F826_Consumers
TPO Capacity F826_Net_Metering_TPO
QA: LAST MONTH’S UID CAPACITY LARGER?
QA: TPO CAP W/O GEN OR GEN W/O CAP OR KWH/KW HIGH/LOW?
Calculate Solar Generation by UID
Aggregate by State
State Capacity & Generation
860 Overlap Overlap_860
Calculate a state KWh/KW rate QA: TPO CAPACITY
GREATER THAN STATE?
QA: 860 OVERLAP CAPACTITY GREATER?
Remove TPO Capacity from State NM
Remove 860 Overlap from State NM
From COM/IND sector, overflow to other
Final Capacity, Generation feeder version
Calculate a blended KWh/KW rate
Census Region Data 923 excel file
Calculate U.S. and region totals
EPM / Final Version
Convert DC to AC
Recalculate Gen from new Cap amount
QA: CHECK RSE VALUES FOR PUBLICATIONS
860 Cap and NM Flag EIA860_Generators_Latest
NM Under Cap Solar_Net_Metering_Limits
Sector Code Plant_Sector_Code

June 2018
U.S. Energy Information Administration | Electric Power Monthly
1 The basic technique employed is described in the paper “Model-Based Sampling and Inference,” on the EIA website. Additional references can be found on the InterStat website (http://interstat.statjournals.net/). See the following sources: Knaub, J.R., Jr. (1999a), “Using Prediction-Oriented Software for Survey Estimation,” InterStat, August 1999, http://interstat.statjournals.net/; Knaub, J.R. Jr. (1999b), “Model-Based Sampling, Inference and Imputation,” EIA web site: http://www.eia.gov/cneaf/electricity/forms/eiawebme.pdf; Knaub, J.R., Jr. (2005), “Classical Ratio Estimator,” InterStat, October 2005, http://interstat.statjournals.net/; Knaub, J.R., Jr. (2007a), “Cutoff Sampling and Inference,” InterStat, April 2007, http://interstat.statjournals.net/; Knaub, J.R., Jr. (2008), “Cutoff Sampling.” Definition in Encyclopedia of Survey Research Methods, Editor: Paul J. Lavrakas, Sage, to appear; Knaub, J.R., Jr. (2000), “Using Prediction-Oriented Software for Survey Estimation - Part II: Ratios of Totals,” InterStat, June 2000, http://interstat.statjournals.net/; Knaub, J.R., Jr. (2001), “Using Prediction-Oriented Software for Survey Estimation - Part III: Full-Scale Study of Variance and Bias,” InterStat, June 2001, http://interstat.statjournals.net/. 2 See the following sources: Bahillo, A. et al. Journal of Energy Resources Technology, “NOx and N2O Emissions During Fluidized Bed Combustion of Leather Wastes.” Volume 128, Issue 2, June 2006. pp. 99-103; U.S. Energy Information Administration. Renewable Energy Annual 2004. “Average Heat Content of Selected Biomass Fuels.” Washington, DC, 2005; Penn State Agricultural College Agricultural and Biological Engineering and Council for Solid Waste Solutions. Garth, J. and Kowal, P. Resource Recovery, Turning Waste into Energy, University Park, PA, 1993; Utah State University Recycling Center Frequently Asked Questions. Published at http://www.usu.edu/recycle/faq.htm. Accessed December 2006. 3 Biogenic components include newsprint, paper, containers and packaging, leather, textiles, yard trimmings, food wastes, and wood. Non-biogenic components include plastics, rubber and other miscellaneous non-biogenic waste.
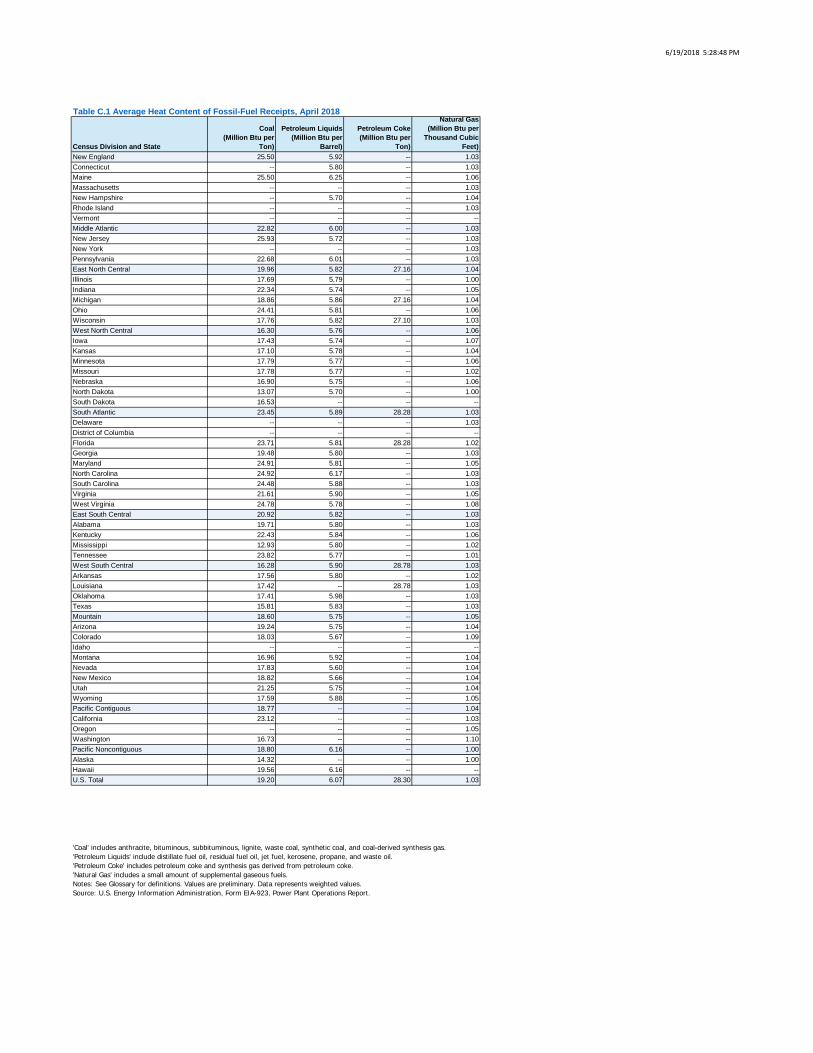
6/19/2018 5:28:48 PM
Census Division and State
Coal (Million Btu per
Ton)
Petroleum Liquids (Million Btu per
Barrel)
Petroleum Coke (Million Btu per
Ton)
Natural Gas (Million Btu per Thousand Cubic
Feet)New England 25.50 5.92 -- 1.03Connecticut -- 5.80 -- 1.03Maine 25.50 6.25 -- 1.06Massachusetts -- -- -- 1.03New Hampshire -- 5.70 -- 1.04Rhode Island -- -- -- 1.03Vermont -- -- -- --Middle Atlantic 22.82 6.00 -- 1.03New Jersey 25.93 5.72 -- 1.03New York -- -- -- 1.03Pennsylvania 22.68 6.01 -- 1.03East North Central 19.96 5.82 27.16 1.04Illinois 17.69 5.79 -- 1.00Indiana 22.34 5.74 -- 1.05Michigan 18.86 5.86 27.16 1.04Ohio 24.41 5.81 -- 1.06Wisconsin 17.76 5.82 27.10 1.03West North Central 16.30 5.76 -- 1.06Iowa 17.43 5.74 -- 1.07Kansas 17.10 5.78 -- 1.04Minnesota 17.79 5.77 -- 1.06Missouri 17.78 5.77 -- 1.02Nebraska 16.90 5.75 -- 1.06North Dakota 13.07 5.70 -- 1.00South Dakota 16.53 -- -- --South Atlantic 23.45 5.89 28.28 1.03Delaware -- -- -- 1.03District of Columbia -- -- -- --Florida 23.71 5.81 28.28 1.02Georgia 19.48 5.80 -- 1.03Maryland 24.91 5.81 -- 1.05North Carolina 24.92 6.17 -- 1.03South Carolina 24.48 5.88 -- 1.03Virginia 21.61 5.90 -- 1.05West Virginia 24.78 5.78 -- 1.08East South Central 20.92 5.82 -- 1.03Alabama 19.71 5.80 -- 1.03Kentucky 22.43 5.84 -- 1.06Mississippi 12.93 5.80 -- 1.02Tennessee 23.82 5.77 -- 1.01West South Central 16.28 5.90 28.78 1.03Arkansas 17.56 5.80 -- 1.02Louisiana 17.42 -- 28.78 1.03Oklahoma 17.41 5.98 -- 1.03Texas 15.81 5.83 -- 1.03Mountain 18.60 5.75 -- 1.05Arizona 19.24 5.75 -- 1.04Colorado 18.03 5.67 -- 1.09Idaho -- -- -- --Montana 16.96 5.92 -- 1.04Nevada 17.83 5.60 -- 1.04New Mexico 18.82 5.66 -- 1.04Utah 21.25 5.75 -- 1.04Wyoming 17.59 5.88 -- 1.05Pacific Contiguous 18.77 -- -- 1.04California 23.12 -- -- 1.03Oregon -- -- -- 1.05Washington 16.73 -- -- 1.10Pacific Noncontiguous 18.80 6.16 -- 1.00Alaska 14.32 -- -- 1.00Hawaii 19.56 6.16 -- --U.S. Total 19.20 6.07 28.30 1.03
Table C.1 Average Heat Content of Fossil-Fuel Receipts, April 2018
'Coal' includes anthracite, bituminous, subbituminous, lignite, waste coal, synthetic coal, and coal-derived synthesis gas.'Petroleum Liquids' include distillate fuel oil, residual fuel oil, jet fuel, kerosene, propane, and waste oil.'Petroleum Coke' includes petroleum coke and synthesis gas derived from petroleum coke.'Natural Gas' includes a small amount of supplemental gaseous fuels.Notes: See Glossary for definitions. Values are preliminary. Data represents weighted values.Source: U.S. Energy Information Administration, Form EIA-923, Power Plant Operations Report.
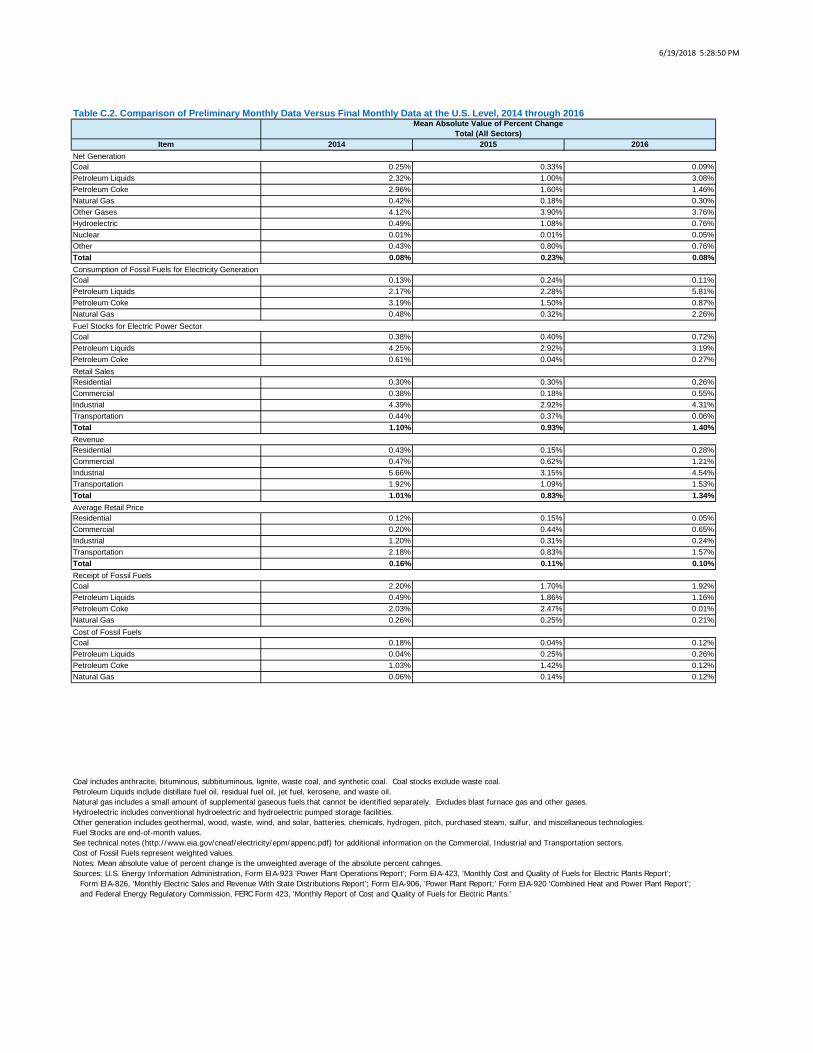
6/19/2018 5:28:50 PM
Item 2014 2015 2016
Coal 0.25% 0.33% 0.09%Petroleum Liquids 2.32% 1.00% 3.08%Petroleum Coke 2.96% 1.60% 1.46%Natural Gas 0.42% 0.18% 0.30%Other Gases 4.12% 3.90% 3.76%Hydroelectric 0.49% 1.08% 0.76%Nuclear 0.01% 0.01% 0.05%Other 0.43% 0.80% 0.76%Total 0.08% 0.23% 0.08%
Coal 0.13% 0.24% 0.11%Petroleum Liquids 2.17% 2.28% 5.81%Petroleum Coke 3.19% 1.50% 0.87%Natural Gas 0.48% 0.32% 2.26%
Coal 0.38% 0.40% 0.72%Petroleum Liquids 4.25% 2.92% 3.19%Petroleum Coke 0.61% 0.04% 0.27%
Residential 0.30% 0.30% 0.26%Commercial 0.38% 0.18% 0.55%Industrial 4.39% 2.92% 4.31%Transportation 0.44% 0.37% 0.06%Total 1.10% 0.93% 1.40%
Residential 0.43% 0.15% 0.28%Commercial 0.47% 0.62% 1.21%Industrial 5.66% 3.15% 4.54%Transportation 1.92% 1.09% 1.53%Total 1.01% 0.83% 1.34%
Residential 0.12% 0.15% 0.05%Commercial 0.20% 0.44% 0.65%Industrial 1.20% 0.31% 0.24%Transportation 2.18% 0.83% 1.57%Total 0.16% 0.11% 0.10%
Coal 2.20% 1.70% 1.92%Petroleum Liquids 0.49% 1.86% 1.16%Petroleum Coke 2.03% 2.47% 0.01%Natural Gas 0.26% 0.25% 0.21%
Coal 0.18% 0.04% 0.12%Petroleum Liquids 0.04% 0.25% 0.26%Petroleum Coke 1.03% 1.42% 0.12%Natural Gas 0.06% 0.14% 0.12%
Retail Sales
Table C.2. Comparison of Preliminary Monthly Data Versus Final Monthly Data at the U.S. Level, 2014 through 2016Mean Absolute Value of Percent Change
Total (All Sectors)
Net Generation
Consumption of Fossil Fuels for Electricity Generation
Fuel Stocks for Electric Power Sector
Revenue
Average Retail Price
Receipt of Fossil Fuels
Cost of Fossil Fuels
Coal includes anthracite, bituminous, subbituminous, lignite, waste coal, and synthetic coal. Coal stocks exclude waste coal.Petroleum Liquids include distillate fuel oil, residual fuel oil, jet fuel, kerosene, and waste oil.Natural gas includes a small amount of supplemental gaseous fuels that cannot be identified separately. Excludes blast furnace gas and other gases.Hydroelectric includes conventional hydroelectric and hydroelectric pumped storage facilities.Other generation includes geothermal, wood, waste, wind, and solar, batteries, chemicals, hydrogen, pitch, purchased steam, sulfur, and miscellaneous technologies.Fuel Stocks are end-of-month values.See technical notes (http://www.eia.gov/cneaf/electricity/epm/appenc.pdf) for additional information on the Commercial, Industrial and Transportation sectors.Cost of Fossil Fuels represent weighted values.Notes: Mean absolute value of percent change is the unweighted average of the absolute percent cahnges.Sources: U.S. Energy Information Administration, Form EIA-923 'Power Plant Operations Report'; Form EIA-423, 'Monthly Cost and Quality of Fuels for Electric Plants Report'; Form EIA-826, 'Monthly Electric Sales and Revenue With State Distributions Report'; Form EIA-906, 'Power Plant Report;' Form EIA-920 'Combined Heat and Power Plant Report'; and Federal Energy Regulatory Commission, FERC Form 423, 'Monthly Report of Cost and Quality of Fuels for Electric Plants.'
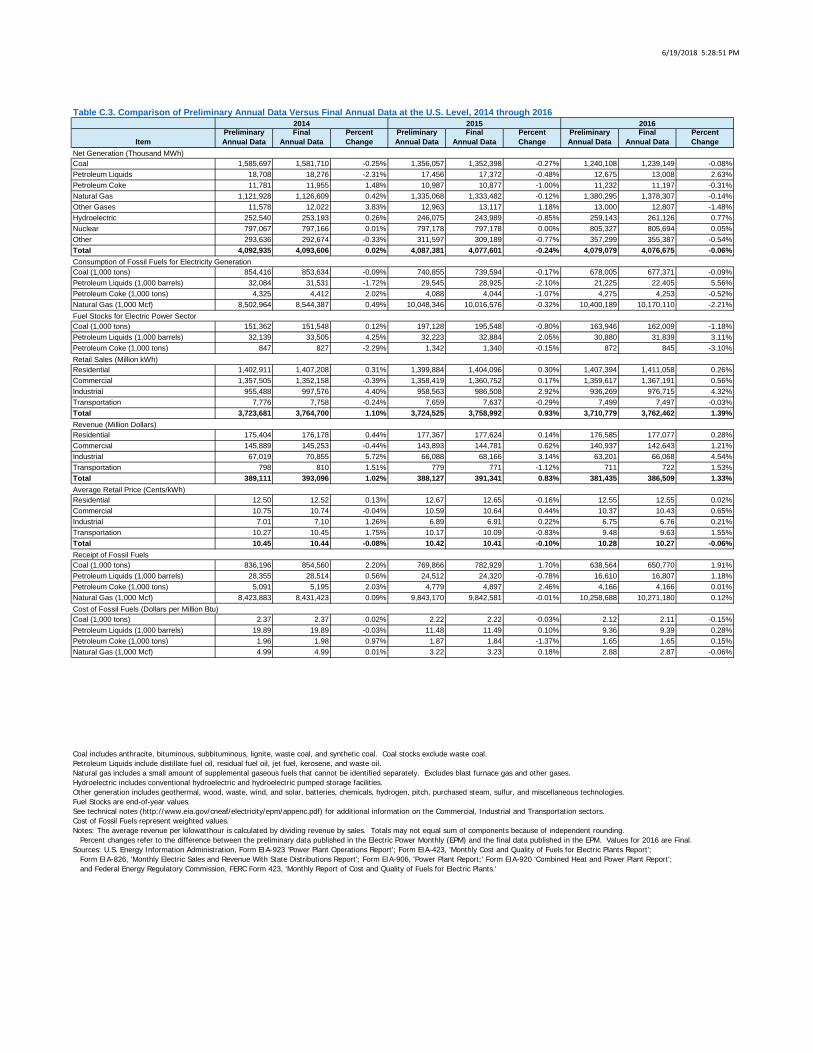
6/19/2018 5:28:51 PM
ItemPreliminary Annual Data
FinalAnnual Data
Percent Change
Preliminary Annual Data
FinalAnnual Data
Percent Change
Preliminary Annual Data
FinalAnnual Data
Percent Change
Coal 1,585,697 1,581,710 -0.25% 1,356,057 1,352,398 -0.27% 1,240,108 1,239,149 -0.08%Petroleum Liquids 18,708 18,276 -2.31% 17,456 17,372 -0.48% 12,675 13,008 2.63%Petroleum Coke 11,781 11,955 1.48% 10,987 10,877 -1.00% 11,232 11,197 -0.31%Natural Gas 1,121,928 1,126,609 0.42% 1,335,068 1,333,482 -0.12% 1,380,295 1,378,307 -0.14%Other Gases 11,578 12,022 3.83% 12,963 13,117 1.18% 13,000 12,807 -1.48%Hydroelectric 252,540 253,193 0.26% 246,075 243,989 -0.85% 259,143 261,126 0.77%Nuclear 797,067 797,166 0.01% 797,178 797,178 0.00% 805,327 805,694 0.05%Other 293,636 292,674 -0.33% 311,597 309,189 -0.77% 357,299 355,387 -0.54%Total 4,092,935 4,093,606 0.02% 4,087,381 4,077,601 -0.24% 4,079,079 4,076,675 -0.06%
Coal (1,000 tons) 854,416 853,634 -0.09% 740,855 739,594 -0.17% 678,005 677,371 -0.09%Petroleum Liquids (1,000 barrels) 32,084 31,531 -1.72% 29,545 28,925 -2.10% 21,225 22,405 5.56%Petroleum Coke (1,000 tons) 4,325 4,412 2.02% 4,088 4,044 -1.07% 4,275 4,253 -0.52%Natural Gas (1,000 Mcf) 8,502,964 8,544,387 0.49% 10,048,346 10,016,576 -0.32% 10,400,189 10,170,110 -2.21%
Coal (1,000 tons) 151,362 151,548 0.12% 197,128 195,548 -0.80% 163,946 162,009 -1.18%Petroleum Liquids (1,000 barrels) 32,139 33,505 4.25% 32,223 32,884 2.05% 30,880 31,839 3.11%Petroleum Coke (1,000 tons) 847 827 -2.29% 1,342 1,340 -0.15% 872 845 -3.10%
Residential 1,402,911 1,407,208 0.31% 1,399,884 1,404,096 0.30% 1,407,394 1,411,058 0.26%Commercial 1,357,505 1,352,158 -0.39% 1,358,419 1,360,752 0.17% 1,359,617 1,367,191 0.56%Industrial 955,488 997,576 4.40% 958,563 986,508 2.92% 936,269 976,715 4.32%Transportation 7,776 7,758 -0.24% 7,659 7,637 -0.29% 7,499 7,497 -0.03%Total 3,723,681 3,764,700 1.10% 3,724,525 3,758,992 0.93% 3,710,779 3,762,462 1.39%
Residential 175,404 176,178 0.44% 177,367 177,624 0.14% 176,585 177,077 0.28%Commercial 145,889 145,253 -0.44% 143,893 144,781 0.62% 140,937 142,643 1.21%Industrial 67,019 70,855 5.72% 66,088 68,166 3.14% 63,201 66,068 4.54%Transportation 798 810 1.51% 779 771 -1.12% 711 722 1.53%Total 389,111 393,096 1.02% 388,127 391,341 0.83% 381,435 386,509 1.33%
Residential 12.50 12.52 0.13% 12.67 12.65 -0.16% 12.55 12.55 0.02%Commercial 10.75 10.74 -0.04% 10.59 10.64 0.44% 10.37 10.43 0.65%Industrial 7.01 7.10 1.26% 6.89 6.91 0.22% 6.75 6.76 0.21%Transportation 10.27 10.45 1.75% 10.17 10.09 -0.83% 9.48 9.63 1.55%Total 10.45 10.44 -0.08% 10.42 10.41 -0.10% 10.28 10.27 -0.06%
Coal (1,000 tons) 836,196 854,560 2.20% 769,866 782,929 1.70% 638,564 650,770 1.91%Petroleum Liquids (1,000 barrels) 28,355 28,514 0.56% 24,512 24,320 -0.78% 16,610 16,807 1.18%Petroleum Coke (1,000 tons) 5,091 5,195 2.03% 4,779 4,897 2.46% 4,166 4,166 0.01%Natural Gas (1,000 Mcf) 8,423,883 8,431,423 0.09% 9,843,170 9,842,581 -0.01% 10,258,688 10,271,180 0.12%
Coal (1,000 tons) 2.37 2.37 0.02% 2.22 2.22 -0.03% 2.12 2.11 -0.15%Petroleum Liquids (1,000 barrels) 19.89 19.89 -0.03% 11.48 11.49 0.10% 9.36 9.39 0.28%Petroleum Coke (1,000 tons) 1.96 1.98 0.97% 1.87 1.84 -1.37% 1.65 1.65 0.15%Natural Gas (1,000 Mcf) 4.99 4.99 0.01% 3.22 3.23 0.18% 2.88 2.87 -0.06%
Consumption of Fossil Fuels for Electricity Generation
Table C.3. Comparison of Preliminary Annual Data Versus Final Annual Data at the U.S. Level, 2014 through 20162014 2015 2016
Net Generation (Thousand MWh)
Coal includes anthracite, bituminous, subbituminous, lignite, waste coal, and synthetic coal. Coal stocks exclude waste coal.Petroleum Liquids include distillate fuel oil, residual fuel oil, jet fuel, kerosene, and waste oil.Natural gas includes a small amount of supplemental gaseous fuels that cannot be identified separately. Excludes blast furnace gas and other gases.Hydroelectric includes conventional hydroelectric and hydroelectric pumped storage facilities.Other generation includes geothermal, wood, waste, wind, and solar, batteries, chemicals, hydrogen, pitch, purchased steam, sulfur, and miscellaneous technologies.Fuel Stocks are end-of-year values.See technical notes (http://www.eia.gov/cneaf/electricity/epm/appenc.pdf) for additional information on the Commercial, Industrial and Transportation sectors.Cost of Fossil Fuels represent weighted values.Notes: The average revenue per kilowatthour is calculated by dividing revenue by sales. Totals may not equal sum of components because of independent rounding. Percent changes refer to the difference between the preliminary data published in the Electric Power Monthly (EPM) and the final data published in the EPM. Values for 2016 are Final.Sources: U.S. Energy Information Administration, Form EIA-923 'Power Plant Operations Report'; Form EIA-423, 'Monthly Cost and Quality of Fuels for Electric Plants Report'; Form EIA-826, 'Monthly Electric Sales and Revenue With State Distributions Report'; Form EIA-906, 'Power Plant Report;' Form EIA-920 'Combined Heat and Power Plant Report'; and Federal Energy Regulatory Commission, FERC Form 423, 'Monthly Report of Cost and Quality of Fuels for Electric Plants.'
Fuel Stocks for Electric Power Sector
Retail Sales (Million kWh)
Revenue (Million Dollars)
Average Retail Price (Cents/kWh)
Receipt of Fossil Fuels
Cost of Fossil Fuels (Dollars per Million Btu)
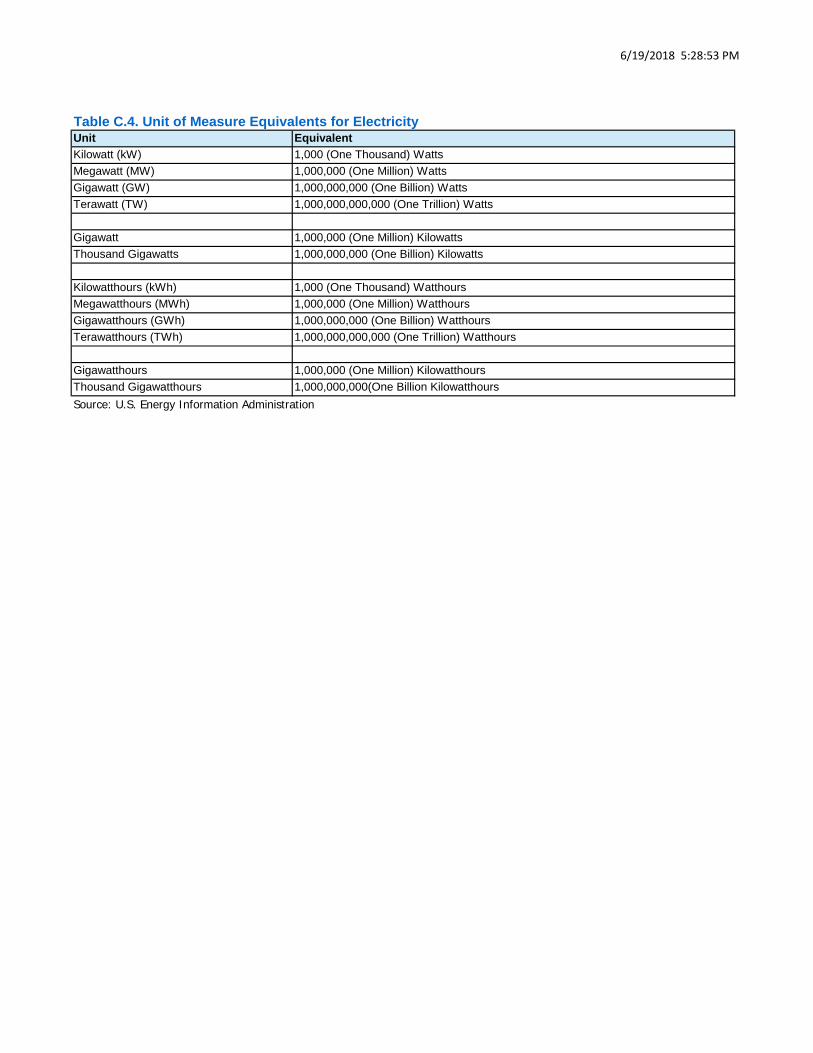
6/19/2018 5:28:53 PM
Unit EquivalentKilowatt (kW) 1,000 (One Thousand) WattsMegawatt (MW) 1,000,000 (One Million) WattsGigawatt (GW) 1,000,000,000 (One Billion) WattsTerawatt (TW) 1,000,000,000,000 (One Trillion) Watts
Gigawatt 1,000,000 (One Million) KilowattsThousand Gigawatts 1,000,000,000 (One Billion) Kilowatts
Kilowatthours (kWh) 1,000 (One Thousand) WatthoursMegawatthours (MWh) 1,000,000 (One Million) WatthoursGigawatthours (GWh) 1,000,000,000 (One Billion) WatthoursTerawatthours (TWh) 1,000,000,000,000 (One Trillion) Watthours
Gigawatthours 1,000,000 (One Million) KilowatthoursThousand Gigawatthours 1,000,000,000(One Billion Kilowatthours
Table C.4. Unit of Measure Equivalents for Electricity
Source: U.S. Energy Information Administration
June 2018
U.S. Energy Information Administration | Electric Power Monthly
Glossary Anthracite: The highest rank of coal; used primarily for residential and commercial space heating. It is a hard, brittle, and black lustrous coal, often referred to as hard coal, containing a high percentage of fixed carbon and a low percentage of volatile matter. The moisture content of fresh-mined anthracite generally is less than 15 percent. The heat content of anthracite ranges from 22 to 28 million Btu per ton on a moist, mineral-matter-free basis. The heat content of anthracite coal consumed in the United States averages 25 million Btu per ton, on the as-received basis (i.e., containing both inherent moisture and mineral matter). Note: Since the 1980's, anthracite refuse or mine waste has been used for steam electric power generation. This fuel typically has a heat content of 15 million Btu per ton or less.
Ash: Impurities consisting of silica, iron, aluminum, and other noncombustible matter that are contained in coal. Ash increases the weight of coal, adds to the cost of handling, and can affect its burning characteristics. Ash content is measured as a percent by weight of coal on a "received" or a "dry" (moisture-free, usually part of a laboratory analysis) basis.
Ash content: The amount of ash contained in the fuel (except gas) in terms of percent by weight.
Average Price of Electricity to Ultimate Consumers (formerly known as Average Revenue per Kilowatthour): The average revenue per kilowatthour of electricity sold by sector (residential, commercial, industrial, or other) and geographic area (State, Census division, and national), is calculated by dividing the total monthly revenue by the corresponding total monthly sales for each sector and geographic area.
Barrel: A unit of volume equal to 42 U.S. gallons.
Biomass: Organic non-fossil material of biological origin constituting a renewable energy resource.
Bituminous coal: A dense coal, usually black, sometimes dark brown, often with well-defined bands of bright and dull material, used primarily as fuel in steam-electric power generation, with substantial quantities also used for heat and power applications in manufacturing and to make coke. Bituminous coal is the most abundant coal in active U.S. mining regions. Its moisture content usually is less than 20 percent. The heat content of bituminous coal ranges from 21 to 30 million Btu per ton on a moist, mineral-matter-free basis. The heat content of bituminous coal consumed in the United States averages 24 million Btu per ton, on the as-received basis (i.e., containing both inherent moisture and mineral matter).
British thermal unit: The quantity of heat required to raise the temperature of 1 pound of liquid water by 1 degree Fahrenheit at the temperature at which water has its greatest density (approximately 39 degrees Fahrenheit).
Btu: The abbreviation for British thermal unit(s).
Capacity: See Generator Capacity and Generator Name Plate Capacity (Installed).
June 2018
U.S. Energy Information Administration | Electric Power Monthly
Census Divisions: Any of nine geographic areas of the United States as defined by the U.S. Department of Commerce, Bureau of the Census. The divisions, each consisting of several States, are defined as follows:
1) New England: Connecticut, Maine, Massachusetts, New Hampshire, Rhode Island, and Vermont;
2) Middle Atlantic: New Jersey, New York, and Pennsylvania; 3) East North Central: Illinois, Indiana, Michigan, Ohio, and Wisconsin; 4) West North Central: Iowa, Kansas, Minnesota, Missouri, Nebraska, North Dakota, and South
Dakota; 5) South Atlantic: Delaware, District of Columbia, Florida, Georgia, Maryland, North Carolina,
South Carolina, Virginia, and West Virginia; 6) East South Central: Alabama, Kentucky, Mississippi, and Tennessee; 7) West South Central: Arkansas, Louisiana, Oklahoma, and Texas; 8) Mountain: Arizona, Colorado, Idaho, Montana, Nevada, New Mexico, Utah, and Wyoming; 9) Pacific: Alaska, California, Hawaii, Oregon, and Washington.
Note: Each division is a sub-area within a broader Census Region. In some cases, the Pacific division is subdivided into the Pacific Contiguous area (California, Oregon, and Washington) and the Pacific Noncontiguous area (Alaska and Hawaii).
Coal: A readily combustible black or brownish-black rock whose composition, including inherent moisture, consists of more than 50 percent by weight and more than 70 percent by volume of carbonaceous material. It is formed from plant remains that have been compacted, hardened, chemically altered, and metamorphosed by heat and pressure over geologic time.
Coal synfuel: Coal-based solid fuel that has been processed by a coal synfuel plant; and coal-based fuels such as briquettes, pellets, or extrusions, which are formed from fresh or recycled coal and binding materials.
Coke (petroleum): A residue high in carbon content and low in hydrogen that is the final product of thermal decomposition in the condensation process in cracking. This product is reported as marketable coke or catalyst coke. The conversion is 5 barrels (of 42 U.S. gallons each) per short ton. Coke from petroleum has a heating value of 6.024 million Btu per barrel.
Combined cycle: An electric generating technology in which electricity is produced from otherwise lost waste heat exiting from one or more gas (combustion) turbine-generators. The exiting heat from the combustion turbine(s) is routed to a conventional boiler or to a heat recovery steam generator for utilization by a steam turbine in the production of additional electricity.
Combined heat and power (CHP): Includes plants designed to produce both heat and electricity from a single heat source. Note: This term is being used in place of the term "cogenerator" that was used by EIA in the past. CHP better describes the facilities because some of the plants included do not produce heat and power in a sequential fashion and, as a result, do not meet the legal definition of cogeneration specified in the Public Utility Regulatory Policies Act (PURPA).
June 2018
U.S. Energy Information Administration | Electric Power Monthly
Commercial sector: An energy-consuming sector that consists of service-providing facilities and equipment of: businesses; Federal, State, and local governments; and other private and public organizations, such as religious, social, or fraternal groups. The commercial sector includes institutional living quarters. It also includes sewage treatment facilities. Common uses of energy associated with this sector include space heating, water heating, air conditioning, lighting, refrigeration, cooking, and running a wide variety of other equipment. Note: This sector includes generators that produce electricity and/or useful thermal output primarily to support the activities of the above-mentioned commercial establishments.
Consumption (fuel): The use of energy as a source of heat or power or as a raw material input to a manufacturing process.
Cost: The amount paid to acquire resources, such as plant and equipment, fuel, or labor services.
Demand (electric): The rate at which electric energy is delivered to or by a system, part of a system, or piece of equipment, at a given instant or averaged over any designated period of time.
Diesel: A distillate fuel oil that is used in diesel engines such as those used for transportation and for electric power generation.
Distillate fuel oil: A general classification for one of the petroleum fractions produced in conventional distillation operations. It includes diesel fuels and fuel oils. Products known as No. 1, No. 2, and No. 4 diesel fuel are used in on-highway diesel engines, such as those in trucks and automobiles, as well as off-highway engines, such as those in railroad locomotives and agricultural machinery. Products known as No. 1, No. 2, and No. 4 fuel oils are used primarily for space heating and electric power generation.
1) No. 1 Distillate: A light petroleum distillate that can be used as either a diesel fuel (see No. 1 Diesel Fuel) or a fuel oil. See No. 1 Fuel Oil.
• No. 1 Diesel fuel: A light distillate fuel oil that has distillation temperatures of 550 degrees Fahrenheit at the 90-percent point and meets the specifications defined in ASTM Specification D 975. It is used in high-speed diesel engines, such as those in city buses and similar vehicles. See No. 1 Distillate above.
• No. 1 Fuel oil: A light distillate fuel oil that has distillation temperatures of 400 degrees Fahrenheit at the 10-percent recovery point and 550 degrees Fahrenheit at the 90-percent point and meets the specifications defined in ASTM Specification D 396. It is used primarily as fuel for portable outdoor stoves and portable outdoor heaters. See No. 1 Distillate above.
2) No. 2 Distillate: A petroleum distillate that can be used as either a diesel fuel (see No. 2 Diesel Fuel definition below) or a fuel oil. See No. 2 Fuel oil below.
• No. 2 Diesel fuel: A fuel that has distillation temperatures of 500 degrees Fahrenheit at the 10-percent recovery point and 640 degrees Fahrenheit at the 90-percent recovery point and meets the specifications defined in ASTM Specification D 396. It is used in atomizing type burners for domestic heating or for moderate capacity commercial/industrial burner units. See No. 2 Distillate above.
June 2018
U.S. Energy Information Administration | Electric Power Monthly
3) No. 4 Fuel: A distillate fuel oil made by blending distillate fuel oil and residual fuel oil stocks. It conforms with ASTM Specification D 396 or Federal Specification VV-F-815C and is used extensively in industrial plants and in commercial burner installations that are not equipped with preheating facilities. It also includes No. 4 diesel fuel used for low- and medium-speed diesel engines and conforms to ASTM Specification D 975.
• No. 4 Diesel fuel and No. 4 Fuel oil: See No. 4 Fuel above.
Electric industry restructuring: The process of replacing a monopolistic system of electric utility suppliers with competing sellers, allowing individual ultimate customers to choose their supplier but still receive delivery over the power lines of the local utility. It includes the reconfiguration of vertically integrated electric utilities.
Electric plant (physical): A facility containing prime movers, electric generators, and auxiliary equipment for converting mechanical, chemical, and/or fission energy into electric energy.
Electric power sector: An energy-consuming sector that consists of electricity-only and combined-heat-and-power (CHP) plants whose primary business is to sell electricity, or electricity and heat, to the public-- i. e., North American Industry Classification System 22 plants.
Electric utility: A corporation, person, agency, authority, or other legal entity or instrumentality aligned with distribution facilities for delivery of electric energy for use primarily by the public. Included are investor-owned electric utilities, municipal and State utilities, Federal electric utilities, and rural electric cooperatives. A few entities that are tariff based and corporately aligned with companies that own distribution facilities are also included. Note: Due to the issuance of FERC Order 888 that required traditional electric utilities to functionally unbundle their generation, transmission, and distribution operations, "electric utility" currently has inconsistent interpretations from State to State.
Electricity: A form of energy characterized by the presence and motion of elementary charged particles generated by friction, induction, or chemical change.
Electricity generation: The process of producing electric energy or the amount of electric energy produced by transforming other forms of energy, commonly expressed in kilowatthours (kWh) or megawatthours (MWh).
Electricity generators: The facilities that produce only electricity, commonly expressed in kilowatthours (kWh) or megawatthours (MWh).
Energy: The capacity for doing work as measured by the capability of doing work (potential energy) or the conversion of this capability to motion (kinetic energy). Energy has several forms, some of which are easily convertible and can be changed to another form useful for work. Most of the world's convertible energy comes from fossil fuels that are burned to produce heat that is then used as a transfer medium to mechanical or other means in order to accomplish tasks. Electrical energy is usually measured in kilowatthours, while heat energy is usually measured in British thermal units.
June 2018
U.S. Energy Information Administration | Electric Power Monthly
Energy conservation features: This includes building shell conservation features, HVAC conservation features, lighting conservation features, any conservation features, and other conservation features incorporated by the building. However, this category does not include any demand-side management (DSM) program participation by the building. Any DSM program participation is included in the DSM Programs.
Energy efficiency: Refers to programs that are aimed at reducing the energy used by specific end-use devices and systems, typically without affecting the services provided. These programs reduce overall electricity consumption (reported in megawatthours), often without explicit consideration for the timing of program-induced savings. Such savings are generally achieved by substituting technically more advanced equipment to produce the same level of end-use services (e.g. lighting, heating, motor drive) with less electricity. Examples include high-efficiency appliances, efficient lighting programs, high-efficiency heating, ventilating and air conditioning (HVAC) systems or control modifications, efficient building design, advanced electric motor drives, and heat recovery systems.
Energy service provider: An energy entity that provides service to an ultimate consumer.
Energy source: Any substance or natural phenomenon that can be consumed or transformed to supply heat or power. Examples include petroleum, coal, natural gas, nuclear, biomass, electricity, wind, sunlight, geothermal, water movement, and hydrogen in fuel cells.
Energy-only service: Sales services for ultimate consumers for which the company provided only the energy consumed, where another entity provides delivery services.
Fossil fuel: An energy source formed in the earths crust from decayed organic material. The common fossil fuels are petroleum, coal, and natural gas.
Franchised service area: A specified geographical area in which a utility has been granted the exclusive right to serve customers. A franchise allows an entity to use city streets, alleys and other public lands in order to provide, distribute, and sell services to the community.
Fuel: Any material substance that can be consumed to supply heat or power. Included are petroleum, coal, and natural gas (the fossil fuels), and other consumable materials, such as uranium, biomass, and hydrogen.
Gas: A fuel burned under boilers and by internal combustion engines for electric generation. These include natural, manufactured and waste gas.
Gas turbine plant: An electric generating facility in which the prime mover is a gas (combustion) turbine. A gas turbine typically consists of an air compressor and one or more combustion chambers where either liquid or gaseous fuel is burned. The resulting hot gases are passed through the turbine where they expand to drive both an electric generator and the compressor.
Generating unit: Any combination of physically connected generators, reactors, boilers, combustion turbines, or other prime movers operated together to produce electric power.
June 2018
U.S. Energy Information Administration | Electric Power Monthly
Generator: A machine that converts mechanical energy into electrical energy.
Generator capacity: The maximum output, commonly expressed in megawatts (MW), that generating equipment can supply to system load, adjusted for ambient conditions.
Generator nameplate capacity (installed): The maximum rated output of a generator, prime mover, or other electric power production equipment under specific conditions designated by the manufacturer. Installed generator nameplate capacity is commonly expressed in megawatts (MW) and is usually indicated on a nameplate physically attached to the generator.
Geothermal: Pertaining to heat within the Earth.
Geothermal energy: Hot water or steam extracted from geothermal reservoirs in the earth's crust. Water or steam extracted from geothermal reservoirs can be used for geothermal heat pumps, water heating, or electricity generation.
Gigawatt (GW): One billion watts.
Gigawatthour (GWh): One billion watthours.
Gross generation: The total amount of electric energy produced by generating units and measured at the generating terminal in kilowatthours (kWh) or megawatthours (MWh).
Heat content: The amount or number of British thermal units (Btu) produced by the combustion of fuel, measured in Btu/unit of measure.
Hydroelectric power: The production of electricity from the kinetic energy of falling water.
Hydroelectric power generation: Electricity generated by an electric power plant whose turbines are driven by falling water. It includes electric utility and industrial generation of hydroelectricity, unless otherwise specified. Generation is reported on a net basis, i.e., on the amount of electric energy generated after the electric energy consumed by station auxiliaries and the losses in the transformers that are considered integral parts of the station are deducted.
Hydroelectric pumped storage: Hydroelectricity that is generated during peak loads by using water previously pumped into an elevated storage reservoir during off-peak periods when excess generating capacity is available to do so. When additional generating capacity is needed, the water can be released from the reservoir through a conduit to turbine generators located in a power plant at a lower level.
Hydrogen: A colorless, odorless, highly flammable gaseous element. It is the lightest of all gases and the most abundant element in the universe, occurring chiefly in combination with oxygen in water and also in acids, bases, alcohols, petroleum, and other hydrocarbons.
Independent power producer: A corporation, person, agency, authority, or other legal entity or instrumentality that owns or operates facilities for the generation of electricity for use primarily by the public, and that is not an electric utility.
June 2018
U.S. Energy Information Administration | Electric Power Monthly
Industrial sector: An energy-consuming sector that consists of all facilities and equipment used for producing, processing, or assembling goods. The industrial sector encompasses the following types of activity: manufacturing (NAICS codes 31-33); agriculture, forestry, and hunting (NAICS code 11); mining, including oil and gas extraction (NAICS code 21); natural gas distribution (NAICS code 2212); and construction (NAICS code 23). Overall energy use in this sector is largely for process heat and cooling and powering machinery, with lesser amounts used for facility heating, air conditioning, and lighting. Fossil fuels are also used as raw material inputs to manufactured products. Note: This sector includes generators that produce electricity and/or useful thermal output primarily to support the above-mentioned industrial activities.
Interdepartmental service (electric): Interdepartmental service includes amounts charged by the electric department at tariff or other specified rates for electricity supplied by it to other utility departments.
Internal combustion plant: A plant in which the prime mover is an internal combustion engine. An internal combustion engine has one or more cylinders in which the process of combustion takes place, converting energy released from the rapid burning of a fuel-air mixture into mechanical energy. Diesel or gas-fired engines are the principal types used in electric plants. The plant is usually operated during periods of high demand for electricity.
Investor-owned utility (IOU): A privately-owned electric utility whose stock is publicly traded. It is rate regulated and authorized to achieve an allowed rate of return.
Jet fuel: A refined petroleum product used in jet aircraft engines. It includes kerosene-type jet fuel and naphtha-type jet fuel.
Kerosene: A light petroleum distillate that is used in space heaters, cook stoves, and water heaters and is suitable for use as a light source when burned in wick-fed lamps. Kerosene has a maximum distillation temperature of 400 degrees Fahrenheit at the 10-percent recovery point, a final boiling point of 572 degrees Fahrenheit, and a minimum flash point of 100 degrees Fahrenheit. Included are No. 1-K and No. 2-K, the two grades recognized by ASTM Specification D 3699 as well as all other grades of kerosene called range or stove oil, which have properties similar to those of No. 1 fuel oil.
Kilowatt (kW): One thousand watts.
Kilowatthour (kWh): One thousand watthours.
Light oil: Lighter fuel oils distilled off during the refining process. Virtually all petroleum used in internal combustion and gas-turbine engines is light oil.
Lignite: The lowest rank of coal, often referred to as brown coal, used almost exclusively as fuel for steam-electric power generation. It is brownish-black and has a high inherent moisture content, sometimes as high as 45 percent. The heat content of lignite ranges from 9 to 17 million Btu per ton on a moist, mineral-matter-free basis. The heat content of lignite consumed in the United States averages 13 million Btu per ton, on the as-received basis (i.e., containing both inherent moisture and mineral matter).
June 2018
U.S. Energy Information Administration | Electric Power Monthly
Manufactured gas: A gas obtained by destructive distillation of coal, or by thermal decomposition of oil, or by the reaction of steam passing through a bed of heated coal or coke. Examples are coal gases, coke oven gases, producer gas, blast furnace gas, blue (water) gas, and carbureted water gas
Mcf: One thousand cubic feet.
Megawatt (MW): One million watts of electricity.
Megawatthour (MWh): One million watthours.
Municipal utility: A nonprofit utility, owned by a local municipality and operated as a department thereof, governed by a city council or an independently elected or appointed board; primarily involved in the distribution and/or sale of electric power to ultimate consumers.
Natural gas: A gaseous mixture of hydrocarbon compounds, the primary one being methane. Note: The Energy Information Administration measures wet natural gas and its two sources of production, associated/dissolved natural gas and nonassociated natural gas, and dry natural gas, which is produced from wet natural gas.
1) Wet natural gas: A mixture of hydrocarbon compounds and small quantities of various nonhydrocarbons existing in the gaseous phase or in solution with crude oil in porous rock formations at reservoir conditions. The principal hydrocarbons normally contained in the mixture are methane, ethane, propane, butane, and pentane. Typical nonhydrocarbon gases that may be present in reservoir natural gas are water vapor, carbon dioxide, hydrogen sulfide, nitrogen and trace amounts of helium. Under reservoir conditions, natural gas and its associated liquefiable portions occur either in a single gaseous phase in the reservoir or in solution with crude oil and are not distinguishable at the time as separate substances. Note: The Securities and Exchange Commission and the Financial Accounting Standards Board refer to this product as natural gas.
• Associated-dissolved natural gas: Natural gas that occurs in crude oil reservoirs either as free gas (associated) or as gas in solution with crude oil (dissolved gas).
• Nonassociated natural gas: Natural gas that is not in contact with significant quantities of crude oil in the reservoir.
2) Dry natural gas: Natural gas which remains after: 1) the liquefiable hydrocarbon portion has been removed from the gas stream (i.e., gas after lease, field, and/or plant separation); and 2) any volumes of nonhydrocarbon gases have been removed where they occur in sufficient quantity to render the gas unmarketable. Note: Dry natural gas is also known as consumer-grade natural gas. The parameters for measurement are cubic feet at 60 degrees Fahrenheit and 14.73 pounds per square inch absolute.
Net generation: The amount of gross generation less the electrical energy consumed at the generating station(s) for station service or auxiliaries. Note: Electricity required for pumping at pumped-storage plants is regarded as electricity for station service and is deducted from gross generation.
June 2018
U.S. Energy Information Administration | Electric Power Monthly
Net summer capacity: The maximum output, commonly expressed in megawatts (MW), that generating equipment can supply to system load, as demonstrated by a multi-hour test, at the time of summer peak demand (period of May 1 through October 31). This output reflects a reduction in capacity due to electricity use for station service or auxiliaries.
Net winter capacity: The maximum output, commonly expressed in megawatts (MW), that generating equipment can supply to system load, as demonstrated by a multi-hour test, at the time of peak winter demand (period of November 1 though April 30). This output reflects a reduction in capacity due to electricity use for station service or auxiliaries.
North American Electric Reliability Council (NERC): A council formed in 1968 by the electric utility industry to promote the reliability and adequacy of bulk power supply in the electric utility systems of North America. The NERC Regions are:
1) Texas Regional Entity (TRE), 2) Florida Reliability Coordinating Council (FRCC), 3) Midwest Reliability Organization (MRO), 4) Northeast Power Coordinating Council (NPCC), 5) ReliabilityFirst Corporation (RFC), 6) Southeastern Electric Reliability Council (SERC), 7) Southwest Power Pool (SPP), and the 8) Western Energy Coordinating Council (WECC).
North American Industry Classification System (NAICS): A set of codes that describes the possible purposes of a facility.
Nuclear electric power: Electricity generated by an electric power plant whose turbines are driven by steam produced by the heat from the fission of nuclear fuel in a reactor.
Other customers: Includes public street and highway lighting, other sales to public authorities, sales to railroads and railways, sales for irrigation, and interdepartmental sales.
Other generation: Electricity originating from these sources: manufactured, supplemental gaseous fuel, propane, and waste gasses, excluding natural gas; biomass; geothermal; wind; solar thermal; photovoltaic; synthetic fuel; purchased steam; and waste oil energy sources.
Percent change: The relative change in a quantity over a specified time period. It is calculated as follows: the current value has the previous value subtracted from it; this new number is divided by the absolute value of the previous value; then this new number is multiplied by 100.
Petroleum: A broadly defined class of liquid hydrocarbon mixtures. Included are crude oil, lease condensate, unfinished oils, refined products obtained from the processing of crude oil, and natural gas plant liquids. Note: Volumes of finished petroleum products include nonhydrocarbon compounds, such as additives and detergents, after they have been blended into the products.
June 2018
U.S. Energy Information Administration | Electric Power Monthly
Petroleum coke: See Coke (petroleum).
Photovoltaic energy: Direct-current electricity generated from sunlight through solid-state semiconductor devices that have no moving parts.
Plant: A term commonly used either as a synonym for an industrial establishment or a generation facility or to refer to a particular process within an establishment.
Power: The rate at which energy is transferred. Electrical energy is usually measured in watts. Also used for a measurement of capacity.
Power production plant: All the land and land rights, structures and improvements, boiler or reactor vessel equipment, engines and engine-driven generator, turbo generator units, accessory electric equipment, and miscellaneous power plant equipment are grouped together for each individual facility.
Production (electric): Act or process of producing electric energy from other forms of energy; also, the amount of electric energy expressed in watthours (Wh).
Propane: A normally gaseous straight-chain hydrocarbon, (C3H8). It is a colorless paraffinic gas that boils at a temperature of -43.67 degrees Fahrenheit. It is extracted from natural gas or refinery gas streams. It includes all products covered by Gas Processors Association Specifications for commercial propane and HD-5 propane and ASTM Specification D 1835.
Public street and highway lighting service: Includes electricity supplied and services rendered for the purpose of lighting streets, highways, parks and other public places; or for traffic or other signal system service, for municipalities, or other divisions or agencies of State or Federal governments.
Railroad and railway electric service: Electricity supplied to railroads and interurban and street railways, for general railroad use, including the propulsion of cars or locomotives, where such electricity is supplied under separate and distinct rate schedules.
Receipts: Purchases of fuel.
Relative standard error: The standard deviation of a distribution divided by the arithmetic mean, sometimes multiplied by 100. It is used for the purpose of comparing the variabilities of frequency distributions but is sensitive to errors in the means.
Residential: An energy-consuming sector that consists of living quarters for private households. Common uses of energy associated with this sector include space heating, water heating, air conditioning, lighting, refrigeration, cooking, and running a variety of other appliances. The residential sector excludes institutional living quarters.
Residual fuel oil: A general classification for the heavier oils, known as No. 5 and No. 6 fuel oils, that remain after the distillate fuel oils and lighter hydrocarbons are distilled away in refinery operations. It conforms to ASTM Specifications D 396 and D 975 and Federal Specification VV-F-815C. No. 5, a residual fuel oil of medium viscosity, is also known as Navy Special and is defined in Military Specification MIL-F-859E, including Amendment 2 (NATO Symbol F-770). It is used in steam-powered vessels in government
June 2018
U.S. Energy Information Administration | Electric Power Monthly
service and inshore power plants. No. 6 fuel oil includes Bunker C fuel oil and is used for the production of electric power, space heating, vessel bunkering, and various industrial purposes.
Retail: Sales covering electrical energy supplied for residential, commercial, and industrial end-use purposes. Other small classes, such as agriculture and street lighting, also are included in this category.
Revenues: The total amount of money received by a firm from sales of its products and/or services, gains from the sales or exchange of assets, interest and dividends earned on investments, and other increases in the owner's equity except those arising from capital adjustments.
Sales: The transfer of title to an energy commodity from a seller to a buyer for a price or the quantity transferred during a specified period.
Service classifications (sectors): Consumers grouped by similar characteristics in order to be identified for the purpose of setting a common rate for electric service. Usually classified into groups identified as residential, commercial, industrial and other.
Service to public authorities: Public authority service includes electricity supplied and services rendered to municipalities or divisions or agencies of State and Federal governments, under special contracts or agreements or service classifications applicable only to public authorities.
Solar energy: The radiant energy of the sun that can be converted into other forms of energy, such as heat or electricity. Electricity produced from solar energy heats a medium that powers an electricity-generating device.
State power authority: A nonprofit utility owned and operated by a state government agency, primarily involved in the generation, marketing, and/or transmission of wholesale electric power.
Steam-electric power plant (conventional): A plant in which the prime mover is a steam turbine. The steam used to drive the turbine is produced in a boiler where fossil fuels are burned.
Stocks of fuel: A supply of fuel accumulated for future use. This includes coal and fuel oil stocks at the plant site, in coal cars, tanks, or barges at the plant site, or in separate storage sites.
Subbituminous coal: A coal whose properties range from those of lignite to those of bituminous coal and used primarily as fuel for steam-electric power generation. It may be dull, dark brown to black, soft and crumbly, at the lower end of the range, to bright, jet black, hard, and relatively strong, at the upper end. Subbituminous coal contains 20 to 30 percent inherent moisture by weight. The heat content of subbituminous coal ranges from 17 to 24 million Btu per ton on a moist, mineral-matter-free basis. The heat content of subbituminous coal consumed in the United States averages 17 to 18 million Btu per ton, on the as-received basis (i.e., containing both inherent moisture and mineral matter).
Sulfur: A yellowish nonmetallic element, sometimes known as "brimstone." It is present at various levels of concentration in many fossil fuels whose combustion releases sulfur compounds that are considered harmful to the environment. Some of the most commonly used fossil fuels are categorized according to their sulfur content, with lower sulfur fuels usually selling at a higher price. Note: No. 2 Distillate fuel is
June 2018
U.S. Energy Information Administration | Electric Power Monthly
currently reported as having either a 0.05 percent or lower sulfur level for on-highway vehicle use or a greater than 0.05 percent sulfur level for off-highway use, home heating oil, and commercial and industrial uses. Residual fuel, regardless of use, is classified as having either no more than 1 percent sulfur or greater than 1 percent sulfur. Coal is also classified as being low-sulfur at concentrations of 1 percent or less or high-sulfur at concentrations greater than 1 percent.
Sulfur content: The amount of sulfur contained in the fuel (except gas) in terms of percent by weight.
Supplemental gaseous fuel supplies: Synthetic natural gas, propane-air, coke oven gas, refinery gas, biomass gas, air injected for Btu stabilization, and manufactured gas commingled and distributed with natural gas.
Synthetic fuel: A gaseous, liquid, or solid fuel that does not occur naturally. Synfuels can be made from coal (coal gasification or coal liquefaction), petroleum products, oil shale, tar sands, or plant products. Among the synfuels are various fuel gases, including but not restricted to substitute natural gas, liquid fuels for engines (e.g., gasoline, diesel fuel, and alcohol fuels) and burner fuels (e.g., fuel heating oils).
Terrawatt: One trillion watts.
Terrawatthour: One trillion kilowatthours.
Ton: A unit of weight equal to 2,000 pounds.
Turbine: A machine for generating rotary mechanical power from the energy of a stream of fluid (such as water, steam, or hot gas). Turbines convert the kinetic energy of fluids to mechanical energy through the principles of impulse and reaction, or a mixture of the two.
Ultimate consumer: A consumer that purchases electricity for its own use and not for resale.
Useful thermal output: The thermal energy made available in a combined heat or power system for use in any industrial or commercial process, heating or cooling application, or delivered to other end users, i.e., total thermal energy made available for processes and applications other than electrical generation.
Waste coal: As a fuel for electric power generation, waste coal includes anthracite refuse or mine waste, waste from anthracite preparation plants, and coal recovered from previously mined sites.
Waste gases: As a fuel for electric power generation, waste gasses are those gasses that are produced from gasses recovered from a solid-waste or wastewater treatment facility, or the gaseous by-products of oil-refining processes.
Waste oil: As a fuel for electric power generation, waste oil includes recycled motor oil, and waste oil from transformers.
Watt (W): The unit of electrical power equal to one ampere under a pressure of one volt. A Watt is equal to 1/746 horsepower.

June 2018
U.S. Energy Information Administration | Electric Power Monthly
Watthour (Wh): The electrical energy unit of measure equal to one watt of power supplied to, or taken from, an electric circuit steadily for one hour.
Wind energy: The kinetic energy of wind converted into mechanical energy by wind turbines (i.e., blades rotating from the hub) that drive generators to produce electricity.
Year-to -date: The cumulative sum of each month's value starting with January and ending with the current month of the data.