electric vehicle possibilities using low power and light
TRANSCRIPT
EEVC European Electric Vehicle Congress 1
European Electric Vehicle Congress
Brussels, Belgium, 3rd
– 5th
December 2014
Electric Vehicle Possibilities using Low Power and Light
Weight Range Extenders
Mulugeta Gebrehiwot 1,2
, Alex Van den Bossche 1
1 Electrical Energy, Systems & Automation, Ghent University, Technologiepark 913, B 9052 Zwijnaarde, Belgium
[email protected] 2Department of Electrical Power Engineering, DEC, Defence University, Ethiopia
Abstract
Electric cars have the disadvantage of a limited range, and drivers may experience a range anxiety. This
range anxiety can be solved by adding a range extender. But, the range extender should be light so as not to
significantly increase the weight of the original vehicle. In urban areas with dense traffic (usually
developing countries), the average speed around cities is typically lower than 50km/h. This means, the
rolling resistance losses are more important than aerodynamic losses, and a weight reduction results in a
bigger electrical range. Therefore, smaller and lighter range extenders are of much interest. The
contribution of this paper is to indicate the possibility of range extenders with less than 25 kg with a
capacity of 150 to 200 cc to suit a condition where weight counts. In this paper, the cost, environmental and
grid impacts of going electric are also discussed. The effect of high altitude and driving style on the
performance of an electric vehicle is assessed. The challenges and opportunities of vehicle electrification
between countries with decarbonated power generation and fossil fuel dominated power generation are
highlighted. Throughout the article, the case of Ethiopia is taken as an example.
Keywords: Electric Vehicles, range extender, ICE, green house gas emissions
1 Introduction Electric mobility seems increasingly beneficial;
both from an environmental and from an
economical point of view, compared to
conventional mobility [1]. However, the road
towards total vehicle electrification still poses
some big challenges. Currently, the main hurdle
resides in the electrical storage technology [2]-
[4]: compared with liquid fuels, they display
much lower specific energy, energy density and
refuelling/recharging rate. The issues of limited
driving range and long charging time are both
centred on the battery package of the car. But
charging time can also be affected by the electric
grid that supplies the power [5].
A series hybrid electric vehicle configuration uses
the Internal Combustion Engine (ICE) as a prime
mover of the generator coupled to the engine, and
an electric motor to provide movement to the
vehicle. This system can run with a small engine
output in a stable operation efficiency region,
supplying and generating electricity to the traction
motor being sufficient for the average consumption
[6]. This allows a reduction of fuel consumption
and a better sizing for the engine [7].
Typical car trips are within the driving range of
efficient electric vehicles (EVs), as almost 90% of
daily car use [8] is for less than 40 km, while

EEVC European Electric Vehicle Congress 2
occasional trips exceed the EV range. In [9], it
has been shown that even with limited range;
electric vehicles could provide a large fraction of
transportation needs. However, for the occasional
extended range; the additional battery cost is
extremely high. A solution to overcome this
limitation is to start from a pure electric vehicle
concept and include a range extender. Range
extenders are small electricity generators
operating only when required. The range
extender consists of four parts: a combustion
engine, a generator, a power electronic converter
and a fuel tank, as shown in Figure 1. The
generator is used to transform mechanical energy
to electrical energy. A power electronic converter,
interfacing the starter/ generator to the battery-bus
of the electric vehicle, helps in starting and
adapting the torque speed curve.
The BLDC starter/generator coupled with the IC
engine acts as a starter motor during the engine
starting (motoring) mode [10].
Figure1: Series Hybrid Electric Vehicle Architecture
2 Power and Torque Requirem
ents for a Range Extender In countries where the highway speed is limited,
electric vehicles combined with low power and
low weight range extenders can do the job of
electric mobility. However, range extenders with
a power up to 30kW, might be useful in Germany
where long distance sustained speeds of 150km/h
are allowed and realistic.
A way to reduce weight is using the generator as
a cranking motor. The accelerating torque
(resultant torque) which is applied as an engine
starting torque is the difference of the torque
produced from the starter/generator working as a
starting motor minus the compression and
friction torque. In the motoring case, the ICE acts
as a load, and therefore applies a negative torque
to the starter/generator.
2.1 Starter/generator Torque
Requirements
The starter/generator under consideration is
permanent magnet BLDC out runner machine
which starts the engine in motoring mode and
works as a generator once the engine has been
started. The electric machine needs to have motoring and
generating capability, high power density, high
efficiency high starting torque and reasonably a
wide speed range to meet performance
specifications.
2.2 Modeling of the compression torque
(Tc) based on piston motion
The two commonly used 4 stroke combustion
engines in production are the SI-engines (Spark
Ignited) used for vehicles using gasoline, and the
CI-engines (Compression Ignited) used for diesel
engines. Here we deal with SI engine at full
throttle, but the same methodology can be used to
CI-engines.
Engine parameters:
, ,
,
Assuming an adiabatic compression, the equation
for torque on the crankshaft due to the compressive
force acting up on the piston can be expressed as:
( ) [ (
( ))
]
( ) (1)
EEVC European Electric Vehicle Congress 3
Note that when adapted, these engines can
deliver considerably more power, as in kart
competition.
: specific heat ratio , 1.4 for air, assuming
adiabatic compression.
, ambient pressure
, intake pressure
is pressure in cylinder at beginning of
compression, usually nearly atmospheric.
Vd: displacement volume, m3
VC: clearance volume, m3
VBC: total volume, m3
Table 1: Engine specifications Model
Type
G200F
Single cylinder,
4-stroke gasoline
Rated Power (kW/3600rpm) 4.1
Max. torque (Nm/rpm) 12.4/2500
Fuel Consumption (gr/kWh) 313 Bore x Stroke (mm) 68x54
Displacement (cc) 196
Compression ratio 8.5:1 Dimension –Length(mm) 342
Dimension –Width(mm) 376
Dimension –Height(mm) 335 Net weight (kg) 16.5
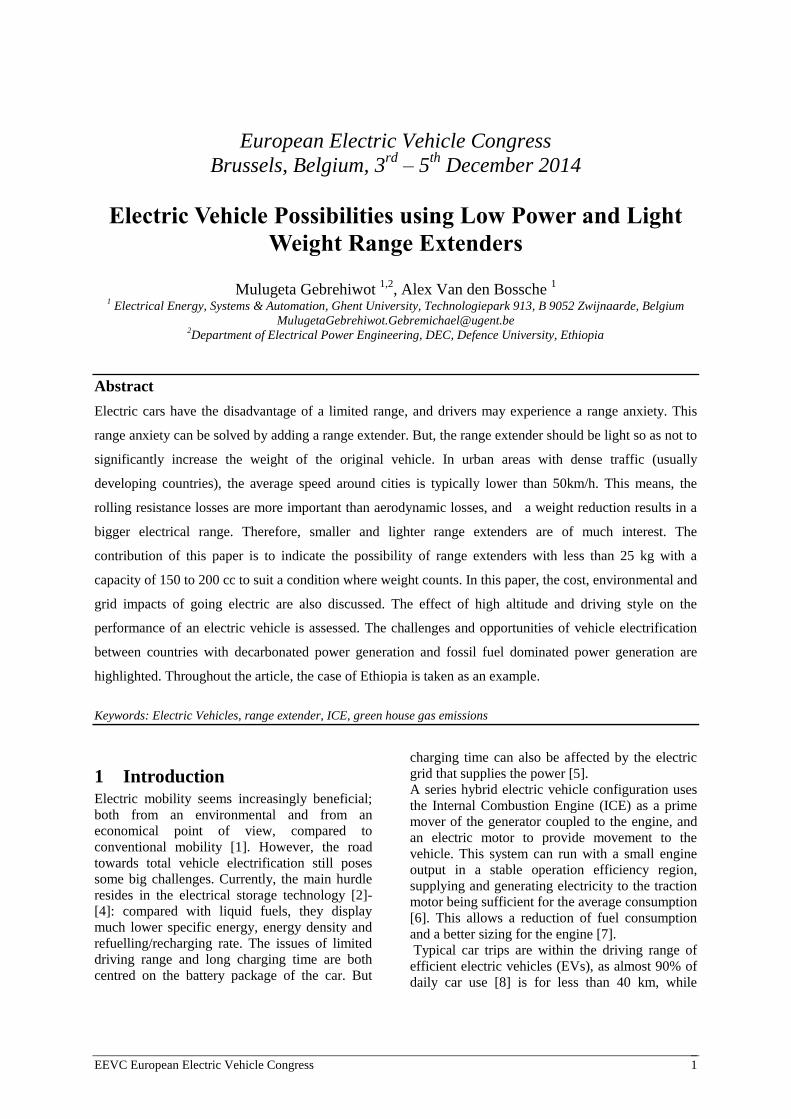
Figure 2: Geometric parameters of a cylinder [11-12].
Figure 3: Compression torque as a function of
Cranking Angle
The energy required for compression is:
∫ ( ( ) )
∫ ( )
(2)
The compression torque is averaged in one and
half cycle (3π) considering from the start of
exhaust 0 till the end of compression at 3π, as
indicated in Fig.3.The BLDC torque requirement
should be greater than the sum of the average
compression torque in one and half cycle (3π) and
the friction torque.
(3)
For the IC engine under consideration, the friction
torque , in a new condition, which is rather worst
case, was measured and found to be 2Nm,
approximately. The effect of valves is neglected as
compared to the worst case of friction torque.
Therefore, an outer runner BLDC motor used at a
torque ( ) capability of just above 7.2 Nm is
sufficient for the engine starting requirement. The
resulting torque accelerates the inertia of engine
and generator. The inertia of the engine including
the flywheel is estimated at 12.347x10⁻³
kg.m2 and
that of generator at 3.031x10⁻³
kg.m2.
The dynamic torque equation for the system is:
( ) (4)
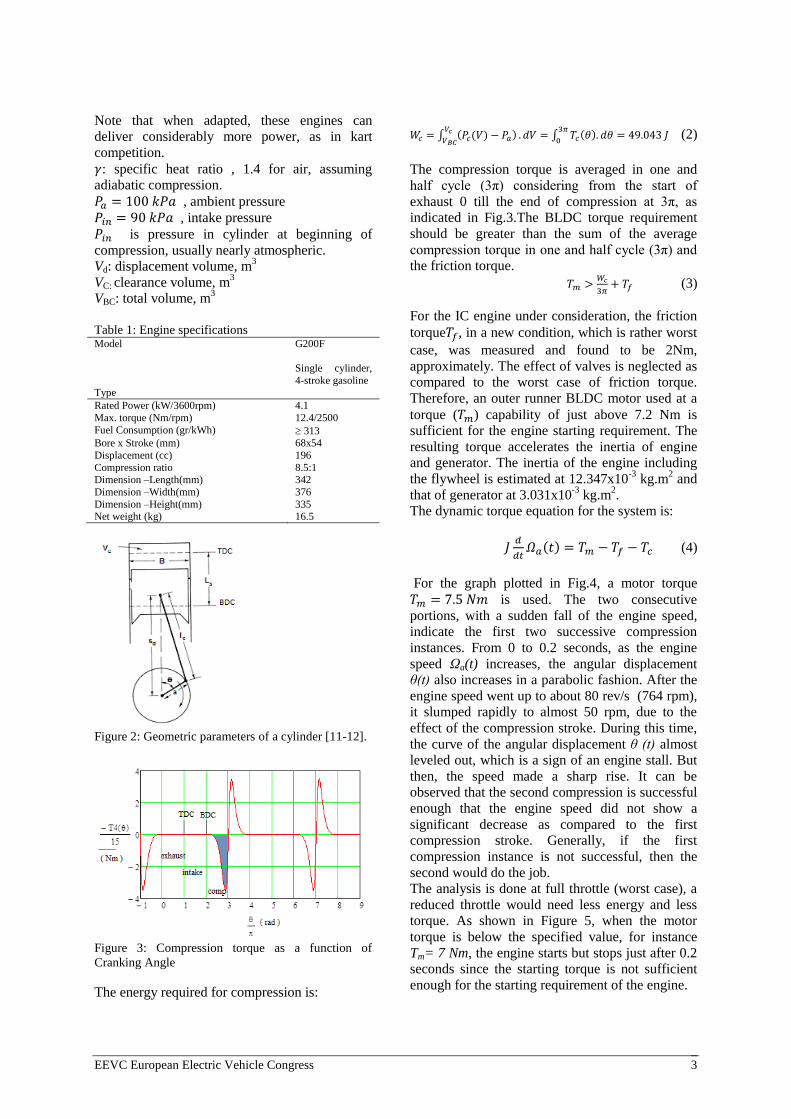
For the graph plotted in Fig.4, a motor torque
is used. The two consecutive
portions, with a sudden fall of the engine speed,
indicate the first two successive compression
instances. From 0 to 0.2 seconds, as the engine
speed Ωa(t) increases, the angular displacement
θ(t) also increases in a parabolic fashion. After the
engine speed went up to about 80 rev/s (764 rpm),
it slumped rapidly to almost 50 rpm, due to the
effect of the compression stroke. During this time,
the curve of the angular displacement θ (t) almost
leveled out, which is a sign of an engine stall. But
then, the speed made a sharp rise. It can be
observed that the second compression is successful
enough that the engine speed did not show a
significant decrease as compared to the first
compression stroke. Generally, if the first
compression instance is not successful, then the
second would do the job.
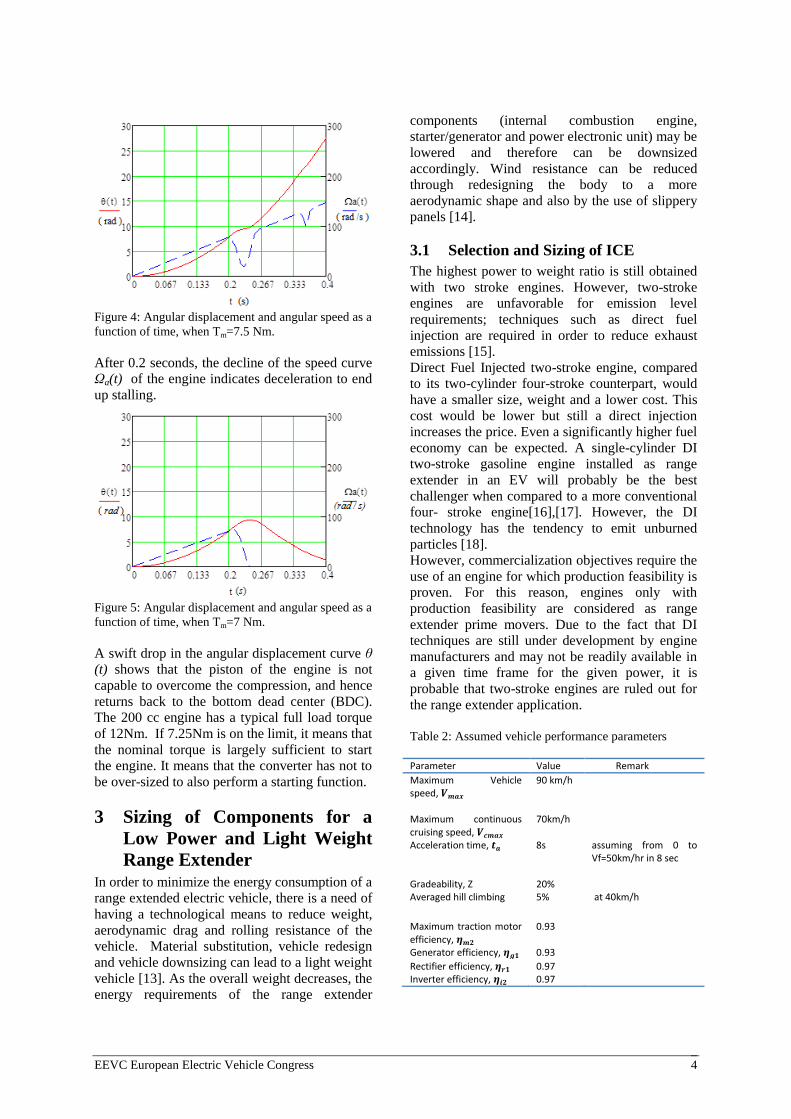
The analysis is done at full throttle (worst case), a
reduced throttle would need less energy and less
torque. As shown in Figure 5, when the motor
torque is below the specified value, for instance
Tm= 7 Nm, the engine starts but stops just after 0.2
seconds since the starting torque is not sufficient
enough for the starting requirement of the engine.
EEVC European Electric Vehicle Congress 4
Figure 4: Angular displacement and angular speed as a
function of time, when Tm=7.5 Nm.
After 0.2 seconds, the decline of the speed curve
Ωa(t) of the engine indicates deceleration to end
up stalling.
Figure 5: Angular displacement and angular speed as a
function of time, when Tm=7 Nm.
A swift drop in the angular displacement curve θ (t) shows that the piston of the engine is not
capable to overcome the compression, and hence
returns back to the bottom dead center (BDC).
The 200 cc engine has a typical full load torque
of 12Nm. If 7.25Nm is on the limit, it means that
the nominal torque is largely sufficient to start
the engine. It means that the converter has not to
be over-sized to also perform a starting function.
3 Sizing of Components for a
Low Power and Light Weight
Range Extender In order to minimize the energy consumption of a
range extended electric vehicle, there is a need of
having a technological means to reduce weight,
aerodynamic drag and rolling resistance of the
vehicle. Material substitution, vehicle redesign
and vehicle downsizing can lead to a light weight
vehicle [13]. As the overall weight decreases, the
energy requirements of the range extender
components (internal combustion engine,
starter/generator and power electronic unit) may be
lowered and therefore can be downsized
accordingly. Wind resistance can be reduced
through redesigning the body to a more
aerodynamic shape and also by the use of slippery
panels [14].
3.1 Selection and Sizing of ICE
The highest power to weight ratio is still obtained
with two stroke engines. However, two-stroke
engines are unfavorable for emission level
requirements; techniques such as direct fuel
injection are required in order to reduce exhaust
emissions [15].
Direct Fuel Injected two-stroke engine, compared
to its two-cylinder four-stroke counterpart, would
have a smaller size, weight and a lower cost. This
cost would be lower but still a direct injection
increases the price. Even a significantly higher fuel
economy can be expected. A single-cylinder DI
two-stroke gasoline engine installed as range
extender in an EV will probably be the best
challenger when compared to a more conventional
four- stroke engine[16],[17]. However, the DI
technology has the tendency to emit unburned
particles [18].
However, commercialization objectives require the
use of an engine for which production feasibility is
proven. For this reason, engines only with
production feasibility are considered as range
extender prime movers. Due to the fact that DI
techniques are still under development by engine
manufacturers and may not be readily available in
a given time frame for the given power, it is
probable that two-stroke engines are ruled out for
the range extender application.
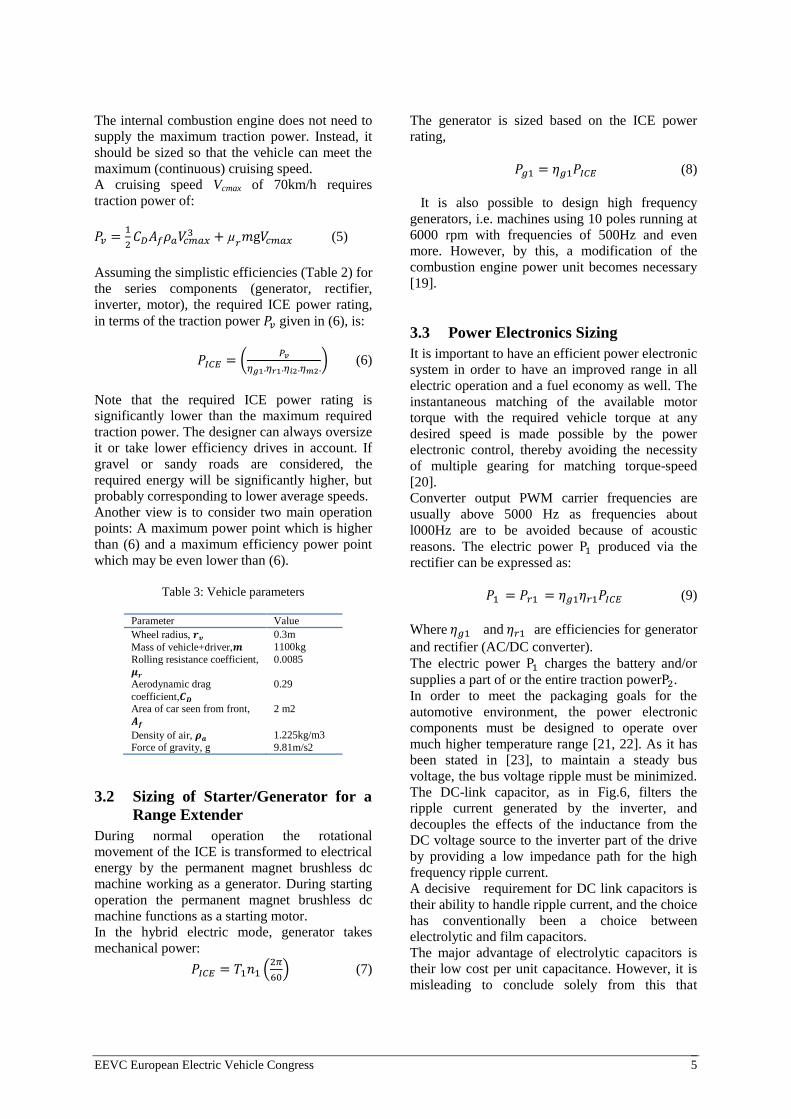
Table 2: Assumed vehicle performance parameters
Parameter Value Remark
Maximum Vehicle speed,
90 km/h
Maximum continuous cruising speed,
70km/h
Acceleration time, 8s assuming from 0 to Vf=50km/hr in 8 sec
Gradeability, Z 20% Averaged hill climbing 5% at 40km/h
Maximum traction motor efficiency,
0.93
Generator efficiency, 0.93
Rectifier efficiency, 0.97 Inverter efficiency, 0.97
EEVC European Electric Vehicle Congress 5
The internal combustion engine does not need to
supply the maximum traction power. Instead, it
should be sized so that the vehicle can meet the
maximum (continuous) cruising speed.
A cruising speed Vcmax of 70km/h requires
traction power of:
(5)
Assuming the simplistic efficiencies (Table 2) for
the series components (generator, rectifier,
inverter, motor), the required ICE power rating,
in terms of the traction power given in (6), is:
(
) (6)
Note that the required ICE power rating is
significantly lower than the maximum required
traction power. The designer can always oversize
it or take lower efficiency drives in account. If
gravel or sandy roads are considered, the
required energy will be significantly higher, but
probably corresponding to lower average speeds.
Another view is to consider two main operation
points: A maximum power point which is higher
than (6) and a maximum efficiency power point
which may be even lower than (6).
Table 3: Vehicle parameters
Parameter Value
Wheel radius, 0.3m
Mass of vehicle+driver, 1100kg
Rolling resistance coefficient,
0.0085
Aerodynamic drag
coefficient,
0.29
Area of car seen from front,
2 m2
Density of air, 1.225kg/m3
Force of gravity, g 9.81m/s2
3.2 Sizing of Starter/Generator for a
Range Extender
During normal operation the rotational
movement of the ICE is transformed to electrical
energy by the permanent magnet brushless dc
machine working as a generator. During starting
operation the permanent magnet brushless dc
machine functions as a starting motor.
In the hybrid electric mode, generator takes
mechanical power:
(
) (7)
The generator is sized based on the ICE power
rating,
(8)
It is also possible to design high frequency
generators, i.e. machines using 10 poles running at
6000 rpm with frequencies of 500Hz and even
more. However, by this, a modification of the
combustion engine power unit becomes necessary
[19].
3.3 Power Electronics Sizing
It is important to have an efficient power electronic
system in order to have an improved range in all
electric operation and a fuel economy as well. The
instantaneous matching of the available motor
torque with the required vehicle torque at any
desired speed is made possible by the power
electronic control, thereby avoiding the necessity
of multiple gearing for matching torque-speed
[20].
Converter output PWM carrier frequencies are
usually above 5000 Hz as frequencies about
l000Hz are to be avoided because of acoustic
reasons. The electric power produced via the
rectifier can be expressed as:
(9)
Where and are efficiencies for generator
and rectifier (AC/DC converter).
The electric power charges the battery and/or
supplies a part of or the entire traction power .
In order to meet the packaging goals for the
automotive environment, the power electronic
components must be designed to operate over
much higher temperature range [21, 22]. As it has
been stated in [23], to maintain a steady bus
voltage, the bus voltage ripple must be minimized.
The DC-link capacitor, as in Fig.6, filters the
ripple current generated by the inverter, and
decouples the effects of the inductance from the
DC voltage source to the inverter part of the drive
by providing a low impedance path for the high
frequency ripple current.
A decisive requirement for DC link capacitors is
their ability to handle ripple current, and the choice
has conventionally been a choice between
electrolytic and film capacitors.
The major advantage of electrolytic capacitors is
their low cost per unit capacitance. However, it is
misleading to conclude solely from this that

EEVC European Electric Vehicle Congress 6
electrolytic capacitors are more cost effective
solutions for DC links [24]. The ripple current
rating is often the most important factor for this
application. Because of the relatively low ripple
current rating of electrolytic capacitors, it is often
necessary to install more capacitance than is
necessary in order to meet the ripple current
requirements. Therefore, comparing the cost per
unit amp of ripple current rating is more useful,
and often results in film capacitors, where ripple
current is not usually the limiting factor.
Hence, using film capacitors would mean the
designer has to only consider the minimum
capacitance value required for the system. As a
result, designs which use film technology
frequently save space [25].
Even though film capacitors do cost more per µF
than electrolytic capacitors, the amount of
capacitance needed for an inverter DC link
capacitor design is much less for a film capacitor
than an electrolytic capacitor since the film
capacitor is not limited by ripple current rating like
the electrolytic capacitor is. Film capacitors are
advantageous over electrolytic capacitors in terms
of size, weight, lifetime, inverter efficiency and
cost [26], [27]. If a film capacitor is used, more
current ripple has to be absorbed by the battery as
a compromise.
For some simulations, Advanced Vehicle
Simulator (ADVISOR) software is used.
Figure 6: Plots for 4 cycle of NEDC with 1100 kg vehicle weight
Figure 7: For 4 cycles of NEDC with 2000 kg vehicle weight

EEVC European Electric Vehicle Congress 7
The following conditions were considered: Series
Vehicle, ICE power 4 kW, generator power 4
kW, traction motor power of 16 kW, mass of
vehicle of 1100 kg, hill climbing 5% at 40 km/hr
as given in Table 1, Table 2 and Table 3.
For the inputs given, the series hybrid vehicle
goes all-electric for almost the first two cycles of
NEDC (Fig.6). and no emissions were released
as no petrol fuel was used. In Fig.7, the vehicle
goes all-electric for the first cycle, and at the
beginning of the second cycle, it then starts using
the gasoline. Keeping other parameters the same
and making a difference only in the weight of the
vehicle, a diffeence in the performance of the
vehicle is observed. In Fig.6 (with lighter
weight), the battery goes till the end of the fourth
cycle without a complete discharge, higher fuel
economy and lower emissions as compared to
that of Fig.7. For the heavier weight of vehicle
(Fig.7), there is a big difference between the
requested and attained speeds in the fourth drive
cycle.
4 Vehicle Electrification Impacts
on Grid and Cost
Car electrification entails costs and grid impacts.
But these impacts differ from country to country
depending on the power generation mix they
have. The impacts will be discussed comparing
countries where the energy mix is of coal
dominated and countries where power generation
is mainly of renewable energy sources.
4.1 Associated costs of driving electric
vehicles
Fuel prices in Ethiopia as of 2014 are 0.718€/litre
and 0.78€/litre for diesel and petrol respectively,
and for electric vehicles the average electricity
rate is around 0.024 €/kWh. This will make range
extended PHEVs and BEVs have the lowest
operating costs due to the reduced price for
electricity, and low usage of the ICE of the
PHEV to recharge the battery.
According to [28], [29], the estimated current
cost of a battery pack is between 400 and 600
€/kWh which makes BEVs have higher initial
costs. The battery pack used in the Nissan Leaf
has an estimated cost of 530 €/kWh (12,720 € for
the 24 kWh battery) and the Chevrolet Volt
battery has an estimated cost of 420 €/kWh (6720
€ for the 16 kWh battery) corresponding to 35%
and 16% of the total cost of the vehicle
respectively. In 2020, the price per kWh is
expected to be approximately 250 €, or 4000–
6000 € for a 16–24 kWh battery pack. As the gap
between electricity prices and petroleum widens,
and as production volumes increase, cost will
come down and PHEVs will become more
attractive in the long run [30].
As to [31], 10 kWh of battery capacity would give
a performance of roughly 4 litres of petrol
equivalent. Due to the way the batteries and
battery chargers work, considering efficiency of
80% for both the battery charger and the battery
itself, we actually consume about 16 (or 10/0.64)
kWh of electricity. This means, for the Ethiopian
case where electricity rate is around 0.024 €/kWh,
roughly €0.40 (16*0.024) would be added to the
house electric bill for the equivalent of 4 litres of
petrol. On the other hand, 4 litres of petrol in
Ethiopia costs around €3.
4.2 Impacts on existing electric grid
The electrification of cars will certainly have an
impact on the grid due to the need of recharging
the battery pack. Knowing the magnitude of
demand arising from the additional plug-in fleet
and meeting the energy requirement as per the
demand is very important aspect of handling the
impact. The daily energy needed to recharge the
entire BEV and PHEV has been dealt in [32], [33].
The daily energy needed to recharge the entire
BEV fleet can be estimated as:
( ) ( ) ( ) ( ) (10)
where is the BEV autonomy to be guaranteed
on a daily base, assumed equal to 41 km, which
corresponds to 15,000 km /year. is the
share of the PEVs at year within the private car
fleet .
The BEV power demand (i.e. PBEV (n)) can
therefore be easily calculated dividing ( ) by
the recharging time .here assumed equal
to 1 h.
PHEV autonomy, differently than BEV, can rely
on the sole fuel availability to be run in charge
sustained mode after battery depletion.
The voltage and amperage of the connection to the
electric grid are the factors which affect the power
demand on the grid. Then the recharging time is
determined by capacity of the battery to be
recharged [34].
( ) ( )
(11)
where the charging time was assumed
equal to 7 h. In Ethiopia, a battery pack can draw a

EEVC European Electric Vehicle Congress 8
maximum of 16 A at 220 V from a regular power
socket. This means, a maximum of 3.52 kWh
energy can be stored in 1 hour. In order to fully
charge a battery with a nominal capacity of 8
kWh, we would actually need around 10 kWh
(8/0.8) of electricity, assuming a 20% charging
loss. This means for 7 hours of charging during
the night, the battery draws roughly 6.5 A at 220
V.
Apart from the different factors which affect the
performance of electric vehicles discussed above,
the type of power source from which the battery
of an electric vehicle charges is that really
matters when it comes to emission reduction.
Therefore, in order to be benefited out of going
electric, it is necessary to look into the grid mix
of a given country.
5 Effect of High Altitude and
Driving Style
5.1 Effect of altitude in energy
consumption
In higher altitudes the air drag will be lower, and
of course less dense. If there is a downhill section
on a hilly road, low power level will be required
and even braking have to occur frequently. If, on
the other hand, there is an upcoming uphill
section on a hilly road, a high power level will be
required for hill climbing [35]. However [28],
certain factors like elevation profile and the
energy recovered while braking , though play an
important role in the overall performance of an
EV, they are not accounted in drive cycles like
NEDC (see Fig.6 and 7).
As altitude increases, air becomes thinner. As air
is required for combustion, and there is less
available at higher altitudes, the engine makes
less power. In general, a naturally aspirated
engine will lose about 3 percent of its rated
power for every 1,000 feet (about 1%/100m) of
altitude gained. However, one can get higher
miles-per-gallon at higher elevations [36].
HP Loss = (elevation x 0.03 x horsepower @ sea
level)/1000
In Ethiopia, the capital city, Addis Ababa, is at
an altitude of 2300 to 2400 m above sea level.
This means a naturally aspirated internal
combustion engine of a range extender will
experience a loss of about 20 percent of its power
compared to sea level. An altitude difference of
1000m and 1000kg corresponds to [37]:
Wa = M Δh x g
That is 9.81MJ/1000m/ton= 2.725 kWh/1000m/ton
M: Mass of the vehicle, Δh: altitude difference. On
the other hand, when driving down hill one should
be aware of overcharging the battery as it may
require a resistive dissipating means to prevent
overcharging.
5.2 Effect of driving style in energy
consumption
The driver’s driving style and the auxiliary
equipment of the vehicle [28] are the other factors
which affect the energy balance. In order to reduce
the extra power requirement due to the auxiliary
equipment, at low speeds it is recommended to
circulate air with the windows open rather than
using the air conditioner of the car. Instead of
using an aggressive driving style, a driving style
with moderate accelerations and speed, minimizing
the time at which the electric motor runs at full
power and maximizing the energy recovered
through regenerative braking, optimizes the
vehicle range.
6 What Matters for an Electric
Vehicle to be Green or not? In order to have a better overview of the impact of
electric vehicles on the climate, it is appropriate to
consider the magnitude of emissions arise from
both electricity supply and vehicle manufacturing.
Both electric and hybrid electric vehicles offer
CO2 emissions reductions; however an EV
charged by electricity derived from carbon
intensive sources would only achieve marginal
savings over an Internal Combustion Engine
(ICE). A vehicle charged from decarbonised
electricity offers significant savings [38].
As far as the GHG emission is concerned, the use
phase dominates the overall impacts when it comes
to a fossil fuel dominated electricity mix.
However, for an electricity mix where the
renewable energy source is dominant, the
production phase of a BEV is the one that
dominates the overall environmental impact [39,
40].
According to [41], an electric vehicle has an
estimated manufacturing emissions of 70 g CO2
e/km over its lifetime, and its wall-to-wheel energy
use, for instance of that Nissan Leaf, is 211wh/km.
Out of the total emissions arise from consuming
grid electricity, 80% comes directly from fuel
combustion, 10% from fuel production indirectly,
and 10% results due to the losses in transmission
and distribution, though this varies from country to
country.
EEVC European Electric Vehicle Congress 9
Table 4: Mix of sources for electric generation in
Ethiopia as of 2012[42].
Type Capacity
(MW)
Generation
(TWh/year)
% share
of total
Hydro 1950 6.2 99.2
Diesel 130 0.01 0.16
Wind 80 0.03 0.48
Geothermal 7 0.01 0.16
Total 2167 6.25 100
In Ethiopia [44], by 2030 the total electric
generation installed capacity will be around
25,000 MW out of which 22,000 MW, 2,000
MW and 1,000 MW will be from hydro, wind
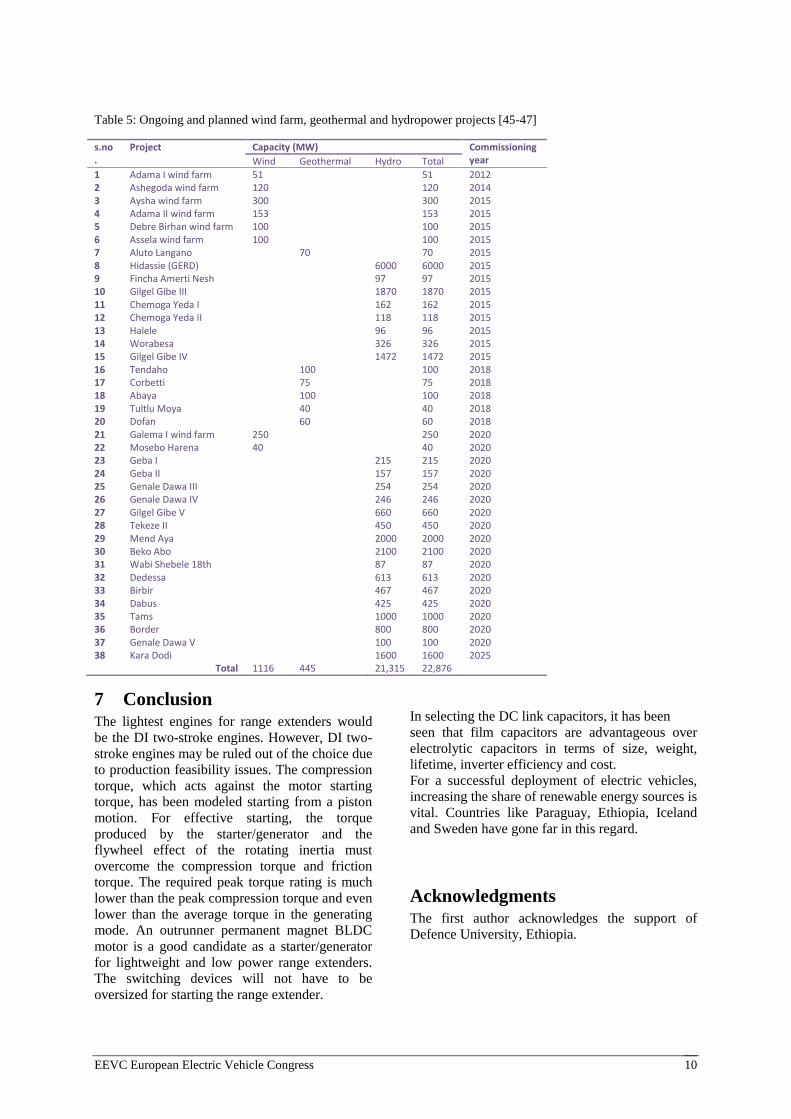
and geothermal power plants, respectively. Table
5 shows the ongoing and planned renewable
energy source projects. This makes Ethiopia a
place where the future of electric vehicles is
promising. Electric vehicles can’t be taken as a
standalone means for emission reduction unless
they are deployed with an aggressive expansion
for more green energy sources.
According to [41],[44], the carbon emissions for
petrol vehicle manufacturing over its lifetime,
and petrol production are estimated at 40 gCO2
e/km and 0.46 kg CO2 e/litre, respectively.
In other words, considering all the emission
components carbon intensity of petrol combustion
(2.31 kg CO2 e/ litre), manufacturing of petrol
vehicle (40 gCO2 e/km) and petrol production
(0.46 kg CO2 e/litre), a hypothetical petrol vehicle
with fuel economy of 220 MPGUS (1 L / 100 km)
will emit around 7 kg CO2 e/100 km. This means,
driving an electric vehicle in Paraguay and
Ethiopia, where all the electric car emissions (70 g
CO2 e/km) result from the vehicle manufacturing,
is equivalent to driving a petrol vehicle of
1litre/100km fuel economy. Needless to say, that
this is sensitive to vehicle manufacturing
assumptions. In the coal based countries, grid
powered electric vehicles are no better than
conventional petrol vehicles, and possibly worse.
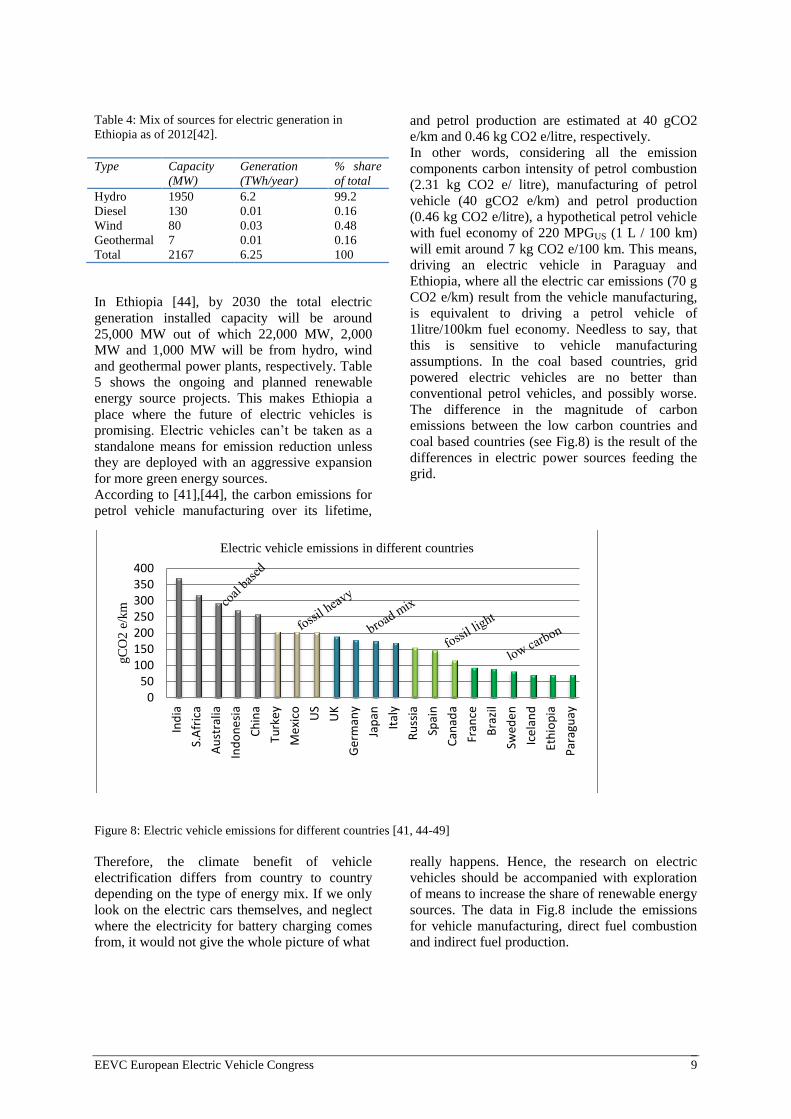
The difference in the magnitude of carbon
emissions between the low carbon countries and
coal based countries (see Fig.8) is the result of the
differences in electric power sources feeding the
grid.
Figure 8: Electric vehicle emissions for different countries [41, 44-49]
Therefore, the climate benefit of vehicle
electrification differs from country to country
depending on the type of energy mix. If we only
look on the electric cars themselves, and neglect
where the electricity for battery charging comes
from, it would not give the whole picture of what
really happens. Hence, the research on electric
vehicles should be accompanied with exploration
of means to increase the share of renewable energy
sources. The data in Fig.8 include the emissions
for vehicle manufacturing, direct fuel combustion
and indirect fuel production.
050
100150200250300350400
Ind
ia
S.A
fric
a
Au
stra
lia
Ind
on
esi
a
Ch
ina
Turk
ey
Me
xico U
S
UK
Ger
man
y
Jap
an
Ital
y
Ru
ssia
Spai
n
Can
ada
Fran
ce
Bra
zil
Swed
en
Ice
lan
d
Eth
iop
ia
Par
agu
ay
gC
O2
e/k
m
Electric vehicle emissions in different countries
EEVC European Electric Vehicle Congress 10
Table 5: Ongoing and planned wind farm, geothermal and hydropower projects [45-47]
s.no.
Project Capacity (MW) Commissioning year Wind Geothermal Hydro Total
1 Adama I wind farm 51 51 2012 2 Ashegoda wind farm 120 120 2014 3 Aysha wind farm 300 300 2015 4 Adama II wind farm 153 153 2015 5 Debre Birhan wind farm 100 100 2015 6 Assela wind farm 100 100 2015 7 Aluto Langano 70 70 2015 8 Hidassie (GERD) 6000 6000 2015 9 Fincha Amerti Nesh 97 97 2015 10 Gilgel Gibe III 1870 1870 2015 11 Chemoga Yeda I 162 162 2015 12 Chemoga Yeda II 118 118 2015 13 Halele 96 96 2015 14 Worabesa 326 326 2015 15 Gilgel Gibe IV 1472 1472 2015 16 Tendaho 100 100 2018 17 Corbetti 75 75 2018 18 Abaya 100 100 2018 19 Tultlu Moya 40 40 2018 20 Dofan 60 60 2018 21 Galema I wind farm 250 250 2020 22 Mosebo Harena 40 40 2020 23 Geba I 215 215 2020 24 Geba II 157 157 2020 25 Genale Dawa III 254 254 2020 26 Genale Dawa IV 246 246 2020 27 Gilgel Gibe V 660 660 2020 28 Tekeze II 450 450 2020 29 Mend Aya 2000 2000 2020 30 Beko Abo 2100 2100 2020 31 Wabi Shebele 18th 87 87 2020 32 Dedessa 613 613 2020 33 Birbir 467 467 2020 34 Dabus 425 425 2020 35 Tams 1000 1000 2020 36 Border 800 800 2020 37 Genale Dawa V 100 100 2020 38 Kara Dodi 1600 1600 2025
Total 1116 445 21,315 22,876
7 Conclusion The lightest engines for range extenders would
be the DI two-stroke engines. However, DI two-
stroke engines may be ruled out of the choice due
to production feasibility issues. The compression
torque, which acts against the motor starting
torque, has been modeled starting from a piston
motion. For effective starting, the torque
produced by the starter/generator and the
flywheel effect of the rotating inertia must
overcome the compression torque and friction
torque. The required peak torque rating is much
lower than the peak compression torque and even
lower than the average torque in the generating
mode. An outrunner permanent magnet BLDC
motor is a good candidate as a starter/generator
for lightweight and low power range extenders.
The switching devices will not have to be
oversized for starting the range extender.
In selecting the DC link capacitors, it has been
seen that film capacitors are advantageous over
electrolytic capacitors in terms of size, weight,
lifetime, inverter efficiency and cost.
For a successful deployment of electric vehicles,
increasing the share of renewable energy sources is
vital. Countries like Paraguay, Ethiopia, Iceland
and Sweden have gone far in this regard.
Acknowledgments The first author acknowledges the support of
Defence University, Ethiopia.
EEVC European Electric Vehicle Congress 11
References [1] Ricardo Faria et al. A sustainability assessment of
electric vehicles as a personal mobility system.
Energy Conversion and Management 61 (2012)
[2] Federico Millo et al. Real CO2 emissions benefits
and end user’s operating costs of a plug-in
Hybrid Electric Vehicle. Applied Energy 114
(2014)
[3] Thomas H. et al. Design, demonstrations and
sustainability impact assessments for plug-in
hybrid electric vehicles. Renewable and
Sustainable Energy Reviews 13 (2009) 115–128
[4] Joao Ribau et al. Analysis of four-stroke, Wankel,
and micro turbine based range extenders for
electric vehicles. Energy Conversion and
Management 58 (2012) 120–133
[5] Hans-Christian B. et al .Evaluation of Fuel-Cell
Range Extender Impact on Hybrid Electrical
Vehicle Performance. IEEE Trans. on Vehicular
Tech, Vol. 62, NO. 1, JANUARY 2013.
[6] G.O.Duarte et al. Effect of Battery State of
Charge on Fuel Use and Pollutant Emissions of a
Full Hybrid Electric Light Duty Vehicle. Journal
of Power Sources, 246(2014) 377-386
[7] Stefano Barsali et al. A Control Strategy to
Minimize Fuel Consumption of Series Hybrid
Electric Vehicles. IEEE Trans. on Energy Conv,
VOL. 19, NO. 1, MARCH 2004
[8] Can.Wang et al. A Permanent Magnet Integrated
Starter Generator for Electric Vehicle Onboard
Range Extender Application. IEEE Trans. on
Magnetics, Vol. 48, NO. 4, APRIL 2012.
[9] Nathaniel S.et al. Electric vehicles: How much
range is required for a day’s driving? Elsevier,
Transportation Research Part C 19 (2011) .
[10] Luigi Alberti et al. IPM Machine Drive Design
and Tests for an Integrated Starter–Alternator
Application. IEEE Trans. on Industry
Applications, Vol. 46, NO. 3, MAY/JUNE 2010.
[11] John B.Heywood (1988). Internal Combustion
Engine Fundamental. Pp.9-10, McGraw-Hill.
[12] Willard W. Pulkrabek. Engineering
Fundamentals of the Internal Combustion
Engine. pp-42, Prentice Hall, New Jersey.
[13] http://mitei.mit.edu/system/files/2007-04-rp.pdf
[14] Jaura AK et al. Systems approach in achieving
higher fuel economy in hybrid vehicles. SAE
Paper No. 2000-01-1585.
[15] Thoma B. et al .Low-Emission Range Extender
for Electric Vehicles. AC Propulsion Inc., South
Coast Air Quality Management District.
[16] Duret P. The Small Gasoline DI 2-Stroke Engine:
an Adapted Range Extender for Electric
Vehicles? Symposium on International
Automotive Technology, Keynote paper,
SIAT’09,2011
[17] Duret P. The New Generation of Gasoline DI 2-
Stroke Engines: a Powertrain for Innovative
Ultra LowCost Passenger Cars? Keynote paper,
SIAT’09, Pune, January 2009
[18] http://www.ft.com/intl/cms/s/0/60b7cc8c-56b2-
11e3-00144feabdc0.html#axzz2mCT3PQ6p 11-27
,access date Dec, 2013
[19] A.Schimdhofer. Range Extender Optimisation for
Electrical Vehicles. IEEE Trans. 2003.
[20] K. M. Rahman and M. Ehsani .Performance
Analysis of Electric Motor Drives for Electric and
Hybrid Electric Vehicle Applications. IEEE Power
Electronics in Transportation, 1996.
[21] Emadi A et al. Power electronics and motor drives
in electric hybrid electric and plug-in hybrid
electric vehicles. IEEE Trans Ind Electron
2008;55(June (6)).
[22] Shaik Amjad et al. Review of design considerations
and technological challenges for successful
development and deployment of plug-in hybrid
electric vehicles. Renewable and Sustainable
Energy Reviews 14 (2010)
[23] Syed A. Hossain, Rodrigo Pedro. Effect of BLDC
motor commutation schemes on inverter capacitor
size selection. International Conference on
Electrical Machines - ICEM 2010, Rome
[24] D. Winterborne et al. Capacitors for High
Temperature DC Link Applications in Automotive
Traction Drives: Current Technology and
Limitations. EPE’13 ECCE Europe.
[25] Gilles Terzulli. .Film Technology to Replace
Electrolytic Technology in Wind Power
Applications. TPC, Division of AVX Corporation,
St.Apollinaire, France.
[26] Michael Salcone and Joe Bond. Selecting Film Bus
Link Capacitors for High Performance Inverter
Applications. Electric Machines and Drives
Conference, 2009. IEMDC’09. IEEE
International,pages 1692-1699, May 2009.
[27] D. Montanari et al. Film capacitors for automotive
and industrial applications. In CARTS Europe,
Helsinki, Finland, Oct. 2008.
[28] Ricardo Faria et al. A sustainability assessment of
electric vehicles as a personal mobility system.
Energy Conversion and Management 61 (2012)
[29] Batteries for Electric Cars: challenges,
opportunities and the outlook to 2020.
http://www.bcg.com/documents/file36615.pdf
[30] Shaik Amjad et al. Review of design considerations
and technological challenges for successful
development and deployment of plug-in hybrid
electric vehicles. Renewable and Sustainable
Energy Reviews 14 (2010)
[31] I.J.M. Besselink et al. Design of an efficient, low
weight battery electric vehicle based on a VW Lupo
3L. The 25th World Battery, Hybrid and Fuel Cell
Electric Vehicle Symposium & Exhibition,
Shenzhen, China, Nov. 5-9, 2010.
[32] Marco Sorrentino et al. Study aimed at assessing
the potential impact of vehicle electrification on
grid infrastructure and road-traffic green house
emissions. Applied Energy 120 (2014) 31–40
[33] Thomas H. Bradley, Casey W. Quinn. Analysis of
plug-in hybrid electric vehicle utility factors.
Journal of Power Sources 195 (2010) 5399–5408
EEVC European Electric Vehicle Congress 12
[34] C.Silva et al. Evaluation of energy consumption,
emissions and cost of plug-in hybrid vehicles.
Energy Conversion and Management 50 (2009).
[35] J.Han, D.et al. Impact of hilly road information
on fuel economy of FCHEV based on
parameterization of hilly roads. International
Journal of Automotive Technology, Vol.15, No.2,
pp.283-290 (2014).
[36] http://www.ehow.com/about_6744997_effect-
elevation-gas-mileage.html
[37] Thoma B. et al, .Low-Emission Range Extender
for Electric Vehicles. AC Propulsion Inc., South
Coast Air Quality Management District.
[38] City of Westminster .Understanding existing
electric vehicle recharging infrastructure,
vehicles available on the market and user
behavior and profiles, 2009.
[39] Samaras C, Meisterling K. Life cycle assessment
of green house gas emissions from plug-in hybrid
vehicles: implications for policy. Environmental
Science and Technology 2008; 42(9):3170–6.
[40] Zackrisson M et al. Life cycle assessment of
lithium-ion batteries for plug-in hybrid electric
vehicles critical issues. Journal of Cleaner
Production 2010; 18:1519–29.
[41] Wilson .Shades of Green: Electric Cars’ Carbon
Emissions around the Globe. Shrink That
Footprint, February 2013
[42] Gudina Terefe et al. Assessment of renewable
energy resources potential for large scale and
standalone applications in Ethiopia. Renewable
and Sustainable Energy Reviews 40(2014)422–
431.
[43] http://www.oecd.org/env/cc/TADELE_FDRE%2
0Ethiopia%20Scaling%20Up%20Renewable%20
Energy%20Program%202012.pdf
[44] https://www.gov.uk/government/uploads/system/
uploads/attachment_data/file/69554/pb13773-
ghg-conversion-factors-2012.pdf
[45] Ethiopian Electric Power Corporation (EEPCo),
Strategicplan2011–2025. Addis Ababa; 2011.
[46] Federal Democratic Republic of Ethiopia,
Ministry of Water and Energy. Scaling-Up
Renewable Energy Program. Ethiopia investment
plan. Nairobi, Kenya; February 2012
[47] Mulugeta Biadgo Asress et al. Wind energy
resource development in Ethiopia as an
alternative energy future beyond the dominant
hydropower. Renewable and Sustainable Energy
Reviews 23(2013)366–378
[48] https://www.gov.uk/government/uploads/system/
uploads/attachment_data/file/69554/pb13773-
ghg-conversion-factors-2012.pdf
[49] http://www.iea.org/publications/freepublications/
publication/CO2emissionfromfuelcombustionhig
hlightsMarch2013.pdf
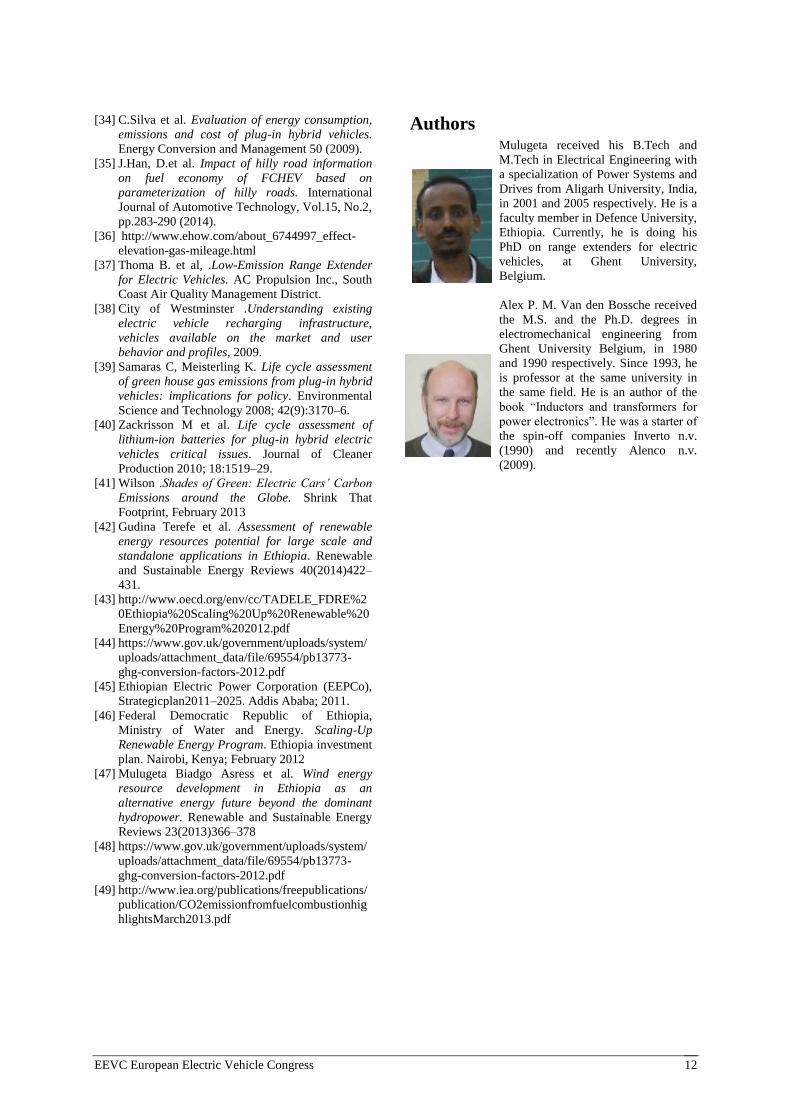
Authors
Mulugeta received his B.Tech and
M.Tech in Electrical Engineering with
a specialization of Power Systems and
Drives from Aligarh University, India,
in 2001 and 2005 respectively. He is a
faculty member in Defence University,
Ethiopia. Currently, he is doing his
PhD on range extenders for electric
vehicles, at Ghent University,
Belgium.
Alex P. M. Van den Bossche received
the M.S. and the Ph.D. degrees in
electromechanical engineering from
Ghent University Belgium, in 1980
and 1990 respectively. Since 1993, he
is professor at the same university in
the same field. He is an author of the
book “Inductors and transformers for
power electronics”. He was a starter of
the spin-off companies Inverto n.v.
(1990) and recently Alenco n.v.
(2009).