electrical and magnetic readings of mental functions
TRANSCRIPT

In: Cognitive Neuroscience, M. D. Rugg (ed.), 1997.Hove East Sussex, UK: Psychology Press.
CHAPTER 7
Electrical and magnetic readingsof mental functions
Marta Kutas & Anders Dale
Ever since Berger's (1929) discovery that brain electrical activity(electroencephalogram (EEG)) can be measured at the human scalp, ithas been assumed that in these voltage fluctuations are hidden themysteries of the workings of the human mind. While classicalneurophysiologists questioned the likelihood that such "simple"fluctuations could be the key to the complexities of understanding, talk-ing, reasoning, imagining and supposing, the past 70 years have provenotherwise. A large body of evidence has shown that electrical andmagnetic activity (human or otherwise) encode information about brainstates and brain processes and, by inference, about mental states andmental processes. The exact mapping from neural structures tosensory, perceptual and cognitive processes and states is not at alltransparent, but all neuroimaging techniques are based on theassumption that such mappings exist and are decipherable.
In this chapter we examine the nature of the mapping betweenperception, movement and cognition on the one hand and electrical andmagnetic activity at various scalp locations on the other. In this regard,it is important to remember that the brain's currency at a neuro-physiological level is electrochemical activity. It is the pattern of electri-cal activity at the scalp that doctors and scientists alike take to be asign of how and how well the brain is functioning. As we will document,electrical and magnetic activity can be used within the context ofpsychological experiments to assess the brain's sensitivity to various
197

198 KUTAS & DALE
experimental manipulations, and thereby to constrain psychologicaltheories of various cognitive and behavioural phenomena. The chapterstarts with a few references to some basics of electrical (event-relatedpotentials (ERPs)) and magnetic (event-related fields (ERF)) recording.This is followed by a short tutorial on the physiology and physics of elec-trical and magnetic activity, a discussion of the types of inference thatcan and cannot be drawn from such measurements, and a cursoryoverview of the most widely used terms in cognitive electrophysiology.We conclude with a few specific examples of cognitive ERP and ERFresearch.
7.1 EVENT-RELATED ACTIVITY:ELECTRICAL (ERPS) AND MAGNETIC (ERFS)
An ERP/ERF experiment requires a willing participant, electrodes forrecording the brain wave activity or a magnetometer, some means ofpresenting stimuli, amplifiers and a digitizer that turns the analoguedata into a digital form for storage, further representation and analy-ses. Technical details about electrodes, electrode placement, amplifiers,magnetic recordings, digitization and analyses can be found in anumber of articles and books (Cooper et al. 1974, Regan 1989,Hamalainen et al. 1993, Rugg & Coles 1995).
There are many ways to look at electrical and magnetic activityin both the temporal and spatial domains. The emphasis of thischapter is on scalp activity, specifically that which is time-locked orsynchronized to some external stimulus or event. Typically, the earli-est or so-called "exogenous" components of the ERP are used in aclinical setting to assess the integrity of the peripheral or centralnervous system, although they are clearly essential for understandingcognitive effects as well (for more in-depth discussion see Desmedt1988, Starr & Don 1988, Regan 1989). Since the evoked response to asingle stimulus at the scalp is quite small (5-10uV), it must beextracted from the background activity via averaging. Averagingenhances the signal (or whatever is invariant from trial to trial) andreduces what is random (noise) to nearly zero, improving the signal-to-noise ratio by a factor proportional to the square root of the numberof trials. Since the assumptions of averaging are often violated, single-trial ERP data have also been examined using pattern recognitiontechniques, cross-correlation, Woody filter and step-wise discriminantanalysis (e.g. Glaser & Ruchkin 1976, Gevins & Remond 1987),although averaging remains the most common technique.


7. READINGS OF MENTAL FUNCTIONS 201
is a dipole term, asin Equation 6, and O(r-3) represents so-called quadropolar, octopolarand higher order terms which fall off as r-3, or faster, with distance.Hence, we see that the electric potential produced by a collection of cur-rent sources and sinks within a region can be approximated closely byconsidering only the monopolar and dipolar terms, as long as the size ofthe region is small relative to the distance at which the measurementsare made.
Now, recall that the current sources and sinks in the brain corre-spond to currents flowing through neural membranes. Since the totalamount of current leaving a cell must equal the total amount of currententering the cell, the monopolar term in the multipole expansion of thesource-sink distribution of a cell must equal zero. Thus, under thesecircumstances, where activity of neurons in a patch of tissue is ob-served at a distance much greater than the linear extent of the patch,only the dipolar term of the multipole expansion need be considered. Inshort, the distribution of sources and sinks within such a patch can berepresented by a single so-called "equivalent dipole" located in the mid-dle of the patch.
If the sources and sinks are distributed in an approximately radiallysymmetric fashion within the patch of tissue, the dipole term vanishes.This is known as a "closed field" source configuration. For example, ifwe assume that all the dendrites of the neurons illustrated in the toprow of Figure 7.1 are activated to a similar extent, on average, then thecurrent sources and sinks in a given cell will be distributed in anapproximately radially symmetric fashion, and the resulting dipolemoment vanishes. In other words, no potential would be recorded at adistance. Figure 7.1 also shows two other examples of closed fields,where the net dipole moment of the collection of cells is zero, eitherbecause the cells are oriented in a random fashion (middle row), orbecause the activity of the cells is not synchronized (bottom row).
In summary, we see that a patch of brain tissue produces an exter-nally observable electric potential or magnetic field if, and only if, (a) theaverage distribution of sources and sinks within the neuron in the patchis distributed in a non-radially symmetric fashion, (b) the neurons arealigned in some systematic fashion, and (c) the neurons are activated ina synchronized fashion, as illustrated in Figure 7.2. The neocortex is oneof the main structures of the brain which satisfies all these constraints.It is organized as a large folded sheet a few millimetres thick. About 70%of the cells in the neocortex are pyramidal cells which have apical
(7)
where is a monopolar term, as in Equation 4,

202 KUTAS & DALE
FIG. 7.1.
Examples of self-cancelling or closed field source configurations. Neurons which areradially symmetric, randomly oriented or asynchronously activated do not produce externally observ-able electric or magnetic fields.
dendrites extending from the soma towards the surface of the sheet,which gives the cortex a columnar appearance. When the proximal partsof the apical dendrites of a cell are activated, currents flow into the cellaround the soma, and currents flow out of the cell at more distal sites,thus creating an approximately dipolar source-sink configurationoriented perpendicularly to the cortical sheet (Nunez 1981). Similarly, if

7. READINGS OF MENTAL FUNCTIONS 203
FIG. 7.2.
Open field source configuration. Neurons which are non-radially symmetric, spatiallyaligned and synchronously activated add up to produce externally observable electric and/ormagnetic fields.
the distal parts of the dendrites are activated, a dipole field of the oppo-site orientation is generated. Of course, the potential and magnetic fieldproduced by a single cortical pyramidal neuron are quite weak, butthose produced by a patch of cortex containing hundreds of thousands ofsuch cells may be strong enough to be detected even at a considerabledistance from the patch. These are believed to be the primary source ofscalp-recorded ERPs and associated ERFs.
Since non-invasive measurements of electric potential and magneticfield are made at a distance of at least 1 cm from the nearest cortex andthe thickness of the cortex is, at most, a few millimetres, we canapproximate the source-sink distribution within a patch of cortex by asingle equivalent dipole located in the middle of the patch and orientedperpendicularly to it. For that given dipole the electric potential
(8)
where s(t) is the strength of the dipole, and ei is a scalar constant whichdepends on the location and orientation of the dipole as well as on theconductive properties of the head. Similarly, the magnetic field
(9)
where
measured at the ith sensor location can be expressed as
is a three-vector constant which depends on the location and
measured at the ith electrode at time t can be expressed as

7. READINGS OF MENTAL FUNCTIONS 205
Although, as we have seen, electric and magnetic signals are gener-ated by the brain in a very similar way, the two types of measure doprovide somewhat different views of the underlying brain activity. Thisis because the electric and magnetic recordings are affected differentlyby factors such as head shape, and dipole location and orientation.3 Forinstance, the magnetic field strength falls off much more rapidly withthe depth of a dipole than does the electric potential. Furthermore,while the electric potential is affected by dipoles of any orientation, themagnetic field is mainly sensitive to the tangential component of thedipole moment, i.e. the portion of the dipole oriented tangentially to thescalp. a purely radially oriented dipole, regardless of depth, producesalmost no magnetic field outside the head.
In practical terms, this means that MEG is mostly sensitive to super-ficial, largely tangentially oriented dipoles. Given that the primarysource of the MEG and EEG are the cortical pyramidal cells, oriented per-pendicularly to the cortical sheet, it follows that the MEG is mostly sen-sitive to activity in the superficial parts of the sulci, and much less sen-sitive to activity on the crowns of gyri or in the depths of sulci. While theMEG provides only a limited view of brain activity compared with theEEG, it has the advantage of being largely unaffected by skull and con-ductive inhomogeneities in the intervening tissue. This makes the mag-netic field easier to model quantitatively than the electric potential, forwhich the exact shape and conductive properties of the head have to betaken into account.
In summary, the MEG mostly provides information about the syn-chronous activation of parallel-oriented populations of pyramidal cellslocated superficially within cortical sulci. The EEG provides a broaderpicture of underlying neuronal activity, which includes both superficialand deep sources at various orientations relative to the scalp. However,since the EEG and MEG provide somewhat complementary informationabout the same underlying brain activity, the broadest picture of thisactivity can be obtained by combining the two kinds of measure (Woodet al. 1985, Dale & Sereno 1993).
7.1.2 What can be inferred from ERPs?In this section we discuss how ERPs can be used to make inferencesabout cognitive processes and their associated neural activity. The clas-sical approach has been to identify certain so-called "components" of theERP, usually positive or negative peaks with characteristic scalp distri-butions and latencies, which can be shown to be reliably correlated withparticular experimental manipulations. It is often assumed that, sincesuch a peak is correlated with a particular cognitive process, it can infact be used as a physiological index of that process. Based on this

206 KUTAS & DALE
reasoning, it follows that the timing of the process can be inferred fromthe latency of the corresponding peak, and the degree of activation or"strength" of the process can be inferred from the amplitude of or areaunder the peak. Moreover, according to this view, the question ofwhether two experimental conditions involve the same cognitive proc-ess reduces to the question of whether both conditions evoke the samecomponent. It may be worthwhile to examine more closely the assump-tions implicit in this reasoning.
Before doing so, however, it is important to note that there is no sin-gle, universally accepted definition of an ERP component. In some cases,"component" merely refers to a peak or a trough in the waveform.According to one of its more common usages, which we will call "func-tional", "component" refers to a delineated waveform feature whoseapproximate polarity, latency and scalp distribution are predictablefrom experimental (psychological) manipulations (Donchin 1979); inthis view, the fact that an ERP is generated by the brain is taken to beirrelevant. At the other extreme, in a more "physiological" view, an ERPcomponent is presumed to be the reflection of the activity of a particulargenerator or set of generators in the brain (Nunez 1981). Although fewresearchers start by explicitly defining their usage of the word "compo-nent", the majority seem to have adopted aposition which is intermedi-ate between or a combination of the "functional" and "physiological"usages. Let us examine the assumptions of this generic combined usageof the term.
From the discussions in the previous section, recall that neural ac-tivity in a particular location in the brain produces a characteristic spa-tial pattern of electric and magnetic measurements (cf. the gain vectorin Eq. (13)). The definition of a "component" in terms of a characteristicscalp distribution thus implies that the neural activity associated witha particular component has a characteristic spatial distribution withinthe brain. The strength of such a component is often defined in terms ofthe peak measurement at a particular electrode within a particularlatency range. This component strength is then used to infer somethingabout the brain's sensitivity to some experimental variable. However,the idea that a peak measured at a given electrode reflects only theactivity of a particular process implicitly assumes that the potentialrecorded at that electrode is affected by that process, and by that proc-ess alone. This assumption is potentially troubling, since we know thateven highly localized foci of activity within the brain may produce wide-spread potential distributions on the scalp, and it is highly unlikelythat there would only be a single process active at any given moment.
We will show the consequences of this assumption via a number ofsimple simulations. Let's imagine, for instance, that three processes (L,
7. READINGS OF MENTAL FUNCTIONS 207
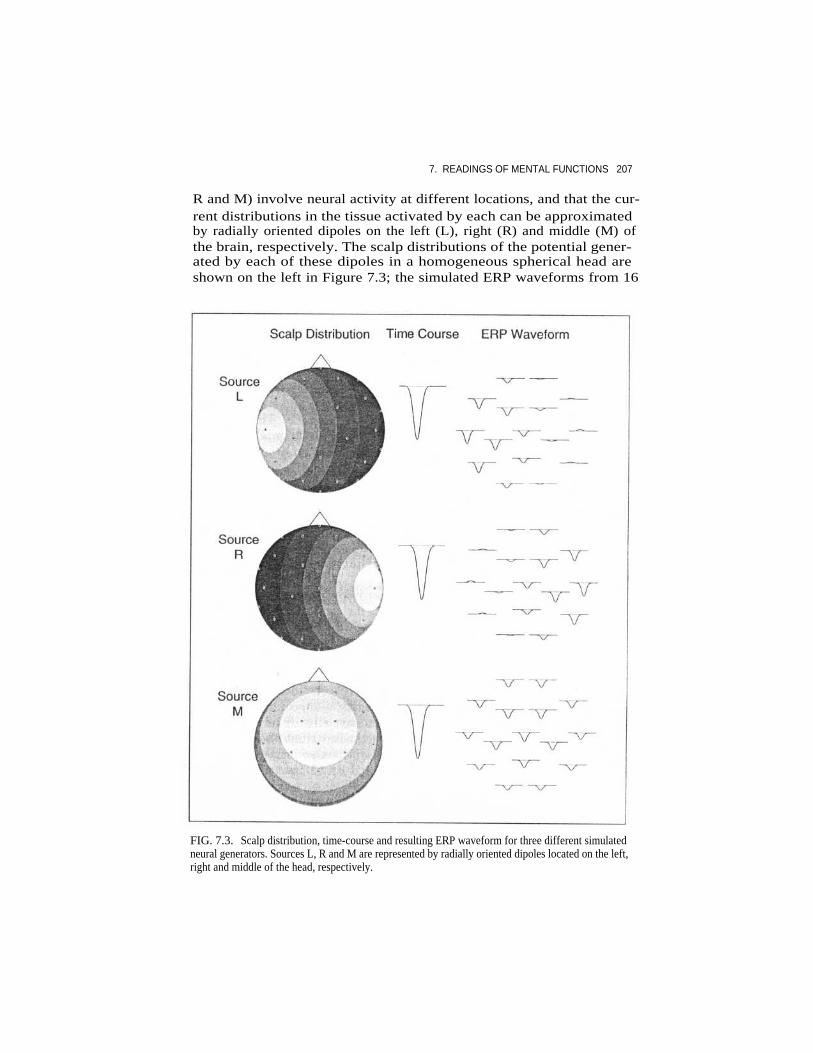
R and M) involve neural activity at different locations, and that the cur-rent distributions in the tissue activated by each can be approximatedby radially oriented dipoles on the left (L), right (R) and middle (M) ofthe brain, respectively. The scalp distributions of the potential gener-ated by each of these dipoles in a homogeneous spherical head areshown on the left in Figure 7.3; the simulated ERP waveforms from 16
FIG. 7.3.
Scalp distribution, time-course and resulting ERP waveform for three different simulatedneural generators. Sources L, R and M are represented by radially oriented dipoles located on the left,right and middle of the head, respectively.

208 KUTAS & DALE
different locations on the scalp generated by each of these dipoles areshown on the right. Clearly, the scalp distributions of the potentialsgenerated by these three dipoles overlap greatly. In fact, dipole M wouldaffect peak amplitude at all the electrodes. Thus, there is no simplemeasure at any electrode that can be used as a pure index for the activ-ity of any of the three processes.
It may be argued that different components can be distinguishedbased on their scalp distributions, since the potentials generated byeach of the dipoles L, R and M are quite distinguishable. However, con-sider the example shown in Figure 7.4 wherein the processes L and Rare both activated but with slightly different latencies. The scalp distri-butions produced by the. combination of these two dipoles, as shown onthe bottom at three different latencies, is quite different from either onealone. In fact, the combined scalp distribution of L and R looks some-what similar to that produced by dipole M (see Fig. 7.3). This examplealso illustrates another common misconception in ERP analysis basedon peak amplitude or area measurements. It is often assumed that apeak reflects the same process at all electrodes, such that differences inpeak latency at various locations can be taken to reflect propagation ofthe process from one side of the head to the other. However, the currentexample shows that continuous changes in peak latency across thescalp may instead be due to multiple fixed dipoles with different butoverlapping time-courses. In fact, as we shall see later, changes in scalpdistribution over time necessarily imply that several generators withdifferent time-courses must be involved.
The fact that different brain generators produce widespread,overlapping potential distributions makes it essential to have a methodfor extracting the signal produced by each generator. As we see inthe next section, if the scalp distribution of each generator is known,then the contribution of each generator is given by a weighted sum ofthe potentials recorded at each electrode, with the weights given bythe least-squares solution. This makes it possible to determinethe time-course of activation of each generator, and in turn todetermine whether or not the same generator is involved in differentexperimental conditions. By this account, the contribution to the ERP ofa particular source can be thought of as a component, and we caninvestigate how this component is affected by various experimentalmanipulations.
Unfortunately, however, we usually do not know the scalp distribu-tions of all the generators involved in a given experiment. The problemof finding these scalp distributions is essentially equivalent tolocalizing all the generators, which, as we see in the next section, is adecidedly non-trivial problem. Nonetheless, as we show next, it is still

7. READINGS OF MENTAL FUNCTIONS 209
FIG. 7.4.
Spatial superpositioning of ERP waveforms produced by the two generators L and R. Thedifference in latency between sources L and R results in a gradual change in scalp distribution overtime.
possible to draw certain important inferences about the underlyingbrain activity from ERP recordings without localizing the sources.
First, let us compare the ERPs from two experimental conditions (Aand B). If A-ERP and B-ERP are (statistically) indistinguishable (acrossall electrode sites), then we can safely conclude that the pattern of dataappears consistent with the hypothesis that the two conditions areidentical. But can we safely offer this as evidence or proof that the brainactivity evoked by the two conditions is identical? No! There are severalreasons, other than the actual identity of the underlying neuralactivity, as to why the ERPs from two conditions could appear to beidentical. For example, the EEG and MEG simply may not be the correcttechniques for detecting the difference because the configuration of

210 KUTAS & DALE
active generators generate no dipole moment (so-called closed fields).Another possible way we could easily be led astray would be if the meas-urements were not sensitive enough due to inappropriate temporaland/or spatial sampling, a poor recording technique or a similar factor.
Conversely, if the A-ERP and B-ERP do differ reliably, then it is safe toconclude (or as safe as science ever allows us to be) that the brain activ-ity and the mental activities it subserves are different in the two condi-tions. For the moment we need not concern ourselves with either thenature or the cause of the difference. The fact is that the ERP differenceindicates that some difference exists and, sometimes, being able to con-clude that two conditions are different is a critical finding in and ofitself. Any such ERP difference, obtained when by all psychologicalaccounts the conditions were expected to be identical, should lead to areformulation of the current working hypothesis that supports or atleast allows the difference.
Of course, identifying a difference is merely the first step in a muchlonger process of ERP analysis. At a minimum, we can use the timing ofthe onset of an ERP difference to make additional inferences about thetiming of the associated mental activity. If time t is the earliest time atwhich ERPs from the two conditions differ significantly, then we can con-clude that the brain activity differs between the two conditions at timet. However, we may not conclude that there was no difference in brainactivity before time t, because such differences simply may not bedetectable with ERPs, as discussed above. In other words, the onset ofthe latency of the ERP difference must be taken as an upper limit on thetime by which the brain must have processed the stimuli sufficiently todistinguish them.
It is also possible to make some inferences based on the spatial dis-tribution of the ERPs. If a given condition involves only a single genera-tor, then the ERP waveform for that condition must have the same scalpdistribution across its entire extent. That is,
is the gain vector for thegenerator. Practically speaking, this means that if the scalp distribu-tion changes over time we can conclude that there must be more than asingle generator involved. In fact, we can go further than that by apply-ing principal component analysis (PCA) to determine the minimumnumber of spatial basis vectors needed to account for the waveforms(Donchin 1979, Press et al. 1990). If a given set of ERP waveformsrequires k basis vectors, i.e. PCA finds k significant "components",4
for all time points t, where is the electric or magnetic recording vec-tor, s( t) is the strength of the generator and
7. READINGS OF MENTAL FUNCTIONS 211
FIG. 7.5.
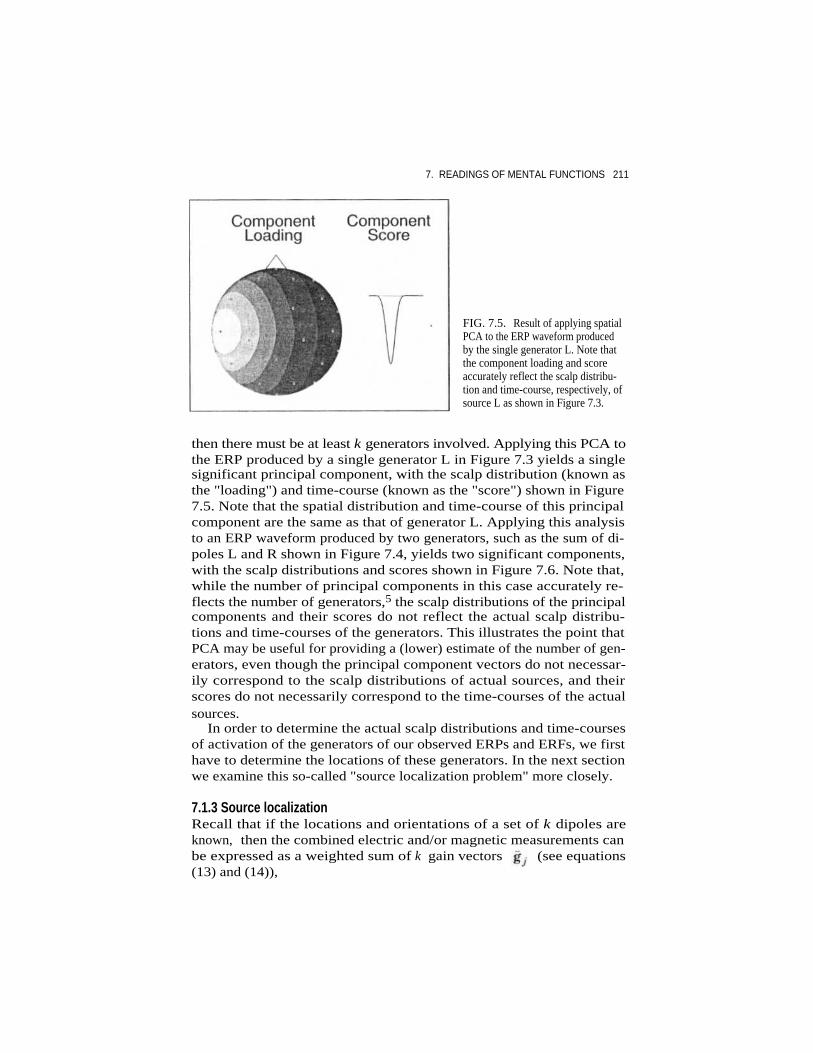
Result of applying spatialPCA to the ERP waveform producedby the single generator L. Note thatthe component loading and scoreaccurately reflect the scalp distribu-tion and time-course, respectively, ofsource L as shown in Figure 7.3.
then there must be at least k generators involved. Applying this PCA tothe ERP produced by a single generator L in Figure 7.3 yields a singlesignificant principal component, with the scalp distribution (known asthe "loading") and time-course (known as the "score") shown in Figure7.5. Note that the spatial distribution and time-course of this principalcomponent are the same as that of generator L. Applying this analysisto an ERP waveform produced by two generators, such as the sum of di-poles L and R shown in Figure 7.4, yields two significant components,with the scalp distributions and scores shown in Figure 7.6. Note that,while the number of principal components in this case accurately re-flects the number of generators,5 the scalp distributions of the principalcomponents and their scores do not reflect the actual scalp distribu-tions and time-courses of the generators. This illustrates the point thatPCA may be useful for providing a (lower) estimate of the number of gen-erators, even though the principal component vectors do not necessar-ily correspond to the scalp distributions of actual sources, and theirscores do not necessarily correspond to the time-courses of the actualsources.
In order to determine the actual scalp distributions and time-coursesof activation of the generators of our observed ERPs and ERFs, we firsthave to determine the locations of these generators. In the next sectionwe examine this so-called "source localization problem" more closely.
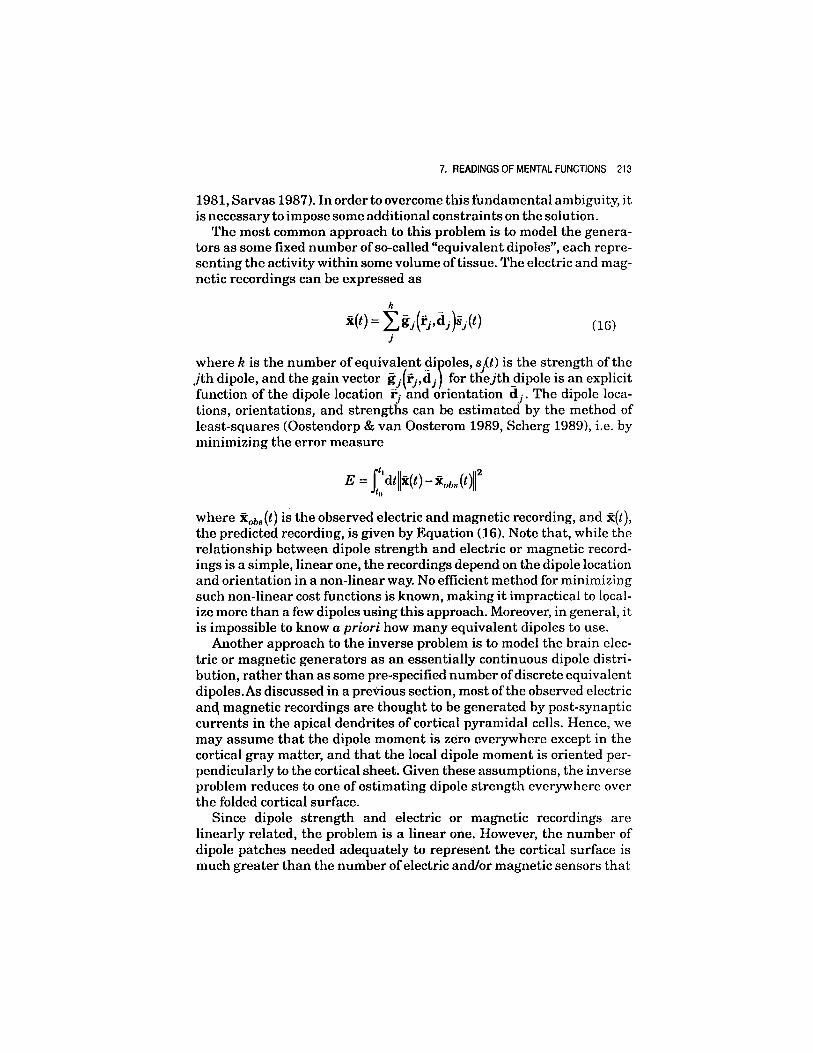
7.1.3 Source localizationRecall that if the locations and orientations of a set of k dipoles areknown, then the combined electric and/or magnetic measurements canbe expressed as a weighted sum of k gain vectors (see equations(13) and (14)),

212 KUTAS & DALE
FIG. 7.6.
Result ofapplying spatial PCA to the
ERP waveform producedby the two generators L
and R. Note that, while thenumber of principalcomponents (two)
accurately reflects thenumber of sources, the
component loadings andscores do not reflect the
scalp distribution or time-course of either generator.
depend on the locations and orientations ofthe dipoles, the locations of the sensors, and the shape and conductiveproperties of the head (Grynszpan & Geselowitz 1973, Cuffin & Cohen1977, Nunez 1981, Oostendorp & van Oosterom 1989, Hamalainen1993). Thus, the so-called "forward problem" of determining the electricpotential and magnetic field produced by a given set of dipoles has a well-defined and unique solution. On the other hand, the so-called "inverseproblem" of determining the locations, orientations and time-courses ofthe set of dipoles producing the electric and magnetic recordings is illposed, i.e. it has no unique solution. In other words, there are, in general,infinitely many distributions of dipoles inside the brain which areconsistent with any set of electric and/or magnetic recordings (Nunez
(15)
where the gain vectors

214 KUTAS & DALE
can practically be applied, and hence the problem remains underdeter-mined. A common way to deal with this problem is to choose the so-called "minimum-norm solution", that is, the "shortest" dipole strengthvector
(Hamalainen & Ilmoniemi 1984, Smith et al. 1990, Wang et al. 1992,Dale & Sereno 1993). The minimum-norm solution
(18)
is the Moore-Penrose pseudo-inverse of the gain matrix G. Althoughthe minimum-norm constraint does provide a unique solution to theinverse problem, there is no guarantee that the solution is the correctone. In order further to disambiguate the inverse problem in a princi-pled way, it is essential to impose additional constraints that are basedon biological insights (Dale & Sereno 1993).
A particularly promising source of such additional constraints isfunctional imaging techniques, such as functional magnetic resonanceimaging (fMRI) and, to a lesser extent, positron emission tomography(PET) (see Ch. 6). Although these techniques provide little informationabout the fine-grained temporal sequence of brain activity, they do pro-vide information about average brain activity with relatively high anduniform spatial resolution (Belliveau et al. 1991, Ogawa et al. 1992). Itseems reasonable to assume that the bioelectrical activity which is re-sponsible for the observed electric and magnetic recordings is alsolikely to cause changes in metabolic and haemodynamic processes,which can be seen using fMRI or PET. The so-called linear estimationapproach (Smith et al. 1990), of which minimum-norm estimation is aspecial case, makes it possible to use such functional imaging data as"soft" constraints on the inverse solution (Dale & Sereno 1993), thuspotentially combining the spatial resolution of fMRI and the temporalresolution of EEG and MEG.
7.2 THE TERMS USED IN COGNITIVE ELECTROPHYSIOLOGY
By contrast to every other brain imaging technique, cognitive ERPresearch has a respectable history - 30 years of research unearthingthe sensitivity of scalp activity to sensory, perceptual, motor and
where
satisfying
is given by

7. READINGS OF MENTAL FUNCTIONS 215
cognitive processes. It is important to note that much of this work wascarried out during a period when there were no electrode caps (i.e. eachelectrode was placed by hand) and amplifiers and computing powerwere prohibitively expensive. Moreover, by today's standards, thecomputers were excruciatingly slow and, perhaps for related reasons,few sophisticated analytical or graphical techniques existed. As a con-sequence, an undue emphasis was placed on looking at the ERP wave-form, specifically at the largest effects on peaks and troughs that couldreadily be discerned with the eye. In the previous section we detailedwhy this approach may be problematic. However, whatever might havebeen missed, the effects that have been reported tended to be the larg-est, the most reliable and undeniably real; thus, each must be explainedby any viable theory of the function under study. Moreover, despite thetechnical differences between the various brain imaging techniques, itis our belief that much time can be saved by using this history to guidecontemporary research in brain imaging for cognitive purposes. Nosingle chapter could do justice to all the published observations on ERPsand their implications. Thus, this section is intended not to encouragecontinued peak labelling, but rather to provide the reader with an ideaof the vast data base on cognitive ERP effects via quick reference to mostof the terms in the various cognitive domains that can serve askeywords in library searches.
7.2.1 Event-preceding negativities including the CNV,O-wave, E-wave, PINV and SPNThe behaviourist tradition led to the discovery of the first of many"endogenous" ERP components linked to some cognitive process. Whilethe primary aim of this research was to use exogenous evoked potential(EP) components to examine effects of conditioning on sensory process-ing, one of the more startling findings was a scalp negativity during theinterval between a warning stimulus and the warned event (Fig. 7.7).Grey Walter et al. (1964) called this shift the contingent negative varia-tion (CNV) orexpectancy wave to underscore that it was the contingencybetween the stimuli and not the processing of either per se that wascritical for its elicitation.
The early research revealed that the CNV varies systematically in itsdistribution across the scalp as a function of stimulus modality, taskparameters and response requirements. Nonetheless, the negativity isreferred to as the CNV, presumably to highlight the functional equiva-lence of the underlying processes, although there is no consensus as toexactly what these are. The proposals include cortical excitability,wherein the specific region of the cortex about to receive informationwas prepared to do so, arousal, attention, uncertainty, preparedness,

216 KUTAS & DALE
FIG. 7.7.
(a) The slow negative potential, called the contingent negative variation (CNV), whichbuilds during the interval between two stimuli. (b) The basic components of a movement-related po-tential elicited by a voluntary hand or arm movement. The waveform is labelled according to two of themore common nomenclatures. RP, readiness potential; MP, motor potential; PMP, pre-motionpositivity, RAF, reafference potential. Movement onset is at zero. Between the movement-relatedpotential and the time-line is the muscle activity (electromyogram) recorded from the responding arm.This figure was originally published as Figure 3 in Was and Hillyard (1985). Reprinted by permissionof Lippincott/Harper & Row.
receptiveness, resource mobilization, level of effortful involvement andmotivation (for a review see McCallum & Curry 1993).
In the 1970s, studies with long foreperiods led to the suggestion thatthe CNV did not index a single cognitive process but rather the sum of anorienting or O-wave that reflected processing of the warning stimulus

7. READINGS OF MENTAL FUNCTIONS 217
and an expectancy or E-wave that developed in anticipation of theimpending stimulus and/or response. To this day, it remains an openquestion whether there exists a subcomponent to the CNV that is notstrictly tied to either the stimuli or the upcoming response but onlyto the contingency between the two. A recent proposal equates the"true" CNV with the stimulus preceding negativity (SPN) (e.g. Damen &Brunia 1994).
Typically, the CNV resolves (i.e. returns to baseline) or falls into a latepositive component. However, under certain circumstances or in somepatient populations (e.g. schizophrenic, neurotic), it is maintained forsome time following the imperative stimulus, and is thus referred to asthe post-imperative negative variation (PINY).
More recent classifications of slow potentials (longer than 1 s in dura-tion) distinguish between those related to preparation, anticipationand expectation (largest at parietal sites) and those related to holdinginformation in working memory (largest at frontal sites). Such investi-gations are based on the working hypothesis that the topography of theslow waves reflects the relative activity of cortical areas involved insolving the problem at hand, while their durations and amplitudesindex the duration and degree of effort invested in particular process-ing steps, respectively (e.g. Roesler & Heil 1991).
7.2.2 Movement-related activity including the RP or BSP,LRP or CMA, MPN and ERNAt about the same time as the discovery of the CNV, a slow negative shiftwith a somatotopic distribution along the central sulcus was observedpreceding self-paced voluntary movements; this was called the Bereit-schaftspotential (BSP) or readiness potential (RP) (see Fig. 7.7b). Subse-quently, movement-related potentials (MPs) were analysed into a seriesof subcomponents preceding and following movement onset (e.g.Shibasaki et al. 1980).
The movement potential component of greatest cognitive interesthas been the RP, as it represents brain activity the generation of whichis endogenous rather than stimulus driven. The RP starts approxi-mately is prior to a voluntary movement at the scalp, subdurally(Neshige et al. 1988) and in magnetic recordings (e.g. Cheyne et al.1991, Kristeva et al. 1991). Given that the RP precedes movementonset, varies with responding member, specific features (force, speedand complexity) of the impending movement, and performance, it hasbeen taken as an index of motor preparation. Some researchers preferthat the RP be replaced by a more neutral term such as movement-preceding negativity MPN (Bocker et al. 1994) so as to mirror its counter-part, the stimulus-preceding negativity.

218 KUTAS & DALE
The RP prior to hand movements is larger over contralateral than ip-silateral central sites. This fact has been used to derive a measurecalled the lateralized readiness potential (LRP) or corrected motor asym-metry (CMA) from activity time-locked to the stimulus. Specifically, theLRP derivation is based on the notion that the late half of the CNV in awarned reaction-time task must include the RP. One common method(among several) of calculating the LRP involves: (1) recording from leftand right central sites for movements with each hand; (2) subtractingthe potential ipsilateral to the responding hand from the potential con-tralateral to it; and (3) averaging the values for the two hands. Theresulting average measure is the LRP. In this way asymmetrical activitythat is the same for both left- and right-hand movements is eliminatedwhile the activity associated with side of movement remains (reviewedin Coles et al. 1995).
Studies of the LRP led to the discovery of the the error-related nega-tivity (ERN) on those trials in a choice reaction-time task in which thewrong response was executed (e.g. Gehring et al. 1993, Falkenstein etal. 1995); presumably the ERN reflects a system involved in the detec-tion of and compensation for response errors.
7.2.3 Information processing effects including P300, P3a, P3b,novel P3, LPC, N200, SW, MMN, P165, Na and Dm.The other ERP component routinely used to analyse the structure of thehuman information processing system was discovered as the heyday ofthe behaviourist tradition was drawing to a close and the informationprocessing approach to cognition was taking hold. From the informa-tion processing point of view, cognition is an ordered sequence ofprocessing stages, each of which performs a specific mental operationand takes a measurable amount of time to complete. Psychologists havebeen challenged to discover the stages (representations and processes),their durations and their order of occurrence. The great hope of theinformation processing approach is that psychological functions can bemapped onto brain functions via the language of information, definedin terms of reduction in uncertainty.
In the late 1960s, a positive ERP component with a peak latencyaround 300ms (P300) was offered as a correlate of stimulus uncer-tainty because its amplitude varied inversely with stimulus un-certainty and its latency indicated when the uncertainty was reduced(for reviews see Pritchard 1981, Donchin & Coles 1988, Johnson 1988).The important finding was that exactly the same physical stimulussometimes did and sometimes did not elicit a P300 depending upon thetask demands and decisions rendered, i.e. upon its informationalvalue. For instance, a large P300 is elicited by the presence of a

7. READINGS OF MENTAL FUNCTIONS 219
stimulus that is unexpected as well as by the absence of one that isexpected.
The relationship between the P300 and expectancy has been studiedmost extensively in the oddball task. In this paradigm individuals areasked to detect improbable (5-25%) targets or "oddballs" that occurunpredictably in a random sequence of non-target, non-oddball,so-called "standard" or background stimuli. Although the oddball taskis considered the prototypical P3-eliciting paradigm, even in this taskthe ERPS to targets often contain both an early, frontally distributedpositivity (P3a) and a later, larger and posteriorly distributed postivity(P3b) (e.g. Squires et al. 1975). These two subcomponents of the P3often overlap and are difficult to disentangle. Other components char-acteristic of ERPs to oddballs include a modality-dependent negativity(N200) preceding the P300 (e.g. Simson et al. 1977), and a subsequentslow wave (SW) that is positive posteriorly but negative frontally (e.g.Ruchkin et al. 1982) (Fig. 7.8).
As long as people pay some attention to the stimulus sequence, theamplitude of P3 to the oddballs is inversely related to its probability ofoccurrence, with contributions from its probability within a givenperiod of time (temporal probability), globally across an entire block
FIG. 7.8.
Schematic representation of the component structure for the ERP to a deviant stimulusunder detection conditions including the N2a (MMN), N2b, P3a, P3b and SW components. The solidli ne represents recordings from a midline frontal site and the dashed line the recording from a midlineparietal site. Reprinted from Naatanen et al. (1982) with kind permission of Elsevier Science NL, SaraBurgerhartstraat 25, 1055 KV Amsterdam, The Netherlands.

220 KUTAS & DALE
of trials (global probability), and more locally in terms of both theimmediate stimuli (local probability) and the fine structure of thestimulus sequence (sequential probability). It is important to note, how-ever, that it is subjective not objective probability that is the morecritical determinant of P3 amplitude (reviewed in Picton & Hillyard1988). For example, in an oddball task when more than two differentstimuli are used, P300 amplitude is determined by the probability ofthe relevant stimulus category rather than the probability of eachindividual stimulus. In short, the P300 seems to index the operationof adaptive brain systems that anticipate the occurrence of signifi-cant environmental events and react to unexpected discrepanciestherein. Specific proposals have suggested that the P300 reflectsupdating of working memory (Donchin & Coles 1988), cognitive closure(Verleger 1988) and transfer of information to consciousness (Picton1992).
Remarkably similar P300s are recorded in the visual, auditory andtactile modalities in a variety of paradigms. Again, it is the presumedfunctional significance of the positivity and the experimental condi-tions that lead to its elicitation, rather than the identity of its underly-ing neural generators that serve as the criteria for defining a P300. Asyet there is no general consensus on the generator(s) of the P300, al-though a number of sites, including the hippocampus, parietal regions,locus coeruleus and temporoparietal junction, have been proposed, ex-amined and implicated (see e.g. Swick et al. 1994).
The peak latency of the P300 to task-relevant stimuli varies fromaround 300 to 1000ms as a function of the difficulty of the categor-ization. By contrast to RT (reaction time) measures, the peak latencyof the P3b is disproportionately sensitive to stimulus evaluation(encoding, recognition, classification) relative to response selectionand execution processes (e.g. Magliero et al. 1984). Accordingly, P3blatency has been taken as an upper limit on the time it takes to reachthe perceptual decision that an informative event has occurred. Thelatency of the preceding N200 likewise varies positively with the diffi-culty of the discrimination for stimulus categorization (Ritter et al.1979).
Identifying a positivity as the P3 is problematic. Most researchershave skirted the problem by referring to any positivity after 300ms as alate positive component (LPC) or simply a member of the P3 family.Others have placed greater emphasis on a topographical criterion,although often implicitly in combination with sensitivity to experimen-tal manipulations: thus, the "true" P3b or parietal P3 is sensitive toprobability and task relevance, while the P3a or frontal P3 is smaller,earlier, and presumably does not require attention. It is unclear by
7. READINGS OF MENTAL FUNCTIONS 221
these criteria whether the P3a differs from the novel P3 which also isearly, has a frontal maximum and is elicited by infrequently occurring"novel" events such as dog barks interspersed in a sequence of tones inan oddball task (Courchesne et al. 1975). Similarly controversial iswhether the so-called difference related to memory (Dm) is merely amodulation in P3 amplitude or an endogenous event that just happensto overlap with the P3, although one can use the measure regardless ofthe answer. The Dm refers to the greater late positivity during encoding(study) of items that will later be remembered, relative to those thatwill not; it is hypothesized to reflect some aspect of elaborative process-ing (Paller et al. 1987). The Dm and P3b have different scalp distribu-tions, as do Pas in different situations (Johnson 1993).
The N200 component, often preceding the P3b, since its discovery,has experienced a similar fractionation (Ma, N2b, N2c) based on itsdifferent distributions and functional roles (sensory processing, orient-ing). By some accounts, the N2a in an oddball task is also known as themismatch negativity (MMN), since its amplitude is a function of thedegree of mismatch between different standard stimuli (Naatanen1992), even if the stimuli are being ignored (see Fig. 7.8). Other compo-nents such as the P165 and Na also have been identified following vari-ous subtractions of ERPs to targets and non-targets in variants of theoddball task with and without attention (Goodin et al. 1978, Ritter etal. 1982).
7.2.4 Attention-related effects including N1, Nd,processing negativity, P1 and selection negativityA major issue that arose from the view of the mind as a limited-capacityinformation processor was the exact location of the "attentional" bottle-neck. Electrophysiological studies designed to address this issue haveimplicated both early (N1 and P2) and later components of the ERP. Ini-tially, the larger negativity observed in response to exactly the samestimuli when they were attended than inattended was called the N1attention effect and presumed to be a physiological index of an earlyselection process. Experiments in the late 1970s, however, showed thatneither the onset nor the duration of this enhanced negativity alwaysmirrored that of the exogenous N1 component; the effect was early foreasy selections but later for more difficult ones. As this effect of audi-tory attention was best visualized by subtracting the ERPs to stimuliwhen unattended from those to the same stimuli when attended, it wascalled the Nd or negative difference; the same effect is sometimes alsoreferred to as the processing negativity (for a review see Naatanen1992). Nd amplitude is presumably some function of the amount ofprocessing resources allocated for focused or divided attention,

222 KUTAS & DALE
although the nature of the processing resources remains unknown. It isnow argued that the Nd comprises an early frontocentral phase and alater more frontal phase (Naatanen 1992).
ERP studies of selective attention have also been conducted in vision.Relative to unattended stimuli, those in the focus of attention produceenhanced sensory-evoked P1 (80-100ms) and N1 (140-190ms) compo-nents in tasks involving sustained attention, spatial cueing and visualsearch. The P1 effect has a focus over the ventrolateral extrastriate cor-tex, while the N 1 effect has a somewhat more dorsal focus over occipito-parietal cortex. Selection among stimuli based on features such ascolour, spatial frequency, contour, size and shape is accompanied by alarger, longer latency negativity between 150-350ms over posteriorsites and is called the selection negativity (SN) (for a review see Hillyard1993).
7.2.5 Language-related effects including N400,N280 or LPN, P600 or SPS, and LANWhen people read sentences such as "He shaved off his moustache andcity" versus "He shaved off his moustache and beard", the most strikingfeature of the ERP to the anomalous (as opposed to the expected congru-ent) word is a negativity starting around 200ms and peaking around400ms (N400); (Fig. 7.9). An N400 is reliably elicited by semanticanomalies in written text and speech at different points in a sentence aswell as in a variety of languages, including the handshapes of AmericanSign Language (for a review see Kutas & Van Petten 1994). Despite thisfamily resemblance, N400s do differ in latency and scalp distribution,even within presumably similar experimental tasks. The problem ofuniquely identifying a negativity as an N400 is further exacerbated bycomparisons across paradigms employing single words in unstructuredlists, word pairs related along various dimensions, and sentences intasks requiring different decisions (such as lexical decisions, grammati-cal judgement).
All word-like stimuli elicit some N400 activity, its amplitude beingsensitive to a variety of factors including frequency of usage, repetitionand predictability. ERPs to words also contain a negativity at around280ms (N280) which, unlike the right posterior predominance of theN400, has a maximum over left frontal sites (Neville et al. 1992). Thefunctional significance of this negativity (also known as the lexicalprocessing negativity (LPN)), is unknown, although its latency doesvary systematically with the frequency of the eliciting word (King &Kutas 1995a) (see Fig. 7.9).
At least three different classes of ERP events have been describedin association with more syntactic aspects of sentence processing: (a)

7. READINGS OF MENTAL FUNCTIONS 223
FIG. 7.9.
Various ERP effects elicited during language processing. (Top left) Over sentence averageERP data showing an N400 elicited by semantic violations and a P600 elicited by grammatical viola-tions occurring in written text read one word at a time for comprehension. (Top right) The lexicalprocessing negativity (LPN) to various word classes, showing how LPN (previously known as N280)varies in latency with frequency and length. From King & Was (1995a). (Bottom left) Over sentenceaverages for written and spoken sentences with embedded relative clauses for good and poorcomprehenders. Auditory and visual data are from two different subject groups. Data from Mueller etal. (1977). (Bottom right) Left anterior negativity (LAN) for main clause verbs in three different sentencetypes, two with embedded relative clauses (subject and object relatives, SS and SO, respectively)and one with no clauses (filler). Data from King and Kutas (1995b).
the P600 or syntactic positive shift (sps), which may be a member ofthe P3 family, but is elicited by some types of grammatical error (seeFig. 7.9); (b) a frontocentral negativity with a left hemisphere ten-dency, which is also seen in word pair studies; and (c) a left anteriornegativity (LAN) from 300 to 700ms or so, elicited by words that signalthe need for reference back to an item earlier in the sentence (see Fig.7.9), which at a non-linguistic level may be related to working-memory usage (for a general review and further references see Kutas& Kluender 1994, Kutas & Van Petten 1994, Osterhout & Holcomb1995).

224 KUTAS & DALE
7.3 EXAMPLES OF ERP STUDIES IN COGNITIVE NEUROSCIENCE
7.3.1 Mental chronometryPeople generally take (a) longer to reject "brane" than "hime" as wordsin the English language, (b) longer to pronounce "dough" than "cough",(c) longer to name the colour of the ink in which a word is printed if theword refers to a different colour than if it refers to the same colour, (d)longer to respond to a particular letter (H) when it is surrounded by adifferent letter (SSHSS) than when it is surrounded by the same letter(HHHHH), and (e) longer to respond to a stimulus to the right of fixa-tion with the left hand and a stimulus to the left of fixation with theright hand than vice versa. Understanding these patterns of behaviourcontinues to be a significant component of experimental psychology andcognitive neuroscience.
According to the information processing framework, the answer toeach of these questions is a matter of pinpointing the stage(s) at whichthere is interference that contributes to the slowed RT. Both RT and ERPmeasures are useful in this regard; in particular, ERPs provide depend-ent variables that are sensitive to the activity of relatively circum-scribed parts of the processing system. For example, variables such asstimulus-response compatibility that alter the timing of response proc-esses typically have very little, if any, effect on P3 latency, whereasmanipulations that increase the difficulty of perceptual discrimi-nations and categorizations do.
This said, how can such observations be used to determine why RTsin some of the conditions outlined above are slowed relative to others?In brief, several laboratories have done so by comparing the effects ofmanipulations like these on RT, P3b latency, electromyographic (EMG)or muscle activity, and LRP measures (for a review see Coles et al. 1988).Whenever P3 latency (defined by functional and distributional criteria)is unchanged while RT is prolonged, then the prolongation is attributedto some aspect of response selection or execution rather than before it.On the other hand, when P3 latency and RT are both prolonged, thenthe onus is placed on some aspect of stimulus evaluation (with or with-out the involvement of response-related processes). Moreover, when-ever response-related processes are implicated, then the nature andtime-course of their contributions can be delineated by examining thetemporal relations among the EMG, the actual response and the LRP.Such data have been used to pinpoint the locus of interference in anumber of paradigms wherein some "incongruence" or "conflict" hasresulted in a delayed overt response. The LRP is taken to reflect re-sponse preparation and its timing an indication of when; moreover, itspolarity can be taken as a sign of what response has been prepared.

7. READINGS OF MENTAL FUNCTIONS 225
On the whole, the patterns of brain, muscle and behavioural activityin conflict situations have revealed that on many incongruent trials,the incorrect response had in fact been activated before the correct one.The results of these experiments indicate that information flow is notalways discrete (all-or-none) in the strictest sense, as partial analysis ofthe stimulus does indeed affect the response system (for reviews see e.g.Coles et al. 1988, 1995). The ERP data have thus been instrumental indiverting the research focus from choosing between all-or-none versuscontinuous models to the delineation of the factors that determinewhen each is the more appropriate characterization. Data from thesetypes of experiment have also demonstrated that different stimulusfeatures are not only processed independently of each other but also atdifferent rates. It is likely that it is from this temporal patterning offeature selection that an apparent information processing structureemerges.
It is important to note that these ERP components are most useful inanswering questions of this type when used in combination with, ratherthan instead of, the more traditional chronometric measures. Thatsaid, the P3 and LRP are especially valuable indices of informationaltransactions because they can be measured even on trials where no re-sponse need be made, as in the NO-GO trials of a GO/NO-GO paradigm
FIG. 7.10.
Lateralized readiness potential (LRP) on GO/NO-GO trials. Note the presence of signifi-cant LRP on NO-GO trials. From Osman et al. (1992) with permission of the authors and publisher.

226 KUTAS & DALE
(e.g. Osman et al. 1992) (Fig. 7.10). We can determine the tune-course offeature extraction and information use by placing contingencies on howpeople respond to certain stimulus configurations. In a typical example,response contingencies are set so that one hand is equated with stimuliin one location and the other hand with stimuli in a different location,but whether or not a response is actually required depends on stimuluscolour. The latency and polarity of the LRP under such circumstancescan be used to determine whether colour is processed before or afterlocation in space. This general logic can be used to test other hypoth-eses about the relative timing of distinct processes in a variety ofcomplex acts such as speech production. Moreover, even when a personresponds, LRP parameters can be used to reveal if and when theychanged their mind, so to speak.
7.3.2 AttentionERPs have been particularly useful in investigating the timing, level ofanalysis and anatomical loci of attentional selection in the brain. Thebeauty of the ERP technique in this endeavour is that it allows an ex-amination of stimuli that are unattended with the same resolution asthose at the centre of attention. ERP data have thus provided an unpar-alleled look at the suppressed processing of feature and semantic infor-mation when unattended in vision, audition and somatosensation, aswell as information about just how effective attentional selection is (i.e.the width of the attentional beam or spotlight); the natures of theprocessing of both attended and unattended information have beenfound to vary depending on the input modality, stimulus features andtask (for references see e.g. Hillyard 1993).
ERP and MEG data have provided some of the strongest evidence forearly selection of sensory inputs based on spatial location; that is, aneffect of focused auditory attention as early as 20ms post-stimulusunder conditions of high sensory load (Woldorff et al. 1993). These dataare in line with those observed for attention-sensitive single units fromprimary auditory cortex in monkeys. The magnetic data implicated theauditory cortex of the supratemporal plane (in or near Heschl's gyrus).Subsequent attention-related effects also appear to emanate fromdifferent regions of the auditory cortex depending on the nature of theselection required.
A variety of neuroimaging and neuropsychological studies have ledto the view that there are many parts to the neural circuitry responsi-ble for co-ordinating attentional resources during visual analyses,including the dorsolateral prefrontal cortex, the anterior cingulate, theposterior parietal lobe and the pulvinar nucleus of the thalamus(Posner & Dehaene 1994). It remains to be seen which of these

7. READINGS OF MENTAL FUNCTIONS 227
structures contribute to the scalp-recorded activity. Much of thecurrent-day ERP/ERF research is aimed at defining the nature and time-course of attentional control by the anterior and posterior attentionalsystems over sensory projection areas.
An elegant example of how ERPs have been used to delineate atten-tion-related processes can be seen in the work of Woods et al. (1991).These researchers recorded ERPs to all events and reaction times tosome in a multidimensional dichotic listening variant of a prototypicERP selective attention paradigm. Specifically, people were asked toattend to tone bursts of a designated pitch in a particular ear and torespond to occasional (20%) stimuli that were 20 ms shorter in durationthan the more frequent (80%) standard stimuli; thus, target stimuliwere defined by three features - ear of delivery (right or left), pitch(250, 1000 or 4000hz) and duration (short or long). The relevant com-parisons involved the ERPs to the standard stimuli when attended ver-sus when inattended. This clever design allowed the authors to use thedifferent ERP patterns to determine whether the brain was sensitive todifferences in tone frequency (as would be expected from previousdata), and also whether the brain processes pitch and location informa-tion differently and, if so, what the time-courses of the processing ofeach of these features and their conjunction might be.
The ERPs to tones of different pitches differed at 100ms (N100 com-ponent) regardless of attention in a way that reflected tonotopic organi-zation in the eliciting area. By contrast, the attention effects for pitch,ear of delivery, and the pitch-ear conjunction, although statistically dif-ferent from each other, did not show tonotopy, thereby implicating theinvolvement of non-tonotopic regions of the auditory cortex. The atten-tion-related differences (Nd) for both pitch and location started fairlyearly (80-120ms) and showed slightly different topographies; thus, wecan infer that these two features were analysed independently and inparallel starting by 80 ms at the latest. After 120 ms, in addition to thepitch and location Nds, conjunction-specific Nds appeared, indicatingthat conjunction processing lagged individual feature analysis some-what. By 400ms, the Nds to individual features disappeared, leavingNd activity strictly in response to stimuli that had both the relevantpitch and location (Fig. 7.11). The different Nd distributions indicatedthat, whereas either individual feature Nd could be accounted for bythe activation of auditory cortical fields, the conjunction Nd (400-900ms) implicated the frontal lobes.
7.3.3 LanguageOne domain of cognition that has been revolutionized by the advent ofvarious neuroimaging techniques is language. Whatever else language

228 KUTAS & DALE
FIG. 7.11.
Timing of feature processing including time-courses of Nd frequency, Nd location, Nd toboth frequency and location and Nd that is conjunction specific. Nd refers to negative difference: e,early, l, late. Modified from Woods et al. (1994) with permission of the authors and publisher.
may be it is a compelling process that takes place in real time and in alarge part outside of awareness until the input makes sense or not.Neuropsychological and neuroimaging data have implicated manyareas of the brain (other than the classical Broca's and Wernicke'sareas) in language processing. While these different areas may not allbe active simultaneously, the relevant processes must overlap consider-ably in time. It is for this reason in particular that ERP/ERF activitywhich tracks language as it is being decoded and interpreted has beenespecially informative (for further discussion see Kutas & King 1996).
An elegant example of how ERPs can be used to investigate psycho-linguistic questions can be found in the work of Garnsey et al. (1989).These researchers exploited the fact that semantic anomalies elicitN400s in order to evaluate two alternative hypotheses about the strat-egies that guide sentence parsing when there is a momentary ambigu-ity about syntactic structure. "Parsing" refers to the process of figuringout the syntactic relations between words in a sentence (i.e. who didwhat to whom). In English, determining the grammatical function (e.g.subject, object) of each word in a sentence is usually relatively easy, asthis information is correlated with word order. However, there areexceptions; for instance, in wh-questions, where the questioned ele-ment occurs at the beginning of a sentence (e.g. Which customer did thesecretary call? ), there is no way of knowing what the grammatical func-tion (subject, object, object of preposition) of the questioned element(Which customer ) is until later in the sentence.
Sentence processing theorists have opposing hypotheses about whatthe parser does in cases where the function of an element is ambiguous.For instance, in the example above, the noun phrase which customermight automatically be assigned as the direct object of the clause, if theparser follows a "first resort" strategy. In this case, the disambiguatinginformation in the verb "call" which occurs later in the sentence would

7. READINGS OF MENTAL FUNCTIONS 229
tell the parser that its initial assignment was correct, because whichcustomer is the direct object of call. However, if the parser were follow-ing a "last resort" strategy, then no grammatical role would be assignedto "which customer" until more information was available. Both strate-gies have costs and benefits. The first resort strategy is effective ifwhichcustomer is the direct object; however, if it is not, as in "Which customerdid the secretary call about?", then the parser incurs a great computa-tional penalty in reanalysing "which customer" as the object of a prepo-sition instead. The last resort strategy is necessarily less efficient in theearly, ambiguous region of the sentence, but ensures no delays when-ever the function of "which customer" is not the expected one.
Garnsey et al. constructed sentences with embedded wh-questionswherein the questioned element was either plausible or implausible asa direct object of the subsequent verb.
(a) The businessman knew which customer the secretary called_______ at home.
(b) The businessman knew which article the secretary called_______ at home.
These were randomly interspersed with simple declarative control sen-tences which either did or did not contain a semantically anomalousword. The beauty of this design is that the noun phrase "which article"in (b) isn't plausible as a direct object and will therefore elicit anenhanced N400 wherever in the sentence the parser assigns it as such.If the first resort strategy is in effect, the N400 will be observed early,namely at the verb "call", which is the first place the parser mightassign a direct object role. On the other hand, according to the lastresort strategy, the N400 should not appear until later in the sentenceat the word "at", when it becomes unambiguous that "which article"serves the direct object role.
An N400 was observed at "called" and this was taken as evidence forthe first resort strategy. Note that, in this example, the N400 is not tobe taken as a direct reflection of role assignment, but rather of the in-congruity that is either a consequence of making an implausible roleassignment or of evaluating the possibility of that assignment. Whileother viable interpretations for this outcome have since been pro-posed,6 these are independent of the choice of the N400 as a measure,and the Garnsey et al. study remains a good example of how ERPs can beused to limit the number of viable explanations for certain linguisticphenomena.
Examples of this type are increasing daily. Equally powerful is theuse of ERPs to investigate speech comprehension and aspects of parsing

230 KUTAS & DALE
and integration beyond the level of individual words (Kutas & King1996) in reading and listening to sentences with simple and complexsyntax. What is remarkable is how similar sentence-level ERP effects arefor written text presented one word at a time and for natural speech (e.g.Osterhout & Holcomb 1993, Mueller et al. 1997). Such data have alsoshown the necessity of taking individual differences in comprehensionskills into account from the earliest stages of sensory analysis throughcomprehension (King & Kutas 1995b) (see Fig. 7.9, bottom right).
7.3.4 Memory: electrophysiological data on encodingand retrieval processesERPs are sensitive indicators of physical, perceptual and conceptualchanges in the environment, both intentional and/or conscious andinvoluntary and/or unconscious. Clearly, an appreciation of changerequires some trace or memory of past events. ERPs have been used toinvestigate aspects of the formation, maintenance (repetition) andretrieval of such memory traces (for reviews see Kutas 1988, Johnson1995, Rugg 1995).
The earliest ERP studies of memory dealt with the timing of retrievalfrom short-term memory. Later ERP studies of memory focused on theamplitude of the P3 during encoding as a predictor of subsequentmemory performance. These investigations were motivated by thehypothesis that P3 amplitude reflected the updating of one's mentalmodel of the "environment" and evidence from intracranial recordingsthat potentials in the amygdala-hippocampal regions of humans co-occurred with the scalp-recorded P3 component. The story was some-what complicated by the fact that humans and monkeys with damageto the medial temporal lobe did not necessarily show reduced P3 ampli-tudes at the scalp. While this issue remains unsettled, studies con-ducted to test the updating of working memory hypothesis of the P3have nonetheless contributed to our understanding of memory and thebrain. Proponents of the levels of processing framework had predictedthat under most circumstances items that were processed more"deeply" (meaningfully) would be better remembered than items thatwere processed at only a shallow level (orthographically or phonologi-cally in the case of words). Such predictions were confirmed by manystudies wherein the nature of encoding was manipulated; the behav-ioural data allowed the inference that the way in which a stimulus isencoded is a critical determinant of the probability of its recognition orrecall. However, the ERP data recorded in such tasks demonstratedmore directly that the brain processes during encoding were in factdifferent within 200-300ms of stimulus presentation. Moreover, ERPsrecorded during the study phase sorted as a function of subsequent

7. READINGS OF MENTAL FUNCTIONS 231
memory performance have revealed different classes of people includ-ing those who choose to use "maintenance" versus "elaborative" re-hearsal strategies to remember (e.g. Fabiani et al. 1990). Again, whilethis should come as no great surprise, ERPs provide more precise onlineevidence of the timing of these strategic choices.
Much current ERP research is aimed at testing various hypothesesabout the proposed implicit/explicit distinction in long-term memory.By definition, amnesics do not perform as well as non-brain-damagedindividuals on traditional tests of recognition and recall, and yet thereare situations wherein the accuracy or speed of their performance canonly be interpreted as indicating that they do have some memory for anevent which they say they do not remember (Squire et al. 1993). Similardissociations between memory measured "directly" and "indirectly"have been observed for non-brain-damaged individuals as well. ERPshave been used to examine the issue of whether, and if so how, perform-ance in implicit and explicit memory tests are subserved by differentneural systems operating on the same or different representations, andthe time-courses of these processes.
A good example is a study by Paller (1990) on "directed forgetting". Inthis experiment individuals were exposed to words printed in red orgreen ink and asked to remember the "red" ones and forget the "green"ones. After the study phase, half the participants were asked to usethree-letter stems as cues to recall words they had just studied whilethe other half were asked to write down the first word that came tomind in response to each stem. Thus both groups were exposed to thesame stimuli, but differed in what they had to do. Both groups also wereasked to recall as many of the words (green or red) as they could in anyorder (free recall).
As expected, everyone recalled more of the words that they had beendirected to remember than those they had been directed to forget. Butdirected forgetting had no differential effect on stem completion; thestems were completed with equivalent numbers of "red" and "green"words. Thus, Paller obtained the expected pattern of dissociation of theeffect of directed forgetting on recall versus priming. Moreover, Pallerfound that the ERPs recorded during encoding (study phase) were sensi-tive to subsequent recall but not to priming; that is, items that would berecalled had larger late positivities than those that would not berecalled, but there were no signs in the ERP of subsequent performancein the stem completion priming task. This pattern supports a differencebetween the encoding factors that are important for explicit versusimplicit memory performance.
In a subsequent series of studies, Paller et al. (1995) combined behav-ioural and electrophysiological measures to examine the processes

232 KUTAS & DALE
underlying implicit (priming) and explicit (recollection) memoryperformance. Across a series of studies, ERPs were recorded during animplicit test of memory (either threshold identification or lexical deci-sion) following study manipulations that either influenced behaviouralpriming measures but not recognition performance, or vice versa. Forexample, people were asked to image a word and compare its size withthat of the cathode ray tube in front of them in order to process the itemdeeply, or instead to count the number of syllables in the word in order toprocess it to a shallow level; this study manipulation had the effect ofvarying recognition but not priming performance. In other experiments,priming but not recognition performance was manipulated by varyingthe physical features of the studied items from the study to the testphase. The results thus far indicate that: (a) ERPs and behaviouralmeasures reflect different aspects of memory-related processes; (b) atleast partly different brain mechanisms support priming and recollec-tion, with the electrophysiological signs of priming occurring earlierthan those of recollection (after 300ms); and (c) recollection processesmay come into play even under nominally implicit tests of memory thathave no immediate consequence on behavioural measures of priming.
Another contemporary line of research uses very slow potentials toexamine retrieval processes from long-term memory. In one typicalapproach exemplified by the work of Roesler and his colleagues (e.g.Roesler et al. 1995), young adults were asked to learn various lists offacts by heart on one day and to make decisions about them on another.The materials were constructed so as to take advantage of the so-called"fan effect". This refers to the observation that the time taken to verifya proposition about a concept depends on the number of links whichthat concept has with other concepts in memory; more links translateinto slower decision times. Thus, it is possible to vary the difficulty ofretrieving an item by increasing the number of links between it andother items. In practice, this means teaching a person many facts aboutsome items, a moderate number of facts about other items, and only asingle fact about yet other items.
The relevant electrophysiological data are the slow potentialsrecorded for several hundreds of milliseconds during the act of retrieval.The results of these studies suggest a close relationship between differ-ent neocortical structures and different retrieval processes. For exam-ple, there appears to be a pronounced DC-like negative potential over leftfrontal sites during retrieval of almost any semantically encoded item(Fig. 7.12) where amplitude varies with the size of the fan. This effectwas seen together with other more task-specific slow potentials theamplitude, timing and distribution of which varied with the nature ofthe information retrieved (general versus specific concepts, verbal

7. READINGS OF MENTAL FUNCTIONS 233
FIG. 7.12.
Very slow potentials related to memory retrieval in three experimental conditions.Recordings are relative to an average reference and across subjects and different levels of fan. FromRoesler et al. (1995) with permission of the authors and publisher.
versus spatial materials, etc.) and the decision (yes or no) required (for areview see Heil et al. 1994). Most importantly, all these studies revealeda pronounced negative slow wave that was temporally related toretrieval, the spatial topography of which reflected the type of materialthat was being retrieved and the amplitude of which varied with thedifficulty of the retrieval. These results fit with the notion that the brainareas involved in explicit memory are the same ones that are needed forencoding and perception; there is no single memory store for all memo-ries. In addition, the ERP data offer a real-time view of the time-courseand relative location of retrieval processes.
7.3.5 Electrophysiological studies of neural plasticityNature or nurture? It's almost outdated to pose the question, for whenit comes to brain development (and the associated perceptual, cognitiveand motor functions), the answer is most certainly "Both to somedegree". So, the better questions are what is the impact of each andwith what time-course? For example, how do the brain and behavioursof someone who has hearing differ from those of someone who is borndeaf? Exactly what is the auditory cortex of a deaf individual doing?These are the sorts of question that are being asked and answered us-ing ERP/ERF recordings. Insofar as a deaf individual's brain responses to

234 KUTAS & DALE
visual and somatosensory stimuli differ, we can infer that differentbrain systems are involved in their processing.
Neville and her colleagues (for a review see Neville 1995) addressedthese questions by comparing the scalp-recorded visual EPs of hearingadults, congenitally deaf adults (individuals who have been deprived ofauditory input since birth), and hearing adults whose first languagewas American Sign Language by virtue of having been born to deaf par-ents. In a number of studies, they found that the visual EPs of deaf indi-viduals were in fact different from those of hearing individuals, espe-cially for stimuli occurring in the periphery. Specifically, early sensorycompoments (N150 and P230) were larger in amplitude for the deaf.The larger N150 over frontal and temporal regions was taken as con-sistent with the hypothesis that auditory areas deprived of their nor-mal input were processing visual information instead, while the largeramplitude P230s over occipital sites were hypothesized to reflect struc-tural changes in the intact visual areas.
Neville & Lawson (1987a-c) also pursued this question within aselective attention task that required detection of motion in differentregions of visual space. While there were some similarities in the over-all pattern of attention-related effects in the deaf and hearing subjects,there were also some notable distribution differences, especially forstimuli in the periphery. For example, deaf individuals had largerattention effects on both the N1 component and a subsequent latencypositivity (PD) and showed these effects at the occipital sites - locationswhere the hearing group had no such effects. Deaf individuals also hadlarger N1 effects over the left hemisphere than hearing individuals,regardless of the visual field of presentation. These ERP results indicatethat the neural systems which mediate attention to visual space andperception of motion are different in part in hearing and congenitallydeaf individuals.
The interpretation of these differences is clarified in part by compar-ing them with the ERPs of hearing individuals born to deaf parents andwhose first language is American Sign Language. With this comparisonwe can determine the extent to which each of these group differences inattention is attributable to sensory deprivation versus the acquisitionof a visuospatial language. Relative to the hearing and congenitallydeaf individuals, these hearing-of-deaf adults show very similar ERPwaveform morphologies; differences occur primarily in the size and dis-tribution of the attention effects (Fig. 7.13). On the one hand, the hear-ing-of-deaf look more like the hearing in that they do not show the largeN1 or PD effects at the occipital sites. On the other hand, the hearing-of-deaf are more similar to the deaf in the lateral distribution of their at-tention effects; that is, they show large effects over the left hemisphere

7. READINGS OF MENTAL FUNCTIONS 235
in response to left visual field stimuli. As the larger ERP (N1 and PD)effects over the occipital region are specific to individuals who are deaf,they are probably a consequence of auditory deprivation since birth. Incontrast, the apparently greater involvement of the left hemisphere inattentional selection based on motion for both the deaf and the hearing-of-deaf (relative to normal hearing) individuals is most consistent withan explanation based on the early acquisition of sign language.
Mapping via magnetic recording techniques has also been used toinvestigate the reorganization of the somatosensory system in humans.For instance Mogilner, et al. (1993) used magnetic recordings to
FIG. 7.13.
Comparison of visual ERPS from hearing, deaf and hearing-of-deaf individuals. Note thatonly deaf individuals show large occipital N1 and later positivity. Both deaf and hearing-of-deaf showlarge N1 over left hemisphere temporal and parietal sites. Thus, the occipital effects are related toaltered sensory experience, whereas as the temporal and parietal effects are more likely due to al-tered language experience (a visuospatial manual language). Adapted from Neville & Lawson(1987c) with permission of the authors and publisher.

236 KUTAS & DALE
compare the somatosensory map of the hand areas of a group of controlpeople with those obtained from two adult men both before and aftersurgical separation of congenitally webbed fingers. The pre-surgicalrecordings revealed that hand areas of the abnormal hand in these twopatients were quite small and unusual in their lack of a consistenttopography; however, a few weeks after surgery, a normal somatotopicorganization was evident. Somatosensory reorganization in humanshas also been observed in MEG recordings of a patient with an ampu-tated limb; via behavioural testing this patient felt touch as well asheat and cold in the phantom limb when a certain area on his cheek ora few inches above the amputation line were stimulated (Yang et al.1994). The MEG patterns revealed no real "hand" area in the hemi-sphere contralateral to the amputated limb, but a normaltopographically organized area in the other hemisphere; moreover, thepresumed hand area was activated by touching either the lower face orthe upper arm 10cm above the line of amputation. This is one of thestrongest pieces of evidence of cortical remapping in humans followingabnormal experience. All in all, these data support the emerging viewthat receptive fields and cortical maps are dynamic in the face of expe-rience, rather than static and inborn.
7.4 CONCLUSIONS
The reader should now have a good idea of the many types of questionthat have proven amenable to the ERP methodology. Different aspects ofthe ERP/ERF are sensitive to stimulus parameters, response param-eters, preparation, modulation and direction of attention, establishingexpectancies and noticing violations thereof, discrimination, categori-zation, decision-making, conscious recollection and implicit processingamong other factors. ERPs can be used not only to help determine whichfactors influence brain activity, mental state and/or an individual'sbehaviour but also to provide some important information about thetime-course of their influences. This time-course of sensitivity to experi-mental and internal variables can be combined with other neural-imaging techniques of greater spatial but coarser temporal resolutionto unfold the active brain areas across time.
ACKNOWLEDGEMENTS
The preparation of this chapter was supported in part by HD22614, AG08313and MH52893 to M. Kutas. A. Dale was supported by a post-doctoral fellowshipfrom the Norweigan Research Council and a grant from ONR N00014-94-1-

7. READINGS OF MENTAL FUNCTIONS 237
0856 to M. I. Sereno. The helpful comments of J. Weckerly, M. Rugg andL. Anllo-Vento on an earlier draft were much appreciated, as is the constantinput from J. King on many fronts.
NOTES
1. More generally,
where
REFERENCES
Belliveau, J. W, D. N. Kennedy Jr, R. C. McKinstry, B. R. Buchbinder, R. M.Weisskoff, M. S. Cohen, J. M. Vevea et al. 1991. Functional mapping of thehuman visual cortex by magnetic resonance imaging. Science 254, 716-19.
Berger, H. 1929. Uber das Elektrekephalogramm des Menschen. Archiv furPsychiatric and Nervenkrankheiten 87, 527-70.
Bocker, K. B., C. H. Brunia, P. J. Cluitmans 1994. A spatio-temporal dipolemodel of the readiness potential in humans. 1. Finger movement.Electroencephalography and Clinical Neurophysiology 91, 275-85.
Cheyne, D., R. Kristeva, L. Deecke 1991. Homuncular organization of humanmotor cortex as indicated by neuromagnetic recordings. Neuroscience Letters122, 17-20.
Coles, M. G. H., G. Gratton, E. Donchin 1988. Detecting early communication:using measures of movement-related potentials to illuminate human infor-mation processing. Biological Psychology 26, 69-89.
Coles, M. G. H., H. G. O. M. Smid, M. K. Scheffers, L. J. Otten 1995. Mentalchronometry and the study of human information processing. In Electro-physiology ofmind: event-related potentials and cognition, M. D. Rugg & M.G. H. Coles (eds), 86-131. Oxford: Oxford University Press.
denotes a tensor, to allow for anisotropic conductivity.
is the permeability of free space.
2. The corresponding equation for the magnetic field produced by a currentdipole is
3. These differences are reflected in the eij and mij in Equations (11) and (12).4. Note that the "components" derived from PCA do not necessarily correspond
to the ERP components as defined above.5. Note that, if two or more generators are strongly correlated in time, the
number of principal components may be lower than the actual number ofgenerators.
6. See e.g. Fodor (1989) for a thorough review of the issues involved inprocessing empty categories. More recent work has favoured models wherethe parser maintains parallel syntactic analyses in certain situations (e.g.Gibson 1990). Moreover, MacDonald et al. (1992) provide evidence thatthere are working memory-related individual differences in the computa-tion of such multiple analyses, thereby muddying the interpretation ofGarnsey et al.'s data somewhat. If subjects were maintaining multiple syn-tactic analyses, the N400 observed may simply have reflected the fact thatthe "first resort" is one of several analyses that is being pursued.

238 KUTAS & DALE
Cooper, R., J. W Osselton, J. C. Shaw 1974. EEG technology. London: Butter-worths.
Courchesne, E., S. A. Hillyard, R. Galambos 1975. Stimulus novelty, task rele-vance and the visual evoked potential in man. Electroencephalography andClinical Neurophysiology 39, 131-42.
Cuffin, B. N. & D. Cohen 1977. Magnetic fields of a dipole in special volumeconductor shapes. IEEE Transactions on Biomedical Engineering 24,372-81.
Dale, A. M. & M. I. Sereno 1993. Improved localization of cortical activity bycombining EEG and MEG with MRI cortical surface reconstruction: a linear ap-proach. Journal of Cognitive Neuroscience 5(2), 162-76.
Damen, E. J. & C. H. Brunia 1994. Is a stimulus conveying task-relevant infor-mation a sufficient condition to elicit a stimulus-preceding negativity?Psychophysiology 31, 129-39.
Desmedt, J. 1988. Somatosensory evoked potentials. In Human event-relatedpotentials, T W Picton (ed.), 159-244. New York: Elsevier.
Donchin, E. 1979. Event-related brain potentials: a tool in the study of humaninformation processing. In Evoked brain potentials and behaviour, H.Begleiter (ed.), 13-88. New York: Plenum.
Donchin, E. & M. G. H. Coles 1988. Is the P300 component a manifestation ofcontext updating? Behavioural Brain Sciences 11, 357-74.
Fabiani, M., D. Karis, E. Donchin 1990. Effects of mnemonic strategy manipu-lation in a Von Restorff paradigm. Electroencephalography and ClinicalNeurophysiology 75, 22-35.
Falkenstein, M., J. Hohnsbein, J. Hoormann 1995. Event-related potential cor-relates of errors in reaction tasks. Electroencephalography and Clinical Neu-rophysiology 44, 287-96.
Fodor, J. D. 1989. Empty categories in sentence processing. Language andCognitive Processes 4, 155-209.
Garnsey, S. M., M. K. Tanenhaus, R. M. Chapman 1989. Evoked potentials andthe study of sentence comprehension. Journal of Psycholinguistic Research18, 51-60.
Gehring, W J., B. Goss, M. G. Coles, D. E. Meyer, E. Donchin 1993. A neuralsystem for error detection and compensation. Psychological Science 4, 385-90.
Gevins, A. S. & A. Remond (eds) 1987. Methods of analysis of brain electricaland magnetic signals. EEG handbook I Revised series. Amsterdam: Elsevier
Gibson, E. 1990. Recency preference and garden-path effects. In Program of theTwelfth Annual Conference of the Cognitive Science Society, 372-9. Hillsdale,NJ: Lawrence Erlbaum.
Glaser, E. M. & D. S. Ruchkin (eds) 1976. In Principles of neurobiological signalanalysis. New York: Academic Press.
Goodin, D. S., K. C. Squires, B. H. Henderson, A. Starr 1978. An early event-related cortical potential. Psychophysiology 4, 360-5.
Grynszpan, F & D. B. Geselowitz 1973. Model studies of the magnetocardio-gram. Biophysical Journal 13, 911-25.
Hamalainen, M. S. & R. J. Ilmoniemi 1984. Interpreting measured magneticfields of the brain: estimates of current distribution. Report TKK-F-A559,Department of Technical Physics, Helsinki University of Technology
Hamalainen, M. S., R. Hari, R. J. Ilmoniemi, J. Knuutila, O. V Lounasmaa1993. Magnetoencephalography-theory, instrumentation, and applicationsto noninvasive studies of the working human brain. Reviews of ModernPhysics 65, 413-97.

7. READINGS OF MENTAL FUNCTIONS 239
Heil, M., F. Roesler, E. Hennighausen 1994. Slow potentials during long-termmemory retrieval. In Cognitive electrophysiology, H. Heinze, T Muente, G. R.Mangun (eds), 149-68. Boston: Birkhauser.
Hillyard, S. A. 1993. Electrical and magnetic brain recordings: contributions tocognitive neuroscience. Current Opinions in Neurobiology 3, 217-24.
Johnson Jr, R. 1988. The amplitude of the P300 component of the event-relatedpotential: Review and synthesis. In Advances in psychophysiology, P K.Ackles, J. R. Jennings, M. G. H. Coles (eds), 69-138. Greenwich, CT: JAI.
Johnson Jr, R. 1993. On the neural generators of the P300 component of theevent-related potential. Psychophysiology 30(1), 90-7.
Johnson Jr., R. 1995. Event-related potential insights into the neurobiology ofmemory systems. In Handbook of neuropsychology, vol. 10, R. Johnson Jr(ed.), 135-64. Amsterdam: Elsevier.
King, J. W & M. Kutas 1995a. A brain potential whose latency indexes thelength and frequency of words. Newsletter of the Centre for Research in Lan-guage 10(2),3-9.
King, J. W & M. Kutas 1995b. Who did what and when? Using word- andclause-related ERPs to monitor working memory usage in reading. Journal ofCognitive Neuroscience 7, 378-97.
Kristeva, R., D. Cheyne, L. Deecke 1991. Neuromagnetic fields accompanyingunilateral and bilateral voluntary movements: topography and analysis ofcortical sources. Electroencephalography and Clinical Neurophysiology 81,284-98.
Kutas, M. 1988. Review of event-related potential studies of memory. In Per-spectives in memory research, M. S. Gazzaniga (ed.), 181-218. Cambridge,MA: MIT Press.
Kutas, M. & S.A. Hillyard 1985. Event-related potentials and psychopathology.In Psychobiology and foundations of clinical psychiatry, section 4, Psychia-try, J. O. Cavenar Jr (ed.), Ch. 62,1-17. Philadelphia, PA: Lippincott/Harper& Row.
Kutas, M & J. W King 1996. The potentials for basic sentence processing: dif-ferentiating integrative processes. In Attention and performance, vol. 16, T.Inui & J. L. McClelland (eds), 501-46. Cambridge, MA: MIT Press.
Kutas, M. & R. Kluender 1994. What is who violating: a reconsideration of lin-guistic violations in light of event-related brain potentials. In Cognitive elec-trophysiology, H. Heinze, T Muente, G. R. Mangun (eds). La Jolla, CA:Birkhauser Boston.
Kutas, M. & C. Van Petten 1994. Psycholinguistics electrified. In Handbook ofpsycholinguistics, M.A. Gernsbacher (ed.), 83-143. San Diego, CA: AcademicPress.
MacDonald, M. C., M. A. Just, P A. Carpenter 1992. Working memory con-straints on the processing of syntactic ambiguity. Cognitive Psychology 24,56-98.
Magliero, A., T. R. Bashore, M. G. H. Coles, E. Donchin 1984. On the depend-ence of P300 latency on stimulus evaluation processes. Psychophysiology 21,171-86.
McCallum, W C. & S. H. Curry (eds) 1993. Slow potential changes in the humanbrain, NATO ASI series A: Life Sciences 254. New York: Plenum.
Mogilner, A., J.A. Grossman, U. Ribary, M. Joliot, J. Volkmann, D. Rapaport, R.W. Beasley et al. 1993. Somatosensory cortical plasticity in adult humansrevealed by magnetoencephalography. Proceedings of the National Academyof Sciences, USA 90(8), 3593-7.
240 KUTAS & DALE
Mueller, H. M., J. W King, M. Kutas 1997. Event-related potentials elicited byspoken relative clauses. Cognitive Brain Research 5(3), 193-203.
Naatanen, R. 1992. Attention and brain function. Hillsdale, NJ: LawrenceErlbaum.
Naatanen, Simpson, Lake 1982. Stimulus deviance and evoked potentials. Bio-logical Psychology 14, 53-98.
Neshige, R., H. Luders, H. Shibasaki 1988. Recording of movement-relatedpotentials from scalp and cortex in man. Brain 111, 719-36.
Neville, H. J. 1995. Developmental specificity in neurocognitive development inhumans. In The cognitive neurosciences, M. S. Gazzaniga (ed.), 219-31.Cambridge, MA: MIT Press.
Neville, H. J. & D. Lawson 1987a. Attention to central and peripheral visualspace in a movement detection task: an event-related potential and behav-ioural study. I: Normal hearing adults. Brain Research 405, 253-67.
Neville, H. J. & D. Lawson 1987b. Attention to central and peripheral visualspace in a movement detection task: an event-related potential and behav-ioural study. 11: Congenitally deaf adults. Brain Research 405, 268-83.
Neville, H. J. & D. Lawson 1987c. Attention to central and peripheral visualspace in a movement detection task. III: Separate effects of auditory depriva-tion and acquisition of a visual language. Brain Research 405, 284-94.
Neville, H. J., D. L. Mills, D. S. Lawson 1992. Fractionating language: differentneural subsystems with different sensitive periods. Cerebral Cortex 2(3),244-58.
Nicholson, C. & J. A. Freeman 1975. Theory of current source-density analysisand determination of conductivity tensor forAnuran cerebellum. Journal ofNeurophysiology 38, 356-68.
Nunez, P L. 1981. Electric fields of the brain. New York: Oxford UniversityPress.
Ogawa, S., D. W Tank, R. Menon, J. M. Ellermann, S. G. Kim, 11. Merkle, K.Ugurbil 1992. Intrinsic signal changes accompanying sensory stimulation:functional brain mapping with magnetic resonance imaging. Proceedings ofthe National Academy of Sciences, USA 89, 5951-5.
Oostendorp, T. F & A. van Oosterom 1989. Source parameter estimation ininhomogeneous volume conductors of arbitrary shape. IEEE Transactions onBiomedical Engineering 36, 382-91.
Osman,A., J. R. Bashore, M. G. H. Coles, E. Donchin, D. E. Meyer 1992. On thetransmission of partial information: inferences from movement-relatedbrain potential. Journal of Experimental Psychology: Human Perception andPerformance 18, 217-32.
Osterhout, L. & P J. Holcomb 1993. Event-related potentials and syntacticanomaly: Evidence of anomaly detection during the perception of continuousspeech. Language & Cognitive Processes 8, 413-37.
Osterhout, L. & P J. Holcomb 1995. Event-related potentials and languagecomprehension. In Electrophysiology of mind: event-related potentials andcognition, M. D. Rugg & M. G. H. Coles (eds), 171-215. Oxford: Oxford Uni-versity Press.
Paller, K A. 1990. Recall and stem-completion priming have differentelectrophysiological correlates and are modified differentially by directedforgetting. Journal of Experimetnal Psychology: Learning, Memory andCognition 16, 1021-32.
Paller, K. A., M. Kutas, A. R. Mayes 1987. Neural correlates of encoding in anincidental learning paradigm. Electroencephalography and Clinical Neuro-physiology 67, 360-71.
7. READINGS OF MENTAL FUNCTIONS 241
Paller, K. A., M. Kutas, H. K. Melsaac 1995. Monitoring conscious recollectionvia the electrical activity of the brain. Psychological Science 6 , 107-11.
Picton, T W 1992. The P300 wave of the human event-related potential. Jour-nal of Clinical Neurophysiology 9(4), 456-79.
Picton, T. W & S. A. Hillyard 1988. Endogenous event-related potentials. InHuman event-related potentials, T. W Picton (ed.), 361-426. New York:Elsevier.
Posner, M. 1. & S. Dehaene 1994. Attentional networks. Trends in Neuroscience17 , 75-9.
Press, W H., B. P Flannery, S. A. Teukolsky, W T Vetterling 1990. Numericalrecipes in C: the art of scientific computing , 59-70 New York: Cambridge Uni-versity Press.
Pritchard, W. S. 1981. Psychophysiology of P300: a review. Psychological Bulle-tin 89 , 506-40.
Regan, D. 1989. Human brain electrophysiology: evoked potentials and evokedmagnetic fields in science and medicine. New York: Elsevier.
Ritter, W, R. Simson, H. G. Vaughan, D. Friedman 1979. A brain event relatedto the making of a sensory discrimination. Science 203 , 1358-61.
Ritter, W, R. Simson, H. G. Vaughan, M. Macht 1982. Manipulation of event-related potential manifestations of information processing stages. Science218, 909-11.
Roesler, F & M. Heil 1991. Toward a functional categorization of slow waves:taking into account past and future events [comment; see comments]. Psy-chophysiology 28 , 344-58.
Roesler, F, M. Heil, E. Hennighausen 1995. Distinct cortical activation pat-terns during long-term memory retrieval of verbal, spatial, and color infor-mation. Journal of Cognitive Neuroscience 7 , 51-65.
Ruchkin, D. S., R. Munson, S. Sutton 1982. P300 and slow wave is a messageconsisting of two events. Psychophysiology 19 , 629-42.
Rugg, M. D. 1995. ERP studies of memory. In Electrophysiology of mind: event-related brain potentials and cognition , M. D. Rugg & M. G. H. Coles (eds),132-170. Oxford: Oxford University Press.
Rugg, M. D. & M. G. H. Coles 1995. Electrophysiology of mind: event-relatedbrain potentials and cognition . Oxford: Oxford University Press.
Sarvas, J. 1987. Basic mathematical and electromagnetic concepts of thebiomagnetic inverse problem. Physics in Medicine and Biology 32, 11-22.
Scherg, M 1992. Functional imaging and localization of electromagnetic brainactivity. Brain Topography 5 , 103-11.
Shibasaki, H., G. Barrett, E. Halliday, A. M. Halliday 1980. Components of themovement-related cortical potential and their scalp topography. Electro-encephalography and Clinical Neurophysiology 49, 213-26.
Simson, R., H. G. Vaughan, W Ritter 1977. The scalp topography of potentialsin auditory and visual discrimination tasks. Electroeneephalography andClinical Neurophysiology 42, 528-35.
Smith, W E., W J. Dallas, W H. Kullmann, H. A. Schlitt 1990. Linear estima-tion theory applied to the reconstruction of a 3-D vector current distribution.Applied Optics 29, 658-67.
Squire, L. R., B. Knowlton, G. Musen 1993. The structure and organization ofmemory. Annual Review of Psychology 44, 453-95.
Squires, K. C., N. K. Squires, S.A. Hillyard 1975. Vertex evoked potentials in arating-scale detection task: relation to signal probability. Behavioural Biol-ogy 13, 21-34.

242 KUTAS & DALE
Starr, A. & M. Don 1988. Brain potentials evoked by acoustic stimuli. In Humanevent-related potentials , T W Picton (ed.), 97-158. New York: Elsevier.
Swick, D., M. Kutas, H. J. Neville 1994. Localizing the neural generators ofevent-related brain potentials. In Localization and neuroimaging in neuro-psychology, A. Kertesz (ed.), 73-122. San Diego, CA: Academic Press.
Verleger, R. 1988. Event-related potentials and cognition: a critique of the con-text updating hypothesis and an alternative interpretation of P3. Behav-ioural Brain Sciences 11(3), 343-56.
Walter, W G., R. Cooper, V J. Aldridge, W C. McCallum, A. L. Winter 1964.Contingent negative variation: an electric sign of sensorimotor associationand expectancy in the human brain. Nature 203, 380-4.
Wang, J. Z., S. J. Williamson, L. Kaufman 1992. Magnetic source images deter-mined by a lead-field analysis: the unique minimum-norm least-squaresestimation. IEEE Transactions on Biomedical Engineering 39, 665-75.
Woldorff, M. G., C. C. Gallen, S.A. Hampson, S.A. Hillyard, C. Pantev, D. Sobel,R. E. Bloom 1993. Modulation of early sensory processing in human auditorycortex during auditory selective attention. Proceedings of the National Acad-emy of Sciences, USA 90, 8722-6.
Wood, C. C., D. Cohen, B. N. Cuffin, M. Yarita, T. Allison 1985. Electricalsources in human somatosensory cortex: identification by combined mag-netic and potential recordings. Science 227, 1051-53.
Woods, D. L., K. Alho, A. Algazi 1991. Brain potential signs of feature processingduring auditory selective attention. Neuroreport 2, 189-92.
Woods, D. L., K. Alho, A. Algazi 1994. Stages of auditory feature conjuction: anevent-related potential study. Journal of Experimental Psychology: HumanPerception and Performance 20(1), 81-94.
Yang, T T, C. C. Gallen, V S. Ramachandran, S. Cobb, B. J. Schwartz, F. E.Bloom 1994. Noninvasive detection of cerebral plasticity in adult humansomatosensory cortex. Neuroreport 5, 701-4.