electrical energy demand in mechanical machining processes
TRANSCRIPT

Electrical Energy Demand in Mechanical Machining Processes
A thesis submitted to The University of Manchester for the degree of
Doctor of Philosophy (PhD)
in the Faculty of Engineering and Physical Sciences
2014
Vincent Aizebeoje Balogun
School of Mechanical, Aerospace and Civil Engineering

ii
(Intentionally left blank)

iii
Table of Contents
List of Figures ix
List of Tables xiii
List of Nomenclature xiv
List of Abbreviations xviii
Abstract xx
List of Publications xxi
Declaration xxii
Copyright Statements xxiii
Dedication xxiv
Acknowledgements xxv
CHAPTER 1 1
Introduction 1
1.1 Manufacturing Sustainability and Resource efficiency 1
1.2 Global Energy Consumption in Manufacturing 2
1.3 Energy Demand in Machining processes 6
1.4 Aim and Objectives 7
1.5 Thesis Outline 8
CHAPTER 2 11
Literature Review 11
2.1 Energy Demand of Machine Tools 11
2.2 Use Phase energy consumption approach 14
2.2.1 Direct energy demand 14

iv
2.2.2 Energy footprint- Direct and embodied energy 22
2.3 Specific cutting energy approach 23
2.4 Online monitoring approach 29
CHAPTER 3 36
Experimental Strategy 36
3.1 Introduction 36
3.2 Machine tool 36
3.2.1 The MHP lathe 36
3.2.2 Takisawa milling machine 37
3.2.3 Mikron HSM 400 high speed machining centre 39
3.3 Measuring Equipments 40
3.3.1 Fluke 345 Clamp meter 40
3.3.2 ProgRes® microscope camera 41
3.3.3 Leica DM2500M Microscope 42
3.4 Workpiece materials 44
3.5 Cutting tools 45
3.6 Measurement of tool wear 45
3.7 Experimental setup for machining tests 46
CHAPTER 4 48
Modelling of direct energy requirements in mechanical machining processes 48
4.1 Abstract 48
4.2 Introduction 49

v
4.3 Machine Tool States and Proposed Improvements 49
4.4 Research Motivation 56
4.4.1 New Improved Model for Direct Electrical Energy Requirement in
Machining 57
4.4.2 Experimental Investigation 57
4.5 Results and Discussions 58
4.5.1 Energy consumption for machine modules and auxiliary units 58
4.5.2 Tool Change and Spindle speed- power characteristics 63
4.5.3 Effect of spindle speed on energy required by a DC motor driven
MAC-V2 Takisawa Milling Machine 64
4.5.4 Development of an improved and new energy model for milling processes 70
4.6 Validation of Direct Energy Model during Milling processes 71
4.7 Conclusion 72
CHAPTER 5 75
Impact of un-deformed chip thickness on specific energy in mechanical
machining processes 75
5.1 Abstract 75
5.2 Introduction 76
5.3 The Wider Importance of Specific Energy Data 79
5.4 Size effect in machining 80
5.5 Aim and Objective 82
vi
5.6 Modelling and Experimental setup 82
5.6.1 Research Methodology 82
5.6.2 Cutting Test Details 83
5.6.3 Influence of varying cutting parameters on power demand during
mechanical machining processes 86
5.7 Results and Discussions 90
5.7.1 Specific energy and size effect 101
5.8 Conclusions 103
CHAPTER 6 106
Improving the integrity of specific cutting energy coefficients for energy
demand modelling 106
6.1 Abstract 106
6.2 Introduction 107
6.2.1 Research aim and motivation 109
6.3 Research Strategy and Experimental Details 109
6.3.1 Research Strategy and Procedure 109
6.3.2 Experimental Details – Milling Tests 110
6.3.3 Experimental Details – Turning Tests 111
6.4 Results and Discussions 111
6.4.1 The effect of chip thickness on specific cutting energy 111
6.4.2 The effect of nose radius on specific cutting energy 115

vii
6.4.3 The effect of cutting environment on specific cutting energy 117
6.4.4 The effects of tool wear on specific cutting energy 119
6.5 Conclusions 122
CHAPTER 7 125
Specific energy based evaluation of machining efficiency 125
7.1 Abstract 125
7.2 Introduction 126
7.2.1 The Total Specific Energy and Chip Morphology 126
7.2.2 Process mechanisms in mechanical machining operations 128
7.3 Research aim and Objective 131
7.4 Experimental strategy and set up 131
7.4.1 Swept angle optimisation and their influence on specific ploughing in
milling processes 131
7.4.2 Estimation of the specific ploughing energy 140
7.4.3 Proposed analysis of the Specific Ploughing Energy 144
7.5 Conclusion 150
CHAPTER 8 151
Direct electrical energy demand in Fused Deposition Modelling 151
8.1 Abstract 151
8.2 Introduction – Layered Manufacturing Technologies 151
8.2.1 Fused Deposition Modelling 153
8.2.2 Research Aim 154

viii
8.3 Energy Demand in Fused Deposition Modelling 155
8.3.1 Energy States of Fused Deposition Modelling Machine 155
8.3.2 New Framework for direct energy requirements in FDM 158
8.3.3 Benchmarking of 3 different FDM technologies 159
8.4 Energy Demand for 3D printing versus Machining 164
8.5 Conclusions 168
CHAPTER 9 170
Conclusions and recommendations for future work 170
9.1 Conclusions 170
9.2 Major Research Contributions to Knowledge 175
9.3 Recomendations 176
REFERENCES 178
APPENDIX A Workpiece materials properties 178
APPENDIX B Cutting tool geometry of SOMT 060204 insert 190
APPENDIX C Process window (recommended machining parameters) on
somt 060204-hq 191
APPENDIX D Taguchi design of experiments for milling AISI 1045 steel alloy 192
APPENDIX E Experimental design to analyze specific energy for AISI 1045
steel alloy 193
APPENDIX F Tool Path View on DepoCAM Software for test piece 241
APPENDIX G ISO NC code blocks for surface cleaning generated on
Depocam software 198

ix
List of Figures
Figure 1.1: Sustainability Pillars (adapted from) [3] 1
Figure 1.2: World electricity consumption by sectors [6] 3
Figure 1.3: UK final energy consumption by main industrial groups [7] 4
Figure 1.4: World total energy consumption [6] 5
Figure 2.1: Energy used as a function of production rate for an automobile
production machining line adapted from Gutowski et al. [14] 15
Figure 2.2: Energy consumption of the machining process on PL700 machining
centre [36]. 19
Figure 2.3: Software architecture for temporal analysis of energy used in
manufacturing adapted from Vijayaraghavan and Dornfeld [22]. 30
Figure 2.4: Architecture of OEEM system adapted from Hu et al. [38]. 32
Figure 2.5: Basic event graph model for an energy consumption cycle adapted
from He et al. [9] 33
Figure 3.1: MHP Lathe 37
Figure 3.2: Takisawa Milling Machine 38
Figure 3.3: Mikron HSM 400 machining centre. 39
Figure 3.4: Fluke 345 Clamp Meter 40
Figure 3.5: ProgRes® microscope workstation 42
Figure 3.6: Leica DM2500M Microscope 43
Figure 3.7: Cutting edge radius measurement under Leica DM2500M Microscope 44
Figure 3.8: Sample flank wear observed under optical microscope 46
Figure 4.1: Machine tool electrical energy consumption estimation model 50
Figure 4.2: Basic and ready states power relationship 60
Figure 4.3: Non-cutting power consumption distribution of the MHP MDSI CNC
Open Lathe machine 61
Figure 4.4: MAC-V2 Takisawa Milling Machine auxiliary units power demand 62
Figure 4.5: Mikron HSM 400 high speed machining, auxiliary units power demand 63
Figure 4.6: Power-Speed Characteristics of a MAC-V2 Takisawa Milling Machine
tool and 3 zones for energy profile 66
Figure 4.7: MAC-V2 Takisawa Milling Machine no load power- spindle
speed characteristic in Zone A to 1500 rpm 67

x
Figure 4.8: MAC-V2 Takisawa Milling Machine no load power- spindle
speed characteristic in Zone B to 5000 rpm 68
Figure 4.9: MAC-V2 Takisawa Milling Machine no load power- spindle
speed characteristic in Zone C to 5500 rpm 69
Figure 4.10: Total Power Consumption Trend for Machining Tool paths 70
Figure 5.1: Key Process variable ranking for power demand in machining of
AISI 1045 steel alloy 88
Figure 5.2: Evaluation of specific cutting energy coefficient at 0.01 mm/tooth
for aluminium AW6082-T6 alloy 91
Figure 5.3: Evaluation of specific cutting energy coefficient at 0.01 mm/tooth for
AISI 1045 steel alloy 91
Figure 5.4: Evaluation of specific cutting energy coefficient at 0.01 mm/tooth
for titanium 6Al-4V alloy 92
Figure 5.5: Evaluation of specific cutting energy coefficient at 0.28 mm/tooth
for aluminium AW6082-T6 alloy 93
Figure 5.6: Evaluation of specific cutting energy coefficient at 0.28 mm/tooth for
AISI 1045 steel alloy 94
Figure 5.7: Evaluation of specific cutting energy coefficient at 0.28 mm/tooth
for titanium 6Al-4V alloy 94
Figure 5.8: Evaluation of specific cutting energy coefficient at 0.55 mm/tooth
for aluminium AW6082-T6 alloy 95
Figure 5.9: Evaluation of specific cutting energy coefficient at 0.55 mm/tooth
for AISI 1045 steel alloy 96
Figure 5.10: Evaluation of specific cutting energy coefficient at 0.55 mm/tooth
for titanium 6Al-4V alloy 96
Figure 5.11: Specific cutting energy model of aluminium AW6082-T6 alloy 98
Figure 5.12: Specific cutting energy model of AISI 1045 steel alloy 98
Figure 5.13: Specific cutting energy model of titanium 6Al-4V alloy 99
Figure 5.14: Specific energy comparison for aluminium AW6082-T6 alloy,
AISI 1045 steel alloy and titanium 6Al-4V alloy 100
Figure 5.15: Specific energy size effect in machining of aluminium AW6082-T6
alloy 102
Figure 5.16: Specific energy size effect in machining of AISI 1045 steel alloy 102

xi
Figure 5.17: Specific energy size effect in machining titanium 6Al-4V alloy 103
Figure 6.1: Determination of specific energy coefficient. 112
Figure 6.2: Specific cutting energy variation with feed per tooth in milling
AISI 1045 steel alloy 113
Figure 6.3: Specific cutting energy variation with un-deformed chip thickness in
milling AISI 1045 steel alloy 114
Figure 6.4: Specific energy comparison for 0.4 mm, 0.8 mm and 1.2 mm nose
radius tools in milling of AISI 1045 116
Figure 6.5: Specific energy demand for dry and flood cutting environment of
AISI 1045 steel alloy 117
Figure 6.6: Optical microscope view of flank wear land 120
Figure 6.7: Specific energy coefficient increases with flank wear during
turning operation of EN8 steel alloy 121
Figure 6.8: Effect of cutting time on k during a turning operation of EN8 steel
alloy 122
Figure 7.1: Effect of un-deformed chip thickness ratio to the cutting edge
radius in orthogonal cutting adapted from [72] 129
Figure 7.2: Power –Material removal rate graph at 18.20 Swept angle 133
Figure 7.3: Power –Material removal rate graph at 25.80 Swept angle 134
Figure 7.4: Power –Material removal rate graph at 31.80 Swept angle 134
Figure 7.5: Power –Material removal rate graph at 36.90 Swept angle 135
Figure 7.6: Power –Material removal rate graph at 41.40 Swept angle 135
Figure 7.7: Optimum swept angle 137
Figure 7.8: Cutter engagement with workpiece. 138
Figure 7.9: Impact of size effect on Specific cutting energy for dry cutting
AISI 1045 steel alloy 143
Figure 7.10: Shear energy estimation of AISI 1045 steel alloy 145
Figure 7.11: Shear energy estimation of aluminium AW6082-T6 alloy 145
Figure 7.12: Shear energy estimation of titanium 6Al-4V alloy 146
Figure 7.13: Ploughing energy variations with process parameter for AISI 1045
steel alloy 149
Figure 8.1: Power-time curve for Stratasys Dimension SST FDM machine
building from room temperature 155

xii
Figure 8.2: Power-time curve for Stratasys Dimension SST FDM machine
building from room temperature 157
Figure 8.3: A simple model fabricated on 3 FDM machines to study energy
demand 159
Figure 8.4: From left Dimension SST FDM, Dentford Inspire D290 and PP3DPP 161
Figure 8.5: Detailed view of low a cost FDM machine model PP3DPP 161
Figure 8.6: Power-time curve for Stratasys Dimension SST machine building
from room temperature. 162
Figure 8.7: Power-time plot for Dentford Inspire D290 machine building
from room temperature 163
Figure 8.8: Power-time plot for PP3DP machine building from room temperature 163
Figure 8.9: Power profile end-milling 9000 mm3 on Mikron HSM 400
Machining centre 166

xiii
List of Tables
Table 3.1: Average cutting edge radius measured under Leica DM2500M
Microscope 44
Table 4.1: Machine tool contribution to electrical energy demand 51
Table 4.2: A summary of other models for direct energy requirements in
machining 53
Table 4.3: A summary of specific energy models in machining 56
Table 4.4: Workpiece type and process parameters 65
Table 4.5: Power and total energy demand estimation of machine
tools under investigation 72
Table 5.1: Global specific energy models found in literature combining both
basic and tip energy 78
Table 5.2: Models of specific cutting pressure 81
Table 5.3: Cutting parameters for milling trials 84
Table 5.4: Cutting tool geometry 85
Table 5.5: Taguchi L9 Experimental Design and Responses 87
Table 5.6: Effect ranking based on Minitab 16 analysis 89
Table 5.7: Experimental values of k at different un-deformed chip thickness h 97
Table 7.1: Cutting tool geometry 132
Table 7.2: Cutting parameters for AISI 1045 steel alloy 133
Table 7.3: Specific energy coefficient data for AISI 1045 steel alloy obtained
from tests 136
Table 7.4: Workpiece materials and cutting parameters for milling trials 141
Table 7.5: Experimental specific energy coefficient values 143
Table 8.1: FDM Machines investigated 160
Table 8.2: Parameters for milling on Mikron HSM 400 Machining centre 165
Table 8.3: Energy benchmarking FDM versus mechanical milling 167

xiv
List of Nomenclature
Notation Description Units
ae Width of cut mm
ap Depth of cut mm
fz Chip load or feed per tooth mm/tooth
h Un-deformed chip thickness µm
hm Minimum chip thickness µm
havg Average un-deformed chip thickness µm
hmax Maximum un-deformed chip thickness µm
rpm Revolutions per minute /min
re Tool edge radius µm
t2, tc, Tm,
tcutting
Cutting time s
Vc Cutting velocity m/min
vf Feed velocity mm/min
α Effective rake angle deg
Ø Swept angle of cut deg
φopt Optimum swept angle deg
Øs Shear angle deg
Q, z Material removal rate mm3/s
P0 Basic power demand W
.
v Material removal rate mm
3/s
k, Esp Specific cutting energy Jmm-3
Ks Specific cutting pressure N/mm2
ke Specific energy Jmm-3

xv
Ke Specific area energy Jmm-2
kAl Specific cutting energy of aluminium AW6082-T6 alloy Jmm-3
ks Specific cutting energy of AISI 1045 steel alloy Jmm-3
kTi Specific cutting energy of titanium 6AL-4V alloy Jmm-3
kt Total specific cutting energy Jmm-3
kf Specific friction energy Jmm-3
kp Specific ploughing energy Jmm-3
ks Specific shearing energy Jmm-3
P1 Constant power W
Pb Basic power demand W
Pr Ready power demand W
Ps Spindle power demand W
p2, pcut, pc Cutting power W
P3 Spindle and table power consumption W
pavg Average total power W
pair Air cutting power W
pm Operating state power of spindle transmission module W
ptool, Ptc Tool change power W
pcool Coolant power W
pi Power of ith-axis of feed motor W
Pva Value adding power demand W
T1 Non-cutting time s
T2 Cycle time s
T3, tms Spindle speed acceleration time s
tb Running time at basic state s
tr Running time at ready state s
∆t Processing time s

xvi
t1 Set up time s
t3, ttc Tool change time s
tfei Feed motor acceleration time s
T Tool life s
tva Value adding process time s
Topt-c Optimum tool-life s
yE Embodied energy per cutting edge of the cutting tool J
E, Etotal Total energy consumption J
Espindle Spindle energy consumption J
Efeed Axis feed energy consumption J
E3, Etool, Etc Tool change energy consumption J
Ecool Coolant pump energy consumption J
Efix Fixed energy consumption J
Eprocess Energy demand of physical process of machine tool J
Eperipheral Energy demand of auxiliary units and to overcome efficiency loses J
E1 Idle cutting J
E2, Etip Cutting energy J
E4 Embodied energy of tool J
E5 Embodied energy of material J
Eb, Ebasic Basic state energy demand J
Er, Eready Ready state energy demand J
em Specific material printing energy Jmm-3
VR Volumetric manufacturing rate mm3/s
α Cutting velocity exponent -
C, β, A, B Constant depending on workpiece and cutting tool geometry -
x Specific energy exponent -
yc Tool cost per cutting edge £

xvii
t3 Tool change time s
Fv Cutting force N
Fp Thrust force N
Vb Horizontal band speed m/s
Vf Vertical feed speed m/s
Lcut Horizontal length of cut m
Achip Chip cross-sectional area m2
η Machine tool efficiency -
b Steady-state specific energy Jmm-3

xviii
List of Abbreviations
Notation Description
APT Automatic programming tool
BAU Business as usual
CAD Computer aided design
CAM Computer aided manufacturing
CED Cumulative energy demand
CES Carbon emission signature
CIRP The International Academy for Production Engineering
CNC Computer numerical control
CO2PE Cooperative effort in process emission
DUKES Digest of United Kingdom energy statistics
EEI Energy efficiency index
EIA Energy information administration
HSS High speed steel
IEA International energy agency
MQL Minimum quantity lubrication
MRR Material removal rate
NC Numerical controls
OEEM Online energy monitoring system
PVD Physical vapour deposition
RPM Revolution per minute
SCE Specific cutting energy
TiN Titanium nitride
TiAlN Titanium Aluminium Nitride

xix
VBA Visual basic application
WC/C Tungsten carbide with carbon
WEO World energy outlook
AISI American Iron and Steel Institute
TiAlCr Titanium aluminium chromide
TiSi Titanium silicate
NaOH Sodium hydroxide

xx
Abstract Rising carbon dioxide emissions present a global grand challenge due to their impact on climate.
Power generation is one of the major sources of CO2 emissions especially when carbon based fuel
such as coal is used. Hence, the electricity that is used in homes and in manufacturing industry has
an environmental burden attributable to CO2 emissions when it was generated at the power stations.
In the UK on average, industry consumed 292 TWh of the electrical energy according to 2012
statistics. The rising cost of electricity in the UK coupled with the demand for eco-friendly
consumer products requires a better understanding of energy demand in manufacture.
In manufacturing, mechanical machining is one of the most widely used processes that consumed
on average 38 TWh. This amounted to 13% of the average UK industrial energy demand and the
reduction of energy intensity in this process is an area of current and urgent focus. In order to
control electrical energy usage in mechanical machining, it is essential to understand electrical
energy demand by machine tools and associated processes. This requires the development of
mathematical models to predict electrical energy demand. The models will support selection of
optimum machining process parameters to reduce direct energy demand and associated carbon
footprint.
Literatures reviewed indicate that energy demand modelling in machining was in its infancy and
the integrity of electrical energy data needed to be significantly improved. In particular a number of
energy studies had ignored the impact of feedrate, cutting velocity, depth of cut and tooling. It was
further observed that where specific energy values were used these were assumed constant
irrespective of the thickness of materials to be removed. The motivation for this research work was
to improve the integrity of electrical energy demand modelling in mechanical machining
addressing current limitations.
Based on electrical energy monitoring in mechanical machining, the energy demand for machining
processes was characterised. Building on the literature review and the concepts of “Basic and Tip”
energy, a new and improved energy model was developed which addressed a number of limitations
and omissions from existing models. The modelling of Tip energy is based on a specific energy and
material removal rate. Having discovered that the impact of chip thickness had not been considered
before in modelling specific energy a follow-on study undertook fundamental modelling of the
specific energy as a function of chip thickness. This led to new generic equations for specific
energy in machining. These models were developed based on machining of 3 common engineering
materials. Furthermore, to raise the practical value of the models and data, the effect of tool wear
on energy demand was studied and this was used to develop an improved understanding of the
evolution of specific energy with tool wear. By linking the cutting mechanism to specific energy,
the use of specific energy coefficients as a surrogate for defining energy efficient machining
conditions was identified and is proposed in this thesis. The impact of machine tools on energy
demand was investigated in a cooperative study between UK and Singapore. This enabled
quantification of the impact of machine tools on energy efficiency and the net result on carbon
dioxide footprint when both machine tool energy demand and national carbon emission signatures
are considered.
The research work provides significant advances in energy demand modelling, presenting new
specific energy data for machining three different workpiece materials and 2 generic and novel
methodologies and equations for (i) energy demand in machining, (ii) the effect of chip thickness
on specific energy. It also for the first time suggests a unique methodology for defining and
benchmarking the energy efficiency of cutting based on specific energy range. The energy models
and data presented in the thesis provide a foundation and possible input for developing software for
energy smart machining. This can be pursued with industrial partners providing a route for
exploitation.

xxi
List of Publications
1. Balogun, V. A., Mativenga, P. T., Modelling of direct energy requirements in
mechanical machining processes, Journal of Cleaner Production, 2013; 41: 179-
186.
2. Balogun, V. A., Aramcharoen, A., Mativenga, P. T., Chuan, S. K., Impact of
Machine Tools on the Direct Energy and Associated Carbon Emissions for a
Standardized NC Toolpath, in: Re-engineering Manufacturing for Sustainability,
Springer, 2013: 197-202.
3. Balogun, V. A., Mativenga, P. T., Impact of un-deformed chip thickness on specific
energy in mechanical machining processes, Journal of Cleaner Production, 2014;
69: 260-268.
4. Balogun, V. A., Kirkwood N. D., Mativenga, P. T., Direct Electrical Energy
Demand in Fused Deposition Modelling, CIRP LCE Norway 2014, accepted for
publication.

xxii
Declaration
No portion of the work referred to in the thesis has been submitted in support of an
application for another degree or qualification of this or any other university or other
institute of learning.

xxiii
Copyright Statements
1. The author of this thesis (including any appendices and/or schedules to this thesis)
owns any copyright in it (the “Copyright”) and the author has given The University
of Manchester certain rights to use such Copyright, including for administrative
purposes.
2. Copies of this thesis, either in full or in extracts and whether in hard or electronic
copy, may be made only in accordance with the Copyright, Designs and patent Act
1988 (as amended) and regulations issued under it or, where appropriate, in
accordance with licensing agreements which the University has from time to time.
This page must form part of any such copies made.
3. The ownership of certain Copyright, patents, designs, trademarks and other
intellectual property (the “Intellectual Property”) and any reproductions of
copyright works in the thesis, for example graphs and tables (“Reproductions”),
which may be described in this thesis, may not be owned by the author and may be
owned by the third parties. Such Intellectual Property and Reproductions the prior
written permissions of the owner(s) of the relevant Intellectual Property Rights
and/or Reproductions
4. Further information on the conditions under which disclosure, publication and
commercialization of this thesis, the Copyright and any Intellectual Property or
Reproductions described in it may take place is available in the University IP
Policy (see:
http://www.campus.manchester.ac.uk/medialibrary/policies/intelectualproperty), in
any relevant thesis restrictions declarations deposited in the University Library, The
University Library’s regulations (see:
http://www.manchester.ac.uk/library/aboutus/regulations) and in The University’s
policy on presentation of thesis.

xxiv
Dedication
To God is the Glory.

xxv
Acknowledgements
My special thanks go to my supervisor Professor Paul Mativenga for his valuable guidance
and support as the research progresses. The progress made so far was due to his
encouragement and support of which without it, the progress would have been hampered.
My thanks are also dedicated to all my friends and colleagues at the University of
Manchester, especially in the School of Mechanical, Aerospace and Civil Engineering
(MACE) for the ongoing support, discussions and debate I had with them. I would like to
also appreciate the efforts of the workshop technicians Richard and Stuart for their
assistance in conducting some of the machining experiments.
Finally, my special thanks to my father the late Mr. Richard Gideon Balogun, my mother
Mrs. Mabel Gilohi Balogun and to all members of my family especially my beloved wife
Mrs. Mabel Ebele Balogun and my children Emmanuel, Theresa, Mary and Peter for all
their unquantifiable and numerous supports. God bless you all in Jesus name. Amen!

1
CHAPTER 1
INTRODUCTION
1.1 Manufacturing Sustainability and Resource efficiency
The United Nations World Commission on Environment and Development defined
sustainable development as a process of meeting the basic needs of all and giving all the
opportunity to satisfy their aspirations for a better and prosperous life [1]. Based on this
definition and as reported in literature [2] sustainable developments can be grouped into
three pillars. The three sustainability pillars are economy, social responsibility and the
environment as illustrated in Figure 1.1.
Figure 1.1: Sustainability Pillars (adapted from) [3]

Chapter 1 Introduction
2
The concentric nature of the circles is important. Figure 1.1 shows that all economic and
social needs should all be met with an environmental sustainability framework. In the same
way the economic activity is there to address and meet society needs. In addition to
providing positive economic and social impact, manufacturing businesses should engage in
activities that positively impact on the ecosystems for example ensuring availability of
fresh water, clean air, productive land and robust biodiversity. Industry should have
comprehensive plans for reducing the negative impact of their production or services on
the environment.
1.2 Global Energy Consumption in Manufacturing
Manufacturing is an industrial production process of tangible goods which entails the input
of raw materials in combination with machines, human resources, energy and output of
products from the synthesis of the inputs. Manufacturing processes have been reported to
be energy intensive and as a result, they have high environmental impact [4]. Dang et al.
[5] reported that manufacturing industries consumed 37% of world total electrical energy
generated in 2006. The Energy Information Administration (EIA) [6] reported that 42.6%
of the world total electrical energy was consumed by the industries in 2011 as depicted in
Figure 1.2. This Figure is an indication of increase of electrical energy consumption trend
within the sector from 1971 to 2011.

Chapter 1 Introduction
3
Figure 1.2: World electricity consumption by sectors [6]
In the United Kingdom UK, Digest of UK Energy Statistics’ (DUKES) [7] reported that in
2012, industry consumed on average 17.9% (292 TWh) of the total energy consumption in
the UK. Energy consumption associated with machine tools and accessories (i.e. metal
products, machinery and equipment) on average accounted for 38 TWh. This amounted to
13% of the average UK industrial energy consumption as shown in Figure 1.3.
Mil
lio
n t
on
nes
of
oil
eq
uiv
ale
nt
Industry

Chapter 1 Introduction
4
Figure 1.3: UK final energy consumption by main industrial groups [7]
It is clear that the manufacturing industries are a significant electrical energy consumer
globally and in the United Kingdom. The World Energy Outlook, WEO-2008 [8],
estimated that without any new policy, world primary energy demand will grow by 1.6%
per year on average in 2006 to 2030 from 11,730 Million tonnes of oil equivalent (Mtoe) to
just over 17,010 Mtoe. This would lead to an energy demand increment of 45% between
2006 and 2030.
The International Energy Agency (IEA) also reported an increasing trend in global energy
demand for 34 countries of the Organization for Economic Co-operation and Development
(OECD) from 1971 to 2011 [6] as shown in Figure 1.4. This analysis included international
aviation and international marine bunkers. These increases have been due to an increase in
demand for tangible and intangible consumer goods and services, and also technological
advancement in the area of product and services development and deliveries. The surge in
0 5 10 15 20 25 30
Other industries
Chemicals
Unclassified
Food, beverages and tobacco
Metal products, machinery and
equipment
Paper, printing and publishing
Iron and steel and non-ferrous metals
Percentage energy demand (%)

Chapter 1 Introduction
5
electrical energy demand was created as a result of increased demands for consumer goods
and services also implies that a proportional increased pressure on electricity generation
and distribution is registered [6].
Figure 1.4: World total energy consumption [6]
The trend of industrial electricity consumption from 1971 to 2011 and as reported in
literature is an increasing one. Since carbon dioxide emission is attributable to electrical
energy consumption and in order that the emission rate is curtailed as proposed by United
Nations Environment Program (UNEP) to meet the sustainability agenda, urgent action is
required at all levels of electrical energy usage in order to help cushion the impact of
electrical energy consumption on the environment.
Mil
lio
n t
on
nes
of
oil
eq
uiv
ale
nt

Chapter 1 Introduction
6
1.3 Energy Demand in Machining processes
In the United Kingdom UK, Digest of UK Energy Statistics’ (DUKES) [7] reported that in
2012, machine tools and accessories (i.e. metal products, machinery and equipment)
consumed on average 38 TWh of electrical energy. This generated on average 16 Million
tonnes of CO2 emitted to the environment in the UK in 2012. Therefore, a reduction of
energy usage in this domain (machining) would reduce the CO2 emission globally and in
the UK.
He et al. [9] reported that the energy efficiency of machine tools is generally less than
30%. This is one of the reasons why machine tools were included by the European Union
EU in the ECO-Design directive [10] to be regulated in terms of its energy consumption
characteristics and efficiency. The aim was for machine tool designers to further
investigate critically how the efficiency of machine tool during the use phase could be
improved in order to reduce and /or optimize electricity consumption. Therefore there is a
need to increase the perceptive and awareness of the energy efficiency improvements for
machine tools.
The development of machine tool has transited through numerous technology and
advancement since the end of the First World War. For example, the improvement from
the use of hydraulics based movement of the machine moving components to more
efficient electrically controlled servos, from gear controlled indexing system to step motors
and more recently, from manually controlled motions to Numerical Control NC codes.
The motorized spindle characteristics of machine tools have also greatly influenced its
efficiency [11]. This motorized system ensures that optimal spindles speeds are selected
especially during turning operations when and if specified within the NC codes.
Improvements such as increased production rate, reduced cycle time and overall

Chapter 1 Introduction
7
production cost optimizations which are enhanced as a result of mass production and
flexible manufacturing systems are some of the advantages derived through technological
development of machine tools. It is worth to note that the technological advancement also
brought about increased electrical energy consumption. These are due to high level of
automation of complex manufacturing processes and the addition of more energy
consuming auxiliary units that have been introduced to modern machining centres. This
addition has greatly affected electricity consumption of machine tools. However, the
introduction of more auxiliary units has brought about great improvement in terms of scrap
rate, process time and product delivery. Since the introduction of more auxiliary units
which now present machine tools with improved manufacturing capability, little has been
done by researchers to investigate the impact of cycle time, high speed machining and
mass production on the electrical energy consumption for these improved processes.
Due to high electrical energy consumption of machine tools, different material
characteristics and process variables, an understanding of the energy demand for the
machining process is therefore required. This energy demand is influenced by machine
tool, cutting tool geometry, workpiece material characteristics, and process variables. The
understanding of the impact of these parameters will elucidate on the optimization of
machining processes and underpin reduction of electrical energy demand and carbon
footprints.
1.4 Aim and Objectives
The aim of this investigation was to develop a deeper understanding and to produce new
data and mathematical models for the electrical energy demand in mechanical machining
processes. The driver was to support energy centric product and process planning.

Chapter 1 Introduction
8
The objectives are as follows:
1. To use event streaming and current monitoring in cutting tests in order to better
understand energy demand in machining processes. Event streaming is a data
gathering method to monitor and record and analyse different actions and/or tasks
that are performed during an operative state of the equipment. An example is using
a power clamp meter to monitor current consumption and to analyse the time series
data and trends to identify distinct machining activities/events.
2. To develop and validate a new model for predicting the electrical energy
requirements in machining processes, explicitly capturing the link between energy
demand and cutting variables of feed rate, speeds and depth of cut.
3. To exploit machining science in modelling and to generate specific energy data for
cutting widely used workpiece materials.
4. To investigate the sensitivity of specific energy and electrical energy demand to the
variation in machining conditions and hence develop robust guidance for electrical
energy demand evaluation.
1.5 Thesis Outline
This thesis is structured into nine chapters based on the research work conducted in the
course of this investigation. The thesis is based on the alternative PhD format. In this
format, research papers are appended to a literature review and conclusions in a coherent
flow.

Chapter 1 Introduction
9
Chapter 1 Introduction
This chapter introduces the background of the study for this research. The broad impact of
the research work was carefully presented from the global perspective and structured in
such a way to defining the aim and objectives of the investigation.
Chapter 2 Literature Review
This chapter provides a critical review of past, present and on-going research work on
electrical energy intensity and estimation methodology in machining processes.
Chapter 3 Research Methodology and Experimental Details
This chapter outlines the methodology of the research, and details of the cutting tests and
evaluation.
Chapter 4 Modelling of direct energy requirements in mechanical machining processes
This chapter focuses on the development of a new mathematical model and logic for
predicting the direct electrical energy requirements in cutting tool paths.
Chapter 5 Impact of Un-Deformed Chip Thickness on Specific Energy in Mechanical
Machining Processes
This chapter is inspired by the mechanistic force modelling and the size effect
phenomenon in machining. The goal was to test the hypothesis that the specific cutting
energy in machining should be dependent on the scale of machining and the thickness of
material to be removed. The chapter focuses on the development of specific energy model
for different workpiece materials and its relationships with the machinability of materials.

Chapter 1 Introduction
10
Chapter 6 Improving the integrity of specific cutting energy coefficients for energy
demand modelling
In this comprehensive study, the evaluation of specific tip energy is undertaken and the
effect of chip thickness, tool wear, nose radius and cutting environment is quantified. This
work is an essential guide for the application of models to estimate energy demand in
practical machining processes.
Chapter 7 Specific Energy Based Evaluation of Machining Efficiency
This chapter discussed the evaluation of the energy efficiency of machining processes
based on specific tip energy and its link to process mechanism.
Chapter 8 Direct electrical energy demand in Fused Deposition Modelling
This chapter focused on the logic for modelling the direct electrical energy demand in
fused deposition. Various additive manufacturing strategies discussed and a case study
where electrical energy demand for 3D modelling was benchmarked to material removal
operation presented.
Chapter 9 Conclusions and Recommendations for Further Work
This chapter summarizes the major findings and conclusions deduced from this research
work and suggest areas for future research.

11
CHAPTER 2
LITERATURE REVIEW
2.1 Energy Demand of Machine Tools
Machining is a mechanical manufacturing process where a thin layer of material is
removed by the relative motion of a cutting tool and a workpiece. The removed material is
called a chip or swarf. The material is removed according to the cutting parameters which
are set to satisfy required dimensional size and accuracy. It is one of the dominant
processes in manufacturing [12-13] by which parts and consumer products are
manufactured directly or indirectly (i.e. to produce moulds and dies for other
manufacturing equipments). The machining of components requires the use of a machine
tool (the main equipment used in the process), a cutting tool (used for material removal
operations) and material to be shaped into the required geometrical tolerances as specified
by the product designer. Machining processes such as milling, turning, shaping, grinding,
gear hobbing etc., have been reported to be energy intensive [14]. This electricity demand
is due to new improvements and additional auxiliary features added to the machine tool
model to improve its performance. For example improved product deliveries (i.e. reduced
cycle time), reduced scrap rate and optimization of process parameters.
Machine tools, machine features and process optimization strategies differ in their
electrical energy consumption, automation levels, complexity and intended use [11]. Initial

Chapter 2 Literature review
12
machine tool improvements were dedicated to reduction of scrap rate and surface finish of
manufactured products. However, the effects of these improvements on electrical energy
demand were not considered during the initial design stages.
The introduction of CNC in machine tools has led to the development and advancement of
flexible manufacturing systems [15]. The CNC mechanism also brought about improved
operational characteristics through advanced machine tool automation and utilization. This
on the one hand contributed to the improvement attained on the surface finish of machined
components, reduced human interaction and errors and scrap rate. It created automated
standalone equipment that can be used in the production line. The added machine features
however, increased the level of electrical energy consumption during the use phase.
The environmental impact and carbon footprint caused by electrical energy consumption
makes machining sustainability agenda a priority and an area of global concern. Issam et
al. [16] investigated cutting of PEEK-CF30 using TiN tools and reported that attention
should be directed towards optimization of process time, electrical energy utilization and
flow of workpiece material. It has been established in literature [17] that significant
improvements in sustainability during machining processes can be obtained by optimizing
process parameters, and adequate characterization of energy consuming units of machine
features [18].
In driving home the sustainability agenda peculiar to machine tools, the International
Standard Organization is developing ISO 14955 1-4 [19] framework based on energy
efficiency index (EEI) and cumulative energy demand (CED) for machine tool design. The
framework anticipates four areas of focus for this standard:
1. ISO 14955-1: Eco-design methodology for machine tools.

Chapter 2 Literature review
13
2. ISO 14955-2: Methods of testing of energy consumption of machine tools and
functional modules.
3. ISO 14955-3: Test pieces/test procedures and parameters for energy consumption
on metal cutting machine tools.
4. ISO 14955-4: Test pieces/test procedures and parameters for energy consumption
on metal forming machine tools.
The functional framework module will allow details of related electrical energy
consumption of machining processes to be investigated and analyzed in a well defined and
structured format. This is to improve the integrity of the electrical energy data collated for
life cycle inventory. However, this framework only addresses the electrical energy demand
of machine tools. The framework does not include for example the computers, fans,
unloaded motors, pumps, servos, etc in the estimation methodology [20-23]. These data
and information are required for an accurate Life Cycle Analysis for manufactured
products.
The Cooperative Effort on Process Emissions in Manufacturing (CO2PE!) methodology
and taxonomy [24-25] is another approach introduced for global standardization of
electrical energy consumption modelling in manufacturing processes proposed by
researchers. This framework developed a joint research methodology, coordinated data
gathering system, systematic data sharing and analysis strategy and output dissemination
strategies. This is initiated to encourage researchers and machine designers to have a global
database whereby electrical energy demand data and process variability for different
machine tools, workpiece material and manufacturing processes are collated and presented
in a format useful for inclusion in Life Cycle Inventory and analysis databases. This will

Chapter 2 Literature review
14
also aid the creation of designs rules and guidelines that will support eco-design and eco-
labelling system of machine tools and machining processes.
Few experimental works have attempted to provide solutions to improving the
methodology and evaluation of the total electrical energy demand in machining processes.
Chapman [26] suggested that studying a particular process in detail is one of the many
ways to evaluating energy usage in a machining process. Therefore, it is paramount to
investigate the factors that govern electrical energy usage of manufacturing process.
From the literature, the evaluation of electrical energy consumption of mechanical
machining processes was categorized into three topics i.e. use phase, specific cutting
energy and online monitoring approach [23, 27-29]. These approaches are discussed in turn
in the successive sections.
2.2 Use Phase energy consumption approach
2.2.1 Direct energy demand
A number of researchers have considered the estimation of energy consumption through
the use phase by disaggregating the energy consuming units of machine tools systems [14,
30-31]. It was reported that the energy demand for actual material removing processes is
considerably lower than that consumed by the equipment during the machining operation.
[32]. For example, Gutowski et al. and Dahmus and Gutowski [14, 31] evaluated the
energy demand of a Toyota automobile production line. In the analysis, the idle stages
dominated the electrical energy consumption. It was reported that 85.2% of the total
energy consumed was used up by the auxiliary units of the machine tools. The actual
cutting process consumed 14.8%. The authors reported that there is significant energy
demand at start-up and to maintain the equipment in an operational mode. The additional

Chapter 2 Literature review
15
energy demand for cutting is proportional to the quantity of material being processed. This
is shown in Figures 2.1 and is modelled in Equation 2.1.
Figure 2.1: Energy used as a function of production rate for an automobile production
machining line adapted from Gutowski et al. [14]
(2.1)
where E is the total energy consumed in J, Po is the idle power (or Basic Power according
to COP2E methodology) in W, k represents the specific cutting energy of the material in
Jmm-3
, material removal rate in mm3/s and t is the cutting time in s.
Behrendt et al. [33], after a survey of 232 machine tools, proposed three assessment
methods for estimating the energy demand of machining operations i.e. idle mode,
operational sequences, and machining operations. In their analysis, they reported that
machine tools standby power varied significantly across different classes and brand of

Chapter 2 Literature review
16
machines available and most importantly, increased with complexity of machine tool. For
example, small and complex 5-axis NMV1500 vertical milling machines, has a standby
power that is almost 2 kW above the medium-sized Haas VF-0 machine. Furthermore, the
cutting energy Ecut, which is given as a percentage of total energy demand, varies between
2% and 20%. This range agreed with Gutowski et al. [14] model previously reported.
Gutowski et al.’s [14] work is a fundamental contribution to the understanding of energy
intensity in machining processes and a great contribution to machining science however,
further investigations is required to categorize and model the energy consuming auxiliary
functions. This addition would allow the basic energy demand at the primary levels and
when the equipment is within the no-cutting zone to be exclusively modelled. This would
also enable a comprehensive process-centric energy estimation model to be developed.
Categorizing the machine tools at this level will aid the estimation of the total energy
demand for machining a given component. Also, the machinability criterion of workpiece
material, which also is one of the parameters that determines the energy demand of
machining a workpiece, needs to be properly modelled.
The energy demand by the auxiliary units and at no-cutting stages was further analyzed by
Mori et al. [34] who modelled the total power consumption during the manufacturing
processes with respect to time. The power consumption was measured while changing
cutting conditions for drilling, end milling and face milling operations on machining
centres. The Taguchi method with an L9 orthogonal array design of experiment was
employed for the analysis. The cutting speed (varied between 50 to 130 m/min), feed rate
(0.20 to 0.35 mm/rev), axial (5 to 15 mm) and the radial depth of cut (0.5 to 1.5 mm) were
among the machining parameters investigated on S45C carbon steel workpiece material.
The cutting tools were multi-layer 10 mm diameter drill coated with TiAlCr + TiSi, with a

Chapter 2 Literature review
17
point angle of 135o and a helix angle of 30
o, for end milling, a 10 mm diameter two-fluted
carbide end mill, multi-layer coated with TiAlCr + TiSi, and for face milling, an 80 mm
diameter face mill with carbide alloy inserts, multi-layer coated with TiAl-N + AlCrN.
From their work, several processes for example, positioning and acceleration of the spindle
following a tool change, actual cutting operation, returning the spindle to the tool change
position after machining, and stopping the spindle were among those investigated. These
stages have great impact on the basic energy demand of machine tools before, during and
after the machining operations. The authors proposed a model based on the processes
investigated and the resultant energy model is shown in Equation 2.2.
(2.2)
where, E is the total energy demand in J, P1 in W is the constant power demand during the
machine operation regardless of the running state, T1 (in s) is the cycle time during non-
cutting state, T2 (in s) is the cycle time during cutting state, P2 (in W) is the power
consumption for cutting by the spindle and servo motor, which fluctuates with cutting
conditions, P3 (in W) is the power consumption to position the workpiece and to
accelerate/decelerate the spindle to the specified speed, and T3 (in s) is the time required to
accelerate the spindle.
The constant power, P1 could vary depending on machine tools and types of auxiliary units
designed to perform auxiliary functions before, during or after the machining process. In
the model proposed (Equation 2.2) the impact of the workpiece materials and process
parameters were ignored for example, the specific cutting energy (tool-tip energy) depicted
as k by [14, 31] and Equation 1 was ignored. The specific cutting energy affects the total
energy demanded for the actual cutting process.

Chapter 2 Literature review
18
In the analysis of Avram and Xirouchakis [35], the relationship between energy
consumption of machine tool state, the transient state and fixed energy consumption of the
peripheral units were established through the use of an automatic programming tool (APT)
file which can be generated by CAD/CAM software. The software called GREEM –
Global Reasoning for Eco-Evaluation of Machining was based on Visual Basic for
Application (VBA). With this software, a methodology was developed for the estimation
of the variable energy requirements of machine tool system through machining toolpath.
The methodology involves the reading and interpretation of an APT file from CAD/CAM
software, estimations of the cutting forces based on process parameters and cutter
geometry, estimating the electric motors load and finally, the variable mechanical power
requirements and the fixed power derived from measurements. All values are then
integrated with respect to the processing time into the software which then provides an
overall estimation of the energy required by the entire machine tool system to complete the
machining of component. This work is an additional contribution to understanding energy
demand of machining processes through APT file generated from CAD/CAM software
however, there were still no distinguishable energy characteristics of various units of the
machining system that will adequately account for the total energy demand and also, the
machinability characteristics of workpiece materials are not modelled explicitly.
He et al. [36] investigated the energy consumption for numerical control machining and
presented a model based on tool path criteria. The authors reported that since machine tool
and features can be controlled through the NC codes, it is therefore possible to estimate
their energy consumption using the related codes that governs the relative movement of
machine features in order to perform specified operations. They approached the energy
estimation based on the linear interpolation of Numerical Codes (NC). In their paper, the

Chapter 2 Literature review
19
general understanding of energy classifications i.e. fixed part and a variable part [37] was
adopted. The fixed and/or constant energy consumption during machining processes
represents that required by the auxiliary features and servos system. This energy demand
ensures and keeps the machine in the running mode. The variable part is required for the
actual machining operations. He et al. [36] presented an energy estimation model as in
Equation 2.3. This model was based on a milling test of C45 steel alloy conducted on
PL700 machining centre at a spindle speed of 2000 RPM, feed of 1500 mm/min and a
depth of cut of 0.2 mm and under the programmed NC codes, the energy consumption of
each machine unit and the machining process was measured by power measurement
devices separately and the result is as shown in Figure 2.2.
Figure 2.2: Energy consumption of the machining process on PL700 machining centre
[36].

Chapter 2 Literature review
20
From Figure 2.2, the fix energy Efix i.e. fan motors and servos accounted for 49% of total
energy consumption; 25% by coolant motor Ecool, unloaded spindle motor Em 13%, cutting
energy Ec 8% and unloaded axis feed motors Efeed 5%. The authors reported that total
energy consumption can be grouped into two parts: constant energy consumption i.e. Efix,
Ecool, Em and Efeed which is the energy demand of idle states and the variable energy
consumption i.e. Ec which is related to the cutting power. The constant energy
consumption depends on machine tool and the installed technology system. The variable
part which is influenced by cutting parameters has the potential to be optimized through
engaging the optimal values of cutting variables for the cutting process. The proposed total
energy estimation model is as shown in Equation 2.3.
(2.3)
where Etotal is the total energy consumption of NC machining, Espindle, Efeed, Etool, Ecool and
Efix are the energy consumption of spindle, axis feed, tool change system, coolant pump,
and the fixed energy consumption respectively.
The model however does not include the start-up energy demand which in most cases is
not negligible. Also, associating the cutting energy with the energy consumed by the
machine tool spindle and called Espindle does not clarify impact of cutting variables. The
electrical energy demand of the spindle and the specific cutting energy should be modelled
separately to capture spindle energy demand characteristics as influenced by spindle and its
drive motors. The specific cutting energy is a function of the spindle-speed characteristic,
workpiece material and the cutting tool geometry. The specific cutting energy is co-related
to the process variables employed during the machining processes and cannot just be
restricted only to the energy demand of the spindle. Also, He et al’s., model ignored other

Chapter 2 Literature review
21
machine auxiliary features, for example fans, computers, chillers; etc. which cannot be
ignored hence, the proposed model requires further improvements and modifications.
Hu et al. [38] reported that the energy required for actual machining is a function of the
machine tool spindle states i.e. start-up, idle and cutting states. They classified total energy
demand into constant energy obtained during the non-machining state and variable energy
obtained at the machining energy state.
Jingxiang et al. [39] proposed a methodology to model the energy demand of CNC
machine tools based on Therbligs (i.e. a set of fundamental motions required for machine
tool to perform an operation). In their study, they established energy supply models of
CNC machine tools by developing the power models of each machine tool Therblig and
obtained the total energy demand for the machining process through summation of each
power of Therblig (i.e. standby operation, lighting, axis feeding cutting, etc). This method
of energy estimation for machining processes could take lot of time for production
planning and process optimization because more data are required to be collated. The
process and product planners require a simple, easy to use methodology to estimate energy
demand.
Salonitis and Ball [40] reported that having an energy audit at the process level can be one
of the ways to characterize energy demand for machine tools subsystems. In their analysis
for grinding operations, they reported that the total energy required by a machine tool to
perform specific process can be estimated using Equation 2.4.
peripheralprocesstotal EEE (2.4)
where Eprocess is the energy required for the physical process to occur and Eperipherals
represents additional energy consumed by the machine tool (e.g. for operating the coolant

Chapter 2 Literature review
22
pump, for overcoming the efficiency losses, etc.). The authors reported that the energy
required for physical process Eprocess depends on the mechanics of the cutting process and
thus can be estimated from the specific cutting energy. The electrical energy consuming
units of the machine tool were lumped into and included in the Eperipheral as modelled in
Equation 2.4. This clearly ignores need for disaggregating energy consuming auxiliary
units to enable modelling of different machine designs.
Seow and Rahimifard [41] categorized energy consumption in the manufacturing sector
into direct and indirect energy. The direct energy is the energy demand during the
manufacturing processes while the indirect is the energy demand to maintain the
environment in which the processes are executed. The direct energy was sub-divided into
theoretical energy (as the minimum energy required carrying out the machining process)
and auxiliary energy (as the energy demand of the supporting activities and auxiliary
equipments). Seow and Rahimifard’s [41] work is a theoretical representation of energy
utilization and is not in line with ISO 14955 [19] or the ‘Basic’ and ‘Tip’ energy concept.
The authors do not disaggregate energy consuming units into the proposed categories in
order to distinctly represents the basic and tip energy concepts.
2.2.2 Energy footprint- Direct and embodied energy
To optimize the total direct and indirect electrical energy associated with a machining
process based on minimum energy and optimization criterion, Mativenga and Rajemi [29,
42] analyzed the energy footprint in machining a given product. They considered the direct
energy demand and the energy embodied in tooling. The model to estimate the total energy
footprint in a single pass turning operation proposed by the authors is as shown in Equation
2.4.
(2.4)

Chapter 2 Literature review
23
where E1 is the energy consumed by the machine during setup operation (Idle energy), E2
the cutting energy, E3 the tool change energy, E4 is the embodied energy of the tool and E5
the embodied energy of the material.
This model is expanded into Equation 2.5.
(2.5)
where t1 is machine setup time in s, t3 is tool change time in s, T is the tool-life in s and yE
represent the embodied energy per cutting edge of the cutting tool in J. Other parameters
retain their initial definitions.
They evaluated an optimum tool life for minimum energy demand that can be used to
constrain cutting velocity and this is modelled by Equation 2.6.
(2.6)
where Topt-c is the optimum tool-life in minutes, α is the cutting velocity exponent, yc is the
tool cost per cutting edge, x is the machine cost rate and t3 is the tool change time in
minutes.
In order to estimate energy demand during the actual cutting process i.e. ‘Tip energy’, the
specific cutting energy k was assumed constant.
2.3 Specific cutting energy approach
Few researchers modelled the total energy demand in machining using the specific cutting
energy approach. The specific cutting energy is the tool-tip energy demand to remove 1
cm3 of material. The specific cutting energy is process dependent and thus has a correlation
with the machinability of materials. Its values have been assumed constant in the models
found in literature [12, 31].

Chapter 2 Literature review
24
In this approach, the relationships between the power demanded during the machining
operations and the material removal rate are statistically evaluated and the resultant
relation is called the specific cutting energy. This relationship normalizes the effect of
power demand with the material removal rates.
Following this methodology, Sarwar et al. [43], in their analysis with three different
workpiece materials (ball bearing steel, stainless steel and Ni-Cr-Mo steel), and a bimetal
band saw cutting tool (High Speed Steel [HSS] edge and low alloy steel backing material)
under vertical feed band saw machine (NC-controlled, Behringer HBP650/850A/CNC)
showed the relationships that existed between specific cutting energy and process
variables. Their specific energy model is as presented in Equation 2.7.
(2.7)
where Esp is specific cutting energy in J/m3, Tm is the time required for cutting in s, Fv is
the cutting force in N, Fp is the thrust force in N, Vb is the horizontal band speed in m/s, Vf
is the vertical feed speed in m/s, Lcut is the horizontal length of cut in m and Achip is the chip
cross-sectional area in m2.
The authors showed that the specific cutting energy increases as the number of cuts
increases and also as the cutting tool width deteriorated. Though they did not model tool
wear, it can be inferred here that their results suggest a link between specific energy and
tool wear. It was reported that the variation of specific cutting energy as a function of
different workpiece materials can provide useful information in estimating machinability
characteristics for selected workpieces. The specific cutting energy can be a function that
reflects the efficiency of metal sawing process.
Chapter 2 Literature review
25
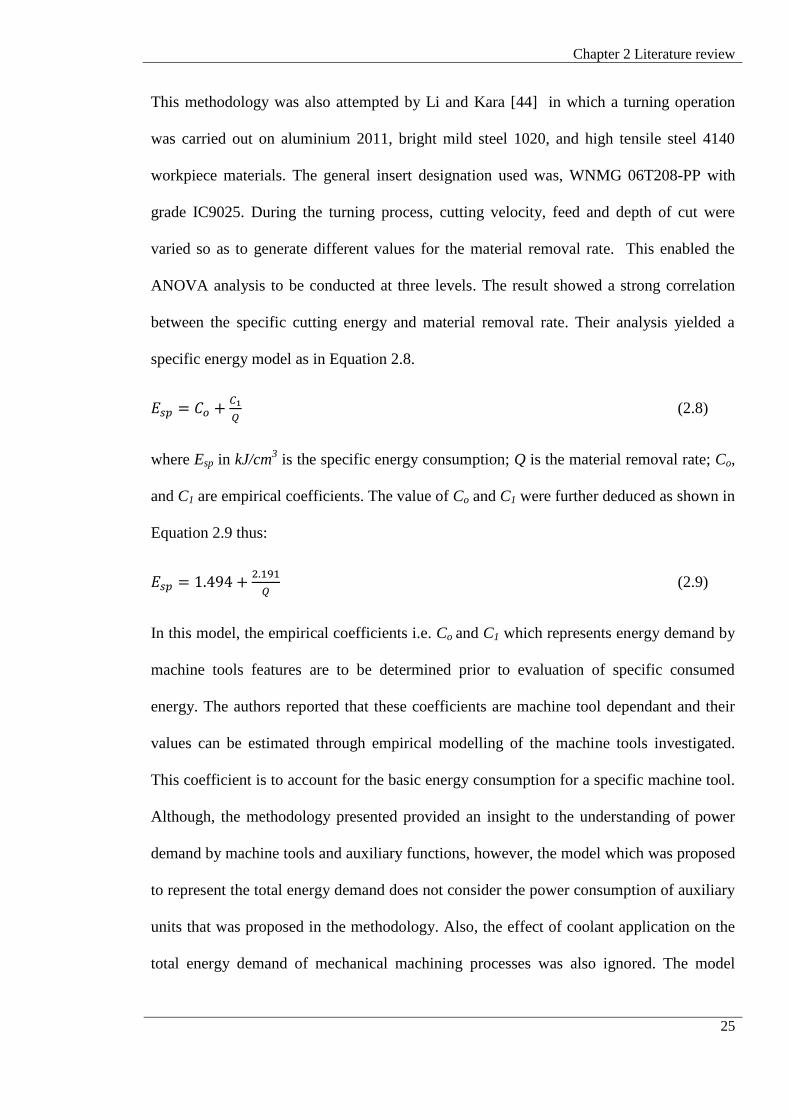
This methodology was also attempted by Li and Kara [44] in which a turning operation
was carried out on aluminium 2011, bright mild steel 1020, and high tensile steel 4140
workpiece materials. The general insert designation used was, WNMG 06T208-PP with
grade IC9025. During the turning process, cutting velocity, feed and depth of cut were
varied so as to generate different values for the material removal rate. This enabled the
ANOVA analysis to be conducted at three levels. The result showed a strong correlation
between the specific cutting energy and material removal rate. Their analysis yielded a
specific energy model as in Equation 2.8.
(2.8)
where Esp in kJ/cm3 is the specific energy consumption; Q is the material removal rate; Co,
and C1 are empirical coefficients. The value of Co and C1 were further deduced as shown in
Equation 2.9 thus:
(2.9)
In this model, the empirical coefficients i.e. Co and C1 which represents energy demand by
machine tools features are to be determined prior to evaluation of specific consumed
energy. The authors reported that these coefficients are machine tool dependant and their
values can be estimated through empirical modelling of the machine tools investigated.
This coefficient is to account for the basic energy consumption for a specific machine tool.
Although, the methodology presented provided an insight to the understanding of power
demand by machine tools and auxiliary functions, however, the model which was proposed
to represent the total energy demand does not consider the power consumption of auxiliary
units that was proposed in the methodology. Also, the effect of coolant application on the
total energy demand of mechanical machining processes was also ignored. The model

Chapter 2 Literature review
26
therefore, cannot be used to estimate the total energy demand for the machine tool which
theoretically should include energy demand by all auxiliary functions, servos, pumps,
lights, fans, air cutting and other energy consuming units. The model also does not
represent the tool tip energy demand since it failed to consider the impact of chip
thickness. The tool tip energy demand is influenced by the un-deformed chip thickness and
process variables. The authors do not consider the impact of un-deformed chip thicknesses
on the specific cutting energy demand model. The specific energy model proposed hid the
effect of process variables and workpiece materials.
In another development, Draganescu et al. [45] attributed the specific cutting energy to
machine tool efficiency. It was evaluated as a ratio of cutting power, Pc, efficiency, η, and
material removal rate, Q as shown in Equation 2.10. In their analysis on a vertical milling
machine FV-32 and a design of experiment that used a 26 composite factorial experimental
design, they carried out a face milling test on aluminium alloy ATSi10Mg and a
relationship was established between specific consumed energy, cutting power, machine
tool efficiency and material removal rate. These relationships are all influenced by cutting
parameters and tool cutting capacity. The analysis also showed that feed has a greater
influence during milling operations on the specific consumed energy especially at values
smaller than 0.1 mm/tooth. This effect is known to be ‘size effect’ in micro-machining.
(2.10)
The authors also proposed that the consumed energy Ec can be estimated as the product of
specific consumed energy Esp and material removal rate Q as depicted in Equation 2.10b.
(2.10b)

Chapter 2 Literature review
27
The machine tool efficiency is an important factor that determines mathematical models
for electric energy consumption since the input variables that yields an output i.e. finished
product are governed by the efficiency of the equipment at use. The efficiency is the ratio
of cutting power, Pc, and consumed power, Pmc, absorbed from power network by the
electric motor [45]. Based on these relationships, it was also observed that feed (the un-
deformed chip thickness) is one of the parameters that relates with the efficiency of the
machine tool and as such, influences specific cutting energy as it varies with process rate.
Their model did not separate the Basic energy from the tip energy. Specific energy
calculated from total energy does not reflect machinability of materials. Its value is
influenced by machine design. Specific energy calculated from tip energy will be a
measure of machinability of materials.
Diaz et al. [46] also modelled energy consumption using the specific cutting energy
approach. Their analysis involves the variations of process parameters that determine the
material removal rate (Q). Cutting tests was conducted on a Mori Seiki NV1500 DCG. The
power demand was measured with a watt node MODBUS Wattmeter. In order to have
different values for material removal rate Q, the width and depth of cut were varied in two
separate experiments and their corresponding power demand measured. The milling test
was conducted with 2-flute uncoated carbide, 2- flute TiN coated carbide and 4- flute TiN
coated carbide end mills. The workpiece material was AISI 1018 steel and 101 mm long. It
was shown that as the material removal rate increases, the power demand also increases
while the energy demanded reduces. This is due to the fact that machining time reduces
with increased material removal rate for a given length of material. In characterizing the
energy consumption of a machine tool, the authors reported that as the material removal
rate approaches infinity the specific energy is expected to reach a steady state of zero. In

Chapter 2 Literature review
28
cutting, friction, rubbing and ploughing always exist and hence zero energy is not a
possible outcome. However, given the work volume, spindle speed, and table feed
constraints of a machine tool as well as the maximum loads that can be applied without
deforming the main body frame or breaking the spindle motor, the operator will never
reach a material removal rate anywhere near infinity. So under the constraints of the
material removal rate the relationship produces a regression equation as depicted in
Equation 2.11. They concluded that the total energy demand can be estimated by
multiplying the specific energy with Q.
(2.11)
where Esp is the specific cutting energy, k is a constant and has units of power and b
represents the steady-state specific energy.
Although, in their report, the need to include the air cutting and power demand of the
machine tool was mentioned, this was not incorporated into the developed model.
In one of the earliest work, Lucca and Seo and Arsecularatne [47-48], it was reported that
tool tip energy demand i.e. specific cutting energy can be influenced by the un-deformed
chip thickness, cutting edge radius and process variables. Although, not investigated, the
authors reported the impact of ploughing on determining the process mechanism and tip
energy. This phenomenon was also supported by Ghosh et al. [49], Pawade et al. [50] and
Guo et al. [51]. These works directly and/or indirectly contribute to the understanding of
specific cutting energy and process mechanisms; directly in the sense that they reported
that higher specific energy values relates to an increase of ploughing effect. However, the
methodology presented does not model this phenomenon explicitly. Up-to-date, the
specific cutting energy model found in literature does not incorporate un-deformed chip
thickness and process mechanisms into proposed specific energy models. Also, the models

Chapter 2 Literature review
29
does not consider the fact that specific cutting energy could vary depending on cutting
parameters, tool geometry and process mechanism at play during the cutting process.
Hence the need for more understanding of the process mechanisms that governs
mechanical machining processes and re-evaluation of specific cutting energy models found
in literature.
2.4 Online monitoring approach
In this approach, energy demand of the manufacturing processes is monitored and
measured in a real time event through the use of sensor devices or software applications
commonly used for online measurement. Teti et al. [52] and Shi and Gindy [53] developed
a PXI-based online machining process monitoring system. This system was developed in
LabVIEW environment and was used to acquire, present and analyze sensory signals
automatically through the use of advanced queue and triggering technique. The developed
online machining process monitoring system was validated on a Swedturn 4-axes CNC
twin lathe when turning Inconel 718 disc. Ceramic insert RCGX 35T-0320 with constant
tool edge preparation (clearance angle 1° and rake angle 13°) and different tooling
conditions were employed to conduct turning trials. The result indicated that the
monitoring system could be used to monitor cutting forces, power, vibrations and tool wear
in real time during the turning operations.
Vijayaraghavan and Dornfeld [22] investigated the energy requirement of machine tools
and their effect on the overall Life cycle and power consumption through system
monitoring and data analysis software. The authors proposed a software-based approach
for automated energy reasoning which can support decision making at all levels. The
software architecture included the ability to monitor energy use with process data,

Chapter 2 Literature review
30
standardized data sources, architecture for large data volumes and ability to analyze data
across different manufacturing platforms as shown in Figure 2.3.
Figure 2.3: Software architecture for temporal analysis of energy used in manufacturing
adapted from Vijayaraghavan and Dornfeld [22].
The software utilizes “Complex Event Processing (CEP)” which handle data reasoning and
information processing. “MTConnect” interface was used to link data from the machine
tool and /or other manufacturing equipment to the “Event Cloud” for information
processing and strategic decision making. MTConnect is based on “eXtensible Markup
Language (XML)”, which provides semi-structured and machine readable data for
exchange [54], process planning and process optimization during the manufacturing
operations. MTConnectSM
, allows operational data of manufacturing equipment for

Chapter 2 Literature review
31
example machine tool to be monitored with respect to energy consumption data. This could
enhance process planning and environmental impact assessment reporting. The software
can monitor and stream events as at when these actions take place. It might be complex to
disaggregate energy consuming units from the total energy demand as only the highs and
the lows of energy consumption of a process are streamed to the event cloud. Also, the
machining theory and impact of process variables cannot be understood since the software
is only used to gather direct energy data during the machining process and estimate the
averages of the total energy demand as output. This does not allow intelligent process
planning before machining.
Hu et al. [38] proposed an on-line approach to monitor the energy efficiency of machine
tools and developed an architecture for the on-line energy monitoring system (OEEM
system). The OEEM system can accurately acquire energy and some other useful energy
efficiency-related information of machine tools and can therefore be used to estimate the
total energy demand. The proposed OEEM system shown in Figure 2.4 is the combination
of spindle power measurement and off-line constant energy consumption measurement.

Chapter 2 Literature review
32
Figure 2.4: Architecture of OEEM system adapted from Hu et al. [38].
The authors reported that the energy estimation with OEEM system involves acquiring the
constant energy consumption in a non-machining state, the variable energy consumption in
a machining state and exportation and visualization of the data related to energy efficiency.
This approach by Hu et al. [38] is a great addition to various ways developed by
researchers in understanding energy intensity of machining processes however, the
proposed methodology is not appropriate during the pre-machining process planning as
data will not have been collated.
In a similar work, He et al. [9] presented a task-oriented modelling method for machining
simulated using event graph on Matlab software. It was reported that in estimating the
energy demand of a process, the operations within the process can be categorized into
event blocks as shown in Figure 2.5. The authors modelled machining system tasks into
three events i.e. start machining, end machining and idle/waiting. In their analysis it was
proposed that a task based simulation can present alternative machining strategy that could
lead to energy saving potentials and sustainable manufacture. This method will aid

Chapter 2 Literature review
33
estimation of total energy demand in machining processes based on executed tasks and can
aid process managers make optimum decisions on selecting the flexible processes of tasks
to meet actual production requirements and save energy. However, other machine tool
features are not properly decomposed into machining phase and sub-phases to model in
more detail energy consumption for tasks proposed.
Figure 2.5: Basic event graph model for an energy consumption cycle adapted from He et
al. [9]
Other researchers also attempted to characterize the energy intensity in machining
processes and their reported methodology does not categorically fit within the three groups
found in literature. De Filippi et al. [55] presented NC machine tools as electric energy
tatp
tpis the processing time of task on machine tool (s)
tais the time interval waiting for the next task on machine tool (s)
Chapter 2 Literature review
34
users. Helu et al. [56] reported on an evaluation of the relationship between use phase
environmental impacts and manufacturing process precision. Behrendt et al. [33]
developed an energy consumption monitoring procedure for machine tools. Li et al. [57]
investigated the fixed energy consumption of machine tools and attempted using the
empirical methodology to estimate the total energy demand. Although their contributions
was an addition to knowledge of energy requirement for machine tools, the respective
energy models presented are not a standalone energy model where energy demand can be
estimated pre- production for process planning.
From the literature review, the following knowledge gaps and facts were established:
Electrical energy demand in mechanical machining can be modelled based on
‘Basic’ and ‘Tip’ energy. The ‘Basic’ energy is the energy demanded by a machine
tool at zero load while the ‘Tip’ energy is the additional energy required for
material removal.
‘Basic’ energy is greater than the ‘Tip’ energy and dominates total electrical energy
demand in mechanical machining processes.
While a limited number of researchers have evaluated the specific energy, they
have grouped all variables together and not captured the effect of differences in
workpiece materials. This is required so that users can tailor model to material
being cut.
Existing models for electrical energy demand are not comprehensive and most do
not capture effect of cutting variables or preparatory states.
It has been assumed that specific energy is constant and not influenced by thickness
of material been cut. This assumption needs to be tested.

Chapter 2 Literature review
35
The impact of process mechanisms on specific cutting energy has not been
comprehensively researched. The specific cutting energy varies with changing tool
geometry, workpiece material and cutting parameters during mechanical machining
operations.
The machinability characteristics of workpiece materials has not brought into the
context of modelling specific cutting energy during the machining process.

36
CHAPTER 3
EXPERIMENTAL DETAILS
3.1 Introduction
In order to address the knowledge gaps identified, a series of cutting tests were conducted
on different machine tools. This was done to define a strategy to estimate electrical energy
demand for machining processes.
In this section, the machine tools, measuring equipments, cutting tools and workpiece
materials used in the course of this study are introduced.
3.2 Machine tool
The focus of this research was the electrical energy demand when machining engineering
materials. For this purpose, an MHP lathe, Takisawa milling machine and Mikron HSM
400 high speed machining centre were used for the cutting tests.
3.2.1 The MHP lathe
The MHP lathe shown in Figure 3.1 is one of the commercially available CNC lathe. The
machine spindle is controlled by an 18 kW DC Servo Motor while the x and z axes are
controlled by 1.1 kW and 1.8 kW DC Servo Motor respectively. The rapid positioning of
the machine axis is constrained to 5 m/min along the x-axis and 10 m/min along the z-axis.
The machine has 450 mm swing over bed and 250 mm turning diameter between centres.

Chapter 3 Experimental Details
37
The turret controlled tool positions have 12 stations and it takes 1.2 seconds to index from
station to station (bi-directional). The machine uses the capability of an MDSI open
architecture controller as the post processor to interact and coordinate the CAD-CAM
application and machine tool units.
Figure 3.1: MHP Lathe
3.2.2 Takisawa milling machine
The Takisawa MAC-V2 is a multi-purpose vertical-type machining centre designed to
manufacture small parts by combining operations such as milling, end milling, drilling,
tapping and boring in one process set up. The machine is controlled by an AC 5.5 kW/ 30-
min rating main motor, the x, y and z feed motors provide 0.85, 0.85 and 1.2 kW
maximum power respectively. The machine is controlled by 3 axes movement i.e. x, y and
z axis. The machine table can travel 510 mm by 400 mm along the X-Y direction and the

Chapter 3 Experimental Details
38
spindle can traverse 300 mm along z axis. The rapid traverse feeds on the x and y axis is
12,000 mm/min and z axis is 10,000 mm/min. The machine post processor is controlled by
the capability of an MDSI open architecture controller to interact and coordinate the CAD-
CAM application and machine tool features. The Takisawa MAC-V2 is shown in Figure
3.2.
Figure 3.2: Takisawa Milling Machine

Chapter 3 Experimental Details
39
3.2.3 Mikron HSM 400 high speed machining centre
The Mikron HSM 400 high speed machining centre shown in Figure 3.3 has a maximum
spindle power of 10 kW. The spindle, HVC140-SB-10-15/42-3F-HSK-E40 is equipped
with ceramic hybrid bearings lubricated by a means of oil-air lubrication system. The
spindle speed ranges from 60 RPM to 42000 RPM. This speed range enables different
workpiece materials to be machined under conventional and high cutting speed. The
CAD/CAM system is linked to the post processor of the machine. The machine controller
is controlled by Heidenhain iTNC 530 controller. This enables the machine tool to interact
between the NC codes and machine features. The precision machine has feedback
mechanisms that engage a probe to measure tool dimensions. The tool magazine can hold
up to 18 tools.
Figure 3.3: Mikron HSM 400 machining centre.

Chapter 3 Experimental Details
40
3.3 Measuring Equipments
3.3.1 Fluke 345 Clamp meter
Fluke 345 has in-built functions for current, voltage, frequency and power measurement
both for single and 3-phase voltage input. An Oscilloscope and Data Logger incorporated
into the hand-held tool allows both online monitoring and data acquisitions to be possible.
The equipment has a capability to measure and record True-rms ac and dc current up to
2000 A. The Fluke 345 clamp meter is shown in Figure 3.4. It is equipped with a low-pass
filter to remove high frequency noise and used to troubleshoot power quality on switching
loads. The power measurement is based on the Hall Effect (variation of output voltage in
response to a magnetic field) characteristics. This makes measurement of DC current
possible without the need to break the circuit. The internal memory of the power clamp
meter enables long-term power quality logging. With 3 logging areas, the recorded data
can be saved and transferred to a computer.
Figure 3.4: Fluke 345 Clamp Meter

Chapter 3 Experimental Details
41
3.3.2 ProgRes® microscope camera
This ProgRes® microscope was used to visualize and measure cutting tool flank wear. The
ProgRes® microscope camera is a reliable and powerful digital microscope camera used
for image analysis and documentation. It is controlled by 3.3 Megapixel SONY Super HAD
CCD sensors with RGB colour mask and micro lenses. The sensors are active within an
area of 7.2 x 5.3 mm2 and at an exposure time of 0.2 micro seconds to 180 seconds. The
photographic image of samples is made visible through software called ProgRes™ Capture
Basic for MS Windows® 2000/XP installed on a computer workstation as shown in Figure
3.5. The microscope has a power consumption of 4 W and work table distance of 145 x 93
x 123 mm. The operating temperature conditions ranges from 5oC to 35
oC. This minimises
the effect of expansion and compression on the physical properties of the equipment.
To assess the microscopy view of sample surfaces, the sample is placed on the work table
and fully focused with the laser beam emitted onto the work sample. The image is then
projected to the computer system where it can be analyzed, measured and documented.

Chapter 3 Experimental Details
42
Figure 3.5: ProgRes® microscope workstation
3.3.3 Leica DM2500M Microscope
The Leica DM2500M Microscope shown in Figure 3.6 is designed to deliver pin-sharp
image quality during material analysis. This was used for imaging the cutting tool. It has
an input voltage of 90-250V with a frequency range of 50 -606 Hz. The pre installed power
input of 160 W is controlled by a F3, 15A and 250V fuses. The working temperature is
between 15-35oC ambient temperatures under a relative humidity of 30 to 80% maximum.
The sample under investigation is mounted on the specimen stage with the specimen
holder and could be magnified by 1X, 1.5X and 2X respectively depending on the
magnification desired to give a clearer image of the specimen.

Chapter 3 Experimental Details
43
Figure 3.6: Leica DM2500M Microscope
The cutting tool edge radius was visualized and estimated under the Leica DM2500M
Microscope. The values of the average cutting edge radius employed for this work ranges
from 60 µm to 70 µm as shown in Table 3.1. The edge radius was measured by inserting a
best fit circle that intersects the tangential line drawn across the rake and flank faces of the
insert. The dimension of the circle (i.e. cutting edge radius) was automatically evaluated by
the microscope as shown in Figure 3.7.

Chapter 3 Experimental Details
44
Figure 3.7: Cutting edge radius measurement under Leica DM2500M Microscope
Table 3.1: Average cutting edge radius measured under Leica DM2500M Microscope
Insert
Nomenclature
Measured tool edge radius
(µm) Average
(µm) 1 2 3
SOMT-
060204-HQ 56.8 62.5 59.6 59.6
HM90 APKT
1003 68.7 69.5 72.2 70.1
3.4 Workpiece materials
Cutting tests were conducted on stainless steel T316L, EN8 steel alloy, AISI 1045 steel
alloy, aluminium AW6082-T6 alloy and titanium 6Al-4V alloy. The workpiece materials
were selected based on their wide engineering applications, for example stainless steel

Chapter 3 Experimental Details
45
T316L materials are widely used in the fabrication of food and medical equipment,
aluminium AW6082-T6 alloy and titanium 6Al-4V alloy are used in the aerospace
industries, AISI 1045 and EN8 are used in other general applications. The chemical
compositions of all workpiece materials are as listed in Appendix A and in relevant
chapters.
3.5 Cutting tools
For this work, cutting tools inserts designated TPKN1603PPTR-P30, SHR-161-6160K,
SOMT-060204-HQ, HM90 APKT 100304PDR IC328, HM90 APKT 100308PDR IC328,
HM90 APKT 100312PDR and CNMG 120408-WF 4215 were used for the cutting tests
i.e. surface cleaning, side milling and turning operations. Cutting tool geometry and
specifications of specific cutting tool inserts used are reported in the relevant chapters.
Further details of the cutting tools geometry used are as stated in Appendix B.
3.6 Measurement of tool wear
To measure flank wear a magnified image of the cutting tool flank face was taken with the
optical microscope after cutting as shown in Figure 3.8. Lines across the flank wear land
and perpendicular to the original cutting edge were used to get an average flank wear
measure.

Chapter 3 Experimental Details
46
Figure 3.8: Sample flank wear observed under optical microscope
3.7 Experimental setup for machining tests
Cutting tests were conducted on MHP lathe, Takisawa and Mikron HSM 400 machining
centre in the UK and Hitachi Seiki VG-45 and Roeder RFM 700 in Singapore. This was to
ensure that data collated can be compared to other international research. The cutting test
was conducted in both dry and wet cutting environment under single and multi-fluted
cutting tools as discussed in relevant chapters.
In all the set up, and before the start of the cutting test, the Fluke 345 (Figure 3.4) power
measuring devices was attached to one of the 3-phase cable that supplies electrical current
to machine tool. The recorded data represented the electricity demand for the machine tool
during non-cutting and cutting modes/operations. The measured electrical current was then
converted by using the power Equation 3.1 and consequently energy demand was
evaluated with Equation 3.2.
3**VIP (3.1)
Flank wear

Chapter 3 Experimental Details
47
tPE * (3.2)
where P is the total power consumed in W, I represent the electrical current in Amps, V is
the electrical voltage in Volts for 3-phase supply, E is the total electrical energy demand in
J, and t is the total cycle time in s.
After the cutting tests, data collated were analyzed to establish relationships between
dependent and independent variables and to model these relationships accordingly. The
resulting model/s, discussion and conclusion deduced are reported in appropriate chapters.
In the course of this research, standard working procedures observed throughout the
cutting tests include:
General risk assessment was taken to ensure the safety of the machine tool,
operator and all involved in data collation.
Adequate laboratory apron, safety booths and safety goggles were worn.
Materials and cutting tools used were as supplied from recommended
manufacturers.
Cutting tests were repeated three times to ensure repeatability of data collated.
In the case where the machine electrical wiring systems was involved, trained
personnel was contacted to ensure safety from electrocution.

48
CHAPTER 4
MODELLING OF DIRECT ENERGY REQUIREMENTS
IN MECHANICAL MACHINING PROCESSES
4.1 Abstract
The aim of this research work was to contribute towards the development of a
mathematical model and logic for predicting direct electrical energy requirements in
cutting tool paths. This work is critical in order to track the visibility and process
dependence of energy and carbon footprint in machining process as well as the cost of
energy as a resource. In this study existing models were critically reviewed and their
limitations identified. The effect of machine modules, auxiliary units and machine codes
on power and energy consumption for machine tools was studied with the electrical current
consumption measured. A mathematical model for electrical energy use in machining was
developed addressing the limitations of existing models and validated on a milling tool
path. The paper provides valuable information on the impact of machine modules,
spindles, auxiliary units and motion states on the electrical energy demand budget for a
machine tool resource. This knowledge is fundamentally important in re-designing
machine tools to make them more energy efficient process planning to ensure that
components are machined using the least amount of energy thus reducing electricity costs
and carbon footprints.

Chapter 4 Modelling of direct energy requirements in mechanical machining processes
49
Keywords: Machine tools, energy models, toolpaths
4.2 Introduction
In the year 2010, 27% of electrical energy consumption in the UK was attributable to
industrial sectors [7]. In most cases this electricity is predominantly generated through the
use of fossil fuel. The industrial sector places a high demand on the supply of electricity.
The use of carbon rich electricity generation sources is of critical global concern as these
processes produce CO2 emissions. This implies that the higher the consumption of
electricity in manufacturing industries, the higher the carbon footprints left by such end
products. As a result, UK government and other nation states are making an increasing
demand for energy efficiency.
Machine tools play a major role in manufacturing and they were cited by the European
Commission as being in a top three priority for inclusion into the product categories to be
regulated through the eco-design directive [10]. Thus there is an urgent need for
manufacturing sectors, particularly machining, to reduce energy use per product
manufactured, to help meeting eco-design directives and CO2 emission targets. Some
relevant targets were set by the Kyoto protocol 1997 [58]. For designers of machine tools,
this calls for an increased understanding of energy use by different design features of a
machine tool. For the manufacturing industry there is a need to understand the impact of
machine tool motions and toolpaths on energy requirements for machining.
4.3 Machine Tool States and Proposed Improvements
The Cooperative Effort in Process Emission (CO2PE!) proposed a unified taxonomy [25]
and methodology [24] so that in manufacturing, energy data collection can be standardized
and presented in a globally compatible approach. They classified machine tool states into

Chapter 4 Modelling of direct energy requirements in mechanical machining processes
50
two categories of ‘Basic State’ and ‘Cutting State’ based on operational characteristics of
the processes. In the ‘basic state’, electrical energy is needed to activate required machine
components and ensure the operational readiness of the machine tool. In the ‘Cutting State’
the energy is demanded at the tool tip to remove work piece material as well as for modes
of energy loss e.g. through machine noise, friction etc.
While COP2E! sets the framework, it does not clarify the existence of a transition state
between the Basic State and Cutting State. In this paper the authors define a third and
intermediate state called the “Ready State”. This is required because after the machine is
started more energy is needed for the drives and spindle movement to bring the tool and
work piece to the correct (about to cut) position and to set-up the necessary cutting
velocity. Examples for such activities could include ‘G00’, ‘S’ and ‘T’ (rapid, spindle
speed and tool change machine features respectively). Figure 4.1 shows the extended
machine tool electrical energy states proposed by the authors.
Figure 4.1: Machine tool electrical energy consumption estimation model
Auxiliary Units
Energy
Consumption
Cutting Units
Energy
Consumption
Machine Ready
State Energy
Consumption
Basic Energy
Consumption
ECutting
Tool Tip and
Coolant Energy
EReady
Machine Spindle, Machine
Jog, Pumps, Servo Home
Location, Tool Change,
Swarf Conveyors
EBasic
Startup, Computer Units,
Lighting, Cooling Fans,
Lubrication, Unloaded
Motors
ETotal

Chapter 4 Modelling of direct energy requirements in mechanical machining processes
51
In order to establish focus for electrical energy improvement, it is important to understand
how the electrical energy use or power demanded is distributed during machine use. A
small number of researchers have explored the critical aspects of electrical energy use in
machine tools. Some of these results are summarized in Table 4.1.
Table 4.1: Machine tool contribution to electrical energy demand
Authors Observations
Kordonowy [30] The constant energy on an Cincinnati Milacron 7VC
Automated Milling Machine was 51.9% of the total energy
requirements in machining.
Dahmus et al. [14] and
Gutowski et al. [31]
The energy consumption of machine tools during actual
cutting processes was 85.2% for ‘Idle’ or machine tool
auxiliary function’ and 14.8% for ‘Cutting’.
Devoldere et al. [59] The idle or stand-by mode consumed 1.7kW energy on a five-
axis milling machine with the biggest consumer as the
hydraulic pump, responsible for nearly 0.9kW.
Diaz et al. [21] Among the auxiliary units on a Mori Seiki NV1500DCG
milling machine, the servo and the spindle consumed the most
energy in the basic and idle states.
Vijayaraghavan and Dornfeld
[22]
For a Mori Seiki NV1500DCG milling machine, energy
consumption was dominated by start-up and idle states.
Rajemi et al. [42] In an MHP CNC Lathe during dry cutting the machine
module and idle power consumption were 61 to 69% of the
total power, in the cutting speed range of 500 to 300 m/min.
Anderberg et al. [60] Reported that energy demand by machine tool auxiliary units
dominates the cost components and CO2 footprint of a
manufactured product.

Chapter 4 Modelling of direct energy requirements in mechanical machining processes
52
Table 4.1 clearly shows that machine tool is the dominant consumer of electrical energy in
machining compared to the actual chip forming process. It is important to further
understand how this electrical energy requirement by the machine is distributed. This can
then help the development of more accurate models of energy demanded by machine tools
and hence inform machine tool designers. A good basis for analysing energy use in
machining is through Gutowski et al.’s [31] mathematical model for direct energy
requirement in machining as shown in Equation 4.1.
(4.1)
where E is the direct energy in J required in machining processes, Po is the power in W,
consumed by the machine before it starts cutting, k is the specific energy requirement in
J/mm3 for machining a particular work piece material, is the material removal rate in
mm3/s, while t is the cutting time in seconds.
Considering both Equation 4.1, it can be noted that Po dominates the direct energy
requirement in machining and hence, and from and Table 4.1, this parameter dominates the
energy demand in machining. Thus, the selection of machine tools can have significant
impact on direct energy requirement in machining. It is noted here that Equation 4.1,
enables modelling of the machine tool energy requirements to be done distinctly from the
energy required for chip formation process. This is very valuable for supporting process
planning as it enables comparison and selection of machine tools and workpiece materials.
After this early work by the MIT group, a number of mathematical models for energy in
machining have been proposed and these are summarised in Table 4.2.

Chapter 4 Modelling of direct energy requirements in mechanical machining processes
53
Table 4.2: A summary of other models for direct energy requirements in machining
Author(s) Direct Energy in Machining Model
Mori et
al. [34]
(4.2)
where E is the total direct energy requirements, P1, P2, P3 represent basic, idle and
cutting power demand in Wh and T1, T2, T3 are the corresponding time.
Diaz et
al. [61]
(4.3)
where E is the total direct energy requirements, pavg is power demand, ∆t processing
time, pcut is the cutting power and pair is air cutting.
He et al.
[36]
(4.4)
This expanded to
sefanservocoecooltooltool
m
i
t
ti
t
t
c
t
t
mtotal ttppttptpdtpdtpdtpEfe
fs
cs
ce
ms
me
cos
1
(4.5)
where Etotal is the total direct energy requirements, pm is the power for enabling the
operating state of the spindle transmission module, pc is the power for material
removal from the workpiece, tms and tme are respectively the starting time and the
ending time for spindle running during the operating state, and tcs and tce are
respectively the starting time and the ending time for cutting during the material
removal process, pi, tfei , and tfsi are respectively, the power, the starting time, and the
ending time of the ith-axis feed motor during material removal process , ptool is the
power of the tool change motor, and ttool is the turret rotation time, pcool is the power of
the coolant pump motors, and (tcoe-tcos) represents the running time of the coolant pump
motor, pservo and pfan are the power of the servos system and fan motors, respectively
and (te – ts) denotes the running time of the machine tool throughout the entire NC file.
From Table 4.2, the modelling approach used by Mori et al. [34] has some resemblance to
Gutowski et al.’s [31] but Mori et al. split Po into basic and idle power. This is in line with
the proposal put forward by this paper in Figure 4.1 assuming that the idle power can be
described as the ‘Ready State’ power. Calling it idle power suggests an unnecessary step,

Chapter 4 Modelling of direct energy requirements in mechanical machining processes
54
while the term ready state clarifies the need to bring the system to an about tool to engage
movement. In the current paper, the authors further propose that the cutting power demand,
P3 in Mori et al.’s [34] model can be expanded to take into account the specific cutting
energy coefficient as introduced by Gutowski et al. [31]. Diaz et al. [61] produced an
interesting approach in that it acknowledged that in machining process the tool engage and
disengage with the workpiece and the total cycle time is not devoted to the actual material
removal. Thus, modelling the air cutting time reduces the chance of over estimation of the
energy demand. Ultimately there is need to quantify the air cutting time for toolpath in
order to estimate this impact. However, Diaz et al.’s model was not focused on process
planning and does not explicitly model the impact of machine tools, workpiece materials
and cutting variables.
Unlike Gutowski et al. [31], He et al. [36] use cutting forces instead of specific energy to
model the energy required for the chip formation process. The utility of using specific
energy is better because it is a simple concept to apply to a range of machining processes.
It enables an assessment of the energy efficiency of machining materials based on their
machinability. The limitation of He et al.’s model is that modelling the fixed energy simply
based on power for servo drives does not present a complete picture as other equipment
features are required to support machining process. For example this model ignores energy
demand for the computer used by the machine, the lights, lubrication of the machine, swarf
conveyors, chillers etc. The model is thus not generic for all machines tools and this is a
significant aspect which needs to be improved. The energy used by machine equipment
features in the unloaded state needs to be characterised according to the machine design
and energy losses. Additionally, He et al.’s part of the energy model for tool change did
not consider the number of tool changes required to finish a machining job. Moreover it

Chapter 4 Modelling of direct energy requirements in mechanical machining processes
55
did not consider the fact that turret indexing could be done using the shortest route.
Additionally, on a milling machine, the axis has to be engaged to take the spindle from its
current location on the workspace to the tool magazine pick up position and back and this
required energy. Ultimately, the model did not incorporate cutting conditions of cutting
speed, feed and depth of cut and hence did not maximise the chance of being an
information source for process planning.
There are also other approaches to modelling of energy consumption in machining as
shown in Table 4.3. These are based on some sort of efficiency measure. This can be total
energy normalised by the volume machined. While these may be interesting as a
benchmarking measure, Diaz et al. [46], Draganescu et al. [45] and Li and Kara’s [44]
specific energy models do not directly give the energy footprint for a machined component
nor do they render themselves supportive to process planning which needs cutting speeds,
feeds and depth of cut information to be modelled explicitly.

Chapter 4 Modelling of direct energy requirements in mechanical machining processes
56
Table 4.3: A summary of specific energy models in machining
Author(s) Energy in Machining Model
Diaz et al.
[46]
(4.6)
where ecut is the specific cutting energy, k is a constant and has units
of power and b represents the steady-state specific energy.
Draganescu
et al. [45]
(4.7)
where Ecs is the specific energy consumption, Pc is the cutting
power, is machine tool efficiency and z is the material removal
rate.
Li and Kara
[44]
(4.8)
where in kW/cm3 is the specific energy consumption; is
the material removal rate; Co, and C1 are empirical coefficients and
are not the same as the specific cutting energy and idle power
because the empirical approach considered the machine tool to be a
single holistic system. Unfortunately this hides vital information
about the machine tool design and work piece machinability.
4.4 Research Motivation
The motivation for this work was to contribute towards an improvement in the modelling
capability for energy requirements in mechanical machining, in particular improving the
explicit modelling of the machine tool, workpiece machinability and cutting variable
impact. It is essential to raise the integrity of such models and data so that they can be used
in eco-friendly process planning.

Chapter 4 Modelling of direct energy requirements in mechanical machining processes
57
4.4.1 New Improved Model for Direct Electrical Energy Requirement in Machining
Considering Equation 4.1 and the new classification in Figure 4.1, the model for direct
energy requirements in machining can further be re-organised into Equation 4.9a.
(4.9a)
where Et is the direct total energy requirement, Pb , Pr and Pcool in W are the basic and
ready state power (power increment above basic power to bring the machine about to cut
position) and coolant pumping power requirements respectively, tb and tr in seconds are the
basic and ready time respectively and with units of kJ/cm3
is the specific cutting energy
which is closely related to the work piece machinability and the specifics of the cutting
mechanics; in cm3/s is the rate of material processing; and is the cutting time in
seconds. Taking into account Diaz’s et al’s [46] approach, represents the average
power requirements for non cutting approach and retract moves over the component and
represents the total time duration in seconds of these non-cutting moves. Obviously in
machining the objective is to keep the non cutting time as short as possible in order to
improve machine actual cutting utilisation.
Equation 4.9a can further be re-organised into Equation 4.9b.
(4.9b)
4.4.2 Experimental Investigation
To validate the mathematical approach suggested by Equations 4.9a and 4.9b, cutting tests
were done in milling to characterize energy requirements and further develop the model
according to observed electrical energy demand patterns. This was extended into the
application of the model for facing off an x-y plane surface on a component on a vertical

Chapter 4 Modelling of direct energy requirements in mechanical machining processes
58
axis milling machine. The machines used were a CNC MHP lathe, Takisawa CNC milling
machine and a Mikron HSM 400 High Speed Milling Centre.
A Fluke 345 Power Quality Clamp Meter was clamped on the power bus at the back of the
machine tool system under investigation and used for current measurement. Fluke 345 has
in-built functions for power measurement, Oscilloscope and Data Logger in a single, hand-
held tool. True-rms ac and dc current measurements up to 2,000Amps can be measured
without disconnecting the load due to the hall effect of the instrument. The switchable low-
pass filter also allows effective measurements on variable speed drives and eliminating
noise from other electrically noisy equipment.
4.5 Results and Discussions
4.5.1 Energy consumption for machine modules and auxiliary units
In order that the energy demand of the machine modules be properly accounted for, and to
understand the dominant energy consumers, a direct assessment of the energy demand of
machine modules was undertaken. A CNC MHP lathe with Open MDSI architecture,
Takisawa CNC milling machine and Mikron HSM 400 high speed machining centre were
tested. To measure the electrical current drawn by the machines using the Fluke 345 power
clamp meter, current flow was recorded when the machine was switched ON and then
individual auxiliary units were identified through the electrical circuitry. To characterize
the electrical energy requirements by the machine, the current readings were recorded
without any cutting operation. The servos and spindle were then manually indexed through
the jog mode to measure the current during home positioning and tool change.
The power needed for switching on the machine modules of the CNC MHP lathe with
Open MDSI architecture was 1,229W. The machine start-up consumed 3,537W of power.

Chapter 4 Modelling of direct energy requirements in mechanical machining processes
59
This was due to the fact that at start-up, most of the auxiliary units are powered. The rapid
movement to home location (axes jog) had required 2,394W. Rotating the spindle without
cutting (idle condition with spindle on) at a speed of 1,000 rpm required 3,594W.
Figure 4.2 shows the distribution of power consumption of the machine modules, auxiliary
units and essential motions based on machine tool states of “Basic” and “Ready”. The tip
or cutting state is not shown since this is a study for a non cutting operation. The results
show that the power demand of the basic states is 53%, 72% and 53% for CNC MHP lathe,
Takisawa CNC milling machine and Mikron HSM 400 High Speed Milling Centre
respectively, of the total power requirements for a machine operating at no cutting load.
The “Ready states” power budget is 47%, 28% and 47% respectively. This shows that the
intermediate actions of getting the machine ready have a significant power demand though
lower than start-up.
Therefore, it is important that the power demand of the “Ready” state is included in the
estimation methodology of the total energy demand for machine tool system as shown
Equation 4.9b. Hence, the total energy demand of machine tool system could be estimated
using Equation 4.9b.

Chapter 4 Modelling of direct energy requirements in mechanical machining processes
60
Figure 4.2: Basic and ready states power relationship
The power requirements for individual aspects of the CNC MHP lathe, MAC-V2 Takisawa
Milling Machine, and Mikron HSM 400 high speed machining centre are shown in Figures
4.3, 4.4 and 4.5. For example taking the MHP CNC lathe, it is noted that the machine
start-up (24.04%), spindle running (24.43%), servo home location (16.27%), fluid pumping
(14.85%) and main switch (8.35%) dominate (>80%) the power demand of the ‘Basic’ and
‘Ready’ states of the machine tool under investigation. These are the key areas for
improvement for eco-design of this type of machine tool for machine utilization and
optimization.
53%
72% 63%
47%
28% 37%
0
20
40
60
80
100
MHP CNC Lathe MAC-V2 Takisawa
Milling Machine
Mikron HSM 400 High
Speed Milling Centre
Po
wer
Dem
an
d (
%)
Basic Machine Tool State Ready Machine Tool State

Chapter 4 Modelling of direct energy requirements in mechanical machining processes
61
Figure 4.3: Non-cutting power consumption distribution of the MHP MDSI CNC Open
Lathe machine

Chapter 4 Modelling of direct energy requirements in mechanical machining processes
62
Figure 4.4: MAC-V2 Takisawa Milling Machine auxiliary units power demand

Chapter 4 Modelling of direct energy requirements in mechanical machining processes
63
Figure 4.5: Mikron HSM 400 high speed machining, auxiliary units power demand
In the cutting state, other auxiliary modules are activated which also consume electricity.
In this category are the tool change system, spindle speed acceleration or deceleration and
coolant pumps.
4.5.2 Tool Change and Spindle speed- power characteristics
The tool change process accesses the tool magazine for tool selection processes based on
the programmed NC codes. In the event of a machining task, as the machine tool is
switched ON, electrical current flows through the system to activate the machine modules
to get to the basic state as previously described. Just before actual cutting starts, there will
be a tool change action (could be null in some machine tools system as in the case of fixed

Chapter 4 Modelling of direct energy requirements in mechanical machining processes
64
spindle machine tool, vertical or universal milling machines) at which the machine tool
now completes the rapid axis movement to a point where the machine tool is in a Ready
state. The energy demand for tool change task can be estimated as shown in Equation
4.10.
(4.10)
where and , represents power demand in W and time in s respectively for tool
change.
The next energy consuming unit of a machine tool system is the spindle. Its analysis is
complex [38]. However, direct measurement and/or statistical modelling of the spindle
power demand characteristics can be estimated with simplifications such as neglecting the
power loss due to friction, vibration of the bearing units, heat, viscosity of the spindle
lubricant. The assembled spindle of a machine tool generally consists of drives, motor and
mechanical transmissions. The energy efficiency of drive component and power output
characteristics depends on the ratio of delivered power to consumed power and it is
therefore the efficiency of the system. The spindle is subject to accelerations and
deceleration during machining processes. This characteristic affects power demand.
4.5.3 Effect of spindle speed on energy required by a DC motor driven MAC-V2
Takisawa Milling Machine
Current consumption of different spindle speeds was recorded at no cutting on the MAC-
V2 Takisawa Milling machine using the Fluke 345 power clamp meter. A tool holder
diameter of diameter 50 mm with four uncoated carbide tool inserts, TPKN1603PPTR-
P30, and model number Bristol Erickson 10-527-008-1.P5030 with an overhang of
105.16mm. The material and process parameter are as shown in Table 4.4.

Chapter 4 Modelling of direct energy requirements in mechanical machining processes
65
Table 4.4: Workpiece type and process parameters
Parameter
Value for Takisawa Milling
Machine (with DC servo
motor model 20M, spindle
A06B-0652-B)
Value for Mikron HSM 400
Machining Centre (with
HVC140-SB-10-15/42-3F-
HSK-E40 spindle)
Workpiece
Hardness
Spindle speed
Feed speed
Cutting depth
Cutting Fluid
Tool holder Diameter
Stainless Steel T316L
220 Vickers
650 RPM
75 mm/min
0.5mm
Blasocut BC25
50 mm
Stainless Steel T316L
220 Vickers
650 RPM
500 mm/min
0.5mm
Blasocut BC25
8 mm
During the analysis, it was observed that the spindle exhibited three different
characteristics when running in non-cutting mode. These could be related to the power
spindle characteristics curve as shown in Figure 4.6. The zones were identified as zone A,
B and C. The rate at which the spindle power required rises with increase in spindle speed
depended on the spindle design and spindle power characteristics as shown in Figures 4.6
to 4.9. The influence of spindle speed on spindle power demand was evaluated and a
regression equation with R-squared of between 97 - 100% was obtained. It is therefore
possible to estimate the power demand of the spindle for each zone using the power
equation as shown in Equations 4.11, 4.12 and 4.13. The choice of spindle power
consumption equation depends on the spindle speed selected during machining processes.
From Figure 4.6 and Figure 4.7, for the power-spindle speed characteristics for spindle
speed ranges between 600-1900 rpm, the power model in Equation 4.11 should be used for
MAC-V2 Takisawa CNC Milling machine.

Chapter 4 Modelling of direct energy requirements in mechanical machining processes
66
(4.11)
where is the spindle power and N, is the spindle speed.
Figure 4.6: Power-Speed Characteristics of a MAC-V2 Takisawa Milling Machine tool and
3 zones for energy profile
0
1000
2000
3000
4000
5000
6000
7000
0 2000 4000 6000 8000
Po
we
r (W
)
N (rpm)
Zone A Zone B Zone C
(6000, 5050)
(1500,5950) (4500,5950)

Chapter 4 Modelling of direct energy requirements in mechanical machining processes
67
Figure 4.7: MAC-V2 Takisawa Milling Machine no load power- spindle speed
characteristic in Zone A to 1500 rpm
For Zone B, spindle speeds ranges 2000-5000 rpm,
(4.12)
y = 0.8518x - 345.26
R² = 0.955
350
700
1050
900 1200 1500
Po
wer
(W
)
Spindle Speed (RPM)
Power (Watt) Linear (Power (Watt))

Chapter 4 Modelling of direct energy requirements in mechanical machining processes
68
Figure 4.8: MAC-V2 Takisawa Milling Machine no load power- spindle speed
characteristic in Zone B to 5000 rpm
Likewise, for Zone C, spindle speeds ranges 4800-5600 rpm,
(4.13)
y = 1.181x - 1682.5
R² = 0.9774
450
1800
3150
4500
1600 2800 4000 5200
Pow
er (
W)
Spindle Speed (RPM)
Power Linear (Power)

Chapter 4 Modelling of direct energy requirements in mechanical machining processes
69
Figure 4.9: MAC-V2 Takisawa Milling Machine no load power- spindle speed
characteristic in Zone C to 5500 rpm
It is therefore clear that the spindle power consumption equation to be used depends on the
spindle speed selected during machining processes as shown in Equations 4.11, 4.12, and
4.13. Hence, a generic model was formulated for the spindle speed power demand as
shown in Equation 4.14.
(4.14)
where Ps, is the spindle power demand, m, represent the spindle speed coefficient and N,
represent the spindle speed in rpm and C, a constant.
y = -1.5513x + 11423
R² = 1
2600
3400
4200
4600 5100 5600
Po
wer
(W
)
Spindle Speed (RPM)
Power Linear (Power)

Chapter 4 Modelling of direct energy requirements in mechanical machining processes
70
4.5.4 Development of an improved and new energy model for milling processes
The work piece type and process parameter in Table 4.4 was used to undertake a face
cleaning cutting toolpath and the generated power –time graph is shown in Figure 4.10.
The area under the graph equates to the total energy demand of machining the workpiece
which were categorized into three zones thus; ‘Basic’, ‘Ready’ and ‘Cutting’ energy states
as previously explained.
Figure 4.10: Total Power Consumption Trend for Machining Tool paths
Based on the analysis of the three states of machine tools as depicted in Figure 4.10, the
energy demand of each state can be summed and the total energy demand of a machine
tool predicted.
240216192168144120967248241
4000
3000
2000
1000
0
Time(Sec)
Po
we
r(W
)
Total Power Demand of Machining Trial
BASIC STATE ZONE
READY STATE ZONE
CUTTING STATE ZONE

Chapter 4 Modelling of direct energy requirements in mechanical machining processes
71
The tool life is an important characteristic in machining processes. It needs to be used to
effect a tool change so that surface finish and product precision is not compromised. Thus
incorporating tool life into the energy equation:
Total energy demand equation can therefore be re-written thus:
(4.15a)
Incorporating spindle power demand, from Equation 14 then;
(4.15b)
where represent tool change power and tool change time respectively.
The cutting time, t2 and Tool life T and material removal rate can be modelled for turning
and milling as a function of cutting velocity variables thus enabling the use of the equation
in process planning.
4.6 Validation of Direct Energy Model during Milling processes
In order to validate the energy model in Equation 4.15, machining trials were conducted on
the Takisawa Milling machine. A tool holder diameter of diameter 50mm with four
uncoated carbide tool inserts, TPKN1603PPTR-P30, and model number Bristol Erickson
10-527-008-1.P5030 with overhang of 105.16mm was used. The test piece was also
machined on a Mikron HSM 400 High Speed Machining Centre. An SHR-161-6160K 8
mm diameter carbide mill end cutter and an HSK40E-VC13-90 tool holder were used. The
material and process parameters are stated in Table 4.3. The power consumption of the
corresponding power states of the machine tools system were measured with the Fluke 345
power meter and the results are shown in Table 4.5.

Chapter 4 Modelling of direct energy requirements in mechanical machining processes
72
Table 4.5: Power and total energy demand estimation of machine tools under investigation
Machine
Tools
Power Consumptions (W) Energy Demand (Wh)
%
Error
Basic
State
Power
(W)
Ready
State
Power
(W)
Tool
Change
Power
(W)
Air
Cutting
(W)
Coolant
(W)
Total
Energy
Measured
Total
Energy
Calculated
%
MAC-V2
Takisawa
Milling
Machine
2736 496 0 0 776.33 391 426 8
Mikron
Machining
Centre
2516 401 920 55.42 1790 402 394 2
Note: Zero represents ‘do not need’ for event i.e. tool already in spindle and single pass
tested.
The total energy demand on MAC-V2 Takisawa Milling Machine and Mikron HSM 400
machining centre calculated using Equation 4.15 was 426 WHr and 394 WHr respectively.
The Fluke 345 Clamp meter gave measured values of power and cycle time which lead to
an area under the graph of 391 WHr and 402 WHr respectively. The deviation of the
prediction from the energy calculated from the experimental measurement of current
demand was only 8% and 2% for the Takisawa and the Mikron CNC milling machine
respectively. These values further prove that the energy model as stated in Equation 4.15
can be used as a generic and robust estimate of the energy requirements in machining.
4.7 Conclusion
The electrical energy requirements for a machining process needs to be modelled in order
to account for and optimize the monetary and environmental impact of electricity usage in

Chapter 4 Modelling of direct energy requirements in mechanical machining processes
73
manufacture. This paper classified three categories for the energy states of machine tools.
In addition, to the start-up and tip (cutting) energy an intermediate step of the “ready state”
was proposed. The ready state brings the cutting tool and work piece to a proximity state or
an about to cut state. Current measurements were then done on an MHP CNC lathe, MAC-
V2 Takisawa Milling Machine and Mikron HSM 400 Milling centre and some conclusions
can be drawn from the study.
1. There is growing evidence from literature that the tool tip energy is typically lower
than the energy required by a machine tool operating at no load. For this reason it is
important to further understand what constitutes the power requirements and hence
energy usage for a machine tool. The study shows that machine tools should not be
left in a no-cutting mode unnecessarily otherwise its energy footprint is
significantly increased.
2. On a CNC MHP lathe machine, the power requirement of the basic machine state
(the machine start-up state) was 63% of the total power requirement for a machine
running at no load. At 37% the ready state power is smaller but significant and
hence should be modelled more explicitly and accurately.
3. The case study on the MHP CNC lathe machine shows an interesting fact that in a
no-cutting mode, the bulk of the power demand arises from machine start-up
(45%), spindle power (15%), servo home location (10%), hydraulic pumps (8.9%)
and coolant pumps (8.2%). These are the key areas of focus on the redesign of the
MHP lathe to target a lower energy footprint resource. Fluid pumping was a major
energy consumer as it required 17.1% of the total power. The design of more
energy efficient pumps should be a target.

Chapter 4 Modelling of direct energy requirements in mechanical machining processes
74
4. Total energy demand can be estimated using the generic model presented. The
model was developed to consolidate the following key machine tool energy trends:
a. In addition, to the Basic and Cutting States, explicitly modelling the energy
required to take a machine tool from the Basic State to a state where the
axis and tool is ready for action and about to cut. This has been named the
Ready State.
b. Modelling of energy requirements for spindles based on spindle speed used
and machine tool spindle – power characteristic zones.
c. Accounting for the number of tool changes required and associated energy
for tool change by incorporating the tool life.
d. Modelling energy demand for air cutting during toolpath execution to
account for repositioning the cutting tool.
e. Modelling energy with an explicit consideration and incorporation of
cutting speeds, feed and depth of cut to support process planning.
f. Acknowledging that there are differences in number and design of machine
tool accessories/modules.
5. Further work is required to compare the data presented here with other machine
tools and to model the energy consumed by machine axis and its dependence on
G01, G02 and G03 axis as well as plane of interpolation.
75
CHAPTER 5
IMPACT OF UN-DEFORMED CHIP THICKNESS ON
SPECIFIC ENERGY IN MECHANICAL MACHINING
PROCESSES
5.1 Abstract
Energy demand reduction is a grand challenge for manufacturing sustainability in order to
reduce the escalating cost of energy and to cut down on the carbon footprint of
manufacturing processes. The direct electrical energy requirements in manufacturing and
machining in particular can be modelled from the basic energy required by the machine
tool and the energy for actual material removal (tip energy). However, energy centric
modelling of manufacturing processes is in its infancy and related material processing data
is limited and of low integrity. It has often been assumed that the specific cutting energy is
a constant value for particular workpiece materials. This paper is inspired by the
mechanistic force modelling and the size effect phenomenon in machining. The aim of this
work was to investigate the specific electrical energy demand in machining and model its
relationship to thickness of material removed. To this end, specific energy evaluated in
cutting tests was empirically modelled. This work was comprehensive in that it covered a
wide range of un-deformed chip thickness as well as three workpiece materials. A new and
fundamental understanding of the variation of specific energy with chip thickness is

Chapter 5 Impact of un-deformed chip thickness on specific energy in mechanical machining
processes
76
reported for the first time. This can be an evidence base for a generic model for the
dependence of specific energy on un-deformed chip thickness. This information is vitally
important to raise the integrity of energy labelling of machining processes and as a
backbone to process optimisation in order to reduce electrical energy demand and promote
manufacturing sustainability.
Keywords: specific cutting energy coefficient; un-deformed chip thickness; manufacturing
sustainability.
5.2 Introduction
Reducing electricity consumption and CO2 emission is the driving force for optimising
energy demand in manufacturing industry. This addresses the objectives of manufacturing
sustainability and resource efficiency. Optimization of direct electrical energy consumption
and improving the energy efficiency of mechanical machining processes is influenced by
material characteristics and process parameters. The fundamental approach to modelling
energy in manufacturing processes is based on the ‘Basic’ energy state and ‘Tip’ energy
[14]. This has been extended recently to include the ‘Ready’ energy state [62]. These states
are described by others as start-up, idle and cutting states [38]. For a manufacturing
process, energy is required to start the production equipment or resource (Basic energy), to
prepare the process for value adding activity (Ready State) and finally for actual
manufacturing for example ‘Tip’ energy in machining. The tip energy is the energy
demand at the cutting tool tip (cutting edge) and represents the energy for actual material
removal. A fundamental energy demand model was proposed by Gutowski et al. [31] as in
Equation 5.1.
tvkPE 0 (5.1)

Chapter 5 Impact of un-deformed chip thickness on specific energy in mechanical machining
processes
77
where E represents the total energy demand by the manufacturing process in J, P0 is the
power in W demanded by the production equipment in this case the machine tool when
operating at zero load , t is the production time in s, v is the rate of material processing in
mm3s
-1 and k is specific cutting energy in Jmm
-3.
Gutowski’s et al. [31] energy model presented above is in synergy with ‘The Cooperative
Effort in Process Emission’ (CO2PE!) [24] approach. The aim of the CO2PE!
methodology was to standardise energy reporting and data collection in manufacturing
processes. This initiated a more unified and globally compatible classification of energy
consuming machines in the manufacturing sector. In the CO2PE! methodology, machine
tool states was classified into two categories: ‘Basic State’ and ‘Cutting State’. These
classifications are aimed to define and report, on a global scale, how energy consumption
in machine tools is distributed.
Few researchers for example Li et al. [63] investigated the specific cutting energy of a unit
process and presented energy models as shown in Table 5.1 and Equations 5.2 to 5.5. Also,
Wang et al. [64] reported that the specific energy can be used as a measure of energy
efficiency in manufacturing. These approaches normalised the total energy consumption in
machining to the volume of material removed. These approaches do not disaggregate
energy consumption into the standardised framework as proposed by CO2PE! and as
implied by Equation 5.1. Thus, there still exists a knowledge gap with regard to
characterising and modelling the specific tip energy requirements in machining. This vital
information will enable consideration of differences in workpiece material when modelling
and selecting optimum cutting conditions for minimum energy demand in machining.

Chapter 5 Impact of un-deformed chip thickness on specific energy in mechanical machining
processes
78
Table 5.1: Global specific energy models found in literature combining both basic and tip
energy
Authors Specific energy model
Draganescu et al. [45]
Z
PEcs c
60 (5.2)
Li and Kara [44]
MRR
CCSEC 1
0 (5.3)
Diaz et al. [46] b
MRRkecut
1* (5.4)
Li et al. [63]
MRRk
MRR
nkkSEC
1210 (5.5)
where Ecs, SEC, ecut represents specific energy consumption, Pc is the cutting power,
is machine tool efficiency, C0 and C1 are empirical coefficients, Z and MRR represents
the material removal rate, k is a constant and has units of power and b represents the
steady-state specific energy, k0 is the specific energy requirement in cutting operations,
k1 is the specific coefficients of spindle motor, k2 is the constant coefficient of machine
tools and n is the spindle speed in rev/s.
For process level energy efficient machining to be achieved, an understanding of the
influence of material characteristics and process variables on the specific cutting energy
coefficient is necessary. Process planners have to select optimum process variables for
achieving manufacturing sustainability and energy efficient machining in particular [42].

Chapter 5 Impact of un-deformed chip thickness on specific energy in mechanical machining
processes
79
Inappropriate selection of cutting variables can hinder energy savings. For example,
selection of cutting conditions can lead to significantly higher specific cutting energy in
grinding operations [65]. Moreover, specific cutting energy is an important parameter
which is directly related to chip morphology, cutting forces, tool wear and machined
surface integrity [50]. Kuram et al. [66], related specific energy values to cutting fluid
effectiveness, tool wear and machined components surface roughness.
5.3 The Wider Importance of Specific Energy Data
The specific cutting energy varies for different machining processes even when the work
piece material properties remain the same. For example, the specific cutting energy for
grinding operations is higher compared to other machining processes like turning and
milling. This is due to the inefficient nature of the abrasive grit in cutting compared to the
use of defined cutting edges as in other mechanical machining processes. This knowledge
of specific energy can be important because for example, the specific cutting energy in
grinding operations influence surface integrity of machined components [67]. The specific
energy can also be linked to the process mechanisms. Ghosh et al. [49], reported that chip
formation, ploughing, primary and secondary rubbing phenomenon are major factors
affecting the surface integrity in grinding. Polini and Turchetta [68], presented a model for
the specific energy in stone grinding. In their analysis, it was shown that, the specific
energy is related to the equivalent chip thickness by a power function. The specific energy
range for grinding stone was shown to decrease with the increase of the equivalent chip
thickness from a maximum of 25 kJ/mm3 at 200 mm/min to 6 kJ/mm
3 at 600 mm/min.
Workpiece surface integrity [51] has been correlated to specific cutting energy for ‘High
Speed Machining’ conditions. The cutting edge angle [47], swept angle [69], rake angle

Chapter 5 Impact of un-deformed chip thickness on specific energy in mechanical machining
processes
80
and other cutting tool geometries have distinct influences on the specific cutting energy.
Burr formation has also been reported as linked to higher specific cutting energy. In their
analysis with AISI 1045, Zhang et al. [70-71], reported that “Poisson burr” height
increased when the ratio of un-deformed chip thickness to the cutting edge radius was less
than 1. This result implies that higher specific cutting energy can be associated with larger
burr size and this can be an important attribute for process monitoring.
5.4 Size effect in machining
In milling, chip formation not only depends on material characteristic and cutting tool
geometry, but also on the ratio of the feed per tooth to the cutting edge radius. For
example, in machining, the minimum chip thickness is the ratio of feed per tooth to cutting
tool edge radius below which no chips are formed. This is the lower limit for machining.
The minimum chip thickness has been reported to be in the range of ratio of un-deformed
chip thickness to cutting edge radius of 0.2 - 0.4 [72]. At a value below the minimum chip
thickness the process is dominated by high frictional force due to rubbing and plastic
deformation. If the ratio of un-deformed chip thickness to the cutting edge radius is less
than 1, the dominance of the size effect phenomenon increases and rubbing and ploughing
is associated with size effect in machining [73]. This phenomenon increases the specific
cutting forces [74]. Filiz et al. [75] reported that the size effect induced a nonlinear increase
in specific cutting force. The concept of a non-linear variation of specific cutting force and
specific cutting pressure has been the backbone of empirical force modelling in machining.
Table 5.2 shows other specific cutting pressure models as documented in literature.

Chapter 5 Impact of un-deformed chip thickness on specific energy in mechanical machining
processes
81
Table 5.2: Models of specific cutting pressure
Author(s) Specific cutting pressure
model
Kronenberg [76] ha
s sCtK (5.6)
Schroder [77] 1 hKs (5.7)
Kienzle [78] x
s hKsK 1.1 (5.8)
Hucks1 [79] 25.0
1
qCKs (5.9)
Hucks2 [79] 11 BhAKs
(5.10)
Sabberwal [80] x
s ChK (5.11)
where Ks represent the specific cutting pressure, C, α, β, K, C1,
A, B, a and x are constants depending upon the workpiece
material and cutting tool geometry, t, is the depth of cut, h is
the chip thickness at any instant, s is the feed per tooth and q
is the area at any instant.
It is clear from the review above that a number of researchers over the years have modelled
the specific cutting force and specific cutting pressure through the measurement and
estimation of force component and the material removal rate. Others attributed the specific
cutting force trend to the size effect in machining. Chip thickness, machining mechanisms

Chapter 5 Impact of un-deformed chip thickness on specific energy in mechanical machining
processes
82
and the so called ‘size effect’ should influence the magnitude of the specific energy
required in machining.
5.5 Aim and Objective
The aim of this work was to investigate the specific electrical energy requirement in
machining and its relationship to thickness of material removed and ‘size effect’ and to
improve the integrity of data for specific cutting energy coefficients. The methodology was
to undertake cutting tests at set values of un-deformed chip thickness and to evaluate the
specific energy coefficient. During the cutting tests, electrical current demand was
measured and the variation of power requirement for different material removal rate was
evaluated and the gradient used as a measure of the specific energy requirement. This was
achieved through the direct measurement of the electrical energy consumption by varying
the un-deformed chip thickness at different process parameter levels, cutting tool geometry
and swept angles. This work will contribute towards the development of a realistic and
robust model for estimating the specific cutting energy coefficient, and will provide
valuable data for resource efficient machining in particular energy centric production
planning.
5.6 Modelling and Experimental setup
5.6.1 Research Methodology
Cutting tests were planned to assess the effect of chip thickness on the specific energy
demand in machining. The idea was to undertake cutting tests in single tooth milling mode
and at the same time evaluate the current drawn by the machine. This enables tracing the
impact of chip thickness. The electrical current was then used as the basis for calculating

Chapter 5 Impact of un-deformed chip thickness on specific energy in mechanical machining
processes
83
the power demand. If power demand is considered with machining time, then the area
under the power-time curve is the energy consumed. When the cutting tests are done at
different material removal rates, the plot of power demand versus material removal rate
has a gradient equal to the specific cutting energy in Jmm-3
. The specific cutting energy
was evaluated at a defined chip thickness and for a number of chip thicknesses and the
variation of the specific cutting energy with chip thickness was characterised.
5.6.2 Cutting Test Details
Machining trials were conducted on a Mikron HSM 400 machining centre. This machine
has a HVC140-SB-10-15/42-3FHSK-E40 spindle and Heidenhain TNC 410 NC controller.
The investigation was done for three different materials shown in Table 5.3. The chemical
composition and cutting parameters of the three different workpiece materials are provided
in Table 5.3. The materials selected for investigation were aluminium AW6082-T6 alloy,
AISI 1045 steel alloy, and titanium 6Al-4V alloy. The workpiece materials were selected
to represent the major applicable engineering material classes. The cutting speeds used
were derived from cutting tool manufacturers recommendations. The depth of cut was
determined by the thickness of the workpiece material and the feedrates were selected to
overlap the process window. The radial width of cut was varied to create different material
removal rate. This parameter has a low influence on basic energy and hence is beneficial to
vary when investigating tip energy.
During the machining process, cutting was undertaken on the straight cutting edge by
avoiding engaging the nose radius in side milling. The set up was near- orthogonal
machining. A single insert was used and the conditions were such that the maximum
number of cutting edges engaged at any instance was 1. This ensured that the variation of
power requirement could be related to the chip thickness. The investigations covered seven

Chapter 5 Impact of un-deformed chip thickness on specific energy in mechanical machining
processes
84
different feedrates (un-deformed chip thickness). As mentioned before, at each feedrate,
the material removal rate was varied by machining at four different radial width of cut.
Each experimental run was repeated three times.
Table 5.3: Cutting parameters for milling trials
Aluminium
AW6082-T6 Alloy
AISI 1045
steel alloy
Titanium 6Al-
4V alloy
Feed (mm/tooth) 0.01 – 0.55 0.01 – 0.55 0.01 – 0.55
Depth of cut (mm) 3.5 3.5 3.5
Cutting velocity (m/min) 210 156 80
Radial width of cut
(mm)
0.25 – 1.00 0.25 – 1.00 0.25 – 1.00
Tool diameter (mm) 8 8 8
Chemical composition
(Max)
1%Mn, 0.5%Fe,
1.2%Mg, 1.3%Si,
0.1%Cu, 0.2%Zn,
0.1%Ti, 0.25%Cr,
Balance Al.
0.46%C,
0.40%Si,
0.65%Mn,
0.40%Cr, 0.10
Mo, 0.40%Ni,
0.63% Others
89.37%Ti,
6%Al, 4%V,
0.08%C,
0.3%Fe,
0.2%O2,
0.05%N
Workpiece material
Hardness
HV 104.5 HV 238.2 HV 353.2

Chapter 5 Impact of un-deformed chip thickness on specific energy in mechanical machining
processes
85
A tool holder E90X-D08-C10-06 with an overhang of 25 mm was used. The holder was
mounted with a single insert, SOMT-060204-HQ and used for an end milling operation in
order to mimic orthogonal cutting. The insert was a general purpose TiAlN coated carbide
insert with geometry shown in Table 5.4. This was used for milling the three selected
materials to enable adequate comparison and standardization between the different
materials. The machining trials were conducted under a dry cutting environment in order
not to mask the differences brought by workpiece materials.
Each workpiece material was 100 mm x 50 mm x 3.5 mm. The material was held in a vice
with a protrusion of 12 mm, just enough to accommodate a set of machining trials. This
was done in order to reduce the workpiece and cutting tool vibrations to the barest
minimum. The length of cut was 50 mm. Each experimental trial was repeated three times.
A new cutting tool edge was used in order to minimize the effect of tool wear. The
electrical current consumption during the machining process was measured with a FLUKE
345 Power Clamp meter.
Table 5.4: Cutting tool geometry
Geometry Values
Nose radius (mm) 0.4
Edge radius (µm) 60
Rake angle (deg.) +5
Rake face primary chip
breaker land (µm)
60
Clearance angle (deg.) 7

Chapter 5 Impact of un-deformed chip thickness on specific energy in mechanical machining
processes
86
5.6.3 Influence of varying cutting parameters on power demand during mechanical
machining processes
In machining, there is the need to understand the dominant parameters that influences the
specific energy. This information is useful in developing process control strategies for
reducing energy demand of different workpiece materials. A pilot test was therefore
carried out to study the influence of process variables on power demand during machining
process. A dry milling operation was conducted on the Mikron HSM 400 with single
inserts of code SOMT-060204-HQ on AISI 1045 steel. The process variables investigated
were cutting velocity vc, feed fz, depth of cut ap and radial depth of cut ae. The
experimental design was an L9 Taguchi orthogonal array. The results were analyzed on
Minitab 16 software to access the effects of varying cutting parameters that influence the
power consumption in machining AISI 1045 steel. The experimental design and responses
were as shown in Table 5.5.
Taguchi experimental design can be used to identify significant input parameters or
process variables that can be used to control an output or response. The analysis can be
extended to the ranking of input dominant parameters and to the selection of optimum
input conditions. The purpose of this particular study was to identify parameters that could
be varied to generate different material removal rates and those that should be held
constant in order to model the effect of feedrates only (on specific energy). There was no
need therefore to undertake confirmation tests as is customary in process optimisation
studies.

Chapter 5 Impact of un-deformed chip thickness on specific energy in mechanical machining
processes
87
Table 5.5: Taguchi L9 Experimental Design and Responses
Cutting
Velocity, vc
(m/min)
Feed per tooth,
fz (mm/tooth)
Depth of
Cut,
ap
(mm)
Width of
Cut,
ae
(mm)
Material
Removal
Rate,
Q (mm3/s) Power (W)
100 0.1 0.5 0.6 1.33 3054.90
100 0.2 1.0 0.8 7.07 3074.07
100 0.3 1.5 1.0 19.89 3090.13
120 0.1 1.0 1.0 5.30 3113.68
120 0.2 1.5 0.6 9.55 3135.28
120 0.3 0.5 0.8 6.37 3164.69
150 0.1 1.5 0.8 7.96 3101.11
150 0.2 0.5 1.0 6.63 3084.31
150 0.3 1.0 0.6 11.94 3083.66
Figure 5.1 shows the main effects plot for power demand in machining. Using the
minimum the better objective, the highest point on the signal to noise ratio curve is the set
of cutting conditions which lead to minimum power requirements. Therefore, Figure 5.1
shows that in order to minimise power demand, a low cutting velocity of 100 m/min, low
feedrate of 0.1 mm/tooth, mid-range depth of cut of 1.0 mm and a low radial width of cut
of 0.6 mm must be selected. In Figure 5.1, the variable with the largest signal-to- noise
ratio gradient is the dominant parameter. Therefore, it is evident that the cutting velocity is
the dominant parameter as supported by Table 5.6. This is well accepted because in

Chapter 5 Impact of un-deformed chip thickness on specific energy in mechanical machining
processes
88
machining the machine tool ‘Basic’ energy state dominates power demand and a major
component of this is the spindle.
150120100
-69.75
-69.80
-69.85
-69.90
-69.95
0.30.20.1
1.51.00.5
-69.75
-69.80
-69.85
-69.90
-69.95
1.00.80.6
Cuting velocity (m/min)
Me
an
of
SN
ra
tio
s
Feed (mm/tooth)
Depth of cut (mm) Width of cut (mm)
Main Effects Plot for SN ratiosData Means
Signal-to-noise: Smaller is better
Figure 5.1: Key Process variable ranking for power demand in machining of AISI 1045
steel alloy

Chapter 5 Impact of un-deformed chip thickness on specific energy in mechanical machining
processes
89
Table 5.6: Effect ranking based on Minitab 16 analysis
Level Vc
(m/min)
fz
(mm/tooth)
ap
(mm)
ae
(mm)
1 3073 3090 3101 3091
2 3138 3098 3090 3113
3 3090 3113 3109 3096
Delta 65 23 18 22
Rank 1 2 4 3
From the results it can be inferred that varying either the depth of cut ap, and/or radial
width of cut ae, will have a lower impact on the power demand in mechanical machining
compared to changing cutting velocity or spindle speeds. The second most important factor
is the feed per tooth which drives the size effect in machining. Hence, in the subsequent
study and machining cuts to evaluate specific energy, the cutting velocity Vc, was kept
constant so that its dominant effect would not mask the modelling impact of feed per tooth
(chip thickness). The axial depth of cut was fixed by the thickness of the material hence the
radial width of cut was varied between 0.25 mm and 1.00 mm in order that different
material removal rates could be computed and power demand measured. This enabled
power and material removal rate to be plotted and specific cutting energy coefficient
evaluated.

Chapter 5 Impact of un-deformed chip thickness on specific energy in mechanical machining
processes
90
5.7 Results and Discussions
After milling on the Mikron HSM 400 high speed milling centre the power demand was
calculated from the measured current and the material removal rate Q for each set of
experiment was plotted against the power demand. The slope of each graph represents the
specific cutting energy coefficient in J/mm3 for the selected workpiece material at the
defined cutting conditions. This is in accordance with the modelling approach introduced
by Gutowski et al. [31] in Equation 5.1 where the basic energy is modelled separately from
the tool tip energy. As mentioned earlier, this approach also supports the EU based
COP2E! [24]. Figures 5.2, 5.3 and 5.4 showed the variation of power demand in machining
with material removal rate for cutting aluminium AW6082-T6 alloy, AISI 1045 steel alloy
and titanium 6Al-4V alloy respectively at a feed fz of 0.01mm/tooth. It is observed from
Figures 5.2, 5.3 and 5.4 that at the lowest feed of 0.01mm/tooth, the specific cutting energy
as represented by the slope of the graph was 13.08, 5.38 and 10.66 Jmm-3
with R2 of 0.96,
0.81 and 0.90 for aluminium AW6082-T6 alloy, AISI 1045 steel alloy and titanium 6Al-
4V alloy respectively. At this feed per tooth and axial width of cut of 3.5mm, the average
un-deformed chip thickness was evaluated to be 3µm using Equation 5.12 [65]. This un-
deformed chip thickness and the specific energy values would be used latter to evaluate the
dependence of the two.
s
df
hs
zavg
0
sin (5.12)
where havg represents the average un-deformed chip thickness in mm, fz is the feed in
mm/tooth and Ø is the swept angle in degrees and Øs is the swept angle in radians.

Chapter 5 Impact of un-deformed chip thickness on specific energy in mechanical machining
processes
91
Figure 5.2: Evaluation of specific cutting energy coefficient at 0.01 mm/tooth for
aluminium AW6082-T6 alloy
Figure 5.3: Evaluation of specific cutting energy coefficient at 0.01 mm/tooth for AISI
1045 steel alloy
P= 13.08Q + 3018.2
R² = 0.96
3030
3045
3060
3075
3090
1.0 2.0 3.0 4.0 5.0
Pow
er (
W)
Q (mm3/s)
fz = 0.01 mm rev-1
ap = 3.5 mm
Vc = 210 m min-1
P = 5.38Q + 3076.9
R² = 0.81
3080
3085
3090
3095
3100
0.85 1.55 2.25 2.95 3.65
Pow
er (
W)
Q (mm3/s)
fz = 0.01 mm rev-1
ap = 3.5 mm
Vc = 156 m min-1

Chapter 5 Impact of un-deformed chip thickness on specific energy in mechanical machining
processes
92
Figure 5.4: Evaluation of specific cutting energy coefficient at 0.01 mm/tooth for titanium
6Al-4V alloy
Figures 5.5, 5.6 and 5.7 show the estimated specific cutting energy coefficient at a feed of
0.28 mm/tooth which is equivalent to an average un-deformed chip thickness of 97 µm. It
is observed from Figure 5.5, 5.6 and 5.7 and at the feed of 0.28 mm/tooth that the specific
cutting energy as represented by the slope of the graph was 0.78, 1.97 and 2.55 Jmm-3
with
R2 of 1.0, 0.96 and 0.94 for aluminium AW6082-T6 alloy, AISI 1045 steel alloy and
titanium 6Al-4V alloy respectively. Compared to a feedrate of 0.01 mm/tooth as in Figure
5.2, 5.3 and 5.4, in Figure 5.5, 5.6 and 5.7 the specific cutting energy significantly reduced
to values reported in literature [12]. The increase in specific energy for 0.01mm/tooth
compared to 0.28 mm/tooth can be attributable to increased ploughing and less dominant
shearing at the lower un-deformed chip thickness. This is expected because the tool edge
radius for the new tooth was evaluated to be 0.06 mm. This means machining at 0.01
P = 10.66Q + 2969.4
R² = 0.90
2974
2978
2982
2986
2990
0.4 0.9 1.4 1.9
Pow
er (
W)
Q (mm3/s)
fz = 0.01 mm rev-1
ap = 3.5 mm
Vc = 80 m min-1

Chapter 5 Impact of un-deformed chip thickness on specific energy in mechanical machining
processes
93
mm/tooth (3 µm un-deformed chip thickness) is associated with highly negative effective
rake angles.
Figure 5.5: Evaluation of specific cutting energy coefficient at 0.28 mm/tooth for
aluminium AW6082-T6 alloy
P = 0.78Q+ 3091.3
R² = 1.0
3115
3145
3175
3205
30 57 84 111 138
Pow
er (
W)
Q (mm3/s)
fz = 0.28 mm rev-1
ap = 3.5 mm
Vc = 210 m min-1

Chapter 5 Impact of un-deformed chip thickness on specific energy in mechanical machining
processes
94
Figure 5.6: Evaluation of specific cutting energy coefficient at 0.28 mm/tooth for AISI
1045 steel alloy
Figure 5.7: Evaluation of specific cutting energy coefficient at 0.28 mm/tooth for titanium
6Al-4V alloy
P = 1.97Q + 3016.7
R² = 0.96
3070
3095
3120
3145
3170
3195
3220
25 45 65 85 105
Pow
er (
W)
Q (mm3/s)
fz = 0.28 mm rev-1
ap = 3.5 mm
Vc = 156 m min-1
P = 2.55Q + 3123.6
R² = 0.94
3140
3163
3186
3209
3232
3255
12 23 34 45 56
Pow
er (
W)
Q (mm3/s)
fz = 0.28 mm rev-1
ap = 3.5 mm
Vc = 80 m min-1

Chapter 5 Impact of un-deformed chip thickness on specific energy in mechanical machining
processes
95
The evaluation of specific energy was conducted for 0.01, 0.10, 0.19, 0.28, 0.37, 0.46 and
0.55 mm/tooth. For the purposes of saving space, the graphs shown are for the lowest,
middle and highest feed rates used. The detailed specific energy values obtained are shown
in Table 5.7. The results for the highest federate of 0. 55 mm/tooth (un-deformed chip
thickness of 190µm) are shown in Figures 5.8, 5.9 and 5.10. For this condition, the specific
cutting energy coefficient was 0.21, 1.47 and 1.13 with R2 of 1.0, 0.99 and 0.92 for
aluminium AW6082-T6 alloy, AISI 1045 steel alloy and titanium 6Al-4V alloy
respectively. The results at the highest feed settings reveal that the specific cutting energy
in the shear cutting regime remains fairly constant despite an increase in feedrate.
Figure 5.8: Evaluation of specific cutting energy coefficient at 0.55 mm/tooth for
aluminium AW6082-T6 alloy
P = 0.21Q + 3372.8
R² = 1.00
3385
3400
3415
3430
65 135 205 275
Pow
er (
W)
Q (mm3/s)
fz = 0.55 mm rev-1
ap = 3.5 mm
Vc = 210 m min-1

Chapter 5 Impact of un-deformed chip thickness on specific energy in mechanical machining
processes
96
Figure 5.9: Evaluation of specific cutting energy coefficient at 0.55 mm/tooth for AISI
1045 steel alloy
Figure 5.10: Evaluation of specific cutting energy coefficient at 0.55 mm/tooth for titanium
6Al-4V alloy
P = 1.47Q + 3171.9
R² = 0.99
3230
3278
3326
3374
3422
3470
48 87 126 165 204
Pow
er (
W)
Q (mm3/s)
fz = 0.55 mm rev-1
ap = 3.5 mm
Vc = 156 m min-1
P = 1.13 + 3207.4
R² = 0.92
3220
3255
3290
3325
23 43 63 83 103
Pow
er (
W)
Q (mm3/s)
fz = 0.55 mm rev-1
ap = 3.5 mm
Vc = 80 m min-1

Chapter 5 Impact of un-deformed chip thickness on specific energy in mechanical machining
processes
97
A summary of the specific energy coefficient obtained from the study is shown in Table
5.7 for all the feedrates tested.
Table 5.7: Experimental values of k at different un-deformed chip thickness h
Data obtained in this study
Feed, fz
(mm/tooth)
0.01 0.10 0.19 0.28 0.37 0.46 0.55
havg (µm) 3 35 66 97 128 159 190 Kalpakjian
and Schmid
[12].
Spec
ific
cutt
ing e
ner
gy
(Jm
m-3
)
Aluminium
AW6082-T6
Alloy
13.08 1.99 1.52 0.78 0.87 0.21 0.21 0.40- 1.00
AISI 1045
steel alloy
5.38 3.73 2.08 1.97 1.65 1.55 1.47 2.00- 9.00
Titanium alloy 10.66 4.45 3.78 2.55 2.65 1.14 1.13 2.00- 5.00
The specific cutting energy coefficient was plotted against the un-deformed chip thickness
as shown in Figures 5.11, 5.12 and 5.13.The relationship between specific energy and un-
deformed chip thickness can be represented by a power function. The graphs clearly show
that the specific energy coefficient in cutting is fairly constant at higher un-deformed chip
thickness (typical of roughing operations) but increases exponentially at low (typical of
finishing and/or micro-scale machining operations) un-deformed chip thickness. The
exponential increase in specific energy at reduced un-deformed chip thickness can be

Chapter 5 Impact of un-deformed chip thickness on specific energy in mechanical machining
processes
98
attributable to highly negative rake angles and increased ploughing and friction. The chip
thickness to specific energy trend mirrors that in specific cutting force. Table 5.2 shows
specific cutting pressure model found in literature.
Figure 5.11: Specific cutting energy model of aluminium AW6082-T6 alloy
Figure 5.12: Specific cutting energy model of AISI 1045 steel alloy
k = 0.071h-0.94
R² = 0.89
0
4
8
12
16
20
0.00 0.05 0.10 0.15 0.20
k (
Jm
m-3
)
h (mm)
k = 0.900h-0.33
R² = 0.91
1.00
2.50
4.00
5.50
0.00 0.05 0.10 0.15 0.20
k (
Jm
m-3
)
h (mm)

Chapter 5 Impact of un-deformed chip thickness on specific energy in mechanical machining
processes
99
Figure 5.13: Specific cutting energy model of titanium 6Al-4V alloy
Based on Figures 5.11, 5.12 and 5.13, new specific energy equations were deduced and
these are shown as Equations 5.13, 5.14 and 5.15.
94.0*071.0 hkAl (5.13)
33.0*900.0 hkS (5.14)
51.0*670.0 hkTi (5.15)
where kAl, kS and kTi represents the specific cutting energy in Jmm-3
of aluminium
AW6082-T6 alloy, AISI 1045 steel alloy and titanium 6Al-4V alloy respectively and h is
the un-deformed chip thickness in mm.
Figure 5.14 compares the specific energy trend for aluminium AW6082-T6 alloy, AISI
1045 steel alloy and titanium 6Al-4V alloy. The variations of specific energy with un-
deformed chip thickness for three workpiece materials follow similar power function trend.
It can be seen that aluminium AW6082-T6 alloy specific energy coefficient varies from
k = 0.670h-0.51
R² = 0.86
0.0
3.0
6.0
9.0
12.0
0.000 0.050 0.100 0.150 0.200
k (
Jm
m-3
)
h (mm)

Chapter 5 Impact of un-deformed chip thickness on specific energy in mechanical machining
processes
100
13.08 to 0.21 Jmm-3
, and for titanium 6Al-4V alloy the range is 10.66 to 1.13 Jmm-3
while
the range for AISI 1045 steel alloy is 5.38 to 1.47 Jmm-3
. It is observed that for aluminium
alloys the specific energy for cutting can be significantly high at very low un-deformed
chip thickness to significantly low at chip thicknesses typical of conventional machining.
Figure 5.14: Specific energy comparison for aluminium AW6082-T6 alloy, AISI 1045
steel alloy and titanium 6Al-4V alloy
From the three workpiece materials, it can be concluded that a generic model for the
relationship between specific energy and the un-deformed chip thickness can be
represented by Equation 5.16.
x
ee hKk (5.16)
k(Ti) = 0.670h-0.51
k(S) = 0.907h-0.32
k(Al) = 0.071h-0.94
0.0
3.0
6.0
9.0
12.0
15.0
0.00 0.05 0.10 0.15 0.20
k (
Jm
m-3
)
h (mm)
k_Titanium k_1045 k_Aluminium

Chapter 5 Impact of un-deformed chip thickness on specific energy in mechanical machining
processes
101
where ke is the specific cutting energy in Jmm-3
at the required un-deformed chip thickness
and Ke is the specific area energy in Jmm-2
at un-deformed chip thickness of 1 mm, and h is
the un-deformed chip thickness in mm while x is the specific energy exponent.
5.7.1 Specific energy and size effect
The ratio of the un-deformed chip thickness to the cutting edge radius is one of the key
measures for defining the size effect in machining. The specific energy was plotted as a
function of this ratio in order to elucidate the effect of machining length scale on the
energy efficiency for material removal. The coefficient of the graphs in Figure 5.15, 5.16
and 5.17 is equivalent to the specific energy at un-deformed chip thickness equal to tool
edge radius. This value is the upper limit for the specific energy experienced in machining
when shearing mechanisms instead of ploughing dominate. These experimental values
derived are in agreement with the range of values published by Kalpakjian and Schmid
[12] (i.e. 0.40 to 1.00, 2.00 to 9.00 and 2.00 to 5.00 Jmm-3 for aluminium AW6082-T6
alloy, AISI 1045 steel alloy and titanium 6Al-4V alloy respectively). It therefore implies
that the empirical modelling adopted is a robust approach for determining the specific
cutting energy for various materials. So, from Figure 5.15, 5.16 and 5.17, the coefficients
of 1.01, 2.26 and 2.78 indicate that aluminium AW6082-T6 alloy has the lowest average
specific energy in shear dominated machining followed by AISI 1045 steel alloy and
titanium 6Al-4V alloy in increasing order of difficult-to-cut materials. Thus, the tip energy
in machining processes and environmental impact of materials processing is influenced by
material machinability as driven by workpiece material properties.

Chapter 5 Impact of un-deformed chip thickness on specific energy in mechanical machining
processes
102
Figure 5.15: Specific energy size effect in machining of aluminium AW6082-T6 alloy
Figure 5.16: Specific energy size effect in machining of AISI 1045 steel alloy
k = 1.007(h/re)-0.94
R² = 0.89
0
4
8
12
16
20
0.0 0.5 1.0 1.5 2.0 2.5 3.0 3.5
k (
J/m
m3)
h/re
k = 2.260(h/re)-0.33
R² = 0.91
1
2
3
4
5
6
7
0.0 0.7 1.3 2.0 2.6 3.3
k (
J/m
m3)
h/re

Chapter 5 Impact of un-deformed chip thickness on specific energy in mechanical machining
processes
103
Figure 5.17: Specific energy size effect in machining titanium 6Al-4V alloy
5.8 Conclusions
This research investigated the variation of specific energy coefficient for a wide range of
un-deformed chip thicknesses and three different workpiece materials that are widely used
in engineering. The specific energy coefficient is a fundamental quantity required for the
estimation of tool tip energy and can have impact on surface integrity of machined parts.
The following conclusions were drawn as a result of this study:
1. A new generic model for the specific cutting energy coefficient based on the un-
deformed chip thickness for aluminium AW6082-T6 alloy, AISI 1045 steel alloy
and titanium 6Al-4V alloy has been presented in this work. The model is in
agreement with the theory for specific cutting force models. The specific cutting
energy can be modelled from the following generic relationship.
k = 2.782(h/re)-0.51
R² = 0.86
0
2
4
6
8
10
12
14
0.0 0.5 1.0 1.5 2.0 2.5 3.0 3.5
k (
J/m
m3)
h/re

Chapter 5 Impact of un-deformed chip thickness on specific energy in mechanical machining
processes
104
x
ee hKk
where ke is the specific cutting energy in Jmm-3
at the required un-deformed chip
thickness and Ke is the specific area energy in Jmm-2
at un-deformed chip thickness
of 1 mm, and h is the un-deformed chip thickness in mm while x is an
experimentally determined specific energy exponent.
2. The variation of specific energy with un-deformed chip thickness for three
workpiece materials follows similar power function trends. For the aluminium
AW6082-T6 alloy, specific energy coefficient varies from 13.08 to 0.21 Jmm-3
, and
for titanium 6Al-4V alloy the range is 10.66 to 1.13 Jmm-3
while the range for AISI
1045 steel alloy is 5.38 to 1.47 Jmm-3
.
3. For aluminium alloys the specific energy for cutting can be significantly high at
very low un-deformed chip thickness to significantly low at chip thicknesses
typical of conventional machining.
4. A representative average value of specific energy for different workpiece materials
is evaluated at a condition where the un-deformed chip thickness is equal to the tool
edge radius. Since this is the upper limit for the shear dominant mechanism. On this
basis the average specific energy in conventional machining for a positive 5 degree
rake angle carbide tool is 1.007, 2.260 and 2.782 Jmm-3
for aluminium AW6082-T6
alloy, AISI 1045 steel alloy and titanium alloy respectively.
5. This study shows that the specific energy is significantly influenced by federate in
milling. To reduce energy consumption during manufacturing it is recommended
that bulk material removal (roughing) should be undertaken at feedrates greater
than the tool edge radius.

Chapter 5 Impact of un-deformed chip thickness on specific energy in mechanical machining
processes
105
6. This study is based on specific energy evaluation without a focus on modelling
impact of tool wear; more research work is needed to investigate the sensitivity of
this model to tool wear.
7. Electrical energy demand in manufacturing is a significant contributor to the global
warming potential (GWP) and environmental burden of manufacturing industries.
Fundamental to evaluating the energy demand is a need for data on specific energy
requirements for machining different materials. Thus, the paper contributes key
data required for energy demand modelling and energy smart and environmentally
friendly manufacturing.

106
CHAPTER 6
IMPROVING THE INTEGRITY OF SPECIFIC CUTTING
ENERGY COEFFICIENTS FOR ENERGY DEMAND
MODELLING
6.1 Abstract
Energy modelling for mechanical machining processes is essential for energy labelling of
machined products and as a foundation for selecting optimum cutting conditions that meet
economic objectives while reducing energy demand and CO2 footprint. Electrical energy
demand in machining can be modelled in two parts, Basic Energy demand by the machine
tool and Tip Energy for actual material removal. A significant amount of research and
energy evaluation is based on the use of average specific energy values and ignores the
impact of machining conditions. In this comprehensive study, the evaluation of specific tip
energy is undertaken and the effect of chip thickness, tool wear, nose radius and cutting
environment is quantified. This work is an essential guide for the application of models to
estimate energy demand in practical machining processes. It is of significant importance to
improve accuracy in energy centric modelling of machining processes for sustainable
manufacture and resource efficiency.
Keyword: Energy demand; tool wear; cutting conditions

Chapter 6 Improving the integrity of specific cutting energy coefficients for energy demand
modelling
107
6.2 Introduction
The electrical energy demand for mechanical machining processes can be defined and
modelled as the basic and tip energy [31]. A third preparatory state called the ‘Ready state’
was also recently proposed [62]. The ‘Basic state’ is the energy demand of the machine
tool resource and auxiliary units at zero load. The ‘Ready state’ energy demand represents
the energy consumed for all transitional movement made by the machine axes up to the
point the tool is just about to cut. ‘Tip’ or ‘Cutting state’ energy is the specific energy
demand for the actual material removing operation. During a machining process, an
average three quarters of the total energy is consumed by the machine tool which
constitutes the basic and ready energy states [81-82]. There is thus a need for machine tool
designers to reduce the energy demand in the machine basic and ready state. Moreover, the
European Union (EU), Eco-design directive [10], Co-operative effort on process emissions
in manufacturing CO2PE! [24], ISO 14955 [19], ISO 14020:2000 [83] and ISO 5001:2011
[84] all promote energy demand reduction for machine tools. Design approaches include
the improvement of energy efficiency of machine tool auxiliary units and the use of more
energy efficient electric motors and drives.
From literature it has been reported that, energy demand in machining can be reduced by
optimizing cutting parameters, synchronizing spindle acceleration/deceleration with rapid
traverse [34], reducing non-productive modes [59], optimizing energy demand for coolant
pumps and centralizing coolant systems [85-86], use of low coefficient of friction tools
coatings [87] and selection of optimum cutting conditions [29, 34].
For manufacturers and machine shops, energy demand reduction can be achieved through
process planning by selection of energy efficient machine tools and cutting conditions. The
energy demanded for material removal i.e. the specific cutting energy is driven by material

Chapter 6 Improving the integrity of specific cutting energy coefficients for energy demand
modelling
108
machinability factors. It is this tip energy which is under the direct control of end users and
machinists because its magnitude is influenced by machining conditions.
Central to modelling, this tip energy is the evaluation of the specific energy for material
removal as defined in Equations 6.1 and 6.2.
tipreadybasictotal EEEE (6.1)
where Etotal is the direct total energy demand, Ebasic, Eready and Etip represent electrical
energy demand for basic, ready and cutting states respectively in (J) in a machining
process.
Equation 6.1 can further be expanded to explicitly model tip energy. The basic and ready
energy depend on the machine design and will be machine specific.
cuttingreadyreadybasicbasictotal kQttPtPE (6.2)
where tbasic, tready, tcutting are the time in seconds when the machine is in the basic, ready
state and actual cutting mode respectively. While Pbasic, Pready are the average power
demand in the basic and ready state respectively, k is the specific cutting energy coefficient
in J/mm3 and Q is the material removal rate in mm
3/s.
The specific energy coefficient represents the energy demand to remove 1 mm3 from a
workpiece material. To date there is no comprehensive study that examines how this key
energy modelling parameter varies with cutting conditions. The aim of this paper is to
address this knowledge gap and to raise the integrity of data used for specific energy
modelling and at the same time provide guidance for end users in energy demand
modelling of machined products.

Chapter 6 Improving the integrity of specific cutting energy coefficients for energy demand
modelling
109
6.2.1 Research aim and motivation
This research aim was to understand the factors that influence the tip energy in machining
processes. To achieve this, cutting tests were undertaken to assess the impact on specific
energy coefficients of cutting tool geometry (nose radius), cutting environment (dry and
flood coolant) and tool wear in machining AISI1045 steel alloy and EN8 steel alloy
materials. This information is essential because at present most data on energy demand
modelling is based on constant specific energy values derived in short run cutting tests.
Understanding how changes in conditions will influence the normalized tip or specific tip
energy will enable accurate analysis of direct electrical energy requirements in machining.
6.3 Research Strategy and Experimental Details
6.3.1 Research Strategy and Procedure
The research approach was to measure the current demand in machining processes and
hence evaluate the associated power and electrical energy demand. The electrical current
consumption was measured with a FLUKE 345 power clamp meter. Given that the total
energy in machining can be modelled as proposed in Equation 6.1, then the specific tip
energy can be obtained by plotting the power demand for different material removal rates.
The gradient for such a curve represents the specific cutting energy coefficient. This
specific energy coefficient was to be evaluated at different values of flank wear, tool nose
radius and cutting fluid in order to quantify and assess the effect of such variables on the
electrical energy demand in machining processes.

Chapter 6 Improving the integrity of specific cutting energy coefficients for energy demand
modelling
110
6.3.2 Experimental Details – Milling Tests
For the cutting tests, the machines used were the high speed milling Mikron HSM 400
machining centre that has an HVC140-SB-10-15/42-3FHSK-E40 spindle and Heidenhain
TNC 410 NC controller. For the milling tests, a tool holder E90X-D08-C10-06 with an
overhang of 25 mm was used. The holder had single insert.
To evaluate the variation of specific cutting energy with feed per tooth, cutting tests were
performed using SOMT-060204-HQ. The insert has a 0.4 mm nose radius, the edge radius
was evaluated to be 60 µm, the rake face primary chip breaker length was 60 µm and the
rake and clearance angles were 5o and 7
o respectively. This tool was used for end milling
operation. The insert was a general purpose TiAlN coated carbide insert with geometry as
described above.
Side milling tests were conducted under a dry cutting environment on AISI 1045 alloy
steel under the “One-Factor-at a Time” design of experiments. To evaluate the effect of
different nose radii, three insert types HM90 APKT 100304PDR IC328, HM90 APKT
100308PDR IC328 and HM90 APKT 100312PDR with 0.4 mm, 0.8 mm and 1.2 mm nose
radius respectively and edge radius of 70 µm and primary rake face land of 130 µm were
used.
The cutting variables were derived from insert manufacturers’ recommendations. The
cutting velocity was kept constant at 156 m/min in order to fix the spindle speed and avoid
large variations in basic power requirement. The depth of cut was 3.5 mm as defined by the
end milled plate thickness. The feed per tooth and radial width of cut were varied from
0.01 to 0.55 mm/tooth and 0.25 to 1.0 mm respectively.

Chapter 6 Improving the integrity of specific cutting energy coefficients for energy demand
modelling
111
6.3.3 Experimental Details – Turning Tests
Turning trials were conducted on the MHP lathe for continuous cutting in order to enable a
systematic evaluation of tool wear and electrical energy demand for each wear land value.
The MHP Lathe had an 18 kW rated DC Servo motor spindle. A tool holder
PCLNL2020K12 and insert CNMG 120408-WF 4215 were used. The insert was coated
with TiCN + Al2O3 + TiN. The turning tests for tool wear evaluation were conducted
under a flood cutting environment on EN8 steel alloy.
The turning tests involved establishing a pre-defined wear land value through cutting for
extended times. Each test was repeated to generate a sufficient number of tools with
particular wear land values. Using these tools and at a particular wear land, more
experiments were conducted to evaluate specific energy coefficient values in relation to the
wear previously generated. A CNMG 120408 insert was used in the turning tests to
evaluate effect of tool wear and cutting fluid. This was used to machine EN8 steel at 0.3
mm/rev, for a range of depth of cut varying from 0.25 mm to 1.0 mm (to generate different
materials removal rate) and a cutting velocity of 415 m/min. The cutting variables were
selected to be within the process window as recommended by Sandvik Coromant the tool
manufacturer.
6.4 Results and Discussions
6.4.1 The effect of chip thickness on specific cutting energy
During the end milling tests, the radial width of cut was varied from 0.25 mm to 1.0 mm to
generate different values for the material removal rate. The feed (chip load) was also
varied from 0.01 mm/tooth to 0.55 mm/tooth and the total power demand measured for
each feed was plotted against the material removal rate generated by varying the radial

Chapter 6 Improving the integrity of specific cutting energy coefficients for energy demand
modelling
112
with of cut. The slope of the curves obtained represents the specific energy coefficient of
milling AISI 1045 steel alloy as shown in Figure 6.1.
Figure 6.1: Determination of specific energy coefficient.
The average un-deformed chip thickness is estimated using Equation 6.3.
s
df
hs
zavg
0
sin (6.3)
where havg represents the average un-deformed chip thickness in mm, fz is the feed per tooth
in mm/tooth and Ø is the swept angle in degrees and Øs is the swept angle in radians.
In order to understand the effect of feed on the tool tip energy, the specific energy was
plotted against the feed (chip load) as shown in Figure 6.2. It can be observed from Figure
6.2 that the specific energy decreases by a power function as shown in Equation 6.4. In
P = 3.73Q + 3013
R² = 0.94
3040
3067
3094
3121
3148
9 16 23 30 37
Po
wer
(W
)
Q (mm3/s)
fz = 0.100 mm/tooth
ap = 3.5 mm
Vc = 156 m/min

Chapter 6 Improving the integrity of specific cutting energy coefficients for energy demand
modelling
113
increasing the feed from 0.01 mm/tooth to 0.55 mm/tooth, the specific energy decreases
from 5.38 J/mm3 to 1.47 J/mm
3 for AISI 1045 steel alloy.
Figure 6.2: Specific cutting energy variation with feed per tooth in milling AISI 1045 steel
alloy
34.025.1 zfk (6.4)
where k is the specific cutting energy in J/mm3 and fz is the feed per tooth in mm/tooth
Figure 6.3 shows the relationship of the specific cutting energy coefficient and the un-
deformed chip thickness.
Figure 6.3 show that as the un-deformed chip thickness increases, the energy efficiency of
the cutting process tends to improve i.e. the specific cutting energy decreases. This can be
related to the changing of the process mechanisms towards a shearing dominated process
as a result of the effective rake angle reducing from being highly negative to a more
k = 1.25fz - 0.34
R² = 0.92
0.00
2.00
4.00
6.00
0.00 0.10 0.20 0.30 0.40 0.50 0.60
k
(J/m
m3)
fz (mm/tooth)

Chapter 6 Improving the integrity of specific cutting energy coefficients for energy demand
modelling
114
positive angle. This decreasing trend implies that as the process mechanisms shifted from
ploughing and rubbing dominated zone to shearing dominated zones, the specific energy
decreases by 73% (considering the lowest un-deformed thickness of 3 µm as shown in
Figure 6.3).
Figure 6.3: Specific cutting energy variation with un-deformed chip thickness in milling
AISI 1045 steel alloy
Thus, based on tip energy, the energy intensity of the actual material removal process
depends on the process mechanism at play. These process mechanisms are driven by the
ratio between the un-deformed chip thickness and the tool edge radius [88].
The values of the specific energy gradually decrease as un-deformed chip thickness
increases up to a point whereby it is greater than the cutting edge radius. At this value, the
process mechanism would have shifted to dominant shearing. This zone tends to be the
k = 0.90h-0.33
R² = 0.91
0
2
4
6
0.00 0.05 0.10 0.15 0.20
spec
ific
ti
p e
ner
gy
, k
(J
/mm
3)
un-deformed chip thickness, h (mm)

Chapter 6 Improving the integrity of specific cutting energy coefficients for energy demand
modelling
115
value for the specific energy at which roughing operations are conducted. This represents
an energy efficient tip energy material removal zone. Inappropriate process parameters
selection, especially when the ratio of un- deformed chip thickness to the cutting edge
radius is less than unity can cause an increase in the specific energy demand during
machining operations. It is important to select chip thickness that ensures dominant shear
mechanism if the energy intensity of roughing operations is to be reduced.
6.4.2 The effect of nose radius on specific cutting energy
In this section, 3 insert types HM90 APKT 100304PDRIC328, HM90 APKT100308PDR
IC328 and HM90 APKT 100312PDR with nose radius of 0.4, 0.8 and 1.2 mm respectively
were evaluated in milling tests. Other geometry and coatings of the 3 inserts were the same
as stated previously. The milling test was similar to that as previously described. The
current consumption was measured and the power demand calculated and analyzed to
determine the specific energy coefficient as described before.
Figure 6.4 shows the variations for the specific energy coefficients when different cutting
tool nose radius was engaged at a range of un-deformed chip thickness.

Chapter 6 Improving the integrity of specific cutting energy coefficients for energy demand
modelling
116
Figure 6.4: Specific energy comparison for 0.4 mm, 0.8 mm and 1.2 mm nose radius tools
in milling of AISI 1045
It can be observed that at an average un-deformed chip thickness of 3 µm, the specific
energy coefficient was 6.33, 4.95 and 3.94 J/mm3 for 1.2, 0.4 and 0.8 mm nose radius
respectively. This also shows that for energy efficiency, a mid-range tool nose radius of 0.8
mm should be preferred when milling AISI 1045 at a feed per tooth fz of 0.01 mm/tooth. At
this feed per tooth 0.01 mm/tooth, and a step-over of 1 mm for 8 mm diameter tool the
maximum un-deformed chip thickness is 6.6 µm which is 11% of the 60 µm cutting edge
radius. As the un-deformed chip thickness increases to a value closer to the cutting edge
radius of the tool, in this case 0.07 mm, the specific energy requirements for different nose
radius becomes comparable in magnitude. The data shows that, broadly, for conventional
machining in shear dominated cutting zone, the decision to use a 0.4 mm, 0.8 mm or 1.2
mm nose radius insert does not significantly affect the specific tip energy.
0
2
4
6
8
0.00 0.08 0.16 0.24 0.32 0.40
Sp
ecif
ic c
utt
ing
en
erg
y k
(J
/mm
3)
feed per tooth, fz (mm/tooth)
k_0.4 k_0.8 k_1.2

Chapter 6 Improving the integrity of specific cutting energy coefficients for energy demand
modelling
117
6.4.3 The effect of cutting environment on specific cutting energy
Dry and flood cutting environment was tested and analyzed and the result as displayed in
Figure 6.5.
Figure 6.5: Specific energy demand for dry and flood cutting environment of AISI 1045
steel alloy
In the region of feed per tooth between 0.01 and 0.2 mm/tooth the specific energy in
machining under flood coolant is higher than for dry machining. At 0.2 mm/tooth, the
average un-deformed chip thickness was 66 µm and greater than the 60 µm edge radius.
This means the higher specific energy for flood compared to dry is experienced when feed
per tooth is lower than the tool edge radius and in this zone ploughing and rubbing
dominates process mechanisms and have the effect of hindering the penetration of cutting
fluid to the cutting zone due to the highly negative rake angle. Additionally, the fluid
R² = 0.97
R² = 0.97
0
2
4
6
8
10
0.00 0.10 0.20 0.30 0.40 0.50 0.60
Sp
ecif
ic c
utt
ing
en
erg
y (
J/m
m3)
feed per tooth, fz (mm/tooth)
k_flood k_dry

Chapter 6 Improving the integrity of specific cutting energy coefficients for energy demand
modelling
118
pressure can generate an additional load that could increase specific energy requirements.
When machining at federates higher than the tool edge radius the access of the cutting fluid
to the cutting zone reduces the coefficient of friction enabling lower specific energy. It has
been suggested by Childs, [89] in 2006, that the effectiveness of cutting fluid is cutting
velocity and un-deformed chip thickness dependent.
Figure 6.5 shows that the impact of cutting fluid as a lubricant was not effective at lower
un-deformed chip thickness. This is due to the fact that fluid accessibility to the contact
zone becomes extremely difficult at such lower un-deformed chip thickness of less than
0.02 mm (i.e. 0.10 mm feed per tooth). The coolant pump flow rate was 30 L/min at an
operative pressure of 300 kN/m2. The pressure of the cutting fluid increases the energy
required for the machining processes.
Flood cooling increases ploughing effect at nano un-deformed chip thickness since flood
cooling tends to avoid chips build up at the tool-chip cutting interface because during
ploughing effect chips are built up until the size is up to the minimum chip thickness and
could therefore be removed as chip. Hence, higher specific energy was observed at lower
un-deformed chip thickness.
It can also be noticed from Figure 6.5 that as the un-deformed chip thickness is increased
further, the average specific energy coefficient for dry is 2.26 J/mm3 while that for flood
milling is 1.26 J/mm3. This implies that the tip energy can be reduced by approximately
28% with flood cutting when compared to dry cutting under the same process parameters.
Assuming tip energy to be 25% of total direct electrical energy demand then 7% energy
reduction due to effective use of cutting fluid is possible.

Chapter 6 Improving the integrity of specific cutting energy coefficients for energy demand
modelling
119
From Figure 6.5 and at a feed of 0.2 mm/tooth, the specific energy of flood cutting is equal
to that of dry cutting. This suggests that cutting conditions should be set above 0.2
mm/tooth for the effectiveness of cutting fluid lubricating effect to be realized.
6.4.4 The effects of tool wear on specific cutting energy
For the tool wear evaluation, a turning operation was conducted on the MHP lathe and on
EN8 workpiece material. The cutting tool and process parameters were as stated in Section
6.3.3 above. After the turning operations, each cutting tool edge was examined under the
optical microscope for tool wear measurement. Figures 6.6a and 6.6b are some samples of
the cutter showing the flank wear as imaged by the optical microscope. It is observed as
expected, that flank wear grows with cutting time.

Chapter 6 Improving the integrity of specific cutting energy coefficients for energy demand
modelling
120
(a) Flank wear at k = 2.27 J/mm3 after 4.16 minutes
(b) Flank wear at k = 4.50 J/mm3 after 8.06 minutes
Figure 6.6: Optical microscope view of flank wear land
From Figure 6.7, it is deduced that the specific energy coefficient is directly proportional to
flank wear and as the flank wear increases from 0.055 mm to 0.135 mm, the corresponding

Chapter 6 Improving the integrity of specific cutting energy coefficients for energy demand
modelling
121
specific energy also increased from 2.14 to 4.50 J/mm3. This indicates that, as cutting
progresses, tool wear can increase the energy coefficient by an average of 52% when
turning EN8 steel alloy. This is the case when the tool life criterion was set at 0.15 mm VB
in order not to compromise component accuracy due to change in actual cutting variables
as the tool edge recesses.
Figure 6.7: Specific energy coefficient increases with flank wear during turning operation
of EN8 steel alloy
Also Figure 6.8 showed that as the cutting time increases, specific energy coefficient also
increases. This result is based on the wear land established as indicated in Figure 6.6a and
Figure 6.6b for EN8 alloy steel. The observed linear trend makes it easier to account for
the effect of tool wear on energy demand.
2
3
4
5
0.05 0.07 0.09 0.11 0.13 0.15
Sp
ecif
ic c
utt
ing
en
erg
y k
(J
/mm
3)
Flank Wear Vb (mm)

Chapter 6 Improving the integrity of specific cutting energy coefficients for energy demand
modelling
122
Figure 6.8: Effect of cutting time on k during a turning operation of EN8 steel alloy
6.5 Conclusions
This work was focused on improving the integrity of specific cutting energy coefficients
for mechanical machining processes. The study has provided data on how the specific
cutting energy varies with un-deformed chip thickness, tool wear, cutting tool nose radius,
dry and flood coolant. The following conclusions were drawn from the study:
Increasing the feed from 0.01 mm/tooth to 0.55 mm/tooth, the specific energy
decreases from 5.34 J/mm3 to 1.47 J/mm
3 for AISI 1045 steel alloy. This is a 72%
reduction in tip energy, which is about 18% reduction in total direct energy demand
assuming that tip energy is on average 25% of total direct energy demand. The
change from low feed per tooth to high feed per tooth shifts the dominant process
mechanism from rubbing/ploughing to shearing dominated zones. Therefore, to
k = 0.408t + 1.0278
R² = 0.93
2.0
2.5
3.0
3.5
4.0
4.5
2.0 3.5 5.0 6.5 8.0 9.5
Sp
ecif
ic c
utt
ing
en
erg
y k
(J
/mm
3)
Cutting time (mins)

Chapter 6 Improving the integrity of specific cutting energy coefficients for energy demand
modelling
123
reduce the energy intensity of machining processes, roughing or bulk material
removal should be undertaken at un-deformed chip thickness greater than the tool
edge radius.
Tool wear can increase the specific energy coefficient by an average of 52% when
turning EN8 steel alloy. Assuming that tip energy is 25% of the total energy
demand then tool wear can increase total energy by an average of 13%.
The flood cutting environment decreases the specific energy coefficient by an
average 28% when compared to dry cutting in normal shear mode cutting
conditions. This is estimated to be a 7% reduction in total energy demand in
machining when assuming that tip energy is on average 25% of the total energy
demand.
For nose radius of 1.2, 0.8, and 0.4 mm the specific energy does not significantly
change in shear dominated cutting mechanism zones. However, at very low un-
deformed chip thickness, the 0.8 mm nose radius tool appears to give the best and
lowest specific energy values.
This study has provided a benchmark that total energy demand in mechanical
machining processes can be reduced or increased by 18%, 13%, or 7% by selection
of un-deformed chip thickness, by tool wear and use of cutting fluids respectively.
These factors need to be taken into account if the margin of energy demand
improvement is comparable. There is a strong case for selection of optimum
feedrates and hence chip thickness in order to reduce the energy intensity of
machining processes. Choosing between a tool nose radius of 0.4 mm, 0.8 mm or
1.2 mm does not significantly alter the specific energy demand in shear dominated
cutting zones. These choices are within the grasp of machine shops and end users

Chapter 6 Improving the integrity of specific cutting energy coefficients for energy demand
modelling
124
since they may not significantly influence the basic power demand unless by choice
of machines.

125
CHAPTER 7
SPECIFIC ENERGY BASED EVALUATION OF
MACHINING EFFICIENCY
7.1 Abstract
Rubbing and ploughing increases the tool tip energy demand in machining. An efficient set
of cutting conditions would direct the energy into material shearing and hence value
adding activity. In this work, specific ploughing energy was investigated on AISI 1045
steel alloy, titanium 6Al-4V alloy and aluminium AW6082-T6 alloy materials. The
relationship between shear angle and specific ploughing energy is explored. An optimised
model for width of cut and un-deformed chip thickness at which ploughing effect would be
minimal is proposed. The proposed methodology can be used to derive the specific
ploughing energy for minimum tip energy demand. It also contributes towards the design
of machines.
Keywords: Specific ploughing energy, swept angle, cutter engagement, un-deformed chip
thickness, specific cutting energy coefficient.

Chapter 7 Specific energy based evaluation of machining efficiency
126
7.2 Introduction
7.2.1 The Total Specific Energy and Chip Morphology
The electrical energy input into machining processes can cater for material shearing,
ploughing, friction, new surface generation, chip momentum change [12] and machine
tool energy losses and process upkeep. The modelling of specific energy in machining
relates to the tip energy [44, 46, 60, 62] i.e. the energy required for actual material
removal. Since the surface energy and the momentum energy represents a very small and
negligible amount compared to the specific frictional and specific shear energies, and also
because they do not contribute to chip removal processes, they are incorporated into the
specific ploughing energy [48]. Therefore, the total specific cutting energy Ke in Jmm-3
can
be categorised as in Equation 7.1.
spfe kkkK (7.1)
where Ke is the total specific cutting energy, kf represents the specific friction energy in
Jmm-3
; kp is the specific ploughing energy in Jmm-3
and ks is the specific shearing energy in
Jmm-3
.
The estimated value of the specific cutting energy varies for different machining processes
even when the workpiece material properties remain the same. For example, the specific
cutting energy of grinding operations is higher compared to other machining processes like
turning and milling [49]. This is due to the inefficient nature of the abrasive grit in grinding
compared to the use of defined cutting edges as in other mechanical machining processes.
The knowledge of specific energy can be important [49] because for example, the specific
cutting energy in grinding operations influences surface integrity of machined components
[67] and is one of the characteristics of ploughing effect.

Chapter 7 Specific energy based evaluation of machining efficiency
127
Ploughing effect can be explained as the action of the cutting tool pushing the material
(especially at un-deformed chip thickness lower than the cutting edge radius) upwards
and/or side ways to form a ridge-like structure and burrs on top, at the entry, exit or side of
the machined surfaces depending on the type of machining operations.
The consumed electrical energy demand for ploughing is undesirable. This is because
often, no desired work is done and this is a waste of energy (with the exception of grinding
operations) since; the ploughed materials remain attached to the workpiece material after
the tool pass. This effect is indicated by the surface integrity [72, 90]. Ploughing effect has
also been identified to affect the geometrical accuracy of machined products [72, 91-92].
Therefore, it is desirable to reduce or if possible eliminate the specific ploughing energy in
mechanical machining processes. Ploughing is encouraged by a lower ratio of un-deformed
chip thickness to the cutting edge radius. This scenario is known as ‘size effect’ in
mechanical machining processes.
Lucca et al. [47] used ploughing and elastic spring back effect to explain the increase in
specific cutting energy. In a previous work, Lucca et al. [93] used the relation between the
un-deformed chip thickness and the cutting edge radius to explain the transition from
shearing dominated machining process to ploughing dominated process. The authors
further reported that in ploughing dominated machining processes, the force per unit width
in the thrust direction was found to increase more rapidly than the force per unit width in
the cutting direction. This implies that the tool edge condition has a significant effect on
the thrust forces when the depth of cut was below the tool edge radius. In this case, rubbing
phenomenon is predominant and this resulted in higher friction forces at the tool-chip
interface [94]. Increase in cutting forces means a corresponding increase in specific cutting
energy.

Chapter 7 Specific energy based evaluation of machining efficiency
128
In studies on brass materials, Taminiau and Dautzenberg [95] reported an increased
specific cutting energy when machining at an un-deformed chip thickness less than the
cutting edge radius. The average specific cutting energy was almost constant when the
ratio of the un-deformed chip thickness to the cutting edge radius is equal or more than
unity.
Singh et al. [96] in their analysis and study of specific ploughing energy for mild steel and
composite ceramics during a grinding operation deduced an equation for the specific
ploughing energy using single grit scratch test [97]. They reported that the specific
ploughing energy was a significant component of total specific grinding energy which is
responsible for around 40% to 80% of the specific grinding energy. This was found to
dominate at low depth of cut especially with materials of hard and high strength such as
conductive ceramic.
7.2.2 Process mechanisms in mechanical machining operations
Chip formation is a good indication of material characteristics and the machinability of
workpiece materials. It has been shown that chip formation not only depends on material
characteristic and cutting tool geometry, but also on the ratio of feed per tooth to cutting
edge radius. Chae et al. [98] show that this ratio is between 5% and 35% of the tool edge
radius. At a value below the minimum chip thickness, no chip will be formed and the
process will be dominated by rubbing and ploughing. This is an indication of high
frictional force at the tool-chip contact interface and plastic deformation of the cutting tool
as a result of high temperature [74, 99].
Researchers explained that the machining process mechanisms were dominated by
rubbing, ploughing and shearing. For example, Chae et al. [98], Ducobu et al. [74] and
Aramcharoen et al. [72] use the relationship between un-deformed chip thickness and

Chapter 7 Specific energy based evaluation of machining efficiency
129
cutting tool edge radius in orthogonal cutting process to define the three established
mechanisms during a mechanical machining process. These are as depicted in Figure 7.1.
Figure 7.1: Effect of un-deformed chip thickness ratio to the cutting edge radius in
orthogonal cutting adapted from [72]
Figure 7.1 shows the relationship between cutting edge radius and the un-deformed chip
thickness during a machining process. The first scenario occurrs when the ratio h/re is less
than the minimum chip thickness. In this case, the cutter will deform elastically and the
workpiece material will be compressed by the cutting tool. Material spring back effect is
dominant where workpiece material is forced under the cutting tool and then recovers back
after the tool passes as shown in Figure 7.1a. The cutting mechanism at this zone is
dominated by rubbing and ploughing effect [73] and as a result of this phenomenon,
cutting and frictional forces increases rapidly [74], rake angle will also increase as a result
of materials gathering around the cutting tool edge radius which will increase the chip
thickness [92]. This will eventually cause an increase of specific cutting energy.
In the second scenario (Figure 7.1b) where the ratio h/re is approximately equal to 1, the
process mechanism consist effect of ploughing and shearing. The process mechanism tends

Chapter 7 Specific energy based evaluation of machining efficiency
130
to move from a rubbing and ploughing dominated area to a shearing dominated zone.
However still, the effect of ploughing exist at this zone and shearing effect tends to be
more dominant [74]. Although a chip is formed, the workpiece material undergoes an
elastic deformation and recovery at the desired depth of cut after the tool pass. Thus, the
removed material is less than the desired value giving rise to a poor dimensional accuracy
and surface integrity.
Figure 7.1c show the third scenario. In this zone, the ratio h/re is greater than 1. The elastic
deformation of the workpiece decreases rapidly and an improved chip is formed. In this
zone, the process mechanism tends to be value adding and sustainable machining. A lower
specific energy demand is an expected characteristic in this zone and an indication of the
efficiency of the process.
Other force components, for example the ploughing force components, are neglected either
because they cannot be measured or they do not contribute to chip formation processes and
considered too small. The ploughing force, difficult to be isolated from the measured force
data [100] is notably significant in tool wear assessment and monitoring, material flow
stress calculation, chip formation mechanisms, and machined surface integrity. The impact
of the process mechanisms ultimately affects the tool tip energy demand of the process.
The process mechanisms can also be used to define the efficiency of the machining
operations. In the case where rubbing and ploughing are said to be dominant, the process is
within the ‘Waste’ dominated zone since no chips are removed from the workpiece. In the
other hand, if the process is dominated by shearing effect, then it can be said to be a ‘Value
adding’ operations. Therefore, for a process to be energy centric, efficient and sustainable,
it should be within the value adding zone. A zone whereby rubbing and ploughing effect
are reduced and/or eliminated and shearing effect encouraged.

Chapter 7 Specific energy based evaluation of machining efficiency
131
7.3 Research aim and Objective
The aim of this work was to investigate the process mechanism during milling operations.
This was to enable the identification of process parameters and evaluate process efficiency
at which the mechanisms of rubbing, ploughing and shearing effect are dominant. The
study also aimed to propose a methodology to estimate the specific ploughing energy and
optimise cutter engagement. The result will enable process and system designers to
optimise electrical energy usage for resource efficiency and sustainable manufacture of
products.
7.4 Experimental strategy and set up
7.4.1 Swept angle optimisation and their influence on specific ploughing in milling
processes
In order that the optimised radial depth of cut is engaged, a pilot test was carried out on
AISI 1045 steel alloy. A general purpose TiAlN coated carbide single insert SOMT-
060204-HQ with geometry shown in Table 7.1 was used for the side milling test. The
milling test was conducted on a high speed Mikron HSM 400 machining centre under a dry
cutting environment. This study was to investigate the correlation between the radial depth
of cut and ploughing effect during a milling operation.
For this experiment, the radial depth of cut ae, feed rate, and depth of cut were varied as
shown in Table 7.2. The side milling test was conducted in such a way that each test
engaged a different swept angle. The swept angles and the un-deformed chip thicknesses
were estimated with Equations 7.2 and 7.3 [65] respectively considering the radial depth
of cut for each set of milling test.

Chapter 7 Specific energy based evaluation of machining efficiency
132
(7.2)
where Ø is the swept angle in degrees, r is the cutter radius in mm and ae is the cutter
engagement or step over in mm.
(7.3)
where hm(avg) is the average un-deformed chip thickness in mm, fz is the feed in mm/tooth,
φs is the swept angle in radians.
Table 7.1: Cutting tool geometry
Geometry Values
Nose radius (mm) 0.4
Edge radius (µm) 60
Positive Rake angle
(degrees)
5
Rake face primary chip
breaker land (µm)
60
Clearance angle (degrees) 7

Chapter 7 Specific energy based evaluation of machining efficiency
133
Table 7.2: Cutting parameters for AISI 1045 steel alloy
Feedrates
(mm/min) 62 621 1179 2855 3413
Feed fz
(mm/tooth) 0.01 0.10 0.19 0.46 0.55
Radial depth
of cut ae (mm) 0.20 0.40 0.60 0.80 1.00
Figures 7.2, 7.3, 7.4, 7.5 and 7.6 shows the relationship between power demand and
material removal rate during side milling operations of AISI 1045 steel alloy.
Figure 7.2: Power –Material removal rate graph at 18.20 Swept angle
P = 7.80Q + 2990.5
R² = 0.92
2900
3000
3100
3200
3300
3400
0 5 10 15 20 25 30 35 40
Po
wer
(W
)
Material removal rate (Q) (mm3/s)
vc = 156 m/min
fz = 0.01 - 0.55 mm/tooth
ap = 3.5 mm

Chapter 7 Specific energy based evaluation of machining efficiency
134
Figure 7.3: Power –Material removal rate graph at 25.80 Swept angle
Figure 7.4: Power –Material removal rate graph at 31.80 Swept angle
P = 3.73Q + 3009
R² = 0.85
2900
3025
3150
3275
3400
0 20 40 60 80
Po
wer
(W
)
Material removal rate (Q) (mm3/s)
vc = 156 m/min
fz = 0.01 - 0.55 mm/tooth
ap = 3.5 mm
P = 2.78Q + 3017.1
R² = 0.88
2850
2950
3050
3150
3250
3350
0 20 40 60 80 100 120
Po
wer
(W
)
Material removal rate (Q) (mm3/s)
vc = 156 m/min
fz = 0.01 - 0.55 mm/tooth
ap = 3.5 mm

Chapter 7 Specific energy based evaluation of machining efficiency
135
Figure 7.5: Power –Material removal rate graph at 36.90 Swept angle
Figure 7.6: Power –Material removal rate graph at 41.40 Swept angle
P = 2.11Q + 3024
R² = 0.88
2900
3000
3100
3200
3300
3400
0 50 100 150 200
Po
wer
(W
)
Material removal rate (Q) (mm3/s)
vc = 156 m/min
fz = 0.01 - 0.55 mm/tooth
ap = 3.5 mm
P = 1.56Q + 3070.7
R² = 0.80
2900
3000
3100
3200
3300
3400
0 50 100 150 200
Po
wer
(W
)
Material removal rate (Q) (mm3/s)
vc = 156 m/min
fz = 0.01 - 0.55 mm/tooth
ap = 3.5 mm

Chapter 7 Specific energy based evaluation of machining efficiency
136
The specific energy coefficient is represented by the slope of the Power- Material removal
rate trend line and tabulated in Table 7.3. It was observed that as the swept angle increases,
the specific energy reduces varying from 7.80 to 1.56 Jmm-3
. This is due to the fact that the
milling test gradually moved from smaller to higher chip thickness and from a ploughing
dominated area to a shearing dominated one. Therefore, it can be deduced that to reduce
ploughing effect in milling processes, a higher swept angle must be engaged.
Table 7.3: Specific energy coefficient data for AISI 1045 steel alloy obtained from tests
Swept angle
fz (mm/tooth) hm average (mm) Degrees (o) Radians
(rad)
k (Jmm-3)
0.010 0.002 18.2 0.318 7.80
0.100 0.022 25.8 0.450 3.73
0.190 0.051 31.8 0.555 2.78
0.460 0.143 36.9 0.644 2.11
0.550 0.190 41.4 0.723 1.56
Analyzing further, the relationship between specific energy coefficients was plotted against
the swept angles. The result shows a non-linear relationship. It can be seen from Figure 7.7
that at lower swept angles 0.318 rad (ae of 0.2 mm), the specific energy was 7.80 Jmm-3
while the values decreases to a value of 1.56 Jmm-3
for swept angle 0.723 rad. The lower
range of specific energy values are relatively comparable to published values in literature
[12].

Chapter 7 Specific energy based evaluation of machining efficiency
137
Figure 7.7: Optimum swept angle
Following on from Figure 7.7, a quadratic trend curve fitted well with R2 of 0.98. The
regression equation derived from Figure 7.7 is stated in Equation 7.4.
Differentiating the regression equation:
(7.4)
Differentiating Equation 7.4 with respect to the swept angle;
(7.4b)
(7.4c)
It can be seen that the optimum swept angle for minimizing the specific energy for the
insert nose radius of 0.4 mm used is 39.64o (i.e. 0.692 rad). At this angle, the shearing
effect will be dominant. The specific cutting energy is therefore at an optimized value
k = 42.25Q2 - 58.46Q + 21.96
R² = 0.98
1.50
2.50
3.50
4.50
5.50
6.50
7.50
8.50
0.30 0.35 0.40 0.45 0.50 0.55 0.60 0.65 0.70 0.75
Sp
ecif
ic C
utt
ing
En
erg
y k
(J
/mm
3)
Swept Angle (Radians)

Chapter 7 Specific energy based evaluation of machining efficiency
138
when compared with a lower swept angle of 18.2o (i.e 0.318 rad). Hence, the step over
which equates to the optimum specific cutting energy can be estimated.
From Figure 7.8, the average un-deformed chip thickness is defined as in Equation 7.3 and
the swept angle deduced based on Equation 7.2.
Figure 7.8: Cutter engagement with workpiece.
From Equations 7.2 and 7.4c, the cutter engagement can be estimated thus:
(7.5)
From this case study, the cutter diameter was 8 mm, and the experimental optimum swept
angle was 39.64o, it therefore follows from Equation 7.5 that the optimum cutter

Chapter 7 Specific energy based evaluation of machining efficiency
139
engagement should be 0.92 mm offset. Also, from Figure 7.8 and Equation 7.3, the un-
deformed chip thickness can be estimated as stated in Equation 7.6.
(7.6)
= Optimised maximum un-deformed chip thickness (7.6b)
where hmax is the maximum un-deformed chip thickness in mm, fz is the chip load in
mm/tooth and ae is the step over or the radial depth of cut in mm.
Hence, for optimized values of the specific cutting energy that would improve process
efficiency, the step over ae should not be less than 0.23*r and the maximum un-deformed
chip thickness should not be less than 0.64*fz. This equation agrees with Campatelli et al.
[101], when they reported that the optimal value of the radial engagement (i.e. radial width
of cut) to minimize the specific energy that is related only to the efficiency of cutting is
achieved by maintaining the value suggested by the tool manufacturer, about 1 mm and at
that value, the feed per tooth shows an optimal design value for a 0.12 mm/tooth. For
example, in comparing Campatelli et al. [101] results and from Equation 7.6b, (assuming
feed/tooth is 0.12 mm/tooth), it therefore implies that the un-deformed chip thickness is
equal to 0.077 mm. This also implies that the ratio of the un-deformed chip thickness to
cutting edge radius is equivalent to 1.28 (cutting edge radius of insert used is 0.06 mm from
Table 7.1). This value also correlates to the point at which the effect of shearing dominates
the rubbing and ploughing effect. The specific energy at this point is expected to be
comparably lower when compared to the rubbing-ploughing dominated machining.
In order to estimate the machining process efficiency that would distinguish the value
adding and waste processes, an understanding of the process mechanism is necessary. This
will enable the process to be adequately categorized and evaluated. Therefore, the milling

Chapter 7 Specific energy based evaluation of machining efficiency
140
experiment was designed with the understanding that the specific energy is increased when
step over << 0.23r and h <<0.64fz. This range of values would adequately account for the
specific energy controlled by the process mechanisms i.e. rubbing, ploughing and shearing.
This range of values also define value adding and waste criterion of the process.
Since the impact of the ploughing effect is increased at values of ae and fz less than the
proposed values, the ranges of values for the step over were set to overlap the proposed
values. Hence, the step over were set at 0.063r, 0.125r, 0.188r and 0.25r. This values
equates to swept angles of 20.36o, 28.96
o, 35.66
o and 41.41
o. The value of fz was set at
0.01, 0.10, 0.19, 0.28, 0.37, 0.46 and 0.55 mm/tooth. These values equates to un-deformed
chip thickness h of 0.003, 0.035, 0.066, 0.097, 0.128, 0.159 and 0.190 mm respectively as
shown in Table 7.4. These ranges would allow the milling to be carried out within the
ploughing and shearing domain so that a clearer picture of the ploughing effect could be
observed and properly represented on the specific energy variation curve.
7.4.2 Estimation of the specific ploughing energy
With knowledge of the optimized cutter engagement and un-deformed chip thickness
values, a side milling test was conducted on aluminium AW6082-T6 alloy, AISI 1045 steel
alloy and titanium 6Al-4V alloy under Mikron HSM 400 machining centre with a spindle
HVC140-SB-10-15/42-3FHSK-E40 and Heidenhain TNC 410 NC controller. A general
purpose multi-layered TiAlN coated carbide single insert SOMT-060204-HQ with
geometry as in Table 7.1 was mounted on a tool holder E90X-D08-C10-06 with an
overhang of 25mm. The cutting parameters and chemical composition of the workpiece
materials were as stated in Table 7.4. The machining trials were conducted under a dry
cutting environment. Each workpiece materials of size 50mm X 100mm X 3.5mm was
clamped supported by parallel slips on a milling vice. The material overhang was limited

Chapter 7 Specific energy based evaluation of machining efficiency
141
to 12 mm just enough to accommodate a set of machining trial and to eliminate the effect
of vibrations of the workpiece materials during the machining process. Each milling trial
was repeated three times. A new cutting tool edge was introduced for a new set of trials in
order that wear characteristics was not introduced into the electrical current measured. The
electrical current consumption was measured with a FLUKE 345 Power Clamp meter. The
side milling tests were conducted based on the procedure previously published by Balogun
and Mativenga [88].
Table 7.4: Workpiece materials and cutting parameters for milling trials
Aluminium Alloy
AW6082-T6
AISI 1045 Titanium alloy
6Al-4V
Feed (mm/tooth) 0.01 – 0.55 0.01 – 0.55 0.01 – 0.55
Depth of cut (mm) 3.5 3.5 3.5
Cutting velocity (m/min) 210 156 80
Radial depth of cut (mm) 0.25 – 1.00 0.25 – 1.00 0.25 – 1.00
Tool diameter (mm) 8 8 8
Chemical composition
(Max)
1%Mn, 0.5%Fe,
1.2%Mg, 1.3%Si,
0.1%Cu, 0.2%Zn,
0.1%Ti, 0.25%Cr,
Balance Al.
0.46%C,
0.40%Si,
0.65%Mn,
0.40%Cr, 0.10
Mo, 0.40%Ni,
0.63% Others
89.37%Ti,
6%Al, 4%V,
0.08%C,
0.3%Fe,
0.2%O2,
0.05%N
Material Hardness HV 100 HV 146.4 HV 329

Chapter 7 Specific energy based evaluation of machining efficiency
142
In order for that the specific ploughing energy be properly accounted for, an analysis based
on the work of Balogun and Mativenga [88] was adopted and the specific energy
coefficient values derived based on the optimised swept angle and un-deformed chip
thickness analysis previously reported in this paper. The specific energy coefficients
obtained on three different wokpiece material was as shown in Table 7.5. It can be seen
that at a lower feed for example 0.010 mm/tooth, the specific energy coefficients were
13.08, 10.66 and 5.31 Jmm-3
for aluminium AW6082-T6 alloy, titanium 6Al-4V alloy and
AISI 1045 steel alloy respectively.
The higher values of specific energy at such un-deformed chip thickness is a result of the
contribution of ploughing effect at which rubbing, higher frictional effect and plastic
deformation of the cutting tool dominate. From Figure 7.9, it is shown that as the un-
deformed chip thickness increases, the ploughing effect tends to decrease and eventually
eliminated as the feed increases. This phenomenon is not the same for all machining
processes. For example, in micro-machining where components are miniaturized,
ploughing effect cannot be avoided since the ratio of un-deformed chip thickness to the
cutting edge radius is always less than unity. However, with adequate knowledge of the
range of specific energies, an optimised value can be estimated to avoid catastrophic wear
and/or damage of the cutting tools. This will cause an improvement on the surface
integrity of the machined component and also reduce the values of specific ploughing
energy.

Chapter 7 Specific energy based evaluation of machining efficiency
143
Figure 7.9: Impact of size effect on Specific cutting energy for dry cutting AISI 1045 steel
alloy
Table 7.5: Experimental specific energy coefficient values
Materials
Cutting variables AISI 1045 Aluminium alloy Titanium alloy
fz (mm/tooth) vc (m/min) ap (mm) Specific energy coefficient (Jmm-3
)
0.01
156 3.5
5.31 13.08 10.66
0.10 3.73 1.99 4.45
0.19 2.08 1.52 3.28
0.28 1.97 0.78 2.55
0.37 1.65 0.87 2.65
0.46 1.55 0.21 1.14
0.55 1.47 0.21 1.13
Value
adding
Process
waste

Chapter 7 Specific energy based evaluation of machining efficiency
144
7.4.3 Proposed analysis of the Specific Ploughing Energy
The specific energy coefficients obtained for AISI 1045 steel alloy, aluminium AW6082-
T6 alloy, and titanium 6Al-4V alloy respectively were plotted against the ratio of the un-
deformed chip thickness to the cutting edge radius for the three materials under
investigation. Figures 7.10, 7.11 and 7.12 show the contribution of ploughing effect on the
specific energy curves.
From Figure 7.9 two distinctive regions can be observed. The first region is where the un-
deformed chip thickness is less than the cutting edge radius. At this region, it is observed
that higher values of specific energy resulted. This is due to the influence of ploughing
effect. At this point also, the spring back effects are pronounced and diminutive or no chips
are formed [72, 74, 102-104]. The boundary is a point where the ratio of un-deformed chip
thickness and the cutting edge equals unity and the second region is a near constant trend
zone of specific energy values where the un-deformed chip thickness is greater than the
cutting edge radius.
In micro, nano and peso machining, the cutting plane usually falls within the first region
where ploughing is dominant thereby an increase in the tool tip energy will be observed.
Whereas, in the case of macro-machining, the cutting plane lies within the third region
where shearing is dominant and the values of the specific energy recorded agrees with that
available from literature [12].
Figures 7.10, 7.11 and 7.12 show that at higher value of un-deformed chip thickness, for
example above 66 µm for AISI 1045 steel alloy, the relationship between specific energy
and h/re is more or less linear. The tool edge radius was 60 µm. Therefore fitting a straight
trend line AB to the experimental data curve for h > 66 µm and extrapolating to h/re = 0,
gives a value which can be interpreted as the point of maximum shear. Therefore the

Chapter 7 Specific energy based evaluation of machining efficiency
145
intercepted point A gives a value equivalent to the maximum specific shear energy of 2.25,
2.42 and 4.91 Jmm-3
, for aluminium AW6082-T6 alloy, AISI 1045 steel alloy and titanium
6Al-4V alloy respectively as depicted in Figures 7.10, 7.11 and 7.12. Machining processes
conducted within these range of values are called the “Value-adding process”.
Figure 7.10: Shear energy estimation of AISI 1045 steel alloy
Figure 7.11: Shear energy estimation of aluminium AW6082-T6 alloy
k = -0.32(h/re) + 2.42
R² = 0.94
k = 2.26(h/re)-0.33
R² = 0.91
0
1
2
3
4
5
6
7
0.0 0.5 1.0 1.5 2.0 2.5 3.0 3.5
k (
J/m
m3)
h/re
B
A C
Process
waste
Value
adding
process
k = -0.71(h/re) + 2.25
R² = 0.92
k = 1.01(h/re)-0.94
R² = 0.89
0
4
8
12
16
0.0 0.5 1.0 1.5 2.0 2.5 3.0 3.5
k (J
/mm
3)
h/re
B
A CValue
adding
process
Process
waste

Chapter 7 Specific energy based evaluation of machining efficiency
146
Figure 7.12: Shear energy estimation of titanium 6Al-4V alloy
The trend line Equations 7.7, 7.8 and 7.9 of line AB shown in Figures 7.10, 7.11 and 7.12,
represents the maximum specific shear energy equations at which ratio h/re equals zero.
e
Sr
hk 32.042.2max (7.7)
e
Alr
hk 71.025.2max (7.8)
e
Tr
hk 27.191.4max (7.9)
where kS(max), kAl(max) and kT(max) represents maximum specific shear energy of AISI 1045
steel alloy, aluminium AW6082-T6 alloy and titanium 6Al-4V alloy respectively in Jmm-3
.
It also can be deduced that a specific energy value above line AC indicates effects of
ploughing mechanisms (also could include rubbing) and termed “Process waste” zone. For
example during the cutting tests and at fz of 0.01mm/tooth, the total specific energy
k = -1.27(h/re) + 4.91
R² = 0.92
k = 2.78(h/re)-0.51
R² = 0.86
0
2
4
6
8
10
12
14
0.0 0.5 1.0 1.5 2.0 2.5 3.0 3.5
k (
J/m
m3)
h/re
B
A C
Process
waste
Value
adding
process

Chapter 7 Specific energy based evaluation of machining efficiency
147
calculated was 5.31, 10.66 and 13.08 Jmm-3
(Table 7.5) for AISI 1045 steel alloy, titanium
6Al-4V alloy and aluminium AW6082-T6 alloy respectively. At these ranges of values, the
ratio h/re tends towards zero (cutting edge radius re = 0.06 mm). This means that the bulk
of the specific energy is due to ploughing mechanisms and infinitesimally small rubbing
mechanisms. It can be deduced therefore that the specific ploughing energy is 54%, 54%
and 83% of the total specific energy demand for AISI 1045 steel alloy, titanium 6Al-4V
alloy and aluminium AW6082-T6 alloy respectively (these values are true for cutting test
conducted at a feed of 0.01 mm/tooth). This percentage gradually decreases as the ratio h/re
increases more than unity. These values also confirms the work of Singh et al. [96] where
they reported that ploughing effects contributes to about 40% to 80% of the total specific
cutting energy in mechanical machining processes.
This value can be said to be true since ploughing effect dominates as values of h/re << 0 or
approaches an infinitesimal values. Therefore the difference between the maximum
specific shear energy and the experimental maximum value is equivalent to the total
specific ploughing energy used up due to the size effect for side milling the workpiece
materials under investigation.
Therefore, from Figures 7.10, 7.11 and 7.12 the area below the linear trend line AB
indicates an area at which the process mechanisms are optimised and is said to be the value
adding zones. Comparatively, area above the maximum specific shear (line AC) indicates
higher specific energy (i.e. increased ploughing and rubbing mechanisms) hence termed
process waste zone. For the purpose of sustainability and resource efficiency, it is therefore
recommended that machining operations be conducted within area within the maximum
specific shear line AC. This area can be estimated for different workpiece materials as
proposed in this paper.

Chapter 7 Specific energy based evaluation of machining efficiency
148
The process mechanism model can therefore be deduced from the above analysis as shown
in Figure 7.13. The process mechanism model can be used to further describe the cutting
characteristics depicted in Figure 7.10, 7.11 and 7.12. The process mechanism includes
three mechanisms i.e. rubbing, ploughing and shearing. The mechanisms engaged during
machining are dependent on type of cutting operations and ratio h/re.
Looking at the graphs at Figures 7.10, 7.11 and 7.12 the specific cutting energy shows an
exponential increase when the ratio of un-deformed chip thickness to the cutting edge
radius is less than unity and approaches zero. In this zone, the effective rake angle is
predominantly negative and ploughing and rubbing are the dominant process mechanisms.
It can therefore be inferred that higher specific energies are correlated to process
inefficiency through rubbing and shearing.
The above result shows that at lower ratio h/re, the specific ploughing energy is higher
more than 50% of the specific energy required for milling any workpiece materials. More
so, the values become higher with ductile materials. For example for aluminium AW6082-
T6 alloy, this could be above 60%. The result further confirms the work of Schaller et al.
[105] and Mian et al. [106] that the specific ploughing energy is relatively higher in ductile
materials. This methodology can be applied to determine maximum specific shear energy
demand and specific ploughing energy for machining.
In analysing the process mechanisms, the impact of ploughing and rubbing was quantified
based on the average specific shear energy required to create a value adding operation.
This was achieved by assuming a range of values for the ratio h/re from 0.01 to 2 and
substituting their values into, for example, Equation 7.7 for AISI 1045 steel alloy. The
effect of rubbing and ploughing can hence be shown as in Figure 7.13.

Chapter 7 Specific energy based evaluation of machining efficiency
149
This energy demand value is an indicator of the efficiency of the machining operation
engaged. From Figure 7.13, it can be seen that as the ratio of un-deformed chip thickness
to the cutting edge radius increases from 0.01 to 2 and above, the percentage of the
ploughing and rubbing effects gradually decreases from 78% to 5%. This is a further proof
that in order to improve the efficiency of a machining operation and at low tip energy
demand, the ploughing effect should be reduced or eliminated if possible. However, since
the machining processes are a combination of roughen and finishing, the effect of
ploughing might not be eliminated or ignored. For example, in grinding operation whereby
the grit size of the grinding wheel are often equal to or less than the chip thickness, the
ploughing energy could be considerably higher compared to other machining operations.
Figure 7.13: Ploughing energy variations with process parameter for AISI 1045 steel alloy
Assuming machining AISI 1045 alloy steel with h/re = 1 ( i.e. un-deformed chip thickness
and cutting edge radius are both 0.06 mm); then the optimised specific energy for milling
AISI 1045 will be 2.26 J/mm3 as previously shown in Figure 7.9. The estimate for the
0
20
40
60
80
0.01 0.10 0.50 1.00 1.50 2.00
Plo
ugin
g +
ru
bb
ing en
ergy (
%)
h/re

Chapter 7 Specific energy based evaluation of machining efficiency
150
specific energy was derived using the power function equation obtained from the specific
energy- h/re.
7.5 Conclusion
In this study, a new optimised value at which ploughing is minimum was developed. The
values correspond to 39.65o swept angle when machining with a tool that has an edge
radius of 60 µm. This value was derived for different workpiece materials and cutting
parameters. Other conclusions derived from the study include:
The specific ploughing energy can be estimated with the proposed methodology of
extrapolation of the specific energy curve to the point where h/re is zero.
The specific shear energy is 52%, 63.8% and 69% for AISI 1045 steel alloy,
titanium 6Al-4V alloy and aluminium AW6082-T6 alloy respectively when
compared to the specific energy values.
Ductility characteristics of workpiece materials affect the specific cutting energy.
In order to improve the process efficiency in mechanical machining, shearing
dominated machining should be encouraged.
Machining efficiency can be improved by over 50% without compromise to
workpiece surface integrity by controlling tool stepover to reduce the energy
wasted in rubbing and ploughing.
A pre-knowledge of the values of the specific ploughing energy can aid pre-process
and support energy resource management.

151
CHAPTER 8
DIRECT ELECTRICAL ENERGY DEMAND IN FUSED
DEPOSITION MODELLING
8.1 Abstract
3D printing is predicted to grow and underpin distributed manufacture of customized and
geometrically complex products. At this early stage of technology development it is timely
to consider and optimize the resource efficiency of these layered manufacturing
technologies. In this work, the direct electrical energy demand in one of the most popular
technologies, fused deposition modelling was studied and a generic model for direct
energy demand in layered manufacture proposed. The performance of Fused Deposition
Modelling was further benchmarked to machining processes in order to throw light on the
relative energy demands for alternative manufacturing processes. The work is a foundation
for electrical energy demand modelling and optimisation for the rapidly expanding 3D
printing processes.
Keywords: Energy; Rapid prototyping; Fused deposition
8.2 Introduction – Layered Manufacturing Technologies
Rapid prototyping (RP) or layered manufacturing (LM) are additive manufacturing
techniques that build up the product layer by layer [107]. In these techniques the part is

Chapter 8 Direct electrical energy demand in Fused Deposition Modelling
152
fabricated from a 3D solid model produced in Computer Aided Design (CAD) packages.
The process is considered to be material efficient because material is added in layers and
therefore reducing the amount of material wasted in producing a part compared to material
removal processes [108]. Additional characteristics and benefits of additive manufacturing
techniques are well documented [109-110]. As rapid prototyping, this technology was
initially developed to produce prototypes of physical models as fast as possible using
polymers [111]. This largely reduces errors and cycle time in new product development
and accelerates time to market. Today, layered manufacturing is growing as a means for
3D printing of customized parts, or as a repair technique for functional high value parts.
In RP technology, CAD models are uploaded to specialist software. This software slices
the model in the z-axis so that an RP machine can construct a 3D replica of model in layers
without needing tooling. Post processing may be required if support material is used in
fabrication.
Various layered manufacturing techniques have been developed, these include Stereo
Lithography (SLA), Fused Deposition Modelling (FDM), Ink Jet Printing (IJP), 3D
Printing (3DP), Selective laser sintering (SLS), Selective laser melting (SLM), 3D laser
cladding process, Laminated object manufacturing (LOM) and Laser chemical vapour
deposition (LCVD) [112-113]. It has been reported that [114] RP can cut costs by up to
70% and reduces time to market of finished parts by 90% when compared to other
conventional manufacturing methods. Manufacturing of functional parts through these
technologies in 3D printing is predicted to grow and underpin distributed manufacture of
customized and geometrically complex products.

Chapter 8 Direct electrical energy demand in Fused Deposition Modelling
153
8.2.1 Fused Deposition Modelling
Fused deposition modelling (FDM) was developed by Stratasys Inc. and has grown to
become one of the most popular RP processes [110]. A thermoplastic filament is unwound
from a spool that supplies material to a heated extrusion nozzle. As the filament passes
through the nozzle, it is melted and extruded onto a build platform to form bonded bead
and road width which rapidly solidifies. The machine follows a hatch strategy for each
model cross-sectional layer as generated in the STL file slicing software. When a layer is
finished, the build platform then indexes down and another layer is fabricated. The
common material used is Acrylonitrile butadiene styrene (ABS), which combines the
strength and rigidity of acrylonitrile and styrene polymers with the toughness of
polybutadiene rubber. ABS has many daily applications as material for example for Lego
bricks, toys, golf club heads, automotive trim components, automotive bumper bars etc.
In FDM process, fabrication occurs inside a temperature controlled chamber. The heated
nozzle is mounted on to a motion system that can move in the X-Y plane within the
chamber. For the base bridge as a foundation to lay the part and for large overhangs and
complex geometries, the nozzle also extrudes support material when required. Thus, the
part has to be post processed to remove any support material. For the Stratasys Dimension
SST FDM, this is done in a heated bath of detergent which selectively dissolves the
support material and leaves the part material. Other FDM machines do not provide this
soluble support material and hence the support structures have to be broken down
manually.
It is generally acceptable that because FDM and other layered manufacturing technologies
are based on material addition they are more material efficient compared to mechanical
machining processes. However the energy intensity of layered manufacturing process has

Chapter 8 Direct electrical energy demand in Fused Deposition Modelling
154
not received much attention. It is timely at this early stage of the technology development
to embed resource efficiency in developing and optimizing manufacturing techniques.
8.2.2 Research Aim
This work was aimed at investigating the direct electrical energy requirements of Rapid
Prototyping (RP) and Rapid Manufacturing (RM) with a view to understand how the
energy demand varies for different FDM machines (machines based on the same process
mechanism), develop a mathematical model or framework for electrical energy modelling
in 3D printing process and evaluating the electrical energy intensity of material additive
process to that of mechanical machining.
The electrical energy requirement for a manufacturing process was studied by Gutowski et
al., [31] who proposed a mathematical model for the electrical energy based on machine
tools on a Toyota automobile production line. In their model, they categorized the
electrical energy demand into two groups i.e. ‘Basic State’ and ‘Cutting State’. Along these
lines the vision for this work was to use energy monitoring and event streaming to study
the energy demand for fused deposition modelling and explore the effect of different FDM
machines available in Manchester but made by different systems developers. To put this in
context, energy demand for Fused Deposition Modelling was benchmarked to using a high
speed milling machine to machine a similar component. The contribution would help to
assess the energy efficiency of FDM technology and identify priority areas for
improvement.

Chapter 8 Direct electrical energy demand in Fused Deposition Modelling
155
8.3 Energy Demand in Fused Deposition Modelling
8.3.1 Energy States of Fused Deposition Modelling Machine
In order to investigate and classify build process activities and energy profile for FDM
machines, a series of reference moves were carried out during the fabrication processes.
The FDM machine was switched ON and the current consumption for the machine states
was measured and categorised. This method allows the current consumption to be
differentiated at each stage of the build process. The current consumption was measured
with the Fluke 345 Power Quality Clamp Meter. The machine cycle was repeated three
times (on different days) to generate and compare current profile at each state. The current
consumption was measured from ‘Start-up’ and at room temperature for each day. The
current profile shown in Figure 8.1 is representative of the current profile ultimately
measured on a Stratasys Dimension SST FDM when building a first component starting
from room temperature.
Figure 8.1: Power-time curve for Stratasys Dimension SST FDM machine building from
room temperature

Chapter 8 Direct electrical energy demand in Fused Deposition Modelling
156
As the FDM machine Starts-up, it took the machine 270 seconds to attain a temperature of
68oC within the build chamber. This start-up time is marked in Figure 8.1. This process
occurred just once in the course of a day or after the machine had switched off and allowed
to cool back down to room temperature. However, once the machine has acquired the
required temperature, it takes less time to be ready for next build. From the first build test
on the Stratasys Dimension SST FDM as shown in Figure 8.1, there were four different
electrical energy consumption states in the FDM build process.
Start-up State: This state occurs after the power up and initial start-up of the
machine.
Warm-up State: This state occurs after the Start-up. The machine is heated up
initially until the build chamber reaches between 61oC to 68
oC inside chamber
temperature. The Warm-up stage continues until the filament materials attain a
temperature of 102oC to enable extrusion through the build nozzle or nozzles. The
melting point of Acrylonitrile Butadiene Styreneplastics ABS material is about
105°C.
Ready State: At this state, the nozzle finds the home position by referencing the x,
y and z-axes and positions itself to a point just about to start building. The machine
could be at this state for longer than necessary depending on the operator’s speed to
load the “SLICE” file.
Build State: The fabrication of the part commences at this state. This state
encompasses any operation that the machine does from receiving the “SLICE” file
(part program) initialisation to part completion. The peaks and the troughs observed
during building on all the energy profiles are a result of the nozzle movement and
material deposition by the FDM machine. The peaks and higher energy periods are

Chapter 8 Direct electrical energy demand in Fused Deposition Modelling
157
when the nozzle is extruding material and actually building the layers of the model.
The lower energy periods are when the nozzle is returning to its start point to begin
building another layer.
Not shown in Figure 8.1 is Post Processing for which Stratasys Dimension SST FDM uses
soluble supports, a water-based solution designed to simply wash away the support
material enabling support removal from complex models. The solution for removing
support material can be NaOH and will be in a powered tank usually operated at a warm
solution temperature and with washing mechanically assisted by ultrasonic vibration. This
adds up the energy demand.
During the first build, it was observed that the electrical energy demand to power up the
FDM machine from Start-up state to Build state was 897 Wh. Figure 8.2 shows that Start-
up, Warm-up, Ready and Build energy demand states consumed 3%, 14%, 73% and 10%
respectively when the FDM machine was started from room temperature to part
completion.
Figure 8.2: Power-time curve for Stratasys Dimension SST FDM machine building from
room temperature

Chapter 8 Direct electrical energy demand in Fused Deposition Modelling
158
After the first build and allowing the machine to cool down for 5 minutes (this time is
assumed the period for unloading and loading a new model for build), the same part was
fabricated again. This was done to compare the effect of temperature on the total electrical
energy demand. As expected, the energy for the warm-up state reduced by 96% as shown
in Figure 8.2. This is a clear indication that batching jobs and building more than one part
can reduce the electrical energy per part considerably.
8.3.2 New Framework for direct energy requirements in FDM
Following the increasingly common classification of manufacturing process energy states
after Gutowski et al., [31] and the Cooperative Effort on Process Emissions in
Manufacturing CO2PE! [24] into Basic and Tip energy, a generic equation for direct
electrical energy requirements in layered manufacturing is proposed as shown in Equation
1. This is based on Basic and Value Adding energy states.
vavabb tPtPE (8.1)
where E is the total electrical energy in J, Pb, Pva represents basic and value adding power
in W, and tb, tva are the corresponding time for basic and value adding operations in
seconds. Equation 8.1 can be expanded for the value adding energy demand as shown in
Equation 8.2.
vaRmbb tVetPE (8.2)
where E is the direct energy requirement in J for RP and RM processes, bP is the basic
idle power in W consumed for non value adding activities, bt is the basic energy state
duration in s, me is the specific material printing energy as determined by the materials and

Chapter 8 Direct electrical energy demand in Fused Deposition Modelling
159
process mechanism in Jmm-3
, RV is the volumetric manufacturing rate in mm3/s and vat is
the build time in s.
The value bP and bt can be expanded into start-up state, warm up state, ready state, basic
state, nozzle positioning and post processing power demand. These can be measured for
particular machines.
8.3.3 Benchmarking of 3 different FDM technologies
To explore the variability of energy demand according to the machine systems concepts, 3
different FDM machines available at the University of Manchester were used to build a
simple standardized model, shown in Figure 8.3, of 9,000 mm3 volume. Table 8.1 shows
the specifications of the machines used, while Figures 8.4 and 8.5 shows the images of the
FDM machines.
Figure 8.3: A simple model fabricated on 3 FDM machines to study energy demand

Chapter 8 Direct electrical energy demand in Fused Deposition Modelling
160
The Stratasys Dimension SST and the Dentford Inspire D290 are standard size machines
with enclosed build chambers while the PP3DP is a miniature open chamber machine as
evident from the size of the filament diameter in relation to the machine envelope.
Table 8.1: FDM Machines investigated
Stratasys Dimension SST
FDM
Dentford Inspire
D290
PP3DP
Size (mm) 914 x 686 x 1041 720 x 850 x 1650 245 x 260 x 350
Model Material ABS ABS & PLA
Plastic
ABS
Build Envelope
(mm)
203 x 203 x 305 255 x 290 x 320 140 x 140 x 135
Software Catalyst TierTime Model
Wizard
TierTime Model
Wizard
Jetting heads 2 nozzles 2 nozzles 1 nozzle
Layer thickness
(mm)
0.254 0.100 0.150
Rated Power
(KW)
1.6 2.0 0.22

Chapter 8 Direct electrical energy demand in Fused Deposition Modelling
161
Figure 8.4: From left Dimension SST FDM, Dentford Inspire D290 and PP3DPP
Figure 8.5: Detailed view of low a cost FDM machine model PP3DPP
Figures 8.6, 8.7 and 8.8 represent the power profile measured to fabricate a similar part
from room temperature. It can be observed that the power profile trend for the three FDM
machines follows similar trend as modelled in Equations 8.1 and 8.2. From data input

Chapter 8 Direct electrical energy demand in Fused Deposition Modelling
162
there is a drop in the power as the machine processes the data that has been fed, then, there
is a spike in the power as the machine begins to extrude material and build the part.
Figure 8.6: Power-time curve for Stratasys Dimension SST machine building from room
temperature.

Chapter 8 Direct electrical energy demand in Fused Deposition Modelling
163
Figure 8.7: Power-time plot for Dentford Inspire D290 machine building from room
temperature
Figure 8.8: Power-time plot for PP3DP machine building from room temperature

Chapter 8 Direct electrical energy demand in Fused Deposition Modelling
164
From Figures 8.6, 8.7 and 8.8 the machine with the largest area under the Power – Time
curve has the highest energy demand. Inspire D290 uses a lot more energy compared to the
Stratasys Dimension SST FDM machine, while the miniature open Fused Deposition
modelling machine has the least energy demand. It however, needs to be noted that the
functional unit produced is different; the Stratasys Dimension SST allows easy support
material, while the Dentford Inspire D290 builds a honey comb structure and saves
material. Comparing similar standard size machines it can be deduced from Figures 8.6,
8.7 and 8.8 that the energy consumed can be higher by 256% for one standard size FDM
machine technology and design. When the cheapest miniature machine with open build
envelope which is not temperature controlled is compared to the Inspire D290, the energy
demand is over 20 times lower. Clearly there is significant opportunity for improving the
energy demand of different FDM technologies.
8.4 Energy Demand for 3D printing versus Machining
A further study was set up to compare the energy demand in additive manufacture to that
in subtractive manufacture. Similar volume of ABS material was milled (in this case 9000
mm3) during end-milling operation on Mikron HSM 400 Machining centre. The high speed
milling machine is chosen because when geometric complexity is not an issue the machine
can be used for rapid fabrication of prototypes. Thus this part of the study compares
alternative manufacturing process in terms of resource efficiency. The cutting and process
parameters used on the Mikron HSM 400 Machining centre are stated in Table 8.2.

Chapter 8 Direct electrical energy demand in Fused Deposition Modelling
165
Table 8.2: Parameters for milling on Mikron HSM 400 Machining centre
Machine spindle HVC140-SB-10-
15/42-3F-HSK-E40
Workpiece Material ABS
Spindle speed
(RPM)
9549
Feedrate (mm/min) 1910
Depth of cut (mm) 0.5
Tool diameter (mm) 10
Number of cutting
edges on tool
4
The current profile as recorded by the Fluke 345 power clamp meter, was converted into a
power profile for the end-milling operation, is shown in Figure 8.9. The area under the
power-time graph and the total energy demand when end-milling ABS was 114 Wh.

Chapter 8 Direct electrical energy demand in Fused Deposition Modelling
166
Figure 8.9: Power profile end-milling 9000 mm3 on Mikron HSM 400 Machining centre
The result of the analysis was benchmarked with the FDM machine as shown in Table 8.3.
The result shows that the Basic power required for keeping the Mikron HSM 400 running
was 90% of that required by the FDM machine. This is the result of various electricity
consuming auxiliary units that keep the Mikron HSM 400 functional for example, un-
loaded motors, pumps, lights, computer. The Ready state of the FDM consumed 57% more
power than the Mikron HSM 400.
The cycle time to process similar volume of materials was approximately 22 times higher
to fabricate 9000 mm3 on the FDM machine when compared with machining on the
Mikron HSM 400 centre. Taking the power and cycle time into account, the FDM
machine demanded 6 times more energy processing the same volume of material compared
to the Mikron HSM 400 machining centre. Reflecting on these results it can be proposed
that the biggest challenges for FDM and layered manufacturing technologies, if they are to

Chapter 8 Direct electrical energy demand in Fused Deposition Modelling
167
be as resource efficient as machining, is to address the high cycle time and low fabrication
rate.
Table 8.3: Energy benchmarking FDM versus mechanical milling
FDM
machine
Mikron HSM
400 milling
machine
% difference
FDM/Milling
Basic Power (W) 270 2904 9%
Ready Power (W) 934 401 233%
Total Cycle Time (s) 3012 137 2198%
Total energy demand (Wh) 685 114 601%
The ultrasonic cleaning tank for the Stratasys Dimension SST demanded about 250W. The
solution is operated in a tank that has ultrasonic vibration and a heater. The Stratasys
Dimension SST FDM model that was benchmarked to mechanical milling was washed in
approximately 3600 s. This adds another 250Wh to the energy demand for FDM, thus
making a total energy demand of 935 Wh for the data given in Table 8.3. Thus considering
the post processing energy demand, the FDM machine required 8 times more energy
compared to using a milling machine. A step change in the build rate of FDM machines
and layered manufacturing machines will help to significantly bridge the gap in relation to
energy efficiency compared to material removal processes.

Chapter 8 Direct electrical energy demand in Fused Deposition Modelling
168
8.5 Conclusions
This work presented an evaluation of the direct electrical energy demand in Fused
Deposition Modelling, one of the most popular 3D printing technologies. The following
conclusions can be deduced from the study:
1. When standard size enclosed chamber FDM machines are used for the first build,
the energy demand required raising the temperature within the build chamber and
preparing the machine for extrusion can be a very large proportion of the total
energy demand in building the first component or set of nested components. The
warm up time for the FDM machine is considerably high. This can be an area of
improvement for energy efficiency and sustainable manufacture to meet the goals
of energy efficiency. New temperature ramp up cycles and heaters can be designed
to reduce this energy demand.
2. Given that in terms of production planning, first builds in FDM processes are
associated with a higher energy demand due to the thermo ramp-up cycles,
planning jobs back-to-back can help reduce the energy demand per part.
3. For FDM machines using the soluble support removal process, the energy demand
for the cleaning process is not insignificant; this is due to the need to elevate
solution temperature and to induce ultrasonic vibration for enhanced cleaning. The
energy for cleaning was 35% of the build energy for the case considered.
4. The energy demand in FDM can be modelled as Basic energy demand by the
machine and Value Adding energy for the extrusion process. A framework can be
developed by monitoring current usage and event streaming the activities
performed by the machine.

Chapter 8 Direct electrical energy demand in Fused Deposition Modelling
169
5. A step change in the build rate of FDM and other layered manufacturing machines
will help to significantly bridge the gap in relation to energy efficiency compared to
material removal processes.
6. When compared with the alternative machining process, although, the basic energy
demand of Mikron HSM 400 machining centre was 90% higher than the FDM
machine it only needed 6 times lower energy compared to FDM in building the
same part. This was mainly due to the relatively high cycle time for the FDM and
low manufacturing rate.
7. While for FDM machines, the long build cycle time is the major challenge that
need to be addressed in order to reduce energy intensity of manufacture, for
mechanical machine tools reducing the Basic Power and energy demand can have
significant impact on the energy efficiency.
8. Considering one 3D printing technology such as FDM, there is a major difference
in energy demand for different machine platforms. This is evident that significant
opportunities exist for system developers to radically improve the energy efficiency
of 3D printing technologies.
9. In Life Cycle Analysis (LCA) it is more accurate to include the fabrication rates if
the environmental impact of layered manufacturing processes is to be accurately
captured.

170
CHAPTER 9
CONCLUSIONS AND RECOMMENDATIONS FOR FUTURE
WORK
9.1 Conclusions
This investigation undertook a critical review of research work on electrical energy
intensity in machining processes. The literature review revealed that a more robust energy
estimation model was not developed that could account for machine tool characteristics
and process parameters.
A new mathematical model and logic for predicting direct electrical energy requirements in
machine tool paths was developed. The hypothesis that the specific cutting energy in
machining should be dependent on the scale of machining and the thickness of material to
be removed was tested and validated and a new specific energy coefficient model for 3
different workpiece materials was developed which capture size effect phenomenon in
machining, and machinability of materials.
This further led to the research to improve the integrity of specific cutting energy
coefficients for energy demand modelling in which the effect of chip thickness, tool wear,
nose radius and cutting environment on specific tip energy was quantified. Based on this
knowledge, the mechanical machining efficiency was linked to specific energy through the
process mechanisms characteristics.

Chapter 10 Conclusions and recommendations for future work
171
Furthermore, in evaluating the process efficiency applications, a case study of electrical
energy demand for Fused Deposition Modelling was benchmarked to material removal
operation in order to characterise process efficiency and sustainable manufacture of parts
based Fused Deposition Modelling and mechanical machining process.
Finally, the impact of machine tools on the direct electrical energy demand and associated
carbon emissions for a standardized NC toolpaths was evaluated in two different locations
in order to assess the impact on CO2 emission of machining at different geographical
locations.
In this research therefore the following conclusions were drawn from the study:
1. Machine tool electricity consumption can be classified into the ‘Basic’, ‘Ready’
and ‘Cutting’ states. The need for the third ‘ready’ state was proposed and
incorporated into the existing electrical energy model. The machine tool ‘ready’
state brings the cutting tool and workpiece to a proximity state or an about to cut
state.
2. The basic and ready state power consumption varies with machine tools. The
current demand of the basic states at no load was 53%, 72% and 63% on MHP
CNC lathe, Takisawa milling machine and Mikron HSM 400 machining centre
respectively and their corresponding machine ready states was 47%, 28%, and 37%
respectively. This further confirms the need to incorporate the ready state energy
demand into the electrical energy demand model of mechanical machining
processes.
3. The coolant flow contributes 14% and 21% of the total electrical energy demand
during machining on the Takisawa milling machine and Mikron HSM 400

Chapter 10 Conclusions and recommendations for future work
172
respectively. In this case, dry or near dry (MQL) machining will save between 14-
21% energy of the total electrical energy resource.
4. A new generic model for energy demand was developed as is shown by Equation
4.15 and restated here.
where represent tool change power and tool change time respectively.
The cutting time, t2 and Tool life T and material removal rate can be modelled for turning
and milling as a function of cutting velocity variables thus enabling the use of the equation
in process planning.
The advantages of the model are as follows:
The tool change energy demand was characterized into the number of tool
changes needed for machining operations by incorporating the tool life
equation. It is shown that the tool change energy demand increases with
complex component designs that will require a number of tool changes. The
electrical energy demand of tool change depends on the process parameters,
cutting tool geometry and number of machining operation on the workpiece
material.
Modelling energy with an explicit effect of cutting speeds, feed and depth
of cut.
Explicitly modelling the energy required to take a machine tool from the
basic state to a state where the axis and tool is ready for action and about to
cut.

Chapter 10 Conclusions and recommendations for future work
173
Acknowledging the influence of the machinability characteristics of
different workpiece materials.
5. The specific cutting energy, developed for the first time in this thesis, can be
modelled from the following generic relationship.
x
ee hKk
where ke is the specific cutting energy in Jmm-3
at the required un-deformed chip thickness
and Ke is the specific area energy in Jmm-2
at un-deformed chip thickness of 1 mm, and h is
un-deformed chip thickness in mm while x is the specific energy exponent.
6. A representative average value of specific energy for different workpiece materials
is evaluated at a condition where the un-deformed chip thickness is equal to the tool
edge radius. On this basis the average specific energy in conventional machining
for a positive 5 degree rake angle carbide tools is 1.007, 2.260 and 2.782 Jmm-3
for
aluminium AW6082-T6 alloy, AISI 1045 steel alloy and titanium alloy
respectively.
7. The specific ploughing energy can be estimated with the proposed methodology of
extrapolation of the specific energy curve to the point where h/re is zero.
8. When compared with the alternative machining process, although, the basic energy
demand of Mikron HSM 400 machining centre was 90% higher than the FDM
machine it only needed 6 times lower energy compared to FDM in building the
same part. This was mainly due to the relatively high cycle time for the FDM and
low manufacturing rate.
9. The energy demand in FDM can be modelled as Basic energy demand by the
machine and value adding energy for the extrusion process. A framework can be

Chapter 10 Conclusions and recommendations for future work
174
developed by monitoring current usage and event streaming the activities
performed by the machine.
10. A step change in the build rate of FDM and other layered manufacturing machines
will help to significantly bridge the gap in relation to energy efficiency compared to
material removal processes.
11. While for FDM machines, the long build cycle time is the major challenge that
need to be addressed in order to reduce energy intensity of manufacture, for
mechanical machine tools reducing the Basic Power and energy demand can have
significant impact on the energy efficiency.
12. Considering one 3D printing technology such as FDM, there is a major difference
in energy demand for different machine platforms. This is evident that significant
opportunities exist for system developers to radically improve the energy efficiency
of 3D printing technologies.
13. In Life Cycle Analysis (LCA) it is more accurate to include the fabrication rates if
the environmental impact of layered manufacturing processes is to be captured.
14. When more energy efficient machines are used with a typical 20% lower energy
demand, their carbon emission signature can be significantly increased by moving
the machine from one geographical location to another due to differences in carbon
emission signature between nation states. This may increasingly become a relevant
consideration due to international mobility of capital and manufacturing businesses.
Introduction of carbon emission penalties or quotas will make this even more
critical.
It is therefore clear from this research that the total electrical energy demand and the
specific energy required can be estimated using the new generic models presented to

Chapter 10 Conclusions and recommendations for future work
175
ensure that electrical energy demand is not underestimated. A pre-knowledge of the values
of the specific energy can aid pre-process, resource efficient machining and energy
resource management.
In meeting the research objectives of this study, the electrical energy intensity of
mechanical machine tools was investigated through an event streaming methodology to
record data for actions and tasks involved during turning and milling processes. The
electricity consumption of individual events and/or tasks were recorded with a FLUKE 345
power clamp meter and visualized on the event mapping graph. A new model for
predicting the electrical energy requirements in mechanical machining processes was
developed to include the cutting variables of feed rate, speed and depth of cut. Machining
mechanisms were also analysed with particular focus on specific cutting energy and a new
generic model and specific energy data were derived statistically for cutting three widely
used workpiece materials. The process mechanisms and specific energy evaluation were
used to define new energy efficiency evaluation metrics for machining processes.
9.2 Major Research Contributions to Knowledge
This research provides significant and new and novel contributions to knowledge as
indicated by the following research output:
1. Proposed the new “Ready” state energy demand as the third transition state of the
machine tool. This energy state is a transitive state of the machine tool at a point
just about to cut. The proposed new addition will increase the knowledge and
understanding for electrical energy reduction strategy for product and process
planning and to evaluate resource efficiency of machine tool states.

Chapter 10 Conclusions and recommendations for future work
176
2. Proposed and validated a new and an improved generic electrical energy model for
machining processes. This is to enable an accurate estimation of electrical energy
demand in mechanical machining operations for process planning and life cycle
assessment.
3. Proposed a new generic specific energy model for three different engineering
materials.
4. Introduced novel idea to assess process energy efficiency or effectiveness during
mechanical machining based on specific ploughing energy. This can be the basis
for energy rating of machining toolpaths.
9.3 Recomendations for future work
To apply the knowledge developed in this thesis, there is a need to develop energy demand
software which encompasses all the variables applicable to machine tools as proposed in
this report. These variables for example the machine tool basic state, ready state and
cutting state energy demand, the specific cutting energy demand for different materials,
toolpath and NC g-codes generation from CAD/CAM software, etc will all be incorporated
into the architecture of the software for the analysis of total electrical energy demand and
carbon dioxide evaluations. This will enable engineers, production planners, process
managers and machine tools designers to have a pre-process understanding of electrical
energy resource, CO2 emission and cost implications of their product before engaging in
the manufacturing processes.
It is intended that the models which should be targeted towards the small and medium
scale enterprise (SME) will enhance process planning, energy and cost savings for machine
tool optimization and process control.

Chapter 10 Conclusions and recommendations for future work
177
To support the software, further study should be conducted.
Develop and validate software for estimating the energy intensity in machining and
their associated carbon footprints for CNC programs for selected NC controllers
and CAD/CAM postprocessor.
Develop specific energy data and equations for workpiece materials not covered
here.
Model the effect of workpiece properties such as hardness on specific energy.
Develop a methodology for linking the energy models to CNC codes, APT files,
different controllers and post-processors.
Considers energy reduction in the manufacturing objectives in multiple objective
functions such as optimisation, cost, production rate etc.

178
REFERENCES
[1] Brundtland, G. H., Report of the World Commission on environment and
development: “our common future”, United Nations, 1987.
[2] Pusavec, F., Krajnik, P., Kopac, J., Transitioning to sustainable production - Part I:
application on machining technologies, Journal of Cleaner Production, 2010; 18
(2): 174-184.
[3] UN, World Commission on Environment and Development, Our Common Future,
Oxford University Press, London, 1987.
[4] Park, C. W., Kwon, K. S., Kim, W. B., Min, B. K., Park, S. J., Sung, I. H., Yoon,
Y. S., Lee, K. S., Lee, J. H., Seok, J., Energy consumption reduction technology in
manufacturing - A selective review of policies, standards, and research,
International Journal of Precision Engineering and Manufacturing, 2009; 10: 151-
173.
[5] Dang, H. T. J., Wilkinson, D., New Zealand: Energy in Brief, in, New Zealand
Ministry of Economic Development, Wellington, New Zealand, 2007.
[6] IEA, Key World Energy Statistics 2013,
<http://www.iea.org/publications/freepublications/publication/KeyWorld2013.pdf>
, 2013: [accessed 04-01-2014].
[7] Digest of United Kingdom energy statistics (DUKES), Department of Energy and
Climate Change, TSO 2010,
<www.decc.gov.uk/assets/decc/11/stats/publications/dukes/2303-dukes-2011-
chapter-1-energy.pdf> 2010: [accessed 14-11-2011].
[8] OECD/IEA, International Energy Agency,
<http://www.iea.org/textbase/nppdf/free/2011/key_world_energy_stats.pdf> 2011:
[accessed 08-07-2012].
[9] He, Y., Liu, B., Zhang, X. D., Gao, H., Liu, X. H., A modeling method of task-
oriented energy consumption for machining manufacturing system, Journal of
Cleaner Production, 2012; 23: 167-174.
[10] EPTA, Study for Preparing the First Working Plan of the Eco-design Directive,
Report for tender No. ENTR/06/026 <ec.europa.eu/enterprise/policies/sustainable-
business/files/workingplan_finalreport_en.pdf> 2007: [accessed 30-03-2012].

179
[11] Abele, E., Sielaff, T., Schiffler, A., Rothenbücher, S., Analyzing Energy
Consumption of Machine Tool Spindle Units and Identification of Potential for
Improvements of Efficiency, in: Hesselbach, J., Herrmann, C., (Eds.) Glocalized
Solutions for Sustainability in Manufacturing, Springer Berlin Heidelberg, 2011:
280-285.
[12] Kalpakjian, S., Schmid, S., Manufacturing processes for engineering materials,
Prentice-Hall, Englewood Cliffs, New Jersey, 2003.
[13] Trent, E. M., Wright, P. K., Metal cutting, 4th edition, Butterworth-Heinemann,
Boston, MA 2000.
[14] Dahmus, J., Gutowski, T., An environmental analysis of machining, 2004 ASME
International Mechanical Engineering Congress (IMECE) and R&D Expo,
Anaheim, California, 2004: 1-10.
[15] Thyer, G., Computer numerical control of machine tools, Industrial Press Inc.,
USA, 1991: 318.
[16] Hanafi, I., Khamlichi, A., Cabrera, F. M., Almansa, E., Jabbouri, A., Optimization
of cutting conditions for sustainable machining of peek cf30 using tin tools, Journal
of Cleaner Production, 2012; 33: 1-9.
[17] Helu, M., Behmann, B., Meier, H., Dornfeld, D., Lanza, G., Schulze, V., Total Cost
Analysis of Process Time Reduction as a Green Machining Strategy, Leveraging
Technology for a Sustainable World, 2012: 299-304.
[18] Herrman, C., Bergmann, L., Thiede, S., Zein, A., Energy Labels for Production
Machines – An Approach to Facilitate Energy Efficiency in Production Systems,
Proceedings of 40th CIRP International Seminar on Manufacturing Systems,
Liverpool, UK, 2007.
[19] ISO14955-2, Methods of evaluating energy efficiency of machine tools and
machine components, in: Working draft,
<http://www.iso.org/iso/iso_catalogue/catalogue_tc/catalogue_detail.htm?csnumbe
r=55294>, [accessed 14-04-2012].
[20] Aggarwal, A., Singh, H., Kumar, P., Singh, M., Optimizing power consumption for
CNC turned parts using response surface methodology and Taguchi's technique--A
comparative analysis, Journal of Materials Processing Technology, 2008; 200: 373-
384.

180
[21] Diaz, N., Helu, M., Jarvis, A., Tönissen, S., Dornfeld, D., Schlosser, R., Strategies
for Minimum Energy Operation for Precision Machining, Proc. of MTTRF 2009
Annual Meeting, PRC, Shanghai, 2009: 47-50.
[22] Vijayaraghavan, A., Dornfeld, D., Automated energy monitoring of machine tools,
CIRP Annals - Manufacturing Technology, 2010; 59: 21-24.
[23] Li, Y., He, Y., Wang, Y., Yan, P., Liu, X., A framework for characterising energy
consumption of machining manufacturing systems, International Journal of
Production Research, 2013: 1-12.
[24] Kellens, K., Dewulf, W., Overcash, M., Hauschild, M. Z., Duflou, J. R.,
Methodology for systematic analysis and improvement of manufacturing unit
process life cycle inventory (UPLCI) CO2PE! initiative (cooperative effort on
process emissions in manufacturing). Part 2: case studies, International Journal of
Life Cycle Assessment, 2012; 17: 242-251.
[25] Ostaeyen, J. V., CO2PE! (Cooperative effort on process emissions in
manufacturing) - Taxonomy, <www.mech.kuleuven.be/co2pe!/taxonomy.php>,
[accessed 13-01-2012].
[26] Chapman, P., Energy costs: a review of methods, Energy Policy, 1974; 2: 91-103.
[27] Neugebauer, R., Wabner, M., Rentzsch, H., Ihlenfeldt, S., Structure principles of
energy efficient machine tools, CIRP Journal of Manufacturing Science and
Technology, 2011; 4: 136-147.
[28] Rahimifard, S., Seow, Y., Childs, T., Minimising Embodied Product Energy to
support energy efficient manufacturing, CIRP Annals - Manufacturing Technology,
2010; 59: 25-28.
[29] Mativenga, P. T., Rajemi, M. F., Calculation of optimum cutting parameters based
on minimum energy footprint, CIRP Annals - Manufacturing Technology, 2011;
60: 149-152.
[30] Kordonowy, D. N., 2001. A Power Assessment of Machining Tools, Massachusetts
Institute of Technology, B.S. Thesis, Department of Mech. Eng., Cambridge, MA,
USA, 2001.
[31] Gutowski, T., Dahmus, J., Thiriez, A., 2006. Electrical energy requirements for a
manufacturing process, Proceedings of 13th CIRP International Conference on Life
Cycle Eng, Leuven, Belgium, 2006: 623.

181
[32] Gutowski, T. G., Murphy, C. F., Allen, D. T., Bauer, D. J., Bras, B., Piwonka, T.
S., Sheng, P. S., Sutherland, J. W., Thurston, D. L., Wolff, E. E., “WTEC Panel
Report on Environmentally Benign Manufacturing (EBM),” International
Technology Research Institute, World Technology (WTEC) Division, Baltimore,
Maryland <http://www.wtec.org/loyola/ebm/ebm.pdf>, 2001: [accessed 24-10-
2012].
[33] Behrendt T., Zein, A., Min, S., Development of an energy consumption monitoring
procedure for machine tools, CIRP Annals-Manufacturing Technology, 2012; 61
(1): 43-46.
[34] Mori, M., Fujishima, M., Inamasu, Y., Oda, Y., A study on energy efficiency
improvement for machine tools, CIRP Annals-Manufacturing Technology, 2011;
60: 145-148.
[35] Avram, O. I., Xirouchakis, P., Evaluating the use phase energy requirements of a
machine tool system, Journal of Cleaner Production, 2011; 19: 699-711.
[36] He, Y., Liu, F., Wu, T., Zhong, F. P., Peng, B., Analysis and estimation of energy
consumption for numerical control machining, Proceedings of the Institution of
Mechanical Engineers Part B-Journal of Engineering Manufacture, 2012; 226: 255-
266.
[37] Hesselbach, J., Herrmann, C., Detzer, R., Martin, L., Thiede, S., Lüdemann, B.,
Energy Efficiency through optimized coordination of production and technical
building services, Proceeding of the 15th Conference on Life Cycle Engineering,
Sydney, 2008.
[38] Hu, S., Liu, F., He, Y., Hu, T., An on-line approach for energy efficiency
monitoring of machine tools, Journal of Cleaner Production, 2012; 27: 133-140.
[39] Jingxiang, L., Renzhong, T., Shun, J., Therblig-based energy supply modeling of
computer numerical control machine tools, Journal of Cleaner Production,
Available online 24 October 2013, ISSN 0959-6526,
http://dx.doi.org/10.1016/j.jclepro.2013.09.055.
[40] Salonitis, K., Ball, P., Energy efficient manufacturing from machine tools to
manufacturing systems, Procedia CIRP, 2013; 7: 634-639.
[41] Seow, Y., Rahimifard, S., A framework for modelling energy consumption within
manufacturing systems, CIRP Journal of Manufacturing Science and Technology,
2011; 4 (3): 258-264.

182
[42] Rajemi, M. F., Mativenga, P. T., Aramcharoen, A., Sustainable machining:
selection of optimum turning conditions based on minimum energy considerations,
Journal of Cleaner Production, 2010; 18: 1059-1065.
[43] Sarwar, M., Persson, M., Hellbergh, H., Haider, J., Measurement of specific cutting
energy for evaluating the efficiency of bandsawing different workpiece materials,
International Journal of Machine Tools and Manufacture, 2009; 49: 958-965.
[44] Li, W., Kara, S., An empirical model for predicting energy consumption of
manufacturing processes: a case of turning process, Proceedings of the Institution
of Mechanical Engineers Part B-Journal of Engineering Manufacture, 2011; 225:
1636-1646.
[45] Draganescu, F., Gheorghe, M., Doicin, C. V., Models of machine tool efficiency
and specific consumed energy, Journal of Materials Processing Technology, 2003;
141: 9-15.
[46] Diaz, N., Redelsheimer, E., Dornfeld, D., Energy consumption characterization and
reduction strategies for milling machine tool use, Glocalized Solutions for
Sustainability in Manufacturing, Springer, Berlin-Heidelberg, 2011; 263-267.
[47] Lucca, D., Seo, Y., Komanduri, R., Effect of tool edge geometry on energy
dissipation in ultraprecision machining, CIRP Annals-Manufacturing Technology,
1993; 42: 83-86.
[48] Arsecularatne, J., On tool-chip interface stress distributions, ploughing force and
size effect in machining, International Journal of Machine Tools and Manufacture,
1997; 37: 885-899.
[49] Ghosh, S., Chattopadhyay, A., Paul, S., Modelling of specific energy requirement
during high-efficiency deep grinding, International Journal of Machine Tools and
Manufacture, 2008; 48: 1242-1253.
[50] Pawade, R. S., Sonawane, H. A., Joshi, S. S., An analytical model to predict
specific shear energy in high-speed turning of Inconel 718, International Journal of
Machine Tools and Manufacture, 2009; 49: 979-990.
[51] Guo, Y., Loenders, J., Duflou, J., Lauwers, B., Optimization of Energy
Consumption and Surface Quality in Finish Turning, Procedia CIRP, 2012; 1: 512-
517.

183
[52] Teti, R., Jemielniak, K., O’Donnell, G., Dornfeld, D., Advanced monitoring of
machining operations, CIRP Annals-Manufacturing Technology, 2010; 59: 717-
739.
[53] Shi, D., Gindy, N. N., Development of an online machining process monitoring
system: Application in hard turning, Sensors and Actuators A: Physical, 2007; 135:
405-414.
[54] Atluru, S., Deshpande, A., Data to information: can MTConnect deliver the
promise?, Transactions of NAMRI/SME, 2009; 37: 197-204.
[55] De-Filippi, A., Ippolito, R., Micheletti, G. F., NC Machine Tools as Electric Energy
Users, CIRP Annals - Manufacturing Technology, 1981; 30: 323-326.
[56] Helu, M., Vijayaraghavan, A., Dornfeld, D., Evaluating the relationship between
use phase environmental impacts and manufacturing process precision, CIRP
Annals - Manufacturing Technology, 2011; 60: 49-52.
[57] Li, W., Zein, A., Kara, S., Herrmann, C., An Investigation into Fixed Energy
Consumption of Machine Tools, Glocalized Solutions for Sustainability in
Manufacturing, 2011: 268-273.
[58] Protocol K., United Nations framework convention on climate change, Kyoto
Protocol, Kyoto, 1997.
[59] Devoldere, T., Dewulf, W., Deprez, W., Willems, B., Duflou, J., Improvement
Potential for Energy Consumption in Discrete Part Production Machines Advances
in Life Cycle Engineering for Sustainable Manufacturing Businesses, in: S. Takata,
Y. Umeda (Eds.), Springer London, 2007: 311-316.
[60] Anderberg, S. E., Kara, S., Beno, T., Impact of energy efficiency on computer
numerically controlled machining, Proceedings of the Institution of Mechanical
Engineers Part B-Journal of Engineering Manufacture, 2010; 224: 531-541.
[61] Diaz, N., Redelsheimer, E., Dornfeld, D., Energy Consumption Characterization
and Reduction Strategies for Milling Machine Tool Use, Glocalized Solutions for
Sustainability in Manufacturing, in: J. Hesselbach, C. Herrmann (Eds.) 18th CIRP
International Conference on Life Cycle Engineering, Springer London, Technische
Universität Braunschweig, Braunschweig, Germany, 2011: 263-267.
[62] Balogun, V. A., Mativenga, P. T., Modelling of direct energy requirements in
mechanical machining processes, Journal of Cleaner Production, 2013; 41: 179-
186.

184
[63] Li, L., Yan, J., Xing, Z., Energy requirements evaluation of milling machines based
on thermal equilibrium and empirical modelling, Journal of Cleaner Production,
2013; 52: 113-121.
[64] Wang, Q., Liu, F., Li, C., An Integrated Method for Assessing the Energy
Efficiency of Machining Workshop, Journal of Cleaner Production, 2013; 52: 122-
133.
[65] Boothroyd, G., Knight, W., Fundamentals of machining and machine tools, Marcel
Dekker, New York, 1989.
[66] Kuram, E., Ozcelik, B., Bayramoglu, M., Demirbas, E., Simsek, B. T.,
Optimization of cutting fluids and cutting parameters during end milling by using
D-optimal design of experiments, Journal of Cleaner Production, 2013; 42: 159-
166.
[67] Paul, S., Chattopadhyay, A., A study of effects of cryo-cooling in grinding,
International Journal of Machine Tools and Manufacture, 1995; 35: 109-117.
[68] Polini, W., Turchetta, S., Force and specific energy in stone cutting by diamond
mill, International Journal of Machine Tools and Manufacture, 2004; 44: 1189-
1196.
[69] Bayoumi, A. E., Yücesan, G., Hutton, D. V., On the closed form mechanistic
modeling of milling: Specific cutting energy, torque, and power, JMEP, 1994; 3:
151-158.
[70] Zhang, T., Liu, Z. Q., Xu, C. H., He, N., Li, L., Experimental Investigations of Size
Effect on Cutting Force, Specific Cutting Energy, and Surface Integrity during
Micro Cutting, in: Materials Science Forum, Trans Tech Publ, 2012: 371-376.
[71] Zhang, T., Liu, Z., Xu, C., Influence of size effect on burr formation in micro
cutting, The International Journal of Advanced Manufacturing Technology, 2013:
1-7.
[72] Aramcharoen, A., Mativenga, P., Size effect and tool geometry in micromilling of
tool steel, Precision Engineering, 2009; 33: 402-407.
[73] Bissacco, G., Hansen, H. N., De-Chiffre, L., Size effects on surface generation in
micro milling of hardened tool steel, Cirp Annals-Manufacturing Technology,
2006; 55: 593-596.

185
[74] Ducobu, F., Filippi, E., Rivière-Lorphèvre, E., Chip Formation and Minimum Chip
Thickness in Micro-milling, Proceedings of the 12th CIRP Conference on
modelling of machining operations, 2009: 339-346.
[75] Filiz, S., Conley, C. M., Wasserman, M. B., Ozdoganlar, O. B., An experimental
investigation of micro-machinability of copper 101 using tungsten carbide micro-
endmills, International Journal of Machine Tools and Manufacture, 2007; 47: 1088-
1100.
[76] Kronenberg, T., Basic Course of the Machine Cutting Teachings, Springer-Verlag,
Berlin, 1927: (in German).
[77] Schroder, H. J., The importance of small chip thickness in rolling milling cutter,
Mech. Eng. Bus., 1934; 13: 541–548 (in German).
[78] Kienzle, O., The determination of forces and services to metal cutting machine
tools, Assoc. Ger. Eng., 1952; 94: 299–305 (in German).
[79] Hucks, K., Cutting forces and mechanics of materials, Ind. Indicators, 1955; 77:
365–370 (in German).
[80] Sabberwal, A. J. P., Cutting forces in down milling, International Journal of
Machine Tool Design and Research, 1962; 2: 27-41.
[81] Xu, X. L., Wang, H. L., Yu, T. B., Research and Application of NC Machine Tool
Energy Consumption Control Optimization, Key Engineering Materials, 2014; 579:
314-319.
[82] Balogun, V. A., Aramcharoen, A., Mativenga, P. T., Chuan, S. K., Impact of
Machine Tools on the Direct Energy and Associated Carbon Emissions for a
Standardized NC Toolpath, in: Re-engineering Manufacturing for Sustainability,
Springer, 2013: 197-202.
[83] ISO14020:2000, Environmental labels and declarations-general principles, Geneva,
Switzerland, 2000.
[84] International Standard Organisation, Win the energy challenge with
ISO50001:2011, <www.iso.org/iso/iso_50001_energy.pdf>, 2011: [accessed 01-
09-2012].
[85] Weinert, K., Inasaki, I., Sutherland, J., Wakabayashi, T., Dry machining and
minimum quantity lubrication, Cirp Annals-Manufacturing Technology, 2004; 53:
511-537.

186
[86] Oda, Y., Kawamura, Y., Fujishima, M., Energy Consumption Reduction by
Machining Process Improvement, Procedia CIRP, 2012; 4: 120-124.
[87] Zolgharni, M., Jones, B., Bulpett, R., Anson, A., Franks, J., Energy efficiency
improvements in dry drilling with optimised diamond-like carbon coatings,
Diamond and Related Materials, 2008; 17: 1733-1737.
[88] Balogun, V. A., Mativenga, P. T., Impact of un-deformed chip thickness on specific
energy in mechanical machining processes, Journal of Cleaner Production, 2014;
69: 260-268.
[89] Childs T., Friction modelling in metal cutting, Wear, 2006; 260: 310-318.
[90] DeVor, R. E., Kapoor, S. G., On the modeling and analysis of machining
performance in micro-endmilling, Part I: Surface Generation, Journal of
Manufacturing Science and Engineering, Transactions of the ASME, 2004; 126 (4):
685–694.
[91] Gillespie, L., Deburring precision miniature parts, Precision Engineering, 1979; 1:
189-198.
[92] Lee, K., Dornfeld, D. A., Micro-burr formation and minimization through process
control, Precision Engineering, 2005; 29: 246-252.
[93] Lucca, D., Rhorer, R., Komanduri, R., Energy dissipation in the ultraprecision
machining of copper, CIRP Annals-Manufacturing Technology, 1991; 40: 69-72.
[94] Waldorf, D. J., A simplified model for ploughing forces in turning, Journal of
manufacturing processes, 2006; 8: 76-82.
[95] Taminiau, D., Dautzenberg, J., Bluntness of the tool and process forces in high-
precision cutting, CIRP Annals-Manufacturing Technology, 1991; 40: 65-68.
[96] Singh, V., Ghosh, S., Rao, P. V., Comparative study of specific plowing energy for
mild steel and composite ceramics using single grit scratch tests, Materials and
Manufacturing Processes, 2011; 26: 272-281.
[97] Singh, V., Durgumahanti, U. P., Rao, P. V., Ghosh, S., Specific ploughing energy
model using single grit scratch test, International Journal of Abrasive Technology,
2011; 4: 156-173.
[98] Chae, J., Park, S., Freiheit, T., Investigation of micro-cutting operations,
International Journal of Machine Tools and Manufacture, 2006; 46: 313-332.

187
[99] Kim, C. J., Mayor, J. R., Ni, J., A static model of chip formation in microscale
milling, Transactions of the ASME-B-Journal of Manufacturing Science and
Engineering, 2004; 126: 710-718.
[100] Guo, Y., Chou, Y., The determination of ploughing force and its influence on
material properties in metal cutting, Journal of Materials Processing Technology,
2004; 148: 368-375.
[101] Campatelli, G., Lorenzini, L., Scippa, A., Optimization of process parameters using
a Response Surface Method for minimizing power consumption in the milling of
carbon steel, Journal of Cleaner Production, available online 26 October 2013,
ISSN 0959-6526, <http://dx.doi.org/10.1016/j.jclepro.2013.10.025>, 2013.
[102] Woon, K. S., Rahman, M., Fang, F. Z., Neo, K. S., Liu, K., Investigations of tool
edge radius effect in micromachining: A FEM simulation approach, Journal of
Materials Processing Technology, 2008; 195: 204-211.
[103] Nasr, M. N. A., Ng, E. G., Elbestawi, M. A., Modelling the effects of tool-edge
radius on residual stresses when orthogonal cutting AISI 316L, International
Journal of Machine Tools and Manufacture, 2007; 47: 401-411.
[104] Mian, A. J., Driver, N., Mativenga, P. T., Identification of factors that dominate
size effect in micro-machining, International Journal of Machine Tools and
Manufacture, 2011; 51: 383-394.
[105] Schaller, T., Bohn, L., Mayer, J., Schubert, K., Microstructure grooves with a width
of less than 50 μm cut with ground hard metal micro end mills, Precision
Engineering, 1999; 23: 229-235.
[106] Mian, A. J., Driver, N., Mativenga, P. T., A comparative study of material phase
effects on micro-machinability of multiphase materials, The International Journal
of Advanced Manufacturing Technology, 2010; 50: 163-174.
[107] Hopkinson, N., Hague, R., Dickens, P., Introduction to rapid manufacturing, Rapid
Manufacturing: An Industrial Revolution for the Digital Age, John Wiley & Sons
Ltd., (ISBN 13-978-0-470-01613-8), 2006: 1–4.
[108] Levy, G. N., Schindel, R., Kruth, J. P., Rapid manufacturing and rapid tooling with
layer manufacturing (LM) technologies, state of the art and future perspectives,
CIRP Annals-Manufacturing Technology, 2003; 52: 589-609.
188
[109] Holmström, J., Partanen, J., Tuomi, J., Walter, M., Rapid manufacturing in the
spare parts supply chain: alternative approaches to capacity deployment, Journal of
Manufacturing Technology Management, 2010; 21: 687-697.
[110] Kruth, J. P., Leu, M. C., Nakagawa, T., Progress in Additive Manufacturing and
Rapid Prototyping, CIRP Annals - Manufacturing Technology, 1998; 47: 525-540.
[111] Santos, E. C., Shiomi, M., Osakada, K., Laoui, T., Rapid manufacturing of metal
components by laser forming, International Journal of Machine Tools and
Manufacture, 2006; 46: 1459-1468.
[112] Mellor, S., Hao, L., Zhang, D., Additive Manufacturing: A Framework for
Implementation, available online 23 July 2013, ISSN 0925-5273,
<http://dx.doi.org/10.1016/j.ijpe.2013.07.008>, 2013.
[113] Hague, R., Reeves, P., Rapid prototyping, tooling and manufacturing, Rapra
Review Report, vol. 10, No. 9, RAPRA Tech. Ltd., Shrewsbury, UK, 2000.
[114] Lan, H., Ding, Y., Hong, J., Huang, H., Lu, B., A web-based manufacturing service
system for rapid product development, Computers in Industry, 2004; 54: 51-67.
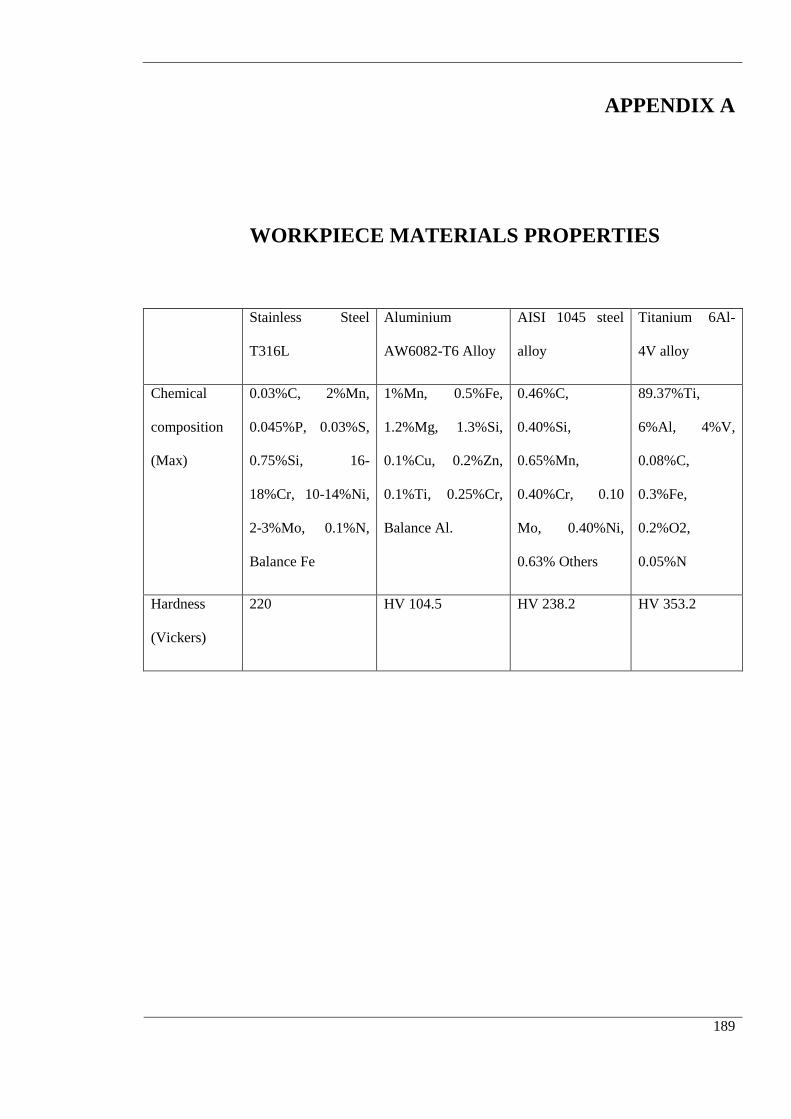
189
APPENDIX A
WORKPIECE MATERIALS PROPERTIES
Stainless Steel
T316L
Aluminium
AW6082-T6 Alloy
AISI 1045 steel
alloy
Titanium 6Al-
4V alloy
Chemical
composition
(Max)
0.03%C, 2%Mn,
0.045%P, 0.03%S,
0.75%Si, 16-
18%Cr, 10-14%Ni,
2-3%Mo, 0.1%N,
Balance Fe
1%Mn, 0.5%Fe,
1.2%Mg, 1.3%Si,
0.1%Cu, 0.2%Zn,
0.1%Ti, 0.25%Cr,
Balance Al.
0.46%C,
0.40%Si,
0.65%Mn,
0.40%Cr, 0.10
Mo, 0.40%Ni,
0.63% Others
89.37%Ti,
6%Al, 4%V,
0.08%C,
0.3%Fe,
0.2%O2,
0.05%N
Hardness
(Vickers)
220 HV 104.5 HV 238.2 HV 353.2

190
APPENDIX B
CUTTING TOOL GEOMETRY OF SOMT 060204 INSERT
Geometry Values
Nose radius (µm) 400
Edge radius (measured) (µm) 60
Positive Rake angle (deg.) 5
Rake face primary chip breaker land (µm) 60
Figure B1: Cutting tool geometry for insert SOMT 060204-HQ (ISCAR LTD,
HELIQUAD, 2013).

191
APPENDIX C
PROCESS WINDOW (RECOMMENDED MACHINING
PARAMETERS) ON SOMT 060204-HQ

192
APPENDIX D
TAGUCHI DESIGN OF EXPERIMENTS FOR MILLING
AISI 1045 STEEL ALLOY
vc
(m/min)
N
(rpm)
Feedrates
(mm/min)
fz
(mm/tooth)
ap
(mm)
ae
(mm)
Q
(mm3/s)
Power
(W)
100 2652 265 0.1 0.5 0.6 1.33 3054.90
100 2652 530 0.2 1 0.8 7.07 3074.07
100 2652 796 0.3 1.5 1 19.89 3090.13
120 3183 318 0.1 1 1 5.30 3113.68
120 3183 637 0.2 1.5 0.6 9.55 3135.28
120 3183 955 0.3 0.5 0.8 6.37 3164.69
150 3978 398 0.1 1.5 0.8 7.96 3101.11
150 3978 796 0.2 0.5 1 6.63 3084.31
150 3978 1194 0.3 1 0.6 11.94 3083.66

193
APPENDIX E
EXPERIMENTAL DESIGN TO ANALYZE SPECIFIC
ENERGY FOR AISI 1045 STEEL ALLOY
EXP_1 1 2 3 4
Vc (m/min) 156 156 156 156
N (rpm) 6206 6206 6206 6206
fz (mm/tooth) 0.010 0.010 0.010 0.010
Feed
(mm/min) 62 62 62 62
ap (mm) 3.50 3.50 3.50 3.50
ae (mm) 0.250 0.500 0.750 1.000
Q (mm3/s) 0.905076 1.810153 2.715229 3.620306
EXP_2 1 2 3 4
Vc (m/min) 156 156 156 156
N (rpm) 6206 6206 6206 6206
fz (mm/tooth) 0.100 0.100 0.100 0.100
Feed
(mm/min) 621 621 621 621
ap (mm) 3.50 3.50 3.50 3.50

Appendix E
194
ae (mm) 0.250 0.500 0.750 1.000
Q (mm3/s) 9.050764 18.10153 27.15229 36.20306
EXP_3 1 2 3 4
Vc (m/min) 156 156 156 156
N (rpm) 6206 6206 6206 6206
fz (mm/tooth) 0.190 0.190 0.190 0.190
Feed
(mm/min) 1179 1179 1179 1179
ap (mm) 3.50 3.50 3.50 3.50
ae (mm) 0.250 0.500 0.750 1.000
MRR (mm3/s) 17.19645 34.3929 51.58935 68.78581
EXP_4 1 2 3 4
Vc (m/min) 156 156 156 156
N (rpm) 6206 6206 6206 6206
fz (mm/tooth) 0.280 0.280 0.280 0.280
Feed
(mm/min) 1738 1738 1738 1738
ap (mm) 3.50 3.50 3.50 3.50
ae (mm) 0.250 0.500 0.750 1.000
Q (mm3/s) 25.34214 50.68428 76.02642 101.3686
EXP_5 1 2 3 4

Appendix E
195
Vc (m/min) 156 156 156 156
N (rpm) 6206 6206 6206 6206
fz (mm/tooth) 0.370 0.370 0.370 0.370
Feed
(mm/min) 2296 2296 2296 2296
ap (mm) 3.50 3.50 3.50 3.50
ae (mm) 0.250 0.500 0.750 1.000
Q (mm3/s) 33.48783 66.97565 100.4635 133.9513
EXP_6 1 2 3 4
Vc (m/min) 156 156 156 156
N (rpm) 6206 6206 6206 6206
fz (mm/tooth) 0.460 0.460 0.460 0.460
Feed
(mm/min) 2855 2855 2855 2855
ap (mm) 3.50 3.50 3.50 3.50
ae (mm) 0.200 0.350 0.500 0.650
Q (mm3/s) 33.30681 58.28692 83.26703 108.2471
EXP_7 1 2 3 4
Vc (m/min) 156 156 156 156
N (rpm) 6206 6206 6206 6206
fz (mm/tooth) 0.550 0.550 0.550 0.550

Appendix E
196
Feed
(mm/min) 3413 3413 3413 3413
ap (mm) 3.50 3.50 3.50 3.50
ae (mm) 0.200 0.400 0.600 0.800
Q (mm3/s) 39.82336 79.64672 119.4701 159.2934
where Vc represent cutting velocity, N is the spindle speed, fz is the chip load, ap is the
depth of cut, ae is the radial width of cut and Q is the material removal rate.

197
APPENDIX F
TOOL PATH VIEW ON DEPOCAM SOFTWARE FOR
TEST PIECE

198
APPENDIX G
ISO NC CODE BLOCKS FOR SURFACE CLEANING
GENERATED ON DEPOCAM SOFTWARE
%
O1234
N1( DEPOCAM v7.0.4 )
N2( 23 November 2012 11:00:44 )
N3( C:\Documents and Settings\RP\Desktop\Vincent_test_piece\AISI104501.ncc )
N4( C:\Documents and Settings\RP\Desktop\Vincent_test_piece\AISI1045.dca )
N5( RP )
N6G21
N7G17G40G80G90
N8( Area Clearance Toolpath 1 [12x6, 0] )
N9( Area Clearance Toolpath )
N10( Thickness in XY is: 0.000 )
N11( Thickness in Z is: 0.000 )
N12( Cutter: 12.000x6.000 )
N13( Note: Cutter tip output )
N14G0G91G28Z0
N15T1M06
N16G0G90G54
N17F10000
N18G0G43Z7.000H1

Appendix G
199
N19G0X50.500Y25.418
N20S1000M03
N21M08
N22G1Z6.205
N23F2000
N24X50.462Z5.815
N25X50.348Z5.440
N26X50.163Z5.094
N27X49.914Z4.791
N28X49.611Z4.542
N29X49.265Z4.357
N30X48.890Z4.243
N31X48.500Z4.205
N32G3X42.890Y17.290Z3.882I0.000J-6.000
N33G3X52.479Y14.927Z3.559I5.610J2.128
N34G3X51.288Y24.730Z3.236I-3.979J4.491
N35G3X42.544Y20.141Z2.913I-2.788J-5.313
N36G3X49.936Y13.592Z2.590I5.956J-0.723
N37G3X53.438Y22.826Z2.267I-1.436J5.826
N38G3X43.562Y22.826Z1.943I-4.938J-3.408
N39G3X47.064Y13.592Z1.620I4.938J-3.408
N40G3X54.456Y20.141Z1.297I1.436J5.826
N41G3X45.712Y24.730Z0.974I-5.956J-0.723
N42G3X44.521Y14.927Z0.651I2.788J-5.313
N43G3X54.110Y17.290Z0.328I3.979J4.491

Appendix G
200
N44G3X48.500Y25.418Z0.005I-5.610J2.128
N45F4000
N46G1X25.000
N47G3X24.582Y25.000I0.000J-0.418
N48G3X25.000Y24.582I0.418J0.000
N49G1X75.000
N50G3X75.418Y25.000I0.000J0.418
N51G3X75.000Y25.418I-0.418J0.000
N52G1X50.000
N53X48.500
N54G2X48.117Y25.596I0.000J0.500
N55G1X47.383Y26.469
N56G3X47.000Y26.647I-0.383J-0.322
N57G1X23.788
N58G3X23.353Y26.212I0.000J-0.435
N59G1Y23.788
N60G3X23.788Y23.353I0.435J0.000
N61G1X76.212
N62G3X76.647Y23.788I0.000J0.435
N63G1Y26.212
N64G3X76.212Y26.647I-0.435J0.000
N65G1X50.000
N66X47.000
N67G2X46.617Y26.825I0.000J0.500
N68G1X45.883Y27.698

Appendix G
201
N69G3X45.500Y27.876I-0.383J-0.322
N70G1X22.559
N71G3X22.124Y27.441I0.000J-0.435
N72G1Y22.559
N73G3X22.559Y22.124I0.435J0.000
N74G1X77.441
N75G3X77.876Y22.559I0.000J0.435
N76G1Y27.441
N77G3X77.441Y27.876I-0.435J0.000
N78G1X50.000
N79X45.500
N80G2X45.118Y28.054I0.000J0.500
N81G1X44.382Y28.927
N82G3X44.000Y29.105I-0.382J-0.322
N83G1X21.330
N84G3X20.895Y28.670I0.000J-0.435
N85G1Y21.330
N86G3X21.330Y20.895I0.435J0.000
N87G1X78.670
N88G3X79.105Y21.330I0.000J0.435
N89G1Y28.670
N90G3X78.670Y29.105I-0.435J0.000
N91G1X50.000
N92X44.000
N93G2X43.617Y29.283I0.000J0.500

Appendix G
202
N94G1X42.883Y30.156
N95G3X42.500Y30.334I-0.383J-0.322
N96G1X20.101
N97G3X19.666Y29.899I0.000J-0.435
N98G1Y20.101
N99G3X20.101Y19.666I0.435J0.000
N100G1X79.899
N101G3X80.334Y20.101I0.000J0.435
N102G1Y29.899
N103G3X79.899Y30.334I-0.435J0.000
N104G1X50.000
N105X42.500
N106G2X42.117Y30.512I0.000J0.500
N107G1X41.383Y31.385
N108G3X41.000Y31.563I-0.383J-0.322
N109G1X18.871
N110G3X18.437Y31.129I0.000J-0.435
N111G1Y18.871
N112G3X18.871Y18.437I0.435J0.000
N113G1X81.129
N114G3X81.563Y18.871I0.000J0.435
N115G1Y31.129
N116G3X81.129Y31.563I-0.435J0.000
N117G1X50.000
N118X41.000

Appendix G
203
N119G2X40.618Y31.741I0.000J0.500
N120G1X39.882Y32.614
N121G3X39.500Y32.792I-0.382J-0.322
N122G1X17.642
N123G3X17.208Y32.358I0.000J-0.435
N124G1Y17.642
N125G3X17.642Y17.208I0.435J0.000
N126G1X82.358
N127G3X82.792Y17.642I0.000J0.435
N128G1Y32.358
N129G3X82.358Y32.792I-0.435J0.000
N130G1X50.000
N131X39.500
N132G2X39.117Y32.970I0.000J0.500
N133G1X38.383Y33.843
N134G3X38.000Y34.021I-0.383J-0.322
N135G1X16.413
N136G3X15.979Y33.587I0.000J-0.435
N137G1Y16.413
N138G3X16.413Y15.979I0.435J0.000
N139G1X83.587
N140G3X84.021Y16.413I0.000J0.435
N141G1Y33.587
N142G3X83.587Y34.021I-0.435J0.000
N143G1X50.000

Appendix G
204
N144X38.000
N145G2X37.617Y34.199I0.000J0.500
N146G1X36.883Y35.072
N147G3X36.500Y35.250I-0.383J-0.322
N148G1X15.184
N149G3X14.750Y34.816I0.000J-0.435
N150G1Y15.184
N151G3X15.184Y14.750I0.435J0.000
N152G1X84.816
N153G3X85.250Y15.184I0.000J0.435
N154G1Y34.816
N155G3X84.816Y35.250I-0.435J0.000
N156G1X50.000
N157X36.500
N158G2X36.117Y35.428I0.000J0.500
N159G1X35.383Y36.301
N160G3X35.000Y36.479I-0.383J-0.322
N161G1X13.955
N162G3X13.521Y36.045I0.000J-0.435
N163G1Y13.955
N164G3X13.955Y13.521I0.435J0.000
N165G1X86.045
N166G3X86.479Y13.955I0.000J0.435
N167G1Y36.045
N168G3X86.045Y36.479I-0.435J0.000

Appendix G
205
N169G1X50.000
N170X35.000
N171G2X34.617Y36.658I0.000J0.500
N172G1X33.883Y37.531
N173G3X33.500Y37.709I-0.383J-0.322
N174G1X12.726
N175G3X12.291Y37.274I0.000J-0.435
N176G1Y12.726
N177G3X12.726Y12.291I0.435J0.000
N178G1X87.274
N179G3X87.709Y12.726I0.000J0.435
N180G1Y37.274
N181G3X87.274Y37.709I-0.435J0.000
N182G1X50.000
N183X33.500
N184G2X33.117Y37.887I0.000J0.500
N185G1X32.383Y38.760
N186G3X32.000Y38.938I-0.383J-0.322
N187G1X11.497
N188G3X11.062Y38.503I0.000J-0.435
N189G1Y11.497
N190G3X11.497Y11.062I0.435J0.000
N191G1X88.503
N192G3X88.938Y11.497I0.000J0.435
N193G1Y38.503

Appendix G
206
N194G3X88.503Y38.938I-0.435J0.000
N195G1X50.000
N196X32.000
N197G2X31.617Y39.116I0.000J0.500
N198G1X30.883Y39.989
N199G3X30.500Y40.167I-0.383J-0.322
N200G1X10.268
N201G3X9.833Y39.732I0.000J-0.435
N202G1Y10.268
N203G3X10.268Y9.833I0.435J0.000
N204G1X89.732
N205G3X90.167Y10.268I0.000J0.435
N206G1Y39.732
N207G3X89.732Y40.167I-0.435J0.000
N208G1X50.000
N209X30.500
N210G2X30.117Y40.345I0.000J0.500
N211G1X29.383Y41.218
N212G3X29.000Y41.396I-0.383J-0.322
N213G1X9.038
N214G3X8.604Y40.962I0.000J-0.435
N215G1Y9.038
N216G3X9.038Y8.604I0.435J0.000
N217G1X90.962
N218G3X91.396Y9.038I0.000J0.435

Appendix G
207
N219G1Y40.962
N220G3X90.962Y41.396I-0.435J0.000
N221G1X50.000
N222X29.000
N223G2X28.617Y41.574I0.000J0.500
N224G1X27.883Y42.447
N225G3X27.500Y42.625I-0.383J-0.322
N226G1X7.809
N227G3X7.375Y42.191I0.000J-0.435
N228G1Y7.809
N229G3X7.809Y7.375I0.435J0.000
N230G1X92.191
N231G3X92.625Y7.809I0.000J0.435
N232G1Y42.191
N233G3X92.191Y42.625I-0.435J0.000
N234G1X50.000
N235X27.500
N236G2X27.118Y42.803I0.000J0.500
N237G1X26.382Y43.676
N238G3X26.000Y43.854I-0.382J-0.322
N239G1X6.580
N240G3X6.146Y43.420I0.000J-0.435
N241G1Y6.580
N242G3X6.580Y6.146I0.435J0.000
N243G1X93.420

Appendix G
208
N244G3X93.854Y6.580I0.000J0.435
N245G1Y43.420
N246G3X93.420Y43.854I-0.435J0.000
N247G1X50.000
N248X26.000
N249G2X25.618Y44.032I0.000J0.500
N250G1X24.882Y44.905
N251G3X24.500Y45.083I-0.382J-0.322
N252G1X5.351
N253G3X4.917Y44.649I0.000J-0.435
N254G1Y5.351
N255G3X5.351Y4.917I0.435J0.000
N256G1X94.649
N257G3X95.083Y5.351I0.000J0.435
N258G1Y44.649
N259G3X94.649Y45.083I-0.435J0.000
N260G1X50.000
N261X24.500
N262G2X24.117Y45.261I0.000J0.500
N263G1X23.383Y46.134
N264G3X23.000Y46.312I-0.383J-0.322
N265G1X4.122
N266G3X3.688Y45.878I0.000J-0.435
N267G1Y4.122
N268G3X4.122Y3.688I0.435J0.000

Appendix G
209
N269G1X95.878
N270G3X96.312Y4.122I0.000J0.435
N271G1Y45.878
N272G3X95.878Y46.312I-0.435J0.000
N273G1X50.000
N274X23.000
N275G2X22.617Y46.491I0.000J0.500
N276G1X21.883Y47.364
N277G3X21.500Y47.542I-0.383J-0.322
N278G1X2.893
N279G3X2.458Y47.107I0.000J-0.435
N280G1Y2.893
N281G3X2.893Y2.458I0.435J0.000
N282G1X97.107
N283G3X97.542Y2.893I0.000J0.435
N284G1Y47.107
N285G3X97.107Y47.542I-0.435J0.000
N286G1X50.000
N287X21.500
N288G2X21.117Y47.720I0.000J0.500
N289G1X20.383Y48.593
N290G3X20.000Y48.771I-0.383J-0.322
N291G1X1.664
N292G3X1.229Y48.336I0.000J-0.435
N293G1Y1.664

Appendix G
210
N294G3X1.664Y1.229I0.435J0.000
N295G1X98.336
N296G3X98.771Y1.664I0.000J0.435
N297G1Y48.336
N298G3X98.336Y48.771I-0.435J0.000
N299G1X50.000
N300X20.000
N301G2X19.617Y48.949I0.000J0.500
N302G1X18.883Y49.822
N303G3X18.500Y50.000I-0.383J-0.322
N304G1X0.534
N305G3X0.000Y49.466I0.000J-0.534
N306G1Y0.534
N307G3X0.534Y0.000I0.534J0.000
N308G1X50.000
N309X99.466
N310G3X100.000Y0.534I0.000J0.534
N311G1Y49.466
N312G3X99.466Y50.000I-0.534J0.000
N313G1X50.000
N314X18.500
N315F6000
N316X18.110Z0.043
N317X17.735Z0.157
N318X17.389Z0.342

Appendix G
211
N319X17.086Z0.591
N320X16.837Z0.894
N321X16.652Z1.240
N322X16.538Z1.615
N323X16.500Z2.005
N324F10000
N325Z7.000
N326M09
N327M05
N328M30
%