electrical properties of a liquid crystal dispersed in an
TRANSCRIPT

155
Electrical properties of a liquid crystaldispersed in an electrospun cellulose acetate networkDoina Manaila Maximean*1, Octavian Danila1, Pedro L. Almeida*2,3
and Constantin Paul Ganea4
Full Research Paper Open Access
Address:1University Politehnica of Bucharest, Department of Physics, 313 Spl.Independentei, 060042, Bucharest, Romania, 2I3N - CENIMAT,Departamento de Ciência dos Materiais, Faculdade de Ciências eTecnologia, FCT/UNL, 2829-516 Caparica, Portugal, 3ÁreaDepartamental de Física, ISEL, Instituto Superior de Engenharia deLisboa, I.P.L., R. Conselheiro Emídio Navarro, 1959-007 Lisboa,Portugal and 4National Institute of Materials Physics, POBox MG 07,077125 Magurele, Romania
Email:Doina Manaila Maximean* - [email protected];Pedro L. Almeida* - [email protected]
* Corresponding author
Keywords:cellulose nanocomposite; dielectric spectroscopy; impedancespectroscopy; liquid crystal; optical transmission
Beilstein J. Nanotechnol. 2018, 9, 155–163.doi:10.3762/bjnano.9.18
Received: 27 July 2017Accepted: 18 December 2017Published: 15 January 2018
This article is part of the Thematic Series "Nanostructured liquid crystalsystems and applications".
Guest Editor: A. Emelyanenko
© 2018 Maximean et al.; licensee Beilstein-Institut.License and terms: see end of document.
AbstractElectro-optical devices that work in a similar fashion as PDLCs (polymer-dispersed liquid crystals), produced from cellulose
acetate (CA) electrospun fibers deposited onto indium tin oxide coated glass and a nematic liquid crystal (E7), were studied. CA
and the CA/liquid crystal composite were characterized by multiple investigation techniques, such as polarized optical microscopy,
dielectric spectroscopy and impedance measurements. Dielectric constant and electric energy loss were studied as a function of fre-
quency and temperature. The activation energy was evaluated and the relaxation time was obtained by fitting the spectra of the
dielectric loss with the Havriliak–Negami functions. To determine the electrical characteristics of the studied samples, impedance
measurements results were treated using the Cole–Cole diagram and the three-element equivalent model.
155
IntroductionThe widely known polymer dispersed-liquid crystals (PDLCs)
are a class of liquid crystal (LC)-based electro-optical devices,
formed by LC droplets dispersed in a solid polymeric matrix
[1-5]. The optical transmission of such devices is sensitive to
external AC electric fields. Without external influence (the so
called OFF state), PDLCs scatter the incident light due to the
fact that the LC molecules are anchored to the inner surface of
the droplets in the polymeric matrix, having a non-uniform ori-
entation between different droplets. Since there is no uniform
direction of alignment of the LC director between different
droplets, the optical path of the incident light travelling through
a PDLC is different from point to point, due to the mismatch

Beilstein J. Nanotechnol. 2018, 9, 155–163.
156
between the effective refractive index of the LC and the refrac-
tive index of the polymer. The state where the device becomes
transparent (the so called ON state) can be achieved by applying
an electric field with adequate magnitude. Under the action of
the field, the LC molecules inside each droplet align along the
direction of the field, and the ordinary refractive index of the
LC becomes equal to the refractive index of the polymeric
matrix, creating a constant optical path for the incident light
along the surface of the PDLC sample, reducing the light scat-
tering to a minimum and increasing the transmission of light to
a maximum. PDLC films have many interesting applications in
optoelectronics (light valves, polarizers), architectural windows,
reduction of solar heat load [2,6], nonlinear optics [7-9] and
nanotechnological applications [10-20].
The macroscopic electro-optical effect in electrospun cellulose
acetate/LC composites is similar to the one observed in tradi-
tional PDLC. The major difference is that instead of having
small droplets of LC confined in a polymeric matrix, the LC
fills the voids between fibers in mats of non-woven electro-spun
cellulose acetate fibers [21-27]. The electrospun cellulose fibers
were deposited on indium tin oxide (ITO)-coated glass, and two
such fiber-coated glass plates form a sandwich type cell, where
the nematic liquid crystal (NLC) is filled in by capillarity
[21,22,28]. A schematic representation of the electrospun cellu-
lose network with the dispersed liquid crystal as well as the
working principle is given in Figure 1.
Figure 1: Schematic representation of morphology and working prin-ciple of the electrospun cellulose network with the dispersed liquidcrystal. The applied electric field is denoted by .
The cellulose acetate used in the preparation of the CA/LC sam-
ples [29-33] was obtained from green and renewable sources.
The used nematic LC is E7, a mixture of alkylcyanobiphenyls
with a cyano head group [34-36]. This paper presents the inves-
tigations of the electrical properties of an electrospun CA
network with dispersed liquid crystals. Dielectric spectroscopy
(DS) was performed over wide ranges of frequency and temper-
ature to determine physical properties such as activation energy
and characteristic time. The experimental results of DS were
fitted to the Havriliak–Negami [37] model and further modelled
by the Vogel–Fulcher–Tammann law. In addition to this,
impedance spectroscopy measurements were performed, and
the results were processed using a simple equivalent circuit
model, that permits the extraction of electric circuit parameters.
Results and DiscussionScanning electron microscopyFigure 2 shows the SEM image of the deposited fibers
[21,22,28]. In the SEM image, the fibers exhibit a wide dimen-
sion range, starting with dozens of nanometres.
Figure 2: SEM image of deposited electrospun CA fibers.
Polarized optical microscopyFigure 3 presents the polarizing optical microscopy images of
the electrospun CA cell, (a) without LC and (b) filled with E7,
taken between crossed polarizers.
As it can be perceived by the colors seen in the POM image, the
LC fills the voids between the CA fibers (Figure 3b). The multi-
plicity of colors arises from the existence of liquid crystal poly-
domains imposed by the distortion of the nematic director field
through the fibers.
Dielectric spectroscopyThe characterized samples were electrospun CA without LC,
and the same CA sample after filling in the LC (denoted as
CA/E7 composite). The DS measurements were carried out

Beilstein J. Nanotechnol. 2018, 9, 155–163.
157
Figure 3: Polarizing optical microscopy images of the electrospun CA a) without LC and (b) filled with E7.
Figure 4: Dielectric constant and dielectric loss (logarithmic scale) as functions of the temperature for (a) the CA cell before filling in the LC and for(b) the CA/E7 cell, at 1 Hz and 10 Hz.
under isothermal conditions, in the frequency range from 10−1
to 107 Hz, in a temperature domain from 293 to 350 K.
The DS results were obtained by plotting the real and
imaginary components of the complex permittivity function
ε*(ω) = ε′(ω) − iε″(ω). Here, ε*(ω) is the dielectric permittivity,
the real part, ε′(ω), is the dielectric constant, and the imaginary
part, iε″(ω), is the dielectric loss [37].
Figure 4 shows dielectric constant and dielectric loss as func-
tions of the temperature at two constant representative frequen-
cies, 1 Hz and 10 Hz, for (a) the cell with CA fibers before
filling in the LC, and (b) for the same cell after the LC was
introduced. The changes of slope may indicate phase transi-
tions. Thus, we can suppose that CA without LC might have a
phase transition at T = 315 K. Similarly, the sample CA/E7
might have a phase transition at about 333 K. The verification
of this supposition is based on the fitting parameters of the
Vogel–Fulcher–Tammann law (see below in Figure 6 and
Table 1).
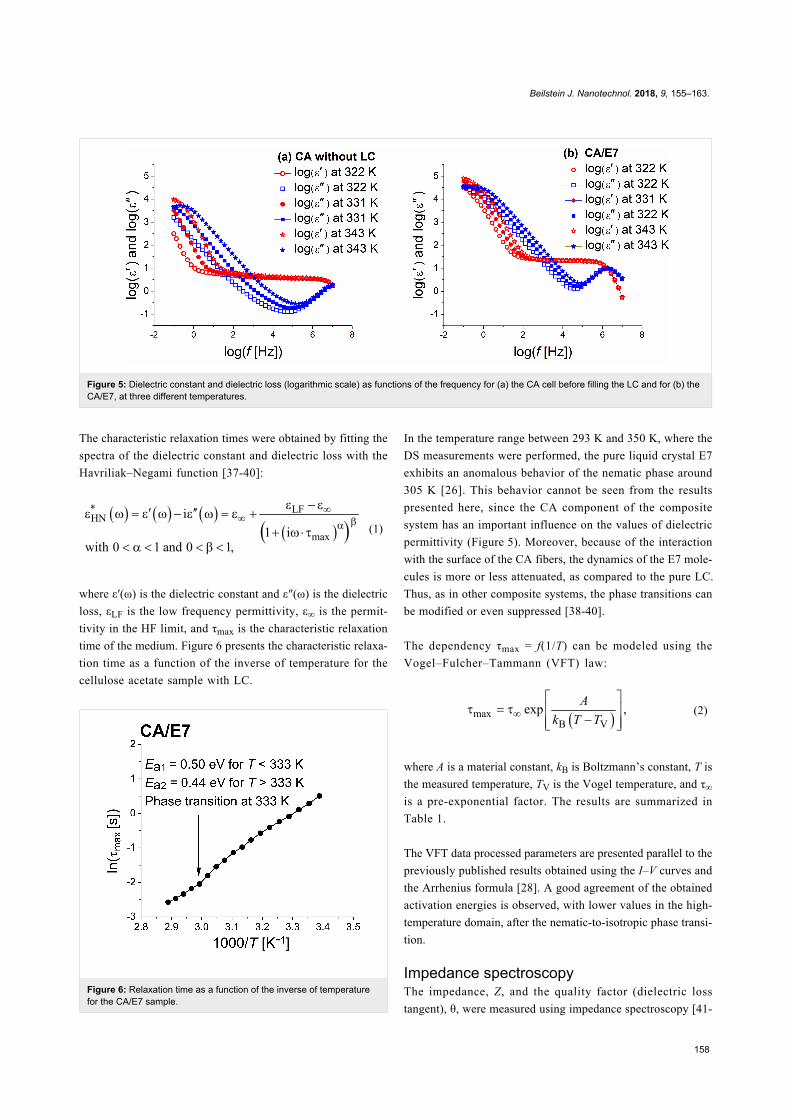
Figure 5 presents dielectric constant and dielectric loss as func-
tions of the frequency for the CA cell (a) before and (b) after
filling in the LC, at three constant temperatures. For the CA
sample without LC measured in the high frequency (HF)
domain, one notices a relaxation process outside the measure-
ment domain, while in the low frequency (LF) range, two
CA-attributable almost overlapping relaxation processes can be
observed at 1 Hz and 1000 Hz. The CA/E7 sample exhibits a re-
laxation process due to the LC in the HF measurement range,
and two almost overlapping relaxation processes in the LF
range.
Beilstein J. Nanotechnol. 2018, 9, 155–163.
158
Figure 5: Dielectric constant and dielectric loss (logarithmic scale) as functions of the frequency for (a) the CA cell before filling the LC and for (b) theCA/E7, at three different temperatures.
The characteristic relaxation times were obtained by fitting the
spectra of the dielectric constant and dielectric loss with the
Havriliak–Negami function [37-40]:
(1)
where ε′(ω) is the dielectric constant and ε″(ω) is the dielectric
loss, εLF is the low frequency permittivity, ε∞ is the permit-
tivity in the HF limit, and τmax is the characteristic relaxation
time of the medium. Figure 6 presents the characteristic relaxa-
tion time as a function of the inverse of temperature for the
cellulose acetate sample with LC.
Figure 6: Relaxation time as a function of the inverse of temperaturefor the CA/E7 sample.
In the temperature range between 293 K and 350 K, where the
DS measurements were performed, the pure liquid crystal E7
exhibits an anomalous behavior of the nematic phase around
305 K [26]. This behavior cannot be seen from the results
presented here, since the CA component of the composite
system has an important influence on the values of dielectric
permittivity (Figure 5). Moreover, because of the interaction
with the surface of the CA fibers, the dynamics of the E7 mole-
cules is more or less attenuated, as compared to the pure LC.
Thus, as in other composite systems, the phase transitions can
be modified or even suppressed [38-40].
The dependency τmax = f(1/T) can be modeled using the
Vogel–Fulcher–Tammann (VFT) law:
(2)
where A is a material constant, kB is Boltzmann’s constant, T is
the measured temperature, TV is the Vogel temperature, and τ∞
is a pre-exponential factor. The results are summarized in
Table 1.
The VFT data processed parameters are presented parallel to the
previously published results obtained using the I–V curves and
the Arrhenius formula [28]. A good agreement of the obtained
activation energies is observed, with lower values in the high-
temperature domain, after the nematic-to-isotropic phase transi-
tion.
Impedance spectroscopyThe impedance, Z, and the quality factor (dielectric loss
tangent), θ, were measured using impedance spectroscopy [41-

Beilstein J. Nanotechnol. 2018, 9, 155–163.
159
Table 1: Extracted values of the DS characteristic constants for the CA/E7 .
no. sampletype
investigation method temperature range[K]
activation energy,Ea
a [eV]Vogel temperatureTV [K]
relaxation time,τmax [s]
1 CA/E7 DS, Vogel–Fulcher–Tammann 295–328 0.50 0.61 3.79·10−9
333–346 0.44 0.22 2.38·10−8
2 CA/E7 [23] I–V curves, Arrhenius 308–330 0.66 — —333–353 0.54 — —
aBecause the obtained Vogel temperature is very small, the VFT equation approximates an Arrhenius-like expression, the material constant A beingincorporated into the activation energy Ea.
Figure 7: Active and reactive part of the impedance as functions of the frequency, for (a) the CA cell and for (b) the CA/E7 sample, at 323 K.
43]. Based on the obtained data, the real (active) impedance
component, Z′, and the imaginary (reactive) impedance compo-
nent, Z″ impedance components were calculated using the equa-
tions
(3)
and
(4)
Figure 7 presents selected plots of the active and reactive part of
the impedance as functions if the frequency, for (a) the CA cell
and for (b) the CA/E7 samples, at 323 K. The curves were ob-
tained by standard interpolation. The reactive part of the imped-
ance plays an important role in determining the components of
the equivalent electrical model, and it is presented in Figure 8
for different temperatures. The curves were obtained by interpo-
lation of the raw data.
The spectra of the two impedance components, Z′ and Z″, are
different for the samples CA and CA/E7. Similar to the DS
results, at low frequencies an E7 molecule-dynamic dipolar re-
laxation process is overlapping on the intrinsic CA processes
(Figure 7b and Figure 5b). Another process is observed at high
frequencies (1 MHz), attributed to LC molecules in the bulk,
“far” from the CA fibers, as seen in Figure 5b. The slow process
noticed at low frequencies (100 Hz), which is observed in
Figure 7b and less evident in Figure 5b, is due to the additional
interaction of dipoles with the surface. As the temperature in-
creases, the peak values of the reactive impedance shift to
higher frequencies (Figure 8).
The Cole–Cole [32] diagrams, Z″ = f(Z′), are presented in
Figure 9. The semicircular shapes of the diagrams allow for
modelling the raw data with a theoretical three-element electric
circuit model, consisting of a series resistance, a parallel resis-
tance and a parallel capacitor. The model is presented in
Figure 10.
The values of the serial and parallel resistances can be
calculated directly from the Cole–Cole diagrams using the
equation:

Beilstein J. Nanotechnol. 2018, 9, 155–163.
160
Figure 8: Normalized reactive part of the impedance as a function of the frequency for (a) the CA cell and for (b) the CA/E7 sample, at different tem-peratures.
Figure 9: Cole–Cole diagrams for (a) the CA cell at 303 K (black solid squares), 313 K (red solid circles), and 323 K (blue solid upward triangles), andfor (b) the composite CA/E7 at 313 K (black solid squares), 323 K (red solid circles), and 338 K (blue solid upward triangles).
Figure 10: Equivalent three-element model circuit, formed by a serialresistance, Rs, a parallel resistance, Rp, and a parallel capacitance,Cp.
(5)
To determine the parallel capacitance for the two samples, we
extracted relevant information from the frequency plot of Z″
(Figure 8) and the Cole–Cole diagram (Figure 9). In the
Cole–Cole diagram, for this particular model, the coordinate
having a maximum Z″ is also the position at which ωτ = 1,
where ω is the angular frequency. This angular frequency can
be deduced by estimating the frequency at which the maximum
value of Z″ is obtained (Figure 8). Also, the electrical response
time is τ = 1/(RpCp), and knowing the angular frequency, the ca-
pacitance can be determined. Based on the fitting technique, we
modeled the sample behavior by a simple three-element electric
circuit (Figure 10), which describes a single relaxation process.
The values of the determined electric parameters have an appro-
priate temperature variation (Table 2).
Electro-optical measurementsThe optical transmission was measured using the setup de-
scribed in the Experimental section of this paper and in
[21,22,28]. The transmission coefficient is defined as the ratio
between the light intensity passing through the sample and the
incident light intensity. Figure 11 presents the transmission

Beilstein J. Nanotechnol. 2018, 9, 155–163.
161
Table 2: Characteristic elements of the equivalent three-elementcircuit, extracted from the Cole–Cole diagrams.
no. T [K] sample RS [kΩ] Rp [MΩ] τ [s] Cp [nF]
1 313 CA 1810 714 0.5495 0.7692 313 CA/E7 15.17 7.37 0.3616 493 323 CA 2350 1350 0.2936 0.2184 323 CA/E7 17.58 12.8 0.3331 265 338 CA/E7 29.37 18.2 0.1667 9.1
coefficient versus the ac electric field. An improved character-
istic is observed, as compared to the previous similar devices
[21,22,28], with a stable “ON” state and a lower required elec-
tric field to switch between “OFF” and “ON”, at values of
1–1.5 V/μm. No significant optical hysteresis was observed be-
tween the transmission curves obtained when increasing and de-
creasing the applied voltage. The electro-optical response
remained stable when repeating the switching cycles.
Figure 11: Optical transmission of the sample CA/E7 as a function ofthe applied ac electric field.
ConclusionCA electrospun nanofibers were deposited onto ITO-coated
glass and an electro-optic cell was formed by two such glass
plates with fibers in between. By filling in the nematic liquid
crystal E7 a light scattering device with a polymer-dispersed
liquid crystal was obtained. Dielectric spectroscopy (DS) and
impedance measurements were performed on the electro-optic
cells before and after filling in the LC. Also, the dependency of
the dielectric constant and electric energy loss on frequency and
temperature was studied. The nematic–isotropic phase transi-
tion temperature of E7 and the activation energy were deter-
mined, and found to be in good agreement with previously ob-
tained data. The relaxation time was obtained by fitting the
spectra of the dielectric loss with the Havriliak–Negami func-
tion. Impedance measurements were evaluated using Cole–Cole
diagrams and the three-element equivalent model, which
permits the estimation of the equivalent resistances and capaci-
ty, necessary in practical applications. To test the efficiency of
the electro-optic device, optical transmission measurements in
external ac fields were performed.
ExperimentalSample preparationThe non-woven nano- and micro-fiber cellulose mats used to
prepare the electro-optical cells were produced by electrospin-
ning [21,22,28] from an isotropic solution (15%) of cellulose
acetate (CA, Aldrich, MW = 60.000 g·mol−1, 40% acetyl
groups) in a mixture of dimethylacetamide/acetone (1:2). The
solution was prepared at room temperature. After the first week,
it was stirred every day and kept away from light for at least
four weeks until used. To produce the fibers, the solution was
poured into a 1 mL syringe (diameter 4.5 mm) fitted with a
27-gauge needle (diameter 0.2 mm), which was then placed on
the infusion syringe, pump (KDS100) to better control the in-
coming flow of the polymer solution. A conducting ring is held
coaxially with the needle tip. The needle and the ring were
directly connected to the positive output of a high-power
voltage supply (Glassman EL 30 kV), as schematically
presented in Figure 12. After applying the electric potential be-
tween the metallic syringe tip and the plate, the fibers were
deposited directly onto the ITO-coated glass, over the ITO sur-
face. The fibers were then carefully dried in vacuum, at room
temperature, for 72 h before further characterization and use.
Figure 12: Schematic representation of electrospinning cellulose fibersfrom solution.
To prepare a sample cell, two ITO-coated glasses with fibers
were glued together with the fiber mat acting as a spacer. After
assembly, the cells thickness between the two ITO-coated
glasses was of around 20 μm. This sample was named CA.
Before filling the cells with the liquid crystal, the CA cells were
kept at 110 °C for 30 min and then allowed to cool slowly to
100 °C. The nematic liquid crystal E7 (commercially available
from Merck) was then filled in through capillarity. The liquid

Beilstein J. Nanotechnol. 2018, 9, 155–163.
162
Figure 13: Experimental set-up for the optical transmission measure-ment.
crystal E7 is a mixture of alkylcyanobiphenyls with a cyano
head group, exhibiting a nematic to isotropic transition at
333.5 K. The refractive index of the CA is 1.45 and the ordi-
nary refractive index of E7 liquid crystal is 1.51. This sample
type was named CA/E7.
Characterization techniquesScanning electron microscopyThe fiber dimensions and distribution were characterized by
SEM, using a SEM DSM 962 model from Zeiss Company after
thermal evaporation under vacuum of gold onto the surface of
the fibers.
Dielectric spectroscopyThe dielectric spectroscopy measurements were performed
using a broadband dielectric spectrometer, NOVOCONTROL,
consisting of two devices: an Alpha-A high-performance fre-
quency analyzer in the LF domain (0.01 to 107 Hz) and an
Agilent E4991A RF impedance/material analyzer for the HF
range, (1 MHz to 3 GHz), equipped with WinDETA software.
The temperature was controlled within 0.2 K, at a constant ac
voltage of 0.5 V.
Impedance measurementsImpedance spectroscopy was performed using a high-resolu-
tion LCR meter, Hioki – 3200-50 in the frequency range from
1 Hz to 10 kHz and a temperature-controlled hot-stage Mettler-
Toledo 3200 series.
Electro-optical transmissionThe optical transmission was measured using the setup previ-
ously described [21,22,28] and presented in Figure 13. A
He–Ne laser beam (wavelength 623.8 nm) passes through the
sample, which is modulated by an ac voltage provided by a
function generator–amplifier system. The laser beam is detected
by a high-speed photodiode with adjustable gain (Thorlabs).
The electrical signal generated by the photodiode was recorded
with a high-resolution voltmeter Keithley 6517A.
AcknowledgementsThis work was partially funded by FEDER funds through the
COMPETE 2020 Program and National Funds through FCT -
Portuguese Foundation or Science and Technology under the
projects nos. POCI-01-0145-FEDER-007688 (Reference UID/
CTM/50025) and PTDC/FIS-NAN/0117/2014. Constantin Paul
Ganea thanks the Romanian Ministry of Education and
Research for financial support under PN16-480101 of CORE
Program. Doina Manaila Maximean thanks Ligia Frunza and
Stefan Frunza for useful discussions.
ORCID® iDsPedro L. Almeida - https://orcid.org/0000-0001-7356-8455
References1. Mucha, M. Prog. Polym. Sci. 2003, 28, 837–873.
doi:10.1016/S0079-6700(02)00117-X2. Drzaic, P. S. Liquid crystal dispersions; Series on Liquid Crystals, Vol.
1; World Scientific Publishing Co Pte Ltd: Singapore, 1995.doi:10.1142/2337
3. Loiko, V. A. Polymer Films with Nanosized Liquid-Crystal Droplets:Extinction, Polarization, Phase, and Light Focusing. In Nanodroplets;Wang, Z., Ed.; Lecture Notes in Nanoscale Science and Technology,Vol. 18; Springer: New York, NY, U.S.A., 2013; pp 195–235.doi:10.1007/978-1-4614-9472-0_9
4. Bedjaoui-Alachaher, L.; Semdani, F.; Meziane, R.; Maschke, U.Mol. Cryst. Liq. Cryst. 2011, 546, 87–157.doi:10.1080/15421406.2011.571925
5. Manaila-Maximean, D.; Rosu, C.; Klosowicz, S.; Czuprynski, K. L.;Gilli, J. M.; Aleksander, M. Mol. Cryst. Liq. Cryst. 2004, 417, 199–205.doi:10.1080/15421400490478830
6. Schmidt, J.; Dierking, I. Prog. Photovoltaics 2001, 9, 263–272.doi:10.1002/pip.378
7. Zegadlo, K. B.; El Ouazzani, H.; Cieslik, I.; Weglowski, R.; Zmija, J.;Klosowicz, S.; Majchrowski, A.; Mysliwiec, J.; Sahraoui, B.;Karpierz, M. A. Opt. Mater. 2012, 34, 1704–1707.doi:10.1016/j.optmat.2012.02.027
8. Miedzinski, R.; Ebothe, J.; Fuks-Janczarek, I.; Kityk, I. V.;Majchrowski, A.; Weglowski, R.; Klosowicz, S. J.J. Mater. Sci.: Mater. Electron. 2010, 21, 659–665.doi:10.1007/s10854-009-9973-5
9. Manaila-Maximean, D.; Albu, A. M.; Umanski, B. A.; Rosu, C.; Bena, R.Proc. SPIE 2001, 4430, 554–559. doi:10.1117/12.432891
10. Cîrcu, V.; Gibbs, T. J. K.; Omnès, L.; Horton, P. N.; Hursthouse, M. B.;Bruce, D. W. J. Mater. Chem. 2006, 16, 4316–4325.doi:10.1039/B608823F
11. Micutz, M.; Iliş, M.; Staicu, T.; Dumitraşcu, F.; Pasuk, I.; Molard, Y.;Roisnel, T.; Cîrcu, V. Dalton Trans. 2014, 43, 1151–1161.doi:10.1039/C3DT52137K
12. Roşu, C.; Manaila-Maximean, D.; Cîrcu, V.; Molard, Y.; Roisnel, T.Liq. Cryst. 2011, 38, 757–765. doi:10.1080/02678292.2011.573585
13. Tsai, T.-Y.; Lee, C.-Y.; Lee, C.-J.; Chang, W.-C.; Lee, W.; Chen, P.-C.J. Phys. Chem. Solids 2010, 71, 595–599.doi:10.1016/j.jpcs.2009.12.045
14. Shibaev, P. V.; Kopp, V. I.; Genack, A. Z. J. Phys. Chem. B 2003, 107,6961–6964. doi:10.1021/jp0222189

Beilstein J. Nanotechnol. 2018, 9, 155–163.
163
15. Palffy-Muhoray, P.; Cao, W.; Moreira, M.; Taheri, B.; Munoz, A.Philos. Trans. R. Soc. London, Ser. A 2006, 364, 2747–2761.doi:10.1098/rsta.2006.1851
16. Hinojosa, A.; Sharma, S. C. Appl. Phys. Lett. 2010, 97, 081114.doi:10.1063/1.3482942
17. Rosu, C.; Manaila-Maximean, D.; Donescu, D.; Frunza, S.;Sterian, A. R. Mod. Phys. Lett. B 2010, 24, 65–73.doi:10.1142/S0217984910022238
18. Cîrtoaje, C.; Petrescu, E.; Moţoc, C. Physica E 2013, 54, 242–246.doi:10.1016/j.physe.2013.07.005
19. Palarie, I.; Dascalu, C.; Iacobescu, G. E.; Varut, M. C. Liq. Cryst. 2012,39, 833–837. doi:10.1080/02678292.2012.684072
20. Cîrcu, V.; Mocanu, A. S.; Roşu, C.; Manaila-Maximean, D.;Dumitraşcu, F. J. Therm. Anal. Calorim. 2012, 107, 877–886.doi:10.1007/s10973-011-1609-3
21. Almeida, P. L.; Kundu, S.; Borges, J. P.; Godinho, M. H.;Figueirinhas, J. L. Appl. Phys. Lett. 2009, 95, 043501.doi:10.1063/1.3186640
22. Almeida, P. L.; Godinho, M. H.; Figueirinhas, J. L. Phys. Rev. E 2014,89, 012507. doi:10.1103/PhysRevE.89.012507
23. Bouchakour, M.; Derouiche, Y.; Beyens, C.; Mechernène, L.; Riahi, F.;Maschke, U. Liq. Cryst. 2015, 42, 1527.doi:10.1080/02678292.2015.1044579
24. Boudraa, K.; Dali Youcef, B.; Bedjaoui, L.; Bouchaour, T.; Maschke, U.Macromol. Symp. 2014, 336, 61–67. doi:10.1002/masy.201300016
25. Loiko, V. A.; Krakhlev, M. N.; Konkolovich, A. V.; Prischepa, O. O.;Miskevich, A. A.; Zyryanov, V. Ya.J. Quant. Spectrosc. Radiat. Transfer 2016, 178, 263–268.doi:10.1016/j.jqsrt.2015.10.024
26. De Sousa, F. A.; Michels, R. N.; Cardoso, P. M. M.; De Jesus, M. M. A.Mol. Cryst. Liq. Cryst. 2013, 576, 106–117.doi:10.1080/15421406.2013.789711
27. De Jesus, M. M. A. Caracterização eletro-óptica de uma misturalíquido cristalina eutética em diferentes configurações deconfinamento. Ph.D. Thesis, Universidade Estadual de Maringa,Maringa, Brazil, 2009.
28. Rosu, C.; Manaila-Maximean, D.; Kundu, S.; Almeida, P. L.; Danila, O.J. Electrost. 2011, 69, 623–630. doi:10.1016/j.elstat.2011.08.009
29. Sena, C.; Godinho, M. H.; de Oliveira, C. L. P.; Figueiredo Neto, A. M.Cellulose 2011, 18, 1151–1163. doi:10.1007/s10570-011-9575-2
30. Geng, Y.; Brogueira, P.; Figueirinhas, J. L.; Godinho, M. H.;Almeida, P. L. Liq. Cryst. 2013, 40, 769–773.doi:10.1080/02678292.2013.783137
31. Godinho, M. H.; Almeida, P. L.; Figueirinhas, J. L. Materials 2014, 7,4601–4627. doi:10.3390/ma7064601
32. Aflori, M.; Serbezeanu, D.; Carja, I.-D.; Fortunato, G. Chem. Lett. 2015,44, 1440–1442. doi:10.1246/cl.150546
33. Tański, T.; Matysiak, W.; Hajduk, B. Beilstein J. Nanotechnol. 2016, 7,1141–1155. doi:10.3762/bjnano.7.106
34. Viciosa, M. T.; Nunes, A. M.; Fernandes, A.; Almeida, P. L.;Godinho, M. H.; Dionísio, M. D. Liq. Cryst. 2002, 29, 429–441.doi:10.1080/02678290110113478
35. Rosu, C.; Manaila-Maximean, D.; Godinho, M. H.; Almeida, P. L.Mol. Cryst. Liq. Cryst. 2003, 391, 1–11. doi:10.1080/10587250216170
36. Manaila-Maximean, D.; Bena, R.; Albu, A.-M. Mod. Phys. Lett. B 1997,431–440. doi:10.1142/S0217984997000530
37. Kremer, F.; Schönhals, A., Eds. Broadband Dielectric Spectroscopy;Springer-Verlag: Berlin-Heidelberg, Germany, 2003.doi:10.1007/978-3-642-56120-7
38. Frunza, L.; Kosslick, H.; Frunza, S.; Schönhals, A.Microporous Mesoporous Mater. 2006, 90, 259–270.doi:10.1016/j.micromeso.2005.10.025
39. Frunza, S.; Schönhals, A.; Frunza, L.; Beica, T.; Zgura, I.; Ganea, P.;Stoenescu, D. Chem. Phys. 2010, 372, 51–60.doi:10.1016/j.chemphys.2010.04.031
40. Brás, A. R.; Frunza, S.; Guerreiro, L.; Fonseca, I. M.; Corma, A.;Frunza, L.; Dionísio, M.; Schönhals, A. J. Chem. Phys. 2010, 132,224508. doi:10.1063/1.3432775
41. Cole, K. S.; Cole, R. H. J. Chem. Phys. 1941, 9, 341–352.doi:10.1063/1.1750906
42. Wang, Y.-M.; Snyder, D. D.; Nelson, G. J. Mol. Cryst. Liq. Cryst. 1987,149, 163–176. doi:10.1080/00268948708082977
43. Rout, D. K.; Jain, S. C. Mol. Cryst. Liq. Cryst. 1992, 210, 75–81.doi:10.1080/10587259208030758
License and TermsThis is an Open Access article under the terms of the
Creative Commons Attribution License
(http://creativecommons.org/licenses/by/4.0), which
permits unrestricted use, distribution, and reproduction in
any medium, provided the original work is properly cited.
The license is subject to the Beilstein Journal of
Nanotechnology terms and conditions:
(http://www.beilstein-journals.org/bjnano)
The definitive version of this article is the electronic one
which can be found at:
doi:10.3762/bjnano.9.18