electrical resistance tomography (ert)€¦ · web viewimaging tool for the real-time measurement...
TRANSCRIPT
ABSTRACT— Random or structured packing is typically used in the chemical reactors to increase the contact area between gas and liquid phases, and thus improve reaction efficiency. Knowledge of how packing types and sizes affect gas distribution and the overall gas void fraction is critical for the optimal design and operation of industrial processes. In this work, a method of in-situ quantifying the gas distribution and void fraction in packed bubble column using electrical resistance tomography (ERT) is proposed. A 3D simulation validation shows that the ERT is able to quantitatively determine the gas void fraction within 4.0% relative error against the theoretical value. The experiment was conducted in a bubble column, packed with 6 mm glass beads and 16 mm plastic pall rings. The results demonstrate that the gas distribution and the void fraction are considerably changed by different packing materials. All of these facts suggest ERT is a reliable imaging tool for the real-time measurement of complex two-phase flows in the packed bubble column reactors.
Keywords: Electrical resistance tomography (ERT), Packed bubble column, Gas distribution and void fraction, Gas-liquid two-phase flow
1. Introduction
In gas-liquid phase mass transfer processed, the packed column is a hollow tube, pipe, or vessel filled with a constant packing. The packing can be made up of small objects such as Raschig rings, or specifically designed structured packing. Packed columns may also contain catalyst particles or adsorbents such as zeolite pellets, granular activated carbon, etc. Typically the purpose of the packed columns is to improve contact area between the gas and liquid phases of the mass transfer process. However, the existence of packing changes flow dynamics, for example, the gas phase distribution and void fraction in the packed column.
Electrical Resistance Tomography (ERT) is a non-intrusive, fast and low-cost alternative to hard field tomographic modalities in chemical engineering to measure gas void fraction in the reaction column [1-2]. However, these studies are limited to the case of the packing-free column. The study of the effect of packing on system using ERT is also limited to liquid dispersed phase in non-flooded packed columns. For instance, Hurry [3] used ERT to visualise the transport of fluids
through a structured rock heaps column, however, the quantitative gas void fraction distribution was not studied. Later, axial profiles of liquid holdups in structured packing columns were estimated by a conductivity technique [4]. A study of liquid holdup in different structure packings was presented [5]. The effects of liquid velocity on holdup and its distribution were discussed. Liquid distribution and hold-up in the counter current flow with structured packing was investigated using electrical capacitance tomography (ECT) [6]. Displacement-current phase tomography (DCPT) is a new sensing modality utilising the phase information of the displacement current in the region of interest to reconstruct the imaginary part of the complex permittivity [7]. DCPT is able to image water continuous two-phase flow without direct contact between water and the electrodes [8].
So far, there is no thorough study focusing on gas void fraction in a packed column to complement the previous study on liquid holdup. Information on both phases is essential for characterising flow dynamics in packed columns. The major aim of this study is to propose an ERT based method and quantitatively measure gas void fraction inside a bubble reactor column in a laboratory experiment. The method is then used to study the dependence of gas void fraction and distribution on different experimental conditions, such as the shape of packing, volumetric gas flow rates.
2. Measurement Principle
A.Electrical Resistance Tomography (ERT)
A new ERT operation mechanism has been developed to extend the measurement capability of ERT [9]. As illustrated in Fig.1, a voltage source is applied to a pair of adjacent electrodes in a 16 electrodes ring array as an excitation source. The response voltage across next pair of electrodes is acquired one at a time. All other electrodes remain floating. Both the output current from this voltage source and the response voltages across successive pairs of adjacent electrodes are monitored simultaneously to obtain mutual impedance Z (Z=V/I). The process is then repeated by switching the voltage source to the next pair of adjacent electrodes and calculating corresponding mutual impedances until all 104 independent measurements are taken. The key benefit of this measurement methodology is that the amplitude of output current is adjustable in terms of the
1
Quantification of Gas Distribution and Void Fraction in Packed Bubble Column Using Electrical Resistance Tomography
Huarui Wang, Jiabin Jia*, Yunjie Yang, Bill Buschle and Mathieu Lucquiaud
School of Engineering, University of Edinburgh, UK
Email: [email protected]

electrical conductivity of the medium inside the ERT sensor. When the two-phase flow has a highly conductive liquid phase, the voltage source can generate up to hundreds milliamp current to ensure the response voltage V is large enough for accurate measurement. In contrast, a typical 10 kHz current source only generates dozens of milliamp current, therefore, the current source ERT cannot work for the high-conductivity background, because the response voltage is too small to be measured accurately.
Fig.1 Schematic of voltage source ERT.In order to obtain the void fraction of non-conductive
gaseous dispersed phase, a two-step ERT measurement procedure needs to be employed. First, an ERT reference measurement must be taken to find the mutual impedance of continuous phase when the pipe or column is filled with conductive liquid only. Next, gas is introduced into the column and the mutual impedance of the liquid and gas mixture in the pipe or column is measured again. The difference between the two mutual impedance measurements is used to derive the void fraction of the gas phase.
In the ERT, a linearised model is used to represent the relationship between conductivity change in each image pixel and mutual impedance detected across all the electrode pairs on the condition of a small conductivity perturbation (σmc – σ << σ) [8].
(1)
where S∈Rm× n is the sensitivity matrix; the vectors Z∈Rmand Zmc∈Rm refer to the mutual impedance of the continuous phase and the mutual impedance after the dispersed phase is introduced into the ERT sensor respectively. I∈Rn is an all-one vector. The vector σ∈Rn is the conductivity of continuous phase and σmc
∈Rnis the mixture conductivity after the dispersed phase is introduced into the ERT sensor. The operation ./ denotes the division of corresponding elements. According to the Maxwell-Garnett formula [10], the void fraction of dispersed phase α ∈Rnis a vector as well and can be derived from the conductivity ratio σmc./σ.
(2)
Substituting equation (1) into (2) builds the ultimate relationship between the local void fraction of the dispersed phase and mutual impedance
(3)
Previous study [11] found that ERT could accurately measure full void fraction range of dispersed phase from 0 to 1 when the conductive liquid remained as the continuous phase in the mixture, which is an essential prerequisite for the study discussed in this work. In some scenarios of this work, the total void fraction of non-conductive dispersed phase can reach up to 0.72.
The sensitivity coefficients in the sensitivity matrix S are derived by equation below and computed using Finite Element Method software COMSOL Multiphysics.
s j(σk )=−∫Ωk
∇∅I∅
∙ ∇φIφ
d Ωk
(4)
where Ωk is the discrete 2D area of the kth pixel, ϕ is the potential distribution within the kth pixel when the excitant electrode pair during the jth measurement is excited by Iϕ and other electrodes are set to high impedance, φ is the potential distribution at the kth pixel when the measurement electrode pair during the jth
measurement is excited by Iφ and other electrodes are set to high impedance.
B.Estimation of radial gas void fraction and distribution
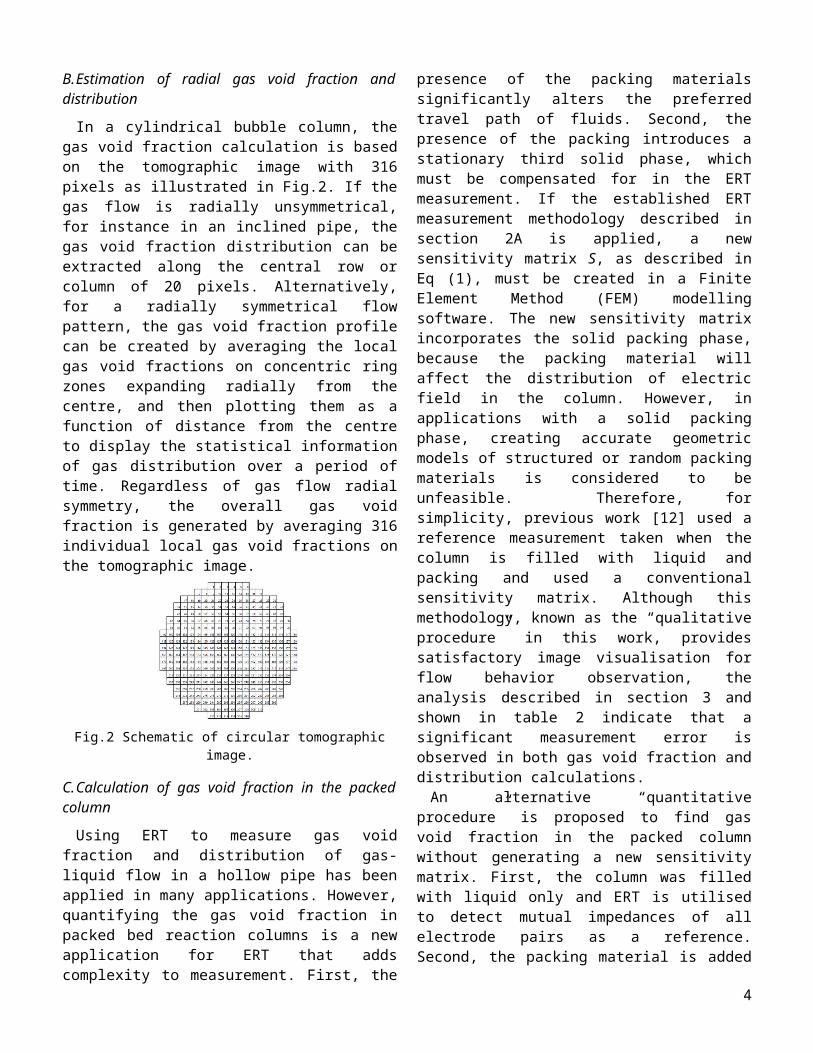
In a cylindrical bubble column, the gas void fraction calculation is based on the tomographic image with 316 pixels as illustrated in Fig.2. If the gas flow is radially unsymmetrical, for instance in an inclined pipe, the gas void fraction distribution can be extracted along the central row or column of 20 pixels. Alternatively, for a radially symmetrical flow pattern, the gas void fraction profile can be created by averaging the local gas void fractions on concentric ring zones expanding radially from the centre, and then plotting them as a function of distance from the centre to display the statistical information of gas distribution over a period of time. Regardless of gas flow radial symmetry, the overall gas void fraction is generated by averaging 316 individual local gas void fractions on the tomographic image.
2

Fig.2 Schematic of circular tomographic image.
C. Calculation of gas void fraction in the packed column
Using ERT to measure gas void fraction and distribution of gas-liquid flow in a hollow pipe has been applied in many applications. However, quantifying the gas void fraction in packed bed reaction columns is a new application for ERT that adds complexity to measurement. First, the presence of the packing materials significantly alters the preferred travel path of fluids. Second, the presence of the packing introduces a stationary third solid phase, which must be compensated for in the ERT measurement. If the established ERT measurement methodology described in section 2A is applied, a new sensitivity matrix S, as described in Eq (1), must be created in a Finite Element Method (FEM) modelling software. The new sensitivity matrix incorporates the solid packing phase, because the packing material will affect the distribution of electric field in the column. However, in applications with a solid packing phase, creating accurate geometric models of structured or random packing materials is considered to be unfeasible. Therefore, for simplicity, previous work [12] used a reference measurement taken when the column is filled with liquid and packing and used a conventional sensitivity matrix. Although this methodology, known as the “qualitative procedure” in this work, provides satisfactory image visualisation for flow behavior observation, the analysis described in section 3 and shown in table 2 indicate that a significant measurement error is observed in both gas void fraction and distribution calculations.
An alternative “quantitative procedure” is proposed to find gas void fraction in the packed column without generating a new sensitivity matrix. First, the column was filled with liquid only and ERT is utilised to detect mutual impedances of all electrode pairs as a reference. Second, the packing material is added into liquid and the mutual impedances are measured again by ERT. The changes in these mutual impedances with respect to the reference are used to obtain the solid fraction of the packing. Third, gas is introduced into the packed column, the changes in mutual impedances caused by the presence of gas are measured the third time by ERT.
The changes in these mutual impedances are used to obtain the total fraction of the packing material and gas. Finally, the gas void fraction is obtained by subtracting the void fraction of the packing from the total fraction. In the following section, the accuracy of this procedure is validated in the simulation study.
3. Simulation Validation
To validate the accuracy of the ERT quantitative measurement procedure, two 3D ERT simulations were conducted by combining COMSOL Multiphysics 5.2 with MATLAB. The first simulation calculated the various solid fraction of glass beads and compared with the real solid void fraction obtained by counting the number of glass beads. The second simulation calculated the gas void fraction in a glass bead packed column and compared with the real value.
In the first simulation, a 3D cylindrical model was built with 50 mm internal diameter and 125 mm height. 16 stainless steel rectangular ERT electrodes with 6 mm width and 20 mm height are mounted in the middle of the column. These dimensions were the same as these of the experimental rig described in section 4. Represented by blue spheres in Fig.4, hundreds of glass beads with 6 mm diameter were randomly packed in the column. The conductivity of blue spheres was set to 1×10⁻¹⁰ mS/cm and the remaining space inside the column was set to 10 mS/cm as water phase. The mutual impedances of all 104 independent electrode pairs were computed in COMSOL to simulate ERT measurement data.
(a) (b)
3
(c) (d)
Fig.4 3D model of ERT sensor and different number of blue spheres with 6 mm diameter, (a). 500 spheres, (b). 400
spheres, (c). 300 spheres and (d). 200 spheres.
These mutual impedance measurements were used as raw data to retrieve an image of relative conductivity change using Eq (1). Then the relative conductivity change was converted into the overall solid fraction of glass beads using Eq (3). This result was compared with the genuine value of the overall solid fraction of the glass beads, which was determined by the volume ratio of glass beads against the total volume of the column.
The solid fractions of spheres obtained from ERT calculation and the real solid fractions are shown in Table.1. The ERT measurement procedure demonstrates good performance across a range of 200 to 500 spheres, capable of determining the overall solid fraction of spheres in a water and solid two-phase system with no more than 5.22% relative error.
Table 1. Solid fractions of blue spheres in the column.Number of spheres 500 400 300 200
Real volume fraction 0.230 0.184 0.138 0.092
Volume fraction obtained from ERT
0.242 0.186 0.142 0.088
Relative error (%) 5.22 1.09 2.90 4.35
In the second simulation, 500 spheres with 6 mm diameter were randomly positioned inside the column again. However, a fraction of the spheres were randomly classified as packing represented by blue spheres with the remainder classified as gas bubbles represented by grey spheres as shown in Fig.5. The conductivities of blue and grey spheres were set to 1×10⁻¹⁰ and 8×10-14
mS/cm respectively. The remaining space inside the column was considered a liquid phase and set its conductivity to 10 mS/cm. The void fractions of the grey spheres in this liquid, gas and solid three-phase system were calculated using the ERT qualitative and quantitative procedures described previously for comparison.
Table 2 shows the gas void fraction obtained from two procedures against the real values. The relative measurement errors of the two methods in rows 5 and 7 demonstrates that the quantitative ERT procedure shows significant improvement over the qualitative procedure, with a reduction by factor of ~3 to ~6.
(a) (b)
(c) (d)
Fig. 5 3D model of ERT sensor with blue and grey spheres with 6 mm diameter.
Table 2. Void fractions of grey shperes in packed column.
Number of blue spheres (packing) 125 166 250 334
Number of grey spheres (gas) 375 334 250 166
Genuine gas void fraction 0.173 0.154 0.115 0.077
Gas void fraction from qualitative procedure 0.192 0.172 0.129 0.087
Relative error (%) 10.98 11.69 12.17 12.99
Gas void fraction from quantitative procedure 0.180 0.157 0.118 0.076
Relative error (%) 3.89 1.91 2.61 1.30
The validation simulations theoretically demonstrate that ERT with the quantitative procedure is an accurate
4

tool to quantify the gas void fraction in the packed column.
4. Experimental Setup
The voltage source ERT scheme expanded the capacity of working for high conductive flow and full range of void fraction measurement, though the two-phase flow the ERT system can handle must have water as a continuous phase. A series of experiments were conducted on a bubble column to demonstrate the performance of ERT for characterising gas distribution and void fraction measurements. The column is made of the transparent acrylic resin with 50 mm internal diameter and 250 mm height. The middle of the column was surrounded by one ERT sensor plane which was composed of 16 electrodes mounted into the inner walls of the column in a non-intrusive fashion. The electrodes were made of stainless steel with the rectangular contact areas of 6 mm width and 20 mm height.
The performance of ERT in application depends on its parameter configurations. As visualisation of the real-time images was not required in this experiment, the system was configured as block mode for rapid data capture and off-line data analysis. The number of the sinusoidal cycles for each stimulation signal was set as 5. Data acquisition rate was set to 125 image frames per single sensing plane. A critical parameter is the phase shift of switching timing, which can significantly reduce transient process and measurement error. The ERT system was set to automatically find and apply the optimal phase shift.
As shown in Fig. 6, the packing materials in the experiment are plastic pall rings with 16 mm diameter and height, and glass beads with 6 mm diameter. These packing materials are randomly heaped in the bubble column as shown in Fig. 7. The volume of packing added to the bubble column is determined by measuring the liquid level before and after the addition to calculate the volume of liquid displaced by the packing. In the bubble column, NaCl solutions with different conductivity were used as a continuous liquid phase and bottled air was used as a gas phase. Air was continuously injected through a small nozzle with 4.63 mm diameter at the center of the column base and into the interior of the column. The distance between gas inlet and tomographic plane is 110.0 mm. In the experiment, gas was introduced into a static liquid column filled with different packing materials as a gas-liquid-solid three-phase mixture. The gas volumetric flow rate varied from 0.52 L/min to 1.80 L/min and was controlled by an XFM digital mass flow meter from Aalborg Instruments & Controls, Inc.
(a) (b)
Fig. 6 Packing materials (a) plastic pall rings; (b) glass beads.
(a) (b)
Fig. 7 Experimental setup: ERT sensor with (a) pall rings packed bubble columnwith and (b) glass beads packed bubble column.
The conductivity of the glass beads is estimated to be in the range of 1×10⁻¹⁴ to 1×10⁻¹⁰ mS/cm and the conductivity of polypropylene plastic pall ring is estimated to be in the range of 1×10⁻¹² to 1×10⁻¹⁵ mS/cm. The conductivity of gas is estimated to be in the range of 3×10⁻¹⁴ to 8×10⁻¹⁴ mS/cm. Both the packing and gas phases have considerably smaller conductivity thanNaCl solution, whose conductivity in our experiment varied from 0.1 to 50.0 mS/cm. Thus, the packing and gas can be regarded as the same non-conductive material. This assumption simplifies a three-phase mixture into a two-phase system so that Eq (3) can still be used to calculate the total fraction of packing materials and gas. As stated in Section 2A, the voltage source of the ERT system was developed specially for highly conductive flow. The v5r Electrical Resistance Tomography System from Industrial Tomography Systems plc was used for the experiments in this work.
The first experiment verified the robustness of the ERT system against changes in liquid conductivity. The 6 mm glass beads were fully and randomly packed in the column, but the conductivity of liquid phase was changed from 0.133 mS/cm to 80.1 mS/cm. The electrical conductivity of liquid was measured by HACH sensION+ EC5 Portable Conductivity Meter. The solid fraction of the glass beads packing was determined by
5

the ERT system and water displacement method. The overall solid fraction of glass beads should be constant regardless of background liquid conductivity.
The second set of experiments quantified the effect of packing materials on the gas distribution and void fraction in the column. First, ERT measurements were conducted with no packing present in the column. Next, plastic pall rings and glass beads were added into the column separately. The gas distribution and the void fraction under each packing condition were measured using the quantitative procedure. The results will be presented and discussed in next section.
5. Experimental Results and Discussion
A. Solid fraction of packing
The solid fractions of glass beads packing and pall ring packing were measured by ERT using the quantitative method described previously in section 2A at different liquid conductivities. The solid fractions of glass beads packing and pall ring packing were found to be 0.59 and 0.15 respectively based on the liquid displacement method, which is marked as red and blue dashed lines in Fig.8. It is worth noting that the solid fraction of glass beads reported here is in line with the theoretical value of 0.58 of identical spherical glass beads in a corresponding volume. This theoretical value was, for example, calculated using an algorithm [13], which simulated sequential introduction of packing in a container with spherical glass beads falling in the gravitational field. The method described the actual process of generating packing without considering interacted forces among glass beads and vibration [14].
It can be seen from Fig.8 that the solid fractions of the glass beads and pall rings packing in NaCl solution are accurately computed using the voltage source ERT system with less than 5% error, when the conductivity of NaCl solution is from 1.446 mS/cm to 80.1 mS/cm. However, the solid fraction of glass beads is underestimated by 11%, when the background liquid phase was tap water with 0.133 mS/cm conductivity. Since the accuracy of mutual impedance Z (Z=V/I) in Eq (3) is determined by both response voltage (V) across electrodes and output current (I) of voltage source, the measurement error on either V or I can propagate to Z and can affect the accuracy of the solid fraction calculation. For instance, if the medium has a very low conductivity as is the case with tap water, the magnitude of output current (I) is low, which occurs large measurement error. If the medium has a very high conductivity, the magnitude of response voltage (V) is low, which occurs large measurement error too. Both glass bead and pall ring are non-conductive, but the solid fraction of glass beads is much larger than that of and pall rings. When the continuous liquid is tap water, the
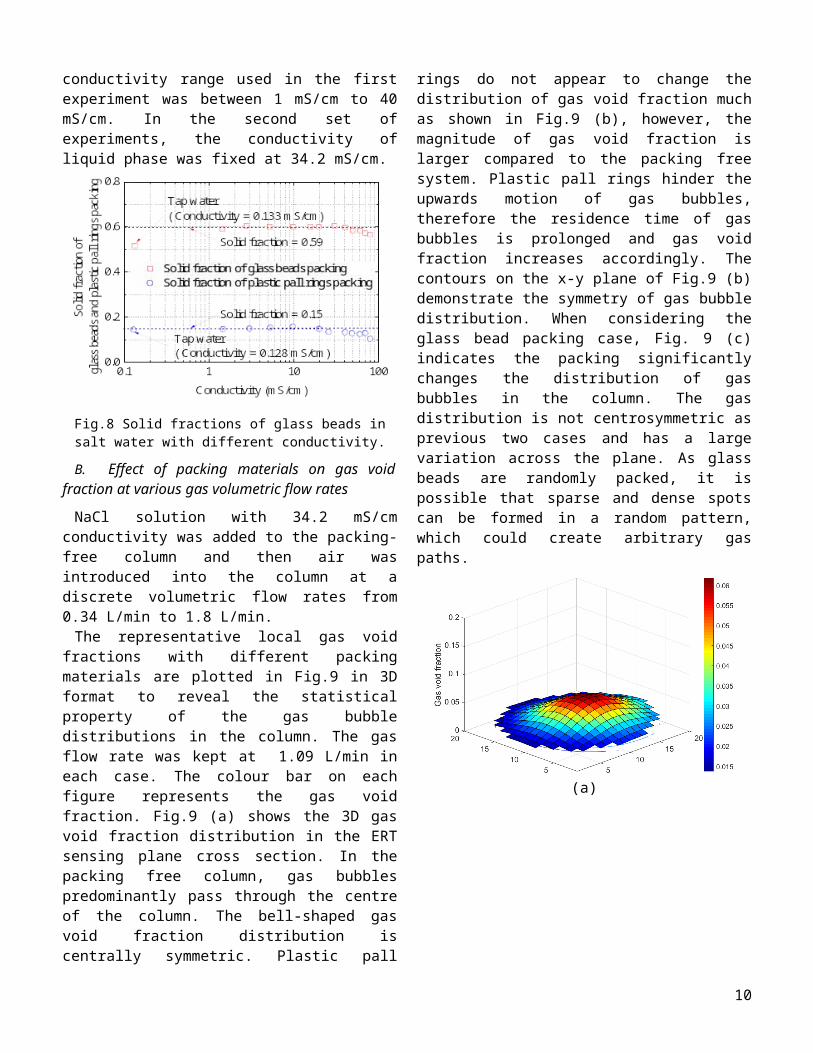
overall conductivity of glass beads column is much lower than that of pall rings column. Therefore, the solid fraction of glass beads measured by ERT is not as accurate as the solid fraction of pall rings. This would indicate that the larger the solid fraction of packing, the narrower the conductivity range ERT can measure accurately. Whereas, if liquid phase has very high conductivity, the values of response voltage become small despite output current is large, which deteriorates the accuracy of the solid fraction as well. This trend starts showing up after the conductivity is larger than 40 mS/cm. For both packing types, the conductivity range used in the first experiment was between 1 mS/cm to 40 mS/cm. In the second set of experiments, the conductivity of liquid phase was fixed at 34.2 mS/cm.
Fig.8 Solid fractions of glass beads in salt water with different conductivity.
B. Effect of packing materials on gas void fraction at various gas volumetric flow rates
NaCl solution with 34.2 mS/cm conductivity was added to the packing-free column and then air was introduced into the column at a discrete volumetric flow rates from 0.34 L/min to 1.8 L/min.
The representative local gas void fractions with different packing materials are plotted in Fig.9 in 3D format to reveal the statistical property of the gas bubble distributions in the column. The gas flow rate was kept at 1.09 L/min in each case. The colour bar on each figure represents the gas void fraction. Fig.9 (a) shows the 3D gas void fraction distribution in the ERT sensing plane cross section. In the packing free column, gas bubbles predominantly pass through the centre of the column. The bell-shaped gas void fraction distribution is centrally symmetric. Plastic pall rings do not appear to change the distribution of gas void fraction much as shown in Fig.9 (b), however, the magnitude of gas void fraction is larger compared to the packing free system. Plastic pall rings hinder the upwards motion of gas bubbles, therefore the residence time of gas bubbles is
6

prolonged and gas void fraction increases accordingly. The contours on the x-y plane of Fig.9 (b) demonstrate the symmetry of gas bubble distribution. When considering the glass bead packing case, Fig. 9 (c) indicates the packing significantly changes the distribution of gas bubbles in the column. The gas distribution is not centrosymmetric as previous two cases and has a large variation across the plane. As glass beads are randomly packed, it is possible that sparse and dense spots can be formed in a random pattern, which could create arbitrary gas paths.
(a)
(b)
(c)
Fig.9 3D Gas void fractions at different packings: (a) packing free; (b) plastic pall rings packing; (c) glass beads packing.
A more quantitative representation is adopted to show the sensitivity of ERT measurement in Fig. 10. The local gas void fractions in the same concentric ring zone of Fig. 2 are averaged and plotted as radial gas void fraction profiles. Fig. 10 (a) shows the radial gas void fraction profiles at nine discrete gas volumetric flow rates in the packing free column. It can be seen that all of the gas radial void fraction distributions have bell-shaped profiles and decrease radially from the center, which illustrates that gas has a higher void fraction at the center of the column and lower values at the boundaries.
For the column with the plastic pall rings packing, the profiles in Fig. 10 (b) remain the similar shape with Fig. 10(a), but the gas void fractions are larger in magnitude than that in the packing free column, because the packing resists the motion of bubbles. The glass bead packing completely alters the radial gas void fraction distribution as shown in Fig.10 (c). After averaging the local void fractions in the same concentric zone, the distribution variation is suppressed and spatial information is lost to some extent, therefore, in a practical industrial process application, both 3D gas void fraction and radial profile should be closely monitored.
In addition to the radial gas void fraction profiles, the overall gas void fraction is another important process parameter, which is the average of 316 local gas void fraction on the cross-sectional image in Fig 9. At each gas flow rate and packing condition, the ERT system collected 10000 frames of images at an image rate of 125 frames/s, which was the slowest rate but has the highest systemic measurement accuracy. The data were split into 10 subsets with 1000 frames per subset. In each subset, the void fraction average was computed from the 1000 frames. The standard deviation of the 10 averages was calculated and represented using box plot. The corresponding experimental results are shown in Fig.11. It can be seen that the overall gas void fraction has a strong linear relationship with the gas volumetric flow rate in both the packing free column and packed columns, despite of the different slopes with different packing condition. This phenomena coincides with the findings in a number of previously published study [15]. The overall gas void fraction in the glass beads packed column is always larger than that in the plastic pall rings packed column. The overall gas void fraction in the packing free column has the smallest value in each gas volumetric flow rate. The larger overall magnitude of the overall gas void fraction is attributed to the fact that the length of gas pathway is prolonged due to the packing. These results are also found by Niranjan [16] who determined the gas phase void fraction in a packed
7

bubble column by measuring the dispersion height for a given superficial gas velocity and the height of a clear liquid after the gas flow had been stopped.
(a)
(b)
(c)Fig.10 Radial gas void fraction profiles with different packing materials and gas flow rates: (a) packing free; (b) plastic pall
rings packing; (c) glass beads packing.
Fig. 11 Overall gas void fraction at different gas flow rate and packing materials.
To validate the accuracy of ERT measurement against the conventional bed expansion (BD) method, the experiment was repeated, but the conductivity of continuous liquid was changed to 20 mS/cm to demonstrate the robustness of the system at different liquid conductivity. Because the liquid depth fluctuated dramatically, in particular, at the large gas flow rate, like 1.43 L/min, 10 liquid levels for each packing and gas flow rate condition were taken and averaged to calculate the overall gas void fraction. These values were shown in the box plots in Fig. 12 and compared with each average overall gas void fraction (solid dots) obtained from the ERT. In general, two sets of gas overall void fraction values had a good agreement, which proved the validity of the ERT method. The average overall gas void fractions from the BD method and the ERT method are presented in Table 1.
Fig.12 Comparison of overall gas void fraction obtained from the conventional bed expansion method and the
ERT method.Table 3. Comparison of average gas void fractions.Gasflowrate
Packing free Pall rings Glass beads
BD ERT BD ERT BD ERT
0.34 0.022 0.017 0.042 0.041 0.079 0.082
8

0.52 0.025 0.021 0.053 0.051 0.084 0.0890.71 0.032 0.028 0.063 0.059 0.090 0.0930.89 0.033 0.031 0.072 0.067 0.097 0.0971.09 0.037 0.037 0.077 0.074 0.103 0.1021.28 0.043 0.043 0.083 0.083 0.111 0.1061.43 0.046 0.047 0.092 0.090 0.114 0.1111.60 0.052 0.052 0.098 0.095 0.120 0.1151.80 0.059 0.059 0.106 0.102 0.126 0.122
6. ConclusionsMultiphase flow measurement in packed columns is a
relatively new application of electrical resistance tomography (ERT). The presence of packing materials brings a challenge for ERT. The conventional qualitative ERT procedure cannot accurately quantify gas distribution and void fraction in packed columns. A quantitative procedure was proposed and validated in the complex 3D simulation models. The comparison between two procedures shows the new quantitative procedure is a much better choice for the application of packed bubble columns. In practical experiment using this ERT procedure, gas distribution and void fraction was measured on packing free column, plastic pall rings packed column and glass beads packed column, and benchmarked with the bed expansion method. The experiment results demonstrate the ERT system is very sensitive to the shape of packing material and gas flow rate. The study in this paper opens a route for ERT deployment for two-phase flow monitoring in packed bubble columns.AcknowledgementsThis research was supported by the UK Engineering and Physical Sciences Research Council (EPSRC, EP/M001482/1). References[1] Wahab, Y. A., Rahim, R. A, Rahiman, M. H. F.,
Aw, S. R., Yunus, F. R. M., Goh, C. L., Rahim, H. A, and Ling, L. P, 2015, Non-invasive process tomography in chemical mixtures-A review, Sensors and Actuators B: Chemical, vol. 210, pp.602-617.
[2] Jin, H., Lian, Y., Yang, S., He, G., and Guo, Z., 2013, The parameters measurement of air–water two phase flow using the electrical resistance tomography (ERT) technique in a bubble column, Flow Measurement and Instrumentation, vol. 31, pp. 55-60
[3] Hurry, R., Wang, M., Williams, R. A. and Cross, C., 2007, An Electrical Impedance Sensing System for Monitoring Hydraulic Flow Transport in Heap Leach Test Columns, 5th World Congress on Industrial Process Tomography, Bergen, Norway , 3rd-6th September.
[4] Muzen, A. and Cassanello, M. C., 2005, Liquid
holdup in columns packed with structured packings: Countercurrent vs. cocurrent operation, Chemical Engineering Science, vol. 60, pp. 6226-6234.
[5] Zakeri, A., Einbu, A. and Svendsen, H. F., 2012, Experimental investigation of liquid holdup in structured packings, Chemical Engineering Research and Design, vol. 90(5), pp. 585-590.
[6] Wu, H., Buschle, B., Yang, Y. Tan, C. Dong, F, Jia, J and Lucquiauda, M., 2018, Liquid distribution and hold-up measurement in counter current flow packed column by electrical capacitance tomography, Chemical Engineering Journal, vol 353, pp. 519-532.
[7] Rasel, R. K., Gunes, C. Marashdeh, Q. M. and Teixeira, F. L. 2017, "Exploiting the Maxwell-Wagner-Sillars Effect for Displacement-Current Phase Tomography of Two-Phase Flows," IEEE Sensors Journal, vol. 17, pp. 7317-7324.
[8] Gunes, C., Marashdeh, Q. M. and Teixeira, F. L, 2017, "A Comparison Between Electrical Capacitance Tomography and Displacement-Current Phase Tomography," IEEE Sensors Journal, vol. 17, no. pp. 8037-8046.
[9] Jia, J., Wang, M., Schlaberg, H. I. and Li, H., 2010, A novel tomographic sensing system for high electrically conductive multiphase flow measurement, Flow Measurement and Instrumentation, vol. 21(3), pp. 184-190.
[10] Choy, T. C., 2016, “Maxwell-Garnett,” in Effective Medium Theory, 2rd ed., vol. 2. Oxford: Clarendon Press.
[11] Jia, J., Wang, M. and Faraj, Y., 2014, Evaluation of EIT systems and algorithms for handling full void fraction range in two-phase flow measurement, Measurement Science and Technology, vol. 26, pp. 1-7.
[12] Yang, Y., Jia, J., Polydorides, N. and McCann, H., 2014, Effect of structured packing on EIT image reconstruction. Presented at Imaging Systems and Techniques (IST), 2014 IEEE International Conference, pp. 14-17.
[13] Shii, Y. and Zhang, Y., 2008, Simulation of random packing of spherical particles with different size distributions, Applied Physics A, vol. 92, pp. 621-626.
[14] Visscher, W. M. and Bolsterli, M., 1972, Random packing of equal and unequal spheres in two and three dimensions, Nature, vol. 329, pp. 504-507.
[15] Moshtari, B., Babakhani, E. G. and Moghaddas, J. S., 2009, Experimental Study of Gas Hold-up and Bubble Behavior in Gas-Liquid Bubble Column, Petroleum & Coal, vol. 51, pp. 27-32.
[16] Niranjan, K. and Pangarkar, V. G., 1984, Gas Holdup and Mixing Characteristics of Packed
9
Bubble Columns, The Chemical Engineering Journal, vol. 29, pp. 101-111.
10