electrification of volcanic plumes -...
TRANSCRIPT
Abstract Volcanic lightning, perhaps the most spectacular consequence of theelectrification of volcanic plumes, has been implicated in the origin of life on Earth,and may also exist in other planetary atmospheres. Recent years have seen volcaniclightning detection used as part of a portfolio of developing techniques to monitorvolcanic eruptions. Remote sensing measurement techniques have been used tomonitor volcanic lightning, but surface observations of the atmospheric electricPotential Gradient (PG) and the charge carried on volcanic ash also show that manyvolcanic plumes, whilst not sufficiently electrified to produce lightning, havedetectable electrification exceeding that of their surrounding environment. Electri-fication has only been observed associated with ash-rich explosive plumes, but thereis little evidence that the composition of the ash is critical to its occurrence. Differentconceptual theories for charge generation and separation in volcanic plumes havebeen developed to explain the disparate observations obtained, but the ash frag-mentation mechanism appears to be a key parameter. It is unclear which mecha-nisms or combinations of electrification mechanisms dominate in differentcircumstances. Electrostatic forces play an important role in modulating the dry fall-out of ash from a volcanic plume. Beyond the local electrification of plumes, thehigher stratospheric particle concentrations following a large explosive eruption mayaffect the global atmospheric electrical circuit. It is possible that this might presentanother, if minor, way by which large volcanic eruptions affect global climate. Thedirect hazard of volcanic lightning to communities is generally low compared toother aspects of volcanic activity.
T. A. Mather (&)Department of Earth Sciences, University of Oxford, Parks Road, Oxford OX1 3PR, UKe-mail: [email protected]
R. G. HarrisonDepartment of Meteorology, The University of Reading, 243 Earley Gate, Reading RG6 6BB,UKe-mail: [email protected]
123
Surv Geophys (2006) 27:387–432DOI 10.1007/s10712-006-9007-2
ORI GI N A L P A PE R
Electrification of volcanic plumes
T. A. Mather Æ R. G. Harrison
Received: 13 February 2006 / Accepted: 2 June 2006 /Published online: 20 July 2006� Springer Science+Business Media B.V. 2006
Keywords Volcanic lightning Æ Atmospheric electricity Æ Historical accounts ofvolcanic lightning Æ Origins of life Æ Volcanic monitoring Æ Ash-charging mechanisms ÆPlanetary lightning Æ Planetary volcanism Æ Ash fall-out Æ Global atmosphericelectrical circuit Æ Volcanoes and climate Æ Hazards
NomenclatureA Ion asymmetry parameter, A = n+l+/n–l–
a,b Vertical distancese Magnitude of the elementary charge (1.6 · 10–19 C)EFW Vertical electric field in fair weather conditions (EFW = – PG)Ep Vertical electric field associated with a region of chargej Number of elementary chargesi Polarity of the ionk Boltzmann’s constant (1.38 · 10–23 J K–1)n, n+, n– Number concentration of total ions, positive ions and negative ionsNj Number concentration of particles carrying j elementary chargesN0 The number of neutral particles, i.e., number of particles with j = 0PG Potential gradient. The rate of change of electric potential with vertical
distance, usually referred to a measurement made at 1 m above thesurface. When the potential increases positively with height, the PG isconsidered positive
Q Electric charger Particle radiusT Temperaturex Horizontal distanceX Ion–aerosol attachment rateZ Aerosol particle number concentrationbij(r) Attachment coefficient of ion (sign i = ± 1) to a particle of radius r
carrying j chargese0 Permittivity of free space 1
36p�109
� �F m–1
/ Electric potentiall+, l– Ion mobility (drift speed in a unit electric field)J Mean number of elementary charges per particles Charging timescaleRc Columnar resistance, the resistance of a unit column of atmosphere from
the surface to the ionosphereVI Ionospheric potential
1 Lightning and eruptions
1.1 Introduction
Electrification in the terrestrial atmosphere is most commonly experienced on alarge scale through thunderstorms and lightning. Even in these situations, however,it is the electrification on microscopic size scales that ultimately leads to the familiar
388 Surv Geophys (2006) 27:387–432
123
macroscopic displays of atmospheric electrical activity. On the microscopic scale,interactions between molecular ions and aerosol particles lead to charge separation:dynamical motions may then carry charged particles into different regions, resultingin the generation of electric fields.
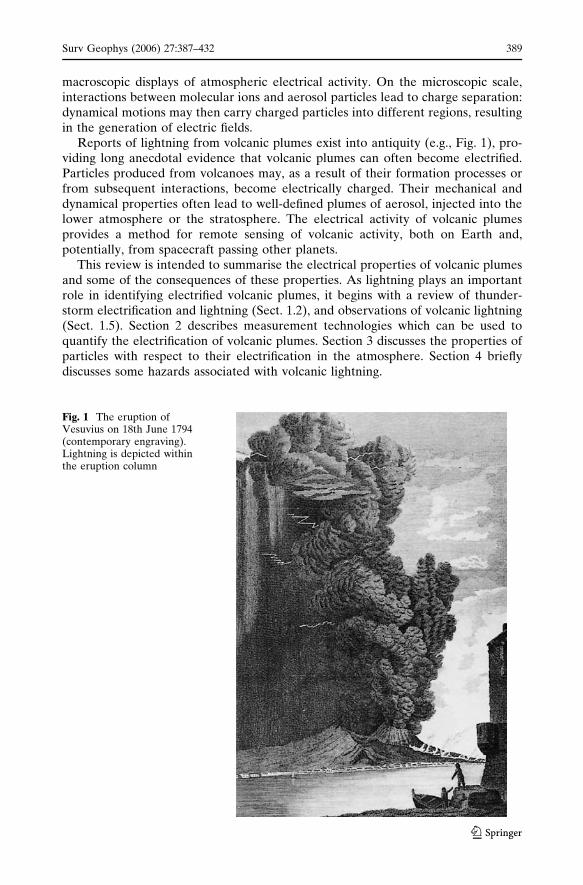
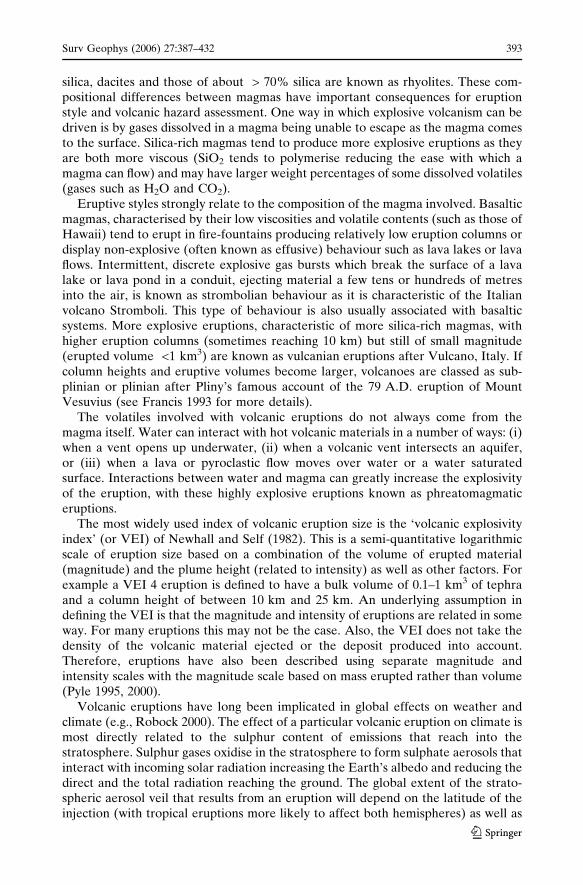
Reports of lightning from volcanic plumes exist into antiquity (e.g., Fig. 1), pro-viding long anecdotal evidence that volcanic plumes can often become electrified.Particles produced from volcanoes may, as a result of their formation processes orfrom subsequent interactions, become electrically charged. Their mechanical anddynamical properties often lead to well-defined plumes of aerosol, injected into thelower atmosphere or the stratosphere. The electrical activity of volcanic plumesprovides a method for remote sensing of volcanic activity, both on Earth and,potentially, from spacecraft passing other planets.
This review is intended to summarise the electrical properties of volcanic plumesand some of the consequences of these properties. As lightning plays an importantrole in identifying electrified volcanic plumes, it begins with a review of thunder-storm electrification and lightning (Sect. 1.2), and observations of volcanic lightning(Sect. 1.5). Section 2 describes measurement technologies which can be used toquantify the electrification of volcanic plumes. Section 3 discusses the properties ofparticles with respect to their electrification in the atmosphere. Section 4 brieflydiscusses some hazards associated with volcanic lightning.
Fig. 1 The eruption ofVesuvius on 18th June 1794(contemporary engraving).Lightning is depicted withinthe eruption column
Surv Geophys (2006) 27:387–432 389
123

1.2 Thunderstorm electrification and lightning
1.2.1 Thunderstorm electrification
Thunderclouds result from irregular heating of the Earth’s surface, causing vigorousupdrafts and latent heat release during condensation and freezing. Thundercloudsare particularly deep cumulus clouds, which generate precipitation including liquidraindrops, hail, snow and soft hail (graupel). The electrification of thunderstormshas been known since the 17th century (Harrison 2004a) but some fundamentalaspects remain poorly understood. This is particularly because it is difficult toobserve cloud electrification processes in situ, which has led to a necessary emphasison laboratory experiments. This laboratory emphasis makes it difficult to deducethe relative importance of different charge generation mechanisms in the realatmosphere. The charge generation mechanisms can be divided into inductivemechanisms (Mason 1971), in which a particle or droplet is polarised by an inducedcharge, and collisional mechanisms, in which charge is transferred by contactbetween particles.
Inductive charging was first suggested by Mason (1953). Mason (1988) shows thatsuch a mechanism can generate a sufficient electric field to cause a lightning dis-charge within the typically observed timescales of ~10–20 min. Inductive chargingrequires a pre-existing electric field, such as the fair weather field, to polarise softhail particles. The upper part of the hail carries a negative charge and the lower parta positive charge, and cloud droplets rising in the updraft collide with the lowerpositive parts of the particle, which then continue to rise carrying their positivecharge upwards. Calculations (Mason 1988) show fields of about 400 kV m–1 pro-duced in about 10 min, for a rainfall rate building up to 20 mm h–1. A deficiency isthat this theory cannot account for soft hail observed to carry charges greater thanthose possible from background fields (Saunders 1988). Because a pre-existingatmospheric electric field is required, inductive charging is unlikely to be the onlythunderstorm electrification process active.
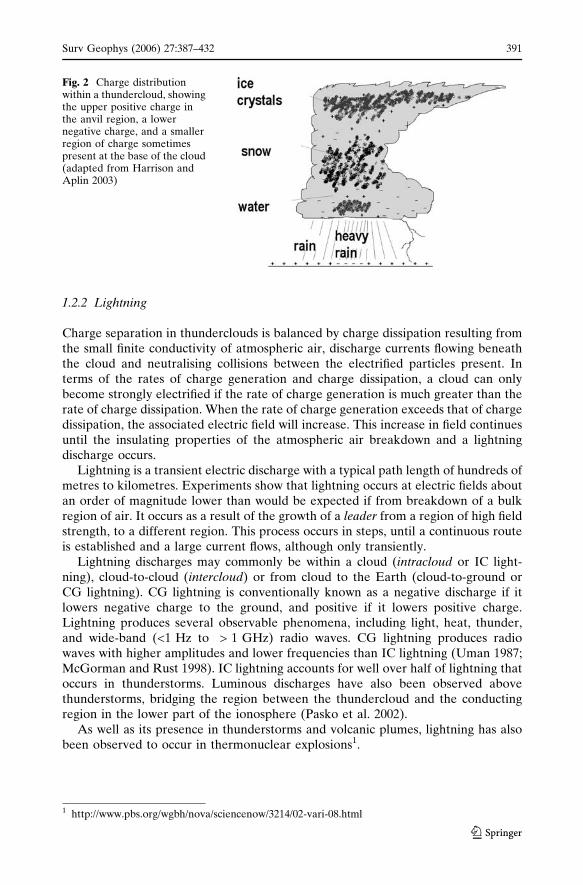
In a thunderstorm, electrification arises from collisions between ascending icecrystals and descending soft hail pellets (graupel), with positive charge carried up-wards on the ice crystals into the anvil, and negative charge carried downwards onthe graupel. Charge transfer occurs when ice crystals and hail pellets collide in thepresence of supercooled droplets, a process replicated in laboratory experiments(Jayaratne et al. 1983; Keith and Saunders 1990). The polarity and magnitude of thecharge exchange has been found to vary in a complicated manner with the cloudliquid water content, particle size, impact parameters, and air temperature(McGorman and Rust 1998). For cloud water contents above about 1 g m–3, apolarity reversal temperature occurs in laboratory experiments below which graupelbecomes negatively charged and above which graupel becomes positively charged.From this it is concluded that, at the low temperatures in the upper part of athundercloud, graupel charges negatively, leaving positive charge on rising icecrystals. The net effect of very many such microphysical interactions is to produce apositive charge in the upper (anvil) regions, and negative charge in the lower part ofthe cloud. A small amount of positive charge near the cloud base may also bepresent. Figure 2 shows a schematic diagram of the charged regions present within atypical thundercloud.
390 Surv Geophys (2006) 27:387–432
123
1.2.2 Lightning
Charge separation in thunderclouds is balanced by charge dissipation resulting fromthe small finite conductivity of atmospheric air, discharge currents flowing beneaththe cloud and neutralising collisions between the electrified particles present. Interms of the rates of charge generation and charge dissipation, a cloud can onlybecome strongly electrified if the rate of charge generation is much greater than therate of charge dissipation. When the rate of charge generation exceeds that of chargedissipation, the associated electric field will increase. This increase in field continuesuntil the insulating properties of the atmospheric air breakdown and a lightningdischarge occurs.
Lightning is a transient electric discharge with a typical path length of hundreds ofmetres to kilometres. Experiments show that lightning occurs at electric fields aboutan order of magnitude lower than would be expected if from breakdown of a bulkregion of air. It occurs as a result of the growth of a leader from a region of high fieldstrength, to a different region. This process occurs in steps, until a continuous routeis established and a large current flows, although only transiently.
Lightning discharges may commonly be within a cloud (intracloud or IC light-ning), cloud-to-cloud (intercloud) or from cloud to the Earth (cloud-to-ground orCG lightning). CG lightning is conventionally known as a negative discharge if itlowers negative charge to the ground, and positive if it lowers positive charge.Lightning produces several observable phenomena, including light, heat, thunder,and wide-band (<1 Hz to > 1 GHz) radio waves. CG lightning produces radiowaves with higher amplitudes and lower frequencies than IC lightning (Uman 1987;McGorman and Rust 1998). IC lightning accounts for well over half of lightning thatoccurs in thunderstorms. Luminous discharges have also been observed abovethunderstorms, bridging the region between the thundercloud and the conductingregion in the lower part of the ionosphere (Pasko et al. 2002).
As well as its presence in thunderstorms and volcanic plumes, lightning has alsobeen observed to occur in thermonuclear explosions1.
Fig. 2 Charge distributionwithin a thundercloud, showingthe upper positive charge inthe anvil region, a lowernegative charge, and a smallerregion of charge sometimespresent at the base of the cloud(adapted from Harrison andAplin 2003)
1 http://www.pbs.org/wgbh/nova/sciencenow/3214/02-vari-08.html
Surv Geophys (2006) 27:387–432 391
123

1.3 Global atmospheric electricity
A terrestrial atmospheric electrical circuit results from the currents generated bythunderclouds and disturbed weather, which are balanced by small currents flowingthrough the fair weather atmosphere. The currents generated by thunderstorms andregions of disturbed weather pass to the conducting regions of the ionosphere,causing the ionosphere to acquire a large positive potential (~300 kV) with respectto the Earth’s surface. A small current flows from the ionosphere to the Earth’ssurface in fair weather regions, which balances the charging process in disturbedweather regions. This continuous charge balance system is generally referred to asthe global circuit (e.g., Rycroft et al. 2000). The conduction current in fair weatherregions arises because atmospheric air is very slightly ionised, as a result of ionproduction by cosmic rays and natural radioactivity (Harrison and Carslaw 2003).Attachment of ions to particles and raindrops leads to electrification (see Sect. 3.1).
Several quantities are useful for measuring the extent of local atmospheric elec-trification. The vertical component of the electric field is the quantity most com-monly measured. This is the rate of change of potential vertically. A convention inatmospheric electricity is to refer to the electric field as the Potential Gradient (PG).In magnitude, the PG and the vertical electric field are equal. Unlike the expectationfrom conventional electrostatics however, the PG is positive in fair weather, i.e., thepotential increases positively with height and, although the electric field is conven-tionally negative, the PG is positive.
At the microscopic level, the total amount of charge per unit volume is a usefulquantity. This is also known as the space charge. In fair weather conditions, the spacecharge is typically of order 10–12 Coulombs per cubic metre, (pC m–3), but can be oforder 10–9 Coulombs per cubic metre (nC m–3) in electrified clouds. The spacecharge is the product of the number of particles and the charge they carry, summedacross all types and sizes of particles from ions to aerosol.
As well as the removal of ions by particles, recent work has linked the presence ofions in clean air with aerosol particle formation (Harrison and Carslaw 2003). Iongrowth has been observed in air under different conditions (Vohra et al. 1969;Wilkening 1985; Eichkorn et al. 2002; Wilding and Harrison 2005), which can in turninfluence cloud formation (Harrison and Stephenson 2006). The influence of ions oncloud processes has been the subject of recent research because the terrestrial sur-face energy balance, and with it the climate, could be highly sensitive to smallelectrically induced changes in cloud (Carslaw et al. 2002).
1.4 Eruption classification
There are many different ways that volcanic eruptions can be classified, for example,by the composition of the material ejecta, eruption style, by the height of theeruption column, by the total volume or mass that the eruption produces or by theorigin of the gases involved.
The composition of the material ejected is determined to a large extent by thecomposition of the magma driving the eruption. One way of classifying magmacomposition is by silica (SiO2) content. Partial melting of the Earth’s mantle yieldsmagma of about 45–55% silica known as basalt. As it travels through the Earth’scrust, this basalt might evolve into magmas with higher silica contents. Magmas withsilica contents of about 55–63% silica are known as andesites, those of about 64–70%
392 Surv Geophys (2006) 27:387–432
123
silica, dacites and those of about > 70% silica are known as rhyolites. These com-positional differences between magmas have important consequences for eruptionstyle and volcanic hazard assessment. One way in which explosive volcanism can bedriven is by gases dissolved in a magma being unable to escape as the magma comesto the surface. Silica-rich magmas tend to produce more explosive eruptions as theyare both more viscous (SiO2 tends to polymerise reducing the ease with which amagma can flow) and may have larger weight percentages of some dissolved volatiles(gases such as H2O and CO2).
Eruptive styles strongly relate to the composition of the magma involved. Basalticmagmas, characterised by their low viscosities and volatile contents (such as those ofHawaii) tend to erupt in fire-fountains producing relatively low eruption columns ordisplay non-explosive (often known as effusive) behaviour such as lava lakes or lavaflows. Intermittent, discrete explosive gas bursts which break the surface of a lavalake or lava pond in a conduit, ejecting material a few tens or hundreds of metresinto the air, is known as strombolian behaviour as it is characteristic of the Italianvolcano Stromboli. This type of behaviour is also usually associated with basalticsystems. More explosive eruptions, characteristic of more silica-rich magmas, withhigher eruption columns (sometimes reaching 10 km) but still of small magnitude(erupted volume <1 km3) are known as vulcanian eruptions after Vulcano, Italy. Ifcolumn heights and eruptive volumes become larger, volcanoes are classed as sub-plinian or plinian after Pliny’s famous account of the 79 A.D. eruption of MountVesuvius (see Francis 1993 for more details).
The volatiles involved with volcanic eruptions do not always come from themagma itself. Water can interact with hot volcanic materials in a number of ways: (i)when a vent opens up underwater, (ii) when a volcanic vent intersects an aquifer,or (iii) when a lava or pyroclastic flow moves over water or a water saturatedsurface. Interactions between water and magma can greatly increase the explosivityof the eruption, with these highly explosive eruptions known as phreatomagmaticeruptions.
The most widely used index of volcanic eruption size is the ‘volcanic explosivityindex’ (or VEI) of Newhall and Self (1982). This is a semi-quantitative logarithmicscale of eruption size based on a combination of the volume of erupted material(magnitude) and the plume height (related to intensity) as well as other factors. Forexample a VEI 4 eruption is defined to have a bulk volume of 0.1–1 km3 of tephraand a column height of between 10 km and 25 km. An underlying assumption indefining the VEI is that the magnitude and intensity of eruptions are related in someway. For many eruptions this may not be the case. Also, the VEI does not take thedensity of the volcanic material ejected or the deposit produced into account.Therefore, eruptions have also been described using separate magnitude andintensity scales with the magnitude scale based on mass erupted rather than volume(Pyle 1995, 2000).
Volcanic eruptions have long been implicated in global effects on weather andclimate (e.g., Robock 2000). The effect of a particular volcanic eruption on climate ismost directly related to the sulphur content of emissions that reach into thestratosphere. Sulphur gases oxidise in the stratosphere to form sulphate aerosols thatinteract with incoming solar radiation increasing the Earth’s albedo and reducing thedirect and the total radiation reaching the ground. The global extent of the strato-spheric aerosol veil that results from an eruption will depend on the latitude of theinjection (with tropical eruptions more likely to affect both hemispheres) as well as
Surv Geophys (2006) 27:387–432 393
123
the mass of sulphur released and height of the eruption column. The VEI is primarilybased on volcanological data and, while ‘stratospheric injection’ is mentioned lowdown in the list of criteria, it is not always useful as an index of the effect of volcaniceruptions on climate. Various other indices, including the Dust Veil Index (Lamb1970), have been proposed which attempt to align more closely with the physicalparameters of a volcanic eruptions which can lead to global climatic effects (seeRobock and Free 1995 and Robock 2000 for a summary).
1.5 Historical accounts
The oldest and most famous account of a volcanic eruption is probably that of Plinythe Younger (Sect. 1.4). Pliny described the 79 A.D. eruption of Mount Vesuvius, inletters to the Roman historian Tactitus shortly afterwards. Pliny comes close torecording volcanic lightning in the following excerpt (translated in 1747):
‘a black and dreadful cloud bursting out in gusts of igneous serpentine vapournow and again yawned open to reveal long fantastic flames, resembling flashesof lightning but much larger.’
Atmospheric electrical activity is a phenomenon long associated with large-scaleeruptions by observers. For example, lightning was recorded at the 1650 eruptionjust off Santorini in Greece (Fouque 1879). Perhaps some of the most graphic his-torical descriptions come from the eye-witness accounts of the splendour of theelectrical phenomenon coinciding with the paroxysmal stage of the 1883 eruption ofKrakatoa in Indonesia (Symons 1888). On the afternoon of the 26th August CaptainWoolridge of the Sir R. Sale, which was about 40 miles from the volcano, speaks ofthe great vapour cloud resembling
‘an immense wall with bursts of forked lightning at times like large serpentsrushing through the air.’
He describes the sky at sunset above the volcano as presenting
‘a most terrible appearance, the dense mass of clouds being covered with amurky tinge, with fierce flashes of lightning.’
Later that day, although the volcanic cloud had rendered it intensely dark, at 7 pmthe whole scene was illuminated from time to time by the electrical discharges.Woolridge recorded that the cloud above Krakatoa presented
‘the appearance of an immense pine-tree, with the stem and branches formedwith volcanic lightning.’
On the Governeur Generaal Loudon, 40 or 50 miles northwest of the volcano,lightning was recorded to strike the mainmast conductor five or six times (Symons1888).
Lightning has been observed in eruption plumes of various types and sizes,although it is particularly common during larger eruptions (Table 1 adapted fromMcNutt and Davis 2000). This suggests that while the size or intensity of an eruptionmight play a role in producing volcanic lightning (in that the eruption must beexplosive enough to produce significant ash and perhaps be energetic enough tocharge it, see Sect. 3.3), magma composition is unlikely to be a crucial factor.
394 Surv Geophys (2006) 27:387–432
123
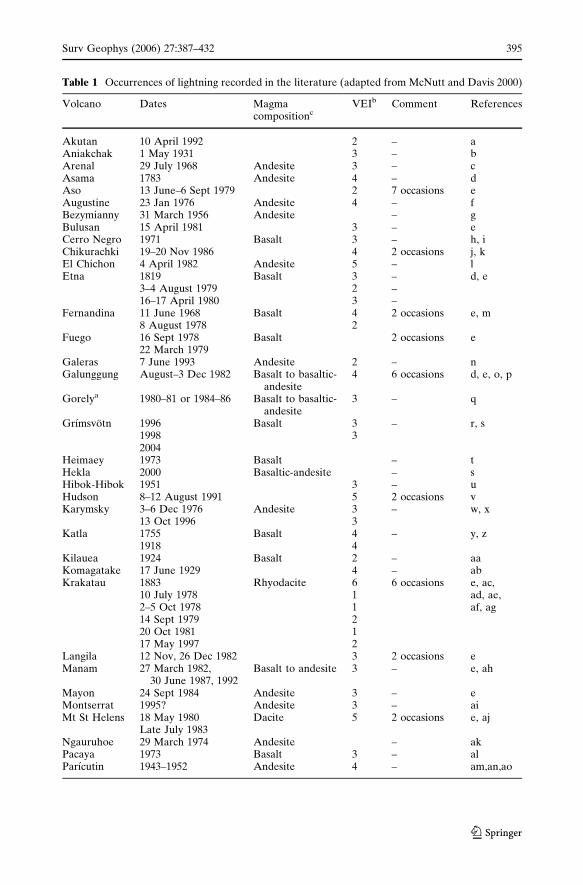
Table 1 Occurrences of lightning recorded in the literature (adapted from McNutt and Davis 2000)
Volcano Dates Magmacompositionc
VEIb Comment References
Akutan 10 April 1992 2 – aAniakchak 1 May 1931 3 – bArenal 29 July 1968 Andesite 3 – cAsama 1783 Andesite 4 – dAso 13 June–6 Sept 1979 2 7 occasions eAugustine 23 Jan 1976 Andesite 4 – fBezymianny 31 March 1956 Andesite – gBulusan 15 April 1981 3 – eCerro Negro 1971 Basalt 3 – h, iChikurachki 19–20 Nov 1986 4 2 occasions j, kEl Chichon 4 April 1982 Andesite 5 – lEtna 1819 Basalt 3 – d, e
3–4 August 1979 2 –16–17 April 1980 3 –
Fernandina 11 June 1968 Basalt 4 2 occasions e, m8 August 1978 2
Fuego 16 Sept 1978 Basalt 2 occasions e22 March 1979
Galeras 7 June 1993 Andesite 2 – nGalunggung August–3 Dec 1982 Basalt to basaltic-
andesite4 6 occasions d, e, o, p
Gorelya 1980–81 or 1984–86 Basalt to basaltic-andesite
3 – q
Grımsvotn 1996 Basalt 3 – r, s1998 32004
Heimaey 1973 Basalt – tHekla 2000 Basaltic-andesite – sHibok-Hibok 1951 3 – uHudson 8–12 August 1991 5 2 occasions vKarymsky 3–6 Dec 1976 Andesite 3 – w, x
13 Oct 1996 3Katla 1755 Basalt 4 – y, z
1918 4Kilauea 1924 Basalt 2 – aaKomagatake 17 June 1929 4 – abKrakatau 1883 Rhyodacite 6 6 occasions e, ac,
10 July 1978 1 ad, ae,2–5 Oct 1978 1 af, ag14 Sept 1979 220 Oct 1981 117 May 1997 2
Langila 12 Nov, 26 Dec 1982 3 2 occasions eManam 27 March 1982,
30 June 1987, 1992Basalt to andesite 3 – e, ah
Mayon 24 Sept 1984 Andesite 3 – eMontserrat 1995? Andesite 3 – aiMt St Helens 18 May 1980 Dacite 5 2 occasions e, aj
Late July 1983Ngauruhoe 29 March 1974 Andesite – akPacaya 1973 Basalt 3 – alParıcutin 1943–1952 Andesite 4 – am,an,ao
Surv Geophys (2006) 27:387–432 395
123
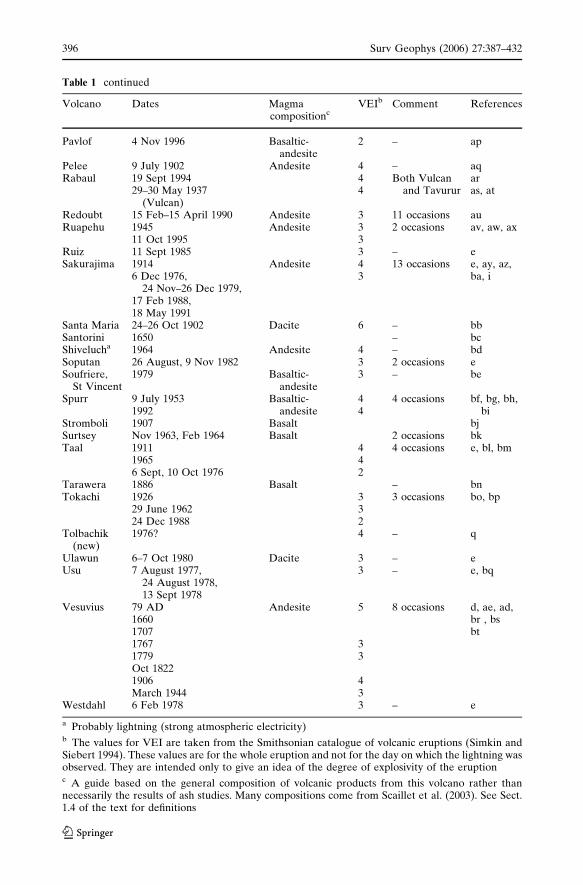
Table 1 continued
Volcano Dates Magmacompositionc
VEIb Comment References
Pavlof 4 Nov 1996 Basaltic-andesite
2 – ap
Pelee 9 July 1902 Andesite 4 – aqRabaul 19 Sept 1994 4 Both Vulcan
and Tavururar
29–30 May 1937(Vulcan)
4 as, at
Redoubt 15 Feb–15 April 1990 Andesite 3 11 occasions auRuapehu 1945 Andesite 3 2 occasions av, aw, ax
11 Oct 1995 3Ruiz 11 Sept 1985 3 – eSakurajima 1914 Andesite 4 13 occasions e, ay, az,
6 Dec 1976,24 Nov–26 Dec 1979,
17 Feb 1988,18 May 1991
3 ba, i
Santa Maria 24–26 Oct 1902 Dacite 6 – bbSantorini 1650 – bcShivelucha 1964 Andesite 4 – bdSoputan 26 August, 9 Nov 1982 3 2 occasions eSoufriere,
St Vincent1979 Basaltic-
andesite3 – be
Spurr 9 July 1953 Basaltic-andesite
4 4 occasions bf, bg, bh,bi1992 4
Stromboli 1907 Basalt bjSurtsey Nov 1963, Feb 1964 Basalt 2 occasions bkTaal 1911 4 4 occasions e, bl, bm
1965 46 Sept, 10 Oct 1976 2
Tarawera 1886 Basalt – bnTokachi 1926 3 3 occasions bo, bp
29 June 1962 324 Dec 1988 2
Tolbachik(new)
1976? 4 – q
Ulawun 6–7 Oct 1980 Dacite 3 – eUsu 7 August 1977,
24 August 1978,13 Sept 1978
3 – e, bq
Vesuvius 79 AD Andesite 5 8 occasions d, ae, ad,1660 br , bs1707 bt1767 31779 3Oct 18221906 4March 1944 3
Westdahl 6 Feb 1978 3 – e
a Probably lightning (strong atmospheric electricity)b The values for VEI are taken from the Smithsonian catalogue of volcanic eruptions (Simkin andSiebert 1994). These values are for the whole eruption and not for the day on which the lightning wasobserved. They are intended only to give an idea of the degree of explosivity of the eruptionc A guide based on the general composition of volcanic products from this volcano rather thannecessarily the results of ash studies. Many compositions come from Scaillet et al. (2003). See Sect.1.4 of the text for definitions
396 Surv Geophys (2006) 27:387–432
123

Observations made during the eruption of Parıcutin (1943–1952), Mexico highlightsome of the characteristics of volcanic lightning. Although the composition of theejecta changed progressively during the course of the eruption from basaltic andesite(55 wt% SiO2) in 1943 to andesite (>60 wt% SiO2) in 1952 (Luhr and Simkin 1993),lightning was reported throughout the eruption. However, it was not a constantphenomenon. Lightning associated with the eruption column occurred on some daysbut not others, with Fries and Gutierrez (1950) recording that electric dischargesoccurred on 2 days in July, 3 days in August, 3 days in September, 1 day in Octoberand 3 days in December in 1949. Electrical discharges were observed to be associatedwith more ash-rich plumes and increased intensity. Forshag and Gonzalez-Reyna(1956) observed that lightning on 27th May 1945 was only associated with occasionalash-rich plumes, but none was seen in the steam column. Electrical discharges withinthe column appear to have been more common although those from the column tothe rim of the cone were also recorded (Fries and Gutierrez 1950).
1.6 Volcanic lightning in primitive atmospheres
There is much uncertainty about the exact composition of the Earth’s atmosphere inthe Hadean, 4.5–3.8 Ga (billion years ago), and Archean, 3.8–2.5 Ga. A combinationof climate modelling with a fainter young Sun, atmospheric chemistry modelling andevidence from paleosols (ancient or fossil soils) suggest that it was a mixture of N2,CO2 and CH4 (Kasting and Catling 2003). Concentrations of atmospheric oxygen arethought to have dramatically increased between 2.2 Ga and 2.4 Ga although theexact trigger for this increase remains hotly debated (Kasting 2001). Fossil evidenceshows the existence of tropical lightning 250 Ma (million years ago), but it is unclearhow the flash rate varied in this or earlier atmospheres (Harland and Hacker 1966).Meteoritic evidence for cosmic rays within the solar system (Shaviv 2002) suggeststhe presence of charge carriers in primitive atmospheres, and therefore a finiteatmospheric conductivity. For volcanic lightning to occur in the primitive atmo-sphere, the charge generation rate within the plume would have to be greater than
Table 1 continued
a, J. Paskievitch pers. comm. (1992); b, Volcano Quarterly (1993); c, W. Melson pers. comm. (1994);d, Krafft (1993); e, McClelland et al. (1989); f, Kienle and Swanson (1985); g, Gorshkov (1959); h,Viramonte et al. (1971); i, Fisher et al. (1997) (photo by J. Viramonte); j, GVN (1986); k, BVE(1989); l, Havskov et al. (1983); m, Simkin and Howard (1970); n, GVN (1993); o, Katili andSudradjat (1984); p, Gourgaud et al. (1989); q, Fedotov and Masurenkov (1991); r, Benediktsson(1996) (video); s, Arason (2005a, b); t, Brook et al. (1973); u, Alcaraz (1989); v, GVN (1991); w,Rulenko (1981); x, AVO Bimonthly (1996); y, Anon. (1863), in Pounder (1980); z, Larsen (2000); aa,National Park Service display; ab, Poster Display (1995), video; ac, Symons (1888); ad, Lane (1966);ae, Francis (1976); af, Simkin and Fiske (1983); ag, M. Lyvers pers. commun. (1997); ah, GVN (1982,1987, 1992); ai, ‘World’s Deadliest Volcanoes’ (video); aj, Cobb (1980); ak, Nairn et al. (1976); al,W.C. Buell photo; am, Green (1944); an, Gutierrez (1972); ao, Luhr and Simkin (1993); ap, J. Painterpers. commun. (1997); aq, Anderson and Flett (1903); ar, GVN (1994a, b, c, 1995a, b, d, 1996, 1997,1998); as, Johnson and Threlfall (1985); at, McKee et al. (1985); au, Hoblitt (1994); av, Blong (1984);aw, GVN (1995c); ax, Schneider (1995); ay, Abe (1979); az, Newcott and Menzel (1993); ba, Ryan(1994) (photo by T. Takayama); bb, Sapper (1905); bc, Fouque (1879); bd, Gorshkov and Dubik(1970); be, Sheppard et al. (1979); bf, Juhle and Coulter (1955); bg, Wilcox (1959); bh, Davis andMcNutt (1993); bi, Paskievitch et al. (1995); bj, Perret (1924); bk, Anderson et al. (1965); bl, Pratt(1911); bm, Carroll and Parco (1966); bn, Pond and Smith (1886); bo, H. Okada pers. comm. (1995);bp, Katsui et al. (1990); bq, Niida et al. (1980); br, Jaggar (1906); bs, Martino Museum (painting),Goldsmith (1852); bt, Shore (1975)
Surv Geophys (2006) 27:387–432 397
123
the charge dissipation rate from the finite atmospheric conductivity, as for thecontemporary terrestrial atmosphere.
Volcanism on the early Earth has been suggested to be more intense and moreexplosive due to higher mantle temperatures and higher volatile contents in themagma generated (e.g., Richter 1985). The temperatures of the magma involvedwere also probably higher (e.g., komatiite lavas at temperatures of > 1700�C, Nisbetet al. 1993). In addition to classic mantle-derived volcanism, there was an additionaltype of volcanism (e.g., French 1970) due to impacts from space bodies during thelate heavy bombardment (4–3.8 Ga). Consequently it has been estimated thatvolcanic lightning might have been more prevalent in the early Earth (Navarro-Gonzalez et al. 1998).
Volcanic lightning has been proposed to have contributed to the development oflife on Earth in a number of ways. The sudden discharge of electrical energy along alightning channel produces a plasma thermally equilibrated at temperatures >104 Kwhich then propagates outwards in a cylindrical shock wave, cooling by expansion,radiative heat loss and entrainment of the surrounding gas. This rapid heating fol-lowed by rapid cooling means that the gas mixture thermodynamically equilibratesat a temperature very much greater than the ambient atmosphere generating ele-vated levels of some chemical species of atmospheric or biological importance. Theintense ultraviolet light emitted by the lightning flash can also generate additionalspecies by photolysis, however this effect is thought to be less important than thespecies generated by the intense heat within the lightning channel (Navarro-Gon-zalez and Segura 2001).
In 1953 Miller set out to test the hypothesis that the building blocks of life wereformed when the Earth had an atmosphere of methane, ammonia, water andhydrogen. An electrical discharge was passed through mixture of these gases for aweek and was found to produce aspartic acid, glycine, a-alanine, b-alanine and aamino-m-butyric acid (Miller 1953). Many similar experiments have been done sincethen using different gas mixtures and energy sources. The main conclusions fromsuch studies are that (1) a reduced atmosphere is required to synthesise organiccompounds and (2) electric discharges are among the most efficient energy sourcesfor the synthesis of organic matter (Navarro-Gonzalez et al. 1996). Given theuncertainty of the composition of the early atmosphere and geological evidence thatit was composed mainly of CO2, N2 and H2O it seems unlikely that the key mole-cules relevant for the origins of life (e.g., HCN and HCHO) were synthesised bynormal lightning in the atmosphere. In a volcanic plume, the atmospheric compo-sition is significantly modified by the presence of magmatic gases. Evidence suggeststhat the mantle oxidation state (and thus the assumed oxidation state of volcanicgases) has not changed over time (Canil 1997) and presentday gas emissions fromvolcanoes can contain significant levels of reduced gases such as CH4 and NH3, solightning in volcanic plumes may be more likely to have played a role in synthesisingmolecules relevant for the origins of life than lightning in the atmosphere as a whole(reviewed in Navarro-Gonzalez et al. 1996).
Navarro-Gonzalez et al. (1998) examined volcanic lightning as a mechanism to fixnitrogen on the early Earth. Nitrogen is an essential constituent of life but itsdominant form in the environment of the early Earth was as inert N2 in the atmo-sphere. To be involved with the biological reactions or those reactions leading to life,it must first be ‘fixed’ in a more reactive form. Navarro-Gonzalez et al. (1998)excited mixtures of Archean magmatic gas composition (assumed to be similar to
398 Surv Geophys (2006) 27:387–432
123
that from Hawaii today), diluted by water or Archean atmosphere (assumed as 80%CO2 and 20% N2), using a microwave cavity and measured the products. Theseexperiments strongly suggest that volcanic lightning was one of the major sources offixed nitrogen on the early Earth.
Glindemann et al. (1999) and De Graaf and Schwartz (2000) studied phosphorusreduction by volcanic lightning. Phosphorus is again a necessary component of life. Itoccurs naturally as apatite (Ca5(PO4)3(OH, F, Cl)), an insoluble mineral and inorder to be available to the biological reactions or those reactions leading to life itmust be reduced to hydrophosphites or phosphites. Experiments showed thatlightning in volcanic plumes containing minerals such as fluorapatite could yieldsignificant phosphite (see Navarro-Gonzalez and Segura 2001 for a summary)although the fraction converted varied significantly with the starting material and thecomposition of the gas mixture (with more phosphite production occurring in morereduced atmospheres).
Experiments have also been carried out on the effects on volcanic lightning onprimitive Martian atmospheres (Navarro-Gonzalez and Basiuk 1998; Segura andNavarro-Gonzalez 2001, 2005). It has been estimated that Martian volcanism waspresent from 4 Ga for about 3 billion years (Greeley and Spudis 1981; Mouginis-Mark et al. 1992). The lower atmospheric pressure than Earth and interactions withunderground or surface water (such an interaction was highly probable in early Marsbecause groundwater is thought to have been an important part of the upper crust,Wilson and Head 1994; Boynton et al. 2002), suggest that Martian volcanism mighthave been explosive in nature with high column heights (see also Sect. 2.5). Thechemical composition of the simulated volcanic gases was based on the thermody-namic model for planetary accretion developed by Kuramoto and Matsui (1996) andapplied to Mars by Kuramoto (1997). These give a more reduced volcanic gascomposition than for the Earth (due to the presence of metallic Fe in Mars’ uppermantle), containing more CH4 and H2. The Martian atmosphere is assumed to be80% CO2 and 20% N2. These experiments show that volcanic lightning might havebeen a significant source of fixed nitrogen and key molecules relevant for the originsof life (because HCN is produced) on early Mars also (Navarro-Gonzalez andBasiuk 1998; Segura and Navarro-Gonzalez 2001, 2005).
2 Observations
Electric field and potential gradient measurements of thunderclouds and the fairweather atmosphere have been made by launching instrumented rockets (e.g., Winnand Moore 1971), balloons and kites into clouds, as well as through recording thesimultaneous surface changes in electric fields and radio waves. In situ measurementof charge carriers can also be made. This section discusses some such measurementtechniques and their application to volcanic plumes.
2.1 Surface electric fields
At the Earth’s surface in clean air away from any charge separation processes,there is an increase in electric potential positively with height, arising from the fairweather electric field. This electric field is conventionally referred to as the fairweather atmospheric potential gradient, which is typically 120 V m–1 near to the
Surv Geophys (2006) 27:387–432 399
123
surface. The potential gradient (PG) results from the positive potential of theionosphere achieved with respect to the surface, which is sustained by the elec-trification of clouds in disturbed weather and current flow within the globalatmospheric electrical circuit. The PG is sensitive to local aerosol: high aerosol orsmoke concentrations reduce the electrical conductivity of air, increasing the PG(e.g., Harrison and Aplin 2002; Harrison 2006). If the aerosol is charged, as can bethe case for radioactive aerosol or volcanic aerosol, the PG may be moresubstantially affected. This provides one basis for the detection of charged volcanicplumes.
The PG can be measured with electrostatic sensors, or electrometer voltmeters.Electrostatic sensors based on measuring the induced charge in a conductor, under arotating shutter are known as field mills (Chalmers 1967; Chubb 1990). These haverapid time response ( > 1 Hz sampling), but ultimately suffer wear due to movingparts and, if not carefully protected, exposed electrode surfaces may slowly deteri-orate under atmospheric conditions. Electrometer voltmeter sensors require a suit-able potential probe (or collector) (Israel 1970, 1973) connected to an ultra-highimpedance electrometer (Harrison 2002). A collector acquires the local atmosphericpotential: collectors used have included radioactive sources, flame probes, waterdroppers and long wire antennae (Crozier 1963; Chalmers 1967).
Conducting material, such as metal masts and equipment enclosures distort theelectric field. Absolute calibration of an electric field sensor is therefore usuallycarried out in situ, against a measurement taken in an area with an undisturbedelectric field. For this, a long horizontal wire antenna, connected to a high imped-ance voltmeter, is particularly well suited (Harrison 1997; Bennett and Harrison2006). If the antenna is many times longer than the height at which it is operated,there is little distortion of the atmospheric electric field, and the potential it mea-sures, when divided by the height at which it is operating, provides a reference valueof the electric field. The long wire antenna requires vertical atmospheric mixing tooperate satisfactorily (Harrison 2004b), and is therefore not suited to continuousmonitoring.
2.2 Charged particle measurements
2.2.1 Remote electric field measurements
The influence of charged particles on the surface electric field provides the basis fordetection of electrified plumes or clouds. If the cloud or plume contains chargedparticles, the change in surface PG depends on the charge distribution, and thedistance between the plume and the surface sensor.
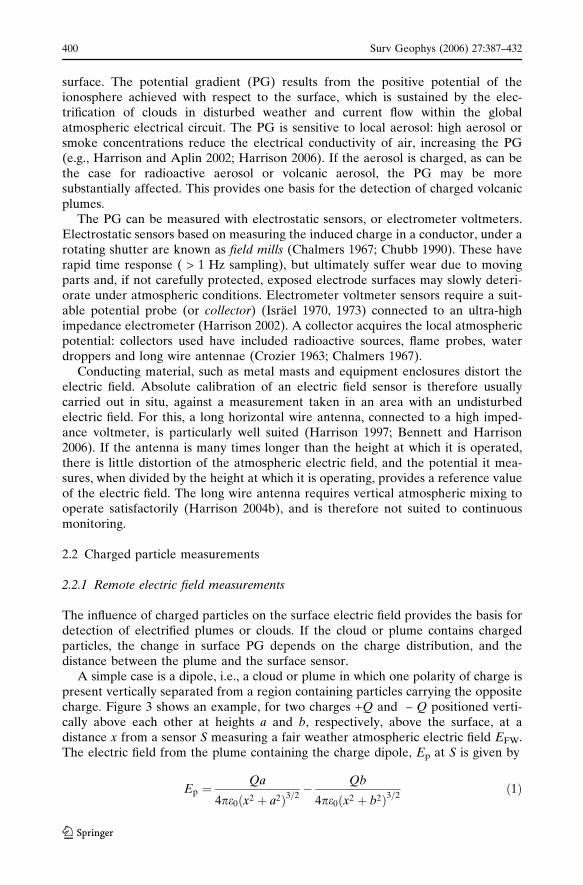
A simple case is a dipole, i.e., a cloud or plume in which one polarity of charge ispresent vertically separated from a region containing particles carrying the oppositecharge. Figure 3 shows an example, for two charges +Q and – Q positioned verti-cally above each other at heights a and b, respectively, above the surface, at adistance x from a sensor S measuring a fair weather atmospheric electric field EFW.The electric field from the plume containing the charge dipole, Ep at S is given by
Ep ¼Qa
4pe0 x2 þ a2ð Þ3=2� Qb
4pe0 x2 þ b2ð Þ3=2ð1Þ
400 Surv Geophys (2006) 27:387–432
123
For the charge due to the dipole to be detectable, Ep will typically need to becomparable with EFW, or at least larger than its typical fluctuations at a particularsite. It is clear from Eq. 1 that the field change will depend on the amount of charge,its separation distance, and the distance between the sensor and the dipole. If adipole containing ± 1 mC of charge at 800 and 600 m passes directly above a sensorS, the field resulting will be ~40 V m–1. For a smaller charge of ± 1 lC, the chargeswould need to be, e.g., at 100 and 15 m to produce the same field. Because thecombination of separations and charge is not uniquely determined by the surfacefield, additional information, such as the observed height of the cloud or plume isrequired if the charge contained is to be inferred.
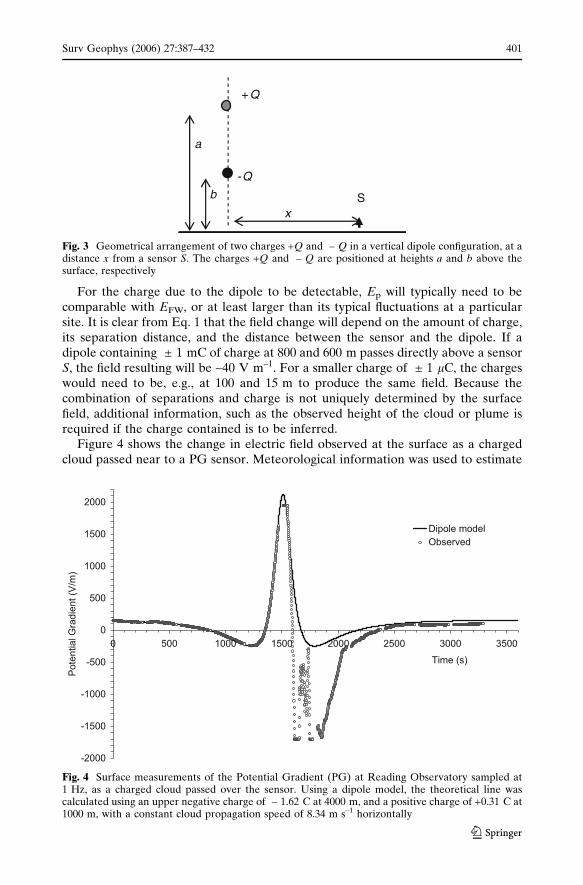
Figure 4 shows the change in electric field observed at the surface as a chargedcloud passed near to a PG sensor. Meteorological information was used to estimate
S
+Q
-Q
x
b
a
Fig. 3 Geometrical arrangement of two charges +Q and – Q in a vertical dipole configuration, at adistance x from a sensor S. The charges +Q and – Q are positioned at heights a and b above thesurface, respectively
-2000
-1500
-1000
-500
0
500
1000
1500
2000
0 500 1000 1500 25002000 3000 3500
Time (s)
Po
ten
tia
l G
rad
ien
t (V
/m)
Dipole model
Observed
Fig. 4 Surface measurements of the Potential Gradient (PG) at Reading Observatory sampled at1 Hz, as a charged cloud passed over the sensor. Using a dipole model, the theoretical line wascalculated using an upper negative charge of – 1.62 C at 4000 m, and a positive charge of +0.31 C at1000 m, with a constant cloud propagation speed of 8.34 m s–1 horizontally
Surv Geophys (2006) 27:387–432 401
123
the upper and lower boundaries of the cloud, and the approximate positions of theupper and lower charges in the dipole. The dipole model, with estimated wind speedinformation, provides a close fit to the PG changes observed as the cloud approachedand caused a fluctuation in EFW.
If only a single region of charge Q is present at a height a, Eq. 1 can be simplifiedto
Ep ¼2Qa
4pe0 x2 þ a2ð Þ3=2ð2Þ
in which the numerator factor 2 accounts for an image charge induced below thesurface.
2.2.2 In situ charge measurement
Measurements of charged particles in the atmosphere can be made from aircraft orfrom balloon-carried sensors. A further opportunity for charge measurement isthrough capture of particles at the surface following gravitational settling or pre-cipitation, but this can be less satisfactory as, depending on the timescale of thevertical transport, the charge may be modified.
2.3 Remote lightning detection
Lightning can be detected remotely by different techniques. Using the radio wavesemitted by a lightning discharge received by several stations, it is possible to locatethe origin of the discharge. Radio waves for this purpose tend to be at very lowfrequency (~10 kHz), but VHF (~100 MHz) is also used (e.g., Hamer 1996;McGorman and Rust 1998). Lightning can also be detected from orbiting satelliteplatforms, using signal processing to enhance the visible transient (e.g., Christian1999).
2.4 Measurements at volcanic plumes
Only a small number of studies have been made of the electric potential gradients,charges on particles and lightning associated with volcanic plumes.
2.4.1 Remote electric field measurements under volcanic plumes
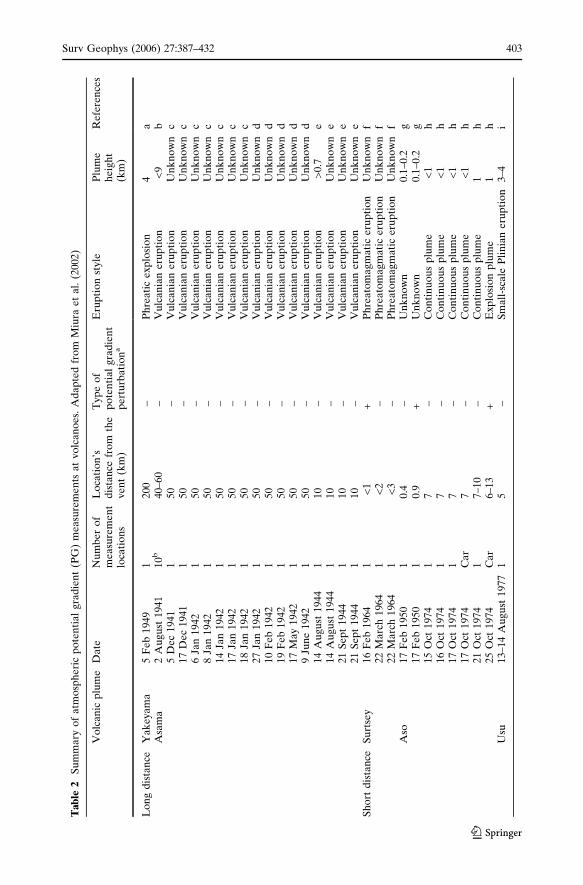
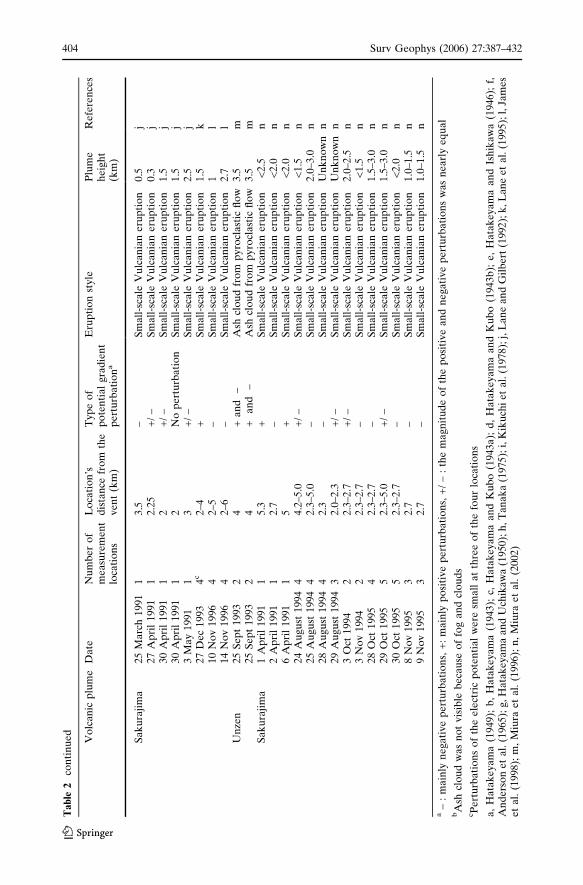
Table 2 summarises the previous measurements of PG perturbations associated withvolcanic plumes and the polarity of these perturbations. The variation of thesepolarities is discussed further in Sect. 3.3. Both electrometer voltmeters (Andersonet al. 1965) and electrostatic sensors (Lane and Gilbert 1992; James et al. 1998;Miura et al. 2002) have been used in volcanic contexts and the PGs measured showlarge variations of up to tens of kV m–1.
2.4.2 In situ volcanic plume charge measurement
Previous measurements of the charged particles in volcanic plumes have been lim-ited to measurements on those particles that settle out to the ground. Gilbert et al.
402 Surv Geophys (2006) 27:387–432
123
Tab
le2
Su
mm
ary
of
atm
osp
he
ric
po
ten
tia
lg
rad
ien
t(P
G)
me
asu
rem
en
tsa
tv
olc
an
oe
s.A
da
pte
dfr
om
Miu
rae
ta
l.(2
002
)
Vo
lcan
icp
lum
eD
ate
Nu
mb
er
of
me
asu
rem
en
tlo
cati
on
s
Lo
cati
on
’sd
ista
nce
fro
mth
ev
en
t(k
m)
Typ
eo
fp
ote
nti
al
gra
die
nt
pe
rtu
rba
tio
na
Eru
pti
on
sty
leP
lum
eh
eig
ht
(km
)
Re
fere
nce
s
Lo
ng
dis
tan
ceY
ak
eya
ma
5F
eb
19
49
12
00
–P
hre
ati
ce
xp
losi
on
4a
Asa
ma
2A
ugu
st1
94
11
0b
40
–6
0–
Vu
lca
nia
ne
rup
tio
n<
9b
5D
ec
19
41
15
0–
Vu
lca
nia
ne
rup
tio
nU
nk
no
wn
c1
7D
ec
19
41
15
0–
Vu
lca
nia
ne
rup
tio
nU
nk
no
wn
c6
Jan
19
42
15
0–
Vu
lca
nia
ne
rup
tio
nU
nk
no
wn
c8
Jan
19
42
15
0–
Vu
lca
nia
ne
rup
tio
nU
nk
no
wn
c1
4Ja
n1
94
21
50
–V
ulc
an
ian
eru
pti
on
Un
kn
ow
nc
17
Jan
19
42
15
0–
Vu
lca
nia
ne
rup
tio
nU
nk
no
wn
c1
8Ja
n1
94
21
50
–V
ulc
an
ian
eru
pti
on
Un
kn
ow
nc
27
Jan
19
42
15
0–
Vu
lca
nia
ne
rup
tio
nU
nk
no
wn
d1
0F
eb
19
42
15
0–
Vu
lca
nia
ne
rup
tio
nU
nk
no
wn
d1
9F
eb
19
42
15
0–
Vu
lca
nia
ne
rup
tio
nU
nk
no
wn
d1
7M
ay
19
42
15
0–
Vu
lca
nia
ne
rup
tio
nU
nk
no
wn
d9
Jun
e1
94
21
50
–V
ulc
an
ian
eru
pti
on
Un
kn
ow
nd
14
Au
gust
19
44
11
0–
Vu
lca
nia
ne
rup
tio
n>
0.7
e1
4A
ugu
st1
94
41
10
–V
ulc
an
ian
eru
pti
on
Un
kn
ow
ne
21
Se
pt
19
44
11
0–
Vu
lca
nia
ne
rup
tio
nU
nk
no
wn
e2
1S
ep
t1
94
41
10
–V
ulc
an
ian
eru
pti
on
Un
kn
ow
ne
Sh
ort
dis
tan
ceS
urt
sey
16
Fe
b1
96
41
<1
+P
hre
ato
ma
gm
atic
eru
pti
on
Un
kn
ow
nf
22
Ma
rch
19
64
1<
2–
Ph
rea
tom
ag
mat
ice
rup
tio
nU
nk
no
wn
f2
2M
arc
h1
96
41
<3
–P
hre
ato
ma
gm
atic
eru
pti
on
Un
kn
ow
nf
Aso
17
Fe
b1
95
01
0.4
–U
nk
no
wn
0.1
–0.2
g1
7F
eb
19
50
10
.9+
Un
kn
ow
n0
.1–0
.2g
15
Oct
19
74
17
–C
on
tin
uo
us
plu
me
<1
h1
6O
ct1
97
41
7–
Co
nti
nu
ou
sp
lum
e<
1h
17
Oct
19
74
17
–C
on
tin
uo
us
plu
me
<1
h1
7O
ct1
97
4C
ar
7–
Co
nti
nu
ou
sp
lum
e<
1h
21
Oct
19
74
17
–1
0–
Co
nti
nu
ou
sp
lum
e1
h2
5O
ct1
97
4C
ar
6–
13
+E
xp
losi
on
plu
me
1h
Usu
13
–14
Au
gust
19
77
15
–S
mal
l-sc
ale
Pli
nia
ne
rup
tio
n3
–4
i
Surv Geophys (2006) 27:387–432 403
123
Table
2co
nti
nu
ed
Vo
lcan
icp
lum
eD
ate
Nu
mb
er
of
me
asu
rem
en
tlo
cati
on
s
Lo
cati
on
’sd
ista
nce
fro
mth
ev
en
t(k
m)
Typ
eo
fp
ote
nti
al
gra
die
nt
pe
rtu
rba
tio
na
Eru
pti
on
sty
leP
lum
eh
eig
ht
(km
)
Re
fere
nce
s
Sa
ku
raji
ma
25
Ma
rch
19
91
13
.5–
Sm
all-
sca
leV
ulc
ania
ne
rup
tio
n0
.5j
27
Ap
ril
19
91
12
.25
+/
–S
mal
l-sc
ale
Vu
lcan
ian
eru
pti
on
0.3
j3
0A
pri
l1
99
11
2+
/–
Sm
all-
sca
leV
ulc
ania
ne
rup
tio
n1
.5j
30
Ap
ril
19
91
12
No
pe
rtu
rba
tio
nS
mal
l-sc
ale
Vu
lcan
ian
eru
pti
on
1.5
j3
Ma
y1
99
11
3+
/–
Sm
all-
sca
leV
ulc
ania
ne
rup
tio
n2
.5j
27
De
c1
99
34
c2
–4
+S
mal
l-sc
ale
Vu
lcan
ian
eru
pti
on
1.5
k1
0N
ov
19
96
42
–5
–S
mal
l-sc
ale
Vu
lcan
ian
eru
pti
on
1l
14
No
v1
99
64
2–
6–
Sm
all-
sca
leV
ulc
ania
ne
rup
tio
n2
.7l
Un
zen
25
Se
pt
19
93
24
+a
nd
–A
shcl
ou
dfr
om
py
rocl
ast
icfl
ow
3.5
m2
5S
ep
t1
99
32
4+
an
d–
Ash
clo
ud
fro
mp
yro
cla
stic
flo
w3
.5m
Sa
ku
raji
ma
1A
pri
l1
99
11
5.3
+S
mal
l-sc
ale
Vu
lcan
ian
eru
pti
on
<2
.5n
2A
pri
l1
99
11
2.7
–S
mal
l-sc
ale
Vu
lcan
ian
eru
pti
on
<2
.0n
6A
pri
l1
99
11
5+
Sm
all-
sca
leV
ulc
ania
ne
rup
tio
n<
2.0
n2
4A
ugu
st1
99
44
4.2
–5.0
+/
–S
mal
l-sc
ale
Vu
lcan
ian
eru
pti
on
<1
.5n
25
Au
gust
19
94
42
.3–5
.0–
Sm
all-
sca
leV
ulc
ania
ne
rup
tio
n2
.0–3
.0n
28
Au
gust
19
94
42
.3–
Sm
all-
sca
leV
ulc
ania
ne
rup
tio
nU
nk
no
wn
n2
9A
ugu
st1
99
43
2.0
–2.3
+/
–S
mal
l-sc
ale
Vu
lcan
ian
eru
pti
on
Un
kn
ow
nn
3O
ct1
99
42
2.3
–2.7
+/
–S
mal
l-sc
ale
Vu
lcan
ian
eru
pti
on
2.0
–2.5
n3
No
v1
99
42
2.3
–2.7
–S
mal
l-sc
ale
Vu
lcan
ian
eru
pti
on
<1
.5n
28
Oct
19
95
42
.3–2
.7–
Sm
all-
sca
leV
ulc
ania
ne
rup
tio
n1
.5–3
.0n
29
Oct
19
95
52
.3–5
.0+
/–
Sm
all-
sca
leV
ulc
ania
ne
rup
tio
n1
.5–3
.0n
30
Oct
19
95
52
.3–2
.7–
Sm
all-
sca
leV
ulc
ania
ne
rup
tio
n<
2.0
n8
No
v1
99
53
2.7
–S
mal
l-sc
ale
Vu
lcan
ian
eru
pti
on
1.0
–1.5
n9
No
v1
99
53
2.7
–S
mal
l-sc
ale
Vu
lcan
ian
eru
pti
on
1.0
–1.5
n
a–
:m
ain
lyn
ega
tiv
ep
ert
urb
ati
on
s,+
:m
ain
lyp
osi
tiv
ep
ert
urb
ati
on
s,+
/–
:th
em
ag
nit
ud
eo
fth
ep
osi
tiv
ea
nd
ne
gati
ve
pe
rtu
rba
tio
ns
wa
sn
ea
rly
eq
ua
lbA
shcl
ou
dw
as
no
tv
isib
leb
eca
use
of
fog
an
dcl
ou
ds
cP
ert
urb
ati
on
so
fth
ee
lect
ric
po
ten
tia
lw
ere
sma
lla
tth
ree
of
the
fou
rlo
cati
on
s
a,
Ha
tak
ey
am
a(1
949
);b
,H
ata
ke
ya
ma
(19
43);
c,H
ata
ke
ya
ma
an
dK
ub
o(1
94
3a
);d
,H
ata
ke
yam
aa
nd
Ku
bo
(19
43
b);
e,
Ha
tak
ey
am
aa
nd
Ish
ika
wa
(19
46);
f,A
nd
ers
on
et
al.
(19
65);
g,
Ha
tak
ey
am
aa
nd
Uch
ika
wa
(19
50);
h,
Tan
ak
a(1
975
);i,
Kik
uch
ie
ta
l.(1
97
8);
j,L
an
ea
nd
Gil
be
rt(1
992
);k
,L
ane
et
al.
(19
95
);l,
Jam
es
et
al.
(19
98
);m
,M
iura
et
al.
(19
96);
n,
Miu
rae
ta
l.(2
00
2)
404 Surv Geophys (2006) 27:387–432
123
(1991) used parallel plates and a ground plate connected to an electrometer torecord absolute charge to mass ratios (i.e., the charges on individual particles) onvolcanic ash from +3 · 10–4 to +6 · 10–4 C kg–1 and – 2 · 10–4 to – 5 · 10–4 C kg–1
at Sakurajima volcano. The average total charge (measured by collecting ash in aFaraday cup connected to an electrometer) was from +2 · 10–5 to +5 · 10–5 C kg–1.These data yield surface charge densities of – 7 · 10–6 and +1 · 10–5 C m–2 sug-gesting that ash particles generated during the explosive volcanism at Sakurajima arecharged almost to the air ionisation limit, that is to say, they are almost saturatedwith charge. A few other researchers have reported results of volcanic ash charge-mass ratio measurements. Hatakeyama (1958) measured an average net charge-massratio (i.e., the sum of positive and negative charges) of – 4 · 10–7 C kg–1 for fallingash particles during the Asama 1941 eruption using a Faraday cup. Miura et al.(2002) used parallel plates and measured deflections to determine that volcanic ash,again from Sakurajima volcano, had specific charges from – 4 · 10–5 C kg–1 to+4 · 10–5 C kg–1. The net polarity varied for the measurements made on differentdays. Comparison with PG measurements (Miura et al. 2002) confirmed the findingsof Gilbert et al. (1991) that the average charge in the plume is much smaller than thecharges held by individual particles (see Sect. 3.3. for further discussion of thesemeasurements).
Direct measurements of charged particles airborne within a volcanic plume aredifficult, as aircraft are frequently unable to fly near erupting volcanoes. Balloon-carried sensors provide an alternative, as they can be readily launched into theplume. Additional sensors, carried by conventional meteorological radiosondes (e.g.,Harrison 2005a), can provide high-resolution spatial sampling. A disposable chargesensor (Harrison 2001), used to detect charged particles in the free atmosphere usinga balloon platform, would be well suited to sampling volcanic plumes.
2.4.3 Remote volcanic lightning detection
As well as visual observations of lightning in volcanic plumes (e.g., Table 1), moresystematic measurements of volcanic lightning occurrences have been made. Hoblitt(1994) temporarily installed a commercially available lightning detection system(LDS) loaned from the U.S. Bureau of Land Management around Redoubt Vol-cano, Alaska in 1990 with the nearest detectors about 100 km from the volcano. TheLDS antennae picked up broad-band radio waves. The hardware then filtered outsignals that did not have the waveform characteristic of CG lightning. They deter-mined that due to the similarity of the waveforms, systems designed to detectthunderstorm lightning can also monitor volcanic lightning. Lightning was generatedby ash clouds rising from pyroclastic density currents, following a dome collapse.The amount of lightning detected was related to the amount of ash generated and itslocation was controlled by the local topography, which channelled the density cur-rents, and the wind’s interaction with the dust cloud. In individual eruptions, earlyflashes tended to be negative and later flashes positive, suggesting that the negativelycharged particles are settling out of the plume.
Following this study the Alaska Volcano Observatory installed their own LDS tohelp monitor possible eruptions of Cook Inlet volcanoes. McNutt and Davis (2000)describe the application of this system, as well as the now more distal Bureau ofLand Management system and a slow-scan TV camera, to study the volcanic light-ning in the 1992 eruption plumes from Mount Spurr in Alaska. Lightning occurred
Surv Geophys (2006) 27:387–432 405
123
associated with the ash clouds of all three eruptions. For them all the first lightningwas recorded 21–26 min after the onset of the eruption. This might suggest that thetimescale for charge separation in the volcanic cloud was such that the plume wastransported away from the vent (potentially both vertically and laterally) beforelightning occurred. Measurements of the exact location of the lightning wouldconfirm this. This is about 2–5 times longer a delay than at Redoubt (Hoblitt 1994)and McNutt and Davis (2000) speculate that this is due to the differing silica con-tents of the magmas (Table 1). Similar results for the strike polarity were observedas for Redoubt though, with the August 1992 eruption showing negative polaritiesfor the first 12 recorded flashes and a positive polarity for the last. The Augustlightning was strongest, June weakest, and September intermediate. All threeeruptions had similar durations of 3.5–4 h, and tephra volumes of 44–56 million m3.The August eruption, however, produced stronger volcanic tremor and largeramounts of gas. Thus, in this case, lightning strength correlates with both tremoramplitude and magmatic gas content but not the tephra volume as suggested byHoblitt (1994). Greater gas content might lead to a more explosive eruption (con-sistent with the potential importance of magma fragmentation in plume electrifica-tion discussed in Sect. 3.3) or more efficient formation of ice or sulphate aerosol inthe plume, both of which would influence the charge characteristics of the plume.Meteorological conditions might also account for the difference. The August erup-tion occurred during the lightest winds, so the ash and hence charge densities in theplume might have been highest promoting lightning production and the ash cloudand charge separation more vertically oriented favouring CG lightning. The Sep-tember eruption occurred during the coldest and driest atmospheric conditions,which may explain the small amount of lightning either due to differences in theelectrical conductivity of the background air or the ease of ice formation.
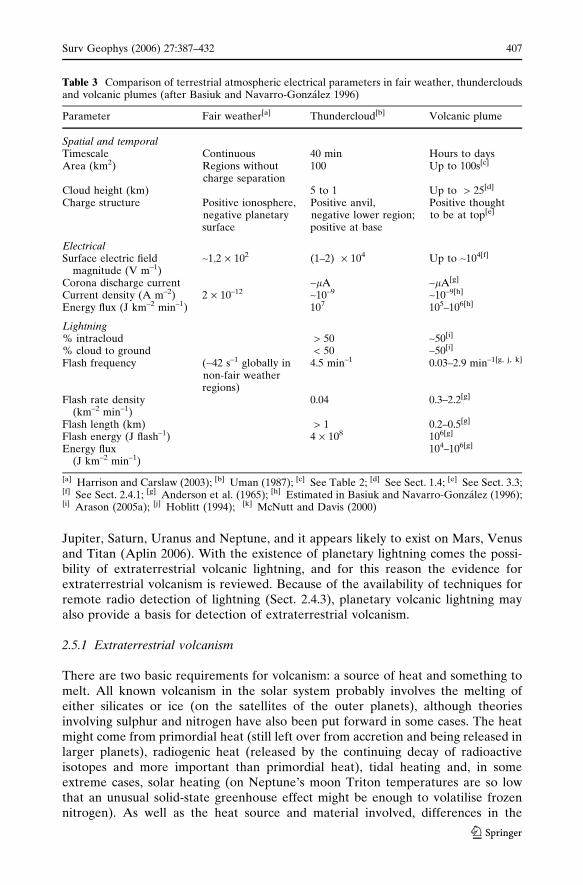
The eruption of Grimsvotn in November 2004 provided an opportunity for avariety of remote sensing techniques to be combined by the Icelandic Meteorolog-ical Office (Arason 2005a, b; Vogfjorð et al. 2005). The UK Met Office Arrival TimeDifference lightning location system (ATD) was used to detect the lightning fromGrimsvotn simultaneously with tracking of the plume by the Icelandic weather ra-dar. In the first 36 h of the eruption 250 lightning strikes were detected over Vat-najokull. Of 152 lightning events for which the waveform was detected, 70 were IClightning, and 82 were CG events. The proportion of CG lightning is greater thanthat usually associated with thunderstorms. The rate of lightning events was posi-tively correlated with the height of the volcanic plume, with the maximum event rateoccurring for plume heights of about 10 km. Table 3 compares measured parametersof volcanic plume electrification with those from thunderclouds and the fair weatheratmosphere.
Satellite based remote sensing has not yet been applied to the study of terrestrialvolcanic lightning.
2.5 Planetary volcanic lightning
The electrification of clouds and production of lightning occurs on other planets andplanetary bodies in the solar system. The combination of cosmic ray ion productionand charge separation processes from dynamical motions leads to observable, or atleast inferred atmospheric electrical effects. Strong evidence exists for lightning on
406 Surv Geophys (2006) 27:387–432
123
Jupiter, Saturn, Uranus and Neptune, and it appears likely to exist on Mars, Venusand Titan (Aplin 2006). With the existence of planetary lightning comes the possi-bility of extraterrestrial volcanic lightning, and for this reason the evidence forextraterrestrial volcanism is reviewed. Because of the availability of techniques forremote radio detection of lightning (Sect. 2.4.3), planetary volcanic lightning mayalso provide a basis for detection of extraterrestrial volcanism.
2.5.1 Extraterrestrial volcanism
There are two basic requirements for volcanism: a source of heat and something tomelt. All known volcanism in the solar system probably involves the melting ofeither silicates or ice (on the satellites of the outer planets), although theoriesinvolving sulphur and nitrogen have also been put forward in some cases. The heatmight come from primordial heat (still left over from accretion and being released inlarger planets), radiogenic heat (released by the continuing decay of radioactiveisotopes and more important than primordial heat), tidal heating and, in someextreme cases, solar heating (on Neptune’s moon Triton temperatures are so lowthat an unusual solid-state greenhouse effect might be enough to volatilise frozennitrogen). As well as the heat source and material involved, differences in the
Table 3 Comparison of terrestrial atmospheric electrical parameters in fair weather, thundercloudsand volcanic plumes (after Basiuk and Navarro-Gonzalez 1996)
Parameter Fair weather[a] Thundercloud[b] Volcanic plume
Spatial and temporalTimescale Continuous 40 min Hours to daysArea (km2) Regions without
charge separation100 Up to 100s[c]
Cloud height (km) 5 to 1 Up to > 25[d]
Charge structure Positive ionosphere,negative planetarysurface
Positive anvil,negative lower region;positive at base
Positive thoughtto be at top[e]
ElectricalSurface electric field
magnitude (V m–1)~1.2 · 102 (1–2) · 104 Up to ~104[f]
Corona discharge current ~lA ~lA[g]
Current density (A m–2) 2 · 10–12 ~10–9 ~10–9[h]
Energy flux (J km–2 min–1) 107 105–106[h]
Lightning% intracloud > 50 ~50[i]
% cloud to ground < 50 ~50[i]
Flash frequency (~42 s–1 globally innon-fair weatherregions)
4.5 min–1 0.03–2.9 min–1[g, j, k]
Flash rate density(km–2 min–1)
0.04 0.3–2.2[g]
Flash length (km) > 1 0.2–0.5[g]
Flash energy (J flash–1) 4 · 108 106[g]
Energy flux(J km–2 min–1)
104–106[g]
[a] Harrison and Carslaw (2003); [b] Uman (1987); [c] See Table 2; [d] See Sect. 1.4; [e] See Sect. 3.3;[f] See Sect. 2.4.1; [g] Anderson et al. (1965); [h] Estimated in Basiuk and Navarro-Gonzalez (1996);[i] Arason (2005a); [j] Hoblitt (1994); [k] McNutt and Davis (2000)
Surv Geophys (2006) 27:387–432 407
123

magma type, volatile content, atmosphere and strength of the gravitational fieldon other planetary bodies will also influence that style of volcanism observed(Francis 1993).
For our nearest solar system neighbours, the Moon, Venus, Mars and Mercury,there is abundant evidence for volcanism on the Moon, Venus and Mars and sug-gestive, if ambiguous, evidence for volcanism on Mercury. However, with theexception of Venus, which is similar in size and mass to the Earth, this volcanism isalmost certainly long extinct as smaller planets cool more quickly (higher surfacearea to volume ratios) and contain lower total numbers of radioactive isotope atoms.Venus’s cloud-laden atmosphere makes it hard to study the planet’s surface. Givenits similarity to Earth it is possible that there is still active volcanism but withoutcontinual monitoring of the planet’s surface this is hard to detect. There are someindirect suggestions of volcanism though, with variations in the atmospheric com-position hinting that volcanic emission rates might vary (Esposito 1984). Further, in1991 the Galileo spacecraft detected electromagnetic pulses from the atmospherethat were probably caused by lightning (Gurnett et al. 1991). Venus’s atmospheremay not support convective storms like those that generate the majority of lightningon Earth, so it is possible that this could arise from ash-laden volcanic plumes,though other explanations are also possible (Francis and Oppeneheimer 2004).
Further out in the solar system volcanism of different types has been observed ona number of the satellites orbiting the gas planets. Io is the innermost of Jupiter’slarger moons. Tidal heating due to its proximity to Jupiter ensures that volcanism isvery much alive on this planet sending plumes high up above its surface where theycan be seen by passing spacecraft. It has been suggested that sulphur volcanismdominates on Io (e.g., Nash and Howell 1989). However, lava temperatures mea-sured by the Galileo spacecraft (Lopes-Gautier et al. 1997) and from Earth usinginfrared telescopes (Johnson et al. 1988) are too high ( > 1300�C, hotter than con-temporary terrestrial magmas suggesting komatiite composition) showing that sul-phur cannot form the dominant magma on Io, although it might occur on a smallerscale. The height of Io’s volcanic plumes suggests that eruptions must be driven byextra volatiles from near-surface layers as well as those dissolved within the magma(e.g., Cataldo et al. 2002). Jupiter’s next moon out, Europa, is entirely covered by alayer of ice. The low number of surface impact craters and a couple of telescope andspectroscopic measurements suggest ice volcanism may occur. Thermal modellingsuggests that heat leaks out from the inner silicate part of the moon and maintains aliquid water ‘mantle’, capped by an ice crust (Pappalardo et al. 1999 and referencestherein). It could be that similar activity occurs or has occurred on the other satel-lites of Jupiter, Saturn and Uranus. Even further away from the sun Triton, Nep-tune’s largest moon, shows abundant evidence of resurfacing and images fromVoyager 2 showed dark geyser-like plumes rising about 8 km from the surface.Triton’s surface is thought to consist of solid nitrogen and methane, perhapsunderlain by ice. To account for Triton’s volcanism it has been postulated thatradiation from the distant sun penetrates the clear nitrogen ice to be absorbed by anunderlying dark layer. This then heats the nitrogen ice from below (analogous to thegreenhouse effect mediated by the atmosphere on the Earth) increasing its vapourpressure until it bursts through the surface and erupts as a geyser spraying a plume ofnitrogen gas, ice and entrained dark particles high into space (Brown and Kirk 1994and references therein; Francis and Oppeneheimer 2004).
408 Surv Geophys (2006) 27:387–432
123

3 Plume electrification and generation of volcanic lightning
3.1 Aerosol electrification
Charged particles in the fair weather atmosphere arise because of the presence ofmolecular ions, generated by cosmic rays and radioactive isotopes. Charged particlesare also generated as a result of combustion. The attachment of molecular ions toatmospheric aerosol (fine, i.e., < tens of lm in diameter, solid or liquid particlessuspended in the atmosphere) by diffusion leads to aerosol electrification. Factorsinfluencing electrification of atmospheric aerosols include the particle size, and theproperties of the molecular ions. Positive and negative ions differ chemically, whichleads to different mean ion mobilities for positive and negative ions. If this were notthe case, the rates of positive and negative charge exchange between particles andions would be equal, and no net charge on the aerosol would result. The naturalasymmetry in atmospheric ion properties leads to a finite mean charge on atmo-spheric aerosols. In general, a charge distribution exists on atmospheric aerosolparticles, which although the mean charge may be small, does not preclude theexistence of highly charged particles within the ensemble. Establishing the chargedistribution on an aerosol particle population can be found by making thermody-namic assumptions about the energetics (Sect. 3.1.1) or, equivalently by consider-ation of the statistics of charge acquisition, from ion–aerosol theory (Sect. 3.1.2). Thenatural charge distributions found using these theoretical techniques provide a basisfor assessing the differences in electrical properties of charged volcanic aerosols.
3.1.1 Thermodynamic considerations
Using a thermodynamic perspective, Keefe et al. (1959) argued for the existence ofan aerosol charge distribution. This was on the basis that collisions between bipolarions and aerosol were sufficiently frequent for charge-exchange equilibrium to beestablished. Under that assumption, the particle charge distribution would be givenby the Boltzmann energy factor exp( – //kT), where / is the particle’s electricpotential. A conducting sphere of radius r carrying a potential / has an electricalenergy given by 1/2Q/ or (1/2)Q/, where Q is the total charge on the sphere. Theassociated electric potential is given by / = Q/4pe0r. With j charges on the aerosol,assuming a Boltzmann distribution, the number of particles, Nj, carrying j charges isproportional to
Nj
N0¼ exp
�j2e2
8pe0rkT
� �ð3Þ
This simple argument has been challenged, but the experimental data largelyjustifies the result. Brown (1991) and Fuchs (1963) state that using a Boltzmanndistribution in such non-equilibrium situations is invalid, because of the absence ofan exact inverse process in the charge equilibrium, other than the arrival of oppo-sitely charged ions. However, the agreement with measurements led Hoppel andFrick (1986) to argue that the distribution can be justified. Charge distributions of anexponential form were predicted by Gunn (1955), and observed by Lissowski (1940).
The Boltzmann formulation takes no account of imbalances in positive andnegative ion concentrations or their properties, which would be intuitively expected
Surv Geophys (2006) 27:387–432 409
123
to influence the charge acquired by the aerosol, particularly in the atmosphere.However, the simple Boltzmann form has had widespread use in aerosol science andatmospheric electricity, despite the fact that ion concentration imbalances andmobility asymmetries are widely observed.
3.1.2 Detailed balance calculations
The physics of charge exchange between ions and aerosol is relatively well under-stood (Harrison and Carslaw 2003). Diffusion of ions to aerosol particles transferscharge from the ion to the particle, leading to a reduction in the ion number con-centration and an increase in the charge carried by the aerosol. The charge on theparticles can be calculated by considering all the possible ion–particle charge-exchange interactions, allowing for multiply-charged particles and collisions whichresult in the particles obtaining a net charge of zero. In a real volcanic plume, furtherelectrification processes beyond diffusion charging may occur (Sect. 3.3.), andaddition physical methods of charge exchange need to be considered to produce acomplete theory. These are beyond current theoretical calculations and will requirefurther development and parameterisation of current models.
Attachment occurs when an ion comes sufficiently close to the larger particle togive up its charge, under a combination of Brownian diffusion and electrical motion.The probability of a collision between an ion and a particle occurring is quantified byan ion–aerosol attachment coefficient. The attachment coefficient bij(r) is given interms of the rate of ion–aerosol attachment rate per unit volume X by
bijðrÞ ¼ X=nZðrÞ ð4Þ
where n and Z are the ion and aerosol number concentrations, respectively, i is thepolarity of the ion (i = ± 1) and j is the number of charges carried on a particle ofradius r. The mean ion–aerosol attachment rates have been measured in volcanicplumes. The eruption of Mt St Helens, USA on May 18th, 1980 allowed the study ofaerosol profiles before and after the eruption (Kondo et al. 1982) using balloonascents and laser backscatter measurements. The balloon sounding recorded themean value of ion–aerosol attachment rate b Z. Approximate mean values foundaround the tropopause (14–17 km) before and after the eruption were bZ = 2.5 · 10–3 s–1 and b Z = 5.5 · 10–3 s–1, respectively. The increase in attachmentrate could result from the increase in size of the particles present, but is more likelyto have resulted from an increase in the number concentration.
3.1.3 Theoretical charge distributions
Calculating the aerosol charge distribution requires the use of Eq. 4 for all theparticles, including those already charged. Eventually the charge distributionbecomes steady, when the rates of acquisition and loss of charge by particles areequal. The equations describing this (Bricard 1965; Boisdron and Brock 1970; Mead1978; Adachi 1985; Clement and Harrison 1992) can be solved numerically as afunction of time, but an analytical steady-state formula exists. This, the ModifiedBoltzmann Distribution, can be derived from the analytical attachment coefficientsof Gunn (1954), giving
410 Surv Geophys (2006) 27:387–432
123
Nj
N0¼ nþlþ
n�l�
� �j8pe0rkT
je2sinh
je2
8pe0rkT
� �exp
�j2e2
8pe0rkT
� �ð5Þ
where there is a number concentration Nj of particles carrying j charges, in thepresence of ions of concentrations n+ and n– and mobilities l+ and l–. The meanaerosol charge J (Gunn 1955) can be derived from this as
J ¼ lnnþlþn�l�
� �¼ r
4pe0kT
e2
� �ln A ð6Þ
In Eq. 6, A is written as the ratio of the polar ionic properties, an ion asymmetryfactor. This determines the mean aerosol charge and charge distribution.
The Modified Boltzmann Distribution (MBD, Eq. 5) is similar to Eq. 3 (Keefeet al. 1959), as, for large radii, the sinh function is small, and may be neglected. If theion concentrations and mobilities are equal, the ion asymmetry factor tends to unity,and the Modified Boltzmann distribution reduces to the simple exponential Boltz-mann distribution, Eq. 3.
In the case of a volcanic cloud, the ion concentrations will be strongly affected bythe combination of substantial particle concentrations, as well as possible ion-pro-duction processes associated with the hot eruption gases. The mean charge observedin particles within a mature plume in the steady-state provides a measure of the ionasymmetry present, through Eq. 6 above. For example, if the ion concentrations arestrongly unipolar, the steady-state aerosol charge would adopt the same sign as themajority of the ions present.
3.2 Electrical properties of volcanic ash
3.2.1 Plume composition
A volcanic plume is a mixture of gas plus liquid and solid particles. For present-dayvolcanism on Earth, steam and carbon dioxide tend to be the most prevalent speciesin the gas phase followed by sulphur species (SO2 and H2S) and halogen halides(HCl, HF, HBr) and more minor species such as H2, CO, OCS, Ar, NH4, CH4,N2 andHe (Delmelle and Stix 2000). The proportions of these different volatiles vary fromvolcano to volcano. Upon release into the atmosphere, the plume will mix rapidlyand become diluted, therefore even shortly after emission, components of thebackground atmosphere will account for significant proportions of the speciespresent within the plume. During explosive volcanism, the magma fragments withinthe conduit. This fragmented magma will cool rapidly and solidify forming a solidsilicate phase. Close to the source, a plume might contain larger blocks ( > 64 mm)or lapilli (64–2 mm) of pumice or scoria, but it will be the finer ash particles (up to afew mm in size) that will generally be transported further. As well as juvenilefragments (solidified magma which may contain crystals and gas bubbles), ash alsoconsists of lithic (pieces of the volcanic edifice that were torn off during eruption)and crystal (derived from the magma or lithic fragments and released during thefragmentation process) components. Scanning electron microscope (SEM) imageshave shown a huge diversity of volcanic ash morphology, depending on factors suchas magma composition or the involvement of external water (Heiken and Wohletz1985; Sparks et al. 1997).
Surv Geophys (2006) 27:387–432 411
123
Fine silicate particles may also be present in a plume originating from lessexplosive activity, typically from bubbles bursting through the surface of a lava lakeor from re-suspended dust from the conduit walls, but in much lower concentration.In addition to silicates, other species such as metal chlorides, sulphates, sulphuricacid and water may condense into the particle phase as the plume cools. These maycondense onto particles that are already present such as ash, forming overgrowths onthe surface of these particles or liquid envelopes or they may condense to formseparate liquid or solid particles (Mather et al. 2003). Remote sensing measurementsof eruption plumes have suggested the presence of significant levels of ice particles insome eruption plumes, such as those from Hekla, Rabaul and Soufriere Hills, al-though observations at other volcanoes show that this is not ubiquitous (e.g., Roseet al. 2003).
3.2.2 Size distribution
The particle size distribution in volcanic plumes is important both in terms ofcharging mechanisms, charge density and charge separation.
The size distribution of the ash will depend on, amongst other things, the initialfragmentation properties of the magma including the proportion of inhomogeneitiesin the melt. Hence magmas with a higher small crystal proportion by weight arelikely to be a source of larger amounts of small particles, with dome-formingeruptions of highly crystalline magma, such as that at the Soufriere Hills Volcano(Montserrat), releasing considerable quantities of fine ash (<63 lm in diameter).Typical ash emissions on Montserrat contain 10–30% by weight of particles withdiameters less than 10 lm (Baxter et al. 1999; Bonadonna et al. 2002; Moore et al.2002). Measurements of particle size distributions are also necessary to assess thecharacteristics of ash fall-out from volcanic clouds and the associated hazard. Vol-canic ash tends to be sorted by size during transport and deposition (Pyle 1989).Studies summarised in Sparks et al. (1997) show a bimodal size distribution in ashfall deposits with modes at ~10 and ~200 lm and the finer mode becoming moredominant with distance from the volcanic vent until the grain size distribution isessentially unimodal. The deposition of the finer mode close to the plume’s sourcehas been attributed to particle aggregation (see Sect. 3.4.1).
This size sorting and the complicated deposition patterns of volcanic ash makecharacterising the bulk size distribution difficult. Consequently the grain-size anal-yses of samples from many different sites must be integrated to determine the totalgrain-size distribution (e.g., Bonadonna and Houghton 2005). Calculations of totalgrain-size are therefore vulnerable to several difficulties, such as from the integrationof grain-size analysis from single samples, scarcity of data points over the ash-falldeposit region and uneven data-point distribution within the area (Bonadonna andHoughton 2005). Common techniques for calculation of the total grain-size distri-bution of tephra-fall deposits are weighted average of sample grain-size distributionfor all samples over the whole deposit, and arbitrary sectorisation of tephra-falldeposits. The application of this varied methodology makes the analyses of differenttephra-fall deposits by different authors difficult to compare. Further, Bonadonnaand Houghton (2005) highlighted that the techniques suffer from sampling of non-uniform deposits and arbitrariness in the choice of sectors. All existing techniquesto calculate total grain-size distribution of an eruption give only apparent distribu-tions if the data set is small. However, the sensitivity of the analysis depends on
412 Surv Geophys (2006) 27:387–432
123

the original sorting of the particle distribution and the style and intensity of thecorresponding eruption.
Bonadonna and Houghton (2005) applied the Voronoi tessellation technique,which provides a better statistical treatment of non-uniform datasets withoutintroducing arbitrary sectors, to the large dataset of the 17 June 1996 eruption ofRuapehu tephra-fall deposit. The total grain-size distribution shows a Gaussiandistribution with 99.9 wt% of the deposit particles with diameter between 256 mmand 1 lm. Two lognormal sub-populations with modes at 8 and 1 mm could also befitted, with particle fractions of about 40 and 60 wt%, respectively. Further effortsare needed in this area to understand more about the bulk size distribution ofvolcanic ash. Through geochemical studies on sieved size fractions from differenttypes of Montserrat ash, Horwell et al. (2001) also determined that the chemicalcomposition of ash may not be constant in the different size fractions, with somemineral phases being concentrated more in ash fragments of particular sizes due todifferent fragmentation characteristics.
Ash grains are not the only particles present in plumes. The remote sensingmeasurements of Hekla’s 2000 eruption plume by Rose et al. (2003) detected iceparticles with effective radii between about 9 and 40 lm during the 42 h after theeruption. Volcanic plumes also often have a sub-micron particle phase composed ofsulphuric acid and metal salt droplets (Mather et al. 2003). Ash particles may alsohave overgrowths of these substances or be surrounded by a water or ice envelope,modifying their surface properties and size.
3.3 Plume electrification mechanisms
Direction measurements of charge on ash fallout from volcanic plumes (see alsoSect. 2.4.2) have measured net charges of between 4 · 10–7 C kg–1 (Hatakeyama1958, 50 km from the vent of Asama–yama volcano) and 5 · 10–5 C kg–1 (Gilbertet al. 1991, <5 km from the vent of Sakurajima volcano). Substantial PG anomalieshave also been measured (Table 2). This section reviews some of the proposedmechanisms by which this charge and charge separation might arise in volcanicplumes. It is possible that these mechanisms may operate in combination. In allcases, for lightning to occur in a plume, the charge generation rate must be signifi-cantly greater than the internal charge dissipation rate.
3.3.1 Charging of ash due to interactions with water
Observations of the phreatic Surtsey eruption in Iceland in 1963 showed thatcomparable electrification was produced in the plume (105–106 elementary chargescm–3, positively charged) during the periods when steam and tephra were beingvigorously co-erupted and when lava flowed into the sea (Anderson et al. 1965).Subsequent laboratory experiments indicated that charge arises as sea salt particles,volatilised by the hot rock, carry positive charge away from contact with the lava(Bjornsson et al. 1967). Pounder (1972) suggested that the pulverisation of the waterduring evaporation caused charge separation, with the magnitude of the chargedepending on factors such as temperature, size of evaporating droplets and con-centration of salt. Buttner et al. (1997) also suggested that liquid water presentduring the fragmentation process greatly enhances the detection of an electricalsignal.
Surv Geophys (2006) 27:387–432 413
123
3.3.2 Charging of ash via fragmentation mechanisms
Not all volcanic plumes generating PG perturbations involve seawater, or arephreatic in nature, such as the ash clouds associated with pyroclastic flows fromUnzen (Miura et al. 1996). Gilbert et al. (1991) measured the charge on ash particlesfrom Sakurajima’s plume in Japan and suggested two mechanisms for the chargingof these particles which did not involve water explicitly: (i) triboelectrical or fric-tional charging (due to contact between materials with different work functions), (ii)fractoemission or fractocharging (whereby electrons, positive and negative ions,neutral atoms and electromagnetic radiation are ejected from fresh crack surfacesresulting in a residual charge). Earlier experiments on mechanism (i) in the volcaniccontext used particles sliding over one another, down metal chutes which generatedspecific charges between 10–8 C kg–1 and 10–9 C kg–1 (Hatakeyama and Uchikawa1952). Although Kikuchi and Endoh (1982) recorded values of up to 10–5 C kg–1,they thought that the process was more analogous to the charging of wind blown ashthan any process that might occur in an explosive eruption plume (summarised inJames et al. 2000). James et al. (2000) carried out experiments in which silicateparticles were generated by fracture during collisions between pumice samples. Theyfound that charge magnitudes generated during fracture-dominated impact experi-ments were significantly greater than those produced during friction-dominatedrotation experiments, with the small silicate particles generated by fracture carryingcharges similar to that measured on volcanic ash-fall (~10–5–10–6 C kg–1). During theexperiments there was evidence of ion release during the fracture process. Frac-toemission was concluded to be the dominant charging mechanism in these exper-iments. If this is the dominant mechanism in eruption plumes then the volcanic gaseswill be charged (i.e., contain ionic space charge). Charge generation will be con-centrated within the upper regions of the conduit and the jet portion of the plume,where the rates of brittle fragmentation, and therefore fractoemission, are greatest.
The experiments of James et al. (2000) yielded further insights into ash chargingduring volcanic eruptions. The net charge observed resulted from a small imbalancebetween the total individual bipolar particle charges, up to several orders of mag-nitude larger than the net charge. Pumice samples from six different deposits wereused in the experiments: Mount St. Helens, USA (rhyolitic glass), Sakurajima, Japan(dacitic), Aira caldera, Japan (dacitic), Soufriere St. Vincent, Lesser Antilles(andesitic), Santorini, Greece (rhyodacitic) and Gorge Farm, Kenya (rhyolite).During the experiments at atmospheric pressure, all the samples consistently pro-duced net negatively charged particles, except for the most silica poor sample fromSoufriere St. Vincent (55 wt% SiO2) which always produced net positively chargedparticles. At lower pressure these results were not as straightforward: Gorge Farmpumice produced net negative ash, and the Aira caldera sample produced differentpolarity ash depending on which clast was used. Relative humidity had only a smalleffect on the net particle charge. Varying the impact of the pumice collisions (0.3–0.7 m s–1) produced an order of magnitude increase in the measured charges onindividual particles but with no detectable change in the overall net charge. Thissuggests that more explosive eruptions might give rise to particles with higherindividual charges, which, if positive and negative charges are effectively separatedmight give rise to larger PG anomalies. However, as the fragmentation or explo-siveness will also affect the ash concentration and size distribution, it may not bepossible to consider these factors in isolation.
414 Surv Geophys (2006) 27:387–432
123
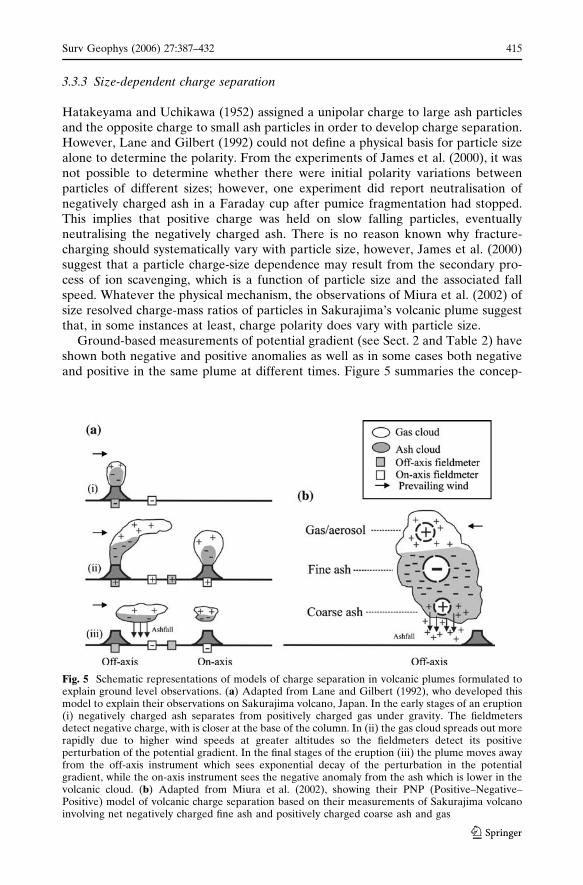
3.3.3 Size-dependent charge separation
Hatakeyama and Uchikawa (1952) assigned a unipolar charge to large ash particlesand the opposite charge to small ash particles in order to develop charge separation.However, Lane and Gilbert (1992) could not define a physical basis for particle sizealone to determine the polarity. From the experiments of James et al. (2000), it wasnot possible to determine whether there were initial polarity variations betweenparticles of different sizes; however, one experiment did report neutralisation ofnegatively charged ash in a Faraday cup after pumice fragmentation had stopped.This implies that positive charge was held on slow falling particles, eventuallyneutralising the negatively charged ash. There is no reason known why fracture-charging should systematically vary with particle size, however, James et al. (2000)suggest that a particle charge-size dependence may result from the secondary pro-cess of ion scavenging, which is a function of particle size and the associated fallspeed. Whatever the physical mechanism, the observations of Miura et al. (2002) ofsize resolved charge-mass ratios of particles in Sakurajima’s volcanic plume suggestthat, in some instances at least, charge polarity does vary with particle size.
Ground-based measurements of potential gradient (see Sect. 2 and Table 2) haveshown both negative and positive anomalies as well as in some cases both negativeand positive in the same plume at different times. Figure 5 summaries the concep-
Fig. 5 Schematic representations of models of charge separation in volcanic plumes formulated toexplain ground level observations. (a) Adapted from Lane and Gilbert (1992), who developed thismodel to explain their observations on Sakurajima volcano, Japan. In the early stages of an eruption(i) negatively charged ash separates from positively charged gas under gravity. The fieldmetersdetect negative charge, with is closer at the base of the column. In (ii) the gas cloud spreads out morerapidly due to higher wind speeds at greater altitudes so the fieldmeters detect its positiveperturbation of the potential gradient. In the final stages of the eruption (iii) the plume moves awayfrom the off-axis instrument which sees exponential decay of the perturbation in the potentialgradient, while the on-axis instrument sees the negative anomaly from the ash which is lower in thevolcanic cloud. (b) Adapted from Miura et al. (2002), showing their PNP (Positive–Negative–Positive) model of volcanic charge separation based on their measurements of Sakurajima volcanoinvolving net negatively charged fine ash and positively charged coarse ash and gas
Surv Geophys (2006) 27:387–432 415
123

tual models that have been developed to explain these observations. Figure 5a showsthe model described in Lane and Gilbert (1992) where the ash takes a negativecharge and the gas takes a positive charge and charge separation occurs due to morerapid gravitational settling of the ash. The polarity of the electric field determined byfieldmeters depends on their geometry with respect to the plume. Miura et al. (2002)suggested a slightly different model (the ‘‘PNP model’’), from observations atSakurajima showing that only the fine ash carried a net negative charge (Fig. 5b).They noted that positive field perturbations tended to occur when the wind velocitywas less than 6 m s–1, and that negative field perturbations dominated when the windvelocity was greater than 6 m s–1. Miura et al. (2002) suggested gravitational dif-ferentiation to explain these results. In short, for a low wind velocity, the fine ashwould probably have settled before the plume reached the measurement site, leavinga positive perturbation observed from the gas/aerosol plume. At high wind velocity,the fine ash would be more likely to pass over the measurement sites, giving anegative perturbation. In general, the PNP model predicts positive anomalies eithernear or far from the vent.
3.3.4 Thunderstorm analogy mechanism
Mechanisms for the electrification of normal thunderstorm clouds have been de-scribed in Sect. 1.2.1. Based on these models, Williams and McNutt (2004) havesuggested that, as condensed water may coat volcanic ash as liquid water and ice,similar mechanisms could operate in volcanic clouds to cause electrification andlightning. Ice is found in some mature eruption clouds, which supports the possibilityof this mechanism at least in some circumstances (Rose et al. 2003).
3.3.5 Timescales
From consideration of ion sources and losses (Harrison and Carslaw 2003), thetimescale s for the aerosol charge to reach steady-state charge is given by
s ¼ 1
bZð7Þ
where Z is the aerosol number concentration and b is the (radius-dependent) ion–aerosol attachment coefficient (see Sect. 3.1.2). For b ~ 10–11 m3 s–1 (radius 0.1 lm)and Z ~ 1000 · 106 m–3 (a plausible upper limit for the near-vent particle concen-tration given the measurements in Rose et al. 2006), s is ~100 s.
In Table 2, PG anomalies are observed at distances from the vent between 0.4 kmand 200 km. This suggests that plumes become electrified rapidly upon eruption, andretain this electrification for considerable distances and lengths of time duringtransport downwind. Neutralisation processes arise from the natural electrical con-ductivity of air due to ionisation by cosmogenic rays and radiation from radoisotopes(Sect. 1.3). In a volcanic plume these therefore seem relatively ineffective. This isbecause the high particle concentrations in volcanic plumes effectively remove theions from the plume gases and the entrained background air. This probably results inthe air within the plume having a low conductivity compared to the backgroundatmosphere, and the space charge being present on the particles, rather than as ionsin the gas phase.
416 Surv Geophys (2006) 27:387–432
123

3.4 Physical behaviour of particles within the electrified plume
3.4.1 Electrical effects on aggregation
Aggregation of particles in the atmosphere shifts the aerosol size distribution tolarger particles, and reduces the extremely high ultrafine particle concentrationsproduced by gas-to-particle conversion. Aggregation rates are influenced by particleelectrification, in a similar way to ion–aerosol attachment (Sect. 3.1.2), through anelectrostatic force. For a monodisperse collection of particles (i.e., uniform in shape,size, and composition), the rate of aggregation between particles with like charges islower than that for neutral particles, while the rate is enhanced for particles withunlike charges. The effect of a charge distribution on particles frequently leads tomore complicated aggregation behaviour (Clement et al. 1995), as the tails of thecharge distribution also contribute to the changes in aggregation asymmetrically,favouring enhancement of the coagulation rate. In atmospheric regions of unipolarions, where multiple aerosol charges occur, this effect would slow the production oflarger aerosol particles from smaller particles. The aggregation rate is not influencedby the atmospheric ion production rate, which varies with height, since this does notaffect the charge distribution on the particles, at least in steady state. An additionalcaveat, however, is that Dhanorkar and Kamra (1997) show that aggregation ofaerosols itself affects charge distribution, shifting it away from a Boltzmann distri-bution. The mean charge increases, while the number of particles with zero netcharge decreases. The greatest effect is an increase in the number of singly chargedparticles.
In volcanic plumes, aggregation of particles has important implications for thefallout of fine-grained materials, accounting for the proximal deposition of fine ashand the non-monodisperse size distributions typical of many fall deposits. Electro-static forces may play a role in promoting particle aggregation in volcanic plumesleading to the formation of dry aggregates. These aggregates tend to break up onimpact with the ground and so are not preserved in the geological record (Sparkset al. 1997). Gilbert et al. (1991) observed that much of the fine ash in Sakurajima’splume fell as porous aggregates <3 mm in diameter. Particles >200 lm in diametermainly fell as single particles, although they might have been coated with fine ash.
James et al. (2002) performed laboratory experiments fracturing pumice from the18 May 1980 Mount St. Helens fall deposit to demonstrate that electrostatic forcesand differences in fall velocities could indeed lead to efficient dry aggregation of ashover fall distances of ~1 m. They found that the aggregates formed tended to be<800 lm in size and irregular in shape, and to have densities of ~100–200 kg m–3. Inexperiments with a horizontal airflow the experiments reproduced the bimodalparticle size distributions observed in field deposits, with the particle size distributionsuggesting that the aggregates are dominated by particles <70 lm in diameter.Further experiments (James et al. 2003) demonstrated that, despite their irregularshapes, dry volcanic aggregates can be represented as spheres with a density of~200 kg m–3. Size analysis of the component particles making up the aggregatesshowed exponential-type cumulative distributions. This suggests that particles<10 lm in diameter have a high and uniform probability of being incorporated intoaggregates. Images of deposited aggregates indicated that those smaller than~140 lm are likely to be produced extremely rapidly and that larger aggregates growdominantly by the accumulation of these smaller aggregates. They are also capable
Surv Geophys (2006) 27:387–432 417
123

of incorporating significantly larger particles, possibly as the fall velocity of theaggregate increases.
3.4.2 Washout of electrified particles
The removal of aerosol particles by cloud droplets, scavenging, is influenced bymany factors, including electrical forces (Pruppacher and Klett 1997). An increasein aerosol scavenging is therefore expected in clouds containing charged particles,including radioactive aerosol (Tripathi and Harrison 2001), or naturally chargedaerosol (Tripathi and Harrison 2002) such as from volcanic plumes. Recentdevelopments in this area are microphysical simulations of aerosol collection,which include the electrostatic image force in calculation of the electrically mod-ified particle trajectory of an aerosol around a water droplet (Tinsley et al. 2000).These trajectory calculations show that the image force is always attractive at smalldroplet-particle separations, and therefore that the effect of the plume polarity islikely to be unimportant. Rainfall through a volcanic plume may therefore beexpected to preferentially remove the charged particles over neutral particles, butthis has yet to be tested. Tripathi et al. (2006) provide a simple method forcalculations of the enhanced collection efficiency of charged particles by waterdrops.
3.5 Volcanic aerosol in global atmospheric electricity
Volcanic plume electrification leads to lightning and perturbations in atmosphericelectricity close to the eruption, but as previous climatic studies have shown (e.g.,Robock 2000), the effect of volcanic products injected into the stratosphere, mayhave wider consequences. In terms of the atmospheric electrical effects, due to thetransport timescales, and the substantial increase in air conductivity with height, theaerosol electrification associated with the eruption is unlikely to persist into thestratosphere. However, the increased aerosol loading in the stratosphere following alarge volcanic eruption (e.g., Hofmann et al. 2003) might lead to a perturbation inthe global atmospheric electrical circuit. The current flowing from the ionosphere tothe surface is determined from Ohm’s Law, by the potential of the ionosphere andthe resistance of the atmospheric column beneath. If the column’s aerosol loading isincreased by the injection of volcanic aerosol, depletion of the ion concentration byion–aerosol attachment (Sect. 3.1.2) will follow and the column’s electrical resistancewill increase. This will have the effect of reducing the current flowing between theionosphere and the surface. As volcanic aerosol can become globally distributedwithin the stratosphere, the currents flowing in the global circuit can be modified. Aglobal electrical change can therefore result from a substantial eruption, if thestratospheric aerosol loading is significantly increased.
Although the global circuit ideas were not established until the early 20th century(Harrison 2004a), there is evidence that an effect at a distance was sought followingthe eruption of Krakatoa. An account of the contemporary UK atmospheric elec-tricity measurements was given by G. M. Whipple (Symons 1888):
‘The information to hand as to atmospheric electricity is confined to theabstracts from communications to ‘Nature’ by Professor Michie Smith ofMadras, who gives certain isolated observations, but without sufficient data as
418 Surv Geophys (2006) 27:387–432
123

to the conditions of atmospheric electricity at his station on other dates and atordinary times to enable us to judge whether the phenomena he observed wereexceptional or not.Looking at the rapid and frequent variations of atmospheric electricity, asconstantly recorded at Kew, Greenwich, and other observatories provided withcontinuously recording electrographs, we are of opinion that the material istotally unreliable for the purpose of deciding as to the influence or otherwise ofthe explosion in producing the effects attributed to it by Professor MichieSmith.Neither at Kew nor at Greenwich were the electrical phenomena on August27th, or subsequent dates, such as to call for special remark.’
Quantitatively, the effect of stratospheric aerosol on the global circuit can be foundin terms of the change in columnar resistance, the resistance of a unit column ofatmosphere from the surface to the ionosphere. For a unit area column, the totalsurface-ionosphere resistance, the columnar resistance Rc is typically 100–300 PW m2. It varies because of the geomagnetic modulation of cosmic ray ionisa-tion, and the variable amount of aerosol in the boundary layer. Figure 6 shows theeffect on the profile of the columnar resistance Rc of stratospheric layer having anenhanced aerosol concentration, calculated as described in Harrison (2005b). Theobserved background aerosol concentration in the ‘clean’ stratosphere is ~1 cm–3
(Pruppacher and Klett 1997), and the volcanic perturbations from this chosen for theillustrative calculations (10, 100 and 1000 particles cm–3) are broadly consistent withthe measurements detailed in Hofmann et al. (2003). Cosmic ray ion production rateis large in the stratosphere, and the loss rate to aerosol is small. Consequently theeffect of aerosol is, proportionally, large. The total Rc increases by up to 20% (the1000 cm–3 case), which, for a constant current flowing vertically, would increase theionospheric potential.
There is evidence for such a volcanic effect in atmospheric data. Measurements ofthe ionospheric potential were obtained by Muhleisen and Fischer (Muhleisen 1977),using balloon soundings of the electric field profile, from Weissenau, Germany.Because of the considerable conductivity from cosmic ray ionisation in the uppertroposphere and stratosphere, the upper balloon measurements are at a potentialclose to the ionospheric potential, VI. Figure 7 shows the Weissenau time series of VI
(Budyko 1971). Meyerott et al. (1983) compared the VI data with cosmic ray andvolcanic aerosol data over the period 1959–1976 and suggested that changes in theionospheric potential correlated convincingly with changes in volcanic aerosols inthe troposphere and stratosphere, associated with the southern hemisphere eruptionof Mt Agung in 1963. Tinsley (2005) has argued that the measured effect may havebeen enhanced by the sounding height used, which sampled only within the tropo-sphere. It should also be noted that substantial nuclear weapon testing occurred inthe late 1950s and 1960s, which would have produced radioactive aerosol, andaffected atmospheric electrical parameters (Harrison 2004a). However the atmo-spheric weapons tests ceased in 1962, therefore the later increase in VI is morereadily attributed to volcanic stratospheric aerosol.
Such a perturbation on the global atmospheric electrical circuit could potentiallyprovide a further, but indirect, route by which volcanic eruptions influence climate(beyond the radiative effects of stratospheric aerosol), through electrically inducedchanges in cloud properties (see Sect. 1.3).
Surv Geophys (2006) 27:387–432 419
123
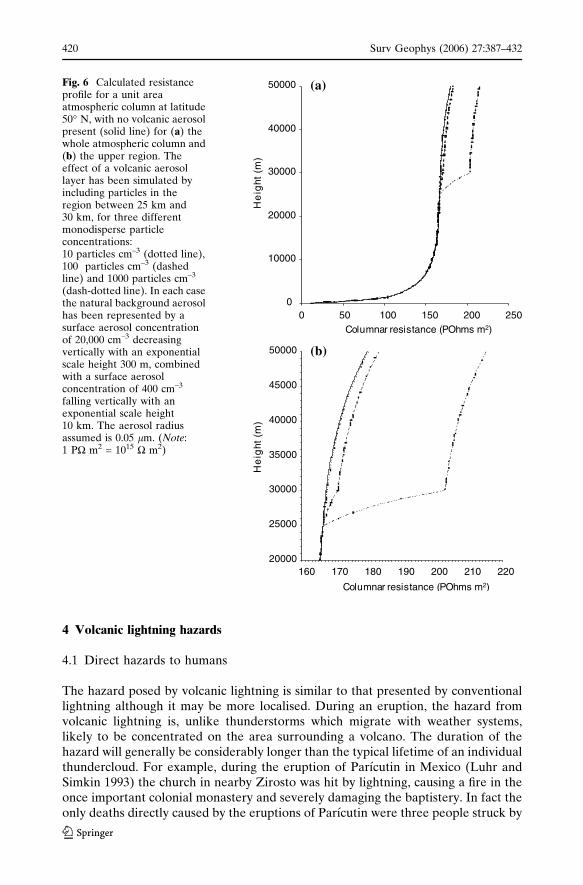
4 Volcanic lightning hazards
4.1 Direct hazards to humans
The hazard posed by volcanic lightning is similar to that presented by conventionallightning although it may be more localised. During an eruption, the hazard fromvolcanic lightning is, unlike thunderstorms which migrate with weather systems,likely to be concentrated on the area surrounding a volcano. The duration of thehazard will generally be considerably longer than the typical lifetime of an individualthundercloud. For example, during the eruption of Parıcutin in Mexico (Luhr andSimkin 1993) the church in nearby Zirosto was hit by lightning, causing a fire in theonce important colonial monastery and severely damaging the baptistery. In fact theonly deaths directly caused by the eruptions of Parıcutin were three people struck by
0
10000
20000
30000
40000
50000
2500 50 100 150 200Columnar resistance (POhms m2)
Columnar resistance (POhms m2)
He
ight
(m
)H
eig
ht (
m)
20000
25000
30000
35000
40000
45000
50000
220210200190180170160
(a)
(b)
Fig. 6 Calculated resistanceprofile for a unit areaatmospheric column at latitude50� N, with no volcanic aerosolpresent (solid line) for (a) thewhole atmospheric column and(b) the upper region. Theeffect of a volcanic aerosollayer has been simulated byincluding particles in theregion between 25 km and30 km, for three differentmonodisperse particleconcentrations:10 particles cm–3 (dotted line),100 particles cm–3 (dashedline) and 1000 particles cm–3
(dash-dotted line). In each casethe natural background aerosolhas been represented by asurface aerosol concentrationof 20,000 cm–3 decreasingvertically with an exponentialscale height 300 m, combinedwith a surface aerosolconcentration of 400 cm–3
falling vertically with anexponential scale height10 km. The aerosol radiusassumed is 0.05 lm. (Note:1 PW m2 = 1015 W m2)
420 Surv Geophys (2006) 27:387–432
123
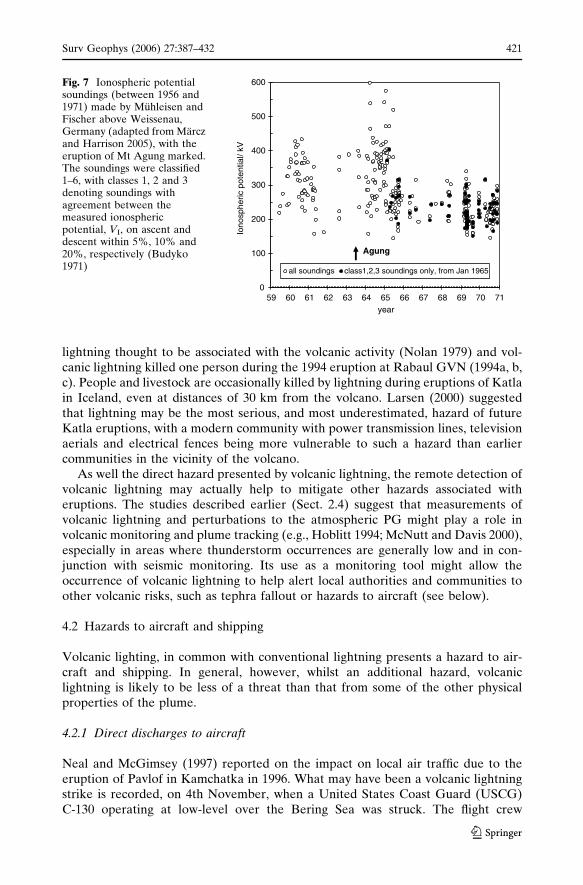
lightning thought to be associated with the volcanic activity (Nolan 1979) and vol-canic lightning killed one person during the 1994 eruption at Rabaul GVN (1994a, b,c). People and livestock are occasionally killed by lightning during eruptions of Katlain Iceland, even at distances of 30 km from the volcano. Larsen (2000) suggestedthat lightning may be the most serious, and most underestimated, hazard of futureKatla eruptions, with a modern community with power transmission lines, televisionaerials and electrical fences being more vulnerable to such a hazard than earliercommunities in the vicinity of the volcano.
As well the direct hazard presented by volcanic lightning, the remote detection ofvolcanic lightning may actually help to mitigate other hazards associated witheruptions. The studies described earlier (Sect. 2.4) suggest that measurements ofvolcanic lightning and perturbations to the atmospheric PG might play a role involcanic monitoring and plume tracking (e.g., Hoblitt 1994; McNutt and Davis 2000),especially in areas where thunderstorm occurrences are generally low and in con-junction with seismic monitoring. Its use as a monitoring tool might allow theoccurrence of volcanic lightning to help alert local authorities and communities toother volcanic risks, such as tephra fallout or hazards to aircraft (see below).
4.2 Hazards to aircraft and shipping
Volcanic lighting, in common with conventional lightning presents a hazard to air-craft and shipping. In general, however, whilst an additional hazard, volcaniclightning is likely to be less of a threat than that from some of the other physicalproperties of the plume.
4.2.1 Direct discharges to aircraft
Neal and McGimsey (1997) reported on the impact on local air traffic due to theeruption of Pavlof in Kamchatka in 1996. What may have been a volcanic lightningstrike is recorded, on 4th November, when a United States Coast Guard (USCG)C-130 operating at low-level over the Bering Sea was struck. The flight crew
0
100
200
300
400
500
600
59 60 61 62 63 64 65 66 67 68 69 70 71year
Iono
sphe
ric p
oten
tial/
kV
all soundings class1,2,3 soundings only, from Jan 1965
Agung
Fig. 7 Ionospheric potentialsoundings (between 1956 and1971) made by Muhleisen andFischer above Weissenau,Germany (adapted from Marczand Harrison 2005), with theeruption of Mt Agung marked.The soundings were classified1–6, with classes 1, 2 and 3denoting soundings withagreement between themeasured ionosphericpotential, VI, on ascent anddescent within 5%, 10% and20%, respectively (Budyko1971)
Surv Geophys (2006) 27:387–432 421
123
reported a ‘‘smoky’’ smell in the cockpit and a fine dust throughout the plane.Subsequent investigations failed to positively identify the source of this material.However, based on forecast winds, it appears unlikely that primary ejecta fromPavlof could have been the culprit; rather that low-level winds remobilised fine ashfrom the ground. No sample of the material was recovered for analysis.
Civilian aircraft are struck by lightning on average about once per year, fre-quently on approach to airports as they descend (Anon 1984). Aircraft are rigorouslytested to ensure their resilience to lightning discharges, both as a result of the largecurrents that may flow in their structure, and the associated damage to controlsystems. In some cases the aircraft itself may trigger an intra-cloud lightning strikeduring the descent or ascent away from an airport, however the specific hazard fromvolcanic lightning is likely to be small, as (1) aircraft will be routed around zonesaffected by volcanic plumes because of the risk to their engines from dust and (2)there is no strong evidence that volcanic lightning leads to greater currents flowingthan lightning produced by thunderstorms (Table 3).
Volcanic lightning detection may have benefits to aircraft as sensing of volcanicplume PG perturbations and remote lightning detection may provide information toreduce the likelihood of aircraft flying through plumes unwittingly. This would re-duce the risk of damage from more direct hazards, such as hot volcanic ash enteringthe engines.
4.2.2 St Elmo’s fire
St Elmo’s fire is the visible blue glow that surrounds conducting points exposed tohigh electrical potentials in the atmosphere. The electric field strength around thepoint, enhanced by its geometry, is sufficient to break down the air electrically,although it is localised. St Elmo’s fire was reported from eruptions of the Katlavolcanic system in Iceland (Larsen 2000).
St Elmo’s fire associated with volcanic eruptions has been observed on boardships. During the paroxysmal stage of the 1883 eruption of Krakatoa in Indonesia(Symons 1888) Captain Watson on the Charles Bal recorded:
‘peculiar pinky flame coming from clouds which seemed to touch the mast-heads and yard-arms.’
While there is no significant hazard from St Elmo’s fire, its occurrence can causeconsiderable alarm. On the Governeur Generaal Loudon during the Krakatoaeruption:
‘the mud-rain which covered the masts, rigging, and decks, was phosphores-cent, and on the rigging presented the appearance of St. Elmo’s fire. Thenatives engaged themselves busily in putting this phosphorescent light out withtheir hands, and were so intent on this occupation that the stokers left theengine-rooms for the purpose, so that the European engineers were left todrive the machinery for themselves. The natives pleaded that if this phos-phorescent light, or any portion of it, found its way below, a hole would burst inthe ship; not that they feared the taking fire, but they thought the light was thework of evil spirits, and that if the ill-omened light found its way below, the evilspirits would triumph in their design to scuttle the ship.’
422 Surv Geophys (2006) 27:387–432
123
For aircraft also, St Elmo’s fire itself presents no substantial hazard to aircraftstructures, although it may indicate electrification of extremities, e.g., communica-tion antennae and airspeed sensors, which may lead to system failures.
4.2.3 Planetary exploration
Section 2.5 explored the possibility of volcanic lighting on other planets in the solarsystem. Should such lightning prove common on a particular planetary body thenprobes designed to descend to its surface would need to be built to withstand strikes.Here again though the hazard to the probe from volcanic debris in the plume mightbe more immediate than that from the volcanic lightning. In fact, it is conceivablethat detection of volcanic lightning (or at least geographically localised and recurrentlightning) prior to a descent into a planetary atmosphere might provide a basis forselecting probe descent trajectories that avoid the complication of volcanic plumeencounters.
5 Summary
Evidence for lightning on the Earth extends back into the geological past, which,together with evidence for volcanic activity, indicates that the conditions for volcaniclightning are not a new phenomenon in geological terms. Volcanic lightning alsopresents an alternative source of electrical activity in the atmosphere at times whenmeteorological convective processes were absent. The high temperatures in thelightning channel allow the production of chemical species unstable at ambient con-ditions. Hence, lightning has been implicated in the origin of life and the generation ofvolcanic lightning in the primordial atmosphere may have enhanced the likelihood oflife especially given the unusual chemistry of volcanic plumes compared to the rest ofthe atmosphere. Volcanic lightning may also exist in other planetary atmospheres.
Remote sensing measurement techniques have been used to monitor volcaniclightning but surface observations of the PG and the charge carried on volcanic ashshow that many volcanic plumes, whilst not sufficiently electrified to producelightning, have detectable electrification exceeding that of their surrounding envi-ronment. Observations and laboratory experiments suggest that the presence of ashin a volcanic plume may be a prerequisite for plume electrification or it could be thatit is only ash producing eruptions that are explosive enough to generate charge. Thecomposition of the ash does not seem to be critical in determining whether chargingwill occur but it may alter the details of the concentration or the polarity of thecharge that accumulates. It could however be the fragmentation mechanism that isthe dominant determinant. Due to the interrelated nature of these different factorstheir effects are currently difficult to disentangle.
Different conceptual theories for charge generation and separation in volcanicplumes have been developed to explain the disparate observations obtained. It is notclear which mechanisms or combinations of mechanisms dominate in different cir-cumstances. In situ measurements of the vertical PG profile and charge carried bythe particles, for example, from radiosonde experiments in combination withquantitative and numerical models might be expected to illuminate these processes.Different processes may be important at different distances from the vent and underdifferent volcanological and meteorological conditions.
Surv Geophys (2006) 27:387–432 423
123
Field observations and laboratory experiments have shown that electrostaticforces play an important role in modulating the dry deposition (fallout) of ash from avolcanic plume. Comparison with electrified aerosol in other atmospheric contextssuggests that electrostatic forces might also play a role in water mediated aggrega-tion or deposition of volcanic ash, although this has yet to be confirmed by anylaboratory or field experiments.
Calculations presented here and previous measurements of the ionosphericpotential suggest that a large volcanic eruption, which substantially increased theaerosol loading of the stratosphere, could have an effect on global atmosphericelectricity by increasing the atmospheric columnar resistance. It is possible that thismight be another, if minor compared to the radiative forcing, mechanism by whichlarge volcanic eruptions affect global climate.
The direct hazard of volcanic lightning to communities is generally low comparedto other aspects of volcanic activity such as pyroclastic flows, lahars and ash-fall. Infact, volcanic lightning can provide evidence of an electrified volcanic plume and canbe detected using lightning detection systems available to meteorological services.The ability to detect explosive volcanic plumes is therefore a new application of suchsystems, which can be used for hazard mitigation. It may also provide remote evi-dence of volcanic activity in planetary exploration.
Acknowledgements TAM gratefully acknowledges the financial support of the Royal Society.RGH acknowledges a Visiting Fellowship at Mansfield College, University of Oxford. A. J. Bennett(Reading University) provided assistance with data for figures. The authors thank J. S. Gilbert(Lancaster University) for her helpful comments.
References
Abe K (1979) Seismicity of the caldera-making eruption of Mount Katmai, Alaska in 1912. BullSeismol Soc Am 82:175–191
Adachi M (1985) Unipolar and bipolar diffusion charging of ultrafine aerosol particles. J Aerosol Sci16:109–123
Alcaraz AP (1989) Some notes on false alarms of volcanic activity and mud flows. In: Latter JH (ed)Volcanic hazards: assessment and monitoring, IAVCEI Proceedings in Volcanology, vol 1.Springer, Berlin, pp 163–168
Anderson R, Bjornsson S, Blanchard D, Gathman S, Hughes J, Jonasson S, Moore CB, Survilas HJ,Vonnegut B (1965) Electricity in volcanic clouds. Science 148:1179–1189
Anderson T, Flett JS (1903) Report on the eruptions of the Soufriere in St. Vincent, and on a visit toMontagne Pelee in Martinique. Philos Trans Roy Soc London, A 200:353–553
Anon (1984) Atmospheric electricity hazards: threat environment definition. Air Force WrightAeronautical Laboratories, Dayton, Ohio
Aplin KL (2006) Atmospheric electrification in the Solar System, Surv Geophys 27:63–108, doi:10.1007/s10712-005-0642-9
Arason P (2005a) Volcanogenic lightning during the Grımsvotn 2004 subglacial eruption. GeophysRes Abstracts 7:05355
Arason P (2005b) Lightning during volcanic eruptions in Iceland. Geophys Res Abstracts 7:05369AVO (Alaska Volcano Observatory) Bimonthly Report (1996) Double Issue, September–December
1996, Alaska Volcano Observatory, Fairbanks, Alaska, vol 8 (5 and 6), 56Basiuk VA, Navarro-Gonzalez R (1996) Possible role of volcanic ash-gas clouds in the Earth’s
prebiotic chemistry. Origins Life Evol B 26:173–194Baxter PJ, Bonadonna C, Dupree R, Hards VL, Kohn SC, Murphy MD, Nichols A, Nicholson RA,
Norton G, Searl A, Sparks RSJ, Vickers BP (1999) Cristobalite in volcanic ash of the SoufriereHills volcano, Montserrat, British West Indies. Science 283:1142–1145
424 Surv Geophys (2006) 27:387–432
123
Benediktsson P (1996) Eruption at the ice cap: volcanic unrest at Vatnajokull 1996’ (video). Sjonvarpid, Reykjavik Iceland
Bjornsson S, Blanchard DC, Spencer AT (1967) Charge generation due to contact of saline waterswith Molten Lava. J Geophys Res 72:1311–1323
Blong RJ (1984) Volcanic hazards: a sourcebook on the effects of eruptions. Academic Press, SydneyBennett AJ, Harrison RG (2006) Absolute calibration of atmospheric air conductivity measure-
ments. Rev Sci Instrum 77:016103Boisdron Y, Brock JR (1970) On the stochastic nature of the acquisition of electrical charge and
radioactivity by aerosol particles. Atmos Environ 4:35Bonadonna C, Houghton BF (2005) Total grain-size distribution and volume of tephra-fall deposits.
Bull Volcanol 64:441–456Bonadonna C, Mayberry GC, Calder ES, Sparks RSJ, Choux C, Jackson P, Lejeune AM, Loughlin
SC, Norton GE, Rose WI, Ryan G, Young SR (2002) Tephra fallout in the eruption ofSoufriere Hills Volcano, Montserrat. In: Druitt TH and Kokelaar BP (eds) The eruption ofSoufriere Hills Volcano, Montserrat, from 1995 to 1998, Geological Society of LondonMemoirs vol 21, pp 483–516
Boynton WV, Feldman WC, Squyres SW, Prettyman TH, Bruckner J, Evans LG, Reedy RC, StarrR, Arnold JR, Drake DM, Englert PAJ, Metzger AE, Mitrofanov I, Trombka JI, d’Uston C,Wanke H, Gasnault O, Hamara DK, Janes DM, Marcialis RL, Maurice S, Mikheeva I, TaylorGJ, Tokar R, Shinohara C (2002) Distribution of hydrogen in the near surface of Mars: evidencefor subsurface ice deposits. Science 297:81–85
Bricard J (1965) Action of radioactivity and of pollution upon parameters of atmospheric electricity.In: Coroniti SC (ed) Problems of atmospheric and space electricity, Elsevier
Brook M, Moore CB, Sigurgeirsson T (1973) Lightning in volcanic clouds. Eos Trans Am GeophysUnion 54:701
Brown RC (1991) Theory of interaction between aerosol particles and an ionized gas in the low-concentration limit. J Aerosol Sci 22:313–325
Brown RH, Kirk RL (1994) Coupling of volatile transport and internal heat flow on Triton. JGeophys Res 99:1965–1981
Budyko MI (1971) Results of observations of atmospheric electricity, in The World Network,Additional Issue 1965–1969, USSR Chief Administration of the Hydro-Meteorological Service,Leningrad, pp 51–58
Buttner R, Roder H, Zimanowski B (1997) Electrical effects generated by experimental volcanicexplosions. Appl Phys Lett 70:1903–1905
BVE (Bulletin of Volcanic Eruptions) (1989) Volcanological Society of Japan, Tokyo, JapanCanil D (1997) Vanadium partitioning and the oxidation state of Archaean komatiite magmas.
Nature 389:842–845Carslaw KS, Harrison RG, Kirkby J (2002) Cosmic rays, clouds and climate. Science 298:1732–
1737Carroll JJ, Parco SA (1966) Social organization in a crisis situation: the Taal disaster. Philippine
Sociological Society, ManilaCataldo E, Wilson L, Lane S, Gilbert J (2002) A model for large-scale volcanic plumes on Io:
implications for eruption rates and interactions between magmas and near-surface volatiles. JGeophys Res 107:5109, doi:10.1029/2001JE001513
Chalmers JA (1967) Atmospheric electricity 2nd ed. Pergamon Press, New YorkChristian HJ (1999) Optical detection of lightning from space. Proceedings of the 11th International
Conference on Atmospheric Electricity, Guntersville, Alabama, June 7–11, pp 715–718Chubb JN (1990) Two new designs of ‘‘Field Mill’’ type fieldmeters not requiring earthing of rotating
chopper. IEE Trans Indus Appl 26:1178–1181Clement CF, Harrison RG (1992) The charging of radioactive aerosols. J Aerosol Sci 23:481–504Clement CF, Clement RA, Harrison RG (1995) Charge distributions and coagulation of radioactive
aerosols. J Aerosol Sci 26:1207–1225Cobb WE (1980) Electric fields and lightning in the Mt. St. Helens volcanic cloud. Eos Trans Am
Geophys Union 61:987Crozier WD (1963) Measuring Atmospheric Potential with Passive Antennas. J Geophys Res
68:5173–5179Davis CM, McNutt SR (1993) Lightning associated with the 1992 eruptions of Mt. Spurr volcano,
Alaska. Eos Trans Am Geophys Union 74:649Dhanorkar S, Kamra AK (1997) Calculation of electrical conductivity from ion–aerosol balance
equations. J Geophys Res 102:30147–30159
Surv Geophys (2006) 27:387–432 425
123
De Graaf RM, Schwartz AW (2000) Reduction and activation of phosphate on the primitive Earth.Origins Life Evol B 30:405–410
Delmelle P, Stix J (2000) Volcanic gases. In: Sigurdsson H, Houghton B, McNutt S, Rymer H, Stix J(eds) Encyclopedia of volcanoes. Academic Press, pp 803–815
Eichkorn S, Wilhelm S, Aufmhoff H, Wohlfrom KH, Arnold F (2002) Cosmic ray-induced aerosol-formation: first observational evidence from aircraft-based ion mass spectrometer measurementsin the upper troposphere. Geophys Res Lett 29:1698
Esposito LW (1984) Sulfur dioxide: episodic injection shows evidence for active Venus volcanism.Science 233:1072–1074
Fedotov SA, Masurenkov Yu P (1991) Active volcanoes of Kamchatka. Nauka, MoscowFisher RV, Heiken G, Hulen JB (1997) Volcanoes: crucibles of change. Princeton University Press,
Princeton, NJForshag WF, Gonzalez-Reyna JR (1956) Birth and development of Parıcutin volcano, Mexico. In:
U.S. Geological Survey Bulletin 965D:355–489Fouque FA (1879) Santorini and its eruptions, translated by A.R. McBirney in 1998, The Johns
University Press, LondonFrancis P (1976) Volcanoes. Penguin, New YorkFrancis P (1993) Volcanoes a planetary perspective. OUP, OxfordFrancis P, Oppeneheimer C (2004) Volcanoes. OUP, OxfordFrench BM (1970) Possible relations between meteorite impact and igneous petrogenesis, as indi-
cated by the Sudbury structure, Ontario Canada. Bull Volcanol 34:466–517Fries C Jr, Gutierrez C (1950) Activity of Parıcutin volcano from July 1 to December 31, 1949. Trans
Am Geophys Union 31:732–740Fuchs NA (1963) On the stationary charge distribution on aerosol particles in a bipolar ionic
atmosphere. Geofis Pura App 56:185Gilbert JS, Lane SJ, Sparks RSJ, Koyaguchi T (1991) Charge measurements on particle fallout from
a volcanic plume. Nature 349:598–600Glindemann D, De Graaf RM, Schwartz AW (1999) Chemical reduction of phosphate on the
primitive Earth. Origins Life Evol B 29:555–561Goldsmith O (1852) A history of the earth and animated nature, vol 1. Blackie, GlasgowGorshkov GS (1959) Gigantic eruption of the volcano Bezymianny. Bull Volcanol 20:77–109Gorshkov GS, Dubik YM (1970) Gigantic directed blast at Shiveluch volcano (Kamchatka). Bull
Volcanol 34:261–288Gourgaud A, Camus G, Gerbe MC, Morel JM, Sudradjat A, Vincent PM (1989) The 1982–83
eruption of Galunggung (Indonesia): a case study of volcanic hazards with particular relevanceto air navigation. In: Latter JH (ed) Volcanic hazards: assessment and monitoring, IAVCEIProceedings in Volcanology, vol 1. Springer, Berlin, pp 151–162
Greeley R, Spudis PD (1981) Volcanism on Mars. Rev Geophys 19:13–41Green JA (1944) Paricutin, the cornfield that grew a volcano. Nat Geog Mag, 85Gutierrez C (1972) A narrative of human response to natural disaster: the eruption of Paricutin. In:
Nolan ML (eds) San Juan Nuevo Parangaricutiro: memories of past years, environmentalQuality Note No. 07, College Station, Texas A & M University, 78
Gunn R (1954) Diffusion charging of atmospheric droplets by ions, and the resulting combinationcoefficients. J Meteor 11:339–347
Gunn R (1955) The statistical electrification of aerosols by ionic diffusion. J Coll Sci 10:107–119Gurnett DA, Kurth WS, Roux A, Gendrin R, Kennel CF, Bolton SJ (1991) Lightning and plasma
wave observations from the Galileo flyby of Venus. Science 253:1522–1525GVN Bulletin (1982) Manam, vol 7(3), Smithsonian Institution, Washington, DCGVN Bulletin (1986) Chikurachki, vol 11(11), Smithsonian Institution, Washington, DCGVN Bulletin (1987) Manam, vol 12(6), Smithsonian Institution, Washington, DCGVN Bulletin (1991) Cerro Hudson, vol 16(7), Smithsonian Institution, Washington, DCGVN Bulletin (1992) Manam, vol 17(5), Smithsonian Institution, Washington, DCGVN Bulletin (1993) Galeras, vol 18(3), Smithsonian Institution, Washington, DCGVN Bulletin (1994a) Rabaul, vol 19(8), Smithsonian Institution, Washington, DCGVN Bulletin (1994b) Rabaul, vol 19(9), Smithsonian Institution, Washington, DCGVN Bulletin (1994c) Rabaul, vol 19(10), Smithsonian Institution, Washington, DCGVN Bulletin (1995a) Rabaul, vol 20(2), Smithsonian Institution, Washington, DCGVN Bulletin (1995b) Rabaul, vol 20(4), Smithsonian Institution, Washington, DCGVN Bulletin (1995c) Ruapehu, vol 20(10), Smithsonian Institution, Washington, DCGVN Bulletin (1995d) Rabaul, vol 20(12), Smithsonian Institution, Washington, DC
426 Surv Geophys (2006) 27:387–432
123
GVN Bulletin (1996) Rabaul, vol 21(5), Smithsonian Institution, Washington, DCGVN Bulletin (1997) Rabaul, vol 22(5), Smithsonian Institution, Washington, DCGVN Bulletin (1998) Rabaul, vol 23(11), Smithsonian Institution, Washington, DCHamer GL (1996) Structure and methods of locating the lightning discharge, MSc dissertation, The
University of Reading, UKHarland WB, Hacker JLF (1966) ‘‘Fossil’’ lightning strikes 250 million years ago. Adv Sci 22:663–671Harrison RG (1997) An antenna electrometer system for atmospheric electrical measurements. Rev
Sci Inst 68:1599–1603Harrison RG (2001) A balloon-carried electrometer for high-resolution atmospheric electric field
measurements in clouds. Rev Sci Instrum 72:2738–2741Harrison RG (2002) A wide-range electrometer voltmeter for atmospheric measurements in thun-
derstorms and disturbed meteorological conditions. Rev Sci Instrum 73:482–483Harrison RG (2004a) The global atmospheric electrical circuit and climate. Surv Geophys 25:441–
484Harrison RG (2004b) Atmospheric turbulence and surface atmospheric electricity observations. Inst
Phys Conf Ser 178:337–342Harrison RG (2005a) Inexpensive multichannel digital data acquisition system for a meteorological
radiosonde. Rev Sci Instrum 76:026103 doi:10.1063/1.1841971Harrison RG (2005b) Columnar resistance changes in urban air. J Atmos Solar-Terrestrial Phys
67:763–773Harrison RG (2006) Urban smoke concentrations at Kew, London, 1898–2004. Atmos Environ
40:3327–3332Harrison RG, Aplin KL (2002) Mid-nineteenth century diurnal smoke concentrations at Kew,
London. Atmos Environ 36:4037–4043Harrison RG, Aplin KL (2003) Atmospheric Electricity. In: MacCracken MC, Perry JS (eds)
Encyclopedia of global environmental change, vol 1. The earth system-physical and chemicaldimensions of global environmental change. Wiley
Harrison RG, Carslaw KS (2003) Ion–aerosol–cloud processes in the lower atmosphere. RevGeophys 41:1012, 10.1029/2002RG000114
Harrison RG, Stephenson DB (2006) Empirical evidence for a nonlinear effect of galactic cosmicrays on clouds. Proc Roy Soc A 462:1221–1233, doi: 10.1098/rspa.2005.1628
Hatakeyama H (1943) On the variation of the atmospheric potential gradient caused by thecloud of smoke of the volcano Asama. The second report. J Meteor Soc Jpn 21:420–426 (inJapanese)
Hatakeyama H (1949) On the disturbance of the atmospheric potential gradient caused by thesmoke-cloud of the Volcano Yake-yama. J Meteor Soc Jpn 27:372–376 (in Japanese)
Hatakeyama H (1958) On the disturbance of the atmospheric potential gradient caused by thesmoke-cloud of the Volcano Asama-yama. Pap Meteor Geophys 8:302–316
Hatakeyama H, Kubo T (1943a) On the variation of the atmospheric potential gradient caused bythe cloud of smoke of the volcano Asama. The first report. J Meteor Soc Jpn 21:49–52 (inJapanese)
Hatakeyama H, Kubo T (1943b) On the variation of the atmospheric potential gradient caused bythe cloud of smoke of the volcano Asama. The third report. J Meteor Soc Jpn 21:426–428 (inJapanese)
Hatakeyama H, Ishikawa T (1946) On the variation of the atmospheric potential gradient caused bythe cloud of smoke of the volcano Asama. The fourth report. Kisho-gijitsukan-yoseijo-ken-kyuhokoku 1:14–18 (in Japanese)
Hatakeyama H, Uchikawa K (1950) On the disturbance of the atmospheric potential gradient causedby the eruption smoke of the Volcano Aso (in Japanese with English abstract). J Meteor Soc Jpn28:456–462
Hatakeyama H, Uchikawa K (1952) On the disturbance of the atmospheric potential gradient causedby the eruption smoke of the volcano Aso. Pap Meteorol Geophys 2:85–89
Havskov J, De la Cruz-Reyna S, Singh SK, Medina F, Gutierrez C (1983) Seismic activity related tothe March–April, 1982 eruptions of El Chichon volcano, Chiapas, Mexico. Geophys Res Lett10:293–296
Heiken G, Wohletz K (1985) Volcanic ash. University of California Press, BerkeleyHoblitt RP (1994) An experiment to detect and locate lightning associated with eruptions of
Redoubt Volcano. J Volcanol Geotherm Res 62:499–517Hofmann D, Barnes J, Dutton E, Deshler T, Jager H, Keen R, Osborn M (2003) Surface-based
observations of volcanic emissions to the stratosphere. In: Robock A, Oppenheimer C (eds)
Surv Geophys (2006) 27:387–432 427
123
Volcanism and the Earth’s Atmosphere, Geophysical Monograph 139, American GeophysicalUnion, pp 57–73
Hoppel, WA, Frick, GM (1986) Ion–aerosol attachment coefficients and the steady-state chargedistribution on aerosols in a bipolar environment. Aerosol Sci Tech 5:1–21
Horwell CJ, Brana LP, Sparks RSJ, Murphy MD, Hards VL (2001) A geochemical investigation offragmentation and physical fractionation in pycroclastic flows from Soufriere Hills volcano,Montserrat. J Volcanol Geotherm Res109:247–262
Israel H (1970) Atmospheric electricity vol 1(Fundamentals, conductivity, ions) (Problems of cosmicphysics vol 29), Israel Program for Scientific Translations, Jerusalem
Israel H (1973) Atmospheric electricity vol 2 (Fields, charges, currents) (Problems of cosmic physicsvol 29), Israel Program for Scientific Translations, Jerusalem
Jaggar TA (1906) The volcano Vesuvius in 1906. Tech Quart Proc 19:104–115James MR, Lane SJ, Gilbert JS (1998) Volcanic plume monitoring using atmospheric electric
potential gradients. J Geol Soc Lond 155:587–590James MR, Lane SJ, Gilbert JS (2000) Volcanic plume electrification: Experimental investigation of
a fracture-charging mechanism. J Geophys Res 105:16641–16649James MR, Gilbert JS, Lane SJ (2002) Experimental investigation of a volcanic particle aggregation
in the absence of a liquid phase. J Geophys Res 107:2191, doi:10.1029/2001JB000950James MR, Lane SJ, Gilbert JS (2003) Density, construction, and drag coefficient of electrostatic
volcanic ash aggregates. J Geophys Res 108:2435, doi:10.1029/2002JB002011Jayaratne ER, Saunders CPR, Hallett J (1983) Laboratory studies of the charging of soft-hail during
ice crystal interactions. Q J Roy Meteor Soc 109:609–630Johnson RW, Threlfall NA (1985) Volcano Town: the 1937–43 Rabaul eruptions. Robert Brown &
Associates, Bathurst, NSWJohnson TV, Veeder GJ, Matson DL, Brown RH, Nelson RM, Morrison D (1988) Io: evidence for
silicate volcanism in 1986. Science 242:1280–1283Juhle W, Coulter H (1955) The Mt. Spurr eruption, July 9,1953. Eos Trans Am Geophys Union
36:199Katili JA, Sudrajat A (1984) Galunggung: the 1982–1983 eruption, Volcanological Survey of
IndonesiaKasting JF (2001) The rise of atmosphere oxygen. Science 239:819–820Kasting JF, Catling D (2003) Evolution of a habitable planet. Annu Rev Astron Astr 41:429–463Katsui Y, Kawachi S, Kondo Y, Ikeda Y, Nakagawa M, Gotoh Y, Yamagishi H, Yamazaki T, Sumita
M (1990) The 1988–1989 explosive eruption of Tokachi-dake, Central Hokkaido, its sequenceand mode. Bull Volcanol Soc Jpn 35:111–129
Keefe D, Nolan PJ, Rich TA (1959) Charge equilibrium in aerosols according to the Boltzmann law.Proc R Irish Acad 60A:27–45
Keith WD, Saunders CPR (1990) Further laboratory studies of the charging of graupel during icecrystal interactions. Atmos Res 25:445–464
Kienle J, Swanson SE (1985) Volcanic hazards from future eruptions of Augustine volcano, Alaska.Report UAG R-275, University of Alaska, Fairbanks, Alaska
Kikuchi K, Endoh T (1982) Atmospheric electrical properties of volcanic ash particles in theeruption of Mt. Usu volcano, 1977. J Meteorol Soc Japan 60:548–561
Kikuchi K, Endoh T, Konno Y, Murakami M (1978) Atmospheric electrical observations of the 1977eruption of the Mt. Usu volcano, Usu eruption and its impact on environment (in Japanese withEnglish abstract), in An interdisciplinary research on environmental changes caused by the 1977eruption of Usu volcano and their social effects, Hokkaido University, pp 75–85
Kondo Y, Reiter R, Jager H, Takagi M (1982) The effect of the Mt St Helens eruption on tropo-spheric and stratospheric ions. Pure Appl Geophys 120(1):11–17
Krafft M (1993) Vulkane, Feuer der Erde. Otto Maier, Ravensberg, GermanyKuramoto K (1997) Accretion, core formation, H and C evolution of the Earth and Mars. Phys Earth
Planet Int 100:3–20Kuramoto K, Matsui T (1996) Partitioning of H and C between the mantle and core during the core
formation in the Earth: Its implications for the atmospheric evolution a redox state of earlymantle. J Geophys Res 101:14,909–14,932
Lamb HH (1970) Volcanic dust in the atmosphere, with a chronology and assessment of its mete-orological significance. Philos Trans Roy Soc London A 266:425–533
Lane FW (1966) The Elements of Rage. David and Charles PublishersLane SJ, Gilbert JS (1992) Electric potential gradient changes during explosive activity at
Sakurajima volcano, Japan. Bull Volcanol 54:590–594
428 Surv Geophys (2006) 27:387–432
123

Lane SJ, Gilbert JS, Kemp AJ (1995) Electrical and chemical properties of eruption plumes atSakurajima Volcano, Japan. In: Report on the 8th Joint Comprehensive Observation ofSakurajima Volcano, Sakurajima Volcanological Observatory, Disaster Prevention ResearchInstitute, Kyoto University, pp 105–127
Larsen G (2000) Holocene eruptions within the Katla volcanic system, south Iceland: characteristicsand environmental impact. Jokull 49:1–28
Lissowski P (1940) Das Laden von Aerosolteilchen in einer bipolaren Ionenatmosphare. ActaPhysicochimica URSS 13:157–192
Lopes-Gautier R, Davies AG, Carlson R, Smythe W, Kamp L, Soderblom L, Leader FE, MehlmanR, Galileo NIMS Team (1997) Hot spots on Io: initial results from Galileo’s near infraredmapping spectrometer. Geophys Res Lett 24:2439–2442
Luhr JF, Simkin T (eds) (1993) Parıcutin The Volcano Born in a Mexican Cornfield. GeosciencePress Inc., Pheonix Arizona
Marcz F, Harrison RG (2005) Further signatures of long-term changes in atmospheric electricalparameters observed in Europe. Ann Geophys 23:1987–1995
Mason BJ (1953) On the generation of charge associated with graupel formation in thunderstorms. QJ Roy Meteor Soc 79:501
Mason BJ (1971) The physics of clouds (2nd ed.), OUPMason BJ (1988) The generation of electric charges and fields in thunderstorms. Proc Roy Soc A
415:303–315Mather TA, Pyle DM, Oppenheimer C (2003) Tropospheric Volcanic Aerosol. In: Robock A,
Oppenheimer C (eds) Volcanism and the Earth’s Atmosphere, Geophysical Monograph 139,American Geophysical Union, pp 189–212
McGorman DR, Rust WD (1998) The electrical nature of storms, OUPMcClelland L, Simkin T, Summers M, Nielsen E, Stein TC (1989) Global volcanism 1975–1985.
Prentice-Hall, Englewood Cliffs, NJMcKee CO, Johnson RW, Lowenstein PL, Riley SJ, Blong RJ, de Saint Ours P, Talai B (1985)
Rabaul caldera, Papua New Guinea: volcanic hazards, surveillance, and eruption contingencyplanning. J Volcanol Geotherm Res 23:195–237
McNutt SR, Davis CM (2000) Lightning associated with the 1992 eruptions of Crater Peak MountSpurr Volcano, Alaska. J Volcanol Geotherm Res 102:45–65
Mead JE (1978) Charge distributions for radioactive aerosols in a bipolar atmosphere permeated byan electric field. MS Thesis, Kansas State University
Meyerott RE, Reagan JB, Evans JE (1983) On the correlation between ionospheric potential andcosmic rays. In: McCormac BM (ed) Weather and climate response to solar variations. Colo.Ass. Univ Press, 449 pp
Miller SL (1953) A production of amino acids under possible primitive Earth conditions. Science117:528–529
Miura T, Koyaguchi T, Tanaka Y (1996) Atmospheric electric potential gradient measurements of ashclouds generated by pyroclastic flows at Unzen volcano, Japan. Geophys Res Lett 23:1789–1792
Miura T, Koyaguchi T, Tanaka Y (2002) Measurements of electric charge distribution in volcanicplumes at Sakurajima volcano Japan. Bull Volcanol 64:75–93
Moore KR, Duffell H, Nicholl A, Searl A (2002) Monitoring of airborne particulate matter duringthe eruption of Soufriere Hills volcano, Montserrat. In: Druitt TH, Kokelaar BP (eds) Theeruption of Soufriere Hills Volcano, Montserrat, from 1995 to 1998, Geol Soc London Memoirs21:557–566
Mouginis-Mark P, Wilson L, Zuber M (1992) The physical volcanology of Mars. In: Kieffer HH,Jakosky BM, Snyder CW, Matthews MS (eds) Mars. Univ of Ariz. Press, Tucson, pp 424–452
Mulheisen R (1977) The global circuit and its parameters. In: Dolezalek H, Reiter R (eds) Electricalprocesses in atmospheres. Steinkopf Verlag, pp 467–476
Nairn IA, Hewson CAY, Latter JH, Wood CP (1976) Pyroclastic eruptions of Ngauruhoe volcano,central north island, New Zealand, 1974 January and March. In: Johnson RW (ed) Volcanism inAustralasia. Elsevier, Amsterdam, pp 385–405
Nash DB, Howell RR (1989) Hydrogen sulphide on Io: evidence from telescopic and laboratoryinfrared spectra. Science 244:454–457
Navarro-Gonzalez R, Basiuk VA (1998) Prebiotic synthesis by lightning in Martian volcanic plumes.In: Chela-Flores J, Raulin F (eds) Exobiology: matter, energy and information in the origin andevolution of life in the universe. Springer, New York, pp 255–260
Navarro-Gonzalez R, Segura A (2001) Volcanic lightning and the availability of reactive nitrogenand phosphorus for chemical evolution. In: Chela-Flores J, Owen T, Raulin F (eds) First
Surv Geophys (2006) 27:387–432 429
123
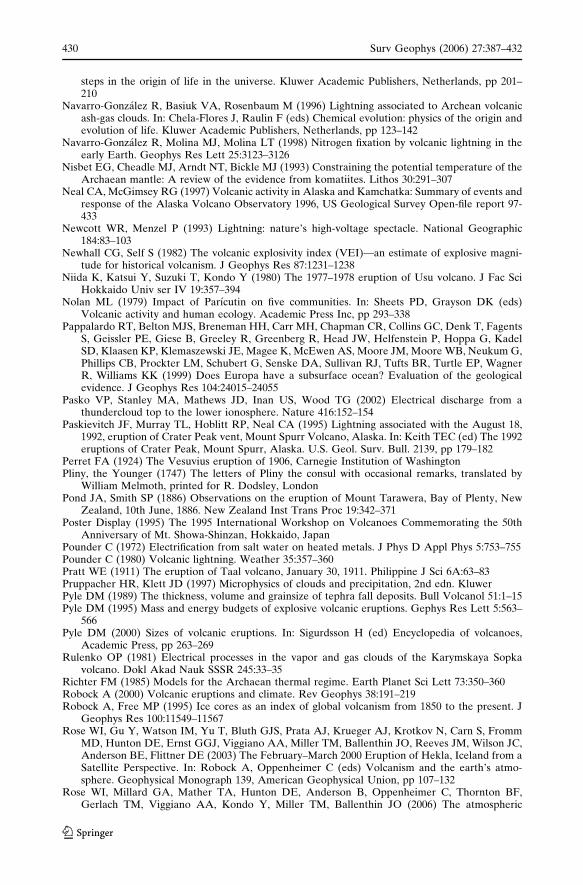
steps in the origin of life in the universe. Kluwer Academic Publishers, Netherlands, pp 201–210
Navarro-Gonzalez R, Basiuk VA, Rosenbaum M (1996) Lightning associated to Archean volcanicash-gas clouds. In: Chela-Flores J, Raulin F (eds) Chemical evolution: physics of the origin andevolution of life. Kluwer Academic Publishers, Netherlands, pp 123–142
Navarro-Gonzalez R, Molina MJ, Molina LT (1998) Nitrogen fixation by volcanic lightning in theearly Earth. Geophys Res Lett 25:3123–3126
Nisbet EG, Cheadle MJ, Arndt NT, Bickle MJ (1993) Constraining the potential temperature of theArchaean mantle: A review of the evidence from komatiites. Lithos 30:291–307
Neal CA, McGimsey RG (1997) Volcanic activity in Alaska and Kamchatka: Summary of events andresponse of the Alaska Volcano Observatory 1996, US Geological Survey Open-file report 97-433
Newcott WR, Menzel P (1993) Lightning: nature’s high-voltage spectacle. National Geographic184:83–103
Newhall CG, Self S (1982) The volcanic explosivity index (VEI)—an estimate of explosive magni-tude for historical volcanism. J Geophys Res 87:1231–1238
Niida K, Katsui Y, Suzuki T, Kondo Y (1980) The 1977–1978 eruption of Usu volcano. J Fac SciHokkaido Univ ser IV 19:357–394
Nolan ML (1979) Impact of Parıcutin on five communities. In: Sheets PD, Grayson DK (eds)Volcanic activity and human ecology. Academic Press Inc, pp 293–338
Pappalardo RT, Belton MJS, Breneman HH, Carr MH, Chapman CR, Collins GC, Denk T, FagentsS, Geissler PE, Giese B, Greeley R, Greenberg R, Head JW, Helfenstein P, Hoppa G, KadelSD, Klaasen KP, Klemaszewski JE, Magee K, McEwen AS, Moore JM, Moore WB, Neukum G,Phillips CB, Prockter LM, Schubert G, Senske DA, Sullivan RJ, Tufts BR, Turtle EP, WagnerR, Williams KK (1999) Does Europa have a subsurface ocean? Evaluation of the geologicalevidence. J Geophys Res 104:24015–24055
Pasko VP, Stanley MA, Mathews JD, Inan US, Wood TG (2002) Electrical discharge from athundercloud top to the lower ionosphere. Nature 416:152–154
Paskievitch JF, Murray TL, Hoblitt RP, Neal CA (1995) Lightning associated with the August 18,1992, eruption of Crater Peak vent, Mount Spurr Volcano, Alaska. In: Keith TEC (ed) The 1992eruptions of Crater Peak, Mount Spurr, Alaska. U.S. Geol. Surv. Bull. 2139, pp 179–182
Perret FA (1924) The Vesuvius eruption of 1906, Carnegie Institution of WashingtonPliny, the Younger (1747) The letters of Pliny the consul with occasional remarks, translated by
William Melmoth, printed for R. Dodsley, LondonPond JA, Smith SP (1886) Observations on the eruption of Mount Tarawera, Bay of Plenty, New
Zealand, 10th June, 1886. New Zealand Inst Trans Proc 19:342–371Poster Display (1995) The 1995 International Workshop on Volcanoes Commemorating the 50th
Anniversary of Mt. Showa-Shinzan, Hokkaido, JapanPounder C (1972) Electrification from salt water on heated metals. J Phys D Appl Phys 5:753–755Pounder C (1980) Volcanic lightning. Weather 35:357–360Pratt WE (1911) The eruption of Taal volcano, January 30, 1911. Philippine J Sci 6A:63–83Pruppacher HR, Klett JD (1997) Microphysics of clouds and precipitation, 2nd edn. KluwerPyle DM (1989) The thickness, volume and grainsize of tephra fall deposits. Bull Volcanol 51:1–15Pyle DM (1995) Mass and energy budgets of explosive volcanic eruptions. Gephys Res Lett 5:563–
566Pyle DM (2000) Sizes of volcanic eruptions. In: Sigurdsson H (ed) Encyclopedia of volcanoes,
Academic Press, pp 263–269Rulenko OP (1981) Electrical processes in the vapor and gas clouds of the Karymskaya Sopka
volcano. Dokl Akad Nauk SSSR 245:33–35Richter FM (1985) Models for the Archaean thermal regime. Earth Planet Sci Lett 73:350–360Robock A (2000) Volcanic eruptions and climate. Rev Geophys 38:191–219Robock A, Free MP (1995) Ice cores as an index of global volcanism from 1850 to the present. J
Geophys Res 100:11549–11567Rose WI, Gu Y, Watson IM, Yu T, Bluth GJS, Prata AJ, Krueger AJ, Krotkov N, Carn S, Fromm
MD, Hunton DE, Ernst GGJ, Viggiano AA, Miller TM, Ballenthin JO, Reeves JM, Wilson JC,Anderson BE, Flittner DE (2003) The February–March 2000 Eruption of Hekla, Iceland from aSatellite Perspective. In: Robock A, Oppenheimer C (eds) Volcanism and the earth’s atmo-sphere. Geophysical Monograph 139, American Geophysical Union, pp 107–132
Rose WI, Millard GA, Mather TA, Hunton DE, Anderson B, Oppenheimer C, Thornton BF,Gerlach TM, Viggiano AA, Kondo Y, Miller TM, Ballenthin JO (2006) The atmospheric
430 Surv Geophys (2006) 27:387–432
123
chemistry of a 33–34 hour old volcanic cloud from Hekla Volcano (Iceland): insights from directsampling and the application of chemical box modeling. J Geophys Res (in press)
Ryan MP (eds) (1994) Magmatic systems. Academic Press, San DiegoRycroft MJ, Israelsson S, Price C (2000) The global atmospheric electric circuit, solar activity and
climate change. J Atmos Sol-Terr Phys 62:1563–1576Saunders CPR (1988) Thunderstorm Electrification. Weather 43:318–324Sapper K (1905) In den Vulkangebieten Mittelamerikas und Westindiens. Verlag der E. Schweiz-
erbartschen Verlagsbuchhandlung, Stuttgart, pp 101–153Scaillet B, Luhr J, Carroll MR (2003) Petrological and volcanological constraints on volcanic sulfur
emissions to the atmosphere. In: Robock A, Oppenheimer C (eds) Volcanism and the earth’satmosphere, Geophysical Monograph 139, American Geophysical Union, pp 11–40
Schneider M (1995) Eruption! Mt. Ruapehu, N.Z. (postcard), Kiwi Vista collection New ZealandSegura A, Navarro-Gonzalez R (2001) Experimental simulation of early Martian volcanic lightning.
Adv Space Res 27:201–206Segura A, Navarro-Gonzalez R (2005) Nitrogen fixation on early Mars by volcanic lightning and
other sources. Geophys Res Lett 32:L05203 doi:10.1029/2004GL021910Shaviv NJ (2002) Cosmic ray diffusion from the galactic spiral arms, iron meteorites, and a possible
climatic connection. Phys Rev Lett 89:051102Sheppard JB, Aspinall WP, Rowley KC, Pereire J, Sigurdsson H, Fiske RS, Tomblin JF (1979) The
eruption of Soufriere volcano, St. Vincent April–June 1979. Nature 282:24–28Shore D (1975) The man who fought Vesuvius. Weekend Mag July 30:6–7Simkin T, Howard KA (1970) Caldera collapse in the Galapagos Islands. Science 169:429–437Simkin T, Fiske RS (1983) Krakatau 1883: The volcanic eruption and its effects. Smithsonian
Institution PressSimkin T, Siebert L (1994) Volcanoes of the world, 2nd edn. Geoscience, Tucson ArizSparks RSJ, Bursik MI, Carey SN, Gilbert JS, Glaze LS, Sigurdsson H, Woods AW (1997) Volcanic
Plumes. John Wiley & Sons, ChichesterSymons GJ (eds) (1888) The eruption of Krakatoa and subsequent phenomena, Report of the
Krakatoa committee of the Royal Society. Harrison and Sons, LondonTanaka Y (1975) The feasibility study on the measurement technique for estimation of the energy of
volcanic plumes (in Japanese), Report on Sunshine project in 1974, Agency of Natural Re-sources and Energy, Ministry of Energy, Trade, and Industry, Japan, pp 23–32
Tinsley BA (2005) On the variability of the stratospheric column resistance in the global electriccircuit. Atmos Res 76:78–94
Tinsley BA, Rohrbaugh RP, Hei M, Beard KV (2000) Effects of image charges on the scavenging ofaerosol particles by cloud droplets and on droplet charging and possible ice nucleation processes.J Atmos Sci 57:2118–2134
Tripathi SN, Harrison RG (2001) Scavenging of electrified radioactive aerosol. Atmos Environ35:5817–5821
Tripathi SN, Harrison RG (2002) Enhancement of contact nucleation by scavenging of chargedaerosol particles. Atmos Res 62:57–70
Tripathi SN, Vishnoi S, Kumar S, Harrison RG (2006) Computationally-efficient expressions for thecollision efficiency between electrically charged aerosol particles and cloud droplets. Q J RoyMeteor Soc (in press)
Uman MA (1987) The lightning discharge, International Geophysics Series, vol 39. Academic Press,Orlando, FL
Viramonte JG, Ubeda E, Martinez M (1971) The 1971 eruption of Cerro Negro. Geol. Service ofNicaragua, Managua, Nicaragua
Vogfjorð KS, Jakobsdottir SS, Guðmundsson GB, Roberts MJ, Agustsson K, Arason ·, Geirsson H,Karlsdottir S, Hjaltadottir S, Olafsdottir U, ·orbjarnardottir B, Skaftadottir ·, Sturkell E,Jonasdottir EB, Hafsteinsson G, Sveinbjornsson H, Stefansson R, Jonsson ·V (2005) Forecastingand monitoring a subglacial eruption in Iceland. Eos Trans Am Geophys Union 86:245–248
Vohra KG, Subba Ramu MC, Vasudevan KN (1969) Role of natural ionisation in the formation ofcondensation nuclei in the atmospheric air. In: Coroniti SC, Hughes J (eds) Planetary electro-dynamics. Gordon and Breach Science Publishers
Volcano Quarterly (1993) Tanaka J (ed) The village square of volcanodom. Issaquah, WashingtonWilcox RE (1959) Some effects of recent volcanic ash falls with especial reference to Alaska. US
Geol Surv Bull 1028-N:409–476Wilding RJ, Harrison RG (2005) Aerosol modulation of small ion growth in coastal air. Atmos
Environ 39:5876–5883
Surv Geophys (2006) 27:387–432 431
123

Wilkening M (1985) Characteristics of atmospheric ions in contrasting environments. J Geophys Res90:5933–5935
Williams ER, McNutt SR (2004) Are large volcanic eruptions just dirty thunderstorms? Eos Trans.Am. Geophys. Union 85, Fall Meet. Suppl., Abstract AE23A-0842
Wilson L, Head J (1994) Review and analysis of volcanic eruption theory and relationships toobserved landforms. Rev Geophys 32:221–263
Winn WP, Moore CP (1971) Electric field measurements in thunderclouds using instrumentedrockets. J Geophys Res 76:5003–5017
432 Surv Geophys (2006) 27:387–432
123