electricity blueprintmnsblueprint.org/pdf/electricity.pdf · electricity 1 table of contents list...
TRANSCRIPT

Rupali Ghate – GreenEarth Social Development Consulting Pvt. Ltd. March 2013 l Version 2 - Draft for Approval © Maharashtra NavNirman Sena
Towards Sustainable Power for MaharashtraElectricity Blueprint

Electricity 1
Table of Contents
List of Tables ............................................................................................................................... 3
List of Figures .............................................................................................................................. 6
Abbreviations and Acronyms ...................................................................................................... 8
Units .......................................................................................................................................... 11
Overview ....................................................................................................................................... 12
India Power Scenario ................................................................................................................ 13
Maharashtra Power Scenario ................................................................................................... 30
Problems ....................................................................................................................................... 58
Load shedding ........................................................................................................................... 59
Electricity Tariff and Subsidies .................................................................................................. 60
Lacunae in the System .............................................................................................................. 69
Projections .................................................................................................................................... 70
Future Electricity Demand in Maharashtra .............................................................................. 71
Electricity Sources for the Future ................................................................................................. 73
Challenges Ahead .......................................................................................................................... 77
The Way Forward .......................................................................................................................... 82
Solution 1: Upgrade and Optimize Efficiency of Thermal Power Plants ...................................... 85
Performance evaluation of Thermal power stations ................................................................ 90
Renovation and Modernization .............................................................................................. 111
Conclusion ............................................................................................................................... 115
Case studies on performance enhancement initiatives by power producers in India and abroad ..................................................................................................................................... 117
Solution 2: Reduce T & D losses .................................................................................................. 126
Transmission and Distribution ................................................................................................ 130
Solutions for improving efficiency of the grid ........................................................................ 142
Conclusion ............................................................................................................................... 149

Electricity 2
Case studies on smart grid technology ................................................................................... 150
Solution 3: Increase green energy sources ................................................................................. 154
Renewable Energy Scenario ................................................................................................... 160
Renewable Energy Potential of Maharashtra ......................................................................... 173
Conclusion ............................................................................................................................... 187
Case Studies ............................................................................................................................ 191
Solution 4: Implement Energy Conservation Measures ............................................................. 194
Energy Savings across Sectors ................................................................................................ 202
Conclusion ............................................................................................................................... 221
Integrated Energy Resource Management ................................................................................. 222
IERM scenario ......................................................................................................................... 223
Scenario 1: Business as Usual (BAU) ....................................................................................... 228
Scenario 2: Integrated Energy Resource Management (IERM) .............................................. 229
Conclusion ................................................................................................................................... 232
Annexures ................................................................................................................................... 234
Annexure I - List of Power plants and PPAs in Maharashtra .................................................. 235
Annexure II - Godbole Committee Report .............................................................................. 252
Annexure III- Power plants in Pipeline .................................................................................... 255
Annexure IV- Regional Imbalance in Maharashtra ................................................................. 259
Annexure V - Installed Capacity, Generation and Efficiency of MahaGenCo Thermal Power Stations ................................................................................................................................... 269
Annexure VI - Works undertaken under APDRP ..................................................................... 276
Annexure VII – Case Study on Power Grid Failure: 30-31 July 2012 ...................................... 280
Annexure VIII- Financial Assistance by MEDA and MEDA Budget Estimate ........................... 291
Annexure IX – Energy Savings in Households ......................................................................... 294
Annexure X – Other Policy measures ..................................................................................... 295
Bibliography ................................................................................................................................ 300

Electricity 3
List of Tables
Table 1 – Installed Capacity Addition during the 10th Plan ........................................................... 24
Table 2- 11th Plan capacity addition target - Sector wise (MW) ................................................... 25
Table 3 - All India target and actual capacity addition during 11th plan upto 31.3.2011 (MW) ... 26
Table 4 - Power supply position (2007-08 to 2010-11) ................................................................ 28
Table 5-Power supply position -India (August 2012) .................................................................... 29
Table 6-Peak demand and peak met (August 2012) ..................................................................... 29
Table 7- Transmission system network of MSETCL (as on 31.3.2012) ......................................... 31
Table 8 - Total No. of Consumers of MSEDCL ............................................................................... 32
Table 9 – Installed Capacities of Power Utilities in Maharashtra State ........................................ 33
Table 10 – Installed Capacity available in Maharashtra and Mumbai .......................................... 35
Table 11 - Installed capacity - Maharashtra.................................................................................. 36
Table 12 - MoUs signed with Private Power Companies in 2005-06 ............................................ 40
Table 13 - Peak Demand & Availability status in Maharashtra from 2001-02 to 2011-12 ........... 42
Table 14- MSEDCL Supply and shortfall of electricity at peak demand (MW) ............................. 43
Table 15 – Variation in monthly energy demand ......................................................................... 44
Table 16- Per Capita electricity consumption in India .................................................................. 50
Table 17-Energy consumption in Maharashtra (million kWh) ..................................................... 51
Table 18- Average tariffs in select SEBs (paise/kWh) ................................................................... 60
Table 19 - Income, expenditure and cost recovery of 89 utilities ................................................ 66
Table 20 - Peak demand projections ............................................................................................ 71
Table 21 - Growth rate of electricity consumption ...................................................................... 72
Table 22- Population growth (1961-2011).................................................................................... 72
Table 23 - Projection of Electricity Consumption (2025) .............................................................. 72
Table 24: Mechanical equipment of a power plant ...................................................................... 88
Table 25 - Sector wise PLF ............................................................................................................. 90
Table 26 - Installed Capacity, Year of Commissioning & Efficiency of MSPGCL power stations .. 92
Table 27-Primary performance parameters ................................................................................. 94
Table 28 -Secondary performance parameters ............................................................................ 94
Table 29- Unit wise installed capacity of Koradi thermal power station (2012) .......................... 96
Table 30 - Unit wise installed capacity Nasik thermal power station (2012) ............................... 98
Table 31 - Unit wise installed capacity of Bhusawal thermal power station (2012) .................. 100
Table 32 - Unit wise installed capacity of Paras thermal power station (2012) ......................... 102
Table 33- Unit wise installed capacity of Parli thermal power station (2012) ........................... 104
Table 34 - Unit wise installed capacity of Khaparkheda thermal power station (2012) ............ 106
Table 35 - - Unit wise installed capacity of Chandrapur thermal power station (2012) ............ 108
Table 36 -R&M and LE – Units covered and cost incurred ......................................................... 111
Table 37 -R&M works in MSPGCL power plants in the 10th and 11th five-year plans .............. 112
Table 38-Plant Load Factor Comparison – MSPGCL, NTPC and Private Power Producers ......... 113
Table 39- Production (Million tons) by Coal type - CIL (2008-2012) .......................................... 121
Table 40- Production (Million tons) by coal type – All India (2007-2011) .................................. 121
Table 41: Consumption of electricity in Maharashtra by consumer type .................................. 128

Electricity 4
Table 42-Transmission Network in Maharashtra, MSETCL ........................................................ 130
Table 43-Transmission System Availability ................................................................................. 131
Table 44 - Distribution Network (Cumulative) ............................................................................ 131
Table 45-AT&C Loss, Billing & Collection Efficiency of Distribution Utilities .............................. 134
Table 46 - Percentage Consumption and Revenue from LT Agriculture (metered & unmetered)..................................................................................................................................................... 138
Table 47- Unmetered Agriculture connections (2008 to 2011).................................................. 138
Table 48: Losses in different elements of transmission and distribution .................................. 142
Table 49-Performance indices (2009-10) ................................................................................... 142
Table 50-Quality of Supply (2010-11) ......................................................................................... 143
Table 51- Envisaged addition of renewable energy technologies by MEDA .............................. 162
Table 52 – Financial incentives and grants for bagasse cogeneration and biomass generation 165
Table 53-JNNSM targets as set by the Ministry of New and Renewable Energy ....................... 166
Table 54 - State level incentives for bagasse and biomass captive generation ......................... 168
Table 55 – State incentives for wind based captive power generation ..................................... 168
Table 56 – Capital cost and typical cost of generated electricity from renewable options, ...... 171
Table 57–Renewable energy potential in India & Maharashtra and untapped potential in Maharashtra................................................................................................................................ 174
Table 58 - Classification of small hydropower projects .............................................................. 175
Table 59: Anticipated future of biomass power ......................................................................... 178
Table 60- Grid Connected solar power plants in Maharashtra .................................................. 179
Table 61 – Installed capacity – India and Maharashtra (January 2012) ..................................... 180
Table 62-Wave power at selected sites along Maharashtra coast ............................................. 186
Table 63 - Anticipated renewable power generation in 2025 .................................................... 187
Table 64 – Potential for Energy Conservation ............................................................................ 197
Table 65 - Electricity Consumption across sectors (mkWh) ....................................................... 202
Table 66 – Energy savings from energy efficient household appliances .................................... 204
Table 67 - Domestic consumers of MSEDCL ............................................................................... 207
Table 68- Urban electricity savings ............................................................................................. 207
Table 69 - Rural electricity savings .............................................................................................. 207
Table 70– Share of electricity in the total production cost ........................................................ 209
Table 71- Energy savings potential of SME clusters in Maharashtra ......................................... 210
Table 72 - Energy savings potential in energy intensive Industries ............................................ 211
Table 73- Achievements of the Energy Conservation Program .................................................. 212
Table 74- Average savings in Agriculture sector ......................................................................... 215
Table 75-Quantitative analysis of IERM Scenario 2025 .............................................................. 225
Table 83: Demand Projections and actual Demand ................................................................... 252
Table 76- Installed capacity, generation and efficiency of Koradi Thermal Power Station ....... 269
Table 77 - Installed capacity, generation and efficiency of Nasik Thermal Power Station ........ 270
Table 78-Installed capacity, generation and efficiency of Bhusawal Thermal Power Station ... 271
Table 79 - Installed capacity, generation and efficiency of Paras Thermal Power Station ........ 272
Table 80 - Installed capacity, generation and efficiency of Parli Thermal Power Station .......... 273

Electricity 5
Table 81- Installed capacity, generation and efficiency of Khaparkheda Thermal Power Station..................................................................................................................................................... 274
Table 82 - Installed capacity, generation and efficiency of Chandrapur Thermal Power Station..................................................................................................................................................... 275
Table 84 - List of works undertaken under APDRP Phase-I (as on 30 September 2008) ........... 276
Table 85 - List of works undertaken under APDRP Phase-II (as on 30 September 2008) .......... 276
Table 86 - Gaothan Feeder Separation- Phase I (Commissioned on June 2009) ....................... 277
Table 87-Gaothan Feeder Separation- Phase II .......................................................................... 277
Table 88- MEDA budget estimate for financial year 2011-12 (‘in lakhs) .................................... 293

Electricity 6
List of Figures
Figure 1 –Installed Capacity (MW) in India (March 31, 2007) ...................................................... 23
Figure 2 –Installed Capacity (MW) in India (August 31, 2011) ..................................................... 23
Figure 3 – 10th Plan Capacity addition target for various sectors ................................................. 24
Figure 4 – 10th Plan Capacity addition achievement by various sectors ...................................... 24
Figure 5 – 10th Plan Capacity Addition Target (Source wise) ........................................................ 25
Figure 6 - 10th Plan Capacity Addition Achievement (Source wise) .............................................. 25
Figure 7 – 11th Plan Capacity Addition Target: Sector wise .......................................................... 25
Figure 8 – 11th Plan Capacity Addition Target: Source wise ......................................................... 25
Figure 9: Growth of Installed Capacity (MW) from 6th Plan till July 2011 .................................... 27
Figure 10 – Growth of Thermal Installed Capacity since 6th Plan ................................................. 27
Figure 11 – Power supply position (2007-08 to 2010-11) ............................................................ 28
Figure 12- Peak demand and peak met (2007-08 to 2010-11) ..................................................... 29
Figure 13 - Western grid: Maharashtra, Gujarat, Madhya Pradesh, Chhattisgarh, Goa, Daman & Diu Dadra Nagar Haveli ................................................................................................................. 30
Figure 14 - Installed Capacity in Maharashtra from State, Private and Central Sectors .............. 33
Figure 15 - % Share (State, Private and Central Utilities) of installed capacity ............................ 34
Figure 16 - Sector wise installed capacity (MW) for use in Maharashtra (except Mumbai) ........ 36
Figure 17 - State (MSPGCL) Power generation sources ................................................................ 37
Figure 18 - Demand -Supply (MSEDCL) ......................................................................................... 43
Figure 19- Seasonal Electricity Demand Pattern (2009-10 to 2011-12) ....................................... 43
Figure 20 - Daily peaks (demand-supply) and average supply in monsoon (August 2009) ......... 45
Figure 21 - Daily morning peaks (demand-supply) and average supply in summer month (March 2012) ............................................................................................................................................. 46
Figure 22- Daily evening peaks (demand-supply) and average supply in summer month (March 2012) ............................................................................................................................................. 46
Figure 23 - Daily peaks (demand-supply) and average supply in October 2011 .......................... 47
Figure 24 - Hourly demand curve- 24 October 2011 .................................................................... 47
Figure 26 - Comparison of Installed Capacity and Generation ..................................................... 48
Figure 27- Changing share of electricity in Maharashtra across various sectors ......................... 49
Figure 28- Generation and Consumption of Electricity in selected states ................................... 50
Figure 29- Category wise electricity consumption from 2004-05 to 2010-11 .............................. 51
Figure 30 - Tariff across various economic sectors for select SEB (2007-08) ............................... 61
Figure 31 - Tariff across economic sectors for select SEBs (2008-09) .......................................... 61
Figure 32- State wise variation in average tariff (paise/kWh sold) for 2009-10 .......................... 62
Figure 33 – Regulated price structure- Subsidy ............................................................................ 64
Figure 34-Electricity Subsidies in India ......................................................................................... 66
Figure 35- कोयाडी औष्णणक वलद्मतु कें द्राची लीज ननर्भिती षभता ल प्रत्मष लीज ननर्भिती (1974-75 to
2006-07) ........................................................................................................................................ 97
Figure 36 - नार्ळक औष्णणक वलद्मतु कें द्राची लीज ननर्भिती षभता ल प्रत्मष लीज ननर्भिती (1970-71 to
2006-07) ........................................................................................................................................ 99

Electricity 7
Figure 37- बवुालऱ औष्णणक वलद्मतु कें द्राची लीज ननर्भिती षभता ल प्रत्मष लीज ननर्भिती (1968-69 to
2006-07) ...................................................................................................................................... 101
Figure 38 - ऩायव औष्णणक वलद्मतु कें द्राची लीज ननर्भिती षभता ल प्रत्मष लीज ननर्भिती .................. 103
Figure 39 - ऩयऱी औष्णणक वलद्मतु कें द्राची लीज ननर्भिती षभता ल प्रत्मष लीज ननर्भिती .................. 105
Figure 40-खाऩयखेडा औष्णणक वलद्मतु कें द्राची लीज ननर्भिती षभता ल प्रत्मष लीज ननर्भिती.............. 107
Figure 41 -चंद्रऩयू भशाऔष्णणक वलद्मतु कें द्राची लीज ननर्भिती षभता ल प्रत्मष लीज ननर्भिती ............ 108
Figure 42- Average Load of Unit 1 .............................................................................................. 109
Figure 43- Average load of Unit 2 ............................................................................................... 109
Figure 44-रयरामन्वची लीज ननर्भिती षभता ल प्रत्मष लीज ननर्भिती ................................................ 117
Figure 45-Performance of NTPC – Evaluation by NTPC .............................................................. 118
Figure 46-Performance of NTPC – evaluation by third party ..................................................... 119
Figure 47- Coal and lignite reserves map of India ...................................................................... 122
Figure 48- Electricity Consumption across various economic sectors and for administrative purposes ...................................................................................................................................... 129
Figure 49 – Transmission and Distribution Losses for past 6 years ............................................ 132
Figure 50 - Circles with > 33% reduction in distribution loss...................................................... 133
Figure 51-Block diagram of an online prepaid energy meter ..................................................... 144
Figure 52 - Pictorial representation of Smart Grid Technology .................................................. 146
Figure 53- UCSD micro-grid ......................................................................................................... 151
Figure 54-Status of Rural Electrification in India ........................................................................ 156
Figure 55- Breakup of Renewable Energy Capacity in India ....................................................... 160
Figure 56-Installed Capacity (Renewable Energy) in Maharashtra ............................................ 161
Figure 57 - Economics of Decentralized Distributed Generation ............................................... 172
Figure 58- Solar streetlight ......................................................................................................... 181
Figure 59 – Decentralized application of solar power for pumping water in Melghat, a tribal village ......................................................................................................................................... 181
Figure 60 - Anticipated Renewable Energy Capacity Achievement (2025) –MEDA calculations 187
Figure 61-Peak demand, supply & shortfall in Maharashtra (MSEDCL distribution area) ......... 195
Figure 62 - Power consumption in domestic sector ................................................................... 203
Figure 63 – Consumption of electricity in domestic sectors ...................................................... 203
Figure 64 - Industrial electricity consumption (2004-05 to 2010-11)......................................... 208
Figure 65- Consumption by agriculture sector (2004-05 to 2010-11) ........................................ 214
Figure 66-Reduction of WPI in building after applying ECBC ..................................................... 218
Figure 67 - Urbanization in India ................................................................................................. 219
Figure 68-Schematic Representation of IERM Scenario 2025 .................................................... 227

Electricity 8
Abbreviations and Acronyms
ABT Availability Based Tariff Ag DSM Agricultural Demand Side Management Ag LM Agricultural Load Management APDRP Accelerated Power Development & Reform Program AT&C Loss Accelerated Technical and Commercial Loss BAU Business as Usual BEE Bureau of Energy Efficiency BEST Bombay Electricity and Suburban Transport BSES Brihanmumbai Suburban Electric Supply BTL Boiler Tube Leakage CAG Comptroller and Auditor General CAGR Compounded Annual Growth Rate CEA Central Electricity Authority CFL Compact Fluorescent Lamp CHP Combined Heat and Power Generation CIL Coal India Ltd CPP Captive Power Producers CTU Central Transmission Utility DPC Dabhol Power Company DSM Demand Side Management EA 2003 Electricity Act 2003 ECBC Energy Conservation Building Code EHV Extra High Voltage ERC Act Electricity Regulatory Commissions Act 1998 FSA Fuel Supply Agreement FYP Five Year Plan GAIL Gas Authority of India Ltd GCV Gross Calorific Value GoI Government of India GoM Government of Maharashtra HT High Tension HVAC High Voltage Alternate Current HVDC High Voltage Direct current IEA International Energy Agency IERM Integrated Energy Resource Management

Electricity 9
IPP Independent Power Producers ISGTF India Smart Grid Task Force JNNSM Jawaharlal Nehru National Solar Mission LE Life Extension LED Light Emitting Diode LM Load Management LNG Liquefied Natural Gas LoI Letter of Intent LT Low Tension MCCIA Mahratta Chamber of Commerce Industries and Agriculture MEDA Maharashtra Energy Development Agency MERC Maharashtra Electricity Regulatory Commission MIS Management Information Systems MNRE Ministry of New and Renewable Energy MoEF Ministry of Environment and Forests MoU Memorandum of Understanding MSEB Maharashtra State Electricity Board MSEDCL Maharashtra State Electricity Distribution Company Ltd MSETCL Maharashtra State Electricity Transmission Company Ltd MSGPCL Maharashtra State Power Generation Company Ltd Mu DSM Municipal Demand Side Management NGO Non-Governmental Organization NHPC National Hydro Power Corporation NPC National Planning Commission NPCIL Nuclear Power Corporation of India Limited NTPC National Thermal Power Corporation O&M Operation and Maintenance OECD Organization for Economic Co-operation and Development PAP Project affected people PFC Power Finance Corporation PLF Plant Load Factor PPA Power Purchase Agreement PVs Photovoltaics R&R Rehabilitation and resettlement R&M Renovation and Modernization REC Rural Electrification Corporation REL Reliance Energy Limited

Electricity 10
RGGVY Rajiv Gandhi Grameen Vidyutikaran Yojana RGPPL Ratnagiri Gas and Power Private Limited RLNG Re-gasified Liquefied Natural Gas SAWS San Antonio Water System SEB State Electricity Board SERC State Electricity Regulatory Commission SEZ Special Economic Zone SHP Small Hydro Project SLDC State Load Despatch Centre SPCC Specific Coal Consumption STP Sewage Treatment plants STU State Transmission Utility T&D Transmission and Distribution TAPS Tarapur Atomic Power Station TPC Tata Power Corporation UNFPA United Nations Population Fund

Electricity 11
Units
Ckt. Km. Circuit kilometers kCal/kg kilo calories per kilogram kCal/kWh kilo calories per kilowatt hour kg/kWh kilogram per kilowatt hour kW Kilo Watt kWh Kilo Watt Hour ml/kWh mililitre per kilowatt hour MTOE Million tons of oil equivalent MU Million Units MVA Mega Volt Ampere MW Mega Watt Rs. Rupees

Electricity 12
Overview

Electricity 13
India Power Scenario
Power (energy) is one of the major inputs for economic development of a country. Increased economic activities have led to higher demand of energy resources. It is a crucial input not only for industrial development but also for socioeconomic progress.
Energy is essential for power generation, lighting, cooking, transportation, agriculture, industry, etc. This policy will mainly deal with energy use for power generation and cooking in Maharashtra. Most of the rural places do not have access to electricity and usually cook using traditional fuels. Inadequate ventilation leads to an increase in incidences of respiratory diseases among women and children. Innovative and advanced technologies need to be developed for these two fields. Monitoring mechanism needs to be introduced in order to ensure that regulatory processes are followed.
Indian Power Sector has progressed a great deal since independence. A network of institutions was set up at the state and central levels. The State Electricity Boards (SEBs) created at the state level were semi - autonomous bodies according to the law and owned by state government. They were entrusted with the responsibilities of electricity generation and its supply in the state, while remaining within the broad legal and policy frameworks designed by the state and central governments. At national level, an autonomous institution called the Central Electricity Authority (CEA) was created to provide techno-economic expertise and advice to the SEBs. The Central Electricity Authority was the supreme authority in crucial techno-economic matters such as sanctioning of new power projects as well as inter-state electricity transfer and exchanges.
The energy sector is one of the most capital-intensive sectors. In the post-independence period, because private industry was not adequately developed to raise such a huge capital, it was argued (even by the private sector) that government should take up the responsibility of developing this sector. The sector was thus developed and expanded by providing capital from the budgets of central and state governments. For many years, about one fourth to one fifth of the total plan allocation from the central and state governments’ budgets was directed to the electricity sector.
The energy sector was consistently and generously funded in the Five-Year Plan budgets. By 2001, the State Electricity Boards had built an extensive network electrifying 85% of Indian villages, and increased installed capacity from minimum levels at independence – barely enough generation to provide minimal power to 20% of the population at the time – to 100,000 MW. However, in spite of this growth, investments made by the state governments have been unable to meet the energy needs of the population and the country has experienced significant capacity shortfalls an inequitable distribution of electricity. Some of the capacity constraints were due to the fact that the SEBs had consistently fallen short of the infrastructure targets in the Five year Plans. Had all the capacity targets been reached since the First Plan in 1950, total capacity addition would have been 84,000 MW in 1990, yet only 65,000 MW were installed at that time. Energy sector has gone through major transformations over the years, through

Electricity 14
unbundling of the electricity companies into separate generation, transmission and distribution companies and introduction of Acts and Policies. A brief history of the Indian Power sector is cited below.
Pre – independence
Utility scale electricity production in India began relatively early as compared to other developing countries, as it was a British colony. Most of the installed capacity was located in West Bengal and Bombay states which were under strong British influence and contained major urban and industrial areas. The first instance of generation of electricity in India dates back to 1879 in Kolkata (then Calcutta).
In 1897, the Government of Bengal granted an exclusive 21-year license to the Calcutta Electricity Supply Corporation to supply electricity to Calcutta. Mumbai (then Bombay) was the second city to get electricity and as time progressed, private companies set up power supply systems in major urban areas under franchises, which allowed them a reasonable rate of return.
The key driver for electricity growth was demand by industries, tramways, commercial enterprises and domestic use. To meet this demand coal fired and hydroelectric plants were installed. During this period, electricity undertaking was a private sector held under British holding companies that provided management as well finance. Most of the earlier private companies in the power sector cease to exist today as they were amalgamated into state-owned enterprises; however, a few of them continue to exist as private players.
Post – independence
After independence, the Indian Government created the National Planning Commission (NPC) and began its full-scale experiment of national-level economic planning with objectives of domestic self-sufficiency, rapid increase in the standard of living of Indian people, decreasing economic inequality and poverty and instituting a socialistic pattern of society. Electricity was viewed as a crucial instrument for social development and a rigid control by the government was considered essential for meeting the objectives. Private companies providing electricity was considered unacceptable, as they would focus on areas with greatest demand – cities and urban areas – and neglect rural areas due to meager return on their investments. This was considered inequitable so the government aimed its policies to provide cheap electricity to villages and rural areas, which would help increase electricity access and demand for irrigation and village-based small scale industries.
By the 1970s public owned sector dominated in the first two decades. In the earlier decades, the state sector was the principal; however the central sector soon began to play an important role. New centrally owned public sector corporations were established viz. National Thermal Power Corporation (NTPC) established in 1975, National Hydro Power Corporation (NHPC) in 1975 and Nuclear Power Corporation of India Limited (NPCIL) in 1987] to increase the capacity,

Electricity 15
aimed at supplementing generation activities of the State Electricity Boards (SEBs) and existing public sector companies.
The energy scene of the early 1970s was marked by power shortages and frequent power plant breakdowns. Hydroelectric plants were suffering from low generation, as water resources depended heavily on erratic monsoons. In the early 1970s, growth in generation from hydroelectricity reduced significantly because of poor monsoons, with only a 4% increase during the Fourth Plan (1969-1974). Other reasons, in addition to monsoons, included long construction times, delays in civil works, delays in delivery of power plant equipment, higher-than-expected capital costs and inadequate addition of transmission and distribution infrastructure. Further growth of hydroelectricity was stalled due to resistance from local groups against construction of large hydroelectric projects as they led to large-scale displacement and biodiversity losses.
Generation of electricity from nuclear sources had just begun with the commissioning of the Tarapur Atomic Power Station near Bombay in the year 1969. However, this nascent development was superseded by the international sanctions imposed on India because of its 1974 nuclear weapons test. The oil shocks of 1973 and 1978 marginalized the use of oil for power generation. The 1970s energy crisis was mostly due to failure of hydroelectricity and coal shortages, unlike some of the OECD countries. Nonetheless the oil crisis made the use of indigenous coal and hydroelectricity relatively cheaper and forced the government to emphasize coal usage in many energy-intensive sectors including electricity generation.
The SEBs established as autonomous commercial entities started facing several difficulties. The major problem was political interference which began to destroy financial viability of SEBs. They were not free to distribute power on a commercial basis and politicians keen to exploit the rural voting blocks, gave farmers practically free electricity for the irrigation pump sets. In the name of alleviating poverty and improving food security, flat rate tariffs based on electricity connections rather than metered consumption became the norm in rural areas of many states. This resulted in the increase in the share of agricultural electricity consumption. Thus there was inequality in the tariff rates and domestic consumers in most of the states also had lower tariffs than the actual cost of supply. To make up these losses, the SEBs set higher tariffs for industrial and commercial consumers. This led to the industries generating captive power on their premises and opting out of the grid. The share of industrial consumption in the overall electricity consumption reduced, further declining the SEBs financial situation.
In the financial crisis of 1991 a new power policy was passed in October which officially opened the power sector to private investors, the first time ever since independence. The Electricity (Supply) Act, 1948 was amended to allow private companies own power plants and generate electricity as Independent Power Producers (IPPs). The IPPs were offered lucrative incentives and by about mid-1995, about 189 projects with a total capacity of 75 GW were proposed. But most of these projects were based on expensive liquefied natural gas, natural gas or naptha rather than using the inexpensive poor quality Indian coal.
Electricity 16
Another major breakthrough was the Electricity Act 2003 which created a new paradigm for the development of power sector in the country as it abolished the monopoly of the State Electricity Boards created through the Electricity (Supply) Act, 1948. The Act intends to separate generation from transmission and distribution, with the hope that generation will be subject to market competition. Industry could setup captive generation anywhere and has open access to the existing electricity transmission infrastructure, as long as it pays wheeling charges. Thus it created a new competitive framework for the development of the power sector in the country with focus on the consumers and safeguarding of their interests by independent Regulatory Commissions.
Today, India is a major energy producer as well as consumer. It ranks as the world's 7th largest energy producer accounting for about 2.49% of the world’s total annual energy production. It is also the world’s fifth largest energy consumer, accounting for about 3.45% of the world’s total annual energy consumption in 2004. India experiences an electricity deficit of 9.2% and a peak shortage of 11%1; 23.97% of electricity was lost in transmission and distribution (T&D) while aggregate technical and commercial (AT&C) losses were 26.15%2. Above all, over 499 million are estimated to have no access to electricity (IEA 2007). As on July 2011, 13.22 crore out of 19.16 crore (70%) households have access to electricity. 320 million are estimated to have no access to electricity3. The 11th FYP calls for 80 GW of new electric power to be built between 2007 and 2012 a figure which includes 14 GW from renewable energy (CEA 2008).
Historical Background of Legislative Initiatives4
The central and state governments in India have carried out many legislative and regulatory reforms since mid-1990s which involve establishment of independent electricity regulatory commissions and increased participation of private sector in generation and distribution of electricity. As a consequence of these reforms in the electric power sector and in the overall economy, productivity of electricity use has increased since 1991. Despite these reforms, and the large generation capacity, electricity shortages are endemic throughout the country.
Pre Economic Reform Phase (before 1991)
Pre independence era (up to 1947)
In the pre-independence era, electricity was decentralized. It was generated and supplied locally by private entrepreneurs, enterprising municipalities and provincial governments. The hydroelectric project of Tata in Khandala supplied power to Mumbai (then Bombay), and
1 Government of India, Ministry of Power, Central Electricity Authority, Highlights of Power sector, August 2012
2 Government of India, Ministry of Power, Central Electricity Authority, Highlights of Power sector, August 2012
3 Government of India, Planning Commission, Report of the Working Group on Power for Twelfth Plan (2012-2017)
4 Economic and Political Weekly – Special Articles: S L Rao: The Political Economy of Power; Vol. - XXXVII No. 33,
August 17, 2002

Electricity 17
Mettur dam on Cauvery River supplied power to the Madras Presidency. But the emphasis was on supply to large urban concentrations, and there was little coordination or cooperation between the different suppliers. The first legislation was passed in 1877, which provided for protection of person and property from injury and risks, attendant to the supply and use of electricity for lighting and other purposes. This was repealed and replaced by the Indian Electricity Act 1903, a tentative measure to be amended with experience. The legislation of 1887 and 1903 that provided for private power and minimal regulation, evolved into a more comprehensive Indian Electricity Act, 1910 which regulated generation, supply and use of electricity and dealt with licensing, regulation and safety, giving considerable authority to the provincial governments.
5
Post-independence era (1947-1990)
At the time of independence, electricity generation and supply was concentrated in the hands of private electricity suppliers and largely in urban areas. It was necessary to promote overall growth and development across the country. Hence, the Electricity (Supply) Act, 1948, that was based on the broad lines of the Electricity (Supply) Act, 1926 in force in the United Kingdom, was introduced. It was enacted “to facilitate the establishment of regional coordination in the development of electricity transcending the geographical limits of local bodies”. It provided “for the rationalization of the production and supply of electricity and generally for taking measures conducive to the electrical development of the Provinces of India”. It enabled the creation of state electricity boards for promoting the coordinated development of generation, supply and distribution in the Provinces and in other areas of the country. It enabled the creation of state electricity boards for promoting the coordinated development of generation, supply and distribution in the Provinces and in other areas of the country. It was amended subsequently and significant additions and changes were introduced. Central Electric Authority (CEA) was established to develop a national power policy and coordinate electricity planning over the country at the central level.
5 http://www.powermin.nic.in/indian_electricity_scenario/pdf/Historical%20Back%20Ground.pdf
Salient Features of the Indian Electricity Act, 1910
Provided basic framework for electric supply industry in India.
Growth of the sector through licensees.
Licenses allotted by State Government for supply of electricity in a specified area.
Legal framework for laying down of wires and other works.
Provisions laying down relationship between licensee and consumer.

Electricity 18
The Industrial Policy Resolution of 1956 reserved generation and distribution of electricity exclusively for states. The existing private licensees were however allowed to continue. This led to the gradual domination of electricity sector by government enterprises. Regional Electricity Boards were formed in 1964 to promote regional coordination and operation of power supply.
In 1976, amendments were made which enabled state and central governments to set up generation companies, which resulted in establishment of NTPC, NHPC, North Eastern Electric Power Corporation Ltd. (NEEPCO), Mysore (now Karnataka) Power Corporation, and consulting firm WAPCOS. Joint sector projects between states and central government were also made possible, with Damodar Valley Corporation (DVC), Neyveli Lignite Corporation Ltd. (NLC), etc.
Post Economic Reform Phase (after 1991)
Till 1991, the power sector was mainly under the government ownership under various state and central government owned utilities. However the Indian Power sector had reached a dead end by the 1980s. The total losses of the SEBs without subsidy had crossed Rs. 3000 crore. The sector was facing peak shortages in various parts of the country and severe financial burden was imposed on the state governments because of the performance of the SEBs6.
By amendments in 1991, generation was opened to private investment, including foreign investment. Legislation governing the electricity sector was amended in October 1991 allowing private investor to generate power and sell it to the grid. The policy permitted 100 percent foreign-owned companies to set up power project, without any export obligations. Attractive returns were provided in the policy. Since the policy was based on negotiations leading to tariff
6 Government of India, Planning Commission, Power and Energy Division, Annual Report on the working of State
Power Utilities and Electricity Departments, 2011-12
Main amendments to the Indian Electricity Supply Act
Amendment in 1975 to enable generation in Central sector.
Amendment to bring in commercial viability in the functioning of SEBs – Section 59 amended to make the earning of a minimum return of 3% on fixed assets a statutory requirement (w.e.f 1.4.1985).
Amendment in 1991 to open generation to private sector and establishment of RLDCs.
Amendment in 1998 to provide for private sector participation in transmission, and also provision relating to Transmission Utilities.
Salient features of the Electricity (Supply) Act, 1948
Mandated creation of SEBs.
Need for the State to step in (through SEBs) to extend electrification (so far limited to cities) across the country.

Electricity 19
finalization, the initial projects led to high tariffs. Besides, the poor financial position of the SEBs which are the monopoly purchasers of power, led the central and state governments to offer many artificial comforts to the new investors. Regional Load Dispatch Centers were also established at the same time to operate the power system in a region, ensure regional grid security and to integrate with power systems of other regions and areas. Tariffs in cases of interregional movements and transmission charges were to be determined by the central government on the advice of the CEA.
Further amendments in 1998 opened transmission to private investment, subject to the approval of Central Transmission Utility (CTU).
It was realized that in spite of giving a free hand to foreign investors through the 1991 amendment, not many generation projects could come up, and that unless the sector was restructured & unbundled, investment would not be made in this sector.
The Electricity Regulatory Commissions Act, 1998, enabled the creation of electricity regulatory commissions at the centre and the states. The MERC was established in 1999 under this Act. Such commissions had already been set up in Orissa and Haryana in 1996 and 1998 respectively under state legislations. The primary functions of CERC is to regulate the tariffs of Central Public Sector Undertakings generating companies, tariffs of power generated and supplied inter-state, interstate tariffs for transmission services, regulation of inter-state transmission and issue of licenses to private investors in interstate transmission. The SERCs determine tariffs to be charged to customers, the tariffs and functioning of intrastate transmission including the operation of the SLDC. The enactment of the ERC Act, 1998 was only a partial step towards reforms.
Other than this, three major steps were taken by the government to improve the performance of the power sector. The first was initiation of Accelerated Power Development Program (APDP) in 2000-01 which focused on giving a composite loan/grant to for improving the infrastructure of electric utilities. The name of the scheme was changed to Accelerated Power Development & Reform Program (APDRP) in 2003-03 and the funding was made extremely liberal.
The second step was establishment of Expert Committee for making recommendations for one-time settlement of outstanding dues of all SEBs towards central public sector undertakings and for suggesting a strategy for capital restructuring of the SEBs. The committee recommended that 50% of the surcharge/interest on delayed payments be waived. The rest of the dues along
The Electricity Regulatory Commission (ERC) Act, 1998
Provision for setting up of Central / State Electricity Regulatory Commission with powers to determine tariffs.
Constitution of SERC optional for States.
Distancing of Government from tariff determination.

Electricity 20
with full principal amount aggregating to about Rs. 33,600 crores be secured through bonds issued by the respective state governments.
The third initiative taken was to sign Memorandum of Understanding (MOU) with State governments in order to accelerate the process of reforms. The state governments were encouraged to set up their own electricity regulatory commissions, undertake 100 percent metering, conduct energy audits at 11 KV level, impose minimum agricultural tariff, pay subsidies on time, etc. In return, the Central government promised to increase the share of the State concerned from central generating stations, upgrade the inter-state transmission lines through APDRP funding, extend help for the State’s rural electrification program and provide other financial benefits. By 2005, the Central Government had signed MOUs with all of India’s 28 states7.
7 Government of India, Planning Commission, Power and Energy Division, Annual Report on the working of State
Power Utilities and Electricity Departments, 2011-12
Salient features of the Electricity Act, 2003
No license is required for Generation and captive generation has been freely permitted. Hydro projects exceeding the capital cost notified by Central Government however, need concurrence of the Central Electricity Authority.
No license required for generation and distribution in notified rural areas.
Transmission Utility at the Central as well as State level, to be a Government company – with responsibility for planned and coordinated development of transmission network. Provision for private licensees in transmission.
Trading, a distinct activity recognized with the safeguard of the Regulatory Commissions being authorized to fix ceilings on trading margins, if necessary.
Open access in distribution with provision for surcharge for taking care of current level of cross subsidy with the surcharge being gradually phased out.
Distribution licensees would be free to undertake generation and trading.
The State Governments are required to re-organize the SEBs. However, they may continue the SEB as State Transmission Utilities and licensees for such time the State and Central Government agree.
Setting up of the State Electricity Regulatory Commission made mandatory.
An Appellate Tribunal to hear appeals against the decision of the CERC and SERCs.
Metering of all electricity supplied made mandatory.
Provisions relating to theft of electricity made more stringent.
For rural and remote areas standalone systems for generation and distribution permitted.
Thrust to complete rural electrification and provide for management of rural distribution by Panchayats, cooperative societies, non-government organizations, franchises, etc.

Electricity 21
The Electricity Act 2003 repealed all the existing electricity laws, such as, the Indian Electricity Act 1910, the Electricity Supply Act 1948, etc. but saved various reform acts of some of the states which were already in operation. This Act made it mandatory for all SEBs to unbundle into separate generation, transmission and distribution entities, so as to make them vertically more efficient than vertically integrated utilities. There are several other sections in the Act which talk about open access, quality of supply, standards of performance, etc.
Reforms have played a crucial role in each segment of the power sector. In the generation segment, de-licensing of thermal and captive power generation and generation in rural areas has allowed private players to invest in power generation. The government made distribution a separate segment to improve the segment’s performance.
After the establishment of regulatory commissions, several regulations have been passed; the most important ones being Availability–Based Tariff Order (2002), Terms and Conditions of Tariff (2004), Multi-Year Tariff (MYT) Norms (2004), Electricity Grid Code (2006), and Open Access in Inter-State Transmission (2008).
Availability–Based Tariff Order - Generator and beneficiary set up PPAs on the basis of which generators feed power to the grid and beneficiary draws the power. If buyer overdraws power it has to pay Unscheduled Interchange (UI) charges and if generator overfeeds to the grid it will have to pay UI charges. It has improved the quality of power supply dramatically, brought the much-needed commercial discipline among the generators and utilities, and laid the foundation of a power market. The ABT regime also encourage inter-state trading and merit order dispatch8
Terms and conditions of tariff – These were Introduced in 2004. Norms were laid down to determine tariff for generation, transmission and distribution.
Multi-Year Tariff was introduced to reduce regulatory risk and incentivize efficient performance of utility. It was set up for a fix number of years called control period. In this period fixed charges remain unchanged while energy charges change.
In 2006 the Electricity Grid Codes laid down technical rules covering all the utilities connected through grid or using inter-state transmission system. These codes ensure efficient functioning of power system. CERC is the regulatory body that monitors these codes at the central level while SERC monitors it at state level.
National Electricity Policy (NEP)9 - Under the provisions of section 3(1) of the Electricity Act, 2003, the Central Government is required to prepare the National Electricity Policy for development of power system based on optimal utilization of resources. The Policy was
8 International Journal of Regulation and Governance, Khosla Sunil K, Plummer Judith: How price reform
revolutionized the operational discipline of India's power sector, 2005 9 Government of India, Ministry of Power, National Electricity Policy, February 2005

Electricity 22
prepared in consultation with States, Central Electricity Authority and other stakeholders. It aims at accelerated development of power sector, providing supply of electricity to all areas and protecting interests of consumers and other stakeholders keeping in view availability of energy resources, technology available to exploit these resources, economics of generation using different resources, and energy security issues.
National Tariff Policy
Objectives of NTP
Ensure availability of electricity to consumers at reasonable and competitive rates;
Ensure financial viability of the sector and attract investments;
Promote transparency, consistency and predictability in regulatory approaches across jurisdictions and minimize perceptions of regulatory risks;
Promote competition, efficiency in operations and improvement in quality of supply.
Objectives of NEP
Access to Electricity
Available for all households in next five years.
Availability of Power Demand to be fully met by 2012. Energy and peaking shortages to be overcome and spinning reserve to be available.
Supply of Reliable and Quality Power of specified standards in an efficient manner and at reasonable rates.
Per capita availability of electricity to be increased to over 1000 units by 2012.
Minimum lifeline consumption of 1 unit/household/day as a merit good by year 2012.
Financial Turnaround and Commercial Viability of Electricity Sector.
Protection of consumer interests.

Electricity 23
Installed Capacity in India
The current installed capacity as on August 31, 2012 was 2,07,006 MW, of which 39,291 MW was from hydropower; 1,37,936 MW from thermal power generation, 4780 MW from nuclear and 24,998 MW from renewable sources10. Other than this captive generating capacity of 34,444 MW was also connected to the grid11. As can be seen from the graph, the Indian Power sector is dominated by coal, which is a domestically abundant resource.
Thermal capacity comprises coal (117,833 MW – 85.4%), gas (18,903 MW – 13.7%) and (1120 MW – less than 1%) diesel based capacity. Of the various sources of power generation, coal based installed capacity dominates with 66.6% of the total installed capacity.
Figure 1 –Installed Capacity (MW) in India (March 31, 2007) Figure 2 –Installed Capacity (MW) in India (August 31, 2011)
Capacity addition in the 10th Plan
The cumulative capacity at the end of the 10th plan was 1,32,329 MW which included 34,654 MW from hydro; 86,015 MW from thermal (coal, lignite, gas, oil & diesel); 3,900 MW from nuclear power plants and 6,191 MW from renewable energy sources (small hydro projects, biomass gas, biomass power, urban and industrial waste power & wind energy)12. This capacity comprises central, state and private sectors. Coal based power plants dominate electricity generation as use of coal offers a number of advantages viz. it is often the most economical fuel, especially when compared with natural gas or oil; coal used for power generation is often produced domestically, which enhances energy security; and coal conversion technologies are well-established with a long manufacturing and operational history.
10
Government of India, Ministry of Power, Central Electricity Authority, Monthly Reports, August 2012 11
Government of India, Ministry of Power, Central Electricity Authority, Monthly Review of Power Sector Reports 12
Government of India, Planning Commission, Report of the Working Group on Power for Eleventh Plan (2007-2012), February 2007: Table 1.4

Electricity 24
Capacity addition of 21,080 MW was achieved during the 10th Plan. Capacity expansion had fallen short of targets; both in the 9th and 10th Five-year plans the capacity additions were just about half the targets. The capacity addition targeted and achieved in the 10th is tabulated below13.
Table 1 – Installed Capacity Addition during the 10th
Plan
Type/ Sector
Target Achievement
Central State Private Total Central State Private Total
Thermal 12790 6676 5951 25417 6590 3554 1971 12114
Hydro 7842 5381 1170 14393 4495 2691 700 7886
Nuclear 1300 0 0 1300 1080 0 0 1080
Total 21932 12057 7121 41110 12165 6245 2671 21080
The Central sector was leading the charge of capacity addition accounting for 54% of new capacity addition, followed by state sector (29%) and private sector (17%). None of the sectors achieved the set target. Of the target set, Central sector achieved 55%, state sector 52% while private sector achieved 38%.
Taking into consideration the target set for capacity addition based on source of power generation, hydro power comprised 35%; thermal power 62% and the target set for nuclear power was 3%.
Figure 3 – 10
th Plan Capacity addition target for various
sectors Figure 4 – 10
th Plan Capacity addition achievement by
various sectors
13
http://planningcommission.nic.in/plans/planrel/fiveyr/11th/11_v3/11v3_ch10.pdf

Electricity 25
Figure 5 – 10
th Plan Capacity Addition Target (Source wise) Figure 6 - 10
th Plan Capacity Addition Achievement
(Source wise)
Capacity Addition Target in 11th Plan
The government has set a target of 78,700 MW capacity addition during 11th 5-year plan. It is unlikely that this target can be reached in the 11th Five-year plan (2007 -12)14.
Table 2- 11th
Plan capacity addition target - Sector wise (MW)
Type/ Sector Central State Private Total
Thermal 24840 23301 11552 59693
Hydro 8654 3482 3491 15627
Nuclear 3380 0 0 3380
Total 36874 26783 15043 78700
The central sector in the 11th plan too will be leading the charge in capacity additions with accounting for as much as 47%, followed by state sector (34%) and the private sector (19%), though the target set for central sector was reduced by 7% and that of state and private sectors were increased by 5% and 2% respectively in comparison to the 10th plan.
Figure 7 – 11
th Plan Capacity Addition Target: Sector wise Figure 8 – 11
th Plan Capacity Addition Target: Source wise
14 Government of India, Planning Commission, Report of the Working Group on Power for Eleventh Plan (2007-
2012), February 2007

Electricity 26
The target set for thermal power capacity addition is 76% whereas for hydro and nuclear it is 20% and 4% respectively. A capacity addition of 34,462 MW has been achieved during the first four years of the 11th Plan. Year wise details of the targeted and actual capacity addition during 11th Plan up to 31.03.2011 is given below. Actual achievement during the 11th Five Year Plan has been 54,963 MW15 as against the targeted 78700 MW.
Table 3 - All India target and actual capacity addition during 11th
plan upto 31.3.2011 (MW)
Year Type Target Achievement
2007-08
Hydro 2,372 2,423
Thermal 9,007 6,620
Coal 7,880 5,620
Lignite 0 0
Gas 1,127 1,000
Nuclear 660 220
Total 12,039 9,263
2008-09
Hydro 1,097 969
Thermal 5,773 2,485
Coal 3,820 2,010
Lignite 200 0
Gas 1,753 475
Nuclear 660 0
Total 7,530 3,454
2009-10
Hydro 845 39
Thermal 13,002 9,106
Coal 9,105 6,655
Lignite 1375 335
Gas 2,522 2,116
Nuclear 660 440
Total 14,507 9,585
2010-11
Hydro 1,346 690
Thermal 17,793 11,251
Coal 14,000 9,725
Lignite 1,185 635
Gas 2,608 891
Nuclear 1,220 220
Total 20,359 12161
Grand Total (Up to 31st March 2011) 34,462
15
Government of India, Planning Commission, Power and Energy Division, Annual Report on the working of State Power Utilities and Electricity Departments, 2011-12; Government of India, Ministry of Power, Central Electricity Authority, Operational Performance of Generating Stations, 2011-12

Electricity 27
Growth of India’s Installed Capacity since 6th Plan Period
Growth of installed capacity since the 6th plan is graphically presented in the below. The average growth in installed capacity of thermal and nuclear power since 6th plan was 35%, for hydropower it was 22% and 1372% for renewable energy.
Figure 9: Growth of Installed Capacity (MW) from 6th
Plan till July 2011
Thermal power comprises of coal, gas and diesel based capacity which showed average growth of 31%, 127% and 73% respectively from the end of 6th plan till July 2011. Large increase in growth in gas based installed capacity was registered in the 7th and 8th plan periods. From the end of the 10th plan till July 2011, coal based installed capacity registered 38% growth while gas based capacity showed 29% growth.
Figure 10 – Growth of Thermal Installed Capacity since 6th
Plan

Electricity 28
India Power Supply Position
The table below depicts energy requirement from 2007-08 to 2010-1116. Over the years, power requirement is increasing. Though power shortfalls have reduced, the gap between demand and supply is yet to be bridged. Demand always outstrips availability.
Table 4 - Power supply position (2007-08 to 2010-11)
Year Peak (MW) Energy (MU)
Peak Demand (MW)
Peak Met (MW)
Peak Deficit/ Surplus (MW)
Peak Deficit/ Surplus ( % )
Energy Require-ment (MU)
Energy Avail- ability (MU)
Energy Deficit/ Surplus (MU)
Energy Deficit/ Surplus ( % )
2007-08 108866 90793 -18073 -16.6 739343 666007 -73336 -9.9
2008-09 109809 96785 -13024 -11.9 777039 691038 -86001 -11.1
2009-10 119,166 104,009 -15,157 -12.7 830,594 746,644 -83,950 -10.1
2010-11 125,077 112,167 -12,910 -10.3 862,125 789,013 -73,112 -8.5
Figure 11 – Power supply position (2007-08 to 2010-11)
16
Government of India, Planning Commission, Report of the Working Group on Power for Eleventh Plan (2007-2012)

Electricity 29
Figure 12- Peak demand and peak met (2007-08 to 2010-11)
The tables below provide information on the power requirement and availability for India from April to August 2012. In this time period there was shortage of 8.5% (35,409 MU). In August 2012 there was a power shortage of 9.1%17. Power shortages hamper economic development of the country.
Table 5-Power supply position -India (August 2012)
August 2012 April to August 2012
Requirement (MU)
Availability (MU)
Surplus/deficit Requirement (MU)
Availability (MU)
Surplus/deficit
MU % MU %
82815 75306 -7509 -9.1 418431 383022 -35409 -8.5
Peak demand and Peak met
Table 3 indicates peak demand for the period between April and August 2012. Demand was highest in June 2012 (135,453 MU) resulting in 12,159 MU of power shortfall, a 9% deficit.
Table 6-Peak demand and peak met (August 2012)
August 2012 April to August 2012
Requirement (MU)
Availability (MU)
Surplus/deficit Requirement (MU)
Availability (MU)
Surplus/deficit
MU % MU %
128250 115822 -12368 -9.6 135453 123294 -12159 -9.0
17
Government of India, Ministry of Power, Central Electricity Authority, Monthly Reports, August 2012

Electricity 30
Maharashtra Power Scenario
Maharashtra is the second largest state in India both in terms of population and geographical area (3.08 lakh sq. km.). Total population of the state is 11.2 crore (precisely 11,23,72,972 Census 2011) with 45.2% people residing in urban areas and 54.8% in rural areas. The population density is 365 per sq.km18.
Maharashtra state was created in 1960. In the subsequent years, Maharashtra State Electricity Board (MSEB) made significant progress as compared to the other SEBs. This was achieved in spite of not including the industrial mega-city like Mumbai in MSEBs service area. The annual turnover of MSEB in 2000-01 amounted to Rs. 12,500 crores, which was highest among all SEBs, and equivalent to the annual budget of some medium-sized states in India.
Electricity supply grid of Maharashtra is a part of the Western region electricity grid in the country and shares electricity with the neighboring Gujarat, Madhya Pradesh, Chhattisgarh, Goa, Daman & Diu and Dadra Nagar Haveli.
Figure 13 - Western grid: Maharashtra, Gujarat, Madhya Pradesh, Chhattisgarh, Goa, Daman & Diu Dadra Nagar Haveli
19
18
Government of Maharashtra, Department of Planning, Directorate of Economics and Statistics: Economic Survey of Maharashtra 2011-12, Ch.9 Infrastructure; Government of India, Ministry of Home Affairs, Census of India, 2011 19
Government of India, Power System Operation Corporation Ltd, Western Region Load Despatch Centre, Annual Report 2010-11

Electricity 31
Maharashtra State Electricity Board (MSEB) is a state-owned electricity utility established in June 20, 1960 with generation, transmission and distribution functions, operating within the state of Maharashtra. MSEB is the largest and only state-owned electricity provider in Maharashtra with around 186 lakh consumers. According to provisions of the Electricity Act 2003, the state government restructured MSEB and formed separate companies for generation, transmission and distribution. GoM unbundled MSEB into four companies’ w.e.f. 6th June 2006 into MSEB Holding Company Ltd, Maharashtra State Power Generation Company Ltd (MSPGCL), Maharashtra State Electricity Transmission Company Ltd (MSETCL) and Maharashtra State Electricity Distribution Company Ltd (MSEDCL). The holding company is chaired by the State Energy Minister. The state established Maharashtra Electricity Regulatory Commission (MERC) in 1999 under the Central Electricity Regulatory Act 1998.
M.S.E.B. Holding Co .Ltd – This Company produces, distributes, and transmits electricity through its subsidiaries MSPGCL, MSETCL and MSEDCL.
Maharashtra State Power Generation Company Ltd (MSPGCL) –The main functions of MSPGCL, also known as “MahaGenCo” is to establish, operate and maintain generating stations, tie-lines, substations and dedicated transmission lines and supply electricity to licensees and consumers. The total installed capacity of MahaGenCo is 9996 MW, which includes thermal, gas and hydropower generating stations.
Maharashtra State Electricity Transmission Company Ltd (MSETCL) – The main function is to develop the intra state transmission system as well as ensure safety and stability of the grid.
MSETCL has 559 EHV substations with transformation capacity of 89,178 MVA and transmission circuit of 39,871 circuit km.
Table 7- Transmission system network of MSETCL (as on 31.3.2012)20
Voltage level
EHV Substations
Transformation Capacity (MVA)
EHV Lines
(ckt. km)
500 kV HVDC 2 3582 1504
400 kV 22 18180 7405
220 kV 171 39383 13209
132 kV 260 21633 12073
110 kV 34 2674 1724
100 kV 36 2587 686
66 kV 34 1139 3270
Total 559 89178 39871
20
http://www.mahatransco.in/

Electricity 32
Maharashtra State Electricity Distribution Company Ltd (MSEDCL) – It is one of the largest public sector company engaged in power distribution and serves 193 lakh consumers in Maharashtra State, excluding the city of Mumbai.
Table 8 - Total No. of Consumers of MSEDCL21
Category of consumers
No. of consumers (in Lakh)
Domestic 143.00
Commercial 13.79
Industrial 3.63
Agriculture 31.7
Others 10.00
Total 202.12
Maharashtra’s power system is bifurcated into that of Mumbai “served Tata Power Companies (TPC) and Reliance Energy Limited (REL - erstwhile BSES Ltd.) and Bombay Electricity and Suburban Transport (BEST), a state government undertaking” and the rest of the state served by MSEDCL.
The operations of Tata Power and Reliance include power generation, transmission and distribution, while BEST is a distribution utility with no generation of its own and receives electricity from Tata Power.
Tata Power has 1200 circuit km transmission network and a 935 km HT and LT cable distribution network connecting 17 major receiving stations and over 85 sub-stations in its Mumbai License area22.
Mula Pravara Electric Cooperative Society (MPECS) was the only rural electric cooperative distribution utility in the state established in 1969. It served nearly 183 villages spread over five talukas in Ahmednagar district catering to 1.45 lakh customers. It also had its own network to supply electricity to the consumers in its area of operation. It was awarded a 20 year license in 1971, which was renewed in 1991 up to 2011. According to MSEDCL, MPECS since 1977 had defaulted in payment of regular bills to erstwhile MSEB, and it continued with its habit. The accumulated arrears of MPECS had amounted to Rs. 2316 crore in March 201223. After the Maharashtra Electricity Regulatory Commission’s order dated January 27, 2011, MSEDCL has started distribution of electricity in the area which was previously within the territorial jurisdiction of Mula Pravara Electricity Cooperative Society from February 1, 2011.
21
http://www.mahadiscom.in/aboutus/mahadiscom-Company_profile.pdf http://www.mahadiscom.in/aboutus/abt-us-01.shtm 22
http://www.tatapower.com/services/transmission.aspx 23
Reply to RTI from MSEDCL

Electricity 33
Installed Capacity
The total installed capacity in Maharashtra from the power generating stations of the state, Centre and private sectors is 26,838 MW. This includes 11,956 MW of MSPGCL (State) and 8600 MW of private sector (Tata, Reliance, JSW, Wardha Power Company Ltd as well as Renewable Energy projects incentivized by Ministry of New and Renewable Energy) and 6282 MW from Central sector24. Of the total power installed capacity of the central power generating stations, Maharashtra gets a share of 4282 MW i.e. 68% from the central power generating stations located in the state is allocated for use in Maharashtra (As of August 31, 2012)25. Coal power plants dominate the power sector in the state.
Figure 14 - Installed Capacity in Maharashtra from State, Private and Central Sectors
Table 9 – Installed Capacities of Power Utilities in Maharashtra State
Coal Gas Diesel Total Thermal
Nuclear Hydro Renewable Grand total
State 8400 672 0.00 9072 0.00 2884 0.00 11956
Private 4246 180 0.00 4426 0.00 447 3726 8600
Central 2968 2624 0.00 4932 690 0.00 0.00 6282
Sub Total 15614 3476 0.00 19090 690 3331 3726 26838
24
Government of India, Ministry of Power, Central Electricity Authority, Monthly Reports, Installed capacity (in MW) of Power Utilities in States/UTS located in Western Region including allocated shares in joint & Central sector utilities http://www.cea.nic.in/reports/monthly/inst_capacity/aug12.pdf 25
Government of India, Ministry of Power, Central Electricity Authority, Allocation of Power from Central generating Stations, August 31, 2010 http://www.cea.nic.in/reports/monthly/gm_div_rep/power_alloc_wr.pdf

Electricity 34
Of the total installed capacity, the state comprises 44.5%; central power generating stations comprise 23.4% of the installed capacity while private power generating stations comprise 32.1%.
Figure 15 - % Share (State, Private and Central Utilities) of installed capacity
Installed capacity available for use in Maharashtra
Total installed capacity available for use in Maharashtra is 23,506.09 MW, of which 20,897.09 MW is available for use in Maharashtra and 2609 MW is available for consumption in Mumbai. The power available in Mumbai is generated by private power generators viz. Tata Power Company Ltd. and Reliance Infrastructure. Power available for use in Maharashtra is generated by the state power generating company “MahaGenCo/ MSPGCL”, private, interstate, and central power generating plants.
A list of existing power plants in the state is provided in Annexure I. The list of proposed power plants by state and central power generating companies is provided in Annexure III.

Electricity 35
Table 10 – Installed Capacity available in Maharashtra and Mumbai
Power generating station Installed
capacity (MW) Installed Capacity in Maharashtra (except Mumbai)
MahaGenCo 9948.83
Interstate hydroelectric projects 444.5
RGPPL 1967
Tarapur (Nuclear – share of state)26 552
Share from Centre 3634
Power from Private hydropower projects 120
Wardha Power Company Ltd (Thermal) 27 (Private)
540
JSW energy (Thermal) 28 (Private) 600
Captive Power (Private Power plants)29 1051
Renewable (Wind Power – Private) 2309.76
Sub - total 21167.09
Installed Capacity available in Mumbai
Tata & Reliance Thermal Power stations 1900
Tata gas power stations 180
Tata hydroelectric power stations 447
Tata renewable energy 82
Sub - total 2609
Total 23776.09
Maharashtra state’s share in the total installed capacity (in Maharashtra except Mumbai) is 59% (includes share of interstate projects and RGPPL); followed by 21% share of private sector and 20% is contribution of central sector.
26
Government of Maharashtra, MSETCL, STU Five Year Transmission Plan for the year 2010-11 to 2014-15 27
Government of Maharashtra, Department of Planning, Directorate of Economics and Statistics: Economic Survey of Maharashtra 2010-11, Ch.9 Infrastructure, December 2010 28
Government of Maharashtra, Department of Planning, Directorate of Economics and Statistics: Economic Survey of Maharashtra 2010-11, Ch.9 Infrastructure, December 2010 29
Government of Maharashtra, Department of Planning, Directorate of Economics and Statistics: Economic Survey of Maharashtra 2010-11, Ch.9 Infrastructure, March 2010

Electricity 36
Figure 16 - Sector wise installed capacity (MW) for use in Maharashtra (except Mumbai)
Increase in installed capacity
Table 11 - Installed capacity - Maharashtra
Month Installed Capacity (MW)
Month Installed Capacity (MW)
Month Installed Capacity (MW)
2009-10 2010-11 2011-12 April 17429 April 18055 April 19380
May 17429 May 18150 May 19680
June 17429 June 18280 June 19705
July 17478 July 18280 July 19981
August 17478 August 18580 August 20481
September 17478 September 18580 September 20481
October 17523 October 18756 October 20781
November 17785 November 18516 November 20781
December 17785 December 18925 December 20951
January 17795 January 19059 January 20951
February 18045 February 19295 February 21546
March 18305 March 19295 March 23341
State (MahaGenCo) Power Generating Plants
The total installed capacity of MahaGenCo is 11700 MW from thermal, gas and hydropower plants and renewable energy. It has seven thermal (coal based) power generating stations with a total installed capacity of 8400 MW. The total installed capacity of hydropower is 2600 MW. This includes Koyna power generating as well as small hydropower stations. The state has one gas-based power plant of installed capacity 672 MW comprising seven units and two units of

Electricity 37
waste heat recovery of 120 MW each. The renewable energy installed capacity is 25 MW, which is from solar. A list of power plants is given in Annexure I.
Thermal (coal) power plants dominate with 71% of the total installed capacity followed by hydropower (22%) and gas based installed capacity (7%). The contribution of renewable energy is negligible.
Figure 17 - State (MSPGCL) Power generation sources
Interstate Power Plants
In Maharashtra, there are two interstate hydropower projects viz. Pench (160 MW) and Sardar Sarovar (1450 MW). The state receives 33% (53 MW) and 27% (391.50 MW) of electricity from Pench and Sardar Sarovar respectively.
State and Centre Power Plants
The total installed capacity of Ratnagiri Gas and Power Private limited (RGPPL) is 1967 MW. The plant has three blocks viz. Block I comprising 640 MW and Block II and III of 663.5 MW each. NTPC and GAIL have a 30.17% stake each in RGPPL, while MSEB Holding Company has 17.90% shares and 21.77% shares are owned by financial institutions30.
Power Plants operated by Government of India
Nuclear Power Nuclear Power Corporation of India Ltd (NPCIL)
Tarapur Atomic Power Station (TAPS) was the first nuclear power plant in India. The total installed capacity is 1440 MW31 and the state’s share is 552 MW32.
30
http://www.rgppl.com/index.php?option=com_content&view=article&id=64&Itemid=75 31
http://www.npcil.nic.in/main/AllProjectOperationDisplay.aspx

Electricity 38
Private Power Plants
Hydropower Plants
The total power available for the state from private hydropower stations is 120 MW.
Thermal Power Plants
Two power plants by private companies have been commissioned viz. JSW in Ratnagiri and Wardha Power in Warora from which 600 MW and 270 MW33 power is available for distribution by MSEDCL through Power Purchase Agreements (PPA). Wardha power plant comprises two units of 135 MW each which were commissioned on June 5, 2010 and October 10, 2010. JSW comprises two units of 300 MW each commissioned on August 24, 2010 and December 9, 201034. A third unit of Wardha Power was also commissioned on January 21, 2011. The number of private power plants (coal and gas based) is increasing. A list of proposed power plants in Maharashtra from private sector is provided in Annexure I.
Since power demand has always been more than the power supply, MSEDCL had taken several measures to meet the demand by entering into PPAs with private power generators.
In 1990, MSEB entered into power purchase agreements with three major Independent Power Producers (IPPs) viz. Enron (Dabhol -2284 MWLNG); Reliance (447 MW liquid fuel Patalganga Project) and Ispat (Bhadrawati - 1082 MW coal project). Of these three, Enron’s Dabhol was the most controversial project. First phase of this project (740 MW) started generation in 1999 but generation stopped since May 2001, after MSEB rescinded the PPA on grounds of false declaration by the company. Timeline of this project is given in the box below. The PPA between Reliance (second IPP) and MSEB was amended after establishment of MERC. However on disclosure of all contracts relating to IPPs, Prayas (an NGO) filed a petition before the MERC, this was because all PPAs need to be approved by MERC as per the Act. In response to this appeal, MERC issued an order that unless MSEB/Reliance approached them for approval of amendments, the same cannot be legally valid. Since then the project has been shelved as Reliance has not approached MERC on this issue. The third IPP (Ispat’s Bhadravati coal project) has also been abandoned mainly due to several controversies relating to fuel supply and cost. From 1995 to 2007-08, there was no capacity addition by MSPGCL due to sole reliance on Enron. However, MSGPCL increased the installed capacity thereafter as per the XI FYP.
32
Government of Maharashtra, MSETCL, STU Five Year Transmission Plan for the year 2010-11 to 2014-15 33
Government of Maharashtra, Department of Planning, Directorate of Economics and Statistics: Economic Survey of Maharashtra 2010-11, Ch.9 Infrastructure, December 2010 34
http://www.cea.nic.in/reports/proj_mon/tpp_11plan.pdf

Electricity 39
35
MSEDCL, since its formation entered several PPA/ LoIs with the centre, other states as well as independent power producers. (A list of PPA/ LoIs is attached in Annexure I). In 2005-06, the GoM signed MoUs with 8 private companies to generate 12,500 MW power. Electricity would be purchased at competitive prices from these companies. List of these companies is tabulated below. However there is no progress in these projects till date. These projects require vast tracts of land. In an effort to provide land to these companies, the government allotted same piece of land to TPC and Reliance to set up a power plant. No regulatory process has been carried out and there is no further progress besides the signing of MoUs.
35
http://indianpowersector.com/about/case-study/ & http://www.rgppl.com/
Timeline of the Enron’s Dabhol project (now RGPPL):
1992- GoM, GE, Enron, Bechtel signs MoU.
1993- PPA signed.
1995- Construction of phase I began; Change in Government of Maharashtra; Project Scrapped.
1996- Renegotiation; Construction of phase I resumes.
1999- Phase I becomes operational.
2000- MSEB begins to default.
2001- Enron files for bankruptcy; DPC shuts down.
July 2005 – The plant is taken over by Ratnagiri Gas and Power Private limited (RGPPL). (RGPPL was incorporated under the Companies Act, 1956 on 8th July, 2005 and is promoted by NTPC Limited & GAIL (India) Limited. The company was set up to take over and revive the assets of Dabhol Power Company Project. RGPPL owns an Integrated Power generation and Re-gasified LNG facility. The power station is India's largest operating gas based combined cycle power station).
Oct.2005-The project was taken over by a conglomerate that included public sector banks, MSEB, GAIL, NTPC and some financial institutions.
May 2006 – Ratnagiri Gas and Power Pvt. Ltd. (RGPPL), a special purpose vehicle started operation.
4 July 2006 - RGPPL shutting down the plant due to a lack of naphtha supply.
April 2009 - The Dabhol Power Plant Project is operational with 900 MW RLNG fired running capacity.
31st March 2010- Ratnagiri Gas and Power Pvt. Ltd. (RGPPL) the company that now owns the project made all six gas turbines operational earlier this year, achieving full capacity of 1,940 MW (de-rated from the original installed capacity of 2,184 MW because of problems with equipment).
November 2010- Half yearly profits at Rs. 220 crore during the current fiscal.

Electricity 40
Table 12 - MoUs signed with Private Power Companies in 2005-06
Name of the Company Power generation (MW)
Central Indian Power Co. ltd. 2000
Ispat Energy 1000
Essar 1500
GMR Energy 1000
Spectrum Technology 500
Tata Power Corp 1500
Jindal Power Corp 1000
Reliance Energy 4000
Total 12,500
Captive Power Plants
The installed capacity of captive power plants in the state was 1273.209 in the year 2005-06 which grew to 2926MW36 up to March 2010. The installed capacity of the captives ranges from 1MW to 350MW. Captive power plants set up use varied fuels such as diesel/ liquid fuels, coal, bagasse, biomass, cogeneration/ waste heat recovery and natural gas. 1051 MW of captive power is available with MSEDCL for distribution.
Renewable Energy
Electricity generation from wind, solar, small hydro projects, bagasse cogeneration, biomass and urban and industrial waste is categorized as renewable energy. The installed capacity of bagasse, biomass and industrial waste power plants are included in the installed capacity of captive power plants. The total installed capacity form wind power was 2733 MW as of March 31, 201237.
Power plants for Mumbai
Tata Power has 1400 MW of thermal (coal) power capacity, 447 MW of hydropower capacity, 180 MW of gas based capacity and 82 MW from renewable power. This power is used to meet the requirements of Mumbai, through its own distribution and through BEST (Brihanmumbai Electric Supply & Transport Undertaking)
Reliance has a 500 MW coal based power plant at Dahanu. This power is used for consumption in Mumbai.
36
Captive Power in India, 2010, pp. 197-203, List of captive power plants 37
Government of India, Ministry of New and Renewable Energy

Electricity 41
Maharashtra - Electricity Demand and Supply position
Demand supply variations
Demand for electricity varies throughout the day, over the course of the week, and seasonally. Demand is also impacted by location, population and climate. To meet the constantly changing demand for electricity, peak and intermediate power plants are a critical component of the electricity supply system.
Base load power plants (Coal, nuclear, combined cycle gas turbine; hydropower depending on regional availability) produce continuous, reliable and efficient power at low costs. These plants run continuously all year except when they require unforeseen repairs or are scheduled for maintenance. Their reliability to meet the base demand - to continuously supply electricity to consumers - helps keep their operation costs low and offers stable, attractive pricing through long term agreements. The rule of thumb is that base load power is usually 35–40% of the maximum load during the year. These plants have high capital costs and low variable costs. Sharp increases in demand are handled by intermediate or peak power plants.
Peak load power plants i.e. peaking plants, provide electricity at periods when consumers are using the most power. Peaking stations are designed to be highly responsive to changes in electrical demand and can be started up quickly. However the peak power stations are generally smaller than the base load power plants. These are characterized by low capital costs and higher variable costs.
Intermediate power plants cover electricity demand between base load and peaking plants. They typically operate between 30 and 60% of the time in accordance with daily, weekly and seasonal demands. Given their sporadic nature, wind and solar can only be used as intermediate power sources because they cannot be relied upon to meet constant supply needs, nor can they be immediately called upon to generate electricity during peak demand periods.
Due to large fluctuations in supply and demand, energy providers must be able to respond to changing conditions in order to meet consumer energy needs across time and space demand variations. Demand variations are given below
1. Annual and seasonal demand variations Driven by
a. Economic growth b. Weather change c. Change in usage such as lighting and air conditioning
2. Weekly demand variations Driven by
a. Working day (industries – mechanical, IT, etc.) Vs. public holidays/ weekends 3. Daily demand variations

Electricity 42
Driven by a. Time of Day b. Weather
4. Demand would also be affected by population increase and lifestyle changes as urbanization increases.
Peak demand, availability and shortage
Peak demand and availability in Maharashtra is tabulated below. Peak demand refers to the period of highest consumer demand for power. Peak demand has increased significantly in the state from 11895 MW in 2001-02 to 21045 MW in 2011-12. Peak supply increased from 10879 MW in 2001-02 to 16577 MW in 2011-12. The gap between demand and supply increased from 1016 MW to 4468 MW in the same time period. Since Mumbai does not have power cuts, power shortfall is applicable for MSEDCL distribution area.
Table 13 - Peak Demand & Availability status in Maharashtra from 2001-02 to 2011-1238
Year Peak Demand (MW) Availability (MW)
Peak Shortfall (-) /Surplus (+)
(MW) State MSEDCL Mumbai
2001-02 11895 10119 1776 10879 -1016
2002-03 13418 11425 1993 10997 -2421
2003-04 13692 11357 2335 11650 -2042
2004-05 14822 12749 2073 11777 -3045
2005-06 16094 14061 2033 11889 -4205
2006-07 17161 14825 2336 12634 -4527
2007-08 18133 15689 2444 12856 -5277
2008-09 18098 15656 2442 13157 -4941
2009-10 19120 16582 2538 14952 -4168
2010-11 19850 17150 2700 15968 -3882
2011-12 21045 18145 2900 16577 -4468
Under normal situations there is a balance between demand and supply. Until 1998-99, there was sufficient generation capacity to meet Maharashtra’s peak demand for electricity. Since then, however, demand has exceeded the available system capacity resulting in shortage. Power shortage has increased over the years from 2001-02 till 2011-12.
38
Government of Maharashtra, MSETCL, STU Five Year Transmission Plan for the year 2010-11 to 2014-15

Electricity 43
Table 14- MSEDCL Supply and shortfall of electricity at peak demand (MW)
Year Peak Demand
Supply Shortfall
2001-02 10119 9103 1016
2002-03 11425 9004 2421
2003-04 11357 9315 2042
2004-05 12749 9704 3045
2005-06 14061 9856 4205
2006-07 14825 10691 4134
2007-08 15946 10078 5868
2008-09 15630 10747 4883
2009-10 16582 12414 4168
2010-11 17150 13268 3882
2011-12 18145 13677 4468
Figure 18 - Demand -Supply (MSEDCL)
Annual / seasonal demand and supply variations in MSEDCL distribution area
Seasonal data analysis is used to identify periods when supply-demand balance comes under strain. Figure 17 shows the seasonal energy demand variation from April 2009 to March 2012 for MSEDCL distribution area. Demand peaks in winter and summer months (December to May) whereas reduces in monsoon (June to September). The highest demand in 2009-10 and 2010-11 was in March while in 2011-12 the demand was at its peak in December. Peak demand-supply gap reduced in 2010-11 (18.2%) but again increased in 2011-12 by 13.1%.
Figure 19- Seasonal Electricity Demand Pattern (2009-10 to 2011-12)

Electricity 44
Table 15 – Variation in monthly energy demand
Year Month
Peak Demand (MW)
Peak Supply (MW)
Peak Demand- Supply Gap (MW)
% of Load shed
20
09
-10
Apr 16494 12141 4353 26.39
May 15820 11897 3923 24.80
Jun 14976 11321 3655 24.41
Jul 13635 10399 3236 23.73
Aug 17121 11388 5733 33.49
Sep 15482 11545 3937 25.43
Oct 16232 11859 4373 26.94
Nov 16520 11881 4639 28.08
De 16000 11713 4287 26.79
Jan 16210 11746 4464 27.54
Feb 16548 12069 4479 27.07
Mar 17512 12788 4724 26.98
(a)17512 (b)12788 (c)5733
20
10
-11
Apr 17378 13206 4172 24.01
May 17364 13001 4363 25.13
Jun 16400 11711 4689 28.59
Jul 14553 12310 2243 15.41
Aug 14304 11211 3093 21.62
Sep 14699 11757 2942 20.01
Oct 15938 12511 3427 21.50
Nov 15694 12234 3460 22.05
Dec 17308 13573 3735 21.58
Jan 17233 13247 3986 23.13
Feb 17676 13624 4052 22.92
Mar 17477 14063 3414 19.53
(a)17676 (b)14063 (c) 4689
201
1-1
2
Apr 17551 14298 3253 18.53
May 17596 13582 4014 22.81
Jun 16564 13838 2726 16.46
Jul 16023 12930 3093 19.30
August 15926 12713 3213 20.17
Sep 17811 12574 5237 29.40
Oct 18103 13140 4963 27.42
Nov 18649 13571 5078 27.23
Dec 18829 13526 5303 28.16
Jan 17603 13419 4184 23.77
Feb 17476 14196 3280 18.77
Mar 17335 13847 3488 20.12
(a)18829 (b)14298 (c) 5303
(a)– Installed Capacity at year end; (b) (c) (d) – peak of the year

Electricity 45
Daily variation in peak demand and supply
Daily variation in peak demand and supply has been analyzed for monsoon and summer.
In 2009, demand started increasing from the month of August, which usually starts increasing from September. It can be seen that during public holidays and week days the demand is low. The lowest peak demand was 11507 MW on 23rd August 2009 (Sunday) while highest of 15171 MW was on 17th August 2009 (Monday), the first working day of the week.
Figure 20 - Daily peaks (demand-supply) and average supply in monsoon (August 2009)
Figures 19 & 22 show morning and evening peak electricity demand for March 2012 (financial year end). Load management provides 14% peak demand relief in the morning (2400 MW) and 25% relief in the evening peak (3500 MW).

Electricity 46
Figure 21 - Daily morning peaks (demand-supply) and average supply in summer month (March 2012)
Figure 22- Daily evening peaks (demand-supply) and average supply in summer month (March 2012)

Electricity 47
The month of October was chosen for analysis as Diwali happened to be in this month. During this period the peak demand was lowest (26th-28th October), which was lower than the monsoon peak demand, which is the lowest in the year. It can be seen that the demand over the month decreases on weekends and increases on Monday. The demand on Thursday also shows a dip. On an average the demand has increased by 3.7% from Sunday to Monday. The highest peak demand was seen on 10th and 24th of the month. Hourly demand curve for 24th October is also shown (Figure 23).
Figure 23 - Daily peaks (demand-supply) and average supply in October 2011
Figure 24 - Hourly demand curve- 24 October 2011
The graph above represents power demand met over 24 hours on October 24, 2011. This was the day of the month with highest peak demand. Power demand is relatively low in the early morning hours and late night hours.

Electricity 48
Figure 25 - Comparison of Installed Capacity and Generation
The graph above shows installed capacity, online capacity (OLC) and generation for the day. OLC is the maximum power that can be generated. It is usually less due to real time problems like availability of fuel & other resources, planned & forced outages, etc.
Power generation (converted into MW from ‘million units’ electricity generated) is close to OLC. If OLC is maintained at par with installed capacity demand could be met easily.

Electricity 49
Electricity Consumption across Sectors in Economy
Electricity demand is classified into six different consumer groups: (i) Agriculture, (ii) Industry, (iii) Domestic, (iv) Commercial, (v) Railways and, (vi) Others (i.e. municipal, public institutions).
Over the last few decades, economic growth, liberalization, power sector reforms and rapid expansion of urban areas have affected electricity consumption patterns in Maharashtra significantly. Figure below gives the sector-wise break-up of electricity consumption from 1980-81 to 2010-11. Consumption of electricity has increased from 14,034 mkWh to 87,397 mkWh, a change of 522.8% in 20 years. As per the Daily System Report the electricity consumption almost reached 1 lakh MU in 2011-12. The share of industrial consumers has dropped considerably from 58% to 39%, whereas the share of the domestic sector has increased from 13% to 22%, this can be attributed to population growth and changes in lifestyle which increased dependency on electrical appliances. Share in consumption of agriculture and commercial sectors has increased by 6%. Electricity consumption of the domestic has increased the most over the years, largely due. In 1980-81, industries consumed more than half the total demand. In 2010-11, the overall demand of industries decreased as most of the big industries switched to captive power. Industrial sector accounts for 39% of the total electricity consumption, which is followed by the domestic sector with 22%.
14,034 million kWh
87,397 million kWh39
Figure 26- Changing share of electricity in Maharashtra across various sectors
Per capita Electricity Consumption
The per capita consumption of electricity of the all states and Union Territories is given below. If we compare Andhra Pradesh, Karnataka, Gujarat and Tamil Nadu which are more or less of the same geographical area and economic status as that of Maharashtra, it can be seen that per capita consumption of electricity in Maharashtra is lower than Gujarat and Tamil Nadu. Per capita power consumption in different states in India is as follows:
39
Government of Maharashtra, Department of Planning, Directorate of Economics and Statistics: Economic Survey of Maharashtra 2010-11, Ch.9 Infrastructure

Electricity 50
Table 16- Per Capita electricity consumption in India
States / UTs
Per Capita Consumption
(kWh)
States / UTs
Per Capita Consumption
(kWh)
Haryana 1222.21 Rajasthan 736.20
Himachal Pradesh 1379.99 Uttar Pradesh 348.37
Jammu & Kashmir 952.02 Uttarakhand 1112.29
Punjab 1526.86 Chandigarh 1340.00
Tamil Nadu 1131.58 Delhi 1651.26
Puducherry 1743.37 Tripura 335.47
Lakshadweep 418.14 Gujarat 1615.24
Mizoram 376.99 Madhya Pradesh 602.07
Bihar 122.11 Chhattisgarh 1546.94
Jharkhand 880.43 Maharashtra 1028.22
Orissa 874.26 Goa 2263.63
West Bengal 550.16 Daman & Diu 7118.23
A & N Islands 493.98 D & N Haveli 11863.64
Sikkim 850.00 Nagaland 218.03
Arunachal Pradesh
470.00 Andhra Pradesh 966.99
Assam 204.80 Karnataka 903.24
Manipur 240.22 Kerala 525.25
Meghalaya 675.19 India 779
Figure 27- Generation and Consumption of Electricity in selected states

Electricity 51
Sector-wise Electricity Consumption
The aggregate energy consumption during 2010-11 was 87,937 mkWh higher by 10.4% compared to the previous year (79,139 mkWh) and higher by 56.9% as compared to 2004-05. Energy consumption for each of the sectors is tabulated below40.
Table 17-Energy consumption in Maharashtra (million kWh)
Category 04-05 05-06 06-07 07-08 08-09 09-10 10-11 %change 11-12*
Industry 22515 25692 26535 30323 28850 30866 34416 11.5 26687
Domestic 12916 13572 14284 15553 16878 18171 19547 7.6 16484
Agriculture 10733 11094 9749 12676 12733 13925 16257 16.7 15515
Commercial 5420 4841 6940 6661 9102 10546 11571 9.7 9047
Administrative Purposes
Public Works 2174 2148 2272 2520 2560 2658 2310 -13.1 2260
Railways 1850 1861 1987 2024 2110 2119 2707 27.7 1657
Miscellaneous 76 79 318 82 761 854 589 -31.0 217
Total 55684 59287 62085 69838 72994 79139 87397 71867
% Total change 6.5 4.7 12.5 4.5 8.4 10.4 *Upto December 2011
The industrial sector (39%) is the largest consumer of electricity followed by domestic (22%), agriculture (18%) and commercial sector (13%). There was a high increase in the consumption of electricity in the commercial sector (43.4%) whereas the use by the agriculture sector decreased by 12% in the year 2006-07.
Figure 28- Category wise electricity consumption from 2004-05 to 2010-11
40
Government of Maharashtra, Department of Planning, Directorate of Economics and Statistics: Economic Survey of Maharashtra

Electricity 52
Industrial consumers
The industrial sector is the largest power consumer. A few energy intensive industries are fertilizers, aluminium, textiles, cement, iron and steel pulp and paper with iron and steel being the largest consumer of energy. A few energy intensive industries under the Energy Conservation Act 2001 are listed below.
Thermal Power Station – 30000 metric tonnes of oil equivalent (MTOE) per year & above.
Fertilizer – 30000 MTOE per year and above.
Cement - 30000 MTOE per year and above
Iron & steel - 30000 MTOE per year and above
Chlor-Alkali-12000 MTOE per year and above.
Aluminum - 7500 MTOE per year and above
Railways workshop - 30000 MTOE per year and above
Textile - 3000 MTOE per year and above
Pulp & paper - 30000 MTOE per year and above
Transport
Chemicals and
Sugar Industry
Other than these many other small and medium industries as well as the IT industries require energy. The IT industries in particular require energy for space cooling as well. In the current year industrial load shedding was for 24 hours in the beginning and was later increased to 40 hours every week. The MCCIA stated that due to heavy power cut offs the industrial production decreased by around 16% during this time period. The industrial power consumption however had increased from 25,692 in 2005-06 to 26,535 million kWh in the year 2006-07.
Commercial consumers
The commercial users could be divided into small shops, malls, plazas, multiplexes, hotels (small restaurants, 3 and 5 star hotels) and hospitals. The MSEDCL distributed electricity to 13.79 lakhs commercial consumers as on 31.3.2012. The electricity consumed by the commercial sector in

Electricity 53
the year 2010-11 was 11571 million kWh. The malls and multiplexes consume a large amount of power. Apart from the daily lighting needs, they require power for advertisements of products that are constantly run on screens, advertisements banners, space cooling as well escalators that operate continuously.
Domestic consumers
The domestic electricity consumption increased with changing lifestyles with most of the households using electronic appliances like washing machine, air conditioner, geyser, boiler, heater, microwave, refrigerator, etc. The demand by the domestic sector is high in the morning and evening hours. The electricity consumption for this sector increased from 18,171 kWh for 2009-10 to 19,547 kWh for 2010-11 and which will continue to increase with the rise in population and standards of living. There were 143 lakh domestic consumers as on 31.03.2012 as stated by the MSEDCL and electricity consumed was 20000 million kWh for 2011-1241.
Maharashtra - Rural energy scenario
The rural consumers need energy as electricity for agriculture, cottage based industries and lighting; and for cooking by using traditional sources. Thus the rural energy scenario is dividing into the electricity users (mostly agriculture consumers as power requirement is more) and the fuel wood consumers for cooking which comprises women.
Electricity Requirement
70% of the population still lives in rural areas and meeting their energy requirements in a sustainable manner is a challenge. Electricity is predominantly required for agriculture (lift irrigation) and other important activities like small and medium industries, khadi and cottage industries, schools health centers, and Gram Panchayat.
Today after 60 years of independence, Maharashtra state boasts of 100% rural electrification with financial support from Rural Electrification Corporation (REC) and GoM. In spite of this there is a long list of paid pending agricultural consumers and long duration of power cut offs. In the current year rural areas faced a power cut off for 12-16 hrs. This has not only affected the agricultural industry but also made life difficult for the rural population. Some of the issues faced by the rural sector are listed below:
High cost of supply due to low density and low load factors
High T & D losses
Low paying capacity of consumers
Need of subsidy for some category of consumers
41
Government of Maharashtra, Department of Planning, Directorate of Economics and Statistics: Economic Survey of Maharashtra 2011-12, Ch.9 Infrastructure

Electricity 54
Lack of commercial funding for expansion of network
Definition of village electrification42
The basic infrastructure such as distribution transformer and or distribution lines is made available in the inhabited locality within the revenue boundary of the village including at least one hamlet/Dalit Basti as applicable and
Any of the public places like Schools, Panchayat Office, Health Centres, Dispensaries, Community centers etc. avail power supply on demand and
The ratings of distribution transformer and LT lines to be provided in the village would be finalized as per the anticipated number of connections decided in consultation with the Panchayat / Zilla Parishad/District Administration who will also issue the necessary certificate of village electrification on completion of the works.
The number of household electrified should be minimum 10% for villages which are unelectrified, before the village is declared electrified. The revision of definition would be prospective.
Currently, rural households get limited period electricity for both household electrification and electrification of irrigation pump sets. The scenario of pump set electrification in Maharashtra is accelerating; rather, more pump sets than the capacity of groundwater reserves are energized as on July 31st 2012. This puts a great pressure on the groundwater table and it can have profound long term ill-effects. Around 38 lakh irrigation pump sets (IPS) have been energized till date, while the handling capacity is just over 24 lakh. Household electrification is a different concept which is often neglected in trying to prioritize IPS electrification.
Here comes the importance of need of electricity. Both the urban dweller and the rural dweller need tube lights, fans, television, computer, refrigerator and lamps (compact fluorescent lamps instead of incandescent bulbs). City dwellers undoubtedly ‘consume’ more electricity, but that does not mean that they ‘need’ more electricity than their rural brothers and sisters. In urban areas, more consumption is commonly ‘affordable’. Converse is not always true. We must not assume the converse that rural consumers cannot afford electricity consumption. Rather, the inclusive growth of the state demands the capability of every individual to bear the cost of basic necessities – like water and power.
42
Government of India, Ministry of Power, Rural Electrification powermin.nic.in/rural_electrification/main.htm

Electricity 55
Priority was given to pump set electrification, and not to household electrification. Occupation was given the priority over household. That is the reason we see a huge percentage of villages electrified, but a meager percentage of households electrified. Even the status of village electrification shows zero un-electrified villages but a lot of partially electrified villages43. RGGVY registers a village electrified even if electricity is provided to only some part of it for some time. The definition of village electrification as per the Ministry of Power, Government of India states that a village can be declared electrified only when at least 10% of its households are electrified. This 10% cap just to declare it electrified is inappropriate. 10 families receiving electricity from a population of 100 families is not village electrification.
This may increase the number of electrified villages, but the goal and need of total electrification remains distant.
Rajiv Gandhi Grameen Vidyutikaran Yojana (RGGVY) was started in 2005 under Bharat Nirman, the ambitious national level infrastructure project by the Government of India. Village electrification increased from 74% to 91%, and rural household electrification increased from 43% to 56%.
RGGVY seems to have been established for the (comparatively underdeveloped) eastern states – Uttar Pradesh, Bihar, Jharkhand and Orissa. Out of the 105314 electrified villages (till 30.06.2012), 82324 - 78% - are from these four states. More surprisingly, out of the planned village electrification of 110887 villages (till 30.06.2012), 84492 - 76% - villages are from these four. Even if Maharashtra is a well performing state in terms of economy and urbanization because of well-developed urban centres in the western part (Mumbai, Thane, Pune, Navi Mumbai), the eastern and south-central parts (Marathwada and Vidarbha) of Maharashtra are still underdeveloped. The Yojana must reach the yet unreached parts of the whole country.
Agriculture consumers
Rain fed agriculture poses many difficulties to the farmer, as the untimely rain can undo all efforts and investment of the farmer, forcing him into debt and migration. Moreover the crops fetch low prices and therefore yield lower income. With assured irrigation, the farmer can grow high risk and value added crops like cotton or medium risk crops like paddy or low risk crops like sugarcane and earn a decent income. As health and education services are getting privatized and becoming more expensive by the day and social functions like marriages becoming expensive, the farmer is in need of guaranteed income. Assured irrigation and assured price for his produce is the farmer’s necessity.
Electricity consumed by agriculture consumers rose to 30% from about 8% in 1975. The promise of “free power” to agriculture wins elections was demonstrated in the 2004 elections to Parliament and assemblies (Maharashtra & Andhra Pradesh). It is estimated that there are
43
http://www.powermin.nic.in/bharatnirman/pdf/Electrification_Achieved.pdf

Electricity 56
around 22,000 irrigation pump sets in Maharashtra. Around 26% of the total electricity used is for running of these pump sets. Government of Maharashtra has withdrawn free power to agriculture consumers in the state with effect from 1st June, 2005.
There exists a complex relationship between water supply and electricity supply on the side of the government, and one between rainfall and electricity consumption especially in the case of agricultural consumers. Efficient agriculture needs sufficient water and electricity is thus required mainly for pumping water. Only 17.9% of the state’s cropped land is under irrigation as per the Economic Survey 2011-12. This makes almost 82% of cropped land depend extensively on groundwater. Just as dam storage or even the amount of precipitation is limited (although it varies slightly every year), groundwater is also limited. Inadequate water supply for farming through irrigation or by using check dams/bunds increases the pumping out of groundwater.
The number of energized pump sets in Maharashtra as on August 31st 2012 is 38,09,586 where the ‘Estimated ultimate groundwater potential in terms of electrical pump sets’ as specified by the CEA is 24,49,800.
Around 1977-78, MSEB started charging its agricultural consumers (for consumption of electricity by their electrical pumps) on the ‘flat-rate basis,’ instead of charging them for their actual metered consumption. This flat rate was fixed on the basis of the capacity (horsepower) of the pump. At the time, the number of agricultural consumers and the volume of the electricity used by them were quite small. As a result, the decision to stop metering their electricity consumption did not prove disastrous. The subsequent years saw a rapid increase in the number of agricultural pumps and also in their electricity consumption, which still was not metered. In the flat rate system the farmers were also given consumption subsidy which was availed by a limited number of farmers who were using excessive electricity to grow crops like sugarcane and which were fed with excessive amount of water. About 2 to 3% of total farmers in the state were members of large lift irrigation schemes and received substantial portion of the subsidy given to agriculture consumers (As per survey conducted by Prayas in 1995-96). Around 80% farmers did not have electric pumps and did not receive subsidy. Instead of decreasing the subsidy the politicians kept on increasing it. The needful farmers either got less or no subsidy at all and only a few rich farmers reaped the benefit. For the years 1995-96 to 1998-99 the MSEB (govt.) gave a subsidy of around Rs. 1500 crores, whereas in 1999 – 2000 a
Electrical Pump Set Potential – 24,49,800
Actual Pump Set Electrification – 38,09,586
55.5% more than advised groundwater exploited

Electricity 57
subsidy of Rs. 1600 crores was given. In 2012-13, subsidies worth Rs.2500 crore would be given to farmers by way of concession in electricity bill44. The present trend of power consumption in agriculture is ecologically unsustainable and ruinous to farmers, power utilities and the economy as a whole.
Energy for Cooking
It is important to pay attention to the energy needs of villages not only in terms of electricity but also for cooking. Villagers usually use traditional fuels mainly fuel wood, dung and agro residues as sources of cooking energy. They also have no / improper ventilation which creates indoor pollution causing health hazards by leading to a high incidence of respiratory infections and diseases among women and children mostly. Many alternative means have been designed and developed but these are not commercially viable. More research needs to be carried out to make lives better for the rural women.
44
Government of Maharashtra, Department of Finance, Maharashtra State Budget, 2012-13

Electricity 58
Problems

Electricity 59
Load shedding
Power shortage kept on increasing from 10% during 2001-02 to 44.4% during 2007-08. In 2003-04, peak demand amounted to 13,279 MW, which required the shedding of 2,367 MW of load. During 2006-07, the peak demand of 16,388 MW was registered on 30th December 06, with load shedding of 3912 MW. During 2007-08, upto December, the peak demand (17,489 MW) was registered on 18th December 07 with load shedding of 4618 MW.
The minimum peak demand supply gap was 2726 MW in June 2011. In April 2011 and February 2012 – the summer months – when the demand is the highest, the load shed was observed to be the lowest (3250 MW).
To bridge the gap between demand and supply, the state utility has resorted to load shedding in recent years, resulting in disruption of lifestyle, loss of production and causing inconvenience to consumers.
In the year 2007 -08, since there were no rains, so the agriculture demand increased as water had to be pumped. The entire state except Mumbai faced load shedding. The industrial belt of Pune faced load shedding of 40hrs; rural areas for 12-14hrs; semi- urban areas for 8-9 hrs. This resulted in an increased demand for diesel in Pune, which resulted in its shortage. Industrial production also decreased by 16% (MCCIA).
Power shortage results in loss of production or requires use of expensive backup power for industrial consumers, while in case of residential consumers a shortage causes inconvenience with no direct economic loss. (A brief outline of the findings of the Godbole Committee report is given in Annexure II).
MSEDCL abides itself by a Load Shedding Protocol. It has classified regions in its jurisdiction according to Distribution and commercial losses and load is shed in direct proportion to the losses.
MSEDCL Circular 43: April 21, 2012
Presently, load shedding is based on DCL – Distribution and Collection Loss (70% to Distribution loss and 30% to collection loss)
Newly added parameters to decide on load shedding matters o LT distribution loss o LT collection efficiency o Revenue collection in ‘Ag’ category

Electricity 60
Electricity Tariff and Subsidies
Electricity Tariff
Tariff rates on electricity differ among states and between consumer categories in each state. Moreover, state governments not only provide subsidies on tariff rates (by providing electricity to consumers at discounted rates), but also grant capital subsidies to the state utilities.
Consumers are divided into broad economic sectors, but for the tariff studies the following economic sectors are considered viz. domestic, commercial, industrial and agricultural. Each of these categories is further divided into sub categories based on their consumption levels. State electricity utilities calculate electricity tariffs on the basis of revenue required and sale forecast. These tariffs are regulated by regulatory commissions. So utilities approach State Electricity Regulatory Commissions (SERC) for approval of tariff rates. The approved tariffs mostly are lower than those requested by utilities. Peoples’ participation through public hearing is conducted by SERC officials at district headquarters before final approval of tariffs.
The average tariffs in Maharashtra and other select SEBs is tabulated below. Between the consumer categories, the industrial sector pays higher tariff in comparison to other sectors. Amongst the domestic sector, consumers below poverty line pay lower tariff.
Table 18- Average tariffs in select SEBs (paise/kWh)
Year 07-08 08-09 07-08 08-09 07-08 08-09 07-08 08-09 07-08 08-09
State SEBs Domestic Commercial Agricultural Industrial Average
Maharashtra 308.00 345.23 620.95 692.10 173.00 194.08 443.44 445.99 361.81 403.69
Gujarat 305.31 379.45 487.82 563.91 119.52 197.49 458.00 537.72 337.31 417.84
Karnataka 319.19 320.73 276.39 268.93 72.87 82.32 467.23 469.27 305.62 303.42
Kerala 172.10 191.71 668.20 743.65 105.44 135.33 404.46 474.71 350.61 379.96
Tamil Nadu 153.07 165.17 606.30 616.23 0.04 0.04 455.01 457.90 296.66 290.69
Andhra Pradesh 242.90 240.23 586.59 575.88 8.17 861.00 365.45 373.98 254.15 251.60
Uttar Pradesh 187.08 157.18 374.47 358.49 162.95 153.06 432.63 431.81 268.40 266.36
All India 242.23 252.96 494.34 509.88 77.57 94.73 416.41 432.74 306.46 325.76
As can be seen from table 16, average tariff in Maharashtra is 15% higher, while Uttar Pradesh has tariff 14% lower than all India tariff. Average tariff in Karnataka was at par with the all India average tariff in the year 2007-08. In 2008-09 the average tariff in Maharashtra was higher by 19% than the average all India tariff.

Electricity 61
Figure 29 - Tariff across various economic sectors for select SEB (2007-08)
In the year 2007-08, in the domestic sector Jharkhand followed by Jammu and Kashmir and Tamil Nadu had the lowest tariffs. Rajasthan, Haryana and Karnataka have high domestic tariffs. Kerala has the highest tariff for commercial sector followed by Maharashtra and Tamil Nadu. For the agricultural sector, Tamil Nadu has lowest tariff followed by Punjab and Andhra Pradesh, while Assam has the highest industrial tariffs followed by Rajasthan and Karnataka. The lowest industrial tariffs are for the state of Jammu & Kashmir followed by Meghalaya and Uttarakhand.
Figure 30 - Tariff across economic sectors for select SEBs (2008-09)

Electricity 62
It can be seen from figure 29 below that the average tariff in Maharashtra for 2009-10 was higher by 29% than all India tariff.
Figure 31- State wise variation in average tariff (paise/kWh sold) for 2009-10
Electricity subsidies
Subsidy is assistance provided to a business, economic sector or producers. A subsidy is viewed opposite of tax. Like indirect taxes, subsidies can alter relative prices and thereby affect decisions concerning production, consumption and allocation of resources in the industry.
Subsidy can be categorized into two types viz. full subsidy (paid out of the public exchequer) and cross subsidy (one group of customers pay for other groups). Cross-subsidies arise in the context of regulated price structures which distinguish between prices according to use/products for the same group of goods/services.
Agricultural sector in India consumed 29% of the power generated in 1999, but contributed to only 3.36% of the total electricity sales revenue. This pattern has been stable over the last two decades and, as such, industrial and commercial consumers of electricity have cross-subsidized

Electricity 63
power consumption of the agricultural sector (Gulati and Narayanan 2003). This is true for almost all states in India45.
Subsidies for energy can be broadly divided under two heads viz. producer or consumer subsidies. Producer subsidies are provided to companies to encourage investment and increase output. Consumer subsidies support energy consumption by lowering prices at which energy products are sold.
Subsidies have multiple effects on government budget. The subsidy becomes a part and parcel of the government system, once started never to be removed.
Types of subsidies
Grant and other direct payments
Market price support
Tax concessions
In-kind subsidies
Cross subsidies
Credit subsidies and government guarantees
Hybrid subsidies
Derivative subsidies
Subsidies through government procurement
Functioning of subsidies – regulated prices
Subsidy is – price support – price control. There are two primary forms of price control, a price ceiling (Price -cap), the maximum price that can be charged, and a price floor, the minimum price that can be charged. Commonly they are known as ‘subsidies’ and ‘price supports’. The government controls price either by declaring “maximum price” or by “minimum price”. Both the estimations are non-desirable as compared with free market equilibrium.
Maximum price –price ceiling create shortages.
Minimum price – price floor – create surplus.
Price controls are Governmental restrictions on the prices that can be charged for goods and services in a market. The intention behind implementing such controls stems from the desire to maintain affordability of staple foods and goods, to prevent price going up during shortages or, or price going down during surpluses.
45
International Food Policy Research Institute: Discussion Paper 00716: Investment, Subsidies, and Pro-Poor Growth in Rural India; September 2007

Electricity 64
In India and Maharashtra, we see price ceilings especially in markets of energy, petroleum products, staple food (Ration shops), and public transportation. In Maharashtra, Government Regulatory Authority (MERC) sets a maximum price that can be charged by the companies selling electricity in Maharashtra.
A price ceiling is a government-imposed limit on the price charged for a product. India/ Maharashtra Government put price ceilings in intention to protect consumers from conditions that could make necessary commodities such as electricity in this example unattainable.
Figure 32 – Regulated price structure- Subsidy
When, Government of India / Maharashtra announces a subsidy on electricity /water pumps/ petroleum products (petrol/ kerosene /LPG, etc.), construction of greenhouses etc. it assures the consumer (the relatively poor sections of the society) a price ‘below’ the market price of the product. The sellers of this product have less incentive to sell because of low price. The consumers have the incentive to demand the relatively cheap products in more quantities, resulting in shortage of the product.
A price ceiling is often set below the free-market price (Figure 3146). This has several effects. Suppliers find they can't charge what they could charge in open markets. As a result, some suppliers drop out, thereby reducing supply. Meanwhile, consumers find they can now buy the product for less, so quantity demanded increases. Thus quantity demanded exceeds quantity supplied, creating shortage.
46
Price ceiling, http://en.wikipedia.org/wiki/File:Binding-price-ceiling.svg

Electricity 65
Beneficiaries (Supposedly) of Electricity Subsidy
The supposed target of subsidy – are poor sections of the society, who arguably cannot afford electricity at the given point of time. The residential consumers, or BPL consumer pay less, and industrial consumers pay more for the same unit of electricity. However, though it appears that the poor consume cheaper electricity, they have to bear the impact of increased prices of other energy related industry made products. The higher electricity bills of industries are passed on to the final consumer by raising the prices of their products. Thus the end consumer pays twice – once for the costly products – inflation, second the huge administrative cost – that goes into collecting taxes and redistributing them in various welfare schemes such as free or subsidized electricity.
Subsidies in the electricity sector in India
India originally introduced subsidies in the 1960s to support the green revolution, with major spending to (artificially) keep down the costs of fertilizer, irrigation water from public systems, and rural electricity - that drove many of the private irrigation pumps attached to wells. In addition India nationalized the main banks and directed them to provide credit to farmers at concessional interest rates. During the early phases of the green revolution payment of subsidies on inputs contributed to rapid expansion of production of cereals and thereby to poverty reduction, subsequently it is less clear that the subsidies have continued to do so47.
Electricity pricing or lack thereof, emerged as a powerful political tool in the late 1970s during the post green revolution period. The trend between elections and electricity pricing began in Andhra Pradesh in 1977, when Congress party was the first in India to campaign on the basis of free power. By 1989, the government was spending 25% of total expenditure on agricultural electricity subsidies, and politicians were required to maintain these subsidies to either gain election or remain in power. In 2004, the Congress Party on Andhra Pradesh campaigned on free power.
During the early days of the electric power industry, both government and business favored utility regulation for manifold reasons. Regulation offered a risk free way to finance the creation of electric industry. Establishment of electric industry required large capital for infrastructure building. At the dawn of the electrical era, government guaranteed – businessmen who took risk – a fair return on their investment through ‘regulated rates’.
Subsidies are introduced in the power sector both through cross subsidization among the different categories of consumers and budgetary support. Budgetary support becomes necessary because the SEBs have to show a three percent return on net fixed assets as stipulated in the Electricity (Supply) Act, 1948. But if they do not have the flexibility in
47
Organization for Economic Cooperation and Development, Global Forum on Agriculture, Steve Wiggins, ODI; Jonathan Brooks: The Use of Input Subsidies in Developing Countries - Policies for Agricultural Development, Poverty Reduction and Food Security - OECD Headquarters, Paris, 29-30 November 2010

Electricity 66
increasing the tariff rates to ensure this statutory rate of return, the concerned state governments have to provide necessary budgetary support48.
Expenditure on electricity subsidies for agriculture, an input subsidy aimed at improving agricultural productivity and the incomes of the agricultural work force, exceeds that spent on health or education49.
According to a report by Power Finance Corporation Ltd “Performance of State Power Utilities for the years 2007-08 to 2009-10”, 89 utilities in the country earned Rs. 1,90,948 crore in the year 2009-10. However, their total expenditure was higher by 75.74% - to the tune of Rs.2,52,125 crore.
Table 19 - Income, expenditure and cost recovery of 89 utilities
2007-08 2008-09 2009-10
Total income excluding subsidy (Rs. Crore) 1,49,622 1,71,639 1,90,948 Total expenditure (Rs. Crore) 1,83,595 2,23,403 2,52,125 Recovery of cot (%) 81.50 76.83 75.74
It can be seen from the graph below that the subsidy released by the government is lesser than the subsidy booked by the utilities.
Figure 33-Electricity Subsidies in India
48
National Institute of Public Finance and Policy - Budgetary Subsidies in India Subsidizing Social and Economic Services 49
http://www.ncsu.edu/cenrep/workshops/TREE/documents/Jessoe_electric.pdf

Electricity 67
With rising fuel costs - a pattern that may be aggravated by deficient rainfalls and the resulting increase in dependence on thermal power- this trend of increase in the subsidy support is likely to persist for the distribution utilities.
Impact of electricity subsidies50
Impact to the State
Providing subsidies in the electricity sector decreases government revenue.
Impact to the utility
SEBs attributed losses to agriculture as it could not be measured. It is estimated that about 30 to 40% of the consumption shown against the agricultural sector is an overestimate. This means that losses even in industry, which was happening on account of a nexus between the ground staff of the SEBs and the errant consumers, were being put on the account of agriculture since the agriculture sector had no meters or had defective meters.
Lower revenue generation from agricultural sector (9.4% of the total revenue for the year 2010-11), so limited interest in serving this sector.
Due to cross subsidy most of the industrial and commercial consumers have started showing their dissatisfaction and are moving towards captive generation technologies and direct purchase from generators, leaving the utilities in further financial distress.
Subsidies often promote inefficiencies. The utilities become financially weak with declining service quality, as subsidies are not often funded adequately.
o SEBs push most of the losses on agriculture sector, as most of the billing is on a flat rate based on pump set capacity, thereby hiding their inefficiencies.
o Subsidies may promote inefficient use of resources and indirectly raise the cost of service provision.
o Poorest sections of the society are worst affected as they lack access to service and have to generally depend on other high cost alternatives.
Impact on farmers/ agricultural consumers
Subsidy not only damage utilities’ efficiency and state government finances, but also has a negative impact on the farmers. Overuse of water, induced by subsidized electricity has led to soil degradation, soil nutrient imbalance and ground water depletion, which may result in a decrease in
50 http://planningcommission.nic.in/reports/genrep/arep_seb11_12.pdf

Electricity 68
Electricity subsidies enable agricultural users to access electricity at prices below the marginal cost of supply, thereby lowering the cost of irrigation and groundwater extraction. This induces farmers to grow more water intensive cash crops resulting in extensive extraction of groundwater. Overuse of groundwater led to the depletion of this limited resource.
Subsidies provided are mostly cornered by well-off farmers who have resources to invest in irrigation infrastructure.
Due to lower revenue from agricultural consumers, the quality of power gets hampered. The irony, however, is that the farming community in general is willing to pay the required tariff for receiving good quality power. Poor quality has indirect cost for farmers. Frequent breakdowns result in water being unavailable during peak irrigation times when it is most needed. This poor service creates the need for investment in backup facilities like diesel pumps. It also impairs pump operating efficiency resulting in financial costs for the farmers. Low voltage also results in motor burn out for which the farmer has to spend money and time.
Though there has been a consensus among Indian policy makers to phase out electricity subsidies in the agricultural sector, there is stiff resistance to attempts made in this regard. As has been discussed earlier, subsidies are captured by a small group and do not benefit the intended beneficiaries. Electricity consumption by the agricultural sector needs to be rationalized.

Electricity 69
Lacunae in the System
The energy sector, particularly the power sector has several; influences from the political sector, be it setting up of power plants or distribution of electricity. Other than this there are several drawbacks in the system cited below.
Politically influenced sector Most of the politicians and industrialists don’t pay electricity bills. No strict measures
are taken against these defaulters. Poor revenue generation/ bill collection Theft of power - This is a major drawback and details of theft record are also not
maintained. No strict measures are taken as well which increases the menace. Theft includes stealing of power as well as tampering with the electricity meters.
Un-metered power supply to farmers - Improvements in the tariff structure by metering the agriculture power supply instead of a flat rate. Prevent politicians from declaring free power and high subsidies to the agriculture sector to win elections. This results in lack of accounting for electricity generated, distributed and consumed.
Free power to the agricultural consumers – As the power sector is politically influenced, free power and subsidies to farmers becomes a large vote bank for the politicians. Free power does not improve the efficiency and additional problems arise. Farmers tend to pump a large amount of groundwater or practice flood irrigation. This results in problems such as salinity and water logging and a large wastage of a precious resource like water.
Scrap plants installed by foreign energy investors - When companies like Enron invest in the power sector in India the material they use to set up the plants should be verified before installation and the set up should be of good quality and not scrap. As in the case of Dabhol, wherein discussions with MSEB officials it was noted that the scrapped plant was installed as a result not all the gas is used for power generation due to leakages
Operation and maintenance of plants. The age of plants and leakages or any other problems thereof
Five year plan targets not met o 9th Plan (1997-’02) target of 40,245 MW while capacity addition was about
21,000 MW; private sector target: 17,589 MW vs. a realized addition of 6,735 MW
o 10th Plan (2002-’07) target 41,010 MW, revised down to 36,956 MW, Commissioned: 13,416 MW
o 11th Plan (2007 -12) target of 78,700 MW was planned while the actual achievement has been 54,963 MW51.
51
Government of India, Planning Commission, Power and Energy Division, Annual Report on the working of State Power Utilities and Electricity Departments, 2011-12; Government of India, Ministry of Power, Central Electricity Authority, Operational Performance of Generating Stations, 2011-12

Electricity 70
Projections

Electricity 71
Future Electricity Demand in Maharashtra
Economic growth is a key driver for energy demand. Future energy demand is determined by these factors:
Increased population growth that will compete for all kinds of depleting resources
Accelerated Urbanization
Increasing energy use
Climate change
Sustainability
The fast rate of economic growth of the state has proved wrong the projections made on energy demand by experts. Several industries/ SEZs are coming up in Maharashtra and meeting their power needs poses a major challenge. Current power generation relies mainly on burning fossil fuels. As coal supplies are available at present in the country, coal fired power plants dominate the energy sector. However, there is an urgent need to tap alternate source of power generation to meet the growing needs of the increasing population. In the current scenario of growing population, rapidly changing life styles and phenomenal growth in energy demands, finding renewable and environment-friendly sources of energy is being increasingly felt critical to sustainable development. In addition to this, it is necessary to use energy efficient equipment that uses less energy. It has been seen that the demand is always more while the availability is less.
Peak demand projections
The peak demand increase on an average by 6% every year, based on which future peak demand projections are calculated till 2035.
Table 20 - Peak demand projections
Year Peak Demand (MW)
2009 (up to Dec 2009) 15,988
2010 16,947
2015 22,679
2020 30,350
2025 40,615
2030 54,352
2035 72,736
The peak demand in 2009 up to December 2009 was 15988 MW and the peak demand in 2035 is projected to be 72,736 MW.

Electricity 72
Electricity Consumption projections
Total electricity consumption in Maharashtra shows a CAGR of a 7.8% growth in electricity consumption is seen every year, for the past 6 years. Considering the same annual growth rate for the next 13 years, the total consumption in the year 2025 would be around 2,32,000 MU. And the per capita consumption would be around 1850 units per year.
Table 21 - Growth rate of electricity consumption
Year/ Consumption (MU)
04-05 05-06 06-07 07-08 08-09 09-10 10-11 CAGR
55684 59287 62085 69838 72994 79139 87397 7.8%
Table 22- Population growth (1961-2011)
Year Population Growth/year
1961 39554000
1971 50412000 1085000
1981 62784000 1237000
1991 78937000 1615000
2001 96879000 1794000
2011 112373000 1549400
Population growth year on year increased till 2001. But late in the first decade of this century, the population growth receded from the previous year on year (y-o-y) growth.
According to the United Nations Population Fund (UNFPA) report, population of Maharashtra will grow to around 120 million in 2016, a rise of 8 million from 112 million in the five-year period 2011-2016. Considering a stable rise in population in the consequent two five-year periods 2016-2026, the population can be projected to be 136 million in 2026. The same has been considered as the population in 2025 for the projection of electricity consumption.
Table 23 - Projection of Electricity Consumption (2025)
Year 2011 2025
Population 112372972 136000000
Total Consumption (MU) 87397 232000
Per Capita consumption (kWh) 778 1700

Electricity 73
Electricity Sources for the Future

Electricity 74
Alternate Sources of Energy
The use of coal in power generation has negative impacts. In addition to the environmental and social consequences of coal mining, coal-based power generation contributes significantly to local (and regional) air pollution through the emission of particulates, sulfur and nitrogen oxides in stack flue gases, and water pollution through release of waste heat and effluents. In the recent years the efficiency of coal based power plants has improved but it still remains low in absolute terms. Moreover, there are no fixed patterns in heat rates in terms of seasonal variations, and, in many cases, there is little or no correlation of heat rates with plant load factor (PLF). Large hydropower projects also cause social and environmental problems such as displacement of people, submergence of fertile lands and forests as well disturbance to the fauna and their habitat.
The solution to future energy needs lies in greater use of renewable energy such as wind, biomass, solar, tidal, small hydropower as they rely on inexhaustible natural sources for their fuel and do not create pollution.
Hydropower is widely used for decades; however other renewable technologies have yet to make a mark in the market. These sources produce little or no greenhouse gases. Most of these technologies are at an early stage of market development, so their costs are generally higher than the already existing conventional system. A step has already been taken in the direction as solar and wind power generation is already in use but is costly. The economics will improve as they develop technically in the years to come.
The Government of Maharashtra established MEDA (Maharashtra Energy Development Agency) in 1985 to undertake development of renewable energy and facilitate energy conservation in the State of Maharashtra. There is a vast potential for renewable energy, especially in areas such as solar power, biomass and wind power. These renewable sources will reduce our dependence on fossil fuels and large hydropower projects and also gain carbon credits by reducing carbon emissions.
Wind power
Wind has been the fastest growing energy technology in the world for the past decade. In 1999, the world wind industry installed a record amount of new utility-scale wind generation equipment, more than 3,900 megawatts (MW). Total wind installations have increased with an average of 40 percent annually from 1995-1999 to nearly 14,000 MW worldwide. Wind energy has only recently gained a foothold in India, and is now well-recognized as a viable alternative source of energy in many states.
Large-scale wind farms provide power for national electrical grids, whereas small individual turbines are used to provide electricity to rural areas and locations outside the electrical grid.

Electricity 75
Wind power potential in Maharashtra is 4584 MW with 31 potential sites. The state has taken up a leading position in wind energy projects in India with around 800 windmills installed in Satara, Sangli Ahmednagar, Dhule, Nasik and Nandurbar having an installed capacity of 1373.93 MW. (Refer Annexure I for list). During 2006-07, 1663 million kWh of energy was generated by these projects. Asia’s single largest wind farm is developed in Dhule district with an installed capacity of 545 MW.
Studies conducted by Down to Earth, have revealed that Maharashtra is not wind energy capacity to its full potential. Though incentives are reaped power generation has not increased which needs to be changed. Currently wind energy policies are more incentive based than performance based. A huge incentive is offered on the installed capacity; however, the need is to provide such incentives and rebates on the power generation capacity.
Small Hydropower
Hydropower is a renewable, non-polluting and environmentally benign source of energy. It is perhaps the oldest renewable energy technique known to the mankind for mechanical energy conversion as well as electricity generation. Of the total installed capacity in India, 33,194 MW belongs to hydropower. Hydropower power projects are categorized as large and small hydro, with projects upto 25 MW station capacity being Small Hydro Projects (SHP).
India has a century old history of hydropower and the beginning was from small hydro. The first hydro power plant was of 130 KW set up in Darjeeling during 1897, marked the development of hydropower in the country. With the advancement of technology, and increasing requirement of electricity, the thrust of electricity generation was shifted to large size hydro and thermal power stations. Small hydro projects are economically viable and have relatively short gestation period. As on 31.3.08, Maharashtra had 27 projects with 207.08 MW capacity. The advantages of hydro power include minimal pollution levels, good reliability compared with other renewables, low operating costs, and cost competitiveness with fossil-fuel power generation.
Biomass
Biomass energy accounts for nearly a quarter of total primary energy consumption in India and further it accounts for over 70% of rural energy consumption pattern. Biomass resources for energy consist of fuel wood, crop residue (agricultural by product), vegetable oil and cattle dung. Biomass can be used to generate power by way of combustion and gasification. Industrial as well as agricultural biomass could be used. Energy from biomass can be used in the villages as agriculture residue is available in plenty. Biomass gasifier can be used to produce clean power.
The potential of grid quality power from surplus biomass material in the State is 781 MW. The MSEDCL has signed energy purchase agreement with 24 biomass developers having total capacity of 268 MW. These projects are likely to commission in the year 2008-09.

Electricity 76
Solar energy
Solar power harnesses the natural source of sunlight to generate electricity. The solar industry can be divided into two general types: a) solar photovoltaics (PV) are used to generate electricity. b) Solar thermal uses heat from the Sun to generate hot water. These systems could be grid connected or standalone local grid solutions. In certain rural places particularly for communities with widely separated houses, solar power systems prove to be an attractive option for rural electrification schemes. Some tribal villages have been made self-sufficient by use of solar technologies and energy efficient lighting.
Technology in the solar industry is growing and improving at one of the fastest paces of any renewable energy sector.
Bagasse based energy
Bagasse based cogeneration is extensively used by the sugar industry, where the fuel sugarcane residue is available virtually free for the captive unit. In this process the sugar mills generate sufficient power to sell the surplus to the grid after meeting their own requirement.

Electricity 77
Challenges Ahead

Electricity 78
Humankind has faced a daunting set of challenges at every age, but today’s generation has to deal with unique challenges. Even as large numbers of people enjoy unprecedented levels of material prosperity, a greater number remains mired in chronic poverty, lacking access to the most basic amenities and with minimal opportunities for social and economic progress. Energy is critical to human development and connects in fundamental ways to these challenges.
In many developing nations energy is a growing concern among businesses, governments and consumers. The main concern is that the energy-supply infrastructure will not keep up with the increasing demand, thereby becoming a constraint to growth. The conditions in global energy markets are also aggravating the situation, with high and volatile prices and supply risks from weather-related shocks, political uncertainty, or evolving greenhouse gas (GHG) regulation. Governments and businesses are exploring ways to resolve the challenges they face and ensure that insufficient energy supplies will not halt sustained growth. By 2030 India is expected to overtake Japan and Russia to become the third largest global consumer of energy. However, if consumption follows the current pattern and trajectory, the country is projected to run out of coal, its primary source of energy, in forty years. Furthermore, its domestic reserves of oil and gas are limited. Imported coal is more expensive than domestic coal as it requires additional investments in roads and railways, which would thereby raise the cost of power generation52.
After independence, the Indian Government created the National Planning Commission (NPC) and began its full-scale experiment of national-level economic planning with objectives of domestic self-sufficiency, rapid increase in the standard of living of Indian people, decreasing economic inequality and poverty and instituting a socialistic pattern of society. Electricity was viewed as a crucial instrument for social development in India and a rigid control by the government was considered essential for meeting the objectives. Private companies providing electricity were considered unacceptable, as they would focus on areas with greatest demand – cities and urban areas – thereby neglecting rural areas due to meagre return on their investments. This was considered inequitable so the government aimed its policies to provide cheap electricity to villages and rural areas, which would help increase electricity access and demand for irrigation and village-based small scale industries. In order to promote agriculture, agricultural tariffs were lowered and then in 1980s, agricultural pumps were de-metered.
It was seen that the direct benefit of subsidising fertiliser and under-pricing power and water mainly went largely to fertilizer producers and high income farmers. Under-pricing water and power has a negative effect on the environment, production and on the small income farmers. De-metering agricultural pumps motivates to farmers especially the larger ones to cultivate water intensive cash crops for which they pump water from deep wells at a relatively low cost. This has led to miscalculation of distribution losses by the distribution companies (state
52
Energy Security Series: The Brookings Foreign Policy Studies, India, pp. 14

Electricity 79
electricity boards) as the distribution company passes off the distribution losses on irrigation pump sets in order reduce the distribution losses53.
The 1990-1991 economic crisis faced by India provided an opportunity for unshackling the economy by de-licensing a number of sectors and subsequently the power sector was opened for private investment including foreign investment. Private investors were expected to produce electricity for sale to State Electricity Boards, which would control transmission and distribution. However due to very low tariffs to certain categories of consumers as well as heavy T & D losses and thefts, the SEBs were financially weak and the private investors’ feared non-payment. So they insisted on arrangements that guaranteed purchase of electricity by the State governments backed by additional guarantees by central government. In 1991, the government amended the Electricity (Supply) Act 1948 to allow private companies own power plants and generate electricity as Independent Power Producers (IPPs). In Maharashtra, Dabhol power plant is the output of the 1991 IPP liberalisation. The state generation utilities did not take efforts to increase power generation or upgrade old worn out units or make considerable efforts in increasing green energy sources or reduce distribution losses or conserve energy. The multiple effect of the lack of efforts from the state utilities resulted in demand outpacing supply, thereby leading to power shortage which was curbed by load shedding.
The growing economy and changing lifestyle have increased the demand for electricity. In the past decades power generation was not increased and the MSEDCL lost a huge client base, as most of the industries opted for captive power generation. Maharashtra state has a power shortage of 3000-5000MW. To meet the ever increasing demand the immediate stand taken by the government is “build new power plants in large numbers”. So Maharashtra State government has proposed an allowed an ambitious target of around 68,980MW of power generation from 57 power plants across Maharashtra. These power generation plants are state, central or privately owned. The share of private power has increased due to de-licensing of thermal generation and removal of restrains from captive power generation as per the Electricity Act 2003. Most of the projects are facing problems in acquiring land. Considering the delays in land acquisition for power projects, the state Ministry of Power has invoked an emergency clause for faster land acquisition for the proposed nuclear power project (Jaitapur) in the state.
Constructing new power plants requires vast tracts of land and water. In quest for making the State power self-sufficient and / or surplus; agricultural land is being diverted for setting up power plants. If all these projects were to take off, Maharashtra’s generation from the new plants would be roughly around 47,000MW by year 2014. The new power generation also includes up-gradation of 3090MW of MahaGenCo Chandrapur, Parli and Koradi thermal power plants. These power plants are taken up for upgradation under the National Renovation and
53
Economic and Political Weekly: Anjana Das and Jyoti Parikh: The Political Economy of Power; Vol. - XXXV No. 14, April 01, 2000

Electricity 80
Modernisation program launched by Government of India, Ministry of Power with assistance from the World Bank.
The energy (electricity) sector has wide scope for improvement in areas ranging from scientific demand forecasting, improving efficiency of existing power plants, demand side management measures, using energy options (green energy) that limit environmental degradation and preserve the integrity of natural systems, etc. Accurate forecasting of demand is very crucial for planning investments in the energy sector. To forecast demand there are several aspects that need to be studied scientifically and accurately. It is necessary to know the precise T&D losses, for which it is of importance to know the power consumed by all categories of consumers especially the agricultural consumers. This would necessitate metering of agricultural pumps. It is also necessary to precisely calculate the revenue losses due to non-payment of bills and theft of electricity.
There is a disparity in access to electricity between urban and rural areas. The development is urban centric and the attention of power utilities is more focused on the urban centres. More and more power is pulled by the urban centres whereas most of the rural areas lurk in darkness. In spite of most of the power generation plants being located in backward or underdeveloped regions of the state; these regions face more power cuts. There are many places in rural Maharashtra that are not even connected to the power grid, whereas in some places the transmission and distribution network exists, yet there is no power supplied. In some tribal areas large amount of finances have been wasted to construct the necessary distribution network infrastructure; yet these regions continue to lurk in darkness.
At present several energy prospects - state owned and private - have been undertaken across the state. It is necessary to evaluate the cumulative impact that these power projects (thermal and nuclear) will have in the long run and take up only as many projects as are essential and realistically feasible. Along with this, it is necessary to explore and develop alternate sources or renewable sources of energy, and also crucial to conserve and use energy efficiently by bringing down T&D losses up to the international standards (6% and 8% respectively). This can be achieved by eliminating thefts as well as improving revenue collection. If the State has to be free from load shedding and provide power to all it would be imperative to bring a paradigm shift in the power sector rather than continuing with the business-as-usual (BAU) scenario.
The BAU scenario in the State based on the polluting and depleting fossil fuels and nuclear fuels is ecologically and socially unsustainable. Witness to the unsustainable energy growth in the State is the large number of projects (coal based and a major nuclear powered) undertaken in the State. Large tracts of fertile land or forest and water will be diverted for these projects. Before planning new generation units, it is essential to take into account both the short term and long term consequences of energy use.
The BAU approach taken by the state will result in loss of livelihood, pollute the ambient air and degrade the land quality. The path for our future energy use has to be paved on energy sources that will be cleaner and will have a minimal impact on the environment and climate.

Electricity 81
There are several challenges that need to be tackled in future. Few of the critical future challenges are listed below.
Increased population growth that will compete for all kinds of depleting resources
Accelerated Urbanization
Rise in standard of living
Increasing energy use
Climate change
Sustainability
All these challenges will impact the energy sector (generation, demand and supply). Proactive measures need to be taken in order to deal with these challenges. There is a need for rapid growth to meet developmental needs in order to ensure energy security. The emphasis must be on cleaner power generation including limiting carbon emissions.
There is no single solution to meet these challenges. Finding new methods for producing energy, particularly blend of conventional and renewable sources of energy, is of utmost importance in tackling problems related with population growth. Considering the urban rural divide in terms of electricity supply and infrastructure development, the solutions that would work in an urban centre may not work for its rural counterpart. The same applies for electricity demand in terms of variability according to time of day and year.

Electricity 82
The Way Forward

Electricity 83
There is an urgent need for a paradigm shift in our energy policy. Rather than generating millions of MW of additional capacity based on thermal and centralized power supply system, we need to adopt an 'Integrated Energy Resource Management (IERM)’ approach which will have renewable energy sources, energy efficient technologies, demand side management measure and decentralized supply systems at its core.
The state of Maharashtra has to progress towards a sustainable energy future. The state should not only become energy self-reliant but also power surplus and be able to sell the surplus power outside the state and earn profits out of it.
Current energy habits must change in order to reduce significant public health risks, avoid placing intolerable stress on critical natural systems, and to manage the substantial risks posed by global climate change. Four thrust areas have been identified as follows.
Upgrade and optimise efficiency of existing State owned power plants;
Strengthen transmission & distribution (T&D) network (Smart Grid);
Increase green energy sources and promote decentralised off grid power generation; and
Energy conservation across economic sectors
These priority areas are dealt with in detail in the subsequent chapters that follow. The first chapter “Upgrade and optimise efficiency of existing State owned power plants” covers various aspects related to existing state run thermal (coal fired) power plants in the state. The thermal power plants in the state are aging and it is necessary to upgrade them so that their efficiency can be improved, energy output increased and emissions reduced. Improved efficiency will also help in conservation of fuel. A list of the state run (thermal) power plants and their efficiency is also provided and the factors that have contributed to the reduced efficiency have also been included. It was understood that coal quality and supply play a major role in the efficiency of power plants. More so ever coal will continue to dominate the power sector in the years to come. Taking into consideration these factors a report on coal supply, quality and the market scenario is also included, in this chapter with special distinction.
The second chapter “Strengthen transmission & distribution (T&D) network (smart grids)” deals with losses in energy when it is moved from the source of generation to large distances and the final delivery to the source. Technical and commercial aspects are responsible for losses have

Electricity 84
also been covered. Various solutions that would bring down T&D losses have been explored. The chapter also explains the concept and current status of smart grids.
The third chapter “Increase green energy sources and promote decentralised off grid power generation” explores the green and clean sources of energy and the potential for each of the sources. It takes into consideration various initiatives to promote clean energy such as cogeneration from sugar factories, promoting solar power, wind power, etc. and incentives offered for investments in renewable sector. It also explains the benefits of decentralised generation especially in rural areas to ensure assured power supply.
The fourth chapter “Implement measures for energy conservation” identifies various initiatives taken at the national and state level such as institutions set up, schemes, incentives, subsidies, etc. to promote energy conservation measures. It also provides potential energy savings across various economic sectors in the state. It introduces the latest trends in energy savings in the construction industry such as green buildings.

Electricity 85
Solution 1
Upgrade and Optimize Efficiency of Thermal
Power Plants
Goal - Identify techniques for up-gradation and efficiency optimization to achieve maximum potential of state owned power plants

Electricity 86
Introduction
In the early 1950s and 1960s the government plans centered on co-developing irrigation and power sectors, and there was greater emphasis on hydroelectricity. But these hydropower plants were suffering from low generation as water resources depended heavily on the erratic monsoon. So the focus was shifted to generation of electricity from coal. Other than this there were several other reasons for shifting focus to coal based plants such as construction time, delays in civil works, and resistance from local groups against the construction of large hydroelectric dams as they led to large scale displacement, etc.54 By the early 1970s the government had to rely much more on indigenous coal, especially since the global oil crisis made the use of indigenous coal relatively cheaper. This forced the government to emphasize coal usage in many energy intensive sectors, including electricity generation55. This resulted in a rapid increase in coal based capacity.
Coal based power plants are and will remain in the forefront as they provide cheap power. These plants have high capital costs and low variable costs and produce continuous, reliable, efficient power at low cost. They often take a long time to start up and are relatively inefficient at less than full output. These plants run throughout the year except in case of repairs or scheduled maintenance. Their reliability to provide base demand (i.e. to continuously supply electricity to consumers) helps keep their operation costs low and offers stable, attractive pricing through long term agreements. The rule of thumb is that base load power is usually 35–40% of the maximum load during the year.
Coal based plants would continue to dominate the energy market for the foreseeable future considering the increasing demand for electricity, current standing of renewable energy and construction time taken for setting up new power plants. Bridging the demand supply gap is a serious problem as supply is not increasing in proportion to the demand. The burgeoning demand for power has long outstripped supply. In this context it is of utmost importance to improve the efficiency of the existing coal fired power generating units. It is also necessary that new power plants should function efficiently and be well maintained.
Maharashtra state had a remarkable growth of 14.23%56 in the financial year 2010-11. To support this growth, uninterrupted and quality power would be crucial. Considering the growth graph of the state, large scale capacity additions are in the pipeline (Annexure III). Though these capacity additions may seem impressive, there would be shortfalls due to a variety of factors such as obtaining environmental & governmental clearances, land acquisition, water allocation,
54 Energy Technology Innovation Policy, A joint project of the Science, Technology and Public Policy Program and
the Environment and Natural Resources Program, Belfer Center for Science and International Affairs – AP.Chikkatur & AD.Sagar: “Cleaner Power in India: Towards a Clean-Coal-Technology Roadmap” pp. 31 55
Harvard University, Kennedy School of Government, The Pew Centre on Global Climate Change Coal Initiative, AP.Chikatur: A Resource and Technology Assessment of Coal Utilization in India, Cambridge, October 2008, pp. 20 56
http://planningcommission.nic.in/data/datatable/0904/tab_104.pdf

Electricity 87
fuel constraints; as witnessed earlier, shortages of construction equipment, which would leading to delays in the commissioning the projects.
Coal supply and quality pose major issues. Indigenous Indian coals exhibit high ash content (35‐40%), high levels of silica and alumina, and are highly abrasive. Average coal consumption is estimated at 5,000 tons/MW, which is higher than most imported coals because of a low heating value (3,500 kcal/kg) and high ash content. The total coal demand for power generating plants in India was 625 million tons (MT) in the year 2010-11 of which 90 MT coal was imported. The 12th Five Year Plan, projected annual coal requirement increases to 842 MT and the estimated domestic coal availability is 700 MT by 2016‐2017 thus India’s dependence on imported coals is expected to increase to 142 MT annually.
Escalating coal prices have disrupted a number of new coal plants. Tata Power Company’s 4000 MW ultra-mega thermal power plant in Mundra on imported coal would supply at Rs. 2.26 per unit for the next 25 years. This arrangement worked till coal prices were in the range of US $30-40 per ton. Coal costs surged to US $110-120 per ton, distorting the supply side costs. Reliance Power’s 4000 MW Krishnapattanam project and JSW Energy’s 2000 MW project at Ratnagiri are delayed due to the same reasons. However, the dominance of coal in the country’s energy mix is not likely to change till 2031-3257, and the same scenario will prevail in Maharashtra, though rising coal prices coupled with inefficiencies in coal supply and coal quality continue to paralyze the electricity sector.
Since the state’s power generating company (MSGPCL) contributes a large share in power generation, the focus is primarily on suggesting processes necessary to optimize the efficiency of MSGPCL power plants. Higher efficiency in power generation is an important aspect of energy security. It reduces environmental costs and lowers the cost of electricity.
57
Government of India, Planning Commission, Integrated Energy Policy, August 2006

Electricity 88
Efficiency of Coal-Fired Thermal Power Plants
A coal fired thermal power plant consists of the following mechanical equipment. These are the actual machines installed in a coal power station. To increase the efficiency of coal power plants, it is essential to maintain and monitor the performance of all the machinery involved in a synergistic manner.
Table 24: Mechanical equipment of a power plant
Coal conveyor Electro Static Precipitator Cooling tower Coal hopper Cooling water pump Low pressure steam turbine Coal pulverizer Cooling tower Steam Control valve Boiler steam drum High pressure steam turbine Surface condenser Bottom ash hopper
Intermediate pressure steam turbine
Condensate pump
Boiler Cooling water pump Electrical generator
There are some common problems associated with power generating units which collectively affect plant output. Most of the problems arise due to the use of fuel which is not as per the design standards but is of lower grade.
Boiler leakage is the most common problem affecting the performance of thermal power generation units in Maharashtra. Analysis of Daily System Reports released by Maharashtra State Load Dispatch Centre (MSLDC) provides details about ongoing planned outages and sudden forced outages each day. It is seen that forced outages occur maximum times due to boiler tube leakage as compared to other reasons. MSPGCL monitors boiler tube leakages daily and has a separate portal for the same58. MSGPCL officials revealed that the boiler tubes get damaged more or less due to poor coal quality. Ash and other impurities intrinsic to Indian coal cause cracks to the boiler tubes and eventually damage them.
Coal pulverizer is susceptible to inefficiency as its blades and churners face impurities like stones in the coal frequently. In addition to stone content, the inefficient pulverization increases the Specific Coal Consumption (SPCC). One of the reasons for private power plants’ efficiency is good quality coal which is always unadulterated.
Clinker gets formed in the boiler tubes primarily due to poor quality coal viz. low gross calorific value, higher ash content, presence of stone, shale and sand, etc. the impurities in coal get deposited on the inner sides of boiler tubes that carry water and steam (or any high pressure fluid). It happens more in case of pipes catering steam to low pressure turbines. Clinkering reduces efficiency of boilers and may also cause leakage to boiler tubes.
58
http://www.mahagenco.in/BTLManager/login.php

Electricity 89
Primary Performance Parameters of a Power Station
Operating Availability (Av) Operating availability of a power generating station in a year is defined as
Av = T – PO – FO T-Total time in a year; PO - total duration of planned outages; FO- total duration of forced outages
Plant Load Factor (PLF) It is the most important performance parameter of a power station. It is the efficiency with which electricity is generated as against the installed capacity of the generating station. (Availability (Av) is a subset parameter of the PLF) Forced Outage Forced outage is unplanned stoppage or sudden breakdown that occurs in a power station due to these problems. Advanced technology and equipment, skilled workforce, working discipline can greatly reduce the number of forced outages. Planned Outage Regular maintenance works are necessary for any power generating station – rather they are necessary for any constituent of the manufacturing and infrastructure sector. Annual and Capital overhaul are planned well in advance, and they require around 30 and 50 days respectively.
Secondary Performance Parameters
Secondary parameters affect the primary performance parameters.
Realization of coal It is the percentage of coal that actually gets effectively utilized in generating power. Specific Coal Consumption (SPCC) It is the amount of coal (in Kg) required to produce one unit (kWh) of electricity at the generating station. SPCC of a power plant reduces with the coal quality and should be as low as possible. Auxiliary Consumption It is the power consumed by the power plant itself as a percentage of power generated. Gross Calorific value Amount of heat (in Kcal) produced per Kg of fuel.

Electricity 90
Performance evaluation of Thermal power stations
CEA carries out performance analysis of thermal power plants in India. Key performance parameters for the year 2009-10 are as follows59
Total electricity generation increased by 6.6% and thermal generation increased by 8.6%.
This growth was achieved at PLF of 77.68% at the national level.
PLF of state utilities was worst among all power producers
None of the best performing power stations in India were from Maharashtra
Planned outage is about 6% for majority of the power stations
Main cause of Forced Outage is Boiler Tube Leakage
Private sector IPPs topped the PLF chart with 85.68%.
Table 25 - Sector wise PLF
Sector PLF (%)
State Utilities 71.13
Private Utilities in State 82.41
Central Utilities 85.64
Private IPPs 85.68
The best performing thermal power stations in India were 5 private companies, 11 NTPC stations and 5 state power stations viz. 2 of PSEB (Punjab) and 2 of APGENCO (Andhra Pradesh). These stations have pegged their PLF at above 90%. This shows that power generating stations in Maharashtra have performed worse. PLF of thermal stations in Maharashtra is 69.71% which is lesser than 71% national average (2009-10)60.
Average national Operating Availability (OA) of thermal power plants was 85.1%. If we consider the same average OA for Maharashtra, it means that MSPGCL thermal power stations were unavailable for 55 days in a year. Even if we deduct annual overhaul of 30 days for every power station, 25 days of unavailability, mostly due to forced outages is a matter of great concern for power stations in Maharashtra. This is a major factor reducing the PLF.
Capital overhaul of a power station requires about 35 days, but it is not carried out annually. It is seen that one out of six-eight units of power generation undergo capital overhaul in a year.
59
Government of India, Ministry of Power, Central Electricity Authority, Thermal Performance Review 2009-10 60
Government of Maharashtra, MSPGCL, Annual Report 2009-10

Electricity 91
Efficiency of MSPGCL’s Coal-based Thermal Power Plants
MSGPCL operates seven coal power plants comprising 40 units of which 33 units generate power. Seven of the 39 units have been scrapped due to ageing and inefficient performance. The table below provides unit wise capacity of MSGPCL coal fired power stations, the date of commissioning and the plant efficiencies.
Most of the units are commissioned in the 70s and the 80s. The installed capacity is 20 to 30 years old, while the economic life of a thermal power plant is only about 25-30 years old. But it is important to check the remaining life of various components after 20 years (or 160,000 hours of operation). The efficiency of most units has declined which has resulted in producing less electricity than that for which they were originally set up. Some units have been scrapped, while some need to be shut down, but, some can be rehabilitated using modern techniques. High efficiency of power plants reduces emissions thereby protecting the environment and conserves fuel.
Fresh investments in renovation and modernisation (R&M) and life extension (LE) can help improve the performance of older plants and their generation at a much lower gestation period than a new plant. However, there is considerable lack of enthusiasm with regards to R&M, and the government plans have consistently missed their targets. Since the above mentioned plants are under the public sector domain, procedural and other bottlenecks need to be addressed urgently by the government to facilitate maximum utilisation of existing assets61.
61
India Infrastructure Research - Thermal Power Generation in India (Volume I), pp. 31

Electricity 92
Table 26 - Installed Capacity, Year of Commissioning & Efficiency of MSPGCL power stations
Thermal Power Station
Date of commissioning
Total No. of
Units
No. of working
units
Unit Capacity
(MW)
Total power station
capacity
Working capacity
(MW)
Average efficiency
(%)
Koradi
1974,1975,1976,1977 7 7 4 x 10⁵ 1040 1040 57
1978 1 x 200
1982,1983 2 x 210
Nasik 1970,1971 5 3 2 x 12562
880 630 60
1979,1980,1981 3 x 210
Bhusawal 1968 5 4 1 x 5563 1475 1420 61
1971,1982 2 x 210
2012 2 x 500 -
Paras 1961 4 2 3064 585 500 -
1967 1 x 5565 60
200866, 2010 2 x 250 -
Parli 1971 7 5 2 x 2067 1180 1130 64
1980,1985, 1989 3 x 210
2007, 2 x 250 -
Khaperkheda 1989,1991,2000,2001 5 5 4 x 210 1340 1340 70
2011 1 x 500
Chandrapur 1983,1984,1985,1986 7 7 4 x 210 2340 2340 59
1991,1992,1997 3 x 500
Total 40 33 8840 8400
62
NOTE - The installed capacity of these units was initially 140MW, but has de-rated to 125MW w.e.f 20-04-2007 vide CEA letter no. CEA/PLG/DMLF/513/ (CDHUVARAN)/2007 dated 20/04/2007. The efficiency has been calculated taking into consideration the original installed capacity of 140MW 63
NOTE - The installed capacity of this unit was 62.5MW initially, which was derated to 58 MW and later to 55 MW. So the efficiency has been calculated taking into consideration the old installed capacity. The total installed capacity is therefore 478MW 64
http://www.parastps.co.in/index.php?option=com_content&view=article&id=53&Itemid=58 65
NOTE - The capacity of this unit was 58MW, based on which the efficiency has been calculated. The power generation figures for the new unit of 250MW commissioned in the year 2008 are not available and hence efficiency has not been calculated. 66
http://www.mahagenco.in/investor/pprojects_completion.shtm#parastps 67
NOTE: These two units had an installed capacity of 30MW when installed. The capacity of both the units derated to 20MW from 20/4/2007. The efficiency was calculated prior to the de-rating considering 30MW each-http://www.parlitps.com/about-us.asp

Electricity 93
Analysis of performance parameters of MSPGCL coal based power plants
Primary performance parameters of MSGPCL coal based power stations are given below (please refer table 10)
Operational Availability (Av) increased to about 87% for the years 2007-08, 08-09, 09-10, but reduced drastically in 2010-11 to 81.64%. Unavailability of coal was the major factor responsible for reduction in Av in 2010-11. Availability of coal coupled with timely operation and maintenance can increase Av to 90%.
Average Plant Load Factor (PLF) for 2010-11 is 61%. As per the analysis of various units of power stations as indicated in the previous tables (table 1, 3-8), the average efficiency was 61%. PLF has steadily reduced from 2007-08 till 2009-10. Indian coal has high ash content which reduces GCV of coal resulting in an increase in the amount of coal required to generate per unit of electricity, thereby reducing the PLF. Though imported coal is of better quality, it is not suited for most of the power generation units in the state as they have conventional designs. Generation units in India are designed for Indian coal, which make them dependent only on local coal. Coal related factors that affect PLF
o Wet coal in monsoon o Improperly washed coal o Lower quality of coal –Coal has high ash content and contains shale, sand and
stones o Irregular coal supply
Other factors that affect PLF o Lack of proper operation and maintenance o Forced outages o Unavailability and / or poor quality of water
Planned Outage percentage has steadied on a fair level. Annual and capital overhaul is a fairly constant type of outage, and no significant diversions from normal should be seen in this. There is a direct relation between the number of units overhauled and the percentage of planned outage.
Forced Outage is far better than that in 2006-07 when it was 10% of the total time. Boiler tube leakage still remains the main contributing cause of forced outage. Ideally it should reduce to 2-3% at maximum. Coal unavailability is the recent factor contributing largely towards forced outage. The primary performance parameters are indicated in the table below.

Electricity 94
Table 27-Primary performance parameters
2006-07 2007-08 2008-09 2009-10 2010-11
Operating Availability % 82.11 87.58 86.69 88.4 81.64
Plant Load Factor % 73.64 76.99 70.61 69.71 61.23
Planned Outage % 7.9 7.95 8.41 5.82 5.41
Forced Outage % 10 4.47 4.9 5.78 5.07
Annual Overhaul (Generation units per year)
23 26 24 18 17
Secondary performance parameters of MSGPCL power plants are indicated in table 5. These parameters are most affected over the years.
Realization of coal- In the last 6 years, the percentage of coal that is effectively used in power generation has reduced from 91% to 86%, almost 1% reduction per year.
Specific coal consumption (SPCC) has increased steadily in the past 6 years. It may have been due top very poor coal quality or the improper and undisciplined O&M works at the generating station.
Auxiliary consumption -In 2010-11, MSPGCL consumed 10.63% of its produced power on itself. Whether it spent it on itself or it was diverted somewhere else is a different topic, but auxiliary consumption has seldom touched such an alarming level.
Gross calorific value (GCV) decreased from 3455 to 3245 kcal/kg indicating the deterioration in coal quality. The units are designed with a GCV in the range of 3500 to 5000 kCal/kg.
Table 28 -Secondary performance parameters
2006-07 2007-08 2008-09 2009-10 2010-11
Realization of coal (%) 91.31 91.29 88.11 89.49 86
Specific Coal Consumption (Kg/KWh)
0.765 0.796 0.828 0.826 0.852
Boiler Tube Leakage (%) 2.86 2.94 2.38 3.02 2.55
BTL as % of FO (%) 65.77
Sp. Oil Consumption (ml/KWh) 1.91 1.78 4.12 3.56 5.75
Auxiliary Consumption (% of Generation)
8.99 8.78 9.49 9.93 10.63
Average Gross Calorific Value Kcal/Kg
- 3455 3537 3245
Heat rate (Kcal/KWh) - 2898 2989 2817
Transit Loss (%) - 0.43 0.96 1.99 0.5

Electricity 95
The efficiency in power generation depends on the type of generation, condition of power plant (operation and maintenance), ambient conditions and design of the power plant68. Efficiency improvement has a positive effect on energy security, local and regional air pollution abatement, and employment69. The efficiency of the old units of each of the MSGPCL coal based power plants is discussed in the paragraphs below. The details of installed capacity, generation and efficiency of each of the MSGPCL coal power plants are provided in Annexure V.
68
Frans van Aart Energy Efficiency in IPPC installations - Energy Efficiency In Power Plants - October 21, Vienna 69
http://www02.abb.com/db/db0003/db002698.nsf/0/a3881ed5c3dbc647c12575080036dafd/$file/Energy_efficiency_ makes_difference_191108.pdf

Electricity 96
Koradi Thermal Power Plant
Koradi thermal power station is located at Koradi in Nagpur. Total installed capacity of Koradi thermal power station is 1040 MW.
Table 29- Unit wise installed capacity of Koradi thermal power station (2012)
लीज ननर्भिती षभता १०४० MW (१ x २०० MW; २ x २१० MW)
कें द्र कामियत कयण्माची तायीख वचं १ (१०५ MW) - ३ जनू, १९७४
वचं २ (१०५ MW) - २४ भाचि, १९७५
वचं ३ (१०५ MW) - ३ भाचि, १९७६
वचं ४ (१०५ MW) - २२ जुर,ै १९७६
वचं ५ (२०० MW) - १५ जुर,ै १९७८
वचं ६ (२१० MW) - ३० भाचि, १९८२
वचं ७ (२१० MW) - १३ जानेलायी, १९८३ वयावयी कामिषभता (वचं १- ७) ५७%
Of the seven total units, four with a 105 MW capacity each are closed since January 2011, but not yet scrapped. These four units were commissioned between the years 1974 to 1976 and had an installed capacity 120 MW, which was derated to 115MW from 1990 and later to 105 MW from the year 200770. These units are old and have outlived their normal life span. The generation from these units have reduced over the years since their commissioning.
Installed capacity in 1974-75 was 120 MW with the first unit commissioned. In 1975-76 the second unit (120 MW) was commissioned, increasing the installed capacity to 240 MW, followed by commissioning of the third and fourth units (120 MW each) in 1976-77 and 1979-80, increasing the total installed capacity to 680 MW in the year 1979-80.
The installation of all seven units increased the total installed capacity to 1100 MW in 1983-84. In 1990, with the first four units derated, installed capacity reduced to 1080 MW.
On April 19, 2007 the four old units which were derated to 115 MW each were further derated to 105MW, thereby reducing the total installed capacity of Koradi thermal power station to 1040 MW.
The installed capacity and generation has been graphically represented below. The efficiency of Koradi thermal power station is 57%, which is calculated up to the year 2007 since the commissioning of its first unit.
70
Government of India, MECON Ltd., Report on achievable heat rate and auxiliary power consumption of thermal power stations, 2007

Electricity 97
Figure 34- कोयाडी औष्णणक वलद्मतु कें द्राची लीज ननर्भिती षभता ल प्रत्मष लीज ननर्भिती (1974-75 to 2006-07)
The first four units of the plant were designed in the seventies based on prevailing pollution norms and technology of those days. A few reasons which pose problems in meeting the desired performance levels are cited below71.
Old design of boiler, turbine & auxiliaries
Poor quality of coal
Increase in cooling water (CW) inlet temperature as compared to design value
Vibration in turbine generator (TG) bearings in case of Units 1 to 4
Ageing of the units and
Poor state of the instrumentation & control.
Renovation and Modernization for Unit 6 has been undertaken from March 2012.
To improve generation capacity, 4 old units of 120MW commissioned in the 70s are being replaced with 1 unit of 660 MW equipped with supercritical technology. In addition to this replacement, two new units of 660 MW supercritical technology are under execution.
71
Government of India, MECON Ltd., Report on achievable heat rate and auxiliary power consumption of thermal power stations, 2007

Electricity 98
Nasik Thermal Power Station
Nasik thermal power station is located at Eklahare in Nasik, Maharashtra. The current total installed capacity of this power station is 630 MW, comprising total three units of 210 MW installed capacities.
The first two units of the power plant have aged and have been closed in 2012 due to environmental concerns. Their capacity when commissioned in the seventies was 140 MW which was derated by 15MW from 2007 to 125 MW each.
Table 30 - Unit wise installed capacity Nasik thermal power station (2012)
लीज ननर्भिती षभता ६३० MW (३ x २१० MW)
कें द्र कामियत कयण्माची तायीख वचं १ (१४० MW): १६ ऑगस्ट, १९७० (फदं केरे)
वचं २ (१४० MW): २१ भाचि, १९७२ (फदं केरे) वचं ३ (२१० MW) - २६ एवप्रर, १९७९ वचं ४ (२१० MW) - ७ ऑक्टोफय, १९८०
वचं ५ (२१० MW) - ३० जानेलायी, १९८१
वयावयी कामिषभता (वचं १ - ५) ६०%
Total installed capacity of Nasik thermal power station has decreased to 630 MW from its previous installed capacity of 910 MW. Installed capacity and generation is given in the graph below.

Electricity 99
Figure 35 - नार्ळक औष्णणक वलद्मुत कें द्राची लीज ननर्भिती षभता ल प्रत्मष लीज ननर्भिती (1970-71 to 2006-07)
As compared to the designed quality of coal, the quality of coal supplied to the power plant is inferior in terms of ash content, GCV, volatile matter and moisture. This is the case with almost all the MSGPCL run power stations. There are times when coal quality is at par with design specifications which positively affects the efficiency of the power stations. It is observed that if imported coal or coal having the desired GCV is used, plant performance improves.
The first two units were designed to operate with coal of GCV 5900 kcal/kg whereas the other three units are designed to operate with coal of GCV 5000 kcal/kg. The available coal has an average GCV of about 3850 kcal/kg. Also, constituents of coal like moisture, Hydrogen and ash show a wide variation as compared to the designed coal quality. This results into poor performance of the units in terms of improper heat transfer and reduced boiler efficiency. Since the quality of coal is poor, higher of quantity coal needs to be fired in the boilers. Units 3, 4 and 5 have been designed for coal with GCV of 5000 kcal/kg, but the coal being supplied varies from 3700 kcal/kg to 3900 kcal/kg. This results in extra loading of mills and fans. Poor quality of coal results in increased heat rate and increased auxiliary power consumption of the units72.
Renovation and Modernization of Unit 3 has been undertaken from June 2011.
A 660 MW unit is in planning stage (2017-18).
72
Government of India, MECON Ltd., Report on achievable heat rate and auxiliary power consumption of thermal power stations, 2007, pp. 187

Electricity 100
Bhusawal Thermal Power Station
Bhusawal thermal power station is located at Deepnagar in Jalgaon district of Maharashtra. The total installed capacity of this power plant is 1420 MW and comprises total five units. The first three units were installed during years 1968 to 1982. These units are old and have outlived their normal life span.
Table 31 - Unit wise installed capacity of Bhusawal thermal power station (2012)
लीज ननर्भिती षभता १४२० MW (२ x २१० MW; २ x ५०० MW)
कें द्र कामियत कयण्माची तायीख वचं १ (५८ MW) - १७ जुर,ै १९६८ (फदं केर)े
वचं २ (२१० MW) - ३० ऑगस्ट, १९७९
वचं ३ (२१० MW) - ४ भे, १९८२
वचं ४ (५०० MW) - भाचि, २०१२
वचं ५ (५०० MW) - जून २०१२
वयावयी कामिषभता (वचं १ - ३) ६१%
The first unit was commissioned in July 17, 1968. Its installed capacity was 62.5 MW which was derated to 55 MW from April 20, 2007. Unit 1 was utilised to generate power for a span of around 42 years and was scrapped w.e.f. November 16, 2010. The average age of the plants is 25-28 years and unit 1 had clearly outlived its normal lifespan. Installed capacity and generation of the older units 1, 2 and 3 installed from the sixties, seventies and eighties is presented graphically below. The average efficiency of these 3 units since their date of commissioning till 2006- 07 is 61%.

Electricity 101
Figure 36- बुवालऱ औष्णणक वलद्मुत कें द्राची लीज ननर्भिती षभता ल प्रत्मष लीज ननर्भिती (1968-69 to 2006-07)
Units 4 and 5 have been recently commissioned in March and June 2012 with an installed capacity of 500 MW each. Thus, total installed capacity of Bhusawal thermal power station is 1420 MW.
Units 1, 2 and 3 were designed in the seventies based on prevailing pollution norms and technology of those days. Few broad reasons which pose problems in meeting the desired performance level of the units are73
Poor quality of coal
Less availability of boiler feeder pump (BFP) in summer
Problem of temperature rise in Unit Auxiliary Transformer (UAT) and
Ageing of the units
The design GCV of coal in units 2 and 3 has been considered as 5000 kcal/kg whereas the actual GCV of coal being supplied varies from 3000 kcal/kg to 4000 kcal/kg. This results in the deterioration of the equipment in the long run.
Renovation and Modernization of Unit 2 has been undertaken from June 2011.
One 660 MW unit is under planning stage. (2016-17)
73
Government of India, MECON Ltd., Report on achievable heat rate and auxiliary power consumption of thermal power stations, 2007, pp. 200

Electricity 102
Paras Thermal Power Station
Paras thermal power station is located at Paras in Akola. There was no capacity addition till as late as 2008 and total installed capacity of the power plant was 62.5 MW. The plant comprised two units viz. unit 1 of 30 MW and unit 2 of 62.5 MW.
Unit 1 was scrapped in 1991 due to ageing and inefficient performance.
Unit 2 was commissioned on October 25, 1967. In its operating life span, it was derated twice, once to 58 MW from 1980-81 and a second time to 55 MW from April 20, 200774. This unit was thus derated by 12% from its designed capacity since commissioning. The average efficiency of unit 2 of Paras thermal power station was 60%, since its commissioning till 2006-07.
It was the first power station in MSEB (now MSGPCL) to use pulverized coal for its boilers and hydrogen gas for cooling of generator. Generation details of unit 1 were not available, so its efficiency could not be calculated. Unit wise installed capacity is indicated below.
Table 32 - Unit wise installed capacity of Paras thermal power station (2012)
लीज ननर्भिती षभता ५०० MW
कें द्र कामियत कयण्माची तायीख वचं १ (३० MW) – ३१ भाचि १९६१ (फदं केरे) वचं २ (६२.५ MW) - २५ ऑक्टोफय १९६७ (फदं केरे) वचं ३ (२५० MW) - ३१ भाचि, २००८
वचं ४ (२५० MW) - ३१ ऑगस्ट, २०१०
वयावयी कामिषभता (वचं २) ६०%
The installed capacity vis a vis generation of unit 2 is graphically presented in figure 4 below. This unit has achieved efficiency as high as 95% in the year 2005-06 while average efficiency from its date of commissioning till 2006-07 was 60%.
74
http://www.parastps.co.in/index.php?option=com_content&view=article&id=53&Itemid=58

Electricity 103
Figure 37 - ऩायव औष्णणक वलद्मतु कें द्राची लीज ननर्भिती षभता ल प्रत्मष लीज ननर्भिती
Unit 2 had aged and outlived its normal lifespan, deteriorating its performance and was decommissioned in November 16, 2010, a span of 43 years.
A 250 MW unit is in the planning stage (2017-18).

Electricity 104
Parli Thermal Power Station
Parli thermal power station is located at Parli Vaijnath in Beed district of Maharashtra. In the seventies and eighties, five power generating units were installed in two stages. The first stage comprised units 1 & 2 of 30 MW each commissioned in 1971, and second stage comprised units 3, 4 & 5 of 210 MW capacity each installed from 1980 to 1987. Total units installed are tabulated below.
Table 33- Unit wise installed capacity of Parli thermal power station (2012)
लीज ननर्भिती षभता ११३० MW (३ x २१० MW; २ x २५० MW)
कें द्र कामियत कयण्माची तायीख वचं १ (३० MW) - १७ भे १९७१ (फदं केर)े वचं १ (३० MW) - १५ नोव्शेंफय १९७१ (फदं केरे) वचं ३ (२१० MW) - १० ऑक्टोफय १९८०
वचं ४ (२१० MW) - २६ भाचि १९८५
वचं ५ (२१० MW) - ३१ डडवेंफय १९८७
वचं ६ (२५० MW) - १ नोव्शेंफय २००७
वचं ७ (२५० MW) - ३१ जरु ै२०१० वयावयी कामिषभता (वचं १-५) ६४%
Stage 1 units were derated to 20 MW from April 20, 2007 and were retired and closed in December 15, 2012. The average efficiency (from 1971-72 to 2006-07) of stage 1 and 2 of Parli thermal power station is 64%.

Electricity 105
Figure 38 - ऩयऱी औष्णणक वलद्मुत कें द्राची लीज ननर्भिती षभता ल प्रत्मष लीज ननर्भिती
Installed capacity of Parli thermal power station was increased in 2007 and in 2010 with the commissioning of units 6 & 7 under stage 3. Installed capacity of units 6 and 7 is 250 MW each. The current installed capacity of the power plant is 1130 MW.
The coal received at the power station is of low grade (3500-3600 kcal/kg) as compared to design quality (4445 to 5000 kcal/kg) of coal. This increases the heat rate and auxiliary consumption of the units75.
Since the units are around 25 to 36 years old, they have deteriorated over the time due to wear and tear, different temperature regime, etc. This results in increase in heat rate of the units, thereby reducing the efficiency. Performance of cooling tower also decreases due to ageing civil structure.
Stage 1 units would be replaced by unit 8 with a capacity of 250 MW, which will be operational in July 2013.
Renovation and Modernization of Unit 3 has been undertaken from September 2011.
One 250 MW unit is under completion.
75
Government of India, MECON Ltd., Report on achievable heat rate and auxiliary power consumption of thermal power stations, 2007, pp.234, 247

Electricity 106
Khaparkheda Thermal Power Station
Khaparkheda thermal power station is located in Nagpur. It is the oldest power station in MSPGCL and had an installed capacity of 30 MW (3 x 10). During the subsequent years 3 units of 30 MW each were added, increasing the capacity to 120 MW. The old power stations of 3 x 10 MW were shut down in 1976 and the 3 x 30 MW units were closed on June 22, 1991.
Table 34 - Unit wise installed capacity of Khaparkheda thermal power station (2012)
लीज ननर्भिती षभता १३४० MW (४ x २१० MW)
कें द्र कामियत कयण्माची तायीख वचं १ (२१० MW(: २६ भाचि, १९८९
वचं २ (२१० MW): ८ जानेलायी, १९९०
वचं ३ (२१० MW): ३१ भे, २०००
वचं ४ (२१० MW): ७ जानेलायी, २००१
वचं ५ (५०० ) जुर ै२०११ वयावयी कामिषभता (वचं १-४) ७०%
Four power generating units were installed during years 1989 to 2001 in two stages. Units 1 and 2 were installed in 1989-90, while units 3 & 4 were installed in 2000-01. The average efficiency of these units is 70%. Figure 6 indicates the installed capacity vis a vis generation of the power plant.

Electricity 107
Figure 39-खाऩयखेडा औष्णणक वलद्मुत कें द्राची लीज ननर्भिती षभता ल प्रत्मष लीज ननर्भिती
The average age of stage 1 and 2 units range from 11-23 years. Natural deterioration due to several factors such as wear & tear, different temperature regimes etc. results in the increase in heat rate of units.
Sometimes the coal received is of low grade and muddy with high moisture content which results in less generation and increase in auxiliary power consumption. Due to deterioration in the quality of coal the percentage of coal mill rejects has also increase from the designed value of 0.5% it has increased to 1.5% for stage 1 units and 1% for the stage 2 units.
Though this power plant has the highest average efficiency as compared to other MSPGCL power stations, its performance still has a scope for improvement if excellent quality coal is used.

Electricity 108
Chandrapur Thermal Power Station
There are 7 power generating units in Chandrapur thermal power station installed during years 1983 to 1997 in two stages. Units 1 to 4 were installed in the years 1983 to 86 and units 5 & 6 were installed in 1991 – 92, while unit 7 in 1997. The table above
Table 35 - - Unit wise installed capacity of Chandrapur thermal power station (2012)
लीज ननर्भिती षभता २३४० MW (४ x २१० MW; ३ x ५०० MW)
कें द्र कामियत कयण्माची तायीख वचं १ (२१० MW): १५ ऑगस्ट, १९८३
वचं २ (२१० MW): २४ जरु,ै १९८४
वचं ३ (२१० MW): ३ भाचि, १९८५
वचं ४ (२१० MW): ८ भाचि, १९८६
वचं ५ (५०० MW): २२ भाचि, १९९१
वचं ६ (५०० MW): ११ भाचि, १९९२
वचं ७ (५०० MW): १ ऑक्टोफय, १९९७ वयावयी कामिषभता (वचं १-४) ५९%
Performance of the units is not up to the desired levels. Few broad reasons which pose problems in meeting the desired performance level of the units are76
Poor quality of coal
Increase in CW inlet temp.
Obsolete design of first two boilers and
Ageing of the units.
Figure 40 -चंद्रऩूय भशाऔष्णणक वलद्मुत कें द्राची लीज ननर्भिती षभता ल प्रत्मष लीज ननर्भिती
76
Government of India, MECON Ltd., Report on achievable heat rate and auxiliary power consumption of thermal power stations, 2007, pp. 131

Electricity 109
Units 1 and 2 are of conventional type and there are several design constraints, due to which the desired load cannot be achieved. Age of these units ranges from 28-29 years, due to which natural wear and tear of the equipment is expected.
It is observed that since commissioning, the units on a monthly basis have operated at an average load of 160-180MW. When tried to load above 190 MW there are chances of boiler tube failure. Efficiency of units 4 and 5 is affected due to poor quality of coal77.
Figure 41- Average Load of Unit 1
Figure 42- Average load of Unit 2
77
Government of India, MECON Ltd., Report on achievable heat rate and auxiliary power consumption of thermal power stations, 2007, pp. 136, 137

Electricity 110
The boilers of units 6, 7 and 8 are adversely affected due to clinker problem. Clinkers cause tipping/ outages of power plants. Clinkers have been a recurring problem in all coal-fired boilers for as long as humans have operated coal boilers. Clinkers occur in small stoves used for heating a home and in giant commercial/industrial boilers. Clinkers, also known as slag, consist of the noncombustible elements and minerals found in coal that melt and fuse together as lumpy ashes from coal combustion78.
The sand content in coal is primarily the problem for clinkering and slagging. The sand also contains iron and calcium impurities due to which ash fusion temperature decrease. The clinkering problem gives rise to frequent soot bowing as well as frequent bottom ash evacuation. The average age of stage 2 units is 15-20 years. The units are designed to operate with coal of GCV 3750 kcal/kg for units 5 & 6 and 3500 kcal/kg for unit 7. However the available coal has GCV of about 3000 - 3300 kcal/kg. The constituents of coal such as moisture, Hydrogen and ash show wide variation as compared to the designed coal quality. Poor quality of coal and clinkering problems also affect the heat rate.
Renovation and Modernization for Units 1 & 2 has been undertaken in October 2010.
Two 250 MW units are under execution.
78
What Causes Clinkers in Coal Fired Boilers? http://www.ehow.com/info_12152358_causes-clinkers-coal-fired-boilers.html#ixzz27Mp1IySR

Electricity 111
Renovation and Modernization
Renovation and Modernization is distinctively different from the regular Operation and Maintenance (O&M). R&M makes way for a disciplined and efficient O&M. O&M is a procedure to be undertaken quite frequently while R&M is scheduled once in about ten years.
Central Electricity Authority started the Phase-I Renovation and Modernization (R&M) Program in 1984 for power generating units in 34 power stations in India79.
After Phase-I R&M in the 7th plan, subsequent five-year plans paved way for further R&M works covering much of the generating units in the country. 163 units were covered in 7th plan period and 198 in the 8th plan period. Life Extension (LE)80 was started to supplement R&M in the 9th plan period. 127, 57 and 76 thermal generating units went through R&M and 25, 106 and 53 units went through LE during 9th, 10th and 11th plan periods respectively.
Average R&M expenditure has increased from Rs.4-6 crore/unit to Rs.60 crore/unit, while LE expenditure has increased from Rs.60-65 crore/unit to around Rs.250 crore/unit81.
Table 36 -R&M and LE – Units covered and cost incurred
Five Year Plan
Thermal power stations
Units covered
R&M Total Expenditure (Rs. Crore)
LE Total Expendit-ure (Rs. Crore)
Expendit-ure on R&M/unit (Rs. Crore)
Expendit-ure on LE/unit (Rs. Crore)
Additional generation achieved (MU)
Installed Capacity covered (MW)
R&M LE R&M LE
7 34 -- 163 -- 1066 cr. -- 6.5 cr. -- 10000 13570
8 44 -- 198 -- 862 cr. -- 4.35 cr. -- 5000 20869
9 29 7 127 25 850 cr. 1560 cr. 6.7 cr. 62.4 cr. 14500 18991
10 13 32 57 106 977 cr. 9200 cr. 17 cr. 87 cr. 23700 (anticipated)
10747
11 21 23 76 53 4487 cr. 12433 cr. 59 cr. 235 cr. 14000 (anticipated)
26283
Planned for 2012-17
12 8 32 23 72 4971 cr. 28868 cr. 216 cr. 400 cr. 6900 (anticipated)
16532
79
http://www.cea.nic.in/reports/renov_modern/national_plan.pdf 80
http://www.cea.nic.in/reports/renov_modern/th_randm_annex-a.pdf 81
http://www.cea.nic.in/thermal_rnm.html

Electricity 112
Table 37 -R&M works in MSPGCL power plants in the 10th and 11th five-year plans82
Plan and Year
Year of commis- sioning
Plant Units Proposed cost (Rs. Crore)
Incurred cost (Rs. Crore)
Actual Energy Efficiency and R&M undertaken
83
10 (2002-07)
1979 1980 1981
Nashik 3 4 5
484.7 469 Unit 3 (June 2011)
1989 1990
Khaparkheda 1 2
54.2 53.2
1979 1982
Bhusawal 2 3
246.8 210.1 Unit 2 (June 2011)
11 (2007-12)
1978 1982 1983
Koradi 5 6 7
573 309.4 Unit 6 (March 2012)
1983 1984 1985 1986 1991 1992
Chandrapur 1 2 3 4 5 6
335.13 335.16 Unit 1 & 2 (October 2010)
1980 1985 1987
Parli 3 4 5
312.9 108.4 Unit 3 (September 2011)
O&M works are carried out frequently. Planned outage is essential and inevitable, but forced outage is a result of indiscipline and error, human and mechanical, which reduce PLF. Evaluation of power plant performance presented earlier in this chapter illustrates factors affecting PLF and the extent to which they affect. In spite of O&M and R&M, the PLF of 61% in 2011. We shall have a look at the solutions other than institutional reforms to improve power plant performance.
The table below provides a comparison between central, state and private power generators in India. It can be seen that central and private generators are more efficient than MSPGCL. Moreover, NTPC boasts best PLF (85%) in the country, while state utilities’ average PLF is about 71%84. PLF of MSPGCL power stations reduced to 61.23% in 2010-1185. Around 80% of coal in India is produced by Coal India Limited (CIL), a state owned “Maharatna” Company86. Even
82
India Infrastructure Research, Thermal Power Generation in India 83
http://www.mahagenco.in/PIP/home.php 84
Government of India, Ministry of Power, Central Electricity Authority, Thermal Performance Review 2009-10 85
Government of Maharashtra, MSPGCL, Annual Report 2010-11 http://www.mahagenco.in/soa/AnnualReportENGLISH-FY_2010-2011.pdf 86
http://www.coalindia.in/Company.aspx?tab=0
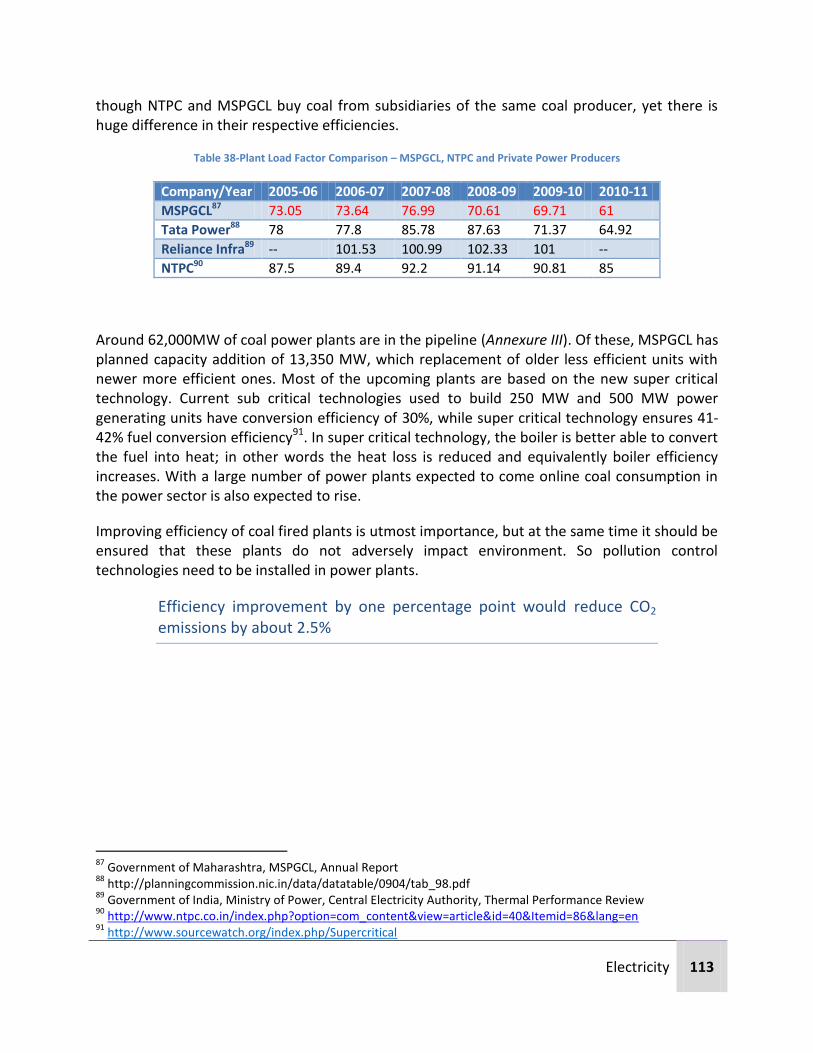
Electricity 113
though NTPC and MSPGCL buy coal from subsidiaries of the same coal producer, yet there is huge difference in their respective efficiencies.
Table 38-Plant Load Factor Comparison – MSPGCL, NTPC and Private Power Producers
Company/Year 2005-06 2006-07 2007-08 2008-09 2009-10 2010-11
MSPGCL87 73.05 73.64 76.99 70.61 69.71 61
Tata Power88 78 77.8 85.78 87.63 71.37 64.92
Reliance Infra89 -- 101.53 100.99 102.33 101 --
NTPC90 87.5 89.4 92.2 91.14 90.81 85
Around 62,000MW of coal power plants are in the pipeline (Annexure III). Of these, MSPGCL has planned capacity addition of 13,350 MW, which replacement of older less efficient units with newer more efficient ones. Most of the upcoming plants are based on the new super critical technology. Current sub critical technologies used to build 250 MW and 500 MW power generating units have conversion efficiency of 30%, while super critical technology ensures 41-42% fuel conversion efficiency91. In super critical technology, the boiler is better able to convert the fuel into heat; in other words the heat loss is reduced and equivalently boiler efficiency increases. With a large number of power plants expected to come online coal consumption in the power sector is also expected to rise.
Improving efficiency of coal fired plants is utmost importance, but at the same time it should be ensured that these plants do not adversely impact environment. So pollution control technologies need to be installed in power plants.
Efficiency improvement by one percentage point would reduce CO2 emissions by about 2.5%
87
Government of Maharashtra, MSPGCL, Annual Report 88
http://planningcommission.nic.in/data/datatable/0904/tab_98.pdf 89
Government of India, Ministry of Power, Central Electricity Authority, Thermal Performance Review 90
http://www.ntpc.co.in/index.php?option=com_content&view=article&id=40&Itemid=86&lang=en 91
http://www.sourcewatch.org/index.php/Supercritical

Electricity 114
Solutions to coal crisis
Institutional
1. Resolve regulation issues between Ministry of Coal and Ministry of Environment and Forests – stakeholders and law makers should work together to reduce differences between environment, rights of local populace and coal sector.
Dump all the waste in an eco-friendly manner Utilize the fly-ash constructively for e.g. to manufacture bricks Do not over exploit water resources Make proper compensations to the displaced people
2. Make sensible FSAs – Fuel Supply Agreements – so that both the sides of the deal benefit fairly in the business dependent on ‘natural resources’.
Agreements should be agreeable to both sides 3. Allocate coal on a competitive basis
Guarantee for the contracted coal quantity as a condition for allocation contract 4. Coal is a limited resource – Bring policy changes in coal power generation
Start the substitution of coal with a proper feasible and sustainable alternative like gas. Explore renewable energy options; promote extensive research in making renewable energy as viable as coal energy. This will reduce the pressure on coal and coal power.
5. Coal imports are making the power costly and the dimensions of the issue are increasing.
Technological
1. There is no single solution to monitor the fuel quality. By incorporating a number of strategies, care that the fuel quality is excellent must be taken.
Check fuel entering the power station Insist for good Gross Calorific Value coal Make provisions so that coal does not get wet or even moist
2. Instead of spending hundreds of crore on Life Extension (LE) works, replace the units that have passed their lifetime.
3. Make way for Super Critical Technology – 660 MW and above power generation units 4. Introduce computerized control in the management system of power plants

Electricity 115
Conclusion
The power plants are suffering from underutilization of capacity due to (low PLFs) and being out of operation for longer periods of time (due to non-availability of water). In many cases the poor quality of coal and irregular supply limited the generation.
There is a plenty of room for improving the efficiency of coal power plants. A modest improvement in PLF upto 75% can avoid installation of 9000 MW coal capacity till 2025. 34,000 MW of coal based capacity would have to be added by 2025 if performance in the power sector is not improved. However improving power plant efficiency to 75% will reduce the addition of coal power to 24,700 MW.
Capital expenditure of Rs. 45000 crore92 will be saved till 2025
India is a developing economy and to satisfy the base load power requirement in the immediate future the dependence will be on power plants based on coal. Reliable electricity is the key to economic development. Coal power stations provide the base load of electricity to the state as well as to the country.
The standard life of a power generation unit is 25-30 years93. But it is important to check the remaining life of these components after 20 years (or 1,60,000 hours of operation) in addition to yearly operation and maintenance. Almost all of the units have are old and have outlived their normal life span.
Replace old units
One of the solutions would be to replace the older power generating units with units equipped with latest technology and designed optimally for available coal. MSPGCL has initiated closure and retirement of its oldest units that were installed in the sixties and seventies. Power generation companies will have to bear huge costs for this renewal which will ultimately be recovered from consumers.
Life Extension, Renovation and Modernization
As discussed earlier, Life Extension (LE) of units supplements R&M. LE works increase the lifetime of a power generating unit by 15 years94. However after undertaking LE and R&M works unless designed fuel quality is ensured, the upgradation would be rendered useless.
92
5 crore per MW of coal based power 93
http://www.cea.nic.in/reports/renov_modern/national_plan.pdf 94
http://www.nlcindia.com/index.php?file_name=about_01e

Electricity 116
Coal quality and Supply
Provide coal with the designed or close to the designed values. Assured, regular and good quality coal should be supplied to power plants.
With the phasing in of supercritical technology coupled with all the measure mentioned above, an ambitious PLF of 85% can also be achieved. Thus, more and more fossil fuel energy can be saved if improvement is consistent.
In spite of tremendous scope for improvement through O&M of power plants, the crux of the problem lies in supply and quality of coal. Most outages are caused because of coal shortage, poor quality of coal, or due to reasons like boiler tube leakage which are direct results of inferior quality coal. Continuous supply of excellent quality coal can potentially increase PLF of MSPGCL coal fired plants to 75%.

Electricity 117
Case studies on performance enhancement initiatives by power producers in India and abroad
Case Study 1- Dahanu Thermal Power Station, Reliance Energy
Dahanu Thermal Power Station owned and run by Reliance Energy achieved the highest ever Plant Load Factor (PLF) of 102.33% in India (2009-10)95. PLF greater than or equal to 100% means that the power station generated electricity at full rated output without any disruption. Ideally, PLF exceeding 100% seems impossible, but a power generating unit is designed with an added tolerance capacity; thus a 250 MW unit can sometimes deliver output power of 251 MW (100.4% PLF).
Figure 43-रयरामन्वची लीज ननर्भिती षभता ल प्रत्मष लीज ननर्भिती
Performance improvement strategies undertaken by Dahanu TPS are worth to be studied and implemented96.
MSPGCL officials recounted the close relationship between the government and private power producers. State owned coal producers (CIL and its subsidiaries) preferably sell the top quality coal to private enterprises through unofficial agreements. Coal found in India is of low quality as compared to coal found in other parts of the world. The finest quality coal that comes out of this is generally sold to private power producers. State owned power producers are left with poor coal97.
95
Government of India, Ministry of Power, Central Electricity Authority, Thermal Performance Review 2009-10 96
http://www.energymanagertraining.com/announcements/issue28/Winners/1_Santosh%20Mahadeo%20Mestry.pdf 97
LiveMint, “WCL supplying inferior quality coal: MahaGenCo”, Makarand Gadgil, October 14, 2011 http://www.livemint.com/2011/10/14220042/WCL-supplying-inferior-quality.html

Electricity 118
Non availability of coal, poor quality of coal, more ash content in coal, lower GCV of coal, wet coal are some of the practical difficulties that arise; and significantly lower the PLF. State owned power producers are worst affected by this which results in poorer and poorer performance.
The excellent Plant Load Factor of Dahanu TPS might have resulted from this fact. And this also might be the reason for lower PLFs of MSPGCL power plants.
Case Study 2 –National Thermal Power Corporation (NTPC)
NTPC is India’s largest power producer and fifth largest enterprise in India. Total installed capacity of the company is 39,174 MW (including Joint Ventures) with 16 coal-based and 7 gas-based stations. NTPC has been operating its plants at high efficiency levels. Although the company has 17.75% of the total national capacity, it contributes 27.40% of total power generation due to its focus on high efficiency.
Figure 44-Performance of NTPC – Evaluation by NTPC
The Times of India, “Maharashtra Electricity Regulatory Commission overlooks MahaGenCo’s failure to lift WCL coal”, Ashish Roy, June 22, 2012 http://articles.timesofindia.indiatimes.com/2012-06-22/nagpur/32368265_1_wcl-western-coalfields-limited-mahagenco

Electricity 119
Figure 45-Performance of NTPC – evaluation by third party98
NTPC has taken the following steps to enhance their performance99
1. Adoption of newest technology a. Pneumatic conveyors for fly ash b. Ash water recirculation system c. Pipe conveyors for coal
2. Online systems a. Online life assessment b. Online coal flow measurement c. Acoustic pyrometers d. 3-D model of complete plant layout
3. High efficiency Electrostatic precipitators (efficiency of the order of 99.97%) 4. Soft logic in control systems like Electrical breakers (forced outage minimization) 5. Collaboration with academic and research institutions
98
http://www.business-standard.com/content/research_pdf/ntpc_160512.pdf 99
http://www.asiapacificpartnership.org/pdf/PGTTF/events-april-08/Asia_Pacific_Partnership_India_Peer_Review_NTPC_ppt.pdf

Electricity 120
History of Coal – the primary fuel for power generation
Coal is a vitally important resource in India as more than 50% power produced is attributed to coal. Coal has a clear cut majority in power generation both in the country and in the state. That is the reason why coal is critically important as a primary energy resource. Given the interdependence between coal and coal power sector it is important to have a better understanding of issues associated with the coal sector. Coal quality is an important factor in the efficiency of power plants. But constraints like uncertainties, poor coal quality need to be taken into consideration. It has been observed that in many cases, lack of regular coal supply and poor quality of coal has limited generation. Poor quality coal increases wear and tear of power plant equipment. Use of low-quality coal increases auxiliary consumption, operation and maintenance costs and time, and reduces overall efficiency. The subsequent paragraphs deal with these issues.
Coal India Limited (CIL)100 is a central government owned coal manufacturer of India, and is the single largest coal manufacturer in the world. It has been granted ‘Maharatna’ status by the Government of India (Ministry of Heavy Industries and Public Enterprises) for its stature and achievements101.
CIL was formed on November 1, 1975 after the nationalization of coking coal mines in May 1972 and that of non-coking coal mines in May 1973. It has seven wholly owned coal producing subsidiaries.
1. Eastern Coalfields Limited (ECL), Sanctoria, West Bengal 2. Bharat Coking Coal Limited (BCCL), Dhanbad, Jharkhand 3. Central Coalfields Limited (CCL), Ranchi, Jharkhand 4. South Eastern Coalfields Limited (SECL), Bilaspur, Chhattisgarh 5. Western Coalfields Limited (WCL), Nagpur, Maharashtra 6. Northern Coalfields Limited (NCL), Singrauli, Madhya Pradesh 7. Mahanadi Coalfields Limited (MCL), Sambalpur, Orissa
100
http://www.coalindia.in/Company.aspx?tab=0 101
The criteria for Maharatna status is as follows:
Having Navratna status.
Listed on Indian stock exchange with minimum prescribed public shareholding under SEBI regulations.
An average annual turnover of more than Rs. 20,000 crore during the last 3 years. Earlier it was Rs 25,000 Crore.
An average annual net worth of more than Rs. 10,000 crore during the last 3 years. Earlier it was Rs. 15,000 crore.
An average annual net profit after tax of more than Rs. 2500 crore during the last 3 years. Earlier it was Rs. 5000 crore.
Should have significant global presence/international operations. The Maharatna status gives the PSEs financial and managerial autonomy to invest up to Rs. 5000 crore in a new venture without seeking government approval.

Electricity 121
Coal production for the last five years is tabulated below. We can see that the production increased for the first three years, but after that it has stabilized in spite of the ever increasing demand. Non coking coal is used in power generating plants. Coal production for India and CIL (monopoly in coal production in India) is tabulated below.
Table 39- Production (Million tons) by Coal type - CIL (2008-2012)
2008 2009 2010 2011 2012
Raw prod.
Raw prod.
Raw prod.
Raw prod.
Raw prod.
Non Coking Coal 353.30 377.19 395.13 389.97 392.48
Coking Coal 26.16 26.54 36.13 41.35 43.36
Total 379.46 403.73 431.26 431.32 435.84
Table 40- Production (Million tons) by coal type – All India (2007-2011)
2008 2009 2010 2011 2012
Raw prod.
Raw prod.
Raw prod.
Raw prod.
Raw prod.
Non Coking Coal 398.73 422.63 457.95 487.63 483.54
Coking Coal 32.10 34.45 33.81 44.41 49.53
Total 430.83 457.08 491.76 532.04 533.07
Coal is found primarily in the states of Jharkhand, West Bengal, Chhattisgarh, Madhya Pradesh, Maharashtra, Orissa and Andhra Pradesh. Lignite reserves are situated in Rajasthan and Gujarat, but most prominently in Tamil Nadu. India owns fifth largest estimated coal reserves (Geological Resources of Coal) in the world - 285.86 billion tons102; of which, 113.4 billion tons are proven resources.
102
http://coal.gov.in/welcome.html

Electricity 122
Figure 46- Coal and lignite reserves map of India103
Institutional barriers
Annual requirement of coal in India was pegged at 604.33 MT by Planning Commission in 2009-10104. Actual supply of raw coal was 580 MT, 513 MT from indigenous sources and 67 MT from imports.
In spite of having excellent coal resources, we have to accede to coal import. The main obstruction as cited by the Coal Ministry is delay caused by forest and environment clearances. Ministry of Environment and Forests (MoEF) has barred coal producers from mining coal in some places, and has also halted mining operations in some105. The Coal Ministry and coal manufacturers always grapple with MoEF for clearances due to which production is hampered. There is a serious debate running constantly between giving service to the accelerating growth and preserving the environment.
103
Maps of India http://www.mapsofindia.com/maps/india/coalreserves.htm 104
Provisional Coal Statistics, 2009-10 105
The Economic Times, “Government panel says 'Go, No-Go' concept of forest area classification legally not tenable and should be abandoned”, Sarita Singh, June 29, 2011 http://articles.economictimes.indiatimes.com/2011-07-29/news/29829405_1_environment-ministry-coal-blocks-forest-clearance

Electricity 123
80% of coal produced per year goes for power generation.106 Other prominent buyers of coal are Cement, Sponge Iron and Steel manufacturers. Others include heavy energy consuming industries that have captive power plants with coal linkage agreements with the coal producers.
Fuel Supply Agreement
The agreement between fuel producer and power generator (MSPGCL) that decides the contracted fuel quantity, the period of supply, the minimum compulsory amount to be supplied as a percentage of the contracted quantity, the penalty for supply default is the Fuel Supply Agreement (FSA).
CIL released changes in FSAs in April 2012 wherein CIL was liable to supply at least 80% of the contracted coal quantity and not 100%. The penalty, if less than 80% is supplied was pegged at just 0.01% of the shortfall107. Also, 80% quantity was to be supplied in a period of three years and no penalty was to be issued against the coal supplier (CIL) in this period. FSA also gave supplier the power to terminate the agreement unilaterally, which was unacceptable. This FSA was overtly one-sided and it exploited the interests of CIL and the helplessness of power producers.
Very few power producers agreed to this FSA. NTPC opposed it strongly, and after the intervention of PMO the clause of 0.01% penalty was changed to a penalty of 10% of the shortfall108. As CIL governs more than two third of coal production in India, it included one sided clauses in the agreement. This has resulted in delay in confirmation of clauses in FSA and agreement on both sides.
In addition to the tussle between coal and environment ministries, this in itself is a barrier in growth of energy sector. This weakens the public sector enterprises and deteriorates the standard of provision of basic services to the consumer.
This lop-sided nature of the agreement shows that CIL, in spite of being the single largest coal manufacturer in the world, still has to struggle for profits. The growth in coal production by CIL has not been commendable.
In this fight between the coal producers and power producers (most of which are state owned), the ultimate sufferer would be the consumer who has to bear the cost.
106
http://coal.gov.in/cpddoc.htm 107
Daily News and Analysis, “Coal India board okays 80% trigger, not the penalty”, Sumit Moitra, August 1, 2012 http://www.dnaindia.com/money/report_coal-india-board-okays-80pct-trigger-not-the-penalty_1722435 108
The Economic Times, “NTPC ends row with Coal India over fuel supply agreement; accepts changes proposed by PMO”, Debjoy Sengupta, June 26, 2012 http://articles.economictimes.indiatimes.com/2012-06-26/news/32424986_1_fuel-supply-agreement-coal-india-cil

Electricity 124
Importance of Coal in India and Maharashtra
Coal India Limited produces 81% of the total coal produced in the country. Almost all the state owned power plants buy coal from CIL and its subsidiaries. Maharashtra buys coal from Western Coalfields Limited (WCL). WCL produces around 43MT of coal per year. Thermal power plants in Maharashtra require an average of 39.6 MT coal per year, if we extrapolate coal linkages per day on to coal requirement per year109. Several private (CPPs and IPPs) and captive power producers buy coal from various sources including CIL.
Thermal plants of MSPGCL and private producers contribute largely to the power requirement of Maharashtra. It has been observed and MSPGCL also claims that they are supplied with poor quality coal110 whereas fine quality coal is supplied to private producers. The problems associated with coal that pose major impediments in power plant performance are indicated below.
Supply default – 100% contracted quantity is not supplied, results in more outages
Wet coal – Coal is often transported in open containers and stored in open spaces. Wet coal or moist coal reduces the calorific value of coal.
Coal found in India is of low quality and has a low gross calorific value111. It also has high (30-35%) ash content which reduces Specific Coal Consumption (SPCC).
Adulteration – Mixing of sand, shale, stones and other impurities damage the power generation equipment esp. the coal pulverizer (crushers).
Though there is 112 billion tons of proven coal reserves in the country, problems related with quality, supply and transport deter growth of energy sector which hampers development on social and economic fronts. Poor quality of coal is problematic as it increases auxiliary consumption, operation and maintenance costs and time, and reduces overall efficiency. Hence, use of better quality coals, including washed coals, would improve efficiency.
Coal-gate scam
Popularly called as Coal-gate by critics, the report by the Comptroller and Auditor General (CAG) of India on coal sparked widespread protests-in-print in response to the estimated loss of Rs. 1.86 lakh crore to the exchequer of India.
109
Government of India, Ministry of Power, Central Electricity Authority, Multiplied linkages per day for thermal power stations by 365 to get the annual requirement http://www.cea.nic.in/archives/coal_monthly/jul12.pdf - 110
LiveMint, “WCL supplying inferior quality coal: MahaGenCo”, Makarand Gadgil, October 14, 2011 http://www.livemint.com/2011/10/14220042/WCL-supplying-inferior-quality.html 111
http://www.fe.doe.gov/international/Publications/Coal_Beneficiation_Workshop/coal_beneficiation_paper_zamuda.pdf

Electricity 125
Coal, like water and oil is a natural resource. The ownership of such resource naturally goes to the state, whose beneficiaries are its people. India has fifth largest coal reserves in the world. State must take care – by law – that the beneficiaries of the revenue generated from the natural resources its people own, must be passed on to them.
From 1993 till 2005, 41 private companies and 29 state-owned companies got coal blocks “for free”. This exponential acceleration can be attributed to the post liberalization era. It must be taken into account that even if less number of coal blocks were allocated to state-owned companies, the amount of coal to be mined was far more. After 2005, improvements were made in coal block allocation. Newspaper advertisements with separate advertisements for different sectors were introduced to accelerate the process and stop the delays that impede sectoral growth.
CAG Audit: In 2010, parliament passed the amendment bill of Mines and Minerals (Development and Regulation) Act (MMDR Act), and auction was made compulsory. Till then from 2006 to 2009, 135 captive coal blocks were allocated freely to government and private companies. Competitive bidding would have got the highest bidder to the forefront and the state would have received a justified market price for the coal blocks sold.
By giving away captive coal blocks freely to private companies, the state deprived itself of the money it owned. The money remained with the parties from whom it should have been ideally transferred to Government of India. The ultra-fast coal block allocation was done as a necessity for higher growth, and to minimize the need for expensive coal imports, asserts the Coal Ministry.
Clarification by Ministry of Coal: If the coal blocks were not made available, it would have resulted in higher imports causing outflow of foreign exchange or no large investments in these crucial sectors. Allocation of coal blocks has resulted in investment in these sectors which was the need of the times. 195 blocks with reserves of 44.23 billion tonnes of coal stand allocated, out of which 96 blocks with 26.93 billion tonnes of reserves have been allocated to Government companies / UMPPs. 27 blocks with 5 billion tonnes of coal reserves are allotted to private companies in the power sector, which is a regulated sector.

Electricity 126
Solution 2
Reduce T & D losses
Goal: To strengthen the power transmission and distribution system

Electricity 127
Introduction
Electricity once generated must be moved to areas where it will be used. This is known as transmission – moving large amounts of power over sometimes very long distances. It is separate from distribution, which refers to delivering electric energy from the high voltage transmission grid to specific locations such as residential streets, commercial organizations, etc. Distribution is considered to encompass substations and feeder lines that take power from the high voltage grid and progressively step down the voltage. The transmission and distribution system includes everything between a generation plant and an end use site. Along the way, some of the energy supplied is lost due to the resistance of wires and equipment that the electricity passes through. Most of this energy is converted into heat. The amount of energy that is lost in T&D depends on the physical characteristics of the system as well as how it is operated112.
The central transmission utility (CTU) and state transmission utilities (STUs) are responsible for interstate and intra-state transmission in India. The STUs develop, operate and maintain the state transmission system to facilitate transmission of electricity from its source to load dispatch centres. MSEDCL is the distribution company of Maharashtra and MSETCL is the transmission company. The transmission network is used for electricity trading, providing open access and transfer of electricity. Electrical losses are an inevitable consequence of the transfer of energy across electricity distribution networks. Almost 100% of electricity transmission in India is owned by the public sector while about 13% of electricity distribution in India is owned by the private sector113.
The transmission and distribution (T&D) losses in our country, which were around 15% up to 1966-67, increased gradually to 23.28% by 1989-90. After a brief spell of reduction in T&D losses to 21.13% (1994-95), there has been an upswing and the losses reached a level of 33.98% during 2001-02. Since then, a reducing trend has been observed as T&D losses have come down to 32.54% during 2002-03, 32.53% during 2003-04 and 31.25% during 2004-05114.Over 21% of the total electricity generated in India is lost to transmission and distribution115. The T&D losses in the advanced countries of the world have been ranging between 6 to 11%116. T&D losses in India are among the highest in the world. These losses result in reduction of the State revenue and have drastic implications on profitability and commercial viability of the operations of transmission and distribution companies.
112
Energy efficiency in the power grid - http://www.nema.org/prod/technologies/upload/TDEnergyEff.pdf 113
The Political Economy of India’s Climate Agenda, CEPS Working Document No. 325/March 2010, Noriko Fujiwara 114
http://www.ignou.ac.in/schools/soet/acpdm/BLOCK%204%20BEE-001/Part%203.pdf 115
Journal of Computer Science 3 - Performance Monitoring of Energy Flow in the Power Transmission and Distribution System Using Grid Computing, (5): 323-328, 2007 http://www.scipub.org/fulltext/jcs/jcs35323-328.pdf 116
http://www.ignou.ac.in/schools/soet/acpdm/BLOCK%204%20BEE-001/Part%203.pdf

Electricity 128
MSEDCL suffers heavy financial losses due to theft/ pilferage of electricity, unmetered use and ineffective practices of billing and collection. In addition, the distribution system is often characterized by inefficiency, low productivity, frequent interruption in supply and poor voltage.
System losses increase the operating cost of power utilities and typically result in higher cost of electricity.
Electricity consumption
Domestic, industrial, commercial and agricultural consumers comprise the key customer segments. Besides these power is also supplied in bulk to railways for traction as well as to service utilities for public lighting and water works, among other. The total power consumption in 2010-11 is 87,397 MU (million kWh). Power consumption has grown at an average rate of 9.48% over the period from 2005-06 to 2010-11. The following table gives the consumption of electricity in the state by customer type.
Table 41: Consumption of electricity in Maharashtra by consumer type
Consumer Category
05-06 mkWh
06-07 mkWh
07-08 mkWh
08-09 mkWh
09-10 mkWh
10-11 mkWh
Annual % change (10-11)
Average % change
Agriculture 11094 9749 12676 12733 13925 16257 16.75 9.3
Industry 25692 26535 30323 28850 30866 34416 11.5 6.8
Commercial 4841 6940 6661 9102 10546 11571 9.72 27.8
Domestic 13572 14284 15553 16878 18171 19547 7.57 8.8
Administrative purposes
Railways 1861 1987 2024 2110 2119 2707 27.75 9.1
Public works 2148 2272 2520 2560 2658 2310 -13.1 1.5
Miscellaneous 79 318 82 761 854 589 -31.0 129
Total 59287 62085 69838 72994 79139 87397 10.43 9.48
Of the estimated total power consumption of 87,397mkWh in 2010-11, the industrial sector consumed the majority share at 39.38%. This was followed by domestic (22.37%) and agriculture (18.6%). These three sectors together, account for 80% of the total electricity consumption in the state. Further, the agriculture segment has recorded the highest annual growth rate of 16.75% (2010-11) and the commercial segment has recorded highest average growth rate of 27.8% in electricity consumption.
The agricultural consumption has shown a modest average growth rate of 9.3% over the period 2005-06 to 2010-11, however it has increased by a staggering 16.75% from 2009-10 to 2010-11. Taking into consideration the consumption from 2005-06 till 2008-09, the share of agriculture consumption as a proportion of total power consumption, decreased from 18.71% (2005-06) to 18.6% (2010-11). In the year 2006-07 and 2007-08, agricultural consumption was 15.70% and

Electricity 129
18.15% as a proportion of total power consumption respectively. Agricultural consumption has remained between 15-20% of total consumption for the past 6 years. The agricultural consumers are a heavily subsidized class of consumers.
Figure 47- Electricity Consumption across various economic sectors and for administrative purposes
The agriculture consumption is not metered and tariffs are based on the pump size or unit horsepower (HP) of the motors. Such power loads get sanctioned at lower load declarations. Once the connections are released the consumer gets into the habit of increasing their connected loads, without obtaining necessary sanction for increased load from the utility117. Further, meter-less connections have made theft easier. Even if the distribution company has the record of total electricity consumed by agricultural consumers, it does not get recorded in front of the actual consumer because of the absence of meter. Drawing electricity from poles or from transmission lines illegally thus goes unnoticed. This has created several inefficiencies in the entire system – pumps are inefficient, price signals for crop selection are limited, water tables are falling rapidly, and poor farmers who do not have access to irrigation face water scarcity. As per the CEA, estimated ultimate groundwater potential in terms of electrical pump sets is 24.49 lakhs for Maharashtra as on July 31, 2012, however, 38.01 lakh118 agricultural pumps were energized at the end of July 2012.
The precise estimation of unmetered consumption by the agricultural sector greatly depends on the cropping pattern, ground water level, seasonal variation, hours of operation, etc.119. Thefts get a safe environment with unmetered connections. Metered connections for agriculture will reduce the AT&C loss to a great extent.
117
http://www.teriin.org/upfiles//pub/papers/ft33.pdf 118
http://www.cea.nic.in/reports/monthly/dpd_div_rep/pumpset_energisation.pdf 119
http://www.teriin.org/upfiles//pub/papers/ft33.pdf

Electricity 130
Transmission and Distribution
The generated electric power is stepped up to a higher voltage for transmission on the transmission grid. The transmission grid moves the power over long distances to substations. Upon arrival at a substation, the power will be stepped down from the transmission level voltage to a distribution level voltage. As the power exits the substation, it enters the distribution grid. Finally, upon arrival at the service location, the power is stepped down again from the distribution voltage to the required service voltage(s).
Maharashtra State Electricity Transmission Company Limited – MSETCL
MSETCL is the wholly Maharashtra Government owned transmission entity under MSEB Holding Company Ltd. providing electricity service in most parts of Maharashtra. It has built 559 substations with a variety of voltage levels as per the requirement and technological progress which transfer electricity from source to the distribution company.
The electricity grid infrastructure is built in Maharashtra predominantly by MSETCL. At national level, Government of India owned Power Grid Corporation of India (PGCIL) builds and manages the national grid. The transmission network of MSETCL is constantly growing to meet the ever growing needs of a developing state.
MSETCL is the only transmission company in India among state transmission utilities to build HVDC (high voltage direct current) transmission line. MSETCL operates 752 km long, 1500 MW, 500 kV bipolar HVDC line from Chandrapur to Padghe. Other than this transmission line the rest of the transmission network operates on HVAC (high voltage alternating current).
Table 42-Transmission Network in Maharashtra, MSETCL
Voltage level
EHV Substations
Transformation Capacity (MVA)
EHV Lines (ckt km)
500 kV HVDC 2 3582 1504
400 kV 22 18180 7405
220 kV 171 39383 13209
132 kV 260 21633 12073
110 kV 34 2674 1724
100 kV 36 2587 686
66 kV 34 1139 3270
Total 559 89178 39871
Transmission System Availability which is a measure of availability of the transmission grid is improving year on year.

Electricity 131
Table 43-Transmission System Availability120
HVAC System (MERC Benchmark 98%)
Year 2005-06 2006-07 2007-08 2008-09 2009-10 2010-11 2011-12 Availability 98.72% 98.82% 98.99% 99.29% 99.48% 99.62% 99.72%
HVDC System (MERC Benchmark 95%) Availability 63.48% 91.73% 92.29% 93.55% 94.96% 97.62% 96.55%
Maharashtra State Electricity Distribution Company Limited – MSEDCL
MSEDCL is the wholly Maharashtra Government owned transmission entity under MSEB Holding Company Ltd. which distributes electricity to its variety of consumers viz. domestic, industrial, agricultural, commercial, public works, railways and other miscellaneous consumers. MSEDCL accepts electricity from MSETCL and dispatches it through State Load Despatch Centre.
MSEDCL has its own infrastructure consisting of distribution transformers, distribution lines, and sub-stations. The growth in distribution infrastructure is shown in the table below.
Table 44 - Distribution Network (Cumulative)121
Year No. of sub stations
No. of distribution transformers
Distribution lines (ckt. Km.)
2006-07 1827 2,72,231 7,07,067
2007-08 1889 3,00,957 7,28,754
2008-09 1947 3,27,314 7,58,093
2009-10 2033 3,51,243 7,92,785
2010-11 2234 3,91,574 8,33,470
120
http://www.mahatransco.in/wps/wcm/connect/b8a373004a56d5bda8cbbaf57b420b69/Technical+Perfoemance+05-2012.pdf?MOD=AJPERES 121
Government of Maharashtra, Department of Planning, Directorate of Economics and Statistics: Economic Survey of Maharashtra, 2011-12

Electricity 132
Transmission and Distribution losses in Maharashtra
T&D losses during 2010-11 were 21.60% as against 25.20% in the previous year. T&D losses in the state for the past six (2006-07 till 2011-12) years have been presented graphically below122. Though the losses have declined over the years they still remain very high. Losses beyond 18% are primarily due to theft of energy123.
Figure 48 – Transmission and Distribution Losses for past 6 years124
To get a picture of the geographical variations in the T&D Losses, circle wise distribution losses in the state (for a six-month period from January 2012 to June 2012) are presented below in the graph125. The average distribution loss for MSEDCL circles in the state is 17.75%. Osmanabad has highest distribution losses of 38%, followed by Nandurbar (35%) Fifteen circles have losses of more than 20%.
122
Government of Maharashtra, Department of Planning, Directorate of Economics and Statistics: Economic Survey of Maharashtra 123
http://www.cag.gov.in/html/cag_reports/maharashtra/rep_2006/com_chap_2.pdf 124
Government of Maharashtra, Department of Planning, Directorate of Economics and Statistics: Economic Survey of Maharashtra, 2011-12 125
http://www.mahadiscom.in/consumer/Distribution-Losses-circle.pdf

Electricity 133
Exhibit 1- Circle-wise Six Monthly Sliding Average Percentage Distribution Loss
By increasing quality of metering, feeder separation and various such measures to curb losses, several circles have reduced their distribution losses by more than 33%.
Figure 49 - Circles with > 33% reduction in distribution loss

Electricity 134
Table 45-AT&C Loss, Billing & Collection Efficiency of Distribution Utilities126
Year AT&C Loss (%)
Collection Efficiency (%)
2001-02 46.34 88.77
2002-03 44.25 87.6
2003-04 26.62 111.16
2004-05 38.95 96.34
2005-06 26.53 102.01
2006-07 NA NA
2007-08 31.32 90.47
2008-09 31.19 88.19
2009-10 25.02 94.42
Transmission loss
Electricity generated at power stations is given to the Power Grid for transmission to different places. Power is required to be transmitted at very high voltage levels in order to transmit it efficiently. It is transmitted at voltage levels ranging from 33kV to 500 kV.
Power is dissipated into the transmission lines as it is transferred from one place to another. Transmission lines have their own resistance where voltage drops as a result of Ohm’s Law. When distances are long, the magnitude of dropped voltage naturally increases. Using excellent quality materials and design for the cables and wires in transmission lines, transmission losses can be controlled.
Old worn-out and poor distribution network leading to frequent outages; skewed tariff structure; huge transmission & distribution (T&D) losses are largely attributed to outright theft & unmetered supply; uneven low transmission/high transmission line ratio, overloaded distribution transformer/lines; lack of accountability at feeder level and in distribution setup of state electricity boards etc.
Distribution loss
It refers to the difference between the amount of energy delivered to the distribution system and the amount of energy customers is billed. The distribution loss figures at 22/11kV and LT levels; the distribution loss estimation is not accurate, as these involve meters at the consumer level. These meters can sometimes be defective. Also, the estimation of distribution loss of unmetered energy for agriculture and other unmetered consumers like single point lighting is quite difficult127.
126
Government of India, Power Finance Corporation, Performance of State Power Utilities 2001-02 to 2005-06 127
Economic and Political Weekly, V Ranganathan: “Determining T&D losses in India-Their Impact on Distribution Privatization & Regulation”, pp. 658, February 12, 2005

Electricity 135
Calculation of T&D losses: T&D loss accounts for the loss of energy from the point of generation to the point of billing. It is the difference between units injected into the system and units billed to the ultimate consumer, and generally expressed as percentage of units injected.
T&D Loss (%) = (Energy input – Energy billed) x 100/ Energy input
These losses occur on both sides of the energy meter - the utility side as well as the consumer side. On the utility side, the main causes for the energy losses are non-standard and antiquated distribution engineering practices, inefficient and overloaded distribution equipment, faulty and poor maintenance practices, a lack of investment in system upgrade, faulty meters and poor commercial management and accounting practices. At the consumer end, the problems leading to avoidable energy and revenue losses are lack of meters, prevalence of flat rate tariffs over metered tariffs, non-payment, theft, illegal connections, and lack of consumer education in the rural sector, rampant political interference and inefficient electricity use128. Distribution system therefore comprises two types of losses: technical as well as commercial losses. System losses increase the operating cost of electric utilities and distinctly result in higher costs of electricity.
T&D networks are supposed to
Reach all consumers that want to be connected
Meet their demands
Provide satisfactory power supply reliability
Provide power supply quality
Technical losses
They are naturally occurring (caused by actions internal to the power system) and consist mainly of heat dissipation in electrical system components. Technical losses occur during transmission and distribution and involve substation, transformer and line related losses. High technical losses in the system are primarily due to inadequate investments over the years for system improvement works, which has resulted in unplanned extensions of the distribution lines, overloading of the system elements like transformers and conductors, and lack of adequate reactive power support. The following are the major reasons for technical losses in India:
Inadequate investment in transmission and distribution, particularly in sub transmission and distribution. The investment in T&D sector (11th FYP) is 1:0.5 as against the ratio of
128
India Electricity Distribution Reform, Review and assessment, Volume I: Main Report Submitted By CORE International, Incorporated U.S.A, September 18, 2002

Electricity 136
1:1129. Low investment has resulted in overloading of the distribution system without commensurate strengthening and augmentation.
Haphazard growths of sub-transmission and distribution system with the short-term objective of extension of power supply to new areas.
Large scale rural electrification through long 11kV and LT lines.
Overloading of existing lines & substation equipment.
Poor quality of equipment used in agricultural pumping in rural areas, cooler air conditioners and industrial loads in urban areas.
Absence of up gradation of old lines and equipment.
Low HT: LT ratio.
Poor R&M of equipment
Non-installation of sufficient capacitors.
Commercial or non-technical losses
Commercial or non-technical losses are caused by actions external to the power system or are caused by loads or conditions that the technical computation fails to take into account. These are difficult to measure as most of these losses are unaccountable. These losses are mainly due to low metering efficiency, unmetered supply of energy, theft and pilferages. This may be eliminated by improving metering efficiency, proper energy accounting & auditing and improved billing & collection efficiency130.
Theft of power is energy delivered to customers that is not measured by the energy meter for the customer. This can happen as a result of meter tampering or by bypassing the meter. Losses due to metering inaccuracies are defined as the difference between the amount of energy actually delivered through the meters and the amount registered by the meters. All energy meters have some level of error which requires that standards be established. The drivers for commercial losses are listed below.
Low metering/billing/collection efficiency;
Low accountability of employees;
Errors in meter reading - Avoid meter reading due to various reasons like house locked, meter not traceable, etc.; manual error in meter reading; data punching errors; lack of validation checks131;
Absence of Energy Accounting & Auditing;
Theft, Pilferage and tampering of meters: Theft or pilferage by existing consumers is the predominant cause of loss of revenue to the utility. Almost all categories of consumers
129
International Conclave on key inputs for accelerated development of Indian power sector for 12th
plan and beyond - Capacity building for transmission system-Supply & Execution, - http://www.cea.nic.in/more_upload/conclave/24.pdf 130
http://www.powermin.nic.in/JSP_SERVLETS/internal.jsp 131
The IGNOU Report, sub source PFC

Electricity 137
are involved in this. The following can be considered as practices of theft that directly affect the power distribution
o Theft (by SEBs) where meters are installed unofficially, off the records132. o Theft (by the consumer):
Direct hooks on HT/LT lines: This practice of direct tapping by non-customers is followed mainly in domestic and agricultural categories.
Tampering the meter, using devices to reverse the meter reading and damaging the instrument to prevent correct reading133. This results in slowing down of the meter and losses to the utility. There are various ways of tampering with the meters and slowing them down.
Unmetered connections: The agricultural consumers are not metered and charged on a flat rate basis. This arises in arriving at incorrect estimates in consumption in this category resulting in losses. Excessive use of electricity through unmetered connections goes unchecked and there is a potential to steal large amounts of electricity.
Industrial or commercial units consume power on using residential or agricultural power connections. This type of theft does not get reflected as losses in the books of records.
o Another aspect of theft by consumers is non-payment of bills for the electricity consumed. Though this is not accounted for in the distribution losses, it results in financial losses for the distribution utilities.
Apart from T&D losses which occur due to technical or commercial reasons, there are losses which occur due to the gap between the billing and the collection. In the year 2007-08, 46,260.05 million units (MUs) power was generated at a cost of Rs. 9,417 crore and 79,871MUs were purchased at a cost of Rs. 18,515 crore. Thus 126,131.05 MUs were available in the state, however only 104,430.95 MUs were billed. Thus 21700.1 MUs of power was lost either due to technical and commercial reasons. Even out of the total amount billed Rs. 23,483 crore only Rs. 22,687 crore was collected creating a deficit of Rs. 796.08 crore. Thus 17.20% of the units are lost and 3.4% of the billed amount is not collected134. The MSEDCL have quoted their circle wise average distribution losses as 17.75%.
The aggregate of T&D loss and loss due to non-realization of billed demand is termed as Aggregate Technical and Commercial loss (AT&C loss). The T&D losses have always been computed taking into account electricity bills issued to consumers as accrued income and not on actual collection. Therefore, T&D loss figures do not capture the major gap between the billing and the collection, apart from the large amount of theft not captured in billing. AT&C
132
Economic and Political Weekly, V Ranganathan: “Determining T&D losses in India-Their Impact on Distribution Privatization & Regulation”, pp. 658, February 12, 2005 133
http://www.cag.gov.in/html/cag_reports/maharashtra/rep_2006/com_chap_2.pdf 134
Government of Maharashtra, Department of Finance, Medium Term Fiscal Policy –Fiscal Policy Strategy Statement and Disclosures for Maharashtra, 2010-11, pp. 20

Electricity 138
loss to the utility is the sum total of technical losses, commercial losses and loss due to non-realization of total billed units. AT&C loss for a year is also expressed as percentage of Energy Input. It is the difference between units injected into the system and the units for which the payment is collected. The AT&C losses take this gap into account.
Losses due to Unmetered (Agriculture) Consumption
In the year 2010-11, the agricultural sector (LT) consumed 15,813 MUs of electricity which was a staggering 40% of LT sales (22% of the total sales). Of the total units consumed by agricultural LT consumers, 8476 MUs were unmetered. This unmetered electricity is either consumed through pumps or other agricultural equipment.
Table 46 - Percentage Consumption and Revenue from LT Agriculture (metered & unmetered)
Total revenue generated by sale of electricity by MSEDCL in the FY 2010-11 was Rs. 33238 crore. The contribution of agricultural consumers to the total revenue was a meager Rs.3131 crore (9.4% of the total revenue).
Government of Maharashtra announced free power to farmers in the state in 2004. After incurring huge losses, the free power scheme was converted to a scheme with concessional rates in 2005. Electricity connections available for farmers are bifurcated in two types - metered and unmetered. Tariff for unmetered agriculture connections is based on ‘HP’ rating of the pump set used to draw water. This is a part of an indirect subsidy to farmers where a monthly charge based on the power rating is levied upon the farmer. MERC has directed MSEDCL to install meters for all unmetered agricultural connections. However the MSEDCL officials are facing stiff opposition from the beneficiaries (well-off farmers who actually corner the subsidies).
Table 47- Unmetered Agriculture connections (2008 to 2011)
Category Particular FY 2007-08 FY 2008-09 FY 2009-10 FY 2010-11
Ag. Unmetered consumers
No. of consumers 1,491,514 1,441,319 1,407,668 1,535,159 Load in HP 6,286,356 6,086,496 5,940,885 7,252,058
Ag Metered consumers
No. of consumers 1,091,519 1,227,228 1,393,567 1,621,818 Load in HP 4,607,505 5,200,299 5,885,311 7,650,990
Unmetered connections have increased in 2010-11 from the previous years (table 6 above). He reason for the tremendous Over 1 lakh new unmetered agricultural connections were released in the year 2010-11 due to shortage of meters135.
135
Government of Maharashtra, Maharashtra Electricity Regulatory Commission, Order for Truing Up of FY 2009-10 and APR of FY 2010-11, December 30, 2011, Case no. 100 of 2011
Year Consumption Revenue
2010-11 22% 9.4%

Electricity 139
Initiatives taken by the Government to reduce T&D losses
The government has initiated two key programs to modernize distribution systems and increase supply networks - the Accelerated Power Development & Reform Program (APDRP) for urban areas and towns, and Rajiv Gandhi Gram Vidyutikaran Yojana (RGGVY) for rural areas and villages.
The government launched Accelerated Power Development and Reform Program (APDRP) in 2000-01 to bring about commercial viability in the distribution sector. Subsequently, the APDP was revamped to APDRP during 2002. The program had objectives such reducing AT&C losses to 15% in five years, decreasing power outages and interruption in supply, increasing the reliability and supply of power, adopting a systematic approach with management information systems, and improving consumer satisfaction through greater transparency136.
The program, along with other initiatives of the Government of India and of the States, has led to reduction in the overall AT&C loss from 38.86% in 2001-02 to 34.54% in 2005-06, and further reduction to 28.56% in 2009-10137. The commercial loss of the State Power Utilities reduced significantly during this period from Rs. 29,331 crore to Rs. 19,546 crore. The loss as percentage of turnover was reduced from 33% in 2000-01 to 16.60% in 2005-06138.
The Centre provided financial assistance to states for strengthening and upgrading sub-transmission and distribution networks. Till 2005-06, the government funded 50% of the project cost, half of which was in the form of grant and the rest in the form of loan. The loan component was discontinued in 2005-06. The rest of the funding comes from either the utilities’ own resource generation or as counterpart funding from Rural Electrification Corporation (REC) and Power Finance Corporation (PFC). As on March 2008, in Maharashtra the APDRP project cost was Rs. 1643 crore out of which of Rs. 480 crore was under central assistance. The total amount utilized was Rs. 1148 crore which was 70% of the project cost. For FY 2010-11, although the sanction target was Rs. 9000 crore, Power Finance Corporation, the nodal agency for APDRP (now Restructured – APDRP) was able to sanction schemes of Rs. 13665 crore. Also, the entire amount of Rs. 2256.79 crore as released by Government of India (Central assistance) for disbursement under the Programme was disbursed by PFC to various state utilities.
The list of works undertaken by MSEDCL under APDRP I and II is provided in Annexure VI139. Phase I was undertaken in Pune city, Aurangabad, Jalgaon, Pimpri city, Nasik, Solapur, Sangli city, Ahmednagar, Osmanabad, Malegaon City, Amravati city, Latur, Ratnagiri, Kolhapur city, Nagpur, Sindhudurg, Nanded city, Amravati, Nagpur city and Nasik city at an estimated cost of Rs. 1136 crore. Phase II was undertaken in Akola, Buldhana, Khamgaon, Malkapur,
136
Power in India, Power distribution, pp. 228-229 137
Government of India, Power Finance Corporation, Performance of State Power Utilities 2007-08 to 2009-10 138
http://www.powermin.nic.in/distribution/distribution_overview.htm 139
http://www.mahadiscom.in/Apdrp_Project-02.shtm

Electricity 140
Shegaon, Yavatmal, Bhandara, Dombivali, Ulhasnagar, Mulund-Bhandup and Thane districts. The estimated cost of the works undertaken was Rs. 237 crore.
MSEDCL has also undertaken ‘Gaothan feeder separation scheme’ in two phases in order to provide un-interrupted power supply to rural consumers as well as reduce T&D losses. The data on types of works undertaken under the Gaothan feeder separation scheme is tabulated in tables 10 & 11 in Annexure VI140. Works in phase I were undertaken in Nanded, Beed, Osmanabad, Latur, Nasik, Dhule, Jalgaon, Ahmednagar, Solapur, Kolhapur, Satara, Sangli, Pune, Aurangabad, Jalna, Parbhani, Amravati, Akola, Yavatmal and Buldhana districts. The cost was Rs. 943 crore. Rural Electrification Corporation (REC) had sanctioned a loan of Rs. 714 crore. Phase II works were implemented in Nasik, Dhule, Jalgaon, Ahmednagar, Wardha, Bhandara, Chandrapur, Gadchiroli, Gondia, Nagpur, Solapur, Kolhapur, Satara, Sangli, Pune Rural, Aurangabad, Jalna & Parbhani, Amravati, Akola, Buldhana and Yavatmal districts. The estimated cost of the project was Rs. 1446 crore and loan sanctioned from REC was Rs. 1301 crore.
Measures taken by MSETCL and MSEDCL to reduce losses
MSETCL has initiated various measures to reduce the transmission losses by modernization of Extra High Voltage (EHV) sub-stations. During 11th Five Year Plan, an addition of 134 EHV sub-stations of 39,575 MVA transformation capacity and EHV line length of 20,142 circuit km is expected.
In 2010-11, the work of 16EHV sub-stations of 8,827 MVA transformation capacity and EHV line length of 935.27 circuit km has been completed. As on 31st March, 2012, the Company had 559 sub-stations having transformation capacity of 89,178 MVA and EHV line length of 39,871 ckt. km141.
The Transmission System Availability of MSETCL for HVAC System was 99.72% while that for HVDC System was 96.55% in 2011-12. Maharashtra Electricity Regulatory Commission (MERC) benchmark for HVAC system is 98% while that for HVDC system is 95%.
MSEDCL has undertaken measures like replacement of faulty meters, load reduction on overloaded HT & LT circuits by providing additional transformers, erection and commissioning of new sub-stations and lines under various schemes142. A massive drive has also been
140
http://www.mahadiscom.in/Gaothan_Feeder_Separation_Scheme_Project-01.shtm 141
http://www.mahatransco.in/wps/wcm/connect/msetcl/menu/transmission+network/network+at+glance/current+infrastructure 142
Government of Maharashtra, Department of Planning, Directorate of Economics and Statistics: Economic Survey of Maharashtra 2009-10, Ch.9 Infrastructure

Electricity 141
undertaken against unauthorized use of electricity. MSEDCL has also completed metering of all feeders. The initiatives taken by MSEDCL to reduce distribution losses are enlisted below143:
Monthly Energy Accounting at Division level / Feeder level / DTC level;
Giving target for each Division / Subdivision for LT loss reduction;
Photo Meter Reading as well as DTC & feeder meters reading through digital camera;
Collection for feeder wise energy audit;
Massive theft control drive o In order to detect and curb the unauthorized utilization of electricity, there were 40
flying squads and 120 special squads (division level) operating during 2008-09 at different places in the State. During 2008-09, these squads detected 57,065 theft cases. MSEDCL has recovered Rs. 44.48 crore from these unauthorized consumers. During 2009-10 up to the end of October, 32,887 theft cases were detected and an amount of Rs. 36.02 crore was realized144.
o In the Pune division there are 15 squads to detect power theft of large quantum. The squad detected power thefts to the tune of Rs. 24 crores but recovered only Rs. 16 crore. In Mumbai division out of Rs. 30crores of thefts detected Rs. 17crore have been recovered; whereas out of Rs. 39.436 crore thefts detected from the Nagpur division only Rs. 13.46 crore have been recovered145.
MSEDCL police stations for efficient handling of theft of energy/other cases;
Checking of doubtful energy intensive consumers;
Capital investment plans;
Accelerated Power Development Reforms Program (APDRP) schemes;
Registrar General, Bombay High Court has designated all courts of additional districts & Session Judge at district headquarters for trial of Cases under EA 2003;
Strict disciplinary action against delinquent employees;
Speedy disposal of vigilance cases and strict action against defaulters; and
Creation of more number of distribution franchisees in MSEDCL areas for improvement in metering, billing and revenue collection. E.g. Franchisee appointed in Bhiwandi circle (Details of Bhiwandi franchisee model is provided in Annexure VI)
Maharashtra has 35 districts and 44 distribution circles. The distribution losses are calculated circle-wise on a six monthly sliding average percentage.
143
Government of Maharashtra, Maharashtra Electricity Regulatory Commission, Order on APR of MSEDCL for FY 2008-09 & tariff determination for FY 2009-10, Case No. 116 of 2008 144
Government of Maharashtra, Department of Planning, Directorate of Economics and Statistics: Economic Survey of Maharashtra 2009-10, Ch.9 Infrastructure pp. 133-134 145
Sakal, August 18,2010

Electricity 142
Solutions for improving efficiency of the grid
In the T&D sector, energy losses are essentially through transformers and cables. According to a study carried out by EPRI, USA, the overall losses between power plant and consumers could be between 8 and 15%, which indicates that efficiency of transmission and distribution system could be improved, thereby reducing CO2 emissions146. Losses in various elements of the T&D system usually are of the order as indicated below.
Table 48: Losses in different elements of transmission and distribution
System element Power losses (%)
Minimum Maximum
Step up transformers & EHV transmission system 0.5 1.0
Transformation to intermediate voltage level, transmission system & step down to sub transmission voltage level
1.5 3.0
Sub transmission system & step down to distribution voltage level 2.0 4.5
Distribution lines & service connections 3.0 7.0
Total losses 7.0 15.5
The losses in any system would, however, depend on the pattern of energy use, intensity of load demand, load density, and capability and configuration of the transmission and distribution system that vary for various system elements.
Though energy efficiency is more focused on end users however there are several prospects in the T&D sector for efficiency improvement. Improving efficiency does not merely focusing on reducing losses but the primary focus is on reliability. A reliable network is crucial for economic development. There are several indices used to measure power quality and reliability. These indices are based on sustained outages i.e. interruptions that last for more than five minutes.
SAIDI (System average interruption duration index) represents the sum of customer-sustained outage minutes per year divided by the total customers served.
SAIFI (System average interruption frequency index) represents the number of customer.
CAIDI (Customer average interruption duration index) for group of customers that actually had one or more interruptions and how long (on average) the interruptions lasted. The figure represents the total number of customer interruption durations divided by the total number of customers interrupted.
Table 49-Performance indices (2009-10)
Distribution Co. SAIFI (No.) SAIDI (Minutes) CAIDI (Minutes)
TPC-D 1.77 44.33 25.18
MSEDCL 12.28 307.19 25.01
146 International Electro-technical Commission (IEC) - Efficient electrical energy transmission and distribution - http://www.iec.ch/about/brochures/pdf/technology/transmission.pdf

Electricity 143
Table 50-Quality of Supply (2010-11)147
Total No. of Incidences/ Events.
Voltage variation outside the specified range 18362
Harmonics beyond control level, at the point of supply 250
Following steps would help curb T&D losses
Energy audit should be conducted at all levels of feeders and transformers.
Due to growing urbanization, the distribution lines in urban areas carry excess load, leading to power losses and breakdowns. On the other hand the rural lines are overextended. The losses can be reduced by realigning the lines to reduce line mileage and by using small distribution transformers to reduce the length of low tension lines.
Installation of tamper proof meter boxes and tamper proof numbered seals.
Statistical analysis of electricity meter readings must be done so that the sample data from electricity meters can be analyzed statistically over time to estimate significant deviation from usual meter reading. This will help keep track the energy usage of consumers and a benchmark will be available, in case of significant meter reading deviation.
Installation of online prepaid meter: This is a device which can be interfaced with a static electronic meter. It is a micro controller based application. This device will accept the number of units recharged by the concerned department person, count the number of units consumed by the customer. As soon as the customer exceeds the recharged amount, the power supply will be disconnected until the next recharge. When the number of units consumed matches with the number of units the consumer has paid for, the microcontroller sends a signal to the contact maker/breaker circuit and the power supply to the consumer is cut off until the next recharge. The figure below represents a block diagram of an online prepaid energy meter. This system can be used effectively for preventing power theft, non-payment of electricity bills, can reduce the cost of manpower and the entire billing process can be centralized.
Energy audit of energy received and energy sold in each area, which should be the responsibility of the Executive Engineer. These audits should be held on a biannually.
Existing distribution network can be converted to a high voltage distribution system (HVDS) which covers reduction of LT lines, taking high voltage line up to the load centre and supplying power through smaller capacity energy efficient distribution transformation, re-conductoring of over loaded lines, power factor correction, Geographic Information System (GIS) mapping, pole wise consumer information, etc. This would require energy audit and accounting studies, analysis of the data using software for developing component aided network model148.
147 http://www.mercindia.org.in/pdf/Order%2058%2042/SoP%20of%20MSEDCL%20FY2010-11.pdf 148
http://www.cea.nic.in/god/special_reports/Guidelines

Electricity 144
Figure 50-Block diagram of an online prepaid energy meter
Smart grid is one of the solutions to the critical and persistent problems facing the T&D sector. These grids contain sensors and load control switches that can monitor, preemptively detect and repair defects in the T&D network. Such technologies can be used to reduce interruptions and outages while minimizing maintenance expenditure. The losses can be considerably reduced with the introduction of smart energy meters- high-accuracy electronic meters with tamper detection, remote billing, disconnection and reconnection features. This can be done in a phased manner starting with industrial and high end commercial users149 (malls and multiplexes) followed by residential complexes.
Commercial action includes tamper proof metering at all level of transformation and for all the consumers; operationalizing energy accounting up to feeder level; de-centralized computerized billing & collection; development of MIS and proper duties & responsibilities up to the line man. Commercial activities target reduction of commercial losses and improvement of revenue150.
High voltage distribution system (HVDS)
Reduction of LT lines reduces line losses considerably and also reduces probability of power theft by hooking. HVDS suggests an increase in installation of small capacity single-phase transformers in the network which again save considerable energy. The existing distribution network can be converted to a high voltage distribution system (HVDS) which covers reduction
149
LiveMint, “Being smart about electricity”, Gulzar Natarajan, April 6, 2010 150
http://www.cea.nic.in/god/special_reports/Guidelines%20for%20Formulation%20of%20Report%20on%20Strengthening%20and%20Improvement%20of%20Sub-transmission%20and%20Distribution%20Network%20under%20 Accelerated%20Power%20Development%20&%20Reform%20Programme/status_of_distribution_sector_in.htm

Electricity 145
of LT lines, taking high voltage line up to the load centre and supplying power through smaller capacity energy efficient distribution transformation, re-conductoring of over loaded lines, power factor correction, Geographic Information System (GIS) mapping, pole wise consumer information, etc. This would require energy audit and accounting studies, analysis of the data using software for developing component aided network model151. HVDS helps to reduce the length of LT lines and makes power available at site close to the users. It also reduces the probability of power theft by hooking and can be an ideal step to reduce line losses.
Smart Grid
Smart grid technologies could contribute to greenhouse gas emission reductions by increasing efficiency & conservation, facilitating renewable energy integration, and enabling plug-in hybrid electric vehicles.
The traditional grid is a network of transmission lines, sub stations, transformers and more that deliver electricity to the consumers. Smart grid is an intelligent network that uses two-way flow of electricity and information to create an automated and distributed advanced energy delivery network152. It is a concept referring to the application of digital technology to the electric power sector to improve reliability, reduce cost, increase efficiency, and enable new components and applications. A smart grid thus extends from the generation, through the transmission and distribution systems, to the consumer. It incorporates the entire value chain. The benefits associated with smart grids are as follows:
Increased integration of large scale renewable energy systems- Compared to the existing grid, the smart grid promises improvements in reliability, power quality, efficiency, information flow, and improved support for renewable and other technologies.
More efficient transmission of electricity and improved security - Smart grid technologies, including communication networks, advanced sensors, and monitoring devices, form the foundation of new ways for utilities to generate and deliver power and for consumers to understand and control their electricity consumption. This also helps in quicker restoration of electricity after power disturbances
Reduced peak demand – In home energy management systems and intelligent controls in appliances, giving consumers more choice and control over how and when electricity is used, which can save money and help the grid operate its electricity network more efficiently and reliably benefitting all consumers.
Reduce T&D losses - Smart grid will reduce losses occurring in transmission and distribution systems to a large extent as the grid will be interactive and easily ‘readable’ at any point of time from many operating servers.
151
http://www.cea.nic.in/god/special_reports/Guidelines 152
IEEE, “Smart Grid – The New and Improved Power Grid: A Survey”, Xi Fang, Satyajayant Misra, Guoliang Xue, Dejun Yang http://optimization.asu.edu/~xue/papers/SmartGridSurvey.pdf

Electricity 146
Minimize thefts to a great extent - Consumers having illegal connections, drawing excess electricity, and tampering with the meter would be traced easily. Also, the consumers who default in payment can be easily traced. The whole spectrum of T&D losses consists of theft, illegal and tampered meters, and inefficient collection. Smart grid will curb all these when all the essential installation components of the Smart Grid are in place.
Total Inter-regional transmission capacity by the end of 10th Plan was 14,050 MW which is expected to grow to about 25,650 MW by 11th Plan end. An inter-regional transmission capacity of 37,800 MW has been planned for the 12th Plan. Transmission line capacity addition of about 100000 ckt. km. (circuit kilo metre), HVDC terminal capacity of 13,000 MW and AC transformation capacity of 270000 MVA has been planned for the 12th Plan. The country has initiated steps to evolve smart grid with a view to improve the reliability & efficiency of the power sector as a whole.
Figure 51 - Pictorial representation of Smart Grid Technology153
An inter-ministerial group on smart grid, the India Smart Grid Task Force (ISGTF) has already been set up. It will serve as government focal point for activities related to smart grid. The main functions of ISGTF pertaining to smart grid are154:
153
www.energyinformative.org 154
Government of India, Ministry of Power, India Smart Grid Task Force http://www.isgtf.in/Forms/About_ISGTF.aspx

Electricity 147
To ensure awareness coordination and integration of diverse activities related to smart grid technologies.
Practices & services for research & development of smart grid.
Coordination and integrate other relevant inter-governmental activities.
Collaborate on interoperability framework.
Review & validate recommendations from India Smart Grid Forum, etc.
Policy framework to promote use of smart grids in India would be developed after pilot implementation. An outlay of Rs.500 crore has been estimated for various pilot projects to be executed during the plan. The total outlay of Rs 9,500 crore has been estimated, which includes pilot projects and scaling up of pilots, phased installation of smart meters, extending mechatronics (Supervisory Control and Data Acquisition - SCADA technology) system to 100 more towns and integration of renewable energy power into the grid155.
The fundamental difference between traditional grid and smart grid that will radically change the transmission and distribution of electricity is the ‘interactive’ nature of smart grid. Consumers will be able to interact with the electricity distributor about the quality of electricity they receive; they will be able to lodge complaints through the network and advanced security mechanisms would be put in place. Sensors would be present (PMU – Phasor Measurement Units) at regular intervals along the grid which will give feedback to the load despatch centre about over loading, under loading, attempt of theft, etc. Consumers will also be able to add electricity to the grid.
Smart Transmission and Distribution
New technologies viz. new materials, electronics, sensing, communication, computing, and signal processing are incorporated in transmission network. Real-time monitoring of transmission lines can transform the entire monitoring process of transmission and distribution. Introduction of DC (direct current) power dispatch system using high frequency switching techniques can make power distribution systems more efficient (loss minimization) and easier to control energy flow.
Intelligent meters and field devices (devices other than meters which are a part of distribution system) will replace current devices. These will offer failure protection to the consumers which are the other end of the distribution system. Moreover, they will be equipped with protection from tweaking, by using handling protection and monitoring based on high speed communication mechanism. It would not be easy to manipulate energy meter.
155
Government of India, Planning Commission, Report of the Working Group on Power for Twelfth Plan (2012-2017)

Electricity 148
Micro-grid and Macro-grid
Micro-grid will essentially be a part of Macro-grid, unless otherwise specifically put into application. The users in a Micro-grid can generate low voltage electricity using distributed generation, such as solar panels, wind turbines, and fuel cells. The single point of common coupling with the Macro-grid can be disconnected, with the Micro-grid functioning autonomously156. The multiple distributed generators and the ability to isolate the Micro-grid from a larger network in disturbance will provide highly reliable electricity supply (islanding).
Renewable Energy
Renewable energy generation and distribution will become increasingly simple in the Smart Grid. Renewables like solar energy and wind energy are dependent on intensity and duration of solar radiation and wind respectively. Being entirely dependent on renewables thus may not yield uninterrupted power and the outcome of using renewables may defy the whole purpose of using them. Smart Grid can have provisions that will enable electricity distributors to switch from one power source to other; while keeping electricity supply to the end user uninterrupted. Incorporation of green energy thus becomes easier which will ultimately contribute to environmentally stable high growth.
Large scale deployment is not at all an easy task. But it can be divided into smaller regional modules where the modules can be designed autonomously.
156
IEEE, “Smart Grid – The New and Improved Power Grid: A Survey”, Xi Fang, Satyajayant Misra, Guoliang Xue, Dejun Yang

Electricity 149
Conclusion
The existing T&D system is a centralized grid system. However in future we need to change this grid network so that it does not solely rely on large conventional plants but also on clean energy generators distributed throughout the grid.
The new grid will bring down losses to a large extent. Current T&D losses are 25% and after the realization of the presented solutions, T&D losses will come down to 10%, which the transmission and distribution utilities should strive to achieve. Developed countries have T&D losses in the range of 6-11%157.
Improvement in transmission and distribution network by using advanced robust technologies, 100% metering and computerization of the power grid can save installation of 10000 MW of coal based power in 2025. In 2025, 34000 MW of coal based capacity needs to be added if the power sector maintains its performance as it is right now. Improvement in transmission and distribution and reducing T&D losses to 10% will reduce the addition of coal power to 24000 MW.
Capital expenditure of Rs. 50000 crore158 will be saved till 2025.
157
http://www.ignou.ac.in/schools/soet/acpdm/BLOCK%204%20BEE-001/Part%203.pdf 158
5 crore per MW of coal based power

Electricity 150
Case studies on smart grid technology
Japan
Japan had not seen much value in smart grid technology in the past, but that changed in March 2011 due to the disaster at the Fukushima Daiichi nuclear power station. Along with bolstering its own power infrastructure, Japan is looking to create business opportunities by tapping its technology leadership with the so-called “smart community” concept, which embraces renewable energy sources and central energy management systems for monitoring and controlling power flows. Along with smart homes and EVs, smart communities apply IT and sensor networks to create intelligent transportation systems. Social healthcare systems are also part of this effort to make cities smart. Interestingly enough, Japan will deploy this new “smart city” concept in the Tohoku region, which was affected by the tsunami disaster in 2011. Constructing a more energy- efficient power infrastructure also less vulnerable to natural disaster is a crucial goal for Japan, and smart meter deployments have increased accordingly.
China
China made major strides in installing high-voltage transmission lines, and within the next few years it will continue to develop its grid. State Grid has announced an investment plan for 2009–2020 with provisions for 384.1 billion Yuan (US$58.5 billion) worth of investment in smart grid technology (split between 30.8% for smart use, 23.2% for smart distribution, and 19.5% for substations)159.
University of California, San Diego (UCSD)160
The University of California, San Diego’s 1,200-acre, 450-building campus, with a daily population of 45,000, runs two 13.5 MW gas turbines, one 3 MW steam turbine and a 1.2 MW solar-cell installation that together supply nearly 80% of the campus’ annual power, said a paper released last year by three computer science professors. The turbines produce 75% fewer emissions than conventional gas power plants, the university said on its website. For HVAC, it uses a 40,000 ton/hour, 3.8 million-gallon capacity thermal energy storage tank, plus three chillers driven by steam turbines and five driven by power. The balance of campus power - up to 10 MW - is bought on the open market under California’s deregulated market and served by SDG&E (San Diego Gas & Electric)161.
The University of California at San Diego can’t claim to be a smart grid but it most definitely is a micro-grid, with its own power generation, monitoring and security. UCSD has only one
159
Nuclear Sneak Attack, pp. 11; Power – Vol. 5, No. 5, May 2011 160
Smart Power Generation at UCSD 161
Smart Grid Today: UC San Diego gears up for smart micro-grid - http://www.poweranalytics.com/pa_articles/pdf/ucsd_smart_grid.pdf

Electricity 151
connection to the SDG&E grid at the transmission level, and it owns the high-voltage substation, which gives the campus greater reliability. The campus also owns and maintains all of its distribution wires and meters.
Figure 52- UCSD micro-grid162
At UCSD, the micro-grid provides the ability to manage 42 megawatts of generating capacity, including a central cogeneration plant, an array of solar photovoltaic installations and a fuel cell that operates on natural gas reclaimed from a landfill site. The central micro-grid control allows operators to manage the diverse portfolio of energy generation and storage resources on the campus to minimize costs. The micro-grid is connected to the utility grid but can disconnect and operate in islanded mode if conditions (such as a cascading blackout) warrant, as in the case of the power blackout that struck parts of Southern California, Arizona and Mexico in September 2011163.
The UCSD micro-grid case study demonstrates the success of the integration and management of local resources in conjunction with the ability to be parallel with the grid, independent from the grid, the ability to go back and forth based on data driven decisions as well and responding to grid stability issues. This action with the grid can be viewed as a throttle instead of a switch, giving the ability to continuously process make/buy decisions for energy.
162
http://www.energy.ca.gov/research/notices/2011-12-16_workshop/presentations/06_UCSD_AM-Kleissl.pdf 163
http://www.glennmosier.com/2012/01/video-the-uc-san-diego-microgrid-a-living-laboratory/

Electricity 152
US Department of Agriculture (USDA)164
The U.S. Department of Agriculture (USDA) has reached its $250 million goal to finance smart grid technologies. Agriculture Secretary Tom Vilsack announced nine rural electric cooperatives and utilities in 10 states would receive loan guarantees to make improvements to generation and transmission facilities and implement smart grid technologies.
The funding is based on the Obama Administration's Blueprint for a Secure Energy Future, a framework for a modernized electric system that specifies a number of public and private initiatives. It includes a goal of $250 million in loans for smart grid technology deployment as part of the USDA's Rural Utility Service, which is focused on upgrading the electric grid in rural America. $250 million investment in loan funds for smart grid technologies means "infrastructure investment at virtually no cost to the taxpayer." Following is a list of rural utilities that will receive USDA funding, which is contingent upon the recipient meeting the terms of the loan agreement.
Colorado/ Nebraska/ New Mexico/ Wyoming: Tri-State Generation and Transmission Association, Inc. – $140,483,000 loan. Funds will be used to build 50 miles of transmission line and make upgrades to existing generation and transmission facilities. The loan amount includes $21,756,000 in smart grid projects and $808,780 in environmental improvements.
Kansas: The Ark Valley Electric Cooperative Association, Inc. – $6,130,000 loan. Funds will be used to build and improve 355 miles of distribution line and make other system improvements. The loan amount includes $2,014,500 in smart grid projects.
Minnesota: Stearns Cooperative Electric Association – $23,654,000 loan. The cooperative will improve 147 miles of distribution line and make other system improvements. The loan amount includes $974,085 in smart grid projects.
Agralite Electric Cooperative – $5,159,000 loan. Funds will be used to build and improve 61 miles of distribution line and make other system improvements. The loan amount includes $180,968 in smart grid projects.
Missouri/Iowa: Northeast Missouri Electric Power Cooperative – $30,093,000 loan. Funds will be used to build and improve 24 miles of transmission line, build three new substations, and make other improvements. The loan amount includes $500,000 in smart grid projects.
North Carolina: Edgecombe-Martin County Electric Membership Corporation – $6,410,000 loan. The cooperative will build and improve 310 miles of distribution line and 2 miles of transmission line and make other system improvements. The loan amount includes $1,084,728 in smart grid projects.
164
Power Magazine, Sonal Patel: “USDA Reaches $250M Goal for Smart Grid Technologies”, September 11, 2012 http://www.powermag.com/smart_grid/USDA-Reaches-$250M-Goal-for-Smart-Grid-Technologies_4956.html

Electricity 153
Piedmont Electric Membership Corporation – $30,000,000 loan. Funds will be used to build and improve 108 miles of distribution line and 5 miles of transmission line and make other system improvements.
Brunswick Electric Membership Corporation – $21,500,000 loan. Funds will be used to build and improve 220 miles of distribution line and make other system improvements. Wisconsin: Chippewa Valley Electric Cooperative – $6,000,000 loan. Funds will be used to build and improve 88 miles of distribution line and make other system improvements. The loan amount includes $255,833 in smart grid projects.
Also some of the largest utilities in the US including Florida Power and Light, Xcel Energy, Pacific Gas and Electric, and American Electric Power, have undertaken initiatives to deploy smart grid technologies.

Electricity 154
Solution 3
Increase green energy sources
Goal: To explore all sources of green energy in the state and increase their share in the electricity market by providing power efficiently, cost effectively and on a large scale.

Electricity 155
Introduction
Efficient and reliable supply of energy is critical for economic growth. The increasing demand for electricity is not being met and shortfall remains. The availability of conventional energy sources is limited and may not be sufficient in the long run to sustain the process of economic development165. Renewable energy sources are currently insufficiently exploited though the potential exists.
Before India’s independence, electricity was decentralized. It was generated and supplied locally by private entrepreneurs, enterprising municipalities and provincial governments. Most of the installed capacity was located in West Bengal and Bombay states which were under strong British influence and contained major urban and industrial areas. The emphasis was on supply to large urban concentrations, and there was little coordination or cooperation between the different suppliers. Various legislations were formed in the pre as well as post-independence era. In the post-independence period, private companies providing electricity was considered unacceptable, as they would focus on areas with greatest demand – cities and urban areas – and neglect rural areas due to meager return on their investments. Eventually state electricity boards (SEBs) were established, which led to the gradual domination of the electricity sector by government enterprises. To promote regional coordination and operation of power supply, Regional Electricity Boards were also formed. Central sector in due course established several centrally owned public sector corporations to supplement generation activities of the SEBs. In the financial crisis of 1991, the sector was opened for private investment. Regional Load Dispatch Centers were also established at the same time to operate the power system in a region, ensure regional grid security and to integrate with power systems of other regions and areas. Amendments in 1998 opened transmission to private investment, subject to the approval of Central Transmission Utility (CTU)166.
Thus electricity in the pre-independence era was decentralized and privatized, and was available to those who could afford it. After independence this attitude changed as electricity was viewed as a crucial instrument for social development and a rigid control by the government was considered essential. However, later the electricity sector was opened for private investments. However, private companies generate power and sell the power to SEBs through power purchase agreements or trade it at the electricity market. Even with the various reforms and experiments with the electricity sector, electricity is still unavailable to most of the rural areas. Industries and commercial establishments in rural as well as urban areas have to rely on power back up systems in hours of load shedding. This scenario prevails in the state of Maharashtra as well.
There are 41,095 inhabited villages in Maharashtra. 36 villages still remain un-electrified in Maharashtra as on July 31st 2012. Barring these which are termed as unfeasible and
165
http://planningcommission.nic.in/reports/genrep/intengpol.pdf 166
Economic and Political Weekly: S L Rao: The Political Economy of Power; Vol. - XXXVII No. 33, August 17, 2002

Electricity 156
inaccessible by Rural Electrification Corporation (REC), 100% villages in the state have been electrified167. The 36 remaining villages are set to be electrified using non-conventional energy through MEDA, as per CEA report on village electrification. (36,010 are electrified as per the criteria laid down in the Rural Electrification Policy of 2004. 86.5%168 of the villages are electrified169).
Figure 53-Status of Rural Electrification in India
170
Even if it is seen that 100% of villages in the state are electrified, it is not so. The Ministry of Power has two terms to indicate the electrification of a village viz. UEV – Un-electrified village and PEV – Partially Electrified Village. 36 villages are UEV that means most of the villages have been electrified, completely or partially. The number of partially electrified villages is large171.
Those who have access to electricity suffer from shortages and poor quality of supply. Unscheduled outages, load shedding, fluctuating voltage and erratic frequency are common. Consumers and the economy bear a large burden of this poor quality supply. Motors are overdesigned and consume more electricity; voltage stabilizers are needed for more expensive equipment; diesel generators provide backup power to industrial and commercial consumers; and inverters have become a household phenomenon. Equipment gets damaged; motors and
167
http://www.recindia.nic.in/download/Maharashtra.pdf 168
Government of Maharashtra, Department of Planning, Directorate of Economics and Statistics: Economic Survey of Maharashtra 2009-10, Ch.9 Infrastructure, pp. 240, 169
Government of Maharashtra, Department of Planning, Directorate of Economics and Statistics: Economic Survey of Maharashtra 2009-10, Ch.9 Infrastructure, pp. 134; Government of India, Ministry of Home Affairs, Census of India 2011 170
Government of India, Ministry of Power, Central Electricity Authority, Village Electrification http://www.cea.nic.in/reports/monthly/dpd_div_rep/village_electrification.pdf 171
Government of India, Ministry of Power, Bharat Nirman http://powermin.gov.in/bharatnirman/pdf/Progress_on_electrification_of_villages_households.pdf

Electricity 157
pumps are often burnt out. In addition to this is the cost of the idle manpower and loss in production when power supply is interrupted172. 44% of rural households depend on kerosene for domestic lighting and another 55% on electricity, while in urban areas dependency is 89% on electricity and 10% on kerosene173.
The expense on back-up power generation apportioned across the total power consumption by a consumer can be viewed as the 'premium' above the grid power cost borne by the consumer for choosing to have backup power. The amount of premium borne depends on several factors174:
Duration of back-up equipment usage – The premium increases with increase in the typical daily outage duration as a larger number and/or a larger capacity of battery storage units have to be used to accommodate the outage.
Load/Power consumption to be supported on back-up equipment – The premium increases with increase in the number and especially the type of appliances that a consumer chooses to run. Higher the load to be supported on back-up, higher is the capacity rating of the Inverter to be used thus resulting in an increased initial investment.
The premium paid by residential consumers varies widely across cities because this premium depends on the duration of usage of back-up power which in turn depends on the severity of the daily outage and the duration of the peak outage season in a given city.
A consumer with a typical monthly consumption level of 400 units with an 800 VA Inverter back-up pays a premium of ~80% above the grid power cost when faced with a severe outage of 6 to 7 hours throughout the year. A similar consumer will pay a premium of ~17% above grid costs when facing a 1 hour daily outage for only 3 months a year and a less frequent lower duration outage for the rest of the year. With the use of an inverter of the above mentioned capacity, the consumer will be able to run only limited appliances in the house. The premium will increase if the consumer chooses to run all appliances; this will however require a shift from inverter to generator set.
Commercial consumers choosing to opt for back-up systems end up paying an even higher amount of premium as compared to residential consumers.
For a commercial establishment with a typical consumption of 1500 units and a diesel generator power back up, faces a premium of ~150% above the grid power cost when faced with a severe outage of 6 to 7 hours throughout the year. A similar establishment will pay a premium of ~11% above grid costs when facing a 1 hour daily outage for only 3 months a year and a less frequent lower duration outage for the rest of the year.
172
http://planningcommission.nic.in/reports/genrep/intengpol.pdf 173
Reality Checks, “Rural Energy Security in India”, Bikramjit Sinha & Indranil Biswas 174
The Real Cost of Power, Wartsila

Electricity 158
Power plants require fuels. India is not well endowed with reserves of oil, uranium and gas. While coal is abundant, it is with low calorie and high ash content, though with low sulphur content and is regionally concentrated175. Moreover in Maharashtra most of the power plants are concentrated in areas where coal reserves are found. This has resulted in the shortage of water for generating power. At Chandrapur Super Thermal Power Station only one unit of 210MW was functional due to water shortage in March 2010176. The installed capacity Chandrapur Super Thermal Power Station is 2340MW. After the monsoon the situation has slightly improved and at present 1840MW of power would soon be generated. Since the coal had also become wet due to rains the units could not be operated due to lack of fuel.
Electricity requirement can be met by alternate fuels which include renewables like bagasse, biomass, wind, solar, etc. Green Energy is any energy system that does not severely impact the health of humans or the environment in the short or long term. It is also defined as any energy source whose by-products can be readily reintegrated back into the environment by the existing biological systems of the Earth. These energy sources have less ecological impact than conventional energy sources.
Green / alternative / renewable energy plays a significant role in the global efforts to combat climate change and develop new energy system. In the light of pressures to reduce carbon emissions, there is a need to increase renewable energy technologies and solutions and thereby promote development of sustainable energy systems. Renewable energy systems contribute to saving the planet by reducing greenhouse gas emissions.
It is not completely necessary for green energy sources to come from places like solar or wind, which are examples of green “power plants.” A green energy source can be a building that is designed in a way that it keeps itself cool in the daytime and heated in the night through its architectural design rather than having air-conditioning or a heating system. The conservation of energy through architectural design becomes, itself, a green energy source. Similarly, many sources of green energy can come directly from the area in which the energy is needed rather than from an outside source. A residence, for example, can be covered with solar panels for the purpose of collecting energy to be used for electricity. When utilized properly, surplus energy is often produced in this manner, which can be sent back through the local power grid and used at other destinations177.
Given the present trends of increasing energy demands, rapid economic growth, availability of fuel supplies, environmental impact particularly climate change, health impact no single resource or technology is the solution. It is necessary to explore and harness all possible sources of green energy and get them into the mainstream supply of power at economical
175
http://planningcommission.nic.in/reports/genrep/intengpol.pdf 176
Maharashtra Times, October 13, 2010 177
http://www.wisegeek.com/what-is-green-energy.htm

Electricity 159
prices. Development of clean, renewable energy sources to replace carbon based fuels is underway on many fronts. The key drivers for renewable energy are as follows:
Demand supply gap, especially as population increases, Large untapped potential, Concern for the environment, Need to strengthen energy security, Pressure on high emission industry sectors from their shareholders, Viable solution for rural electrification.

Electricity 160
Renewable Energy Scenario
Figure 54- Breakup of Renewable Energy Capacity in India178
India
The total installed capacity of renewable energy stood at 13,310 MW. Wind energy had a large share of 10,000MW and the balance was of micro hydro, co-generation, solar and biomass. Thus in the renewable energy sector, wind occupied a dominant position having 69% share in the installed capacity followed by small hydro (16%) and biomass (14%)179. Solar power is still in its nascent stage of development due to high costs, but this sector will receive a boost with the Jawaharlal Nehru National Solar Mission (JNNSM).
The economic crisis that started in United States of America in 2008 and slowly swept the world for a brief period of time induced a slowdown in capacity addition of power renewable sources180. In 2006, the grown of solar energy capacity addition dropped to 31% from 34% the previous year. It did jump to 60% in 2008 but again the solar PV market contracted by 17% in 2009.
Maharashtra
Total installed capacity of renewable energy has increased from 1955 MW in March 2008 to 3630 MW in March 2012. There has been a rise of close to 100% in the renewable energy installed capacity in the state in the past 4 years. It has further increased to 3726 MW in July 2012.
178
Government of India, Ministry of Non Renewable Energy, 2010 179
Tata Power - Policy incentive for Wind and Biomass Power Generation, Dec 17,2009 180
PowerLine Volume 14, April 2010, p.78

Electricity 161
The largest component of renewable generation is the wind power sector having a total installed capacity of 1997MW. Several private players viz. Suzlon Energy Pvt. Ltd., Enercon India Pvt. Ltd., Acorn Properties Pvt. Ltd., Theolia Wind, Shri Ram EPC Pvt. Ltd. and RRB Pvt. Ltd. are developing wind farms across the state currently. As on 31st March 2012, wind power capacity increased to 2733 MW181.
Bagasse cogeneration has shown a significant growth of 14.5% in 2009-10 from the previous year whereas growth registered by wind power is 3.4%. Biomass capacity has registered no growth in 2009-10 from the previous year. Urban waste disposal has become a major problem with no towns and villages ready to spare land for landfills. Urban waste has can be put to use for generating electricity. This will also reduce the amount of waste entering a landfill.
Figure 55-Installed Capacity (Renewable Energy) in Maharashtra
Targets set by Central & State Governments
India is blessed with an abundance of non-depleting and environment friendly renewable energy resources such as solar, wind biomass and hydro power. Recognizing this potential, the Indian government has accorded a high priority to exploring and harnessing the potential. Ministry of New and Renewable Energy (MNRE) was set up with the aim to develop and deploy new and renewable energy for supplementing the energy requirements of the country. In fact India initiated its renewable energy program in 1981 with the establishment of the Commission for Additional Sources of Energy, which was later converted into the Ministry of Non-Conventional Energy Sources (MNES) in 1992 and renamed the Ministry of New and Renewable Energy (MNRE) in 2006.
181
Government of India, Ministry of Non Renewable Energy, 2010

Electricity 162
Ministry of New and Renewable Energy (MNRE) has set aggressive targets with projections touching 25,000 MW by 2012 which would require investment to the tune of $12billion. MNRE has also set up provisions for subsidies of $650 million. By 2012, the government expects renewable energy to contribute 10% of total power generation and have a 4-5% share in the fuel mix182. Globally, renewable energy technologies and industries have been growing at rates ranging between 20-60%183.
The National Action Plan on Climate Change (NAPCC) launched in 2008 envisages renewable energy to constitute around 15% of India’s energy mix by 2020. The Prime Minister had also announced providing subsidies worth a whopping Rs. 82,000 crore to produce 200,000 MW of solar power by 2050184. Following are eight missions under NAPCC.
National Solar Mission
National Mission for Enhanced Energy Efficiency
National Mission on Sustainable Habitat
National Water Mission
National Mission for Sustaining the Himalayan Ecosystem
National Mission for a "Green India"
National Mission for Sustainable Agriculture
National Mission on Strategic Knowledge for Climate Change
The National Solar Mission has been approved as one of the eight missions under the NAPCC. It aims to promote development and use of solar energy for power generation and other uses with the ultimate objective of making solar competitive with fossil-based energy options.
In line with the central government policy, Maharashtra Energy Development Agency (MEDA) was established as a state nodal agency under the umbrella of the MNRE. The main objective is undertaking development of renewable energy and facilitating energy conservation in the Maharashtra. MEDA has envisaged the addition of the following renewable technologies by 2012185.
Table 51- Envisaged addition of renewable energy technologies by MEDA
Renewable based grid connected power 2450MW
Solar water heating systems 4,35,000m2
Solar concentrators for medium temperature applications 15,000m2
Solar cookers 1,10,000
Solar PV systems for homes 65,000
182
India Infrastructure Research – “Power in India Renewable Energy”, 2009, pp. 166-169 183
India Infrastructure Research – “Power in India Renewable Energy”, 2009, pp. 174 184
Power Line, Vol. 14 – “Road to Copenhagen”, Nov 2009, pp. 24 185
http://www.usaid.gov/in/Pdfs/Maha%20_EC_Action_Plan.pdf

Electricity 163
Energy conservation in industrial units (No) 3819 Electricity demand saving in different sectors (Total) 3000MW
For the year 2010-11, wind generation projects by various private developers are being set up in districts Dhule, Nandurbar, Beed, Nasik, Ahmednagar, Aurangabad, Kolhapur, Satara, Sangli and Pune. The total proposed wind generation is 5273MW, but considering a PLF of 25 % of the total capacity to be installed, it turns out to be 1318MW186.
Policy Support and Incentives
There is an urgent need to promote renewable sources of energy for power generation as these are the most environmental friendly sources. The central and state governments have announced a package of fiscal incentives. One of the cornerstones of the government’s policy has been a competitive market based structure for those segments of the power sector that are commercially viable.
The Electricity Act, 2003 enjoins the State Electricity Regulatory Commissions to promote cogeneration and non-conventional energy sources through appropriate measures of grid connectivity, sale of electricity as well as specifying the purchase of electricity. The central and state governments also extend a support through a number of measures like generation based incentive (GBI), prompt clearances, preferential tariffs, open access, etc. incentives are also granted to encourage equipment companies to manufacture renewable energy equipment, or private and government entities to undertake R&D relating to renewable energy187.
Direct Tax Benefits: The income of industrial undertakings or enterprises engaged in infrastructure development including renewable energy based power projects is exempt from direct taxes for a period of ten year. This benefit is under section 80-1A of the Income Tax Act and can be availed for any ten consecutive assessment years out of the first fifteen years of operation.
Accelerated Depreciation Benefit: (Any method of depreciation used for accounts or income tax purposes that allows greater deductions in the earlier years of the life of an asset is Accelerated Depreciation). For projects commissioned before September 30 of a financial year, investors can take advantage of accelerated depreciation of up to 80% of the project cost for income tax calculations subject to a minimum utilization of six months in the year in which the deduction is claimed. For projects commissioned before March 31 of the financial year, the accelerated depreciation can be claimed on 40% of the project cost. For biomass power generation projects, 80% depreciation can be claimed in the first year for the following equipment required for cogeneration systems: back pressure, pass out, controlled extraction, extraction cum condensing turbines for cogeneration
186
Government of India, Ministry of New and Renewable Energy 187
Captive Power in India-2010, Captive Power from Renewable Sources, pp. 120-122

Electricity 164
with pressure boilers; vapor absorption refrigeration systems; organic rankine cycle power systems; and low inlet pressure small steam turbines.
Concessional Loans and Easy Clearances: GoI has incentivized investment in wind power projects by providing soft loans through Indian Renewable Energy Department (IREDA). Industrial clearance is not required for setting up a renewable energy project. For generation projects upto `1billion, no clearance from Central Electricity Authority (CEA) is required.
Clean Development Mechanism (CDM) Benefits: The renewable energy projects set up in the country are allowed to register and reap benefits under the Kyoto Protocol’s CDM. The CDM framework was developed under the United Nations Framework Convention on Climate Change (UNFCC) to help industrialized countries meet a part of their emission reduction requirements through the purchase of emission reduction credits from projects in developing countries.
Renewable Purchase Obligations (RPO): Under the Electricity Act 2003, the National Electricity Policy 2005 and the Tariff Policy 2006, it is obligatory upon SERCs to fix a certain percentage for purchase of power from renewable energy sources in the area of a distribution licensee. In Maharashtra, the RPO is 6%.
Renewable Energy Certificate (REC): REC would help create a national market for renewable energy. Under this mechanism, renewable energy generators will have the option to either sell the renewable energy at preferential tariffs fixed by the concerned SERC or to sell the electricity generation and environmental attributes associated with renewable energy generation separately. The environmental attributes can be exchanged in the form of RECs in case of latter option. Central Electricity Regulatory Commission (CERC) has asked state counterparts to notify REC regulations in order for utilities to meet their renewable purchase obligation (RPO). Those who hold the certificates will be able to sell green energy to states, individuals or other trading entities. MERC has notified the final regulations.
Generation Based Incentive (GBI): This scheme is based at rewarding actual generation rather than mere capacity addition. the incentive provided is `0.50 per unit of electricity fed into the grid, over and above the specified SERC tariff, for a period not less than 4 years and a maximum period of 10 years with a cap of `6.2 million/MW. The total disbursement in a year will not exceed one fourth of the maximum limit of the incentive (`1.55 million/MW) during the first four years. The scheme will be applicable to a maximum capacity limited to 4000MW during the period of the 11th plan.
Customs Duty Concession: A standard customs rate of 5% is charged on imports of key wind energy equipment and components. These include wind operated electricity generators and battery charges up to 30kW, special bearings, gear boxes, yaw components, wind turbine controllers, sensors, brake hydraulics, flexible couplings, brake calipers, blades for rotor, as well as parts and raw materials for the manufacture of blades and rotors.
Excise Duty Exemption: Wind operated electricity generators, components and parts thereof, water pumping mills, wind aero-generators and battery chargers are exempted from excise duty.

Electricity 165
Several financial incentives and grants have been announced under the National Policy on bagasse based cogeneration and biomass generation in the country. The table below summarizes the details regarding capital subsidy and central financial assistance.
Table 52 – Financial incentives and grants for bagasse cogeneration and biomass generation
Projects Special category states (North East, Sikkim, J&K,
Himachal Pradesh & Uttarakhand)
Other states
Biomass Rs. 2.5 million x (‘C’MW)^0.646 Rs. 2 million x (‘C’MW)^0.646
Bagasse cogeneration Rs. 1.8 million x (‘C’MW)^0.646 Rs. 1.5 million x (‘C’MW)^0.646
Bagasse cogeneration projects by cooperative /public/ joint sector
Rs. 4 million/MW for 40 bar & above* Rs. 5 million/MW for 60 bar & above Rs. 6 million/MW for 40 bar & above
Rs. 4 million/MW for 40 bar & above* Rs. 5 million/MW for 60 bar & above Rs. 6 million/MW for 40 bar & above
(maximum support is Rs. 80 million per project)
Biomass power projects using advanced technologies
`12 million x (‘C’ MW)^0.646 `10 million x (‘C’ MW)^0.646
Note: ‘C’ is the variable used for the capacity of the power plant; for new sugar mills which are yet to start production and which are employing the backpressure route/ seasonal/ incidental cogeneration, subsidies will be half of the level mentioned above
**Eligibility: For biomass power-Minimum 62 bar steam pressure, maximum of up to 15% use of fossil fuel of total energy consumption in kCal or as per DPR, whichever is less; For only new boilers and turbines (capacity limited to in accordance the estimated potential in a state). For cogeneration: Minimum 40 bar steam pressure; maximum of upto 15% use fossil fuel of total energy consumption in kCal or as per DPR, whichever is less, during crushing season.
Ministry of New and Renewable Energy (MNRE) mix of fiscal and financial benefits188
2/3rd of the project cost subject to a maximum of `2 crore /100 KW for procurement of modules, structures, power conditioning units, cabling etc. to the implementing agency. The balance cost on land, extension of grid lines, transformers, civil works, foundation and erection and commissioning, etc. is met by the implementing agency.
Up to `1.0 lakh for the preparation of Detailed Project Report (DPR) for grid interactive SPV power projects.
2.5% of its share of project cost, subject to a maximum of `5 lakhs for performance evaluation, monitoring, report writing, etc. to the State Nodal Agency.
Interest subsidy of up to 4% to financial institutions including IREDA, nationalized banks, etc. for captive power projects of maximum capacity 200 KW by industry.
188
Overview of Sustainable Energy Potential of India- http://www.geni.org/globalenergy/research/renewable-energy-potential-of-india/Renewable%20Energy%20Potential%20for%20India.pdf

Electricity 166
Jawaharlal Nehru National Solar Mission189
The Jawaharlal Nehru National Solar Mission (JNNSM) is one of the eight missions under the NAPCC, which has set an ambitious target of achieving 20,000MW in three phases by 2022. The JNSSM’s target is to increase the country’s grid connected solar capacity to 1000MW by 2013 (Phase I), to 4000MW by 2017 (Phase II) and to 20,00MW by 2022 (Phase III). It is further aiming for off-grid solar power of 200MW in Phase I, 1000MW in Phase II and 2000MW in Phase III. 87.8 MW of capacity was installed in the Batch-I of the Phase-I of JNNSM (till June 2012)190.
Table 53-JNNSM targets as set by the Ministry of New and Renewable Energy191
Application Target Phase-I (2010-13)
Cumulative Target Phase-II (2013-17)
Cumulative Target Phase-III (2017-22)
Grid connected Solar power including roof-top
1100 MW 4000-10000 MW 20000 MW
Off-grid installations including rural solar lights
200 MW 1000 MW 2000 MW
Solar collectors 7 million sq.m. 15 million sq.m. 20 million sq.m.
Phase I which ends in 2013 has a target of 1000MW, to be equally divided between solar photovoltaic (PV) and thermal, making the scheme totally technologically neutral. The modules for PV should be 100% manufactured in India while for solar thermal, 30% of the cost would come from domestic sources, which would eventually increase to 100% in the second phase. In the first phase, the maximum limit for a single PV project is 5MW and that for solar thermal is 15MW. Solar projects that have come up under state policies and the MNRE’s generation based incentives have been allowed to migrate to the JNSSM.
The Ministry of Power is supporting the implementation of first phase, whereby costly solar power would be allocated with the unallocated power of the central generating stations, to make solar power an attractive proposition for purchase by distribution companies that are not financially sound. This would help in significantly reducing the unit cost of solar power. NTPC’s trading arm, NTPC Vidyut Vyapar Nigam Ltd (NVVNL) has been appointed as the nodal agency for the same.
Under the JNNSM, the MNRE has announced guidelines for off-grid applications and small grid connected projects at the 33kV level. For off-grid projects of less than 100kW, capital subsidy at 30% of the benchmark cost or soft loans at 5% interest rate have been made available. For grid connected rooftop solar projects ranging from 100kW to 2MW state utilities can purchase
189
Power Line, Volume 14-No.12 – “Solar Power in India”, August 2010; pp. 84 190
http://mnre.gov.in/file-manager/UserFiles/commissioning_status_spv_batch1_phase1.pdf 191
Power Line Volume 14, April 2010, p.71; http://www.mahaurja.com/PDF/PG2_solar_JNNSM.pdf

Electricity 167
power at a feed-in-tariff set by the respective state electricity regulatory commissions. JNNSM aims to create an enabling environment for solar technology penetration, both at a centralized and decentralized level.
In the one year since the launch of the JNNSM, 37 projects totaling 650 MW have been allotted. By November, 2011, bidding process for 350 MW under second batch of projects of first phase of National Solar Mission has also been completed. As against the average tariff of Rs. 12.20 /kWh in the first batch of solar projects in 2010, the tariff offered in the second batch of projects were in the range of Rs.7.49/kWh to Rs. 9.44/kWh, with weighted average of the offered tariff at Rs. 8.78/kWh. The steep decline in solar power tariff affirms Ministry's aim to achieve the grid parity in the shortest possible time frame192.
Government of Maharashtra has announced various policies for attracting private investment in generation through wind, biomass, bagasse, waste to energy and hydro. MERC has announced attractive tariff for each of the sectors for private investment. Government of Maharashtra has also provides following policy support for renewable energy193.
Green Energy Funds have been created to support renewable energy projects on wider scale partly through subsidy and partly by providing finance on commercial terms. Amendment to the Maharashtra Tax on Sale of Electricity Act, 1963 was made in December 2004 and notification dated 15th May 2008 was issued to levy the “Green Energy Cess” equivalent to 8 paise per unit on the sale of electricity to commercial and industrial consumers.
Urjankar Nidhi has been created to provide seed money initially to support renewable energy projects. To manage the proposed funds, the public trust under the name of Urjankar Fund Trust has been established under the Indian Trusts Act, 1882.
Comprehensive Renewable Energy Policy: Approval to the comprehensive energy policy was accorded by the cabinet on 4 September 2008, by which target of commissioning 2000 MW capacity wind energy projects, 1000 MW capacity bagasse projects, 400 MW capacity biomass projects and 100 MW capacity small hydro projects has been finalized.
Renewable Purchase Obligation: Maharashtra Electricity Regulatory Commission (MERC) had put forth a criterion to be implemented from 2007-08, that of all the power being distributed by distribution companies, at least 4% should be from renewable sources. The MERC has also set solar Renewable Purchase Obligation (RPO) targets of 0.25% for 2010-11 till 2012-13194. Till 2015-16, 0.50% RPO in solar and 8.50% RPO in
192
Government of India, Ministry of New and Renewable Energy, Annual Report 2011-12 193
Government of Maharashtra, Department of Planning, Directorate of Economics and Statistics: Economic Survey of Maharashtra 2009-10, Ch.9 Infrastructure, pp. 137 194
Power Line, Volume 14-No.12 – “Stellar Support-Regulatory incentives and guidelines”, August 2010; pp. 88

Electricity 168
other renewables totaling 9% RPO, for entities owning captive plants or having open access195.
Evacuation arrangement: MEDA and MSEDCL/MSETCL will undertake the survey for installation of LV, HV and EHV sub-stations, and will also supervise the erection of sub-stations196.
After the evacuation arrangement is transferred to MSEDCL/MSETCL, MEDA will reimburse 50% of the approved expenses to the developer.
State level incentives for bagasse and non-bagasse based (biomass) captive power generation
State level incentives for bagasse and non-bagasse (biomass) based captive power generation are tabulated below. Maharashtra state has also promulgated favorable policies which include wheeling and banking and third party sale. Maharashtra has also announced preferential tariffs for biomass power generation197.
Table 54 - State level incentives for bagasse and biomass captive generation
Source Tariff Tariff validity 3rd party sale Wheeling Banking
Bagasse `4.98/ unit 5 years Allowed Allowed Allowed
Biomass `4.79/ unit 5 years Allowed Allowed Allowed
Third party sales generally lead to shorter payback periods and are therefore more attractive to private investors.
Evacuation arrangement
For installing HV / EHV substation for Bagasse Based Cogeneration Power Project / Energy Generation Project capital subsidy of Rs. 1 crore per project will be given; only if minimum 80% PLF is achieved for minimum one year.
For the cooperative sugar factory that installs bagasse based cogeneration project, 100% exemption for 10 years on 3% purchase tax on sugarcane purchase.
State level incentives for wind based captive power generation
Wheeling charges levied for captive use wind generated power are much less in comparison to other conventional sources of energy. These are in the range of 2-10%, but buy back tariffs are in the range of 3-5%. Banking and open access facilities have also been provided.
Table 55 – State incentives for wind based captive power generation
195
Government of Maharashtra, Maharashtra Electricity Regulatory Commission, Regulations 2010 196
http://www.ireda.gov.in/Compendium/index%20copy.htm 197
Captive Power in India, “Captive Power from Renewable Sources”, 2010, pp. 122-123

Electricity 169
Wheeling (% of energy fed into the grid)
Banking Buy-back Open access
RPO (%)
Capital subsidy
Reactive power charges
2+5% transmission loss + grid support charges
12 months
`4.98/ unit (escalation of `0.15/ unit per year for 13 years from date of commissioning of project)
Allowed 6 Power evacuation, approach road, electricity duty, loan to co-operative societies
`0.25 / kVARh
Evacuation arrangement-
MEDA shall get the approach roads constructed.
Electricity Duty will not be levied for the first 10 years.
100% refund of Octroi from the Green Energy Fund
State level incentives for small Hydro Power Project
Evacuation arrangement
Capital subsidy will be applicable up to 5 MW Capacity Small Hydro Projects based on Kolhapur type weir, waterfall, and run of the river. (only if 80% PLF achieved)
Up to 5 MW. Small Hydro Power Projects subsidy of Rs.50, 000 per KW will be given.
Maximum limit for subsidy will be Rs.1.5 crore per project.
Benefits of Renewable energy198
Tackle rising carbon emissions
The energy mix is dominated by coal fired plants in the state and in our country. By 2017 India will be the fourth largest emitter of greenhouse gas emissions. The power sector is alone for more than 40% of those emissions. Aggressive use of renewable, clean energy sources can help alleviate this problem.
Addresses energy security challenges
India has fourth largest coal reserves in the world, but Indian coal has a high ash and low heat content199. Coal is being imported and significant imported coal capacity is now being built in coastal regions. The fuel for the proposed nuclear power plants will also have to be imported.
198 Mckinsey Report, Renewable Energy: Bridging India’s power gap 199 Resources for the Future, Discussion Paper, “Options for Energy Efficiency in India and Barriers to their adoption: A Scoping Study”, Soma Bhattacharya and Maureen L. Cropper, April 2010

Electricity 170
Fuels for renewable energy sources are not import dependent and can help address energy security concerns.
Provide electricity to rural villages
Instead of relying on the slow extension of electricity distribution grid to remote villages, renewable enable distributed generation. This will also accelerate the pace of rural electrification. It will also reduce the consumption of kerosene. These subsidies can be redirected towards promoting renewable energy for remote villages.
Economically competitive
Technological improvements will ensure that cost of power generated through renewable sources will decline, especially for solar energy. Renewable energy is already competitive compared to peak power prices of or retail prices for commercial and high end consumers in cities like Mumbai. In Maharashtra, the peak power deficit was 4941MW in 2008-09, which is likely to worsen in the near future. Up to December 31, 2010 the peak power deficit was 4106MW already (A part of this deficit was given relief with the Agricultural Load Management Scheme). Meeting peak demand through distributed renewable sources like solar panels on residential rooftops or commercial buildings or from hybrid renewable plants can prove economically viable.
Employment Generation
Providing electricity in rural areas will generate employment. Rural energy needs are not just agricultural and cooking and lighting needs. Electricity is needed for schools, micro, small and medium enterprises (MSME) as well. In India, there are around 87% of schools are located in rural areas. Among MSME, around 44.52% of the registered units and around 54.68% unregistered units are in rural areas. There are thousands of rural artisans such as weavers who operate as Own Account Enterprises200. Their productivity will be enhanced by supply of clean energy and moreover due to availability of electricity, number of hours of work will also increase.
Cost of various sources of renewable energy
Electricity production is based on coal fired plants, with 68% share in the state’s total electricity production. 1 kWh of electricity generated at a thermal power plant emits waste heat, carbon dioxide, nitrogen oxide, carbon monoxide, sulphur dioxide and fly ash.
Thermal power generation using coal and gas involves exploited burning of fossil fuels and consequently carbon and greenhouse gas emissions. Although it is not feasible to completely
200
India Science and Technology: 2008 - “Rural Energy Security in India: Reality Checks”, Bikramjit Sinha & Indranil Biswas, May 2009

Electricity 171
discard power from fossil fuel sources, we can reduce dependence on fossil fuels by catering to renewables. The capital cost per MW of various sources of renewable energy is tabulated below.
Table 56 – Capital cost and typical cost of generated electricity from renewable options201
,202
Renewable energy source
Capital Cost (Rs. Crore
/MW)
Estimated cost of generation per unit
(Rs./kWh)
Wind 4.50-5.50 2.00-3.00
Small hydro projects 5.00-6.00 1.50-2.50
Bagasse cogeneration 3.5 2.50-3.00
Biomass 4.00 2.50-3.50
Biomass (Gasifier) 0.94 2.50-3.50
Solar (PV) 10-15 7.49-9.44203
Urban waste Industrial waste
2.5-10.0 2.50-7.50
Decentralized Distributed Generation
The cost of a decentralized distributed generation (DDG) for a village with 240 households, having a demand of 150W per household is tabulated below. DDG is a transitional solution for remote rural areas, depending on the type of fuel availably. It can be installed in these remote locations by the Gram Panchayats with subsidies and incentives provided by the government. If these models are locally owned, rural communities can take responsibility of pricing and collection, operation and maintenance of the plant. Private players can provide technical and management support204 with the government playing a critical role. Other than providing subsidy, the government shall also regulate and monitor the process till the DDG becomes operational. The model once successful can be implemented in other rural places too.
201
http://planningcommission.nic.in/reports/genrep/intengpol.pdf 202
Government of Maharashtra, Maharashtra Electricity Regulatory Commission, Renewable Energy Tariff order FY 2012-13 203
Government of India, Ministry of New and Renewable Energy, Jawaharlal Nehru National Solar Mission 204
Confederation of Indian Industry – “Bharat Nirman Plus: Unlocking Rural India’s Growth Potential”, May 2007

Electricity 172
Figure 56 - Economics of Decentralized Distributed Generation
The government provides incentives, tax concessions, subsidies and various other incentives for setting up renewable energy plants. The Electricity Act, 2003 removed licensing requirement for all power generation plants including those based on renewable energy.205 Off / on grid captive power plants can be best suited for rural electrification. It is a cost effective route of power, especially with the emerging renewable technologies such as biomass projects. The appropriate DDG can be chosen depending on the local fuel availability as well as demand in the area. A pilot DDG project was set up in village Bahrabari in Bihar by Desipower, a nonprofit organization. National Thermal power Corporation (NTPC) also took up distributed generation for rural electrification of remote villages through non-conventional energy sources in order to assist Government of India in achieving the goal of “electricity for all”. Two pilot projects at village Jemara in Chhattisgarh with biomass (woody) for 100 households and at village Jaraha- Chetwa in Uttar Pradesh for 200 households, were successfully commissioned in 2004-05206.
205
Captive Power in India-2010, “Fuel Outlook”, pp. 110 206
https://www.ntpc.co.in/annualreports/2004-05/DirectorsReport05.pdf

Electricity 173
Renewable Energy Potential of Maharashtra
Over 14% of the rural households in Maharashtra still do not have access to electricity. There are many regions which have access to grid connected electricity but suffer from power outages, fluctuating power supply or no power at all, e.g. Melghat forest in Akola district. The tribal villages like Melghat are located in such remote locations that the cost of wheeling power will not be economically feasible. Moreover there are several tribal villages located in the buffer zones of Tiger Reserves and National Parks. These regions can be supplied with electricity through renewable power generation sources. There are various villages particularly the tribal villages which have remote locations. Wheeling power to such large distances would not be feasible economically as in such villages the power consumption will be less than 30 units.
The unit cost of power for a consumer is same whether the consumer is near the generating station or whether he is in a remote location. The cost of providing power to far off communities is hidden in this pricing mechanism. Moreover, transfer of electricity to large distances also involves losses – commercial and technical. Since grid extension is technically and economically challenging, decentralizing electricity systems are a feasible option for rural electrification. A combination of renewable energy technologies can be used for rural electrification as well as remote villages in the state. Thus decentralized renewable energy technologies can penetrate in locations where it is not economically feasible by MSETCL and MSEDCL to transmit and distribute power at larger distances due to the remoteness of many regions in Maharashtra. Billing, collection, maintenance and monitoring thefts would also be difficult in such remote areas.
In such regions off grid applications or decentralized distributed generation has a lot of relevance. Off-grid and decentralized generation proves to be a viable option in such regions. The key drivers for renewable energy are the following207:
Demand-supply gap, especially as population increases
Large untapped potential
Concern for the environment
Need to strengthen energy security
Pressure on high-emission industry sectors from their shareholders
A viable solution for rural electrification
As demand has always outstripped supply, it is necessary that urban areas should also make a transition towards renewable energy. Maharashtra has 3005MW of grid connected renewable power as on March 2011, which is mainly on account of wind power208. The renewable energy
207
Global Energy Network Institute – “Overview of Renewable Energy Potential in India”, Meisen, Queneudec, Avinash, Timbadiya; October 2006 208
http://mospi.nic.in/mospi_new/upload/Energy_Statistics_2012_28mar.pdf

Electricity 174
potential of India and Maharashtra, installed capacity and untapped potential in the state and the capital cost required for setting up various renewable energy plants is tabulated below.
Table 57–Renewable energy potential in India & Maharashtra and untapped potential in Maharashtra209
Renewable energy source
India potential (MW)210
Maharashtra Potential211 (MW)
Maharashtra Installed Capacity (MW)
Maharashtra Untapped Potential (MW)
Maharashtra % untapped (2011-12)
Wind 48000 5439 2733 2706 49.75
Small hydro projects 15000 732 256 476 65.03
Bagasse cogeneration 5000 1250 671 579 46.32
Biomass 16881 781 403 378 48.40
Solar - - 21 NA NA
Waste
Urban waste 2700 287 0 0
Industrial waste 350 11 339 96.86
Total 87581 8839 4095 4765 50.66 NA-Not available
Small hydro means hydro power projects with a station capacity more than 1MW and up to & including 25MW
Out of total potential of 8839 MW of renewable energy in the state, 50% is untapped. Wind power is the only resource that is largely utilized so far. Investments in solar power are picking up with the JNNSM. One of the major benefits of renewable energy sources is that the power plants from these sources can be off-grid decentralized plants catering to the needs of a single household (except small hydro power) or a village, or larger MW scale power plants connected to the grid.
Wind power
Wind power is one of the most promising sources of renewable energy today and the most developed so far. India’s installed wind power capacity stood at 17,351 MW as of March 31, 2012 and accounted for around 70% of the total grid connected renewable capacity. India is currently the world’s fifth largest wind producer. The government has set a target of 10,500MW for the Eleventh Plan period. Karnataka, Gujarat, Rajasthan and Maharashtra together account for 70% of the country’s total wind capacity.
209
Government of Maharashtra, Department of Planning, Directorate of Economics and Statistics: Economic Survey of Maharashtra 2009-10, Ch.9 Infrastructure, pp. 135 210
Power in India, Renewable Energy, pp. 169 211
Government of Maharashtra, Maharashtra Energy Development Agency

Electricity 175
The cost of setting up a 1MW wind power plant is also reasonable costing around Rs. 4.5-5.5 crore/MW. Wind energy has a drawback that it cannot act as a peaking station and cannot produce power on demand.
Projected wind capacity and generation (2025)
Assuming tapping the entire Maharashtra wind energy potential of 5439 MW in 2025
Wind power generation @ PLF 30% - 14294 MU
% wind capacity of total installed capacity - 12.75%
% generation of total generation - 6%
Small hydro power (SHP)
SHP schemes have little or no environmental impact and can provide a range of energy services particularly in rural areas. SHP projects avoid issues such as deforestation and submergence. In areas with hydro-power potential, this form of renewable energy is the most cost-effective opportunity to energize on/off-grid areas. Small hydro-power can satisfy low to medium electric needs such as lighting or telecommunication and power for small industries. SHP projects are further classified as:
Table 58 - Classification of small hydropower projects212
Class Station Capacity in kW
Micro Hydro Up to 100
Mini Hydro 101 to 2000
Small Hydro 2001 to 25000
SHPs typically have an inherent ability for immediate starting, stopping and load variations (solar and wind have similar flexibility but not so with biomass and co-generation). These plants usually have limited poundage capacity. Thus in off seasons when they are generating less than full capacity, water can be stored during off-peak hours and utilized during peak hours, making them suitable as peaking plants. In peak season they usually run as base loads.
212
http://www.mnre.gov.in/schemes/grid-connected/small-hydro/

Electricity 176
Projected SHP capacity and generation (2025)
Assuming tapping the entire Maharashtra SHP potential of 732 MW in 2025
SHP generation @ PLF 30% - 1923 MU
% SHP capacity of total installed capacity – 1.8%
% generation of total generation – 0.83%
Bagasse based cogeneration
Bagasse based cogeneration is extensively used by the sugar industry, where the fuel sugarcane residue is available virtually free for the captive unit. In this process the sugar mills generate sufficient power to sell the surplus to the grid after meeting their own requirement. 5000MW of power could be supplied to the grid if all the 550 sugar mills in the country switch to modern techniques of cogeneration213. In Maharashtra, 76% of bagasse cogeneration remains untapped. There are around 163 sugar factories in Maharashtra. Nearly 76% of the cogeneration potential from the sugar mills is yet untapped. If the all the factories switch to cogeneration, Maharashtra will have a total of 1250 MW of power available from bagasse based cogeneration.
Projected Bagasse capacity and generation (2025)
Assuming tapping the entire Maharashtra bagasse based cogeneration potential of 1250 MW in 2025
Bagasse based co-generation @ PLF 50% - 3285 MU
% bagasse capacity of total installed capacity - 3 %
% generation of total generation – 1.5%
Biomass projects
These are significant from the socioeconomic perspective as they have potential for employment generation and asset creation as they are linked to agriculture. According to the IEA, the share of global electricity from biomass is expected to increase from 1.3% at present to
213
http://mnre.gov.in/annualreport/2007_2008_English/Chapter%205/chapter%205_1.htm

Electricity 177
about 3.5% by 2050. This is based on the 120-150 million tons of surplus biomass available from agriculture and forest residues. The current net availability of biomass in India is estimated at 540 million tons, of this almost three four this is used as fodder for cooking and for other economic activities. Being linked to agriculture, biomass projects have a tremendous potential for employment generation. The technology for biomass gasification is reasonably matured.
Biomass energy includes fuel wood, charcoal and agricultural residues as fuel. Biomass fuels comprise of both woody and non woody mass. The first comes from trees and shrubs; the latter from crop residues and other vegetation. Biomass includes rice husk, bamboo, cane, straw, cotton stalk, coconut shells, soya husk, de-oiled cakes, coffee waste, jute wastes, groundnut shells, saw dust, market waste, house waste, etc. Biomass plants are generally small sized plants with captive capacities of 25MW and below. Punjab has the highest installed capacity accounting for 32% of the total biomass based captive capacity. This is followed by Andhra Pradesh (18.5%) and Tamil Nadu (17.3%)214. As of now only 88.9% biomass potential in Maharashtra remains untapped, but growing scarcity of fossil fuels is likely to necessitate its growth in the future. Biomass generation is ideal for rural and remote areas as it is flexible to integrate biomass with other sources such as wind and solar.
There are several advantages of this route for village electrification, a few of which are listed below215:
Biomass is available almost everywhere.
Power will be available on demand at any time of the day or year. The device can be used for 24 hours continuously or for limited period of the day.
Different capacities from a few kilowatts to megawatt scale gasifiers are available.
The power can be used for multiple applications like lighting, drinking and irrigation water supply, small scale industries, etc. Since the device can be used any time of the day, service can be conveniently sequenced.
Production cost of power from gasifier systems range from `2.5/kWh to `5/kWh depending on capacity utilization, biomass cost, etc.
Socially beneficial electricity production, as it is linked to agriculture.
Biomass is an important energy source in Indonesia, Malaysia, Philippines, Thailand and Vietnam216. Developed nations like Finland, Sweden and Austria also have biomass power generation. Sweden also has a higher share of biomass generation. Biomass surpassed oil to become the number one source for energy generation in 2009, accounting for 32% of the total energy consumption in Sweden. It is projected that biomass consumption will continue to
214
Captive Power in India, Captive Power from Renewable Sources, pp119 215
The Economic Times, “Lighting up rural India, naturally”, Paul P J, August 20, 2010 216
Biomass: More than a Traditional form of Energy- FAO/RAPA

Electricity 178
increase by another 10% in 2011217. A total of 147 MW of biomass capacity has been installed in Maharashtra till 2010-11218.
Table 59: Anticipated future of biomass power
Parameter Now (2010) Future (2020)
Distributed electricity generation
Biomass has a minor contribution
Biomass will be a major contributor
Use in co-firing in power plants
Fewer than 1% of power plants use biomass
A much larger % of utility power will be from biomass
Use of feedstock Primarily waste biomass and assorted
Dedicated energy crops
Related revenue streams
Some additional revenue streams already present
A more established end user market for co-products
Standalone renewable electricity source?
Primarily standalone mode
Will be used in conjunction with other renewable electricity sources
Projected Biomass capacity and generation (2025)
Assuming tapping the entire Maharashtra biomass potential of 780 MW in 2025
Biomass based co-generation @ PLF 68% - 2050 MU
% biomass capacity of total installed capacity – 1.8 %
% generation of total generation – 0.94%
Solar energy
Data on solar energy potential in the state is not available; however the present state of harnessing solar energy is insignificant219. Since Maharashtra has a temperature in the range of 25-27.5oC, the state has a huge solar potential. Solar energy at present is being used only for water heating in residential complexes. However, it can also be used to meet peak demands through solar panels on residential rooftops and commercial buildings. Solar PVs are best suited for urban buildings. The high end commercial and residential consumers can go off the grid and have their own solar installations rather than paying higher tariffs.
217
http://www.renewableenergyworld.com/rea/news/article/2010/06/biomass-generates-32-of-all-energy-in-sweden 218
http://www.mahaurja.com/PDF/Biomass_Proj_StatusC.pdf 219
India Science and Technology: 2008 - “Rural Energy Security in India: Reality Checks”, Bikramjit Sinha & Indranil Biswas, May 2009

Electricity 179
India’s grid connected capacity currently stands at around 143 MW220. Most projects are small sized demonstration projects set up by MNRE. The installation of MW scale projects are very few as cited below.
95 MW of solar power is installed in the states of Gujarat and Rajasthan.
2 MW grid connected – West Bengal, Green Energy Development Corporation at Asansol
Two projects of 3MW each commissioned by Karnataka Power Corporation Ltd
2 MW project Azure Power at Amritsar in Punjab
1 MW solar PV thermal power project is being developed at Chandrapur by MahaGenCo
NTPC plans to establish solar power capacities of over 300 MW (PV or thermal) Tata Power is independently exploring options for 300 MW worth of solar projects to be
commissioned by 2013 From FY 2010-11, Maharashtra has seen the inception of Grid interactive solar power. A total of 25 MW solar power generating capacity has been added in two years. A 125 MW (5 X 25) solar power project at Sakri, Dhule is being undertaken by MSPGCL. It is going to be the biggest solar power project in the state. The table below shows location and commissioning details of solar power projects commissioned in Maharashtra.
Table 60- Grid Connected solar power plants in Maharashtra221222
Company Capacity MW
Location Commissioned
MSPGCL 1 Chandrapur STPS April 2010
MSPGCL 2 Chandrapur STPS October 2011
MSPGCL 2 Chandrapur STPS February 2012
Dr. Babasaheb Ambedkar Sahakari Sakhar Karkhana Ltd.
1 Osmanabad July 2011
Tata Power 3 Mulshi, Pune March 2011
Clover Solar Pvt. Ltd. 2 Supa, Baramati, Pune October 2011
Videocon Industries Ltd. 5 Warora, Chandrapur October 2011
Citra Real Estate Ltd. 2 Katol, Nagpur November 2011
Sepset Construction Ltd. 2 Katol, Nagpur November 2011
Firestone Trading Pvt. Ltd. 5
Total (MW) 25
Apart from grid connected system, solar power finds a wide application in decentralized and off grid applications. Some of the key decentralized applications using solar power include home
220
http://mnre.gov.in/file-manager/UserFiles/powerplants_241111.pdf 221
http://www.mahagenco.in/uploads/projects/projectCompletedInLast5Years.pdf 222
http://mnre.gov.in/file-manager/UserFiles/commissioning_status_spv_batch1_phase1.pdf

Electricity 180
lighting, street lighting, pumps, solar water heaters, solar cookers, etc. solar power plants have also been established as stand-alone off- grid installations for supplying power to railway stations, border outposts, hospitals, etc. The market for decentralized and off-grid power is huge. It also includes demand from areas such as rural electrification, backup power for telecom towers and for lighting billboards and tail end grid support, where solar power could effectively reduce dependence on DG sets as well as load from grid. Tabulated below is the installed capacity of decentralized solar applications in India and Maharashtra as of January 2012223.
Table 61 – Installed capacity – India and Maharashtra (January 2012)
Source/System Cumulative Capacity
India Maharashtra
Solar home lighting systems (No.) 6,96,069 2431
Solar lanterns (No.) 8,50,375 8683
Solar street lighting systems (No.) 1,41,280 8420
Solar PV pumps (No.) 7571 228
Solar water heating – collector data (million sq.m) 3.25
Solar cookers (No.) 6,72,000 58044
JNNSM’s guidelines for off-grid projects provide multiple channels of contact between the suppliers through channel partners such as renewable energy service provider companies, financial institutions including micro-finance institutions, system integrators and program integrators. Incentives are available through renewable vouchers, capital and interest subsidy, viability gap funding and green energy bonds. Grid connected capacities are the main focus area of JNNSM though. Following are examples of off-grid solar power used for cooking, lighting and telecom towers224. Batch II of Phase I of JNNSM has just started (January 2013).
Through its Rural Village Electrification (RVE) program, MEDA has installed solar home lighting and street lighting in 362 villages and 805 hamlets in Maharashtra till July 2012225. 30,483 solar home lights and 3,508 solar street lights have been installed by MEDA. 56 kW solar photo voltaic SPV power plants have also been installed at 6 village places.
Solar steam cooking
Solar concentrators have been used for solar steam cooking systems. The world’s largest solar steam system for cooking is set up at the Shirdi temple. It is designed to meet requirements of about 50,000 meals per day. Other examples include Mount Abu in Rajasthan designed for 10,000 people per day, Tirupathi and Satyabhama University, both in Andhra Pradesh each catering to 15,000 people per day. The world’s highest solar cooker installation was in Ladakh
223
Government of India, Ministry of New and Renewable Energy, Annual Report 2010-11, 2011-12, 224
Power Line, Volume 14-No.12: “Off-grid Solutions-Needs and deployments”, August 2010; pp. 92 225
http://www.mahaurja.com/PDF/RE_RVE_Achivement.pdf

Electricity 181
for the Indian Army. It involved 10 solar concentrators to cook for about 500 people. Solar concentrators have also been deployed for systems processing drinking water from sea water. Other emerging uses include solar crematoriums, waste water evaporation and solar air conditioning.
Solar lighting
Lighting solutions are among the most basic requirements addressed by off-grid solar systems. In remote rural areas to fulfill lighting needs, solar lamps have been introduced in most areas. Villagers spend around `150 every month on kerosene to fuel kerosene lanterns226. The people in remote areas are ready to shell out money for solar lamps. The United Nations Environment Program says that kerosene fumes are responsible for 64% deaths for children under the age of five in developing countries227. Even if these remote households get solar lanterns the health of women and children will improve. The children will have more hours for studying and the local artisans will also be benefitted as their productivity will increase. Several such installations have been installed and the impact has been that rural productivity from income generating activities has increased. This is particularly significant as access to power in rural areas remains a problem. This can just be the start, but in the long run, electricity is not just essential to fulfill lighting needs, but for the development of the area.
Figure 58 – Decentralized application of solar power for pumping water in Melghat, a tribal village
Telecom towers
The telecom industry has over 250,000 towers that are shared by various operators. The energy requirements of running the base station towers involve both utility supply and diesel
226
Mint – “Solar lamps light up rural lives, dim use of oil lanterns”, September 2010 227
Wall Street Journal Online, “Solar lamps face subsidy shadow in rural India”, December 7, 2009; http://online.wsj.com/article/SB125991486832876383.html
Figure 57- Solar streetlight

Electricity 182
generator (DG) sets. Each tower requires a 15-20 kVA DG set and has an average run time of 16-20 hours per day. At an approximate diesel consumption of 1.9-2 liters per hour, the total annual diesel consumption is calculated to be approximately 12-14 kilo liters. Per unit cost based on DG sets ranges from `30-50. Hybrid solutions comprising solar and DG sets or solar power entirely can be harnessed to meet the energy requirements of the telecom base stations.
The typical PV array for a single operator base station tower is 3-3.5kWp (kilowatt-peak, a measure of the peak output of a photovoltaic system). The energy generated from a 3kWp PV array is 11-13kWh per day, and the array supports the load for about 10-12 hours in the day. Also reducing the DG set operation by 10 hours would reduce the CO2 emissions by about 45kg per day. The installation of these systems faces challenges such as insufficient space for PV arrays, remote management sites and logistics issues.
Land is a key input in solar projects. Solar PV is generally regarded as suitable for Indian conditions where space is a constraint, especially for projects such as rooftop solar. Globally, solar PV is the fastest growing technology with PV production increasing by an average of 20% each year since 2002. At end 2009, the cumulative global PV installation surpassed 21,000MW, of which 90% consisted of grid tied systems. Grid parity, the point at which PV electricity is equal to or cheaper than grid power, has been achieved in California, Japan and Hawaii and other islands. The US is expecting to reach grid parity by 2015228.
Solar energy can be harnessed by several applications such as photovoltaic (PV) cells placed on the roof top of houses or commercial buildings, and collectors such as mirrors or parabolic dishes that can move and track the sun throughout the day are also used. This mechanism is being used for concentrated lighting in buildings and called concentrating solar power (CSP). The capital costs of CSP projects are high. Globally the capital cost of projects based on parabolic trough technology (the most commercially deployed technology) range from `160 million/MW to `400 million/MW. The capital costs of upcoming projects coming up in India have been estimated to be over `140 million/MW. The costs are expected to decline with more competitive supply of components and as other low-cost technological options like CSP plants with storage and hybridization are explored229.
Photovoltaic (PV) cells have a low efficiency factor, yet power generation systems using photovoltaic materials have the advantage of having no moving parts. PV cells find applications in individual home rooftop systems, community street lights, community water pumping, and areas where the terrain makes it difficult to access the power grid. The efficiency of solar
228
Power Line,Volume14-No.12,“PV Promise-Solar photovoltaic dominates technology choice”,August 2010; pp. 88 229
Power Line, Volume 14-No.8, “Cost trend-Economics of solar PV and CSP projects”, April 2010; pp. 74

Electricity 183
photovoltaic cells with single crystal silicon is about 13-17%. High efficiency cells with concentrators are being manufactured which can operate with low sunlight intensities230.
Solar Rooftop
Buildings can provide a unique opportunity to generate electricity by utilizing rooftops. These plain surfaces facing direct sunlight at most of the times of the year are a vast source of energy – these rooftops can come together to become a massive power plant – a decentralized one.
An example of solar PV installations in Pune city is considered to get a clear understanding of power that can be generated from cities through renewables. Utilizing the area of residential and commercial building roof tops in the city, Pune alone can provide an installed capacity of 1000 MW and generate upto 1000 MUs of electricity annually. This is calculated considering minimum efficiency of 10%.
44% of residential area has been considered as per the City Development Plan Report prepared for JNNURM. It has been assumed that 50% of the buildings’ residents agree and installation of solar power plant is possible on their rooftops. It has also been assumed that only 40% of the area of the total plant (building) can be actually utilized for installing solar panels.
230
Global Energy Network Institute – “Overview of Renewable Energy Potential in India”, Meisen, Queneudec, Avinash, Timbadiya; October 2006

Electricity 184
Projected solar capacity and generation (2025)
Maharashtra solar power potential of 905 MW in 2025231
Solar generation @ PLF 10% - 793 MU
% generation of total generation – 0.34 %
In addition, utilization of solar power potential on rooftops of buildings will provide more power from solar energy, which has a potential of generating 4 million units from a square kilometer of urban area.
Energy from Waste
Energy from waste which remains untapped altogether needs to be promoted on a large scale, particularly in the urban regions. Several initiatives have been taken up in various towns but these are minuscule. Municipal solid waste (MSW) generation ranges from 0.25 to 0.66kg/person/day with an average of 0.45kg/person/day. In addition, large quantities of solid and liquid wastes are generated by industries. Most wastes that are generated find their way into land and water bodies without proper treatment, causing severe water pollution. They also emit greenhouse gases like methane and carbon dioxide, and add to air pollution. The problems caused by solid and liquid wastes can be significantly mitigated through the adoption of environment-friendly waste-to-energy technologies that will allow treatment and processing of wastes before their disposal. These measures would reduce the quantity of wastes, generate a substantial quantity of energy from them, and greatly reduce pollution of water and air232.
In most cities and towns in India, waste is disposed in an unregulated and unscientific manner in low-lying, open dumps on the outskirts of cities. Most of these dumping sites do not have systems for leachate collection, landfill gas collection or monitoring, nor do they use inert materials to cover the waste. As a result, ground and surface water get contaminated from runoff and lack of covering; air pollution is caused by fires, toxic gases, and odour; and public health problems due to mosquitoes and scavenging animals.
Though recycling waste is the best option so far but there are limits to recycling. If all the waste that is recyclable would have been recycled the problem of disposing waste would have been tackled by now. The waste that yields a high price is only recycled. Waste that is dumped is mixed, comprising all kinds of biodegradable, non-biodegradable and hazardous waste. This mixed waste leads to contamination of materials which limits the proportion of recoverable
231
Government of India, Ministry of New and Renewable Energy 232
http://www.eai.in/ref/ae/wte/wte.html

Electricity 185
material and its value233. Since availability of land for new landfill sites is also a constraint and no one wants to have a landfill nearby due to health hazards. Generating electricity from waste can provide a solution to managing the waste. There is considerable scope for energy recovery from urban and industrial wastes.
Urban and Industrial Waste
Various technologies are available to harness energy by treatment of urban & industrial wastes. It is estimated that through adoption of technologies for recovery of energy from wastes over 1000MW of equivalent power can be generated from the above wastes in India234. About 42 million tonnes of solid waste (1.15 lakh tons per day) and 6000 million cubic meters of liquid waste are generated every year by our urban population235.
A major advantage would be reduction in the quantity of waste and net reduction in environmental pollution, besides generation of substantial quantity of energy. Some Municipal Corporations have set up plants to recover energy from urban waste, the energy generated is used to light the street lights. The potential of 2700MW has been calculated for the country whereas Maharashtra has a potential of 270 MW.
MNRE has notified a scheme for Accelerated Program on Energy Recovery from Urban Wastes, with the following objectives:
To accelerate the promotion of setting up of projects for recovery of energy from urban wastes;
To create conducive conditions and environment, with fiscal and financial regime, to develop, demonstrate and disseminate utilization of wastes for recovery of energy; and
To harness the available potential of MSW-to-energy by the year 2017
Wave Energy
Wind transfers tremendous amounts of power to waves. Heavy winds blow across the seas towards the land. This wave energy can be tapped by placing instruments to convert it into electrical energy.
The wave quality varies for different periods and seasons. It is possible to have a realistic formula to calculate the overall wave energy potential. A general study of the wave nature has shown that there is potential of 40,000 MW along the Indian coast.
A similar study along the coast of Maharashtra has shown that there are some potential sites such as Vengurla rocks, Malvan rocks, Redi, Pawas, Ratnagiri and Girye, possessing an average
233
ILEX Energy Consulting UK, “Eligibility of Energy from Waste –Study and Analysis”, March 2005 234
http://www.ireda.gov.in/homepage1.asp?parent_category=2&sub_category=29&category=106 235
http://mnre.gov.in/energy-uwaste.htm#Recent%20developments%20in%20Municipal%20Solid%20Waste%20Management

Electricity 186
annual wave energy potential of 5 to 8 kW/m and monsoon potential of 15-20 kW/m. Considering this, the total potential along the 720 km-stretch of Maharashtra coast is approximately 500 MW for wave energy power plants.
Table 62-Wave power at selected sites along Maharashtra coast236
Off Shore Avg. Wave Power kW/m
Coastal Avg. Wave Power kW/m
Site Annual (Jun-August) Site Annual (Jun-August)
Vengurla Rock 8.01 20.61 Girye 5.90 14.21
Square Rock 6.79 16.64 Vijaydurg 5.86 13.58
Redi 6.35 16.57 Ambolgarh 5.74 13.48
Malvan Rock 6.91 16.73 Kunkeshwar 5.64 13.35
Kura Inset 5.79 13.74 PawaPoint 5.36 13.10
Wagapur 5.70 13.10
MEDA, the nodal agency appointed by the state government to take initiatives in nonconventional energy sources is set to float tenders for projects involving power generation through wave energy along Maharashtra coast.
236
http://www.mahaurja.com/PG_Wave.html

Electricity 187
Conclusion
The current installed capacity of renewable in Maharashtra is 4095 MW. A large potential of 4747 MW yet remains untapped, of which the solar installed capacity would vary as we utilize potential areas of solar radiation. Solar potential is not included in total potential of renewable. MNRE has set a target of installing 905 MW of solar capacity in the 12th FYP. This would add to the existing renewable potential which would ultimately increase the renewable installed capacity to 9744 MW in 2025.
Figure 59 - Anticipated Renewable Energy Capacity Achievement (2025) –MEDA calculations
Table 63 - Anticipated renewable power generation in 2025
Source Renewable Potential (MW)
Installed Capacity (MW) 2012
Proposed Capacity Addition in 12th plan (MW)
MEDA potential (MW)
PLF (%)
Target potential in 2025 (MW)
Anticipated yearly generation in 2025 (MU)
Wind 5439 2733 1500 5439 30 Scope in augmentation
14294
Solar variable 18 525 905 10 793
Biomass 781 403 150 781 70 4789
Bagasse Cogeneration
1250 671 250 1250 50 5475
Small Hydro 732 256 50 732 30 1924
Waste 637 11 15 637 30 Scope in augmentation
1674
Sub total 2490
TOTAL 8839 4092 6582 9744 15000 28948

Electricity 188
9744 MW is the proven renewable energy potential that must be achieved with utmost urgency. However more areas for solar and wind energy will have to be identified. Roof top solar power generation is a viable option; its potential remains largely untapped. Considering the energy demand of around 40,000 MW in 2025, it is recommended that at least 35-40% (~15,000 MW) of power be generated from renewable sources in order to get closer to being sustainable in the electricity sector. 35-40% power in 2025 be generated from renewable sources
Accelerating the growth of renewables in Maharashtra and taking the total installed capacity to 15000 MW in 2025 would generate around 45000 MU of electricity from renewables.
The country is faced with a dilemma of not only sustaining its economic growth but also with the global threat of climate change. India is the fifth largest emitter of greenhouse gases (GHGs) in the world, accounting for 4.7% of the total emissions. The principal energy-related challenge is access to energy, which has two distinct facets: ensuring energy supply to meet the growing demand of fuelling economic growth; and providing access to lifeline levels of clean commercial energy for the poor, chiefly electrification and cooking gas/kerosene237. 44% of rural households depend on kerosene for domestic lighting and another 55% on electricity, while in urban areas dependency is 89% on electricity and 10% on kerosene238. The disparity in access to energy between urban and rural areas and across income groups has stayed the same or widened. The grim reality is that in India almost half the population in rural areas has little or no supply of power. For long years, open ended subsidies in power have mostly been diverted and usurped by the undeserving non poor239.
Electrification particularly in rural areas will greatly improve quality of life. Lighting alone brings benefits such as increase in study time and improved study environment for school children, extended hours for small businesses, and greater security240.
Though the market share of renewable energy is small it holds a tremendous promise for meeting the future needs of electricity. As discussed several policy measures are being implemented; subsidies and incentives are being provided at the state and central level. Many such projects are coming up on a large scale in various parts of the country. The cost of renewable energy technologies has decreased substantially since the 1970s. Renewable/ green energy is a viable option for electrification particularly in the regions where people have no or
237
CEPS Working Document No. 325, “The Political Economy of India’s Climate Agenda”, Noriko Fujiwara, March 2010 238
India Science and Technology: 2008 - “Rural Energy Security in India: Reality Checks”, Bikramjit Sinha & Indranil Biswas, May 2009 239
The Economic Times, “Focus on power poverty- Innovate Rural Electrification”, September 27,2010 240
Independent Evaluation Group, World Bank, “The Welfare Impact of Rural Electrification: A Reassessment of Costs and Benefits”

Electricity 189
little access to electricity. Distributed decentralized generation is the best viable option for remote villages.
Indigenous manufacturing holds the key to success of incorporation of renewable energy into the conventional energy system in India. Import of technology is proving costly and there are several other limitations in being dependent on imported technology. Also, economics of scale will play a major role to ensure lower costs241. In addition to subsidies in deployment of renewable energy technology, incentives for solar manufacturers are equally important.
Solar lighting systems and kW scale off-grid solar systems can make a tremendous difference in the lives of the rural poor that have little or no access to electricity. Today, solar PV based lighting solutions (lanterns and home lighting systems) offer a cost-effective solution to quickly provide better quality lighting services to this population. Solar off-grid systems can provide lighting and power to Primary Health Centers, schools, drinking water systems, and for small income generating activities, significantly improving the quality of life in rural areas. The JNNSM has set a target to achieve 20 million solar lights by 2022, which is around 20,00,000 solar lights per day across the country. But this target seems to be minuscule for the mission which has set a massive target of 20,000MW by 2022. Nevertheless the subsidies and soft loans for the solar lights can be used to lighting for lighting up the rural households.
In urban areas, renewable energy can be used in a different manner altogether. In the urban areas, private players are ready to invest as the return on investment is quicker and higher in comparison to rural areas. Moreover state of the art infrastructure is available in urban areas. Residential complexes are investing in solar water heaters, but this is not sufficient.
In urban area power plants using urban and industrial waste should be considered. Municipal solid waste (MSW) poses hazard to health and environment, so using it to generate power would be feasible. The pace of setting up plants using MSW as a fuel should be intensified. Similarly industries are mostly clustered in MIDCs, or in specific areas and the industrial waste generated should also be put to better use by fuelling power plants based on industrial waste as fuel. Such plants should be located within MIDCs and depending on the quantum of waste generated; the capacity of the plant can be decided. Instead of connecting such plants to the grid, they can be used for street lights or other uses.
Power can also be generated from sewage treatment plants, as is being done in several developed countries.
Instead of taking up fertile lands from farmers, who rarely benefit due to the projects monetarily or in terms of electricity. The affected people are pushed into more poverty. Instead generation can be distributed through clean green energy, which would ensure power as well as cut down on the T&D losses as well.
241
Power Line Volume 14, April 2010, pp. 72

Electricity 190
A policy decision/ reforms are needed wherein it would be made mandatory for all telecom towers and advertisements (hoardings) to harness solar power.
Commercial, industrial and high end residential consumers who pay higher tariffs in order to cross subsidize the low end BPL consumers can switch to captive renewable technologies and generate their own power. A hybrid of solar and biomass technologies can be used to produce power, depending on the estimated usage. Depending on the type of industry, the waste can also be used to generate power. In fact, MIDCs can produce power from industrial as well as municipal waste. This would reduce municipal waste in the area considerably, and this electricity can be used by industries in MIDC.
Renewable energy will also reduce greenhouse gas emissions and dependence on imported fuels. Moreover, setting up decentralized plants will also reduce T&D losses.
Envisaged total renewable capacity in 2025 - 15000 MW

Electricity 191
Case Studies
San Antonio, Texas – Power generation from Sewage treatment Plants
San Antonio Water System (SAWS) has come up with an innovative technology of generating power from methane gas - a byproduct from the sewage treatment process, currently burnt off through the use of flares. 80% bio solids are already sold to recyclers for use in compost. Thus the sewage treatment plants (STPs) give a trifold benefit – power generation from methane gas, treated water used for irrigation and solid waste used for compost.
SAWS signed a 20-year lease and operating agreement with Massachusetts-based Ameresco that will allow the company to build a gas conditioning and distribution facility at the Dos Rios Water Recycling Center. Ameresco will be in charge of selling the gas on the open market. In return, SAWS will receive a 12 percent royalty off the sale of the gas.
Methane gas, which is a byproduct of human and organic waste, is a principal component of the natural gas used to fuel furnaces, power plants and other combustion-based generators.
About 140,000 tons of bio solids produced each year generate an average of 1.5 million cubic feet of gas per day on treatment which is enough to fill 1250 tanker trucks each year. AS per estimates calculated the contract could generate between $200,000 to $250,000 revenue for the utility each year.
Some communities are using methane gas harvested from solid waste to power smaller facilities like sewage treatment plants, but San Antonio is the first to see large-scale conversion of methane gas from sewage into fuel for power generation
Kearny, New Jersey – Power generation from Landfill site
Collection of methane gas is proposed in the 400 acre landfill at Kearny, New Jersey. This site is among 21 landfills in New Jersey where methane gas produced by decomposing garbage and used as fuel to generate electricity, according to the state Board of Public Utilities. Decades' worth of household trash, construction waste and assorted refuse buried in the landfill are providing electricity to thousands of homes. The Environmental Protection Agency has spotted 445 potential landfill sites through its Landfill Methane Outreach Program. The environmentalists envision making more use of landfill sites by installing wind and solar power to supplement methane. Thus these three sources could be combined to create a steady source of power. The new landfills need to be designed to accommodate methane gas collection whereas existing landfills can produce methane long after they've been shut down.
The Edgeboro landfill in East Brunswick, operated by the Middlesex County Utilities Authority, has been collecting methane since 2001 and currently generates about 13 megawatts of electricity, enough for about 13,000 homes for a year, according to Public Service Electric and Gas, the state's largest utility.

Electricity 192
The Middlesex County agency uses the electricity generated by the Edgeboro landfill's methane to power the county's wastewater treatment plant in Sayreville. Last year, that saved the authority about $3 million, according to the executive director.
Long tubes with perforated bases are drilled down into a landfill to collect the methane gas, which then is used as fuel to drive generators. Inactive landfills are capped usually with a plastic or rubber covering that prevents excess gas from escaping.
Amanora Park Town Hadapsar, Pune - Electricity generation through Biomass gasifier system
Prosopis juliflora (Vedi Babhul) is used to generate electricity through Biomass gasifier system. This species is used as it is available in plenty and also thrives on less water. In the Amanora Township 11 kW electricity is supplied to the workers colony. The time required for installation is from 2 hrs. to 2 days. 1.3 kg per unit of Prosopis juliflora is used. Rs. 600,000 is the expenditure to generate 11 kW of electricity.
This project is also undertaken in villages Dhavlas, Valekhindi Dicholi and Yellur of talukas Mangalvedha, Jat, Patan and Valva respectively.
Dapoli Nagar Panchayat242
Dapoli is a small town in Ratnagiri district of Maharashtra. The local government Nagar Panchayat has installed renewable energy in its campus. Energy has been produce from solar, wind and waste. It is utilized for street lighting, running the local government buildings. It has set an excellent example of making peoples’ (governmental) buildings autonomous of external power, at least for a part of their electricity needs.
53 kW power generation in the campus of Nagar Panchayat
Supported by Maharashtra Energy Development Agency
Funding from Central Government: Rs. 35.19
7 kW from solar PV panels atop the building
16 kW from wind in the Nagar Panchayat campus
30 kW from biogas produced from waste
23 kW will be utilized for Nagar Panchayat buildings
30 kW for street lighting
242 http://72.78.249.125/eSakal/20120302/4996037045006219840.htm

Electricity 193
Renewable Energy Facts
1. Europe DECOMMISSIONED more coal, fuel oil and nuclear capacity than it installed in 2009.
2. Solar energy is working at night on a commercial scale. A plant in Spain has seven hours of heat storage.
3. In a time period of just 5 years, Portugal's electric grid leapt from 15% to 45% renewables.
4. Iceland's power supply went from 75% imported coal to more than 80% local geothermal and hydro in 30 years.
5. China built (roughly) one windmill an hour in 2009.

Electricity 194
Solution 4
Implement Energy Conservation Measures
Goal: To explore various energy conservation techniques for all segments of energy users in order to reduce the operational costs and enhance productivity.

Electricity 195
Introduction
Energy is crucial for the development of modern society and so is energy conservation. Energy conservation is the practice of decreasing the energy used by using available energy in a smart and efficient manner. It involves the efficient use of energy in a way that will lead to use of less energy to achieve similar outcomes. Around two-thirds of the energy is lost while converting primary, secondary and final energy into useful energy services. Improving the energy efficiency of end-use applications would further reduce the energy intensity of the economy. Thus the end use is an area of high potential and needs to be largely explored. Higher end use energy efficiency i.e. providing technologically more desired service per unit of delivered energy consumed, is essentially the most easily deployable and certainly the most neglected243 (in terms of implementation) way to conserve energy. End use energy refers to energy consumed in industrial, residential, agricultural and commercial settings.
Energy conservation is achieved through efficient energy use and it does not necessarily entail huge investments. It reduces energy consumption and energy demand per capita and thus offsets some of the growth in energy supply needed to keep up with population growth. This reduces the rise in energy costs and can reduce the need for new power plants. The reduced energy demand can provide more flexibility in choosing the most preferred methods of energy production. It further facilitates replacement of non- renewable energy with renewable energy. Thus energy conservation and efficiency immediately saves peoples’ money, reduces outages and offsets the need for new power plants.
Figure 60-Peak demand, supply & shortfall in Maharashtra (MSEDCL distribution area)244
243
Rocky Mountain Institute, “Energy End-Use Efficiency”, Amory B. Lovins, pp. 1; www.rmi.org 244
Government of Maharashtra, Department of Planning, Directorate of Economics and Statistics: Economic Survey of Maharashtra 2009-10, Ch.9 Infrastructure

Electricity 196
Electricity demand has consistently exceeded available supply. Peak demand, supply and shortfall at peak for the MSEDCL distribution from 1998-99 till 2011-12is plotted below. As can be seen, the demand supply gap has widened over the years. The average electricity deficit from 1998-99 to 2011-12 is 30% with the peak electricity deficit being 33% in 2011-12. Considering the severe power shortage in Maharashtra, growing demand and heavy distribution losses, huge investments in power sector are not sufficient to fulfil the energy gap.
Limited availability of finance and other legal and administrative barriers have constrained the construction of new power plant capacity in the country. As a result, under BAU scenario, India continues to face an electricity deficit beyond the end of the Twelfth Five Year Plan245. Moreover, resources such as land, water and fuel are limited. This has also posed a challenge to the construction of new power plants. Shortage of fuel (coal) has led to importing fuel at higher prices which has affected tariffs for consumers. Energy conservation and efficiency measures have the advantage to meet demand with the help of existing capacity at costs lower than that required for construction of power plants. It would also provide relief to the pressure on existing resources due to construction of new power plants.
Addition of new power plants is getting delayed due to land acquisition and environmental issues. There are widespread protests for constructing major power projects from thermal to nuclear. In Raigad (Konkan) - famous for alphonso mangoes, farmers are protesting against the 1200 MW thermal power project, which they say will damage their crops. Jaitapur nuclear project (9900 MW) in Konkan is also facing strong opposition from the locals, in spite of land being forcefully acquired by Government of Maharashtra under the emergency clause. Maharashtra is not the only state to face protests from the local population. Several proposed power projects across the country are in a similar crisis - the proposed 6000 MW Jasapara nuclear project in Bhavnagar and the Somepeta coal power plant site in Andhra Pradesh are also facing protests from the locals. Considering the overall hue and cry of populace protesting against major power projects, it is time to rethink our ways to deal with the looming power crisis because projects being planned may never be built. People will continue to oppose these projects, as they know their poverty will only be replaced by destitution, if and when these projects are built246. So even if the projects are built by force, by the time they are commissioned, electricity demand would have outpaced supply.
Electricity sector is dominated by coal fired power plants. Combustion of fossil fuels, especially coal to generate electricity is responsible for more greenhouse gas emissions than industry and transport combined. Unless the mix of fuels changes dramatically, greenhouse gas emissions will rise to unacceptable levels. Business as Usual projections will increase by two thirds over the same period, making power generation the fastest growing cause of climate change.
245
Lawrence Berkeley National Laboratory, International Energy Studies Group, “Eliminating Electricity Deficit through Energy Efficiency in India: An Evaluation of Aggregate Economic and Carbon Benefits”, Jayant Sathaye and Arjun Gupta, April 2010 246
Down To Earth, “See the Light”, Sunita Narain, August 15, 2012 http://downtoearth.org.in/node/1631

Electricity 197
Taking into consideration the problems discussed, indicates that a sustainable solution for meeting the increasing needs of electricity is imperative. It is not possible to keep on increasing production of electricity with potential increase in the severity of the problems. No matter which method is used there are limits set by technology, economics and resources. One apparent and obvious solution is to use electricity more efficiently. The initiative has already been taken by encouraging conservation and demand side management measures. Energy efficiency of appliances has vastly improved – with the same amount of electricity the output is much larger.
Energy conservation through efficient use of energy is the most economical and least cost option which contributes to sustainable development. It is a realistic choice to elevate pressures of energy shortage. Many opportunities exist to encourage the energy conservation and efficiency across various sectors. It is a realistic choice to alleviate the pressures of energy shortage. Energy efficiency and conservation measures can reduce peak and average demand. Energy conservation potential and possible energy savings for various economic sectors is tabulated below. The maximum potential is in the industrial, commercial and agricultural sectors247.
Table 64 – Potential for Energy Conservation
Sector Conservation Potential
Possible annual savings (mkWh)
Agriculture Up to 30% 2619
Industrial Up to 25% 4359
Domestic Up to 20% 2380
Commercial Up to 30% 1318
Globally, the anticipated growth in energy demand is on an unsustainable course, and energy efficiency and conservation will play a key role in slowing that growth248. Without focused efforts to reduce the energy consumption by appliances and equipment, residential and commercial building electricity demand will continue to grow rapidly, taxing energy supply and delivery systems, restraining economic growth, and resulting in significant global and local environmental damage249. The need of the hour is to develop more efficient systems and low energy technologies in high energy intensive industries and reduce consumption of energy intensive products. One unit saved avoids 2.5 to 3 times of fresh capacity addition250.
Energy conservation is any behavior that results in the use of less energy. Energy efficiency is the use of technology that requires less energy to perform the same function.
247
http://power.indiabizclub.com/info/energy_conservation 248
e-Journal USA Volume 14/Number 4, U.S. Department of State – “Energy Efficiency: The First Fuel”, April 2009 249
United Nations, Energy Case Studies, Market transformation through energy efficiency standards and labeling 250
Infra line Energy, “Energy Efficiency: Prospects & Issues” sub ref: Asian Development Bank

Electricity 198
Energy Conservation Initiatives
Bureau of Energy Efficiency (BEE)
BEE was set up in 2002 under the Energy Conservation Act, 2001, which aims at an integrated approach to energy conservation. BEE has wide ranging powers to promote the conservation of all forms of energy251. Prior to the Energy Conservation Act, 2001, the Government of India launched a voluntary appliance labeling scheme known as Eco-Mark in 1991. The aim was to increase consumers’ awareness about environmentally friendly products in the market. However, the scheme did not succeed in attracting participation from most manufacturers. Two major reasons cited for the failure of manufacturers to participate were the cost of participation and lack of consumers’ awareness. This scheme was re-launched a decade later as the Standards and Labeling Program to be monitored under the BEE252. The BEE launched Energy Conservation Building Code (ECBC) in 2007. According to BEE statistics, in 2008-09, energy savings generated through measures such as the standards and labeling scheme and green buildings resulted in 1505MW of avoided generation capacity up from 623MW in 2007-08. The target is to achieve 10,000MW in avoided capacity by 2012253. Various schemes launched by BEE are as follows
Standards & Labeling Scheme in 2006 - BEE established a standard and labeling program for eleven household electronic appliances (refrigerators - Frost Free/No-Frost, Tubular Fluorescent Lamps, Room Air Conditioners, Direct Cool Refrigerator, Distribution Transformer, Induction Motors, Pump Sets, Ceiling Fans, LPG, Electric Geysers and Color TV) and is moving to gradually make them mandatory which would then become the de facto minimum efficiency performance standard (MEPS)254.
Energy Conservation Building Code (ECBC) was launched in 2007. The purpose of ECBC is to provide minimum requirements for energy efficient design and construction of buildings and their systems. It is applicable to buildings or building complexes that have a connected load of 500kW or greater or contract demand of 600 kVA or greater. Generally buildings or complexes having an area of more than 1000m2 will fall under this category. The Code defines norms and standards for the energy performance of buildings and their components based on the climate zone in which they are located. It covers building envelope, heating, ventilation and air conditioning system, interior and exterior lighting system, service hot water, electrical power systems and motors. BEE has joined forces with the International Finance Corporation and Alliance to Save Energy, in a large-scale effort to improve the energy efficiency of municipal buildings.
251
India Resident Mission (INRM) Policy Brief No. 6, “Energy Efficiency and Conservation”, 2006 252
Resources for the Future, Discussion Paper, “Options for Energy Efficiency in India and Barriers to their adoption: A Scoping Study”, Soma Bhattacharya and Maureen L. Cropper, April 2010, pp21 253
Power Line, Volume 14-No.3, “Road to Copenhagen”, November 2009; pp. 24 254
Prayas Energy Group, “Factsheet - Scaling-Up DSM to the National Level”

Electricity 199
The Indian government introduced an Energy Conservation Code for commercial buildings in 2007 aimed at cutting their energy consumption by 25 to 40%255.
Star rating for office buildings: BEE launched the star rating for office buildings on February 25, 2009. The star rating program is based on the actual energy performance of a building, in terms of its specific energy usage.
Bachat Lamp Yojana (BLY), launched on February 25, 2009- BLY was launched with an objective of replacing the incandescent lamps and cutting down the price of CFLs. Due to the high price of CFLs, which is 8-10 times the cost of incandescent lamps, CFLs haven’t yet penetrated widely in households across the country. The share of incandescent lamp lighting in both residential and commercial sector is 80%256. BLY is also registered under the Clean Development Mechanism of the Kyoto Protocol part of the United Nations Framework Convention on Climate Change (UNFCC) on April 29, 2010. State level electricity distribution companies that join the program would distribute high quality CFLs at about `15 per piece to their consumers and in return take back a working incandescent lamp.
Agricultural and Municipal DSM – Effective implementation of EC Act by Strengthening Institutional Capacity of State Designated Agencies (SDAs)
Energy Efficiency in Small and Medium Enterprises (SMEs) Scheme
Contribution to State Energy Conservation Fund (CECF) Scheme
Institutional Strengthening of BEE
The benefits of electricity efficiency have been recognized in the 10th and 11th Plans as they both emphasize its importance and outline measures for its implementation. Schemes for promoting energy efficiency in India during the 11th Plan include the Bachat Lamp Yojana (promoting the uptake of CFLs), Standards and Labeling Scheme (covering all basic household appliances as well as motors, variable speed drives and agricultural pump sets), ECBC (for new commercial construction), Agricultural and Municipal DSM Schemes, and others.
National Mission on Enhanced Energy Efficiency
The National Mission on Enhanced Energy Efficiency (NMEE) has been approved as one of the eight missions under the National Action Plan on Climate Change (NAPCC). NMEE aims at rationalizing energy consumption without any adverse impact on economic productivity. The industrial segment which is the largest energy consumer gets a particular focus. BEE is responsible for planning and execution of this mission. In this regard it has already initiated the capacity building exercise required such as building a database of energy consuming industries in the economy257.
255
McKinsey Global Institute, “Fueling sustainable development: The energy productivity solution”, October 2008 256
http://moef.nic.in/downloads/public-information/bachat-lamp-yojana.pdf 257
Power in India, Recent Developments, 2009, pp28
Electricity 200
Performance and achieve trade scheme (PAT) – Market based mechanism to enhance energy efficiency
Market Transformation for Energy Efficiency (MTEE) – which would cover clean development mechanism roadmap, standards and labeling, energy service company (ESCO) promotion and capacity building
Financing energy efficiency – tax exemptions, a revolving fund, and partial risk guarantee fund
Power Sector Technology Strategy – which covers fuel-shifting, focus on new as well as old plants, integrated gasification combined cycle (IGCC) demonstration plants, and development of know-how for advanced super-critical boilers
The Government envisages improvement of energy efficiency of designated consumers under the NMEE. Nine notified energy intensive sectors are being covered in the 1st phase. These sectors include thermal power plants, cement, aluminum, iron & steel, pulp & paper, fertilizer, textile, chlor-alkali and railways. The sector wise energy efficiency targets and the unit-wise specific energy consumption (SEC) production targets for the nine notified energy intensive sectors are proposed to be established in 2011. The implementation period to achieve the specified targets by these designated consumers proposed is three years from the date the norms are established. The monitoring mechanism for designated consumers is also proposed to be ready by 2011. The Government envisages a saving of around 10 million tons of oil equivalent in the energy consumption of the designated consumers from the 9 energy intensive sectors and an avoided capacity addition of 5623MW258.
Even though the Government has ongoing efforts such as standards and labels, and utility DSM programs, the changes in behavior are not rapid enough to ensure maximum efficiency gains. Because rapid implementation of these energy efficiency options will not only have financial and environmental benefits, but will also deliver results much faster than building GW power plants, it will reduce power shortages and achieve significant public benefits259.
Maharashtra Energy Development Agency
Government of Maharashtra has designated the Maharashtra Energy Development Agency (MEDA) as the nodal agency for energy conservation with responsibility to coordinate, regulate and enforce the provisions of the EC Act in Maharashtra. In 2003, MEDA established a separate department for Energy Conservation. An action plan was drafted with the aim of peak demand saving of 1000 MW energy by 2012.
To provide guidance to MEDA on Energy Conservation Policy matter, Government of Maharashtra has constituted State Level Energy Conservation Committee under chairmanship
258
Government of India, Ministry of Power, Rajya Sabha Question No 432 Answered on 26.04.2010 National Mission for Enhanced Energy Efficiency 259
Prayas Energy Group, “Factsheet - Energy Saving Potential of Indian Household Appliance”

Electricity 201
of Principal Secretary (Energy) in 2005. MEDA has developed 11 energy conservation programs to be implemented in cooperation with relevant state government agencies and private sector.
1. Home Bright: Residential high efficiency lighting program (Replacement of Incandescent Lamp by Compact Fluorescent Lamp (CFL))
2. Agricultural Efficiency: Energy efficiency improvement in agriculture (installation of Capacitors)
3. Bright Streets: Municipal Street Lighting Program using advanced technology 4. Municipal Energy Efficiency program: Improvement of energy efficiency in municipal
pumping and street lighting 5. SME Program: Energy efficiency improvement in small and medium enterprises 6. Public Buildings Partnership Program: Energy efficiency implementation in public
buildings using ESCOs as the implementing mechanism 7. Green Buildings Program: Cooperate with existing Green Buildings Center; construct one
or two new Green Buildings in Maharashtra 8. Solar Water Heating: Solar Water Heating Program 9. Work Bright Program: Commercial High-Efficiency Lighting Program 10. Motor RE-Power: High Efficiency Motor Rewinding Program 11. EE Financing: Financing of energy efficiency improvement using the Energy Conservation
Fund. 12. Awareness program: Awareness on Energy Conservation and Electrical Safety
MEDA also provides financial assistance to eligible organization for carrying out energy audits at their facilities through empanelled consultants. This promotional activity initiated by MEDA covered industries, commercial buildings and government/ government undertakings/ local self-government buildings/ MIDC. The details are tabulated in Annexure VIII260. MEDA also receives central and state grants for various conservation programs which are provided in Annexure VIII.
Several schemes have been introduced by the central and state governments for conserving electricity improving energy efficiency. It is necessary to undertake evaluation of the schemes that have been implemented till date. This would provide a better understanding of the energy saved due to energy conservation and efficiency measures taken by the government and would further help in forecasting new power addition requirements. It would be necessary to find out that of the various schemes launched how many of them have reached the end user? Has labeling promoted the purchase of more efficient appliances? How have the old appliances (non – starred) been phased out, or are they available for sale?
260
Save Energy Program (Financial assistance for carrying out energy audit) [Valid from 1sstt July 08 to 31sstt March 10]

Electricity 202
Energy Savings across Sectors
Total electricity consumption in Maharashtra during 2010-11 was 87,397 mkWh. Electricity consumption for various sectors for the years from 2004-05 to 2011-12 is tabulated below. As can be seen for the years tabulated below, industry is the largest consumer of electricity with an average consumption of 40% followed by domestic (22.81% average consumption) and agriculture (18.38% of average consumption). These three sectors account for 80% of the total electricity consumption in the state.
Table 65 - Electricity Consumption across sectors (mkWh)261
Category 04-05 05-06 06-07 07-08 08-09 09-10 10-11 11-12*
Industry 22515 25692 26535 30323 28850 30866 34416 26687
% consumption 40.43 43.33 42.74 43.42 39.52 39.00 39.38 37.13
Domestic 12916 13572 14284 15553 16878 18171 19547 16484
% consumption 23.20 22.89 23.01 22.27 23.12 22.96 22.37 22.94
Agriculture 10733 11094 9749 12676 12733 13925 16257 15515
% consumption 19.27 18.71 15.70 18.15 17.44 17.60 18.60 21.59
Commercial 5420 4841 6940 6661 9102 10546 11571 9047
% consumption 9.73 8.17 11.18 9.54 12.47 13.33 13.24 12.59
Administrative Purposes
Public Works 2174 2148 2272 2520 2560 2658 2310 2260
Railways 1850 1861 1987 2024 2110 2119 2707 1657
Miscellaneous 76 79 318 82 761 854 589 217
TOTAL 55684 59287 62085 69838 72994 79139 87397 71867
% change 6.5 4.7 12.5 4.5 8.4 10.4 * Upto December 2012
Energy Savings in the Domestic sector
Domestic electricity use accounts for a major impact on electricity demand because of complex attitudes towards use of electricity. New appliances are being added in the market, but their efficiency is not checked at the consumer end, due to lack of awareness and apathy towards energy savings.
The average growth in power consumption in domestic sector from 2004-05 to 2010-11 is 7%.
261
Government of Maharashtra, Department of Planning, Directorate of Economics and Statistics: Economic Survey of Maharashtra 2005-06 to 2011-12

Electricity 203
Figure 61 - Power consumption in domestic sector
Energy consumption by various household appliances is given below. It can be seen from the figure that lighting requirements consume maximum (20%) electricity followed by refrigeration followed by air conditioners. Major part of the consumption comes from fans, lighting, refrigerators, and televisions (active mode). A part of the consumption is contributed by ACs, air coolers, electric water heater, and stand-by power (including Set-Top-Boxes, DVD Players, TVs, and Computers). These nine appliances account for almost all the total consumption. The figure below graphically represents the consumption of nine household appliances. Out of these, only four end uses viz. lighting (incandescent bulbs and tube lights), fans, refrigerators and television sets contribute 80% of household consumption.
Figure 62 – Consumption of electricity in domestic sectors

Electricity 204
With living standards rising, it is inevitable that the number of appliances in the market will inevitably and continuously increasing. Consequently introducing energy efficient appliances in the household sector is an important alternative to decrease the need for increasing generation capacity. This will make the society less dependent on fossil fuels and would also have an impact in reducing emissions of carbon dioxide into the atmosphere262.
The focus of energy conservation is on five end uses viz. a) lighting, b) cooling, c) televisions, d) refrigeration and e) water heating. Energy conservation has been calculated for each of these end uses by replacement of conventional appliances with energy efficient ones (Table placed in Annexure IX).
The parameters considered for calculation are
Power consumption
Hours of Operation - daily, monthly and yearly
Number of appliances per consumer
Number of consumers
If new sales are restricted to energy efficient appliances for use in households, around 25% energy could be saved. The potential for energy conservation in the domestic sector is 20% that results in avoided capacity of 570 MW263. The energy that would be saved by transition to energy efficient appliances is tabulated below264.
Table 66 – Energy savings from energy efficient household appliances
Appliance Standard (W)
Energy Efficient (W)
Saved Watts (W)
Savings (%)
Tube light 36 28 8 22.2
Incandescent Lamp 60# 20# 40 66.7
Fan 70 55 15 21.4
Air Conditioner 2300 1900 400 17.4
Refrigerator 130-140 90-100* 45 36.0
Television 90 50 40 44.4
Geyser(boiler) 2500 0** 2500 100.0
Total saved watts 3033
# 60W bulb is in use at large while 40W bulb is used on few instances. 20W CFL would replace the standard 60W bulbs. * Operating wattage of the refrigerator. ** 100% savings as electric water heaters and geysers would be replaced with solar heaters.
262
Resources for the Future, Discussion Paper, “Options for Energy Efficiency in India and Barriers to their adoption: A Scoping Study”, Soma Bhattacharya and Maureen L. Cropper, April 2010 263
Calculations based on energy consumption across urban and rural consumers in Maharashtra 264
Energy efficient appliances calculations based on research from documents of BEE and Energy Saving Potential in Indian Household from Improved Appliances, Prayas Energy Group

Electricity 205
Lighting needs
Lighting constitutes a major category of household energy use accounting for 20% of the energy consumption. Compact Fluorescent Lamps (CFLs) and energy efficient tube lights are an efficient alternative to traditional incandescent bulbs for provision of high quality lighting services. As can be seen from the table above, a transition from incandescent bulbs to CFLs will result in two thirds of (66%) energy savings. A 20W CFL can replace 60W incandescent bulb, still giving same amount of illumination. CFLs are more expensive than traditional bulbs, but the payback period is estimated to be 1.2 years, which is cost effective given the longer life of these lamps. The low acceptability of CFLs appears to be due to its high price and lack of warranty265. Use of efficient lighting can result in saving nearly 80-90% of energy savings.
Tube light
The energy efficient tube light that saves 8W, can give relief around of 390 MW in the evening peak.
Incandescent Lamp
Incandescent lamps are used as main lighting source in many rural households and as a secondary source in urban areas. In urban households, incandescent lamps are mostly used in toilets, bathrooms, passageways, backyard, etc. Replacement of all lamps by CFLs can provide relief of 1460 MW from the evening peak.
Energy savings in household lighting - 1850 MW of relief in evening peak hours can be achieved, by switching over to energy efficient lighting in both urban and rural areas of Maharashtra.
Cooling needs
Fan
15W can be saved per fan if the existing fans are replaced by efficient fans with the following improvements266:
Increase the height of the stator and rotor stack.
Using thicker wires (more copper)
Using smaller capacitor which will decrease the top speed of the fan
380 MW of reduction in summer peak can be achieved by using energy efficient fans.
265
Resources for the Future, Discussion Paper, “Options for Energy Efficiency in India and Barriers to their adoption: A Scoping Study”, Soma Bhattacharya and Maureen L. Cropper, April 2010 266
Prayas energy Group, “Fact sheet on ceiling fans”

Electricity 206
Air conditioner
5% consumers can provide a relief of 160 MW in summer peak, by switching over to BEE star labeled air conditioners.
Energy savings in cooling (fan + Air conditioner) - Around 540 MW of relief can be obtained in the summer peaks.
Refrigeration
More efficient direct-cool refrigerators have a payback period of less than 3 years; more efficient frost-free refrigerators have a payback period less than 2 years. The more efficient direct cool refrigerators result in energy savings of 49%.
Though the energy labeling programs and star ratings have been introduced by BEE, there is lack of awareness among the consumers and the implementation process is slow. It is necessary to phase out inefficient cheap appliances from the market.
Energy savings in refrigeration - Around 114 MW round the clock relief can be achieved (Considering one refrigerator per two households).
Television
Televisions constitute 18% energy consumption in households. Nearly 44% energy can be saved by switching over to energy efficient televisions.
Energy savings in television - 366 MW of relief can be achieved by moving to energy efficient televisions.
Water heating
The energy efficient solution in this regard is to replace conventional electric water heaters and geysers in a phased manner and make way for solar water heating. Many consumers have already switched over to solar water heating due to rising cost of electricity. Replacement to solar water heaters needs to pick up rapid pace.
Energy savings in water heating - Considering 10% consumers in Maharashtra use geyser for water heating, replacement to solar water heater can provide a relief of 2000 MW in morning peaks.

Electricity 207
Urban and Rural Domestic Electricity Savings and Peak Demand Relief
There is a remarkable difference in the energy requirement of urban and rural domestic consumers. With increasing urbanization, standard of living of population in urban centres, energy requirements in urban areas is higher than that in rural areas, and also not all households in rural areas are electrified whereas almost all the households in urban centres are electrified. Energy savings in both urban and rural areas is tabulated below based on the above criteria, by considering around 56% of the 143 lakh MSEDCL domestic consumers as urban and 44% as rural267.
Table 67 - Domestic consumers of MSEDCL
Urban Rural
MSEDCL consumers 8000000 6300000
Table 68- Urban electricity savings
Appliance
Total Units saved/year
(MU)
Peak Demand Relief (MW)
Summer Morning Evening
Tube light 561 256
Incandescent Lamp 350 960
Fan 788 240
Air Conditioner 117 160
Television 526 240 (afternoon & evening
Refrigerator 1000 114 (RTC)
Geyser (boiler) 365 2000
Total 3707
Table 69 - Rural electricity savings
Appliance
Total Units saved/year (MU)
Peak Demand Relief (MW)
Summer Morning Evening
Tube light 241 132
Incandescent Lamp 920 504
Fan 466 142
Television 276 126 (afternoon & evening)
Total 1903
267
Government of India, Ministry of Home Affairs, Census of India, 2011

Electricity 208
A significant impact of energy efficient appliances can be seen in the peak load relief that would be obtained daily.
Energy savings potential in domestic energy savings in urban and rural areas
In both rural and urban areas of Maharashtra, demand relief of around 2500 MW would be achieved in summer, while in monsoon and beginning of winter as demand is less, a relief of 1500 MW would be achieved. Energy saving lighting appliances have a potential of saving more than 2500 MW in the evening.
Energy Savings in the Industrial sector
There are 32,178 units under MIDC area having investment of around Rs.37025 crore employing almost 820,723 people. Small and medium enterprises (SME) form a vital part of the industrial sector and represent nearly 40% of the country’s GDP268. Power consumption by industries has increased on an average by 8% from 2004-05 to 2010-11. The graph below shows power consumption of industries over the years from 2004-05 to 2010-11.
Figure 63 - Industrial electricity consumption (2004-05 to 2010-11)
268
http://www.mahaurja.com/PDF/SMEProgram.pdf

Electricity 209
The industrial sector is the largest consumer of energy, consuming 40% of the energy generated. It can be seen that energy consumption has decreased by 5% in the year 2008-09, which can be attributed to various factors like economic recession and also a shift to captive power plants due to power shortages and higher tariffs. Power shortages impact industries not only by way of loss of production and earning, but also in terms of huge investments made by users on standby systems.
The cost of energy constitutes a significant proportion of the production costs in several industries such as fertilizer, chlor-alkali, steel, aluminum, etc. As a result, managing energy costs becomes important for these industries to not only reduce energy expenditures but to also improve their overall productivity and competitiveness. Table below shows the energy costs as a proportion of the total production costs across key industries269.
Table 70– Share of electricity in the total production cost
Industry Share of energy in total production costs (%)
Aluminum 30 (rolled products), 40 (metal)
Cement 29-61
Chemicals 5-15
Chlor alkali 50-65
Fertilizer 65-87
Integrated steel 30-35
Paper and pulp 20-22
The chlor-alkali industry is the most energy intensive industries – it manufactures caustic soda for almost every other industry as a strong chemical base. This industry utilizes mercury in large amounts, although it has been prohibited from 1991 for use in industries by CPCB. The high energy cost (between 65 and 87%) of fertilizer industry is because the industry uses gas/naptha/furnace oil/low sulphur heavy stock not only as an energy source but also as process input.
Steel, cement and aluminum industries are required to maintain a continuous manufacturing process, so power is one of the most critical inputs for these industries. Any power interruption leads to loss of production, additional fuel consumption and wastage of energy. As can be seen from the table above, energy costs represents more the 10% of the production costs, these enterprises should consider conservation efforts. Most of the industries had also opted for captive power generation due to power shortages and power quality problems such as voltage fluctuations, frequency variation, generation spikes, surges and sags, etc. The quality of grid supply is a major cause of concern for most of the industrial consumers as power quality problems result in damage to equipment besides leading to downtime and production losses.
269
Captive Power in India, India Infrastructure Research, “Captive Economics”, pp. 76-77

Electricity 210
These result in significant problems not only in manufacturing industries but also in office buildings, malls, hospitals, hotels, etc. that rely on grid power270. The installed capacity of captive power plants in the state was 1273.209 in the 2005-06 which grew to 2926MW up to March 2010. Economic output is influenced by the size of the electricity savings and rate of penetration of energy efficient technologies, and that of self-generation equipment and inverters used by businesses faced with electricity cuts271.
There are thousands of industrial processes, each depending upon a different amount and mix of energy for a variety of services (e.g., motor drive, process heat, steam and electricity generation, electrolysis, and product feed stocks). Moreover, industries vary greatly in their overall level of energy use, because of differences in industry scale and energy intensity. Unlike the domestic sector where replacement with energy efficient appliances saves energy, the industrial sector will have to undertake varied measures to tap the energy saving potential. The industrial sector nevertheless has a huge energy saving potential. It is possible to conserve energy through use of energy conservation measures, which include energy savings potential for motors, lighting, heating and ventilation systems, and industrial processing. Energy saved would result in economic benefits through reduced power consumption from the grid and the saved power can be used effectively in areas facing power shortages. Moreover this would also increase the revenue of the utilities as power would be wheeled to other companies. Industries in spite of knowing the benefits of energy efficiency consider it as a burden272.
Table 71- Energy savings potential of SME clusters in Maharashtra273
Cluster Location
Cluster type
Total Units listed (nos.)
Estimated Total Energy Consumption
% Savings potential assessed
Annual energy saving Potential assessed
Bhandara Rice Mills 160 16.52 MU 10 1.65 MU
Jalgaon Dall Mills 160 23. 49 M U 10 2.35 M U
Pune / Kolhapur
Dairy Units 102 12460 TOE/ 42 MU
10 1250 TOE/ 4.2 MU
Ichalkaranji Textile Units -Sizing & Processing
183 113760 TOE / 39.12MU
10 11400 TOE/ 4 MU
Power Looms ~ 1.5 lakh 690 MU 5 34.5 MU
Total 46.7 MU/12650 TOE
270
Captive Power in India, India Infrastructure Research, “Captive Economics”, pp. 76-77 271
Lawrence Berkeley National Laboratory, International Energy Studies Group, “Eliminating Electricity Deficit through Energy Efficiency in India: An Evaluation of Aggregate Economic and Carbon Benefits”, Jayant Sathaye and Arjun Gupta, April 2010 272
Mahratta Chamber of Commerce Industries and Agriculture, Energy Audit 273
Government of India, Ministry of Power, Bureau of Energy Efficiency, State-wise Electricity Consumption & Conservation Potential in India (prepared by National Productivity Council)

Electricity 211
BEE has set targets for 478 commercial business units (including Reliance industries, Vedanta group, NTPC, Hindalco) that account for 1/3rd of 500 million tonnes of oil equivalent (MTOE) of energy consumption in the commercial sector. These units from eight sectors (iron and steel, chlor-alkali, cement, fertilizers, aluminium, pulp and paper, textile, TPS) consumed 166 MTOE of energy in 2009-10. The limit for electricity consumption is set for electricity consumed per unit of the product274.
Table 72 - Energy savings potential in energy intensive Industries275
Industry Conservation potential (%)
Pulp and Paper 25
Textiles 20-25
Sugar 20
Glass/ ceramics/ Ferrous foundry 15-20
Fertilizer 10-15
Petrochemicals 10-15
Cement 10-15
Iron and steel 8-10
Aluminum 8-10
Refineries 8-10
Chlor alkali 10-15
Ferro alloys 8-10
Initiatives by MEDA
MEDA has provided the following measures to conserve energy in industries276:
1. Conduct regular energy audits. 2. Plug all oil leakages. 3. Avoid incomplete combustion of fuel. 4. Keep insulation on the furnace walls to save heat, use optimum thickness insulation. 65
mm thick insulation on a 115 mm thick furnace wall can reduce the heat loss by 66%. (2650 Kcal/m2 down to 850 Kcal/m2)
5. For boilers, Always check the soot deposits – a meager ‘3 mm’ layer of soot on the heat transfer surface consumes 2.5% extra fuel. Stop steam leakage – a single instance of a ‘3 mm’ hole on a steam pipe carrying steam at rate of 7 kg/cm2 would waste 32 kilolitre of fuel every year.
274
http://www.business-standard.com/india/news/govt-issues-mandatory-energy-norms-for-firms/469691/ 275
Infra line Energy, “Energy Efficiency: Prospects & Issues”, sub ref: ADB and MEDA http://www.mahaurja.com/PDF/POTEcon.pdf 276
http://www.mahaurja.com/PDF/TipIS.pdf

Electricity 212
6. Refrigeration and Air conditioning - Utilize waste heat of excess steam or flue gases. 7. Proper selection of pump according to pumping requirement, and proper insulation,
alignment, installation of pump is also important. 8. Cooling towers in thermal power plants - Installation of automatic on-off switches for
cooling tower fans can save 40 % on electricity use.
Energy audits in industries
Periodic energy audits are mandatory for power intensive industries, under the Energy Conservation Act, 2001. MEDA has empanelled a group of energy consultants and auditors and has assisted industries and businesses in identifying energy efficiency opportunities by subsidizing energy audits. Till 2009, 475 energy audits have been conducted.
Table 73- Achievements of the Energy Conservation Program277
Particulars Cumulative achievement (up to
March 31, 2008)
Achievement (in 2008 -09)
Cumulative achievement (up to
March 31, 2009)
Energy Audit (Nos) 445 30 475
Replacement of CFL at Gram Panchayat
2505 6008 8510
Waste Heat Recovery 0 6 6
Measures to be adopted for energy savings in few energy intensive industries
Cement industry278
Comprehensive energy audits
Waste heat recovery
Use of Vertical Roller Mill (VRM) in the place of conventional ball mill.
External re circulation systems for VRM
Installation of pre-calcinators
Use of Variable Frequency Drive (VFD) and Variable Speed Drive (VSD)
Computerized maintenance system and Inventory Control
Fertilizers industry279
Replace process equipment with high efficiency models
Improve process controls to optimize chemical reactions
Recover ‘process’ heat
Maximize waste heat recovery
277
http://www.mahaurja.com/PDF/CummAchv.pdf 278
http://www.industry.siemens.com/datapool/industry/industrysolutions/cement/en/Cement-production-en.pdf 279
http://www.sswm.info/sites/default/files/reference_attachments/GELLINGS%20et%20al%202004%20Energy%20Efficiency%20in%20Fertiliser%20Production.pdf

Electricity 213
Paper industry280
Type of raw material used
Size and vintage of the plant
Variety mix
Comprehensive energy audits
Waste heat recovery
Installation of pre-calcinators
External re circulation systems for VRM
Use of Variable Frequency Drive (VFD) and Variable Speed Drive (VSD)
Use of Vertical Roller Mill (VRM) in the place of conventional ball mill.
Computerized maintenance system and Inventory Control
Energy savings potential in industries
The industrial sector overall has energy saving potential of 25% which means avoided capacity of 970MW281.
Energy savings in Agricultural sector
Agricultural pumping consumes a fifth of electricity use in India. Political decisions made in individual states in the 1970s to provide subsidized electricity, and in the 1980s and 1990s to provide virtually free electricity for irrigation have had long-term negative impacts on the electricity sector as a whole. Since meters were removed during this period, agricultural rates in India for majority of agricultural consumers are based on the pump size, not metered consumption. This has created several inefficiencies in the entire system – pumps are inefficient, price signals for crop selection are limited, water tables are falling rapidly, and poor farmers who do not have access to irrigation face water scarcity. The effective subsidy, though
280
http://ies.lbl.gov/iespubs/41843.pdf 281
Calculated based on industrial consumption
1kWh saved at user end for normal industrial use is
Saving of Rs. 30,000/- per year @ `5.5 per kWh and 5500 hours per year use saving 4500 kg of coal per year at power use
5T CO2 emissions released to atmosphere per year

Electricity 214
partially compensated by the government, contributes to the financial plight of the electricity companies282.
In Maharashtra too, the state utility (MSEB, now unbundled) suffered the same plight. Around 1977-78, MSEB started charging its consumers on a flat rate fixed on the basis of the pump capacity (horsepower) rather than actual metered consumption. During the time, number of agricultural consumers and the volume of electricity used by them were quite small. So the decision to stop metering their electricity consumption did not prove disastrous. The subsequent years saw a rapid increase in the number of agricultural pumps and also in their electricity consumption, which still was not metered. In the same period, like other SEBs, MSEB too suffered from various distortions such as technical incompetence, financial mismanagement, administrative lethargy, political interference, electricity theft and increasing arrears283. Energy audit conducted by BEE at Solapur brought forward the fact that for most of the unmetered consumers connected HP is much more than the sanctioned HP. This contributes to commercial losses for MSEDCL.
There is a strong nexus between electricity, water and agriculture. Since agricultural sector is provided with electricity at far cheaper rates which leads to exploitation of ground water resources. This not only creates stress on the water table but also is highly energy intensive. Energy intensity of pumping is increasing further because of falling water table. Groundwater potential for irrigation pump sets is such that it can sustain 2.4 million pumps. But, in reality 150% of sustainable pumps have been energized, as a result they suck out 50% more groundwater. If energized pumps draw groundwater beyond safe limits, the very purpose of energizing pumps will get defeated as there will be no water to draw.
Figure 64- Consumption by agriculture sector (2004-05 to 2010-11)
282
An Overview of Indian Energy Trends 283
Prayas Energy Group, “Privatization or Democratization: The Key to the Crises in the Electricity Sector - The Case of Maharashtra”, 2001

Electricity 215
In the year 2010-11, the agricultural sector consumed about 17% of the total energy generated. Agricultural power consumption from 2004-05 to 2010-11 is depicted in the graph above.
A simple method to conserve energy in agriculture sector is using BEE star labeled pump sets.
5 HP pumps can be replaced by 3.7 HP pumps,
3 HP pumps by 2.2 Hp pumps.
These replacements can save 2800 MU of electricity, and give a load relief of around 580 MW from 2200 to 1400 hrs.; the hours for which energy for pumps is available according to Agricultural Load Management (Ag LM) scheme. Energy savings in the agriculture sector has been calculated by considering 3.6 million284 energized pumps in Maharashtra. Around 16% electricity could be saved by shifting to energy efficient pumps.
Table 74- Average savings in Agriculture sector
Unit Currently used pump
rating
Energy efficient pump
Currently used pump
rating
Energy efficient
pump
HP 5 3.7285 3 2.2
kW 3.73 2.76 2.24 1.64
hrs./day 8286 8 8 8
hrs./yr 2000 2000 2000 2000
units/yr 7460 5520 4476 3282
saving 1940 1194
No. of energized pumps 1800000 1800000 3600000287
Total energy savings (MU) 3490 2150 5640
Demand Relief (MW) 1175
Parameters affecting pump set efficiency performance:
Improper pump selection and usage
Undersized pipes
Suction head Variations and large discharge lengths
Inefficient foot valves and piping system
Motor rewinding and low voltage profile
Water table variations
284
Government of Maharashtra, Department of Planning, Directorate of Economics and Statistics: Economic Survey of Maharashtra 2011-12, Ch.9 Infrastructure 285
Prayas Energy Group, Agricultural Pumping Efficiency in India http://mahadiscom.com/emagazine/nov05/agri_pumping_eff_in_india.pdf 286
As per the Ag-LM (Agricultural Load Management) scheme, only 8 hours of power is supplied to agricultural pumps, as pumps are not needed to be run for 24 hrs. 287
Government of India, Ministry of Power, Central Electricity Authority, Progress Report, Pump set Energization
Electricity 216
Analysis of the agricultural electricity supply system shows that a program replacing two components, undersized pipes and high friction foot valves, can save the utility company Rs.2.1/kWh due to reduction in fuel use and other short-run costs, even assuming a zero agricultural electricity tariff288.
Initiatives by BEE
BEE has prepared an Agricultural DSM (Ag DSM) program in which pump set efficiency upgradation could be carried out by an Energy Service Company (ESCOs) or the distribution company. The Ag-DSM program for preparation of DPRs has already been initiated by BEE as pilot projects in 5 states viz. Maharashtra, Gujarat, Haryana, Punjab & Rajasthan. One DPR in Solapur district of Maharashtra is ready for implementation purpose. The result of the study is encouraging with the saving potential of 40% by replacement of inefficient pumps with Star rated pump sets. BEE is also developing a methodology for CDM in Ag-DSM project so that it becomes more attractive. The implementation for replacement of inefficient pumps with Star rated pump sets will be done through the ESCO/Utility who would invest in energy efficiency measures on a rural pump set feeder on which supply quality enhancements (such as feeder segregation & High Voltage Direct Supply [HVDS]) have already been carried out. The intervention would lead to lower energy supply on the feeder, and hence, could result in lower subsidy to be paid by the State Government. Part of the savings in the subsidy would be paid to the ESCO/Utility on an annual basis, over a period of time, to pay for their investment in pump set upgradation289.
Energy savings potential in agricultural sector
Demand relief of around 1175 MW would be achieved.
Energy Savings in Buildings
Buildings account for over 40% of the world’s energy use and the resulting carbon emissions are more than those in the transportation sector. Energy efficient buildings represent one of the primary opportunities to reduce electricity consumption and resulting carbon emissions and create new jobs290. The construction sector in India is witnessing a fast growth due to several factors. Some of the key growth drivers are, increased demand for housing, strong
288
Implementing End-use Efficiency Improvements in India: Drawing from Experience in the US and Other Countries, Lawrence Berkeley National Laboratory, 2006 289
http://www.bee-dsm.in/PoliciesRegulations_1_4.aspx#TOP 290
Green buildings, climate change, energy security and the current economic crisis

Electricity 217
demographic impetus, expansion of organized retail, increased demand for commercial office spaces by multinationals and IT sector and setting up of SEZs291.
The building sector in India represents about 33% electricity consumption, with commercial and residential sector accounting for 8% and 25% respectively292. The commercial and residential sectors continue to be a major market for the construction industry. The sectors consume a lot of energy throughout the life cycle of buildings and thus becoming a major contributor to greenhouse gas emissions. The demand for air conditioning and other appliances in the residential and commercial sectors is likely to push electricity demand to high levels, straining the sector as a whole293.
India’s building and construction sector has seen unprecedented growth post liberalization. Commercial and residential building types constructed in western style with absolute disregard to context and climatic conditions led to a steady increase in building energy consumptions. The building trends ever since, have involved the use of high embodied energy materials such as aluminum and steel, extensive external glazing systems, leading to increased heat gains and consequently use of extensive refrigeration based space-conditioning systems, electrical appliances, etc. To cater to the increased demand for such equipment in the increasing urban settlements, more industries were set up to manufacture and provide such appliances, etc. Increasing travel times due to increased fringe development and satellite towns led to a sudden explosion in the transport sector as well, with unparalleled growth in the automobile sector and increased demand for petroleum and diesel. The current state of an overburdened energy infrastructure may be traced using the same route.
The first government initiative towards energy efficiency was when the Indian parliament passed the Energy Conservation Act, 2001 that led to the establishment of the Bureau of Energy Efficiency and kick started the formulation of the ECBC as India’s first effort towards energy efficiency in buildings. ECBC aims to reduce India’s baseline energy consumption by supporting adoption and implementation of building energy codes. It takes into account location and occupancy of the buildings and provides minimum standards for reducing energy demand of the buildings through design and construction practices while enhancing occupants’ comfort.
ECBC has both prescriptive and performance-based compliance paths. The prescriptive path calls for adoption of minimum requirements for the building envelope and energy systems (lighting, HVAC, service water heating and electrical). The performance-based compliance path requires the application of Whole Building Simulation Approach to prove efficiency over base building as defined by the code.
291
http://high-performancebuildings.org/pdf/HighPerformanceCommercial%20Buildings.pdf-High performance Buildings in India 292
ECBC User Guide, pp1 293
Prayas Energy Group, An Overview of Indian Energy Trends

Electricity 218
For the purpose of ECBC, the definition of a building is as mentioned in the Energy Conservation Act, 2001, i.e. any structure with a connected load of 500kW or contract demand of 600kVA and intended to be used for commercial purposes. The code is also applicable to all buildings with a conditioned floor area of 1,000 m2 (10,000 ft2) or greater. The code is recommended for all other buildings.
Most commercial buildings have energy performance index (EPI) of 200 to 400 kWh/sq.m/year. Energy-conscious building design has been shown to reduce EPI to 100 to 150 kWh/sq.m/year in India.
Centre for Environmental Science and Engineering (CESE), IIT Kanpur reduced the EPI from 240kWh/m2 to 98 kWh/m2 through implementation of ECBC.
Figure 65-Reduction of WPI in building after applying ECBC294
Green buildings
Population in the cities will increase in the coming decades. A report by McKinsey cites that Maharashtra will be in the top five states that will be have more population living in the cities than in villages (figure 6). This will lead to an increase in housing requirements in cities, so buildings that will house large occupants will have to be constructed. Also buildings for commercial and industrial purposes will increase. This will evidently create pressure on the available resources required to construct and operate a building. Buildings have major
294
http://www.indiaworldenergy.org/brochure/ECBC.pdf

Electricity 219
environmental impacts over their entire life cycle. Resources such as ground cover, forests, water, and energy are depleted to construct and operate buildings.
Figure 66 - Urbanization in India
In order to reduce the pressure on resources, green buildings need to be designed. Green buildings are not to be equated with energy savings. Reducing energy use is indeed one critically important aspect of sustainability. Green buildings, in comparison to traditional buildings reduce environmental footprints while still enhancing the indoor environmental quality (IEQ) for the occupants. Green signifies “getting more with less” i.e. more quality of life for building occupants by using less resources. Any building may be built or remodeled with improved green characteristics.
A great deal of effort is placed in achieving sustainable development in the construction industry with the aim of reducing energy consumption in both construction and management of buildings, thereby limiting its consequences on local and global environment. Building green can involve many facets, but the main objectives include efficient use of land and energy, water
A green building is one which uses less water, optimizes energy efficiency, conserves natural resources, generates less waste and provides healthier spaces for occupants, as compared to a conventional building
Indian Green Building Council

Electricity 220
conservation, improved indoor air quality, and resource conservation, primarily by using recycled & regional materials.
In India there are two major rating systems the LEED and GRIHA.
LEED (Leadership in Energy and Environment Development) Rating system
The LEED-INDIA Green Building Rating System is a nationally and internationally accepted benchmark for the design, construction and operation of high performance green buildings. It is run by the Indian Green Building Council (IGBC). Its certification scheme addresses all types of new commercial buildings. At present IGBC offers following exclusively dedicated programs for environmental ratings of the buildings:
(i) IGBC Green Homes Rating System (for residential sector) (ii) IGBC Green Factory Building rating system (for industrial buildings) (iii) LEED India for New Construction (To help in guide and design High Performance Green
Building) (iv) LEED India for Core & Shell (IT Parks)
Green Rating for Integrated Habitat Assessment (GRIHA) Rating System
Keeping in view Indian agro-climatic conditions and in particular the preponderance of non AC buildings, a National Rating System viz. Green Rating for Integrated Habitat Assessment (GRIHA) was developed by TERI and the Ministry of New and Renewable Energy. GRIHA has derived inputs from the codes and guidelines developed by the Bureau of Energy Efficiency, MoEF (Ministry of Environment and Forests), Government of India, and the Bureau of Indian Standards. It is now adopted as National Green Building rating system. It is also developed on a point based scoring system to evaluate buildings on “Green Scale”295.
Energy savings potential in buildings
Energy savings potential is in the range of 20% - 50%.
If energy efficiency measures are implemented at the design stage, the potential for energy savings is 40-50%.
For existing buildings, the potential can be as high as 20-25% which can be achieved by implementing housekeeping and retrofitting measures.
295 http://www.nistads.res.in/indiasnt201011/T3_Industry/Status%20of%20Green%20building%20Sector%20in%20India.pdf

Electricity 221
Conclusion
Energy conserving household appliances can save 2000 MW
Energy conservation initiatives in industrial sector can save 970 MW
Savings in agriculture 1175 MW
Energy efficiency in commercial buildings (green buildings) can save 25% of commercial energy consumption
Domestic and agriculture sectors alone can save 11250 MU of electricity (5% of the total consumption)

Electricity 222
Integrated Energy Resource Management

Electricity 223
Energy savings in the four thrust areas is analyzed quantitatively. Two scenarios are highlighted viz. Scenario 1- Business as Usual (BAU) and Scenario 2 - 'Integrated Energy Resource Management (IERM). In BAU scenario works in continuing with present trends of inefficient power plant performance, losses in transmission and distribution, slow pace of renewable energy generation and aversion to energy conservation.
The IERM scenario takes the BAU as the starting point but explores the four thrust areas to the fullest extent.
a. Operating power plants with maximum efficiency, b. Introducing computerization and 100% metering, introducing innovative technologies
like Smart Grid in T&D sector, c. Promoting R&D and fast track implementation in renewable energy sector, and d. Taking extraordinary efforts in inducing energy conservation across economic sectors.
IERM scenario
It will be of great importance to analyze the four thrust areas together quantitatively. We have seen the qualitative and quantitative analysis separately for each of the sectors. It is necessary to achieve a constructive confluence of improvement in these four key areas with inclusive growth.
Achieving maximum power plant efficiency and reducing losses in T&D are factors that are in consonance with the existing infrastructure. Even though efforts have been made constantly to improve performance in these sectors for the past several years, the result has not been satisfactory.
In the renewable sector, hydro power has been exploited for a long period of time. First hydropower plant was set up in Maharashtra in 1915 by Tata group. Wind energy has been in generation in the past, but solar power generation has just been introduced in the energy generation market. Solar power generation sector is yet to pick up pace due to high cost and operating efficiencies. The government has opened lucrative gateways for private enterprises in the renewable sector which will help renewable energy economy gain momentum.
The concept of conserving energy is yet to seep into the market and the minds of people. Theoretically it is easy to analyze the benefits of energy conservation, but it is equally hard to realize profits. Introducing energy conservation measures across economic sectors poses a major challenge as compared to the other three thrust areas.
A ten year time period has been considered for the transition from BAU to IERM scenario. It is assumed that till 2025, power plants will operate with excellent PLF, T&D losses will be negligible, renewable energy will have a substantial percentage in the energy mix and energy efficient appliances will replace inefficient ones.

Electricity 224
Considering the efficiency of power generation and availability of resources & infrastructure, power generation from coal is the easiest way of power generation. But, in comparison to hydropower and renewable power generation which are a perennial inexhaustible option, power from coal is exhaustible. We can still rely on coal for the coming years in the near future. We shall try to achieve maximum possible generation from sources other than coal, and fill the gap with power from coal as base load power.
The situation that will ensue if every other alternative except coal is exploited to the fullest of its potential is shown mathematically shown in the table below.

Electricity 225
Table 75-Quantitative analysis of IERM Scenario 2025
Business As Usual
Power Plant Performance
T&D Renewables Energy
Conservation
Integrated Energy Resource
Management
MW MU MW MU MW MU MW MU MW MU MW MU Renewables (R) 9744 28948 9744 28948 9744 28948 15000 44676 9744 28948 15000 44676 Conservation (E) 0 0 0 0 0 0 0 0 0 11250 0 11250 Gas (G) 3972 24356 3972 24356 3972 24356 3972 24356 3972 24356 3972 24356 Hydro (H) 3378 13020 3378 13020 3378 13020 3378 13020 3378 13020 3378 13020 Coal (C) 12226 64260 12226 80325 12226 64260 12226 64260 12226 64260 12226 80325 Total Generation (R+C+G+H+E)
29320 130584 29320 146649 29320 130584 34576 146312 29320 141834 34576 173627
Available for consumption (with T&D loss)
97938 25%
109987 25%
117526 10%
109734 25%
106376 25%
156265 10%
Total requirement (Projected Consumption in 2025)
232000 232000 232000 232000 232000 232000
Consumption Deficit in 2025 - To be catered from base load coal power
134062 122013 114474 122266 125624 75735
Generation from coal required (with T&D loss)
178749 25%
162684 25%
127193 10%
163021 25%
167499 25%
84150 10%
Installed Capacity of Coal required (with PLF)
34009 60%
24762 75%
24200 60%
31016 60%
31868 60%
12808 75%
# the generation of electricity from installed capacity has been formulated from the power load factors of the respective sources of generation. For example, wind energy can give a maximum of 30% power load factor, while solar panels can deliver at 10%. For hydropower it is 50% and for gas power generation it is 60%.
Constant values – Current installed capacities from coal, gas, hydro and renewables + proposed capacity addition for gas & hydro power stations + MEDA renewable potential IERM thrust areas Final outcome

Electricity 226
Quantitative analysis of BAU and IERM scenarios in 2025
1. Current installed capacities of thermal (coal gas) & hydro power plants as well as planned installed capacities of gas and hydropower stations are constant values in both scenarios. In the BAU scenario, MEDA potential for renewables is considered. In the IERM scenario however, the renewable potential suggested by MEDA seems underutilized and so a higher potential is considered.
2. The total energy available for consumption would be less than that generated at point source due to losses during transmission and distribution of electricity to the end user, and so T&D loss of 10% is considered in the IERM scenario while 25% in the BAU scenario.
3. Projected consumption of 2025 is calculated on the basis of annual growth (CAGR 7.8%) in consumption of electricity. So there remains a deficit in power supply which needs to be catered.
4. The table above also shows potential energy saving individually calculated for each of the thrust areas. A realistic estimate is considered while improving in power plant efficiency and reduction in losses in the T&D sector, while in case of renewables and energy conservation the estimate is idealistic and ambitious which will take immense effort to materialize.
5. Finally, the outcome is presented in the form of capacity required from coal in 2025. In the IERM scenario, the additive effect of saving in all thrust areas significantly reduces the need of base load generation from coal power.
Constant values in 2025
Current installed capacity of gas power is 1452 MW and comprises 672 MW from Uran power station, 180 MW from Tata power station and 600 MW from RGPPL. With availability of gas, complete utilization of RGPPL will take its installed capacity to 1875 MW (1900 is considered for calculation). Further, the proposed 1220 MW extension to Uran gas power station is taken to be completely realized till 2025.
The estimate of maximum hydropower potential given by MEDA has been considered as final hydropower estimate of 2025, which is 3378 MW.
Capacity of hydropower generation in 2025 - 3378 MW
Capacity of gas power generation in 2025 - 3972 MW
Gas and hydropower are exploited to the same extent in the BAU as well as IERM scenario.
For estimating future base load capacity, current installed capacity of coal power plants is considered.
Capacity of coal power generation in 2012 – 12226 MW

Electricity 227
Figure 67-Schematic Representation of IERM Scenario 2025

Electricity 228
Scenario 1: Business as Usual (BAU)
The BAU scenario assumes that situation of power and current energy policies will broadly continue in 2025 and major efforts to provide sustainable power to all will not materialize. Even though power would be available to all in the BAU scenario, it would be at the cost of available dwindling land and water resources, hence not sustainable.
In the BAU scenario, it is assumed that there will be no improvement in the efficiencies of the coal based power plants. Considering the apathy in the T&D sector and reluctance in investments in innovative technologies, minimal reduction in T&D losses is considered. However, the importance of renewables is not ruled out, but its share in the energy mix is low and the rate of expansion which plays a key role is also low too. Market infiltration of efforts in the energy conservation would be minuscule so it is not considered.
34,000 MW coal based capacity addition required
Consumption in the year 2025 is projected to be around 232,000 MUs (CAGR 7.8%). If the electricity sector follows the present trajectory, the demand supply deficit would be around 134,062 MUs in 2025. Electricity available for consumption from the constants would be less due to higher T&D losses of 25%.
This would require installation of additional base load capacity of 34,009 MW. Due to its abundance, availability in the foreseeable future and low cost, coal has been the primary fuel choice for base load power generation.

Electricity 229
Scenario 2: Integrated Energy Resource Management (IERM)
The IERM scenario builds on the BAU scenario. In addition to applying the same constant values, it explores improved efficiency in each of the four thrust areas. The combined additive effect gives the final outcome.
IERM implies that the final capacity addition can be reduced by deploying smart grid technologies, using efficient electrical equipment and increasing share of renewables. It also focuses on policy measures that encourage energy efficiency through non-technical ways to make consumers’ and producers’ behavior less energy intensive.
12,808 MW additional coal capacity installation required in 2025
Upgrade Power Plant efficiency
Improvement in the PLF of coal fired power plants will bring in maximum saving in the energy required to be generated from coal itself.
24,762 MW of additional coal capacity will be required in 2025
27% of additional coal generating capacity will be saved if PLF of coal fired plants in Maharashtra improves to 75% as compared to 60% in BAU.
Strengthen T&D network
Reduction in transmission and distribution loss to 10% will drastically reduce requirement of electricity from coal fired power plants.
24,200 MW additional coal generating capacity will be required in 2025
28-30% of installed capacity in comparison to the BAU case would be saved. If T&D loss is further reduced to 7-8% as is the case in developed countries, savings in fossil fuel energy generation would further increase.
Increase in green energy
In BAU scenario it is assumed that full potential of renewable energy calculated by MEDA must be utilized. While in IERM scenario, it is recommended that renewable capacity addition be increased twofold than BAU scenario, considering the untapped solar and wind potential which is being identified in phases.
Renewable installed capacity should be elevated to 15000 MW in 2025

Electricity 230
There is extensive potential for expansion of renewables to achieve the scale up. The difference between BAU and IERM is that the latter proposes a higher growth rate. Thus the two steps viz. identifying maximum potential and rapid installation are absolutely necessary.
Maharashtra has already picked up pace in the development of renewable energy. The state is at second position in India in terms of renewable installed capacity after Tamil Nadu296, but as far as actual generation it is at the fourth position297. Utilization of full potential till 2025 will just reduce 1400 MW of coal capacity addition.
Here it is proposed that around 15000 MW be generated through renewable sources by 2025. To reach this proposed capacity, it is necessary to explore and deploy generation from renewables preferably DDG from sources biomass, waste to energy, solar, wind or hybrid renewables. If we extend models like “solar city” to other cities of Maharashtra, renewable power generation could reach 15000 MW, thus proving the claim.
31,000 MW additional coal generating capacity will be required in 2025
Energy conservation
Energy conservation is the most difficult part that the energy sector of Maharashtra faces. Use of energy efficient appliances reduces the domestic consumption of electricity. The most striking example is the use of CFLs in place of incandescent lamps. A 60-W bulb can be replaced by a 15W CFL lamp. This saves a lot of electricity (75%), as can be directly ascertained.
Here, it is not only necessary to manufacture appliances that are highly energy efficient, but there is an equally dire need to educate people the importance of using efficient appliances. Further, the cost of energy efficient appliances is very high compared to normal appliances. These factors have impeded the development of the philosophy of energy conservation.
31,868 MW additional coal generating capacity will be required in 2025
The net benefit of IERM scenario would be avoided cost of electricity generation such as capital cost, fuel cost, operation and maintenance, etc., savings in electricity bills, avoided environmental damage cost due to conservation and energy efficiency measures.
Net benefit = avoided generation cost + savings in electricity bills + avoided environmental damage cost - T&D reduction cost
296
http://www.cea.nic.in/reports/monthly/inst_capacity/aug12.pdf 297
http://www.cea.nic.in/reports/articles/god/renewable_energy.pdf

Electricity 231
Although IERM scenario shows a general pathway, the key lies in rapid implementation. Though macro-level analysis presented in IERM gives a crude estimate, case studies for each of the thrust areas strongly supports the recommendations.
If implemented, these recommendations would incur high initial costs, the benefits of which would be reaped in the long run. Heavy investments would be needed to revamp transmission and distribution network, which will pose a major challenge.
In the areas of green energy and energy conservation, the saving in additional coal capacity is less (3000 MW and 2000 MW respectively). The benefit lies in production of electricity from permanent source of energy and using less electricity per appliance. The ambitious returns and benefits of energy conservation can only be sought with patience.
The four thrust areas would play a significant role in alleviating the state’s electricity deficit. It would reduce government outlay for 60% power capacity expansion. It would also lead to climate change mitigation by reducing carbon emissions.
In IERM, 60% of coal capacity addition will be saved with a combined effort of improvement in power plant efficiency, transmission and distribution, use of energy efficient appliances and scaling up renewable energy potential in Maharashtra.

Electricity 232
Conclusion

Electricity 233
To provide uninterrupted electricity in all pockets of Maharashtra, blindly making capacity additions is not environmentally and technologically suitable solution. Proactive measures are necessary to deal with the challenges faced by this sector. Current energy habits must change in order to reduce significant public health risks, avoid placing intolerable stress on critical natural systems, and to manage the substantial risks posed by global climate change.
We will shift focus from the conventional approach to an integrated one encompassing renewable energy sources, energy efficient technologies, demand side management measure and decentralized systems. We will not rely on a specific technology but will evaluate the circumstances and provide solutions to suit the needs of local population and also create employment opportunities.

Electricity 234
Annexures

Electricity 235
Annexure I - List of Power plants and PPAs in Maharashtra
Existing Power Plants in Maharashtra
Power generating station
Installed
capacity (MW) Power available for use in Maharashtra except Mumbai
MahaGenCo 9943.83
Interstate hydroelectric projects 444.5
RGPPL 740
Tarapur (Nuclear) 393
Central share 5169
Captive Power 908
Renewable 2498
Sub - total 20096.33
Power available for use in Mumbai
Tata & Reliance thermal Power stations 1900
Tata gas power stations 180
Tata hydroelectric power stations 447
Tata renewable energy 82
Sub - total 2609
Grand Total power in Maharashtra 22,766.25

Electricity 236
MahaGenCo Power Plants
Thermal Power Stations
Thermal Power Station
Date of commissioning
Total No. of Units
No. of working units
Unit Capacity (MW)
Total power station capacity
Working capacity (MW)
Average efficiency (%)
Koradi
1974,1975,1976,1977 7 7 4 x 10⁵ 1040 1040 57
1978 1 x 200
1982,1983 2 x 210
Nasik 1970,1971 5 3 2 x 125298
880 630 60
1979,1980,1981 3 x 210
Bhusawal 1968 5 4 1 x 55299 1475 1420 61
1971,1982 2 x 210
2012 2 x 500 -
Paras 1961 4 2 30300 585 500 -
1967 1 x 55301 60
2008302, 2010 2 x 250 -
Parli 1971 7 5 2 x 20303 1180 1130 64
1980,1985, 1989 3 x 210
2007, 2 x 250 -
Khaperkheda 1989,1991,2000,2001 5 5 4 x 210 1340 1340 70
2011 1 x 500
Chandrapur 1983,1984,1985,1986 7 7 4 x 210 2340 2340 59
1991,1992,1997 3 x 500
Total 40 33 8840 8400
298
NOTE - The installed capacity of these units was initially 140MW, but has de-rated to 125MW wef 20-04-2007 vide CEA letter no. CEA/PLG/DMLF/513/(CDHUVARAN)/2007 dated 20/04/2007. The efficiency has been calculated taking into consideration the original installed capacity of 140MW 299
NOTE - The installed capacity of this unit was 62.5MW initially, which was derated to 58 MWand later to 55 MW. So the efficiency has been calculated taking into consideration the old installed capacity. The total installed capacity is therefore 478MW 300
http://www.parastps.co.in/index.php?option=com_content&view=article&id=53&Itemid=58 301
NOTE - The capacity of this unit was 58MW, based on which the efficiency has been calculated. The power generation figures for the new unit of 250MW commissioned in the year 2008 are not available and hence efficiency has not been calculated. 302
http://www.mahagenco.in/investor/pprojects_completion.shtm#parastps 303
NOTE: These two units had an installed capacity of 30MW when installed. The capacity of both the units derated to 20MW from 20/4/2007. The efficiency was calculated prior to the de-rating considering 30MW each-http://www.parlitps.com/about-us.asp

Electricity 237
Gas Power Stations
Power generating station
Installed capacity*
)MW(
Total units
Capacity of units (MW)
Region
Uran Gas Turbine Power Station 612 7 3 x60 (120) 4x10⁸ (432)
At/Post Bokadvira, Taluka Uran, District Raigad
Waste heat recovery 240 2 2 x 120 (240)
Total 852
Hydro Power Stations
Power generating station
Installed capacity*
(MW)
Total units
Capacity of units (MW)
Region
Koyna (Four stages) 1920 16 Pophali, Taluka Chiplun, District Ratnagiri
Koyna State I&II 600 8 4 x 70 (280) 4 x 80 (320)
W. Maharashtra
Koyna State III 320 4 4x80 (320) Konkan
Koyna State IV 1000 4 4x250 (1000) W. Maharashtra
Koyna dam foot 40 2 2x20 (40) Konkan
Ghatghar PSS 250 2 2x125 (250) Nasik (W. Maharashtra)
Bhira Tailrace 80 2 2x40 (80) Konkan
Bhatsa 15 1 1x15 Konkan
Tillari 66 1 1x66 W. Maharashtra
Terwanmedhe 0.2 1 1x0.2 Konkan
Surya 6 1 1x6 Konkan
Surya canal drop 0.75 3 3x0.25 Konkan
Dolwahal 2 2 2x1 Konkan
Radhanagri 4.8 4 4x1.20 W. Maharashtra
Bhatghar 16 1 1x16 W. Maharashtra
Veer 9 2 2x4.50 W. Maharashtra
Pawna 10 1 1x10 W. Maharashtra
Khadakwasla 16 2 2x8 W. Maharashtra
Kanher 4 1 1x4 W. Maharashtra
Dhom 2 2 2x1 W. Maharashtra
Manikdoh 6 1 1x6 W. Maharashtra
Dimbhe 5 1 1x5 W. Maharashtra
Warna 16 2 2x8 W. Maharashtra
Dudhganga 24 2 2x12 W. Maharashtra
Yevteshwar 0.075 1 1x0.075 W. Maharashtra
Karanjwan 3 1 1x3 Nasik (W.

Electricity 238
Maharashtra)
Vaitarna 60 1 1x60 Nasik (W. Maharashtra)
Vaitarna Dam foot 1.5 1 1x1.5 Nasik (W. Maharashtra)
Yeldari 22.5 3 3x7.50 Marathwada
Paithan 12 1 1x12 Marathwada
Majalgaon 0.75 1 1x0.75 Marathwada
Ujani 12 1 1x12 W. Maharashtra
Shahanoor 0.75 1 1x0.75 Marathwada
Wani 1.5 1 1x1.5 Marathwada
Total 2606.83

Electricity 239
Private Power Projects in Maharashtra
Hydro Electric Projects (Power for Maharashtra)
Power generating station/ Name of company
Total installed
capacity (MW) Total units
Capacity of units (MW)
Region
Vajra Fall 3 1 1x3 Konkan
Konal 10 2 2x5 Konkan
Devgad 1.5 1 1x1.5 Konkan
Chaskaman 3 1 1x3 W.Maharashtra
Nira Deoghar 6 2 2x3 W.Maharashtra
Tembhu Barage 4.5 3 3x1.5 W.Maharashtra
Bhandardara 46 2 Nasik
Bhandardara Phase I 12 1 1x12
Bhandardara Phase II 34 1 1x34
Total 120
Thermal Power Plants (Power available for Mumbai)
Power generating station/ Name of Company
Installed Capacity (MW)
Total Units
Capacity of units (MW)
Region
Tata Power 1400 Konkan
Trombay 1150 3 1X150 2X500
Trombay 250 1
Reliance Konkan
Dahanu Thermal Power Station 500 2 2x250
Total 1900
Hydro Electric Projects – Tata (Power available for Mumbai)
Power generating station/ Name of company
Total installed
capacity (MW) Total units
Capacity of units (MW)
Region
Bhira 150 6 6x25 Konkan
Bhira Pumped Storage Scheme 150 1 1x150 Konkan
Khopoli 72 6 6x12 Pune
Bhivpuri 72 6 6x12 Pune
Bhivpuri 3 2 2x1.5 Pune
Total 447

Electricity 240
Gas based power stations – Tata (Power available for Mumbai)
Power generating station/ Name of company
Total installed
capacity (MW) Total units
Capacity of units (MW)
Region
Trombay 120 1 1x120 Konkan
Trombay WHR 60 1 1x60 Konkan
Total 180
Renewable energy – Tata (Power available for Mumbai)
Renewable energy Total installed Capacity (MW)
Region
Wind Power W. Maharashtra
Khandke 50 Ahmednagar
Supa 17
Bramanvel 11
Visapur 4
Total 82
Site wise Wind Farm Installations in Maharashtra ( 31/03/12 )
Name of site District No. of Wind
Turbines
Sub Total
Wind Turbine Make
Capacity KW per Turbine
Total Capacity
MW
Sub Total
Dahanu Thane 1 Vestas 90 0.090
Deogad Sindhudurga 10 Vestas 55 0.550
10 Bonus 55 0.550
Vijaydurga Sindhudurga 6 BHEL 250 1.500
Sub-total (1) 27 2.690
Chalkewadi Satara 8 BHEL 250 2.000
3 Suzlon Energy 1250 3.750
2 NEPC 225 0.450
1 REPL 320 0.320
16 Suzlon Energy 350 5.600
8 Vestas RRB 225 1.800
10 Vestas RRB 500 5.000
20 Enercon India 230 4.600
8 Enercon India 600 4.800
Sub-total (2) 76 28.000
Thoseghar Satara 36 Vestas RRB 225 8.100
52 Enercon India 230 11.960
18 Enercon India 600 10.800
8 Enercon India 800 6.400
Sub-total (3) 114 37.260

Electricity 241
Vankusavade Satara 540 Suzlon Energy 350 189.000
7 Suzlon Energy 1000 7.000
28 NEG-Micon 750 21.000
25 Enercon India 230 5.750
21 Enercon India 600 12.600
1 IWPL/ NEG-Micon 750 0.750
4 IWPL 250 1.000
1 Vestas RRB 225 0.225
11 Vestas RRB 500 5.500
Sub-total (4) 638 242.825
Matrewadi Satara 25 Enercon India 230 5.750
30 Suzlon Energy 1500 45.000
2 Vestas Wind Tech 1650 3.300
10 Pioneer Wincon 250 2.500
Sub-total (5) 67 56.550
Varekarwadi Satara 15 Enercon India 600 9.000
5 Enercon India 800 4.000
4 Vestas Wind Tech 1650 6.600
Sub-total (6) 24 19.600
Ambheri Satara 24 Vestas RRB 600 14.400
4 Elecon 600 2.400
5 Gamesa 800 4.000
71 Southern Windfarms
225 15.975
66 Shriram-EPC 250 16.5
25 Pioneer Wincon 250 6.25
18 Kenersys 2000 36
Sub-total (7) 213 95.525
Sadawaghpur Satara 75 Suzlon Energy 1250 93.750
25 Suzlon Energy 600 15.000
Sub-total (8) 100 108.750
Agaswadi Satara 64 Regen 1500 96.000
15 Gamesa 850 12.750
Sub-total (9) 79 108.750
Vaspeth Sangli 2 Global Wind 2500 5
5 Kenersys 2000 10
Sub-total (11) 7 15.000
Chavneshwar Satara 87 Enercon India 800 69.600
Sub-total (10) 87 69.600
Kas Satara 12 Shriram-Leitwind 1500 18.000
1 Suzlon Energy 600 0.600
Sub-total (11) 13 18.600

Electricity 242
Palsi Satara 19 Vestas Wind Tech 1650 31.350
Sub-total (12) 19 31.350
Maloshi Satara 19 Suzlon Energy 1250 23.75
Sub-total (13) 19 23.750
Gudepachgani Sangli 8 Enercon India 230 1.840
14 Enercon India 230 3.220
12 Enercon India 600 7.200
63 Enercon India 800 50.400
30 Suzlon Energy 600 18.000
24 NEG-Micon 1650 39.600
2 Suzlon Energy 1500 3.000
Sub-total (14) 151 123.260
Dhalgaon Sangli 14 Enercon India 600 8.400
51 Suzlon Energy 600 30.600
132 Suzlon Energy 1250 165.000
49 Suzlon Energy 1500 73.500
Sub-total (15) 246 277.500
Bhud Sangli 26 Regen 1500 39.000
26 Vestas Wind Tech 1650 42.900
3 Ghodawat Industries
1650 4.950
Sub-total (16) 55 86.850
Mendhegiri Sangli 25 Gamesa 850 21.25
Sub-total (17) 25 21.250
Kavadya Dongar
A'Nagar 57 Suzlon Energy 1000 57.000
6 Suzlon Energy 1250 7.500
Sub-total (18) 63 64.500
Panchpatta A'nagar 24 Suzlon Energy 1500 36.000
65 Enercon India 800 52.000
Sub-total (19) 89 88.000
Khandke A'nagar 135 Enercon India 800 108.000
Sub-total (20) 135 108.000
Sautada Beed 52 RRB Energy 600 31.200
14 Shriram-EPC 250 3.500
Sub-total (21) 66 34.700
Brahmanwel Dhule 5 Windia 600 3.000
4 Windia 750 3.000
20 NEG-Micon 750 15.000
23 NEG-Micon 1650 37.950
16 Suzlon Energy 600 9.600
377 Suzlon Energy 1250 471.250

Electricity 243
4 Suzlon Energy 1500 6.000
1 Suzlon Energy 2100 2.100
Sub-total (22) 449 547.900
Jaibhim Dhule 16 Suzlon Energy 2100 33.6
Sub-total (23) 16 33.600
Chakala Nandurbar 154 Suzlon Energy 1250 192.500
66 Suzlon Energy 1500 99.000
10 Suzlon Energy 2100 21.000
Sub-total (24) 230 312.500
Motha Amarawati 2 Suzlon Energy 1000 2.000
Sub-total (25) 2 2.000
Aundhewadi Nashik 13 Enercon India 800 10.400
28 Suzlon Energy 1500 42.000
Sub-total (26) 41 52.400
Andhralake Pune 133 Enercon India 800 106.400
Sub-total (27) 133 106.400
TOTAL 3184 2717.110 MW*
*As on 31 Mar 2012

Electricity 244
PPA/LOI of MSEDCL with power producers
Brief details of PPAs/LOIs and other concrete proposals entered since formation of MSEDCL
A. Ultra Mega Power Project
Mundra: Costal Gujarat Power Ltd. (4000 MW)
PPA between MSEDCL and Costal Gujarat Power Ltd on 22.4.2007
Expected COD: September 2011 to March 2013
MSEDCL share: 800 MW
Krishnapattanum: Costal Andhra Power Ltd (4000 MW)
PPA between MSEDCL and Costal Andhra Power Ltd on 23.03.2007
Expected COD: September 2013 (First Unit)
MSEDCL share: 800 MW
Tilaiya : Jharkhand Integrated Power Ltd. (4000 MW)
PPA expected to be signed on 10.09.2008
Share of MSEDCL is 300 MW
Tamilnadu UMPP (4000 MW)
PPA is yet to be signed.
MSEDCL share: 400 MW
B. Proposed Future UMPP Projects
Munge : Maharashtra (4000MW)
MSEDCL share: 2000 MW
Costal Project Karnataka State (4000 MW)
MSEDCL share: 1000 MW

Electricity 245
C. MSEDCL’s Projects under CBG
Case I Stage I (2000 MW)
MSEDCL has issued LOI for supply of power of 1320 MW to Adani Power Ltd (APL) at rate of Rs. 2.642 per unit and 680 MW to Lanco Kondapalli Power Private Ltd. (LKPPL) at rate of Rs. 2.70 per unit.
PPA will be signed in the month of September 2008.
MSEDCL share: 2000 MW
Expected year of commissioning: 2012
Case I Stage II (2000MW)
MSEDCL has submitted RfP document to MERC for procurement of additional 2000 MW through Case I CBG.
MERC public hearing will be on 17.09.08
After approval of MERC all other relevant process such as calling of bid , evaluation of bid , finalization of bid , issue of LOI and signing of PPA will be carried out.
It is expected after completion of above formalities project will be commissioned in year 2013.
Case II : Dhopave (1600 MW)
MERC has conducted public hearing on 2.09.2008 for approval of deviations in RfP document.
It is expected that project will be commissioned in year 2013 subject to land acquisition and other related clearance.
D. Central Sector Projects:
Sipat: Stage-I (3x660 MW)
MSEDCL share 510 MW
Sipat: Stage-II (2x500 MW)
MSEDCL share 258 MW out of that from one unit of 500 MW is commissioned on 26.06.2008 and MSEDCL is getting its share of 152.46 MW.

Electricity 246
Kahalgaon STPS Stage II U5: (3x500MW)
MSEDCL share is 148 MW and out of 3x500 MW , one unit of 500 MW is commissioned on 1.08.2008 and MSEDCL is getting 58 MW from this unit.
Vindhyachal Stage-III U9 (500MW)
MSEDCL is getting 152.46 MW from 1.12.2006
Vindhyachal Stage-III U10 (500MW)
MSEDCL is getting 152.46 MW from 15.07.2007
Mauda Super Thermal Power Station (2x500MW)
PPA signed between NTPC and MSEDCL on 7.12.2007
Commissioning year: 2012-2013
MSEDCL share: Share is not yet allocated by CEA, but it is expected to get around 700 MW being a project coming instate of Maharashtra.
Barh: (3x660MW)
PPA signed between NTPC and MSEDCL on 9.03.2006
Commissioning year: 2010
MSEDCL share: 164 MW
North Karnapura: (3x660MW)
PPA signed between NTPC and MSEDCL on 9.03.2006
Commissioning year: 2010
MSEDCL share: 67 MW
E: Independent Power Projects
Ratnagiri Gas & Power Station (2150MW)
PPA signed on 10.04.2007 between RGPPL and MSEDCL
Block II Commercial Operations Started on 1.09.2007
Block-III Commercial Operations Started on 21.11.2007

Electricity 247
Block-I is synchronized on 8.07.2008 and generating infirm power, COD not declared yet.
Lanco Tista Hydro (4x125 MW)
PPA signed on 29.08.2006 and approved by MERC on 8.05.2008
Rate of this power is Rs.2.32 per unit.
MSEDCL share is 500 MW
Commissioning year: 2012
MIDC : Bhadrawati (1100 MW)
MSEDCL in principle agreed to purchase power from this station, which is developed by MIDC under Case II CBG and from which MSEDCL will get around 900 MW.
Year wise power purchase on short term basis through traders to meet the shortfall to some extent. Day by day rate of short term power purchase is increasing trend and presently rate of short term power purchase is reached to the extent of Rs. 10 per unit at ex-bus. The cost of this power to the distribution company is around Rs. 11.30 per unit.

Electricity 248
MSEDCL’s Power Purchase Plan till 2014-15304
304
http://mahadiscom.in/2.Anne%20D%20hrs%20of%20supply%20from%20add%20gen%20capacity.pdf

Electricity 249
MSEDCL Power Purchase Agreements with Bagasse Cogeneration projects
Sr. No.
Name of the Project ( Location, District )
EPA
Installed Capacity
(MW)
Date of Commissioning
Exportable Capacity (MW)
Energy Purchase Rate
(Rs. per unit)
Date of Valid Last Current
Execution till date Season Off-season Year Year
1 M/s. Shri Datta SSKL,Shirol,Kolhapur 6.3.97 31.8.2007 8.00 4.3.1993 3.0 0.0 2.55 2.68
2 M/s. Jawahar SSKL,Hupari,Kolhapur 4.3.97 30.9.2007 1.50 23.10.1994 1.5 0.0 2.55 2.68
(\\)3 M/s. Devgiri SSK Ltd.,Aurangabad 23.7.97 28.2.2001 5.00 16.3.1995 1.5 0.0
4 M/s. Majalgaon SSK Ltd.,Beed 8.9.97 31.5.2009 5.00 3.11.1995 1.5 0.0 2.32 2.43
(\\)5 M/s. Adinath SSK Ltd.,Solapur 27.5.97 21.2.2009 5.00 26.1.1996 1.5 0.0
6 M/s Chopada SSK,Jalgaon 5.3.97 27.5.2009 5.00 28.5.1996 1.5 0.0 2.32 2.43
(*)7 M/s. Warna SSK Ltd.,Warnanagar 15.4.98 25.5.2005 6.36 26.5.1995 1.86 0.0 3.01 3.16
SUB-TOTAL [A] 35.86 12.4 0.0
Plant Commissioned
1 M/s. Jawahar SSKL,Kolhapur 5.10.02 22.11.2014 24.00 23.11.2001 8.0 12.0 3.23 3.29
(**)2 M/s.Kay Pulp & Pap. Mills Ltd.,Satara 7.6.00 10.1.2015 6.00 11.1.2002 4.5 0.0 3.23 3.29
3 M/s Terna SSK Ltd.Dhoki,Osmanabad 30.9.02 12.12.2015 14.00 13.12.2002 7.0 0.0 3.17 3.23
4 M/s. Adinath SSK Ltd.,Solapur 2.11.02 31.1.2016 6.00 01.02.2003 5.5 0.0 3.17 3.23
SUB-TOTAL [B] 50.00 25.0 12.0
TOTAL COMMISSIONED CAPACITY 85.86 37.4 12.0
Plants Yet To Be Commissioned Scheduled
Commissioning
1 M/s Pravara Power Pvt.Ltd.,A'nagar 2.2.99 **** 35.00 Feb-06 22.5 28.0 -- --
2 M/s.Purti Sakhar Karkh. Ltd.,Nagpur 2.9.02 **** 22.00 Aug-03 11.325 18.1 -- --
3 M/s. Baliraja S.K.Ltd.,Parbhani 3.10.02 **** 15.00 Oct-03 10.0 0.0 -- --
4 M/s Vasantdada SSK Ltd.,Sangli 13.9.00 **** 12.50 Jul-04 7.47 6.5 -- --

Electricity 250
5 M/s Mula SSK,Ahemadnagar 8.8.03 **** 16.00 Apr-05 9.35 13.45 -- --
6 M/s SMS Mohite Patil,Solapur 10.12.03 **** 26.00 Nov-05 14.37 1.37 -- --
7 M/s Vighnahar SSK,Pune 10.12.03 **** 18.00 Oct-04 10.2 10.2 -- --
8 M/s Pandurang SSK,Solapur 10.12.03 **** 9.00 Feb-06 8.54 7.75 -- --
9 M/s Vitthalrao Shinde SSK,Solapur 7.1.04 **** 10.50 Nov-05 6.30 0.00 -- --
10 M/s Standard Fibrochem, Nasik 31.1.04 **** 24.00 Dec-05 16.93 20.90 -- --
11 M/s NV Energy Pvt. Ltd Mumbai 17.2.04 **** 4.00 Sep-04 3.90 3.50 -- --
12 M/sRajarambapu Patil SSKL Sangli 6.4.04 **** 12.00 Dec-05 6.90 0.00 -- --
13 Dr B. Ambedkar SSKL Osmanabad 7.6.04 **** 16.00 Jun-06 9.70 0.00 -- --
14 M/s Bhimashankar SSK ,Pune 21.6.04 **** 6.00 Mar-06 4.57 5.00 -- --
15 M/s Dnyaneshwar SSK A'Nagar 29.7.04 **** 12.00 Jul-06 6.3 6.9 -- --
16 M/s Makai SSKL Solapur 6.8.04 **** 7.50 Jul-06 4.8 6.2 -- --
17 M/s Jawahar SSSK Kolhapur 27.8.04 **** 3.00 Nov-06 2.5 0 -- --
***18 M/s yash Agro Energy Pvt. Ltd. NGP. 25.10.04 **** 8.00 Oct-06 5.62 7.18 -- --
19 M/s Malegaon SSK Ltd.,Malegaon BK 07.11.05 **** 24.00 Oct-06 14.09 9.813 -- --
***20 M/s Chintamani SSKL, Yevatmal 03.12.06 **** 30.00 Feb-06 15.86 25.60 -- --
21 M/s Loknete Baburao P. SSK Solapur 27.12.06 **** 8.00 Dec-06 4.25 0.00 -- --
22 M/s Kranti SSKL Kundal, Sangli 27.12.06 **** 13.00 Dec-06 6.65 0.00 -- --
TOTAL[ C ] 331.50 202.1 170.5
TOTAL[ B+C] 381.50 227.1 182.5
TOTAL[ A+B+C] 417.36 239.5 182.5

Electricity 251
(\\) Firm not responding for renewal of
**** Validity of EPA is 13 years from d ( *) Bio-gas N/A - Not Applicable
-- Rate for the first year of commissioning (**) Paper (*** ) Bio-mass
20 M/s Wardha SSKL Wardha 30.00 Dec-06 15.86 25.60
23 M/sGayatri Energy (YCP&IPL)A'bad 7.00 Dec-06 4.29 6.42
(***)4 M/s Gayatri Agro (Bio-mass),Gondia 5.10.02 **** 6.60 Jun-04 5.9 0.0 -- --

Electricity 252
Annexure II - Godbole Committee Report
Maharashtra started facing power shortage from the year 1999 – 2000 and since then load shedding was around 1820 MW. To deal with this crisis situation Maharashtra Govt. formed a committee namely Godbole committee under the chairmanship of Dr. Madhav Godbole (former Union home secretary) an expert from the power sector. The committee had to present its findings on the future demands for the next 10 years from 2002-03 and the solutions to meet the demands. In the report, the projected demands were incorrectly calculated, so the utility had to resort to load shedding to bridge the demand supply gap as sufficient investments were now made by the government for generating power. The committee had also stated in the report that the power deficit could be balanced with share from the central sector. One of the major reasons for power shortage was the miscalculation in future demand, which needs to be calculated more scientifically.
The demand projections and actual demand is tabulated below.
Table 76: Demand Projections and actual Demand
Year Godbole committee
MSEB TERI Actual Demand
Load shedding
02-03 10109 11424 - 13418 2496
03-04 10657 11933 - 13692 2042
04-05 11169 12701 12260 14822 3045
05-06 11711 13518 12883 16049 4205
06-07 12272 14388 13526 16500 4600
07-08 12866 15314 14180 - -
08-09 13438 16299 14854 - -
09-10 14038 17348 15545 - -
Pune Model of zero load shedding Jul 23, 2007-Indian Express; 22 Aug 08-ToI; Jan 03, 2008
Pune started the no-load shedding era in June 06, by roping in industries to generate captive power on a public-private partnership (PPP) model initiated by CII. In February this year, Maharashtra Electricity Regulatory Commission mooted extending the model to cities like Nasik, Kolhapur, Thane, Mulund, Bhandup, Navi Mumbai, etc.
In the original model (year 2006) around 30 CII member industries were brought together to draw around 80-100MW power from their Captive Power Plants (CPPs) so the power shortfall in Pune can be met. For a city that witnessed peak load shedding of 180-200 MW, such a measure gave instant relief, completely eliminating the need for load-shedding. Generating power was a relatively expensive affair as diesel was required to run the gen-sets. The cost of generation by CPPs was over Rs. 10/kWh.

Electricity 253
The MSEDCL worked out a formula to reimburse the industrial units the differential cost i.e difference in cost of running CPPs and the electricity bill. Reliability charge of 42 paise per unit fixed for customers consuming more than 300 units per month for zero load-shedding convenience. This raised enough funds to successfully compensate participating industries.
With the demand for power going up in Pune, MERC in March this year directed the MSEDCL not to give grid support to keep the Pune model running and look for a franchisee that will secure additional power exclusively. The revised Pune model was worked out in association with Tata Power Trading Company Ltd and 100 MW power on round the clock basis was contracted for Pune. The reliability charge was fixed at 49 paise per unit.
However MSEDCL had told MERC that Tata Power be asked to contract power till June 2008 and later from October 2008 till June 2009. So from July – September, Tata Power did not contract power. But since there were no rains in July power shortfall increased and MSEDCL started demanding 225 MW additional power for Pune to prevent load shedding, whereas its earlier requirement projection was 150 MW for 12 hour basis. Load shedding was introduced in Pune and the model scrapped on July 15.
Tata Power Trading Company Ltd started securing additional electricity on 'day ahead' basis for Pune, Thane and Navi Mumbai through the Indian Energy Exchange from August 13. MSEDCL refused to accept power on 'day ahead' basis and insisted on 'firm' power, i.e. power contracted in advance. So load shedding was resumed in Pune from August 20.
Instead of generating power from CPPs, other alternatives could have been looked for reducing load shedding viz. 400MW idle generation capacity of Uran plant (by converting it to liquid fuel facility); incentivizing load withdrawals by big consumers; reducing technical and commercial losses; etc. These alternatives were not seriously analyzed.
Major landmarks in the energy sector
1970 Lowering agricultural tariffs
1980 De-metering of pumps to encourage growth of the agricultural sector
1991
Opening generation for private sector by making amendments in the Indian Electricity Act, 1910 and the Electricity (Supply) Act, 1948 with The Electricity Laws (Amendment) Act, 1991—Notification wherein
• Private Sector allowed to establish generation projects of all types (except nuclear)
• 100% foreign investment & ownership allowed

Electricity 254
• New pricing structure for sales to SEBs
• 5 Year Tax holiday; import duties slashed on power projects
October 1991 Union Power Ministry began to publish a series of notifications seeking to encourage the entry of privately owned generating companies into the electricity sector
1992-97
• 8 projects given "fast-track" status
• Sovereign guarantees from Central Government
• Seven reached financial closure
• Dabhol (Enron), Bhadravati (Ispat), Jegurupadu (GVK), Vishakapatnam (Hinduja), Ib Valley (AES), Neyveli (CMS), Mangalore (Cogentrix)
1999-2000
State started facing power shortage – Godbole committee formed to calculate demand projections and provide solutions
2006
• GoM unbundled the MSEB into four companies’ w.e.f June viz. MSEB Holding Company Ltd, Maharashtra State Power Generation Company Ltd (MSPGCL), Maharashtra State Electricity Transmission Company Ltd (MSETCL) and Maharashtra State Electricity Distribution Company Ltd (MSEDCL)
• Pune model of zero load shedding established w.e.f. September
2008
Pune model of zero load shedding revised in March, worked in association with Tata Power and suspended on July 15.
Tata Power secured additional power from Indian Energy Exchange on a day ahead basis on August 13, however MSEDCL insisted on firm power. Load shedding resumed in Pune from August 20.

Electricity 255
Annexure III- Power plants in Pipeline
Land and water requirements of proposed and existing power plants in Konkan
No Company Location /Name of
Project
Capacity (MW)
Land requiremen
t (ha.)
Water requirement for cooling (m3/day)
Fresh / Raw water
requirement (m3/day)
Total water req. (m3/day)
Coal and Gas based – Centre and State Government Projects 1 NTPC Dhopave,
Guhagar, Ratnagiri
1600 485 4864000.0 7789.3 4871789.3
2 Central Govt. (NTPC)
Munge, Devgad (UMPP), Sindhudurg
4000 1236.3 12160000 19473.3
Gas based – Centre and State Government Projects 3 RGPPL Dabhol,
Guhagar, Ratnagiri
1200 (Total land acquired by RGPPL)
688
4 Uran upgradation
Uran, Raigad 1220 800.8 27000 27000
Coal based-Private Power Projects 5 GMR
Energy Bhopan, Dapoli, Ratnagiri
1980 612 6019200 9639
6 JSW Energy Jaigad, Ratnagiri 3200 989 9728000 15587.7
Existing 1200 MW
370.9 3648000 5842
7 Finolex Ranpar,
Ratnagiri
Phase1- 43
13.29 130720 209.3
Phase2-1000
200 198000
8 Reliance Energy
Shahpur, Thane 4000 919 200000
9 Reliance Industries Ltd
Saphale, Thane 495 263.1 1540480 2409.8 152889.8
10 TATA Dehrand, Raigad
1600 444 130000
11 Ind Bharat Power (Konkan) Ltd
Dhakore, Anjagaon, Sawantwadi
1050 424.7 3192000 5111.8

Electricity 256
The figures marked in red are calculated and those in blue were available in various database. The water and land requirements are bound to change depending on the type of technology used.
12 M/s IBPKL Sindhudurg 450 182.1 1368000 2190.8
13 M/s Ispat Energy Ltd
Dolvi, Raigad 1000 1011.7 100000
14 Tiana Power Projects Pvt. Ltd
Konkan- Anjarle 1500 344.7 75000
15 Larsen & Toubro
Nervi (Pawas & Purnagad)
2000 459.5 100000
Nuclear power 16 NPCIL,
Central Govt.
Jaitapur, Ratnagiri
Units 1&2- 3350 Total- ~10,000
938.026 10368000
Gas based
17 M/s Urban Energy Generation Pvt. Ltd
Vangni Tarfe Taloja, Raigad
2100 182.1 100440
18 Urban Energy Generation
Navi Mumbai Special Economic Zone at Dronagiri , Uran Taluka, Raigad
2000 40 3388920
19 Urban Energy Generation
Kondgaon, Roha, Raigad
2100 101.2 100400
20 Reliance Industries Ltd.
Nagothane, Raigad
800 69.4 38262.9
21 Poena Power Ltd.
Khalapur, Raigad
1300 242.8 72000 72000
Captive Power Plant – Private Power Generation
22 M/s Hi-Tech Carbon
Raigad 25 4.5 7200
Total 42263.0 9732.9 53045400.0 4403475.9 57448875.9

Electricity 257
Vidarbha
It is learnt that 47 power plants will be set up in Vidarbha region. Vidarbha produces 67% of the total power in the state. According to the statutory board’s report, the 47 projects would need 1,353 million cubic metres of water annually. This water, most of which is to be sourced from irrigation projects in the region, would deprive about 200,000 ha of agricultural land from irrigation, the statutory board and Vidarbha Industries Association estimated305. Of late in the summer months of April – May, 2010 certain units of the state power plants in Vidarbha were shut down due to scarcity of water.
305
Down to Earth, “47 power plants in Vidarbha”, Aparna Pallavi, February 28, 2010 47 power plants in Vidarbha - Why set up thermal plants when the region is power surplus? 306
http://thermalpower.industry-focus.net/index.php/industry-overview/342-list-of-upcoming-thermal-plants-in-india.html 307
http://thermalpower.industry-focus.net/index.php/industry-overview/342-list-of-upcoming-thermal-plants-in-
india.html
No Company Location /Name of Project Capacity (MW)
Coal based thermal power projects
1 Maharashtra State Power Generating Company Ltd (MahaGenCo)
Chandrapur Super Thermal Power Project Expansion
1000 (2x500)
2 Maharashtra Industrial Development Corporation ltd306
Bhadravati, Chandrapur 1320 (2x660)
3 Maharashtra State Mining Corporation (MSMC)
Nagbhid, Chandrapur 540
4 Gupta Energy Pvt. Ltd Ghugus, Chandrapur 120 (2x60)
5 Gupta Energy Pvt. Ltd Usgaon, Chandrapur 540 (2x270)
6 Wardha Power Company Pvt. Ltd. Unit I & II
Warora, Chandrapur Phase I -270 (2x135)
7 EMCO Energy Ltd Warora, Chandrapur 270
8 GMR Energy Warora, Chandrapur 600
9 M/s Nagpur Energy infrastructure Ltd
Bhadravati , Chandrapur 1000
10 M/s Nagpur Energy Infrastructure Ltd307
Deulwada, Bhadravati Taluka Chandrapur / Nagpur
1200 (4x300)
11 Central Indian Power Company Ltd Bhadravati , Chandrapur 1072 (2x536)
12 Dhariwal Infrastructure Pvt ltd Tadali, Chandrapur 600 (2x300)
13 Nandlal Enterprises Ltd. Kineboli, Chandrapur 750 (3x250)
14 Aryan Coal Benefications Pvt. Ltd Pandarpauni, Chandrapur 60 (2x30)
15 Gopani Iron & Power Chandrapur 15 (Captive use)
16 National Thermal Power Mauda in Nagpur 1000 (2x500)

Electricity 258
308
http://thermalpower.industry-focus.net/index.php/industry-overview/342-list-of-upcoming-thermal-plants-in-india.html 309
http://thermalpower.industry-focus.net/index.php/industry-overview/342-list-of-upcoming-thermal-plants-in-india.html
Corporation (NTPC)
17 Maharashtra State Power Generation Co. Ltd. (Mahagenco)
Koradi TPP expansion/replacement
1980
18 Maharashtra Airport Development Company
Khairi, Hingna taluka, Nagpur
100 (2x50)
19 Lenexis Energy Khursapur, Umred taluka, Nagpur
1320 (2x660)
20 M/s Astarc Power Pvt. Ltd. Pandhartal & Khursapar, Lohra taluka, Nagpur
1320 (2x660)
21 Vidarbha Industries Power ltd308 Butibori, Nagpur 300
22 Mantri Power Ltd Bela in Nagpur 540 (4x135)
23 Ideal Energy Projects Bela in Nagpur 270
24 Lanco Mahanadi Power Pvt.Ltd Dahigaon, Wardha 1320
25 Abhijeet MADC Nagpur Energy Pvt. Ltd
Gumgaon, Nagpur 200
26 Suryalakshmi Cotton Mills Ramtek, Nagpur 25 (Captive use)
27 Adani power Tiroda, Gondia 1980 (3x660)
28 Sophia Power Company Ltd & Indiabulls Power Ltd.
Nandgaonpeth, Amravati 2640 (Stage I - 2x660) (Stage II- 2x660)
29 Maharashtra State Power Generation Co. Ltd. (Mahagenco)
Lohara village, Yavatmal 660
30 JV of Abhijeet group & Darda group
Yavatmal 1215
31 Jinbhuvish Power Generation Pvt.Ltd309
Dhanmukh, Mahagaon taluka, Yavatamal
540 (2x270) + 660
32 M/s Indo Rama Synthetics (I) Ltd. Maregaon & Wani taluka, Yavatmal
1320 (2x660)
33 M/s Prithvi Khanij Sampada Pvt. Ltd
Tumsar taluka, Bhandara 1320 (2x660)
Biomass based Thermal Power
34 M/s A.A. Energy Ltd Desaiganj taluka, Gadchiroli 10
Cogeneration Plant
35 RPL Urja Kalmana in Yavatmal 100

Electricity 259
Annexure IV- Regional Imbalance in Maharashtra
प्रादेर्ळक अवभतोर आणण अनळुऴे
१९६० भध्मे भशायाणर याज्म स्थाऩन झारे, ल त्माऩलूी भध्म प्रदेळात अवरेरे वलदबि आणण शैदेयाफादेत अवरेरा भयाठलाडा भशायाणर वभावलणट झारा. १९६० च्मा अगोदय फॉम्फे प्रांतात भुफंई, ऩणेु, गजुयातते्रा काशी बाग अवे वधन प्रदेळ शोत.े बौगोर्रक ऩरयष्स्थती, ऩष्चचभ घाटाचे अष्स्तत्ल, नवैर्गिक वभदृ्धी, ऩाण्माची फायभाशी उऩरब्धता मांभऱेु कामभच वधन याहशरेरा शा प्रदेळ वलाांगाने वभदृ्ध झारा. फयीच दळके भयाठलाडा ननझाभाच्मा याजलटीत अवल्माभऱेु नतथरे भयाठीऩण कभकुलत झारेच शोत.े वलदबि कामभ ह्मा याजलटीतनू त्मा याजलटीत प्रलाव कयत शोताच. ऩष्चचभ भशायाणर च्मा तरुनेत कभी वभदृ्ध अवे शे दोन भोठे बौगोर्रक आणण वांस्कृनतक प्रदेळ भशायाणरात एकलटरे. वलदबाितरी ळतेी ऩणूित् भोवभी ऩालवालय अलरफंनू, तय भयाठलाड्मात ननजाभाच्मा अखत्मायीत भजुयी शाच उदयननलािश अवल्माभऱेु मांच ेवलरीनीकयण ‘भशा’याणरात केल्मानतंय अवभतोर चुकणाय नव्शताच. ऩष्चचभ भशायाणरात ऩालवालय फशुवखंमांची योजी योटी अलरफंनू अवरी तयीशी इथरा ऩाउव काशी बाग वोडता जलऱऩाव वायखाच ऩडतो आणण ऩयेुवा शोतो. वलदबाितरा ऩाऊव ऩष्चचभ भशायाणरातीर ऩालवाशून जास्त अव्मलष्स्थत आणण अननमर्भत आशे. ऩष्चचभ भशायाणरात उद्मोजकता देखीर ऩलूीऩावनू रूढ आशे, जी भयाठलाड्मात नततकीळी नव्शती. वखुाने नांदणाऱ्मा ऩष्चचभ भशायाणरारा जेव्शा तरुनेने अल्ऩ वखुात याशणाया वलदबि आणण भयाठलाडा मेऊन र्चकटरा, तवे्शा अवभतोर ननभािण झारा.
ऩष्चचभ भशायाणर आणण कोकण मा वलबागांना ऩष्चचभ घाट छेद कयतो. मा दोनशी वलबागात ऩष्चचभ घाटातीर वभदृ्धीने भोराची बय ऩाडरी आशे. कोकण वलबागात ऩष्चचभ घाटाफयोफय वभदु्र ककनायाशी आशे ज्माभऱेु मा वलबागाचा वलकाव लेगळ्माच ऩद्धतीने झारा आशे.
भशायाणर याज्मारा ५२ लऴ ेऩणूि झारी. प्रादेर्ळक अवभतोर ष्जतका नवैर्गिक आशे नततकाच याशून इतय षेत्ांभध्मे एकत्रत्त वलकाव शोणे ५२ लऴाित तयी अऩेक्षषत शोत.े ऩण तवे झारे नाशी, अवभतोर याहशराच आणण लाढत्मा रोकवखंमेभऱेु याज्माचे आर्थिक वतंरुन अर्धकच त्रफघडरे. वलदबाित ल भयाठलाड्मात ऩालवालय अधीनता, नोकऱ्मांची आणण उद्मोगांची लणलण, मांभऱेु याज्मातीर वलकाव भखुमत्ले ऩष्चचभ भशायाणर कें हद्रतच याहशरा.
नोव्शेंफय १९५६ भध्मे बायतीम ववंदेत ७ ली घटना दरुुस्ती भजंूय झारी. त्मात काशी याज्मांचे ऩनुगिठन कयण्मात आरे ज्माभध्मे भशायाणर याज्मारा वलबागलाय वलकाव कयण्माचे, वलकाव भशाभडंऱे स्थाऩण्माच ेआदेळ र्भऱारे. ववंलधाननक तयतदू कामद्मात उतयलण्मावाठी भशायाणर वयकाय ने २८ लऴ ेरालरी, आणण जुर ै १९८४ भध्मे भशायाणर वलधान वबेत आणण वलधान ऩरयऴदेत वलदबि वलकाव भशाभडंऱ, भयाठलाडा वलकाव भशाभडंऱ, आणण उलिरयत भशायाणर वलकाव भशाभडंऱ स्थावऩत कयण्माचे भजंूय झारे. त्मा नतंय १० लऴाांनी भाचि १९९४ भध्मे याणरऩतींनी भशायाणर याज्माच्मा याज्मऩारांना घटनेच्मा आटीकर ३७१ अन्लमे

Electricity 260
‘वलळऴे जफाफदायी’ च े आदेळ हदरे, ज्मानतंय भहशन्माबयात एवप्रर १९८४ भध्मे तीन प्रदेळांवाठी तीन लेगलेगऱी वलकाव भशाभडंऱे स्थाऩन झारी.
कें द्रीम वर्भत्मा
अवभतोर कभी कयत कयत वालित्रत्क वलकाव घडून भानली वलकाव ननदेळांक (Human Development Index) लाढलण्माचा याज्म वयकायचा उद्देळ आशे. अवभतोर कुठलय ऩोशोचरा आशे, त्माची तीव्रता ककती शे जाणण्मावाठी भशायाणर वयकायने १९८३ वारी अथितस व्शी. एभ. दांडकेय मांच्मा अध्मषतखेारी उच्चस्तयीम वर्भती गठीत केरी (Fact Finding Committee). एवप्रर १९८४ भध्मे दांडकेय वर्भतीचा अशलार प्रर्वध्द झारा. वतंरु्रत वलकाव याखण्मावाठी वलवलध वलबागांना वाधनवऩंत्ती ची गयज ३१८७ कोटी आशे अवे अशलाराने वांर्गतरे. त्मात वलदबािचा लाटा ३९%, उलिरयत भशायाणराचा ३७% आणण भयाठलाड्माचा २४% इतका शोता.
१९९५ वारी याज्मऩारांनी ‘Indicators and Backlog Committee’ गठीत केरी. जुर ै१९९७ भध्मे मा वर्भतीच्मा अशलारात अव ेवांगण्मात आरे की प्रादेर्ळक अवभतोर बरून काढण्मावाठी १ एवप्रर १९९४ मा तायखेरा १५३५५ कोटीचंी गयज आशे310. त्मात वलदबािचा लाटा ४७%, भयाठलाड्माचा २८% आणण उलिरयत भशायाणराचा २३% इतका शोता.
यस्त,े र्वचंन, ग्राभ वलद्मतुीकयण, र्ळषण, ततं्र्ळषण, आयोग्म, ऩाणी ऩयुलठा, जर्भनीचा वलकाव आणण वलंधिन मा भदु्दमांना कें द्रस्थानी ठेलनू मा दोन्शी वर्भत्मांनी आऩरा अशलार प्रर्वध्द केरा.
ऩनु:चाचऩणी वाठी याज्मऩारांनी १९९७ भध्मे ऩनु्शा एकदा ‘Reconstituted Indicators and Backlog Committee’ गठीत केरी. मा अशलाराने १ एवप्रर १९९४ रा १४००६ कोटींची गयज र्वद्ध केरी आणण वलदबि आणण भयाठलाड्माची टक्केलायी ऩनु: ऩयीषणानतंय लाढलरी.
तार्रका 1 - प्रादेर्ळक अनळुेऴ बरून काढण्मावाठी ननधीची प्रदेळननशाम लाटणी
प्रदेळ / वर्भती
दांडकेय वर्भती (१९८४)
Reconstituted Indicators and Backlog
Committee (१९९४) वलदबि ३९.१२ ४७.६०
भयाठलाडा २३.५६ २८.७७
उलिरयत भशायाणर ३७.३२ २३.६३
310
Business Standard, “Kelkar to head Maharashtra panel on regional balance”, Sanjay Jog, Febryary 23, 2011 - http://www.business-standard.com/india/news/kelkar-to-head-maharashtra-panelregional-balance/426206/

Electricity 261
नतन्शी वर्भत्मांच े अशलार आल्मानतंय देखीर उलिरयत भशायाणरारा याखील तयतदुीऩेषा जास्त ननधी लऱलण्मात आऱा, आणण वलदबि आणण भयाठलाड्मात कभी. भयाठलाडा आणण वलदबािचा लाढत चारररेा लाटा अवभतोर लाढतो आशे शेच दळिलतो.
र्वचंन
र्वचंन षते्ात प्रादेर्ळक अवभतोर अळा प्रकाये घडरेरा आशे.
तार्रका 2: एकूण अनुऴळेातीर र्वचंनाची टक्केलायी311
प्रदेळ / वार १९८४ १९९४ २०००
वलदबि ४२.३० ६१.६४ ६८.४७
भयाठलाडा ४२.१८ ५९.९६ ६१.२९
उलिरयत भशायाणर ४५.५६ २७.६५ १८.४२
भशायाणराची उजेची गयज देळात वलाित जास्त आशे. भुफंई, ठाणे, ऩणेु, नार्ळक मेथीर वलकर्वत कें द्रांभध्मे ती वलाित जास्त बागरी जात.े ऩष्चचभ भशायाणरातीर (उलिरयत भशायाणर) ग्राभीण बागात देखीर लीज ऩयुलठा जलऱऩाव वलि हठकाणी झारेरा हदवतो. वलदबाित नागऩयू आणण भयाठलाड्मात औयंगाफाद वोडरे तय तलेढे भोठे ळशयी कें द्र कोणतशेी नाशी. भुफंई जलऱीर वलकर्वत वलबागात १२ भशानगयऩार्रका आशेत. माच बागात वभुाये याज्मातीर ४ कोटी जनता लास्तव्माव आशे.
भशायाणर याज्म वलकाव अशलार312 शी वांगतो की वलकर्वत ११ ष्जल्ह्मांऩकैी ७ ष्जल्शे ऩष्चचभ भशायाणरात आशेत. ऩयकीम थेट गुतंलणुकीभऱेु ळशयी आणण ग्राभीण बागातीर अतंय लाढरे आशे अवेशी अह्लार वांगतो. मांभऱेु मा वलकर्वत बागात उजेचा लाऩय प्रचडं प्रभणात आशे. ळतेी षते्ात कोल्शाऩयू, नार्ळक ल अशभदनगय अग्रभानांककत आशेत. ळतेी ऩऩं वलाित जास्त प्रभाणात इथचे आढऱतात. भशायाणरात ळतेी वाठी लीज वलना-भीटय देण्माची वलरत आशे. मा वलि फाफींभधून वलजलाऩयाच्मा प्रभाणाचा अदंाज मेतो.
311
http://rajbhavan.maharashtra.gov.in/responsibility/responsibilities_devboard.htm 312
Government of India, Planning Commission, Maharashtra State Development Report, 2006

Electricity 262
उजाि ननर्भिती
र्वचंन आणण उजाि ननर्भिती मांच्मातीर वफंधं घननणठ आशे. भशायाणरात ६०% उजाि कोऱळातनू ननभािण केरी जात.े कोऱळातनू लीज ननर्भिती वाठी भफुरक ऩाण्माचा लाऩय कयाला रागतो. ऩाणी वऩण्मावाठी, ळतेीवाठी, की ऊजािननर्भितीवाठी वोडामचे शा लाद कामभच उठतो. ळशयी बागात जास्तीत जास्त रोकांच ेस्थरांतय शोत अवत.े ळशयाची रोकवखंमा आणण फाजायऩेठ लाढत जात,े ज्माभऱेु ळशयांतीर वऩण्माच्मा ऩाण्मारा प्राधान्म हदरे जात.े ऩण ळतेी व्मलवामालय अलरफंनू अवरेरा लगि खूऩ भोठा आशे. उद्मोगांच्मा भापि त तय याज्म वयकायरा वलाित जास्त भशवरू र्भऱतो, आणण आर्थिक वलकावशी त्मांतनूच घडतो. त्माभऱेु याज्म वयकायची दयवार ऩाणी कोणत्मा वलबागारा, नेभकी कुठरी गयज बागलण्माकयता द्मामच ेमाची चढाओढ वरुु अवत.े ककंफशुना ऩाणी देण्माची वरुुलात कोणाऩावनू कयामची मालरून लाद उवऱतात. आणण ह्माच्माभध्मे उजाि ननर्भिती पवत.े
याज्माच्मा वलि बागात रोकवखंमेप्रभाणे ऩाण्माची वभान लाटणी झारी ऩाहशजे आणण त्मानतंय व्मलवामाप्रभाणे लगिलायी करून त्माप्रभाणे लाटणी झारी ऩाहशजे. ळतेी, उजाि ननर्भिती, पटीरामजय, र्वभेंट, ऩेऩय उत्ऩादन मा उद्मोगांना बयऩयू प्रभाणात लीज आणण ऩाणी रागत.े जवजवे ळशयी कें द्रा लाढत जातीर, तवतळी त्मांची ऩाण्माची गयज देखीर लाढणाय आशे. त्मातनू ऩष्चचभ भशायाणरात आणण भयाठलाड्मातीर काशी बागात ऊवाची फेभतरफ रागलड आशे. ऊवाची ऩाण्माची गयज ऩाशता भशायाणर याज्म ककती उवाच ेऩीक वशन करू ळकेर मारा एक वीभा आशे. दवुऱ्मा भशायाणर याज्म र्वचंन आमोगाचे अध्मष डी. एन. भोये मांनी देखीर ऊवाच्मा वऩकाचा भशायाणरातीर ऩाणी टंचाई भध्मे भोठ लाटा आशे. इतकेच नाशी तय धुऱे त ेवांगरी शा ऩट्टा ऩजिन्म छामेत मेतो, आणण तयीशी नतथे ऊवाचीच रागलड जास्त आशे.
जास्तीत जास्त ऊव ऩष्चचभ भशायाणरात (कोकण लगऱून) ननघतो. नगदी ऩीक अवल्माने ळतेकयी उवाच्मा भागेच धालतो. याज्माच्मा उत्तय बागातीर नभिदा आणण ताऩी वोडता वगळ्मा नद्मा ऩलूि लाहशन्मा आशेत – ऩष्चचभ घाटात उगभ ऩालनू फगंार च्मा उऩवागयारा जाऊन र्भऱतात. कृणणा आणण गोदालयी मा दोन नद्मांच्मा खोऱ्मांनी ल उऩखोऱ्मांनी भशायाणर फशयरा आशे. कधी टंचाई मेउच नमे इतके ऩाणी उऩरब्ध आशे. ऩण अमोग्म ऩाणी लाटऩाभऱेु भयाठलाडा आणण वलदबि मा वलबागांना झऱ फवत ेआशे.

Electricity 263
तार्रका 3 - वलबागलाय धयण,े ऩाणी वाठलण षभता आणण उजाि ननर्भिती षभता
वलबाग धयणे ऩाणी वाठलण षभता (द.र.घ.र्भ.)
जरवलद्मुत षभता
(MW)
भशाननर्भिती औष्णणक वलद्मुत ननर्भिती कें दे्र
खाजगी ल कें द्रीम औष्णणक वलद्मुत ननर्भिती कें दे्र
औष्णणक वलद्मुत षभता
(MW)
लीज लाऩयाची टक्केलायी
ष्जल्ह्मांची वंखमा
ऩष्चचभ भशायाणर
918 16798 2975 1 5 5500 71.42 14
भयाठलाडा 803 7583 0 1 0 1130 8.86 9
वलदबि 731 6927 53 5 2 7185 19.72 12
भयाठलाडा आणण वलदबि र्भऱून ष्जतका ऩाणीवाठा आशे त्माशूनशी जास्त ऩाणी वाठलण्माची षभता पक्त ऩष्चचभ भशायाणरात आशे. वाशष्जकऩणे जरवलद्मतु प्रकल्ऩ ऩष्चचभ भशायाणरात जास्त आशेत, ककंफशुना पक्त ऩष्चचभ भशायाणरातच आशेत.
वलदबाित ७ औष्णणक प्रकल्ऩातनू ७१८५ MW लीजननर्भिती शोत,े भयाठलाड्मात एका प्रकल्ऩातनू ११३० MW तय ऩष्चचभ भशायाणरात ६ प्रकल्ऩातनू ५५०० MW इतकी लीज ननर्भिती शोत.े
भशायाणरातीर कोऱवा खाई भखुमत्ले वलदबाित आशेत. भशायाणर, भध्म प्रदेळ, छत्तीवगड आणण आंध्र प्रदेळ वीभा बागात नवैर्गिकरयत्मा उऩरब्ध कोऱळाचे जाऱे आशे. म्शणूनच भशायाणरातीर वलाित जास्त औष्णणक उजाि ननर्भिती षभता वलदबाित आशे. ऩाण्माच्मा उऩरब्धतभेऱेु ऩष्चचभ भशायाणरात खाजगी औष्णणक प्रकल्ऩ आशेत. भयाठलाड्मात ऩाणी आणण कोऱवा दोन्शीची लानला अवल्माभऱेु लीज ननर्भिती प्रकल्ऩांना थाया र्भऱारा नवाला.
ऩष्चचभ भशायाणरात ऊवारा प्रचंड प्रभाणात ऩाणी हदरे गेल्माभऱेु, तय वलदबाित उजाि ननर्भिती वाठी ऩाणी लऱलल्माभऱेु दोन्शी बागात वऩण्माच्मा ऩाण्माचे प्रचन उबे याहशरे आशेत. नलीन प्रकल्ऩांना ऩाणी भजंूय केरे अवता आंदोरने केरी जात आशेत. ऩाण्माचे लाटऩ अव्मलष्स्थत झार ेआशे, ल त्माभऱेु उजाि षते्ालय ताण ऩडतो आशे.

Electricity 264
ऊजाि लाऩय
लयीर तक्त्मातनू आऩण शेशी ऩाशू ळकतो की ऩष्चचभ भशायाणरात याज्माजाड ेअवरेल्मा वलजेऩकैी ७१% लीज लाऩयरी जात.े याज्मात जलऱऩाव ५०% लीज ऩणेु, ठाणे ल भुफंई वलबागात लाऩयरी जात.े याज्मातीर एकाच बागात इतका बयभवाठ लीजलाऩय आणण उयरेल्मा बागात अत्मल्ऩ लाऩय प्रादेर्ळक अवभतोर गबंीयऩणे दळिलतो. भयाठलाडा आणण वलदबाित २१ ष्जल्ह्मांभध्मे र्भऱून याज्मातीर २८% लीजलाऩय शोतो. माचे कायण अऩयुी लीज ननर्भिती देखीर अव ूळकत.े पक्त भशत्त्लाच्मा हठकाणी उत्कृणट लीज ऩयुलठा केरा जातो. ऩणेु, ठाणे भुफंई नक्कीच भोठी ळशये म्शणून प्रस्थावऩत झारी अवतीर, ऩयंत ुयाज्मातीर ५० लीज जय एकाच वलबागातनू भागणी अवेर, तय इतय वलबागांच्मा वालित्रत्क वलकावाकड ेरष हदरे गेरे ऩाहशजे.
तार्रका 4 - भशावलतयण च्मा 'झोन' प्रभाणे लीज लाऩय
Zone Consumers Demand (Rs)
Collection (Rs)
Efficiency % of total demand
Vidarbha
Amravati 1966931 12007073868 11529724317 96.02 3.96
Nagpur Urban 932536 19488405605 19852276192 101.87 6.43
Nagpur 1276851 16501571159 16650616191 100.9 5.45
Jalgaon 1214033 11763769068 11043574227 93.88 3.88
Marathwada
Aurangabad 834064 17137067844 16536710865 96.5 5.66
Latur 1058332 5230357640 4496328157 85.97 1.73
Nanded 828629 4465126597 3757700584 84.16 1.47
Western Maharashtra
Baramati 1859715 21387447548 21316397374 99.67 7.06
Bhandup Urban 1550316 46431472069 46706818671 100.59 15.32
Pune 1848704 48873867996 50120524929 102.55 16.13
Kalyan 1905178 53243327924 51978151136 97.62 17.57
Kokan (Ratnagiri) 674725 5002047534 5082283693 101.6 1.65
Kolhapur 1480101 17040004548 17215933867 100.44 5.62
Nasik 1938580 24424756495 22497419456 92.11 8.06
वलबागातीर उद्मोग, ळतेी, रोकवखंमा मांप्रभाणे ऊजाि लाऩय कभी जास्त नक्कीच शोऊ ळकतो. वलि वलबागांभध्मे वभान ऊजाि लाऩयण्माचे धोयण आखता मेणे अलघड आशे. वलबागलाय गयजा लेगळ्मा, व्मलवाम लेगऱे ल त्माभऱेु ऊजाि लाऩय देखीर लेगऱा. ऩण लीज उऩरब्धता शी एक भरूबतू गयज झारेरी आशे. तटस्थऩणे वलजेची गयज ऩाशता एक ककभान ऩातऱी अवाली की ष्जतकी लीज याज्मातीर प्रत्मेकाव त्माच्मा स्लखचाितनू लाऩयामरा र्भऱेर. कभीत कभी हदल,े ऩखंे, टी.व्शी., वगंणक मांवाठी रागणायी लीज र्भऱणे आलचमक आशे. एका व्मक्ती ऩेषा एका कुटंुफारा वलजेची गयज नेभकी ककत ेआशे, माची ककंभत काढरी तय अजून भशायाणरात लीज ऩयुलठ्माचा अनळुऴे प्रचंड प्रभाणात आशे.

Electricity 265
तक्त्मात शे हदवनू मेत ेकी ऩणेु, कल्माण ल बांडूऩ मा तीन लीज वलतयण वलबागात (zones) याज्माच्मा ४९% लीज ऩयुलठा शोतो. इतय वलबागात वलजचेा ऩयुलठा नाशी की वलजचेी भागणी नाशी शा भोठा प्रचन आशे. ऩष्चचभ भशायाणर वोडल्माव इतय वलबागात उद्मोग, नोकऱ्मा मांचे प्रभाण कभी आशे, ल त्माभऱेु तथेीर फयाच भोठा मलुक लगि ऩष्चचभ भशायाणरात र्ळषण अथला योजगायावाठी मेतो. याज्मातीर वलि वलबागात र्ळषण, नोकयी, उद्मोगांवाठी दाये उघडी झारी ऩाहशजेत जेणे करून वलि वलबागांत वलकावाच ेशात ऩोचतीर. वलाांगीण वलकाव शोत अवतानाच लीजलाऩय लाढतो; मा दृणटीने वलजचेी भागणी लाढरी ऩाहशजे. भयाठलाडा ल वलदबािच्मा लीज ननर्भिती, लाऩय ल ऩयुलठ्माच्मा उद्देळाने वलळऴे प्रमत्न केरे ऩाहशजेत अवेच मातनू हदवनू मेत.े
ग्राभीण (ळतेीऩऩं) वलद्मतुीकयण
याज्मऩारांच्मा ननदेळांनवुाय ळतेी ऩऩं वलद्मतुीकयणावाठी भशायाणराच्मा ळतेी ऩऩं अनळुऴे ननधीतनू वलदबािरा ६०% ननधी देण्माची गयज आशे313. भयाठलाड्मारा १३% ल उलिरयत भशायाणरारा २७% इतका (२००८-०९).
एभ.जी.ककंभतकय, तस, वलदबि लधैाननक वलकाव भशाभडंऱ मांनी अशलारात हदरेल्मा भाहशती नवुाय:
१००० शेक्टयी वलदबाित १००.३२ ऩऩं आशेत. ऩष्चचभ भशायाणरात तोच आकडा १९१.२५ तय भयाठलाड्मात १२६.१३ आशे. (२००५)
ळतेी ऩऩंावाठीचा प्रनत-शेक्टयी लीजलाऩय ऩष्चचभ भशायाणरात ८२८ मनुनट, भयाठलाड्मात ४८७ मनुनट, तय वलदबाित प्रनत-शेक्टयी लीजलाऩय १९३ मनुनट इतकाच आशे. (२००६-०७)
ळतेी ऩऩंांच्मा एकूण लीज लाऩयात ऩष्चचभ भशायाणर ६६%, भयाठलाडा २२% आणण वलदबि १२% अळी टक्केलायी आशे. (२००५)
याज्मात वयावयी ऩषेा ऩष्चचभ भशायाणरात ३.८५ राख जादा ळतेी ऩऩं फवलरे आशेत. भयाठलाड्मात आणण वलदबाित वयावयीशून कभी ळतेीऩऩं फवलरे गेरे आशेत. (२००८)
पक्त ऩणेु ष्जल्ह्माचा ळतेी ऩऩंांवाठीचा लीज लाऩय वलदबाितीर ११ ष्जल्ह्मांच्मा एकूण लीज लाऩयाशूनशी जास्त आशे.
२०१२-१३ वाठी चे याज्मऩारांचे ननदेळ अवे वांगतात की ६ ष्जल्शे वोडल्माव वलि हठकाणी ळतेी ऩऩंांचा अनळुऴे बरून ननघारेरा आशे. कोकणातीर ठाणे, यामगड, आणण यत्नार्गयी तय वलदबाितीर मलतभाऱ, चंद्रऩयू आणण गडर्चयोरी मांभध्मे अजूनशी एकूण ५८०६८ ळतेी ऩऩंांची कभतयता आशे. (२०१२)
313
Government of Maharashtra, Governor’s directives for Regional Backlog, 2008-09

Electricity 266
कें द्रीम वलद्मतु प्रार्धकयणाच्मा (Central Electricity Authority) अशलाराप्रभाणे भशायाणरात ३८,३६,१७३ ळतेी ऩऩंाना लीज ऩयुलठा आशे314. भशायाणरातीर बजूराच्मा ऩातऱीप्रभाणे २४,४९,८०० इतकेच ककंला माशून कभी ळतेीऩऩं अवालेत अव ेCEA चा अशलार वांगतो (२०१२).
वलतयण शानी
भशावलतयणने हदरेल्मा भाहशती नवुाय भयाठलाड्मातीर फीड, ऩयबणी, रातयू, उस्भानाफाद; वलदबाितीर अकोरा ल लाळीभ; आणण उत्तय भशायाणरातीर नदंयुफाय इथे वलतयण शानी वलाित जास्त आशे. भयाठलाड्मातीर ष्जल्ह्मांत उच्चांकी वलतयण शानी हदवनू मेत.े वलतयण शानीचा पटका वलतयण कंऩनीरा फवतो, आणण वलतयण कंऩनी शी लीज ननर्भिती कंऩनीरा देमक अवल्माभमेु अनंतभत् शा पटका लीज ननर्भिती कयणाऱ्मा कंऩनीरा फवतो. पक्त काशी ष्जल्ह्मातीर दयु्मभ दज्मािच्मा लीज ऩयुलठ्माभऱेु वऩंणूि ग्राशकलगािरा लाढील लीज आकाय ऩडतो.
वलतयण शानीची प्रभखु कायणे आशेत त्रफगय-भीटय लीज जोड, अव्मलष्स्थत भीटय ल फेकामदेळीय भीटय जोड ल मांभऱेु शोणायी लीज चोयी. खयाफ झारेरे पीडय, खयाफ झारेल्मा वलद्मतु ऩायेऴण ताया मांभऱेु देखीर वलतयण ल ऩायेऴण शानी लाढत.े ष्जल्शा स्तयालय माचंे भोजभाऩ शोत.े मार्ळलाम लीजत्रफर वचंामानाची कामिप्रलणता (collection efficiency) देखीर भयाठलाड्मातीर ष्जल्ह्मांना वभावलणट कयणाये भशावलतयणच ेवलबाग – रातयू ल नांदेड – मांभध्मे उच्चांकी आशे. जलऱऩाव १५% त्रफर ककंभत ग्राशकांकडून लवरू कयण्मात भशावलतयणरा अऩमळ मेत.े भयाठलाड्मात लीजवलतयण ल लीजत्रफर वचंामानात अडचणी हदवनू मेत आशेत, ल त्मांना वऩंणुटात आणण्मावाठी प्रादेर्ळक दृण्मा ऩालरे उचररी ऩाहशजेत.
वलतयण शानीची आकडलेायी स्लत् भशावलतयणने वऩंाहदत केरेरी आशे. एका त्मस्थ वर्भतीने ती भोजण्माचे काभ केरे ऩाहशजे. ज्मा वलबागांभध्मे भशावलतयणरा वलाित जास्त तो्मारा वाभोये जाले रागत आशे त्मा वलबागांभध्मे पक्त रोड ळडेींग करून प्रचन वटुणाय नाशी अवेच इनतशावाने वांर्गतरे आशे. एखाद्मा वलबागात कजि भापी, थकफाकी भापी केल्माने ननर्भिती ल वलतयण कंऩनी मांचाच तोटा शोतो, ल तो ग्राशकाकडून लवरू केरा जातो.
१. ज्मा वलबागांत वलतयण ल वचंामानात अडचणी मेत आशेत, त्मा त्मा वलबागातंीर अर्धकाऱ्मांना मा फाफतीत जफाफदाय धयरे ऩाहशजे, ल त्मांच्माकडून जफाफ भार्गतरा ऩाहशजे.
२. तांत्रत्क ल अतातं्रत्क दोन्शी कायणांभऱेु मा तो्मारा तोंड द्माले रागत आशे. वलि प्रथभ खयाफ झारेरे भीटय, पीडय, ऩायेऴण ताया मांना फदरनू तांत्रत्क अडचणींना ऩहशरे नेस्तनाफतू केरे ऩाहशजे.
३. त्मानतंय पवले भीटय, फेकामदेळीय भीटय माचंा ळोध घऊेन त्मांलय कामदेळीय कायलाई केरीच ऩाहशजे.
314
Government of India, Ministry of Power, Central electricity Authority, “Progress Report of Pumpset energisation”, October 2012

Electricity 267
४. त्माचफयोफय ष्जथे लीजत्रफर वचंमन अव्मलष्स्थत आशे, नतथे खाव वर्भती/ऩोरीव/SIT गठीत करून तऩाव केरा ऩाहशजे. थकफाकी अवरेरे पीडय जोऩमांत त्रफर बयणा शोत नाशी तोऩमांत फदं केर ेऩाहशजेत.
५. त्रफगय भीटय लीज जोड (कनेक्ळन) कामभचे फदं केर ेऩाहशजेत. ळतेी वाठी देऊ केरेल्मा मा मोजनेत ष्जथे लाऩयरेल्मा वलजेचे भोजभाऩ शोत नाशी, नतथेच लीज चोयी रा वयािव लाल अवतो, ज्मारा प्रथभ आऱा घातरा ऩाहशजे.
६. ळतेीचे पीडय लगेऱे करून प्रचन अधिलट वटेुर; ऩण १००% ग्राशकांकड ेभीटय फवलरे गेरे तय वऩंणूित् वटेुर.
वर्भत्मांनी केरेल्मा र्ळपायळींची अभंरफजालणी
याज्म वयकायने औऩचारयक रयत्मा वगंठीत वर्भतीच्मा अशलारातीर र्ळपायळी भान्म केल्मा नाशीत, ऩयंत ु१९८५ नतंय अल्ऩ प्रभाणात प्रदेळक अनळुऴे कभी कयण्मावाठी देऊ केरा गेरा. १९८५ वारी २०० कोटी ऩावनू त े १९९३ वारी ५०० कोटी ऩमांत ननधी देण्मात आरा. वन १९९४ भध्मे प्रादेर्ळक वलकाव भशाभडंऱांची स्थाऩना झाल्मानतंय अनळुऴे ननधी ५०० कोटी लरून ९०० कोटी ऩमांत नेण्मात आरा. १९९७-९८ त े२०००-०१ दयम्मान ११०० कोटी अनळुऴे ननधी याज्म वयकायने देऊ केरा, जो २००१-०२ वारी १७२० कोटी ऩमांत नेण्मात आरा315.
लऴि १९८५ १९९३-९४ १९९४ १९९७-९८ २००१-०२
अनळुऴे ननधी २०० कोटी ५०० कोटी ९०० कोटी ११०० कोटी १७२० कोटी
प्रस्तावलत लीज ननर्भिती कें दे्र
बायतात प्रस्तावलत कोऱळालय आधारयत औष्णणक लीज ननर्भिती कें द्रांभध्मे वलाित जास्त लीज ननर्भिती कें दे्र भशायाणरात प्रस्तावलत आशेत. ८९२६९ MW लीज ननर्भिती भशायाणरातीर औष्णणक कें द्रांत शोणाय आशे. त्मातीर ४११९५ MW इतकी लीज ननर्भिती पक्त वलदबाित प्रस्तावलत आशे, ल कोकणात ३०९७८ MW इतकी प्रस्तावलत आशे.
मा घडीरा देखीर वलदबाित अध्मािशून जास्त लीजननर्भिती षभता आशे, आणण लीजलाऩय २०% आशे. तथेीर रोकांभध्मे अवभतोर घडलनू आणल्माचा याग आशे. लगेळ्मा वलदबि याज्माची भागणी वमंकु्त भशायाणराच्मा लेऱीवदु्धा केरी गेरी शोती, आणण ती आत्ताशी केरी जात आशे त्मात मा कायणाचंी देखीर बय आशे.
315 http://rajbhavan.maharashtra.gov.in/responsibility/responsibilities_devboard.htm

Electricity 268
डॉ. वलजम केऱकय उच्च स्तयीम वर्भती (२०११)
अनळुऴे आणण वलकाव खचािचे वभान लाटऩाचा नव्माने वलचाय करून वाधन वऩंत्ती चे वाभान्मामातनेे लाटऩ कयण्मावाठी ल त्मांची तत्ले वरू्चत कयण्मावाठी ज्मेणठ अथितस डॉ. वलजम केऱकय मांच्मा अध्मषतखेारी ३१ भे २०११ योजी उच्चस्तयीम वर्भती स्थाऩन कयण्मात आरी. ३१ भे २०१२ ऩमांत316 अशलार प्रर्वध्द कयण्माचे आदेळ वर्भतीरा शोते, ऩयंत ु२० जुर ै२०१२ च्मा GR (General Resolution) द्लाये भशायाणर वयकायने भाचि २०१३ ऩमांत भदुतलाढ करून हदरी317.
मा अशलारालय वलाांगीण चचाि शोणे ल त्माप्रभाणे आयाखडा आखून ततंोततं अभंरफजालणी शोणे भशायाणरावाठी प्रचंड भशत्त्लाचे आशे. लेगलेगळ्मा प्रदेळांभध्मे नवैर्गिक वऩंत्ती, प्रादेर्ळक इनतशाव, रोकवखंमा मांभऱेु पयक अवणायच, ऩण याज्मातीर रोकांवाठी ऩाणी, लीज ल इतय इन्रास्रक्चय, योजगाय अथाितच एकूण वभदृ्धीवाठी वायखेच भागि भोकऱे झारे ऩाहशजेत, प्रदेळ ननशाम अव ूनमेत.
ननणकऴि
ऩाण्माची उऩरब्धता, र्वचंन, कोऱळाची उऩरब्धता, उजाि ननर्भिती, उजाि लाऩय, वलतयण शानी आणण लीज त्रफर लवरुी मांच्मा फाफतीत भशायाणराच्मा वलवलध वलबागात प्रचंड अवभतोर आशे. वलदबाित कोऱवा ल लीज ननर्भिती, भयाठलाड्मात वलतयण शानी, आणण ऩष्चचभ भशायाणरात वलजेचा लाऩय अवा भशायाणरातीर उजेच्मा वफंरं्धत अवभतोर वलखुयरेरा आशे. याज्मात वलित् लीज जोड भीटय फवलणे, वऩंणूि लीजचेे जाऱे वगंणक प्रणारीत अगंीकृत कयणे प्रचंड भशत्त्लाचे आशे. लीज ननर्भिती, लीज वलतयण आणण लीज लाऩय मा नतन्शी षते्ात अवभतोर कभी व्शाला मावाठी याज्म वयकायने प्रादेर्ळक अनळुऴे ननधी वफंरं्धत वलकाव भशाभडंऱाकड ेत्लरयत लऱलणे गयजचेे आशे.
316
http://samatolvikas.org/attachments/article/45/gr_20110609124500001.pdf 317
http://samatolvikas.org/attachments/article/45/extension_gr_20_july_2012.pdf

Electricity 269
Annexure V - Installed Capacity, Generation and Efficiency of MahaGenCo Thermal Power Stations
Table 77- Installed capacity, generation and efficiency of Koradi Thermal Power Station
Year Installed capacity
(MW) Generation
(MW) Efficiency
(%)
74-75 120 40 33
75-76 360 125 35
76-77 480 206 43
77-78 480 299 62
78-79 480 321 67
79-80 680 411 60
80-81 680 401 59
81-82 680 407 60
82-83 890 458 51
83-84 1100 393 36
84-85 1100 388 35
85-86 1100 460 42
86-87 1100 446 41
87-88 1100 532 48
88-89 1100 506 46
89-90 1100 625 57
90-91 1080 652 60
91-92 1080 689 64
92-93 1080 695 64
93-94 1080 715 66
94-95 1080 648 60
95-96 1080 716 66
96-97 1080 724 67
97-98 1080 653 60
98-99 1080 670 62
99-00 1080 647 60
00-01 1080 681 63
01-02 1080 697 65
02-03 1080 704 65
03-04 1080 716 66
04-05 1080 735 68
05-06 1080 737 68
06-07 1080 776 72
Average Efficiency of Koradi thermal power station (units 1 to 7) is 57%

Electricity 270
Table 78 - Installed capacity, generation and efficiency of Nasik Thermal Power Station
Year Installed
Capacity (MW) Generation
(MW) Efficiency
(%)
70-71 140 18 13
71-72 280 123 44
72-73 280 171 61
73-74 280 171 61
74-75 280 156 56
75-76 280 135 48
76-77 280 173 62
77-78 280 176 63
78-79 280 163 58
79-80 490 227 46
80-81 700 323 46
81-82 910 430 47
82-83 910 419 46
83-84 910 466 51
84-85 910 473 52
85-86 910 581 64
86-87 910 571 63
87-88 910 615 68
88-89 910 523 58
89-90 910 565 62
90-91 910 533 59
91-92 910 554 61
92-93 910 570 63
93-94 910 576 63
94-95 910 589 65
95-96 910 576 63
96-97 910 578 63
97-98 910 590 65
98-99 910 618 68
99-00 910 670 74
00-01 910 667 73
01-02 910 646 71
02-03 910 609 67
03-04 910 644 71
04-05 910 650 71
05-06 910 657 72
06-07 910 745 82
Average Efficiency of Nasik thermal power station (units 1 to 5) is 60%

Electricity 271
Table 79-Installed capacity, generation and efficiency of Bhusawal Thermal Power Station
Year Installed capacity (MW) Generation (MW) Efficiency (%)
68-69 62.5 25 41
69-70 62.5 36 57
70-71 62.5 34 54
71-72 62.5 42 66
72-73 62.5 45 73
73-74 62.5 47 75
74-75 62.5 45 72
75-76 62.5 31 49
76-77 62.5 53 85
77-78 62.5 41 65
78-79 272.5 46 17
79-80 272.5 44 16
80-81 272.5 135 50
81-82 272.5 125 46
82-83 482.5 114 24
83-84 482.5 227 47
84-85 482.5 221 46
85-86 482.5 288 60
86-87 482.5 241 50
87-88 482.5 278 58
88-89 482.5 305 63
89-90 482.5 311 65
90-91 482.5 355 73
91-92 482.5 310 64
92-93 482.5 340 71
93-94 482.5 289 60
94-95 482.5 329 68
95-96 482.5 296 61
96-97 482.5 286 59
97-98 482.5 355 74
98-99 482.5 328 68
99-00 482.5 384 80
00-01 482.5 335 69
01-02 482.5 384 80
02-03 482.5 296 61
03-04 482.5 379 78
04-05 482.5 376 78
05-06 482.5 386 80
06-07 482.5 365 76
Average Efficiency of Bhusawal thermal power station (unit 1 to 3) is 61%

Electricity 272
Table 80 - Installed capacity, generation and efficiency of Paras Thermal Power Station
Year Installed capacity (MW) Generation (MW) Efficiency (%)
67-68 62.5 13 21
68-69 62.5 25 40
69-70 62.5 21 34
70-71 62.5 35 56
71-72 62.5 36 58
72-73 62.5 36 58
73-74 62.5 47 75
74-75 62.5 45 72
75-76 62.5 33 53
76-77 62.5 42 67
77-78 62.5 46 74
78-79 62.5 43 69
79-80 62.5 45 72
80-81 58 45 78
81-82 58 33 57
82-83 58 37 64
83-84 58 32 55
84-85 58 24 41
85-86 58 39 67
86-87 58 25 43
87-88 58 39 67
88-89 58 31 53
89-90 58 36 62
90-91 58 32 55
91-92 58 41 71
92-93 58 31 53
93-94 58 32 55
94-95 58 23 40
95-96 58 23 40
96-97 58 24 41
97-98 58 23 40
98-99 58 34 59
99-00 58 40 69
00-01 58 44 76
01-02 58 42 72
02-03 58 34 59
03-04 58 48 83
04-05 58 45 78
05-06 58 55 95
06-07 58 49 84
Average Efficiency of Paras thermal power station (unit 1) is 60%
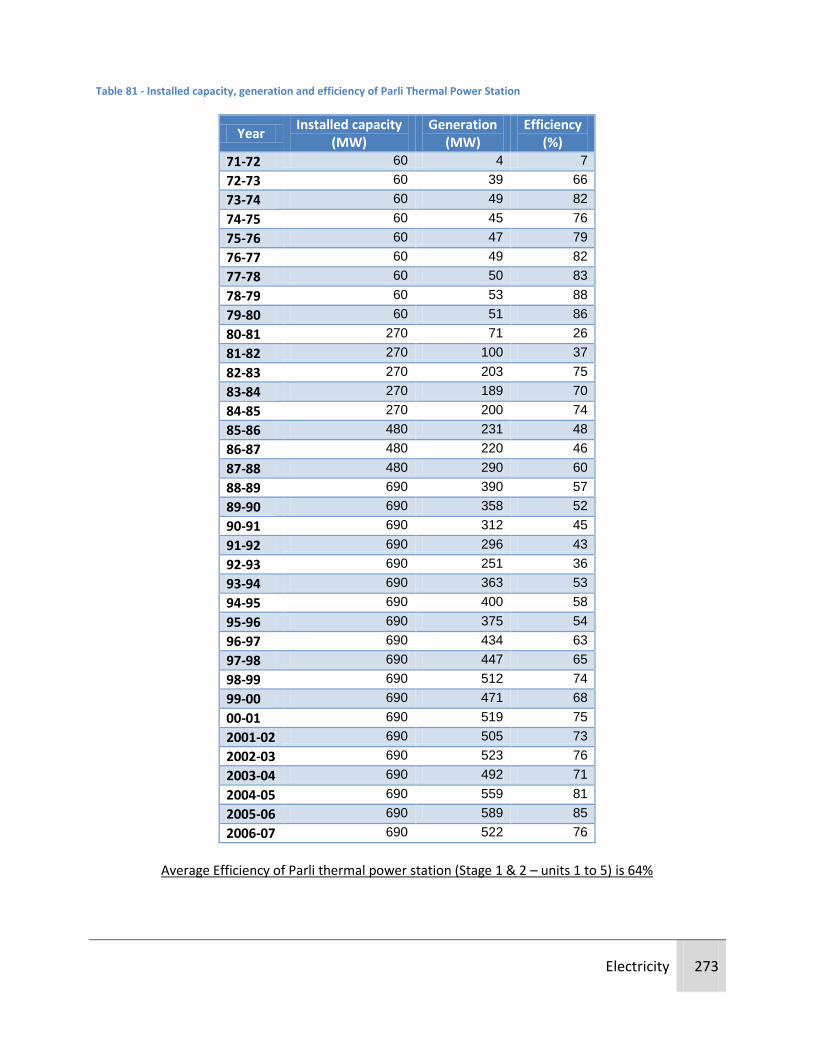
Electricity 273
Table 81 - Installed capacity, generation and efficiency of Parli Thermal Power Station
Year Installed capacity
(MW) Generation
(MW) Efficiency
(%)
71-72 60 4 7
72-73 60 39 66
73-74 60 49 82
74-75 60 45 76
75-76 60 47 79
76-77 60 49 82
77-78 60 50 83
78-79 60 53 88
79-80 60 51 86
80-81 270 71 26
81-82 270 100 37
82-83 270 203 75
83-84 270 189 70
84-85 270 200 74
85-86 480 231 48
86-87 480 220 46
87-88 480 290 60
88-89 690 390 57
89-90 690 358 52
90-91 690 312 45
91-92 690 296 43
92-93 690 251 36
93-94 690 363 53
94-95 690 400 58
95-96 690 375 54
96-97 690 434 63
97-98 690 447 65
98-99 690 512 74
99-00 690 471 68
00-01 690 519 75
2001-02 690 505 73
2002-03 690 523 76
2003-04 690 492 71
2004-05 690 559 81
2005-06 690 589 85
2006-07 690 522 76
Average Efficiency of Parli thermal power station (Stage 1 & 2 – units 1 to 5) is 64%

Electricity 274
Table 82- Installed capacity, generation and efficiency of Khaparkheda Thermal Power Station
Year Installed Capacity (MW)
Generation (MW)
Efficiency (%)
89-90 210 0.5 0
90-91 420 103 25
91-92 420 287 68
92-93 420 265 63
93-94 420 325 77
94-95 420 353 84
95-96 420 291 69
96-97 420 377 90
97-98 420 350 83
98-99 420 337 80
99-00 420 283 67
00-01 630 400 63
2001-02 840 629 75
2002-03 840 702 84
2003-04 840 684 81
2004-05 840 718 85
2005-06 840 651 78
2006-07 840 751 89
Average Efficiency of Khaparkheda thermal power station (units 1 to 4) is 70%

Electricity 275
Table 83 - Installed capacity, generation and efficiency of Chandrapur Thermal Power Station
Year Installed Capacity (MW)
Generation (MW)
Efficiency (%)
84-85 420 84 20
85-86 630 199 32
86-87 840 395 47
87-88 840 470 56
88-89 840 428 51
89-90 840 505 60
90-91 840 484 58
91-92 1340 581 43
92-93 1840 643 35
93-94 1840 893 49
94-95 1840 1013 55
95-96 1840 1286 70
96-97 1840 1347 73
97-98 2340 1346 58
98-99 2340 1533 66
99-00 2340 1805 77
00-01 2340 1776 76
2001-02 2340 1852 79
2002-03 2340 1733 74
2003-04 2340 1853 79
2004-05 2340 1818 78
2005-06 2340 1597 68
2006-07 2340 1502 64
Average Efficiency of Chandrapur thermal power station (units 1 to 4) is 59%

Electricity 276
Annexure VI - Works undertaken under APDRP
Table 84 - List of works undertaken under APDRP Phase-I (as on 30 September 2008)
Works undertaken Program
No of 33 KV Substations (Nos.) 64
33 KV Line (Km) 706.1
11 KV Line (Km) 4757.1
LT Line (Km) 1205.5
No of New Distribution Transformers (Nos.) 7172
S/S Revamping (Nos.) 243
S/S Augmentation (Nos.) 33
Single Phase meters (Nos.) 1686882
Three phase meters (Nos.) 77486
CT operated Meters at DTC (Nos.) 30514
Agriculture Meters (Nos.) 374511
Enhanced Supervisory Control and Data Acquisition (SCADA) at 10 towns (Amravati, Aurangabad, Kolhapur, Sangli, Nasik, Nanded, Nagpur, Malegaon, Pune & Pimpri-Chinchwad)
Table 85 - List of works undertaken under APDRP Phase-II (as on 30 September 2008)
Type of Work undertaken Program
New 33/11 kV Substation (Nos.) 9 Nos.
33 kV Line (km) 45.2
22 kV Line (km) 47.7
22 kV U/G Cable (km) 211.2
11 kV Line (km) 157
11 kV U/G Cable (km) 137
DTC (Nos.) 595
0.6 MVAR Capacitors 74
DTC R &M (Nos.) 339
Aug of DTC (Nos.) 234
DTC Meters (Nos.) 893 Enhanced SCADA is proposed in following 14 towns- Akola, Khamgaon, Shegaon, Mulund-Bhandup, Dombivali, Solapur, Bhandara, Buldhana, Malkapur, Yavatmal, Thane, Ulhasnagar, Osmanabad & Jalgaon

Electricity 277
Gaothan Feeder Separation Scheme
Table 86 - Gaothan Feeder Separation- Phase I (Commissioned on June 2009)
Type of Work undertaken Program
No. of feeders (Nos.) 1504
11KV Line (km) 23011
Total DTC’s (Nos.) 9785
No. of villages covered (Nos.)
7437
Load Management (MW) 1976
Table 87-Gaothan Feeder Separation- Phase II
Type of Work undertaken Program
No. of feeders (Nos.) 1067
11KV Line (km) 27063
Total DTC’s (Nos.) 13722
No. of villages covered (Nos.)
8491
No. of wadis covered (Nos.) 2020
Load Management (MW) 1646

Electricity 278
Bhiwandi Franchisee Model – Case Study
Bhiwandi is a major textile hub of western India having one third of the country’s power looms. The estimated demand in the circle is 750 MVA with an annual power input of around 2600 million units. About 55% of the total sales are to the power loom sector. Government of Maharashtra provides significant subsidy to these consumers. The town has a reputation as a chronic defaulter of power bills for more than 10 years and has a record of very high level of Aggregate technical and commercial (ATC) losses (around 60% in the year 2006-07). GoM grant to MSEB holding company and subsidy to MSEDCL/MSETCL for reduction in agriculture and power loom tariff in 2009-10 was `4238 crores318. Torrent Power Ltd took over operation of Bhiwandi circle from Januray 2007 for a period of 10 years, after signing a Distribution Franchisee Agreement (DFA) with MSEDCL. DFA gives complete autonomy to the franchisee in planning and execution of capital expenditure without requiring any regulatory approval. The tariffs to the franchisee consumers are the same as applicable to consumers of the rest of the license areas.
In the first two years of franchisee period he following observations have been made:
Aggregate technical and commercial losses have reduced considerably from 63% to 19%;
The service and supply quality has also improved substantially;
Due to reduction in distribution losses, consumer payments have doubled and so has the gross revenue of the franchisee from `160 crores in the first year to `340 crores in the second year;
Compared to the increase in revenue of franchisee, the licensee (MSEDCL) revenue is quite moderate. Compared to pre-franchisee year (FY 06-07) the MSEDCL revenue in first full year of franchisee (FY 07-08) decreased by 3% and in the second year of franchisee operation (FY 08-09) it increased by 7%. This is because MSEDCL revenue is based on fixed annual input rate (determined through bidding process) and is indexed to average billing rate (ABR). The ABR for FY 06-07, which was about `4.3/unit has dropped to around `3.6/unit for FY 07-08 and then increased to `3.75/unit for FY 08-09. This drop of about `0.60/unit in ABR in FY-08 compared to ABR for FY 07 has led to MSEDCL earning less revenue than the previous year. Another fact is that, in the first year of franchisee operation, sales to power loom increased by about 30% but the subsidy claim increased by only 2%, leading to about `0.60/unit decrease in power loom subsidy.
The franchisee model adopted in Bhiwandi has proved to be useful in reducing the distribution losses considerably. However the following aspects need to be considered prior to implement such a model in other areas.
318 Government of Maharashtra, Ministry of finance, Financial Statement – Budget, 2010-11

Electricity 279
Realizing the importance of ABR and subsidy, the franchisee agreement stipulates certain process and timeline (quarterly and annual) for undertaking audits of ABR, subsidy claims, metering and billing systems/database, etc. The audit in case of Bhiwandi was not complete even after two years and the audits for metering and billing were yet to begin. A third party monitoring of metering and billing would prove beneficial.
The audits need to be completed as stipulated and the bidding process should be brought under the purview of state regulatory commission.
Before embarking on franchisee model, efforts should be made to build quality base line data which should include existing level of losses, network status, consumer mix and sales, metering and billing. This would provide confidence for prospective bidder and realistic bids be expected. It would also increase accountability of licensee and of successful bidder for post franchisee performance.
Capital expenditure should be regulated and not be under the complete autonomy of the franchisee as is the case of Bhiwandi.
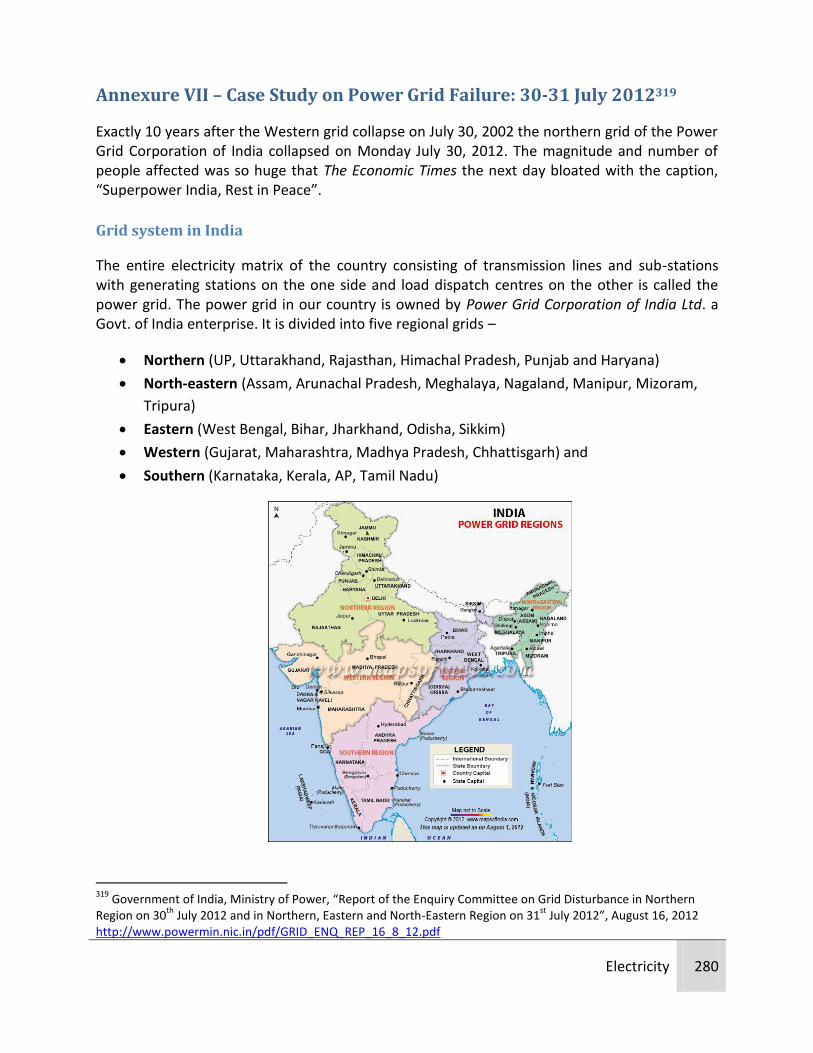
Electricity 280
Annexure VII – Case Study on Power Grid Failure: 30-31 July 2012319
Exactly 10 years after the Western grid collapse on July 30, 2002 the northern grid of the Power Grid Corporation of India collapsed on Monday July 30, 2012. The magnitude and number of people affected was so huge that The Economic Times the next day bloated with the caption, “Superpower India, Rest in Peace”.
Grid system in India
The entire electricity matrix of the country consisting of transmission lines and sub-stations with generating stations on the one side and load dispatch centres on the other is called the power grid. The power grid in our country is owned by Power Grid Corporation of India Ltd. a Govt. of India enterprise. It is divided into five regional grids –
Northern (UP, Uttarakhand, Rajasthan, Himachal Pradesh, Punjab and Haryana)
North-eastern (Assam, Arunachal Pradesh, Meghalaya, Nagaland, Manipur, Mizoram,
Tripura)
Eastern (West Bengal, Bihar, Jharkhand, Odisha, Sikkim)
Western (Gujarat, Maharashtra, Madhya Pradesh, Chhattisgarh) and
Southern (Karnataka, Kerala, AP, Tamil Nadu)
319
Government of India, Ministry of Power, “Report of the Enquiry Committee on Grid Disturbance in Northern Region on 30
th July 2012 and in Northern, Eastern and North-Eastern Region on 31
st July 2012”, August 16, 2012
http://www.powermin.nic.in/pdf/GRID_ENQ_REP_16_8_12.pdf

Electricity 281
The four grids except the southern are connected to each other via HVAC (alternating current) lines. This makes the direct transfer of load in between these grids easier (synchronous interconnection). The scenario is very close to having different switches in the house for a tube light and television; although both the appliances are a part of the same AC circuit of the house. The southern grid is connected with the rest of the grid in HVDC (direct current). As a result, the southern grid is insulated from the rest, and it is secure from damage caused in the upper four grids (asynchronous interconnection). The transfer of load with southern grid is not as easier since it requires AC to DC conversion and more loss is incurred.
A group of states comprise a grid in which internal power load transfers (in MW)320 are already planned within the states and the schedule is registered at regional load dispatch centre (for Maharashtra, it is the State Load Dispatch Centre, Kalwa, Thane). The limit for power load transfer is limited by the existing network of infrastructure (transmission lines). The inter-state load transfer is fixed and it always goes as per schedule. In many instances load scheduling is done as promptly as every 15 minutes. Likewise, inter-grid load transfer also goes as per the schedule. The national grid controls the transfer of power between adjacent grids.
Responsibilities of the National Grid
- Supervision over the Regional Load despatch centres. - Scheduling and dispatch of electricity over the inter-regional links in accordance with
grid standards specified by the authority and grid code specified by Central Commission in coordination with Regional Load Despatch Centres.
- Coordination with Regional Load Despatch Centres for achieving maximum economy and efficiency in the operation of National Grid.
- Monitoring of operations and grid security of the National Grid. - Supervision and control over the inter-regional links as may be required for ensuring
stability of the power system under its control. - Coordination with Regional Power Committees for regional outage schedule in the
national perspective to ensure optimal utilization of power resources.
Power Grid and Load transfer
The whole concept of a centralized power grid has arisen from the experiences from calamitous situations, where electricity supply of a part of the region had failed due to foggy conditions, excessive moisture, rains, etc. If it would take 2 to 3 days to restore the supply, the residents would have to bear the burden for that time period. Instead, when you have a centralized grid, power transfer can be scheduled as per the surplus or deficiency in a region and power failure in a division can be restored easily as it is inter-connected totally in the region.
The amount of load that can be transferred is limited according to the capacity of inter-grid transmission lines. The amount of load to be sold and purchased is scheduled, and the grids
320
SEE TOP RIGHT CORNER - http://mahasldc.in/wp-content/themes/mahasldc/report2.html

Electricity 282
have to abide by the schedule. Transmission gateways are accordingly kept open or closed. The Power System Operation Corporation (POSOCO) controls the regional despatch centres and their inter-transmission. If the regional corporation allows the region to draw more power than scheduled, more power tries to come through a gateway temporarily designed for less amount of power. If a certain region draws less power than scheduled, even then it calls for imbalance; as less power is drawn from a gateway temporarily designed for more power transfer.
Drawing more power than scheduled, and drawing less power than scheduled – both are potentially dangerous for the grids, and are not at all advisable. Drawing more power reduces the frequency of the alternating current during transfer, and drawing less power increases the frequency, both of which can lead to massive electrical hazards.
The standard alternating current frequency of power in India is 50 Hz. In operation, frequency oscillates between 49.8 Hz to 50.2 Hz. If frequency goes beyond these values, there is strain on the grid – the more frequency drops or increases, more the strain. In this strenuous condition if some state tries to extract more power – disobeying the scheduled interchange – it is very likely that the grid will trip and it will trip each and every power generating station that is connected with it.
In our house when some appliance tries to extract more power (current) from the AC mains, the fuse breaks the circuit, or the circuit breaker (MCB) trips the electrical line in the house. This saves the excess current from flowing at the cost of temporary loss of power.
If the same thing happens between two adjacent grids, the grid collapses.
The state which tries to draw more power than scheduled is nothing but fined. There is an UI (unscheduled interchange) charge per unit of electricity, which the state pays off. It is clear that just a monetary penalty for a grave mistake – keeping half of the nation in dark – is not enough. More limitations must be imposed on states which cross over the schedules. They must be made to perform better, reduce their T&D loss in order to make up for their mistake.
In United Kingdom, both excess and less than schedule withdrawal has a penalty associated to it. But in India, only excess withdrawal is penalized, which is unfair and risky.
What happened on July 30, 2012
In July 2002, it was Madhya Pradesh load dispatch centre that tried to extract more power than scheduled. In July 2012, the northern grid collapsed on Monday, July 30. As it was recuperating from the collapse, the eastern grid failed on the subsequent day. But this time the damage was worse. The northern and north eastern grids collapsed after the eastern grid collapse, thus bereaving 600 million Indians of power. The actual intensity of the effect of this failure on the lives of Indians is half than what it seems since over 300 million people are not even connected

Electricity 283
with the grid321. The western grid saved itself from tripping by taking adequate measures, otherwise it was equally susceptible. Who did it this time is a matter of propriety and responsibility on the doer’s side.
At 0230 hours in the peak of the night, the Agra-Bareilly transmission section (400kV Bina-Gwalior transmission line) tripped and it started the collapse. Majority of the other transmission lines interconnecting NEW grid were out due to planned and forced outages. Thus the inter-regional corridor itself was weak.
The current power deficit supplemented by deficient rains all over the country has proved to be a nightmare for agriculture. Rainwater scarcity has forced millions of cultivators to draw ever lowering groundwater, or depend on pumped water supply of the respective state. In the monsoon, the problems of poor coal quality and wet coal loom large and it reduces the Operating Availability as well as the Plant Load Factor (PLF) of the generating station. As more than 50% power is generated from coal fired thermal power plants, the actual power generated
321 Government of India, Ministry of Home Affairs, Census of India, 2011 and http://blogs.wsj.com/indiarealtime/2012/08/01/how-many-people-actually-lost-power-in-india/

Electricity 284
in these unfavorable conditions is less and the demand-supply gap increases. Deficient rainfall has affected power demand restriction, aggravating the power crisis.
In this situation, a member state of the Northern Grid drew more power than scheduled to meet its demands; the frequency was lowered below the critical value and the grid tripped.
(The grids are equipped with ‘Under Frequency Relay’ technique where if the frequency of generated alternating power goes to alarmingly low levels, it trips the grid)
After the grid tripped, important parts of south and central Delhi and the IGI airport were supplied electricity from NTPC’s Badarpur Thermal Power Station in NCT, Delhi. When the Badarpur station tripped at 7 am, power was acquired from Bhutan to deliver power for Metro transport, PM’s residence and AIIMS (All India Institute of Medical Sciences). PGCIL (Power Grid Corporation of India Ltd.) claims that 60% of power was restored in 4-5 hours, while it took more than 12 hours to restore full supply.
Sequence of events
400 kV Bina-Gwalior line tripped
NR loads were met through WR-ER-NR
route, and Bina-Gwalior line was loaded
heavily
Centre of the load swing was NR-ER interface, thus isolating NR from the NEW grid system (North East West)
NR grid collapsed due to under frequency

Electricity 285
NEW – North East West Grid System
The Agra – Bina – Gwalior transmission line can be clearly identified

Electricity 286
Impact on Public Life
Trains were running indefinitely late in Northern India after the grids collapsed on July 30 - 31322
30 crore people were directly affected by the giant power cut
Railways and some airports were shut down till 0800 hours. About a third of the rail
network is electrified, so the effect on rail network was less – due to the use of old
technology (diesel). Close to 300 trains came to a halt.
Even local transport was affected, traffic signaling loss led to traffic jamming.
Hospitals and water treatment plants were shut for half of the day 323
Over 200 coal miners were trapped in the states of Jharkhand and West Bengal as their
mining shafts went off operation due to grid failure.
What happened on July 31, 2012
The Northern Grid collapse on Monday was restored in record time, as per the spokesperson of PGCIL. To make matters worse, the Northern Grid again collapsed at 1300 hours, which triggered the collapse of Eastern and North-eastern grids along with itself.
This affected 60 crore Indians – half of the country was powerless. It was the worst blackout till date. About 500 trains in the northern and eastern part of the country were said to be stranded.
The north eastern grid was restored quickly. The evening of Tuesday saw eastern grid restore to 60% and northern grid to 80%. After the midnight on August 1, 2012 all the grids were restored to 100%324.
322 Deccan Chronicle 323 Wikipedia – July 2012 power blackout
Electricity 287
Despite being a part – with the highest power generation and consumption – of the NEW grid (Northern, North eastern, Eastern, Western), the Western grid was successful in insulating itself from the grid failure. Koyna hydroelectric project poured in 400MW when the NTPC power plant at Vindhyachal stopped supplying 600MW which had induced high variability in the frequency of the electricity. The Maharashtra state power ministry, from 2009, had continuously informed the union power ministry of the excess withdrawal by some northern states – UP, Punjab, Haryana. After the Monday’s grid failure, Maharashtra, Gujarat, MP and Chhattisgarh coordinated to utilize the daily 3000 MW transfer internally, by reducing their generation by same amount. Even load shedding hit areas were supplied with power in order to avert possible disaster in western grid325.
This coordinated effort from the four states in Western Grid did partly help in saving it from a collapse and subsequent blackout.
What could have averted the Grid Failure?
Better coordinated planning of outages of state and regional networks, specifically
under depleted condition of the inter-regional power transfer corridors.
Mandatory activation of primary frequency response of Governors i.e. the
generator’s automatic response to adjust its output with variation in the frequency.
Under-frequency and df/dt based load shedding relief in the utilities’ networks.
Dynamic security assessment and faster state estimation of the system at load
despatch centers for better visualization and planning of the corrective actions.
Adequate reactive power compensation, specifically Dynamic Compensation.
Better regulation to limit over drawal/under drawal under UI mechanism,
specifically under insecure operation of the system.
Measures to avoid mal-operation of protective relays, such as the operation of
distance protection under the load encroachment on both the days. 326
324
http://www.powergridindia.com/PGCIL_NEW/newscontent.aspx?newsid=N:345 325
The Times of India, “Maharashtra shared grid’s extra burden, insulated itself”, Chittaranjan Tembhekar, August 1, 2012 - http://articles.timesofindia.indiatimes.com/2012-08-01/mumbai/32980390_1_western-grid-northern-states-grid-failures 326
Government of India, Ministry of Power, “Report of the Enquiry Committee on Grid Disturbance in Northern Region on 30
th July 2012 and in Northern, Eastern and North-Eastern Region on 31
st July 2012”, August 16, 2012

Electricity 288
Cost
The worst power blackout in the world on July 30 and 31, 2012 hit power generation companies with a potential loss of Rs. 550 crore327, considering 85% generation Plant Load Factor (PLF) and electricity unit price of Rs. 3/unit.
NTPC was the worst affected; it was deprived of a profit of Rs. 42 crore.
Enquiry
An enquiry committee was appointed by the then Union Minister for Power with members:
1. A. S. Bakshi, Chairperson CEA – Chairman
2. A. Velayutham, Member Retd., MERC, Member
3. S. C. Shrivastava, IIT Kanpur, Member
4. K. K. Agarwal, Member (Grid operation and Distribution) CEA, Member Secretary
5. R. N. Nayak, CMD, Power Grid Corporation of India Ltd.
6. S. K. Soonnee, CEO, Power System Corporation of India
7. Balvinder Singh, Retired IPS officer
Terms of Reference of the committee
To analyze the causes and circumstances leading to the grid disturbance affecting
power supply in the affected region.
To suggest remedial measures to avoid recurrence of such disturbance in future.
To review the restoration of system following the disturbances and suggest
measures for improvement in this regard, if any
Other relevant issues concerned with safe and secure operation of the Grid.
The panel submitted the report328 on August 16, 2012.
Impact on economy
The grid collapse on 30th July also persuaded the Income Tax Department to extend the deadline for e-filing of Income Tax returns. The deadline was extended till August 31, 2012 which seems illogical. The last two days of the July 31 deadline were marred by loss of power; an extension of a month in this situation raises eyebrows.
327
http://www.business-standard.com/india/news/power-companies-lose-rs-550-cr-in-2-days/482225/ 328
Government of India, Ministry of Power, “Report of the Enquiry Committee on Grid Disturbance in Northern Region on 30
th July 2012 and in Northern, Eastern and North-Eastern Region on 31
st July 2012”, August 16, 2012

Electricity 289
Confederation of Indian Industry (CII) - which plays an advisory and consultative role in between the industry and the government - expressed grim views over the grid collapse. It said that such a huge failure of power system will have a negative impact on the growth of industry and thus the economy. It also said that it may have lowered the already low sentiment about the current economic situation in India.
“The widespread power blackouts that hit India’s north, east and northeast regions on Monday and Tuesday have had a credit negative effect on the country’s economic activity. Power disruptions will further depress business sentiment, already dampened by slowing growth and the government’s inability to implement measures to revive investment. Unreliable power supply limits the private sector’s international competitiveness. Existing and new facilities tend to invest in contingency generators and diesel stockpiles, thus diverting capital and undermining the scope for productivity improvements. India’s prevalent subsidy system artificially depresses end-prices, leaving state-owned power companies to incur losses and making the sector unattractive for private investment.”
Moody’s Investors Service329 (Renowned credit rating agency)
According to Moody’s, the power failure underscores inadequacy of the country’s
infrastructure, which inhibits growth by discouraging investment and impeding productivity
improvements.
Critical Analysis and Practical Solution
Critical Analysis of the following is necessary
Depleted transmission network – a minimum sustainable capacity must always be
present
Load Despatch Centres tend to draw less power than scheduled to have minimum
spending on UI (Unscheduled Interchange) charges. Some resort even to Load
Shedding just to spend less on UI.
Compliance of State Load Despatch Centres to Regional Load Despatch Centres.
The status of technological safety mechanisms like UFR – Under Frequency Relays,
df/dt relays, PSS- Power System Stabilizers, PMU – Phasor Measurement units, Time
Synchronization, etc.
Following subjects should be considered to design and implement practical solutions
Recommendations have been underlined by the Enquiry Committee; time frames have been set and pertaining authorities who have been given corresponding responsibilities.
329
http://en.wikipedia.org/wiki/Moody's_Investors_Service

Electricity 290
Review of Penal Provisions under Electricity Act, 2003.
Review and improve protection systems
Review ‘Islanding System’
Autonomy to Load Despatch Centres
Co-ordinated outage planning
Network strengthening and visualization – fiber optic connectivity
Solutions pertaining to power generators
Ultimate Solution: Stress on the availability and quality of coal (which produces 65%
of country’s power)
Reduction in start-up times of generators
Make way for gas power to boom with assurance of gas availability, which is reliable
and less time consuming process
All this, will collectively increase power generation across the country, to meet the ever rising demand. There is no other option than to increase the generation, whether by making existing systems efficient, or replacing them with efficient systems. When this is supplemented with a robust makeover of the transmission and distribution power grid, we can surely avert such electrical disasters in the future.
Institutional reform
To make profits from the investment made, PGCIL spent too less on the maintenance
work, on the upkeep of the equipment in the grid. The relays that protect the grid were
covered with tall grass in some instances, making it difficult to operate them. This
neglect of grid maintenance also may have led to the failure of the entire grid on July 30
and 31.
The ultimate source of revenue for power companies is tariff. But political interests
make it difficult to increase the tariff, and it is kept low while heavy losses – extremely
heavy losses - are incurred. The distribution company of Maharashtra MSEDCL has
audited a revenue loss of about Rs. 5000 crore for the year 2010-11.
For both urban and rural consumers, the tariff has risen at a rate lower than the rate of increase of incomes of households, and the rate of increase of expenditure.
In India, overdrawing is penalized, while under drawing is rewarded. Under drawing is
also a sign of grid indiscipline, and it is well accepted by UK where under drawing is
penalized. We need to heavily penalize any deviation from the scheduled interchange;
over or under.

Electricity 291
Annexure VIII- Financial Assistance by MEDA and MEDA Budget Estimate
Pattern for providing the financial assistance to unit or facility by MEDA

Electricity 292

Electricity 293
MEDA Budget Estimate
Table 88- MEDA budget estimate for financial year 2011-12 (‘in lakhs)330
Name of Scheme / Programme/System
Non-Conventional & Renewable Sources of Energy (NRSE)
Tribal Sub Plan (TSP)
Total
Target State Share
Central Share
Target State Share
Central Share
Target State Share
Central Share
Total
Public Awareness Campaign
20 0 0 20 0 20
Walk Through Energy Audit
400 12 0 400 12 0 12
Save Energy Program (Nos.)
35 14 0 35 14 0 12
Waste Heat Recovery (Nos.)
4 4 0 4 4 0 3
Bright Street Light Program (Nos)
8500 136 0 4375 70 0 12875 206 0 220
Demo Project in Govt. / Semi Govt. office buildings of Energy Consv (Nos)
6 150 0 6 150 0 150
Installation of EC Devices in Municipal Councils - Street Lights & Water Supply Schemes (Nos)
15 375 0 15 375 0 300
Total 711 0 70 0 781 0 717
330
http://www.mahaurja.com/MEDA%20budget.html

Electricity 294
Annexure IX – Energy Savings in Households
Appliance Power For one consumer & one appliance
No
. of
Ap
plia
nce
s p
er c
on
sum
er
Urb
an C
on
sum
ers
of
MSE
DC
L
TOTAL Units saved/year
URBAN (MU)
Timing Peak Demand Relief (MW)
Wat
tage
(W
)
Ener
gy E
ff.
Wat
tage
(W
)
Save
d W
atts
(W
)
HO
P (
DA
Y)
(hrs
)
HO
P (
mo
nth
) (h
rs)
HO
P (
year
) (h
rs)
save
d u
nit
s/
mo
nth
(u
nit
s)
save
d u
nit
s/
year
(u
nit
s)
Morning Afternoon Evening
Tube light 36 28 8 6 180 2190 1.44 17.52 4 8000000 561 Evening 256
Incandescent Lamp
60 20 40 2 60 730 2.4 29.2 1.5 8000000 350 Morning & evening
960
Fan 70 55 15 9 270 3285 4.05 49.275 2 8000000 788 Afternoon & night
240
Refrigerator 128 100 28 24 720 8760 20.16 250 0.5 8000000 1000 Round the clock
114
Air Conditioner
2300 1900 400 2 60 730 24 292 0.05 8000000 117 Afternoon 160
Geyser (boiler)
2500 0 2500
0.5 15 182.5 37.5 456.25 0.1 8000000 365 Early morning
2000
Television 90 50 40 6 180 2190 7.2 87.6 0.75 8000000 526 Round the clock
240
3707
HOP: Hours of operation

Electricity 295
Annexure X – Other Policy measures
Utilities
To review the installations on new set ups by expert committee. The newly installed units should have a warranty and guarantee period of 5 years within which if a defect generates, complete replacement should be demanded. e.g. as in the case of Dabhol.
Improve quality of coal used.
Establish a separate body for agriculture sector supply which would bill the agricultural consumer and in turn be billed by the MSEB. If this body failed to pay bills the service would be suspended.
Alternate sources of energy
Landfill sites – Electricity to be generated from landfill sites. (Methane gas generated can be collected and used to produce electricity.) Benefits (carbon credits) to be shared by stakeholders viz MSGPCL, Municipal Corporation / Gram panchayats. MSGPCL to take landfill sites on lease for power generation for a fixed period of time.
Use of industrial waste (biomass) for electricity generation. Incentives should be offered to such industries based on the generation capacity. These industries instead of providing electricity to the grid should be allowed to sell electricity to neighboring industries directly.
Loans could be provided at a lower rate to the industries to set up alternative energy plants. These plants should be maintained by the industry itself.
Every apartment / building should have alternate source of energy for heating water and for other uses such as lighting parking spaces, gardens, etc.
Loans at a lesser interest rate should be made available for installing solar panels. The maintenance of these panels would be the responsibility of the apartment owners / builder.
Every apartment of more than 10 flats to compulsorily use solar heaters for water heating. A time frame of six months should be given for implementation. The societies should be divided ward wise and the corporator of the area should be responsible for getting the measures implemented.
The use of alternate energy to be increased ward wise.
For the increase in use of solar water heating system the State govt. should provide subsidies, tax benefits and loans at a low interest rate.
Power should not be provided for street lights and hoardings in the cities as well as highways. They should produce their own power by way of solar energy.
To provide commercial giants in the market like the malls, plazas, multiplexes and hotels (5 star/ 3 star) 60% of their total electricity requirement. The balance 40% share should be generated from alternative sources such as solar, biomass, etc. This should be a mandatory measure.
As the rural areas face power cut offs for longer durations, alternative sources of energy should be provided at a subsidized rate. This source could be a standalone local grid stations or connected grid whichever is feasible depending on the location of the village. But the power generated should be consumed by the villagers. These units should not be installed and forgotten about but proper monitoring should be carried out for effective functioning of the system and checking the need of

Electricity 296
replacement. The power can be used by the villagers during the night and by the farmers for irrigation and industries during the day time. These would assure uninterrupted supply for domestic uses and also make the villages self-sufficient in terms of power. The Gram Panchayat and/ or NGOs should be given the monitoring responsibility. The village that becomes self-sufficient in energy should be rewarded appropriately. There are substantial economic and social advantages for standalone power systems in rural areas.
Biomass-based power generation systems for rural applications could effectively make up for the absence of grid electricity supply in many remote areas.
The sugar industries as it is get the benefit by way of incentives, so it should be made mandatory for these cooperatives to sell at least 30% electricity to the farmers.
Providing alternate fuel for cooking to rural areas. In rural areas most people use wood / coal as fuel which causes health hazards by indoor pollution. The rural areas would be provided with alternate pollution free fuel for cooking, such as solar cookers / gobar gas plants.
Energy conservation and efficiency
To improve efficiency of coal based power plants. This would increase consumer benefits through cost reduction and reduce local and global pollution through more efficient coal use.
To promote replacement of inefficient lighting by CFLs, LEDs, Ceramic Metal Halide or any other efficient lighting system at industrial, commercial as well as household level. Energy efficient lighting should be made mandatory at all parking spaces, apartment gardens and club houses, etc.
To replace incandescent bulbs in villages (households, schools, dispensaries, Gram Panchayats) with CFLs, LEDs, Ceramic Metal Halide or any other efficient lighting system, provided at subsidized rates.
To make it mandatory for municipal corporations (administrative buildings/ street lights) to replace inefficient lighting with energy efficient lighting within a given time frame of 6 months. This would be the responsibility of the corporator for each ward.
To promote use of energy efficient household appliances. Design energy labels for consumer’s convenience for energy efficient refrigerators, air conditioners, washing machines, microwaves, geysers / boilers, television sets, water pumps/ electric motors, irons, heaters, mixers/ grinders/ juicers and fans.
Enforce strict regulations on energy efficient improvement such as industrial equipment, use of cleaner and more efficient production technologies.
The industries that implement energy conservation and efficiency measures should be provided with tax benefits (0.5%).
To adopt energy efficient processes in industry viz. more efficient and end use electrical equipment, heat and power recovery. Provide with benchmark information, performance standards, subsidies and tax credits and a time frame of one year to fulfill these measures.
To provide green label for industries manufacturing energy efficient products.
To give tax benefits (0.25%) to industries purchasing energy efficient products.
To make it mandatory for commercial consumers (malls, multiplexes, shops) to use energy efficient lighting.

Electricity 297
To construct commercial complexes should be constructed as per the Energy Conservation Codes for commercial buildings where a minimum efficiency standard has been set for external walls, roof, glass structure, lighting heating ventilation and air conditioning. A ban should be imposed on constructing glass structured buildings. Every construction should be monitored for the standards set as per the Energy Conservation Code.
To make the energy conservation code mandatory for all new constructions, and to provide attractive tax benefits to the already existing constructions if they upgrade to the standard.
To meter the agriculture sector’s power supply for judicious use of power and water. This would also provide the exact power consumption by this sector. The installing of meters should be done gradually as there would be a strong resistance and opposition from the farmers.
To make it compulsory for farmers to use energy efficient pump sets. A time frame should be given to farmers to implement the measures viz. 1 year for poor farmers and 6 months for rich farmers. Farmers should be provided subsidies to install energy efficient pumps; again the subsidy should be based on the economic condition of the farmer.
Rewarding consumers for using energy efficient means and saving power by way of incentives and tax benefits and penalizing the excessive users.
Incentives & Subsidies To design tariff rates, incentives and subsidies in a manner such that consumers benefit. To provide subsidies and electricity tariff rate on the farmer’s economic background. Develop a monitoring mechanism to ensure that benefits provided are reaped by the needful farmers. Most of the power subsidy to agricultural consumers is used by big and middle level farmers drawing large amounts of water for cash crops and often small farmers using small amounts of electricity and water for grain crops To provide subsidies for harnessing indigenous energy sources. To provide incentives to renewable sources of power generation based on generation capacity and not on installed capacity viz. wind power generating station, solar plants, bagasse co-generation, biomass, etc. The incentives should be based on the units generated and not on the installed capacity as this would only increase the number of installations with and not power generation.
Environmental and Social benefits
To conduct environmental and social impact assessment not only for documentation purpose but for implementation as well.
To introduce emission control measures in coal fired plants such as installation of high efficiency sulfur scrubbers and electrostatic precipitators.
Prior to giving permission to set up new industrial units, the technology should be checked for energy consumption and equipment to be used. Corrective measures should be suggested for the use of energy efficient equipment.
Industries large and small are divided as per their energy needs. They should be divided as large, medium and small scale consumers and suitable energy management practices to be designed for them.

Electricity 298
To formulate R & R policies for PAPs. Other than providing employment to PAPs their land should be taken on lease for setting up power plants and benefits in terms of dividends, etc. to be paid to the PAPs.
To establish a monitoring mechanism.
Monitoring and enforcement
To monitor the application of corrective measures suggested in the EIA.
To enforce state level environmental regulations and standards for power plants. To monitor emission levels from power plants twice a year.
To appoint a special taskforce for rural areas for generating power from alternate sources, monitor the functioning of these generating stations and for distribution of power as well as revenue collection.
To set efficiency standards for industrial equipment and products. The industries that don’t use efficient equipment shall pay energy tax.
To monitor energy conservation and energy efficient mechanisms of medium and large scale industries twice a year and for small scale enterprises once a year.
Energy conservation measures to be implemented within a given time frame. The industry not following the corrective measures to be penalized.
The MSEDCL & MSETCL to monitor the electricity consumption of each society before and after implementation of solar water heaters, thus setting up a consumption trend.
To develop a monitoring mechanism to ensure that subsidies provided are reaped by the needful farmers.
An individual from each of the village or an officer from the MSEB should be appointed to monitor the implementation as well as to guide the farmers on a day to day basis.
Power Users Association (PUA) should also be formed by the farmers so electricity would be every farmer’s business. The members of this association should be monitored by an NGO and an MSEB official, as this should not become an association of the powerful farmers of the villages. The PUA would monitor the meters, check for and prevent thefts, collect bills and also create awareness on the judicious use of power.
To monitor the electricity supply.
Research and development
To strengthen financial support to R & D for energy efficient equipment, renewable energy sources, thermal power generation, clean coal technology and low or zero emission energy alternatives.
To conduct pilot studies for feasibility of newer cheaper technologies developed.
Provide incentives (to buyers) for a fixed period of time viz. 1 year in order to create a market for newer cheaper technologies
Capacity-Building, Education, Training and Awareness-Raising
To spread awareness among industrial consumers by rewarding the most energy efficient and energy conserving industry by the GoM.

Electricity 299
To restrict the sale of less energy efficient equipment or by putting heavy taxes on such appliances.
To promote energy conservation and consumer education programs through creating public awareness through the media (television, radio & newspapers) and also through advertisements in malls. It should be made mandatory for malls selling electronic equipment to put up these advertisements and also provide information to customer about the energy efficient appliances. Media campaigning could involve radio programs every month; publication of energy conservation guides; leaflets/ brochures/ stickers/ posters for consumers; advertisements in the TV should be aired at prime time.
To develop energy conservation curriculum in schools and colleges and also conduct workshops organized by the MSEB.
To conduct local and state level training programs on energy conservation and use of energy efficient appliances for government officials; MIDC (business owners, industrial technicians, operators, service providers of household appliances like refrigerators, air conditioners, etc.); IT industry; primary and secondary school level (urban and rural schools); housing complexes and societies; and villages (farmers, farm laborers, women self-help groups, etc.). These programs/ workshops aim at strengthening the capability of the energy sector in the region as well as developing skills and knowledge of people.
To design special workshops covering conservation measures for running electrical appliances, cooking, etc. for women
To conduct training workshops in urban areas could be held ward wise. Every ward in case of urban areas and villages that has adopted maximum energy efficient measures would be rewarded appropriately. Every ward should also be encouraged to use energy efficient lighting.
To create awareness among farmers about use of energy efficient pump sets and judicious use of power and efficient irrigation techniques. This is to be done by conducting regular stakeholders meetings and distributing brochures in local language.
To increase communication between electricity distributors and agricultural consumers by conducting quarterly meetings and random survey on farms (pump set sites) to analyze and address the problems.
To strengthen and professionally develop the MSGPCL, MSETCL and MSEDCL and make them politically independent and responsible. The decision makers (be it the minister / MSGPCL/MSETCL/MSEDCL) should be accountable directly to the public. Making the MSGPCL, MSETCL and MSEDCL politically independent will not allow any minister to break the legal guidelines and by pass the regulatory processes.

Electricity 300
Bibliography

Electricity 301
1. 14th Quality Summit Bangalore, P. Bhargava: “Shedding load shedding in Pune - Bringing to life
public private partnership”
2. Business Standard, “Kelkar to head Maharashtra panel on regional balance”, Sanjay Jog,
Febryary 23, 2011
3. Centre for European Policy Studies, Working Document No. 325, Noriko Fujiwara: “The
Political Economy of India’s Climate Agenda”, March 2010
4. Confederation of Indian Industry, “Bharat Nirman Plus: Unlocking Rural India’s Growth
Potential”, May 2007
5. Daily News and Analysis, “Coal India board okays 80% trigger, not the penalty”, Sumit Moitra,
August 1, 2012
6. Down to Earth, “47 power plants in Vidarbha”, Aparna Pallavi, February 28, 2010
7. Down To Earth, “NTPC gets shock treatment”, Aparna Pallavi, June 15, 2010
8. Down To Earth, “See the Light”, Sunita Narain, August 15, 2012
9. Economic and Political Weekly, R S Deshpande and A Narayanamoorthy: “Issues Before
Second Irrigation Commission of Maharashtra”, March 24, 2001
10. Economic and Political Weekly: Anjana Das and Jyoti Parikh: The Political Economy of Power;
Vol. - XXXV No. 14, April 01, 2000
11. Economic and Political Weekly: Ashohk Sreeniwas, Shantanu Dixit: “Are we serious about our
Energy security?”, May 19, 2012
12. Economic and Political Weekly: C. More, S.J.Saikia, R.Banerjee: “An Analysis of Maharashtra
Power Situation”, September 29, 2007
13. Economic and Political Weekly: G.Narendranath, U.Shankari, K.R.Reddy: “To Free or Not to
Free Power – Understanding the Context of Free Power to Agriculture”, December 31, 2005
14. Economic and Political Weekly: S L Rao: The Political Economy of Power; Vol. - XXXVII No. 33,
August 17, 2002
15. Economic and Political Weekly: V Ranganathan: “Determining T&D losses in India-Their
Impact on Distribution Privatization & Regulation”, February 12, 2005, pp. 658
16. e-Journal USA Volume 14/Number 4, U.S. Department of State – “Energy Efficiency: The First
Fuel”, April 2009
17. Elsevier – Energy Policy, A.P. Chikkatur, A.D.Sagar, N. Abhyankar, N. Sreekumar, “Tariff based
incentives for improving coal power plant efficiencies in India”
18. Energy Security Series: The Brookings Foreign Policy Studies, India, pp. 14
19. Frans van Aart Energy Efficiency in IPPC installations – “Energy Efficiency In Power Plants” -
October 21, Vienna
20. Global Energy [R]evolution, A sustainable world energy outlook: Policy recommendations
21. Global Energy Network Institute – Meisen, Queneudec, Avinash, Timbadiya, “Overview of
Renewable Energy Potential in India”, October 2006
22. Government of Haryana, Additional Director Department of Renewable Energy, B.S. Yadav:
“State level seminar on energy conservation - Haryana Energy Conservation Action Plan &
Haryana’s Initiatives on Energy Conservation”, Haryana, December 18, 2007
23. Government of India, Central Board of Irrigation & Power (CBIP), Conference on Peak Power
Management – “Brief report & recommendations” November 23/24, 2006, New Delhi
24. Government of India, MECON Ltd., Report on achievable heat rate and auxiliary power
consumption of thermal power stations, 2007

Electricity 302
25. Government of India, Ministry of Environment and Forests, Environmental Clearance Letter
No. J-13011/ 53/ 2008-IA.II (T), January 30, 2009
26. Government of India, Ministry of Environment and Forests, Environmental Clearance Letter
No. J- 13011/29/2008-IA-II (T)
27. Government of India, Ministry of Environment and Forests, Environmental Clearance Letter
No. J- 13011/23/2007-IA-II (T), July 17, 2007
28. Government of India, Ministry of Environment and Forests, Environmental Clearance Letter
No J-13011/73/2007-IA.II(T), Dated: 7th April, 2008
29. Government of India, Ministry of Environment and Forests, Environmental Clearance Letter
No. J- 13012/130/2007-IA-II (T), Dated: 25th January, 2008
30. Government of India, Ministry of Environment and Forests, Environmental Clearance Letter
No. J- 13011/13/2008-IA-II (T), Dated: 19th September 2008
31. Government of India, Ministry of Environment and Forests, Environmental Clearance Letter
No.J-13011/62/2007-IA-II (T), Dated: 9th May, 2008
32. Government of India, Ministry of Home Affairs, Census of India, 2011
33. Government of India, Ministry of Home Affairs, Census of India, 2011
34. Government of India, Ministry of New and Renewable Energy, (Director) Dr. P. Saxena: “Overview
of small hydropower development in India”
35. Government of India, Ministry of New and Renewable Energy, Annual Report 2010-11, 2011-
12
36. Government of India, Ministry of Power , The Gazette of India EXTRAORDINARY PART-I - Section-
1; New Delhi, 23rd August, 2006
37. Government of India, Ministry of Power, “Report of the Enquiry Committee on Grid
Disturbance in Northern Region on 30th July 2012 and in Northern, Eastern and North-Eastern
Region on 31st July 2012”, August 16, 2012
38. Government of India, Ministry of Power, Bureau of Energy Efficiency, ECBC User Guide
39. Government of India, Ministry of Power, Bureau of Energy Efficiency, “State-wise Electricity
Consumption & Conservation Potential in India” (prepared by National Productivity Council)
40. Government of India, Ministry of Power, Central Electricity Authority, Monthly Reports
41. Government of India, Ministry of Power, Central Electricity Authority, Allocation of Power
from Central generating Stations, August 31, 2010
42. Government of India, Ministry of Power, Central Electricity Authority, Monthly Review of
Power Sector Reports
43. Government of India, Ministry of Power, Central Electricity Authority, Highlights of Power
sector, August 2012
44. Government of India, Ministry of Power, Central Electricity Authority, Thermal Performance
Review
45. Government of India, Ministry of Power, Central Electricity Authority, Western Regional
Electricity Board, Annual Report: 2004-05
46. Government of India, Ministry of Power, Central Electricity Authority, Multiplied linkages per
day for thermal power stations by 365 to get the annual requirement
47. Government of India, Ministry of Power, Central Electricity Authority, Progress Report, Pump
set Energization

Electricity 303
48. Government of India, Ministry of Power, Central Electricity Authority, Operational
Performance of Generating Stations, 2011-12
49. Government of India, Ministry of Power, Central electricity Authority, “Progress Report of
Pumpset energisation”, October 2012
50. Government of India, Ministry of Power, National Electricity Policy, February 2005
51. Government of India, Ministry of Power, Rajya Sabha Question No 432 Answered
on 26.04.2010 National Mission for Enhanced Energy Efficiency
52. Government of India, Planning Commission, “Integrated Energy Policy”, August 2006
53. Government of India, Planning Commission, “Report of Fact Finding Team on Vidarbha”, May
30, 2006
54. Government of India, Planning Commission, 10th Five Year Plan
55. Government of India, Planning Commission, 11th Five Year Plan
56. Government of India, Planning Commission, Maharashtra State Development Report, 2006
57. Government of India, Planning Commission, Power and Energy Division, “Working of State Power
Utilities and Electricity Departments”, Annual Report 2011-12
58. Government of India, Planning Commission, Programme Evaluation Organization,
“Performance Evaluation of Statutory Development Boards in Maharashtra”, April 2003
59. Government of India, Planning Commission, Report of the Working Group on Power for Eleventh
Plan (2007-2012)
60. Government of India, Planning Commission, Report of the Working Group on Power for Twelfth
Plan (2012-2017)
61. Government of India, Power Finance Corporation, Performance of State Power Utilities 2001-
02 to 2005-06
62. Government of India, Power System Operation Corporation Ltd, Western Region Load
Dispatch Centre, Annual Report 2010-11
63. Government of Maharashtra, Department of Finance, Maharashtra State Budget, 2012-13
64. Government of Maharashtra, Department of Finance, Medium Term Fiscal Policy –Fiscal
Policy Strategy Statement and Disclosures for Maharashtra, 2010-11, pp. 20
65. Government of Maharashtra, Department of Planning, Directorate of Economics and Statistics:
Economic Survey of Maharashtra 2005-06 to 2011-12
66. Government of Maharashtra, Dr. G.B. Pant Committee Report, “Windmills and Rainfall”, July
2004
67. Government of Maharashtra, Governor’s directives for Regional Backlog, 2008-09
68. Government of Maharashtra, Maharashtra Electricity Regulatory Commission, Case no. 100 of
2011: “Final True Up for FY 2009-10 and Annual Performance Review for FY 2010-11”,
December 30, 2011.
69. Government of Maharashtra, Maharashtra Electricity Regulatory Commission, Case no. 19 of
2012: “Final True up for FY 2010-11, Aggregate Revenue Requirement of FY 2011-12 and FY
2012-13, Tariff Determination for FY 2012-13 and Revision in Schedule of Charges”, August 16,
2012
70. Government of Maharashtra, Maharashtra Electricity Regulatory Commission, Renewable
Energy Tariff order FY 2012-13
71. Government of Maharashtra, Maharashtra Energy Development Agency, Strategic energy
conservation plan, Final Report - International Institute for Energy Conservation, October 2005

Electricity 304
72. Government of Maharashtra, Ministry of finance, Financial Statement – Budget, 2010-11
73. Government of Maharashtra, MSEDCL Magazine, “Vidyut Warta”, June 2012
74. Government of Maharashtra, MSETCL, STU Five Year Transmission Plan for the year 2010-11
to 2014-15
75. Government of Maharashtra, MSETCL, STU five year transmission plan for 2008-09 to 2012-13
76. Government of Maharashtra, MSPGCL, Annual Report 2009-10
77. ILEX Energy Consulting UK, “Eligibility of Energy from Waste –Study and Analysis”, March 2005
78. Independent Evaluation Group, World Bank, “The Welfare Impact of Rural Electrification: A
Reassessment of Costs and Benefits”
79. India Electricity Distribution Reform, Review and assessment, Volume I: Main Report
Submitted By CORE International, Incorporated U.S.A, September 18, 2002
80. India Infrastructure Research – “Power in India Renewable Energy”, 2009
81. India Infrastructure Research, “Thermal Power Generation in India” Volume I
82. India Infrastructure Research, Captive Power in India, “Captive Economics”, 2010, pp. 76-77
83. India Infrastructure Research, Captive Power in India, “Captive Power from Renewable
Sources”, 2010, pp. 119 – 123
84. India Infrastructure Research, Captive Power in India, “Fuel Outlook”, 2010, pp. 110
85. India Power Sector Reforms Update, Issue IV – September 2002
86. India Power Sector Reforms Update, Issue VIII – May 2004
87. India Power Sector Reforms Update, Issue XI –December 2005
88. India Resident Mission (INRM) Policy Brief No. 6, “Energy Efficiency and Conservation”, 2006
89. India Science and Technology: 2008, Bikramjit Sinha & Indranil Biswas - “Rural Energy Security
in India: Reality Checks”, May 2009
90. Infra line Energy, “Energy Efficiency: Prospects & Issues” sub ref: Asian Development Bank and
MEDA
91. Institution of Electrical and Electronic Engineers (IEEE), Xi Fang, Satyajayant Misra, Guoliang
Xue, Dejun Yang , “Smart Grid – The New and Improved Power Grid: A Survey”
92. International Food Policy Research Institute: Discussion Paper 00716: “Investment, Subsidies,
and Pro-Poor Growth in Rural India”; September 2007
93. International Journal of Regulation and Governance, Khosla Sunil K, Plummer Judith: “How
price reform revolutionized the operational discipline of India's power sector”, 2005
94. Lauder Institute- S.Choukron: “Enron in Maharashtra: Power Sector Development and National
Identity in Modern India”
95. Lawrence Berkeley National Laboratory, International Energy Studies Group, Jayant Sathaye
and Arjun Gupta: “Eliminating Electricity Deficit through Energy Efficiency in India: An
Evaluation of Aggregate Economic and Carbon Benefits”, April 2010
96. LiveMint, “WCL supplying inferior quality coal: MahaGenCo”, Makarand Gadgil, October 14,
2011
97. Maharashtra Times, July 6, 2010
98. McKinsey Global Institute, “Fueling sustainable development: The energy productivity solution”,
October 2008
99. Mckinsey Global Institute, Jaidit Brar, Rahul Sankhe, Vipul Tuli: “Renewable Energy: Bridging
India’s power gap”, 2008
100. Mint – “Solar lamps light up rural lives, dim use of oil lanterns”, September 2010

Electricity 305
101. National Institute of Public Finance and Policy – “Budgetary Subsidies in India Subsidizing
Social and Economic Services”
102. Newspaper articles and updates for years 2007, 2008,
103. Organization for Economic Cooperation and Development, Global Forum on Agriculture,
Steve Wiggins, ODI; Jonathan Brooks: “The Use of Input Subsidies in Developing Countries -
Policies for Agricultural Development, Poverty Reduction and Food Security” - OECD
Headquarters, Paris, 29-30 November 2010
104. Power in India, Recent Developments, 2009, pp28
105. Power Line, Volume 14-No.12, “PV Promise-Solar photovoltaic dominates technology
choice”, August 2010; pp. 88
106. Power Line, Volume 14-No.8, “Cost trend-Economics of solar PV and CSP projects”, April
2010; pp. 74
107. Power Magazine, Sonal Patel: “USDA Reaches $250M Goal for Smart Grid Technologies”,
September 11, 2012
108. PowerLine, Vol. 14 - No.12, “Stellar Support-Regulatory incentives and guidelines”, August
2010; pp. 88
109. PowerLine, Vol. 14, “Road to Copenhagen”, Nov 2009
110. Prayas Energy Group, “Agricultural Pumping Efficiency in India: The Role of Standards”:
Girish Sant and Shantanu Dixit
111. Prayas Energy Group, “Note on GoM Regional Imbalance Committee”, June 2012
112. Prayas Energy Group, “Towards an Efficient and Low Cost Power Sector Draft Chapter on
Energy”, prepared for Narmada Valley Task Force, Appointed by Government of M.P., G. Sant
& S.Dixit
113. Prayas Energy Group, Electricity Supply Monitoring Initiative (ESMI)
114. Prayas Energy Group, Fact sheet on ceiling fans
115. Prayas Energy Group, Factsheet - Energy Saving Potential of Indian Household Appliance
116. Prayas Energy Group, Factsheet - Scaling-Up DSM to the National Level
117. Privatization or democratization: The key to the crisis in electricity sector, The case of
Maharashtra – Prayas
118. Rashtravadi Magazine Issue, Aug 2007 (Hard Copy)
119. Resources for the Future, Discussion Paper, “Options for Energy Efficiency in India and
Barriers to their adoption: A Scoping Study”, Soma Bhattacharya and Maureen L. Cropper,
April 2010
120. Rocky Mountain Institute, “Energy End-Use Efficiency”, Amory B. Lovins, pp. 1
121. Save Energy Program (Financial assistance for carrying out energy audit) [Valid from 1sstt July
08 to 31sstt March 10]
122. The Economic Times, “Focus on power poverty- Innovate Rural Electrification”,
September 27,2010
123. The Economic Times, “Government panel says 'Go, No-Go' concept of forest area
classification legally not tenable and should be abandoned”, Sarita Singh, June 29, 2011
124. The Economic Times, “Lighting up rural India, naturally”, Paul P J, August 20, 2010
125. The Economic Times, “NTPC ends row with Coal India over fuel supply agreement; accepts
changes proposed by PMO”, Debjoy Sengupta, June 26, 2012

Electricity 306
126. The Times of India, “Maharashtra Electricity Regulatory Commission overlooks
MahaGenCo’s failure to lift WCL coal”, Ashish Roy, June 22, 2012
127. The Times of India, “Maharashtra shared grid’s extra burden, insulated itself”,
Chittaranjan Tembhekar, August 1, 2012Maps of India
128. United Nations, Energy Case Studies, “Market transformation through energy efficiency
standards and labeling”
129. Wall Street Journal Online, “Solar lamps face subsidy shadow in rural India”, December 7,
2009
130. http://164.100.194.13:8080/ssdn1/getAgendaMettingMinutesSchedule.do;jsessionid=69
4C5E30156F2B92E1CE3B206B8DCA3D?indCode=THESep%2010,%202009
131. http://164.100.194.13:8080/ssdn1/showTorDetails.do?projectCode=J-13012/151/2008-
IA.II(T)
132. http://72.78.249.125/eSakal/20120302/4996037045006219840.htm
133. http://agricoop.nic.in/VIIDPG3512.pdf
134. http://blogs.wsj.com/indiarealtime/2012/08/01/how-many-people-actually-lost-power-
in-india/
135. http://en.wikipedia.org/wiki/File:Binding-price-ceiling.svg
136. http://ies.lbl.gov/iespubs/41843.pdf
137. http://indianpowersector.com/about/case-study/
138. http://industrymonitor.in/energy/2010/07/list-of-thermal-power-projects-awaiting-
environment-clearance-as-on-july-01-2010/
139. http://mnre.gov.in/energyuwaste.htm#Recent%20developments%20in%20Municipal%20
Solid%20Waste%20Management
140. http://mnre.gov.in/file-
manager/UserFiles/commissioning_status_spv_batch1_phase1.pdf
141. http://mnre.gov.in/file-manager/UserFiles/powerplants_241111.pdf
142. http://moef.nic.in/downloads/public-information/bachat-lamp-yojana.pdf
143. http://mospi.nic.in/mospi_new/upload/Energy_Statistics_2012_28mar.pdf
144. http://optimization.asu.edu/~xue/papers/SmartGridSurvey.pdf
145. http://planningcommission.nic.in/plans/planrel/fiveyr/11th/11_v3/11v3_ch10.pdf
146. http://planningcommission.nic.in/reports/genrep/arep_seb11_12.pdf
147. http://planningcommission.nic.in/reports/genrep/intengpol.pdf
148. http://power.indiabizclub.com/info/energy_conservation
149. http://powermin.gov.in/bharatnirman/pdf/Progress_on_electrification_of_villages_househ
olds.pdf
150. http://rajbhavan.maharashtra.gov.in/pdf/Background_note_on_directives.pdf
151. http://rajbhavan.maharashtra.gov.in/responsibility/responsibilities_devboard.htm
152. http://samatolvikas.org/index.php?option=com_content&view=article&id=5&Itemid=2&l
ang=en
153. http://thermalpower.industry-focus.net/index.php/industry-overview/342-list-of-
upcoming-thermal-plants-in-india.html
154. http://thermalpower.industry-focus.net/index.php/maharashtra-thermal-
projects.html?start=18

Electricity 307
155. http://thermalpower.industry-focus.net/index.php/maharashtra-thermal-projects/248-
nandlal-enterprises-ltd-to-set-up-750-mw-thermal-project-at-kinebodi.html
156. http://thermalpower.industry-focus.net/index.php/maharashtra-thermal-projects/256-
aryan-coal-benefications-pvt-ltd-to-set-up-60-mw-thermal-project-at-pandarpauni.html
157. http://thermalpower.industry-focus.net/index.php/maharashtra-thermal-projects/363-
suryalakshmi-cotton-mills-to-set-up-a-25-mw-thermal-plant-at-ramtek.html
158. http://thermalpower.industry-focus.net/index.php/maharashtra-thermal-projects/257-
sophia-power-co-to-set-up-2640-mw-coal-based-tpp-at-nandgaonpet.html
159. http://www.asiapacificpartnership.org/pdf/PGTTF/events-april-
08/Asia_Pacific_Partnership_India_Peer_Review_NTPC_ppt.pdf
160. http://www.bee-dsm.in/PoliciesRegulations_1_4.aspx#TOP
161. http://www.bee-india.nic.in
162. http://www.business-standard.com/content/research_pdf/ntpc_160512.pdf
163. http://www.business-standard.com/india/news/govt-issues-mandatory-energy-norms-
for-firms/469691/
164. http://www.business-standard.com/india/news/power-companies-lose-rs-550-cr-in-2-
days/482225/
165. http://www.business-standard.com/india/storypage.php?autono=284322
166. http://www.cag.gov.in/html/cag_reports/maharashtra/rep_2006/com_chap_2.pdf
167. http://www.cea.nic.in/god/special_reports/Guidelines
168. http://www.cea.nic.in/more_upload/conclave/24.pdf
169. http://www.cea.nic.in/reports/articles/god/renewable_energy.pdf
170. http://www.cea.nic.in/reports/monthly/dpd_div_rep/village_electrification.pdf
171. http://www.cea.nic.in/reports/monthly/inst_capacity/aug12.pdf
172. http://www.cea.nic.in/reports/proj_mon/tpp_11plan.pdf
173. http://www.cea.nic.in/reports/renov_modern/national_plan.pdf
174. http://www.cea.nic.in/reports/renov_modern/th_randm_annex-a.pdf
175. http://www.cea.nic.in/Thermal/Project%20Appraisal/private-thermal.pdf
176. http://www.cea.nic.in/thermal_rnm.html
177. http://www.coalindia.in/Company.aspx?tab=0
178. http://www.eai.in/ref/ae/wte/wte.html
179. http://www.ehow.com/info_12152358_causes-clinkers-coal-fired-
boilers.html#ixzz27Mp1IySR
180. http://www.energy.ca.gov/research/notices/2011-12-
16_workshop/presentations/06_UCSD_AM-Kleissl.pdf
181. http://www.energymanagertraining.com/announcements/issue28/Winners/1_Santosh%
20Mahadeo%20Mestry.pdf
182. http://www.glennmosier.com/2012/01/video-the-uc-san-diego-microgrid-a-living-
laboratory/
183. http://www.ignou.ac.in/schools/soet/acpdm/BLOCK%204%20BEE-001/Part%203.pdf
184. http://www.indiaworldenergy.org/brochure/ECBC.pdf
185. http://www.industry.siemens.com/datapool/industry/industrysolutions/cement/en/Cem
ent-production-en.pdf
186. http://www.ireda.gov.in/Compendium/index%20copy.htm

Electricity 308
187. http://www.ireda.gov.in/homepage1.asp?parent_category=2&sub_category=29&categor
y=106
188. http://www.isgtf.in/
189. http://www.ispepune.org.in/issue-2009/why_vidarbha.pdf
190. http://www.mahadiscom.in
191. http://www.mahagenco.in
192. http://www.mahagenco.in/investor/pprojects_completion.shtm#parastps
193. http://www.mahagenco.in/investor/pprojects_completion.shtm#parastps
194. http://www.mahagenco.in/uploads/projects/projectCompletedInLast5Years.pdf
195. http://www.mahatransco.in
196. http://www.mahaurja.com/MEDA%20budget.html
197. http://www.mahaurja.com/PDF/Biomass_Proj_StatusC.pdf
198. http://www.mahaurja.com/PDF/CummAchv.pdf
199. http://www.mahaurja.com/PDF/PG2_solar_JNNSM.pdf
200. http://www.mahaurja.com/PDF/RE_RVE_Achivement.pdf
201. http://www.mahaurja.com/PDF/SMEProgram.pdf
202. http://www.mahaurja.com/PDF/TipIS.pdf
203. http://www.mahaurja.com/PG_Wave.html
204. http://www.mapsofindia.com/maps/india/coalreserves.htm
205. http://www.mnre.gov.in/schemes/grid-connected/small-hydro/
206. http://www.mnre.gov.in/solar-mission/jnnsm/introduction-2/
207. http://www.moneycontrol.com/news/business/dardaabhijeet-group-to-setpower-
project_278458.html
208. http://www.mwrdc.org/downloads.htm
209. http://www.nagpurpulse.com/msmc-set-540-mw-coal-based-thermal-power-plant-
nagbhid
210. http://www.ncsu.edu/cenrep/workshops/TREE/documents/Jessoe_electric.pdf
211. http://www.nema.org/prod/technologies/upload/TDEnergyEff.pdf
212. http://www.nistads.res.in/indiasnt201011/T3_Industry/Status%20of%20Green%20buildin
g%20Sector%20in%20India.pdf
213. http://www.nlcindia.com/index.php?file_name=about_01e
214. http://www.npcil.nic.in/main/AllProjectOperationDisplay.aspx
215. http://www.ntpc.co.in/index.php?option=com_content&view=article&id=40&Itemid=86
&lang=en
216. http://www.parastps.co.in/index.php?option=com_content&view=article&id=53&Itemid=58
217. http://www.parastps.co.in/index.php?option=com_content&view=article&id=53&Itemid=58
218. http://www.parlitps.com/about-us.asp
219. http://www.parlitps.com/about-us.asp
220. http://www.poweranalytics.com/pa_articles/pdf/ucsd_smart_grid.pdf
221. http://www.powergridindia.com/PGCIL_NEW/newscontent.aspx?newsid=N:345
222. http://www.powermin.nic.in/bharatnirman/pdf/Electrification_Achieved.pdf
223. http://www.powermin.nic.in/distribution/distribution_overview.htm
224. http://www.powermin.nic.in/JSP_SERVLETS/internal.jsp
225. http://www.projectsmonitor.com/ENERGY/gmr-group-acquires-emco-energy

Electricity 309
226. http://www.projectsmonitor.com/ENERGY/gmr-warora-project-attains-financial-closure
227. http://www.punefloodcontrol.com/bhima%20basin%20reserviors%20new%20data.html
228. http://www.recindia.nic.in/download/Maharashtra.pdf
229. http://www.renewableenergyworld.com/rea/news/article/2010/06/biomass-generates-
32-of-all-energy-in-sweden
230. http://www.rgppl.com/
231. http://www.sandrp.in/drp/DRP_March_2011.pdf
232. http://www.scipub.org/fulltext/jcs/jcs35323-328.pdf
233. http://www.sourcewatch.org/index.php/Supercritical
234. http://www.sswm.info/sites/default/files/reference_attachments/GELLINGS%20et%20al
%202004%20Energy%20Efficiency%20in%20Fertiliser%20Production.pdf
235. http://www.steelguru.com/indian_news/Areva_T_and_D_bags_Warora_Thermal_Power
_Plant_contract_from_GMR/156041.html
236. http://www.tatapower.com/services/transmission.aspx
237. http://www.teriin.org/upfiles//pub/papers/ft33.pdf
238. http://www.usaid.gov/in/Pdfs/Maha%20_EC_Action_Plan.pdf
239. http://www.wisegeek.com/what-is-green-energy.htm
240. http://www02.abb.com/db/db0003/db002698.nsf/0/a3881ed5c3dbc647c12575080036d
afd/$file/Energy_efficiency_ makes_difference_191108.pdf
241. https://www.ntpc.co.in/annualreports/2004-05/DirectorsReport05.pdf
242. www.energyinformative.org
243. www.powermin.nic.in/rural_electrification/main.htm
244. www.wikipedia.com