electricity consumers and compliance
TRANSCRIPT

i
Trust, Reciprocity, and Socio-economic Factors in Uttar Pradesh
Report | February 2019
Electricity Consumers and Compliance
Karthik Ganesan, Kapardhi Bharadwaj, and Kanika Balani
An initiative supported by

ii Electricity Consumers and Compliance: Trust, Reciprocity, and Socio-economic Factors in Uttar Pradesh
Image: iStock

i
Karthik Ganesan, Kapardhi Bharadwaj, and Kanika Balani
ReportFebruary 2019
ceew.in
Trust, Reciprocity, and Socio-economic Factors in Uttar Pradesh
Electricity Consumers and Compliance
An initiative supported by

ii Electricity Consumers and Compliance: Trust, Reciprocity, and Socio-economic Factors in Uttar Pradesh
Copyright © 2019 Council on Energy, Environment and Water (CEEW)
Open access. Some rights reserved. This report is licensed under the Creative Commons
Attribution-Noncommercial 4.0. International (CC BY-NC 4.0) license. To view the full license,
visit: www.creativecommons.org/licenses/ by-nc/4.0/legalcode.
Report on ‘Electricity Consumers and Compliance: Trust, Reciprocity and Socio-economic
Factors in Uttar Pradesh’.
Citation: Karthik Ganesan, Kapardhi Bharadwaj, and Kanika Balani (2019) ‘Electricity Consumers and
Compliance: Trust, Reciprocity, and Socio-economic Factors in Uttar Pradesh,’ February.
Dataset citation: Ganesan, Karthik; Bharadwaj, Kapardhi; Balani, Kanika; Council on Energy, Environment and
Water; Initiative for Sustainable Energy Policy; Electricity Consumers and Compliance: Trust,
Reciprocity, and Socio-economic Factors in Uttar Pradesh, 2019.
Disclaimer: The views expressed in this report are those of the authors and do not necessarily refl ect
the views and policies of the Council on Energy, Environment and Water. The views/analysis
expressed in this report do not necessarily refl ect the views of the Shakti Sustainable Energy
Foundation or the Initiative for Sustainable Energy Policy (ISEP), Johns Hopkins University. The
organisations do not guarantee the accuracy of any data included in this publication nor do they
accept any responsibility for the consequences of its use.
Cover image: iStock
Peer reviewers: Dr Jonathan Balls, Postdoctoral Fellow, University of Melbourne; Shantanu Dixit, Group
Coordinator, Prayas Energy Group; Vikas Chandra Agarwal, Director-Distribution, UPERC; and
Abhishek Jain, Senior Programme Lead, CEEW.
Publication team: Alina Sen (CEEW), Mihir Shah (CEEW), Surit Das, Aspire Design, and Friends Digital.
Organisations: Council on Energy, Environment and Water (CEEW)
The Council on Energy, Environment and Water (www.ceew.in) is one of South Asia’s leading
not-for-profi t policy research institutions. The Council uses data, integrated analysis, and
strategic outreach to explain—and change—the use, reuse, and misuse of resources. It prides
itself on the independence of its high-quality research, develops partnerships with public and
private institutions, and engages with the wider public. In 2019, CEEW was once again featured
across nine categories in the “2018 Global Go To Think Tank Index Report”. CEEW has also been
consistently ranked among the world’s top climate change think tanks. Follow us on Twitter
@CEEWIndia for the latest updates.
Shakti Sustainable Energy Foundation
Shakti Sustainable Energy Foundation works to strengthen the energy security of the country by
aiding the design and implementation of policies that encourage energy effi ciency, renewable
energy and sustainable transport solutions, with an emphasis on subsectors with the most
energy saving potential. Working together with policy makers, civil society, academia, industry
and other partners, we take concerted action to help chart out a sustainable energy future for
India (www.shaktifoundation.in).
Council on Energy, Environment and Water
Sanskrit Bhawan, A-10, Qutab Institutional Area
Aruna Asaf Ali Marg, New Delhi – 110067, India
iii
ABOUT CEEWThe Council on Energy, Environment and Water (CEEW) is one of South Asia’s leading not-for-profi t policy research institutions. The Council uses data, integrated analysis, and strategic outreach to explain – and change – the use, reuse, and misuse of resources. The Council addresses pressing global challenges through an integrated and internationally focused approach. It prides itself on the independence of its high-quality research, develops partnerships with public and private institutions, and engages with the wider public. In 2019, CEEW once again featured extensively across nine categories in the ‘2018 Global Go To Think Tank Index Report’, including being ranked as South Asia’s top think tank (15th globally) with an annual operating budget of less than USD 5 million for the sixth year in a row. In 2016, CEEW was also ranked 2nd in India, 4th outside Europe and North America, and 20th globally out of 240 think tanks as per the ICCG Climate Think Tank’s standardised rankings. In 2013 and 2014, CEEW was rated as India’s top climate change think-tank as per the International Center for Climate Governance (ICCG) standardised rankings.
In over eight years of operations, The Council has engaged in 200 research projects, published well over 130 peer-reviewed books, policy reports and papers, advised governments around the world nearly 500 times, engaged with industry to encourage investments in clean technologies and improve effi ciency in resource use, promoted bilateral and multilateral initiatives between governments on more than 60 occasions, helped state governments with water and irrigation reforms, and organised nearly 250 seminars and conferences.
The Council’s major projects on energy policy include India’s largest multidimensional energy access survey (ACCESS); the fi rst independent assessment of India’s solar mission; the Clean Energy Access Network (CLEAN) of hundreds of decentralised clean energy fi rms; India’s green industrial policy; the USD 125 million India-U.S. Joint Clean Energy R&D Centers; developing the strategy for and supporting activities related to the International Solar Alliance; designing the Common Risk Mitigation Mechanism (CRMM); modelling long-term energy scenarios; energy subsidies reform; energy storage technologies; India’s 2030 Renewable Energy Roadmap; energy effi ciency measures for MSMEs; clean energy subsidies (for the Rio+20 Summit); clean energy innovations for rural economies; community energy; scaling up rooftop solar; and renewable energy jobs, fi nance and skills.
The Council’s major projects on climate, environment and resource security include advising and contributing to climate negotiations (COP-24) in Katowice, especially on the formulating guidelines of the Paris Agreement rule-book; pathways for achieving Nationally Determined Contribution and Mid-Century Strategy for decarbonisation; assessing global climate risks; heat-health action plans for Indian cities; assessing India’s adaptation gap; low-carbon rural development; environmental clearances; modelling HFC emissions; the business case for phasing down HFCs; assessing India’s critical minerals; geoengineering governance; climate fi nance; nuclear power and low-carbon pathways; electric rail transport; monitoring air quality; the business case for energy effi ciency and emissions reductions; India’s fi rst report on global governance, submitted to the National Security Adviser; foreign policy implications for resource security; India’s power sector reforms; zero budget natural farming; resource nexus, and strategic industries and technologies; and the Maharashtra-Guangdong partnership on sustainability.
The Council’s major projects on water governance and security include the 584-page National Water Resources Framework Study for India’s 12th Five Year Plan; irrigation reform for Bihar; Swachh Bharat; supporting India’s National Water Mission; collective action for water security; mapping India’s traditional water bodies; modelling water-energy nexus; circular economy of water; participatory irrigation management in South Asia; domestic water confl icts; modelling decision making at the basin-level; rainwater harvesting; and multi-stakeholder initiatives for urban water management.

iv Electricity Consumers and Compliance: Trust, Reciprocity, and Socio-economic Factors in Uttar Pradesh

v
ACKNOWLEDGMENTSThe authors of this report thank the Shakti Sustainable Energy Foundation for their support in
carrying out this study and Morsel Research and Development Private Ltd., the survey agency, and its
enumerators for their tireless eff ort in administering the survey and collecting the data.
For their valuable contributions in the conceptualisation and design of the survey, we thank our
collaborators Johannes Urpelainen (Professor, Johns Hopkins School of Advanced International
Studies); Jason Chun Yu Wong (Columbia University); and Brian Dylan Blankenship (Columbia
University).
We thank Mr Vikas Chandra Agarwal for his guidance throughout the study and state sector experts
Mr Rama Shankar Awasthi and Mr Awadesh Kumar Verma for conversations that expanded our
understanding of the power sector in Uttar Pradesh.
We thank our reviewers – Dr Jonathan Balls (University of Melbourne); Shantanu Dixit (Group
Coordinator, Prayas Energy Group); Vikas Chandra Agarwal (Director, Distribution, Uttar Pradesh
Electricity Regulatory Commission); and Abhishek Jain (Senior Programme Lead, CEEW) – for their
critical comments and feedback, which helped us in presenting our fi ndings better.
Many discom offi cials apprised us of the ground realities that utilities face and vetted the survey
results – Pankaj Kumar (CE, Azamgarh zone, Purvanchal Vidyut Vitran Nigam Limited (PuVVNL));
A. K. Srivastava (CE, Saubhagya), accompanied by discom offi cials of Mau, Balia, and Kaushambi
regions, PuVVNL; Shashi Bhushan Sharma (CE (Commercial), PuVVNL); V. K. Gangwar (CE, Agra
zone, Dakshinanchal Vidyut Vitran Nigam Limited (DVVNL)); Satish Singh (SE, Headquarters,
LESA, Madhyanchal Vidyut Vitran Nigam Limited (MVVNL)); and Brahm Pal (Director, Commercial,
Headquarters, MVVNL).
Finally, the authors thank our colleagues at CEEW – Prateek Agarwal, Kangkanika Neog, Sunil Mani,
Tauseef Shahidi, and Saurabh Tripathi – for their support in providing valuable inputs in the writing
of the report.

vi Electricity Consumers and Compliance: Trust, Reciprocity, and Socio-economic Factors in Uttar Pradesh

vii
ABOUT THE AUTHORS
Karthik Ganesan [email protected]
Karthik is a Research Fellow at
CEEW. He has over seven years of
experience in analysing energy
and macroeconomic policies.
His current work is on cost-
eff ective power generation options
for discoms, understanding
environmental impacts of power
generation, and the role of energy
effi ciency in industrial production.
He has a B.Tech. and an M.Tech.
in Civil Engineering from IIT
Madras and a Master’s in Public
Policy from National University of
Singapore.
“The challenges for Uttar Pradesh
are in managing a large system
with varying degrees of capacity
at diff erent levels of the electricity
value chain. The most important
step will be to communicate to
consumers that the discoms are
committed to cost recovery and
service delivery”.
Kapardhi Bharadwaj [email protected]
Kapardhi was a Programme
Associate at CEEW. He has been
involved in state-level tariff
determination for Odisha and
Gujarat, working on tariff s for
biomass and hydro-power. He
has fi ve years of experience in
the power sector. He has a BE in
Mechanical Engineering and an
MBA in Power Management from
the University of Petroleum and
Energy Studies, Dehradun.
“Uttar Pradesh can alter the
perception of success in power
sector reform. With the single
largest addition of consumers
under the Saubhagya scheme, it
presents some unique challenges.
We have attempted to prioritise
the tasks that lie ahead, for the
discoms of UP, as they make strides
in achieving and sustaining 24×7
power for all”.
Kanika Balani [email protected]
Kanika is a Research Analyst at
CEEW. She has been working in
the power sector for over three
years. Her past work includes
conducting a study on ‘Regulatory
Oversight of Discoms Under
UDAY Scheme’ and conducting
an on-fi eld exploratory study on
the regulation of electricity theft
with IIT-Kanpur. She has a BA
(Honours) in Political Science
from the University of Delhi and
an MA in Regulatory Governance
from the Tata Institute of Social
Sciences, Mumbai.
“The interactions with the
stakeholders establish that the
power sector has been looked at
as an isolated system. With public
sector utilities, ineffi ciencies are
passed on to consumers – either
directly or indirectly. Consumers
are both rate-payers and tax-
payers in the system, and policies
to govern the sector must be
cognisant of this”.

viii Electricity Consumers and Compliance: Trust, Reciprocity, and Socio-economic Factors in Uttar Pradesh

ix
CONTENTS
Executive Summary
1. Introduction 1
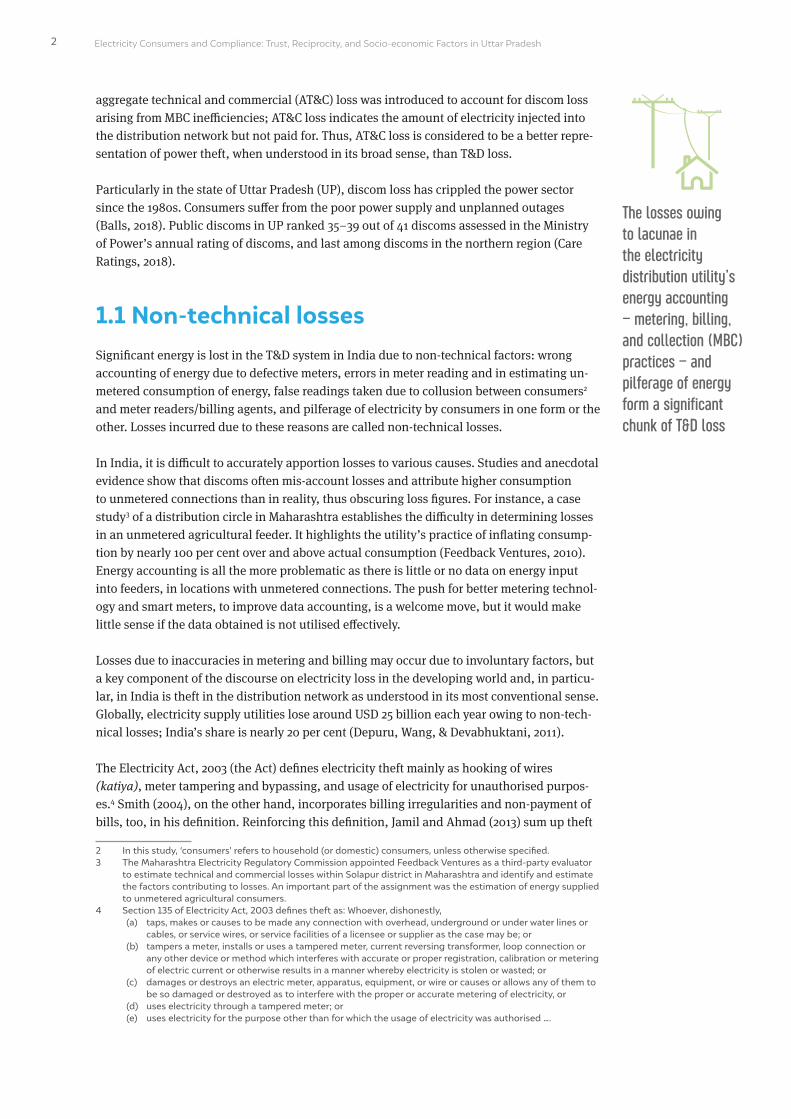
1.1 Non-technical losses 2
1.2 The case of Uttar Pradesh 3
1.3 Non-technical losses and associated impacts 4
1.4 Drivers of compliance and theft 5
1.5 Motivation and objectives 8
2. Methodology and Framework for Assessment 13
2.1 Survey of households in UP 14
2.2 Framework for assessment of survey fi ndings 16
2.3 Limitations of the survey 17
3. Survey Findings 19
3.1 Power supply and consumer satisfaction 19
3.2 Metering and billing – the building blocks 22
3.3 Metering, billing, and collection losses 25
3.4 Electricity theft 32
4. Conclusion and Way Forward 41
Bibliography 43
x Electricity Consumers and Compliance: Trust, Reciprocity, and Socio-economic Factors in Uttar Pradesh
LIST OF FIGURES
Figure 1: Electric Power T&D Losses (% of output) 1
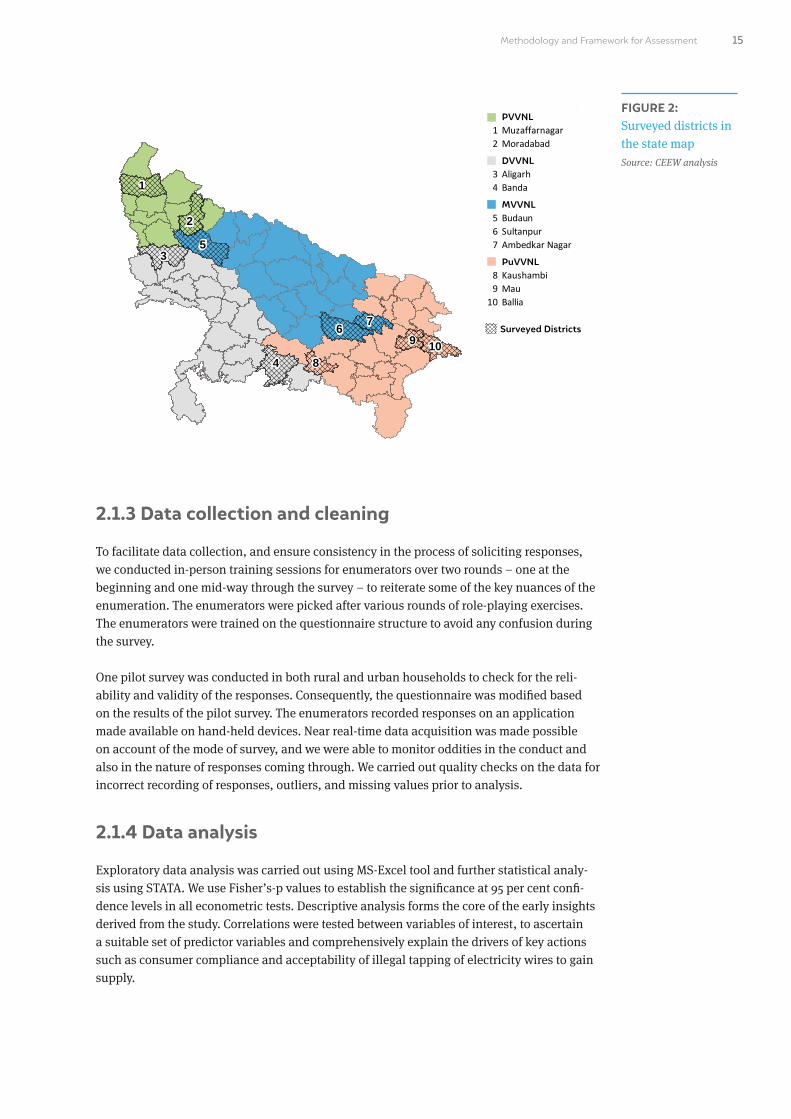
Figure 2: Surveyed districts in the state map 15
Figure 3: Improving power supply situation in UP 19
Figure 4: Power supply hours measured by sensors deployed across the state of UP 20
Figure 5: Demand-supply gap in electricity supplied in rural and urban areas 21
Figure 6: High share of unmetered consumers in discoms of UP 22
Figure 7: Low metering in rural areas 24
Figure 8: Metering exercise relatively recent in rural households 25
Figure 9: Infrequent billing in rural households 26
Figure 10: Differences in billing frequency across UP discoms for rural households 26
Figure 11: Proactiveness of consumers in the face of non-receipt of a bill 28
Figure 12: About half of rural consumers and a quarter of urban consumers do not pay their bills ahead of due date 30
Figure 13: Consumers facing infrequent billing are less likely to make complete payments 30
Figure 14: Low preference for online payments in urban and rural areas 31
Figure 15: Low trust levels on discom offi cials, discom agents and state government 36
LIST OF TABLES
Table 1: Classifi cation of non-technical losses 3
Table 2: AT&C loss (%) of discoms in Uttar Pradesh 9
Table 3: Districts sampled for survey and respective discom areas 14
Table 4: Income disparity across discom regions 21
Table 5: Profi le of unmetered domestic consumers in UP 23
Table 6: Effi ciency in issuing fi rst bill is low even in urban areas 26
Table 7: Employee costs of discoms 27
Table 8: Domestic consumers of States 27
Table 9: Summary of the status of MBC 32
Table 10: Financial management of utility and perceived personal cost important drivers of katiya acceptance 33-34
Table 11: Frequency of billing more important than trust and corruption perception in driving compliance 37-38
Table 12: Disparity across UP discoms 39
Table 13: Policy roadmap for sustaining reliable electricity supply in Uttar Pradesh 42
xi
ABBREVIATIONS
ACCESS Access to Clean Cooking Energy and Electricity Survey of States
ACoS average cost of supply
AMR automated meter reader
AMI advanced metering infrastructure
ARR annual revenue requirement
AT&C aggregate technical and commercial
CEA Central Electricity Authority
DDUGJY Deen Dayal Upadhyaya Gram Jyoti Yojana
Discom distribution company
DVVNL Dakshinanchal Vidyut Vitaran Nigam Limited
ESMI Electricity Supply Monitoring Initiative
FY fi nancial year
GCI Global Corruption Index
GJ Gujarat
HT half the time
IEA International Energy Agency
KA Karnataka
kW kilo watt
kWh kilo watt hour
HH household
INR Indian Rupees
MBC metering, billing and collection
MoP Ministry of Power
MoU Memorandum of Understanding
MH Maharashtra
MT most of the time
MVVNL Madhyanchal Vidyut Vitaran Nigam Limited
PEG Prayas Energy Group
PVVNL Paschimanchal Vidyut Vitaran Nigam Limited
PuVVNL Purvanchal Vidyut Vitaran Nigam Limited
R-APDRP Restructured Accelerated Power Development Reforms Programme
Saubhagya Pradhan Mantri Sahaj Bijli Har Ghar Yojana
ST some of the time
T&D transmission and distribution
TPL Torrent Power Limited
UDAY Ujwal Discom Assurance Yojana
UP Uttar Pradesh
UPERC Uttar Pradesh Electricity Regulatory Commission
UPPCL Uttar Pradesh Power Corporation Limited
USD United States Dollar

xii Electricity Consumers and Compliance: Trust, Reciprocity, and Socio-economic Factors in Uttar Pradesh
Paying consumers making one-time bill payments in full
86% When billed monthly
73% Bi-monthly or longer
~42% of the total electricity supplied by all the discoms is consumed by households
Electricity is supplied for
17 hours in urban areas
12 hours in rural areas
55%of rural consumers are unmetered
Source: CEEW analysis
Image: iStock
xiii
In September 2017, the Government of India announced its ambitions to achieve 100 per
cent household electrifi cation through the Saubhagya scheme. Under this, Uttar Pradesh
(UP) will have added the largest number of households to its existing consumer base – as
many new consumers as being served by state distribution companies (discoms) before the
launch of the scheme. Discoms, already plagued by high under-recovery, face the onerous
challenge of serving a large consumer base that has low capacity to pay. A lion’s share of
the electricity consumption in UP – about 42 per cent of the total electricity supplied by all
discoms – is attributable to domestic consumers (households). More than two-thirds of the
total subsidy earmarked (for discoms) for 2017–2020 is targeted at rural consumers. That
is the size of public spending needed to enable the incremental universal energy access.
Household consumption signifi cantly impacts the overall fi nancial position of discoms and
the state.
Any discussion on losses and theft calls for an evaluation of services provided by discoms.
Electricity loss other than that attributable to technical reasons may be broadly classifi ed
into hard theft and metering, billing, and collection (MBC) losses. Hard theft refers to theft as
defi ned under Section 135 of the Electricity Act-2003 (referred as Act) and entails, mainly,
theft due to hooking of wires (katiya), meter tampering, and unauthorised electricity usage,
and includes wilful misrepresentation of electricity consumption. MBC losses are a ‘soft’
form of theft, arising from lax operational diligence of the discom and the consumer’s lack
of awareness, which precipitates consumer indiff erence or alienates them. This soft theft
includes inter alia losses due to incorrect recording or wrong accounting of energy consump-
tion at the discom’s end, billing irregularities, and non-timely payment or non-payment of
outstanding amounts by consumers as per bills.
Overwhelmingly, households believe that the government should oversee energy provision
and management, but the provision of electricity beyond the limited levels required to pro-
mote development outcomes must be on commercial terms, where the full value of electric-
ity is realised by every stakeholder in the value chain. As an evaluation of the Ujwal Discom
Assurance Yojana and Power for All is undertaken in 2019–2020, the experience in UP will
shape the policy discourse. We carried out our study to improve the understanding of the
discom–consumer relationship and of how this relationship manifests in supply outcomes
for the consumer.
EXECUTIVE SUMMARY
Uttar Pradesh An opportunity to alter the national debate

xiv Electricity Consumers and Compliance: Trust, Reciprocity, and Socio-economic Factors in Uttar Pradesh
This study aims to
unpack the commercial losses attributed to domestic consumers;
capture the consumer perspective and actions (or lack thereof) in the midst of the
administrative reform under way; and
explore how this reform can help drive targeted activities to improve compliance,
satisfaction, and create a virtuous cycle for the utility business in the state.
Sampling, survey, and dataIn addition to relying on administrative data, stakeholder interviews and interactions, CEEW
undertook a consumer survey to capture the fi ner details of electricity distribution in UP.
The survey captures information on the electricity supply situation, compliance metrics,
perceptions on trust and prevalence of theft and most importantly, social and economic
endowments of households in rural and urban areas. The survey was supported by Shakti
Sustainable Energy Foundation and conducted in association with the Initiative for Sustain-
able Energy Policy at the School of Advanced International Studies, Johns Hopkins Univer-
sity. Extending across 10 districts of the state in both rural and urban areas, the survey was
undertaken over a three-month period from April 2018 to June 2018.
The sampling design is representative of rural and urban areas. The fi ndings can be extend-
ed to the state as a whole. The 10 districts (Aligarh, Ambedkar Nagar, Banda, Ballia, Budaun,
Kaushambi, Mau, Moradabad, Muzaff arnagar, and Sultanpur) cover the operating areas of
four of the fi ve public distribution companies – Dakshinanchal Vidyut Vitran Nigam Limited
(DVVNL), Paschimanchal Vidyut Vitran Nigam Limited (PVVNL), Purvanchal Vidyut Vitran
Nigam Limited (PuVVNL), and Madhyanchal Vidyut Vitran Nigam Limited (MVVNL). We
surveyed a total of 90 villages (rural), 90 wards (urban), and around 1,800 households – 900
each in rural and urban areas.
Discom services through the consumer’s lensElectricity is supplied for 17 hours in urban areas and 12 hours in rural areas (median fi gure).
Both rural and urban households experience the highest gap between availability and
requirement from 5 pm to 11 pm. Supply during evening and late evening hours is highly
valued by consumers, especially urban consumers. Their satisfaction with supply is linked to
availability during this period.
The lack of metering among residential consumers is one of the major contributors to discom
losses. The share of unmetered consumers in rural areas is expectedly high – 55 per cent. The
standout observation is that 10 per cent of urban consumers are unmetered. In rural house-
holds, meters are relatively new (see fi gure next page). The median age of meters installed in
rural areas of three of the discoms (barring MVVNL) is less than one year. Metered connec-
tions are much older in most urban areas. In the PuVVNL service area, however, the median
age of meters in urban areas is only three years. Many urban areas are well short of complete
metering as well.
Billing is a key part of the discom service value chain, but discoms fi nd the exercise adminis-
tratively and fi nancially draining. Apart from technical challenges (IT systems, ledgerisation,
indexation of consumers), discoms in UP lack the manpower to cover the vast region they
This study aims to capture the consumer perspective and actions (or lack thereof) in the midst of the administrative reform under way

xv
serve, and their administrative cost of reading meters manually and issuing bills is high. Bill-
ing is more frequent in PVVNL areas than in others, but it is lax in the MVVNL control area
(see fi gure above).
The fi nancial burden of accumulated bills is signifi cant on rural households, especially
those with low and seasonal incomes; they fi nd it diffi cult to set aside large sums in the
anticipation of bills. The signifi cance of monthly billing is evident in the bill payments made
by consumers. When billed monthly, 86 per cent of paying consumers make one-time bill
payments in full, but this fi gure falls to 73 per cent if the billing frequency is bi-monthly or
longer. We also fi nd that when billed frequently, rural households pay their dues just as
much as urban households do. A delay in payments from consumers aff ects discoms’ work-
ing capital fl ows, and they are forced to resort to commercial borrowing to fi nance day-to-day
operations – yet another avoidable cost.
Metering exercise
relatively
recent for rural
households
Source: CEEW analysis
Billing in rural
households is
infrequent
Source: CEEW analysis
0%
10%
20%
30%
40%
50%
60%
70%
80%
90%
100%
Muz
affa
rnag
ar
Mor
adab
ad
Mau
Kau
sham
bi
Bal
lia
Sult
anpu
r
Bud
aun
Am
bedk
arN
agar
Ban
da
Alig
arh
<1 year
% o
f hou
seho
lds
1-5 years 5-10 years 10-20 years >20 yearsDVVNL MVVNL PuVVNL PVVNL
69.2
32.5
55
35.5
13.3
42.9
61.1 57.148.9
62.9
20.5
37.5
3558.1
28.9
35.7
38.9
25 38.3
29
5
10
37.8
7.1 7.13.2
12.55
6.517.8 7.1
7.1 8.51.65.2 7.5 5
2.27.1
3.6 4.3 3.2Years since installation of first meter
0
10%
20%
30%
40%
50%
60%
70%
80%
90%
100%
Muz
affa
rnag
ar
Mor
adab
ad
Mau
Kau
sham
bi
Bal
lia
Sult
anpu
r
Bud
aun
Am
bedk
arN
agar
Ban
da
Alig
arh
Monthly Bi-monthly Every 3 months >3 months Others
DVVNL MVVNL PuVVNL PVVNL
Shar
e of
hou
seho
lds
42.6
36.7
35.7
12
40
17
10
13
20
39.6
23.9
10.6
15.9
10
8
28
12
52
24
17
10
19
30
9
16
26
40
9
21
26
9
21
23
41
22
16
16
5
59
74
22
8
53
21
212
12
Discom-wise billing frequency in rural households
Executive Summary
When billed frequently, rural households pay their dues just as much as urban households do

xvi Electricity Consumers and Compliance: Trust, Reciprocity, and Socio-economic Factors in Uttar Pradesh
RURAL URBAN
Surveyed HHs 900 900
Share of grid-connected HHs 85% 95%
Share of metered HHs 45% 90%
Share of metered and billed HHs 33% 85%
Share of metered billed and paying HHs 28% 79%
Source: CEEW analysis
The table above shows the progressive decline in discom effi ciency from supply to bill-
ing. Despite this, nearly 63 per cent of all legally connected consumers pay some non-zero
amount in lieu of their dues.
Trust, compliance, and hard theftLosses arising from indiff erence to proper metering, billing, and collection – on the part of
both discoms and consumers – are large enough to signifi cantly dent utility fi nances. When
measurement is absent to such a large degree, speculation gives rise to alternative explana-
tions that promote the notion of extensive hard theft, to explain high levels of discom losses.
With such entrenched issues, it is unlikely that aggregate technical and commercial (AT&C)
targets can be met soon. A more pragmatic approach that gathers support for metering and
provides resources for extensive billing and collection infrastructure, is needed. Curbing
hard theft of electricity has been one of the key goals of the present administration in the
state, and eff orts are under way to improve monitoring and reduce discom losses from elec-
tricity theft. That said, we take a look at the socio-economic drivers of electricity theft in the
state.
To assess how they view the utility business, we asked households to rate the importance of
four attributes of a utility – quality of electricity service, method and frequency of bill collec-
tion, communications with the utility employee, and good fi nancial management of the util-
ity – on a scale of 1 (least) to 5 (most). An overwhelming share of rural and urban households
valued supply quality (70 per cent rating of ‘important’ or ‘very important’). The method and
frequency of bill collection was considered important by 51 per cent of rural respondents but
67 per cent of urban residents. Good fi nancial management was considered important by
57 per cent of rural residents and 59 per cent of urban residents. Many people who consider
supply quality important do not consider the fi nancial management of the utility important;
that suggests that the commercial aspects of the utility business are not widely understood.
Metered consumers exhibited a lesser acceptance of katiya among other consumers. An
increase in the perceived importance of the utility’s fi nancial management results in lesser
acceptance. More than 84 per cent of respondents fi nd katiya either unacceptable or highly
unacceptable, but more than 52 per cent of them would issue only a warning to anyone
found using a katiya. This is in line with the offi cial position for the most part where crimi-
nal proceedings have rarely been undertaken. Levying heavy punishments is, however, not
the only contributor to discouraging dishonest behaviour; the perceived likelihood of being
punished must also increase commensurately.
Overall, consumer trust in the utility (the principal) and its actors (agents – discom offi -
cials, linesmen, bill agents) is low – less than 20 per cent of consumers trust these entities.
In rural areas, the median monthly payment is INR 60 to the linesman and INR 250 to the discom, and in urban areas it is ~INR 100 to the linesman and INR 600 to the discom
Declining effi ciency
from supply to
collection
Source: CEEW analysis

xvii
The principal is particularly distrusted. Given the distrust, is the consumer exploiting the
principal–agent asymmetry to their benefi t? Overall, nearly 23 per cent of all grid-connected
rural households make a monthly non-zero payment to the linesman. This share drops to 15
per cent in urban areas. A majority of households reporting payments to the linesman report
that they regularly pay their utility dues too. In rural areas, the median monthly payment is
INR 60 to the linesman and INR 250 to the discom, and in urban areas it is ~INR 100 to the
linesman and INR 600 to the discom. For households that make an informal payment to the
linesman, the sum is substantial relative to their formal payment to the discom.
However, it would be diffi cult to attribute these payments as indicators of theft. Documented
accounts suggest that the utility lacks the manpower to carry out various operational and
maintenance works, and that households have to pay the linesman to attend to faults in their
homes or investigate power outages. Payments to bill agents are reported by only 2 per cent
of the population.
An econometric assessment of the drivers of compliance (in paying bills) shows that lack of
trust in the utility and perception of corruption are signifi cant deterrents. Frequent billing is
the most important and consistent driver. Households that are billed more frequently are 57
per cent more likely to pay on time and 72 per cent more likely to pay in full than households
that are not. The fi ndings suggest that, both principal and agent need an image makeover. To
maintain service standards, and persuade consumers of the intent for reform, increased en-
gagement with consumers through targeted outreach and communication will be essential.
Households that are billed more frequently are 57 per cent more likely to pay on time and 72 per cent more likely to pay in full than households that are not
Executive Summary
Uttar Pradesh has not one but a diverse set of challenges in dealing with losses
Uttar Pradesh is not a singular entity - in terms of the extent of the various challenges faced by the power sector.
The four discom regions present signifi cant diversity in geographical spread, economic status, demographic
mix, and prevailing social norms. The Purvanchal region in the state is the poorest performer on most of the
discom service parameters. In part, some of this can be attributed to the consumer mix as well. PuVVNL has
the most skewed residential consumer mix with 70% being in rural areas. While the rest have a higher share of
urban consumers, as compared to rural, MVVNL will see a near tripling of its consumer base, as per recent tariff
orders. Many of these rural consumers are unmetered, and not surprisingly, our study reveals consumers of
MVVNL and PuVVNL service areas are more accepting of the practice of katiya. The share of paying – industrial
and commercial, consumer base is expected to decrease for all discoms and even at present PuVVNL and DVVNL
have a disproportionately low share. The power sector scenario could improve when the expectations from the
discom refl ect the situation on the ground. Madhyanchal discom, despite benefi ting from housing the seat of
political power, has also come up short on performance. The drivers of issues in each of these discoms arise from
dissimilar endowments – political capital, economic progress, social norms and, most importantly, the discom’s
competency to administer the region under their control. Both state and central government agencies must
acknowledge that all discoms in UP cannot function under one effi ciency improvement trajectory. The targets
under UDAY are paced much more aggressively for poorer performing discoms.
A true separation of discoms, and autonomy for each, is not on the cards. The immediate focus must fi rmly be
on augmenting resources for metering and delivering bills periodically and etching in the consumer’s mind that
payment is mandatory, and non-negotiable. Driving this common agenda is important, alongside the need to
provide context-specifi c incentives – to both consumers and discom agents. It would be important, especially in
areas with a signifi cant new-consumer base, to conduct awareness-raising campaigns on consumers’ fi nancial
responsibility to discoms and the implications of losses on the quality of supply. Bill-paying consumers must also
be in a position to hold the discom to account for supply quality and service levels, as envisaged in the supply
code.

xviii Electricity Consumers and Compliance: Trust, Reciprocity, and Socio-economic Factors in Uttar Pradesh
Image: iStock

1
Arguably, the standout feature of India’s power system is the scale of annual losses – in
both energy (kWh) and fi nancial terms (INR) – of the utilities involved in supplying elec-
tricity (discoms). The share of electricity injected into the network but not accounted for in
fi nal billing is nominally defi ned as the transmission and distribution (T&D) loss. This T&D
loss comprises technical and non-technical loss incurred in the wires and through various
transformations that electricity undergoes as it reaches end consumers.1 Technical loss is
due to energy dissipated in T&D equipment. The T&D loss is higher in India than in its neigh-
bours in South Asia, Brazil, China, Russia, and South Africa (IEA, 2018) (Figure 1).
In developing countries, the losses owing to lacunae in the electricity distribution utility’s
energy accounting – metering, billing, and collection (MBC) practices – and pilferage of
energy form a signifi cant chunk of T&D loss. In most parts of the developed world, T&D loss
is essentially technical loss, as utilities are competitively operated; they move electricity ef-
fi ciently, and they bill clients for their level of consumption. Technical and governance chal-
lenges plague the electricity distribution sector in India, and public utilities lack the capacity
and resources to monitor their vast consumer base.
Metering is poor at various points in the network – interface, distribution feeders, and end
consumers – and estimating input energy and energy billed is diffi cult. The measure of
1 In the case of India, the IEA data represents the difference between net generation and consumption (from utilities and captive). In effect, it subsumes all underlying losses into the T&D component. The overall loss fi gure is 20 per cent because captive consumption does not experience the same kind of losses – technical or non-technical – that utility supply does. Many captive plants are on-site and do not traverse much of the T&D network.
1. Introduction
FIGURE 1: Electric power T&D
losses (% of output)
Source: Electric power T&D
losses (% of output), IEA
Statistics © OECD/IEA 2014
0
5
10
15
20
25
South-Asia
SouthAfrica
RussiaIndiaChinaBrazil
Per
cen
t
15.8%
5.5%
19.4%
10%8.4%
18.9%
T&D loss (per cent) India and it's global counterparts
2 Electricity Consumers and Compliance: Trust, Reciprocity, and Socio-economic Factors in Uttar Pradesh
aggregate technical and commercial (AT&C) loss was introduced to account for discom loss
arising from MBC ineffi ciencies; AT&C loss indicates the amount of electricity injected into
the distribution network but not paid for. Thus, AT&C loss is considered to be a better repre-
sentation of power theft, when understood in its broad sense, than T&D loss.
Particularly in the state of Uttar Pradesh (UP), discom loss has crippled the power sector
since the 1980s. Consumers suff er from the poor power supply and unplanned outages
(Balls, 2018). Public discoms in UP ranked 35–39 out of 41 discoms assessed in the Ministry
of Power’s annual rating of discoms, and last among discoms in the northern region (Care
Ratings, 2018).
1.1 Non-technical lossesSignifi cant energy is lost in the T&D system in India due to non-technical factors: wrong
accounting of energy due to defective meters, errors in meter reading and in estimating un-
metered consumption of energy, false readings taken due to collusion between consumers2
and meter readers/billing agents, and pilferage of electricity by consumers in one form or the
other. Losses incurred due to these reasons are called non-technical losses.
In India, it is diffi cult to accurately apportion losses to various causes. Studies and anecdotal
evidence show that discoms often mis-account losses and attribute higher consumption
to unmetered connections than in reality, thus obscuring loss fi gures. For instance, a case
study3 of a distribution circle in Maharashtra establishes the diffi culty in determining losses
in an unmetered agricultural feeder. It highlights the utility’s practice of infl ating consump-
tion by nearly 100 per cent over and above actual consumption (Feedback Ventures, 2010).
Energy accounting is all the more problematic as there is little or no data on energy input
into feeders, in locations with unmetered connections. The push for better metering technol-
ogy and smart meters, to improve data accounting, is a welcome move, but it would make
little sense if the data obtained is not utilised eff ectively.
Losses due to inaccuracies in metering and billing may occur due to involuntary factors, but
a key component of the discourse on electricity loss in the developing world and, in particu-
lar, in India is theft in the distribution network as understood in its most conventional sense.
Globally, electricity supply utilities lose around USD 25 billion each year owing to non-tech-
nical losses; India’s share is nearly 20 per cent (Depuru, Wang, & Devabhuktani, 2011).
The Electricity Act, 2003 (the Act) defi nes electricity theft mainly as hooking of wires
(katiya), meter tampering and bypassing, and usage of electricity for unauthorised purpos-
es.4 Smith (2004), on the other hand, incorporates billing irregularities and non-payment of
bills, too, in his defi nition. Reinforcing this defi nition, Jamil and Ahmad (2013) sum up theft
2 In this study, ‘consumers’ refers to household (or domestic) consumers, unless otherwise specifi ed.3 The Maharashtra Electricity Regulatory Commission appointed Feedback Ventures as a third-party evaluator
to estimate technical and commercial losses within Solapur district in Maharashtra and identify and estimate the factors contributing to losses. An important part of the assignment was the estimation of energy supplied to unmetered agricultural consumers.
4 Section 135 of Electricity Act, 2003 defi nes theft as: Whoever, dishonestly, (a) taps, makes or causes to be made any connection with overhead, underground or under water lines or
cables, or service wires, or service facilities of a licensee or supplier as the case may be; or (b) tampers a meter, installs or uses a tampered meter, current reversing transformer, loop connection or
any other device or method which interferes with accurate or proper registration, calibration or metering of electric current or otherwise results in a manner whereby electricity is stolen or wasted; or
(c) damages or destroys an electric meter, apparatus, equipment, or wire or causes or allows any of them to be so damaged or destroyed as to interfere with the proper or accurate metering of electricity, or
(d) uses electricity through a tampered meter; or (e) uses electricity for the purpose other than for which the usage of electricity was authorised ….
The losses owing to lacunae in the electricity distribution utility’s energy accounting – metering, billing, and collection (MBC) practices – and pilferage of energy form a significant chunk of T&D loss
3
in three Rs: improper recording of electricity, due to illegal abstraction through hooking of
wires and meter tampering; inaccurate reporting of electricity consumption due to collusion
between employees and consumers; and low recovery, due to non-payment of bills by con-
sumers. These activities are not all voluntary in nature –or wilful acts of commission on the
part of the consumer or discom – but they all contribute to the discom’s energy and revenue
loss.
Electricity loss not attributable to technical reasons may be classifi ed into hard theft and
MBC loss. ‘Hard theft’ refers to theft as defi ned under Section 135 of the Act, which entails
theft due to hooking of wires (katiya), meter tampering, unauthorised electricity usage, and
wilful acts of misrepresenting electricity consumption; MBC losses refer to losses arising
from lax operational diligence of the discom or the consumer’s lack of awareness, which
precipitates consumer indiff erence or alienates them, and are outside the wilful actions
mentioned under Section 135 of the Act. Metering, billing, and collection losses are a subtle
form of theft, which include inter alia losses due to incorrect recording or wrong accounting
of energy consumption at the discom’s end, billing irregularities, non-payment of outstand-
ing amounts by consumers as per bills, and non-timely payments by consumers.
Electricity utilities mis-account energy consumption by unmetered consumers to mask inef-
fi ciencies and their inability to operate in a fi nancially prudent manner (Swain and Charnoz,
2012). Discoms need to institute stringent metering and billing practices; mis-accounting lets
them put it off . Non-timely payment of bills results in debtor days, which aff ect the discom’s
collection rate and adds to their operational burden. Consumers and discom offi cials are
culpable in both hard and soft theft.
Activities defi ned as ‘Hard Theft’ - wilful acts Activities resulting in metering, billing, and collection losses
Hooking of wires Lack of metering or appropriate recording of consumption
Tampering and bypassing of meter Billing irregularities
Damaging meter and other electricity appara-tus and wilful misrepresentation of consump-tion
Non-receipt of bills by consumers
Using electricity for unauthorised purposes Non-payment, partial payment, or irregular payment of bills
1.2 The case of Uttar PradeshUttar Pradesh has the largest population, the largest number of households added under the
Saubhagya scheme, and the highest commitment to reforms under the Ujwal Discom Assur-
ance Yojana (UDAY); and, therefore, the greatest need to address discom losses. Electricity
utilities in UP ran up approximately INR 30,000 crores in losses in FY 2015–16, the largest in
any state (PFC India, 2017). That fi gure is 75 per cent of the state’s power purchase cost for
that year (PFC India, 2017; UPERC, 2015). The multi-year tariff order for the period 2017–2020
had a loss target of 11.96 per cent for the terminal year of the order, and this is more aggres-
sive than what Uttar Pradesh had committed to in the UDAY MoU (14.86 per cent) (Ministry
of Power, 2016; UPERC, 2017, p. 162). However, the state’s AT&C losses stood at 33.08 per cent
(as of December 2018), which accentuates the socio-economic realities peculiar to the state,
TABLE 1: Classifi cation of
non-technical losses
Source: CEEW analysis
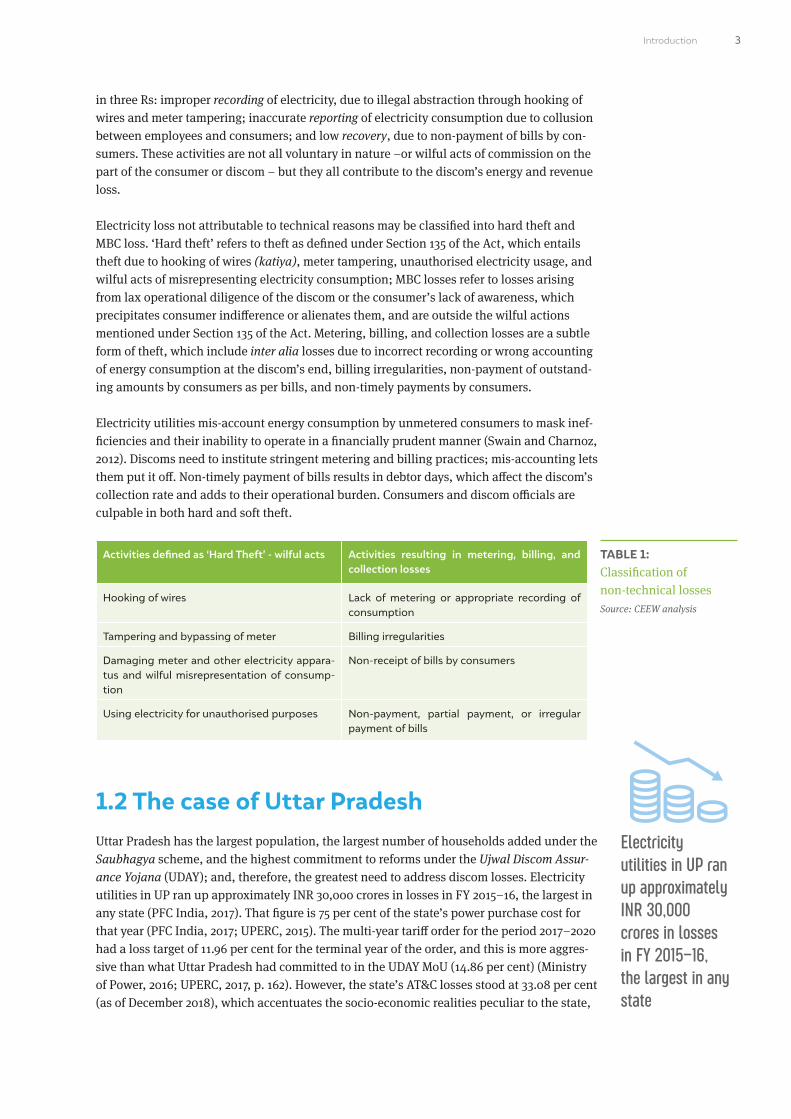
Electricity utilities in UP ran up approximately INR 30,000 crores in losses in FY 2015–16, the largest in any state
Introduction
4 Electricity Consumers and Compliance: Trust, Reciprocity, and Socio-economic Factors in Uttar Pradesh
within which its electricity distribution sector operates, and suggests that the state faces
challenges in delivering on past promises (Ministry of Power2018).
The Uttar Pradesh Power Corporation Limited (UPPCL) manages power procurement and
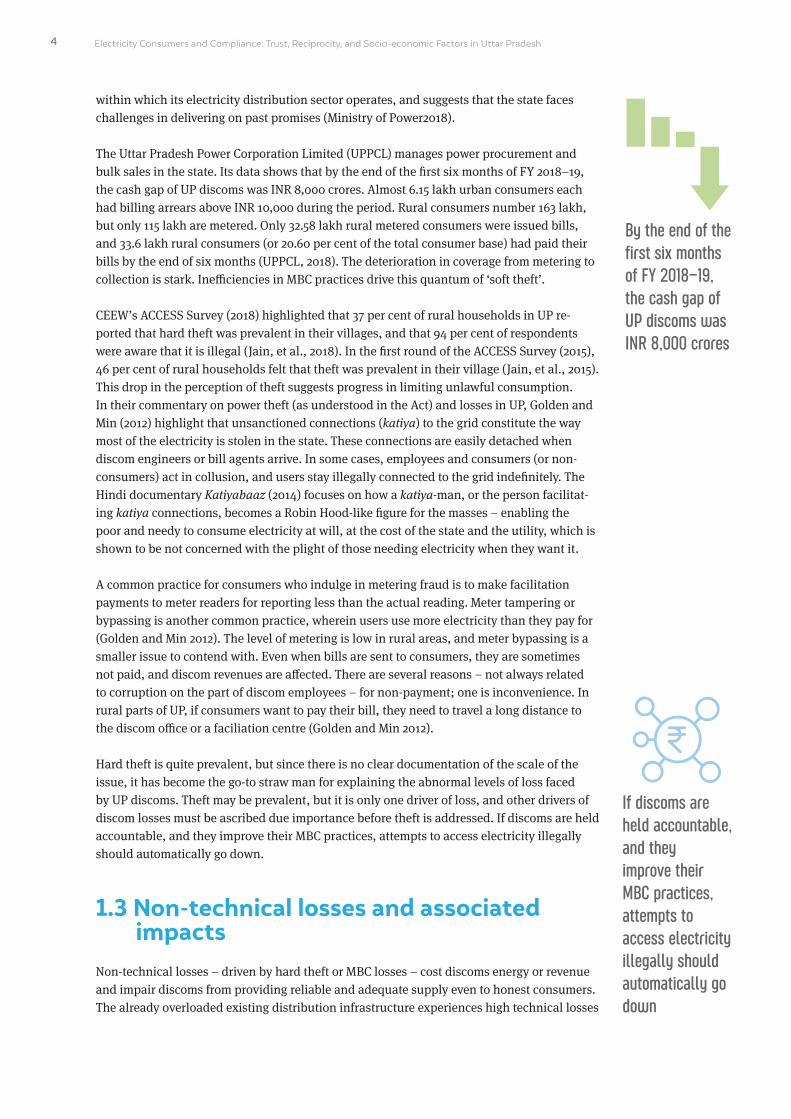
bulk sales in the state. Its data shows that by the end of the fi rst six months of FY 2018–19,
the cash gap of UP discoms was INR 8,000 crores. Almost 6.15 lakh urban consumers each
had billing arrears above INR 10,000 during the period. Rural consumers number 163 lakh,
but only 115 lakh are metered. Only 32.58 lakh rural metered consumers were issued bills,
and 33.6 lakh rural consumers (or 20.60 per cent of the total consumer base) had paid their
bills by the end of six months (UPPCL, 2018). The deterioration in coverage from metering to
collection is stark. Ineffi ciencies in MBC practices drive this quantum of ‘soft theft’.
CEEW’s ACCESS Survey (2018) highlighted that 37 per cent of rural households in UP re-
ported that hard theft was prevalent in their villages, and that 94 per cent of respondents
were aware that it is illegal (Jain, et al., 2018). In the fi rst round of the ACCESS Survey (2015),
46 per cent of rural households felt that theft was prevalent in their village (Jain, et al., 2015).
This drop in the perception of theft suggests progress in limiting unlawful consumption.
In their commentary on power theft (as understood in the Act) and losses in UP, Golden and
Min (2012) highlight that unsanctioned connections (katiya) to the grid constitute the way
most of the electricity is stolen in the state. These connections are easily detached when
discom engineers or bill agents arrive. In some cases, employees and consumers (or non-
consumers) act in collusion, and users stay illegally connected to the grid indefi nitely. The
Hindi documentary Katiyabaaz (2014) focuses on how a katiya-man, or the person facilitat-
ing katiya connections, becomes a Robin Hood-like fi gure for the masses – enabling the
poor and needy to consume electricity at will, at the cost of the state and the utility, which is
shown to be not concerned with the plight of those needing electricity when they want it.
A common practice for consumers who indulge in metering fraud is to make facilitation
payments to meter readers for reporting less than the actual reading. Meter tampering or
bypassing is another common practice, wherein users use more electricity than they pay for
(Golden and Min 2012). The level of metering is low in rural areas, and meter bypassing is a
smaller issue to contend with. Even when bills are sent to consumers, they are sometimes
not paid, and discom revenues are aff ected. There are several reasons – not always related
to corruption on the part of discom employees – for non-payment; one is inconvenience. In
rural parts of UP, if consumers want to pay their bill, they need to travel a long distance to
the discom offi ce or a faciliation centre (Golden and Min 2012).
Hard theft is quite prevalent, but since there is no clear documentation of the scale of the
issue, it has become the go-to straw man for explaining the abnormal levels of loss faced
by UP discoms. Theft may be prevalent, but it is only one driver of loss, and other drivers of
discom losses must be ascribed due importance before theft is addressed. If discoms are held
accountable, and they improve their MBC practices, attempts to access electricity illegally
should automatically go down.
1.3 Non-technical losses and associated impacts
Non-technical losses – driven by hard theft or MBC losses – cost discoms energy or revenue
and impair discoms from providing reliable and adequate supply even to honest consumers.
The already overloaded existing distribution infrastructure experiences high technical losses
By the end of the first six months of FY 2018–19, the cash gap of UP discoms was INR 8,000 crores
If discoms are held accountable, and they improve their MBC practices, attempts to access electricity illegally should automatically go down

5
and interruptions, which in itself undermines the quality of service provided. It aff ects the
overall productivity of assets and deters much needed investments.
Hard theft of electricity creates a vicious spiral where poor investments and poor returns
reinforce each other to drive the system into the ground (Gaur and Gupta, 2016). If the under-
standing of current patterns of electricity consumption is poor, projections of demand will be
incorrect; and poor demand projections drive sub-optimal procurement practices and force
discoms to resort to unscheduled power outages at peak periods. The unpredictable amount
of additional load also imposes uncertainties on the generation assets that are requisitioned
by the discom.
In a regulated return environment, discoms pass on a signifi cant portion of the losses to con-
sumers as tariff s. Discoms borrow to tide over the rest of the losses, and pass the interest on
borrowings to tariff -paying consumers. Every consumer, sanctioned or otherwise, pays taxes
indirectly to the system, and they pay for government bailout schemes – such as Financial
Restructuring Plan 1 and 2 and UDAY – to turn discoms around.
1.4 Drivers of compliance and theftEvery electricity system has distinct characteristics. These characteristics are linked to the
socio-economic realm within which the system operates, and these need to be understood
to address the problem of theft (Smith, 2004). Factors such as corruption levels, human
development indicators, income, religion and caste dynamics, and tariff interact with one
another in various ways and manifest themselves in diff erent forms of theft (Saini, 2017). For
instance, billing disputes constitute a signifi cant issue as evinced in the petitions fi led in
the consumer grievance redressal forums, and this is an issue that discoms need to address
urgently. Consumer behaviour is aff ected by (inter alia) social and economic determinants
such as purchasing power, corruption, trust in the utility, and trust in society.
1.4.1 Purchasing power
Uttar Pradesh, with a population of more than 200 million, has one of the lowest per capita
incomes in the country (Census, 2011; MOSPI, 2017). The per capita energy consumption in
UP is 524 kWh, against the all India average of 1,075 kWh (Ministry of Power, 2017). The rural
household electrifi cation level was 65 per cent for the state as on 6 June 2018; this fi gure is
the third lowest in India (Ministry of Power, 2018).5 Of all the rural households in UP that are
not connected to the electricity grid, 46 per cent have no interest in applying for new connec-
tions (Jain, et al., 2018). In a few districts, un-electrifi ed households using kerosene as their
primary source of lighting were of the view that grid electricity is expensive, even though
they were spending as much on kerosene.
The Ministry of Power introduced the universal household electrifi cation programme, Saub-
hagya, in September 2017. Under the Saubhagya scheme, willing and poor households were
to be given free connections, and other households could avail a connection for a nominal
payment in monthly instalments. This provision should have resolved the challenges associ-
ated to high upfront cost, but the perception that recurring costs will be high and supply
unreliable still persist.
5 Though electrifi cation rates have subsequently increased, on account of the Saubhagya programme.
Of all the rural households in UP that are not connected to the electricity grid, 46 per cent have no interest in applying for new connections
Introduction
6 Electricity Consumers and Compliance: Trust, Reciprocity, and Socio-economic Factors in Uttar Pradesh
ACCESS 2018 highlighted that at least 40 per cent of the electrifi ed households (Jain, et al.,
2018) were not paying for the electricity they consumed, up from 27 per cent in 2015 (Jain,
et al., 2015). That payment rates have dropped further, and exacerbated discoms’ fi nancial
woes, is at least partly because many households cannot aff ord to pay.
1.4.2 Corruption
The level of electricity theft correlates with governance indicators; theft is higher in geogra-
phies with ineff ective accountability, political instability, low government eff ectiveness, and
high corruption (Smith, 2004). India was ranked 81 out of 180 countries and territories in the
Global Corruption Index (GCI), 2017 by Transparency International, based on the perceived
levels of public sector corruption (Transparency International, 2018). Interestingly, out of
the total GCI 2017 survey respondents in UP, about 21 per cent said that corruption levels
had reduced in the state in comparison to the previous year. In another study, 59 per cent of
residents in UP admitted to have paid facilitation payments/bribes to get their work done,
out of which 38 per cent gave bribes (directly or indirectly) once or twice and 21 per cent gave
bribes (directly or indirectly) several times (Transparency International India, Local Circles,
2018).
Electricity is a source of considerable rent-seeking for discom employees (Jamil and Ahmad,
2013). The agent (discom employee) is constrained by the ability of the principal (discom, as
an institution) to set rules for them to function and closely monitor them. Generally, rules
allow employees some discretion, since thorough monitoring is exorbitant. The extent of im-
precision in the implementation of rules, and the cost of monitoring the employees in a util-
ity, may determine the level of corruption and, thus, the level of power theft in the system.
Adding the opportunity cost element to the theory, Jamil and Ahmad (2013) state that theft
occurs if its perceived cost is less than the subjective gains. A consumer can steal electricity
by bribing either the discom employee or the meter reader; whether they will depends on the
cost and benefi t of doing so. Similarly, for a discom employee, the perceived cost of colluding
with a consumer could be the fi ne imposed in case of apprehension or job dismissal.
1.4.3 Trust in the utility
Power theft originates from distrust between utility and consumers, high tariff rate, and
consumers’ unwillingness to pay for the service (Never, 2015). People’s degree of compliance
with the law depends upon their perception of the utility, their evaluation of co-inhabitants,
and their wider concerns (Winther, 2012). In the consumer–utility relationship, consum-
ers should be seen not merely as passive recipients of electricity but as agents interacting
continually with technologies (such as meters) and actors (such as bill agents and meter
readers). Consumer compliance is determined by their constant interaction with discom
infrastructure, offi cials, and agents and by the view consumers take of their attitude.
Power theft creates a vicious theft–loss spiral. Theft impairs discoms’ ability to supply elec-
tricity reliably to consumers, increases honest consumers’ dissatisfaction, and negatively
impacts willingness to pay for the service. The panel data set in the ACCESS study from 2015
and 2018 provides some evidence. Median supply hours for rural electrifi ed households
increased from 8 hours per day in 2015 to 12 hours per day in 2018; however, about two-thirds
of all households receive only three hours of supply between sunset and midnight, almost
36 per cent of electrifi ed rural households were dissatisfi ed with their electricity supply, and
In the consumer–utility relationship, consumers should be seen not merely as passive recipients of electricity but as agents interacting continually with technologies and actors

7
about 76 per cent of them complained also about frequent voltage fl uctuations that led either
to sub-optimal use or damage of appliances (Jain, et al., 2018).
As per the UP’s 24X7 Power for All Roadmap document, the state government and discoms
had committed 24 hours of electricity in all supply areas by October 2018 (Ministry of Power,
2017), but they have not met their commitment. The UPERC’s Tariff Order for FY 2017–18
states that the projections for discoms’ annual expense for FY 2018–19 will consider 24 hours
of supply, and consumer tariff shall be determined accordingly (UPERC, 2017, p. 139), but in
that case consumers are paying for 24X7 electricity while not actually receiving the service.
1.4.4 Trust in society
The literature on regulatory compliance suggests that trust nurtures compliance in society. If
citizens are not compelled to comply and, instead, they volunteer compliance, they choose
to do the right thing, and they persuade themselves that their actions are ‘virtuously right’
(Braithwaite and Makka, 1994). The relational aspects and levels of trust between consumers
and counterparts matter in determining their compliance with the law (Fjeldstad, 2004).
Consumer compliance is determined by three dimensions of trust. The fi rst two dimensions
echo the earlier notions of trust in the utility to use revenues to provide expected services
and to establish fair procedures for revenue enforcement and distribution of services. The
third dimension is the trust consumers have in other citizens (their peers, so to say) to pay
their share of the service charge. Consumers might not comply if they do not fi nd others
complying.
The discoms’ performance on the second dimension of trust can be inferred from the ACCESS
study fi ndings on metering and billing status of households in rural UP. Less than 15 per cent
of the grid-connected households had meters installed (Jain, et al., 2018); at least 25 per cent
of electrifi ed households, metered and unmetered, were not paying their electricity bill; and
25 per cent of metered households were receiving fi xed bills, as opposed to variable bills
based on their electricity consumption. This could be because the meters are not working, or
discoms were not reading them regularly; operational ineffi ciencies lead to MBC losses for
discoms and aff ect their consumers’ trust.
ACCESS 2018 fi ndings on the third dimension of trust suggest 37 per cent of rural households
held that theft is prevalent in their village; 85 per cent of unmetered rural households and
25 per cent of total connected households do not make any payments to the utility for their
consumption (Jain, et al., 2018). This perpetuates the social norm that it is acceptable for
consumers not to pay for utility services and that non-payment has no consequences.
This implicit social norm is a manifestation of path dependence – a concept rooted in his-
torical institutionalism. The literature suggests that years of conditioning electricity users to
certain attitudes, also results in power theft. The idea that electricity is one’s fundamental
right, and must be provided regardless of their ability to pay for it, could further embolden
people to indulge in theft. The mindset seems to be built on the impression that the lives of
the poor and development opportunities for them would improve if the government makes
electricity readily available to them and that, therefore, it is the government’s responsibility,
not that of other consumers or service providers (Rao, 2002). Another related notion among
illegal consumers is that it is dishonest to steal something from their neighbour but not from
the government or the discom (Depuru, Wang, and Devabhuktani, 2011).
Losses arising from electricity theft (hard and soft) constitute a contextual phenomenon; to
Introduction

8 Electricity Consumers and Compliance: Trust, Reciprocity, and Socio-economic Factors in Uttar Pradesh
study and address these, it is necessary to adopt a nuanced approach that is grounded in
studying the psycho-social and psycho-economic determinants of theft.
1.5 Motivation and objectivesUnder the Saubhagya scheme, the Government of India plans to achieve 100 per cent rural
household electrifi cation by early 2019. Under the 24x7 Power for All Scheme, the govern-
ment of UP committed to supply 24 hours electricity to all consumers (except agricultural) by
October 2018, but it has failed its commitment. Nearly 74 lakh consumers were added under
the Saubhagya scheme in UP, and nearly all of them in rural areas. If the current situation of
recovery from rural areas is anything to go by, AT&C losses of discoms are likely to increase
steeply, as will their fi nancial and administrative burden.
The UPERC’s tariff order for FY 2017–18 indicates that a lion’s share of consumption is at-
tributable to domestic consumers (households) in UP – about 42 per cent of the total energy
supplied by all the discoms in the state. Of the total state government subsidy earmarked for
the three fi nancial years 2017–18, 2018–19, and 2019–20, 67.5 per cent or INR 9,780 crores was
apportioned for providing rural domestic consumers electricity. The fi gure shows the size
of public resources required in enabling (incremental) universal energy access. Household
consumption signifi cantly impacts the discom and state’s fi nancial position.
Losses and power theft can reduce the expected benefi ts of the promised 24x7 supply and
100 per cent household electrifi cation. For discoms to be able to deliver reliable and suffi -
cient supply to all its consumers as per the performance standards in the UPERC’s Electricity
Supply Code (2005), it is essential to cut hard and soft theft. With the ‘right to electricity’ nar-
rative gaining traction in recent years, it is important to create a responsible base of consum-
ers and utility staff who duly value the electricity infrastructure service.
To curb theft and cut losses, state discoms have
• introduced better metering technology, by installing Automatic Meter Reading (AMR)-
based meters and smart meters as per UDAY’s mandate;
• installed armoured cables in areas that see high levels of ‘hard theft’;
• improved vigilance by appointing raid teams;
• instituted stringent penalties for those indulging in theft of any form; and
• put naming and shaming practices in place for discom engineers who cannot contain
AT&C loss in their jurisdiction.
In the past, UPPCL had introduced monetary rewards for offi cials who cut losses in their
jurisdiction and fi nes for those who failed (UPPCL, Letter No. 101 & 829, 2018). The state gov-
ernment had planned to privatise the distribution business in Lucknow, Meerut, Moradabad,
Varanasi, and Gorakhpur through the franchisee model, but they later scrapped the plan
(Jainani, 2018).
In the year 2008 distribution franchisees were planned in Kanpur and Agra, after which
Torrent Power Limited (TPL) took over the distribution business in Agra, in 2010. TPL was
expected to cut AT&C loss in Agra to 15 per cent by the end of FY 2016–17 as per the distribu-
tion franchisee agreement (DFA) it signed with UPPCL, but its loss by the end of FY 2015–16
was 31.68 per cent, according to an expert committee report submitted to the UPERC (UPERC,
2012). In August 2016, the last month for which losses were recorded in the report, TPL’s loss

9
was 22.4 per cent. The report found it unlikely that TPL could achieve its loss targets.
Attempts to address the issue of power theft have used conventional approaches: improved
metering (automated or manual), new methods for inspection and control, or private partici-
pation (Winther, 2011). The current tariff regime enforces a uniform retail tariff across the dis-
coms for each consumer category, but the variation in the consumer mix and socio-economic
profi le is enough to justify a diff erentiated tariff regime.
PuVVNL incurs high losses, and it is weighed down by a low industrial consumption base
and a lower urban (domestic) consumer base. In discoms like PVVNL that have a mix of
consumers that pay higher rates, the overall fi nancial performance has been better despite
little eff ort.
Socio-economic conditions vary between western, southern, and eastern UP; therefore,
purchasing power will likely be higher in some regions, as will reliance on government sup-
port in others. Since these utilities are government owned, there is no incentive to improve
performance as long as minimum benchmarks are met.
The discom-wise AT&C loss data for FY 2016–17 (Table 2) for four of UP’s discoms refl ects
the diff erence in performance of each of these discoms. Given the diff erent endowments, the
drivers of theft and MBC losses are also diff erent; and a unifi ed approach in handling this
important issue for all discom regions is certain to be sub-optimal.
Discom AT&C Loss (%, FY 2016–17)
Dakshinanchal Vidyut Vitaran Nigam Limited 43.3
Madhyanchal Vidyut Vitaran Nigam Limited 52
Pashchimanchal Vidyut Vitaran Nigam Limited 26.9
Purvanchal Vidyut Vitaran Nigam Limited 51.1
The fi nancial turnaround schemes and discom loss reduction plans are governed centrally.
In imposing similar targets on all states and discoms, the needs specifi c to states and discom
regions have been disregarded. The UDAY expects the state to cut losses to historically low
levels, but the Saubhagya scheme commits it to ensure 100 per cent rural electrifi cation and
increase subsidy outlay to ensure meaningful consumption for those with new connections.
The consumer base has increased recently, but AT&C loss was 33.08 per cent even after two
years of participating in the UDAY agreement (Ministry of Power, 2018).
The roots of hard theft lie in people’s socio-economic backgrounds; therefore, a nuanced,
contextually sensitive, bottom-up approach is needed (Saini, 2017; Winther, 2012). The CEEW
conducted a representative state-level survey of 1,800 households (both rural and urban) in
10 districts of UP with support from the Shakti Sustainable Energy Foundation and the Initia-
tive for Sustainable Energy Policy at the School of Advanced International Studies, Johns
Hopkins University.
The study aims to analyse the perception of households – those connected to the grid and
those yet to be connected – towards hard theft and its contribution to MBC losses. It aims
also to understand the psycho-economic and psycho-social determinants of power theft. The
study attempts to analyse power theft as a multifaceted phenomenon and understand its
interdependency with variables such as purchasing power, level of trust in the utility, level of
TABLE 2: AT&C loss (%) of
discoms in Uttar Pradesh
Source: Care Ratings, 2018
The study aims to analyse the perception of households – those connected to the grid and those yet to be connected – towards hard theft and its contribution to MBC losses
Introduction
10 Electricity Consumers and Compliance: Trust, Reciprocity, and Socio-economic Factors in Uttar Pradesh
trust in a society, and metering and billing status.
Based on insights obtained from the literature, and on the need to design an appropriate
strategy for curbing theft practices in UP, the study attempts to answer three research ques-
tions.
• How signifi cant is hard theft and MBC loss individually in overall discom loss?
• What determines consumer compliance? Is it a socio-economic construct or does the
discom have a role in improving compliance?
• Should a plan to curb theft be formulated for the whole of UP or for specifi c parts?
11
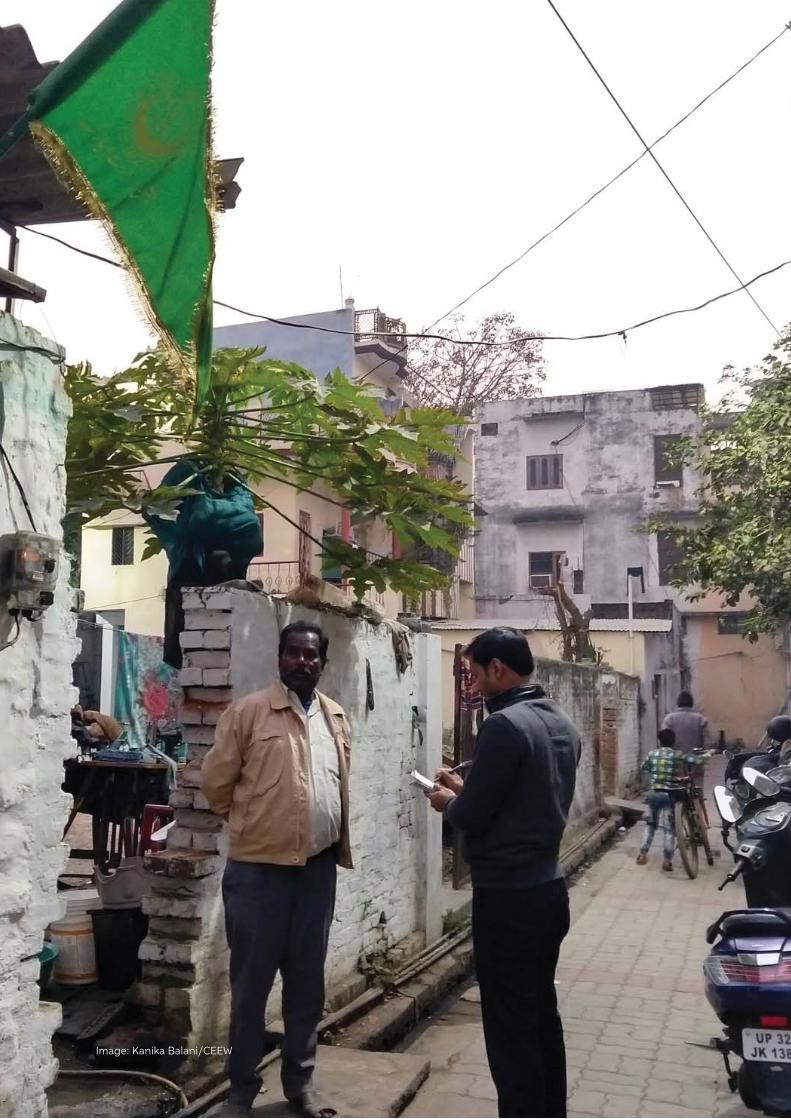
Image: Kanika Balani/CEEW

12 Electricity Consumers and Compliance: Trust, Reciprocity, and Socio-economic Factors in Uttar Pradesh
Image: Morsel
Image: Morsel Image: Morsel
Image: Prateek Agarwal/CEEW Image: CEEW

13
This study uses both quantitative and qualitative data comprising household survey in
both urban and rural areas of UP, secondary data sources, and semi-structured inter-
views with stakeholders. The research tools used for data collection have been described
below.
Household survey in urban and rural areas – A survey questionnaire was designed to solicit
consumer perceptions on services provided by discoms. A preliminary version of the ques-
tionnaire was tested in the pilot phase with limited households. The feedback from pilot
phase was used to fi ne-tune the questionnaire. The fi nal version was deployed in 10 districts
of the state, the sampling technique for which is discussed later in this chapter.
Secondary data sources – An extensive review of existing data in the public domain on
service provision of distribution companies and their losses was fi rst carried out. The review
was extended to elements of trust, social norms, and determinants of theft. The sources
reviewed include published literature – academic journals and peer-reviewed policy reports,
data portals of the Ministry of Power, Government of India, and public data sources hosted
by other research groups.
To incorporate views of the offi cials involved in the distribution sector in the state of UP,
semi-structured interviews were conducted with offi cials of four public distribution com-
panies and the state electricity regulatory commission. The other set of stakeholders in-
terviewed include sector experts active in the state and fellow researchers with an active
interest in the power sector. The interviews were conducted in two phases. The fi rst phase
of interviews was aimed at soliciting views on fi rst version of the survey questionnaire. The
feedback was used to refi ne and make additions to the instrument. The second phase of
interviews were conducted to solicit offi cials’ views on the survey results and in some sense
ground truthing some of the survey results.
2. Methodology and Framework for Assessment

14 Electricity Consumers and Compliance: Trust, Reciprocity, and Socio-economic Factors in Uttar Pradesh
2.1 Survey of households in UP
2.1.1 Questionnaire design
This study aimed to understand the losses of discoms and the contribution of operational
aspects and socio-economic factors to these losses. The survey questionnaire was developed
based on the results from pilot testing of the survey. The questionnaire was reviewed by sec-
tor experts. The fi nal questionnaire consisted of 104 questions. We designed it to be com-
pleted within 35 minutes on average. It encompassed six broad sections.
• Household background and socio-economic information
• Status of electricity supply
• Elements of trust
• Attitudes on crime and the demographic variation of these attitudes
• Consumer preferences on electricity rates and payment method
• Consumer perception on electricity theft
2.1.2 Sampling of districts and villages
The sampling strategy was aimed at arriving at results that are representative of rural and
urban households across the state, thereby eliminating the need for sampling weights.
The sampling approach is a stratifi ed cluster-based random sampling. The state of UP was
divided into fi ve geographic regions. The districts within the region were picked while ensur-
ing a geographically representative sample. A total of 10 districts, two districts from each
region, were picked for conducting the survey. Sample weights, however, were used in state-
level fi ndings, as the rural-urban share is not equal across the districts. Based on census 2011
data, rural-urban population fi gures were used as weights.
Using 2011 census data, the districts were split into two groups – large and small, based on
their population size. Five wards, villages were randomly chosen from the large group. Simi-
larly, four wards, villages were chosen from the small group. A sum total of 90 wards and
villages were picked up for sampling. Finally, 10 households were randomly selected from
each village/ward, to form a sample of 1,800 households (Table 3).
Discoms Districts
Dakshinanchal Vidyut Vitaran Nigam LtdAligarh
Banda
Madhyanchal Vidyut Vitaran Nigam Ltd
Ambedkar Nagar
Budaun
Sultanpur
Purvanchal Vidyut Vitaran Nigam Ltd
Ballia
Kaushambi
Mau
Paschimanchal Vidyut Vitaran Nigam LtdMoradabad
Muzaffarnagar
TABLE 3: Districts sampled for
survey and respective
discom areas
Source: CEEW compilation
The sampling strategy was aimed to arrive at results that are representative of rural and urban households across the state
15
2.1.3 Data collection and cleaning
To facilitate data collection, and ensure consistency in the process of soliciting responses,
we conducted in-person training sessions for enumerators over two rounds – one at the
beginning and one mid-way through the survey – to reiterate some of the key nuances of the
enumeration. The enumerators were picked after various rounds of role-playing exercises.
The enumerators were trained on the questionnaire structure to avoid any confusion during
the survey.
One pilot survey was conducted in both rural and urban households to check for the reli-
ability and validity of the responses. Consequently, the questionnaire was modifi ed based
on the results of the pilot survey. The enumerators recorded responses on an application
made available on hand-held devices. Near real-time data acquisition was made possible
on account of the mode of survey, and we were able to monitor oddities in the conduct and
also in the nature of responses coming through. We carried out quality checks on the data for
incorrect recording of responses, outliers, and missing values prior to analysis.
2.1.4 Data analysis
Exploratory data analysis was carried out using MS-Excel tool and further statistical analy-
sis using STATA. We use Fisher’s-p values to establish the signifi cance at 95 per cent confi -
dence levels in all econometric tests. Descriptive analysis forms the core of the early insights
derived from the study. Correlations were tested between variables of interest, to ascertain
a suitable set of predictor variables and comprehensively explain the drivers of key actions
such as consumer compliance and acceptability of illegal tapping of electricity wires to gain
supply.
FIGURE 2: Surveyed districts in
the state map
Source: CEEW analysis
Surveyed Districts
1
2
3
4
5
6 7
8
9 10
PVVNL1 Muzaffarnagar2 Moradabad
DVVNL3 Aligarh4 Banda
MVVNL5 Budaun6 Sultanpur7 Ambedkar Nagar
PuVVNL8 Kaushambi9 Mau
10 Ballia
Methodology and Framework for Assessment

16 Electricity Consumers and Compliance: Trust, Reciprocity, and Socio-economic Factors in Uttar Pradesh
2.1.5 Semi-structured interviews
We carried out a series of stakeholder discussions with offi cials of UPERC, power sector
experts active in the state, and other researchers. We also discussed the survey question-
naire and relevance to the situation in power sector of UP. We solicited the views of offi cials
of MVVNL, PuVVNL, and DVVNL on the challenges faced by discoms in providing better
services. The outcomes of these discussions are discussed in brief in the relevant sections of
the fi ndings chapter. The objective for interviewing discom offi cials was to capture views of all
stakeholders involved in the decision making of discom activities. In addition, the interviews
were used as a validation exercise on fi ndings from the survey.
2.3 Framework for assessment of survey fi ndings
The survey questionnaire was aimed at capturing perception of discom services, accounting
for electricity charges and losses, and socio-economic factors contributing to losses of dis-
coms. The framework for assessing the survey was developed based on multiple stakeholder
discussions to uncover nuances in discom activities. The issues we attempt to uncover through
the survey fi ndings are captured under the broad umbrella of AT&C losses of discoms.
Some factors of AT&C losses are evident and captured in the existing literature, but certain fac-
tors are hidden. This report aims at capturing these hidden factors in detail to help focus the
eff orts of state government and discoms in limiting the losses. The framework for assessment
is divided broadly into four sections: electrifi cation and power supply situation; metering of
households; billing and collection and accounting of losses; and trust, perceptions, and their
role in aiding and abetting theft.
Electrifi cation and power supply situation
Information from existing data sources is used to describe the status of electrifi cation in the
districts and the power supply position as reported by consumers. This information is com-
pared with other information available in the public domain, power supply, and temporal
trends power supply position in the state. Further, the consumer value attached to power sup-
ply based on time-of-day, for example, value of electricity supplied during evening hours vis-à-
vis morning hours and consumer satisfaction on supply situation is also explored. This forms
the basis for assessing losses and the role for various stakeholders in bringing down electricity
losses.
Metering of households
The biggest challenge facing the power sector in UP is the share of unmetered household con-
nections. The disparity between urban and rural consumers, the share of unmetered connec-
tions, and the scale of losses arising from unmetered connections are other challenges.
Billing and collection and accounting of losses
The cycle of billing and collection prevalent in urban and rural household in UP, and the eff ect
of the discom’s fi nancial performance on ineffi ciencies, is discussed in this section, as are the
socio-economic factors of the consumers’ attitude towards paying electricity bills.
The objective for interviewing discom officials was to capture views of all stakeholders involved in the decision making of discom activities

17
Trust, perceptions, and their role in aiding and abetting theft
Consumer perception of electricity theft infl uences its prevalence. Consumer trust in other
consumers and the discom drives compliance. State and central government initiatives in
curbing electricity theft are also discussed.
2.4 Limitations of the surveyThe survey has several limitations.
The survey relies on recall of respondents on services provided by discoms; for example, the
recall of supply hours in the state could be the actual supply over the previous month or sea-
son. To improve interpretation, the fi ndings section attempts to compare survey results with
alternative datasets.
The questionnaire was designed to interpret consumer responses in the best manner possible.
Some questions are repeated in diff erent points during a survey to test consistency in respons-
es and enumerator bias in recording responses. In some cases, responses are inconsistent,
but we rely on what we believe is likely to have been a more ‘realistic response’ after compre-
hending the question entirely. For instance, there were three diff erent questions pertaining to
billing. Consistency in responses to these and the conditionality imposed in these questions
were used to then choose the most appropriate question to determine the suitable question for
interpretation.
The enumerators were rigorously trained to eliminate bias in recording responses, but some
inconsistencies were identifi ed, and the survey was re-conducted for an entire district (180
responses).6
The respondents were asked to refl ect on the prevalence of electricity theft in their area. Such
responses require them to be aware of their neighbourhoods and to be active participants in
society. The education level and understanding of the socio-political situation in their area
varies across respondents. This limitation is unavoidable, but it makes for interesting analyses
on the variation in such responses and the implications of their background on their
responses.
On bill payments, we use only four sets of questions on expenditure on electricity or alterna-
tive sources to establish the respondent’s spending. We also have a question that solicits over-
all household expenditure. This is unlike the National Sample Survey, which estimates the
monthly expenditure in an itemised manner. Owing to this, and after analysing the responses,
we decided not to use the responses on monthly expenditure.
The central and state governments are trying aggressively to improve electrifi cation and the
quality of supply. Therefore, the state of play as recorded in this study is subject to rapid
change. But systemic issues pertaining to metering and billing are unlikely to have changed
since the survey, as these require signifi cant institutional changes, and there is no evidence
that such change has taken place in the intervening months.
6 Survey response times were much lower than the median in this district. There were also specifi c enumerators who were identifi ed to have carried out the survey inconsistently and as a result the exercise was redone in the early phase. A repeat training was carried out for a new team and some enumerators were also dropped after observing their performance.
Methodology and Framework for Assessment

18 Electricity Consumers and Compliance: Trust, Reciprocity, and Socio-economic Factors in Uttar Pradesh
Image: iStock

19
The political commitment to providing 24×7 power to all consumers by March 2019 has
resulted in better supply of electricity across the state. Combined with rapid household
electrifi cation eff orts, this is a promising move towards universal access to electricity and
reliable supply for all. In this context, the survey instrument sought consumer views on the
rate of electrifi cation, improvement in electricity supply situation, and quality of supply.
This section draws on fi ndings on MBC and electricity theft and also on interviews with dis-
com employees on the issues of discom losses and improved accountability.
3.1 Power supply and consumer satisfaction
3.1.1 Supply hours – Moving towards a 24×7 supply for all
The number of hours of supply has improved in both rural and urban areas, driven primar-
ily by the political ambition to provide 24×7 electricity for all. The median hours of supply
experienced in urban households is 17 hours and the median hours of supply experienced in
rural households in the state is 12 hours. Figure 3 shows the supply hours for all the districts
and discoms.
3. Survey Findings
FIGURE 3: Improving power supply
situation in UP
Source: CEEW analysis
Supply hours – UrbanSupply hours – Rural
0
4
8
15
20
16
18
12
16
12 12
10
14
16
18
16
18
1212
15
8.5
16
20
12
16
20
24
Muz
affa
rnag
ar
Mor
adab
ad
Mau
Kau
sham
bi
Bal
lia
Sult
anpu
r
Bud
aun
Am
bedk
ar N
agar
Ban
da
Alig
arh
DVVNL MVVNL PuVVNL PVVNL
Hou
rs o
f sup
ply
Hours of Supply in UP
The median hours of supply experienced in urban households is 17 hours and the median hours of supply experienced in rural households in the state is 12 hours

20 Electricity Consumers and Compliance: Trust, Reciprocity, and Socio-economic Factors in Uttar Pradesh
The distri cts in Purvanchal discom fared the poorest on this metric as well. It is worth reiter-
ating that the survey relies primarily on respondent recollection, which is likely to be infl u-
enced by their most recent experience of supply – last month or season. There are alternative
sources to verify these fi ndings on the supply situation.
An initiative of the Prayas Energy Group, Electricity Supply Monitoring Initiative (ESMI), is
one such source of data. Prayas has deployed sensors to measure supply hours and power
quality in 416 locations across 23 states, and the highest concentration of these sensors is
in the state of UP. Figure 4 shows the average supply hours for the months of April and May
in UP. The ESMI data is commensurate with the survey fi ndings on median hours of supply
experienced in the urban and rural areas of the state, which indicates that the respondents’
recollection is a fair refl ection of the supply position. Figure 4 shows the aggregated data for
85 locations across UP; the hours of supply were rounded off for ease of representation.
Discom offi cials attribute the poor supply (provided to households) in Purvanchal to the
relatively poor economic status of households. This indeed came across as counter-intuitive,
as the literature suggests that electricity consumption has a causal relationship with devel-
opment outcomes, especially in low-income households of developing countries (Niu, et al.,
2013; Khandker, Barnes, and Samad, 2010). Low level of energy consumption keep house-
holds mired in income poverty.
3.1.2 Time of the day and hours of supply
While the supply situation has certainly improved over the years, the average of daily supply
hours does not provide insight into the needs of electricity at various times during the day.
Figure 5 shows the time of day when electricity is needed vis-à-vis its availability.
Gap between availability and requirement is highest in the evening hours (5–8 pm) and night
hours (8–11 pm) for both rural and urban households. Electricity demand in the evening
hours coincides with typical peak demand period of India. The need –availability gap during
evening hours and late evening hours for rural areas is higher for rural households.
In the late-night hours, most households report having maximum availability. Supply during
evening and late evening hours is highly valued by consumers, especially urban consumers.
FIGURE 4: Power supply
hours measured by
sensors deployed
across the state of
UP
Source: Prayas Energy
Group, ESMI Data, 2018
-1
4
9
14
19
24
No
supp
ly
Low
volt
age
Nor
mal
volt
age
No
supp
ly
Low
volt
age
Nor
mal
volt
age
No
supp
ly
Low
volt
age
Nor
mal
volt
age
Mahanagar Other municipal areas
Rural areas
Hou
rs
19.5
8.5
3.5
11
3.5
1
16
3
5
Hours of Supply

21
Their satisfaction with supply is linked to availability during this period; 83 per cent of urban
consumers are satisfi ed with electricity supply when electricity is available for evening and
night hours, and 63 per cent of rural consumers are satisfi ed with supply if electricity is
available during evening and night hours.
3.1.3 Income disparity between the regions
Data on monthly household expenditure based on the National Sample Survey 68th round
for the 10 districts surveyed in UP is given in Table 4. Though monthly expenditure details
were solicited in the survey, it was not an itemised enumeration of expenses. As a result, the
authors found it diffi cult to interpret the stated overall household expenditures.
Average monthly per capita expenditure (MPCE) in rupees
Discoms Districts Rural Urban
DVVNLAligarh 1,182 2,553
Banda 815 1,206
MVVNL
Ambedkar Nagar 1,117 993
Budaun 1,119 1,374
Sultanpur 1,403 2,658
PuVVNL
Ballia 1,006 1,656
Kaushambi 891 1,169
Mau 1,016 1,481
PVVNLMoradabad 1,161 1,462
Muzaffarnagar 1,545 2,490
The income disparity between urban and rural areas is stark. The diff erence in expenditures
can be observed between the various regions of UP. Incomes are lower in Purvanchal and
Dakshinanchal than in Paschimanchal and Madhyanchal.
The discussion thus far on supply metrics – total hours of supply, evening hours of supply,
blackout days, and the satisfaction levels associated with the supply – sets us up for a deep
dive into the status of MBC in the state and the role it plays in the accounting of losses.
FIGURE 5: Demand-supply
gap in electricity
supplied in rural
and urban areas
Source: CEEW analysis
0
10%
20%
30%
40%
50%
60%
70%
80%
90%
100%
11 pm to 5 am
8 pm to 11 pm
5 pm to 8 pm
Noon to 5 pm
5 am to noon
Shar
e of
hou
seho
lds
Available (R) Available (U) Requirement (R) Requirement (U)
2734
5563
3742
6773
34
44
88 85
35
46
92 91
57 57
75
86
Need availability gap in Uttar Pradesh
83 per cent of urban consumers and 63 per cent of rural consumers are satisfied with electricity supply when electricity is available for evening and night hours
TABLE 4: Income disparity across
discom regions
Source: MOSPI, 2014
Survey Findings

22 Electricity Consumers and Compliance: Trust, Reciprocity, and Socio-economic Factors in Uttar Pradesh
3.2 Metering and billing – the building blocks
3.2.1 The curious case of unmetered consumers of UP
The UP discoms have a large portion of unmetered domestic consumers. Only around 40 per
cent (70 lakh) of the registered domestic consumers in UP were unmetered in FY 2016–17
(UPERC, 2017, pp. 144–145). Unmetered consumption is a major contributor to high losses of
discoms.
Figure 6 below shows the share of unmetered consumers for all four discoms. The share of
unmetered consumers in the surveyed households was around 55 per cent. The drop from
FY17 is apparent and indicates that eff orts have been made to increase metering and also
ensure metering of newly added consumers. Even in urban areas the metering levels are only
90 per cent. The discoms plan to achieve 100 per cent metering by April 2019 (UPERC, 2017).
Before the introduction of Saubhagya, electricity connections were set up by discom offi cials,
whereas meters were typically installed by a contracted private metering agency.7 Discom
offi cials hold that discom losses have increased since third-party agencies were hired. Peri-
odically, new metering technology is introduced, and older meters need to be replaced, but
it is diffi cult for deployment to keep pace with technological changes.8. While advancement
in metering technology presents an operational challenge for discom offi cials, it is also an
adoption challenge for consumers. Consumer dynamics in embracing new technologies af-
fects consumer participation in the system (Foroudi, Gupta, and Sivarajah 2017).
Interactions with discom offi cials indicate that metering is a challenging task given the
inertia involved in changing consumer behaviour towards meters and also vested interests at
various levels that benefi t from unmetered consumption. Under the erstwhile tariff structure,
there was little incentive to move to a metered connection. While consumers have a role to
play in getting metered connections, discoms have an equal role expanding their capacity to
7 Based on interviews with offi cials of PuVVNL, DVVNL, and MVVNL.8 This is the view of discom offi cials of PuVVNL and MVVNL when they were asked to refl ect on the challenges
in metering consumers in their supply areas.
FIGURE 6: High share of
unmetered
consumers in
discoms of UP
Source: Tariff fi lings of
respective discoms for FY
2017–18
Unmetered rural
Metered rural
BPL Urban and single point supply consumers
DVVNL
Per
cen
t sh
are
of h
ouse
hold
s
MVVNL PuVVNL PVVNL0
10%
20%
30%
40%
50%
60%
70%
80%
90%
100%
44.5
8.5
26.9
20.2
23.5
2.2
12.3
62
50.3
2.27.6
39.9
36.5
11.8
21.2
30.5
Breakdown of domestic consumers in 2016-17
Even in urban areas the metering levels are only 90 per cent
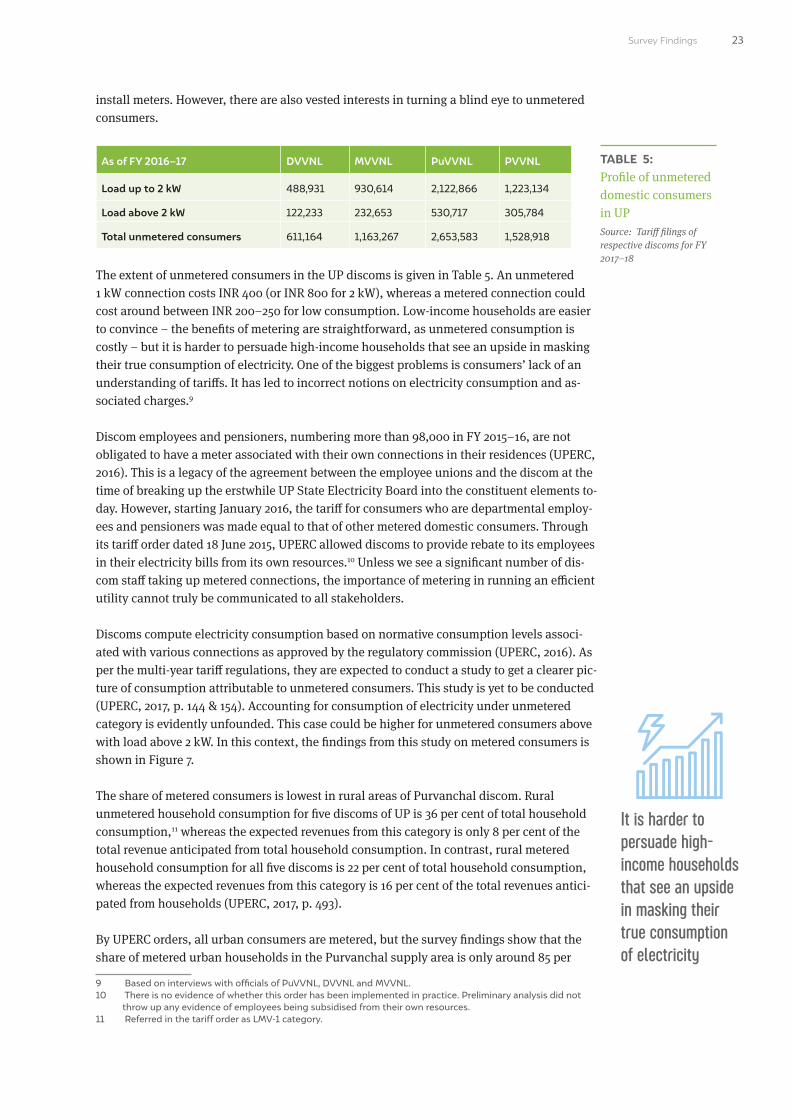
23
install meters. However, there are also vested interests in turning a blind eye to unmetered
consumers.
As of FY 2016–17 DVVNL MVVNL PuVVNL PVVNL
Load up to 2 kW 488,931 930,614 2,122,866 1,223,134
Load above 2 kW 122,233 232,653 530,717 305,784
Total unmetered consumers 611,164 1,163,267 2,653,583 1,528,918
The extent of unmetered consumers in the UP discoms is given in Table 5. An unmetered
1 kW connection costs INR 400 (or INR 800 for 2 kW), whereas a metered connection could
cost around between INR 200–250 for low consumption. Low-income households are easier
to convince – the benefi ts of metering are straightforward, as unmetered consumption is
costly – but it is harder to persuade high-income households that see an upside in masking
their true consumption of electricity. One of the biggest problems is consumers’ lack of an
understanding of tariff s. It has led to incorrect notions on electricity consumption and as-
sociated charges.9
Discom employees and pensioners, numbering more than 98,000 in FY 2015–16, are not
obligated to have a meter associated with their own connections in their residences (UPERC,
2016). This is a legacy of the agreement between the employee unions and the discom at the
time of breaking up the erstwhile UP State Electricity Board into the constituent elements to-
day. However, starting January 2016, the tariff for consumers who are departmental employ-
ees and pensioners was made equal to that of other metered domestic consumers. Through
its tariff order dated 18 June 2015, UPERC allowed discoms to provide rebate to its employees
in their electricity bills from its own resources.10 Unless we see a signifi cant number of dis-
com staff taking up metered connections, the importance of metering in running an effi cient
utility cannot truly be communicated to all stakeholders.
Discoms compute electricity consumption based on normative consumption levels associ-
ated with various connections as approved by the regulatory commission (UPERC, 2016). As
per the multi-year tariff regulations, they are expected to conduct a study to get a clearer pic-
ture of consumption attributable to unmetered consumers. This study is yet to be conducted
(UPERC, 2017, p. 144 & 154). Accounting for consumption of electricity under unmetered
category is evidently unfounded. This case could be higher for unmetered consumers above
with load above 2 kW. In this context, the fi ndings from this study on metered consumers is
shown in Figure 7.
The share of metered consumers is lowest in rural areas of Purvanchal discom. Rural
unmetered household consumption for fi ve discoms of UP is 36 per cent of total household
consumption,11 whereas the expected revenues from this category is only 8 per cent of the
total revenue anticipated from total household consumption. In contrast, rural metered
household consumption for all fi ve discoms is 22 per cent of total household consumption,
whereas the expected revenues from this category is 16 per cent of the total revenues antici-
pated from households (UPERC, 2017, p. 493).
By UPERC orders, all urban consumers are metered, but the survey fi ndings show that the
share of metered urban households in the Purvanchal supply area is only around 85 per
9 Based on interviews with offi cials of PuVVNL, DVVNL and MVVNL.10 There is no evidence of whether this order has been implemented in practice. Preliminary analysis did not
throw up any evidence of employees being subsidised from their own resources. 11 Referred in the tariff order as LMV-1 category.
TABLE 5: Profi le of unmetered
domestic consumers
in UP
Source: Tariff fi lings of
respective discoms for FY
2017–18
Survey Findings
It is harder to persuade high-income households that see an upside in masking their true consumption of electricity

24 Electricity Consumers and Compliance: Trust, Reciprocity, and Socio-economic Factors in Uttar Pradesh
cent. The same is the case with Madhyanchal districts of Ambedkar Nagar and Sultanpur.
Discom offi cials are cognisant of this challenge of unmetered urban consumption. The extent
of unmetered consumption in urban areas is not captured in any of the regulatory hearings
or tariff orders. Recognition of this can help address the issue of losses better.
3.2.2 Lag in metering in rural areas leading to losses of discoms
Metering of households hold the key to curbing losses to this consumer category. As a policy
intervention, metering has received a signifi cant push from the central government under
the schemes of R-APDRP for urban areas and DDUGJY for rural areas. These initiatives are
intended to help reduce discom losses, but the time and eff ort spent on existing metered con-
nections needs to be measured, and how the move to advance metering infrastructure pans
out must be tracked. The results of the implementation of the R-APDRP in UP in the fi ve-year
period from 2010 to 2015 shows an improvement (bringing down AT&C losses below 25 per
cent) in 4 out 12 districts (IPDS, 2016, p. 6). The AT&C loss reduction for UP was achieved
for only 47 per cent of the feeders in this period. The pace of improvement in urban areas of
UP is slow, considering UP had highest losses among the 14 states evaluated in the report.
Therefore, the solutions to bringing down losses of discoms should go beyond technology
upgradation schemes.
Metering in rural areas is a relatively recent exercise, implemented with impetus from central
government schemes. Figure 8 shows the profi le of rural metered consumers: 83 per cent of
all meters for rural connections were installed over the last fi ve years and 46 per cent of the
meters in the last one year. In urban areas, the share of fi rst-time meters installed in the last
fi ve years is nearly 49 per cent and only 14 per cent of the households got their meters in the
last year.
The losses of discoms thus far can be attributed to limited accounting of power supplied
to rural areas. UPERC has approved a 33 per cent increase in tariff for unmetered consum-
ers, with eff ect from April 1, 2018. Given the disincentives for unmetered consumption, the
FIGURE 7: Low metering in
rural areas
Source: CEEW analysis
UrbanRural
0%
10%
20%
30%
40%
50%
60%
70%
80%
90%
100%
Muz
affa
rnag
ar
Mor
adab
ad
Mau
Kau
sham
bi
Bal
lia
Sult
anpu
r
Bud
aun
Am
bedk
arN
agar
Ban
da
Alig
arh
DVVNL MVVNL PuVVNL PVVNL
% o
f hou
seho
lds
50
100
52
95
25
86
38
95
54
86
18
86
29
83
33
72 72
98 98
70
Share of metered households
46 per cent of the meters for rural connections were installed in the last one year. For urban connections, only 14 per cent of the households got their meters in the last year

25
consumer-end resistance to metering is likely to subside going forward. However, this will
require eff orts for billing and collection to be stepped up to impose a credible threat to those
consumers still holding onto an unmetered connection.
3.3 Metering, billing, and collection losses
3.3.1 Electricity billing – long road to achieving complete automation
Electricity billing is an activity of discoms contracted to external agencies. Billing involves
three major activities – meter reading, generating bill, and delivering the bill to consum-
ers. Meter reading can be automated through automated meter reading (AMR) or advanced
metering infrastructure (AMI). While the transitions to above-mentioned technologies will
improve metering, they need to translate to better billing and upgradation in IT systems to
enable the linkage to the metering. In addition, advances in metering are confi ned to parts
of urban areas (Ministry of Power (MoP), 2018). Billing in urban and rural connections of UP
comes with its own set of challenges, and these nuances are discussed below.
Frequency of receiving bills is a direct refl ection of billing effi ciency of discom. This varies
between rural and urban areas. The billing cycle is shown in Figures 9 and 10.
There is a marked diff erence in billing practices across discoms, with Paschimanchal com-
ing out as the best of the four public discoms. MVVNL and PuVVNL, in particular, indicate
poor billing frequencies. Frequency of billing in rural areas is low. The fi nancial burden of
accumulated bills is signifi cant on rural households, especially those with low and seasonal
incomes. Setting aside large sums in the anticipation of bills is a problem for these house-
holds. Billing is more diffi cult in rural areas than in urban areas because households are
dispersed over a larger area, which raises the administrative costs of manual meter reading
and issuance of bills, and because discoms lack the manpower.
FIGURE 8: Metering exercise
relatively recent in
rural households
Source: CEEW analysis
0%
10%
20%
30%
40%
50%
60%
70%
80%
90%
100%
Muz
affa
rnag
ar
Mor
adab
ad
Mau
Kau
sham
bi
Bal
lia
Sult
anpu
r
Bud
aun
Am
bedk
arN
agar
Ban
da
Alig
arh
<1 year
% o
f hou
seho
lds
1-5 years 5-10 years 10-20 years >20 yearsDVVNL MVVNL PuVVNL PVVNL
69.2
32.5
55
35.5
13.3
42.9
61.1 57.148.9
62.9
20.5
37.5
3558.1
28.9
35.7
38.9
25 38.3
29
5
10
37.8
7.1 7.13.2
12.55
6.517.8 7.1
7.1 8.51.65.2 7.5 5
2.27.1
3.6 4.3 3.2Years since installation of first meter
Survey Findings

26 Electricity Consumers and Compliance: Trust, Reciprocity, and Socio-economic Factors in Uttar Pradesh
Respondents were asked to recollect when their fi rst bill was delivered after their electric-
ity connection was installed. The median delay (in months) after getting a connection was
captured to represent the ineffi ciency in fi rst billing (Table 6).
DiscomRural
(in months)Urban
(in months)
DVVNL 3.5 2
PVVNL 2 2
MVVNL N.A. 3
PuVVNL 3 3
TABLE 6: Effi ciency in issuing
fi rst bill is low even
in urban areas
Source: CEEW analysis
FIGURE 10: Diff erences in
billing frequency
across UP discoms
for rural households
Source: CEEW analysis
0
10%
20%
30%
40%
50%
60%
70%
80%
90%
100%
Muz
affa
rnag
ar
Mor
adab
ad
Mau
Kau
sham
bi
Bal
lia
Sult
anpu
r
Bud
aun
Am
bedk
arN
agar
Ban
da
Alig
arh
Monthly Bi-monthly Every 3 months >3 months Others
DVVNL MVVNL PuVVNL PVVNL
Shar
e of
hou
seho
lds
42.6
36.7
35.7
12
40
17
10
13
20
39.6
23.9
10.6
15.9
10
8
28
12
52
24
17
10
19
30
9
16
26
40
9
21
26
9
21
23
41
22
16
16
5
59
74
22
8
53
21
212
12
Discom-wise billing frequency in rural households
FIGURE 9: Infrequent billing in
rural households
Source: CEEW analysis
*Others represents those
consumers who were not
clear on what their billing
frequency was
Monthly Bi-monthly Every 3 months >3 months Others*
Rural Urban0%
10%
20%
30%
40%
50%
60%
70%
80%
90%
100%Sh
are
of h
ouse
hold
s
37.4
21.4
9.4
23.2
8.6 2.1
39.1
79.6
6.2
Billing frequency of rural and urban households

27
TABLE 7: Employee costs of
discoms
Source: PFC report on
state of power utilities
TABLE 8: Domestic
consumers of states
Source: CEA General
Review, UPPCL ARRs, and
World Atlas
Box 1–UP Discoms – Where is the manpower?
An assessment of employee costs (Tables 7 and 8 below), consumer numbers, and geographic expanse of the states suggests how low the annual spend on employees is relative to some comparable discoms in the country. Maharashtra (MH), with only 30 per cent more consum-ers, spends nearly three times as much as UP discoms on its employees. Karnataka (KA) too shows a similar trend when compared to UP. Gujarat (GJ), in comparison, resembles UP in employee expenditure but its consumer base and land area are both 20 per cent lower.
The under-resourcing of the staff base has its origins in a 1997 decision to cut discom ex-penses, which in turn was necessitated by poor state fi nances. Subsequent challenges with implementation of promotions – based on affi rmative action policies and the delays in the adjudication of cases pertaining to this – meant that capacity addition to discoms at various levels were stalled for signifi cant periods from the early 1990s to the late 2000s.
Outsourcing can signifi cantly affect spending on employees, but we are not able to offer insight – this issue needs to be explored.
Employee cost of discoms (INR crore)
UP MH KA GJ
2013–14 1,282 4,028 1981 1,009
2014–15 1,215 4,551 2,053 1,021
2015–16 1,312 4,187 2,227 1,293
Total consumers as on 31 March
UP MH KA GJ
2014 1,17,91,176 1,95,06,124 1,52,13,370 1,17,41,438
2015 1,38,04,128 2,02,30,903
1,53,17,302 1,21,02,062
2016 1,56,70,000 2,09,45,728 1,66,38,087 1,24,41,115
Geographic Area (sq km)
243,290 307,713 191,791 196,024
Surprisingly, very few respondents in the rural areas of the MVVNL control area were able to
recollect when their fi rst bills actually came in. This is a possible indication of the lax imple-
mentation of billing in rural areas of MVVNL. Urban areas see more effi cient billing in terms
of delay in the fi rst bill reaching the consumers. This needs to be addressed as a priority.
With Saubhagya, all connections go with a meter and their linking to a billing system is also
likely to benefi t from this improved and on spot metering infrastructure roll-out. The billing
process being adopted now also relies on online connectivity with the billing system and bill
agents are able to generate a bill as soon as a meter reading is taken.
Survey Findings

28 Electricity Consumers and Compliance: Trust, Reciprocity, and Socio-economic Factors in Uttar Pradesh
3.3.2 What do consumers do when the electricity bill does not arrive on time?
Discoms are responsible for billing and collection and for losses owing to ineffi ciencies in
the billing and collection process. Discoms fi nance working capital shortages by borrowing
and increasing their overall cost of operation. If consumers demand to be billed regularly,
and if they pay their bills in a timely manner, discoms would not incur undue costs or pass
these on to the consumer. Figure 11 documents how consumers respond to the non-arrival of
a bill.
Nearly 49 per cent of rural households and 33 per cent of urban households who do not
receive monthly bills would choose to do nothing when they do not receive bills. When asked
to respond if they would choose to complain, if not satisfi ed with the electricity bill, 90 per
cent of the rural consumers and 87 per cent of urban consumers said they would not com-
plain. This is a matter of concern. This lack of consumer oversight shows that the consumer
base is not empowered to claim their rights. Infrequent billing may cement consumer indif-
ference towards discoms.
Discoms provide fi rst recourse to redress consumer grievances. Consumers can register
complaints at toll-free helplines. Independent bodies, like the consumer grievance redressal
forum and the electricity ombudsman, provide the next level of recourse to consumer griev-
ances. But these avenues will fi nd few takers if the awareness of procedures and the avenues
remains low.
According to discom offi cials, billing will improve over the next year. Upgrading meters
and installing new meters is being taking up on a large scale, as represented by the large
orders placed for meters. The reliance on technology to bridge the gap and decrease human
intervention is signifi cant.12 But however immense the reliance on technology, and however
positive the step, it cannot overcome other lacunae in the system. To communicate the need
for compliance on bill payments, and the implications for utility fi nances, consumer engage-
ment is a prerequisite.
12 Based on interviews with discom offi cials
Nothing
Rural consumers receiving monthly bills
Rural consumersnot receiving monthly bills
Urban consumers receiving monthly bills
Urban consumers not receiving monthly bills
Go to discom or online
Find out through neighbour or lineman
Other My bill arrives on time
0%
10%
20%
30%
40%
50%
60%
70%
80%
90%
100%
Shar
e of
hou
seho
lds
2
24
49
19 33
29
33
23
415
9
5
13
2
0.5
42
7
52.5
11
Consumer responses to infrequent billing FIGURE 11: Proactiveness of
consumers in the
face of non-receipt
of a bill
Source: CEEW analysis

29
3.3.3 Trust-billing and trust your billing
In May 2016, UPERC issued the seventh amendment to the UP Electricity Supply Code, 2005
to carry out trust billing in urban areas where online billing facilities were available (UPERC,
2016, p. 3). This was followed by another order to extend the facility of trust billing beyond
online payments – consumers can self-assess bills and pay at discom billing counters.13 Trust
billing helps in areas where discoms face human resource limitations in providing billing
services.
A signifi cant share of metered consumers do not believe that the bills generated are based on
their meter reading. A signifi cant driver of this perception is the frequency of billing. Nearly
77 per cent of rural households who are not billed monthly do not believe their bill is based
on the meter. In urban areas this is a lot lower – 40 per cent. Despite this, more than 67 per
cent of such households choose to make their monthly bill payments in full. This unex-
pected high level of compliance, could be attributed (based on interactions with civil society
groups) to their desire to avoid any punitive steps that the discom may initiate against them.
Their lack of understanding of the bill generation process, the prevalence of faulty meters
and the understanding that in such cases notional bills are generated are all signs that
consumers lack trust in their bills. Among households who are billed monthly, only 39 per
cent (rural) and 10 per cent (urban) have this perception of their bill. Clearly, monthly billing
improves overall levels of confi dence in the process of billing.
This issue with billing is corroborated by conversations with discom offi cials. According to
DVVNL offi cials from the Mathura zone, cases related to wrong billing are prevalent mostly
in rural Agra. Due to shortage of discom staff , meter readers are hired via a contracting
agency. Such contracts are given out through tendering, wherein the lowest bidder gets the
contract. Personnel expenses are kept low, and meter readers fi nd ways to make money
through other means, such as by colluding with consumers and falsifying meter readings.
As much as 59 per cent of rural respondents and 74 per cent of urban respondents indicated
that they do not trust their bill agents/bill man. Discoms need to ensure that their consumer
base retains trust in the billing process and does not resort to any underhanded practices to
resolve their billing concerns. To improve the perception of billing, discoms must make the
billing process transparent. They must also explain how they compute bills and to provide
information on past payments.
For example, it is possible upon meter reading to enable instant notifi cations to consumers
of a provisional bill subject to reconciliation of records. That would signal to consumers that
there is no additional layer between reading and bill generation that could distort their dues.
Trust billing would increase consumer payments, improve consumer perception of the meter
itself, and become the practice until a regular, meter-based, automated billing mechanism is
put in place.
3.3.4 Consumer preferences to bill payments
Electricity consumers are obligated to make timely payments upon receiving their bills; a
late payment surcharge is levied. The survey instrument tested consumers on proactiveness
in paying bills. Figure 12 shows consumer preferences in paying electricity bills prior to the
due date.
13 Based on reports from local newspapers.
Nearly 77 per cent of rural households do not believe their bill is based on the meter
59 per cent of rural respondents and 74 per cent of urban respondents indicated that they do not trust their bill agents/bill man
Survey Findings

30 Electricity Consumers and Compliance: Trust, Reciprocity, and Socio-economic Factors in Uttar Pradesh
Nearly 70 per cent of urban consumers make their bill payments ahead of the due date, as
compared to 43 per cent of rural consumers. Figure 12 also illustrates that consumers who
are billed less frequently also do not pay up on time, as compared to the average consumer.
The data on payments made by consumers does not necessarily mean that payments are
made in full. A sizeable chunk of consumers prefers to pay their bills in instalments, while
some of them make partial payments against their bill amount, adding to the losses of
discoms. The lumpiness in issuing bills for two or multiple months at one go is a signifi cant
issue. Incomes in rural households follow agricultural seasons and may not coincide with
periods when bills are presented.
Figure 13 shows the impact of infrequent billing on payments. The fi gure indicates the profi le
of paying consumers in both rural and urban areas, by capturing their payment mode, based
on billing frequency. Full payment is more likely when billing is monthly; else, payments are
likely to happen in instalments or in part. The equally revealing fi nding is that as many rural
households pay in full as urban households when billed properly. Rural consumers are no more
wilful defaulters than are urban consumers.
FIGURE 13: Consumers facing
infrequent billing
are less likely to
make complete
payments
Source: CEEW analysis
FIGURE 12: About half of rural
consumers and a
quarter of urban
consumers do not
pay their bills ahead
of due date
Source: CEEW analysis
Always
Rural consumers
Rural consumersnot receiving monthly bills
Urban consumers
Urban consumers not receiving monthly bills
Most of the time
Half the time
Sometimes Never Other
0%
10%
20%
30%
40%
50%
60%
70%
80%
90%
100%Sh
are
of h
ouse
hold
s
22.6 17
42
25.6
20.316
27
20.8
6.4
6
4.60
6.6
30.6
34
17.8
25
17.724
719.7
2.4 3 0.80 2.3
Timeliness of bill payments
Same share of rural households pay bills in full as urban households, when billed properly. Rural consumers are no more wilful defaulters than are urban consumers.
Rural consumersreceiving monthly bills
Rural consumersnot receiving monthly bills
Urban consumersreceiving monthly bills
Urban consumers not receiving monthly bills
0%
10%
20%
30%
40%
50%
60%
70%
80%
90%
100%
One-time payment in full
Full payments in installments
One-time partial payment
Partial payment in installments
Do not pay atall
Shar
e of
hou
seho
lds
88.5
6986
69
8
14
13
20
0.5
4
0.50
22
0.50
1
311 8
Payment profile vis a vis billing frequency

31
Electricity bills are delivered to consumer premises by hand or a digital copy is sent by SMS
or email to the consumers. Collection of the billed amount is a more complicated task than
dispatching the bills. Most consumers pay their bills at service centres or local offi ces of
discoms that also double up as collection points. The distribution of the mode of payment of
consumers is shown in Figure 14.
The transition in bill payments to digital modes is a long way away for the state of UP – most
urban consumers pay at discom collection centres. Collection effi ciencies could improve if
more consumers opt for digital modes of payment. As per MoP data published in the URJA
portal for the state of UP, the share of urban consumers making e-payments was 12.4 per cent
for the month of June 2018, against the national average of 19.9 per cent.14 Evidently, UP is
lacking behind in bringing consumers to digital platforms.
Over the years, and as recently as 31 December 2018, UP discoms have been waiving the
late payment surcharge, under the one-time settlement (OTS) scheme. UPPCL launches the
scheme occasionally15 for consumers to settle unpaid bills (UPPCL, 2018, UPPCL, 2017 and
UPPCL, 2016). Clearly, discoms have had a challenge with collection and payments. In our
survey, nearly 12 per cent of consumers have participated in the scheme at least once.
Discoms launch the scheme to encourage consumers to settle accumulated bills and cut
collection losses, but frequent use of the scheme reprieves defaulters and discourages con-
sumers who otherwise pay on time. Of the consumers who participate in the OTS scheme,
nearly 25 per cent have availed it twice. If the same consumers are defaulting on their bills,
the scheme is being misused. Disconnecting frequent defaulters or not pardoning dues the
second time would prevent misuse. Discoms face the hard choice of disconnecting repeat
off enders.
In absolute terms, monthly average expenditure per household on grid electricity is INR 364
14 https://urjaindia.co.in/discom-state.php?state=33&month=jul18&active=215 2016 announcement–http://upenergy.in/site/writereaddata/uploadedCirculars/C_201612151201004874.pdf 2017 announcement–http://upenergy.in/site/writereaddata/uploadedCirculars/C_201704181228318323.pdf 2018 announcement–http://upenergy.in/site/writereaddata/uploadedCirculars/C_201808231813574173.pdf
UrbanRural
Paying to an official agent at home
Paying to an unofficial agent at home
Paying to an unofficial middlemanat home
Paying to an unofficial middleman at an office
Online Others0%
10%
20%
30%
40%
50%
60%
70%
80%
90%
100%Sh
are
of h
ouse
hold
s
116.5
88.3
1.4 4.27 4.79.2 8.4
2.22.85
79.7
1.9
Mode of bill payment of consumers FIGURE 14: Low preference for
online payments
in urban and rural
areas
Source: CEEW analysis
Survey Findings
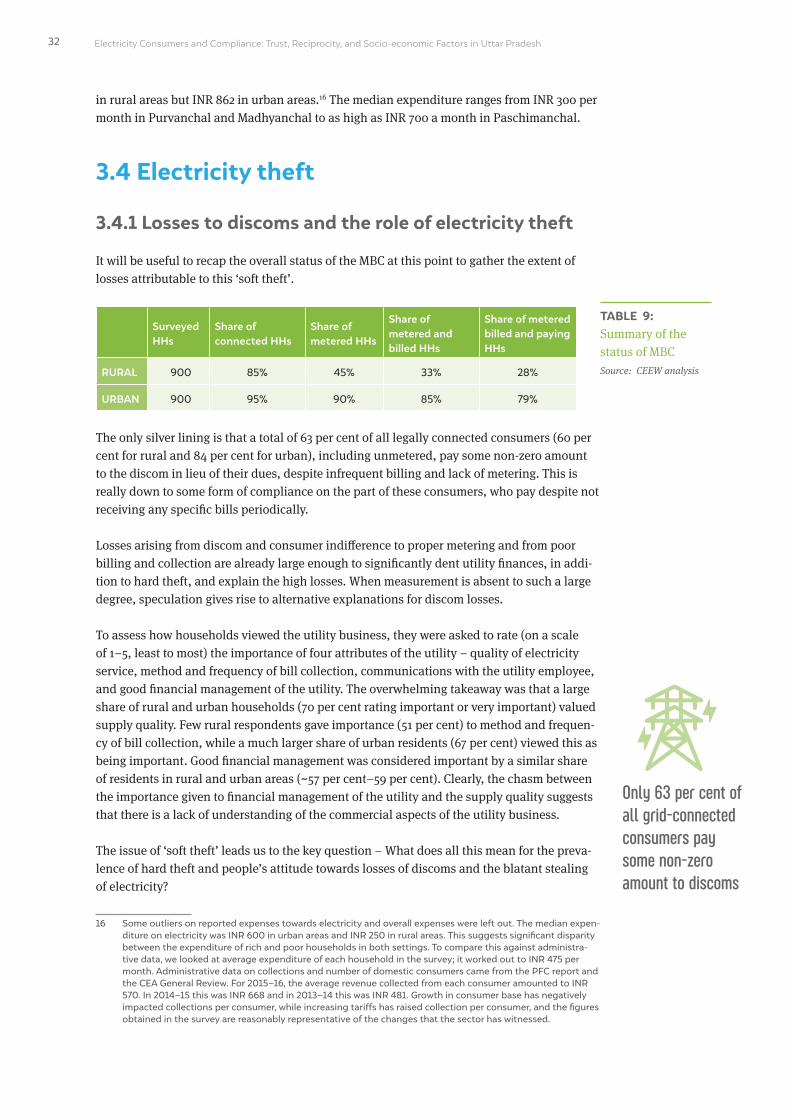
32 Electricity Consumers and Compliance: Trust, Reciprocity, and Socio-economic Factors in Uttar Pradesh
in rural areas but INR 862 in urban areas.16 The median expenditure ranges from INR 300 per
month in Purvanchal and Madhyanchal to as high as INR 700 a month in Paschimanchal.
3.4 Electricity theft
3.4.1 Losses to discoms and the role of electricity theft
It will be useful to recap the overall status of the MBC at this point to gather the extent of
losses attributable to this ‘soft theft’.
Surveyed HHs
Share of connected HHs
Share of metered HHs
Share of metered and billed HHs
Share of metered billed and paying HHs
RURAL 900 85% 45% 33% 28%
URBAN 900 95% 90% 85% 79%
The only silver lining is that a total of 63 per cent of all legally connected consumers (60 per
cent for rural and 84 per cent for urban), including unmetered, pay some non-zero amount
to the discom in lieu of their dues, despite infrequent billing and lack of metering. This is
really down to some form of compliance on the part of these consumers, who pay despite not
receiving any specifi c bills periodically.
Losses arising from discom and consumer indiff erence to proper metering and from poor
billing and collection are already large enough to signifi cantly dent utility fi nances, in addi-
tion to hard theft, and explain the high losses. When measurement is absent to such a large
degree, speculation gives rise to alternative explanations for discom losses.
To assess how households viewed the utility business, they were asked to rate (on a scale
of 1–5, least to most) the importance of four attributes of the utility – quality of electricity
service, method and frequency of bill collection, communications with the utility employee,
and good fi nancial management of the utility. The overwhelming takeaway was that a large
share of rural and urban households (70 per cent rating important or very important) valued
supply quality. Few rural respondents gave importance (51 per cent) to method and frequen-
cy of bill collection, while a much larger share of urban residents (67 per cent) viewed this as
being important. Good fi nancial management was considered important by a similar share
of residents in rural and urban areas (~57 per cent–59 per cent). Clearly, the chasm between
the importance given to fi nancial management of the utility and the supply quality suggests
that there is a lack of understanding of the commercial aspects of the utility business.
The issue of ‘soft theft’ leads us to the key question – What does all this mean for the preva-
lence of hard theft and people’s attitude towards losses of discoms and the blatant stealing
of electricity?
16 Some outliers on reported expenses towards electricity and overall expenses were left out. The median expen-diture on electricity was INR 600 in urban areas and INR 250 in rural areas. This suggests signifi cant disparity between the expenditure of rich and poor households in both settings. To compare this against administra-tive data, we looked at average expenditure of each household in the survey; it worked out to INR 475 per month. Administrative data on collections and number of domestic consumers came from the PFC report and the CEA General Review. For 2015–16, the average revenue collected from each consumer amounted to INR 570. In 2014–15 this was INR 668 and in 2013–14 this was INR 481. Growth in consumer base has negatively impacted collections per consumer, while increasing tariffs has raised collection per consumer, and the fi gures obtained in the survey are reasonably representative of the changes that the sector has witnessed.
TABLE 9: Summary of the
status of MBC
Source: CEEW analysis
Only 63 per cent of all grid-connected consumers pay some non-zero amount to discoms

33
3.4.2 Katiya connections – acceptance, punishment, and prevalence
As a window into the views of the respondents on the matter of katiya connections, we asked
them about their acceptance of illegal hooking; 84 per cent of the respondents (82 per cent
rural and 89 per cent urban) responded that katiya was either unacceptable or highly unac-
ceptable. Some questions attempt to establish the respondent’s moral compass, and some
responses could be labelled disingenuous. The responses to several questions peppered
throughout the survey show the low acceptance for katiya overall.
By way of an introduction to the issue of ‘hard theft’, consumers were asked to estimate the
share of households in their village/ward indulging in theft. The median response from rural
households was that 20 per cent of the houses in their village possessed a katiya connection.
In urban areas, the median response was that no households in their area possessed an ille-
gal connection. Households that were accepting of katiya (only 4 per cent of all respondents)
had markedly higher perceptions of theft; they indicated that 31 per cent of households in
their locality indulged in katiya.
To understand the drivers of the response, we carried out a regression analysis of the ordinal
responses on the acceptability of katiya against various attributes of the respondent. These
ranged from educational attainment, electricity availability at various hours of the day,
views on the need for fi nancial management of the utility, the discom service region the con-
sumer belonged to, levels of trust in agents of the discom, and perceived corruption levels.
The ordered-logit analysis presented explains the impact on the dependent variable (accep-
tance of katiya) through the use of an odds ratio. We are comparing the people who are in
groups greater than k versus those who are in groups less than or equal to k, where k is the
level of the response variable. The interpretation would be that for a unit change in the pre-
dictor variable, the odds for cases in a group that is greater than k versus less than or equal
to k are the proportional odds times larger.
Acceptability of Katiya (1: very unacceptable to 5: very acceptable)
Odds ratio
Education – Secondary school 0.91
Education – Higher than secondary school 0.73
Daily supply hours (0–24) 0.99
Unavailability of electricity between evening hours 5–8 pm (1-unavailable, 0-available)
0.42*
Unavailability of electricity between late evening hours 8–11 pm (1-unavailable, 0-available)
0.43*
Importance of fi nancial management of utility (ranked 1–5, 1-least important, 5-highest importance)
0.83*
Type of survey–urban or rural (1-rural, 2-urban) 0.80
Meter installed in the household (0-no meter, 1-meter installed)
0.66*
PVVNL (2) 1.08
MVVNL (3) 0.98
PuVVNL (4) 1.72*
TABLE 10: Financial
management of
utility and perceived
personal cost
important drivers of
katiya acceptance
Source: CEEW analysis
Survey Findings

34 Electricity Consumers and Compliance: Trust, Reciprocity, and Socio-economic Factors in Uttar Pradesh
Odds ratio
Trust on your utility company (1–5, 1- strongly trust to 5-strongly distrust)
0.94
Electricity bill payments (1–5, 1-one-time payment in full, 2-full payment in instalments, 3-one-time partial payment, 4-partial payment in instalments, 5-do not pay at all)
1.10
Trust on discom offi cials (1–5, 1- strongly trust to 5-strongly distrust)
1.27*
Trust on linemen/servicemen (1–5, 1- strongly trust to 5-strongly distrust)
0.99*
Corruption among linemen/servicemen (1–5, 1-very little to 5-very heavy)
0.90
Corruption among discom offi cials (1–5, 1-very little to 5-very heavy)
0.91
* indicates statistically signifi cant at 95% confi dence interval, N=1,125, Chi2=261. Errors clustered at village level
Using this interpretation, the most signifi cant fi nding is that metered households are less ac-
cepting of katiya. We also see that an increase in the perceived importance of the utility’s fi -
nancial management results in low acceptance of katiya. This is intuitive as well – people do
understand the fi nancial consequences of katiya for the utility. At the same time, the impact
of availability in the evening hours suggests that respondents are less accepting of katiya if
they experience outages in the evening (5–8 pm) and late evening hours (8–11 pm).
This fi nding needs nuancing. Katiya is seen or projected as the forcible claiming by con-
sumers of their right to electricity in response to poor supply from the utility. This analysis
suggests that people understand that katiya has consequences for their own consumption,
and that it excludes (if not immediately, at least in due course) their own consumption from
the grid. The model also suggests that households that distrust their discom offi cial are also
likely to condone theft.
This insight is signifi cant – the discom–consumer interaction needs a balancing force. If
consumers feel they cannot trust discom offi cials, they become indiff erent to the discom’s
challenges. Another insight is the signifi cance of the discom region a household belongs to
in determining the acceptability of katiya. Consumers of PuVVNL, which encompasses some
of the poorer parts of the state, are more likely to have a higher acceptance of katiya.
Surprisingly, consumers are reluctant to impose any signifi cant punishment on off enders.
About 52 per cent of consumers who fi nd katiya unacceptable indicated that they would
issue a warning to anyone found using a katiya, while 20 per cent of the consumers feel
a small fi ne is appropriate punishment. Only 5 per cent of respondents who fi nd katiya
unacceptable are in favour of more severe punishments, involving jail time. Levying heavy
punishment is not the only way to discourage dishonest behaviour; the perceived likelihood
of being punished should increase (Becker, 1968). Dishonest behaviour increases as expect-
ed benefi ts increase and decreases as the severity and perceived likelihood of punishment
increases.
The UP state government has taken steps to reduce losses from electricity theft. Special po-
lice stations in all districts have been sanctioned to help discoms crack down on theft (Times
of India, 2018) (Times of India, 2018b). One of the measures suggested to meet the loss reduc-
tion targets under the UDAY scheme is conducting a name -and-shame campaign.
TABLE 10: Continued from
page 33

35
Discom offi cials hold that hard theft can be tackled by a carrot-and-stick approach. Con-
sumers must be educated in becoming responsible and in their role in improving service
quality for all. To drive the message home, discom offi cials must engage with political and
community leaders in areas where discoms make high losses. In Mathura and other areas
in Agra zone, vigilant and empowered raid teams have cut losses perceptibly.17 They found
more than 100,000 consumers indulging in hard theft (Hindustan Times, 2018) in the past
six months. This number is a very small percentage of the 180 lakh consumers in the state
(UPERC, 2017, p. 153), and more such teams are needed.
This survey was referred to as the ‘theft survey’ during the study period, but its intention
was to understand the drivers and perception of theft – not estimate its prevalence. Techni-
cal authorities can objectively assess the prevalence of theft once they evaluate all consumer
groups across the state and conduct a detailed assessment based on measurement at various
stages in the distribution system.
However, given the representative nature of the survey, it would be amiss not to comment
on the theft encountered by our enumerators. The fi ndings show that about 13 per cent of
the surveyed households were found to possess an illegal connection, based on prima facie
inspection of the connection;18 63 per cent of these households did not show their electric-
ity bills when requested. The respondents were asked to show their recent electricity bills to
confi rm enumerators’ suspicion of katiya usage. Hence, we estimate that at least 8 per cent
of the total surveyed households may have been in possession of a katiya connection.
Of these households, 92 per cent did not have a meter in their house and 77 per cent do not
make monthly utility payments. When asked to estimate of the share of households in their
area in possession of an illegal connection, the median value of the response of these house-
holds was as high as 30 per cent – a household indulging in theft perceives that a signifi cant
number in their locality are indulging in theft.
There are no documented sources of the number of such katiya connections unearthed over
time to clearly capture the scale of the problem. These comparisons clearly illustrate that
the problem of hard theft may not be the lion’s share of losses attributable to the domestic/
household sector.
3.4.3 Principal-agent-client problem and quid pro quo
Discom employees – linemen, technicians, billing agents, engineers, or other offi cials – act
as agents of the discom and directly interact with consumers. Agents may collude with
consumers in hiding the actual electricity consumption by accepting bribes from them (Jamil
& Ahmad, 2013). This is the quid pro quo in the electricity system (or any public provision
system) that benefi ts both consumer and agent at the principal’s cost.
T o understand the dealings between agents and clients, we analyse the trust of consumers
(clients) in discoms (the principal), their agents, and the state (Figure 15). Consumers dis-
trust discoms and state governments more than agents. More than 70 per cent of respondents
view these two agents of discoms as being moderately to highly corrupt.
Is the theory that linesmen collude with households, which in turn results in a signifi cant
17 Based on interview with discom offi cials of DVVNL supply area.18 Tell-tale signs of wires directly running from the electricity pole through to the household. These could also
be attributed to poor workmanship while installing a formal connection, which did not need a meter in the fi rst place.
Survey Findings
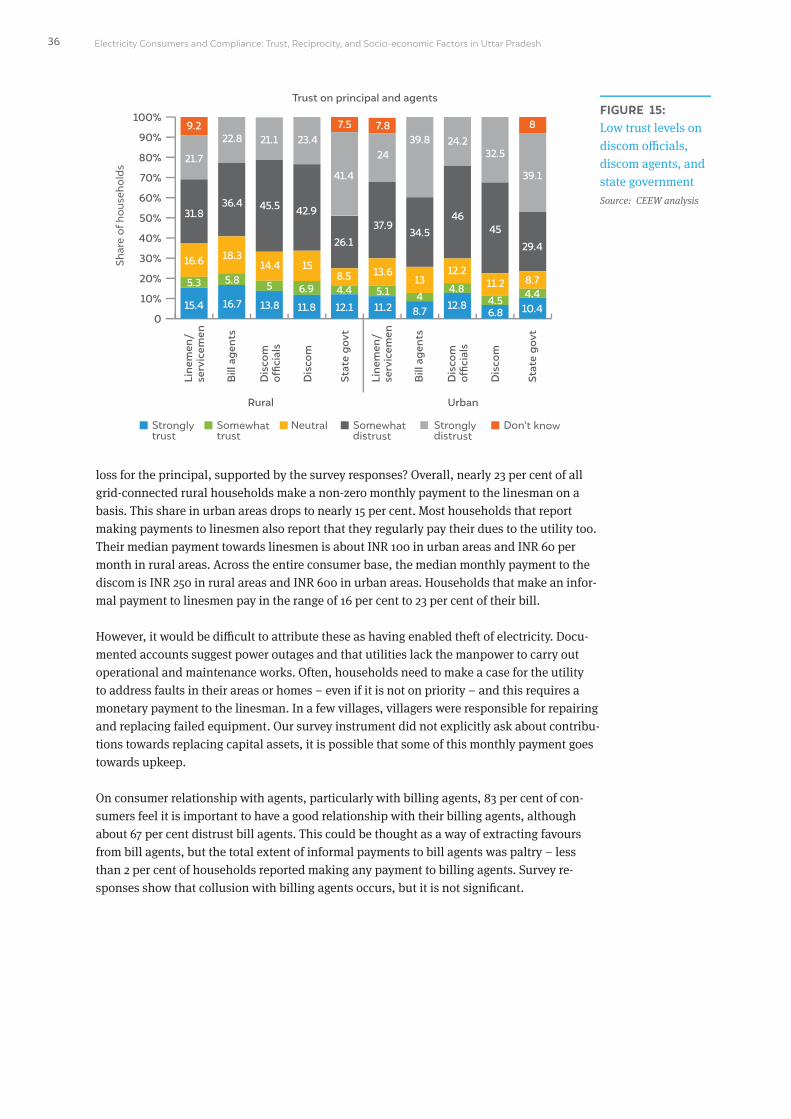
36 Electricity Consumers and Compliance: Trust, Reciprocity, and Socio-economic Factors in Uttar Pradesh
loss for the principal, supported by the survey responses? Overall, nearly 23 per cent of all
grid-connected rural households make a non-zero monthly payment to the linesman on a
basis. This share in urban areas drops to nearly 15 per cent. Most households that report
making payments to linesmen also report that they regularly pay their dues to the utility too.
Their median payment towards linesmen is about INR 100 in urban areas and INR 60 per
month in rural areas. Across the entire consumer base, the median monthly payment to the
discom is INR 250 in rural areas and INR 600 in urban areas. Households that make an infor-
mal payment to linesmen pay in the range of 16 per cent to 23 per cent of their bill.
However, it would be diffi cult to attribute these as having enabled theft of electricity. Docu-
mented accounts suggest power outages and that utilities lack the manpower to carry out
operational and maintenance works. Often, households need to make a case for the utility
to address faults in their areas or homes – even if it is not on priority – and this requires a
monetary payment to the linesman. In a few villages, villagers were responsible for repairing
and replacing failed equipment. Our survey instrument did not explicitly ask about contribu-
tions towards replacing capital assets, it is possible that some of this monthly payment goes
towards upkeep.
On consumer relationship with agents, particularly with billing agents, 83 per cent of con-
sumers feel it is important to have a good relationship with their billing agents, although
about 67 per cent distrust bill agents. This could be thought as a way of extracting favours
from bill agents, but the total extent of informal payments to bill agents was paltry – less
than 2 per cent of households reported making any payment to billing agents. Survey re-
sponses show that collusion with billing agents occurs, but it is not signifi cant.
Strongly trust
Somewhattrust
Neutral Somewhat distrust
Stronglydistrust
Don’t know
0
10%
20%
30%
40%
50%
60%
70%
80%
90%
100%
Line
men
/se
rvic
emen
Bill
age
nts
Rural Urban
Dis
com
of
ficia
ls
Dis
com
Stat
e go
vt
Line
men
/se
rvic
emen
Bill
age
nts
Dis
com
of
ficia
ls
Dis
com
Stat
e go
vt
Shar
e of
hou
seho
lds
15.4 16.7 13.8 11.8 12.1
5.3 5.8 5 6.9 4.4
16.6 18.314.4 15
8.5
31.836.4 45.5 42.9
26.1
21.7
22.8 21.1 23.4
41.4
9.2 7.5
11.2 8.7 12.86.8 10.4
5.1 44.8
4.54.4
13.613
12.211.2 8.7
37.934.5
4645
29.4
2439.8 24.2
32.5
39.1
7.8 8
Trust on principal and agentsFIGURE 15: Low trust levels on
discom offi cials,
discom agents, and
state government
Source: CEEW analysis
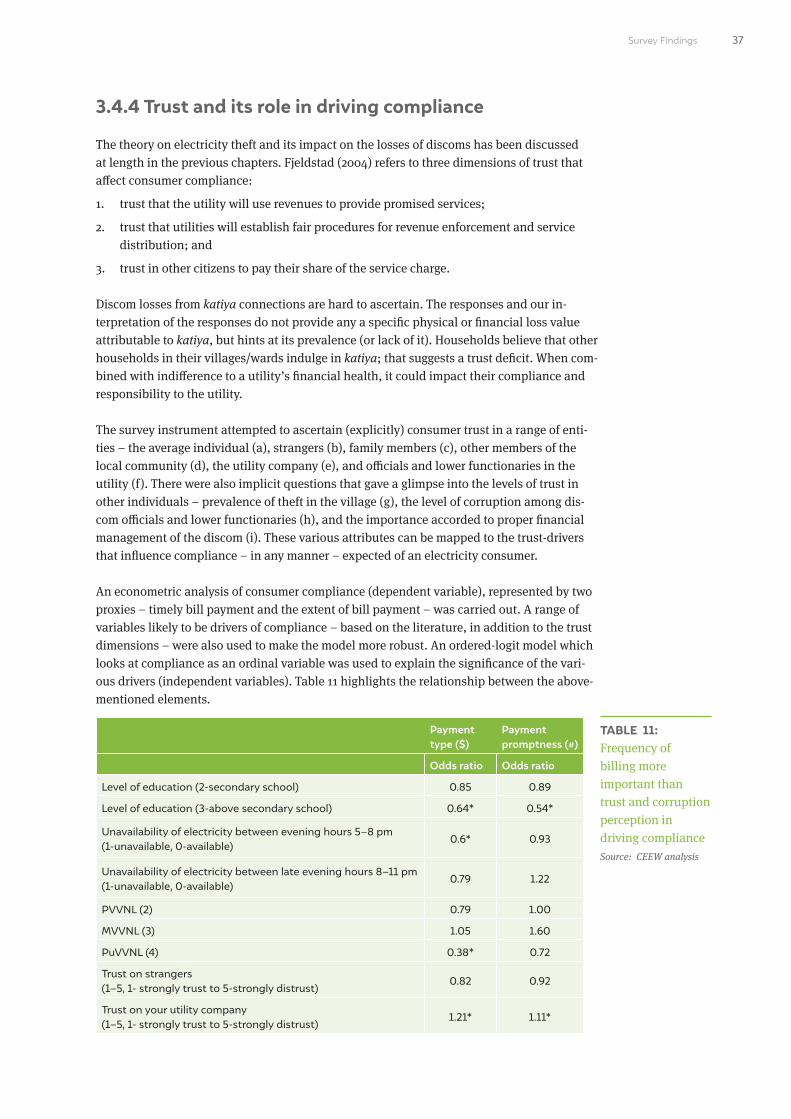
37
3.4.4 Trust and its role in driving compliance
The theory on electricity theft and its impact on the losses of discoms has been discussed
at length in the previous chapters. Fjeldstad (2004) refers t o three dimensions of trust that
aff ect consumer compliance:
1. trust that the utility will use revenues to provide promised services;
2. trust that utilities will establish fair procedures for revenue enforcement and service
distribution; and
3. trust in other citizens to pay their share of the service charge.
Discom losses from katiya connections are hard to ascertain. The responses and our in-
terpretation of the responses do not provide any a specifi c physical or fi nancial loss value
attributable to katiya, but hints at its prevalence (or lack of it). Households believe that other
households in their villages/wards indulge in katiya; that suggests a trust defi cit. When com-
bined with indiff erence to a utility’s fi nancial health, it could impact their compliance and
responsibility to the utility.
The survey instrument attempted to ascertain (explicitly) consumer trust in a range of enti-
ties – the average individual (a), strangers (b), family members (c), other members of the
local community (d), the utility company (e), and offi cials and lower functionaries in the
utility (f). There were also implicit questions that gave a glimpse into the levels of trust in
other individuals – prevalence of theft in the village (g), the level of corruption among dis-
com offi cials and lower functionaries (h), and the importance accorded to proper fi nancial
management of the discom (i). These various attributes can be mapped to the trust-drivers
that infl uence compliance – in any manner – expected of an electricity consumer.
An econometric analysis of consumer compliance (dependent variable), represented by two
proxies – timely bill payment and the extent of bill payment – was carried out. A range of
variables likely to be drivers of compliance – based on the literature, in addition to the trust
dimensions – were also used to make the model more robust. An ordered-logit model which
looks at compliance as an ordinal variable was used to explain the signifi cance of the vari-
ous drivers (independent variables). Table 11 highlights the relationship between the above-
mentioned elements.
Payment type ($)
Payment promptness (#)
Odds ratio Odds ratio
Level of education (2-secondary school) 0.85 0.89
Level of education (3-above secondary school) 0.64* 0.54*
Unavailability of electricity between evening hours 5–8 pm (1-unavailable, 0-available)
0.6* 0.93
Unavailability of electricity between late evening hours 8–11 pm (1-unavailable, 0-available)
0.79 1.22
PVVNL (2) 0.79 1.00
MVVNL (3) 1.05 1.60
PuVVNL (4) 0.38* 0.72
Trust on strangers (1–5, 1- strongly trust to 5-strongly distrust)
0.82 0.92
Trust on your utility company (1–5, 1- strongly trust to 5-strongly distrust)
1.21* 1.11*
TABLE 11: Frequency of
billing more
important than
trust and corruption
perception in
driving compliance
Source: CEEW analysis
Survey Findings

38 Electricity Consumers and Compliance: Trust, Reciprocity, and Socio-economic Factors in Uttar Pradesh
Payment type ($)
Payment promptness (#)
Odds ratio Odds ratio
Trust on lineman (1–5, 1- strongly trust to 5-strongly distrust)
0.99 0.99
Importance of fi nancial management of utility (ranked 1–5, 1-least important, 5-highest importance)
0.95 1.02
Type of survey–Urban or Rural (1-rural, 2-urban)
0.90 0.59*
Corruption among linemen/servicemen (1–5, 1-very little to 5-very heavy)
0.70* 1.13
Corruption among discom offi cials (1–5, 1-very little to 5-very heavy)
1.25* 1.18*
Meter installed in the household (0-no meter, 1-meter installed)
0.89 0.56*
Frequency of receiving electricity bill (1–4, 1-monthly, 2-bi-monthly, 3-every three months, 4-greater than three months)
1.57* 1.72*
* indicates statistically signifi cant at 95% confi dence interval, N=938, Chi2=100, 204. Errors clustered at the village level$ 1 Full payment 2 Full payment in instalments 3 Partial payment 4 Partial payment in instalments 5 No payment at all# 1 Always before due date 2 Mostly before due date 3 About half the time 4 Sometimes before the due date 5 Never before due date
The econometric analysis suggests that trust in the utility is a signifi cant driver of compli-
ance on the part of consumers. For both models, corruption level associated with discom
offi cials turns out to be a signifi cant driver. Both these fi ndings underscore the importance of
an image makeover needed for principal and agent. Increased engagement with consumers
– through targeted outreach and communication – will be essential in convincing them of
the intent for reform and to maintain standards of service.
More importantly, a household belonging to higher socio-economic stratum19 (if educa-
tional achievements are a proxy) is also a consistent driver of compliance. Most importantly,
and the biggest driver of compliance across both models, is the importance of being billed
frequently. This is indeed a telling fi nding, as it suggests that consumers respond to fre-
quent and timely billing. This is something that is clearly missing in the current repertoire of
discom capacity. The implications of this analysis are that the conventional elements of trust
as described in Fjelstad (2004) are perhaps not all consistently important drivers of con-
sumer compliance. The socio-economic context of the state and the incentives for the agents
muddles the trust equation signifi cantly.
Overall, only 39 per cent of the consumers are metered, billed, and pay their bills. This fi gure
drops to 19 per cent for rural UP if we consider the share of households that are metered,
billed frequently, and pay their bills in full. This is in line with the most recent order from
UPPCL (UPPCL, 2018) that suggests that only 20 per cent of the overall rural consumer base
has paid up its entire dues for the fi rst six months of the 2018–19 fi nancial year by the end
of October. This is an important outcome for the discom. It suggests that their focus must shift
to improving their billing rates and improving the perception among the consumers that bills
refl ect their metered consumption.
19 Household expenditure was not used as a proxy for income because many households reported incomes inconsistent with their asset base and expenditure on electricity. Overall, there were indications of under-reporting,
Focus must shift to improving their billing rates and improving the perception among the consumers that bills reflect their metered consumption
TABLE 11: Continued from
page 37
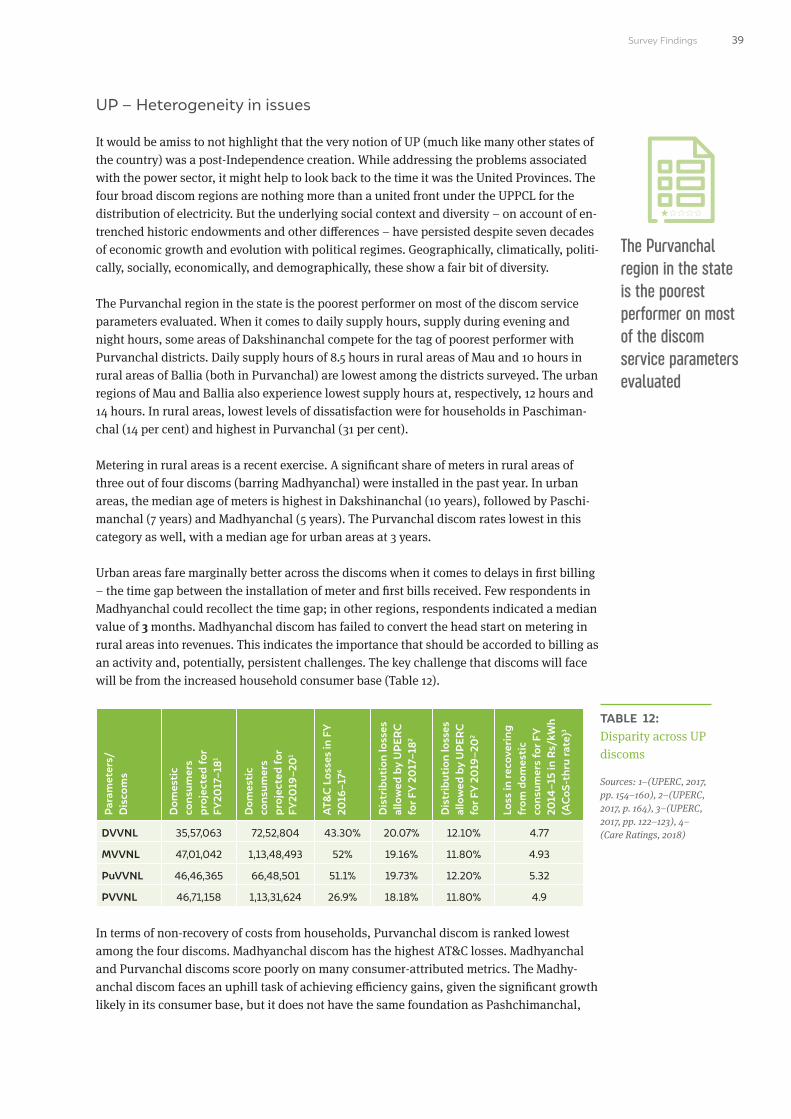
39
UP – Heterogeneity in issues
It would be amiss to not highlight that the very notion of UP (much like many other states of
the country) was a post-Independence creation. While addressing the problems associated
with the power sector, it might help to look back to the time it was the United Provinces. The
four broad discom regions are nothing more than a united front under the UPPCL for the
distribution of electricity. But the underlying social context and diversity – on account of en-
trenched historic endowments and other diff erences – have persisted despite seven decades
of economic growth and evolution with political regimes. Geographically, climatically, politi-
cally, socially, economically, and demographically, these show a fair bit of diversity.
The Purvanchal region in the state is the poorest performer on most of the discom service
parameters evaluated. When it comes to daily supply hours, supply during evening and
night hours, some areas of Dakshinanchal compete for the tag of poorest performer with
Purvanchal districts. Daily supply hours of 8.5 hours in rural areas of Mau and 10 hours in
rural areas of Ballia (both in Purvanchal) are lowest among the districts surveyed. The urban
regions of Mau and Ballia also experience lowest supply hours at, respectively, 12 hours and
14 hours. In rural areas, lowest levels of dissatisfaction were for households in Paschiman-
chal (14 per cent) and highest in Purvanchal (31 per cent).
Metering in rural areas is a recent exercise. A signifi cant share of meters in rural areas of
three out of four discoms (barring Madhyanchal) were installed in the past year. In urban
areas, the median age of meters is highest in Dakshinanchal (10 years), followed by Paschi-
manchal (7 years) and Madhyanchal (5 years). The Purvanchal discom rates lowest in this
category as well, with a median age for urban areas at 3 years.
Urban areas fare marginally better across the discoms when it comes to delays in fi rst billing
– the time gap between the installation of meter and fi rst bills received. Few respondents in
Madhyanchal could recollect the time gap; in other regions, respondents indicated a median
value of 3 months. Madhyanchal discom has failed to convert the head start on metering in
rural areas into revenues. This indicates the importance that should be accorded to billing as
an activity and, potentially, persistent challenges. The key challenge that discoms will face
will be from the increased household consumer base (Table 12).
Par
amet
ers/
Dis
com
s
Dom
esti
c co
nsum
ers
proj
ecte
d fo
r FY
2017
–181
Dom
esti
c co
nsum
ers
proj
ecte
d fo
r FY
2019
–20
1
AT&
C L
osse
s in
FY
2016
–174
Dis
trib
utio
n lo
sses
al
low
ed b
y U
PER
C
for F
Y 20
17–1
82
Dis
trib
utio
n lo
sses
al
low
ed b
y U
PER
C
for F
Y 20
19–2
02
Loss
in re
cove
ring
fr
om d
omes
tic
cons
umer
s fo
r FY
2014
–15
in R
s/kW
h (A
CoS
-thr
u ra
te)3
DVVNL 35,57,063 72,52,804 43.30% 20.07% 12.10% 4.77
MVVNL 47,01,042 1,13,48,493 52% 19.16% 11.80% 4.93
PuVVNL 46,46,365 66,48,501 51.1% 19.73% 12.20% 5.32
PVVNL 46,71,158 1,13,31,624 26.9% 18.18% 11.80% 4.9
In terms of non-recovery of costs from households, Purvanchal discom is ranked lowest
among the four discoms. Madhyanchal discom has the highest AT&C losses. Madhyanchal
and Purvanchal discoms score poorly on many consumer-attributed metrics. The Madhy-
anchal discom faces an uphill task of achieving effi ciency gains, given the signifi cant growth
likely in its consumer base, but it does not have the same foundation as Pashchimanchal,
TABLE 12: Disparity across UP
discoms
Sources: 1–(UPERC, 2017,
pp. 154–160), 2–(UPERC,
2017, p. 164), 3–(UPERC,
2017, pp. 122–123), 4–
(Care Ratings, 2018)
The Purvanchal region in the state is the poorest performer on most of the discom service parameters evaluated
Survey Findings

40 Electricity Consumers and Compliance: Trust, Reciprocity, and Socio-economic Factors in Uttar Pradesh
which is also faced with similar growth prospects. While domestic consumers are not the
only category serviced by discoms, they form a signifi cant portion (39 per cent to 47 per
cent) of sales. The losses approved by UPERC for the next few years are much lower than the
actual losses of discoms. The losses in recoveries will depend upon how well the discoms
improve their service provision by way of billing and collection.
The analysis on acceptance of katiya has also thrown out the interesting fi nding that con-
sumers in the MVVNL and PuVVNL jurisdictions are more likely to condone theft. As areas
that already experience high levels of losses, it is indeed concerning that the acceptance of
katiya is also higher in these regions.
Uttar Pradesh is not a singular entity in terms of the challenges faced by its power sector.
Given the socio-economic status of eastern UP (the Purvanchal control area), the power sec-
tor scenario could improve if the expectations of the discom refl ect the on-ground situation.
Madhyanchal discom, despite benefi ting from housing the seat of political power, has come
up short on performance, due perhaps to proximity to power. Payment dues from public
sector undertakings and urban local bodies are signifi cant; Lucknow, being the largest such
area, has been a drag on Madhyanchal.
State and central government agencies must acknowledge that all UP discoms cannot func-
tion under one effi ciency improvement trajectory. The issues in each of these discoms arise
from dissimilar endowments – political capital, household and societal economic progress
and, most importantly, the discom’s competency to administer the region under their con-
trol. What is common from the state-level analysis is that consumers are more likely to pay
up if metered and billed frequently. The fi rst step, then, would be to ensure that discom ca-
pacity across all regions is geared up to face this common goal. True separation or autonomy
is not on the cards; therefore, driving this common agenda is important alongside the need
to provide both consumers and discom agents context-specifi c incentives.
State and central government agencies must acknowledge that all UP discoms cannot function under one efficiency improvement trajectory

41
4. Conclusion and Way Forward
In the context of reforming the power sector in India, technical and commercial losses have
been debated for a very long time. In UP, there has been little evidence on the true extent
of each of these components of loss. The dominant narrative within commercial loss has
been one of blatant theft and rampant illegal consumption of electricity by consumers across
the board. The study aimed at understanding the drivers of such commercial losses and fac-
tors that lead to acceptance and prevalence of hard theft in the state.
Consumers who are metered and billed and who pay their bills in full make up only 39 per
cent of all consumers in the state and only 19 per cent in rural UP. As the domestic consumer
base grows, discoms will increasingly need to focus on improving their metering, billing,
and collection practices. Technical authorities can objectively assess the prevalence of theft
only after they extensively assess all the distribution infrastructure in the state (or at least a
representative sample) and measure losses at various stages in the distribution system.
The issue of hard theft will continue to grab headlines in the popular media, but it is un-
likely that it is the single biggest contributor to discom loss. Our survey points to only 8 per
cent of households potentially indulging in blatant theft. A much larger dent is made on
discom fi nances by losses arising from the indiff erence of both discoms and consumers to
proper metering and to poor levels of billing and collection. As the discoms move closer to
ensuring 24×7 power for all, it is important to consider the cost of providing uninterrupted
and universal electricity supply.
The diversity in social, economic, demographic, and political-capital endowments of the
various regions of the state is reason enough for the state government to adopt a tailored
strategy to address the malaise within each. Targets and incentives for performance-driven
schemes must be aligned with the wiggle room that each region has. With the transitions
that the power sector is likely to witness over the next two decades – market reforms in bulk
procurement, competition in distribution, and decreasing cost of alternatives – there is a
pressing need to leave behind the baggage of the past and leapfrog into newer paradigms.
The basis for such a leap must certainly start with increased accountability and responsibil-
ity – of consumers and discoms, to each other.
Based on the key fi ndings from the survey and interactions with stakeholders, we have pro-
posed a list of measures to help discoms prioritise their strategies, classifi ed into short-term
(0–2 years) and medium-term (2–5 years) (Table 13).
The issue of hard theft will continue to grab headlines in the popular media, but it is unlikely that it is the single biggest contributor to discom loss

42 Electricity Consumers and Compliance: Trust, Reciprocity, and Socio-economic Factors in Uttar Pradesh
Recommended measures/timelines
Short-term (up to 18 months) Medium-term (beyond 18 months)
Electricity supply Increasing the evening and late evening hours of supply will improve consumer satisfaction and increase compliance levels.
Target 24×7 electricity supply to all.
Universal metering of consumers
An effort equivalent to that required for 100% electrifi cation is needed for universal metering. Procurement, product and technology standardisation and raising consumer awareness on benefi ts of being metered must be the immediate goal.
Installation of advanced metering infrastructure (AMI) to limit manual intervention in meter reading and bill generation is necessary to reduce administrative costs in the long run.
Enabling time-of-day consumption meters
Billing Trust billing to be made universal to enable recovery for newly metered consumers.
Frequent reminders (sms/ email/ texting apps) to consumers on bills and creating a demand for timely billing.
Increasing the outlay for contractual billing and linking payments to timely bill delivery. IT infrastructure spending to link billing with metering systems
Clear specifi cation of recent payments, dues cleared, and outstanding dues in bills. Educative bills that provide clarity on determination of dues.
Shifting to frequent billing – monthly, in all areas.
Leveraging AMI to have frequent billing and shifting bill delivery to online modes.
Collection The OTS scheme must be withdrawn to indicate a credible threat to defaulters. Given the multiple rounds of the OTS, even paying consumers are likely to start defaulting.
Increasing touchpoints with the discom to enable easier payments.
Leveraging public infrastructure such as post-offi ces, to perform the role of point of sale entities
Offering attractive pricing options for pre-paid consumption and for consumers willing to sign-up for auto debit (ECS) payment modes
Shifting bulk of the payments to online modes
Enabling
Curbing electricity theft
Awareness raising and engagement with consumers will bridge the trust defi cit and also reduce acceptance of ka ya in the short term. Vigilance squads only to target key areas of rampant non-compliance and theft.
Extensive metering at all levels and accounting will result in easier identifi cation of theft cases and reduce the effort involved in deploying squads and personnel.
Targeting improvements in AT&C loss
Revising the AT&C loss targets for UP discoms and identifying specifi c action items and commensurate impact that each can have.
Reducing commercial losses to levels that meet the benchmarks set by other discoms in India or international best practices.
TABLE 13: Policy roadmap for
sustaining reliable
electricity supply in
Uttar Pradesh
Source: CEEW analysis
43
Bibliography
Balls, J. (2018). Stalled reforms in the face of electoral fears. In N. Dubash, S. Kale, & R. Bharvirkar, Map-
ping Power–The political economy of electricity in India’s states (pp. 274–295). New Delhi: Oxford
publication.
Becker, G. S. (1968). Crime and Punishment: An Economic approach. Journal of political economy,
169–217.
Braithwaite, J., & Makka, T. (1994). Trust and compliance. Policing and Society, 1994, Vol 4, 1–12.
Care Ratings. (2018). Sixth Annual Integrated Rating–state distribution utilities. New Delhi: Ministry of
Power.
DDUGJY. (2018, July 31). DDUGJY. Retrieved from DDUGJY: https://www.google.com/url?q=http://www.
ddugjy.gov.in/portal/state_wise_summary1.jsp?stateCode%3D09&sa=D&source=hangouts&ust=15
38028689105000&usg=AFQjCNFh0IdpWqMyZGfi VapXgWdGIrKXLA
Depuru, S. S., Wang, L., & Devabhuktani, V. (2011). Electricity theft: Overview, issues, prevention and a
smart meter based approach to control theft. Elsevier Energy Policy 39, 1007–1,015.
Expert Committee to UPERC. (2016). Report of Expert Committee in the Petition No. 816 of 2012.
Feedback Ventures. (2010). Estimation and Segregation of Distribution Loss in Solapur Circle Electricity
Distribution Network. Maharahtra Electricity Regulatory Commission (MERC).
Fjeldstad, O. H. (2004). What’s trust got to do with it? Non-payment of service charges in local. J Mod Afr
Stud, 42–62.
Foroudi, P., Gupta, S., & Sivarajah, U. (2017). Investigating the Eff ects of Smart Technology on Customer
Dynamics and Customer. Computers in Human Behavior.
Gaur, V., & Gupta, E. (2016). The determinants of electricity theft: An empirical analysis of Indian states.
Energy Policy 93, 127–136.
Golden, M., & Min, B. (2012, February). Theft and Loss of Electricity in an Indian State. London School
of Economics and University of Oxford Working Paper 12/0060.
Gurtoo, A., & Pandey, R. (2001). Power Sector in UP: Past Problems and Initial Phase of Reforms. Eco-
nomic and Political Weekly, 2943–2,953.
Hindustan Times. (2018, November 12). Hindustan TImes. Retrieved from HIndustan Times: https://
www.hindustantimes.com/lucknow/over-1-lakh-power-theft-cases-detected-in-uttar-pradesh-
since-april/story-UMkVK9GVdcioEqHqoXIn6I.html
IEA. (2018). Electric power transmission and distribution losses (% of output). Retrieved from The World
Bank Data: https://data.worldbank.org/indicator/EG.ELC.LOSS.ZS
IPDS. (2016, January). IPDS. Retrieved from IPDS: http://www.ipds.gov.in/Whats_New_Files/IMPACT_
ASSESSMENT_REPORT.pdf
Jain, A., Ray, S., Ganesan, K., Aklin, M., Cheng, C.-y., & Urpelainen, J. (2015). ACCESS–Access to clean
cooking energy and electricity. New Delhi: CEEW.
Jainani, D. (2018, April 7). Pulling the plug: UP’s power distribution reform plan scrapped. Retrieved from
Financial Express: https://www.fi nancialexpress.com/economy/pulling-the-plug-ups-power-distri-
bution-reform-plan-scrapped/1124529/
Jamil, F., & Ahmad, E. (2013). An Economic Investigation of Corruption and Electricity theft. Islamabad:
Pakistan Institute of Development Economics.
Khandker, S. R., Barnes, D. F., & Samad, H. A. (2010). Energy poverty in rural and urban India : are the
energy poor also income poor? Washington D.C: World Bank.
Ministry of Power. (2016, January 28). Tripartite Memorandum of Understanding Amongst Ministry of
Power, Government of India And Government of Uttar Pradesh and UP Power Corporation Limited.
Ministry of Power. (2017). 24X7 Power for All Roadmap- UP. Retrieved from Ministry of Power: https://
powermin.nic.in/sites/default/fi les/uploads/PFA_14.04.2017_Signed_CRISIL_Final_Ver00.pdf
Ministry of Power. (2018, December 31st). AT&C Loss ( UP ). Retrieved from Ujjwal Discom Assurance
Yojana- Ministry of Power: https://www.uday.gov.in/state.php?id=8
Ministry of Power. (2018, June 6th). Saubhagya. Retrieved from Ministry of Power: http://saubhagya.gov.
in/
Ministry of Statistics & Programme Implementation. (2017, August 7th). Per Capita Income–Government
of India, Ministry of Statistics & Programme Implementation. Retrieved from Press Information
Bureau: http://pib.nic.in/newsite/PrintRelease.aspx?relid=169,546

44 Electricity Consumers and Compliance: Trust, Reciprocity, and Socio-economic Factors in Uttar Pradesh
MoP. (2018). IPDS. Retrieved from IPDS: http://www.ipds.gov.in/Forms/Know_More.aspx
MOSPI. (2014). NSS-68. New Delhi: MOSPI.
Never, B. (2015). Social norms, trust and control of power theft in Uganda: Does bulk metering work for
MSEs? Energy Policy 82, 197–206.
Niu, S., Jia, Y., Wang, W., He, R., Hu, L., & Liu, Y. (2013). Electricity consumption and human develop-
ment level: A comparative analysis based on panel data for 50 countries. International Journal of
Electrical Power & Energy Systems, 338–347.
Pargal, S., & Banerjee, S. G. (2014). More Power to India: The Challenge of Electricity Distribution. The
World bank.
PFC India. (2017). The Performance of State Power Utilities for the years 2013–14 to 2015–16. Ministry of
Power.
PIB. (2017, October 09). PIB. Retrieved from PIB: http://pib.nic.in/newsite/PrintRelease.
aspx?relid=171,541
Prayas Energy Group, P. (2018). Electricity Supply Monitoring Initiative. Retrieved from Watch Your Power
Qualaity: https://www.watchyourpower.org/download_raw_data.php
Rao, S. (2002). The Political Economy of Power. Economic and Political Weekly Vol. 37, No. 33 (Aug. 17–23,
2002), 3433–3,444.
REC. (2018, October 31). DDUGJY. Retrieved from DDUGJY: http://www.ddugjy.gov.in/portal/memo/prog-
ress_report/progress_report.pdf
Saini, S. (2017, June). Social and behavioral aspects of electricity theft: An explorative review. Interna-
tional Journal of Research in Economics and Social Sciences (IJRESS), 26–37.
Smith, T. B. (2004). Electricity theft: a comparative analysis. Energy Policy 32, 2067–2,076.
Swain, A., & Charnoz, O. (2012, August). In Pursuit of Energy Effi ciency in India’s Agriculture: Fighting
�Free Power� or Working with it? Agence Française de Développement Working Paper (126).
The World Bank. (2005, May 24). The World Bank. Retrieved October 29, 2018, from World Bank: http://
documents.worldbank.org/curated/en/751781468034729937/pdf/32423.pdf
Times of India. (2015, January 12). In UP, own up power theft, get away with minor penalty. Times of
India, p. 1.
Times of India. (2018, May 24). 250 FIRs against power thieves under Mass Raid Programme. Times of
India, p. 1.
Times of India. (2018, June 6). All UP dists to have special police stations to check power. Times of India,
p. 1.
Times of India. (2018b, February 19). Raids reveal direct power theft at 341 spots in west UP. Times of
India, p. 1.
Transparency International. (2018, Februrary). Consumer Perceptions Index 2017. Retrieved from Trans-
parency international: https://www.transparency.org/news/feature/corruption_perceptions_in-
dex_2017
Transparency International India, Local Circles. (2018). India Corruption Survey 2018. Transparency
International India, Local Circles.
UPERC. (2015, June 18). Determination of ARR and Tariff for FY 2015–16 and True-Up and and Revenue
for FY 2012–13 For Dakshinanachal Vidyut Vitran Nigam Limited. 194.
UPERC. (2016, August 1). Determination of ARR and Tariff for FY 2016–17 for KESCO, DVVNL, MVVNL,
PVVNL and PuVVNL.
UPERC. (2016, December 9). Order on Revision of Consumption Norms for Unmetred Category of Con-
sumers. Lucknow.
UPERC. (2016, May 27). UPERC. Retrieved from UPERC: http://www.uperc.org/App_File/SupplyCode7th-
Amendment-pdf118201745013PM.pdf
UPERC. (2017, September). Approcal of Business plan, MYT of UP Discoms for FY 2017–18 to 2019–20.
Lucknow: UPERC.
UPPCL. (2016, April). One Time Settlement Scheme (OTS) of 100 percent surcharge Waiver for
LMV-1 and LMV-5. Retrieved from http://upenergy.in/site/writereaddata/uploadedCirculars
/C_201612151201004874.pdf
UPPCL. (2017, April). One Time Settlement (OTS) Scheme for LMV-1, LMV-2, LMV-4B, LMV-5 and LMV-6
Series Eletric Consumer 2017–18. Retrieved from http://upenergy.in/site/writereaddata/uploadedCi
rculars/C_201704181228318323.pdf
UPPCL. (2018, July). FInal Solution Future Easy Plan. Retrieved from http://upenergy.in/site/writeread-
data/uploadedCirculars/C_201808231813574173.pdf
45
UPPCL. (2018, January 25th). Letter No. 101. Staff Motivation and Empowerment Schemes. Lucknow, UP.
UPPCL. (2018, October 31st). Letter No. 829 to DVVNL, MVVNL, PuVVNL, KESCO discoms.
Winther, T. (2012). Electricity theft as a relational issue: A comparative look at Zanzibar, Tanzania, and
Sunderban Islands, India. Energy for Sustainable Development, 111–119.
Bibliography
46 Electricity Consumers and Compliance: Trust, Reciprocity, and Socio-economic Factors in Uttar Pradesh
Image: iStock
47

48 Electricity Consumers and Compliance: Trust, Reciprocity, and Socio-economic Factors in Uttar Pradesh
COUNCIL ON ENERGY, ENVIRONMENT AND WATER (CEEW)
[email protected] | ceew.in | @CEEWIndia
NEW DELHISanskrit Bhawan, A-10, Aruna Asaf Ali Marg Qutab Institutional Area New Delhi 110 067, India T: +91 11 407 333 73
LUCKNOW504 A, Riviera Blues Fortuna ApartmentsNew Hyderabad, LucknowUttar Pradesh - 226007, IndiaT: +91 0522 4230180
Image: iStock