electricity from natural gas with co2 capture for … · electricity from natural gas with co2...
TRANSCRIPT

Electricity from Natural Gas with CO2 Capture for Enhanced Oil Recovery
Emission accounting under Cap-&-Trade and LCFS
California Council on Science and Technology January 2015

Electricity from Natural Gas with CO2 Capture for Enhanced Oil
Recovery Emission accounting under Cap-‐&-‐Trade and LCFS
Authors: James Rhodes III Andres Clarens Pragnya Eranki Jane C. S. Long
California Council on Science and Technology January 2015
1
Acknowledgments The authors gratefully acknowledge the support of the California Council on Science and Technology and Bipartisan Policy Center, and particularly the consistent encouragement, feedback and support provided by Jane Long. This report would not have possible without your support. We also acknowledge and are grateful for the thoughtful comments and feedback provided by Cassandra Brunette, Noah Deich, Sasha Mackler, Jeff Greenblatt, Susan Hovorka, Howard Herzog, David Keith, Paulina Jaramillo, and Adam Brandt. Your feedback substantially elevated the quality of this report. Thank you.
Reviewers This report was subject to a formal CCST-‐lead peer review process. Thoughtful comments on numerous drafts of the report were provided by the following reviewers (in alphabetical order): Adam Brandt; Cassandra Brunette; Noah Deich; Jeff Greenblatt; Howard Herzog; Susan Hovorka; Paulina Jaramillo; David Keith; and Sasha Mackler. Their time, effort, and thoughtful consideration is very much appreciated and contributed substantially to the quality of the final report. Remaining deficiencies in the report, despite the best efforts of these reviewers, are the sole responsibility of the authors. The California’s Energy Futures Committee of the California Council on Science and Technology requested this study to provide information on emission accounting as part of an ongoing investigation on policies affecting California’s energy future.
Copyright Copyright 2015 by the California Council on Science and Technology
Electricity from Natural Gas with CO2 Capture for Enhanced Oil Recovery: Issues and Context
January 2015 ISBN 978-‐1-‐930117-‐98-‐3
Note: The California Council on Science and Technology (CCST) has made every reasonable effort to assure the accuracy of the information in this publication. However, the contents of this publication are subject to changes, omissions, and errors, and CCST does not accept responsibility for any inaccuracies that may occur. CCST is a non-‐profit organization established in 1988 at the request of the California State Government and sponsored by the major public and private postsecondary institutions of California and affiliate federal laboratories in conjunction with leading private-‐sector firms. CCST’s mission is to improve science and technology policy and application in California by proposing programs, conducting analyses, and recommending public policies and initiatives that will maintain California’s technological leadership and a vigorous economy.

2
For questions or comments on this publication contact:
California Council on Science and Technology 1130 K. Street, Suite 280
Sacramento, California 95814 (916) 492-‐0996 * [email protected]
Support for this project was provided by the Bipartisan Policy Center.
In accordance with ethical guidelines and prudent practices in research, James Rhodes reports to have financial and/or business interests in one or more companies that may be affected by the research described in this report. These include interests related to U.S. patent number US 8574354 B2 and other patent filings. These interests have been disclosed to the California Council on Science and Technology.
3
About the authors James S. Rhodes* works in various capacities to advance development of low emission production systems and coherent climate policy. He currently serves as President of Trestle Energy LLC, which is actively developing low carbon transportation fuels. He previously served for two years as Managing Director of the National Low Carbon Fuel Study, a multidisciplinary initiative to evaluate and develop policy design recommendations for a potential national LCFS policy. The initiative was led by researchers at the University of California, Davis and included collaborators from five other research institutions: the University of Maine; the University of Illinois, Urbana-‐Champaign; Carnegie Mellon University; Oak Ridge National Laboratory; and the International Food Policy Research Institute. James Rhodes received a B.S. in Environmental Science from the University of Denver and an M.S. and Ph.D. in Engineering and Public Policy from Carnegie Mellon University. He has contributed to multiple articles, reports, and patent applications related to low emission energy systems and associated climate policy issues. Andres F. Clarens is an Associate Professor of Civil and Environmental Engineering at the University of Virginia and the Director of the Virginia Environmentally Sustainable Technologies Laboratory. He is an author or coauthor on over 30 archival papers focused broadly on anthropogenic carbon flows and the ways that CO2 is manipulated, reused, and sequestered in engineered systems. The results of his work are important for developing efficient strategies for mitigating the emissions that are driving climate change and for understanding how infrastructure systems must be adapted to meet these changes. For his work, he has received a variety of awards including the National Science Foundation CAREER award and the American Chemical Society Petroleum Research Fund Young Investigator Award. He received a B.S. in Chemical Engineering from the University of Virginia and an M.S.E. and Ph.D. in Environmental Engineering from the University of Michigan. In his spare time, Prof Clarens also enjoys running, backpacking, fly-‐fishing, and traveling. Pragnya L. Eranki received her doctorate in Chemical Engineering and Materials Science at Michigan State University in 2012. The focus of her doctoral research was sustainable biofuel production and associated supply chains, and conducting systems-‐wide life cycle assessments of cellulosic ethanol. As a postdoctoral researcher at the University of Virginia in 2013-‐14, her research has included conducting life cycle assessments of carbon dioxide supply chains & sequestration techniques such as CO2-‐enhanced oil recovery, current and emerging pathways of carbon capture and utilization from coal and natural gas power plants, and shale/natural gas extraction and supply. Jane C. S. Long recently retired from Lawrence Livermore National Laboratory where she was the Principal Associate Director at Large, Fellow in the LLNL Center for Global Strategic Research and the Associate Director for Energy and Environment. Her current work involves strategies for dealing with climate change including reinvention of the energy system, geoengineering and adaptation. She is currently a senior contributing scientist for the Environmental Defense Fund, and chairman of the California Council on Science and Technology’s California’s Energy Future committee. She is also the Chairman and lead scientist for the CCST’s advisory committees for
4
the assessment of hydraulic fracturing in California. Dr. Long was the Dean of the Mackay School of Mines, University of Nevada, Reno and Department Chair for the Energy Resources Technology and the Environmental Research Departments at Lawrence Berkeley National Lab, Visiting Researcher at UC Berkeley, Co-‐chair of the Task Force on Geoengineering for the Bipartisan Policy Center. She holds a bachelor’s degree in engineering from Brown University and Masters and PhD from U. C. Berkeley. Dr. Long is a fellow of the American Association for the Advancement of Science and was named Alum of the Year in 2012 by the Brown University School of Engineering. Dr. Long is an Associate of the National Academies of Science (NAS) and a Senior Fellow and council member of the California Council on Science and Technology (CCST) and the Breakthrough Institute. She serves on the board of directors for the Clean Air Task Force and the Center for Sustainable Shale Development.
________________________________________________
*Note: In accordance with ethical guidelines and prudent practices in research, James Rhodes reports to have financial and/or business interests in one or more companies that may be affected by the research described in this report. These include interests related to U.S. patent number US 8574354 B2 and other patent filings. These interests have been disclosed to the California Council on Science and Technology. The author’s primary motivation in developing this report is in the public interest -‐ to support development of climate policy instruments that are coherent, consistent, and effective in helping achieve California’s long-‐term climate policy objectives. The report and its underlying analysis are firmly grounded in the regulatory records, and they have been developed in close collaboration with the CEFP Committee and CCST representatives and the report’s co-‐authors.
5
Table of Contents Summary ........................................................................................................................................ 7
Introduction ................................................................................................................................. 14
Background .................................................................................................................................. 19
Overview of C&T policy framework .................................................................................................. 19
Overview of LCFS policy framework ................................................................................................. 21
Key distinctions between the LCFS and C&T frameworks .............................................................. 24
Policy relevance of CCUS for C&T and LCFS ..................................................................................... 25
Model Description ....................................................................................................................... 29
Conceptual framework ....................................................................................................................... 29
Specification of NG-‐CCS-‐EOR system ....................................................................................... 29
Specification of emission accounting methodologies .............................................................. 31
Emissions inventory data ......................................................................................................... 37
Comparison baseline production method ............................................................................... 39
Parameter values ................................................................................................................................. 41
Results .......................................................................................................................................... 42
C&T results ........................................................................................................................................... 42
LCFS results ........................................................................................................................................... 45
Sensitivity analysis ............................................................................................................................... 47
Policy Discussion .......................................................................................................................... 52
Issues common to both policies ........................................................................................................ 52
MRV ...................................................................................................................................... 52
Methane leakage .................................................................................................................. 53
Double counting ................................................................................................................... 53
C&T-‐specific issue: where should the emissions reduction be recognized? ............................... 56
LCFS-‐specific issue: which comparison baseline is appropriate? .................................................. 60
References ................................................................................................................................... 63

6
List of Figures Figure S-‐1. Process schematic for NG-‐CCS-‐EOR system evaluated in this report. ........................ 14 Figure 2. Lifecycle stages and covered entities for NG-‐CCS-‐EOR. ................................................. 31 Figure 3. System boundaries for the full lifecycle and innovative methods provisions. ............... 32 Figure 4. System boundary adopted by CARB for evaluating TEOR in CARBOB fuel pathway. .... 33 Figure 5. System-‐wide compliance obligations for NG-‐CCS-‐EOR and “California average” benchmark. .................................................................................................................................. 43 Figure 6. CA-‐C&T compliance obligations by covered entity for each of three policy scenarios. . 44 Figure 7. Carbon intensity of crude oil supplied via NG-‐CCS-‐EOR by lifecycle stage. ................... 46 Figure 8. Sensitivity analysis for C&T emissions reductions. ........................................................ 48 Figure 9. Sensitivity analysis plots for LCFS results. ..................................................................... 49 Figure 10. Sensitivity of emissions reductions to the incremental oil production rate. ................ 51
List of Tables Table S-‐1. Policy design considerations for allocating emissions benefits under the C&T program ................................................................................................................................ 10 Table 2. Key parameter values used for deterministic analysis ................................................... 41 Table 3. Net CI benefits of NG-‐CCS-‐EOR under CA-‐LCFS. ............................................................. 46 Table 4. Policy considerations alternatives for recognizing emissions benefits under C&T. ....... 57
7
Summary This report evaluates emission accounting under California’s existing climate policies for energy systems that integrate CO2 capture and storage (“CCS”) with CO2-‐enhanced oil recovery (“CO2-‐EOR”). CCS has been identified as potentially important for advancing California’s energy future and climate goals. The California’s Energy Future study (CEF)1 showed that California’s 2050 goal of reducing greenhouse gas emissions by 80% below 1990 levels will be very difficult to achieve from a technical perspective alone. Moreover, nearly all technology portfolios identified in the study for achieving the 80% target require CCS, primarily as a way to overcome challenges from irreducible fuel requirements and limited supplies of low-‐carbon fuels. Near-‐term industrial experience is viewed by many to be important for ensuring availability of CCS technologies in time to meet California’s 2050 emissions target. Systems that integrate CCS with CO2-‐EOR (“CCS-‐EOR”), one of several approaches referred to as carbon capture utilization and storage (“CCUS”), have been identified as particularly important for early deployments due to their ability to reduce near-‐term emissions, accelerate development of CCS technologies and infrastructure that can enable deeper future reductions, attract commercial capital. As a result, proximate CCS deployments in California depend in part on resolving regulatory uncertainties regarding emission accounting for CCUS systems that integrate CO2-‐EOR. Several companies have proposed CCUS projects in California where the economics can be improved by using captured CO2 for CO2-‐EOR. While many of the component technologies required for such projects are available, significant risks remain, and innovation is required to effectively integrate the technologies, organizations, and industries that comprise CCS-‐EOR. In theory, California’s climate policies could stimulate such CCUS deployments (within a broader technology portfolio) to advance key climate policy objectives; however, the treatment of these systems under existing regulations is not yet sufficiently well resolved. The current regulatory uncertainty creates challenges for key decision makers—including regulated parties, project developers, and regulatory authorities—and compromises their ability to effectively advance important climate policy objectives. It also confounds decision making in jurisdictions still considering the policy options for implementing coherent climate regulation. Resolving this uncertainty is also important because, if successful, early CCUS projects could open the door to several potentially important low-‐carbon energy systems for California, such as:
• Burning biomass to make electricity and sequestering the CO2 to yield net negative emissions;
• Reforming methane to make hydrogen fuel and sequestering the resulting CO2; • Applying methods to directly capture CO2 from the air and either sequestering the CO2
or utilizing it to produce low-‐carbon fuels; • Providing dispatchable low-‐carbon electricity.
1 http://www.ccst.us/publications/2011/2011energy.php 2 Assumptions for the natural plant with CO2 capture are derived from parameters adopted in the NEMS model.

8
This report addresses these regulatory uncertainties and provides a concrete basis for ongoing policy discussions by evaluating greenhouse gas emissions from a hypothetical CCUS deployment according to a plain reading of the California cap-‐and-‐trade (“CA-‐C&T”) program and the California Low Carbon Fuel Standard. In particular, emissions are characterized for an integrated energy system in which CO2 is captured from a natural gas power plant, utilized for CO2-‐EOR, and sequestered in the oil-‐containing geologic formation. This integrated energy system, referred to here as “NG-‐CCS-‐EOR”, is illustrated in Figure S-‐1. To be clear, the emission accounting in this report reflects the authors’ understanding of California’s current regulations—including existing regulatory language and relevant precedents. Alternate policy interpretations and accounting methods are possible. No judgments are made regarding the emission accounting methods embodied in California’s current regulations.
Figure S-‐1. Process schematic for the NG-‐CCS-‐EOR system evaluated in this report. CCUS can provide large reductions in aggregate CO2 emissions and in petroleum fuel carbon intensity. Emission accounting conforming with the CA-‐C&T program indicates that NG-‐CCS-‐EOR could reduce aggregate emissions from electricity generation and petroleum fuel use (including oil recovery, refining, and combustion) by roughly 40%. This reduction is computed relative to a baseline consisting of California average emissions from electricity generation and crude production and simplifying assumptions for oil refining fuel combustion emissions. This result appears to be reasonable, as the configuration modeled here effectively cuts power plant emissions by 90% from a baseline portfolio in which roughly half of emissions originate at the power plant.2 The CA-‐LCFS regulates the lifecycle carbon intensity (“CI”) of transportation fuels (measured in grams CO2-‐equivalent emissions per mega-‐joule of fuel, or “gCO2e/MJ”). This is a fundamentally different metric and approach than is used in the CA-‐C&T, reflecting the specific policy objectives underlying the LCFS. Consistent with this lifecycle framework, the CA-‐LCFS includes provisions recognizing emissions reductions that result from adopting “innovative methods” of crude oil production instead of more conventional “comparison baseline” production methods. Emission accounting according to these provisions suggests that NG-‐CCS-‐
2 Assumptions for the natural plant with CO2 capture are derived from parameters adopted in the NEMS model. The ability to realize this performance in real world applications remains uncertain.

9
EOR can reduce petroleum fuel CI values by nearly 67% relative to the default CI for California blendstock for oxygenate blending (petroleum gasoline used in California). Credit allocation represents a key uncertainty in the treatment of CCUS under the CA-‐C&T. The current regulatory language is clear about emissions accounting for individual “covered entities”; however, CCUS requires a complex arrangement between different industries. The NG-‐CCS-‐EOR configuration modeled here includes at least four separate “covered entities”: the natural gas supplier; the power plant; the crude oil producer; and the refinery. The regulation is not clear how CO2 sequestered via enhanced oil recovery should be allocated among these various entities. In theory, policy incentives should reflect physical carbon flows, reward entities responsible for achieving emissions reductions, and support efficient reporting and enforcement. It is not obvious how these goals can best be achieved in CCUS projects. This reflects the distribution of responsibilities, costs, and carbon flows among CCUS project participants (e.g., power plants capture CO2 and oil-‐field operators ensure its long-‐term sequestration). Policy decisions regarding allocation under the CA-‐C&T program may be impacted by regulatory treatment under the CA-‐LCFS. For example, allocating CA-‐C&T benefits to the oil producer or refinery may facilitate consolidated reporting under the two policies. Alternately, allocating C&T benefits to the power plant could enable the policies to provide discrete incentives—and compliance obligations—for CCUS participants responsible for both CO2 capture (e.g., the power plant) and CO2 sequestration (e.g., the oil producer or refinery). Table S-‐1 summarizes policy considerations for several allocation schemes. This allocation issue is generally not relevant to LCFS-‐type regulations, and the allocation decision taken under CA-‐C&T should have no impact on policy treatment under CA-‐LCFS. This is because LCFS-‐type regulations (including the CA-‐LCFS) apply only to transportation fuel suppliers and generally allocate all lifecycle emissions impacts to transportation fuels, regardless of where in the fuel supply chain the impacts occur or whether upstream emissions are recognized by other entities within other regulations (including the CA-‐C&T).
10
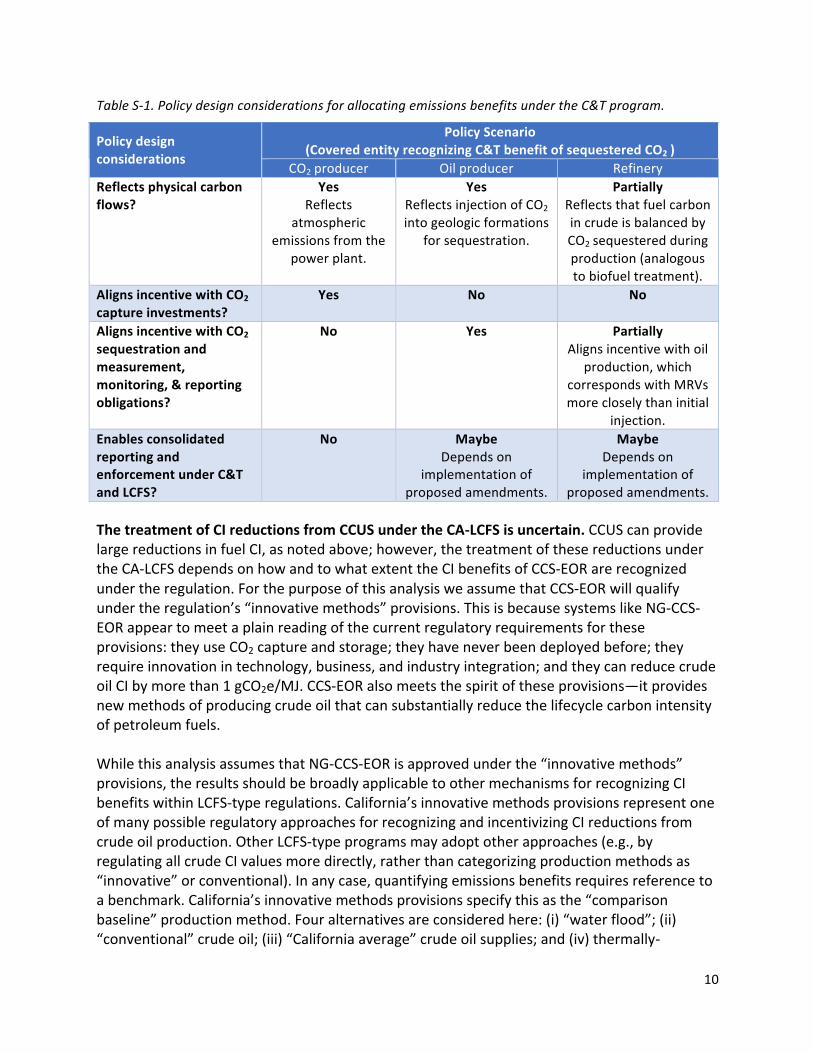
Table S-‐1. Policy design considerations for allocating emissions benefits under the C&T program.
Policy design considerations
Policy Scenario (Covered entity recognizing C&T benefit of sequestered CO2 )
CO2 producer Oil producer Refinery Reflects physical carbon flows?
Yes Reflects
atmospheric emissions from the
power plant.
Yes Reflects injection of CO2 into geologic formations
for sequestration.
Partially Reflects that fuel carbon in crude is balanced by CO2 sequestered during production (analogous to biofuel treatment).
Aligns incentive with CO2 capture investments?
Yes No No
Aligns incentive with CO2 sequestration and measurement, monitoring, & reporting obligations?
No Yes Partially Aligns incentive with oil
production, which corresponds with MRVs more closely than initial
injection. Enables consolidated reporting and enforcement under C&T and LCFS?
No Maybe Depends on
implementation of proposed amendments.
Maybe Depends on
implementation of proposed amendments.
The treatment of CI reductions from CCUS under the CA-‐LCFS is uncertain. CCUS can provide large reductions in fuel CI, as noted above; however, the treatment of these reductions under the CA-‐LCFS depends on how and to what extent the CI benefits of CCS-‐EOR are recognized under the regulation. For the purpose of this analysis we assume that CCS-‐EOR will qualify under the regulation’s “innovative methods” provisions. This is because systems like NG-‐CCS-‐EOR appear to meet a plain reading of the current regulatory requirements for these provisions: they use CO2 capture and storage; they have never been deployed before; they require innovation in technology, business, and industry integration; and they can reduce crude oil CI by more than 1 gCO2e/MJ. CCS-‐EOR also meets the spirit of these provisions—it provides new methods of producing crude oil that can substantially reduce the lifecycle carbon intensity of petroleum fuels. While this analysis assumes that NG-‐CCS-‐EOR is approved under the “innovative methods” provisions, the results should be broadly applicable to other mechanisms for recognizing CI benefits within LCFS-‐type regulations. California’s innovative methods provisions represent one of many possible regulatory approaches for recognizing and incentivizing CI reductions from crude oil production. Other LCFS-‐type programs may adopt other approaches (e.g., by regulating all crude CI values more directly, rather than categorizing production methods as “innovative” or conventional). In any case, quantifying emissions benefits requires reference to a benchmark. California’s innovative methods provisions specify this as the “comparison baseline” production method. Four alternatives are considered here: (i) “water flood”; (ii) “conventional” crude oil; (iii) “California average” crude oil supplies; and (iv) thermally-‐
11
enhanced oil production. These alternatives represent a reasonable set of potential “comparison baseline” methods for the purposes of the CA-‐LCFS, but they also represent a reasonable set of benchmarks for quantifying CI benefits under other LCFS-‐type regulations. C&T and LCFS-‐type regulations can each incentivize CCUS and thereby advance the public interest. The NG-‐CCS-‐EOR configuration analyzed here yields large reductions in both total emissions and in transportation fuel CI, and deployment would consequently involve installing CO2 capture, building CO2 pipeline infrastructure, and exercising MRV protocols. This is consistent with conclusions from prior analyses that identify CCUS as a potentially important step for advancing climate policy objectives. The scales of reductions indicated here appear to be significant, both for advancing proximate policy objectives and for addressing concerns with the feasibility of established regulatory targets. This, in turn, could strengthen the durability of C&T and LCFS-‐type regulations where they exist and support their adoption in new jurisdictions. As a result, CCUS appears to advance the public interest through the joint effects of: (i) delivering near-‐term reductions in aggregate emissions and fuel CI; (ii) building technology, infrastructure, and management systems to advance long-‐term policy objectives; and (iii) supporting established climate policy frameworks. Emission accounting adopted under the existing CA-‐C&T and CA-‐LCFS regulations appears to capture the emissions benefits CCUS. This suggests that both policy frameworks can provide coherent incentives for CCUS development. It also suggests that the financial value of incentives provide by C&T and LCFS-‐type programs may help CCUS projects overcome key financial hurdles to deployment. As a result, these policies could accelerate CCUS deployments. Deployments may be further accelerated as regulatory targets become more stringent, and as similar regulations are adopted in new jurisdictions. Several technical policy questions were identified through this analysis that warrant further consideration. Protocols for validating that CO2 injected during enhanced oil recovery is effectively sequestered—so called measurement, reporting, and verification protocols, or MRVs—are important to resolve. They are, however, the subject of a separate CCST report and are not discussed in detail here. Methane leakage from natural gas supply is also important to resolve. Considerable research is underway to understand the sources and magnitudes of this effect. Established emission accounting protocols appear to be able to address this properly, as the magnitude of the effect is clarified. Recognizing emissions benefits of CCUS under both C&T and LCFS-‐type regulations raises concerns regarding “double-‐counting”; however, this appears to be appropriate in the case of NG-‐CCS-‐EOR and CCUS in general. The potential for “double counting” arises in the current analysis because some emissions sources are included in defining both CA-‐C&T compliance obligations and CA-‐LCFS fuel CI values. As a result, reductions in emissions from these sources will advance compliance under both programs. California’s ARB staff have indicated that this appropriately reflects the “complementary” nature of these regulations. There are also
12
technical reasons why emissions benefits from CCUS should be recognized under both regulatory frameworks. As a policy matter, it may be preferable to avoid creating policies that overlap and raise the potential for “double-‐counting”; however, if emissions from certain sources are counted under multiple policies, then it seems appropriate for reductions in those emissions to also be counted under multiple policies. Several high level policy questions were also identified through this analysis that warrant further consideration. Some have recently argued that CI reductions from CCS-‐EOR should not be recognized or incentivized under LCFS-‐type policies. Emissions reductions in NG-‐CCS-‐EOR and related CCUS configurations may be viewed as occurring primarily in the electric sector, and it may therefore be inappropriate to incentivize such reductions with regulations targeting transportation fuels. There may also be concern that LCFS credits from CCS-‐EOR could overwhelm nascent LCFS credit markets and reduce incentives for other low carbon fuels. It has also been suggested that CO2-‐EOR is not itself innovative, as CO2 floods are routinely used for oil production outside California, and that it may therefore be inappropriate to include CCS-‐EOR under “innovative methods” provisions of the CA-‐LCFS. In noting these concerns it is also important to identify some of the counter arguments, which support recognizing and incentivizing CI benefits of CCS-‐EOR within LCFS-‐type regulations. First, the LCFS policy framework is a technology-‐neutral performance standard that accounts for lifecycle emissions impacts of all processes and inputs to fuel production. CO2 is a necessary input for CO2-‐EOR, and emissions impacts of CO2 supplies vary substantially by source. It therefore seems important for crude CI values to reflect these differences as a strict accounting matter. Second, emissions reductions are not achieved by CO2 capture alone, but by coupling CO2 capture with geologic sequestration. In the case of CCS-‐EOR, oil field operations provide CO2 sequestration. It may be counterintuitive to argue that emissions benefits enabled by CO2 sequestration should be isolated from the activity providing sequestration. Third, defining the level of innovation embodied in integrated energy systems (e.g., NG-‐CCS-‐EOR) according to the availability of individual component technologies (e.g., CO2-‐EOR) substantially underestimates the level of innovation required for deployment and appears to be inconsistent with other proposals under the innovative methods provisions (e.g., biomass-‐fueled steam generation is not innovative, although its integration with enhanced oil recovery may be). More broadly, CCS-‐EOR represents one of the few strategies capable of both substantially reducing petroleum fuel CI and of developing key technologies and infrastructure required to achieve California’s 2050 emissions targets. As proven reserves of high carbon intensity petroleum resources continue to climb (e.g., in the form of oil sands, ultra-‐heavy crudes, etc.), shifting investments toward low carbon intensity production systems becomes increasingly important. LCFS-‐type policies provide incentives to encourage this shift, and CCS-‐EOR provides a technical approach to advance this objective while also accelerating development of CO2 capture technology, pipeline infrastructure, and protocols for ensuring that injected CO2 is effectively sequestered. In this way, recognizing CI reductions achieved via CCS-‐EOR could enable the CA-‐LCFS to accelerate development of the energy systems required to achieve the states climate policy objectives and advance a cleaner energy future.

13
This report aims to provide a concrete basis for ongoing discussion of these important issues and other policy considerations affecting the regulatory treatment of CCS-‐EOR under emerging climate policies.
14
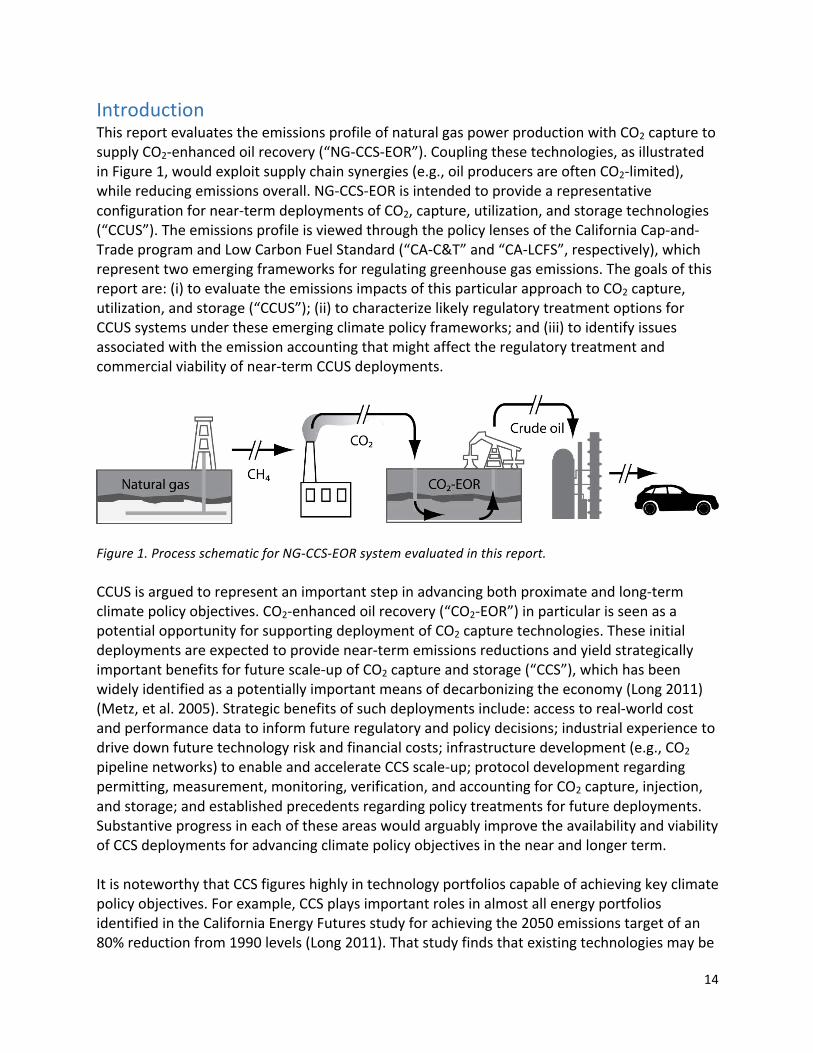
Introduction This report evaluates the emissions profile of natural gas power production with CO2 capture to supply CO2-‐enhanced oil recovery (“NG-‐CCS-‐EOR”). Coupling these technologies, as illustrated in Figure 1, would exploit supply chain synergies (e.g., oil producers are often CO2-‐limited), while reducing emissions overall. NG-‐CCS-‐EOR is intended to provide a representative configuration for near-‐term deployments of CO2, capture, utilization, and storage technologies (“CCUS”). The emissions profile is viewed through the policy lenses of the California Cap-‐and-‐Trade program and Low Carbon Fuel Standard (“CA-‐C&T” and “CA-‐LCFS”, respectively), which represent two emerging frameworks for regulating greenhouse gas emissions. The goals of this report are: (i) to evaluate the emissions impacts of this particular approach to CO2 capture, utilization, and storage (“CCUS”); (ii) to characterize likely regulatory treatment options for CCUS systems under these emerging climate policy frameworks; and (iii) to identify issues associated with the emission accounting that might affect the regulatory treatment and commercial viability of near-‐term CCUS deployments.
Figure 1. Process schematic for NG-‐CCS-‐EOR system evaluated in this report. CCUS is argued to represent an important step in advancing both proximate and long-‐term climate policy objectives. CO2-‐enhanced oil recovery (“CO2-‐EOR”) in particular is seen as a potential opportunity for supporting deployment of CO2 capture technologies. These initial deployments are expected to provide near-‐term emissions reductions and yield strategically important benefits for future scale-‐up of CO2 capture and storage (“CCS”), which has been widely identified as a potentially important means of decarbonizing the economy (Long 2011) (Metz, et al. 2005). Strategic benefits of such deployments include: access to real-‐world cost and performance data to inform future regulatory and policy decisions; industrial experience to drive down future technology risk and financial costs; infrastructure development (e.g., CO2 pipeline networks) to enable and accelerate CCS scale-‐up; protocol development regarding permitting, measurement, monitoring, verification, and accounting for CO2 capture, injection, and storage; and established precedents regarding policy treatments for future deployments. Substantive progress in each of these areas would arguably improve the availability and viability of CCS deployments for advancing climate policy objectives in the near and longer term. It is noteworthy that CCS figures highly in technology portfolios capable of achieving key climate policy objectives. For example, CCS plays important roles in almost all energy portfolios identified in the California Energy Futures study for achieving the 2050 emissions target of an 80% reduction from 1990 levels (Long 2011). That study finds that existing technologies may be
15
able to achieve significant reductions—perhaps up to 60% below 1990 levels; however, irreducible requirements for fuel use and limited availability of low-‐carbon fuel present key challenges to achieving deeper emissions reductions. In this context, CCS may be particularly important for addressing the fuel problem—including fuel for balancing the load of intermittent renewable electricity and running heavy-‐duty transportation—as well as an alternative for providing low-‐carbon electricity (Long 2011). The ability of CCS to make large contributions to key climate policy objectives hinges on our ability to develop real world experience in the near term. An increasingly diverse set of technologies is emerging for capturing CO2 from industrial sources, and even directly from the atmosphere, but practical experience with these technologies at industrial scale is either limited or completely lacking. As a result, large uncertainties remain regarding expected technical and economic performance of these technologies. On the other hand, CO2-‐EOR is not new, it is commonly used in certain areas and geological formations; however, experience with its application to industrial-‐scale CO2 sequestration is very limited. Moreover, coupling CO2 capture from industrial sources with sequestration via CO2-‐EOR will require integrating technical and business processes across industries and bridging complex institutional barriers. Robust methods for achieving such integration will be required if CCS is to make meaningful contributions to advancing key climate policy objectives, and the development of such methods demands real world experience at industrial scale. In this context, CCUS has the potential to make strategically important contributions to advancing CCS in the near term. Companies have expressed interest in near term CCS deployments if the economics can be enhanced by delivering captured CO2 for use in EOR. One effect of integrating CO2-‐EOR is from the contribution of CO2 sales revenues to the project; another effect is to secure a market value that can provide a hedge against regulatory uncertainty and price uncertainty associated with CO2 credit markets. As climate constraints harden and experience with climate policies grow, these benefits from CO2-‐EOR may become less important; however, feedback from the private sector suggests that the advantages of integrating CO2-‐EOR can be significant for developing industrial-‐scale projects in the near-‐term. Successful near-‐term CCUS projects could arguably open the door for several potentially important low-‐carbon energy systems for California, such as:
• Burning biomass to make electricity and sequestering the CO2 to yield net negative emissions;
• Reforming methane to make hydrogen fuel and sequestering the resulting CO2 ; • Applying methods to directly capture CO2 from the air and either sequestering the CO2
or utilizing it to produce low-‐carbon fuels; • Providing dispatchable low-‐carbon electricity.
On the other hand, the prospect of using CO2-‐EOR for CCS (“CCS-‐EOR”) has raised concerns of a potentially perverse outcome: that CCS-‐EOR may be developed to advance climate policy objectives, only to prolong the use of petroleum fuels. Such concerns are legitimate and can be

16
intuitively appealing, but appear to discount several relevant factors. First, proven oil reserves continue to grow globally, with much of that growth provided by high carbon-‐intensity unconventional resources (e.g., oil sands and extra heavy crudes). The increasing availability of hydrocarbons, combined with the significant variability among hydrocarbon resources gives society an ability to “choose” (e.g., through public policy instruments) which types of resources to develop now and which to leave in place—perhaps for future development using cleaner production methods. Moreover, many have argued that climate constraints will prevent development of many fossil fuel reserves. This argument implies that increasing fossil fuel reserves will not prolong their use, as climate policies will cause substantial amounts of fossil fuels to remain undeveloped. It also begs the question, “which fossil fuels should be developed and which should be left in place?” In this context, CCS-‐EOR presents a unique opportunity to significantly reduce the emissions profile of petroleum and fossil energy supplies while also accelerating development of key technologies and infrastructure required to achieve long-‐term climate policy objectives. Meanwhile, C&T programs and LCFS policies are emerging as important frameworks for regulating greenhouse gas emissions. C&T is being implemented domestically within California and by a consortium of states in the Northeast (i.e., the Regional Greenhouse Gas Initiative), while the LCFS is being implemented in California and Oregon, and is being actively considered in several other states. Both of these frameworks have been proposed at the national level (e.g., in drafts of the 2009 Waxman Markey bill) and are being pursued internationally as well. Examples include the European Union’s Emissions Trading Scheme and Fuel Quality Directive as well as British Columbia’s Renewable and Low Carbon Fuel Requirements Regulation. The C&T and LCFS are intended to provide complementary policy frameworks that play distinct roles within a portfolio of climate policies. C&T is generally designed to provide an economy-‐wide carbon price and limit the absolute quantity of emissions. The carbon price provides an economic signal to motivate economically efficient emissions abatement throughout the economy, while the emissions cap ensures progress against the core objective of reducing absolute emissions (as opposed to a carbon tax which creates a defined price signal, but not a defined limit in total emissions). In contrast to C&T, the LCFS has a more limited scope and is strategically designed to provide strong incentives for reducing emissions associated with transportation fuels. The need for such incentives stems from the general insensitivity of transportation fuel emissions to economy-‐wide emissions prices and from certain market characteristics that create particular challenges for the adoption of low carbon transportation fuels. Emissions—and emissions reductions—from sources associated with transportation fuels and within the jurisdiction of a C&T program may be regulated under both C&T and LCFS regulations. This is not viewed as double counting, but rather as reflecting the complementary nature of parallel climate policies within a broader policy portfolio. Despite the considerable progress made in implementing these regulatory frameworks, their treatment of CCUS systems has not been well resolved. The emissions profile—and therefore associated emissions reductions—of CCUS systems would presumably be regulated under these policies, thereby providing financial incentives for CCUS deployments; however, the magnitude
17
of emissions benefits, the mechanisms by which the benefits would be recognized, and the means by which these benefits would be realized by regulated parties has not been well defined. Clarifying these issues should benefit industry, regulatory agencies, and the broader community of regulatory stakeholders. The analysis presented here is intended to provide an informed perspective on these issues to help focus and support ongoing policy discussions. It should shed light on the potential roles and benefits of CCUS for advancing climate policy objectives. It should also improve analysis of the costs and benefits of adopting these policy frameworks in new jurisdictions, including at a national level. In order to clarify the likely regulatory treatment of CCUS under these emerging frameworks, this report quantifies the emissions profile of a hypothetical CCUS deployment in California: a natural gas power plant with CO2 capture supplying CO2-‐EOR operations (“NG-‐CCS-‐EOR”), as illustrated in Figure 1. Emissions accounting follows a careful reading of the California C&T and LCFS regulations to estimate compliance obligations for sources parties regulated under each policy framework. Technology assumptions for the natural gas power plant with CO2 capture are based on those adopted in the NEMS model (EIA 2013); assumptions regarding CO2-‐EOR operations are derived from a review of published literature (Jarmallo, Griffin and McCoy 2009) (Khoo and Tan 2006) (Bowden, Pershke and Chalaturnyk 2013) (Wilson and Monea 2004); the balance of technology assumptions and emissions inventory data are derived from CA-‐GREET and OPGEE, which have been adopted to implement the CA-‐C&T and CA-‐LCFS (CARB 2013). NG-‐CCS-‐EOR is evaluated here as a representative configuration for CCUS in order to provide a concrete technical basis for analysis. It has been proposed as—and appears to be a plausible option for—near-‐term CCUS deployments, both in California and in a variety of other potentially relevant jurisdictions. Natural gas power with CO2 capture has been the subject of considerable analysis, and its expected technical performance is well characterized in the public literature (including, for example, in technology assumptions for the NEMS model). The primary emissions sources associated with this configuration appear to fall within the scope of both cap-‐and-‐trade and LCFS-‐type regulations. For these reasons, NG-‐CCS-‐EOR provides a useful technical basis for analysis; no other judgments are made here regarding the technical or economic merits of this system configuration. The hypothetical California deployment is selected for evaluation because it provides a concrete regulatory basis for analysis, as all major emissions sources within the system boundary are effectively regulated within both policy frameworks (i.e., the California C&T and LCFS programs). Accordingly, the analysis reflects California’s particular implementation of these frameworks, which is not identical to implementations in other jurisdictions. Analytic considerations and implications that appear to be specific to California’s implementation, and that may not be generally applicable, are noted where possible. This report is organized into four sections: background; model description; results; and policy discussion. The Background section describes the C&T and LCFS policy frameworks and the policy relevance of CCUS. The Model Description section provides a conceptual description of the modeling approach adopted in this analysis, as well as specifying key model parameters.

18
The Results section discusses the modeling results, including the implications of alternate interpretations of California’s policy implementation. The Policy Discussion section provides a discussion of key policy issues related to policy implementation options and policy treatment of CCUS systems. It is worth noting that emission accounting under C&T and LCFS-‐type regulations, as developed in this report, represents one of many factors affecting potential deployments of CCUS, including NG-‐CCS-‐EOR. Economic implications of climate policy incentives for CCUS deployments will depend on (among other things) the quantity of emissions (and emissions credits) recognized under associated regulations, the market value of such emissions (and emissions credits) within the regulations, and the relative cost of deployment (including capital and operating costs as well as longer term liabilities associated with CO2 sequestration). Further, CCUS deployments will be affected by a host of factors that are independent of the climate policies, including technology availability, siting and permitting constraints, product marketing constraints, and broader economic dynamics, for example. This report focuses exclusively on emission accounting under C&T and LCFS-‐type regulations (the first of the various factors noted above). It does not consider—and therefore cannot support conclusions regarding—the economic viability of NG-‐CCS-‐EOR deployments under these regulatory frameworks. Moreover, the emission accounting developed in this report is not intended to provide definitive emissions and emissions intensity values for actual NG-‐CCS-‐EOR deployments. Such values will necessarily vary across actual system configurations and site-‐specific parameters. Instead, the emission accounting provided in this report provides a concrete example of how emissions accounting methodologies adopted under these emerging regulatory frameworks may be applied to CCUS systems. This example is intended to support ongoing policy discussions regarding the appropriate regulatory treatment of CCUS systems, the implications of CCUS and emerging climate policy frameworks for advancing broader climate policy objectives, and the implications for increasing adoption of these policy frameworks.
19
Background The C&T and LCFS policies represent two distinctly different approaches to market-‐based regulation of greenhouse gas (“GHG”) emissions. This section provides a high-‐level overview of these two policy frameworks with an emphasis on characteristics that are of particular relevance to CCUS deployments, including the hypothetical NG-‐CCS-‐EOR system evaluated in this report. The California C&T and LCFS were established as part of a portfolio of climate-‐motivated policies created by California’s Global Warming Solutions Act of 2006, commonly referred to as AB-‐32 (CARB 2008). In this context, the C&T program is often viewed as a “backstop” climate policy. Beyond creating an economy-‐wide carbon price (for covered emissions sources), it places a firm limit on total annual emissions from major sources. In this way, it provides a clear mechanism for regulating absolute emissions and tracking progress against quantitative targets for annual emissions reductions (e.g., 50% reduction from 1990 levels). In contrast, the LCFS is a strategically targeted policy designed to overcome specific challenges for mitigating GHG emissions in the transportation sector. These include the relative (in)sensitivity of transportation emissions to economy-‐wide carbon pricing, externalities related to fueling infrastructure and the vehicle fleet, the expected trajectory of mitigation costs in the transport sector over time, and various market conditions in the fuels sector that create particular challenges for supplying new, low carbon fuels. Detailed discussion of these issues is available in the literature (Yeh and Sperling 2009) (Yeh and Sperling 2010). The LCFS is one of several types of policies targeting transportation sector emissions, which is often described as comprising a three-‐legged stool comprising: demand for vehicle miles; vehicle fuel efficiency; and fuel carbon intensity (Yeh and Sperling, Low Carbon Fuel Standards 2009). Demand for vehicle miles and fuel efficiencies are addressed by a variety of other policy instruments (e.g., initiatives to increase mass transit and carpooling and vehicle fuel efficiency standards). The LCFS strategically targets the third leg—fuel carbon intensity—which is subject to particular challenges noted above and in the literature. Overview of C&T policy framework3 The C&T framework regulates total annual GHGs emitted by limiting the aggregate quantity of emissions from “covered” activities. Aggregate emissions from all covered activities are limited to a specified annual quantity—or emissions cap—that is incrementally reduced over time. In the CA-‐C&T, covered activities represent most major stationary sources of GHGs including, among other things, operation of power plants, natural gas systems, and refineries. Operators of these facilities, referred to as “covered entities”, are required to measure and report annual emissions, which are used to define annual “compliance obligations” under the C&T program. They are further required to submit a “compliance instrument”, which takes the form of
3 This overview—including all defined terms and section references—is based on a reading and interpretation of Subchapter 10. Climate Change, Article 5. of Title 17 in the California Code of regulations available at: http://www.arb.ca.gov/cc/capandtrade/ctlinkqc.pdf .

20
“emissions allowances” or “emissions offsets”, for each unit of GHG emissions included in the compliance obligation. In this way, the C&T program limits total emissions from covered activities to a level equivalent to the total number of emissions allowances and offsets available under the program, thereby providing a firm cap on aggregate emissions. Emissions allowances are issued annually by the regulator such that the aggregate quantity of allowances equals the annual emissions cap. This is the primary mechanism ensuring that emissions from covered sources do not exceed the established cap. Emissions allowances may be distributed by issuing them directly to covered entities or by auction. In contrast, regulators generally issue emissions offsets to recognize emissions reductions from sources that might not otherwise be recognized under the cap. Offsets imply that a reduction in emissions from certain non-‐covered sources is in some way equivalent to, and may be substituted for, reductions directly from covered sources. In principle, offsets can increase the economic efficiency of emissions reductions, by expanding the set of emissions sources where reductions can be achieved. In theory, the use of offsets should not affect the cap, because greenhouse gas emissions are generally viewed as fungible across sources (due to their global transport in the atmosphere). However, the use of offsets raises complex questions about the types of sources and reductions that should be treated as equivalent to reductions from covered sources. As a result, defining the rules by which offsets are issued can be both controversial and time consuming. Once emissions allowances and offsets have been issued, they can be traded among firms. As a result, firms that are able to reduce their emissions at relatively low cost are able to generate and sell excess allowances (or offsets) to firms that cannot reduce emissions as cost-‐effectively. In this way, the trading price for allowances and offsets provides an even carbon price for covered entities and covered sources, thereby supporting economically efficient emissions abatement. It’s worth noting that while C&T provides an even carbon price across emissions sources, the price is not specified in the regulation. Instead, C&T fixes the quantity of allowable emissions and allows the carbon price to vary as firms compete to operate under the cap. This contrasts with a carbon tax policy, which sets a defined carbon price and allows the emissions to vary in response to that price. California’s C&T program has several features that are particularly noteworthy in the context of this report and CCUS more generally. The first is that natural gas suppliers to California consumers have a compliance obligation for emissions that will result from complete combustion of the natural gas delivered, except where the fuel is delivered to a party that is already specified as a “covered entity” (§ 95852(c)). For example, natural gas utilities have compliance obligations for combustion emissions resulting from gas supplied to industrial and residential customers, but not from gas supplied to a power plant, which is separately specified as a covered entity. This treatment of carbon contained in fuels will also be applied to refineries

21
supplying CARBOB4 and diesel fuel to the California market beginning in 2015, which will effectively bring transportation sector emissions into the CA-‐C&T program. When that occurs, refineries will have compliance obligations for both facility emissions and the emissions embodied in their fuels under both the C&T and LCFS programs. The implications of this are discussed further below. Similarly, suppliers of CO2 for use in an industrial process have a compliance obligation for the CO2 they deliver; however, there is no compliance obligation for CO2 delivered to an approved geologic sequestration facility. For example, a power plant with CO2 capture retains a compliance obligation for all CO2 delivered for use in the food & beverage industry, but not for CO2 delivered for injection at an approved geologic sequestration site. The effect of this regulatory approach may be appropriate in the case of CO2 deliveries to the food and beverage industry (because such CO2 will ultimately be emitted to the atmosphere); however, it creates some ambiguity for the treatment of CCUS, which appears to hinge on whether CO2-‐EOR operations are classified as industrial processes or as geologic sequestration facilities. This apparent ambiguity in the regulatory language may be viewed as a definitional issue that can be resolved in a straightforward manner; it may also be viewed a source of flexibility that could be helpful for aligning incentives among CCUS project participants and for streamlining implementation and enforcement by regulators. Overview of LCFS policy framework5 The LCFS policy framework is designed to regulate the average greenhouse gas emissions intensity (“carbon intensity” or “CI”) of transportation fuels. In this context, emissions intensity is a measure of the quantity of greenhouse gases emitted per unit of transportation fuel energy. The LCFS regulates average carbon intensity by defining a regulatory standard CI value and requiring that each fuel supplier (referred to as a “regulated party”) track and report both the quantity and the CI of fuels they supply. LCFS “credits” are generated by supplying fuels with CI values lower than the standard value, while LCFS “deficits” are generated by fuels with CI values higher than the standard value. Suppliers are then required to submit one LCFS credit for each LCFS deficit generated within a compliance period. So long as the number of credits (generated by low carbon fuels) balances the number of deficits (generated by high carbon fuels), the average CI of fuels will not exceed the specified regulatory standard CI. Like emissions allowances in the C&T program, LCFS credits may be traded among firms. As a result, regulated parties are neither prevented from supplying high carbon fuels nor required to supply low carbon fuels, as long as they acquire appropriate quantities of LCFS credits from other regulated parties that do supply low carbon fuels.
4 California Reformulated Gasoline for Oxygenate Blending (“CARBOB”) represents the dominant component of gasoline, but is not considered to be a “finished fuel” suitable for use until it has been blended with one or more oxygenates. 5 This overview—including all defined terms and section references—is based on a reading and interpretation of Subchapter 10. Climate Change, Article 4. Regulations to Achieve Greenhouse Gas Emission Reductions, Subarticle 7. Low Carbon Fuel Standard, of Title 17 in the California Code of regulations available at: http://www.arb.ca.gov/fuels/lcfs/CleanFinalRegOrder112612.pdf
22
Under the LCFS, fuel carbon intensity measures aggregate emissions from all stages of fuel production and use—referred to as the full fuel “lifecycle”—via lifecycle assessment (“LCA”). This lifecycle approach is important for transportation fuels, which vary significantly with respect to the geographical distribution of GHG emissions across the fuel lifecycle. For example, vehicle exhaust is the dominant emissions source for petroleum fuels; power plant emissions are the dominant source for electric vehicles; and agricultural sector emissions are dominant sources for biofuels. As a result, regulating emissions at a single point in the fuel lifecycle (e.g., at the tailpipe) could yield incoherent incentives for CI reductions and motivate inefficient investments in emissions abatement. LCA accounts for emissions impacts from all inputs and all processes in the production and use of fuels and feedstock. It also accounts for the emissions impacts of all co-‐products of fuel production. For example, LCA of corn ethanol accounts for the production of distillers grains with solubles (“DGS”) as a co-‐product, which is used as an animal feed (CARB 2009). Using DGS as an animal feed reduces the need to produce other animal feeds, and thereby reduces the emissions associated with producing other animal feeds. LCFS policies typically account for the emissions impacts of such co-‐products by including a “co-‐product credit” within fuel LCAs. Similarly, the LCA adopted by the California Air Resources Board (“CARB”) in implementing the CA-‐LCFS to define the CI of crude oil produced in California and used as a feedstock for petroleum fuels includes an emissions credit for electricity generated as a co-‐product of crude oil (CARB 2009). That LCA indicates that roughly 40% of California crude oil is produced using so-‐called “thermally-‐enhanced oil recovery” (“TEOR”). This production method typically involves burning natural gas to generate steam for injection into oil-‐containing geologic formations. This injected steam heats the oil in place, thereby reducing its viscosity, and increases the volume produced. CARB’s LCA indicates that electricity is often generated along with steam for TEOR by using so-‐called “combined heat and power” systems (“CHP”). It further indicates that nearly 40% of California’s TEOR operations export some of this electricity to the power grid as a co-‐product of crude oil production. The LCA assigns a co-‐product credit for this exported electricity based on the emissions that would be generated by power plants absent the availability of electricity from TEOR operations. The notion of co-‐product credits is important for determining the appropriate policy treatment of CCUS under the LCFS. The example of electricity co-‐products from TEOR is particularly helpful in this regard, as it provides a very close analogue and strong precedent for CCUS systems incorporating CO2-‐EOR. The LCA referenced here for crude oil production and TEOR is particular to the CA-‐LCFS, but the underlying principles should be generally applicable to most LCFS-‐type policies. In this context, it is important to recognize that the CA-‐LCFS has established some unique provisions regarding the treatment of crude oil production that are relevant to the current analysis. Relevant aspects are referred to here as the “CA-‐average provisions” and the “innovative methods provisions”. The CA-‐average provisions state that the CI value for all

23
petroleum fuels will reflect the average CI of crude oils supplied to California refineries, while the innovative methods provisions state that LCFS credits will be issued to refineries that demonstrate the use of crudes produced via “innovative methods of crude oil production” (CARB 2011). Treating all petroleum fuels as though they were produced using crude with a CI equal to the average of all crudes used in California average is intended to limit incentives for so-‐called “crude shuffling”. Crude shuffling could arguably occur if the financial consequences of the CA-‐LCFS were sufficiently large to motivate a re-‐distribution of global crude oil supplies, such that California refineries receive lower carbon intensity crudes while higher carbon intensity crudes are diverted to other markets. Such a distortion to crude markets could create an appearance that California refineries have reduced the CI of their crude supplies (and the CI of resulting fuels) without achieving any meaningful emissions reductions (and potentially increasing emissions from crude oil transport). The ability to generate LCFS credits with crude oils produced using “innovative methods” is designed to retain incentives for reducing the carbon intensity of crude oil production, while crude oils are otherwise treated as having an “average” CI value. The term “innovative method” is defined the CA-‐LCFS regulation:
“For the purpose of this section, an innovative method means crude production using carbon capture and sequestration or solar steam generation that was implemented by the crude producer during or after the year 2010 and results in a reduction in carbon intensity for crude oil recovery (well to refinery entrance gate) of 1.00 gCO2e/MJ or greater.” [Final Regulation Order. Section 95486(b)(2)(A)4]
The Regulation Order goes on to specify that the number of LCFS credits generated will be proportional to the emissions reduction achieved by the “innovative method” relative to a “comparison baseline method”. The comparison baseline method is specified as a process similar to the innovative method, but absent the innovation. Discussion with CARB staff has indicated the intent that the comparison baseline method reflect the production process that is currently being used in the absence of the innovative method. The appropriate “comparison baseline method” for NG-‐CCS-‐EOR is not intuitively obvious and warrants careful consideration. This issue is discussed further below. While the innovative methods provisions are unique to California’s implementation of the LCFS framework, the analysis presented here should be more generally applicable. This is because the analysis focuses on net CI reductions achievable with NG-‐CCS-‐EOR. Other LCFS implementations may not issue credits in the manner specified by the innovative methods provisions; however, the net reduction in fuel CI should arguably be similar and treated similarly across all LCFS-‐type policy instruments.

24
It is worth noting that NG-‐CCS-‐EOR (and CCS-‐EOR more generally) appears to meet a plain reading of this definition adopted for “innovative methods” because it: (i) uses carbon capture and storage; (ii) was not implemented before 2010; and (iii) can provide substantial carbon intensity reductions (as indicated in the results section of this report). CARB has also issued a contract to Stanford University researchers to update the OPGEE model, which CARB uses to define CI of crude oil production under the LCFS, in order to evaluate CO2-‐EOR as an innovative method. Even so, the treatment of CI reductions achieved by CCS-‐EOR deployments remains uncertain. This is reflected a series of recent references to CCS-‐EOR by CARB staff:
• March 2014—LCFS Readoption Concept Paper released by CARB states that CARB staff will propose to “include carbon capture coupled with carbon dioxide enhanced oil recovery as an innovative technique under certain circumstances” (CARB 2014);
• April 2014—Workshop presentation by CARB staff states that: o “CO2 EOR has potential to be an important means of sequestration and [CARB]
staff will continue to evaluate this technology”; and that o “Credit generation for CCS projects will only be allowed after [CARB] has in place
an approved quantification methodology for monitoring, reporting, verification, and permanence requirements”, which staff indicated is expected by 2017 (CARB 2014);
• July 2014 presentation by CARB staff states with respect to innovative methods, that “Carbon capture for CCS projects must occur onsite at the crude oil production facility” (CARB 2014).
The July presentation by CARB staff goes on to discuss cases where CO2 is captured from fuels production facilities (e.g., from CHP units used for TEOR and from an ethanol plant). In such cases, CI reductions could (theoretically) be allocated to fuels produced at the facility with CO2 capture or to fuels produced via CO2-‐EOR. The pending proposal is to allocate CI reductions to fuels produced at the facility with CO2 capture. The presentation does not discuss cases where CO2 is captured from other types of industrial facilities (e.g., those that do not produce transportation fuels, such as the NG-‐CCS-‐EOR system discussed in the current analysis); however, CARB staff have clarified that the currently pending proposal would not include such configurations within the innovative methods provisions. The proposals made by CARB staff to date appear to reflect a measured, pragmatic, and incremental approach to accounting for CI benefits of CCS-‐EOR within the CA-‐LCFS. They, however, do not yet ensure full accounting of the CI benefits from integrating CO2 capture with CO2-‐EOR to produce transportation fuels and sequester CO2 captured from industrial sources. Key distinctions between the LCFS and C&T frameworks The C&T and LCFS represent complementary climate policy frameworks; however, they are structured differently to strategically advance distinct climate policy objectives. As a result, a variety of distinctions exist between the policies, which are worth noting. These include:
25
• The LCFS regulates the carbon intensity of transportation fuels, whereas the C&T regulates aggregate annual emissions from major sources across the economy;
• As a result, total emissions can increase under the LCFS (as fuel consumption increases), whereas C&T provides a firm cap on annual emissions.
• The LCFS measures emissions intensity on a lifecycle basis, regardless of where emissions occur, while the C&T program only measures direct emissions from covered sources;
• LCFS credits and deficits are generated based on the difference in the CI of a fuel and the regulatory standard CI, which changes each year, while the C&T program defines allowances and compliance obligations according to directly measurable emissions.
• The LCFS does not provide for emissions “offsets” similar to those in the C&T program—the only way to generate LCFS credits is to supply low carbon fuels;
For these reasons, LCFS credits and C&T allowances represent fundamentally different things, even though they may be denominated in identical units (e.g., metric tons CO2 ). This reflects the fact that LCFS and C&T represent fundamentally different types of regulations. Note that these distinctions reflect policy design decisions taken to advance strategically important climate policy objectives within a broader climate policy portfolio. Notwithstanding the complementary nature of these policy instruments, their differences have important consequences for policy implementation and for understanding the regulatory treatment of CCUS, including NG-‐CCS-‐EOR, as discussed in this report. Policy relevance of CCUS for C&T and LCFS CCUS is relevant to C&T and LCFS policies for several important reasons. At the most basic level, emissions associated with CCUS (e.g., NG-‐CCS-‐EOR) will likely be regulated under both frameworks. Perhaps more importantly, however, CCUS deployments have the potential to substantially advance key objectives of both policy frameworks. Moreover, policy incentives provided by both C&T and LCFS programs may improve the financial performance of CCUS projects and help motivate or accelerate scale-‐up of CCUS and associated technologies. NG-‐CCS-‐EOR provides a straightforward example for understanding these dynamics. The logic for regulating NG-‐CCS-‐EOR deployments in California under both the CA-‐C&T and CA-‐LCFS policies is fairly straightforward: the C&T program, as implemented in California, independently regulates each emissions source within an integrated NG-‐CCS-‐EOR system; and NG-‐CCS-‐EOR has the potential to reduce the carbon intensity of crude oil production and meets a plain reading of the definition adopted for “innovative methods of crude production” under the CA-‐LCFS. The CA-‐C&T program currently includes all major point sources of GHG emissions under the cap. This specifically includes CO2 suppliers, operators of petroleum and natural gas systems, electricity generating facilities, and oil refineries (CA Code of Regulations. Title 17. § 95811). In addition, the carbon content of natural gas and petroleum fuels supplied in California will be
26
included under the cap beginning in 2015 [§ 95851]. This encompasses each of the core components of a NG-‐CCS-‐EOR production system. Meanwhile, the LCFS regulates the CI of transportation fuels, which includes the emissions profile of all inputs to and co-‐products from crude oil production. NG-‐CCS-‐EOR arguably represents a new innovative method of crude oil production with the potential to drive down the CI value of resulting transportation fuels. As detailed below, the CI reduction is generally associated with co-‐products from supplying CO2 inputs to crude oil production and with sequestration of injected CO2 within oil producing geologic formations. As noted above, the LCA for crude oil produced in California via TEOR includes accounting for emissions impacts associated with electricity co-‐products of steam injected for EOR (CARB 2009). In order to be consistent with this established precedent, the LCA of crude oil produced via NG-‐CCS-‐EOR should arguably account for electricity co-‐products of CO2 injected for EOR. This analogue is discussed further below. NG-‐CCS-‐EOR also illustrates how CCUS can contribute to the broader policy objectives of both the C&T and LCFS. From the perspective of the C&T, NG-‐CCS-‐EOR has the potential to both reduce near-‐term GHG emissions from the energy sector and lay a foundation for future emissions reductions. CCS (including configurations fueled with natural gas) represents a potentially important strategy for decarbonizing the electric sector and broader economy in both the near and longer term. Assuming that CO2 leakage rates from EOR reservoirs is low (e.g., similar to dedicated CO2 sequestration sites), proximate NG-‐CCS-‐EOR deployments represent a near term opportunity for industrial-‐scale deployments of CCS technologies and near term emissions reductions. Such proximate deployments offer the potential for hands-‐on experience with CCS systems at industrial scale, with important implications for achieving longer-‐term climate policy objectives. While CO2-‐EOR is relatively well understood, experience gained from NG-‐CCS-‐EOR could reduce key uncertainties regarding technical and economic performance of the component technologies for CCS. It would provide a concrete basis for developing protocols related to permitting, emission accounting, and measurement, monitoring, and verification of sequestered CO2. It also offers the potential for industrial learning to drive down future costs of CCS and for compiling real-‐world performance data to inform future regulatory and policy decisions regarding CCS. Further, industrial scale development of NG-‐CCS-‐EOR, and CCUS more generally, will inherently involve building out substantial infrastructure for industrial CO2 management (e.g., CO2 pipeline networks). This may be expected to both enable and accelerate future scale-‐up of CCS. For example, extensive CO2 pipelines have been developed in Texas, along the gulf coast, and within the Rocky Mountain region to meet demand for CO2-‐EOR operations there. This infrastructure originally developed to connect geologic formations with “natural CO2 ” to oil containing formations amenable to CO2-‐EOR. This has provided ready infrastructure for more recent CO2 capture projects, thereby lowering deployment costs and accelerating technology demonstration. By analogy, CCUS deployments can support build-‐out of CO2 pipeline networks,

27
to which additional CO2 capture facilities and dedicated sequestration sites might be connected in the future. In this way, CCUS (including NG-‐CCS-‐EOR) provides an opportunity for California and other jurisdictions to build-‐out the infrastructure necessary for future scale-‐up of CCS and broader de-‐carbonization. From the perspective of the LCFS, CCUS deployments that include CO2-‐EOR represent one of the relatively few strategies available for substantially reducing the CI of petroleum fuels. The LCFS is strategically structured as a technology-‐neutral performance standard that is designed to both shift the fuel mix toward lower carbon fuels (e.g., electricity and advanced biofuels) and drive down the CI of established fuels (e.g., petroleum fuels and conventional biofuels) (Yeh, Sperling and Griffin, et al. 2012). That said, with 80% of the emissions burden from conventionally produced petroleum fuels originating from vehicle combustion, it is difficult to deliver large reductions in the lifecycle CI of petroleum fuels. Even if 100% of emissions from crude oil supply, refining, and fuel transport could be captured, traditional CCS could only reduce lifecycle emissions by ~20%. Reducing emissions from crude oil supply is important because petroleum fuels comprise ~90% of the transportation fuel mix and because the carbon intensity of crude oil production is increasing with increasing development of unconventional resources (e.g., oil sands); however, these constraints represent strong constraints on the contributions of such emissions reductions to long term climate policy objectives. In contrast, the analysis of NG-‐CCS-‐EOR in this report suggests that CCUS has the ability to increase the potential scale of CI reductions by generating co-‐products that substantially reduce emissions associated with displaced products. The emission accounting developed in this report relies on co-‐product impacts that may become less relevant as the broader economy is decarbonized; however, prospective deployments that utilize CO2 captured directly from the atmosphere or captured from biomass may deliver CI reductions indefinitely into the future. In this context, CCUS strategies like NG-‐CCS-‐EOR may represent both one of the few options available for petroleum producers to make substantial contributions toward the LCFS and an initial step toward a longer-‐term trajectory of low carbon petroleum production. Perhaps more fundamentally, CCUS provides opportunities to develop petroleum resources with lower carbon footprints. In a world flush with recoverable hydrocarbons, society is increasingly in a position to “choose” which resources are developed now and which are reserved for potential future development. In this context, CCUS provides an opportunity to develop relatively low carbon resources now and defer development of higher carbon resources into the future. Such a prioritization of resource development would not simply delay the inevitable exploitation of high carbon resources (although this would be beneficial, given the persistent nature of CO2 in the atmosphere). It would also allow time for new production methods to emerge that might mitigate emissions associated with resources currently viewed as “high carbon”, and it would allow time for alternative low carbon fuels to be developed. For all of these reasons, CCUS appears to be relevant to C&T and LCFS policies; the reverse is also true—C&T and LCFS policies are relevant to CCUS projects because resulting incentives

28
may help motivate and accelerate commercial deployments. CCUS projects may reduce C&T compliance obligations for covered entities and may create new opportunities for regulated parties to comply with the LCFS. The economic impacts associated with these policy benefits may improve the expected financial performance of CCUS projects and enable them to overcome key financial challenges to deployment. As a result, these policy benefits could pave the way for large capital investments in new energy assets. This is, after all, a key objective for both the C&T and LCFS policies.
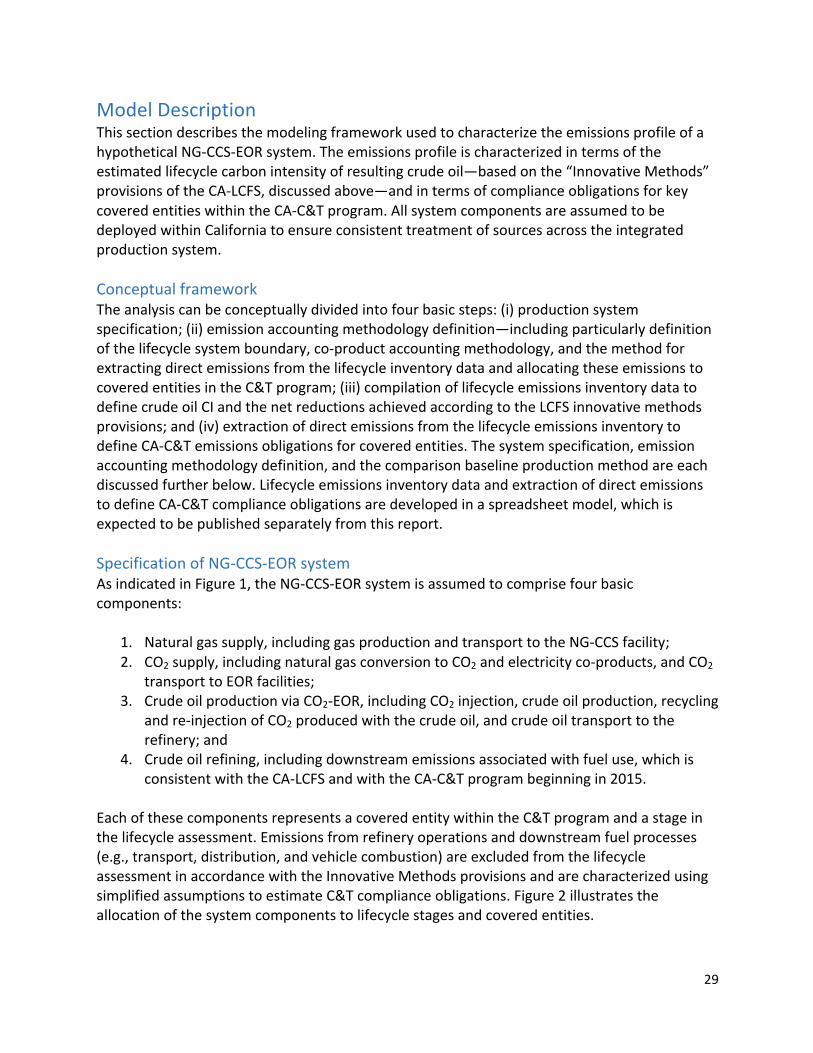
29
Model Description This section describes the modeling framework used to characterize the emissions profile of a hypothetical NG-‐CCS-‐EOR system. The emissions profile is characterized in terms of the estimated lifecycle carbon intensity of resulting crude oil—based on the “Innovative Methods” provisions of the CA-‐LCFS, discussed above—and in terms of compliance obligations for key covered entities within the CA-‐C&T program. All system components are assumed to be deployed within California to ensure consistent treatment of sources across the integrated production system. Conceptual framework The analysis can be conceptually divided into four basic steps: (i) production system specification; (ii) emission accounting methodology definition—including particularly definition of the lifecycle system boundary, co-‐product accounting methodology, and the method for extracting direct emissions from the lifecycle inventory data and allocating these emissions to covered entities in the C&T program; (iii) compilation of lifecycle emissions inventory data to define crude oil CI and the net reductions achieved according to the LCFS innovative methods provisions; and (iv) extraction of direct emissions from the lifecycle emissions inventory to define CA-‐C&T emissions obligations for covered entities. The system specification, emission accounting methodology definition, and the comparison baseline production method are each discussed further below. Lifecycle emissions inventory data and extraction of direct emissions to define CA-‐C&T compliance obligations are developed in a spreadsheet model, which is expected to be published separately from this report. Specification of NG-‐CCS-‐EOR system As indicated in Figure 1, the NG-‐CCS-‐EOR system is assumed to comprise four basic components:
1. Natural gas supply, including gas production and transport to the NG-‐CCS facility; 2. CO2 supply, including natural gas conversion to CO2 and electricity co-‐products, and CO2
transport to EOR facilities; 3. Crude oil production via CO2-‐EOR, including CO2 injection, crude oil production, recycling
and re-‐injection of CO2 produced with the crude oil, and crude oil transport to the refinery; and
4. Crude oil refining, including downstream emissions associated with fuel use, which is consistent with the CA-‐LCFS and with the CA-‐C&T program beginning in 2015.
Each of these components represents a covered entity within the C&T program and a stage in the lifecycle assessment. Emissions from refinery operations and downstream fuel processes (e.g., transport, distribution, and vehicle combustion) are excluded from the lifecycle assessment in accordance with the Innovative Methods provisions and are characterized using simplified assumptions to estimate C&T compliance obligations. Figure 2 illustrates the allocation of the system components to lifecycle stages and covered entities.
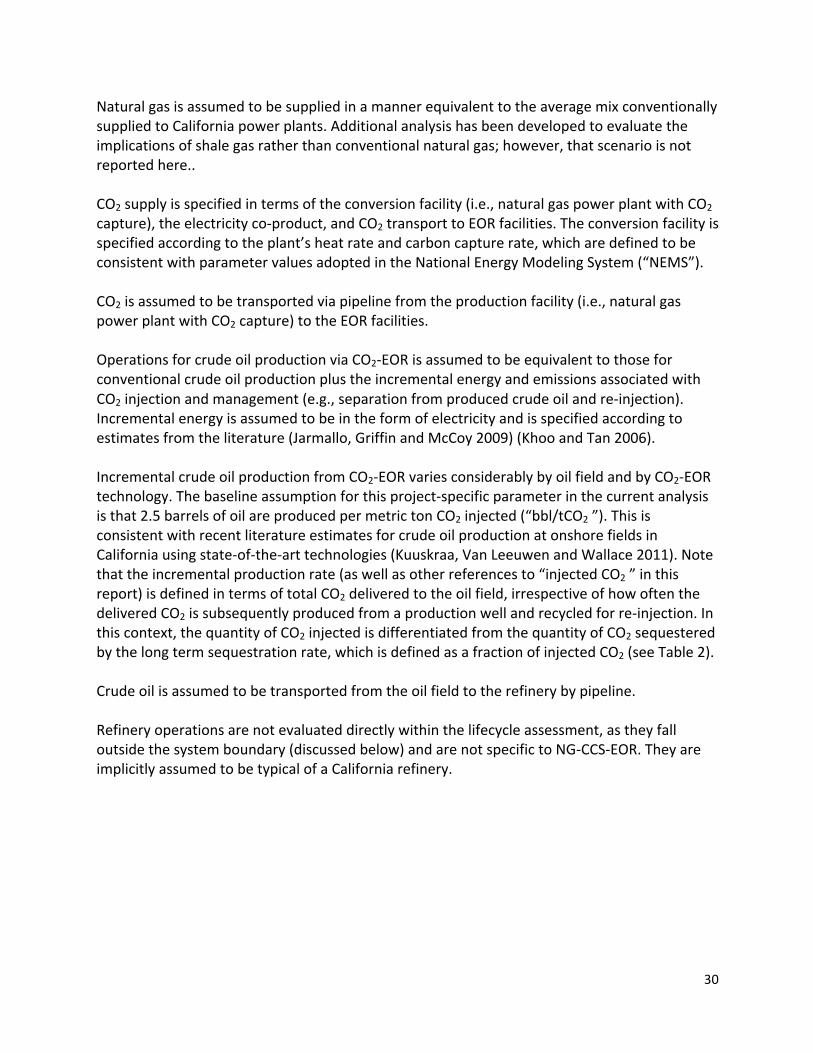
30
Natural gas is assumed to be supplied in a manner equivalent to the average mix conventionally supplied to California power plants. Additional analysis has been developed to evaluate the implications of shale gas rather than conventional natural gas; however, that scenario is not reported here.. CO2 supply is specified in terms of the conversion facility (i.e., natural gas power plant with CO2 capture), the electricity co-‐product, and CO2 transport to EOR facilities. The conversion facility is specified according to the plant’s heat rate and carbon capture rate, which are defined to be consistent with parameter values adopted in the National Energy Modeling System (“NEMS”). CO2 is assumed to be transported via pipeline from the production facility (i.e., natural gas power plant with CO2 capture) to the EOR facilities. Operations for crude oil production via CO2-‐EOR is assumed to be equivalent to those for conventional crude oil production plus the incremental energy and emissions associated with CO2 injection and management (e.g., separation from produced crude oil and re-‐injection). Incremental energy is assumed to be in the form of electricity and is specified according to estimates from the literature (Jarmallo, Griffin and McCoy 2009) (Khoo and Tan 2006). Incremental crude oil production from CO2-‐EOR varies considerably by oil field and by CO2-‐EOR technology. The baseline assumption for this project-‐specific parameter in the current analysis is that 2.5 barrels of oil are produced per metric ton CO2 injected (“bbl/tCO2 ”). This is consistent with recent literature estimates for crude oil production at onshore fields in California using state-‐of-‐the-‐art technologies (Kuuskraa, Van Leeuwen and Wallace 2011). Note that the incremental production rate (as well as other references to “injected CO2 ” in this report) is defined in terms of total CO2 delivered to the oil field, irrespective of how often the delivered CO2 is subsequently produced from a production well and recycled for re-‐injection. In this context, the quantity of CO2 injected is differentiated from the quantity of CO2 sequestered by the long term sequestration rate, which is defined as a fraction of injected CO2 (see Table 2). Crude oil is assumed to be transported from the oil field to the refinery by pipeline. Refinery operations are not evaluated directly within the lifecycle assessment, as they fall outside the system boundary (discussed below) and are not specific to NG-‐CCS-‐EOR. They are implicitly assumed to be typical of a California refinery.
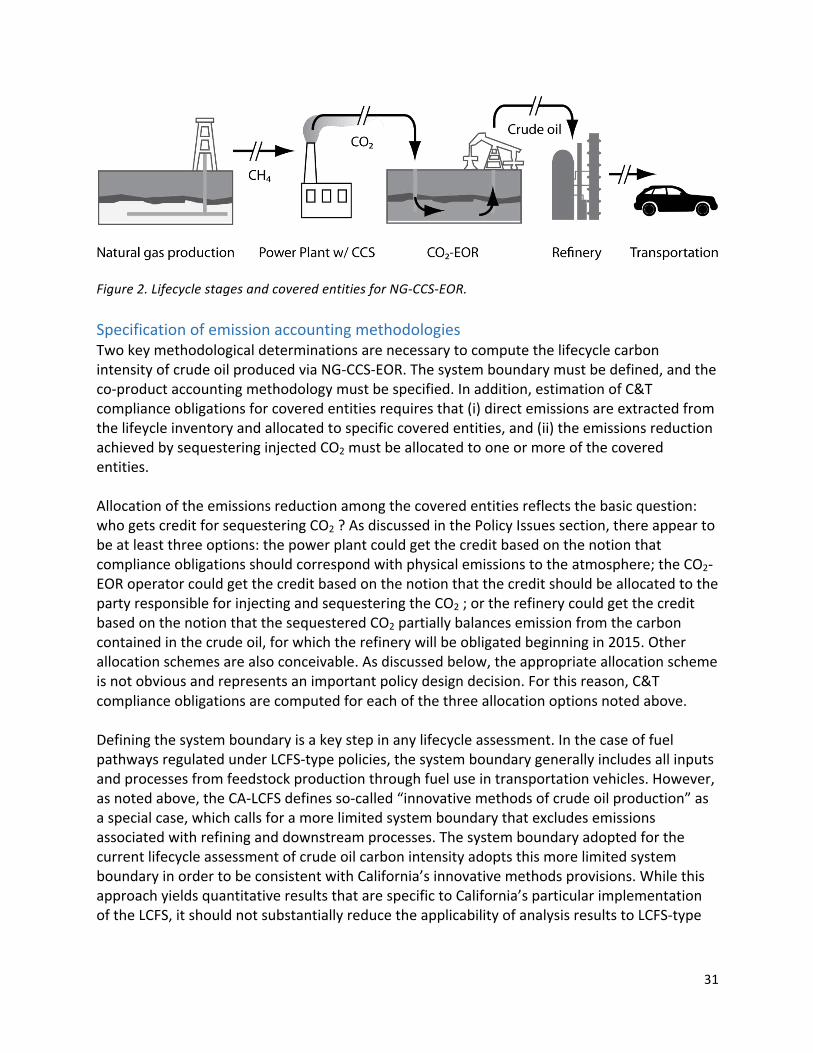
31
Figure 2. Lifecycle stages and covered entities for NG-‐CCS-‐EOR. Specification of emission accounting methodologies Two key methodological determinations are necessary to compute the lifecycle carbon intensity of crude oil produced via NG-‐CCS-‐EOR. The system boundary must be defined, and the co-‐product accounting methodology must be specified. In addition, estimation of C&T compliance obligations for covered entities requires that (i) direct emissions are extracted from the lifeycle inventory and allocated to specific covered entities, and (ii) the emissions reduction achieved by sequestering injected CO2 must be allocated to one or more of the covered entities. Allocation of the emissions reduction among the covered entities reflects the basic question: who gets credit for sequestering CO2 ? As discussed in the Policy Issues section, there appear to be at least three options: the power plant could get the credit based on the notion that compliance obligations should correspond with physical emissions to the atmosphere; the CO2-‐EOR operator could get the credit based on the notion that the credit should be allocated to the party responsible for injecting and sequestering the CO2 ; or the refinery could get the credit based on the notion that the sequestered CO2 partially balances emission from the carbon contained in the crude oil, for which the refinery will be obligated beginning in 2015. Other allocation schemes are also conceivable. As discussed below, the appropriate allocation scheme is not obvious and represents an important policy design decision. For this reason, C&T compliance obligations are computed for each of the three allocation options noted above. Defining the system boundary is a key step in any lifecycle assessment. In the case of fuel pathways regulated under LCFS-‐type policies, the system boundary generally includes all inputs and processes from feedstock production through fuel use in transportation vehicles. However, as noted above, the CA-‐LCFS defines so-‐called “innovative methods of crude oil production” as a special case, which calls for a more limited system boundary that excludes emissions associated with refining and downstream processes. The system boundary adopted for the current lifecycle assessment of crude oil carbon intensity adopts this more limited system boundary in order to be consistent with California’s innovative methods provisions. While this approach yields quantitative results that are specific to California’s particular implementation of the LCFS, it should not substantially reduce the applicability of analysis results to LCFS-‐type
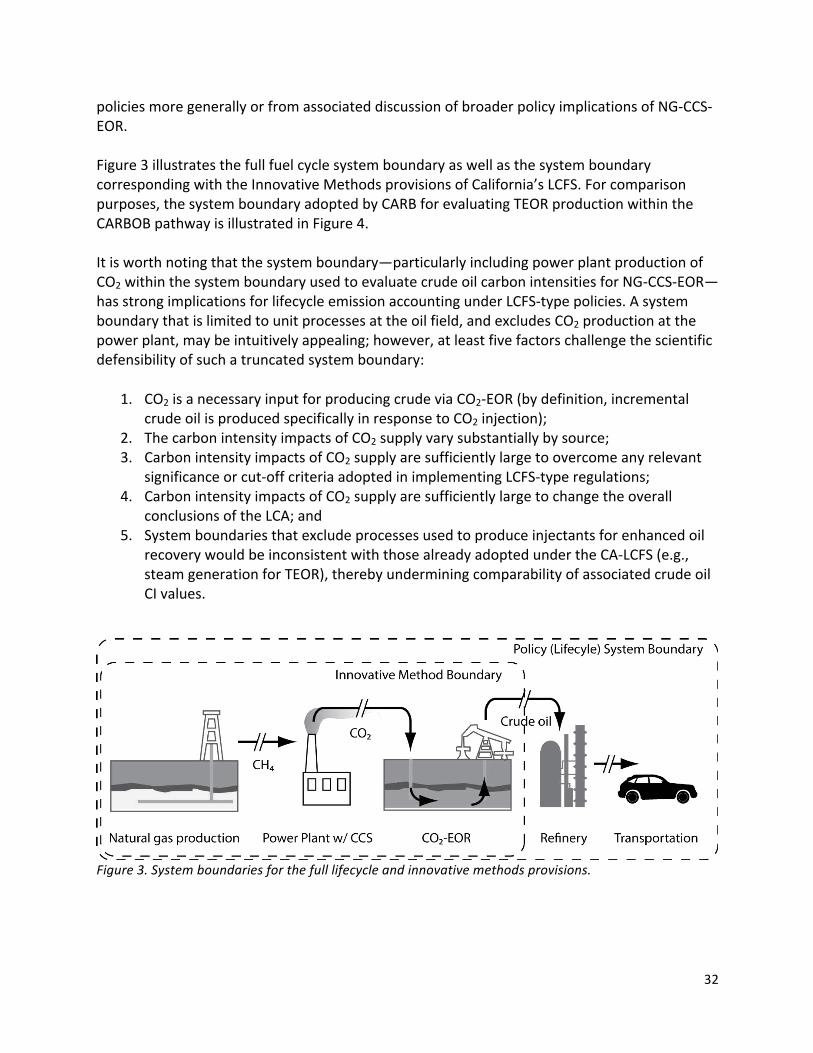
32
policies more generally or from associated discussion of broader policy implications of NG-‐CCS-‐EOR. Figure 3 illustrates the full fuel cycle system boundary as well as the system boundary corresponding with the Innovative Methods provisions of California’s LCFS. For comparison purposes, the system boundary adopted by CARB for evaluating TEOR production within the CARBOB pathway is illustrated in Figure 4. It is worth noting that the system boundary—particularly including power plant production of CO2 within the system boundary used to evaluate crude oil carbon intensities for NG-‐CCS-‐EOR—has strong implications for lifecycle emission accounting under LCFS-‐type policies. A system boundary that is limited to unit processes at the oil field, and excludes CO2 production at the power plant, may be intuitively appealing; however, at least five factors challenge the scientific defensibility of such a truncated system boundary:
1. CO2 is a necessary input for producing crude via CO2-‐EOR (by definition, incremental crude oil is produced specifically in response to CO2 injection);
2. The carbon intensity impacts of CO2 supply vary substantially by source; 3. Carbon intensity impacts of CO2 supply are sufficiently large to overcome any relevant
significance or cut-‐off criteria adopted in implementing LCFS-‐type regulations; 4. Carbon intensity impacts of CO2 supply are sufficiently large to change the overall
conclusions of the LCA; and 5. System boundaries that exclude processes used to produce injectants for enhanced oil
recovery would be inconsistent with those already adopted under the CA-‐LCFS (e.g., steam generation for TEOR), thereby undermining comparability of associated crude oil CI values.
Figure 3. System boundaries for the full lifecycle and innovative methods provisions.
33
Figure 4. System boundary adopted by CARB for evaluating TEOR in CARBOB fuel pathway. With respect to these factors, the international standard for lifecycle assessment (ISO 2006:14044) states the following:
“The deletion of life cycle stages, processes, inputs or outputs is only permitted if it does not significantly change the overall conclusions of the study” (4.2.3.3.1); “Where the study is intended to be used in comparative assertions intended to be disclosed to the public, the final sensitivity analysis of the inputs and outputs data shall include the mass, energy and environmental significance criteria so that all inputs that cumulatively contribute more than a defined amount (e.g. percentage) to the total are included in the study” (4.2.3.3.3); and “Systems shall be compared using the same functional unit and equivalent methodological considerations, such as performance, system boundary, data quality, allocation procedures, decision rules on evaluating inputs, and outputs and impact assessment.” (4.2.3.7)
On the basis of these factors, standards, and related considerations (including CA-‐LCFS regulatory language and relevant precedents) the system boundary adopted for the current analysis includes the power plant supplying CO2 for EOR operations. As with the system boundary, defining the co-‐product accounting methodology is a key step in developing any lifecycle assessment. For the purposes of the current analysis the system expansion (or displacement) method is adopted to account for emissions impacts from electricity co-‐products. The system expansion method assigns all emissions generated within the system boundary to a single product—in this case crude oil—and computes a credit for each co-‐product based on the quantity of emissions that would have been generated if the co-‐product were supplied from another, more conventional source—in this case, electricity from
34
the California power grid. Alternate co-‐product accounting methods are possible and have been used in certain cases within the CA-‐LCFS; however, there are several reasons why system expansion appears to be appropriate here. First, the system expansion (or displacement) method was explicitly recommended by the Expert Working Group, Subgroup on Issues Related to Co-‐Product Credits, which was specifically convened by CARB to evaluate co-‐product accounting within the LCFS (CARB 2010). The final recommendations issued by this subgroup are clear that system expansion is the most appropriate methodology for co-‐product accounting within the LCFS and that consistency in co-‐product accounting methodologies is critical to ensure comparability of results across fuel pathways (e.g., see Recommendations on page 5 and Discussion on page 16) (CARB 2010). Second, this is the methodology used by CARB to account for electricity co-‐products of TEOR within the LCA of the CARBOB fuel pathway. As noted throughout this report, TEOR is a strong analogue to NG-‐CCS-‐EOR with respect to co-‐products because both production methods generate electricity co-‐products in processes that supply fluids for injection into oil-‐containing geologic formations in order to enhance crude oil production. The analysis of TEOR within CARB’s LCA of the CARBOB fuel pathway assumes that surplus electricity, generated during steam production, is exported to the public grid and displaces (i.e., reduces production of) electricity with GHG emissions equivalent to California’s “grid average” electricity. This is the case for a number of fuel pathways approved under the CA-‐LCFS that generate electricity co-‐products. In this context, adopting the system expansion method for evaluating the CI of crude produced using NG-‐CCS-‐EOR and assuming displacement of “grid average” electricity supports consistency and comparability of results with the established LCA for CARBOB. Finally, system expansion appears to be the most broadly adopted methodology across transportation fuel policies that include lifecycle analysis of fuel carbon intensity. For example, the Federal Renewable Fuel Standard effectively adopts the system expansion methodology in implementing its “consequential” LCA modeling framework for evaluating biofuel CI. Other jurisdictions with LCFS-‐type policies also appear to embrace this co-‐product accounting methodology (e.g., British Columbia’s Low Carbon Fuel Requirements Regulation and the European Union’s Fuel Quality Directive). As a result, system expansion appears to both reflect the accounting methods adopted in existing regulations and provide the most broadly applicable basis for analysis relevant to policy development for new jurisdictions. Two options exist under the system expansion method of co-‐product accounting regarding the type of electricity displaced: “grid average” electricity, as noted above, or the “marginal generation mix”. The marginal mix typically excludes baseload (e.g., nuclear) and non-‐dispatchable (e.g., wind and solar) generation sources. Assuming displacement of the marginal generation mix would change the numerical results of the emission accounting exercise, but not the core methodology or overarching conclusions. A third approach to system expansion is to consider potential future changes in the portfolio of electricity generating technologies that are likely to emerge in response to the availability and deployment of NG-‐CCS-‐EOR. This approach, which relies on detailed projections of supply and demand in light of emerging technologies
35
and technological change, has not been adopted to date under the CA-‐LCFS or under other LCFS-‐type policies. System expansion is implemented here using displacement of “grid average” electricity in order to provide consistency with LCAs adopted under the balance of the CA-‐LCFS (including the LCA of crude oil produced using TEOR). It is worth noting that while the average CI of electricity supplied to the grid can be specified with a relatively high degree of confidence, its value is expected to decline systematically over time (e.g., as the C&T cap is ratcheted down). As this occurs, the co-‐product credit resulting from electricity displacement will also decline over time. This issue is not unique to NG-‐CCS-‐EOR, and is relevant to all fuel pathways that account for electricity co-‐products via system expansion. System expansion is not the only method of co-‐product accounting in LCA; an alternate method is to “allocate” upstream emissions burdens across multiple outputs of a single unit process. With this approach, emissions may be allocated in proportion to the mass, energy content, or economic value of the unit process outputs. Allocation based on mass and energy have been applied in limited cases to process flows within fuel LCAs adopted under the CA-‐LCFS (CARB 2009), although their use was subsequently advised against by the Expert Workgroup (CARB 2010). The allocation method is also discouraged in the European Commission Joint Research Centers’ analysis supporting LCFS-‐like components of the European Union’s Fuel Quantity Directive (“EU-‐FQD”) and by the international standards for LCA (see ISO 14044:2006) (Edwards, et al. 2014). Recent analysis supporting the EU-‐FQD provide the following discussion regarding the relative merits of system expansion and allocation methods for fuel CI calculations:
“We strongly favour this "substitution" method which attempts to model reality by tracking the likely fate of coproducts. This approach, (also known as “extension of system boundaries”), is increasingly used by scientists and is the method of choice in the ISO standards for life cycle assessment (LCA) studies. Some other studies have used "allocation" methods whereby energy and emissions from a process are arbitrarily allocated to the various products according to e.g. mass, energy content, “exergy” content or monetary value. Although such allocation methods have the attraction of being simpler to implement their outcomes in terms of energy use and GHG emissions tend to be less realistic. It is clear that the impact of a co-‐product must depend on what the co-‐product substitutes: all allocation methods take no account of this, and so are likely to give unreliable results.” (Edwards, et al. 2014)
In addition to these principled arguments supporting use of system expansion, the use of allocation methods in a manner consistent with their (limited) use to date within the CA-‐LCFS appears to be uniquely problematic for NG-‐CCS-‐EOR. Generally speaking, it would entail allocating a fraction of emissions from natural gas supply and CO2 production (at the power plant) to each of the power plant’s outputs (i.e., CO2 and electricity). While this explicitly allocates some of the emissions burdens from electricity generation to the CO2 used for oil
36
production, it also implicitly allocates sequestration benefits of CO2-‐EOR back “up” the supply chain to electricity co-‐products. This is a function of the integrated nature of CCS-‐EOR systems, in which CO2 captured from one process (e.g., electricity generation) is only prevented from entering the atmosphere due to its subsequent use in CO2-‐EOR. LCA methods generally do not contemplate allocating downstream environmental burdens—or benefits—to upstream coproducts in this manner. For example, the LCA adopted by CARB to evaluate the CI of soybean biodiesel uses allocation methods to account for animal feed co-‐products of vegetable oil supply; however, it does not allocate a portion of emissions from biodiesel production—or emissions benefits from displaced petroleum diesel use—back “up” the supply chain to animal feed co-‐products. Given the physical carbon flows associated with NG-‐CCS-‐EOR, it seems inappropriate to divorce the benefits of CO2 sequestration from the oil field activities that actually provide these benefits. On a more practical level, allocation based on mass or energy (as previously applied within the CA-‐LCFS) is problematic in the case of NG-‐CCS-‐EOR because electricity has essentially zero mass and CO2 has essentially zero energy. As a result, allocation based on mass would assign all emissions from electricity generation to the CO2 and downstream products while allocation based on energy would assign all emissions to electricity products. Such binary and opposing results means that neither allocation option provides a coherent or robust approach for co-‐product accounting. Allocation based on economic value may be possible, but also faces a number of practical challenges. These reflect: (i) the absence of a CO2 market in California with a discernable price; (ii) the associated difficulty in assigning an economic value for captured CO2 that is independent of climate policies motivating the analysis; and (iii) the volatile nature of oil prices, which would presumably translate into volatile CO2 values. Allocation based on economic value is also problematic because it is inconsistent with the methods adopted in the balance of the CA-‐LCFS, thereby compromising the comparability of results. The discussion of allocation methods thus far focuses on allocating emissions burdens across co-‐products of a unit process within the system boundary, which is consistent with the (limited) use of allocation methods to date within the CA-‐LCFS; an alternate approach would be to allocate total emissions occurring within the system boundary across the co-‐products of NG-‐CCS-‐EOR system as a whole. This might be accomplished by, for example, aggregating all emissions within the lifecycle system boundary and allocating them to petroleum and electricity co-‐products in proportion to total energy or economic value. While this approach has been illustrated in several academic studies (see Jaramillo et al, for example), it has not been applied in LCFS-‐type regulations, and it would represent a major departure from the accounting methods adopted to implement the CA-‐LCFS (e.g., neither positive emissions nor emissions reductions achieved in biofuel production are currently allocated across biofuels and associated animal feed co-‐products). The implications of this approach are not immediately obvious; however, its inconsistency with other methods adopted in implementing LCFS-‐like policies poses significant challenges for the comparability of resulting lifecycle CI values. This is

37
problematic because LCFS policy incentives are specifically defined according to comparative LCA results. For these various reasons system expansion is adopted within the current analysis for co-‐product accounting. Emissions inventory data Lifecycle energy and emissions inventory data is compiled from several sources to characterize the emissions associated with each of the four lifecycle stages specified above. Energy and emissions data for natural gas supply are derived from those provided in the CA-‐GREET model. These data are believed to provide reasonable estimates of actual energy and emissions for proximate projects in California and are likely to form the basis for analysis by California regulators in determining the CI of crude oil produced via NG-‐CCS-‐EOR under the CA-‐LCFS. Energy and emissions data for CO2 production (i.e., the natural gas power plant with CO2 capture) is derived from the plant’s heat rate and carbon capture rate, as noted above. These parameters enable the relative quantities of natural gas consumption, combustion emissions, electricity generation, and CO2 production (i.e., capture for export) to be specified. Facility emissions of CH4 and N2O, which are both regulated GHG emissions, are ignored for simplicity. The impact of this simplifying assumption is expected to be minor, based on the emissions profile of natural gas power plants provided in the CA-‐GREET model. A lifecycle emissions credit is computed for electricity co-‐products according to the system expansion (or displacement) method for co-‐product accounting, as discussed above. The co-‐product credit is defined by multiplying the quantity of co-‐product electricity generated (per unit of CO2 produced) by the lifecycle emissions intensity of electricity displaced. Data from the CA-‐GREET model are used to define the emissions intensities of displaced electricity, which is assumed to be equivalent to the average California generation mix. This is consistent with the assumptions made in the LCA adopted by CARB to characterize the electricity co-‐product credit for TEOR production, discussed above. Data for characterizing the energy and emissions profiles of CO2 transport via pipeline to the CO2-‐EOR injection site and of crude oil transport to the refinery are derived from those provided in the CA-‐GREET model. The emissions associated with CO2-‐EOR are characterized as the emissions from conventional crude production and the incremental energy associated with CO2 injection and management, as noted above. The emissions associated with conventional crude oil production are characterized using data from the CA-‐GREET model (CARB 2013). Incremental emissions from CO2 management are defined as those from electricity supply and those from long-‐term leakage of injected CO2. The incremental emissions of electricity supply are defined by
38
integrating published estimates of incremental electricity demand for CO2 management (Jarmallo, Griffin and McCoy 2009) (Khoo and Tan 2006) with lifecycle energy burdens of California’s electric mix, as specified in the CA-‐GREET model. The long-‐term leakage rate is assumed to be 0.9% of injected CO2, based on estimates from the literature (Wilson and Monea 2004) (Bowden, Pershke and Chalaturnyk 2013). These emissions, along with all others characterized here, are allocated only to the incremental quantity of crude oil produced as a result of CO2 injection. Refinery operations are not evaluated directly within the lifecycle assessment because they fall outside the system boundary specified in the innovative methods provisions of the CA-‐LCFS (see discussion of these provisions above and of the system boundary below). However, emissions intensities of refinery operations and downstream processes should not be substantially impacted by the use of crude oil produced via NG-‐CCS-‐EOR. As a result, the results presented here should reflect the net impact on carbon intensity values for petroleum fuels produced from such crudes. Therefore, while the results presented here are defined specifically in accordance with the innovative methods provisions of the CA-‐LCFS, they should be representative of net impacts on fuel CI values under LCFS frameworks more generally. There is at least one exception to the broad applicability of the results presented here to other LCFS-‐type policies. That relates to the allocation of upstream emissions impacts from crude production across multiple refinery products. California’s implementation implicitly allocates all emissions impacts associated with innovative methods to transportation fuel products. This is appropriate according to the assumption that the LCFS treatment of transportation fuel products motivates adoption of emission-‐reducing innovative methods. According to this assumption, while a fraction of the emissions benefits might be notionally allocated to other refinery co-‐products, the resulting use of these reduced-‐carbon co-‐products instead of conventionally produced co-‐products would result in an emissions credit back to the transportation fuel products via system expansion accounting methodologies. Implementation of LCFS-‐type policies that don’t adopt these assumptions and methodologies (e.g., don’t assume transportation fuels to be the primary refinery product, don’t assume emissions reductions in crude production are motivated by the policy treatment of transportation fuel products, and / or don’t adopt system expansion methodologies for co-‐product accounting) might come to different conclusions regarding the allocation of upstream emissions reductions exclusively to transportation fuels. Data characterizing the CA-‐C&T compliance obligations for each covered entity indicated in Figure 2 are extracted from the lifecycle emissions inventory data discussed above. Specifically, emissions impacts associated with process inputs and co-‐products are removed from the emissions profile of each lifecycle stage in order to isolate direct emissions from the unit processes that comprise each stage. The resulting estimates of direct emissions at each stage are allocated to the corresponding covered entity. Compliance obligations for the oil refinery are assumed to be equivalent to 100% of the carbon contained in the crude oil. This simplifying assumption is based on the notion that the carbon
39
contained in crude oil will be either emitted directly from the refinery or will be contained in the refinery’s fuel product slate. As noted above, refineries will have C&T compliance obligations for both direct emissions and for carbon contained in fuel products beginning in 2015. This simplifying assumption reduces the accuracy of estimated compliance obligations developed in this report. It may underestimate total emissions by excluding those associated with other inputs to refinery operations (e.g., natural gas and hydrogen), or it may overestimate compliance obligations by excluding carbon embedded in non-‐fuel refinery products (e.g., asphalt). This assumption should not substantially compromise the report’s conclusions because emissions from refineries and downstream processes are generally not affected by nor specific to NG-‐CCS-‐EOR operations. Values for key parameter used in the model are provided at the end of this section in Table 2. Comparison baseline production method The innovative methods provisions of the CA-‐LCFS specify that LCFS credits may be generated by refiners that utilize crude oil produced using “innovative methods of crude oil production”. The quantity of LCFS credits generated by such crudes is computed from the difference between the carbon intensities of the innovative method and a “comparison baseline” production method. As a result, the credit potential of innovative methods, such as NG-‐CCS-‐EOR, depend both on the carbon intensity of the innovative method and on the carbon intensity of the comparison baseline method. The Innovative Methods provisions do not specify a comparison baseline production method. Discussions with CARB staff indicate that the intent is for the comparison baseline to be the production method that would be used if the innovative method were not implemented. It is, however, not entirely clear how this principle should be interpreted in the case of proximate NG-‐CCS-‐EOR deployments within California. That is because the crude produced via NG-‐CCS-‐EOR may not be amenable for production by other methods currently practiced in California. CO2-‐EOR is often used as a tertiary production method in fields where production rates using other methods are in decline. In California, for example, CO2-‐EOR may be applied to fields that have been produced using water flooding, or other enhanced oil production method, at least until declining production creates challenges for the economic viability of continued operations. Defining the comparison baseline strictly on the basis of the production method used before application of CO2-‐EOR might therefore support adoption of water flooding as the comparison baseline production method for such cases. This approach appears to be consistent with current regulatory language for the innovative methods provisions, as well as comments by CARB staff regarding the intent that comparison baselines reflect production methods used in the field absent use of the innovative production method. That said, CO2-‐EOR is generally used to produce oil that is not amenable to production using methods like water flooding, which have been applied historically. This notion is reflected in the current analysis by defining the quantity of oil produced using CO2-‐EOR in terms of incremental
40
production, above and beyond what would be producing using other production methods. In this context, historically applied production methods like water flooding are not a meaningful substitute for CO2-‐EOR, and therefore may not be viewed as providing a meaningful basis for comparison in evaluating the emissions impacts of applying CCS-‐EOR. This may create some ambiguity regarding the appropriate comparison baseline for evaluating the incremental CI benefits of CCS-‐EOR. An alternate approach would be to consider comparison baseline production methods to be those that are linked to the innovative method by economic mechanisms rather than field-‐level operational mechanisms. This approach also appears to be consistent with the current regulatory language. One example of this approach would be to assume that NG-‐CCS-‐EOR production does not affect crude oil prices, which are generally linked to global markets, and therefore that NG-‐CCS-‐EOR will not affect overall demand by California refineries. In this case, it may be reasonable to assume that the crude produced via NG-‐CCS-‐EOR will displace crude supplied from one or more other sources. In this context, the source of displaced crude supply may represent an appropriate comparison baseline production method. An alternate approach would be to define the comparison baseline method in terms of other production methods capable of providing similar increases in crude production within California. With these various alternatives in mind, results are presented in this report according to four plausible options for defining the comparison baseline production method: low CI “water flood”, based on the range of CI values determined by CARB for notable fields produced with water flooding (CARB 2014); “conventional” crude oil, as specified by the OPGEE model; California “average” crude oil, as determined by CARB (CARB 2014); and TEOR, as specified by the OPGEE model. The “water flood” comparison baseline may be viewed as reflecting the assumptions that (i) CO2-‐EOR will be used as a tertiary production method on fields that have been previously produced using water flooding and (ii) that the production method used immediately prior to implementing CO2-‐EOR should be used as the comparison baseline production method. A CI value near the low end of the range for fields produced using water flooding is used for illustration purposes, as CI values near the upper end of the range are similar to those used to illustrate the implications of other comparison baseline production methods6. The “conventional” crude comparison baseline may be viewed as reflecting an assumption that crude produced using NG-‐CCS-‐EOR is likely to displace crude oil imports. The California “average” crude baseline reflects an assumption that the source of displaced crude cannot be specified, and that the “average” crude oil, as specified by CARB, represents the mix of crudes that would be displaced. The TEOR baseline reflects the assumption that, absent CCUS, TEOR is likely required to support any increase in crude production within California. 6 A CI value of 4.00 gCO2e/MJ is used here to illustrate the “water flood” comparison baseline. This is near the low end of the range of CI values determined by CARB for some of the more notable examples of fields produced using water flooding. For example, CI values for the Inglewood, Ventura, Wilmington, Beverly Hills, San Miguelito, and Sawtelle oil fields are 8.74, 4.35, 6.36, 3.33, 4.44, and 2.83, respectively (CARB 2014). A CI value near the lower end of the range is used here for illustration purposes because values near the upper end of the range overlap with CI values of the other comparison baseline production methods illustrated.
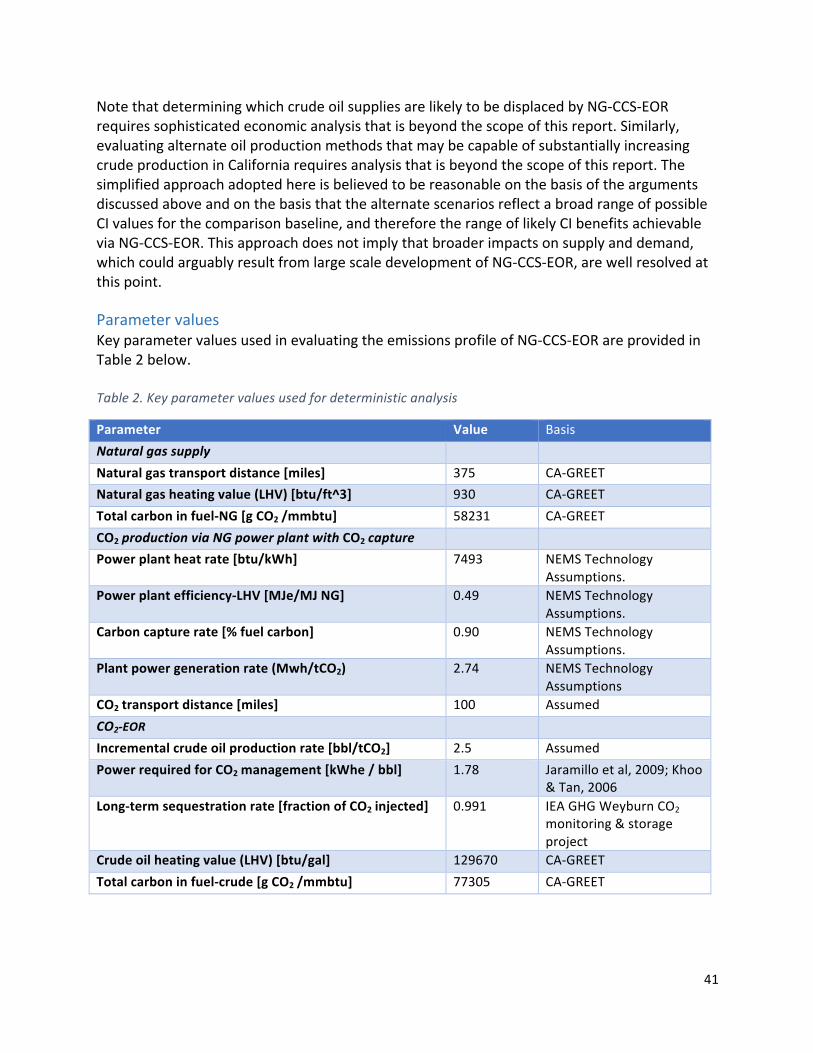
41
Note that determining which crude oil supplies are likely to be displaced by NG-‐CCS-‐EOR requires sophisticated economic analysis that is beyond the scope of this report. Similarly, evaluating alternate oil production methods that may be capable of substantially increasing crude production in California requires analysis that is beyond the scope of this report. The simplified approach adopted here is believed to be reasonable on the basis of the arguments discussed above and on the basis that the alternate scenarios reflect a broad range of possible CI values for the comparison baseline, and therefore the range of likely CI benefits achievable via NG-‐CCS-‐EOR. This approach does not imply that broader impacts on supply and demand, which could arguably result from large scale development of NG-‐CCS-‐EOR, are well resolved at this point. Parameter values Key parameter values used in evaluating the emissions profile of NG-‐CCS-‐EOR are provided in Table 2 below. Table 2. Key parameter values used for deterministic analysis
Parameter Value Basis Natural gas supply Natural gas transport distance [miles] 375 CA-‐GREET Natural gas heating value (LHV) [btu/ft^3] 930 CA-‐GREET Total carbon in fuel-‐NG [g CO2 /mmbtu] 58231 CA-‐GREET CO2 production via NG power plant with CO2 capture Power plant heat rate [btu/kWh] 7493 NEMS Technology
Assumptions. Power plant efficiency-‐LHV [MJe/MJ NG] 0.49 NEMS Technology
Assumptions. Carbon capture rate [% fuel carbon] 0.90 NEMS Technology
Assumptions. Plant power generation rate (Mwh/tCO2) 2.74 NEMS Technology
Assumptions CO2 transport distance [miles] 100 Assumed CO2-‐EOR Incremental crude oil production rate [bbl/tCO2] 2.5 Assumed Power required for CO2 management [kWhe / bbl] 1.78 Jaramillo et al, 2009; Khoo
& Tan, 2006 Long-‐term sequestration rate [fraction of CO2 injected] 0.991 IEA GHG Weyburn CO2
monitoring & storage project
Crude oil heating value (LHV) [btu/gal] 129670 CA-‐GREET Total carbon in fuel-‐crude [g CO2 /mmbtu] 77305 CA-‐GREET

42
Results This section presents the emission profile of NG-‐CCS-‐EOR, as viewed through the policy lenses of the CA-‐C&T and the CA-‐LCFS. C&T results Compliance obligations under the CA-‐C&T program are compiled for each of the four covered entities that comprise the integrated NG-‐CCS-‐EOR system: natural gas supplier; CO2 supplier and power producer (referred to below as simply the power producer); oil producer; and oil refiner. Compliance obligations are presented for the three allocation schemes discussed above. In addition, aggregate obligations for electricity generation / CO2 production, CO2 delivery, crude production, and refining in the NG-‐CCS-‐EOR system are compared with a benchmark representing “California average” electricity generation, crude oil production, and refinery emissions to characterize the overall emissions benefit of NG-‐CCS-‐EOR. As discussed above, compliance obligations under the CA-‐C&T program account for direct atmospheric emissions from covered entities. CO2 that is effectively sequestered is excluded from compliance obligations on the basis that it is not emitted to the atmosphere. Results are presented in units of grams CO2 equivalent emissions per mega-‐joule of crude oil produced (“gCO2e/MJCrude”). These are not customary units for the CA-‐C&T program, which generally defines compliance obligations in units of tons of CO2 equivalent (“CO2 e”) emissions per year. Converting results into annual emissions obligations requires assumptions regarding the scale of deployment (e.g., annual crude oil production rate, power plant scale, etc.). Such assumptions would be inherently arbitrary and do not provide additional insights, given the current focus on relative emissions rates and compliance obligations associated with CCUS deployments under the C&T program. Figure 5 compares aggregate (system-‐wide) compliance obligations for NG-‐CCS-‐EOR with the “California average” benchmark. Note that the aggregate obligations exclude those associated with natural gas supply. Including compliance obligations for natural gas supply would complicate comparison with a “California average” benchmark, as the California power mix includes sources other than natural gas, each of which have distinct emissions associated with fuel supply. As noted above, emissions from natural gas supply are unaffected by NG-‐CCS-‐EOR and are relatively modest in magnitude (as indicated in Figure 6 below). As a result, excluding compliance obligations from natural gas supply does not substantially impact comparisons between NG-‐CCS-‐EOR and a benchmark emphasizing power generation and petroleum production. As indicated in Figure 5, NG-‐CCS-‐EOR yields system-‐wide emissions reductions of around 40% compared with California average electricity, crude oil production, petroleum refining, and fuel combustion. This result makes sense, given that NG-‐CCS-‐EOR sequesters CO2 equivalent to ~90% of that produced by the power plant, and power plant emissions represent almost half of the system-‐wide emissions in the benchmark. A 90% reduction from a source representing 50% of system-‐wide emissions should yield a 45% overall reduction. The decreased efficiency of
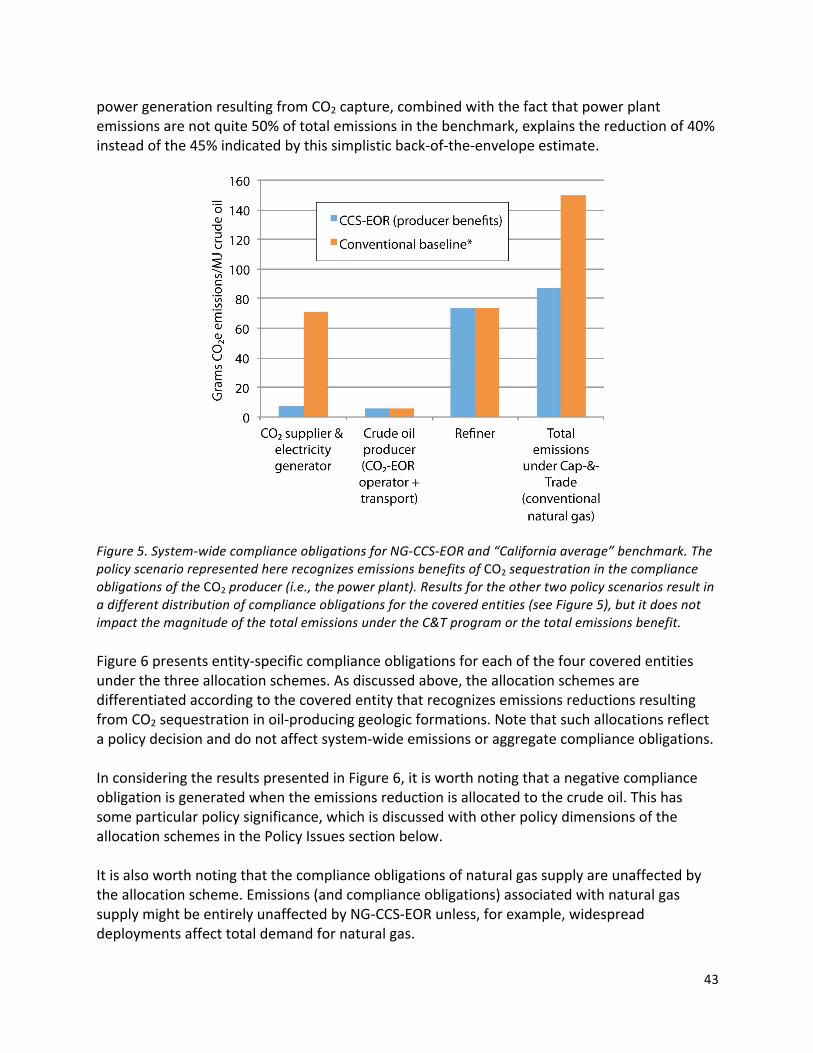
43
power generation resulting from CO2 capture, combined with the fact that power plant emissions are not quite 50% of total emissions in the benchmark, explains the reduction of 40% instead of the 45% indicated by this simplistic back-‐of-‐the-‐envelope estimate.
Figure 5. System-‐wide compliance obligations for NG-‐CCS-‐EOR and “California average” benchmark. The policy scenario represented here recognizes emissions benefits of CO2 sequestration in the compliance obligations of the CO2 producer (i.e., the power plant). Results for the other two policy scenarios result in a different distribution of compliance obligations for the covered entities (see Figure 5), but it does not impact the magnitude of the total emissions under the C&T program or the total emissions benefit. Figure 6 presents entity-‐specific compliance obligations for each of the four covered entities under the three allocation schemes. As discussed above, the allocation schemes are differentiated according to the covered entity that recognizes emissions reductions resulting from CO2 sequestration in oil-‐producing geologic formations. Note that such allocations reflect a policy decision and do not affect system-‐wide emissions or aggregate compliance obligations. In considering the results presented in Figure 6, it is worth noting that a negative compliance obligation is generated when the emissions reduction is allocated to the crude oil. This has some particular policy significance, which is discussed with other policy dimensions of the allocation schemes in the Policy Issues section below. It is also worth noting that the compliance obligations of natural gas supply are unaffected by the allocation scheme. Emissions (and compliance obligations) associated with natural gas supply might be entirely unaffected by NG-‐CCS-‐EOR unless, for example, widespread deployments affect total demand for natural gas.
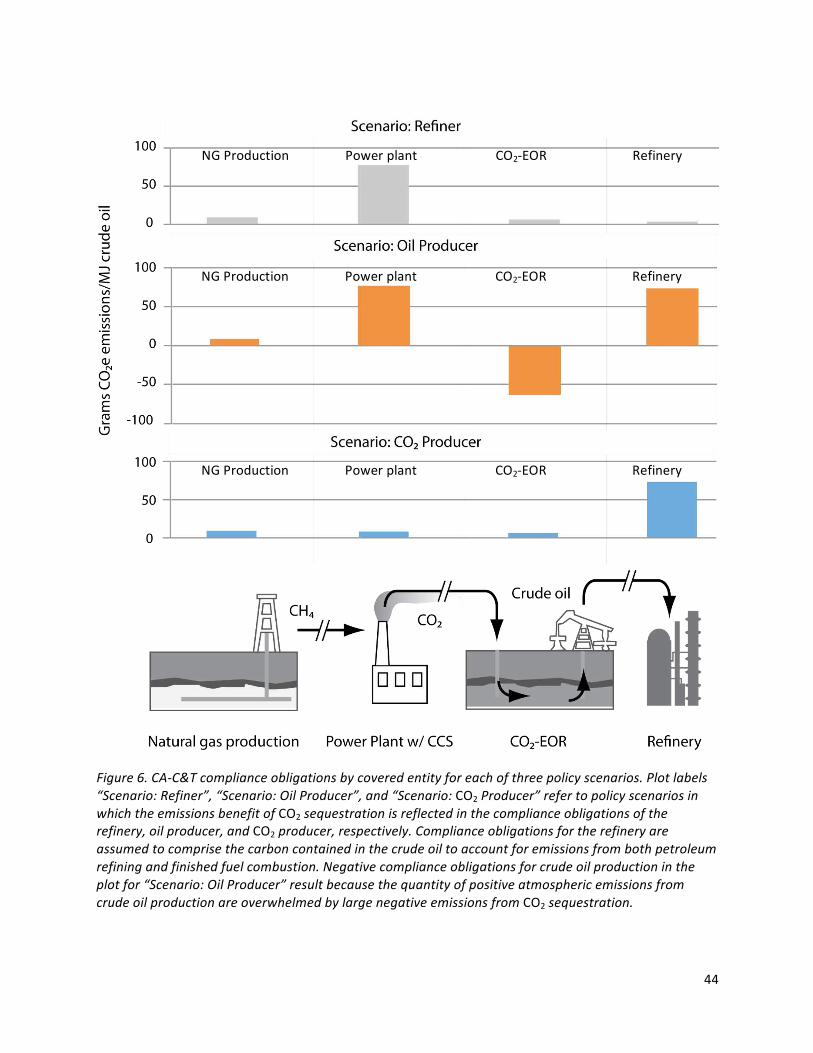
44
Figure 6. CA-‐C&T compliance obligations by covered entity for each of three policy scenarios. Plot labels “Scenario: Refiner”, “Scenario: Oil Producer”, and “Scenario: CO2 Producer” refer to policy scenarios in which the emissions benefit of CO2 sequestration is reflected in the compliance obligations of the refinery, oil producer, and CO2 producer, respectively. Compliance obligations for the refinery are assumed to comprise the carbon contained in the crude oil to account for emissions from both petroleum refining and finished fuel combustion. Negative compliance obligations for crude oil production in the plot for “Scenario: Oil Producer” result because the quantity of positive atmospheric emissions from crude oil production are overwhelmed by large negative emissions from CO2 sequestration.
NG Production Power plant CO2-‐EOR Refinery
NG Production Power plant CO2-‐EOR Refinery
NG Production Power plant CO2-‐EOR Refinery

45
LCFS results Emission accounting results presented through the lens of the CA-‐LCFS represent the lifecycle carbon intensity of crude oil produced via NG-‐CCS-‐EOR and delivered to the refinery gate, as specified in the Innovative Methods provisions. The net benefit of NG-‐CCS-‐EOR as an innovative method of crude oil production is computed as the difference in carbon intensities for this innovative production method and the “comparison baseline” production method. Note that the innovative methods provisions specify that carbon intensity results be computed in units of grams CO2e emissions per mega-‐joule of crude oil. These are not customary units for the LCFS more generally, which regulates carbon intensity in units of grams CO2e per mega-‐joule of transportation fuel. The distinction is that crude oil is not a transportation fuel, but rather a feedstock for producing transportation fuel (e.g., CARBOB blendstock in gasoline). Results are compiled here to be consistent with the innovative methods provisions of the CA-‐LCFS, which seeks to differentiate new crude production methods that reduce lifecycle GHG emissions, as discussed above. Carbon intensity impacts are computed for each lifecycle stage and aggregated to determine the overall carbon intensity of crude oil delivered to the refinery. Figure 7 illustrates the contributions from each lifecycle stage to the net carbon intensity value. Note that the large emissions credit associated with co-‐product electricity makes the overall carbon intensity of delivered crude oil negative. Importantly, this negative carbon intensity value does not imply a negative carbon intensity for resulting transportation fuels, as it does not account for the carbon contained in the crude oil itself, only the carbon intensity of producing the crude oil. Carbon intensity impacts of carbon contained in the crude oil is captured in downstream stages of the LCA (e.g., fuel combustion). According to the LCA adopted by CARB for CARBOB blendstock in gasoline, crude oil refining, CARBOB transport, and fuel combustion contribute 13.72, 0.36, and 72.91 grams CO2e per mega-‐joule, respectively, to the final carbon intensity of CARBOB (CARB 2009). As a result, a full LCA of CARBOB produced using crude from NG-‐CCS-‐EOR might be expected to have a lifecycle CI value of 32.44 (-‐52.55 + 13.72 + 0.36 + 72.91), nearly 67% below the default CI for CARBOB. This suggests that NG-‐CCS-‐EOR, and CCUS more generally, has the potential to make large reductions in the carbon intensity of petroleum fuels and large contributions toward associated policy objectives of the LCFS. Under the CA-‐LCFS, regulated parties (e.g., oil refineries) are permitted to generate LCFS credits in proportion to the net CI benefits provided innovative methods of crude oil production. The net CI benefits of implementing NG-‐CCS-‐EOR as an innovative method of crude oil production are summarized in Table 3. Summary results are provided relative to each of the four “comparison baseline” production methods discussed above: low CI “water flood”; “Conventional” crude oil; “California average” crude oil; and crude oil produced using TEOR. As indicated, the CI benefit is computed as the CI of crude produced using the comparison baseline method minus the CI of crude produced using NG-‐CCS-‐EOR.

46
The net CI benefits indicated in Table 3 suggest that crude oil produced using NG-‐CCS-‐EOR, or CCUS more generally, could yield substantial quantities of LCFS credits. This suggests that CCUS could play a significant role in achieving the policy objectives and in the compliance strategies of regulated parties. Moreover, the value of LCFS credits generated by CCUS projects similar to the NG-‐CCS-‐EOR system evaluated here may be able to provide significant contributions toward the financial performance of CCUS projects.
Figure 7. Carbon intensity of crude oil supplied via NG-‐CCS-‐EOR by lifecycle stage. The large negative emissions associated with the co-‐product of CO2 supply reflects the supply of low carbon electricity from the power plant with CO2 capture. This co-‐product credit is computed in the same way as the credit assigned to electricity co-‐products of thermally enhanced oil recovery in the established fuel pathway for petroleum blendstock used in gasoline (i.e., CARBOB). While the co-‐product credit results in a negative lifecycle carbon intensity value for crude oil supplied via NG-‐CCS-‐EOR, the lifecycle carbon intensity of resulting gasoline blendstock (including emissions from oil refining, fuel distribution, and fuel combustion) is not negative, due to substantial emissions from downstream processes. Table 3. Net CI benefits of NG-‐CCS-‐EOR under CA-‐LCFS.
"Comparison baseline" production method Water Flood
Conven. Crude
CA Average
Thermal EOR
Comparison baseline CI [gCO2e/MJ] 4.00 7.81 11.40 21.60 NG-‐CCS-‐EOR CI [gCO2e/MJ] -‐52.55 -‐52.55 -‐52.55 -‐52.55 Net CI impact [gCO2e/MJ] (difference in crude CIs) -‐56.55 -‐60.36 -‐63.95 -‐74.15 Net CI impact [tLCFS Credits / tCO2 Injected] (results normalized per tCO2 injected)
-‐0.73 -‐0.78 -‐0.83 -‐0.96
47
Note. Net CI impacts under the innovative methods provisions of the CA-‐LCFS are computed as the difference between the CI of crude produced using an “innovative method” and those produced using a “comparison baseline” production method. Four potential “comparison baseline” methods are considered here to evaluate the net CI impact of NG-‐CCS-‐EOR. CI values computed according to the innovative methods provisions do not include emissions from crude refining, CARBOB distribution, or vehicle combustion, which are accounted for separately. Net CI impacts are normalized to units of tons LCFS credits per ton of CO2 injected based on technical assumptions provided in Table 2. Sensitivity analysis The sensitivity of emission accounting results to key model parameters is illustrated in Figures 8, 9 and 10. Figure 8 illustrates sensitivity analysis results for the percentage reduction in emissions provided by NG-‐CCS-‐EOR under the CA-‐C&T program relative the ‘California average’ benchmark. This is consistent with the discussion provided in reference to Figure 5 above. Figure 9 illustrates sensitivity analysis results for CI impact achieved by NG-‐CCS-‐EOR as an innovative method under the CA-‐LCFS. This is consistent with the results presented in Table 3 above. Figure 10 aims to clarify the nature of the model sensitivity to changes in the incremental oil production rate by plotting the sensitivity of net benefits under the CA-‐C&T and CA-‐LCFS as a function of the incremental oil production rate. As illustrated in Figure 8, C&T results are most sensitive to changes in (i) the emissions factor of the ‘California average’ electricity benchmark and (ii) the incremental oil production rate. The emissions reduction achieved by NG-‐CCS-‐EOR decreases as the benchmark emissions factor for electricity decreases (see Panel B). Note that changes in the emissions factor for electricity reflects a change in the benchmark against which emissions reductions are measured, not a change in the emissions profile of the NG-‐CCS-‐EOR system. As discussed above, NG-‐CCS-‐EOR can reduce emissions by ~40% relative to the current benchmark; however, once the economy reaches an equivalent level of decarbonization NG-‐CCS-‐EOR cannot reduce emissions further. This sensitivity to benchmark emissions factors could manifest as a sensitivity to benchmarks in either electricity markets (as illustrated in Panel B of Figure 8) or petroleum markets; although, emissions factors for petroleum refining and use are not treated as variable in the model. Increasing the incremental crude oil production rate (“ICOPR”) causes a decrease in the percentage emissions benefit under CA-‐C&T (see Panel D). This is because increases in ICOPR reflect increases in the production of crude—and increases in associated downstream emissions—per unit of CO2 injected for sequestration. Changes in ICOPR do not change the emissions benefits of CO2 sequestration via NG-‐CCS-‐EOR, but do change the total quantity of energy products (i.e., crude oil) over which the benefits of CO2 sequestration are distributed. This is discussed further below.
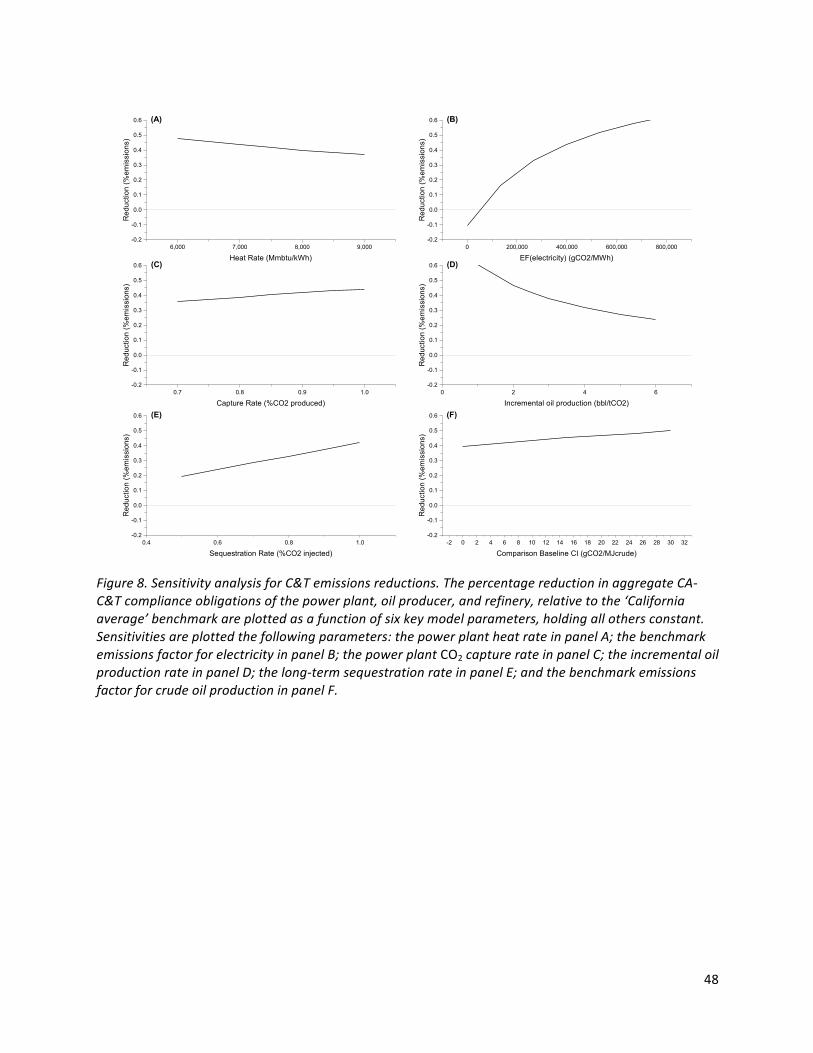
48
Figure 8. Sensitivity analysis for C&T emissions reductions. The percentage reduction in aggregate CA-‐C&T compliance obligations of the power plant, oil producer, and refinery, relative to the ‘California average’ benchmark are plotted as a function of six key model parameters, holding all others constant. Sensitivities are plotted the following parameters: the power plant heat rate in panel A; the benchmark emissions factor for electricity in panel B; the power plant CO2 capture rate in panel C; the incremental oil production rate in panel D; the long-‐term sequestration rate in panel E; and the benchmark emissions factor for crude oil production in panel F.
6,000 7,000 8,000 9,000-0.2
-0.1
0.0
0.1
0.2
0.3
0.4
0.5
0.6R
educ
tion
(%em
issi
ons)
Heat Rate (Mmbtu/kWh)
(A)
0 200,000 400,000 600,000 800,000-0.2
-0.1
0.0
0.1
0.2
0.3
0.4
0.5
0.6
Red
uctio
n (%
emis
sion
s)
EF(electricity) (gCO2/MWh)
(B)
0.7 0.8 0.9 1.0-0.2
-0.1
0.0
0.1
0.2
0.3
0.4
0.5
0.6
Red
uctio
n (%
emis
sion
s)
Capture Rate (%CO2 produced)
(C)
0 2 4 6-0.2
-0.1
0.0
0.1
0.2
0.3
0.4
0.5
0.6
Red
uctio
n (%
emis
sion
s)
Incremental oil production (bbl/tCO2)
(D)
0.4 0.6 0.8 1.0-0.2
-0.1
0.0
0.1
0.2
0.3
0.4
0.5
0.6
Red
uctio
n (%
emis
sion
s)
Sequestration Rate (%CO2 injected)
(E)
-2 0 2 4 6 8 10 12 14 16 18 20 22 24 26 28 30 32-0.2
-0.1
0.0
0.1
0.2
0.3
0.4
0.5
0.6R
educ
tion
(%em
issi
ons)
Comparison Baseline CI (gCO2/MJcrude)
(F)

49
Figure 9. Sensitivity analysis plots for LCFS results. The reduction in crude CI is plotted as a function of six key model parameters, holding all others constant. Sensitivities are plotted the following parameters: the power plant heat rate in panel A; the benchmark emissions factor for electricity in panel B; the power plant CO2 capture rate in panel C; the incremental oil production rate in panel D; the long-‐term sequestration rate in panel E; and the benchmark emissions factor for crude oil production in panel F. As indicated in Figure 9, LCFS results are most sensitive to (i) the carbon intensity of electricity displaced and (ii) the incremental crude oil production rate. Sensitivity to the carbon intensity of electricity displaced is the LCFS analogue to the sensitivity of C&T results to the emissions factor for electricity discussed above. From an LCA perspective, decarbonization of the electric sector reduces the co-‐product credit assigned for electricity co-‐products of crude oil produced using NG-‐CCS-‐EOR. As noted above, the carbon intensity of electricity in California is expected to decline systematically over the coming decades (e.g., in response to California’s climate policies). As this occurs, the CI reduction associated with crude oil produced via NG-‐CCS-‐EOR will also decline. The potential for this effect to moderate the impact of CCUS on LCFS credit markets is discussed below. It is also worth noting that if electricity markets develop in a way that causes co-‐products of NG-‐CCS-‐EOR to displace electricity with sufficiently low carbon intensities, then the co-‐product credit disappears completely, and NG-‐CCS-‐EOR can actually produce crude oil
6,000 7,000 8,000 9,000 10,000 11,000-160
-140
-120
-100
-80
-60
-40
-20
0
20C
I Red
uctio
n (g
CO
2e/M
J)
Heat Rate (Mmbtu/kWh)
(A)
0 200,000 400,000 600,000 800,000-160
-140
-120
-100
-80
-60
-40
-20
0
20
CI R
educ
tion
(gC
O2e
/MJ)
CI(electricity) (gCO2/MWh)
(B)
0.5 0.6 0.7 0.8 0.9 1.0-160
-140
-120
-100
-80
-60
-40
-20
0
20
CI R
educ
tion
(gC
O2e
/MJ)
Capture Rate (%CO2 produced)
(C)
0 2 4 6-160
-140
-120
-100
-80
-60
-40
-20
0
20
CI R
educ
tion
(gC
O2e
/MJ)
Incremental oil production (bbl/tCO2)
(D)
0.4 0.6 0.8 1.0-160
-140
-120
-100
-80
-60
-40
-20
0
20
CI R
educ
tion
(gC
O2e
/MJ)
Sequestration Rate (%CO2 injected)
(E)
-2 0 2 4 6 8 10 12 14 16 18 20 22 24 26 28 30 32-160
-140
-120
-100
-80
-60
-40
-20
0
20C
I Red
uctio
n (g
CO
2e/M
J)
Comparison Baseline CI (gCO2e/MJcrude)
(F)
50
with CI values greater than the comparison baseline. According to the current model, this tipping point occurs when the carbon intensity of electricity is ~67% below the value currently used by CARB in evaluating fuel CI values under the CA-‐LCFS. The sensitivity of crude CI to the incremental crude oil production rate (“ICOPR”) reflects changes in the quantity of crude oil over which emissions benefits are distributed. Note that carbon intensity is defined as emissions per unit fuel energy. As a result, changing the quantity of crude oil produced will decrease the CI impact of a fixed quantity of emissions reductions, all else being equal. In the current context, a higher ICOPR corresponds to production of more oil per unit of CO2 sequestered, or equivalently less CO2 sequestered per unit of incremental oil produced. Conversely, a lower ICOPR corresponds to production of less oil per unit of CO2 injected, or equivalently more CO2 sequestered per unit of incremental crude oil. In practice, the ICOPR will reflect reservoir-‐specific characteristics and field-‐management decisions made by the CO2-‐EOR operator. As a result, ICOPR could plausibly be adjusted by oil field operators (within some range) in order to maximize risk-‐adjusted returns from both crude production and associated CO2 sequestration. The sensitivity analysis illustrated in Figure 10 is intended to clarify the nature of model sensitivities to ICOPR. Panel D in each of Figures 8 and 9 indicates strong sensitivities of C&T and LCFS results, respectively, to changes in ICOPR. As noted in the discussions above, interpretation of this sensitivity is confounded by the way ICOPR is used within the model to compute emissions benefits of NG-‐CCS-‐EOR. In particular, changes in ICOPR affect the quantity of crude oil produced per unit of CO2 sequestered. As a result, changes in ICOPR affect the quantity of energy products over which the emissions benefits of geologic sequestration are distributed. This impacts the percentage reduction in CA-‐C&T compliance obligations because it affects the total emissions—or the divisor—used to compute the reduction as a percentage of baseline emissions. Similarly ICOPR impacts the reduction in crude oil CI by changing the quantity of crude oil—again the divisor—used for computing CI values. Figure 10 aims to clarify this point by illustrating the net emissions benefits under both the CA-‐C&T and CA-‐LCFS programs as a function of the quantity of CO2 injected.
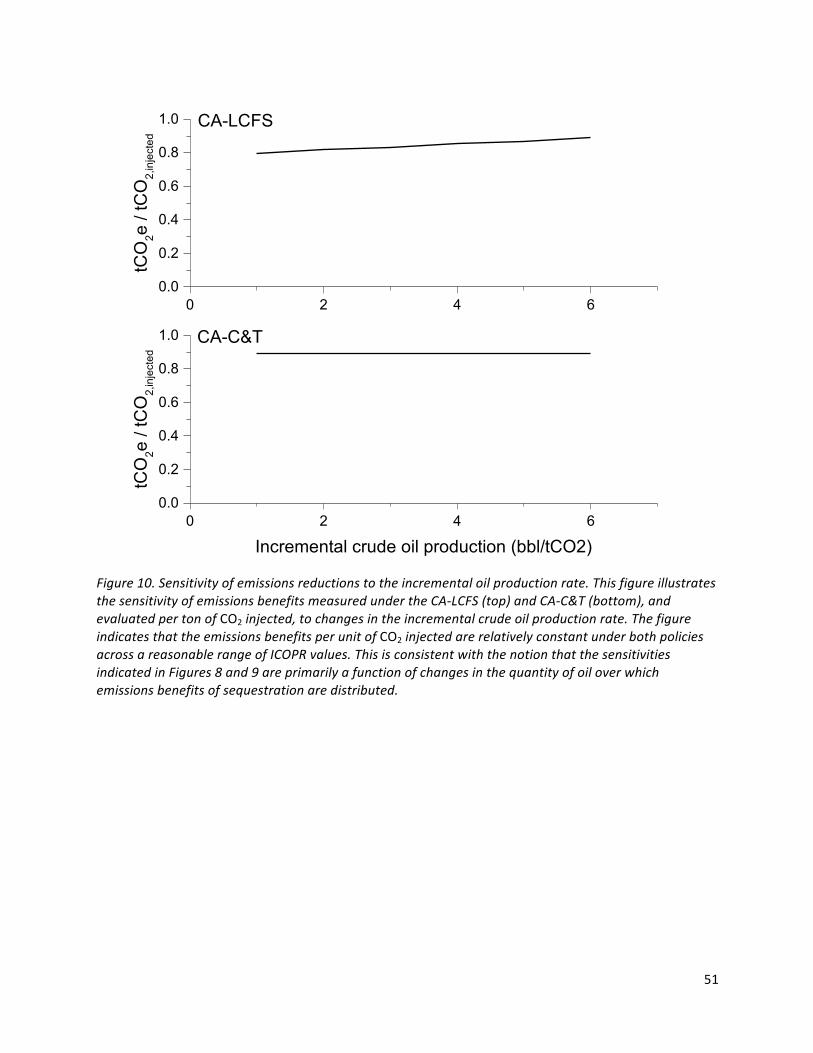
51
Figure 10. Sensitivity of emissions reductions to the incremental oil production rate. This figure illustrates the sensitivity of emissions benefits measured under the CA-‐LCFS (top) and CA-‐C&T (bottom), and evaluated per ton of CO2 injected, to changes in the incremental crude oil production rate. The figure indicates that the emissions benefits per unit of CO2 injected are relatively constant under both policies across a reasonable range of ICOPR values. This is consistent with the notion that the sensitivities indicated in Figures 8 and 9 are primarily a function of changes in the quantity of oil over which emissions benefits of sequestration are distributed.
0 2 4 60.0
0.2
0.4
0.6
0.8
1.0
tCO
2e /
tCO
2,in
ject
ed
Incremental crude oil production (bbl/tCO2)
CA-C&T
0 2 4 60.0
0.2
0.4
0.6
0.8
1.0tC
O2e
/ tC
O2,
inje
cted
CA-LCFS
52
Policy Discussion The analysis presented in this report suggests that NG-‐CCS-‐EOR—and similar types of CCUS configurations by extension—may be able to substantially contribute to the proximate policy objectives of both C&T and LCFS type policies. It also suggests that the policy incentives provided by C&T and LCFS type policies could translate into meaningful support for CCUS projects. We have also argued that near-‐term CCUS deployments have the potential to make important contributions to long-‐term climate policy objectives, as well as well as to the proximate objectives of the C&T and LCFS. However, in developing this analysis it has become clear that a number of key policy issues need to be resolved before these various potential contributions can be realized. Some of these issues are common to both policy frameworks, while others are more policy-‐specific. This section provides a discussion of the key policy issues identified through the process of developing this analysis. Issues that appear to be common across both the C&T and LCFS frameworks are discussed first. This is followed by a discussion of issues that appear to be specific to each framework. Issues common to both policies MRV Measurement, reporting, and verification (“MRV”) refers here to protocols designed to ensure that CO2 injected during CO2-‐EOR operations is effectively sequestered and that long-‐term leakage rates are less than or equal to those assumed in the emissions accounting used for policy compliance purposes. In simple terms, MRV might be viewed as a system and process for ensuring that the CO2 injected underground stays there, at least as much as the emissions accounting says it will. It ensures that regulated parties and covered entities do not get more credit for avoided emissions than is warranted, given the actual performance of sequestration reservoirs. MRV is important for effectively regulating NG-‐CCS-‐EOR—or other CCUS configurations—under either the C&T and LCFS frameworks. This is because emissions accounting under both frameworks assumes that some fraction of the CO2 injected during CO2-‐EOR operations is effectively sequestered away from the atmosphere for timescales relevant to the climate problem. Absent some appropriate system for MRV, there can be no assurance that the emissions profiles indicated in this (or any other) accounting are actually being realized. In addition to providing some assurance that emissions reductions are actually achieved in practice, MRV protocols for proximate CCUS projects have the potential to provide useful data and technical understanding to improve protocols and expectations for future deployments. Uncertainty is inherent to most systems associated with climate policy objectives, and it is certainly the case for fluid dynamics in geologic formations far below the surface over timescales relevant to the climate problem. Initial CO2 injection projects have added considerably to our understanding of geologic sequestration (Bowden, Pershke and Chalaturnyk 2013). Similarly, proximate CCUS projects have the potential to contribute useful data and

53
technical understanding to inform expectations for future sequestration projects and to inform the design of future MRV protocols. While effective MRV protocols are important for enabling proximate CCUS deployments, these are not unique to CCUS. Appropriate protocols will be required for any system that includes geologic sequestration of CO2. Protocols developed for proximate CCUS deployments should arguably have similar requirements—or be designed to achieve similar objectives—as those developed for other types of CO2 injection projects, including projects incorporating dedicated CO2 sequestration (i.e., projects in which CO2 is injected only for sequestration benefits and not for enhanced oil recovery). Methane leakage Methane leakage during natural gas production has emerged as an important source of GHG emissions and is the subject of substantial ongoing research (Allen, et al. 2013) (Miller, et al. 2013). It has the potential to substantially impact the emissions profile of natural gas production, and therefore the emissions profile of all systems that use natural gas. In the context of the current analysis, methane leakage can substantially affect the system-‐wide emissions profile of NG-‐CCS-‐EOR systems under C&T as well as carbon intensity values defined under the LCFS. Recent analyses suggest that methane leakage can vary dramatically across natural gas supplies (Allen, et al. 2013). As a result, understanding the extent of methane leakage, or risks of methane leakage, from natural gas sources supplying CCUS deployments will be important for ensuring appropriate policy treatment under C&T and LCFS frameworks. Like MMV protocols, methane leakage is not unique to CCUS. It is an issue for all types of projects using natural gas. In fact, to the extent that CCUS projects using natural gas are viewed as a substitute for conventional natural gas projects (e.g., natural gas with CO2 capture is employed as a substitute for natural gas without CO2 capture), then methane leakage may not have a large effect on the net emissions benefits of CCUS. It will affect total emissions, but the impact of methane leakage should be similar for conventional and CCUS systems (except for the efficiency reduction associated with CO2 capture). As a result, while methane leakage is important to resolve in general, it should have a limited impact on the net reduction in GHG emissions resulting from CCUS systems. Moreover, methane leakage is not an issue for CCUS projects that use fuels other than natural gas (e.g., projects using CO2 derived from biomass or coal). Double counting The C&T and LCFS policies are structured as parallel, overlapping policies that are designed to play complementary roles in advancing key climate policy objectives. They are parallel in the sense that they can be implemented concurrently within the same jurisdiction, as they have been in California; however, they are generally not integrated or linked in their implementation and they have several distinguishing features, reflecting their respective roles within a climate policy portfolio.
54
C&T and LCFS policies are overlapping in the sense that emissions sources related to transportation fuel supplies may be measured and regulated under both policies. For example, emissions from oil refinery stacks will be counted toward the refinery’s annual compliance obligation under the C&T program and will contribute toward the CI of resulting CARBOB and diesel fuels under the LCFS. As a result, reductions in emissions from oil refinery stacks (e.g., by capturing and sequestering associated CO2 in approved geologic reservoirs) will reduce total annual emissions and compliance obligations under the C&T program and will reduce refinery contributions to fuel CI under the LCFS. This dynamic has precipitated some concerns regarding “double counting” of emissions reductions. There are, however, a number of reasons to think that it is appropriate for emissions reductions from sources that are regulated under both policies be recognized in both policies. Note that the approach described here is consistent with recommendations from recent analysis of a potential national LCFS policy (Yeh, Sperling and Griffin, et al. 2012) (see page 62) and with statements made by CARB staff at a workshop on the CA-‐LCFS held on March 11, 2014. These statements were later clarified through correspondence with Michael Waugh, of CARB, who stated:
“A California facility—refinery, biofuel production facility, large crude oil field, etc.—that is subject to cap-‐and-‐trade and is part of the life cycle analysis for the LCFS can reduce its GHG emissions and receive benefits from both programs. Getting credit from two programs is not double-‐counting. In fact, cap-‐and-‐trade and the LCFS are complementary measures.” (Waugh 2014)
Concerns regarding potential double counting of emissions benefits are straightforward and intuitively appealing. The basic logic is that recognizing a single unit of emissions reduction separately under two overlapping climate policies gives “credit” twice for the same unit of emissions reduction. Accordingly, a 1 ton reduction would receive 2 tons of “credit” (e.g., 1 ton under C&T and 1 ton under the LCFS). Such “double counting” might be argued to be inappropriate because it provides outsized benefits to projects at the intersection of the overlapping policies, thereby skewing the allocation of available capital resources and decreasing the economic efficiency of emissions reduction. Double counting may also be viewed as complicating the accounting of total emissions reductions generated across the climate policies (although, this administrative challenge is inherent to overlapping policies in general). Perhaps the most the most fundamental reason why it may be appropriate to recognize emissions reductions under both policies is because this would appropriately reflect contributions of a particular activity toward the complementary objectives of two distinct, but overlapping policy instruments—one that aims to cap absolute emissions and one that aims to both reduce emissions and specifically stimulate the innovations required to drive down fuel carbon intensities. In principle, it might be preferable to avoid creating overlapping policies that give rise to “double counting” concerns; however, such situations are not uncommon when activities advance multiple, related policy objectives (e.g., wind power can advance compliance

55
with both renewable portfolio standards and limits on criteria pollutant emissions in the electric sector). In this context, it is not immediately apparent how the objectives of C&T and LCFS-‐type policies might both be effectively advanced without overlapping treatment of some emissions sources. A more intuitively straightforward reason why emissions reductions from sources regulated under both C&T and LCFS-‐type policies should be recognized under both policies is that positive emissions from these sources are counted under both policies. In other words, if crediting emissions reductions under both policies is viewed as double counting, then such double counting of reductions is appropriate because the (positive) emissions themselves are being “double counted” under the two policies. In other words, double counting of emissions reductions from certain sources is only possible if their positive emissions are also being double counted7. By extension, ignoring emissions reductions under one policy (e.g., the C&T program) because it is recognized under another (e.g., the LCFS) would create a situation where emissions are regulated according to hypothetical emissions profiles, rather than actual, measurable emissions. A policy that ignores measureable emissions reductions would necessarily define regulatory compliance according to something other than actual atmospheric emissions. It is not intuitively obvious how such emissions accounting could be defined in practice, and adopting hypothetical emissions as a basis for regulation would substantially compromise the policy’s scientific basis and credibility. At a more technical level, it is worth noting that concerns about double counting are based in part on the notion that the “credit” provided under the two policies is somehow equivalent, which is not the case for the LCFS and C&T programs. LCFS deficits and C&T compliance obligations are measured in different ways, are realized in different ways, and represent fundamentally different things. C&T obligations represent discrete quantities of emissions that have been directly emitted from a covered source in a particular year. One ton of compliance obligation equates to exactly one ton of CO2e emissions from a specified source. In contrast, LCFS deficits & credits represent the difference between a policy-‐determined regulatory value and an emissions rate—measured across all sources in the fuel’s lifecycle—integrated over a quantity of fuel. One ton of LCFS credits may not correspond directly with one ton of emissions reductions from a particular emissions source. Similarly, a one ton emissions reduction from a particular source may or may not translate into one metric ton of LCFS credits, depending on how that emissions source relates to the fuel lifecycle. Because the accounting systems used by these two policies are so fundamentally different, and because there is no equivalence between emissions obligations under the two policies, there is technically no “double counting” of emissions or emissions reductions under the two policies.
7 NB, arguments that such double counting exists at all ignore the fundamentally different ways in which emissions are quantified, attributed, and regulated under the two policies, the joint effect of which implies that emission accounting represents fundamentally different measures under these two parallel and complementary policies, as discussed above.
56
For these reasons, while it may be preferable to avoid policies that raise concerns about “double counting”, it appears to be appropriate that emissions reductions from sources regulated under both C&T and LCFS-‐type policies be recognized under both policy frameworks. C&T-‐specific issue: where should the emissions reduction be recognized? The C&T policy framework generally regulates emissions according to the aggregate quantity of GHG emitted directly to the atmosphere from covered entities. Because such emissions can typically be measured and specified directly, defining the compliance obligation is generally straightforward. There are, however, three exceptions built into California’s implementation of C&T, the combined effect of which suggests that the regulatory language supports at least four options for allocating the emissions benefit of sequestered CO2 among the covered entities. This raises an important policy design question regarding which covered entity should recognize the emissions benefits of sequestered CO2. A discussion of the four options that appear to be supported by the regulatory language along with some of the policy tradeoffs associated with each is provided below and summarized in Table 4. As noted above, the CA-‐C&T program includes three exceptions to the use of direct emissions to the atmosphere as the as the basis for compliance obligations, which together support multiple options for assigning the emissions benefit of CO2 sequestered via NG-‐CCS-‐EOR or CCUS more generally. The first of these exceptions is that compliance obligations for CO2 suppliers appear to depend on the intended use of the CO2 supplied. In particular, the Final Regulation Order specifies that a CO2 supplier retains compliance obligations for all CO2 delivered for use as an input to an industrial process (§ 95852(g), § 95802(a)(45))8. In contrast, a supplier of CO2 to a process that has been “. . .verified to be geologically sequestered through use of a Board-‐approved carbon capture and geologic sequestration quantification methodology. . .” is subtracted from the CO2 supplier’s compliance obligation (§ 95852(g)).
8 Unless otherwise indicated, references in this section are to Subchapter 10. Climate Change, Article 5. of Title 17 in the California Code of regulations available at: http://www.arb.ca.gov/cc/capandtrade/ctlinkqc.pdf

57
Table 4. Policy considerations alternatives for recognizing emissions benefits under C&T.
Policy design considerations
Policy Scenario (Covered entity recognizing C&T benefit of sequestered CO2 )
CO2 producer Oil producer Refinery Reflects physical carbon flows?
Yes Reflects atmospheric emissions from the
power plant.
Yes Reflects injection of CO2 into geologic formations for sequestration.
Partially Reflects that fuel carbon in crude is
partially balanced by CO2 sequestered during production (analogous
to fuel carbon in biofuels).
Aligns incentive with CO2 capture investments?
Yes No No
Aligns incentive with CO2 sequestration and MRV obligations?
No Yes Partially Aligns incentive with oil
supplies, which correspond with MRVs
more closely than initial injection.
Enables consolidated reporting and enforcement under C&T and LCFS?
No Maybe Depends on
implementation of proposed
amendments.
Maybe Depends on
implementation of proposed
amendments. In this context, the appropriate treatment of CO2 supplied for sequestration via CO2-‐EOR operations appears to hinge on whether CO2-‐EOR is interpreted as an industrial process or as a method of CO2 sequestration, for which a “Board-‐approved carbon capture and geologic sequestration quantification methodology” is established. If CO2-‐EOR is interpreted to comprise an industrial process (or if a Board-‐approved quantification methodology is not established), then the CO2 supplier (e.g., operator of a natural gas power plant with CO2 capture) would arguably retain compliance obligations for CO2 supplied. On the other hand, if CO2-‐EOR represents an approved method of CO2 sequestration (with an approved quantification methodology), then the CO2 supplier (e.g., power plant) could subtract the quantity of CO2 supplied for EOR from its compliance obligation. This interpretation supports recognition of C&T policy benefits for sequestered CO2 by the CO2 supplier (e.g., the power plant). From a policy perspective, there are trade-‐offs associated with regulatory treatment. On the one hand, this treatment would provide policy incentives (i.e., reduced compliance obligations) to the party responsible for investments in CO2 capture, which (along with pipeline infrastructure costs) represent the dominant costs for deployment. This may be important for supporting such capital investments. This also appears to be consistent with the proposed carbon pollution rules for power plants, which determines compliance with emissions
58
standards “exclusively by the tons of CO2 captured [and emitted] by the emitting [entity]” (79 FR 1483). On the other hand, this regulatory approach moves the policy incentives away from the point of sequestration, away from the party responsible for both ensuring that captured CO2 is not emitted to the atmosphere and for documenting this via implementation of MRV protocols. If CO2 suppliers retain compliance obligations for CO2 delivered for EOR, then an alternate approach would be for emissions benefits of CO2 sequestration to be realized by the oil producer. A benefit of this regulatory treatment is to provide policy incentives to the entity responsible for injecting CO2 underground, thereby avoiding its emission to the atmosphere, and for implementing MRV protocols to document effective sequestration. This may be important for supporting effective CO2 recycling, sequestration, and MRV investments. In this case, the financial value of policy incentives realized by CO2-‐EOR operators could be transmitted to CO2 suppliers that install and operate CO2 capture equipment on industrial emissions (e.g., power plants with CO2 capture) through the prices paid for CO2. A key challenge associated with this approach is that it can yield negative compliance obligations for the crude oil producer, as indicated in Figure 5. This could be achieved by, for example, issuing emissions offsets to CO2-‐EOR operators in proportion to the quantity of CO2 sequestered; however, this introduces some additional complexity from a policy perspective. Emissions offsets are generally used to account emissions reductions from non-‐covered sources, rather than accounting for changes in atmospheric emissions from covered sources. Moreover, issuing emissions offsets requires a separate approval process, which has proved itself to be relatively complex. In this case, all parties to NG-‐CCS-‐EOR deployments are covered entities with measurable atmospheric emissions. It may be deemed inappropriate for the compliance obligations of these entities to be contingent upon a separate process for approving emissions offsets, rather than determined on the basis of measureable emissions. As a practical matter, requiring CCS-‐EOR projects to obtain additional approvals required for offset generation (in addition to those already required for quantification of CO2 sequestration, for example) could create additional burdens for deployment and thereby discourage adoption. A third option for treating the emissions benefits of NG-‐CCS-‐EOR (and related CCUS systems) is for the refinery to recognize the reduced emissions. This option stems from two other exceptions regarding the assignment of compliance obligations according to direct emissions from covered sources. The first of these is that, beginning in 2015, fuel suppliers (e.g., oil refineries) have compliance obligations for the carbon contained in fuels they supply to non-‐covered entities. This provision enables the emissions cap to cover distributed emissions from fuel combustion without requiring direct regulation of distributed fuel consumers. The second additional exception is that emissions from biofuel combustion—including both solid biomass used for power generation and liquid biofuels used for transportation—do not contribute to compliance obligations under the CA-‐C&T policy. Biofuel combustion does produce CO2 emissions, but these emissions are not counted toward compliance obligations—presumably because the carbon contained in biofuels was recently removed from the atmosphere via photosynthesis during biomass production and is part of the active carbon cycle. Note that the
59
C&T program specifically does not adopt a lifecycle emissions accounting framework, which would arguably recognize both the biogenic nature of combustion emissions and the fossil carbon emissions associated with biofuel production and supply. That being said, the emission accounting adopted under this provision does seem to reflect the notion that biogenic CO2 emitted during biofuel combustion is balanced by CO2 sequestered during feedstock production. This is in some ways analogous to the notion that the fossil carbon removed from geologic formations (e.g., carbon contained in crude oil) is at least partially balanced by CO2 sequestered via EOR operations. Taken together, these two additional exceptions could arguably support a regulatory approach in which the CO2 sequestered during EOR is reflected in the compliance obligations oil refineries processing resulting crude oil. This approach rests on two key concepts: (i) that refineries have compliance obligations for the carbon content of petroleum fuels (beginning in 2015); and (ii) that carbon contained in petroleum fuels is partially balanced by CO2 sequestered during feedstock (i.e., crude oil) production via CO2-‐EOR. As with the other regulatory approaches, there are trade-‐offs associated with recognizing the emissions benefit of sequestered CO2 in refinery compliance obligations. This regulatory approach has the benefit of avoiding negative compliance obligations, as it appears unlikely for CO2 sequestered via EOR to exceed the CO2 emitted directly from refineries plus CO2 released via combustion of petroleum fuels. As noted above, negative compliance obligations could be recognized by issuing emissions offsets for sequestered CO2 ; however, this would involve a separate regulatory process established for approving offsets, which has proven itself to be complex and controversial, and may not be appropriate for defining compliance obligations of regulated entities. It also has the administrative benefit of consolidating reporting for CO2 injection under the C&T and LCFS programs. Under the LCFS, the relevant regulated party is the oil refinery. As a result, the refinery will be required to provide detailed reporting of CO2 injection and MRV compliance to justify receiving associated LCFS credits. If the emissions benefits of CO2 injection under the C&T program were also recognized at the refinery, than a single channel for reporting could satisfy the requirements under both policies. This potential advantage may change if and when program amendments are adopted that enable the crude oil producers to generate LCFS credits for crude produced using innovative methods of crude production. Such amendments have been proposed and may be included in package of amendments planned to be submitted for Board review later this year (CARB 2014). A potential downside of recognizing the emissions benefits of CO2 sequestration in the compliance obligations of the refinery is that the refinery is not directly engaged in either CO2 capture or sequestration. This may cause the resulting policy incentive to be somewhat indirect. In principle, it should make no difference where in the production system the emissions benefits are recognized. If the benefits are recognized by the CO2 producer, then the reduced compliance obligation associated with their co-‐products should provide financial incentives to support CO2 capture, effectively subsidizing the supply of captured CO2 to the EOR
60
operator. If the benefits are realized by the oil producer, then the reduced compliance obligations &/or issuance of emissions offsets should enable payment of a higher price for captured CO2, thereby compensating the power plant for installing and operating CO2 capture equipment. If the benefits are realize by the refinery, then the reduced compliance obligation should enable payment of a higher price for crude oil produced with CO2 from the power plant, and financial benefits should be transmitted up the supply chain to compensate the power plant for capturing the CO2 and the oil producer for implementing MRV protocols. This assumes efficient markets for CO2 and crude oil, which may not always be the case. In practice, covered entities are expected to have strong preferences regarding where the benefits are realized. A fourth option for realizing the emissions benefits of sequestered CO2 is to require that the covered entities enter into a contractual arrangement, in which the policy benefits are either shared across the entities or assigned to a third party that is able to ensure that the emissions benefits are realized and documented. This option would allow the covered entities to resolve amongst themselves the most appropriate assignment of policy benefits and responsibilities for MRV protocols. This appears to be a reasonable approach prima facie; however, substantive consideration of its relative merits are beyond the scope of the current discussion. Detailed discussion with CARB staff is recommended to resolve this policy issue before NG-‐CCS-‐EOR (or similar CCUS systems) are deployed. LCFS-‐specific issue: which comparison baseline is appropriate? As noted above, the CA-‐LCFS enables refineries to generate LCFS credits in proportion to the CI benefits crude oil produced via “innovative methods of crude oil production”, and CI benefits are measured relative to a “comparison baseline” production method. Determining the appropriate comparison baseline production method is therefore central to resolving the appropriate policy treatment of NG-‐CCS-‐EOR, and other CCUS configurations. Three alternate comparison baseline methods are considered in this analysis: “conventional” crude oil production; the “California average” mix of crudes; and TEOR. These alternatives are intended to reflect alternate assumptions about the method(s) of crude oil production that would be displaced. All thre reflect three key factors: (i) NG-‐CCS-‐EOR is assumed to be deployed in California; (ii) the crude is assumed to be supplied to California refineries; and (iii) the regulatory intent (expressed by CARB staff) that the comparison baseline represent the method of crude oil production for which the “innovative method” is a substitute. NG-‐CCS-‐EOR would be used to produce crude from reservoirs that are specifically amenable to production via CO2-‐EOR, which has not been used commercially in California. This complicates identification of a single, definitive comparison baseline production method that is consistent with the regulatory intent, as indicated by CARB staff. Instead, it may be reasonable to assume that crude from NG-‐CCS-‐EOR would displace either crude imports to California or other production methods that are capable of expanding production within California. This assumption is reasonable as long as NG-‐CCS-‐EOR production does not affect crude oil prices—which are generally tied to global markets—and therefore does not affect refinery demand.
61
Crude imports to California include substantial quantities of crude produced using “conventional” production methods. This represents the lowest carbon intensity production methods and therefore provides a reasonable lower bound for the appropriate “comparison baseline” production method. If other methods for increasing California production are assumed to be displaced, then TEOR may be viewed as providing an appropriate “comparison baseline” production method. TEOR is among the highest carbon intensity production methods available, and therefore represents a reasonable upper bound for the carbon intensity of the “comparison baseline” production method. Alternatively, if the crude oil production method displaced by NG-‐CCS-‐EOR in California cannot be defined with sufficient certainty, adopting the “California average” crude CI appears to be a logical and justifiable option. Each of these “comparison baselines” appear to be justifiable, and together they provide a reasonable range of CI values for defining the net benefit of deploying NG-‐CCS-‐EOR. The potential scale of LCFS credit generation by CCS-‐EOR may also be a relevant policy consideration. In theory, a rapid scale-‐up of CCS-‐EOR could create an oversupply of LCFS credits, drive down LCFS credit prices, and reduce LCFS policy incentives for other types of low carbon fuels. The potential scale of credit generation can be dialed up or down by choosing alternate comparison baseline production methods as shown in Table 3 and Figure 9(F), and thus the choice of baseline will impact incentives for both CCS-‐EOR and other types of low carbon fuels. On the other hand, the structure of LCFS-‐type policies as technology neutral performance standards reflects the intent to leverage market forces to advance a broad portfolio of low carbon fuels without picking winners or losers. Curtailing contributions from any technology that delivers legitimate reductions in fuel CI implies a hidden or secondary agenda for LCFS-‐type policies, which can increase compliance costs. Also, an LCFS program (on its own or combined with C&T) that gave sufficient credit to CCS-‐EOR could stimulate a rapid ramp-‐up in CCS deployments, thus enabling this option within California’s energy future. These various considerations suggest that a thoughtful policy discussion is warranted before concerns regarding the potential scales of LCFS credit generation are reflected in the policy treatment of CCS-‐EOR under LCFS-‐type programs. As well, the concern that CCS-‐EOR deployments could upset LCFS credit markets might be overblown. Other low carbon fuels would only be substantially impacted if credit prices drop dramatically. This would likely require rapid deployment of multiple large-‐scale CCS-‐EOR projects—representing several million tons of CO2 capture per year by 2020, for example. Such a pace of deployment remains unlikely because CCS-‐EOR projects are complex, capital intensive, challenging to permit, and are characterized by substantial regulatory and market uncertainty. Moreover, assuming LCFS credits provide meaningful incentives for deployment, market dynamics should help moderate the impact of CCS-‐EOR on LCFS credit prices. For example, the capital intensity and risk profile of CCS-‐EOR should arguably motivate developers—and financing sources—to adopt a conservative approach that avoids flooding associated credit markets. CCS-‐EOR developers would find it difficult to attract the capital required for projects that could overwhelm LCFS credit markets and thereby compromise their own financial returns.

62
California needs clarity on policy goals to resolve the choice of the appropriate comparison baseline production method for CCS-‐EOR. These policy considerations are specifically a function of California’s approach to “innovative methods” under the CA-‐LCFS. Other LCFS-‐type policies may not face these policy questions in defining the treatment of CCS-‐EOR; however, clarity on policy goals is important for ensuring coherent implementation of any LCFS-‐type regulation.
63
References
Allen, David T., et al. "Measurements of methane emissions at natural gas production sites in the United States." PNAS (National Academy of Sciences of the United States of America), 2013.
ARI. U.S. Oil Production Potential From Accelerated Deployment of Carbon Capture and Storage. White Paper, Arlington, VA: Advanced Resources International, Inc., 2010.
Bowden, Adrian R., Donna F. Pershke, and Rick Chalaturnyk. "Geosphere risk assessment conducted for the IEAGHG Weyburn-‐Midale CO2 Monitoring and Storage Project." International Journal of Greenhouse Gas Control, 2013: S276-‐S290.
CARB. "Calculation of 2013 Crude Average CI Value." Sacramento: California Air Resources Board, June 19, 2014.
CARB. Climate Change Scoping Plan A Framework For Change. Pursuant to AB 32 The California Global Warming Solutions Act of 2006, Sacramento California: California Air Resources Board, 2008.
CARB. Detailed CA-‐GREET Pathway for California Reformulated Gasoline Blendstock for Oxygenate Blending (CARBOB) from Average Crude Refined in California. Sacramento, CA: California Air Resources Board, 2009.
CARB. Detailed California-‐Modified GREET Pathway for Conversion of Midwest Soybeans to Biodiesel (Fatty Acid Methyl Esters-‐FAME). Sacramento, CA: California Air Resources Board, 2009.
CARB. Issues Related to Accounting for Co-‐Product Credits in the California Low Carbon Fuel Standard. White Paper, Sacramento, CA: California Air Resources Board, 2010.
—. Low Carbon Fuel Standard Computation Modeling Software. October 2, 2013. http://www.arb.ca.gov/fuels/lcfs/software.htm (accessed March 3/24/2014, 2014).
—. "Low Carbon Fuel Standard Re-‐Adoption Concept Paper." Sacramento, CA: California Air Resources Board, March 2014.
—. "Low Carbon Fuel Standard Rulemaking (Staff Presentation)." Sacramento, CA: California Air Resources Board, July 10, 2014.
—. "Low Carbon Fuel Standard Rulemaking (Staff Presentation)." Sacramento, CA: California Air Resources Board, April 18, 2014.
CARB. Proposed Amendments to the Low Carbon Fuel Standard. Staff Report: Initial Statement of Reasons for Proposed Rulemaking, Sacramento, CA: California Air Resources Board, 2011.
Edwards, Robert, Heinz Hass, Jean-‐Francois Larive, Laura Lonza, Heiko Maas, and David Rickeard. Well-‐to-‐Wheels Report Version 4.a. JRC Technical Reports, Fermi, Italy: European Commission, Joint Research Center, 2014.
EIA. Assumptions to the Annual Energy Outlook 2013. Washington, D.C.: U.S. Department of Energy, 2013.

64
Jarmallo, Paulina, Michael W Griffin, and Sean T McCoy. "Life Cycle Inventory of CO2 in an Enhanced Oil Recovery System." Environ. Sci. and Technol. (American Chemical Society), 2009: 8027-‐8032.
Khoo, Hsien H., and Reginald H. B. Tan. "Life Cycle Investigation of CO2 Recovery and Sequestration." Environ. Sci. Technol. (American Chemical Society), 2006: 4016-‐4024.
Kuuskraa, Vello A., Tyler Van Leeuwen, and Matt Wallace. “Improving Domestic Energy Security and Lowering CO2 Emissions with "Next Generation" CO2-‐Enhanced Oil Recovery (CO2-‐EOR). Research Report, PIttsburgh, PA: National Energy Technology Laboratory, 2011.
Long, Jane C. S. (co-‐chair). California’s Energy Future: The View to 2050 Summary Report. Sacramento, CA: California Council on Science and Technology, 2011.
Metz, Bert, Ogunlade Davidson, Heleen de Coninck, Manuela Loos, and Leo Meyer. Carbon Dioxide Capture and Storage. Special Report, IPCC, Cambridge, UK: Cambridge University Press, 2005, 431.
Miller, Scot M, et al. "Anthropogenic emissions of methane in the United States." PNAS, 2013.
Waugh, Michael, interview by James Rhodes. Branch Chief, Transportation Fuels Branch Chief, California Air Resources Board (March 25, 2014).
Wilson, M., and M. (eds) Monea. "IEA GHG Weyburn CO2 monitoring and storage project summary report 2000-‐2004." 7th International Conference on Greenhouse Gas Control Technologies. Vancouver, Canada, 2004. 273.
Yeh, Sonia, and Daniel Sperling. "Low Carbon Fuel Standards." Issues in Science and Technology, 2009: 57-‐66.
Yeh, Sonia, and Daniel Sperling. "Low carbon fuel standards: Implementation scenarios and challenges." Energy Policy, 2010: 6955–6965.
Yeh, Sonia, et al. National Low Carbon Fuel Standard: Policy Design Recommendations. Research Report, Davis, CA: Institute of Transportation Studies, University of California, Davis, 2012.