{electrochemical analysis of indigo carmine using
TRANSCRIPT
http://dx.doi.org/10.5599/jese.953 87
J. Electrochem. Sci. Eng. 11(2) (2021) 87-96; http://dx.doi.org/10.5599/jese.953
Open Access: ISSN 1847-9286
www.jESE-online.org Original scientific paper
Electrochemical analysis of indigo carmine using polyarginine modified carbon paste electrode
D’Souza S. Edwin1,2, Jamballi G. Manjunatha1,, Chenthattil Raril1, Tigari Girish1, Doddarasinakere K. Ravishankar3 and Huligerepura J. Arpitha4 1Department of chemistry, FMKMC College, Madikeri, Constituent College of Mangalore University, Karnataka, India 2Department of Chemistry, St. Philomena College, Puttur, Karnataka, India 3Department of Chemistry, Sri. Mahadeshwara Govt. First Grade College, Kollegal, Chamarajanagar, Karnataka, India 4Department of Physics, Sri Adichunchanagiri First Grade College, Channarayapatna, India
Corresponding author: [email protected]; Tel.: +91- 08272228334
Received: January 13, 2021; Revised: March 18, 2021; Accepted: March 29, 2021
Abstract Suitable electrocatalytic method is established for the selective determination of indigo carmine (IC) at polyarginine modified carbon paste electrode (PAMCPE). Surface morphological study of bare carbon paste electrode (CPE) and PAMPCE is done by field emission scanning electron microscopy (FESEM). The influence of different parameters such as IC concentration, solution pH and potential scan rate on the electrode responses is studied using cyclic and differential pulse voltammetry techniques. The prepared PAMCPE shows better electrochemical response towards IC than CPE. No interference is noticed at simultaneous presence of IC and riboflavin (RF) in the solution. The electrocatalytic current of IC at PAMPCE is varied linearly with its concentration in two separate ranges, from 2×10⁻⁷ to 10-6 M, and 1.5×10⁻⁶ to 3.5×10⁻⁶ M. Limits of detection (LOD) and quantification (LOQ) are determined as 2.53×10⁻⁸ and 8.43×10⁻⁸ M, respectively. The developed PAMCPE is showing successful reproducibility and stability. It is also found sensitive and reliable for trace amounts of IC in some real water and food samples. Since preparation of PAMCPE sensor is simple and easy, it could become a part of the standard method for determination of IC in real samples.
Keywords Carbon paste; electropolymerization; food dye; real samples; cyclic voltammetry; differential pulse voltammetry

J. Electrochem. Sci. Eng. 11(2) (2021) 87-96 ANALYSIS OF INDIGO CARMINE
88
Introduction
Dyes are the colored compounds of either synthetic or natural origin. Synthetic dyes are used in
various industries like printing textiles, paint, cosmetics, pulp, and even in food industry [1]. Their
degradation products are highly poisonous and dangerous to all living beings [2]. Indigo carmine
(IC) (5,5′ indigodisulphonic acid sodium salt) is one such dyes used in cosmetic industry [3], food
industry and in coloring of polyester fibers [4,5]. It is toxic in nature and can cause diarrhea and
vomiting in human beings [6]. In analytical chemistry IC is used as redox indicator [7], food
colorant, and in biology as microscopic stain [8]. The textile industry releases waste-water
containing significant amounts of non–biodegradable dyes [9,10]. These dyes are carcinogenic and
their removal from the industrial effluents is of the major environmental concern [11]. IC is also
utilized in medical diagnosis apart from its use as an additive in pharmaceutical tablets and
capsules [12]. Presence of IC in environment and real samples has to be traced, because IC
ingestion can affect the liver, central nervous system, kidneys and eyes [13,14]. Therefore, it is
proposed obligatory to identify the concentration of IC in a variety of natural samples. Hence, a
susceptible and selective procedure for determination of IC would be of immense significance.
Variety of investigative methods have been selected for the identification of synthetic dyes, such
as high-performance liquid chromatography with UV-Vis, spectrophotometry, stripping voltammetry
capillary electrophoresis, UV-DAD or MS detectors [15-19]. Recently, the cyclic voltammetric
technique was introduced for procuring information regarding the electrochemical reactions
qualitatively and quantitatively. CV provides a lot of information concerning thermodynamics and
kinetics of redox reactions [20-25]. Different electrodes were already applied to explore the
performance of IC [26-27]. Among them, carbon paste electrode in its unmodified or modified form
is frequently used to establish the performance of several chemical compounds, including
electrochemical behavior of IC [28-30].
The purpose of this work is to deploy a better and easier voltammetric method for the
assessment of IC. By using polymer modified carbon paste electrode, a direct, perceptive, prompt
and entirely validated method, based on the voltametric response and oxidation mechanism of IC
is intended to be derived. The oxidation mechanism of IC is shown in scheme 1.
Scheme 1. Structure and oxidation reaction mechanism of IC
Experimental
Reagents
Arginine and indigo carmine were purchased from Molychem, Mumbai, India. Graphite
(150 mesh, loss on drying = 0.5 % at 120 oC, residue on ignition = 1 % at 800 oC), monosodium
E. S. D’Souza et al. J. Electrochem. Sci. Eng. 11(2) (2021) 87-96
http://dx.doi.org/10.5599/jese.953 89
dihydrogen phosphate, disodium hydrogen phosphate, silicone oil (kinematic viscosity = 1000 cS,
refractive index = 1.4035) were obtained from Nice Chemicals, Cochin, India. Stock solution of IC
(25×10-5 M) and arginine (25×10-3 M) were made ready in double distilled water. Standard
solutions of 0.1 M monosodium dihydrogen phosphate and 0.1 M disodium hydrogen phosphate
were mixed in intended proportion to get 0.1 M phosphate buffer solution (PBS).
Instrumentation
Electrochemical analyzer CHI-6038E (USA) was used to perform all electrochemical
experiments. Electrochemical cell was the three – electrode system, equipped with either CPE or
PAMCPE as the working electrode, platinum wire as the auxiliary electrode, and standard calomel
electrode (SCE) as the reference electrode. Field emission scanning electron microscopy (FESEM)
from DST – PURSE Laboratory, Mangalore University, was used to investigate morphology of
electrode surfaces. All measurements were done at the laboratory temperature.
Preparation of bare carbon paste electrode (CPE)
Carbon paste was developed by mixing the graphite powder and a binder (silicone oil) in the
proportion of 60:40 (w/w) using a mortar and pestle, until a consistent paste is formed. A segment
of the paste was crammed firmly into the cavity of a Teflon tube having 3 mm inner diameter. The
electrode surface was polished using a tissue paper to get a smoother surface. The electrical
contact was established by connecting a copper wire to the paste end of the tube. The electrode
surface of thus formed carbon paste electrode (CPE) was revived for every measurement.
The surface of CPE was modified by polyarginine forming PAMCPE, which was prepared
according to the electrochemical polymerization procedure described below.
Results and discussion
Preparation of polyarginine modified carbon paste electrode
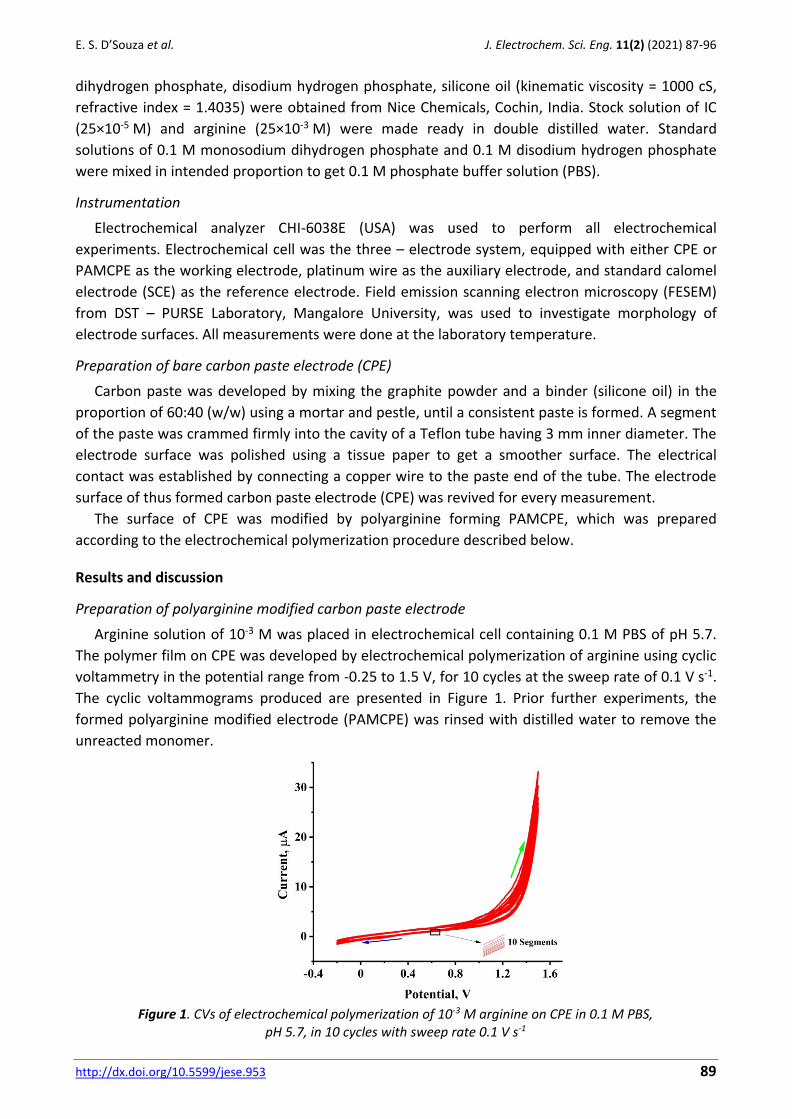
Arginine solution of 10-3 M was placed in electrochemical cell containing 0.1 M PBS of pH 5.7.
The polymer film on CPE was developed by electrochemical polymerization of arginine using cyclic
voltammetry in the potential range from -0.25 to 1.5 V, for 10 cycles at the sweep rate of 0.1 V s-1.
The cyclic voltammograms produced are presented in Figure 1. Prior further experiments, the
formed polyarginine modified electrode (PAMCPE) was rinsed with distilled water to remove the
unreacted monomer.
Figure 1. CVs of electrochemical polymerization of 10-3 M arginine on CPE in 0.1 M PBS,
pH 5.7, in 10 cycles with sweep rate 0.1 V s-1
J. Electrochem. Sci. Eng. 11(2) (2021) 87-96 ANALYSIS OF INDIGO CARMINE
90
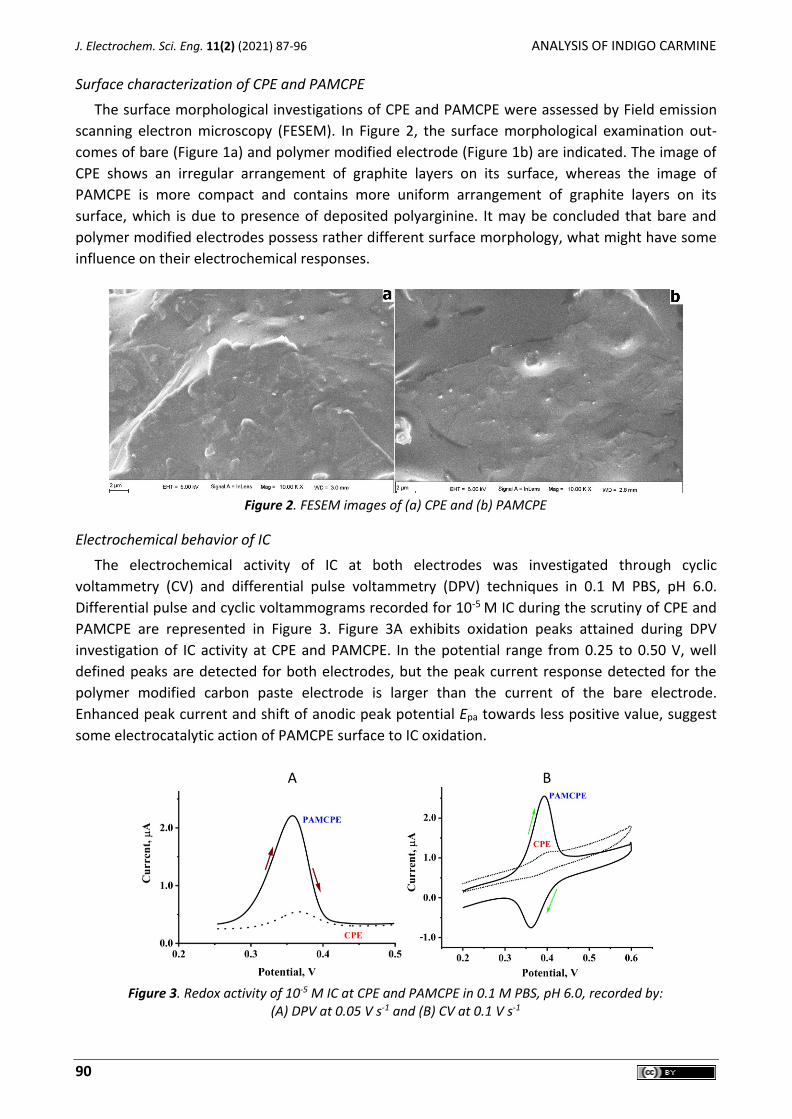
Surface characterization of CPE and PAMCPE
The surface morphological investigations of CPE and PAMCPE were assessed by Field emission
scanning electron microscopy (FESEM). In Figure 2, the surface morphological examination out-
comes of bare (Figure 1a) and polymer modified electrode (Figure 1b) are indicated. The image of
CPE shows an irregular arrangement of graphite layers on its surface, whereas the image of
PAMCPE is more compact and contains more uniform arrangement of graphite layers on its
surface, which is due to presence of deposited polyarginine. It may be concluded that bare and
polymer modified electrodes possess rather different surface morphology, what might have some
influence on their electrochemical responses.
Figure 2. FESEM images of (a) CPE and (b) PAMCPE
Electrochemical behavior of IC
The electrochemical activity of IC at both electrodes was investigated through cyclic
voltammetry (CV) and differential pulse voltammetry (DPV) techniques in 0.1 M PBS, pH 6.0.
Differential pulse and cyclic voltammograms recorded for 10-5 M IC during the scrutiny of CPE and
PAMCPE are represented in Figure 3. Figure 3A exhibits oxidation peaks attained during DPV
investigation of IC activity at CPE and PAMCPE. In the potential range from 0.25 to 0.50 V, well
defined peaks are detected for both electrodes, but the peak current response detected for the
polymer modified carbon paste electrode is larger than the current of the bare electrode.
Enhanced peak current and shift of anodic peak potential Epa towards less positive value, suggest
some electrocatalytic action of PAMCPE surface to IC oxidation.
A B
Figure 3. Redox activity of 10-5 M IC at CPE and PAMCPE in 0.1 M PBS, pH 6.0, recorded by:
(A) DPV at 0.05 V s-1 and (B) CV at 0.1 V s-1
E. S. D’Souza et al. J. Electrochem. Sci. Eng. 11(2) (2021) 87-96
http://dx.doi.org/10.5599/jese.953 91
CV responses of IC at CPE and PAMCPE are represented in Figure 3B. Within the potential from
0.20 to 0.60 V, small redox peaks are observed for CPE at about 0.4 V. For PAMCPE, however,
sensitive and distinct oxidation and reduction peaks appear at 0.394 and 0.361 V, respectively.
Difference in these two peak potential values, ΔEp = 0.33 V, indicates that the redox process of IC
is reversible in nature, involving transfer of two electrons (Scheme 1).
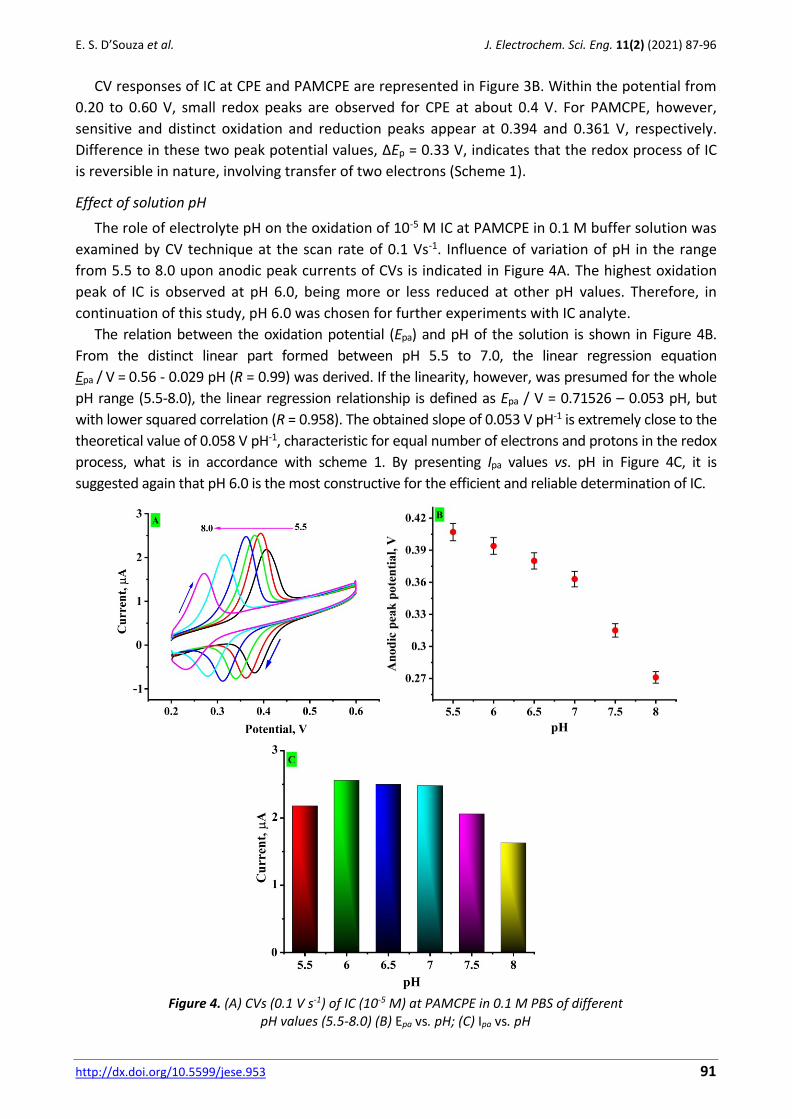
Effect of solution pH
The role of electrolyte pH on the oxidation of 10-5 M IC at PAMCPE in 0.1 M buffer solution was
examined by CV technique at the scan rate of 0.1 Vs-1. Influence of variation of pH in the range
from 5.5 to 8.0 upon anodic peak currents of CVs is indicated in Figure 4A. The highest oxidation
peak of IC is observed at pH 6.0, being more or less reduced at other pH values. Therefore, in
continuation of this study, pH 6.0 was chosen for further experiments with IC analyte.
The relation between the oxidation potential (Epa) and pH of the solution is shown in Figure 4B.
From the distinct linear part formed between pH 5.5 to 7.0, the linear regression equation
Epa / V = 0.56 - 0.029 pH (R = 0.99) was derived. If the linearity, however, was presumed for the whole
pH range (5.5-8.0), the linear regression relationship is defined as Epa / V = 0.71526 – 0.053 pH, but
with lower squared correlation (R = 0.958). The obtained slope of 0.053 V pH-1 is extremely close to the
theoretical value of 0.058 V pH-1, characteristic for equal number of electrons and protons in the redox
process, what is in accordance with scheme 1. By presenting Ipa values vs. pH in Figure 4C, it is
suggested again that pH 6.0 is the most constructive for the efficient and reliable determination of IC.
Figure 4. (A) CVs (0.1 V s-1) of IC (10-5 M) at PAMCPE in 0.1 M PBS of different
pH values (5.5-8.0) (B) Epa vs. pH; (C) Ipa vs. pH
J. Electrochem. Sci. Eng. 11(2) (2021) 87-96 ANALYSIS OF INDIGO CARMINE
92
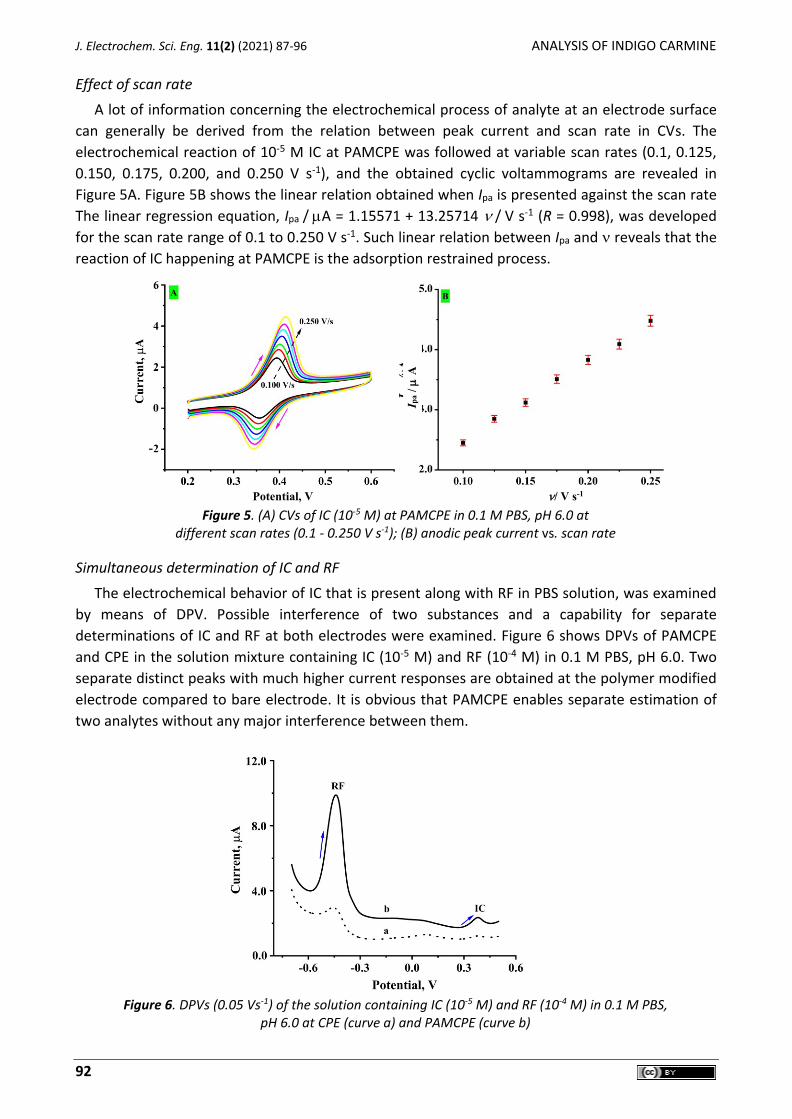
Effect of scan rate
A lot of information concerning the electrochemical process of analyte at an electrode surface
can generally be derived from the relation between peak current and scan rate in CVs. The
electrochemical reaction of 10-5 M IC at PAMCPE was followed at variable scan rates (0.1, 0.125,
0.150, 0.175, 0.200, and 0.250 V s-1), and the obtained cyclic voltammograms are revealed in
Figure 5A. Figure 5B shows the linear relation obtained when Ipa is presented against the scan rate
The linear regression equation, Ipa / A = 1.15571 + 13.25714 / V s-1 (R = 0.998), was developed
for the scan rate range of 0.1 to 0.250 V s-1. Such linear relation between Ipa and reveals that the
reaction of IC happening at PAMCPE is the adsorption restrained process.
Potential, V / V s-1
Figure 5. (A) CVs of IC (10-5 M) at PAMCPE in 0.1 M PBS, pH 6.0 at different scan rates (0.1 - 0.250 V s-1); (B) anodic peak current vs. scan rate
Simultaneous determination of IC and RF
The electrochemical behavior of IC that is present along with RF in PBS solution, was examined
by means of DPV. Possible interference of two substances and a capability for separate
determinations of IC and RF at both electrodes were examined. Figure 6 shows DPVs of PAMCPE
and CPE in the solution mixture containing IC (10-5 M) and RF (10-4 M) in 0.1 M PBS, pH 6.0. Two
separate distinct peaks with much higher current responses are obtained at the polymer modified
electrode compared to bare electrode. It is obvious that PAMCPE enables separate estimation of
two analytes without any major interference between them.
Figure 6. DPVs (0.05 Vs-1) of the solution containing IC (10-5 M) and RF (10-4 M) in 0.1 M PBS,
pH 6.0 at CPE (curve a) and PAMCPE (curve b)
I pa /
A
E. S. D’Souza et al. J. Electrochem. Sci. Eng. 11(2) (2021) 87-96
http://dx.doi.org/10.5599/jese.953 93
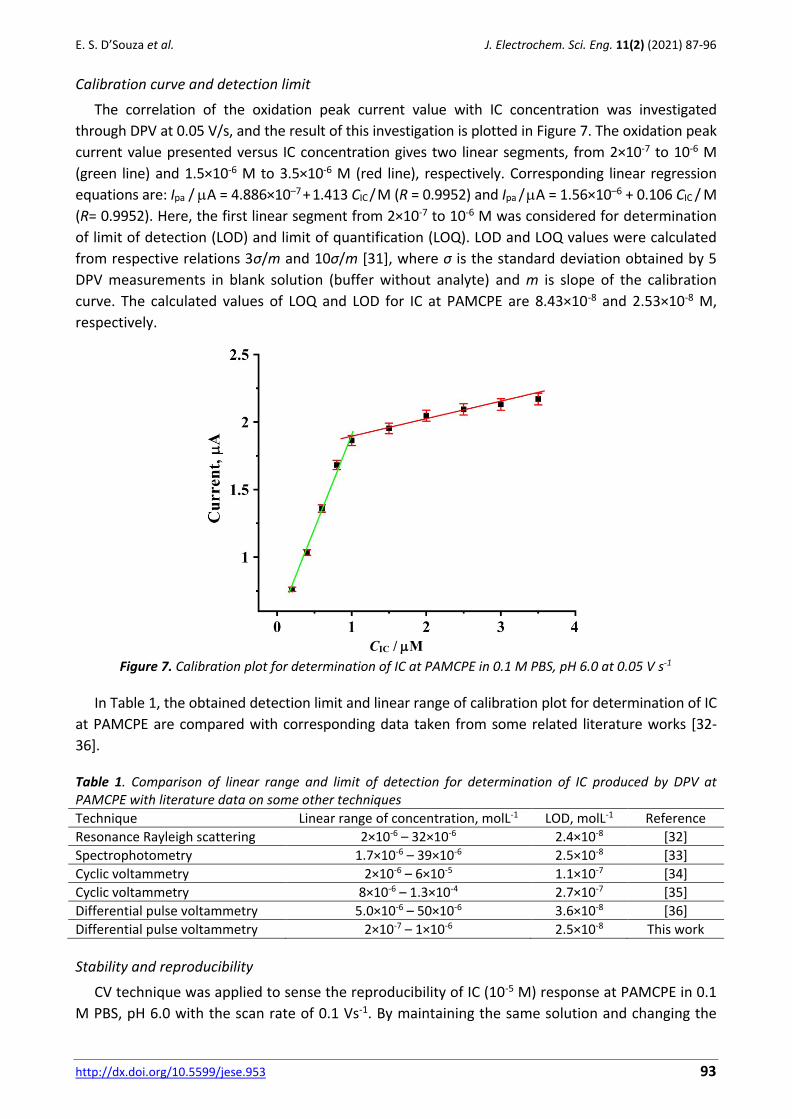
Calibration curve and detection limit
The correlation of the oxidation peak current value with IC concentration was investigated
through DPV at 0.05 V/s, and the result of this investigation is plotted in Figure 7. The oxidation peak
current value presented versus IC concentration gives two linear segments, from 2×10⁻⁷ to 10-6 M
(green line) and 1.5×10⁻⁶ M to 3.5×10⁻⁶ M (red line), respectively. Corresponding linear regression
equations are: Ipa / A = 4.886×10⁻⁷ + 1.413 CIC / M (R = 0.9952) and Ipa / A = 1.56×10⁻⁶ + 0.106 CIC / M
(R= 0.9952). Here, the first linear segment from 2×10⁻⁷ to 10-6 M was considered for determination
of limit of detection (LOD) and limit of quantification (LOQ). LOD and LOQ values were calculated
from respective relations 3σ/m and 10σ/m [31], where σ is the standard deviation obtained by 5
DPV measurements in blank solution (buffer without analyte) and m is slope of the calibration
curve. The calculated values of LOQ and LOD for IC at PAMCPE are 8.43×10⁻⁸ and 2.53×10⁻⁸ M,
respectively.
CIC / M
Figure 7. Calibration plot for determination of IC at PAMCPE in 0.1 M PBS, pH 6.0 at 0.05 V s-1
In Table 1, the obtained detection limit and linear range of calibration plot for determination of IC
at PAMCPE are compared with corresponding data taken from some related literature works [32-
36]. Table 1. Comparison of linear range and limit of detection for determination of IC produced by DPV at PAMCPE with literature data on some other techniques
Technique Linear range of concentration, molL-1 LOD, molL-1 Reference Resonance Rayleigh scattering 2×10⁻⁶ – 32×10-6 2.4×10⁻⁸ [32] Spectrophotometry 1.7×10⁻⁶ – 39×10-6 2.5×10⁻⁸ [33] Cyclic voltammetry 2×10⁻⁶ – 6×10⁻⁵ 1.1×10⁻⁷ [34] Cyclic voltammetry 8×10⁻⁶ – 1.3×10⁻⁴ 2.7×10⁻⁷ [35] Differential pulse voltammetry 5.0×10⁻⁶ – 50×10-6 3.6×10⁻⁸ [36] Differential pulse voltammetry 2×10⁻⁷ – 1×10⁻⁶ 2.5×10⁻⁸ This work
Stability and reproducibility
CV technique was applied to sense the reproducibility of IC (10-5 M) response at PAMCPE in 0.1
M PBS, pH 6.0 with the scan rate of 0.1 Vs-1. By maintaining the same solution and changing the

J. Electrochem. Sci. Eng. 11(2) (2021) 87-96 ANALYSIS OF INDIGO CARMINE
94
electrode surface at each time, the re-appearance of IC response at PAMCPE is studied for 5
consecutive series. The relative standard deviation (RSD) for reproducibility of anodic peak current
response of IC was found to be 2.51 %.
In order to detect stability of the electrode towards IC (10-5 M) sensing, the electrode is made
to run for 20 consecutive measurements, Stability can be evaluated by means of percentage
degradation method, Eq. (1).
pn
plDegradation, %= 100
I
I (1)
where, Ipn is peak current of IC during the last CV cycle and Ipl is the peak current of the first CV
cycle. Even after 20 CV cycles, it was found that about 84 % of the original current is regained.
Both these testing data represent that PAMCPE possesses an outstanding reproducibility and
stability towards IC oxidation.
Analytical application of PAMCPE in real sample IC analysis
In order to assess possible application of the prepared polymer modified electrodes for
determination of IC in real water samples, tap water and laboratory waste-water samples were
chosen. During this analysis, different concentrations of IC were added to 5 ml water sample and a
supporting electrolyte is used to carry out the experiment. Standard addition system was used to
identify the quantity and concentration of IC in these samples. The outcome showed that PAMCPE
possesses the recovery capacity of the authentic sample in the range of 96.3 to 99 %.
To study the applicability of the designed electrode for the presence of IC in a food sample, we
selected a candy crush chocolate, purchased from the nearby marketplace. The standard addition
method was also adopted to investigate the sample recovery. The recovery ranged from 91.2 % to
99 % for IC. The recovery statistics of the sample represents that the designed electrode is of high
sensitiveness and has enormous potential for determination of trace amounts of IC.
Conclusions
Carbon paste electrode (CPE) was successfully modified with polyarginine, forming PAMCPE
electrochemical sensor for indigo carmine (IC) dye. Cyclic and differential pulse voltammetry (CV
and DPV) techniques were applied, showing that in comparison with bare CPE, the polymer
modified electrode exhibits excellent electrochemical response of IC oxidation. Surfaces of both
electrodes were characterized by FESEM. More compact surface structure observed for PAMCPE
can be due to the presence of deposited polymer film. Anodic peak current values of PAMCPE
presented against IC concentration showed a linear two-slope plot. In the linear region from 2×10⁻⁷
to 10-6 M, LOQ and LOD values were determined as 84.3 and 25.3 nM, respectively. Under
optimized experimental conditions, CV and DPV measurements of PAMCPE have revealed high
sensitivity, selectivity, reproducibility, and reliability towards IC determination. When applied to
real water samples (tap) and food stuffs (candy crush chocolate), PAMCPE showed an acceptable
outcome. It can be concluded that the designed PAMCPE sensor is easy to prepare, economical,
steady, readily renewable and exhibits good catalytic activity towards IC oxidation.
Acknowledgements: We are grateful to acknowledge the financial support from the VGST, Bangalore under the Research Project No. KSTePS/VGST-KFIST (L1) 2016-2017/GRD-559/2017-2018/126/333, 21/11/2017.
E. S. D’Souza et al. J. Electrochem. Sci. Eng. 11(2) (2021) 87-96
http://dx.doi.org/10.5599/jese.953 95
References
[1] T. Robinson, G. McMullan, R. Merchant, P. Nigam, Bioresource Technology 77(3) (2001) 247-255 https://doi.org/10.1016/s0960-8524(0,0)00080-8.
[2] J. Hastie, D. Bejan, M. Teutli-León, N. J. Bunce, Industrial & Engineering Chemistry Research 45 (2006) 4898-4904 https://doi.org/10.1021/ie060310b.
[3] J. J. Berzas-Nevado, J. Rodríguez Flores, M. J. Villaseñor Llerena, N. Rodríguez Fariñas, Talanta 48(4) (1999) 895-903 https://doi.org/10.1016/S0039-9140(98)00301-4.
[4] E. Gutiérrez Segura, M. Solache-Ríos, A. Colín Cruz, Journal of Hazardous Materials 170(2-3) (2009) 1227-1235 https://doi.org/10.1016/j.jhazmat.2009.05.102.
[5] U. R. Lakshmi, V. C. Srivastava, I. D. Mall, D. H. Lataye, Journal of Environmental Management 90(2) (2009) 710-720 https://doi.org/10.1016/j.jenvman.2008.01.002.
[6] K. S. Rowe, K. J. Rowe, The Journal of Pediatrics 125 (1994) 691-698 https://doi.org/10.1016/s0022-3476(94)70059-1.
[7] E. H. Rodd, Chemistry of carbon compounds, 4th edition, Elsevier, Amsterdam 1960 https://doi.org/10.1002/ange.19600721522.
[8] L. Ge, K. Moor, B. Zhang, Y. He, J. H.-Kim, Nanoscale 6 (2014) 13579-13585 https://doi.org/10.1039/c4nr03647f.
[9] S. Alahiane, S. Qourzal, M. El Ouardi, M. Belmouden, A. Assabbane, Y. Ait-Ichou, Journal of Materials and Environmental Science 4(2) (2013) 239-250.
[10] C. F. Tsai, C. H. Kuo, D. Y.C. Shih, Journal of Food and Drug Analysis 23 (2015) 453-462 https://doi.org/10.1016/j.jfda.2014.09.003.
[11] M. A. Rauf, S. S. Ashraf, Chemical Engineering Journal 151(1-3) (2009) 10-18 https://doi.org/10.1016/j.cej.2009.02.026.
[12] C. L. Jenkins, Journal of Environmental Health 40(5) (1978) 256-263. [13] R. S. N′ Dri, M. Coulibaly, A. N’ G. Yao, D. Bamba, E. G. Zoro, International Journal of Electrochemical
Science 11 (2016) 5342-5350 https://doi.org/10.20964/2016.06.61. [14] M. Díaz-González, C. Fernández-Sánchez, A. Costa-García, Analytical Sciences 18(11) (2002) 1209-
1213 https://doi.org/10.2116/analsci.18.1209. [15] Y. Ni, X. Gong, Analytica Chimica Acta 354(1-3) (1997) 163-171 https://doi.org/10.1016/S0003-
2670(97)00297-3. [16] E. S. D’ Souza, J. G. Manjunatha, C. Raril, T. Girish, D. K. Ravishankar, S. Fattepur, Journal of
Materials and Environmental Science 11(3) (2020) 512-521. https://www.jmaterenvironsci.com/Document/vol11/vol11_N3/JMES-2020-1145-DSouza.pdf
[17] A. H. Alghamdi, Journal of AOAC International 88(5) (2005) 1387-1393 https://doi.org/10.1093/jaoac/88.5.1387.
[18] S. Suzuki, M. Shirao, M. Aizawa, H. Nakazawa, K. Sasa, H. Sasagawa, Journal of Chromatography A 680(2) (1994) 541-547 https://doi.org/10.1016/0021-9673(94)85153-0.
[19] G. M. Greenway, N. Kometa, R. Macrae, Food Chemistry 43(2) (1992) 137-140 https://doi.org/10.1016/0308-8146(92)90227-S.
[20] C.-L. Sun, C.-H. Su, J.-J. Wu, Biosensors and Bioelectronics 67 (2015) 327-333 https://doi.org/10.1016/j.bios.2014.08.046.
[21] I. O. Gyan, I. F. Cheng, Microchemical Journal 122 (2015) 39-44 https://doi.org/10.1016/j.microc.2015.04.002.
[22] D. N. Oko, S. Garbarino, J. Zhang, Z. Xu, M. Chaker, D. Ma, D. Guay, A. C. Tavares, Electrochimica Acta 159 (2015) 174-183 https://doi.org/10.1016/j.electacta.2015.01.192.
[23] D. M. Fernandez, M. Costa, C. Pereira, B. Bachiller-Baeza, I. Rodrígues-Ramos, A. Guerrero-Ruiz, C. Freire, Journal of Colloid and Interface Science 432 (2014) 207-213 https://doi.org/10.1016/j.jcis.2014.06.050.
[24] H. Beitollahi, H. Karimi-Maleh, H. Khabazzadeh, Analytical Chemistry 80 (2008) 9848-9851 https://doi.org/10.1021/ac801854j.
[25] S. Tajik, M. A. Taher, H. Beitollahi, Sensors and Actuators B Chemical 197 (2014) 228-236 https://doi.org/10.1016/j.snb.2014.02.096.

J. Electrochem. Sci. Eng. 11(2) (2021) 87-96 ANALYSIS OF INDIGO CARMINE
96
[26] C. Raril, J. G. Manjunatha, Journal of Materials and Environmental Science 10(6) (2019) 510-519 http://www.jmaterenvironsci.com/Document/vol10/vol10_N6/53-JMES-Raril-2019.pdf.
[27] C. Raril, J.G. Manjunatha, L. Nanjundaswamy, G. Siddaraju, D.K. Ravishankar, S. Fattepur, E. Niranjan, Analytical and Bioanalytical Electrochemistry 10(11) (2018) 1479-1490 https://www.sid.ir/FileServer/JE/55002820181108.pdf.
[28] S. Tajik, H. Beitollahi, F. G. Nejad, M. Safaei, K. Zhang, Q. Van Le, R. S. Varma, H. W. Jang, M. Shokouhimehr, RSC Advances 10 (2020) 21561-21581 https://doi.org/10.1039/d0ra03672b.
[29] G. Tigari, J. G. Manjunatha, D. K. Ravishankar, G. Siddaraju, Methods and Objects of Chemical Analysis 14(4) (2019) 216-223 https://doi.org/10.17721/moca.2019.216-223.
[30] I. Švancara, K. Vytřas, J. Barek, J. Zima, Critical Reviews in Analytical Chemistry 31(4) (2001) 311-345 https://doi.org/10.1080/20014091076785.
[31] J. G. Manjunatha, M. Deraman, N. H. Basri, Asian Journal of Pharmaceutical and Clinical Research 8(5) (2015) 40-45.
[32] Q. Li, J. Yang, X. Tan, Z. Zhang, X. Hu, M. Yang, Luminescence 31 (2016) 1152-1157 https://doi.org/10.1002/bio.3085.
[33] J. J. Berzas, F. J. Rodríguez Flores, M. J. Villaseñor Llerena, N. Rodríguez Fariñas, Analytica Chimica Acta 391(3) (1999) 353–364 https://doi.org/10.1016/S0003-2670(99)00215-9.
[34] J. G. Manjunatha, Journal of Food and Drug Analysis 26 (2018) 292-299 https://doi.org/10.1016/j.jfda.2017.05.002.
[35] P. A. Pushpanjali, J. G. Manjunatha, C. Raril, D. K. Ravishankar, Research Journal of Life Sciences, Bioinformatics, Pharmaceutical and Chemical Sciences 5 (2019) 820-832 https://doi.org/10.26479/2019.0501.68.
[36] N. Hareesha, J. G. Manjunatha, B. M. Amrutha, M. M. Charithra, N. Prinith Subbaiah, Journal of Electronic Materials 50(3) (2021) 1230-1238 https://doi.org/10.1007/s11664-020-08616-7.
©2021 by the authors; licensee IAPC, Zagreb, Croatia. This article is an open-access article distributed under the terms and conditions of the Creative Commons Attribution license
(https://creativecommons.org/licenses/by/4.0/)