electrochemical and structural study of the layered, “li-excess
TRANSCRIPT

pubs.acs.org/cmPublished on Web 06/09/2009r 2009 American Chemical Society
Chem. Mater. 2009, 21, 2733–2745 2733DOI:10.1021/cm900279u
Electrochemical and Structural Study of the Layered, “Li-Excess”
Lithium-Ion Battery Electrode Material Li[Li1/9Ni1/3Mn5/9]O2
Meng Jiang,† Baris Key,† Ying S. Meng,‡ and Clare P. Grey*,†
†Department of Chemistry, SUNY Stony Brook, Stony Brook, New York 11794-3400, and ‡Department ofMaterials Science and Engineering, University of Florida, Gainesville, Florida 32611
Received January 29, 2009. Revised Manuscript Received May 7, 2009
The overcapacity mechanism and high voltage process of the Li-excess electrode materialLi[Li1/9Ni1/3Mn5/9]O2 are studied by solid-state NMR, X-ray diffraction, X-ray absorption spectro-scopy, transmission electron microscopy, combined with galvanostatic and potentiostatic intermit-tent titration electrochemical measurements. The cycling performance is improved noticeably whenthe material is cycled between potential windows of 5.3-2.5 V compared to 4.6-2.5 V. Diffractiondata show that structural changes occur at high voltages, the solid-state NMR data of the samesamples indicating that the high voltage processes above 4.4 V are associated with Li removal fromthe structure, in addition to electrolyte decomposition. The NMR spectra of the discharged samplesshow that cation rearrangements in the transition metal layers have occurred. The XAS spectraconfirm that theMn oxidation state remains unchanged at 4+, whereas Ni2+ is oxidized to Ni4+ oncharging to 4.4 V, returning to Ni2+ on discharge, independent of the final charge voltage.A significant change of the shape of the Ni edge is observed in the 4.6-5.3 V potential range oncharge,which is ascribed to a change in theNi local environment.NoO2 evolutionwas detected basedon ex situ analysis of the gases evolved in the batteries, the TEM data showing that thick passivatingfilms form on the electrodes. The results suggest that at least some of the oxygen loss from theselithium-excess materials occurs via a mechanism involving electrolyte decomposition.
1. Introduction
Layered lithium nickel manganese oxides have at-tracted interest as possible alternatives to LiCoO2, thematerial that is most commonly used as a positive elec-trode in commercial Li ion batteries, because of theirlower cost and higher safety and abuse tolerance, whenlithium is removed from their structure.1 The series ofcompounds Li[Li1/3-2x/3NixMn2/3-x/3]O2 were first re-ported by Lu and Dahn, and Ohzuku et al. in 2001.2,3
These layered structures are derived from LiCoO2 (spacegroup R3m); however, the additional Li ions present inthe transitionmetal (TM) layers induce cation ordering inthe TM layers. This results in additional superstructurepeaks in their diffraction patterns characteristic ofthe honeycomb Li/Mn ordering found in the end mem-ber compound Li2MnO3 (or Li[Li1/3Mn2/3]O2, using thelayered notation). Ni2+/Ni4+ is generally consideredto be the active redox couple that compensates forthe deintercalation/intercalation of Li ions from/intothe structure.4 However, in the phases with x < 1/2, the
so-called Li-excess compounds, the fraction of Li ionsextracted, particularly in the first charge, is noticeablyhigher than the theoretical capacity calculated based onthe Ni2+/Ni4+ couple.3,5-7 A flat, plateau-like regionstarting from 4.4 V is always observed in the first charge,but this process is not reversible and is not seen in the firstdischarge and in subsequent cycles. Given the technolo-gical interest associated with these materials, much scien-tific effort has been devoted to determine where thisovercapacity comes from. Lu et al. proposed an oxygenlossmechanism (removal ofLi2O) tobalance the charge,3,6,7
which is supported by Armstrong et al.’s observations ofoxygen gas evolution made with in situ electrochemicalmass spectroscopy measurements.8 Unfortunately, theamount of oxygen gas produced was not quantified inthese latter experiments, so it was not possible to deter-mine whether the oxygen evolution accounts for all of theextra capacity. These authors also showed by usingneutron and X-ray diffraction that the phase remainedlayered after the oxygen-loss process. However, signifi-cant questions remain: for example, how does migration
*Corresponding author. E-mail: [email protected].(1) Amine, K.; Liu, J.; Belharouak, I.; Kang, S. H.; Bloom, I.; Vissers,
D.; Henriksen, G. J. Power Sources 2005, 146, 111–115.(2) Ohzuku, T.; Makimura, Y. Chem. Lett. 2001, 8, 744–745.(3) Lu, Z. H.; MacNeil, D. D.; Dahn, J. R. Electrochem. Solid-State
Lett. 2001, 4(12), A200–A203.(4) Yoon, W. S.; Paik, Y.; Yang, X. Q.; Balasubramanian, M.;
McBreen, J.; Grey, C. P. Electrochem. Solid-State Lett. 2002, 5,(11), A263–A266.
(5) Lu, Z. H.; Beaulieu, L. Y.; Donaberger, R. A.; Thomas, C. L.;Dahn, J. R. J. Electrochem. Soc. 2002, 149(6), A778–A791.
(6) Lu, Z. H.; Dahn, J. R. J. Electrochem. Soc. 2002, 149(7),A815–A822.
(7) Robertson,A.D.; Bruce, P.G.Electrochem. Solid-StateLett. 2004,7(9), A294–A298.
(8) Armstrong,A.R.;Holzapfel,M.;Novak, P.; Johnson,C. S.;Kang,S. H.; Thackeray, M. M.; Bruce, P. G. J. Am. Chem. Soc. 2006,128(26), 8694–8698.
Dow
nloa
ded
by U
NIV
OF
FLO
RID
A o
n Se
ptem
ber
29, 2
009
| http
://pu
bs.a
cs.o
rg
Pub
licat
ion
Dat
e (W
eb):
Jun
e 9,
200
9 | d
oi: 1
0.10
21/c
m90
0279
u

2734 Chem. Mater., Vol. 21, No. 13, 2009 Jiang et al.
of oxygen, nickel, and manganese ions occur to form thenew layered phase? If an ideal layered structure is formedat the top of the charge, why does it accommodate onlyapproximately 0.6-0.7 Li on subsequent deintercalation?Li[Li1/9Ni1/3Mn5/9]O2 was chosen as a representative
model compound in this work, in order to investigate thestructural changes that occur during the first charge-discharge cycle in this series of compounds. 6Li MagicAngle Spinning (MAS) Nuclear Magnetic Resonance(NMR), high resolution X-ray diffraction (XRD),X-ray absorption spectroscopy (XAS), and high resolu-tion TEM experiments were all performed to study theshort- and long-range structural and the accompanyingmorphology changes of the crystals during and after thehigh voltage process.
2. Experimental Section
2.1. Sample Preparation. Li[Ni1/3Li1/9Mn5/9]O2.LiOH 3H2O
(Aldrich >98.0%), Ni(NO3)2 36H2O (Aldrich, >98%) and Mn
(NO3)2 36H2O (Fluka >97.%) were used as starting materials, as
previously reported.5 The transition metal nitrates were dissolved
into 50mL of distilled water and were slowly dripped (1-2 h) into a400 mL stirred solution of aq. LiOH (about 0.2-0.4 M). A
precipitate of M(OH)2 with a homogeneous cation distribution
was thus formed. The precipitate was removed by filtration and
washed twice to get rid of the residual Li salts (LiOH and LiNO3),
and then was dried in air at 180 �C overnight. Stoichiometric
amounts of the precipitate and LiOH 3H2O were mixed by grinding
in a mortar. Pellets of the mixture were heated at 480 �C for 12 h.
Afterward, the pellets were ground and made into new pellets. The
new pellets were heated in air at 900 �C for another 12 h and
quenched in liquidnitrogen. 6Li enrichedmaterialswereprepared for
the NMR experiments using 6Li enriched Li2CO3 3H2O as the
starting material.
2.2. Electrochemistry. 2032 type Lithium coin cells were used
to study the electrochemical behavior of the compound and
prepare cycled samples for solid-state NMR, XRD, and TEM.
Li[Li1/9Ni1/3Mn5/9]O2 was mixed with either carbon (acetylene)
black (Timcal, super P-Li) or graphite (10 wt %) and poly
(vinylidenefluoride) binder (PVDF) (10wt%). The graphitewas
used in the cell thatwas cycled between 4.6 and 2.5V for 5 cycles;
acetylene black was used in all the other cells. The mixture was
then dispersed in acetone or NMP, dripped on a disk of
aluminum foil of 9/16 in. diameter, and dried at 80 �C. Thetotal electrode mixture on the aluminum disk is typically about
30mg. Lithiummetal ribbon (Aldrich, 99.9%) and 1MLiPF6 in
a 1:1 ethyl carbonate: dimethyl carbonate (EC: DMC) solution
(Ferro) were used as an anode material and electrolyte, respec-
tively. Twopieces of Celgard separator (Celgard Inc.USA)were
used as the separator. All the cell parts were assembled in an
argon-filled glovebox. The coin cells were cycled galvanostati-
cally on an Arbin battery cycler (College Station, Texas) be-
tween 2.5 and 4.6 V, or 2.5 and 5.3 V at aC/50 (∼0.06mA cm-2)
rate, where C is the theoretical specific capacity of Li[Ni1/3Li1/9-
Mn5/9]O2 defined on the basis of the Ni content. The samples
for the NMR, XRD, and TEM studies were recovered from
cycled batteries by disassembling them inside an argon-filled
glovebox, and scraping the powder mixture from the aluminum
disks. In contrast, the electrode foils were kept intact and used
directly for the XAS experiments after rinsing with DMC
(dimethyl carbonate).9 To avoid contact with air, we sealed
them between two layers of Kapton tape.
The galvanostatic intermittent titration (GITT) experiment
was performed between 5.3 and 2.5 V by applying a current
corresponding to a C/50 rate in intervals of 2 h, separated by a
rest period of 5 h. A potentiostatic intermittent titration (PITT)
experiment was also performed. This is a chronoamperometric
method that is carried out by applying potential steps of 10 mV
for 24 h. The time periods were curtailed when the measured
current fell below the threshold limit of 0.1 μA, corresponding to
a C/200 rate. The voltage window was set at 5.3-2.5 V.
2.3. MAS NMR Spectroscopy. 6Li MAS NMR experiments
were performed at an operating frequency of 29.47 MHz on a
CMX-200 spectrometer (4.7 T). A 1.8 mm double resonance
probe built by Samoson and co-workers (KBFI, Tallinn, Esto-
nia) was used. All spectra were acquired at 38 kHz with a rotor
synchronized echo pulse sequence (90�-τ-180�-τ-acq), where τ=1/νr. A π/2 pulse width of 3.5 μs was used with pulse delays of
0.2 s. The spectra were acquired at “room temperature” (i.e., the
spectra were acquired with no control of the temperature),
which corresponds to a sample temperature of between 70 and
80 �C.2.4. TEM. Electron diffraction patterns and transmission
electron microscope (TEM) images were collected from both
the as-prepared powders and the powders discharged to 2.5 V
after being charged to 5.3 V. Tominimize the exposure to air for
the electrochemically charged/discharged samples, we prepared
the samples in anAr environment. The powders were suspended
on a copper grid with lacey carbon and investigated by using
a JEOL 2010F microscope with an accelerating voltage of
200 kV and a field emission gun.
2.5. Synchrotron XRD. High-resolution synchrotron X-ray
powder diffraction (XRD) were collected at 11-BM10,11 and
1-BM beamlines (λ = 0.619174 and 0.4017 A, respectively)
at the Advanced Photon Source (APS) at Argonne National
Laboratory (ANL). For beamline 1-BM, the samples were
packed in 1.0 mm diameter glass capillaries. For 11-BM,
1.0 mm diameter Kapton capillaries were used. Rietveld refine-
ments were performed on the collected data with the EXPGUI-
GSAS software.
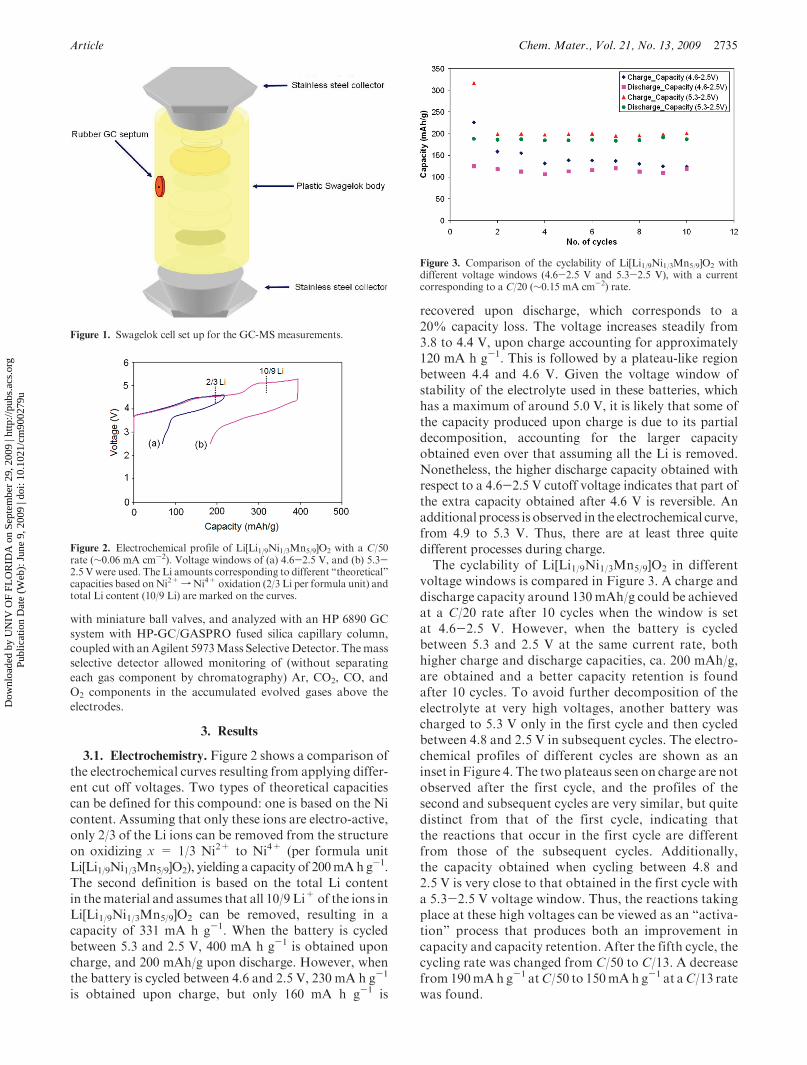
2.6. Ex situ GC-MS Measurements of Gases Evolved from
Batteries.Modified Swagelok-type cells were used to collect the
gases evolving during electrochemical cycling of Li[Li1/9Ni1/3-
Mn5/9]O2. The cells were prepared with empty space above the
positive and negative electrodes to accumulate the gases. The
Swagelok body was modified to accommodate a gas chromato-
graphy (GC) septum in order to syringe out the evolved gases
(Figure 1). Positive electrodes were prepared with the same
electrode mixtures as used for all the other electrochemical
studies, but the maximum amount of active electrode material
possible with this design was used (up to 200 mg in some runs)
to increase the potential gas evolution. Lithium metal was used
as the anode. Glass microfiber disks (Fisher) soaked with 1 M
LiPF6 in 1:1 EC/DMC (ethyl carbonate:dimethyl carbonate)
were used as separators. The components were assembled in an
Ar glovebox. The design has about 9 mL of dead space, which
for a pristine battery contains only Ar gas and low concentra-
tions of electrolyte vapor. The accumulated gases after charging
these batteries to different potentials were syringed out and
transferred for analysis by using aHamilton gastightGC syringe
(9) Balasubramanian,M.; Sun, X.; Yang, X. Q.; McBreen, J. J. PowerSources 2001, 92(1-2), 1–8.
(10) Lee, P. L.; Shu, D. M.; Ramanathan, M.; Preissner, C.; Wang, J.;Beno, M. A.; Von Dreele, R. B.; Ribaud, L.; Kurtz, C.; Antao, S.M.; Jiao, X.; Toby, B. H. J. Synchrot. Radiat. 2008, 15, 427–432.
(11) Lee, Y. J.; Grey, C. P. J. Phys. Chem. B 2002, 106(14), 3576–3582.
Dow
nloa
ded
by U
NIV
OF
FLO
RID
A o
n Se
ptem
ber
29, 2
009
| http
://pu
bs.a
cs.o
rg
Pub
licat
ion
Dat
e (W
eb):
Jun
e 9,
200
9 | d
oi: 1
0.10
21/c
m90
0279
u
Article Chem. Mater., Vol. 21, No. 13, 2009 2735
with miniature ball valves, and analyzed with an HP 6890 GC
system with HP-GC/GASPRO fused silica capillary column,
coupledwith anAgilent 5973Mass SelectiveDetector. Themass
selective detector allowed monitoring of (without separating
each gas component by chromatography) Ar, CO2, CO, and
O2 components in the accumulated evolved gases above the
electrodes.
3. Results
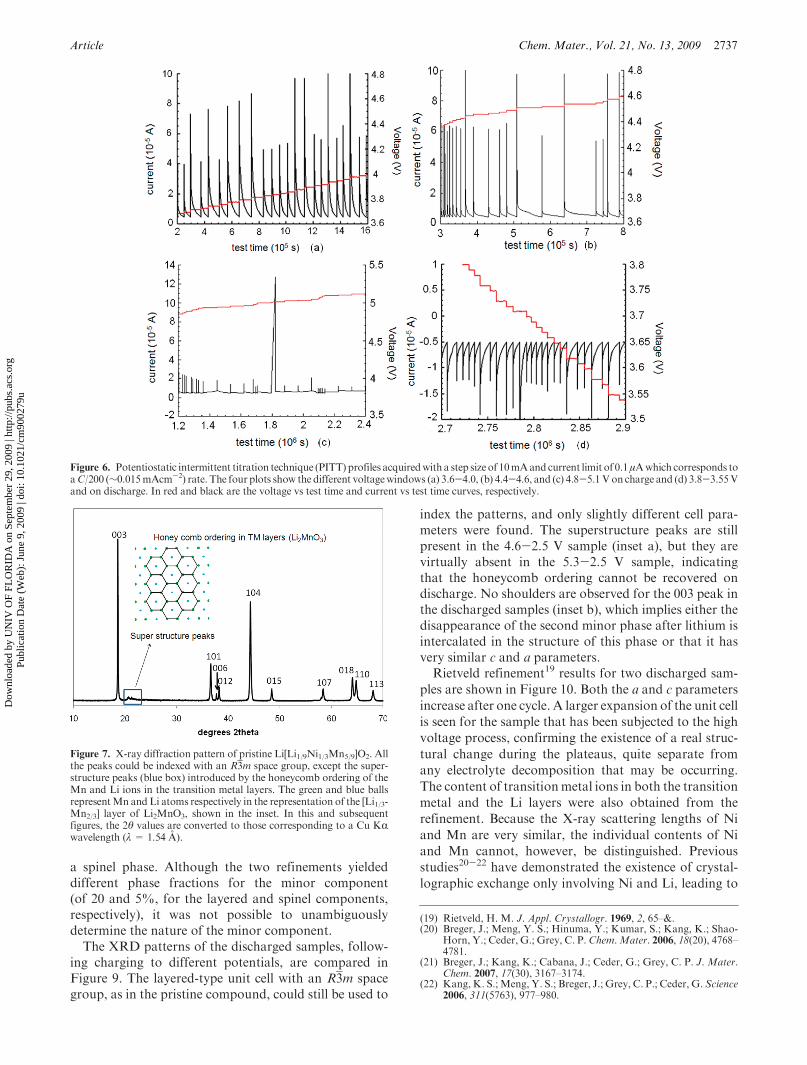
3.1. Electrochemistry. Figure 2 shows a comparison ofthe electrochemical curves resulting from applying differ-ent cut off voltages. Two types of theoretical capacitiescan be defined for this compound: one is based on the Nicontent. Assuming that only these ions are electro-active,only 2/3 of the Li ions can be removed from the structureon oxidizing x = 1/3 Ni2+ to Ni4+ (per formula unitLi[Li1/9Ni1/3Mn5/9]O2), yielding a capacity of 200mAh g-1.The second definition is based on the total Li contentin thematerial and assumes that all 10/9 Li+ of the ions inLi[Li1/9Ni1/3Mn5/9]O2 can be removed, resulting in acapacity of 331 mA h g-1. When the battery is cycledbetween 5.3 and 2.5 V, 400 mA h g-1 is obtained uponcharge, and 200 mAh/g upon discharge. However, whenthe battery is cycled between 4.6 and 2.5 V, 230 mA h g-1
is obtained upon charge, but only 160 mA h g-1 is
recovered upon discharge, which corresponds to a20% capacity loss. The voltage increases steadily from3.8 to 4.4 V, upon charge accounting for approximately120 mA h g-1. This is followed by a plateau-like regionbetween 4.4 and 4.6 V. Given the voltage window ofstability of the electrolyte used in these batteries, whichhas a maximum of around 5.0 V, it is likely that some ofthe capacity produced upon charge is due to its partialdecomposition, accounting for the larger capacityobtained even over that assuming all the Li is removed.Nonetheless, the higher discharge capacity obtained withrespect to a 4.6-2.5 V cutoff voltage indicates that part ofthe extra capacity obtained after 4.6 V is reversible. Anadditional process is observed in the electrochemical curve,from 4.9 to 5.3 V. Thus, there are at least three quitedifferent processes during charge.The cyclability of Li[Li1/9Ni1/3Mn5/9]O2 in different
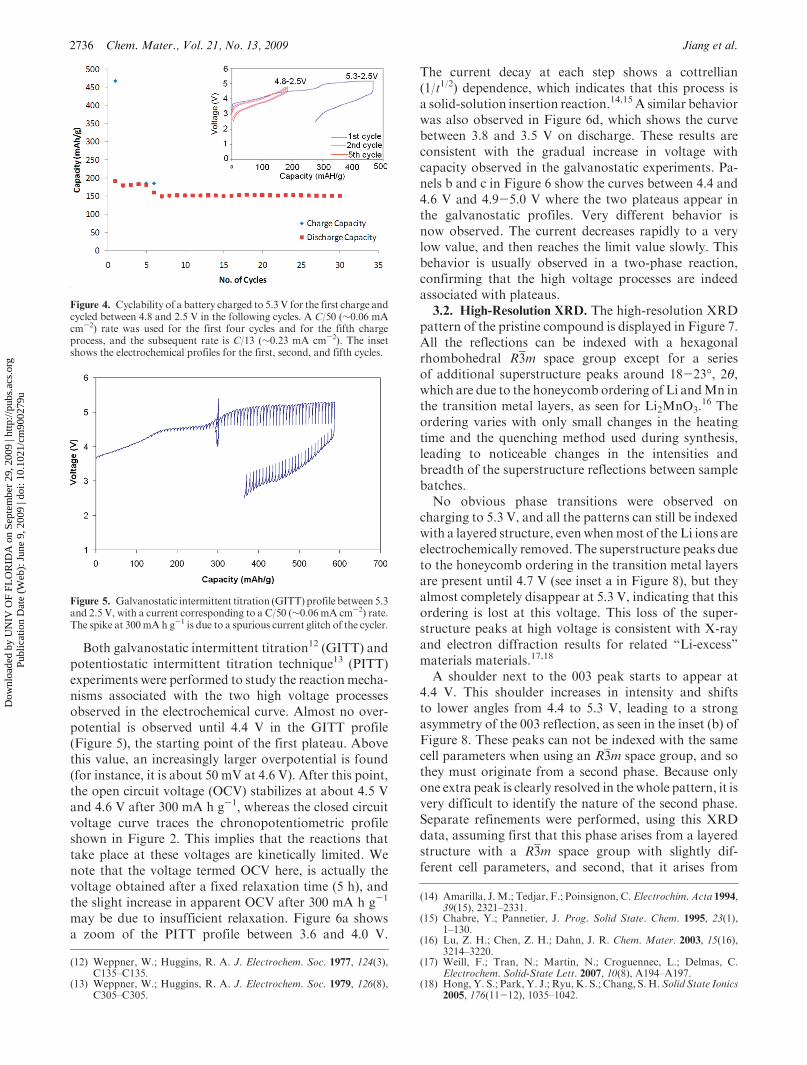
voltage windows is compared in Figure 3. A charge anddischarge capacity around 130 mAh/g could be achievedat a C/20 rate after 10 cycles when the window is setat 4.6-2.5 V. However, when the battery is cycledbetween 5.3 and 2.5 V at the same current rate, bothhigher charge and discharge capacities, ca. 200 mAh/g,are obtained and a better capacity retention is foundafter 10 cycles. To avoid further decomposition of theelectrolyte at very high voltages, another battery wascharged to 5.3 V only in the first cycle and then cycledbetween 4.8 and 2.5 V in subsequent cycles. The electro-chemical profiles of different cycles are shown as aninset in Figure 4. The two plateaus seen on charge are notobserved after the first cycle, and the profiles of thesecond and subsequent cycles are very similar, but quitedistinct from that of the first cycle, indicating thatthe reactions that occur in the first cycle are differentfrom those of the subsequent cycles. Additionally,the capacity obtained when cycling between 4.8 and2.5 V is very close to that obtained in the first cycle witha 5.3-2.5 V voltage window. Thus, the reactions takingplace at these high voltages can be viewed as an “activa-tion” process that produces both an improvement incapacity and capacity retention. After the fifth cycle, thecycling rate was changed from C/50 to C/13. A decreasefrom 190mAh g-1 atC/50 to 150mAh g-1 at aC/13 ratewas found.
Figure 1. Swagelok cell set up for the GC-MS measurements.
Figure 2. Electrochemical profile of Li[Li1/9Ni1/3Mn5/9]O2 with a C/50rate (∼0.06 mA cm-2). Voltage windows of (a) 4.6-2.5 V, and (b) 5.3-2.5 V were used. The Li amounts corresponding to different “theoretical”capacities based onNi2+fNi4+ oxidation (2/3 Li per formula unit) andtotal Li content (10/9 Li) are marked on the curves.
Figure 3. Comparison of the cyclability of Li[Li1/9Ni1/3Mn5/9]O2 withdifferent voltage windows (4.6-2.5 V and 5.3-2.5 V), with a currentcorresponding to a C/20 (∼0.15 mA cm-2) rate.
Dow
nloa
ded
by U
NIV
OF
FLO
RID
A o
n Se
ptem
ber
29, 2
009
| http
://pu
bs.a
cs.o
rg
Pub
licat
ion
Dat
e (W
eb):
Jun
e 9,
200
9 | d
oi: 1
0.10
21/c
m90
0279
u
2736 Chem. Mater., Vol. 21, No. 13, 2009 Jiang et al.
Both galvanostatic intermittent titration12 (GITT) andpotentiostatic intermittent titration technique13 (PITT)experiments were performed to study the reactionmecha-nisms associated with the two high voltage processesobserved in the electrochemical curve. Almost no over-potential is observed until 4.4 V in the GITT profile(Figure 5), the starting point of the first plateau. Abovethis value, an increasingly larger overpotential is found(for instance, it is about 50 mV at 4.6 V). After this point,the open circuit voltage (OCV) stabilizes at about 4.5 Vand 4.6 V after 300 mA h g-1, whereas the closed circuitvoltage curve traces the chronopotentiometric profileshown in Figure 2. This implies that the reactions thattake place at these voltages are kinetically limited. Wenote that the voltage termed OCV here, is actually thevoltage obtained after a fixed relaxation time (5 h), andthe slight increase in apparent OCV after 300 mA h g-1
may be due to insufficient relaxation. Figure 6a showsa zoom of the PITT profile between 3.6 and 4.0 V.
The current decay at each step shows a cottrellian(1/t1/2) dependence, which indicates that this process isa solid-solution insertion reaction.14,15 A similar behaviorwas also observed in Figure 6d, which shows the curvebetween 3.8 and 3.5 V on discharge. These results areconsistent with the gradual increase in voltage withcapacity observed in the galvanostatic experiments. Pa-nels b and c in Figure 6 show the curves between 4.4 and4.6 V and 4.9-5.0 V where the two plateaus appear inthe galvanostatic profiles. Very different behavior isnow observed. The current decreases rapidly to a verylow value, and then reaches the limit value slowly. Thisbehavior is usually observed in a two-phase reaction,confirming that the high voltage processes are indeedassociated with plateaus.3.2. High-Resolution XRD. The high-resolution XRD
pattern of the pristine compound is displayed in Figure 7.All the reflections can be indexed with a hexagonalrhombohedral R3m space group except for a seriesof additional superstructure peaks around 18-23�, 2θ,which are due to the honeycomb ordering of Li andMn inthe transition metal layers, as seen for Li2MnO3.
16 Theordering varies with only small changes in the heatingtime and the quenching method used during synthesis,leading to noticeable changes in the intensities andbreadth of the superstructure reflections between samplebatches.No obvious phase transitions were observed on
charging to 5.3 V, and all the patterns can still be indexedwith a layered structure, evenwhenmost of the Li ions areelectrochemically removed. The superstructure peaks dueto the honeycomb ordering in the transition metal layersare present until 4.7 V (see inset a in Figure 8), but theyalmost completely disappear at 5.3 V, indicating that thisordering is lost at this voltage. This loss of the super-structure peaks at high voltage is consistent with X-rayand electron diffraction results for related “Li-excess”materials materials.17,18
A shoulder next to the 003 peak starts to appear at4.4 V. This shoulder increases in intensity and shiftsto lower angles from 4.4 to 5.3 V, leading to a strongasymmetry of the 003 reflection, as seen in the inset (b) ofFigure 8. These peaks can not be indexed with the samecell parameters when using an R3m space group, and sothey must originate from a second phase. Because onlyone extra peak is clearly resolved in the whole pattern, it isvery difficult to identify the nature of the second phase.Separate refinements were performed, using this XRDdata, assuming first that this phase arises from a layeredstructure with a R3m space group with slightly dif-ferent cell parameters, and second, that it arises from
Figure 4. Cyclability of a battery charged to 5.3 V for the first charge andcycled between 4.8 and 2.5 V in the following cycles. A C/50 (∼0.06 mAcm-2) rate was used for the first four cycles and for the fifth chargeprocess, and the subsequent rate is C/13 (∼0.23 mA cm-2). The insetshows the electrochemical profiles for the first, second, and fifth cycles.
Figure 5. Galvanostatic intermittent titration (GITT) profile between 5.3and 2.5 V, with a current corresponding to a C/50 (∼0.06 mA cm-2) rate.The spike at 300mAh g-1 is due to a spurious current glitch of the cycler.
(12) Weppner, W.; Huggins, R. A. J. Electrochem. Soc. 1977, 124(3),C135–C135.
(13) Weppner, W.; Huggins, R. A. J. Electrochem. Soc. 1979, 126(8),C305–C305.
(14) Amarilla, J.M.; Tedjar, F.; Poinsignon, C.Electrochim. Acta 1994,39(15), 2321–2331.
(15) Chabre, Y.; Pannetier, J. Prog. Solid State. Chem. 1995, 23(1),1–130.
(16) Lu, Z. H.; Chen, Z. H.; Dahn, J. R. Chem. Mater. 2003, 15(16),3214–3220.
(17) Weill, F.; Tran, N.; Martin, N.; Croguennec, L.; Delmas, C.Electrochem. Solid-State Lett. 2007, 10(8), A194–A197.
(18) Hong, Y. S.; Park, Y. J.; Ryu, K. S.; Chang, S. H. Solid State Ionics2005, 176(11-12), 1035–1042.
Dow
nloa
ded
by U
NIV
OF
FLO
RID
A o
n Se
ptem
ber
29, 2
009
| http
://pu
bs.a
cs.o
rg
Pub
licat
ion
Dat
e (W
eb):
Jun
e 9,
200
9 | d
oi: 1
0.10
21/c
m90
0279
u
Article Chem. Mater., Vol. 21, No. 13, 2009 2737
a spinel phase. Although the two refinements yieldeddifferent phase fractions for the minor component(of 20 and 5%, for the layered and spinel components,respectively), it was not possible to unambiguouslydetermine the nature of the minor component.The XRD patterns of the discharged samples, follow-
ing charging to different potentials, are compared inFigure 9. The layered-type unit cell with an R3m spacegroup, as in the pristine compound, could still be used to
index the patterns, and only slightly different cell para-meters were found. The superstructure peaks are stillpresent in the 4.6-2.5 V sample (inset a), but they arevirtually absent in the 5.3-2.5 V sample, indicatingthat the honeycomb ordering cannot be recovered ondischarge. No shoulders are observed for the 003 peak inthe discharged samples (inset b), which implies either thedisappearance of the second minor phase after lithium isintercalated in the structure of this phase or that it hasvery similar c and a parameters.Rietveld refinement19 results for two discharged sam-
ples are shown in Figure 10. Both the a and c parameters
increase after one cycle. A larger expansion of the unit cell
is seen for the sample that has been subjected to the high
voltage process, confirming the existence of a real struc-
tural change during the plateaus, quite separate from
any electrolyte decomposition that may be occurring.
The content of transitionmetal ions in both the transition
metal and the Li layers were also obtained from the
refinement. Because the X-ray scattering lengths of Ni
and Mn are very similar, the individual contents of Ni
and Mn cannot, however, be distinguished. Previous
studies20-22 have demonstrated the existence of crystal-
lographic exchange only involving Ni and Li, leading to
Figure 6. Potentiostatic intermittent titration technique (PITT) profiles acquiredwith a step size of 10mAand current limit of 0.1μAwhich corresponds toaC/200 (∼0.015mAcm-2) rate. The four plots show the different voltagewindows (a) 3.6-4.0, (b) 4.4-4.6, and (c) 4.8-5.1 V on charge and (d) 3.8-3.55Vand on discharge. In red and black are the voltage vs test time and current vs test time curves, respectively.
Figure 7. X-ray diffraction pattern of pristine Li[Li1/9Ni1/3Mn5/9]O2. Allthe peaks could be indexed with an R3m space group, except the super-structure peaks (blue box) introduced by the honeycomb ordering of theMn and Li ions in the transition metal layers. The green and blue ballsrepresentMn andLi atoms respectively in the representation of the [Li1/3-Mn2/3] layer of Li2MnO3, shown in the inset. In this and subsequentfigures, the 2θ values are converted to those corresponding to a Cu KRwavelength (λ= 1.54 A).
(19) Rietveld, H. M. J. Appl. Crystallogr. 1969, 2, 65–&.(20) Breger, J.; Meng, Y. S.; Hinuma, Y.; Kumar, S.; Kang, K.; Shao-
Horn, Y.; Ceder, G.; Grey, C. P.Chem.Mater. 2006, 18(20), 4768–4781.
(21) Breger, J.; Kang, K.; Cabana, J.; Ceder, G.; Grey, C. P. J. Mater.Chem. 2007, 17(30), 3167–3174.
(22) Kang, K. S.;Meng, Y. S.; Breger, J.; Grey, C. P.; Ceder, G. Science2006, 311(5763), 977–980.
Dow
nloa
ded
by U
NIV
OF
FLO
RID
A o
n Se
ptem
ber
29, 2
009
| http
://pu
bs.a
cs.o
rg
Pub
licat
ion
Dat
e (W
eb):
Jun
e 9,
200
9 | d
oi: 1
0.10
21/c
m90
0279
u

2738 Chem. Mater., Vol. 21, No. 13, 2009 Jiang et al.
the presence of the Ni in the Li layers. Hence, only this
exchange was assumed in our structural models. Given
the small X-ray scattering length of Li associated with its
low electron density,23 the refinements are not very
sensitive to the Li content. As a consequence, the approx-
imate Li contents used in this refinement were taken
from the discharge capacity obtained in the correspond-
ing batteries. The results of the refinements are plotted
in Figure 10c. The total transition metal content in the
transitionmetal layers of themajor phase does not change
after one cycle, following a charge to both 4.5 and 5.3 V,
remaining constant at approximately 84-85%. In con-
trast, the Ni content in the Li layers increases from 5% to
9% on cycling between 2.5 and 5.3 V. Because the
Ni content in these materials should remain constant, it
appears that the loss of structural oxygen on charging is
associated with the migration of some of the transition
metal ions to theLi layers.We note that a small increase in
Ni content in the Li layers was also noted in the earlier
study of Li1.12(Ni0.425Mn0.425Co0.15)0.88O2, following
cycling at high voltages.17
TheXRDpatterns of themultiple cycledmaterials witha cutoff voltage window between 4.6 and 2.5 V arecompared in Figure 11. Both cycled samples were stoppedin the fully discharged state. The layered structure withR3m space group still remains after 10 cycles. However,the superstructure peaks representing honeycomb order-ing in the transition metal layers are much less pro-nounced in the sample stopped after 5 cycles, and havetotally disappeared in the 10th cycled sample. Clearly theloss of transition metal ordering can also happen aftermultiple cycles even when the material is cycled betweenthe lower voltage window 4.6-2.5 V. A shoulder next to003 peak is observed in both the 5 and 10 cycles samples,which appears at the same position as that observed in thecharged samples (Figure 8), indicating that the secondphase is still present in the discharged samples aftermultiple cycles. This suggests that this second phase isstill present in the discharged samples after only one cycle(Figure 9), but that its cell parameters are similar to thatof the major phase following the first cycle. However,because this phase is seen quite clearly following multiplecycles on charging to 4.6 V, this may indicate that furthersegregation to form larger domains of the second phasemay be occurring, possibly preventing this phase fromreturning to the same state as observed after one cycle.Preliminary TEM studies show that spinel-like domainsare formed within the particles, whichmay be responsiblefor this second phase. A more detailed TEM study ofthis second phase is underway and will be describedin a separate paper. The role that these domains playin capacity loss or even retention after multiple cyclesis currently under investigation.3.3. 6Li MAS NMR Spectroscopy. Two groups of
resonances are clearly observed in the 6Li NMR spectrumof Li[Li1/9Ni1/3Mn5/9]O2 (Figure 12), one at 737-587ppm, and another at 1511-1341 ppm. On the basisof previous work,4,11,24,25 we assign these resonances toLi ions in lithium and in the transition metal layers,respectively. The large width of the peaks at 737-587 ppmis due to the large variety of different local environmentsfor Li ions in the Li layers, which result from the presenceof varying numbers of Ni2+, Mn4+, and Li+ in the first
Figure 8. High-resolution XRD of charged and pristine materials. Theinsets show the enlargements of different 2θ regions. The XRD patternsare labeled with the cutoff voltage used to synthesize each sample.
Figure 9. Comparison of the high-resolution XRD patterns of dis-charged samples and the pristine material. Both discharged samples werestopped at 2.5 V and the charge voltages are labeled on the patterns. Theinsets show enlargements of the regions containing the superstructure and003 reflections.
(23) Breger, J.; Dupre, N.; Chupas, P. J.; Lee, P. L.; Proffen, T.; Parise,J. B.; Grey, C. P. J. Am. Chem. Soc. 2005, 127(20), 7529–7537.
(24) Yoon, W. S.; Kim, N.; Yang, X. Q.; McBreen, J.; Grey, C. P.J. Power Sources 2003, 119, 649–653.
(25) Pan, C. J.; Lee, Y. J.; Ammundsen, B.; Grey, C. P. Chem. Mater.2002, 14(5), 2289–2299.
Dow
nloa
ded
by U
NIV
OF
FLO
RID
A o
n Se
ptem
ber
29, 2
009
| http
://pu
bs.a
cs.o
rg
Pub
licat
ion
Dat
e (W
eb):
Jun
e 9,
200
9 | d
oi: 1
0.10
21/c
m90
0279
u

Article Chem. Mater., Vol. 21, No. 13, 2009 2739
and second cation coordination shells of Li. The broadpeak at 737 ppm is similar to that seen for theLi ions in the lithium layers of Li2MnO3,
26 while theresonance at 1511 ppm is at the shift position for Li inthe predominantly manganese layers of Li2MnO3, andis hence assigned to Li+ in the transition metal layers,surrounded by 6 Mn4+ ions (Li(OMn)6). The reso-nance at 1341 ppm is assigned to Li+ surrounded by5 Mn4+ and 1 Ni2+ ion.
Figure 13 shows the 6Li NMR spectra of Li[Li1/9-Ni1/3Mn5/9]O2 as a function of the state of charge. Thespectra have been normalized with the total number ofscans and the weight of active material packed in therotors, so that the intensity of each resonance can bedirectly related to the number of Li ions in each sample,assuming that the spin-lattice relaxation times T2 valuesare similar for the different sites. (We note that since avery fast MAS was used (38 kHz), the time between theend of the excitation pulse and the detection (i.e., the sumof the evolution and refocusing times) used in the spin-echo experiment was extremely short (53 μs). Under theseconditions, the corrections that need to be applied tothe relative intensities to take into account any differencesdue to variations in the T2 values are small for thehyperfine-shifted resonances studied in this system,which
Figure 10. Results from the structural refinements for the pristine and two discharged samples. (a, b) Plots of the a and c cell parameters for the threesamples. (c) Plot of the metal content in the Li layers (black line) and total transition metal content in the transition metal layers (red line).
Figure 11. Comparison of the XRD pattern of the multiply cycled, fullydischarged samples cycled with cutoff voltage windows of 4.6-2.5 V andthe pristine material. The inset is an enlargement of the superstructurepeaks region. The sharp peak marked with an asterisk observed in the 5cycles sample is from graphite.
Figure 12.6Li MAS NMR spectrum of pristine Li[Li1/9Ni1/3Mn5/9]O2
acquired at a spinning speed 38 kHz. The sidebands due to magic anglespinning are marked with asterisks. The two main classes of Li localenvironments expected for Ni2+-substitution in a Li2MnO3-type localenvironment are shown.
(26) Breger, J.; Jiang, M.; Dupre, N.; Meng, Y. S.; Shao-Horn, Y.;Ceder, G.; Grey, C. P. J. Solid State Chem. 2005, 178(9),2575–2585.
Dow
nloa
ded
by U
NIV
OF
FLO
RID
A o
n Se
ptem
ber
29, 2
009
| http
://pu
bs.a
cs.o
rg
Pub
licat
ion
Dat
e (W
eb):
Jun
e 9,
200
9 | d
oi: 1
0.10
21/c
m90
0279
u

2740 Chem. Mater., Vol. 21, No. 13, 2009 Jiang et al.
have T2 values several orders of magnitude larger than 53μs).When the compound is charged to 4.4 V, the intensityof the peaks ascribed both to Li in the lithium layers andLi in the transition metal layers decrease, as previouslyobserved,24 indicating that lithium is removed from bothlayers. At 4.6 V, the 737 ppmpeak due to Li environmentsin the Li layers resembling those in Li2MnO3 has de-creased noticeably in intensity and appears to be buriedunder a broader peak centered at 500-600 ppm. Thislatter peak likely contains Li environments in the Li layerwhere the Li is nearby Ni4+ (diamagnetic) ions and/or Liin the tetrahedral sites, adjacent to the Li vacancies in thetransition metal layers. In contrast, the Li ions in thetransitionmetal layers are still not completely removed atthis voltage. The results should be contrasted with the LiNMR spectra of Li[Co1/3Mn1/3Ni1/3]O2 and M-dopedLiCoO2 and LiNiO2, where Li removal is accompaniedby the coalescence and/or gradual shifting of the Liresonances, particularly at higher states of charge. Thisis ascribed to rapid Li and/or electronic mobility, whichdoes not appear to be occurring here, at least on theNMRtime scale.27,28 From 4.6 to 5.3 V, the intensity of thepeaks around 600 ppm gradually decreases, consistentwith the removal of lithium from the structure, and thus,with the compound still being electrochemically active atthese voltages. The continuous Li removal from the struc-ture is consistent with the results observed for Li1.12-[Ni0.425Mn0.425Co0.15]O2, where the removal of Li duringthis plateau is confirmed by chemical Li titration.29 Nopeaks around 1500 ppm are observed at 5.3 V, and onlyone broad symmetric peak remains at around 600 ppm,indicating that all the Li ions have been removed from thetransitionmetal layers, but also that there are still someLi
ions left in the lithium layers. No extra peaks are observedin the charged materials except for one at 0 ppm, whicharises from the Li ions in diamagnetic environments in theelectrolyte salt (LiPF6) or in the passivation layer on thesurface of the electrode.30 This peak becomes broader andslightly more intense in the 5.3 V sample, which is con-sistent with the electrolyte decomposition, a thicker pas-sivation layer being produced in this process.A similar study was also performed on a series of
samples prepared after one charge-discharge cycle, andthe NMR spectra of discharged samples are displayed inFigure 14. The low natural abundance of 6Li (7.43%) andthe fact that the electrolyte and Li metal used in thebatteries is not enriched in 6Li means that the Li contentin these samples can no longer be readily quantified on thebasis of the intensity of the 6Li spectra, which representsthe 6Li content in the sample, and not necessarily the totalLi content. Thus, the spectra for all the dischargedsamples shown in Figure 14 and 15 are not normalized.The two sets of resonances ascribed above to Li in the Li,and in the transitionmetal layers, are still present in all thespectra. As before, the peaks at 0 ppm correspond to thepresence of diamagnetic electrolyte/SEI environments.Two trends can be observed in the spectra as a functionof maximum voltage on charge. First, the intensity of thepeaks around 1500 ppm gradually decreases as the chargecutoff voltage is increased, and these peaks are almostabsent in the 5.3-2.5 V sample, indicating that only veryfew Li ions can be reintercalated into the transition metallayers on discharge after charging at high voltages. Sec-ond, the broad peak centered at 750 ppm becomes muchmore symmetric and featureless, in comparison to thesame resonance in the pristine sample, for the samplecycled over a larger voltage window. This is the evidenceof cation rearrangement in the transition metal layers athigh voltages. Taken together, this appears to suggestthat either some of the vacancies left behind in thetransition metal layers after the Li ions are removed fromthe transition metal layers are occupied by the othertransitionmetal ions which canmigrate from the adjacent
Figure 13. 6Li MAS NMR spectra of the charged samples acquired at a38 kHz spinning speed. Sidebands are marked with asterisks. The insetshows an enlargement of the spectra of the high voltage samples; thedashed blue box in this inset shows the location of the resonances due toLi in the predominantly transition metal layers.
Figure 14. 6Li MAS NMR spectra of discharged samples.
(27) Chazel, C.; Menetrier, M.; Croguennec, L.; Delmas, C. Inorg.Chem. 2006, 45(3), 1184–1191.
(28) Levasseur, S.;Menetrier,M.;Delmas,C. J. Electrochem. Soc. 2002,149(12), A1533–A1540.
(29) Tran, N.; Croguennec, L.; Menetrier, M.; Weill, F.; Biensan, P.;Jordy, C.; Delmas, C. Chem. Mater. 2008, 20(15), 4815–4825.
(30) Meyer, B. M.; Leifer, N.; Sakamoto, S.; Greenbaum, S. G.;Grey, C. P. Electrochem. Solid-State Lett. 2005, 8(3), A145–A148.
Dow
nloa
ded
by U
NIV
OF
FLO
RID
A o
n Se
ptem
ber
29, 2
009
| http
://pu
bs.a
cs.o
rg
Pub
licat
ion
Dat
e (W
eb):
Jun
e 9,
200
9 | d
oi: 1
0.10
21/c
m90
0279
u
Article Chem. Mater., Vol. 21, No. 13, 2009 2741
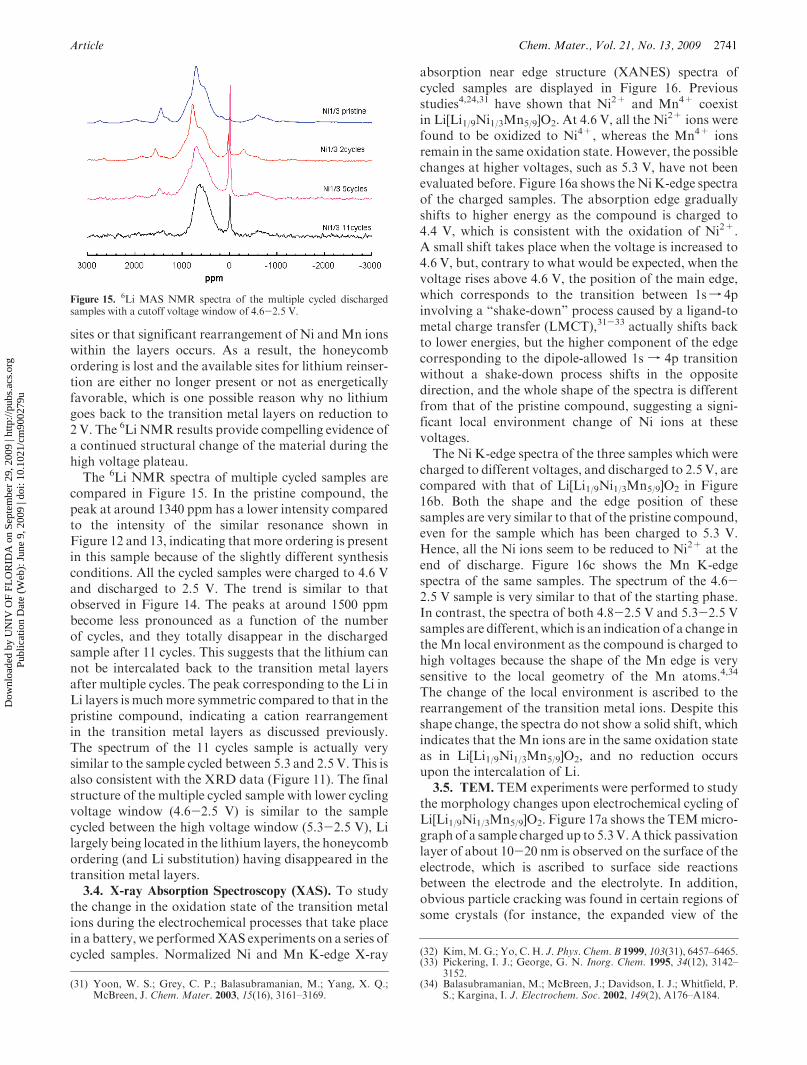
sites or that significant rearrangement of Ni andMn ionswithin the layers occurs. As a result, the honeycombordering is lost and the available sites for lithium reinser-tion are either no longer present or not as energeticallyfavorable, which is one possible reason why no lithiumgoes back to the transition metal layers on reduction to2 V. The 6Li NMR results provide compelling evidence ofa continued structural change of the material during thehigh voltage plateau.The 6Li NMR spectra of multiple cycled samples are
compared in Figure 15. In the pristine compound, thepeak at around 1340 ppm has a lower intensity comparedto the intensity of the similar resonance shown inFigure 12 and 13, indicating that more ordering is presentin this sample because of the slightly different synthesisconditions. All the cycled samples were charged to 4.6 Vand discharged to 2.5 V. The trend is similar to thatobserved in Figure 14. The peaks at around 1500 ppmbecome less pronounced as a function of the numberof cycles, and they totally disappear in the dischargedsample after 11 cycles. This suggests that the lithium cannot be intercalated back to the transition metal layersafter multiple cycles. The peak corresponding to the Li inLi layers is muchmore symmetric compared to that in thepristine compound, indicating a cation rearrangementin the transition metal layers as discussed previously.The spectrum of the 11 cycles sample is actually verysimilar to the sample cycled between 5.3 and 2.5 V. This isalso consistent with the XRD data (Figure 11). The finalstructure of the multiple cycled sample with lower cyclingvoltage window (4.6-2.5 V) is similar to the samplecycled between the high voltage window (5.3-2.5 V), Lilargely being located in the lithium layers, the honeycombordering (and Li substitution) having disappeared in thetransition metal layers.3.4. X-ray Absorption Spectroscopy (XAS). To study
the change in the oxidation state of the transition metalions during the electrochemical processes that take placein a battery, we performedXAS experiments on a series ofcycled samples. Normalized Ni and Mn K-edge X-ray
absorption near edge structure (XANES) spectra ofcycled samples are displayed in Figure 16. Previousstudies4,24,31 have shown that Ni2+ and Mn4+ coexistin Li[Li1/9Ni1/3Mn5/9]O2. At 4.6 V, all the Ni2+ ions werefound to be oxidized to Ni4+, whereas the Mn4+ ionsremain in the same oxidation state. However, the possiblechanges at higher voltages, such as 5.3 V, have not beenevaluated before. Figure 16a shows theNiK-edge spectraof the charged samples. The absorption edge graduallyshifts to higher energy as the compound is charged to4.4 V, which is consistent with the oxidation of Ni2+.A small shift takes place when the voltage is increased to4.6 V, but, contrary to what would be expected, when thevoltage rises above 4.6 V, the position of the main edge,which corresponds to the transition between 1sf 4pinvolving a “shake-down” process caused by a ligand-tometal charge transfer (LMCT),31-33 actually shifts backto lower energies, but the higher component of the edgecorresponding to the dipole-allowed 1s f 4p transitionwithout a shake-down process shifts in the oppositedirection, and the whole shape of the spectra is differentfrom that of the pristine compound, suggesting a signi-ficant local environment change of Ni ions at thesevoltages.The Ni K-edge spectra of the three samples which were
charged to different voltages, and discharged to 2.5 V, arecompared with that of Li[Li1/9Ni1/3Mn5/9]O2 in Figure16b. Both the shape and the edge position of thesesamples are very similar to that of the pristine compound,even for the sample which has been charged to 5.3 V.Hence, all the Ni ions seem to be reduced to Ni2+ at theend of discharge. Figure 16c shows the Mn K-edgespectra of the same samples. The spectrum of the 4.6-2.5 V sample is very similar to that of the starting phase.In contrast, the spectra of both 4.8-2.5 V and 5.3-2.5 Vsamples are different, which is an indication of a change inthe Mn local environment as the compound is charged tohigh voltages because the shape of the Mn edge is verysensitive to the local geometry of the Mn atoms.4,34
The change of the local environment is ascribed to therearrangement of the transition metal ions. Despite thisshape change, the spectra do not show a solid shift, whichindicates that the Mn ions are in the same oxidation stateas in Li[Li1/9Ni1/3Mn5/9]O2, and no reduction occursupon the intercalation of Li.3.5. TEM. TEM experiments were performed to study
the morphology changes upon electrochemical cycling ofLi[Li1/9Ni1/3Mn5/9]O2. Figure 17a shows the TEMmicro-graphof a sample charged up to 5.3V.A thick passivationlayer of about 10-20 nm is observed on the surface of theelectrode, which is ascribed to surface side reactionsbetween the electrode and the electrolyte. In addition,obvious particle cracking was found in certain regions ofsome crystals (for instance, the expanded view of the
Figure 15. 6Li MAS NMR spectra of the multiple cycled dischargedsamples with a cutoff voltage window of 4.6-2.5 V.
(31) Yoon, W. S.; Grey, C. P.; Balasubramanian, M.; Yang, X. Q.;McBreen, J. Chem. Mater. 2003, 15(16), 3161–3169.
(32) Kim,M. G.; Yo, C. H. J. Phys. Chem. B 1999, 103(31), 6457–6465.(33) Pickering, I. J.; George, G. N. Inorg. Chem. 1995, 34(12), 3142–
3152.(34) Balasubramanian, M.; McBreen, J.; Davidson, I. J.; Whitfield, P.
S.; Kargina, I. J. Electrochem. Soc. 2002, 149(2), A176–A184.
Dow
nloa
ded
by U
NIV
OF
FLO
RID
A o
n Se
ptem
ber
29, 2
009
| http
://pu
bs.a
cs.o
rg
Pub
licat
ion
Dat
e (W
eb):
Jun
e 9,
200
9 | d
oi: 1
0.10
21/c
m90
0279
u

2742 Chem. Mater., Vol. 21, No. 13, 2009 Jiang et al.
region marked with an arrow in Figure 17b) of a samplecharged to 5.3 and discharged to 2.5 V. A similar phe-nomenon was observed by Lei et al.35 in their HREMstudy, which was also ascribed to oxygen loss. Othercrystals from the same sample even show distinct diffrac-tion domains, as revealed by the electron diffractionpatterns of two different parts of the same particle inFigure 17c. Different crystallinity is clearly observed;although one side of the particle is still single crystalline
(i.e., results in well-resolved diffraction spots in thepattern), the diffraction pattern of the other is composedof less well-defined spots with considerable streaking.This streaking is most probably associated with a for-mation of nanosized domains (shown in Figure 17c),resulting in a change in the microstructure.3.6. Analysis of the Evolved Gases. Two separate bat-
teries were arrested at the ends of the electrochemicalplateaus at approximately 4.6 V and 5.3 V. An analysisof the evolved gases from these two batteries showeda mixture of Ar, CO2, and CO, Ar representing the majorcomponent. CO2 was found to be the second major
Figure 16. Normalized X-ray absorption near edge structure (XANES) Ni and Mn K-edge spectra for the pristine and cycled Li[Li1/9Ni1/3Mn5/9]O2
samples. Ni K-edge on (a) charge and (b) discharge and (c) the Mn K-edge of the discharged samples.
Figure 17. High-resolution TEM pictures of cycled Li[Li1/9Ni1/3Mn5/9]O2: (a) charged sample stopped at 5.3 V, (b, c) two particles from an electrodecharged to 5.3 V then discharged back to 2.5 V.
(35) Lei, C. H.; Bareno, J.; Wen, J. G.; Petrov, I.; Kang, S. H.;Abraham, D. P. J. Power Sources 2008, 178(1), 422–433.
Dow
nloa
ded
by U
NIV
OF
FLO
RID
A o
n Se
ptem
ber
29, 2
009
| http
://pu
bs.a
cs.o
rg
Pub
licat
ion
Dat
e (W
eb):
Jun
e 9,
200
9 | d
oi: 1
0.10
21/c
m90
0279
u

Article Chem. Mater., Vol. 21, No. 13, 2009 2743
component in the mixture after Ar. No significantO2 components were observed. The absence of any leaksin the battery were confirmed by monitoring the N2:O2
ratio, the absence of N2 confirming that no leak waspresent. The experiment was repeated for several batteriesand similar results were obtained. The Li anode was alsoinspected for proof for reaction with O2. No discernibleevidence of Li2O was observed for batteries arrested at4.4, 4.6, and 5.3 V. The results suggest that, in comparisonto previous results based on in situ gas analysis, eitherwhen the evolved O2 is allowed to remain in the cell itresults in electrolyte decomposition (but surprisingly,little attack of the Li metal), or that part of the oxygenloss mechanism involves the direct oxidation of theelectrolyte. This is discussed later on in the paper.
4. Discussion
The results of both theGITT and the PITT experimentsconfirm the existence of a plateau at around 4.5 V uponthe first charge of a battery containing Li[Li1/9Ni1/3Mn5/9]-O2 as a positive electrode. The NMR results indicate thatalthough some of the capacity observed in this region isassociated with electrolyte decomposition, it must also beaccompanied by removal of Li+. Previous studies haveproposed that the plateau at 4.5V is due to the oxygen lossmechanism,8 and that the removal of Li is accompaniedby the loss of oxygen, resulting in an irreversible net lossof Li2O from the structure. Mantia et al. have demon-strated direct evidence of oxygen evolution from theLi-excess material Li1+x(Ni1/3Mn1/3Co1/3)1-xO2 at highpotentials by in situ differential electrochemical massspectrometry (DEMS).36 Oxygen gas was only observedin the Li-excess material during the first cycle, but not inthe following cycles, and in the stoichiometric (x = 0)material. CO2 was also detected in both systems (Li-excess and stoichiometric) during the first cycle. How-ever, it was absent in the Li-excess material in the secondcycle, and yet was still observable in the stoichiometricsample. The absence of CO2 evolution in the Li-excesssystem in the second cycle was ascribed to the formationof a surface film composed of an electrolyte oxidationproduct during the first cycle. Our TEM micrographs(for example, see Figure 17a) provide direct evidence ofthis passivation layer formation on the surface. TheNMR spectra of the materials charged to high vol-tages also contain strong signals at close to 0 ppm, thesignals primarily arising from diamagnetic componentsin the SEI.Wewere unable to detect anyO2 in our ex situ studies of
the gas evolution on charging to 4.6 and 5.3 V. On thebasis of these results, we propose that at least some of theoxygen loss, which must accompany the Li+ removal, isassociated with the direct oxidation of DMC (DimethylCarbonate) and/or ethyl carbonate (EC) in the electrolyteby the highly oxidized electrode material. In this mecha-nism, the EC or DMC is oxidized to an aldehyde
(or ketone) formally by the oxide ions in the electrodematerial, with CO2 and H2O being generated as by-product. The resulting aldehyde can further react withother O2- ions to yield carboxylic acids, as shown in thescheme drawn below (for DMC as example)
CH3-O-CðOÞ-O-CH3 þ 4Ni4þ
þ 2O2- f 2CH2O þ CO2 þH2O þ 4Ni3þ ð1Þ
CH2O þ 2Ni4þ þO2- f HCO2H þ 2Ni3þ ð2Þ
Ni3þ f Ni4þ þ e- ð3ÞThe different steps presumably occur simultaneously, theremoval of Li+ (whichwill accompany reaction 3) drivingthe processes. It is important to note that the first tworeactions are not associated with current flow in the cell.The Ni4+/Ni3+ may be thought of as a catalyst for theelectrolyte decomposition and O2- loss mechanism, theNi4+ being regenerated electrochemically. This processresults in a capacity that is higher than the 200 mA h g-1
capacity expected solely from the oxidation of the initialNi2+ ions. The in situ results of Mantia et al.36 indicatethat direct O2- oxidation (without the involvement of theelectrolyte) does occur to some degree. Thus a secondpossible explanation for the lack of O2 in our systems isthat anyO2 generated, from the direct oxidation of O2- toO2 (without the involvement of the electrolyte), can reactwith the electrolyte to form CO2. This mechanism maybecome dominate in our closed system, because the O2
cannot escape from the sealed battery. Because the elec-trolytes are stable in air, this mechanism must again beaccompanied (and catalyzed) by a second reaction invol-ving the electrodematerials. The particle cracking seen byTEM suggests that at least some of the oxygen loss occursfrom within the particles. This mechanism presumablydoes not result directly in electrolyte decomposition.On the basis of our preliminary studies, we note thatparticle cracking is mostly observed in large particlessuch as the one observed in Figure 16b, indicating thatimportance of the twomechanismsmay vary as a functionof particle size.Our 6Li NMR results can now be used to evaluate
which sites are vacated by the removal of Li+ ions and thesequence of extraction during charge process. First, fromanOCV of 3.5 V to 4.6 V, 2/3 of the Li+ ions are removedthrough via charge compensation of the oxidation ofNi2+ toNi4+. These ions are extracted from both lithiumlayers and transitionmetal layers, andmost of the lithiumin transition metal layers are removed at this voltage,as seen by the almost complete disappearance of the1500 ppm peak in the 6Li NMR spectra of the 4.6 Vsample. Our samples appear to show some heterogeneity,as two phases are seen at this point byXRD. It is not clearwhether theminor phase is a spinel or a layered phase, butspinel domains are frequently observed in the electrondiffraction results for some of the particles in this voltage
(36) La Mantia, F.; Rosciano, F.; Tran, N.; Novak, P. J. Appl.Electrochem. 2008, 38, 893–896.
Dow
nloa
ded
by U
NIV
OF
FLO
RID
A o
n Se
ptem
ber
29, 2
009
| http
://pu
bs.a
cs.o
rg
Pub
licat
ion
Dat
e (W
eb):
Jun
e 9,
200
9 | d
oi: 1
0.10
21/c
m90
0279
u

2744 Chem. Mater., Vol. 21, No. 13, 2009 Jiang et al.
range. The loss of 1/9 Li ions (per formula unit) from thetransition metal layers results in vacancies in these layers,which then allow 2/9 Li tetrahedral sites (per formulaunit) in the lithium layers, on either side of these vacanciesto be occupied, as discussed in earlier papers for theLi(Ni0.5Mn0.5)O2 material.20,37,38 Although the predictedNMR shifts for Li in tetrahedral sites and octahedral sitesare very close in this system, the NMR spectra areconsistent with this proposal. The ideal formula of thematerial at this point is Li2/9octLi2/9tet[01/9Ni1/3Mn5/9]O2,and all of the Ni ions are present as Ni4+. Our neutrondiffraction results of the Li(Ni0.5Mn0.5)O2 sample, wherevacancies are also formed in the transition metal layers,showed that the concentration of tetrahedral sites waslower than predicted based on the concentration ofvacancies (and the octahedral sites were correspondinglyhigher), presumably because of repulsions between Liions in the tetrahedral sites, when two such occupied sitesare nearby.On the basis of the GITT results, a plateau at approxi-
mately 4.5 V is seen, and after the theoretical capacity hasbeen obtained, another 63 mA h g-1 of capacity isobserved (i.e., until 4.8 V is reached in the experimentsperformed galvanostatically). This is ascribed to theloss of further Li, accompanied by the loss of oxygen.63 mA h g-1 corresponds to 0.2 Li, and an analysis of theintensities of the NMR spectra of the 4.6 and 4.8 Vsamples indicates that the Li removal corresponds toroughly 2/3 of this capacity, indicating that althoughelectrolyte decomposition occurs, it is not the dominantprocess.We propose that Li ions from the octahedral sitesare lost at this point
Li4=9½01=9Ni1=3Mn5=9�O2 f Li0:24½01=9Ni1=3Mn5=9�O1:9
þ 0:05O2 þ 0:2 Liþ þ 0:2e- ð4Þ
A dramatic increase in the potential is now seen oncharging, but the OCV is similar. We ascribe this notice-able increase to either the additional potential required toremove Li from the tetrahedral sites, as proposed pre-viously for Li(Ni0.5Mn0.5)O2,
20,37,38 and/or an additionaloverpotential caused by the formation of by now anincreasingly thick passivating film on the surface. How-ever, if the latter explanation were valid, we might expectthe voltage to increase steadily during this process >5 Vbecause the electrolyte decomposition is now significantin this voltage window, which it does not. For the formerprocess to correct, the Li loss must be accompanied by afurther structural rearrangement, so that the OCV dropsback down to 4.6 V. Referring back to the Li(Ni0.5Mn0.5)O2 system, here we ascribed the >5.0 V high voltageprocess to a combination of Li loss from the tetrahedralsites and themigration ofNi (in this case from the Li layerto the transition metal layer). It is again possible that
a similar process is occurring here, the migration nowinvolving the filling in of the vacancies in the Li layersby cations predominantly in the transition metal layers.At the end of the process, almost all of the Li is removedfrom the material.If Ni andMnmigration occurs to fill in the vacancies in
the transition metal layers, as shown by Armstrong et al.for the their lowerNi contentmaterial Li[Li1/5Ni1/5Mn3/5]-O2,
8 then the formula for the 4.8 V sample should berewritten as Li0.26[00.06Ni0.35Mn0.59]O2. This formularequires that some Li move from the tetrahedral sitesback onto octahedral sites as the vacancies in the transi-tion metal layers are filled. These, according to ourhypothesis, should also be removed at a potential ofapproximately 4.5 V, extending the length of this plateau.On discharge an increased concentration of Ni is seen inthe Li layers, and it is not clear whether this migrationoccurs at high voltages or on the subsequent discharge.It seemsmore plausible, however, that at least some of theNi or Mn ions that migrate at high voltages to fill thevacant sites in the transition metal layers also occupysome sites in the Li layers, most likely occupying sitesabove and below vacancies in the transition metal layers,forming small spinel-like structural motifs in the solid.Another additional complexity that we have not ad-dressed is the mechanism by which the Ni and Mn ionsmove in this system, and the consequences of theirdifferences in mobility, on the phases that are formed.Differences in mobility between the two components maylead to nonuniform Ni/Mn distributions and/or meta-stable phases. Thus, a third possible explanation for thehigher voltage processes is that it is either linked withthe migration of a different transition metal cation, ora transition metal cation from one site to another. Wenote that the particle cracking sometimes observedmeansthat O2- ions can be lost from not just the original surfaceof the particle, reducing the diffusion lengths over whichthe cations must migrate to fill the cation vacancies.On discharge, all the Ni4+ is reduced back to Ni2+, the
oxidation of theMn4+ remaining unchanged, resulting ina material with nominal stoichiometry Li2/3[Ni3/8Mn5/8]-O2, assuming the ideal layered structure model of Arm-strong et al.8 The NMR of this sample confirms thatconsiderable rearrangements of the Ni and Mn haveoccurred in the transition metal layers, the signal broad-ening considerably, as compared to the original sample.The Mn and Ni XAS data also suggest that the localenvironments change noticeably during the high voltageprocesses. The question remains-why can theMn4+ notbe reduced further in this material, if there are stillvacancies in the Li layers, which must be present if anideal layered structure is formed? The simplest explana-tion is that the presence of metal ions in the Li layer blockpossible sites for Li in both the Li and metal layers(in a material containing vacancies in these layers). Limay not also return to the transition metal layers even ifthere are vacancies, because of the rearrangement of thecations in the transition metal layers. Vacancies in themetal layers surrounded predominantly by Ni2+ ions will
(37) Grey, C. P.; Yoon, W. S.; Reed, J.; Ceder, G. Electrochem. Solid-State Lett. 2004, 7(9), A290–A293.
(38) Van der Ven, A.; Ceder, G. Electrochem. Commun. 2004, 6(10),1045–1050.
Dow
nloa
ded
by U
NIV
OF
FLO
RID
A o
n Se
ptem
ber
29, 2
009
| http
://pu
bs.a
cs.o
rg
Pub
licat
ion
Dat
e (W
eb):
Jun
e 9,
200
9 | d
oi: 1
0.10
21/c
m90
0279
u

Article Chem. Mater., Vol. 21, No. 13, 2009 2745
be less favorable for Li+. Interestingly, a redox processthat is likely due to Mn4+ reduction, at close to 3 V, issometimes seen for samples that were charged to only4.6 V (see Figure 2a), but this disappears in the samplescharged to higher voltages. This also disappears for sam-ples cycled over multiple cycles to 4.6 V, the NMR resultsconfirming that local structures in these samples eventuallyresemble the material that has undergone only onecharge-discharge cycle to 5.3 V. Thus, it appears that ametastable (or intermediate) phase that is formed after onecharge to 4.6 V, but that after multiple cycles it starts toresemble the end structure that is created in one cycle,following cycling to higher voltages. Finally, it is worthnoting that the stable structure that is created by eitherhigh-voltage or by extended cycling involves significantcation rearrangements and is produced as a result of astructural rearrangement that occurs at low lithium con-tents, in a material involving predominantly M4+ ions.Thus, simple pretreatments of the material, e.g., by acidleaching,39 are unlikely to result in the same structuralchanges. Different pretreatment strategies are required.
5. Conclusions
The electrochemical behavior of layered Li[Li1/9Ni1/3-Mn5/9]O2 as a positive electrode in lithium batteries hasbeen investigated in this study. Three distinct processesare seen on charging to 5.3 V, the GITT and PITTexperiments confirming that the first processs from 3.6up to approximately 4.4 V involves a solid solution,whereas the two apparent plateaus at approximately 4.5and 5.0 V are associated with a two phase reaction, bothwith an OCV of close to 4.5 V. Both higher capacity andbetter capacity retention are obtained after the materialhas been charged to this higher voltage.The 6Li MAS NMR spectra show that the Li ions are
removed from both the lithium and the transition metallayers upon charge, even at voltages above 4.6 V, which isclear evidence that the capacity obtained at these highvoltages is not solely due to electrolyte decomposition.The high-resolution XRD patterns show that the honey-comb ordering in the transition metal layers is lost when
charging at 5.3 V, which is likely to be associated with amigration of transition metal ions into the vacancies leftby the extracted lithium ions. A second phase is also seenabove 4.4 V, possibly indicating some heterogeneity inour samples. The 6LiMASNMR spectra of these samplesalso show that very few Li ions can be intercalated backinto the transitionmetal layers after being charged at veryhigh voltages, in agreement with the absence of honey-comb type superstructure peaks in the XRD patterns ofthe discharged samples. The change of the 6Li NMR lineshape is indicative of significant rearrangement of transi-tion metal ions in these layers, while the Rietveld refine-ments of these discharged samples show an increase in theNi content in the Li layers, which is ascribed to the cationmigration that occurs at high voltages.The Ni K-edge XANES spectra show that the Ni is
oxidized during the solid solution. The evolution of theNiedge is more complicated during the high voltage pla-teaus, and is ascribed to a change of local structure thatoccurs in this regime. The MnK-edge XANES spectra ofthe different cycled samples suggests a change in the localenvironment of theMn4+ ions, but no obvious reductionis observed. High-resolution TEM pictures show theformation of a passivation layer on the surface of theelectrode particles at high voltages. In addition, crackingand nanosize domains were observed in some crystalsafter charging to 5.3 V, the former being ascribed tooxygen loss. However, no oxygen was observed in ourex situ m.s. analysis of the gases evolved from the battery,the oxygen presumably reacting with the electrolyte.
Acknowledgment. The work was supported by the Assis-tant Secretary for Energy Efficiency and Renewable Energy,Office of FreedomCAR and Vehicle Technologies of theU.S. Department of Energy under Contract DE-AC03-76SF00098, via Subcontract 6517749 with the LawrenceBerkeley National Laboratory. Y.S.M. acknowledges thenew faculty startup fund by University of Florida for finan-cial support. Use of the Advanced Photon Source (APS) wassupported by the U.S. Department of Energy, Office ofScience, Office of Basic Energy Sciences, under ContractW-31-109-Eng-38. We thank Dr. Peter Lee for collectingXRDdata at APS, andDr. Jordi Cabana Jim�enez, Dr.DenisYu, Prof. Gerbrand Ceder, and Prof. Yang Shao Horn forhelpful discussions.
(39) Kang, S.H.; Johnson,C. S.; Vaughey, J. T.; Amine,K.; Thackeray,M. M. J. Electrochem. Soc. 2006, 153(6), A1186–A1192.
Dow
nloa
ded
by U
NIV
OF
FLO
RID
A o
n Se
ptem
ber
29, 2
009
| http
://pu
bs.a
cs.o
rg
Pub
licat
ion
Dat
e (W
eb):
Jun
e 9,
200
9 | d
oi: 1
0.10
21/c
m90
0279
u