electromagnetic emissions compliance report intentional ...€¦ · electromagnetic emissions...
TRANSCRIPT

TRF No.: FCC 15.247/A Page 1 of 69 Report No.: ED170511031E Ver.1.0
ELECTROMAGNETIC EMISSIONS COMPLIANCE REPORT INTENTIONAL RADIATOR CERTIFICATION TO
FCC PART 15 SUBPART C REQUIREMENT
OF
LED TV
Model No.: WD50FBE1001, 8502811, EL, WD50
FCC ID: 2ACWIWD50FBE10
Trademark: THTF, Fluid, Westinghouse, Seiki, Element, ONN
Report No.: ED170511031E
Issue Date: May 18, 2017
Prepared for
Shenyang Tongfang Multimedia Technology Co., Limited
No.10 Nanping East Road HunNan New District Shenyang, LiaoNing Province P.R .China
Prepared by
EMTEK(DONGGUAN) CO., LTD.
No.281, Guantai Road, Nancheng District, Dongguan, Guangdong, China
TEL: 86-769-22807078 FAX: 86-769-22807079
This report shall not be reproduced, except in full, without the written approval of EMTEK(DONGGUAN) CO., LTD.

TRF No.: FCC 15.247/A Page 2 of 69 Report No.: ED170511031E Ver.1.0
VERIFICATION OF COMPLIANCE Applicant: Shenyang Tongfang Multimedia Technology Co., Limited
No.10 Nanping East Road Hunnan New District Shenyang, Liaoning Province P.R .China
Manufacturer: Shenyang Tongfang Multimedia Technology Co., Limited No.10 Nanping East Road Hunnan New District Shenyang, Liaoning Province P.R .China
Product Description: LED TV
Model Number: WD50FBE1001, 8502811, EL, WD50
We hereby certify that:
The above equipment was tested by EMTEK(DONGGUAN) CO., LTD. The test data, data evaluation, test procedures, and equipment configurations shown in this report were made in accordance with the procedures given in ANSI C63.10-2013 and the energy emitted by the sample EUT tested as described in this report is in compliance with conducted and radiated emission limits of FCC Rules Part 15.247(2016).
Date of Test : May 11, 2017 to May 15, 2017
Prepared by : Abby Li/Editor Reviewer : Tomas Yang/Supervisor
Approved & Authorized Signer :
Sam Lv/Manager

TRF No.: FCC 15.247/A Page 3 of 69 Report No.: ED170511031E Ver.1.0
Modified Information
Version Summary Revision Date Report No.
Ver.1.0 Original Report / ED170511031E

TRF No.: FCC 15.247/A Page 4 of 69 Report No.: ED170511031E Ver.1.0
Table of Contents 1. GENERAL INFORMATION ...................................................................................................................... 6
1.1 PRODUCT DESCRIPTION ...................................................................................................................... 6 2. SYSTEM TEST CONFIGURATION ......................................................................................................... 7
2.1 EUT CONFIGURATION .......................................................................................................................... 7 2.2 EUT EXERCISE ................................................................................................................................... 7 2.3 TEST PROCEDURE ............................................................................................................................... 7 2.4 CONFIGURATION OF TESTED SYSTEM ................................................................................................... 7
3. DESCRIPTION OF TEST MODES ........................................................................................................... 9 4. SUMMARY OF TEST RESULTS ............................................................................................................ 10 5. TEST FACILITY ...................................................................................................................................... 11 6. CONDUCTED EMISSIONS TEST ......................................................................................................... 12
6.1 MEASUREMENT PROCEDURE ............................................................................................................. 12 6.2 TEST SET-UP (BLOCK DIAGRAM OF CONFIGURATION) ........................................................................ 12 6.3 MEASUREMENT EQUIPMENT USED ..................................................................................................... 12 6.4 CONDUCTED EMISSION LIMIT ............................................................................................................. 12 6.5 MEASUREMENT RESULT ..................................................................................................................... 12
7. RADIATED EMISSION TEST ................................................................................................................. 19 7.1 MEASUREMENT PROCEDURE ............................................................................................................. 19 7.2 TEST SET-UP (BLOCK DIAGRAM OF CONFIGURATION) ........................................................................ 20 7.3 MEASUREMENT EQUIPMENT USED ..................................................................................................... 21 7.4 RADIATED EMISSION LIMIT ................................................................................................................. 22 7.5 MEASUREMENT RESULT ..................................................................................................................... 23
8. 6DB BANDWIDTH TEST ....................................................................................................................... 32 8.1 MEASUREMENT PROCEDURE ............................................................................................................. 32 8.2 TEST SET-UP (BLOCK DIAGRAM OF CONFIGURATION) ........................................................................ 32 8.3 MEASUREMENT EQUIPMENT USED ..................................................................................................... 32 8.4 MEASUREMENT RESULTS ................................................................................................................... 32
9. MAXIMUM PEAK OUTPUT POWER TEST .......................................................................................... 41 9.1 MEASUREMENT PROCEDURE ............................................................................................................. 41 9.2 TEST SET-UP (BLOCK DIAGRAM OF CONFIGURATION) ........................................................................ 41 9.3 MEASUREMENT EQUIPMENT USED ..................................................................................................... 41 9.4 PEAK POWER OUTPUT LIMIT ............................................................................................................... 41 9.5 MEASUREMENT RESULTS ................................................................................................................... 41
10. BAND EDGE TEST ............................................................................................................................ 42 10.1 MEASUREMENT PROCEDURE ............................................................................................................. 42 10.2 TEST SET-UP (BLOCK DIAGRAM OF CONFIGURATION) ........................................................................ 43 10.3 MEASUREMENT EQUIPMENT USED ..................................................................................................... 43 10.4 MEASUREMENT RESULTS ................................................................................................................... 43
11. POWER DENSITY .............................................................................................................................. 49 11.1 TEST EQUIPMENT .............................................................................................................................. 49 11.2 MEASURING INSTRUMENTS AND SETTING ............................................................................................ 49 11.3 TEST PROCEDURES ........................................................................................................................... 49 11.4 BLOCK DIAGRAM OF TEST SETUP ....................................................................................................... 49 11.5 LIMIT ................................................................................................................................................. 49 11.6 TEST RESULT .................................................................................................................................... 50

TRF No.: FCC 15.247/A Page 5 of 69 Report No.: ED170511031E Ver.1.0
12. ANTENNA PORT EMISSION ............................................................................................................. 58 12.1 TEST EQUIPMENT .............................................................................................................................. 58 12.2 MEASURING INSTRUMENTS AND SETTING ............................................................................................ 58 12.3 TEST PROCEDURES ........................................................................................................................... 58 12.4 BLOCK DIAGRAM OF TEST SETUP ....................................................................................................... 58 12.5 TEST RESULT .................................................................................................................................... 58
13. ANTENNA APPLICATION ................................................................................................................. 65 13.1 ANTENNA REQUIREMENT ................................................................................................................... 65 13.2 RESULT ............................................................................................................................................. 65
APPENDIX I (PHOTOS OF EUT)(3 PAGES)

TRF No.: FCC 15.247/A Page 6 of 69 Report No.: ED170511031E Ver.1.0
1. General Information
1.1 Product Description
Characteristics Description
Product Name LED TV
Model number WD50FBE1001
Power Supply AC 100V-240V, 50/60Hz, 80W
Modulation 802.11b: DSSS(DBPSK/DQPSK/CCK) 802.11g/n: OFDM(BPSK/QPSK/16QAM/64QAM)
Operating Frequency Range
2412-2462MHz for 802.11b/g/n(HT20) 2422-2452MHz for 802.11n(HT40)
Number of Channels 11 for 20MHz bandwidth; 7 for 40MHz bandwidth
Transmit Power Max
802.11b: 13.96dBm 802.11g: 9.92dBm 802.11n(HT20): 9.06dBm 802.11n(HT40): 6.12dBm
Antenna Type Internal antenna
Antenna Gain 2.0dBi
Note: for more details, please refer to the User’s manual of the EUT.

TRF No.: FCC 15.247/A Page 7 of 69 Report No.: ED170511031E Ver.1.0
EUT
2. System Test Configuration
2.1 EUT Configuration
The EUT configuration for testing is installed on RF field strength measurement to meet the Commissions requirement and operating in a manner which intends to maximize its emission characteristics in a continuous normal application.
2.2 EUT Exercise
The Transmitter was operated in the normal operating mode. The TX frequency was fixed which was for the purpose of the measurements.
2.3 Test Procedure
2.3.1 Conducted Emissions
The EUT is a placed on as turn table which is 0.8 m above ground plane. According to the requirements in Section 13.1.4.1 of ANSI C63.10-2013Conducted emissions from the EUT measured in the frequency range between 0.15 MHz and 30 MHz using CISPR Quasi-Peak and average detector mode.
2.3.2 Radiated Emissions
The EUT is a placed on as turn table which is 0.8 m above ground plane. The turn table shall rotate 360 degrees to determine the position of maximum emission level. EUT is set 3m away from the receiving antenna which varied from 1m to 4m to find out the highest emission. And also, each emission was to be maximized by changing the polarization of receiving antenna both horizontal and vertical. In order to find out the max. Emission, the relative positions of this hand-held transmitter (EUT) was rotated through three orthogonal axes according to the requirements in Section 13.1.4.1 of ANSI C63.10-2013.
2.4 Configuration of Tested System
Fig. 2-1 Configuration of Tested System
Table 2-1 Equipment Used in Tested System
Item Equipment Trademark Model No. FCC ID Note
1. LED TV
THTF, Fluid, Westinghouse, Seiki, Element,
ONN
WD50FBE1001 2ACWIWD50FBE10 EUT
Note:
AC Mains

TRF No.: FCC 15.247/A Page 8 of 69 Report No.: ED170511031E Ver.1.0
(1) Unless otherwise denoted as EUT in『Remark』column, device(s) used in tested system is a support equipment.

TRF No.: FCC 15.247/A Page 9 of 69 Report No.: ED170511031E Ver.1.0
3. Description of Test Modes The EUT has been tested under its typical operating condition. The EUT configuration for testing is installed on RF field strength measurement to meet the Commissions requirement and operating in a manner which intends to maximize its emission characteristics in a continuous normal application. The Transmitter was operated in the normal operating mode. The TX frequency was fixed which was for the purpose of the measurements.
Test of channel included the lowest and middle and highest frequency to perform the test, then record on this report.
Those data rates (802.11b: 1 Mbps; 802.11g: 6 Mbps; 802.11n (HT20 ): MCS0; 802.11n (HT40 ): MCS8) were used for all test.
Pre-defined engineering program for regulatory testing used to control the EUT for staying in continuous transmitting and receiving mode is programmed.
Frequency and Channel list for 802.11 b/g/n (HT20):
Channel Frequency (MHz) Channel Frequency
(MHz) Channel Frequency (MHz)
1 2412 5 2432 9 2452 2 2417 6 2437 10 2457 3 2422 7 2442 11 2462 4 2427 8 2447
Frequency and Channel list for 802.11 n (HT40):
Channel Frequency (MHz) Channel Frequency
(MHz) Channel Frequency (MHz)
3 2422 5 2432 8 2447 4 2427 6 2437 9 2452 7 2442
Test Frequency and Channel for 802.11 b/g/n (HT20):
Lowest Frequency Middle Frequency Highest Frequency
Channel Frequency (MHz) Channel Frequency
(MHz) Channel Frequency (MHz)
1 2412 6 2437 11 2462 Test Frequency and channel for 802.11 n (HT40):
Lowest Frequency Middle Frequency Highest Frequency
Channel Frequency (MHz) Channel Frequency
(MHz) Channel Frequency (MHz)
3 2422 6 2437 9 2452

TRF No.: FCC 15.247/A Page 10 of 69 Report No.: ED170511031E Ver.1.0
4. Summary of Test Results
FCC Rules Description Of Test Result §15.247(a)(2) 6dB bandwidth Pass §15.247(b)(3) Max Peak output Power test Pass §15.247(e) Power density Pass §15.247(d) Band edge test Pass
§15.207 AC Power Conducted Emission Pass
§15.247(d), §15.209 Radiated Emission Pass §15.247(d) Antenna Port Emission Pass §15.247(b)&§15.203 Antenna Application Pass

TRF No.: FCC 15.247/A Page 11 of 69 Report No.: ED170511031E Ver.1.0
5. Test Facility
Site Description EMC Lab : Registered on FCC, July 06, 2016
The Certificate Number is 247565.
Registered on Industry Canada, January 13, 2017 The Certificate Number is 9444A
Name of Firm : EMTEK(DONGGUAN) CO., LTD. Site Location : No.281, Guantai Road, Nancheng District,
Dongguan, Guangdong, China

TRF No.: FCC 15.247/A Page 12 of 69 Report No.: ED170511031E Ver.1.0
L.I.S.N EUT
6. Conducted Emissions Test
6.1 Measurement Procedure
1. The EUT was placed on a table which is 0.8m above ground plane. 2. Maximum procedure was performed on the six highest emissions to ensure
EUT compliance. 3. Repeat above procedures until all frequency measured were complete.
6.2 Test SET-UP (Block Diagram of Configuration)
6.3 Measurement Equipment Used
Conducted Emission Test Site EQUIPMENT
TYPE MFR MODEL
NUMBER SERIAL
NUMBER Last Cal. Due date
Test Receiver Rohde & Schwarz ESCS30 100018 05/16/2017 05/15/2018L.I.S.N Rohde & Schwarz ENV216 100017 05/16/2017 05/15/2018
RF Switching Unit CDS RSU-M2 38401 05/16/2017 05/15/2018
Coaxial Cable CDS 79254 46107086 05/16/2017 05/15/2018
6.4 Conducted Emission Limit
Conducted Emission Frequency(MHz) Quasi-peak Average 0.15-0.5 66-56 56-46 0.5-5.0 56 46 5.0-30.0 60 50 Note: 1. The lower limit shall apply at the transition frequencies 2. The limit decreases in line with the logarithm of the frequency in the range
of 0.15 to 0.50MHz.
6.5 Measurement Result Conducted emission at both 120V & 240V is assessed, and emission at 120V represents
AC Mains
Test Receiver

TRF No.: FCC 15.247/A Page 13 of 69 Report No.: ED170511031E Ver.1.0
the worst case. All the modulation modes were tested the data of the worst mode (TX 802.11b) are recorded in the following pages and the others modulation methods do not exceed the limits. Please refer to following pages.

TRF No.: FCC 15.247/A Page 14 of 69 Report No.: ED170511031E Ver.1.0

TRF No.: FCC 15.247/A Page 15 of 69 Report No.: ED170511031E Ver.1.0

TRF No.: FCC 15.247/A Page 16 of 69 Report No.: ED170511031E Ver.1.0

TRF No.: FCC 15.247/A Page 17 of 69 Report No.: ED170511031E Ver.1.0

TRF No.: FCC 15.247/A Page 18 of 69 Report No.: ED170511031E Ver.1.0

TRF No.: FCC 15.247/A Page 19 of 69 Report No.: ED170511031E Ver.1.0
7. Radiated Emission Test
7.1 Measurement Procedure
1. Below 1000MHz, The EUT was placed on a turn table which is 0.8m above ground plane, And above 1000MHz, The EUT was placed on a styrofoam table which is 1.5m above ground plane. 2. Maximum procedure was performed on the six highest emissions to ensure EUT compliance. 3. And also, each emission was to be maximized by changing the polarization of
receiving antenna both horizontal and vertical. 4. Repeat above procedures until all frequency measured was complete.
When spectrum scanned from 30MHz to 1GHz setting resolution bandwidth 120KHz and video bandwidth 300KHz:
EMI Test Receiver Setting Attenuation Auto RB 120KHz VB 300KHz Detector QP Trace Max hold
When spectrum scanned above 1GHz setting resolution bandwidth 1MHz, video bandwidth 3MHz:
EMI Test Receiver Setting Attenuation Auto RB 1MHz VB 3MHz Detector Peak Trace Max hold
When spectrum scanned above 1GHz setting resolution bandwidth 1MHz, video bandwidth 10Hz:
EMI Test Receiver Setting Attenuation Auto RB 1MHz VB 10Hz Detector AVG Trace Max hold

TRF No.: FCC 15.247/A Page 20 of 69 Report No.: ED170511031E Ver.1.0
7.2 Test SET-UP (Block Diagram of Configuration)
(A) Radiated Emission Test Set-Up, Frequency Below 30MHz
(B) Radiated Emission Test Set-Up, Frequency Below 1000MHz
1m to 4m
Test Receiver
EUT
3m
0.8m
Turntable
Coaxial Cable Ground Plane
Test Receiver
EUT 3mTurntable
Coaxial Cable Ground Plane
0.8 m

TRF No.: FCC 15.247/A Page 21 of 69 Report No.: ED170511031E Ver.1.0
(C) Radiated Emission Test Set-Up, Frequency above 1000MHz
7.3 Measurement Equipment Used
Item Equipment Manufacturer Model No. Serial No. Last Cal. Cal. Interval
1. Test Receiver Rohde & Schwarz ESCI 1166.5950.03 05/16/2017 1 Year 2. Bilog Antenna Schwarzbeck VULB9163 000141 05/16/2017 1 Year 3. Power Amplifier CDS RSU-M352 818 05/16/2017 1 Year 4. Power Amplifier HP 8447F OPT H64 05/16/2017 1 Year 5. Color Monitor SUNSPO SP-140A N/A 05/16/2017 1 Year 6. Single Line Filter JIANLI XL-3 N/A 05/16/2017 1 Year
7. Single Phase Power Line Filter JIANLI DL-2X100B N/A 05/16/2017 1 Year
8. 3 Phase Power Line Filter JIANLI DL-4X100B N/A 05/16/2017 1 Year
9. DC Power Filter JIANLI DL-2X50B N/A 05/16/2017 1 Year 10. Cable Schwarzbeck PLF-100 549489 05/16/2017 1 Year 11. Cable Rosenberger CIL02 A0783566 05/16/2017 1 Year 12. Cable Rosenberger RG 233/U 525178 05/16/2017 1 Year 13. Signal Analyzer Rohde & Schwarz FSV30 103040 05/16/2017 1 Year 14. Horn Antenna Schwarzbeck BBHA9120D 9120D-1272 05/16/2017 1 Year 15. Power Amplifier LUNAR EM LNA1G18-40 J10100000081 05/16/2017 1 Year 16. Cable H+S CBL-26 N/A 05/16/2017 1 Year 17. Cable H+S CBL-26 N/A 05/16/2017 1 Year 18. Cable H+S CBL-26 N/A 05/16/2017 1 Year
3m
EUT
1.5m
Turntable 4m
Test ReceiverAmplifier
TRF No.: FCC 15.247/A Page 22 of 69 Report No.: ED170511031E Ver.1.0
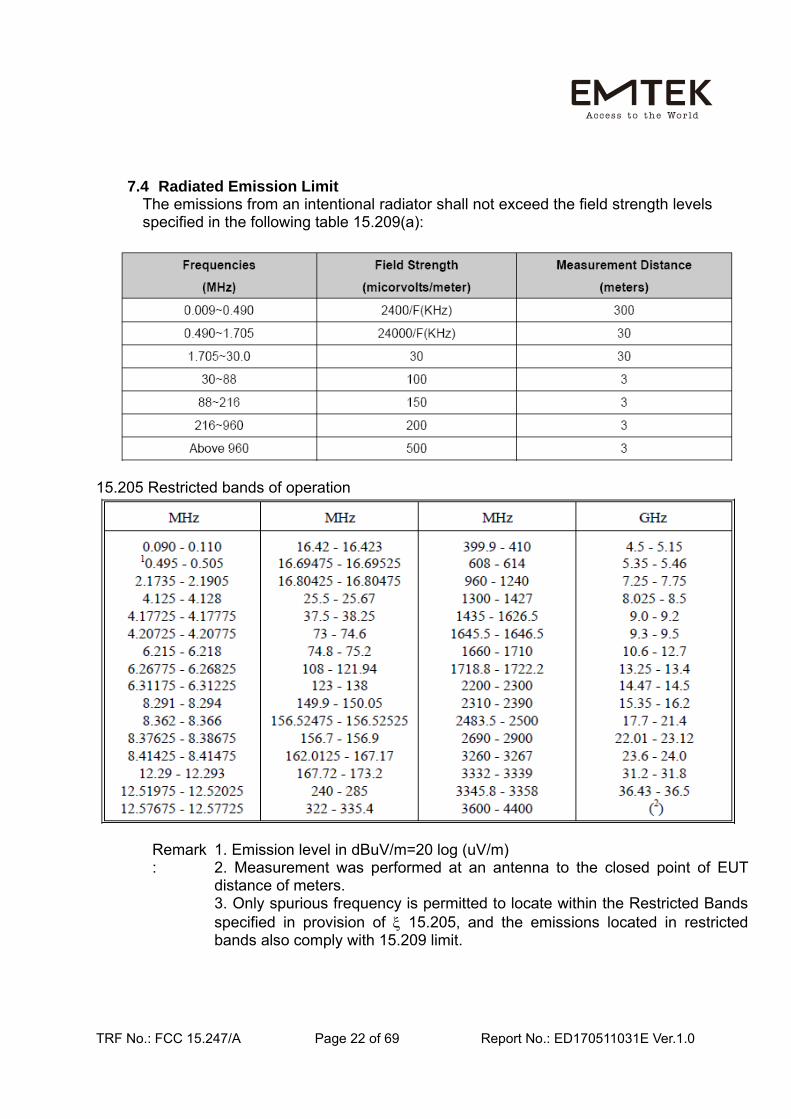
7.4 Radiated Emission Limit The emissions from an intentional radiator shall not exceed the field strength levels specified in the following table 15.209(a):
15.205 Restricted bands of operation
Remark:
1. Emission level in dBuV/m=20 log (uV/m) 2. Measurement was performed at an antenna to the closed point of EUT distance of meters. 3. Only spurious frequency is permitted to locate within the Restricted Bands specified in provision of ξ 15.205, and the emissions located in restricted bands also comply with 15.209 limit.

TRF No.: FCC 15.247/A Page 23 of 69 Report No.: ED170511031E Ver.1.0
7.5 Measurement Result Below 30MHz:
All the modulation modes were tested the data of the test mode are recorded in the following pages.
Operation Mode: TX Mode Test Date : May 15, 2017 Frequency Range: 9KHz~30MHz Temperature : 28℃ Test Result: PASS Humidity : 60 % Measured Distance: 3m Test By: WOLF
Freq. Ant.Pol. Emission Level Limit 3m Over (MHz) H/V (dBuV/m) (dBuV/m) (dB)
-- -- -- -- -- Note: the amplitude of spurious emission that is attenuated by more than 20dB below
the permissible limit has no need to be reported. Distance extrapolation factor =40log(Specific distance/ test distance)( dB); Limit line=Specific limits(dBuV) + distance extrapolation factor.
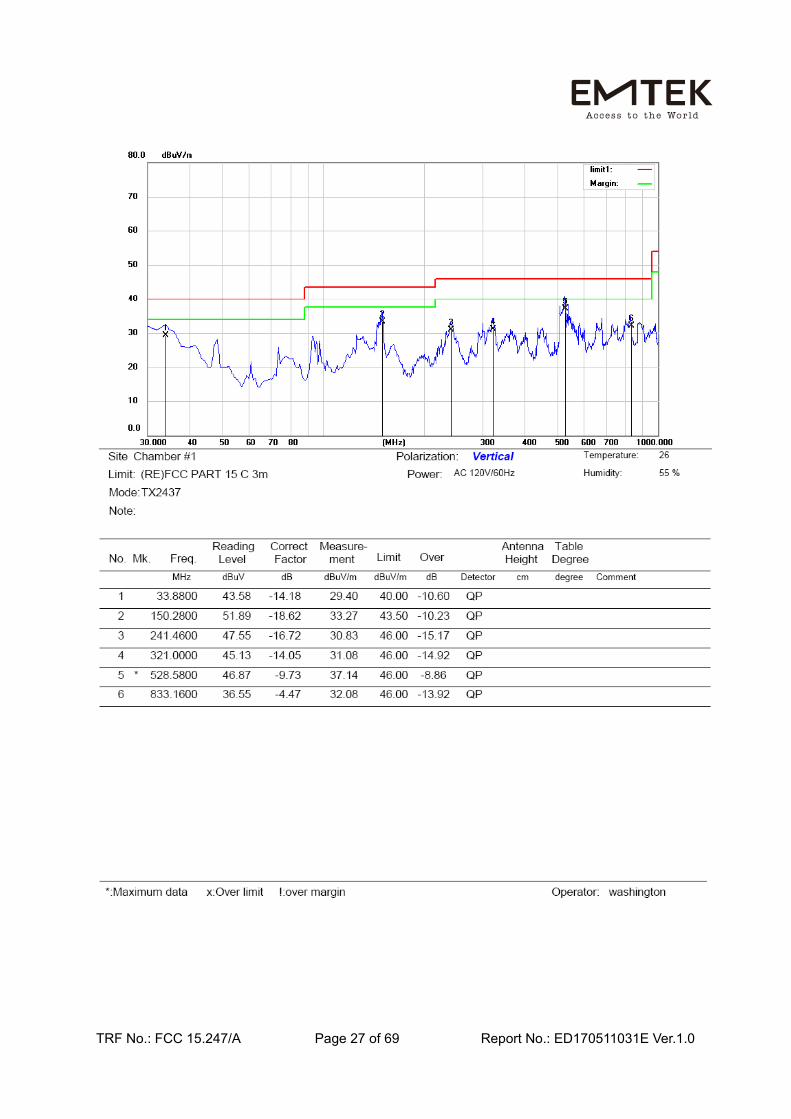
Below 1000MHz: Radiated emission at both 120V & 240V is assessed, and emission at 120V represents the worst case. All the modulation modes were tested the data of the worst mode (TX 802.11b) are recorded in the following pages and the others modulation methods do not exceed the limits.
Please refer to the following test plots:

TRF No.: FCC 15.247/A Page 24 of 69 Report No.: ED170511031E Ver.1.0

TRF No.: FCC 15.247/A Page 25 of 69 Report No.: ED170511031E Ver.1.0

TRF No.: FCC 15.247/A Page 26 of 69 Report No.: ED170511031E Ver.1.0
TRF No.: FCC 15.247/A Page 27 of 69 Report No.: ED170511031E Ver.1.0

TRF No.: FCC 15.247/A Page 28 of 69 Report No.: ED170511031E Ver.1.0

TRF No.: FCC 15.247/A Page 29 of 69 Report No.: ED170511031E Ver.1.0

TRF No.: FCC 15.247/A Page 30 of 69 Report No.: ED170511031E Ver.1.0
Above 1GHz:
Operation Mode: 802.11b Lowest Test Date : May 15, 2017 Test Voltage: AC 120V/60Hz Test by: Andy
Freq. Ant. Pol.(MHz) H/V PK AV PK AV PK AV4824 V 64.06 44.06 74 54 -9.94 -9.947236 V 63.21 43.12 74 54 -10.79 -10.889648 V 62.95 42.94 74 54 -11.05 -11.0612060 V 61.25 41.85 74 54 -12.75 -12.1514472 V 60.28 40.36 74 54 -13.72 -13.6416884 V 59.42 39.42 74 54 -14.58 -14.584824 H 63.22 43.12 74 54 -10.78 -10.887236 H 62.94 42.65 74 54 -11.06 -11.359648 H 61.41 41.95 74 54 -12.59 -12.0512060 H 60.62 40.21 74 54 -13.38 -13.7914472 H 59.42 39.12 74 54 -14.58 -14.8816884 H 58.62 38.65 74 54 -15.38 -15.35
Emission Level(dBuV/m) Limit 3m(dBuV/m) Over(dB)
Operation Mode: 802.11b Middle Test Date : May 15, 2017 Test Voltage: AC 120V/60Hz Test by: Andy
Freq. Ant. Pol.(MHz) H/V PK AV PK AV PK AV4824 V 63.06 43.15 74 54 -10.94 -10.857236 V 62.14 42.65 74 54 -11.86 -11.359648 V 61.39 41.95 74 54 -12.61 -12.0512060 V 60.53 40.18 74 54 -13.47 -13.8214472 V 59.42 39.62 74 54 -14.58 -14.3816884 V 58.41 38.42 74 54 -15.59 -15.584824 H 64.28 44.69 74 54 -9.72 -9.317236 H 63.41 43.25 74 54 -10.59 -10.759648 H 62.95 42.65 74 54 -11.05 -11.3512060 H 61.42 41.24 74 54 -12.58 -12.7614472 H 60.36 40.32 74 54 -13.64 -13.6816884 H 59.42 39.42 74 54 -14.58 -14.58
Emission Level(dBuV/m) Limit 3m(dBuV/m) Over(dB)

TRF No.: FCC 15.247/A Page 31 of 69 Report No.: ED170511031E Ver.1.0
Operation Mode: 802.11b Highest Test Date : May 15, 2017 Test Voltage: AC 120V/60Hz Test by: Andy
Freq. Ant. Pol.(MHz) H/V PK AV PK AV PK AV4824 V 65.06 45.95 74 54 -8.94 -8.057236 V 64.12 44.18 74 54 -9.88 -9.829648 V 63.25 43.62 74 54 -10.75 -10.3812060 V 62.95 42.65 74 54 -11.05 -11.3514472 V 61.48 41.29 74 54 -12.52 -12.7116884 V 60.29 40.29 74 54 -13.71 -13.714824 H 64.12 44.65 74 54 -9.88 -9.357236 H 63.95 43.18 74 54 -10.05 -10.829648 H 62.19 42.15 74 54 -11.81 -11.8512060 H 61.42 41.66 74 54 -12.58 -12.3414472 H 60.62 40.28 74 54 -13.38 -13.7216884 H 59.42 39.45 74 54 -14.58 -14.55
Emission Level(dBuV/m) Limit 3m(dBuV/m) Over(dB)
All emissions not reported were more than 20dB below the specified limit or in the noise floor. No others harmonics emissions are higher than 20 dB below the limits of 47 CFR Part 15.247.
Note: (1) All Readings are Peak Value and AV. (2) Emission Level= Reading Level+Probe Factor +Cable Loss.
(3) Data of measurement within this frequency range shown “ – ” in the table above means the reading of emissions are attenuated more than 20dB below the permissible limits or the field strength is too small to be measured.

TRF No.: FCC 15.247/A Page 32 of 69 Report No.: ED170511031E Ver.1.0
8. 6dB Bandwidth Test
8.1 Measurement Procedure
The EUT was operating in IEEE 802.11b, 802.11g, 802.11n(HT20), 802.11n(HT40) mode or could be controlled its channel. Printed out the test result from the spectrum by hard copy function. 1. Set resolution bandwidth (RBW) = 100 kHz. 2. Set the video bandwidth (VBW) ≥ 3 x RBW. 3. Detector = Peak. 4. Trace mode = max hold. 5. Sweep = auto couple. 6. Allow the trace to stabilize. 7. Measure the maximum width of the emission that is constrained by the frequencies associated with the two outermost amplitude points (upper and lower frequency) that are attenuated by 6 dB relative to the maximum level measured in the fundamental emission.
8.2 Test SET-UP (Block Diagram of Configuration)
8.3 Measurement Equipment Used
EQUIPMENT
TYPE MFR MODEL
NUMBERSERIAL
NUMBER LAST CAL.
CAL DUE.
Spectrum Analyzer Agilent FSV30 1321.3008K 05/16/2017 05/15/2018
8.4 Measurement Results
6 Bandwidth Test Data Chart:
Refer to attached data chart.
EUT Spectrum Analyzer

TRF No.: FCC 15.247/A Page 33 of 69 Report No.: ED170511031E Ver.1.0
Spectrum Detector: PK Test Date : May 16, 2017 Test By: Andy Temperature : 28℃ Humidity : 60%
IEEE 802.11b Channel
frequency (MHz) Measurement level
(KHz) Required Limit
(KHz) Result
2412 10059 >500 Pass 2437 10058 >500
2462 10067 >500

TRF No.: FCC 15.247/A Page 34 of 69 Report No.: ED170511031E Ver.1.0

TRF No.: FCC 15.247/A Page 35 of 69 Report No.: ED170511031E Ver.1.0
IEEE 802.11g Channel
frequency (MHz) Measurement level
(KHz) Required Limit
(KHz) Result
2412 16481 >500 Pass 2437 16462 >500
2462 16459 >500

TRF No.: FCC 15.247/A Page 36 of 69 Report No.: ED170511031E Ver.1.0

TRF No.: FCC 15.247/A Page 37 of 69 Report No.: ED170511031E Ver.1.0
IEEE 802.11n(HT20) Channel
frequency (MHz)
Measurement level (KHz)
Required Limit (KHz) Result
2412 17609 >500 Pass 2437 17593 >500
2462 17623 >500

TRF No.: FCC 15.247/A Page 38 of 69 Report No.: ED170511031E Ver.1.0

TRF No.: FCC 15.247/A Page 39 of 69 Report No.: ED170511031E Ver.1.0
IEEE 802.11n (HT40) Channel
frequency (MHz)
Measurement level (KHz)
Required Limit (KHz) Result
2422 36423 >500 Pass 2437 36376 >500
2452 36361 >500

TRF No.: FCC 15.247/A Page 40 of 69 Report No.: ED170511031E Ver.1.0

TRF No.: FCC 15.247/A Page 41 of 69 Report No.: ED170511031E Ver.1.0
9. Maximum Peak Output Power Test
9.1 Measurement Procedure 1. The testing follows the Measurement Procedure of FCC KDB No. 558074 DTS
D01 Meas. Guidance v04. 2. The RF output of EUT was connected to the power meter by RF cable and
attenuator. The path loss was compensated to the results for each measurement. 3. Set to the maximum power setting and enable the EUT transmit continuously. 4. Measure the conducted output power and record the results in the test report.
9.2 Test SET-UP (Block Diagram of Configuration) 10dB ATTENUATION
9.3 Measurement Equipment Used
EQUIPMENT TYPE
MODEL NUMBER
SERIAL NUMBER
LAST CAL. CAL DUE.
Power meter ML2495A 0824006 05/16/2017 05/15/2018 Power sensor MA2411B 0738172 05/16/2017 05/15/2018
9.4 Peak Power output limit
The maximum peak power shall be less 1Watt.
9.5 Measurement Results
Spectrum Detector: PK Test Date : May 16, 2017 Test By: Andy Temperature : 28℃ Test Result: PASS Humidity : 60%
Test Channel
Peak Output Power (dBm) Limit(dBm) Result802.11b 802.11g 802.11n(HT20) 802.11n(HT40)Lowest 13.96 9.92 9.06 6.12
30 Pass Middle 13.81 9.84 8.64 5.86 Highest 12.12 9.14 8.32 5.64
EUT Power meter

TRF No.: FCC 15.247/A Page 42 of 69 Report No.: ED170511031E Ver.1.0
10. Band Edge Test
10.1 Measurement Procedure
For Conducted Test
1. The testing follows FCC KDB Publication No. 558074 D01 DTS Meas. Guidance v04.
2. The RF output of EUT was connected to the spectrum analyzer by RF cable and attenuator. The path loss was compensated to the results for each measurement.
3. Set to the maximum power setting and enable the EUT transmit continuously. 4. Set RBW = 100 kHz, VBW=300 kHz, Peak Detector. Unwanted Emissions measured
in any 100 kHz bandwidth outside of the authorized frequency band shall be attenuated by at least 20 dB relative to the maximum in-band peak PSD level in 100 kHz when maximum peak conducted output power procedure is used. Measure and record the results in the test report.
5. The RF fundamental frequency should be excluded against the limit line in the operating frequency band.
For Radiated emission Test 1. The testing follows FCC KDB Publication No. 558074 D01 DTS Meas. Guidance
v04. 2. The EUT was arranged to its worst case and then tune the antenna tower (from 1 m
to 4 m) and turntable (from 0 degree to 360 degrees) to find the maximum reading. A pre-amp and a high pass filter are used for the test in order to get better signal level.
3. The EUT was placed on a turntable with 0.8 meter above ground. 4. The EUT was set 3 meters from the interference receiving antenna, which was
mounted on the top of a variable height antenna tower. 5. Corrected Reading: Antenna Factor + Cable Loss + Read Level - Preamp Factor =
Level. 6. For measurement below 1GHz, If the emission level of the EUT measured by the
peak detector is 3 dB lower than the applicable limit, the peak emission level will be reported. Otherwise, the emission measurement will be repeated using the quasi-peak detector and reported.
7. Repeat above procedures until all frequency measured were complete.
When spectrum scanned above 1GHz setting resolution bandwidth 1MHz, video bandwidth 3MHz. EMI Test Receiver Setting Attenuation Auto RB 1MHz VB 3MHz Detector Peak Trace Max hold

TRF No.: FCC 15.247/A Page 43 of 69 Report No.: ED170511031E Ver.1.0
When spectrum scanned above 1GHz setting resolution bandwidth 1MHz, video bandwidth 10Hz. EMI Test Receiver Setting Attenuation Auto RB 1MHz VB 10HzDetector AVG Trace Max hold
10.2 Test SET-UP (Block Diagram of Configuration)
10.3 Measurement Equipment Used
EQUIPMENT
TYPE MFR MODEL
NUMBERSERIAL
NUMBER LAST CAL.
CAL DUE.
Spectrum Analyzer Agilent FSV30 1321.3008K 05/16/2017 05/15/2018
10.4 Measurement Results 1. Conducted Test
Please refer to the following pages.
EUT Spectrum Analyzer

TRF No.: FCC 15.247/A Page 44 of 69 Report No.: ED170511031E Ver.1.0
Test mode: 802.11b

TRF No.: FCC 15.247/A Page 45 of 69 Report No.: ED170511031E Ver.1.0
Test mode: 802.11g

TRF No.: FCC 15.247/A Page 46 of 69 Report No.: ED170511031E Ver.1.0
Test mode: 802.11n(HT20)

TRF No.: FCC 15.247/A Page 47 of 69 Report No.: ED170511031E Ver.1.0
Test mode: 802.11n(HT40)

TRF No.: FCC 15.247/A Page 48 of 69 Report No.: ED170511031E Ver.1.0
2. Radiated emission Test
Spectrum Detector: PK/AV Test Date : May 15, 2017
Test By: Andy Temperature : 28 ℃ Humidity : 65 %
Frequency(MHz)
Antennapolarization
(H/V) PK AV PK AV PK AV<2400 H 63.05 43.66 74 54 -10.95 -10.34<2400 V 59.21 39.2 74 54 -14.79 -14.8
>2483.5 H 64.29 44.12 74 54 -9.71 -9.88>2483.5 V 60.25 40.29 74 54 -13.75 -13.71
Margin(dB)
Emission(dBuV/m)
Band edge Limit(dBuV/m)
IEEE 802.11b
Frequency(MHz)
Antennapolarization
(H/V) PK AV PK AV PK AV<2400 H 65.21 45.12 74 54 -8.79 -8.88<2400 V 60.23 40.2 74 54 -13.77 -13.8
>2483.5 H 64.12 44.12 74 54 -9.88 -9.88>2483.5 V 60.29 40.36 74 54 -13.71 -13.64
Margin(dB)
Emission(dBuV/m)
Band edge Limit(dBuV/m)
IEEE 802.11g
Frequency(MHz)
Antennapolarization
(H/V) PK AV PK AV PK AV<2400 H 63.12 43.62 74 54 -10.88 -10.38<2400 V 60.95 40.95 74 54 -13.05 -13.05
>2483.5 H 64.12 44.18 74 54 -9.88 -9.82>2483.5 V 59.21 39.52 74 54 -14.79 -14.48
Margin(dB)
Emission(dBuV/m)
Band edge Limit(dBuV/m)
IEEE 802.11n(HT20)
Frequency(MHz)
Antennapolarization
(H/V) PK AV PK AV PK AV<2400 H 63.59 43.12 74 54 -10.41 -10.88<2400 V 60.25 40.26 74 54 -13.75 -13.74
>2483.5 H 62.36 43.01 74 54 -11.64 -10.99>2483.5 V 58.69 38.14 74 54 -15.31 -15.86
Margin(dB)
Emission(dBuV/m)
Band edge Limit(dBuV/m)
IEEE 802.11n(HT40)

TRF No.: FCC 15.247/A Page 49 of 69 Report No.: ED170511031E Ver.1.0
11. Power Density
11.1 Test Equipment
EQUIPMENT
TYPE MFR MODEL
NUMBERSERIAL
NUMBER LAST CAL.
CAL DUE.
Spectrum Analyzer Agilent FSV30 1321.3008K 05/16/2017 05/15/2018
11.2 Measuring Instruments and Setting
The following table is the setting of spectrum analyzer. Spectrum analyzer Setting Attenuation Auto Span Frequency Set the span to 1.5 times the DTS bandwidth. RB 3kHz VB 10KHz Detector Peak Trace Max hold Sweep Time Automatic
11.3 Test Procedures
a. The transmitter output (antenna port) was connected to the spectrum analyzer. b. Set analyzer center frequency to DTS channel center frequency. c. Set the analyzer span to a minimum of 1.5 times the DTS bandwidth. d. Set the RBW ≥ 3 kHz. Set the VBW ≥ 3 x RBW. e. Detector = peak. f. Sweep time = auto couple. g. Trace mode = max hold. h. Allow trace to fully stabilize. i. Use the peak marker function to determine the maximum amplitude level.
11.4 Block Diagram of Test Setup
11.5 Limit
The transmitted power density averaged over any 1 second interval shall not be greater +8dBm in any 3 kHz bandwidth.
EUT Spectrum Analyzer

TRF No.: FCC 15.247/A Page 50 of 69 Report No.: ED170511031E Ver.1.0
11.6 Test Result
Spectrum Detector: PK Test Date : May 15, 2017 Test By: Andy Temperature : 28℃ Test Result: PASS Humidity : 60%
IEEE 802.11b Channel
frequency (MHz) Measurement level
(dBm) Limit(dBm) Result
2412 -4.08 8 Pass 2437 -4.35
2462 -5.08

TRF No.: FCC 15.247/A Page 51 of 69 Report No.: ED170511031E Ver.1.0

TRF No.: FCC 15.247/A Page 52 of 69 Report No.: ED170511031E Ver.1.0
IEEE 802.11g Channel
frequency (MHz) Measurement level
(dBm) Limit(dBm) Result
2412 -7.62 8 Pass 2437 -7.99
2462 -8.27

TRF No.: FCC 15.247/A Page 53 of 69 Report No.: ED170511031E Ver.1.0

TRF No.: FCC 15.247/A Page 54 of 69 Report No.: ED170511031E Ver.1.0
IEEE 802.11n(HT20) Channel
frequency (MHz) Measurement level
(dBm) Limit(dBm) Result
2412 -8.66 8 Pass 2437 -9.9
2462 -9.76

TRF No.: FCC 15.247/A Page 55 of 69 Report No.: ED170511031E Ver.1.0

TRF No.: FCC 15.247/A Page 56 of 69 Report No.: ED170511031E Ver.1.0
IEEE 802.11n(HT40)
Channel frequency (MHz)
Measurement level (dBm) Limit(dBm) Result
2422 -13.47 8 Pass 2437 -13.20
2452 -13.81

TRF No.: FCC 15.247/A Page 57 of 69 Report No.: ED170511031E Ver.1.0

TRF No.: FCC 15.247/A Page 58 of 69 Report No.: ED170511031E Ver.1.0
12. Antenna Port Emission
12.1 Test Equipment
EQUIPMENT
TYPE MFR MODEL
NUMBERSERIAL
NUMBER LAST CAL.
CAL DUE.
Spectrum Analyzer Agilent FSV30 1321.3008K 05/16/2017 05/15/2018
12.2 Measuring Instruments and Setting
The following table is the setting of spectrum analyzer. Spectrum analyzer Setting Attenuation Auto RB 100kHz VB 300kHz Detector Peak Trace Max hold
12.3 Test Procedures The conducted spurious emissions were measured conducted using a spectrum
analyzer at low, Middle, and high channels, the limit was determined by attenuation 20dB of the RF peak power output.
12.4 Block Diagram of Test setup
12.5 Test Result
PASS. Please refer to following pages.
EUT Spectrum Analyzer

TRF No.: FCC 15.247/A Page 59 of 69 Report No.: ED170511031E Ver.1.0
Test Mode: 802.11b
Lowest Channel
Middel Channel

TRF No.: FCC 15.247/A Page 60 of 69 Report No.: ED170511031E Ver.1.0
Highest Channel
Test Mode: 802.11g
Lowest Channel

TRF No.: FCC 15.247/A Page 61 of 69 Report No.: ED170511031E Ver.1.0
Middle Channel
Highest Channel

TRF No.: FCC 15.247/A Page 62 of 69 Report No.: ED170511031E Ver.1.0
Test Mode: 802.11n(HT20)
Lowest Channel
Middle Channel

TRF No.: FCC 15.247/A Page 63 of 69 Report No.: ED170511031E Ver.1.0
Highest Channel
Test Mode: 802.11n(HT40)
Lowest Channel

TRF No.: FCC 15.247/A Page 64 of 69 Report No.: ED170511031E Ver.1.0
Middle Channel
Highest Channel

TRF No.: FCC 15.247/A Page 65 of 69 Report No.: ED170511031E Ver.1.0
13. Antenna Application
13.1 Antenna Requirement
For intentional device, according to FCC 47 CFR Section 15.203, an intentional radiator shall be designed to ensure that no antenna other than that furnished by the responsible party shall be used with the device. And according to FCC 47 CFR Section 15.247 (b), if transmitting antennas of directional gain greater than 6dBi are used, the power shall be reduced by the amount in dB that the directional gain of the antenna exceeds 6dBi.
13.2 Result
The EUT’S antenna is an internal PCB antenna. The antenna’s gain is 2 dBi and meets the requirement.

TRF No.: FCC 15.247/A Page 66 of 69 Report No.: ED170511031E Ver.1.0
APPENDIX I (PHOTOS OF EUT)

TRF No.: FCC 15.247/A Page 67 of 69 Report No.: ED170511031E Ver.1.0

TRF No.: FCC 15.247/A Page 68 of 69 Report No.: ED170511031E Ver.1.0

TRF No.: FCC 15.247/A Page 69 of 69 Report No.: ED170511031E Ver.1.0